
A Multi-Attribute Method for Ranking the Risks from Multiple ...
33
Massachusetts Institute of Technology Engineering Systems Division Working Paper Series ESD-WP-2007-25 R ANKING THE R ISKS FROM M UL TIPLE H AZARDS IN A S MALL C OMMUNITY Hua Li 1 , George E. Apostolakis 2 , Joseph Gifun 3 , William VanSchalkwyk 4 , Susan Leite 5 , and David Barber 6 1 MIT Engineering Systems Division 2 MIT Engineering Systems Division and Department of Nuclear Science and Engineering 3 MIT Department of Facilities 4 MIT Office of the Executive Vice President & Treasurer 5 MIT Office of Environment, Health & Safety 6 MIT Campus Police November 2007
-
Upload
khangminh22 -
Category
Documents
-
view
3 -
download
0
Transcript of A Multi-Attribute Method for Ranking the Risks from Multiple ...

MMaassssaacchhuusseettttss IInnssttiittuuttee ooff TTeecchhnnoollooggyyEEnnggiinneeeerriinngg SSyysstteemmss DDiivviissiioonn
Working Paper Series
ESD-WP-2007-25
RANKING THE RISKS FROM MULTIPLE HAZARDS
IN A SMALL COMMUNITY
Hua Li1, George E. Apostolakis2, Joseph Gifun3, William VanSchalkwyk4,Susan Leite5, and David Barber6
1MIT Engineering Systems Division
2MIT Engineering Systems Division andDepartment of Nuclear Science and Engineering
3MIT Department of Facilities
4MIT Office of the Executive Vice President & Treasurer
5MIT Office of Environment, Health & Safety
6MIT Campus Police
November 2007

Submitted to Risk Analysis
Ranking the Risks from Multiple Hazards in a Small Community
Hua Li, George E. Apostolakis∗, Joseph Gifun, William VanSchalkwyk, Susan Leite,
David Barber
Massachusetts Institute of Technology Cambridge, MA 02139-4307, USA
Abstract Natural hazards, human-induced accidents, and malicious acts have caused great losses and disruptions to society. After September 11, 2001, critical infrastructure protection has become a national focus in the United States and is likely to remain one for the foreseeable future. Damage to our infrastructures and assets could be mitigated through pre-disaster planning and actions. We have developed a systematic methodology to assess and rank the risks from these multiple hazards in a community of 20,000 people. It is an interdisciplinary study that includes probabilistic risk assessment, decision analysis, and expert judgment. Scenarios are constructed to show how the initiating events evolve into undesirable consequences. A value tree, based on multi-attribute utility theory, is used to capture the decision maker’s preferences about the impacts on the infrastructures and other assets. The risks from random failures are ranked according to their Expected Performance Index, which is the product of frequency, probability, and consequence of a scenario. Risks from malicious acts are ranked according to their Performance Index as the frequency of attack is not available. A deliberative process is used to capture the factors that could not be addressed in the analysis and to scrutinize the results. This methodology provides a framework for the development of a risk-informed decision strategy. Although this study uses the Massachusetts Institute of Technology campus as a test-bed, it is a general methodology that could be used by other similar communities and municipalities. Keywords: Infrastructures, Risk Ranking, Natural Hazards, Terrorism
∗ Corresponding author, Engineering Systems Division and Department of Nuclear Science and Engineering, Room 24-221, Massachusetts Institute of Technology, Cambridge, Massachusetts 02139-4307; Email: [email protected]
1 of 32

1 INTRODUCTION Terrorist attacks in New York City and Washington DC on September 11, 2001, the thwarted attempt that resulted in the crashing of United Airlines Flight 93 in Shanksville, PA, as well as hurricanes Katrina and Rita remind us of the importance of mitigating the consequences of disasters. Natural disasters, human-induced accidents, and malicious acts have great potential for death, injury, economic losses, and disruption of service to society. The damage to infrastructures and assets could be mitigated through pre-disaster planning and actions. An important element to planning is the prioritization of risks according to criteria acceptable to the decision makers and the stakeholders. The Federal Emergency Management Agency (FEMA) has established the Disaster Resistant University (DRU) program whose purpose is to protect U.S. government investments in academic research and to protect the country’s higher education capability. Several universities have participated in this program including the University of California at Berkeley and the University of North Carolina at Wilmington (UNCW). The UC Berkeley study1,2 developed a scenario-based approach to assess the risk to the campus from earthquakes. Three scenarios (magnitude 6.5, 7.0, and 7.5 on the Richter scale) were used to estimate the structural and non-structural losses (in dollars). The conclusion was that non-structural losses dominated the structural losses. Then, the cost of mitigation was evaluated by considering three attributes: life safety, value (i.e., the purchase price of the equipment), and importance (to research). The UNCW study3 addressed multiple hazards in their DRU project, including hurricanes, wildfires, earthquakes, tornadoes, and severe winter weather. Multiple attributes were used to evaluate the potential impact from these hazards to people, property, and business. The hazards were ranked by the Hazard Priority Score, defined as the product of frequency and potential impact. Qualitative scales were developed for each attribute, and the score for each attribute was given by faculty and staff. The study is based on subjective qualitative analysis rather than quantitative assessment. In addition to the DRU studies, methods for evaluating multiple hazards have been proposed in the literature. A deliberative risk ranking method that describes the risks in multi-attribute terms employs groups of laypeople to perform the risk ranking4,5. The authors used the Centerville Middle School and DePaul County as test-beds. Multiple
2 of 32

risks were considered such as accidental injuries, airplane crashes, bites and stings, common infectious diseases, and lightning. The methodology featured an iterative deliberative process in which each participant provided holistic and multi-attribute risk ranking individually, and then subjected his/her risk ranking to deliberation and revision through group interactions. Several runs of the individual-group risk ranking process were implemented until the participants were satisfied. Risk scenarios were not identified. For example, the expected number of deaths per year was estimated directly and was used to represent the risk of death from a particular hazard. In the New Jersey Comparative Risk Project (NJCRP)6, the authors developed a hazard ranking methodology by sorting multiple environmental threats. The NJCRP was designed to involve experts and stakeholders through focus groups, surveys, newsletters, open meetings, and a website. This was a consequence-based approach containing multiple impact categories, i.e., human health, ecological, and socioeconomic. Deliberation was included in the process, but probabilities were not considered. The objectives of this paper are to develop a systematic methodology to assess and rank the risks from multiple hazards in a small community, and provide a framework for the development of a risk-informed decision strategy to understand and manage the risks. The hazards include natural hazards, human-induced accidents, and malicious acts. Natural hazards and human-induced accidents refer to the ones that happen probabilistically, and they can also be regarded as random failures. Malicious acts refer to intentional attacks. In this study, vandalism, that is, intentional attacks on the infrastructures, is addressed. Multiple infrastructures and assets as well as multiple stakeholders are included. This study was conducted for the campus of the Massachusetts Institute of Technology (MIT) as part of the DRU program. The MIT campus is a good representation of a community. It can be considered a town with approximately 6,000 residents and 14,000 commuters. It operates a utility plant, data network, cable television station, phone system, and has its own police and medical personnel. The method can be applied to many similar communities such as other academic research organizations located in similar settings as well as small municipalities. Section 2 shows the overall framework. Section 3 addresses the details of the methodology. In particular, Section 3.1 discusses hazard identification and screening,
3 of 32

followed by the classifications of critical infrastructures and assets, as is shown in Section 3.2. Section 3.3 introduces how scenarios are constructed using Probabilistic Risk Assessment. Section 3.4 lists the steps used to collect data from the stakeholders through a formal expert elicitation process. The impacts from the scenarios are evaluated by a hierarchical decision framework and are presented in Section 3.5. Section 4 outlines the deliberative process used on the technical results. Section 5 provides preliminary risk management strategies. The contributions of the method and its limitations are discussed in Section 6.
2 OVERALL FRAMEWORK The proposed method is scenario-based and involves the decision makers and the stakeholders in each step. It implements and expands the analytic-deliberative process7. Figure 1 shows the overall framework of the methodology. The first step (bottom of the figure) is to gather data and information from a variety of sources. Using the information, we screen out hazards, infrastructures and assets that are either addressed by other projects (“Do”) due to their significance, or are judged to be insignificant (“Do Not Do)”. The screening is necessitated by the large number of hazards, infrastructures and assets that must be investigated. Second, using Probabilistic Risk Assessment (PRA) techniques, scenarios are constructed for these infrastructures, assets, and hazards. Each scenario starts from an initiating event and proceeds through a series of subsequent events to a number of undesirable physical consequences, i.e., the end states. Since the infrastructures are interconnected, the dependencies among them are included in the scenarios. A preliminary ranking of the scenarios is achieved by using methods from Multi-Attribute Utility Theory. In particular, the objectives of the decision makers are represented in a “value tree,” as shown in Figure 1. Disutilities measure the impact of the scenarios on these objectives. The expected disutilities of the scenarios form the basis for a preliminary ranking, i.e., the higher the disutility the less desirable a scenario. The expected disutilities of scenarios emanating from natural events can be evaluated because their frequencies are known. This is not the case for malicious acts and therefore other methods for ranking are developed.
4 of 32
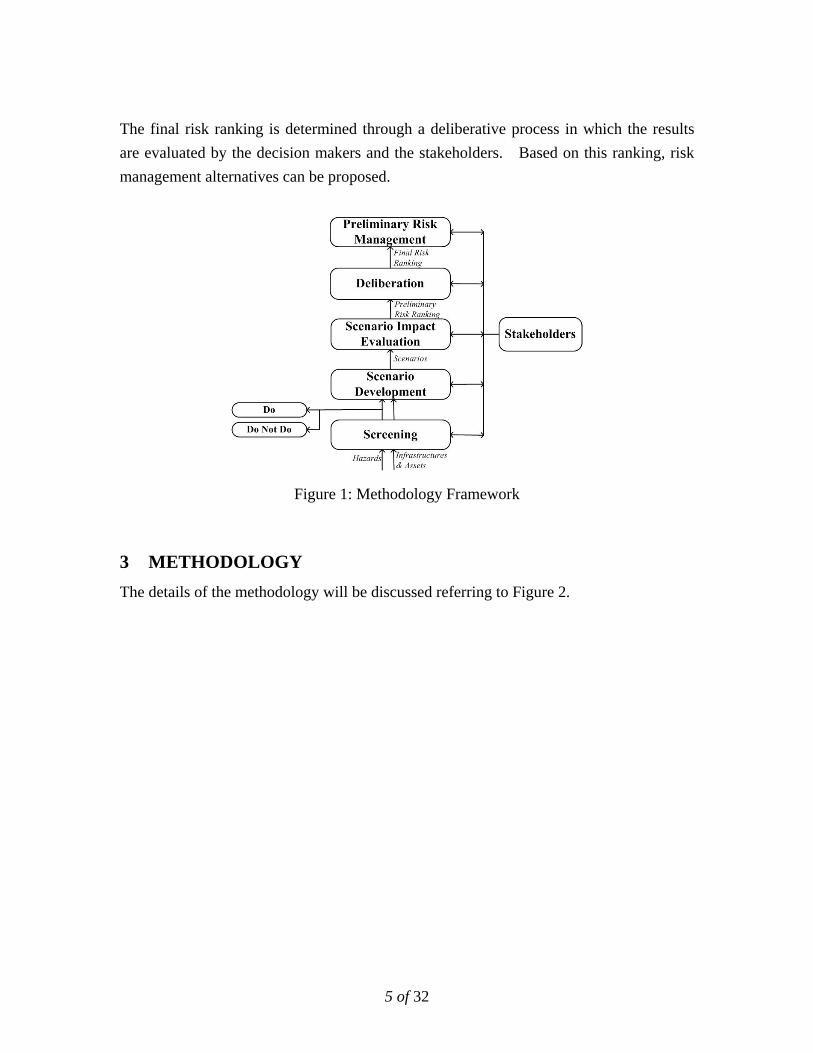
The final risk ranking is determined through a deliberative process in which the results are evaluated by the decision makers and the stakeholders. Based on this ranking, risk management alternatives can be proposed.
Figure 1: Methodology Framework
3 METHODOLOGY The details of the methodology will be discussed referring to Figure 2.
5 of 32

Figure 2: Overall Methodology
3.1 Hazard Identification and Screening
The following hazards may potentially present risks to a small community:
• Natural Hazards: Earthquakes, Tornados, Hurricanes, Winter storms, Freezing, and Heavy rain
• Human-Induced Hazards: Fires, Explosions, Internal flooding, Vandalism, Outbreaks of infectious diseases, and Cyber/IT attacks
Here, internal flooding means the flooding due to broken water pipes, plugged drains, condensation, faulty plumbing, or sprinkler system failure; all internal to the building. Vandalism describes the malicious actions on the infrastructures that result in operation
6 of 32

disruption, property or facilities damage.
The criteria for screening the hazards are: • Frequency: occurrence of events per year; • Severity: the consequence level due to the hazard; • Warning/Detectability: the extent to which warning information is available; • Awareness: how much work has historically been done to mitigate the hazard and
the extent to which MIT grasps the damage due to the hazard • Importance: the extent of urgency or necessity of doing work to address the
hazard; and, • Satisfaction: degree of personal acceptance of the level at which MIT is currently
working to prepare for, respond to, or mitigate a potential hazard.
Each hazard is compared against each of these six criteria, and evaluated using a subjective 0-4 scale (an example for the frequency of occurrence is shown in Table I). The objective of these criteria is not to find the exact scale for each hazard (detailed quantitative analysis will be done in the following steps) but to determine qualitatively the properties of all the hazards and screen out the hazards that are beyond the scope of the analysis. For this reason, the criteria aim to provide a platform to the decision makers and enable them to develop an overview of the hazards. Thus, each decision maker can select the hazards that should be screened out in his/her opinion. After the screening, the decision makers discuss the hazards, and reach consensus on the hazards that do not require further analysis. The results of this screening process are shown in Table II.
Table I: Screening of Hazards Using Frequency Description Level
High (occurs >3 times /year) 4 Moderate (occurs 1-3 times /year) 3
Low (occurs 0.1-1 time /year) 2 Very Low (occurs <0.1 time /year) 1
Extremely low or not available 0
7 of 32

Table II: Hazards in-Scope and Hazards Screened Out Hazards in-Scope Hazards Screened Out and Reasons Internal flooding; Fires; Explosions; Winter Storms (snow storms, wind storms) Rain flooding; Vandalism
Earthquakes • Because of the low probability of severe earthquakes,
mitigating the earthquake consequences is not cost-effective;
• The efforts for reducing the impacts from earthquakes are considered as “Do Not Do”.
Outbreaks of infectious diseases • This hazard is so important and urgent that it is the
subject of a specific study; • The efforts for reducing the impacts from infectious
diseases are considered as “Do”. Cyber attacks
• They have been handled by another organization.
3.2 Infrastructures and Assets
3.2.1 Macro-Groups
The MIT critical infrastructures include the utilities and the emergency and security elements (Figure 3). Electricity is a fundamental utility for the equipment of research and education and the facilities of other utilities, such as the production of chilled water. Water and steam also provide a necessary utility to MIT and its activities. For MIT, natural gas is a fundamental component of the power generation infrastructure. Tel-data refers to the facilities that support data and telephone systems. The chilled water generation and distribution system is a critical infrastructure for MIT, since chilled water is an important utility for the operations and activities of some laboratories and provides the resource to cool interior spaces. HVAC (Heating, Ventilation and Air Conditioning) and Controls refers to the infrastructures that provide both process and temperature controls for the comfort of building occupants, as well as research equipment. The emergency and security elements listed in the right hand side of Figure 3 play a major role in the emergency planning and response system. Fire alarm systems, sprinkler systems, and the access-control systems provide physical defense to hazards. When an incident occurs in the campus, the Operations Center, the Police, EHS, and the Department of Facilities are involved in the emergency response process.
8 of 32

Figure 3: MIT Campus Critical Infrastructures
The key assets can be classified into three sectors (Figure 4):
1. Mission-Related Assets: the assets that are academic and research related; 2. Support and Service Assets: medical center, administration offices, athletics
centers, and residential halls; 3. Other key assets: assets such as the Central Utility Plant which provides multiple
utilities (electricity, steam, and chilled water) to the whole campus. Since there are more than 155 buildings on the campus, the assets are further categorized into Macro-Groups according to their activities and operations (Figure 4). For example, the Animal-Dominant Macro-Group contains the laboratories whose activities are to manage animals and improve quality of control. Given a hazard, the consequences for different Macro-Groups are different. Data are collected from a representative member of the Macro-Group.
Figure 4: MIT Campus Key Assets
9 of 32

3.2.2 Interdependencies
Protecting the infrastructures and assets creates major technical challenges, because the infrastructures are complex and interconnected systems. Rinaldi, Peerenboom, and Kelly8 propose the following categorization of dependencies, and their definitions are adopted in this study:
• Physical Dependency refers to a physical reliance on material flow from one infrastructure to another. The dependency of water pumps on electricity is an example of physical dependency.
• Cyber Dependency refers to a reliance on information transfer between the infrastructures. For example, the Human Resources Department depends on the Data Center to transfer, update, and store personnel data.
• Geographic Dependency refers to the dependency that a local environmental event affects components across multiple infrastructures due to physical proximity. If a utility manhole containing the valves of water pipes, electric power lines, and steam lines is flooded, the result could be a loss of several utilities because of geographic dependency.
• Geographic Dependency refers to the dependency between a local event and the affect of this event on multiple infrastructures due to physical proximity. For example, if a natural gas main exploded in the vicinity of water and steam mains and an electric duct bank, the result could be the loss of three additional utility services because of geographic dependency.
• Logical Dependency refers to the dependency between infrastructures that do not fall into one of the above categories. The dependency among the Institute’s police, Environmental Health and Safety Programs, Emergency Operations Center, and Department of Facilities, and local fire services when responding to a fire is an instance of logical dependency.
The four categories of dependencies enable us to check whether all the dependencies have been included into the analysis.
3.3 Scenario Development
The general risk process shown in Figure 5 provides the basis for constructing the scenarios. A scenario starts with an initiating event. If installed, the physical defense system responds right after the initiating event occurs. Emergency responders, i.e., police, EHS, and other departments, act to mitigate the consequences. In the subsequent
10 of 32

events, utility systems such as electricity, water, and steam may fail. The final consequences for the Macro-Group depend on the activities and operations within the Macro-Group.
Physical DefenseFire sprinkler systems;Emergency generator
for electricity;etc.
UtilitiesElectricityWater;Chilled Water;Steam;Natural Gasetc.
Initiating EventsFlooding;Power outage;Fire; Explosion;etc.
Emergency and Security Elements
Police;EHS;etc.
Assets Macro-GroupsResearchers’ offices;Labs;Classrooms;Medical center;Residential Halls;etc.
Impact Evaluation Physical Consequences
Figure 5: The Risk Process
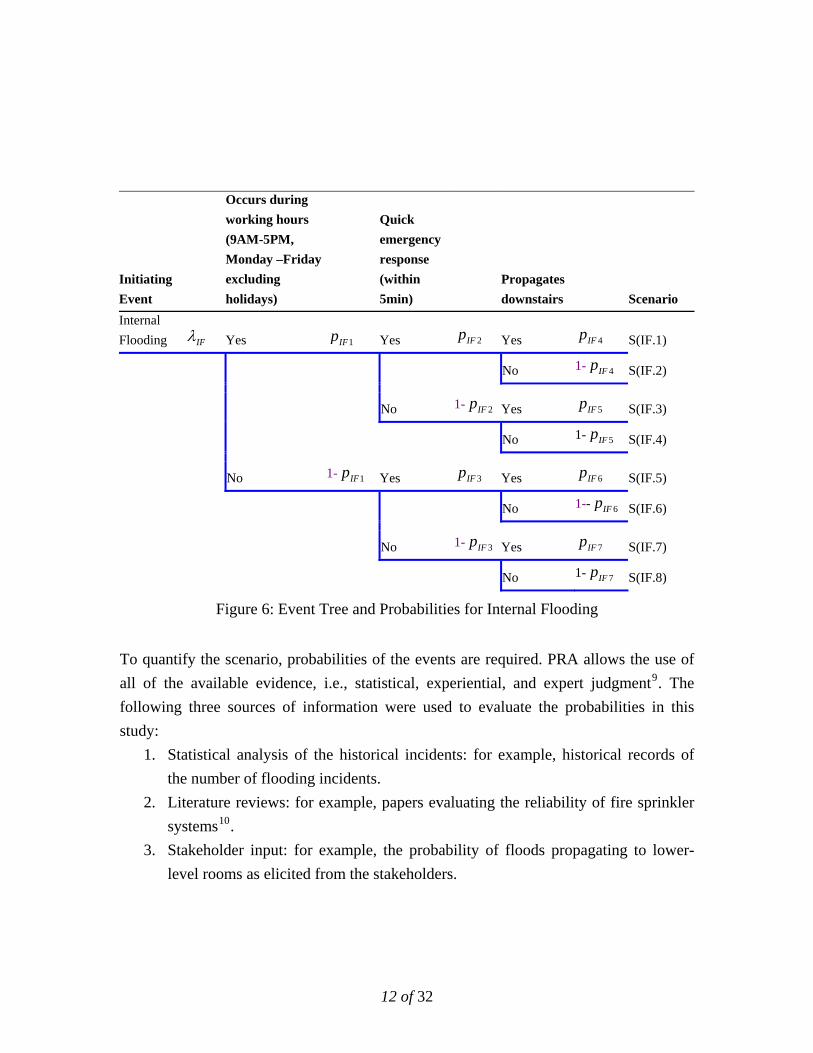
Event Trees are used to describe the scenarios. The event trees start from the initiating events (Table III). There are two types of initiating events: the initiating events that result in campus-wide damage and the initiating events that result in local damage. The former refers to the initiating events that lead to multi-location failures simultaneously; the latter refers to the initiating events that occur in a single location and will be bounded to local damage unless propagated. The branches of the tree denote the subsequent events. The end node of a branch is the end-state of a scenario. Figure 6 shows the event tree for internal flooding. This tree, as well as the physical consequences of the scenarios, are obtained from historical records and stakeholder input.
Table III: Initiating Events
Initiating Event Scope
Loss of electricity Leading to local damage Loss of water Leading to local damage Loss of chilled water Leading to local damage Loss of steam Leading to local damage Loss of natural gas Leading to local damage Internal flooding Leading to local damage Fire Leading to local damage Explosion Leading to local damage Campus-wide power outage Leading to Campus-Wide Damage Loss of water supply from City Leading to Campus-Wide Damage Rain storm Leading to Campus-Wide Damage Winter storm Leading to Campus-Wide Damage
11 of 32
Initiating Event
Occurs during working hours (9AM-5PM, Monday –Friday excluding holidays)
Quick emergency response (within 5min)
Propagates downstairs Scenario
Internal Flooding IFλ Yes 1IFp Yes 2IFp Yes 4IFp S(IF.1)
No 1- 4IFp S(IF.2)
No 1- 2IFp Yes 5IFp S(IF.3)
No 1- 5IFp S(IF.4)
No 1- 1IFp Yes 3IFp Yes 6IFp S(IF.5)
No 1-- 6IFp S(IF.6)
No 1- 3IFp Yes 7IFp S(IF.7)
No 1- 7IFp S(IF.8)
Figure 6: Event Tree and Probabilities for Internal Flooding
To quantify the scenario, probabilities of the events are required. PRA allows the use of all of the available evidence, i.e., statistical, experiential, and expert judgment9. The following three sources of information were used to evaluate the probabilities in this study:
1. Statistical analysis of the historical incidents: for example, historical records of the number of flooding incidents.
2. Literature reviews: for example, papers evaluating the reliability of fire sprinkler systems10.
3. Stakeholder input: for example, the probability of floods propagating to lower-level rooms as elicited from the stakeholders.
12 of 32

3.4 Data Collection and Stakeholder Input
To collect data and evaluate the scenario probabilities, we interviewed more than 50 stakeholders over the course of approximately 30 workshops. The workshops were organized and conducted by a team of analysts. The preparation for each workshop followed five steps11, as discussed below. Step 1: Interview preparation The first step was to select the stakeholders for interview. The stakeholders were selected to represent diverse interests including faculty, emergency coordinators, administrative staff, engineers, and others. Before interviewing the stakeholders, the DRU team prepared a document to provide general information about the study to help the stakeholders fully understand the context. Step 2: Introduction to the DRU project and gathering of general information Each session started with a presentation on the background, framework, and objectives of the project, as well as the benefits to the entire Institute. In this step, the information gathered from the interview was qualitative. The following questions were asked of the stakeholders:
• Question 1: What are the critical operations and activities in your department? • Question 2: What are the critical hazards for your department, e.g., floods, fires,
explosions, loss of utilities (e.g., power, water, chilled water, steam, natural gas)? • Question 3: What are the potential consequences when the incidents occur in your
department due to the above hazards? • Question 4: How do you perceive vandalism for your department? • Question 5: What would you do if you had the funding to mitigate the impact?
Step 3: Construction of the initial event trees and description of the physical consequences The stakeholders were trained on the concept of event trees through examples. Scenarios were generated and the physical consequences of the scenarios were gathered from the stakeholders. The interdependencies among the infrastructures, assets, and utilities within the department were also determined. Step 4: Elicitation of probabilities to quantify the scenarios
13 of 32

We found that the stakeholders were reluctant to provide probability values. To assist the stakeholders who had no background in probability, some guidance was provided. They were encouraged to try to imagine how many times out of 10 (or 100, etc.) would an event happen, given the preceding events in the event tree had occurred. In addition, in order to help control anchoring bias, they were asked to provide a lower bound and an upper bound, instead of just a best estimate of the probability. In Figure 6, the conditional probabilities for “quick emergency response” and “propagates downstairs” were elicited from the stakeholders. . Step 5: Validation of collected input The data that had been collected were sent to the stakeholders. The stakeholders reviewed, discussed, and refined the data until they agreed that the data provided satisfactory information.
3.5 Scenario Impact Evaluation
3.5.1 Value tree
Given that a failure occurs, the physical consequences could be material property loss, personal injury, environmental pollution due to release of hazardous chemicals, loss of research data, or even long-term research damage. These impacts are not commensurate. We evaluated the impact that these consequences have on the decision makers by borrowing the idea of objectives hierarchy and utilities from Multi-Attribute Utility Theory12 . In this study, we use the terms “impact categories” and “performance measures” in lieu of “objectives” because we are interested in the impact that the physical consequences have on the decision makers. We followed the steps below13:
1. Structuring the impact categories and performance measures; 2. Weighting objectives and performance measures; 3. Assessing disutility functions for the performance measures; 4. Performing consistency checks.
The benefit of an analysis that combines MAUT with PRA is that it provides a framework for the stakeholders to discuss the issues in detail, thus enhancing the chances that the stakeholders will reach consensus. It also provides opportunities for the stakeholders to create new decision alternatives (in the light of the PRA results) to better satisfy their preferences14.
14 of 32

An initial value tree (objectives hierarchy) was developed by the MIT Department of Facilities (DOF), to prioritize infrastructure renewal projects15. Later, Apostolakis and Lemon16 revised this value tree in order to use it in the context of malicious acts. The DRU’s value tree, shown in Figure 2, is a revision of the Apostolakis and Lemon value tree. The stakeholders agreed with the elements in the value tree, thus only one value tree was constructed. The reason for these revisions is that these investigators were dealing with different decision-making problems and their value trees had to reflect the preferences of their decision makers and stakeholders. Step 1: Structuring the impact categories and performance measures Three fundamental impact categories are identified (Figure 2):
1. Health, safety, and environment impact; 2. Economic impact on property, academic, and Institute operations; 3. Stakeholder impact.
The objectives are then followed by the identification of the Performance Measures (PM) or Attributes, which are used to measure the magnitude of the impact of each scenario. Natural scales measure directly the impact level, such as dollars for an economic impact, or lost work days for a safety impact. When natural scales do not exist, constructed scales are used. Each constructed scale consists of several levels with a description for each level. The constructed scales are developed for all the performance measures, as is shown in Table IV.
Table IV: Constructed Scales and Disutility Values for DRU’s Value Tree (the Global Weight is the product of the PM’s weight and the disutility)
1 Impact on people Weight 0.295
PM1: death, injury and illness (excluding psychological impact) on individuals. Major injuries are chronic injuries or acute injuries that require hospitalization; Minor injuries are acute injuries that do not require hospitalization.
Level Description Explanation Disutility Global Weight
4 Catastrophic safety impact Hundreds of minor and major injuries and/or tens of fatalities
1 0.295
3 Extreme safety impact Tens of major injuries and/or several fatalities 0.67 0.19765
2 Major safety impact (need hospitalization)
Tens of minor injuries and/or several major injuries
0.46 0.1357
1 Minor safety impact (no need Several minor injuries 0.05 0.01475
15 of 32

hospitalization) 0 No safety impact No personal impact 0 0
2 Impact on the environment Weight 0.196 PM2: the degree of impact on the environment of scenarios.
Level Description Explanation Disutility Global Weight
3 Major Environmental Impact Quantity of chemical involved in the incident reaches federal regulatory reporting thresholds
1 0.196
2 Moderate Environmental Impact
Quantity of chemical involved in the incident reaches state regulatory reporting thresholds
0.34 0.06664
1 Minor Environmental Impact Quantity of chemical involved in the incident is below regulatory reporting thresholds
0.04 0.00784
0 No Environmental Impact 0 0
3 Physical property damage Weight 0.049 PM3: the cost to restore the affected physical property and contents (land, buildings, and equipment).
Level Description Explanation Disutility Global Weight
4 Catastrophic physical property and contents damage
More than $10M 1 0.049
3 Extreme physical property and contents damage
$1M to $10M 0.27 0.01323
2 Major physical property and contents damage
$10K to $1M 0.03 0.00147
1 Minor physical property and contents damage
Less than 10K 0.01 0.00049
0 No physical property and contents damage
0 0
4 Interruption of Institute academic activities and operations Weight 0.056
PM4: the length of time needed to restore the academic activities and institute operations (teaching, research, and other supporting activities, such as work environment or living accommodations).
Level Description Explanation Disutility Global Weight
5 Catastrophic Interruption More than 6 months to restore 1 0.056 4 Extreme Interruption 1 to 6 months to restore 0.57 0.03192 3 Major Interruption Less than 1 month to restore 0.19 0.01064 2 Moderate Interruption Less than 1 week to restore 0.06 0.00336 1 Minor Interruption Less than 1 day to restore 0.02 0.00112 0 No Interruption 0 0
16 of 32

5 Intellectual property damage Weight 0.128 PM5: the degree of damage on the affected intellectual and intangible property.
Level Description Explanation Disutility Global Weight
3 Catastrophic Intellectual Property Damage
E.g. Long-term Experiments Lost 1 0.128
2 Major Intellectual Property Damage;
E.g. Artifacts and Rare Documents Lost 0.46 0.05888
1 Minor Intellectual Property Damage;
E.g. Non-backed up Electronic Data Lost 0.05 0.0064
0 No Intellectual Property Damage
0 0
6 Impact on external public image Weight 0.083
PM6: the degree of the negative image held by parents of prospective students, prospective students, granting agencies, donors, and regulatory agencies.
Level Description Explanation Disutility Global Weight
3 Major Degree of Adverse Publicity
E.g. National/International Media and affects Enrollment, Contributions, Program Funding, or Faculty Recruiting
1 0.083
2 Moderate Degree of Adverse Publicity
E.g. National Media 0.57 0.04731
1 Minor Degree of Adverse Publicity
E.g. Local Media 0.06 0.00498
0 No Adverse Publicity 0 0
7 Impact on internal public image Weight 0.055
PM7: the degree of the negative image held by parents of existing students, students, faculty, staff, and other members of the MIT community.
Level Description Explanation Disutility Global Weight
3 Major Degree of Adverse Publicity
E.g. Petitions, Demonstrations 1 0.055
2 Moderate Degree of Adverse Publicity
E.g. Negative Articles Published 0.34 0.0187
1 Minor Degree of Adverse Publicity
E.g. Verbal Complaints 0.04 0.0022
0 No Adverse Publicity 0 0
17 of 32

8 Program affected Weight 0.138
PM8: the impact on the business, operation, employment, and objectives of the Institute programs (departments, laboratories or centers).
Level Description Explanation Disutility Global Weight
4 Catastrophic impact on Institute programs
Tens of departments and/or thousands of employees are affected
1 0.138
3 Major impact on Institute programs
Several departments and/or hundreds of employees are affected
0.5 0.069
2 Moderate impact on Institute programs
1 department is affected and/or tens of employees are affected
0.23 0.03174
1 Minor impact on Institute programs
1 department is affected and/or several employees are affected. The activity can be restored by relocation.
0.02 0.00276
0 No Impact 0 0
Step 2. Weighting objectives and performance measures After constructing the PMs, the next step is to assign weights to the objectives and the PMs. These weights represent the preferences of the decision makers. When expressing preferences among the impact categories and PMs, the decision makers should not do so in a general sense, but rather, should be aware of the ranges of the consequences. When the range of the consequences changes, the preferences also change. Therefore, the range of the consequences should be determined before weighting. Many methods are available to elicit the weights from the stakeholders12,17. In this study, a first set of weights is produced by asking the decision makers to perform pairwise comparisons as prescribed by the Analytic Hierarchy Process (AHP)18. These preliminary weights are then discussed and possibly modified by the decision makers who must ultimately accept the weights as representing their preferences*. Eliciting value judgments is subject to bias and random errors; hence, it is important to check the consistency of the elements in the decision analysis. One advantage of using AHP is that it provides a numerical indicator, the Consistency Ratio (CR), which allows us to check the consistency of the pairwise comparisons. * The AHP has been criticized in the literature when it is proposed as a decision-making methodology. Here, it is used as a convenient means for a preliminary assessment of relative preferences. The AHP results are evaluated and modified, as appropriate, by the decision makers. The decision-making methodology that we use is the MAUT.
18 of 32
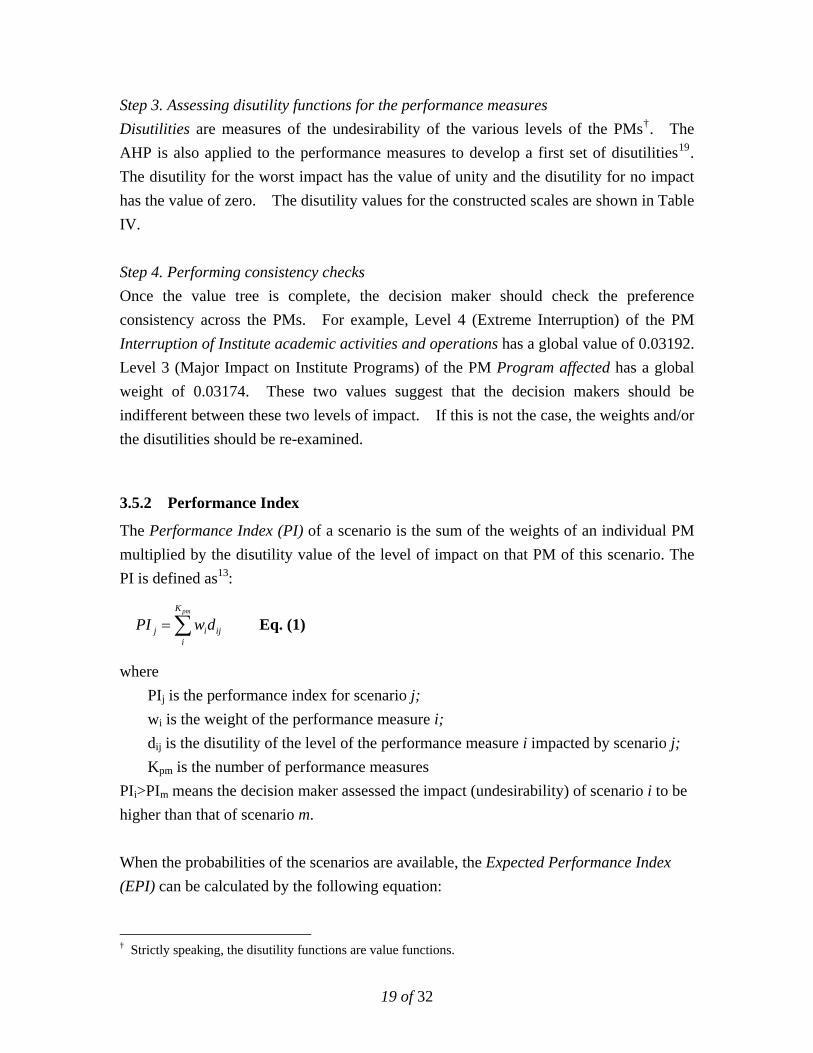
Step 3. Assessing disutility functions for the performance measures Disutilities are measures of the undesirability of the various levels of the PMs†. The AHP is also applied to the performance measures to develop a first set of disutilities19. The disutility for the worst impact has the value of unity and the disutility for no impact has the value of zero. The disutility values for the constructed scales are shown in Table IV. Step 4. Performing consistency checks Once the value tree is complete, the decision maker should check the preference consistency across the PMs. For example, Level 4 (Extreme Interruption) of the PM Interruption of Institute academic activities and operations has a global value of 0.03192. Level 3 (Major Impact on Institute Programs) of the PM Program affected has a global weight of 0.03174. These two values suggest that the decision makers should be indifferent between these two levels of impact. If this is not the case, the weights and/or the disutilities should be re-examined.
3.5.2 Performance Index
The Performance Index (PI) of a scenario is the sum of the weights of an individual PM multiplied by the disutility value of the level of impact on that PM of this scenario. The PI is defined as13:
Eq. (1) pmK
j ii
PI w d= ∑ ij
where PIj is the performance index for scenario j; wi is the weight of the performance measure i; dij is the disutility of the level of the performance measure i impacted by scenario j; Kpm is the number of performance measures PIi>PIm means the decision maker assessed the impact (undesirability) of scenario i to be higher than that of scenario m. When the probabilities of the scenarios are available, the Expected Performance Index (EPI) can be calculated by the following equation:
† Strictly speaking, the disutility functions are value functions.
19 of 32

pmK
j ijii
PI w d= ∑ Eq. (2)
where ijd is the expected disutility of performance measure i for scenario j
In this study, we distinguish between two kinds of risks: random failures and malicious acts. For random failures, the probability of occurrence (or frequency of occurrence) can be estimated from the historical records. Therefore, the expected performance index was used to rank the risks from random failures. However, for malicious acts, the probability of attack is not available. We used performance indices to denote the magnitude of such risks. Eq. (1) and Eq. (2) imply that we are using the additive value model. Although we have made every effort to assure utility independence among the PMs, such independence is difficult to ensure. We view this model as an approximation whose results will be scrutinized by the decision makers. As Clemen states12, “in extremely complicated situations with many attributes, the additive model may be a useful rough-cut approximation.”
3.5.3 Preliminary Risk Ranking
There are more than 270 scenarios for the risks from random failures (10 Macro-Groups with 27 end states for each plus several campus-wide random failures). Figure 7 ranks the risks according to the EPI for the top 80 scenarios from random failures. The PI values are also shown in the figure. For simplicity, the names of the scenarios, except for some examples, are not shown. According to the EPI magnitude, the scenarios were classified in three categories:
• Category I: high risk and high PI values; • Category II: moderate risk and high PI values; • Category III: low risk values, i.e. risks with low probability but severe
consequences The risks in Category I are the significant ones and include all the campus-wide random failures and a few scenarios for local internal flooding. Category II contains the moderate risks. The low-probability, high-consequence scenarios lie in Category III. Since the EPI is calculated from the product of probabilities and a performance index
20 of 32

representing the magnitude of the impact of the physical consequences, it makes sense that these scenarios have low EPI values because of their very low frequency of occurrence; however, these scenarios are still of concern due to their potential high impacts. Figure 8 shows the scenarios ranked according to the PI values. The scenarios for vandalism, which can not be shown in Figure 7 because of lack of probabilities of occurrence, are shown in Figure 8. According to the PI values, the risks are classified into four categories (Category A; Category B; Category C; Category D). The scenarios for vandalism on the key assets lie in the left side of the figure indicating their significant severe damage. These risks are followed by campus-wide random failures and fire-related scenarios.
0
20
40
60
80
100
120
140
160
Scenarios
EPI &
PI
EPI (*0.001) PI (*0.01)
c b
a
Category III Category II Category I
Figure 7: Preliminary Risk Ranking According to the EPI for the First 80 Scenarios
The dark bars show the EPI for campus-wide random failures, the cross-hatched bars show the EPI for local-damage random failures, and the grey bars show the PI for the corresponding scenarios.
For example:
a (the 1st black bar) refers to the scenario for campus-wide rain storm damage;
b (the 2nd cross-hatched bar) refers to the scenario for internal flooding at a specific MG;
c (gray bar) refers to the scenario for uncontrolled fire (sprinkler system failure if installed or sprinkler system is not installed) with fire alarm at a specific MG.
21 of 32

Figure 8: Preliminary Risk Ranking According to PI for the First 120 Scenarios
refer
gray with black l e) refers to vandalism, a licious act on a specific key
st ack bar) refers to campus-wide power outage for less than 8 hours during
rs to uncontrolled fire (sprinkler system failure if installed or sprinkler
0
10
20
30
40
50
60
70
80
90
Scenarios
PI (
*0.0
1) f e
d Category D Category C Category B Category A
The gray bars with black line refer to vandalism on the key assets, and the dark bars to the campus-wide scenarios.
For example:
d (the 1st bar, in maasset;
e (the 1 blworking hours;
f (gray bar) refesystem is not installed) without fire alarm at a specific MG.
22 of 32

3.5.4 Sensitivity Analysis
The risk ranking may change due to the uncertainty in the parameters (or inputs) in Eq. (1) and Eq. (2). A sensitivity analysis was performed on the frequencies of occurrence and the probabilities used in the event trees. The distribution of the frequency of occurrence was assumed to be lognormal and the 5th and 95th percentiles of the lognormal distribution were obtained from the stakeholder inputs. For the parameters elicited from the stakeholders, the uncertainty was modeled by a uniform distribution or triangular distribution, and their minimum and maximum values came from the stakeholder inputs.
The sensitivity analysis demonstrated that the top uncertain parameter was the frequency of the initiating event. The risk ranking was very sensitive to this parameter. The probability of failure of physical systems, such as emergency generators, backup batteries, fire sprinkler systems, and fire alarm systems, contributed little to the variation of ranking. This was because of the high reliability of these systems and the narrow range of the uncertain values.
3.5.5 Observations and Insights
Figure 7 and Figure 8 lead us to the following observations:
• Regardless of whether the probabilities of the scenarios are considered, the
campus-wide failures dominate the local-damage failures. Campus-wide failures
are shown in Category I within Figure 7 and in Category A within Figure 8, at the
left side of each of the figures.
• If the probabilities of the scenarios are considered, the risk from internal flooding
ranks the highest among the local-damage risks in Category I. If the
probabilities of the scenarios are taken out, most of these risks move from
Category I to Category C within Figure 8, while a few of them move to Category
B.
• For the local-damage failures, the risks from uncontrolled fires without fire alarm
rank very low (in Category III within Figure 7) if the probabilities of the scenarios
are considered. However, these risks rank the highest among all the local-
damage risks in Category A within Figure 8, because of their catastrophic
consequences.
23 of 32

• Vandalism, whose probability of attack is not available, dominates random failures (see Figure 8) in terms of the consequences. Vandalism on key assets whose failure could lead to campus-wide damage dominates the campus-wide damage scenarios from random failures.
The insights from the risk rankings are:
• When the risks have approximately the same values (EPI or PI), i.e., they are adjacent in the ranking, it is hard to judge whether one risk is higher than the other, since the slight difference in risk value may come from uncertainty in the parameters and variability in subjective judgments. Therefore, it not useful to emphasize the exact ranking order.
• This study has demonstrated that purely ranking the risks according to the expected consequences could prevent one from considering the potential impact of rare events. Thus, rare but catastrophic scenarios should not be discounted but evaluated to determine priority over other risks and in the context of what could be done to mitigate or eliminate the risk. For example, the risk from an uncontrolled fire in a building (in Category III in Figure 7, yet in Category A in Figure 8) could be reduced by installing fire sprinklers or removing or controlling fuel sources. These mitigation measures could cost much less than the cost due to an uncontrolled fire and such a beneficial outcome might not be realized unless low expected consequence events were discussed.
• Vandalism can only be addressed in the PI ranking, since the probability of attack is not available. The consequences from vandalism on some key assets can be comparable with (or even higher than) the consequences of rare but catastrophic risks, for example, the scenario uncontrolled fire without fire alarm.
4 Deliberation The National Research Council (NRC) recommends an analytic-deliberative process in the decision-making process. Deliberation, as defined by the NRC7, is “any formal or informal process for communication and collective consideration of issues. Participants in deliberation discuss, ponder, exchange observations and views, reflect upon information and judgments concerning matters of mutual interest and attempt to persuade each other.” The whole idea of deliberation is to force the stakeholders to think about the issues in detail by way of logic and a structured format. Thus, a truly wise decision can be reached.
24 of 32

An iterative deliberation process was used extensively in every stage of the process. Through deliberation, the stakeholders achieved consensus on the elements in the value tree. After the risk assessment was completed a deliberative process was used to determine the final risk ranking. In this deliberative process, the results were scrutinized and their validity was evaluated through discussion, reflection, and communication. The deliberation on the results is a very important step for the whole study because it increases understanding, overcomes the causes for mistrust, and brings new insights. Three types of participants were involved in this final deliberation process: stakeholders, the analyst, and a facilitator14. The stakeholders were told that the purpose of the analysis was not to simply produce the results but, rather, to help them understand the relative value and quality of the results, and develop insights from these results. The analyst not only presented what the risks were and what their ranking was, but also explained why the risks had such a ranking. For example, the risks from internal flooding rank high for the following reasons:
1. The frequency of internal flooding incidents is about 10 times that of other initiating events.
2. There is no centralized campus-wide physical prevention system for flooding, unlike fires for which sprinkler systems and alarm systems are installed.
3. The consequences of flooding could be very high. Deliberation was an interactive process. The stakeholders raised questions regarding the analysis, methodology, and the results. They also expressed their opinions of the results. For example, a stakeholder mentioned that the potential impact of the scenario Animal-Dominant Macro-Group loses chilled water supply on hot days is more severe than the potential impact of the scenario Animal-Dominant Macro-Group loses steam supply on cold days; however, in the preliminary risk ranking, these two scenarios had the same ranking. After going back and checking the data, we found that the reason for this ranking was because of the discrete constructed scales (for example, there are only five levels for the PM physical property damage), therefore, these two scenarios cannot be differentiated by their PI values.
25 of 32

5 Risk Management Risk management requires an understanding of hazards, reliable information, teamwork on the part of many segments of society, organizational entities capable of implementing actions, and rigorous supporting technical analyses 20 . We believe that prudent application of risk management will ensure the continuity of MIT’s research and education mission by:
1. Lessening damage by accident or failure; 2. Making potential targets less attractive to malicious acts, thereby reducing the
likelihood that those specific targets will be attacked; 3. Reducing the time necessary for recovery; and 4. Lessening the effects of collateral and cascading damage.
Potential risk mitigation strategies could include both engineering/technical and management solutions. Engineering solutions such as upgrading fire alarm and sprinkler systems would mitigate the physical property damages that could potentially result from a fire, while management solutions calling for periodically run fire evacuation drills would mitigate the potential for injuries. While insurance provides the ability to offset the risk associated with a hazard to a third party for a fee, one should consider that the proceeds from a claim in context of the sum of all damages less deductible, could be insufficient if intellectual property is lost or experiments are delayed. This is particularly true for experiments requiring animals as experimental subjects, multi-generational samples, or difficult to reproduce cell lines. Therefore, the philosophy of risk management at MIT is straightforward; understand dominant hazards and their potential impact well enough to determine whether the hazard could be prevented from occurring and to put in place physical protective barriers and systems and policies, procedures, and practices to prevent and/or mitigate the impact of those hazards, whether intentional or natural. Table V displays internal flooding, one of the credible risk exposures identified by this study, in the context of the risk scenario, magnitude of impact, root cause, existing mitigation plans and actions, and preliminary mitigation strategies. The purpose of the tabular format is to display all risks consistently so that deliberation and prioritization, ultimately the funding and implementation of mitigation efforts proceeds quickly. Similar entries were developed for other risk exposures.
26 of 32

Risk management is also useful when one attempts to implement measures necessary to mitigate high consequence low probability events. There are at least two ways to proceed: 1. Decide that high consequence events take absolute priority over lower consequence
events and 2. Learn more about the risks and selectively mitigate components of the risk. While both options are valid, the first can cause one to spend time, money, and effort on impacts that may never occur. The value of the second is best described by way of an example. Consider the scenario of an uncontrolled fire. In this instance, an uncontrolled fire refers to a fire that takes place in a space that is intentionally not protected by fire sprinklers. An example of the questions one should ask during deliberation is: are the spaces around the un-sprinkled space served by fire sprinklers? If yes, then the fire could be contained and the impact would be less than had the fire occurred in a building that does not have fire sprinklers. The point being that by understanding high-consequence low-probability events lower cost mitigation possibilities could emerge.
Table V: Risk Management for Internal Flooding
Risk Risk Explanation Causes Existing Mitigation Plans and Actions
Preliminary Mitigation Strategies
Internal flooding
Internal flooding ranks high because of the inherent opportunity for flooding in buildings containing many pipes and the frequency and magnitude of flooding experienced on campus. Currently there is no campus-wide physical defense system to prevent internal flooding or mitigate its damage
Faulty or failed plumbing, overflowing drains, condensation, faulty or accidentally damaged fire sprinkler systems
1. Plumbers and custodians directed to scene by way of radio and paging system 2. Water level detection system installed in select locations 3. Call-in process for additional help if needed 4. On-campus personnel repair
1. Seal penetrations, cracks, and holes through floors; prioritize according to potential for consequences, e.g. floors above shared experimental facility 2. Install check valves where they could be effective 3. Increase level of urgency of repair requests associated with potential pipe
27 of 32

One shared facility contains many very expensive experimental devices and serves hundreds of researchers annually. Thus potential for delays in research and high costs associated with damage to equipment and the loss of research income.
systems when failure is observed and reported 5. Fire sprinkler water flow alarm system alerts central operations center personnel of water flowing through sprinkler pipes whether or not a fire is present 6. Sectional valves, where present, prevent impact due to accidental breakage of fire sprinkler heads or piping in active construction sites
breaks 4. Verify call-in procedures and policies for all personnel associated with flood and storm damage response 5. Study need for additional water detectors 6. Install sectional valves on fire sprinkler systems 7. Require that renovation contractors submit and adhere to an agreed upon flood mitigation plan 8. Insert text in design guidelines that addresses flood mitigation in the early stages of design
6 Summary Confronting the natural hazards, human-induced accidents, and malicious acts, we have developed a systematic method to assess and rank the risks in a community. This method is based on a formal, self-consistent decision-making process that integrates probabilistic risk assessment, decision analysis, expert judgment, and other disciplines. A scenario-based model is implemented to show where the risks are and their magnitudes, how the initiating events evolve into the undesirable consequences, and how to generate mitigation alternatives to handle the risks. A value tree, based on Multi-Attribute Utility Theory, is used to capture the stakeholders’ preferences in the analysis. The risks from the random failures are ranked according to their Expected Performance Index (EPI). The risks are also prioritized according to Performance Index (PI) to include the malicious acts from which the risks can not be captured in EPI as the probability of attack is not available.
28 of 32

By implementing this framework in a test-bed (the MIT campus), it has been demonstrated that this framework is reasonable, practical, transparent, and can be used by other similar communities. For example, the delineation of Macro-Groups allows for the often decentralized elements of a university’s infrastructure and key assets to be aggregated into clusters that are readily recognizable from one university to another. Furthermore, these Macro-Groups are defined with sufficient granularity that the concept can be transferred to perform multi-hazard vulnerability assessments at other decentralized entities such as research and teaching hospitals, government research laboratories, and similarly sized municipalities. Another contribution of the research is that it provides a framework for the development of a risk-informed decision strategy. Compared to the risk-based approach which relies heavily on technical expertise, this approach includes not only a formal, quantitative, and replicable analysis, but also a deliberative process to capture the factors that could not be addressed in the analysis. Furthermore, the methodology enables the stakeholders to provide additional input that reflects the stakeholders’ preferences in the analysis. It also provides a platform for the stakeholders to discuss and communicate during the decision process. The limitations of the study are the following:
This study focuses on high-level risk assessment. Only significant scenarios are captured in the scenario development. As a starting point of continuous risk management, it has provided satisfactory results in this phase. We anticipate that once the decision has been made to manage some risks, more detailed scenarios should be developed for the selected risks.
In terms of utilities (infrastructures), we only assessed the risks for the utility end-users and the utility sources (generators). For the infrastructure network, like our test-bed, the analysis has provided an overview of the risks across the utility network. However, for a larger and more complex infrastructure network, rigorous network analyses should be implemented to analyze the critical locations (nodes) in the network. We anticipate the ideas generated from this study will help to assess the risks due to multiple hazards for these critical locations.
The existence of incompleteness and uncertainties may weaken the results of the model. In this study, the potential uncertainties are: the possibly incomplete scenarios, the probabilities of the scenarios, the elements in the value tree (for example, constructed scales are used instead of continuous disutility functions),
29 of 32
and the conservative estimation of the physical consequences. It is also assumed that the occurrence of failures is homogeneously distributed across the campus, and that the locations with similar operations and activities have the same consequences in terms of the same scenario. These assumptions may also lead to uncertainties. The sensitivity analysis demonstrated that the frequency of occurrence is the top uncertainty parameter. We anticipate the uncertainties will decrease through further analysis in future work.
Acknowledgement We thank the Federal Emergency Management Agency for their consideration and funding of the study and results presented herein. Additionally, we extend our appreciation to the Massachusetts Emergency Management Agency, and its representative Mr. Scott MacLeod, who offered valuable guidance in the execution of this study. We also thank William McShea and Gerald Isaacson for their participation in this project. Finally, the DRU project team thanks the Institute’s stakeholders and decision makers along with MIT’s leadership for their insightful, frank discussions and commitment to this project, without which the vulnerability assessment and analysis would not have been possible.
References 1 M. C. Comerio, V. Bertero and J. M. Quigley (2000), The Economic Benefits of a Disaster Resistant University: Earthquake Loss Estimation for UC Berkeley, IURD WP #2000-02, University of California, Berkeley, CA. 2 M. C. Comerio, J. C. Stallmeyer, Y. I. Kim, K. Hung, S. Lau, R. Dooley, R. Smith and J. I. Kim (2003), Seismic Protection of Laboratory Contents: The UC Berkeley Science Building Case Stud, Working Paper 2003-02, University of California, Berkeley, CA. 3 UNCW (2003), The University of North Carolina at Wilmington Hazard Assessment, University of North Carolina, NC. 4 H. K. Florig, M. G. Morgan, K. M. Morgan, K. E. Jenni, B. Fischhoff, P. S. Fischbeck and M. L. DeKay (2001), “A Deliberative Method for Ranking Risks (I): Overview and Test Bed Development”, Risk Analysis 21(5): 913-921. 5 K. M. Morgan, M. L. DeKay, P. S. Fischbeck, M. G. Morgan, B. Fischhoff and H. K. Florig (2001), “A Deliberative Method for Ranking Risks (II): Evaluation of Validity and Agreement among Risk Managers”, Risk Analysis 21(5): 923-937.
30 of 32

6 C. J. Andrews, D. Hassenzahl and B. Johnson (2003), Legitimizing Uncertain Risk Information, http://radburn.rutgers.edu/andrews/projects/njcrp/ACSP03.pdf. 7 National Research Council (1996), Understanding Risk: Informing Decisions in a Democratic Society, National Academy Press, Washington, DC. 8 S. M. Rinaldi, J. P. Peerenboom and T. K. Kelly (2001), “Identifying, Understanding, and Analyzing Critical Infrastructure Interdependencies”, IEEE Control Systems Magazine 21(6): 11-25. 9 G. E. Apostolakis (1990), “The Concept of Probability in Safety Assessments of Technological Systems”, Science 250: 1359-1364. 10 R. W. Bukowski, E. K. Budnick, and C. F. Schemel (1999), “Estimates of the Operational Reliability of Fire Protection Systems”, International Conference on Fire Research and Engineering (ICFRE3), Third (3rd). Proceedings. Society of Fire Protection Engineers (SFPE), National Institute of Standards and Technology (NIST) and International Association of Fire Safety Science (IAFSS). October 4-8, 1999, Chicago, IL, Society of Fire Protection Engineers, Boston, MA, 87-98 pp, 1999. 11 R. L. Keeney and D. von Winterfeldt (1991), “Eliciting Probabilities from Experts in Complex Technical Problems”, IEEE Transactions on Engineering Management 38(3): 191-201. 12 R. T. Clemen (1996), Making Hard Decisions-An Introduction to Decision Analysis, Second Edition, Duxbury Press, Belmont, California. 13 R. Weil and G. E. Apostolakis (2001), “A Methodology for the Prioritization of Operating Experience in Nuclear Power Plants”, Reliability Engineering and System Safety 74: 23-42.
14 G. E. Apostolakis and S. E. Pickett (1998), “Deliberation: Integrating Analytical Results into Environmental Decisions Involving Multiple Stakeholders”, Risk Analysis 18(5): 621-634. 15 D. M. Karydas and J. F. Gifun (2006), “A Method for the Efficient Prioritization of Infrastructure Renewal Projects”, Reliability Engineering and System Safety 91: 84-99. 16 G. E. Apostolakis and D. M. Lemon (2005), “A Screening Methodology for the Identification and Ranking of Infrastructure Vulnerabilities Due to Terrorism”, Risk Analysis 25(2): 361-376. 17 R. L. Keeney and H. Raiffa (1993), Decisions with Multiple Objectives: Preferences and Value Tradeoffs, Cambridge University Press, Cambridge, United Kingdom. 18 T. L. Saaty (2000), Fundamentals of Decision Making and Priority Theory with the Analytic Hierarchy Process, University of Pittsburgh, Pittsburgh, Pennsylvania. 19 W.R. Hughes (1986), “Deriving Utilities Using the Analytic Hierarchy Process”, Socio-Economic Planning Sciences 20(6): 393-395. 20 J. Garrick, J. E. Hall, M. Kilger, J. C. McDonald, T. O’Toole, P. S. Probst, E. R. Parker, R. Rosenthal, A. W. Trivelpiece, L. A. Van Arsdale and E. L. Zebroski (2004), “Confronting the
31 of 32

Risks of Terrorism: Making the Right Decisions”, Reliability Engineering & System Safety 86(2): 129-176.
32 of 32