A morphological approach to the problem of the biological similarity of Jewish and non-Jewish...
10
ANNALS OF HUMAN BIOLOGY, 1985, VOL. 12, NO. 3, 203-212 A morphological approach to the problem of the biological similarity of Jewish and non-Jewish populations E. KOBYLIANSKY and G. LIVSHITS Department of Anatomy and Anthropology,Tel AvivUniversity Received 6 A ugust 1984; revised 20 November 1984 Summary. The genetic kinship between various Jewish and non-Jewish groups, from the biochemical standpoint, has been much investigated, frequently with very contradictory conclusions. The present paper reports the results of two comparative analyses of several Jewish and non-Jewish populations as based on morphological measurements of adult males. The first analysis employeddata on Jewish and non-Jewish communities from five geographicregions of the world. The dendrogram resulting from the cluster analysis clearly indicates that Jewish populations are much closer to one another than to non-Jewish neighbour groups. In the second analysis, 25 ethnoterritorial groups of the USSR (one Jewish and the rest non-Jewish) were evaluated on the basis of 27 anthropometric characters. The latter Jewish group was markedly separate from the other 24 ethnic groups, and especiallydistinct when only traits with high coefficientsof heritability were employed. 1. Introduction The genetic relationship between various Jewish and non-Jewish populations has been repeatedly debated in the literature. Recent studies on the distribution of bio- chemical markers in these populations have led to very contradictory conclusions. For example, Mourant, Kopec and Domaniewska-Sobczak (1978) maintained that 'each major Jewish community as a whole bears some resemblance to the indigenous peoples of the regions where it first developed'. Along the same line, the evaluation by Morton, Kenett, Yee and Lew (1982) of admixture between Jewish and non-Jewish groups showed very high levels of intermixing (the levels of intermixture ranged between 47.1 and 100% for different paired comparisons). Similarly, Chakraborty and Weiss (1982), who compared four Jewish and four non-Jewish populations, concluded that Nei's standard genetic distance measures indicate that the Jewish populations are genetically close to their geographically neighbouring gentile populations. On the other hand, however, Kobyliansky, Micle, Goldschmidt-Nathan, Arensburg and Nathan (1982) showed that the genetic similarity between the majority of the Jewish populations is significantly greater than that between Jewish and non- Jewish populations. It has further been shown that the proportion of diversity among and the Wright standard genetic variance (Fst) between populations of Jews, are lower than for comparable non-Jewish populations (Kobyliansky and Livshits 1983). Karlin, Kenett and Bonne-Tamir (1979), using a non-parametric statistical methodology to analyze biochemical frequency data obtained on a series of nine Jewish and six non- Jewish populations, showed clear similarity between large Jewish communities, whereas the non-Jewish groups were distinctly separate. The overall result of this and most other investigations was merely the significant segregation (from among Jewish as well as non-Jewish populations) of small and isolated Jewish groups (like Samaritans, Habbanites and Yemenites). However, as noted by Kobyliansky and Micle (1982), the random genetic drift is sufficient to explain any departures of these communities from the characteristic Jewish gene frequencies. Ann Hum Biol Downloaded from informahealthcare.com by Tel Aviv University on 08/15/15 For personal use only.
Transcript of A morphological approach to the problem of the biological similarity of Jewish and non-Jewish...

ANNALS OF HUMAN BIOLOGY, 1985, VOL. 12, NO. 3, 203-212
A morphological approach to the problem of the biological similarity of Jewish and non-Jewish populations
E. KOBYLIANSKY and G. LIVSHITS
Department of Anatomy and Anthropology, Tel Aviv University
Received 6 A ugust 1984; revised 20 November 1984
Summary. The genetic kinship between various Jewish and non-Jewish groups, from the biochemical standpoint, has been much investigated, frequently with very contradictory conclusions. The present paper reports the results of two comparative analyses of several Jewish and non-Jewish populations as based on morphological measurements of adult males. The first analysis employed data on Jewish and non-Jewish communities from five geographic regions of the world. The dendrogram resulting from the cluster analysis clearly indicates that Jewish populations are much closer to one another than to non-Jewish neighbour groups. In the second analysis, 25 ethnoterritorial groups of the USSR (one Jewish and the rest non-Jewish) were evaluated on the basis of 27 anthropometric characters. The latter Jewish group was markedly separate from the other 24 ethnic groups, and especially distinct when only traits with high coefficients of heritability were employed.
1. Introduction The genetic relationship between various Jewish and non-Jewish populations has
been repeatedly debated in the literature. Recent studies on the distribution of bio- chemical markers in these populations have led to very contradictory conclusions. For example, Mourant, Kopec and Domaniewska-Sobczak (1978) maintained that 'each major Jewish community as a whole bears some resemblance to the indigenous peoples of the regions where it first developed'. Along the same line, the evaluation by Morton, Kenett, Yee and Lew (1982) of admixture between Jewish and non-Jewish groups showed very high levels of intermixing (the levels of intermixture ranged between 47.1 and 100% for different paired comparisons). Similarly, Chakraborty and Weiss (1982), who compared four Jewish and four non-Jewish populations, concluded that Nei's standard genetic distance measures indicate that the Jewish populations are genetically close to their geographically neighbouring gentile populations.
On the other hand, however, Kobyliansky, Micle, Goldschmidt-Nathan, Arensburg and Nathan (1982) showed that the genetic similarity between the majority of the Jewish populations is significantly greater than that between Jewish and non- Jewish populations. It has further been shown that the proportion of diversity among and the Wright standard genetic variance (Fst) between populations of Jews, are lower than for comparable non-Jewish populations (Kobyliansky and Livshits 1983). Karlin, Kenett and Bonne-Tamir (1979), using a non-parametric statistical methodology to analyze biochemical frequency data obtained on a series of nine Jewish and six non- Jewish populations, showed clear similarity between large Jewish communities, whereas the non-Jewish groups were distinctly separate. The overall result of this and most other investigations was merely the significant segregation (from among Jewish as well as non-Jewish populations) of small and isolated Jewish groups (like Samaritans, Habbanites and Yemenites). However, as noted by Kobyliansky and Micle (1982), the random genetic drift is sufficient to explain any departures of these communities from the characteristic Jewish gene frequencies.
Ann
Hum
Bio
l Dow
nloa
ded
from
info
rmah
ealth
care
.com
by
Tel
Avi
v U
nive
rsity
on
08/1
5/15
For
pers
onal
use
onl
y.
204 E. Kobyliansky and G. Livshits
Thus, the question of the degree of genetic similarity between diverse Jewish and non-Jewish populations awaits further research and resolution. Morton (1982), replying to numerous comments on his analysis, wrote: ' those who reject the present evidence for substantial admixture have an obligation to support their position with objective, quantitative arguments, necessarily based on biological d a t a . . . '.
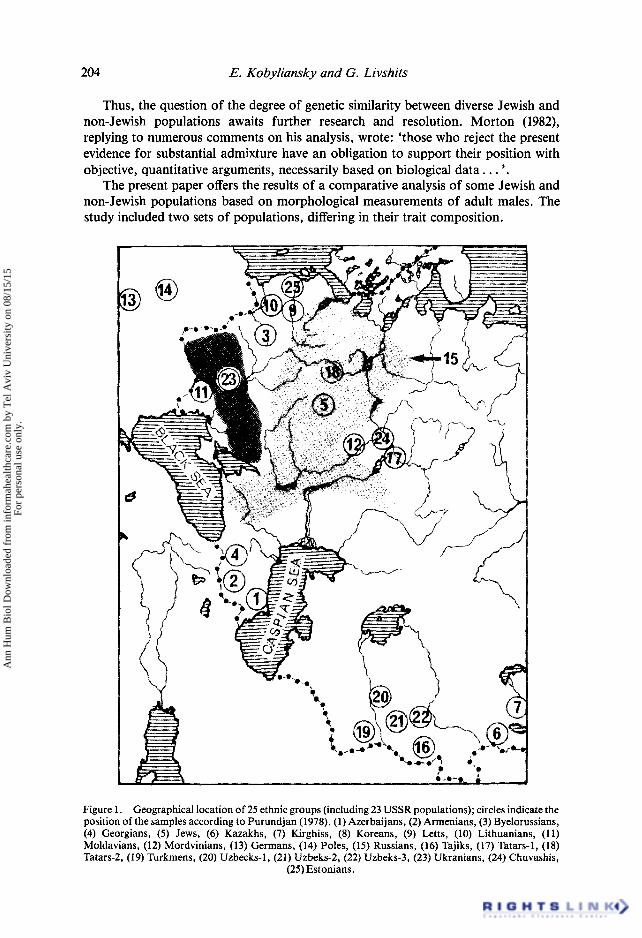
The present paper offers the results of a comparative analysis of some Jewish and non-Jewish populations based on morphological measurements of adult males. The study included two sets of populations, differing in their trait composition.
.. : i i : ,
\
/
• , ...... e . o , - , _ i _ :_
Figure 1. Geographical location of 25 ethnic groups (including 23 USSR populations); circles indicate the position of the samples according to Purundjan (1978). (1) Azerbaijans, (2) Armenians, (3) Byelorussians, (4) Georgians, (5) Jews, (6) Kazakhs, (7) Kirghiss, (8) Koreans, (9) Letts, (10) Lithuanians, (11) Moldavians, (12) Mordvinians, (13) Germans, (14) Poles, (15) Russians, (16) Tajiks, (17) Tatars-1, (18) Tatars-2, (19) Turkmens, (20) Uzbecks-1, (21) Uzbeks-2, (22) Uzbeks-3, (23) Ukranians, (24) Chuvashis,
(25) Estonians.
Ann
Hum
Bio
l Dow
nloa
ded
from
info
rmah
ealth
care
.com
by
Tel
Avi
v U
nive
rsity
on
08/1
5/15
For
pers
onal
use
onl
y.
Similarity of Jew&h and non-Jewish populations 205
2. Material and methods For a first comparison, we analyzed the data on Jewish and non-Jewish populations
from five geographical regions: East Europe; Central Europe; South Europe; Middle East (but only on the indigenous Jewish population); North Africa. The following traits were included in the analysis: Weight; stature; bi-acromial diameter; bi-iliac diameter; bi-acromial diameter/sitting height; and weight/stature. Data on morphological traits of Jews were adopted from Medalie, Kahn, Neufeld, Groen and Riss (1968), on non- Jews from the three European regions, from Eveleth and Tanner (1976) and on North African gentiles, from El Batrawi (1964). We used only data on males. All Jewish groups were represented by individuals aged 40-44 years, and measurements within this age group were made in 1963 and partly in 1965. Ages of European non-Jewish males ranged between 20 and 39 years and the appropriate data on them were extracted from Eveleth and Tanner (1976) which relied on studies published during 1967-1970. Use was made also of the data of El Batrawi (1964) obtained in 1958/59 on physical traits of adult males over 19 years of age (the sample sizes for five geographical regions (Jews and non-Jews) vary between 386 and 1084 individuals). The compared groups displayed only negligible differences that could have stemmed from a secular trend.
Pairwise morphological associations among the groups were obtained by the Euclidean distance (Lalouel 1980):
D = (Xik- Xjk) 2 1
where D is the morphological difference between two populations (i and j), X is the mean value of the kth trait in these populations, and n is the number of traits. Since many of the morphological traits could not be compared, all the traits were standardized by dividing each mean value by its standard deviation (= s.d. between groups). Thus, X actually represents not the average but rather X/s.d. The results of calculations were further subjected to a cluster analysis (UPGMA Method) which in turn led to the construction of simple dendrograms.
For the second set of populations we used Kurshakova's (1978, 1980) and Purundjan's (1978) data on 27 anthropometric characters (listed in the table) for 25 ethnoterritorial groups of the USSR, Poland and Germany, including, among others, European Jews. Each of these groups (excluding only Russians and Ukranians) was represented by a sample of approximately 45 young males aged 18-25 years. The Russian and Ukranian groups comprised 26 and 10 samples, respectively, taken from the European part of the USSR. The geographical location of the samples is shown in figure 1. These data were converted to a similar statistical analysis.
3. Results
Five geographic regions The dendrogram resulting from the cluster analysis is presented in figure 2. It is
evident that Jewish populations are much closer to one another than to non-Jewish groups, forming a separate cluster. Morphological distances (D) ranged from 0.228 (between Central and South European Jewish groups) to 6.558 (between Central European Jewish and North African non-Jewish populations), with an average of 3"216. The average value of D between Jewish communities was 0.780, and between Jews and non-Jews 4-044.
Ann
Hum
Bio
l Dow
nloa
ded
from
info
rmah
ealth
care
.com
by
Tel
Avi
v U
nive
rsity
on
08/1
5/15
For
pers
onal
use
onl
y.

206 E. Kobyliansky and G. Livshits
Table. List of anthropometric traits used in cluster analysis.
1. Vertex-suprasternal height 2. Trunk length 3. Thigh length 4. Tibial height 5. Foot length 6. Hand length 7. Digit III: first phalangeal length 8. Digit III: second phalangeal length 9. Upper arm length
10. Forearm length 11. Breadth of humeral slope 12. Bi-acromial breadth 13. Bi-iliac breadth 14. Foot breadth 15. Dorsum-heel circumference 16. Head circumference 17. Neck circumference 18. Mesosternal chest circumference 19. Waist circumference 20. Thigh circumference 21. Calf circumference 22. Upper arm circumference 23. Forearm circumference 24. Wrist circumference 25. Subscapular skinfold 26. Upper arm skinfold 27. Arch of upper trunk passing over the humeral point
0.0
1.2
2.4
3.6
4.;
6.0
1 2 3 4 5 6 7 8 9
IT 1 I
Figure 2. Dendrogram resulting from cluster analysis of morphological distances between some Jewish (1-5) and non-Jewish (6-9) populations. (1, 6) Central Europe, (2, 7) South Europe, (3, 9) North Africa,
(4, 8) East Europe, (5) Middle East.
Ann
Hum
Bio
l Dow
nloa
ded
from
info
rmah
ealth
care
.com
by
Tel
Avi
v U
nive
rsity
on
08/1
5/15
For
pers
onal
use
onl
y.

Similarity o f Jewish and non-Jewish populations 207
The extruding population was the North African non-Jewish group, with a mean morphological distance of 5.802 f rom the other populations. It should be noted that this group comprised a Bedouin population inhabiting the western desert of North Africa, and thus sequestered from and living in a very different environment than the other studied populations. The differences in environmental conditions between European Jews and non-Jews living in the same country were hardly greater than those between Jewish (or non-Jewish) populations living in different countries. Nevertheless, there was a significantly closer similarity between the Jews f rom various geographical areas than between the Jewish and non-Jewish communities f rom the same area. Hence, it is likely that such similarity of dissimilarity derives significantly f rom the genetic background. This is indeed suggested from our cluster analysis of 25 ethno- territorial groups of the USSR.
Comparison o f the USSR populations Since the Jewish sample in the present study was taken f rom the European part of
the USSR, we can expect a priori that it will be near to the Russian (or Ukranian, or Byelorussian) group with which it has been in social and geographical contact for a long period of time. However, as can be seen in figure 3, the Jewish population is far removed from the Russian one, as well as from any other. The average morphological distance between such different populations, as listed in figure 3, was 42.87 whereas the
O'
20-
40"
60"
80-
100
120
147"
227"
I 2 20 7 14 15 13 18 23
1 I
3 10 12 4 19 16 21 22 24 17
IT 1 8 9 25
Figure 3. Dendrogram resulting from cluster analysis of morphological distances between 25 ethnic groups of the USSR. 5 represents the Jewish populations: Assignation of the other populations is given in
figure 1.
Ann
Hum
Bio
l Dow
nloa
ded
from
info
rmah
ealth
care
.com
by
Tel
Avi
v U
nive
rsity
on
08/1
5/15
For
pers
onal
use
onl
y.

208 E. Kobyliansky and G. Livshits
mean morphological distance of the Jewish community from all other groups was approximately 124.3. The distance between the Jewish group and a cluster including a Russian population was 106, i.e. approximately six times more than between Russians and Germans. We should note, however, that the Slavic communities of the USSR (Russians, Ukranians and Byelorussians), which are expected to be very close on an ethnic, geographical and social basis, showed a significant dissimilarity (figure 3). For instance, the morphological distance between Ukranians and Caucaso-Asiatic clusters (1, 2, 7, 20) was only half that between Ukranians and the cluster including Byelo- russians. The morphological proximity of Russians and Germans (13, 15), Byelo- russians and Lithuanians (3, 10) and some others is questionable. Therefore, the position of the Jewish group on the dendrogram may also be doubtful.
In order to define more accurately the clustering pattern we used two additional approaches to data analysis. In the first, the clusterization was carried out on the matrix of the variances of deviations of average values of traits between each pair of populations (figure 4). Such variance reflects differences in bodily proportions (or in other words, differences in the average value ratios for the 27 traits under consider- ation) between compared populations. A zero value of variance would imply an absence of any differences in bodily proportions.
Figure 4 shows changes in the cluster compositions. We can note, for example, that the Byelorussians, Ukranians, Russians and Tatars are connected in one cluster, which is in agreement with ethnic, geographical and historical facts. Three Uzbekian and two Tatarian samples are now much nearer than appeared previously. However, despite these changes in the dendrogram composition, the Jewish group remains separate and removed from other populations, much the same as was observed for a Korean
0
0.5-
1.0-
1.5"
2.0-
I 2 2 0 4 16 22 21 11
I
3 23 15 18 I0 17 13 24 14 12 6 7 19
i
I
9 2 5 :
L,A Figure 4. Dendrogram resulting from cluster analysis o f morphologicai shape distances between 25 ethnic groups of the USSR. To measure morphological distance here we used an integrated evaluation of a difference in bodily proportion, as calculated from the formula:
dk(i,j) = (Xki-Xkj) /s .d . k
~(dk - dk)2 D i j = n - I
where )?ki andXkj are the mean values of the trait k in populations i and j; a k is the mean difference between each pair of populations for 27 studied characters, n is the number of studied traits. For population
designations see figure 1.
Ann
Hum
Bio
l Dow
nloa
ded
from
info
rmah
ealth
care
.com
by
Tel
Avi
v U
nive
rsity
on
08/1
5/15
For
pers
onal
use
onl
y.
Similarity o f Jewish and non-Jewish populations 209
population and for the Latvian and Estonian cluster, which also barely changed their relative position vis-a-vis figure 3.
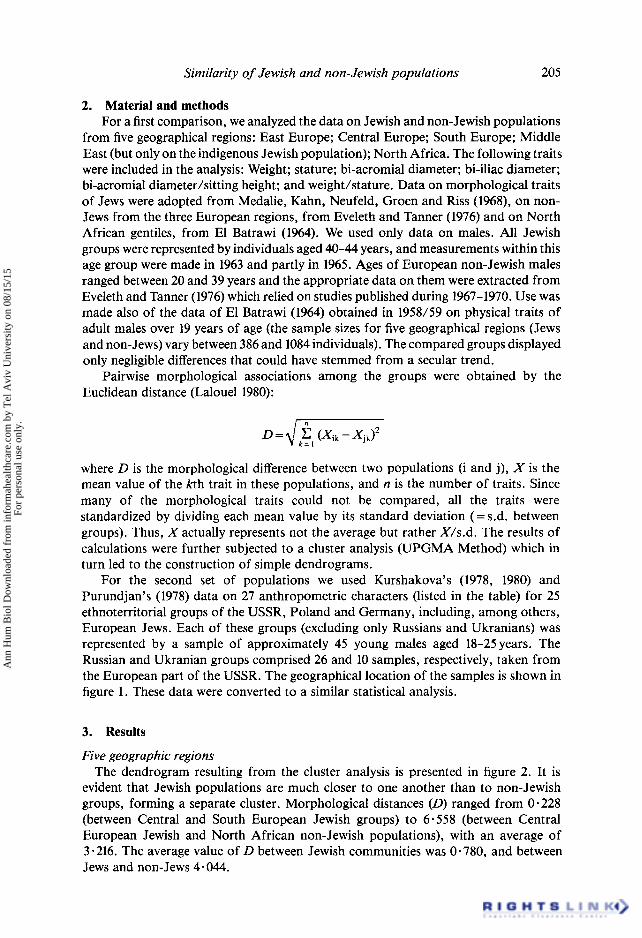
In the second approach we reasoned that the resolution capacity of the morpho- logical distance measures will be higher if we take into consideration only traits with high heritability coefficients. In this way we should reduce accidental environmental effects on the matrix of the morphological distances. The 10 traits in which the herit- ability coefficients were higher than 0-65 were, as based on Osborne and De George (1959), Susanne (1979), Kobyliansky (1984): stature; femur length; hand length; foot length; first phalange of digit III; second phalange of digit III; upper arm length; forearm length; head circumference; and chest circumference.
As evident from figure 5, the use of these traits makes characterization of commun- ities sufficiently more logical than previously (figure 3). As for figure 4, figure 5 also shows the three Slavic groups within a separate cluster. Ethnically close groups (Uzbeks and Takjiks, Kirghiss and Kazakhs, Lithuanians and Germans) are shown in figure 5 as joined pairs. The last dendrogram is also in good agreement with the geographical distribution of most of the ethnic groups (figure 1), for the geographically close groups are likewise close on the dendrogram. However, the Jewish population, as in figures 3 and 4, is positioned separately.
Discussion Thus comparison of morphological traits of five Jewish and four non-Jewish
populations from five geographical regions show a significantly higher similarity between the Jewish groups than between Jewish and non-Jewish populations from the areas. The Jewish population in the USSR is shown to be morphologically strongly separated from 24 other ethnic groups living in the USSR, Poland and Germany. This
O.
1.2.
2.4.
3.6 t
21 16 17 24
T
2 7 6
I 19 12 10 13 23 15 3
i
5 9
Figure 5. Dendrogram resulting from cluster analysis of morphological distances between 19 ethnic groups of the USSR (six other ethnic groups were not included in the analysis primarily owing to a lack of published data of them), based on 10 high heritable traits. For populat ion designation see figure 1.
Ann
Hum
Bio
l Dow
nloa
ded
from
info
rmah
ealth
care
.com
by
Tel
Avi
v U
nive
rsity
on
08/1
5/15
For
pers
onal
use
onl
y.

210 E. Kobyliansky and G. Livshits
separation, and the dendrogram in general, are particularly evident when using only anthropometric traits with high coefficients of heritability, or when employing the matrix of variance to the deviations of average values of all the studied traits.
The present results are in agreement with our previous analyses (Kobyliansky et al. 1982, Kobyiiansky and Livshits 1983). Taking the matrix of the biochemical distances (Cavalli-Sforza's method) between some Jewish and non-Jewish populations, based on the frequencies of 22 alleles from l0 loci (Kobyliansky et al. 1982), we calculated the Spearman rank correlation with the morphological distances used in the first part of the present study. The correlation coefficient was found to be high and significant (r s = 0.743, P < 0"01), indicating that the divergence in morphology is correlated with the divergence at relatively simple genetic systems and, therefore, can also be considered as genetic differentiation. Confirmation of this may serve the results of our cluster analysis of 25 Soviet ethnic groups, carried out on traits with high heritability coefficients. One can well understand that the analysis is not entirely correct since in practice there is no way of estimating cultural heritability and the environmental components within the phenotypic variance of morphological traits in random samples. However, since as it is well known (and we see this in Israel) that the cultural (dietary habits, clothing, mode of life) and climatic similarity between Jews and gentiles from some countries was much more than those between different Jewish groups, the genetic component of morphological similarity between Jews would be underestimated rather than overestimated.
However, comparative studies of individual morphological traits of Jewish and non-Jewish groups in some communities do appear similar. Such findings, for example, concern stature, hair colour and nose shape (Patai and Wing 1975) as well as cephalic index (Pearson 1936). Pearson determined the correlation of Jewish and Gentile cephalic indices to be 0.84 in several populations. These latter observations touch on a very important problem of phenotypic plasticity and human adaptation in various environments. Three possible mechanisms may be offered as an explanation for the aforementioned observations and similar 'migrational effects' which have been observed in other ethnic groups (Shapiro 1939, Goldstein 1943, Lasker 1952, Hulse 1968, Kobyliansky and Arensburg 1977; for a brief review see Hulse 1981): (1) a con- siderable amount of intermarriage between Jews and gentiles, as we have noted above, or perhaps more generally between migrant and indigenous populations; (2) adaptations in the limits of the norm of reaction provoked by environmental influences; and (3) genetic changes caused by selection.
Intermixing of populations must lead to a levelling of the interpopulational differ- ences in all traits. It seems obvious that we may reject this mechanism because the complex of morphological variables studied by us in general did not show any trend of convergence between Jewish and non-Jewish neighbouring communities. This con- clusion was reached also in the analysis of biochemical markers, using the Wright F- statistics and Shanon information measure (Kobyliansky and Livshits 1983).
As for the other two cited alternatives, a choice between them is difficult; both may well make a greater or lesser contribution. Thus, recently, Kobyliansky (1983) presented preliminary data on changes in the cephalic index in Israeli-born offspring of Jewish immigrants. Significant differences were found between siblings born abroad and in Israel, in contrast to small differences in the cephalic index of non-related indi- viduals born in Israel. It may be mentioned that the cephalic index in immigrants was very similar to that of their former neighbours, in agreement with Pearson's obser- vations (1936), while the cephalic index changes in Israeli-born individuals were in the
Ann
Hum
Bio
l Dow
nloa
ded
from
info
rmah
ealth
care
.com
by
Tel
Avi
v U
nive
rsity
on
08/1
5/15
For
pers
onal
use
onl
y.

Similarity o f Jewish and non-Jewish populat ions 211
direct ion o f the 'Med i t e r r anean type ' o f mesocephaly , cited by Beals (1972). The l ikely effect o f envi ronment in the Israeli case would seem cer ta inly much more a p p a r e n t t han selection, and especially more than tha t o f ' in te rmix ing ' as Pea r son bel ieved.
To be sure, the envi ronmenta l influence on the cephalic index a m o n g Jews was suggested long ago by Boas (1911) and for several o ther characters in var ious ethnic groups by Lasker (1952, 1953), Hnlse (1968, 1981) and Mal ina et al. (1982).
Suppor t ing the view o f selection in var ious morpho log ica l characters , we show a sharp decrease in heri tabi l i ty values for some an th ropome t r i c var iables , including cephalic index, in a Mexican migrant popu l a t i on c o m p a r e d with the her i tab i l i ty o f the same characters in Mexican ' sedentes ' (Livshits and Koby l i ansky 1984). The her i tab i l i ty coefficient o f the cephalic index in the migran t g roup , ca lcula ted by var iance analysis and by mult ip le regression, compr i sed only 79°70 and 72%, respectively, o f the sedentary group , and the genetic c o m p o n e n t o f var iance decreased to 5907o. In this lat ter s tudy the changes in cephalic index values (and some other trai ts) appea r to have been genetic and pr imar i ly a result o f selection.
Thus, the quest ion o f what a l ternat ive mechan i sm is responsible for the obse rved divergence between popula t ions should perhaps be changed to how each mechan i sm contr ibutes .
No doub t bo th envi ronment and selection are involved in observed divergencies among popu la t ion groups. The impor t an t quest ion, we believe, should be the extent and direct ion each contr ibutes to the end result .
References BEALS, K.L.,1972, Head form and climatic stress. American Journal of Physical Anthropology, 37,
85-92. BOAS, F., 1911, Changes in Bodily Form of Descendants of Immigrants. (Washington: US Government
Printing Office). CHAKRABORTY, R., and WEISS, K.M., 1982, Comments to N.E. Morton et al. paper (1982). Current
Anthropology, 23, 163-164. EL BATRAWl, A. M., 1964, Publications of the Joint Arabic-Polish Anthropological Expedition 1958/1959.
(Warszawa-Posnan-Cairo: Polish Academy of Sciences), part 11, 1-29. EVELETH, P., and TANNER, J. M., 1976, Worldwide Variation in Human Growth (Cambridge: Cambridge
University Press). GOLDSTEIN, M., 1943, Demographic and Bodily Changes in Descendants of Mexican Immigrants (Austin,
Texas: Institute of Latin-American Studies, University of Texas). HULSE, F.S., 1968, Migration and cultural selection in human genetics. Anthropologist (Delhi), Special
volume 1-21. HULSE, F. S., 1981, Habits, habitats and heredity: A brief history of studies in human biology. American
Journal of Physical Anthropology, 56, 495-501. KARLIN, S., KENETT, R., and BONNE-TAMIR, B., 1979, Analysis of biochemical genetic data on Jewish
populations. II. Results and interpretations of heterogeneity indices and distance measures with respect to standards. American Journal of Human Genetics, 31,341-365.
KOBYL1ANSKY, E., 1983, Changes in cephalic morphology of Israelis due to migration. Journal of Human Evolution, 12, 779-786.
KOBYLLANSKY, E., 1984, Heritability of some morphological traits in man. Regression and segregation analysis of familial resemblance. Zeitschriftfiir Morphologie, 75, 77-84.
KOBYLIANSKY, E., and ARENSBURG, B., 1977, Changes in morphology of human populations due to migration and selection. Annals of Human Biology 4, 57-71.
KOBYLIANSKY, E., and LIVSHtTS, G., 1983, Genetic composition of Jewish populations: Diversity and in- breeding. Annals of Human Biology, 10, 453-464.
KOBYLIANSKY, E., and MICLE, S., 1982, Comments to Morton et al. 0982) paper. Current Anthropology, 23, 165.
KOBYLIANSKY, E., MICLE, S., GOLDSCHMIDT-NATHAN, M., ARENSBURG, B., and NATHAN, H., 1982, Jewish populations of the world: Genetic likeness and differences. Annals of Human Biology, 9, 1-34.
KURSHAKOVA, Y.S., 1978, Stability, liability and variability factors of populational morphological composition. In Problems in Anthropological Standardization, (Moscow: Legkaja industria), pp. 155-224 (in Russian).
Ann
Hum
Bio
l Dow
nloa
ded
from
info
rmah
ealth
care
.com
by
Tel
Avi
v U
nive
rsity
on
08/1
5/15
For
pers
onal
use
onl
y.
212 E. Kobyl iansky and G. Livshits
KURSHAKOVA, Y.S., 1980, Structure of interspecific somatic variability and assessment of genotypical differences between ethnoterritorial groups on the basis of anthropometric features. Voprosy Antropologie, 66, 37-48 (in Russian).
LALOUEL, J.M., 1980, Distance analysis and multidimensional scaling. In Current Development in Anthropological Genetics, edited by J. H. Mielke and M. H. Crawford (New York: Plenum Press), pp. 209-250.
LASKER, G.W., 1952, Environmental growth factors and selective migration. Human Biology, 24, 262-289.
LASKER, G. W., 1953, The age factor in bodily measurements of adult male and female Mexicans. Human Biology, 25, 50-63.
LIVSHITS, G., and KOBYLIANSKV, E., 1984, Changes in heritability components of anthropometric characters due to preselection and environment during migration. Human Heredity, 34, 348-357.
MALINA, R., BURSCHANG, P., ARONSON, W., and SELBY, H., 1982, Childhood growth status of eventual migrants and sedentes in rural Zapotec community in the Valley of Oaxaca, Mexico. Human Biology, 54, 709-716.
MEDALIE, J. H., KAHN, H.A., NEUFELD, H.N., GROEN, J . J . , and RlSS, E., 1968, Physicians Fact Book (Jerusalem: Hadassah Medical Organisation).
MORTON, N.E., 1982, Reply on comments to Morton et al. 1982 paper. Current Anthropology, 23, 165-166.
MORTON, N. E., KENETT, R., YEE, S., and LEW, R., 1982, Bioassay of kinship in populations of Middle Eastern origin and controls. Current Anthropology, 23, 157-161.
MOURANT, A. E.. KOPEC, A. C., and DOMANIEWSKA-SOBCZAK, ](., 1978, The Genetics of the Jews (Oxford: Oxford University Press).
OSBORNE, K.H., and DE GEORGE, F.V., 1959, Genetic basis of Morphological Variation (Cambridge, Mass.: Harvard University Press).
PATAI, R., WING, J .P . , 1975, The Myth of the Jewish Race (New York: C. Scribner's Sons). PEARSON, K., 1936, On the Jewish-Gentile relationship. Biometrika, 28, 32-33. PURUNDJAN, A.L., 1978, Geographic variability of anthropometric traits within USSR territory. In
Problems in Anthropological Standardization (Moscow Industry), pp. 100-155. SHAPIRO, H. L., 1939, Migration and Environment (London: Oxford University Press). SUSANNE, C., 1979, Genetics of human morphological characters. In Physiological and Morphological
Adaptation and Evolution, edited by W.A. Stini (The Hague: Mouton), pp. 187-200.
Address correspondence to: Professor E. Kobyliansky or Dr G. Livshits, Department of Anatomy and Anthropology, Sackler Faculty of Medicine, Tel Aviv University, Ramat Aviv, Israel.
Zusammenfassung. Die genetische Verwandtschaft zwischen verschiedenen jtidischen und nichtjtidischen Gruppen ist von biochemischer Seite h~iufig untersucht worden, oft mit sehr widerspr0ch- lichen SchluBfolgerungen. Die vorliegende Arbeit berichtet die Ergebnisse zweier vergleichender Analysen von verschiedenen jtidischen und nichtjtidischen Bev01kerungen auf der Grundlage morphologischer Messungen von Miinnern. Die erste Analyse verwendet Daten tiber jtidische und nichtjtidische Gemeinden aus fiinf geographischen Regionen der Welt. Das Dendrogramm aus der Clusteranalyse zeigt klar, daft jtidische Populationen einander viel nliher stehen als den nichtjiidischen Nachbargruppen. In der zweiten Analyse wurden 25 ethnoterritoriale Gruppen der UDSSR (eine jtidisch und die tibrigen nichtjtidisch) auf der Grundlage yon 27 anthropometrischen Merkmalen untersucht. Die jtidische Gruppe stand gegentiber den anderen 24 ethnischen Gruppen betont abseits, und dies besonders, wenn nur Merkmale mit hohen Heritabilit~itskoeffizienten verwendet wurden.
R6sum6. La parent6 g6n6tique, du point de vue biochimique, entre divers groupes juifs et non-juifs a 6t6 beaucoup 6tudi6e, souvent avec des conclusions tr~s contradictoires. Le pr6sent travail donne les r6sultats de deux analyses comparatives de plusieurs populations juives et non-juives bas6es sur des mensurations morphologiques d'hommes adultes. La premiere analyse a employ~ des donn6es sur des communaut6s juives et non-juives de 5 r6gions g6ographiques du monde. Le dendrogramme r6sultant de l'analyse des agglom6rats indique clairement que les populations juives sont beaucoup plus proches les unes des autres que de groupes non-juifs voisins. Dans la seconde analyse, 25 groupes ethnoterritoriaux d'URSS (un juif et les autres non-juifs) ont 6t6 6valu6s sur la base de 27 caract~res anthropom6triques. Ce groupe juif 6tait consid6rablement ~ part des 24 autres groupes, et particuli~rement distinct quand seuls des traits A haut coefficient d'6ritabilit6 6taient employ6s.
Ann
Hum
Bio
l Dow
nloa
ded
from
info
rmah
ealth
care
.com
by
Tel
Avi
v U
nive
rsity
on
08/1
5/15
For
pers
onal
use
onl
y.