
A morphological approach to pipe image interpretation based on segmentation by support vector...
9
A morphological approach to pipe image interpretation based on segmentation by support vector machine John Mashford ⁎, Mike Rahilly, Paul Davis, Stewart Burn Commonwealth Scientific and Industrial Research Organisation, PO Box 56, Highett, Vic. 3190, Australia abstract article info Article history: Accepted 7 June 2010 Keywords: Automatic pipe inspection Colour image segmentation Support vector machine Mathematical morphology This paper presents a new approach to automatic pipe inspection using pixel-based segmentation of colour images by support vector machine (SVM) coupled with morphological analysis of the principal connected component of the segmented image. The pixel-based segmentation method has been tested using RGB, HSB, Gabor and local window feature sets and is seen to work best with the HSB feature set. The morphological analysis allows the principal connected component of the segmented image to be decomposed into the pipe flow line region, the pipe joints and adjoining defects. Generalisations of the morphological operations of erosion and dilation are defined and some simple properties of them are derived. A fuzzy approach to pipe connection detection is also described. Crown Copyright © 2010 Published by Elsevier B.V. All rights reserved. 1. Introduction In this paper we propose an approach to signal interpretation for automatic pipe inspection based on colour images. Automatic pipe inspection involves the automatic processing of pipe image or signal data in order to find and classify defects or features and to produce a report about the condition of the pipe. The information obtained from pipe inspection is used to determine if and when maintenance should be carried out for the pipe. We will consider in particular the case of sewer pipe inspection, though the techniques are more generally applicable. The standard method of inspection of sewer pipes which are not large enough to walk through is to have operators view CCTV signals obtained by inspection devices sent into the pipes. This method is time consuming, error prone and subjective. Even experienced operators may differ considerably in their assessment of the same sewer. Automatic sewer pipe inspection has the potential to avoid these problems. An early semi-automatic inspection system was the KARO system [1] which consisted of a multi-sensor inspection device and a two pass interpretation system. During the largely automatic first pass a hierarchical fuzzy logic sensor fusion algorithm was used to identify candidate defects which were then investigated in detail by the operator during a second pass. The PIRAT system [2] was made up of an inspection device providing range images (in which the pixel values are distances) together with an interpretation system using neural networks and other AI techniques [3]. Neural networks have been used in a number of other interpretation systems for automatic pipe inspection [4–6]. Our recent work has focussed on the development of an interpre- tation system rather than on the building of an inspection device. Data for such an interpretation system could be provided by a commercial inspection system. Such an inspection system will move through a pipe and obtain a number of colour images. We also assume that there is the capability to combine together all of these images to form an unwrapped pipe image. An unwrapped pipe image is an image of the pipe represented in cylindrical polar coordinates. Fig. 1 shows part of such an image. In the present paper we will assume that the interpretation system has access to such an unwrapped pipe image. If this were not the case then it would be necessary either to construct an unwrapped pipe image from the underlying images and then process that or to process each of the individual underlying images and then to weave together all of the processing outputs to form an overall pipe condition report. The colour images provide significantly different information from grey-scale images or range images. This can augment the effectiveness of some of the image processing tasks that are to be carried out on the images. However, in some other respects, the tasks are more difficult. With colour images, where the information available is that of colour and intensity, there may be no way of determining whether a defect or feature is an intrusion or an extrusion. This is because a patch of pipe surface looks essentially the same if it is translated in space. This means that it may be difficult to distinguish between categories such as “corrosion” and “deposit” for defects. On the other hand it may be that corrosions tend to have a particular colour or texture signature while deposits have another in which case the colour image data would be sufficient to distinguish between them. With range images it can be determined whether a defect or feature is an intrusion or an extrusion by simply comparing the range values on Automation in Construction 19 (2010) 875–883 ⁎ Corresponding author. Tel.: + 61 3 9252 6115; fax: + 61 3 9252 6253. E-mail addresses: [email protected] (J. Mashford), [email protected] (M. Rahilly), [email protected] (P. Davis), [email protected] (S. Burn). 0926-5805/$ – see front matter. Crown Copyright © 2010 Published by Elsevier B.V. All rights reserved. doi:10.1016/j.autcon.2010.06.001 Contents lists available at ScienceDirect Automation in Construction journal homepage: www.elsevier.com/locate/autcon
-
Upload
independent -
Category
Documents
-
view
2 -
download
0
Transcript of A morphological approach to pipe image interpretation based on segmentation by support vector...
Automation in Construction 19 (2010) 875–883
Contents lists available at ScienceDirect
Automation in Construction
j ourna l homepage: www.e lsev ie r.com/ locate /autcon
A morphological approach to pipe image interpretation based on segmentation bysupport vector machine
John Mashford ⁎, Mike Rahilly, Paul Davis, Stewart BurnCommonwealth Scientific and Industrial Research Organisation, PO Box 56, Highett, Vic. 3190, Australia
⁎ Corresponding author. Tel.: +61 3 9252 6115; fax:E-mail addresses: [email protected] (J. Mashfo
(M. Rahilly), [email protected] (P. Davis), Stewart.Bur
0926-5805/$ – see front matter. Crown Copyright © 20doi:10.1016/j.autcon.2010.06.001
a b s t r a c t
a r t i c l e i n f oArticle history:Accepted 7 June 2010
Keywords:Automatic pipe inspectionColour image segmentationSupport vector machineMathematical morphology
This paper presents a new approach to automatic pipe inspection using pixel-based segmentation of colourimages by support vector machine (SVM) coupled with morphological analysis of the principal connectedcomponent of the segmented image. The pixel-based segmentation method has been tested using RGB, HSB,Gabor and localwindow feature sets and is seen toworkbestwith theHSB feature set. Themorphological analysisallows the principal connected component of the segmented image to be decomposed into the pipe flow lineregion, the pipe joints and adjoining defects. Generalisations of the morphological operations of erosion anddilation are defined and some simple properties of them are derived. A fuzzy approach to pipe connectiondetection is also described.
Crown Copyright © 2010 Published by Elsevier B.V. All rights reserved.
1. Introduction
In this paper we propose an approach to signal interpretation forautomatic pipe inspection based on colour images. Automatic pipeinspection involves the automatic processing of pipe image or signaldata in order to find and classify defects or features and to produce areport about the condition of the pipe. The information obtained frompipe inspection is used todetermine if andwhenmaintenance shouldbecarried out for the pipe. Wewill consider in particular the case of sewerpipe inspection, though the techniques are more generally applicable.
The standard method of inspection of sewer pipes which are notlarge enough to walk through is to have operators view CCTV signalsobtained by inspection devices sent into the pipes. This method is timeconsuming, error prone and subjective. Even experienced operatorsmay differ considerably in their assessment of the same sewer.Automatic sewer pipe inspection has the potential to avoid theseproblems.
An early semi-automatic inspection systemwas theKARO system [1]which consisted of a multi-sensor inspection device and a two passinterpretation system. During the largely automatic first pass ahierarchical fuzzy logic sensor fusion algorithm was used to identifycandidate defectswhichwere then investigated indetail by theoperatorduring a second pass.
The PIRAT system [2]wasmade up of an inspection device providingrange images (in which the pixel values are distances) together with aninterpretation system using neural networks and other AI techniques
+61 3 9252 6253.rd), [email protected]@csiro.au (S. Burn).
10 Published by Elsevier B.V. All rig
[3]. Neural networks have been used in a number of other interpretationsystems for automatic pipe inspection [4–6].
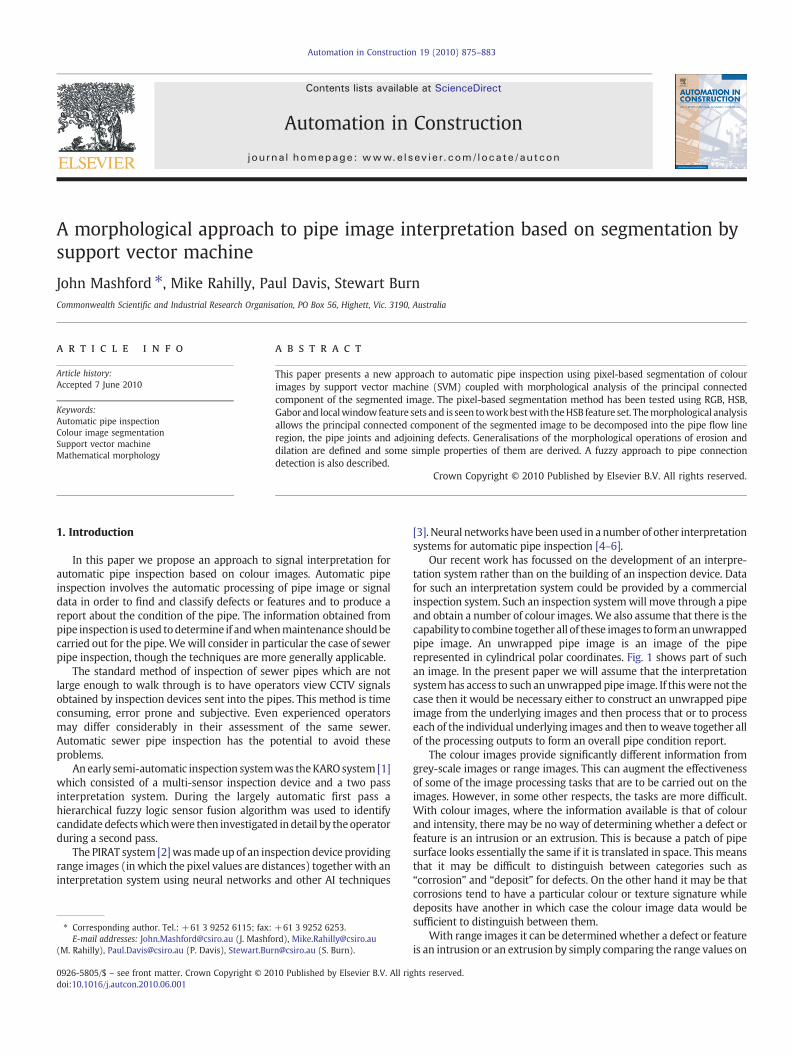
Our recent work has focussed on the development of an interpre-tation system rather than on the building of an inspection device. Datafor such an interpretation system could be provided by a commercialinspection system. Such an inspection systemwill move through a pipeand obtain a number of colour images. We also assume that there is thecapability to combine together all of these images to formanunwrappedpipe image. An unwrapped pipe image is an image of the piperepresented in cylindrical polar coordinates. Fig. 1 shows part of suchan image. In the present paper we will assume that the interpretationsystemhas access to such anunwrappedpipe image. If thiswere not thecase then it would be necessary either to construct an unwrapped pipeimage from the underlying images and then process that or to processeach of the individual underlying images and then toweave together allof the processing outputs to form an overall pipe condition report.
The colour images provide significantly different information fromgrey-scale images or range images. This can augment the effectivenessof some of the image processing tasks that are to be carried out on theimages. However, in some other respects, the tasks are more difficult.With colour images, where the information available is that of colourand intensity, there may be no way of determining whether a defect orfeature is an intrusion or an extrusion. This is because a patch of pipesurface looks essentially the same if it is translated in space. This meansthat it may be difficult to distinguish between categories such as“corrosion” and “deposit” for defects. On the other hand it may be thatcorrosions tend to have a particular colour or texture signature whiledeposits have another in which case the colour image data would besufficient to distinguish between them.
With range images it can be determined whether a defect or featureis an intrusion or an extrusion by simply comparing the range values on
hts reserved.
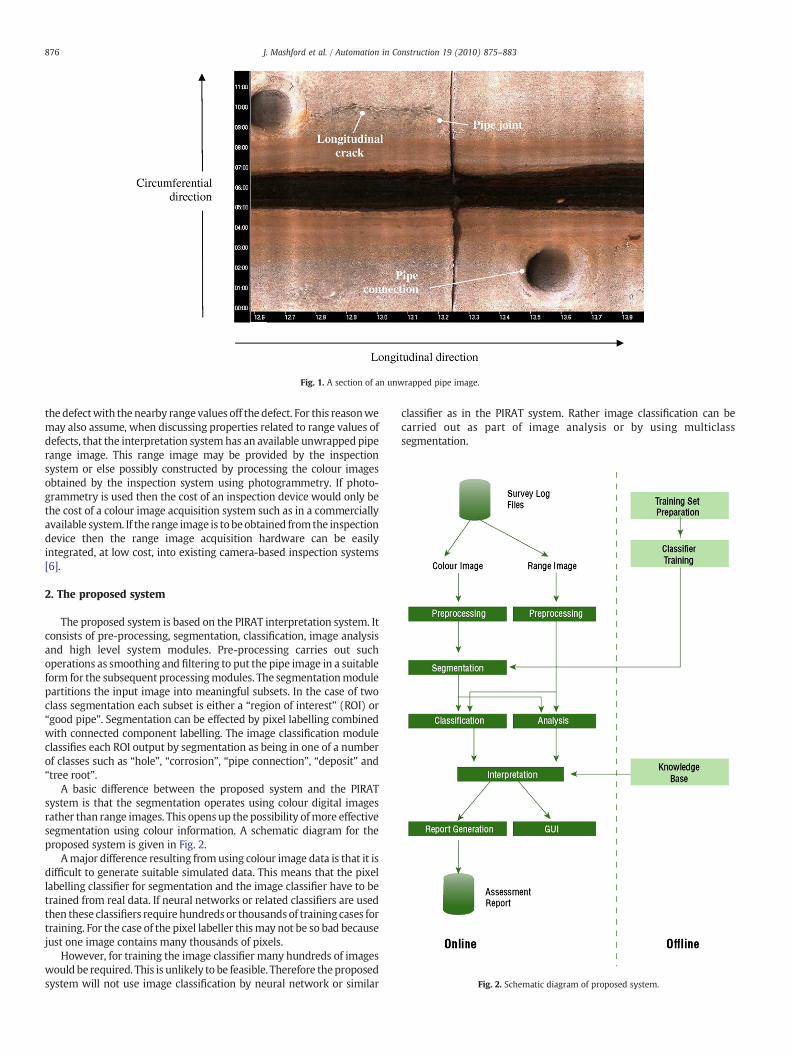
Fig. 1. A section of an unwrapped pipe image.
Fig. 2. Schematic diagram of proposed system.
876 J. Mashford et al. / Automation in Construction 19 (2010) 875–883
the defectwith the nearby range values off the defect. For this reasonwemay also assume, when discussing properties related to range values ofdefects, that the interpretation systemhas an available unwrapped piperange image. This range image may be provided by the inspectionsystem or else possibly constructed by processing the colour imagesobtained by the inspection system using photogrammetry. If photo-grammetry is used then the cost of an inspection device would only bethe cost of a colour image acquisition system such as in a commerciallyavailable system. If the range image is tobeobtained fromthe inspectiondevice then the range image acquisition hardware can be easilyintegrated, at low cost, into existing camera-based inspection systems[6].
2. The proposed system
The proposed system is based on the PIRAT interpretation system. Itconsists of pre-processing, segmentation, classification, image analysisand high level system modules. Pre-processing carries out suchoperations as smoothing and filtering to put the pipe image in a suitableform for the subsequent processingmodules. The segmentationmodulepartitions the input image into meaningful subsets. In the case of twoclass segmentation each subset is either a “region of interest” (ROI) or“good pipe”. Segmentation can be effected by pixel labelling combinedwith connected component labelling. The image classification moduleclassifies each ROI output by segmentation as being in one of a numberof classes such as “hole”, “corrosion”, “pipe connection”, “deposit” and“tree root”.
A basic difference between the proposed system and the PIRATsystem is that the segmentation operates using colour digital imagesrather than range images. This opens up the possibility ofmore effectivesegmentation using colour information. A schematic diagram for theproposed system is given in Fig. 2.
Amajor difference resulting fromusing colour image data is that it isdifficult to generate suitable simulated data. This means that the pixellabelling classifier for segmentation and the image classifier have to betrained from real data. If neural networks or related classifiers are usedthen these classifiers require hundredsor thousandsof training cases fortraining. For the case of the pixel labeller thismay not be so bad becausejust one image contains many thousands of pixels.
However, for training the image classifier many hundreds of imageswould be required. This is unlikely to be feasible. Therefore theproposedsystem will not use image classification by neural network or similar
classifier as in the PIRAT system. Rather image classification can becarried out as part of image analysis or by using multiclasssegmentation.
877J. Mashford et al. / Automation in Construction 19 (2010) 875–883
A decision tree classifier can be implemented in a similar fashion tothe implementation of the classifier that was used in the PIRAT system.The fundamental decision that has to bemade about an ROI is whether itis an intrusion or an extrusion. This can be made by comparing theaverage range value of on-defect pixels with the average range value ofoff-defect pixels which are in a neighbourhood of the boundary of thedefect.
The difference of these values in the case when the defect isdetermined to be an extrusion can be used to assign the defect to beingeither a hole or a corrosion. Alternatively, by using appropriate fuzzymembership functions, the defect can be assigned fuzzy membershipfunction values in the classes “hole” and “corrosion”.
Some holes can be identified as pipe connections by means of a pipeconnection detector which examines the dimensions and location of thedefect and may compute the ellipse of best fit for the boundary of thedefect in order to give a compound fuzzy membership value.
Intrusive defects can be given a deterministic or fuzzy classification aseither tree roots ordeposits byuseof a tree rootdetectorwhich computesthemaximumdeviationbetween the rangevaluesof off-defectpixels andon-defect pixels in windows centred on boundary points of the defect.
Thus it is possible to construct a deterministic or fuzzy imageclassification module for the problem without using neural networkclassifiers. In fact the PIRAT system image classifierwhich performedbestout of all the versions tried was constructed largely on this basis as adecision tree utilising, for the most part, simple detectors. The mosteffective of the neural network classifier based detectors was the pipeconnection/hole classifier which can be implemented just as effectivelywithout using neural networks in the manner described above.
3. The segmentation sub-system
There are a number of approaches to colour image segmentationincluding thresholding, feature based clustering, region-basedapproaches, edge detection approaches, fuzzy approaches and neuralnetwork approaches [7].
The simplest approach is to threshold the brightness and then to carryout connected component labelling. This has been carried out in thesystem of Moselhi and Shehab-Eldeen [8]. The resulting segmentation isdependent upon the threshold value chosen.
Experiments show that when the threshold is large the associatedlabel image is large, resulting in over-segmentationwhile if the thresholdis small the associated label image is small resulting in under-segmentation. Over-segmentation manifests as false positives in thefound defect regions, that is regions which are flagged as being defectregions which do not appear to be defect regions. Under-segmentationmanifests as false negatives, that is regions which appear to be defectregions but are not so flagged. It is found that for some images both falsepositives and false negatives are present in the segmentation. Thereforethere is no threshold value which results in a completely correctsegmentation for all images.
The main segmentation approach that we consider in this paper isbased on an adaptation of the segmentationmethod of the PIRAT systemto the case of colour images [9]. Themethod used in PIRAT is a supervisedmethod which means that the segmentation system is trained by usingtraining exampleswhich are labelledwith their correct classifications. Forthe PIRAT development the training examples were obtained fromsimulated data while for the proposed system they must be obtainedfrom real data.
The method of segmentation used in the PIRAT system involvedfeature extraction followed by classification of the feature vector [10]. Inthe PIRAT project differential geometric features were used and theclassifier was the nearest neighbour classifier. Differential geometricfeatures are mainly applicable to range images. Therefore other featureshave to be used for the colour image segmentation.
A number of authors have used a feature vector consisting simply oftheRGB (red, greenandblue) values of apixel as inputs to a classifier [11].
We have also used as a feature set the H, S and B components in the HSB(hue, saturation and brightness) colour space [12].
In addition, a slightly more sophisticated feature set has beenimplemented in which the max, min and average are computed forRGB values in awindow (of size say 7×7) about each pixel togetherwiththe max, min and average of an intensity feature I given by
I = √ R2 + G2 + B2� �
:
Also we have used a more elaborate feature set constructed fromGabor texture filter banks [13]. Gabor filters are useful for analysing thetexture properties of images. Gabor filters have been used in manyapplications including texture segmentation, target detection and imagecoding. Gabor filters can be described as Gaussian shaped band passfilters. An even-symmetric Gabor filter is obtained by convolving a unitimpulse response function of the form
h u; vð Þ = hðu0; θÞ u; vð Þ = hðu0; θ;u; vÞ= exp − 1 = 2ð Þ x2 = σ2
x + y2 = σ2y
h in ocos 2πu0xð Þ;
where
x = ucosðθÞ –vsinðθÞ;y = usinðθÞ + vcosðθÞ;
with an input image. The Gabor filter ℑ(u0,θ) corresponding to spatialfrequency u0 and orientation θ is given by
ℑðu0; θÞω = hðu0; θÞ�ω;
for ω : Z2 → 0;∞½ Þ;
where
h u0; θð Þ�ωð Þ i; jð Þ = ∑∞
k=−∞∑∞
l=−∞ωði−k; j−lÞhðu0; θ; k; lÞ :
Since the mask h(u0,θ) vanishes exponentially with increasingdistance from the origin it can be well approximated by a finite mask.Thefilter canbe considered to act onfinite imagesbynull extendingfiniteimages to infinite images.
A bank of Gabor filters is obtained by taking a set of values for theradial frequency u0 and the orientation θ. We have used a set of radialfrequencies of the form{√22−2− i: i=0, 1,…, n_u0−1}wheren_u0∈{1,2, …}and a set of orientations of the form {0, π/4, π/2, 3π/4} [14]. Theabove radial frequencies are an octave apart.
For the classifierweuseda support vectormachine (SVM). SVMshavecertain properties that make them superior to neural networks such asrequiring smaller training sets and having better generalisation ability.
For generation of a training set for the SVM a set of feature vectors forindividual pixels together with their classifications must be extractedfrom the training data images. The feature vectors can be extractedautomatically but the classification labels must be determined manually(if they could be determined automatically then we would have alreadysolved the problem of segmentation).
Thismanual pixel classification process can be effected by using a GUIprogram which displays a training image and enables the user to selectcertain regions or sets of pixels and specify that they are of a particularclassification.
A simpler approach togenerating training sets for thepixel classifier isto select rectangular regions of constant classification using standardtools. There will be a problem with this method if regions of constantclassification do not contain rectangular subsets of a reasonable size.
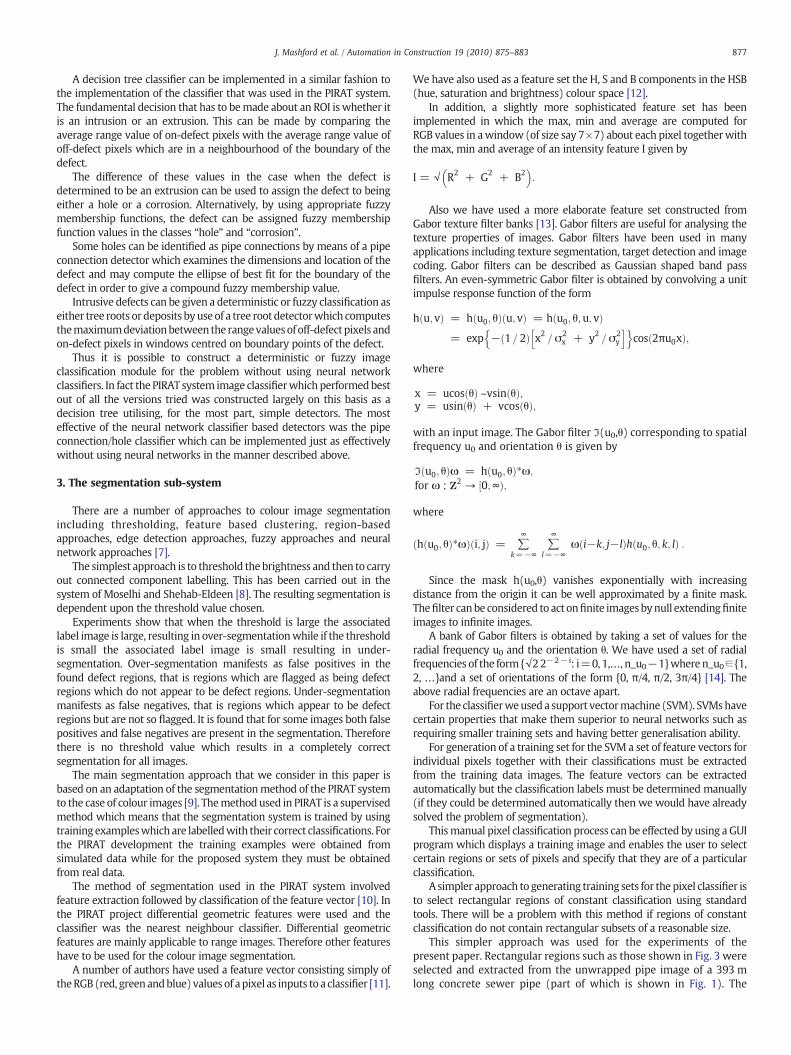
This simpler approach was used for the experiments of thepresent paper. Rectangular regions such as those shown in Fig. 3 wereselected and extracted from the unwrapped pipe image of a 393 mlong concrete sewer pipe (part of which is shown in Fig. 1). The
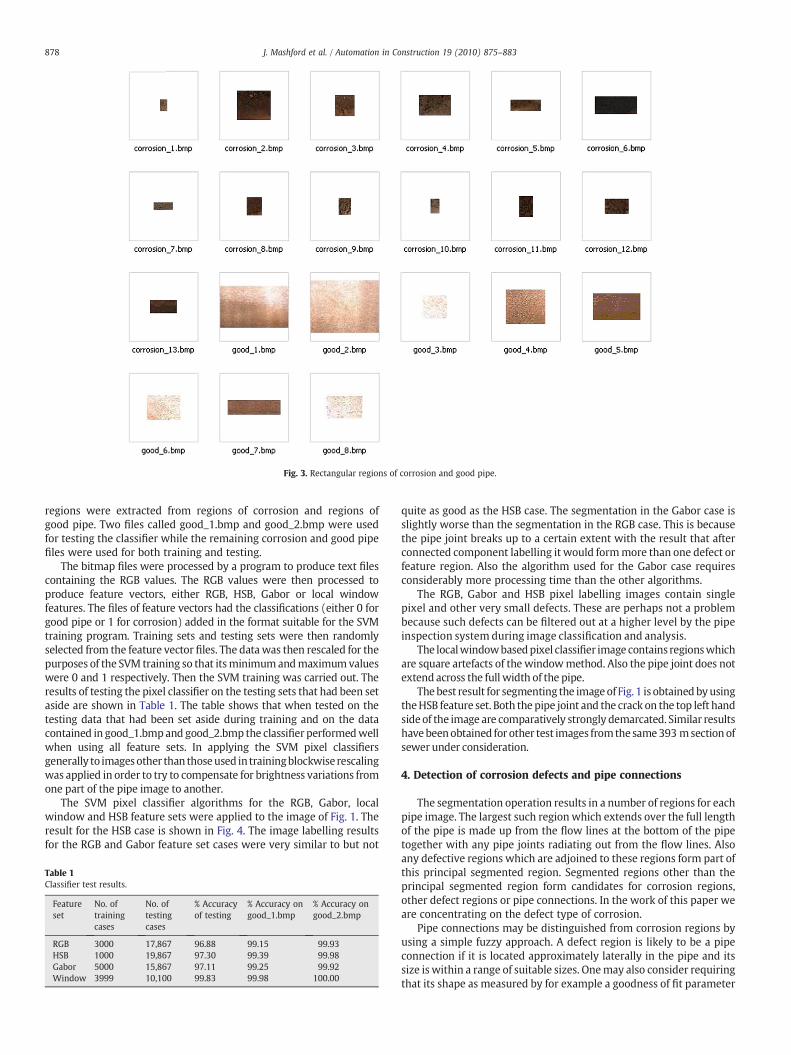
Fig. 3. Rectangular regions of corrosion and good pipe.
878 J. Mashford et al. / Automation in Construction 19 (2010) 875–883
regions were extracted from regions of corrosion and regions ofgood pipe. Two files called good_1.bmp and good_2.bmp were usedfor testing the classifier while the remaining corrosion and good pipefiles were used for both training and testing.
The bitmap files were processed by a program to produce text filescontaining the RGB values. The RGB values were then processed toproduce feature vectors, either RGB, HSB, Gabor or local windowfeatures. The files of feature vectors had the classifications (either 0 forgood pipe or 1 for corrosion) added in the format suitable for the SVMtraining program. Training sets and testing sets were then randomlyselected from the feature vector files. The data was then rescaled for thepurposes of the SVM training so that itsminimumandmaximumvalueswere 0 and 1 respectively. Then the SVM training was carried out. Theresults of testing the pixel classifier on the testing sets that had been setaside are shown in Table 1. The table shows that when tested on thetesting data that had been set aside during training and on the datacontained in good_1.bmpand good_2.bmp the classifier performedwellwhen using all feature sets. In applying the SVM pixel classifiersgenerally to imagesother than thoseused in trainingblockwise rescalingwas applied in order to try to compensate for brightness variations fromone part of the pipe image to another.
The SVM pixel classifier algorithms for the RGB, Gabor, localwindow and HSB feature sets were applied to the image of Fig. 1. Theresult for the HSB case is shown in Fig. 4. The image labelling resultsfor the RGB and Gabor feature set cases were very similar to but not
Table 1Classifier test results.
Featureset
No. oftrainingcases
No. oftestingcases
% Accuracyof testing
% Accuracy ongood_1.bmp
% Accuracy ongood_2.bmp
RGB 3000 17,867 96.88 99.15 99.93HSB 1000 19,867 97.30 99.39 99.98Gabor 5000 15,867 97.11 99.25 99.92Window 3999 10,100 99.83 99.98 100.00
quite as good as the HSB case. The segmentation in the Gabor case isslightly worse than the segmentation in the RGB case. This is becausethe pipe joint breaks up to a certain extent with the result that afterconnected component labelling it would formmore than one defect orfeature region. Also the algorithm used for the Gabor case requiresconsiderably more processing time than the other algorithms.
The RGB, Gabor and HSB pixel labelling images contain singlepixel and other very small defects. These are perhaps not a problembecause such defects can be filtered out at a higher level by the pipeinspection system during image classification and analysis.
The localwindowbasedpixel classifier image contains regionswhichare square artefacts of the windowmethod. Also the pipe joint does notextend across the full width of the pipe.
Thebest result for segmenting the imageof Fig. 1 is obtainedbyusingtheHSB feature set. Both the pipe joint and the crack on the top left handsideof the image are comparatively strongly demarcated. Similar resultshavebeenobtained for other test images fromthe same393 msectionofsewer under consideration.
4. Detection of corrosion defects and pipe connections
The segmentation operation results in a number of regions for eachpipe image. The largest such region which extends over the full lengthof the pipe is made up from the flow lines at the bottom of the pipetogether with any pipe joints radiating out from the flow lines. Alsoany defective regions which are adjoined to these regions form part ofthis principal segmented region. Segmented regions other than theprincipal segmented region form candidates for corrosion regions,other defect regions or pipe connections. In the work of this paper weare concentrating on the defect type of corrosion.
Pipe connections may be distinguished from corrosion regions byusing a simple fuzzy approach. A defect region is likely to be a pipeconnection if it is located approximately laterally in the pipe and itssize is within a range of suitable sizes. Onemay also consider requiringthat its shape as measured by for example a goodness of fit parameter
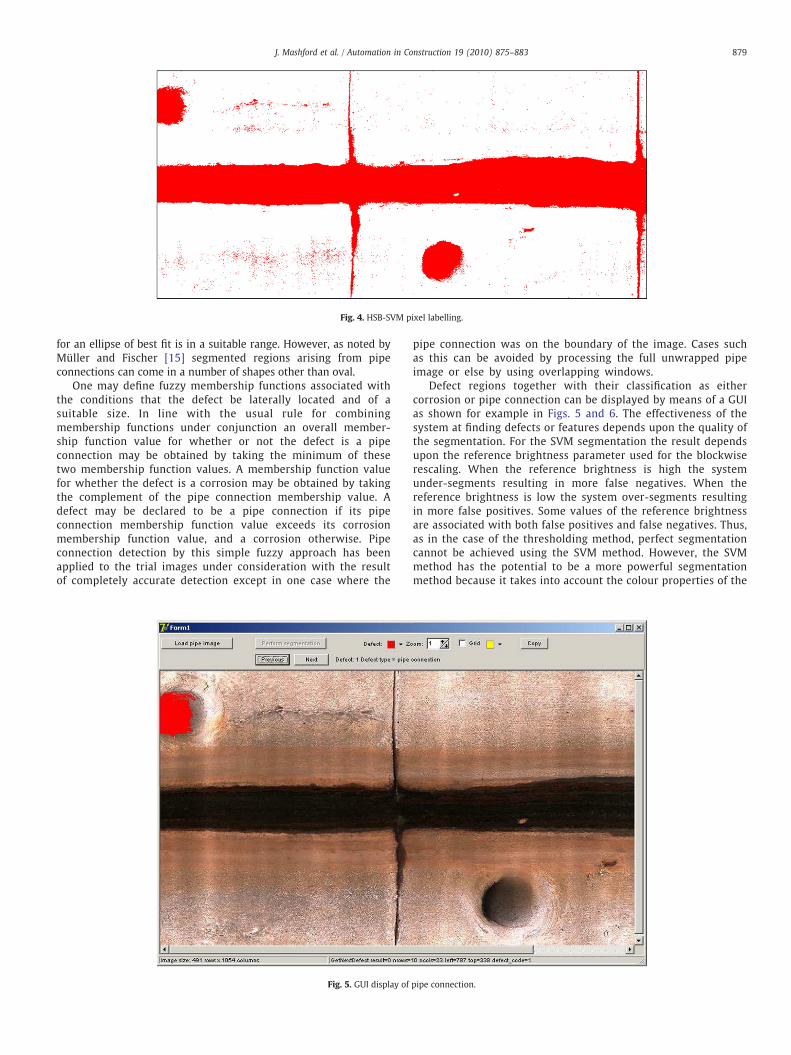
Fig. 4. HSB-SVM pixel labelling.
879J. Mashford et al. / Automation in Construction 19 (2010) 875–883
for an ellipse of best fit is in a suitable range. However, as noted byMüller and Fischer [15] segmented regions arising from pipeconnections can come in a number of shapes other than oval.
One may define fuzzy membership functions associated withthe conditions that the defect be laterally located and of asuitable size. In line with the usual rule for combiningmembership functions under conjunction an overall member-ship function value for whether or not the defect is a pipeconnection may be obtained by taking the minimum of thesetwo membership function values. A membership function valuefor whether the defect is a corrosion may be obtained by takingthe complement of the pipe connection membership value. Adefect may be declared to be a pipe connection if its pipeconnection membership function value exceeds its corrosionmembership function value, and a corrosion otherwise. Pipeconnection detection by this simple fuzzy approach has beenapplied to the trial images under consideration with the resultof completely accurate detection except in one case where the
Fig. 5. GUI display of
pipe connection was on the boundary of the image. Cases suchas this can be avoided by processing the full unwrapped pipeimage or else by using overlapping windows.
Defect regions together with their classification as eithercorrosion or pipe connection can be displayed by means of a GUIas shown for example in Figs. 5 and 6. The effectiveness of thesystem at finding defects or features depends upon the quality ofthe segmentation. For the SVM segmentation the result dependsupon the reference brightness parameter used for the blockwiserescaling. When the reference brightness is high the systemunder-segments resulting in more false negatives. When thereference brightness is low the system over-segments resultingin more false positives. Some values of the reference brightnessare associated with both false positives and false negatives. Thus,as in the case of the thresholding method, perfect segmentationcannot be achieved using the SVM method. However, the SVMmethod has the potential to be a more powerful segmentationmethod because it takes into account the colour properties of the
pipe connection.
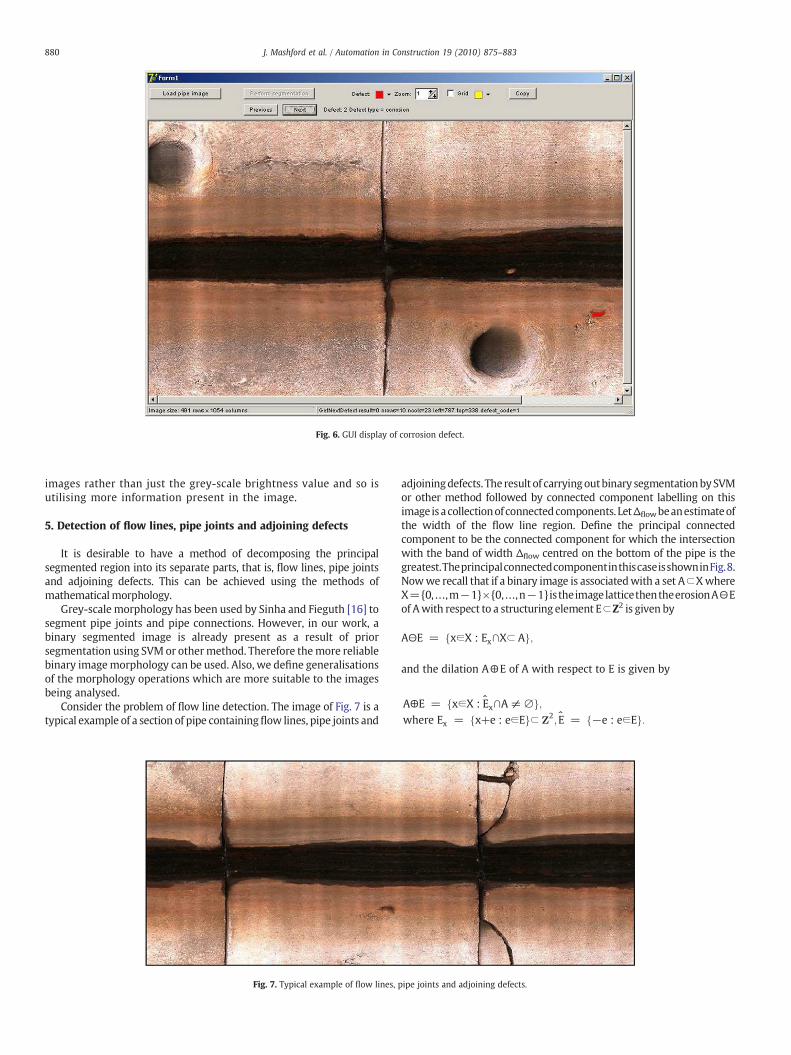
Fig. 6. GUI display of corrosion defect.
880 J. Mashford et al. / Automation in Construction 19 (2010) 875–883
images rather than just the grey-scale brightness value and so isutilising more information present in the image.
5. Detection of flow lines, pipe joints and adjoining defects
It is desirable to have a method of decomposing the principalsegmented region into its separate parts, that is, flow lines, pipe jointsand adjoining defects. This can be achieved using the methods ofmathematicalmorphology.
Grey-scale morphology has been used by Sinha and Fieguth [16] tosegment pipe joints and pipe connections. However, in our work, abinary segmented image is already present as a result of priorsegmentation using SVM or othermethod. Therefore themore reliablebinary imagemorphology can be used. Also, we define generalisationsof the morphology operations which are more suitable to the imagesbeing analysed.
Consider the problem of flow line detection. The image of Fig. 7 is atypical example of a section of pipe containingflow lines, pipe joints and
Fig. 7. Typical example of flow lines,
adjoiningdefects. The result of carryingoutbinary segmentationbySVMor other method followed by connected component labelling on thisimage isacollectionof connectedcomponents. LetΔflowbeanestimateofthe width of the flow line region. Define the principal connectedcomponent to be the connected component for which the intersectionwith the band of width Δflow centred on the bottom of the pipe is thegreatest.TheprincipalconnectedcomponentinthiscaseisshowninFig.8.Nowwe recall that if a binary image is associatedwith a set A⊂XwhereX={0,…,m−1}×{0,…,n−1}is theimagelatticethentheerosionA⊖Eof Awith respect to a structuring element E⊂Z2 is given by
A⊖E = fx∈X : Ex∩X⊂ Ag;
and the dilation A⊕E of A with respect to E is given by
A⊕E = fx∈X : Ex∩A≠∅g;where Ex = fx+e : e∈Eg⊂ Z
2; E = f−e : e∈Eg:
pipe joints and adjoining defects.
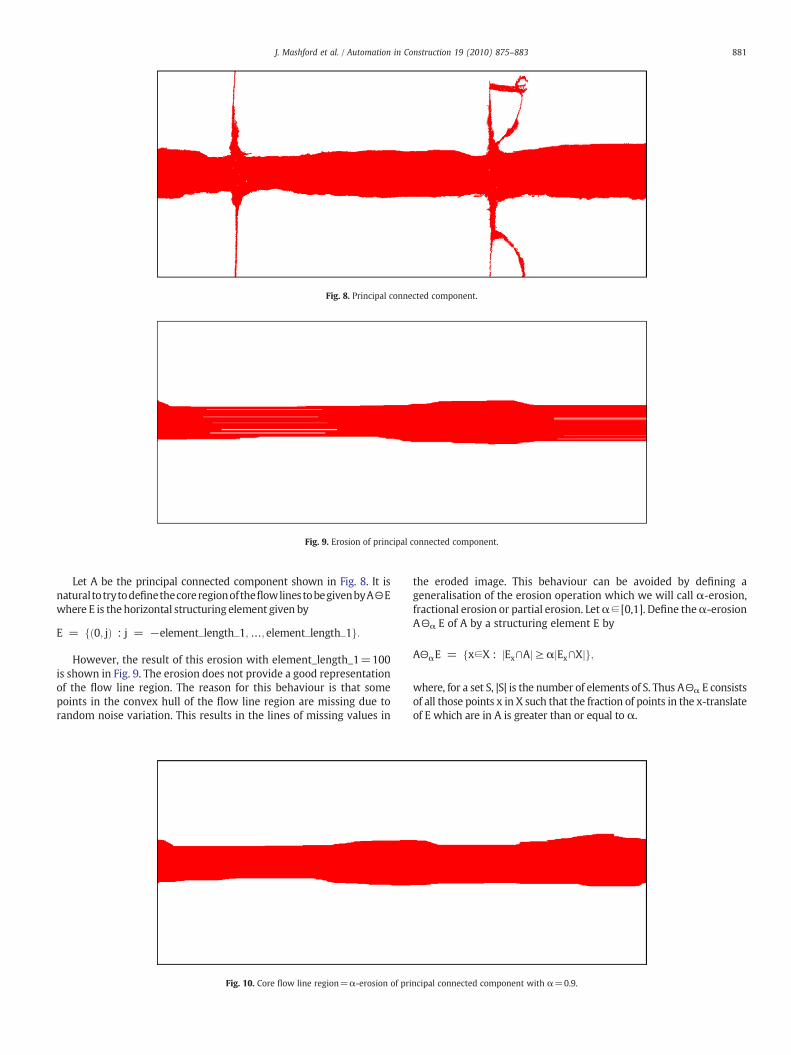
Fig. 8. Principal connected component.
Fig. 9. Erosion of principal connected component.
881J. Mashford et al. / Automation in Construction 19 (2010) 875–883
Let A be the principal connected component shown in Fig. 8. It isnaturaltotrytodefinethecoreregionoftheflowlinestobegivenbyA⊖Ewhere E is the horizontal structuring element given by
E = 0; jð Þ : j = −elementXlengthX1;…; elementXlengthX1f g:
However, the result of this erosion with element_length_1=100is shown in Fig. 9. The erosion does not provide a good representationof the flow line region. The reason for this behaviour is that somepoints in the convex hull of the flow line region are missing due torandom noise variation. This results in the lines of missing values in
Fig. 10. Core flow line region=α-erosion of pri
the eroded image. This behaviour can be avoided by defining ageneralisation of the erosion operation which we will call α-erosion,fractional erosion or partial erosion. Letα∈ [0,1]. Define theα-erosionA⊖α E of A by a structuring element E by
A⊖αE = x∈X : jEx∩Aj ≥ αjEx∩Xjf g;
where, for a set S, |S| is the number of elements of S. Thus A⊖α E consistsof all those points x in X such that the fraction of points in the x-translateof E which are in A is greater than or equal to α.
ncipal connected component with α=0.9.
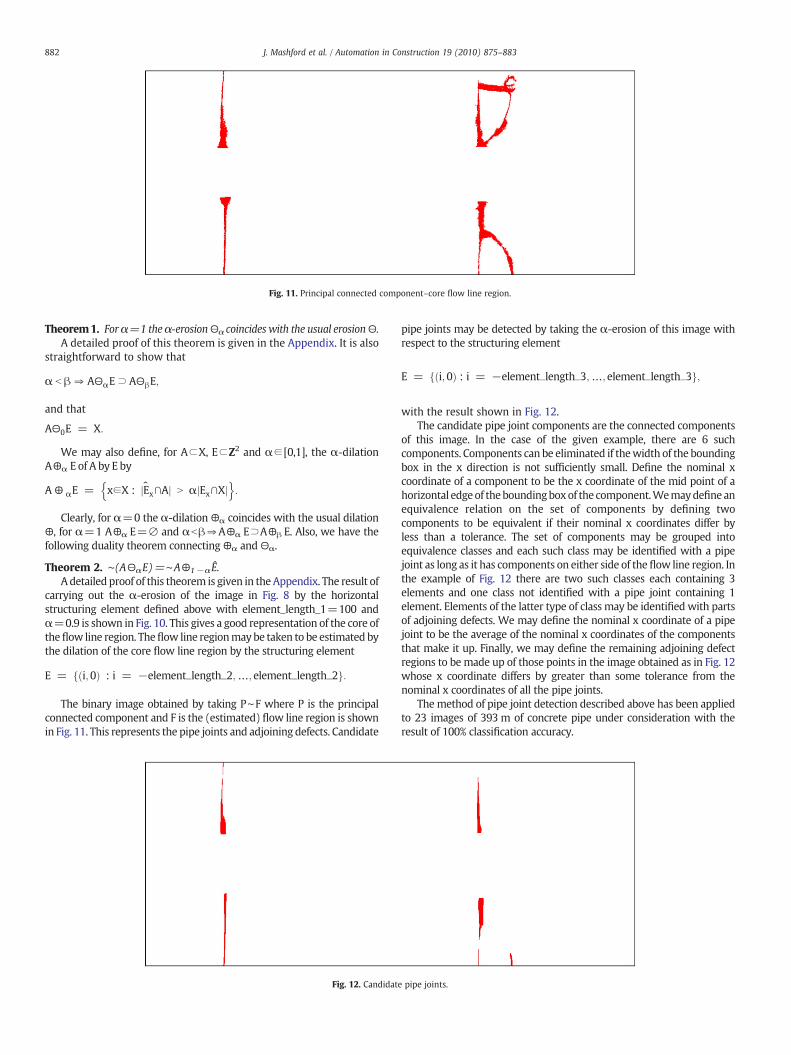
Fig. 11. Principal connected component–core flow line region.
882 J. Mashford et al. / Automation in Construction 19 (2010) 875–883
Theorem1. Forα=1 theα-erosion⊖α coincides with the usual erosion⊖.A detailed proof of this theorem is given in the Appendix. It is also
straightforward to show that
α b β⇒ A⊖αE ⊃ A⊖βE;
and that
A⊖0E = X:
We may also define, for A⊂X, E⊂Z2 and α∈ [0,1], the α-dilationA⊕α E of A by E by
A ⊕ αE = x∈X : jEx∩Aj N αjEx∩Xjn o
:
Clearly, for α=0 the α-dilation ⊕α coincides with the usual dilation⊕, for α=1 A⊕α E=∅ and αbβ⇒A⊕α E⊃A⊕β E. Also, we have thefollowing duality theorem connecting⊕α and⊖α.
Theorem 2. ∼(A⊖αE)=∼A⊕1−αÊ.Adetailed proof of this theorem is given in the Appendix. The result of
carrying out the α-erosion of the image in Fig. 8 by the horizontalstructuring element defined above with element_length_1=100 andα=0.9 is shown in Fig. 10. This gives a good representation of the core oftheflow line region. Theflow line regionmaybe taken to be estimated bythe dilation of the core flow line region by the structuring element
E = i;0ð Þ : i = −elementXlengthX2;…; elementXlengthX2f g:
The binary image obtained by taking P∼F where P is the principalconnected component and F is the (estimated) flow line region is shownin Fig. 11. This represents the pipe joints and adjoining defects. Candidate
Fig. 12. Candidat
pipe joints may be detected by taking the α-erosion of this image withrespect to the structuring element
E = i;0ð Þ : i = −elementXlengthX3;…; elementXlengthX3f g;
with the result shown in Fig. 12.The candidate pipe joint components are the connected components
of this image. In the case of the given example, there are 6 suchcomponents. Components can be eliminated if thewidth of the boundingbox in the x direction is not sufficiently small. Define the nominal xcoordinate of a component to be the x coordinate of the mid point of ahorizontal edgeof theboundingboxof the component.Wemaydefineanequivalence relation on the set of components by defining twocomponents to be equivalent if their nominal x coordinates differ byless than a tolerance. The set of components may be grouped intoequivalence classes and each such class may be identified with a pipejoint as long as it has components on either side of the flow line region. Inthe example of Fig. 12 there are two such classes each containing 3elements and one class not identified with a pipe joint containing 1element. Elements of the latter type of class may be identified with partsof adjoining defects. We may define the nominal x coordinate of a pipejoint to be the average of the nominal x coordinates of the componentsthat make it up. Finally, we may define the remaining adjoining defectregions to be made up of those points in the image obtained as in Fig. 12whose x coordinate differs by greater than some tolerance from thenominal x coordinates of all the pipe joints.
The method of pipe joint detection described above has been appliedto 23 images of 393 m of concrete pipe under consideration with theresult of 100% classification accuracy.
e pipe joints.
883J. Mashford et al. / Automation in Construction 19 (2010) 875–883
6. Conclusions
An approach to signal interpretation for automatic pipe inspectionbased on segmentation of colour images by SVMhas been presented. Thesegmentation approach has been tested using RGB, Gabor, local windowandHSB feature sets. It has been found that themethodworks best in thecase of the HSB feature set. The segmentation algorithm can be used aspart of a pipe inspection systemutilising also range image information forthe purpose of defect classification. Such range image information can beobtained either directly from the inspection device or else possibly byanalysing colour images obtained from the inspection device byphotogrammetry. Analysis of the principal connected component of thesegmented region by mathematical morphology enables the flow lineregion, pipe joints and adjoining defects to be detected. Whilemanifesting some false positives or false negatives in corrosion detection,the system had essentially 100% accuracy in the detection of flow lineregion, pipe joints and pipe connections on the data onwhich it had beentested.
Acknowledgements
The authors thank Tristan Day for supplying colour images of sewers.Also the authors would like to thank Scott Gould for help with theselection of pipe defect images.
Appendix A. Proof of theorems
Theorem 1. For α=1 the α-erosion⊖α coincides with the usual erosion⊖.
Proof. We have, for all x∈X,
x∈A⊖αE⇔ jEx∩Aj = jEx∩X j :
Suppose that x∈A⊖E. Then Ex∩X⊂A. Therefore Ex∩A=Ex∩X andso |Ex∩A|=|Ex∩X|. Thus x∈A⊖α E. Hence A⊖E⊂A⊖α E. Now supposethat x∈A⊖α E and suppose, for contradiction, that x∉A⊖E. ThenEx∩X⊄A. Thus |Ex∩X|=|Ex∩A|+|Ex∩(X∼A)|N |Ex∩A| which contra-dicts the fact that x∈A⊖α E. Thus x∈A⊖E. Hence A⊖α E⊂A⊖E. Itfollows that A⊖α E=A⊖E.
QED
Theorem. 2∼(A⊖αE)=∼A⊕1−αÊ.
Proof. For all x∈X
x∈∼ðAΘαEÞ⇔x∉AΘαE⇔ jEx∩A j b α jEx∩X j⇔ jEx∩Xj = jEx∩Aj + jEx∩ X ∼ Að Þ j b α jEx∩Xj + jEx∩ X ∼ Að Þ j⇔ jEx∩ X ∼ Að Þ j N ð1−αÞ jEx∩X j⇔x∈ ∼ A ⊕ 1−αE:
QED
References
[1] H. Kuntze, H. Haffner, M. Selig, D. Schmidt, K. Janotta, M. Loh, Development of aflexible utilisable robot for intelligent sensor-based sewer inspection, Proc. of the4th International Conference on Pipeline Construction, Hamburg, Germany, 1994,pp. 367–374.
[2] R. Kirkham, P.D. Kearney, K.J. Rogers, J. Mashford, PIRAT — a system forquantitative sewer pipe assessment, The International Journal of RoboticsResearch 19 (11) (2000) 1033–1053.
[3] J.S. Mashford, A neural network image classification system for automaticinspection, Proc. of the 1995 IEEE International Conference on Neural Networks,Perth, Australia, 1995, pp. 713–717.
[4] O. Moselhi, Shehab-Eldeen, Classification of defects in sewer pipes using neuralnetworks, Journal of Infrastructure Systems 6 (3) (2000) 97–104.
[5] S.K. Sinha, F. Karray, Classification of underground pipe scanned images usingfeature extraction and neuro-fuzzy algorithm, IEEE Transactions on NeuralNetworks 13 (2) (2002) 393–401.
[6] O. Duran, K. Althoefer, L.D. Seneviratne, Automated pipe defect detection andcategorization using camera/laser-based profiler and artificial neural network,IEEE Transactions on Automation Science and Engineering 4 (1) (2007) 118–126.
[7] H.D. Cheng, X.H. Jiang, Y. Sun, J. Wang, Color image segmentation: advances andprospects, Pattern Recognition 34 (2001) 2259–2281.
[8] O. Moselhi, T. Shehab-Eldeen, Automated detection of surface defects inwater andsewer pipes, Automation in Construction 8 (1999) 581–588.
[9] J. Mashford, P. Davis, M. Rahilly, Pixel-based colour image segmentation usingsupport vector machine for automatic pipe inspection, Lecture Notes in ArtificialIntelligence, 4830, Springer-Verlag, Berlin, 2007, pp. 739–743.
[10] W.E. Blanz, S.L. Gish, A real-time image segmentation system using a connec-tionist classifier architecture, International Journal of Pattern Recognition andArtificial Intelligence 5 (4) (1991) 603–617.
[11] H. Gomez-Moreno, P. Gil-Jimenez, S. Lafuente-Arroyo, R. Vicen-Bueno, R. Sanchez-Montero, Color image segmentation using the support vector machines, RecentAdvances in Intelligent Systems and Signal Processing, 2003, pp. 151–155.
[12] R. Gonzalez, R. Woods, Digital Image Processing, 2nd ed, Prentice Hall Press, 2002,p. 295.
[13] S.E. Grigorescu, N. Petkov, P. Kruizinga, Comparison of texture features based onGabor filters, IEEE Transactions on Image Processing 11 (10) (2002) 1160–1167.
[14] T. Randen, J.H. Husøy, Filtering for texture classification: a comparative study, IEEETransactions on Pattern Analysis and Machine Intelligence 21 (4) (1999)291–310.
[15] K. Müller, B. Fischer, Objective condition assessment of sewer systems, Proc.LESAM 2007—2nd Leading Edge Conference on Strategic Assessment Manage-ment, Lisbon, Portugal, 2007, pp. 1–13.
[16] S.K. Sinha, P.W. Fieguth, Segmentation of buried concrete pipe images,Automation in Construction 15 (2006) 47–57.