
Nematic-like Organization of Magnetic Mesogen-Hybridized Nanoparticles

A molecular dynamics study of the nematic phase of 4-n-pentyl-4'-cyanobiphenyl
by S. J. PICKENt, W. F. VAN GUNSTERENS, P. TH. VAN DUIJNENS and W. H. DE JEUG
tAKZO Research Laboratories Arnhem, Physical Chemistry Department, P.O. Box 9300, 6800 SB Arnhem, The Netherlands
$Department of Chemistry, University of Groningen, Nijenborg 16, 9747 AG Groningen, The Netherlands
GFOM-Institute for Atomic and Molecular Physics, Kruislaan 407, 1098 SJ Amsterdam, The Netherlands. and Open University, P.O. Box 2960,
6401 DL Heerlen, The Netherlands
(Received 2 November 1988; accepted 21 April 1989)
Preliminary molecular dynamics simulations of the nematic phase of 4-n-pentyl-4'-cyanobiphenyl are described. The simulations include all molecular degrees of freedom. The influence of the molecular dipole moment is investigated by comparing simulations with and without a charge distribution on the molecules. Inclusion of the charge distribution is found to lead to a slight broadening of the orientational distribution function, in qualitative agreement with Raman measurements of the orientational order parameters.
1. introduction Liquid crystals [I] are characterized by the presence of orientational order of the
anisotropic molecules, while positional, order is either completely absent (nematic phase) or strongly reduced (for example in smectic phases). In the case of elongated molecules, the orientational order leads to a unique macroscopic axis, the director, which gives the average orientation of the long molecular axes. The smectic phases are characterized by an additional density wave in one direction, in the smectic A phase along the director. Molecular dynamics studies of liquid crystals [2, 31 have so far usually been restricted to model bodies to represent the real molecules (sphero- cylinders, ellipsoids, etc.) In this paper preliminary results are given for simulations on a set of realistic mesogenic molecules. It should be emphasized, however, that the purpose of the present study was not to investigate the phase behaviour in any detail. The simulations that are described are intended to show the possiblities and dif- ficulties of such detailed molecular dynamics simulations, and could be a starting point for a more complete treatment of larger systems. Within this limited framework calculations have been done in the nematic phase region to study the influence of the molecular charges on the orientational distribution. For that reason 4-n-pentyl-4'- cyanobiphyl (5CB) was chosen.
The degree of orientational order in the nematic phase can be described by the orientational distribution function f (8)
02674292189 53.00 0 1989 Taylor L Fnne* Ltd

358 S. J. Picken et al.
where N(B) dB is the fraction of molecules with their long axis oriented at an angle between j and /3 + dB with the director. The function f (8) can be expanded in terms of the Legendre polynomials of even order
The expectation value (P,(cos B)) is usually called the order parameter, and can be related to the anisotropy of second rank properties such as the birefringence or the anisotropy of the magnetic susceptibility [I]. In the isotropic phase all (P,(cos B)) values are zero, while for perfect orientational order all (P,(cos B)) are one. Using depolarized Raman scattering not only (P,(cosB)) but also (P,(cosB)) can be determined [I, 41.
The choice of 5CB was motivated by the observation that the values found for (P,(cosB)) of the nCB series
showed an anomalous trend giving very low values for the lower members [5]. This was attributed to the effect of antiparallel association of the molecules due to the strong terminal dipole moment. If this association is imagined to take place mainly in the form of dimers, it is easy to visualize that the long axis of a constituent molecule (taken as the para axis) will not coincide with what is expected to be the long axis of the dimer. Assuming the angle between the two axes to be Po this influences the order parameters via
Here the index mon refers to the value to be expected for non-associating mol- ecules (monomers). In this view the higher homologues are expected to have a low value of Po, leading to normal values for the effective (P,(cosB)), while the larger values of Po obtained for the lower homologues give rise to the anomalous low values of <P,(cosB)). This effect is illustrated in figure 1 for various values of Bo [51.
The molecular dynamics method allows us to compare the results of two sim- ulations, one without charges and one including a point charge representation of the molecular charge distribution, keeping other molecular properties the same. Obviously, such a comparison is impossible in a real experimental situation. To obtain the charge distribution within the molecules, ab initio LCAO calculations were performed. The results were used as input for the simulations. Inclusion of the charges indeed gives some broadening of the orientational distribution, thus providing support to the interpretation of the order parameters given here. Though the limited simulation time adds some uncertainty to any conclusion, we feel neverthless that by comparing two systems, with and without a molecular charge distribution, it is possible to predict qualitatively the influence of the dipole moment on the order parameters of 5CB.
The plan of the paper is as follows. In the 92 the system to be simulated is described in more detail. Then in 93 the molecular dynamics method is discussed further. In the last section the method of analysis and the results are presented.

Molecular dynamics simulation of a nematic
Figure 1. Experimental (circles) and calculated (solid lines) values of (P,(cosS)) versus <P,(cos~)) for various values of So; The latter are calculated using the model described in the Introduction. Open circles are experimental data for 7CB, closed circles for 5CB ([5]).
2. Molecular model and force field The molecular dynamics simulations were performed on systems containing 64 5CB molecules, using rectangular periodic boundary conditions. Each molecule contains 19 atoms of types N, C, CH, CH, and CH,. This means that 1216 (=64 x 19) particles were used in the simulations. In table 1 the various terms in the interatomic potential which is used are listed; table 2 shows the numerical values for the parameters. These are average values obtained from diverse experimental methods, such as Raman scattering, M IR, NMR, compressibility measurements, etc. The
Table 1. The potential U that was used. The angle Ouk is the angle between bonds i j and jk. The angles q5ijk, and $ijk, are the dihedral angles between the planes through atoms i, j and k, and the planes through atoms j, k-and 1. The summations are performed over all relevant i j pairs, ijk triplets, or ijkl quadruplets as the case may be.
Potential Description
Lennard-Jones terms
1 QiQi
+;GT Coulomb term
+ 1 +(4hjkl($ - *o);kl Improper dihedral angle term ijk l

360 S. J. Picken er al.
Table 2.1. Lennard-Jones parameters A and B for atoms of the same type. Interactions for unlike atoms are taken to be the square root of the product of the respective entries in this table, e.g.
Bond type A and A,,/J mol-' A'' B and B,,/J mol-' A9
N-N 3.389 x lo9 2-436 x lo6 3.389 x lo9 2.436 x lo6
CH-CH 1.512 x 10¹⁰ 0.833 x loL0
Table 2.2. Atomic masses.
bond lengths of the molecules are kept fixed using the method SHAKE [6]. The Lennard-Jones interaction is used for all non-bonded interactions and for intra- molecular interactions beyond the 1-2 and 1-3 pairs (first and second covalently bonded neighbours). For the 1 4 intramolecular interaction special -values of the constants A and B are used to obtain a realistic description of the conformer statistics (e.g. in the alkyl chain). Also the Coulomb interaction is calculated over all pairs excluding the 1-2 and 1-3 pairs [A. As yet no succesful method for including molecular polarizability has been found. This enhances the qualitative nature of any agreement with experimental values.
The partial atomic charges were obtained from ab initio LCAO calculations performed by one of us (P.Th. van Duijnen). The molecular wave function was calculated using the Hartree-Fock method, taking all electronic orbitals into account. The atomic charges which were used were not the usual Mulliken charges. Instead the partial atomic charges were calculated under preservation of the total charge and the overall dipole moment of the molecule [8]. The results of this calculation are shown in Figure 2. The calculated dipole moment is 2.49 D; experimental values are 4.34 D for cyanobiphenyl in benzene and 3.5 D for a cyanide group in a. non-polarizable medium [9].

Molecular dynamics simulation of a nematic
Figure 2. Partial atomic charges (in electronic units) for the cyanobiphenyl group from ab initio LCAO calculations. No partial charges were used for the aikyl chain.
Table 2.3. Bond lengths.
Bond type ~ength/A
CH and CG
3. Computational procedure To obtain an initial configuration for the simulations we placed the 64 molecules,
at random positions and with a random orientation around the biphenyl axis, in a rectangular box. The molecules were alternately placed with an up or a down orien- tation to prevent a net dipole moment for the initial configuration. Molecular overlap was avoided by assigning an excluded volume to each particle. The starting con- figuration obtained by this method is shown in figure 3. Of course the density of the starting configuration is much too small due to inefficient filling of the available space.
Before starting the simulation the initial configuration was treated by an energy minimization routine that reduces the potential energy. This is required to prevent

S. J. Picken et al.
Figure 3. The initial configuration for the molecular dynamics simulatio
Table 2.4. Bond-angle interaction parameters.
oscopi c pair).
Bond type Angle (I, K#/J mol-I rad-2
N d - C ,C-CH
C etc.
Table 2.5. Improper dihedral interaction parameters.
On all combinations
k the phenyl rings are kept flat using:
K, = 0-17 x lo6 Jmol-I rad-2, ILo = 0"
initial bad contacts or strained bonds leading to high initial velocities of the particles. The energy minimization was performed by using a steepest gradient method which changes the conformation along the steepest path down the potential energy surface [A. After the energy minimization the particles are assigned with a velocity taken from a maxwellian distribution. Using the method SHAKE [6] constraints are incorporated to remove the velocity components in the direction of the bonds. Also, any centre of

Molecular dynamics simulation of a nematic 363
Table 2.6. Dihedral interaction parameters.
K,/J mol-' n 40 Description
Alkane
mass velocity and angular momentum of the whole system is removed. Having obtained both coordinates and velocities for the initial conformation in this way the simulation can be started.
The molecular dynamics algorithm used is the so-called leap-frog algorithm [lo]
ri(t + At) = r,(t) + vi(t + )At) At
where At is the length of the time step used. In our case At was 0404ps as no very rapid motions are to be expected in this system. The force Fon each particle is derived from the potential
The advantage of using the leap-frog algorithm is that the particle velocities are explicitly used in the calculation of the new configuration. These velocities are required anyway to perform temperature and pressure scaling. Temperature scaling is used to keep the temperature of the system, on average, constant and to allow a smooth transition from one temperature to another [I 11. It is performed by the algorithm 1121
This is equivalent to a coupling of the system (with temperature T ( t ) ) to a heat bath of temperature TWr. The coupling time constant is T, and is usually taken to be 0.1 ps. Analogously, the pressure is kept, on average, at PWI by using a scaling factor [I21

364 S. J. Picken er al.
where B is the isothermal compressibility of the system, r, is the coupling time constant (again taken as 0.1 ps) and P, is the pressure along direction i. We used P,, = 9.8 x lo4 Pa and /3 = 5.9 x lo-'' Pa-' . The size of the entire system is scaled .by a factor Si in the corresponding x, y or z direction. The pressure 8 is obtained from the virial theorem and is given by
P, V = 1 m,v?(j) + 1 r,(i)&(j), I J
(8)
where V is the volume of the system, and the index j denotes particles. As we have mentioned the density of the initial configuration was too low.
Performing a molecular dynamics simulation using pressure scaling (equations (7) and (8)) led to the formation of holes in the configuration. This is probably caused by the fact that the virial theorem, which is used to evaluate the pressure, is not applicable to systems that are not in equilibrium. The correct (non-equilibrium) equation to calculate the pressure would be
where pi(j) is the momentum of particle j in the direction i. The last term is usually taken to be zero on average (in equilibrium). However for a system that is system- atically shrinking it leads to a decrease of the calculated pressure. This in turn leads to a faster scaling down of the dimensions of the system than with the normally used equation (8), thus hopefully preventing the formation of holes. Unfortunately, when using periodic boundary conditions, equation (9) leads to ambiguous results for the evaluation of Cj r i ( j ) . pi(j). This means that this equation cannot be used sensibly in molecular dynamics simulations with periodic boundary conditions, as described here. To prevent the formation of holes we have used instead a method where the density of the system was increased to the required value by reducing the size of the system during the first 1000 time steps without applying pressure scaling. After this forced adaptation of the density, the pressure scaling (equations (7) and (8)) was switched on and kept the system near the required density.
A final subtlety worth mentioning is the searching scheme that is used to calculate the non-bonded interactions. The non-bonded interactions were taken into account while using cut-off radii to limit the number of interacting pairs to be considered. The non-bonded interactions were completely included within a radius of 0.7 nm. The interacting pairs are stored in a pair list which is updated every 10 molecukar dynamics steps. In addition, once every 10 steps the interactions from pairs within a cut-off radius between 0-7 and 1-Onm were calculated. This long range part of the non- bonded interactions can then be used for the next 10 molecular dynamics steps without further change [13]. The computation times for one molecular dynamics step using a Control-Data Cyber 1701760 computer are shown in tabIe 3. The grid searching scheme which, in principle, is more efficient for larger systems is shown for comparison. Using the long range pair list method quite fast simulations are possible i.e. the system was simulated over 60 ps which required about 1 1-5 hours computation time. Although certain properties, like temperature and density, were well equi- librated within that time, others, like the molecular orientation, were still changing slightly during the last 40-60ps of the runs. This means that the system is not fully equilibrated. However, since both runs are performed under identical conditions, tentative conclusions about the effects of inclusion of a molecular charge distribution may still be drawn.

Molecular dynamics simulation of a nematic 365
'able 3. Computation time for one molecular dynamics step on a Control-Data Cyber 1701760 computer for a grid searching scheme, a simple pair list searching scheme and a pair list scheme where the long range interactions are included every 10 steps.
Cut off Long range Average CP time per radiuslnm radiuslnm molecular dynamics step/s
- -
Grid scheme 0.8 Pair list 0.8 Long range pair list 0-7
4. Results and discussion In figure 4 the configuration is shown after 60 ps simulation time. We note that
there seems to be a collective tilt occurring in the systems. Such an effect has been found before in simulations of ordered lamellar phases [14]. The tilt varies as a function s f
Figure 4. (b)
The configurations after 60ps simulation for the uncharged (a) and the charged (6) system (stereoscopic pairs).

366 S. J. Picken et al.
time, so that on average the molecules are still aligned along the director. There is no immediately visible difference between the configurations for the charged and uncharged simulations. To make a more accurate analysis possible various properties have to be determined, such as order parameters and diffusion constants. This will now be described in more detail.
Figure 5. The calculated orientational distribution functions for the uncharged (a) and the charged (b) systems.

Molecular dynamics simulation of a nematic 367
The orientational distribution function f(P) is obtained by counting the number of molecules with a deviation angle between /3 and /3 + dp. The normal expression for f(P) (see equation 1) in the discrete case yields
where
is the fraction of molecules between t3 and + AP. The order parameters (P,(cos 8)) are now found by
where the summation is performed by dividing the interval [0, x /2 ] into segments of width A/?, and use is made of the axial symmetry of the nematic phase;
In figure 5 the orientational distribution functions are shown averaged over 32-56 ps and in figure 6 the order parameters (P2(cosj?)) and (P4(cos/3)) are glven as a function of time. During the simulations the reference temperature T,, was increased at the indicated intervals (see figure 6). The orientational distribution function for the charged system is clearly slightly broader compared to that of the uncharged system. However no large differences in (P2(cos/3)) and (P4(cos/3)) are apparent from figure 6 comparing the two simulations. To test if (P4(cos/3)) is affected by the presence of a molecular charge distribution we also show (P4(cos/3)) versus (P2(cos /I)) in figure 7. The black cloud of the simulated results for (P4(cos P)) versus (P,(cosP)) for the charged system is steeper than for the uncharged system. This indicates that the inclusion of a molecular charge distribution tends to decrease the value of (P4(cos/3)) for a given value of (P,(cos P)). From figure 7 we also find that the agreement with the experimental values [5] is improved if the molecular charge distribution is included in the calculation.
To be certain that the simulated systems are nematic it is necessary to calculate smectic order parameters. The smectic order parameter r, is defined by
rk = (cos (k r)), (12)
where k is the reciprocal lattice vector along the director n
and where r, is the layer spacing to be considered. In a system of molecules of length 1, smectic order parameters corresponding to lengths 1, 1.41 and 21 appear to be relevant. These are associated with the various types of smectic A phase: S,, S,,, and SAz. The length of 1-41 corresponds to the length of a dimer compared to the length of an individual molecule in the case of 5CB. This was estimated using space filling molecular models and assuming complete overlap of the aromatic cyano-biphenyl groups. The evaluation of 7, using this equation gives rise to a rather fundamental problem in that the origin of the layer coordinates is not known. Thus an unknown

S. J. Picken et al.
Figure 6. The calculated results for (P,(cosB)) and (P,(cos 8)) as a function of time for the uncharged (a) and the charged (b) system. The temperature is increased at the boundaries of the intervals, as indicated.
phase factor in k r has to be dealt with. This is readily done by evaluating the average
where 11 indicates the norm of a complex number. If the origin of r is centred on a layer, expressions (12) and (14) for rk yield the same result. The latter expression however is independent of an overall translation of r. The various smectic order parameters for the charged and uncharged systems are all found to be very small (< 0.1) and show an erratic behaviour as a function of time. In the simulations the axial ratio of the box is the same as that of the individual molecules; the box is approxi- mately four molecules long. The effect of the periodic boundary conditions could be to increase the smectic order parameters (at least for I and 21). The observation that the

Molecular dynamics simulation of a nematic
Figure 7. The calculated (P4(cosB)) versus (P2(cos 8)) curves (the black clouds) for the two simulations without (a) and with (b) a molecular charge distribution. The straight lines indicate the average slope of (P4(cos8)) versus (P2(cos8)). The curves are from the model described in the Introduction. The measured values for 5CB are indicated by the crosses.
370 S. J. Picken et al.
smectic order parameters are small then gives confidence that the simulated systems are indeed nematic,
Diffusion constants Di ( i = x, y, z ) can be obtained from the Einstein relation
1 D, = lim - ((ri(t) - r,(O))').
I-= 2t
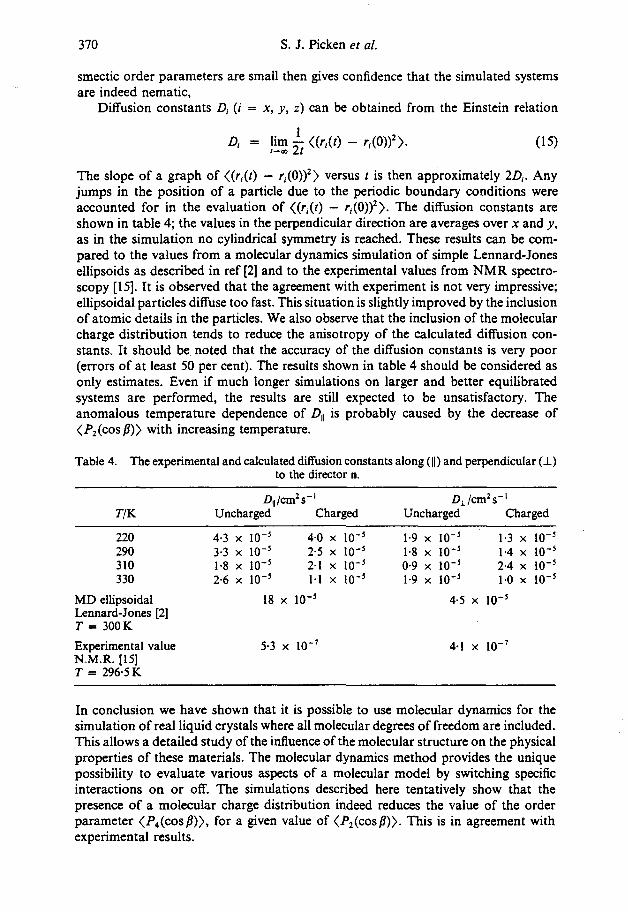
The slope of a graph of ((r,(t) - r,(O))') versus t is then approximately 20,. Any jumps in the position of a particle due to the periodic boundary conditions were accounted for in the evaluation of ((ri(t) - ri(0))'). The diffusion constants are shown in table 4; the values in the perpendicular direction are averages over x and y, as in the simulation no cylindrical symmetry is reached. These results can be com- pared to the values from a molecular dynamics simulation of simple Lennard-Jones ellipsoids as described in ref [2] and to the experimental values from NMR spectro- scopy 1151. It is observed that the agreement with experiment is not very impressive; ellipsoidal particles diffuse too fast. This situation is slightly improved by the inclusion of atomic details in the particles. We also observe that the inclusion of the molecular charge distribution tends to reduce the anisotropy of the calculated diffusion con- stants. It should be noted that the accuracy of the diffusion constants is very poor (errors of at least 50 per cent). The results shown in table 4 should be considered as only estimates. Even if much longer simulations on larger and better equilibrated systems are performed, the results are still expected to be unsatisfactory. The anomalous temperature dependence of D, is probably caused by the decrease of (P,(cos /3)) with increasing temperature.
Table 4. The experimental and calculated diffusion constants along (11) and perpendicular (I) to the director n.
D,/cm2 s-I D, /cmz s- T/K Uncharged Charged Uncharged Charged
MD ellipsoidal Lennard-Jones [2] T = 300K
Experimental value N.M.R. [IS] T = 296.5 K
In conclusion we have shown that it is possible to use molecular dynamics for the simulation of real liquid crystals where all molecular degrees of freedom are included. This allows a detailed study of the influence of the molecular structure on the physical properties of these materials. The molecular dynamics method provides the unique possibility to evaluate various aspects of a molecular model by switching specific interactions on or off. The simulations described here tentatively show that the presence of a molecular charge distribution indeed reduces the value of the order parameter (P4(cos/3)), for a given value of (P,(cosj)). This is in agreement with experimental results.

Molecular dynamics simulation o f a nematic 37 1
The main limitation for the use of the molecular dynamics method is the rather large computational effort required for even a relatively small number of particles. In this respect we feel that the present results should be treated with some caution until a similar simulation with a larger number of molecules has been done. Moreover, to obtain quantitative results on order parameters, much longer simulations should be performed than was possible at the time this work was camed out. Of course the ever increasing power of super-computers and the planned construction of dedicated molecular dynamics machines is steadily reducing the computation time. We feel that the method is not (yet) suitable as a standard tool for the investigation of liquid crystals, but should be used to study specific problems that have not yielded to more traditional methods of research. Future molecular dynamics simulations could address a variety of interesting problems such as the structure of disc-like liquid crystal phases and of polymer liquid crystals, Also the influence of the flexible alkyl chains on the type(s) of phase(s) could be studied at a molecular level.
This work was performed while the first and last author were a t the Solid State Physics Laboratory of the University of Groningen. The authors would like to thank Professor J. Kommandeur for suggesting the use of the molecular dynamics method for the study of liquid crystals. This work is part of the research program of the Stitchting voor Fundamentel Onderzoek der Materie (Foundation for the Funda- mental Research on Matter, FOM) and was made possible by financial support from the Nederlandse Organisatie voor Wetenschappelijk Onderzoek (Netherlands Organization for the Advancement of Research, NWO).
References 111 See for example VERTOGEN, G. and DE JEU, W. H., 1988, Thermotropic Liquid Crystals,
Fundamentals, Springer Ser. Chem. Phys., Vol. 45 (Springer). [2] DECOSTER, D., CONSTANT, E., and CONSTANT, M., 1983, Molec. Crystals liq. Crystals, 97,
263. [3] For a review see FRENKEL, D., 1987, Molec. Phys., 60, 1. [4] JEN, S., CLARK, N. A., PERSHAN, P. S., and PRIESTLY, E. B., 1979, J. chem. Phys., 66,4635. [5] CUMPER, C. W. N., DEV, S. K., and LANDOR, S. R., 1973, J. chem. Soc. Perkin 11, 537.
46, 1443. [6] RYCKAERT, J.-P., C I C C O ~ , G., and BERENDSEN, H. J. C., 1977, J. comput. Phys., 23, 327. [A VAN GUNSTEREN, W. F., and BERENDSEN, H. J. C., GROMOS mannua1(1987), BIOMOS
BV, Groningen, The Netherlands. [8] THOLE, B. T., and VAN DUIJNEN, P. TH., 1983, Theor. chim. Acta, 63, 209. [9] CUMPER, C. W. N., DEV, S. K., and LANDOR, S. R., 1973, J. chem. Soc. Perkin II, p. 537.
[lo] HOCKNEY, R. W., and EASTWOOD, J. W., 1981, Computer Simulation using Particles (McGraw-Hill).
[I 11 HAULEY, H. J. M., and HEYES, D., 1986, Molecular Dynamics Simulation of Statistical- Mechanical Systems (Proc. Int. School of Physics Enrico Fermi, course 97) edited by G. Ciccotti and W. G. Hoover, (North Holland), p. 317.
I121 BERENDSEN, H, J. C., POSTMA, J. P. M., VAN GUNSTEREN, W. F., DINOLA, A., and HAAK, J. R., 1984, J. chem. Phys., 81, 3684.
[13] BERENDSEN, H. J. C., 1985, Molecular Dynamics and Protein Structure, edited by J. Hermans, (Polycrystal Book Series) (P.O. Box 27, Western Springs), p. 18.
[14] VAN DER PLOEG, P., and BERENDSEN, H. J. C., 1982, J. chem. Phys., 76, 3271. [IS] L E A D B ~ R , A. J., TEMME, F. P., HEIDEMANN, A. and HOWELLS, W. S., 1975, Chem. Phys.
Lett., 34, 363. (161 BACA, A., ROSSETTI, R., and BRUS, L. E., 1979, J. chem. Phys., 70, 5575.
Copyright © 2022 FDOKUMEN