
Orbital periods of cataclysmic variables identified by the SDSS
Upload
independentCategory
view
1download
0
RIVER RESEARCH AND APPLICATIONS
River. Res. Applic. 24: 132–147 (2008)
Published online in Wiley InterScience
A MODEL TO PREDICT OUTBREAK PERIODS OF THE PEST BLACKFLYSIMULIUM CHUTTERI LEWIS (SIMULIIDAE, DIPTERA) IN THE GREAT FISH
RIVER, EASTERN CAPE PROVINCE, SOUTH AFRICA
N. A. RIVERS-MOORE,a* D. A. HUGHESa and F. C. DE MOORb
a Institute for Water Research, Rhodes University, Gahamstown, P.O. Box 94, 6140, South Africab Albany Museum and Department of Zoology and Entomology, Rhodes University, Somerset Street, Grahamstown, 6140, South Africa
(www.interscience.wiley.com) DOI: 10.1002/rra.1055
ABSTRACT
Elevated, more constant flows characterize the current flow regime of the Great Fish River (Eastern Cape province, South Africa)following the completion of an interbasin transfer scheme (IBT) in 1977, where prior to this the winter months were oftencharacterized by zero flows. Changes in aquatic macroinvertebrate communities, and in particular outbreaks of the pest blackflySimulium chutteri Lewis (Diptera: Simuliidae) have been documented in response to these altered flows. Integrated controlmeasures of pest blackfly have been advocated based on flow reductions during the winter months. In this study, a site-specificdischarge threshold of 2m3 s�1 was identified as a flow reduction target based on the amount of hydraulic habitat available toS. chutteri larvae within a particular rapid. Hydrological analyses showed that flow conditions have created ideal blackfly larvalhabitat in this rapid, with prolonged uninterupted periods (>3 months) exceeding this threshold. A model was developed topredict probabilities and severities of blackfly outbreaks, based on flow periods and water temperatures, both of which determinethe success and duration respectively of the aquatic phase of S. chutteri. July was identified as the critical month for flowrestriction to 2m3 s�1 for a period of 38 days, in order to reduce thewinter populations of S. chutteri in the Great Fish River at thestudy site and avoid the typical spring outbreaks of blackfly. Copyright # 2008 John Wiley & Sons, Ltd.
key words: Simulium chutteri; discharge; water temperature; available habitat; flow regulation; integrated control
Received 21 April 2006; Accepted 12 December 2006
INTRODUCTION
Within a semi-arid country such as South Africa, where rainfall is unevenly distributed and unpredictable,
interbasin transfer schemes (IBTs) involving mass transfers of water from one geographically distinct catchment to
another are perceived as a feasible solution to uneven water distribution (Snaddon and Davies, 1998). Typically, the
technical and economic aspects of IBTs overshadow and supersede their environmental consequences (Snaddon
and Davies, 1998). Snaddon and Davies (1998) list a number of ecosystem responses in recipient systems including
decreased flow variability, unseasonal increase in discharge and altered aquatic macroinvertebrate community
composition and hydraulic biotopes.
The Great Fish River is an example of a permanently changed system due to an IBT that has resulted in prolonged
flow perturbation (O’Keeffe and de Moor, 1988). This IBT, achieved through a tunnel transferring flow from the
Orange River to the Great Fish River, was completed in 1977 to provide a regular supply of water to the arid Eastern
Cape region. As a consequence of this scheme, the flow regime in this river has changed from being naturally
seasonal and variable to perennial with reduced seasonal variation (O’Keeffe and de Moor, 1988).
The most significant biological change in this system as a result of an increase in high-velocity biotopes has been
that Simulium chutteri Lewis (Diptera: Simuliidae) populations now reach pest proportions and outnumber other
invertebrate species (O’Keeffe and de Moor, 1988). S. chutteri is the only blackfly species in South Africa
appearing in sufficiently high numbers to warrant the development of specific control programmes (de Moor,
1994a). Economically, S. chutteri is significant because of its nuisance effect on tourists (although not recorded as a
*Correspondence to: N. A. Rivers-Moore, Ezemvelo KZN Wildlife, P.O. Box 13053, Cascades, 3202, Pietermaritzburg, South Africa.E-mail: [email protected]
Copyright # 2008 John Wiley & Sons, Ltd.
PREDICTING OUTBREAK PERIODS OF PEST BLACKFLY 133
man-biting species, its swarming around head; and crawling into hair, eyes, nose and mouth in vast numbers, causes
considerable discomfort) and its association with reductions in livestock production and stock losses, which has
been conservatively estimated at R43 million (ca USD6 million at the time of writing) per annum in the Northern
Cape province along the Orange River (Mullins, 2005). Along the Great Fish and Orange Rivers, the livestock most
affected are sheep; in sufficient numbers, females of S. chutteri requiring blood meals inflict painful bites which
may result in secondary infections, loss of condition and even death (Palmer 1997).
Water temperatures and flow volumes are key determinants in the life cycles of the pest blackfly S. chutteri Lewis
(Carlsson, 1967; de Moor, 1994a). For example, within the Orange River, a sharp inflection in available habitat
occurs for flows between 233 and 603m3 s�1, with a threshold value for major increases in available habitat
estimated to be at 300m3 s�1 (Palmer, 1997). While flow rates and volumes are linked to blackfly abundance, the
underlying driver is current velocity and the associated amount of available habitat for S. chutteri larvae (O’Keeffe
and de Moor, 1988). During their ontogeny, aquatic invertebrates attain two critical thresholds for water
temperature, viz a developmental threshold (which limits the development of larval stages) and a maturation
threshold (which limits the development to pupal and adult stages) (Ward and Stanford, 1982). These temperature
thresholds place limits on the duration of the aquatic stage, that is, the developmental time from egg through various
larval instars to adult emergence from the pupal stage. In the case of S. chutteri, the duration of the aquatic stage
varies between 12 and 45 days, depending on water temperatures (de Moor, 1982b, 1989). A mean daily water
temperature of 108C was identified as a maturation threshold for S. chutteri by Palmer (1997), below which no
pupation occurs, and therefore no adults emerge when water temperatures are below this for prolonged periods of
time.
Such thresholds are largely meaningless unless they are considered within a life-history context, which provides
a means of identifying critical ‘windows of time’ during the year when they should not be exceeded. The
life-history of S. chutteri is such that populations of this species encounter ‘periods during the year when abiotic
influences are at an optimum and biotic interferences are at a minimum, and the habitat suitability attains its highest
level (deMoor, 1989). During such times, one can expect exponential population growth’ (deMoor, 1986, 1989). In
the Great Fish River, pest population outbreaks typically occur during late winter/early spring in certain identified
problem reaches, so that critical periods for controlling population sizes are July–August when most of the
population is present in the larval or pupal phase (O’Keeffe and de Moor, 1988).
Understanding when these outbreaks may occur can be facilitated through the use of models which often have a
probabilistic output. For example, Bonkewitzz and Palmer (1997) developed an interactive, flexible rule-based
probabilistic model for river managers involved with blackfly control programmes. The aim of this model was to
assist river managers in deciding when larvicides should be applied, in order to minimize the number of
applications and associated costs, by predicting when the annoyance levels of adult S. chutteri females exceeded a
given threshold value. The model was based on historical data linked to those driving variables that were considered
to be the important in blackfly outbreaks. Variables considered included flow volumes, weekly maximum and
minimum water temperatures, evaporation, larval abundances (based on Palmer’s (1994) 10-point scale), the
presence and abundance of larval and pupal blackfly predators and the toxic blue-green algae Microcystis spp. A
matrix of all variables at a weekly timescale, with an associated table of probabilities of outbreaks correlated with
each variable formed the basis for calculations. While the model was primarily designed for the Orange River, it
could be applied to any river system where blackfly problems occur since a user is able to set the relative amount of
blackfly habitat available based on five flow categories using a 10-point scale. Flow categories are a function of the
probability of exceedance at the 10th, 40th, 60th and 90th percentiles, which allows the model to accommodate
rivers of any size, with different geomorphologies being implicit in the qualitative 10-point scale.
Within the Great Fish River, the available blackfly habitat changes on a seasonal basis under different flow
conditions, with water temperatures affecting the life cycle duration. In order to apply larvicides more effectively, it
is important to know when the time ‘window’ is optimal for such applications, as well as to clarify whether critical
flow discharges—linked to water velocity-driven available larval blackfly habitat—exist. This would enable
critical flow reduction targets to be set during certain times of the year. Such flow regulation would contribute to an
integrated blackfly control programme, which deMoor (1997) regards as being the most effective control approach.
From the perspective of available habitat for S. chutteri larvae, however, this cannot be achieved without an
understanding of how flow volumes have changed since the completion of the Orange-Fish IBT in 1977. The aims
Copyright # 2008 John Wiley & Sons, Ltd. River. Res. Applic. 24: 132–147 (2008)
DOI: 10.1002/rra
134 N. A. RIVERS-MOORE ET AL.
of this research were to identify a critical discharge threshold for pest blackfly larval outbreaks and to develop a
model which would facilitate the identification of an optimum ‘window’ period where pest blackfly larval
populations could be controlled through flow manipulation.
STUDY SITE
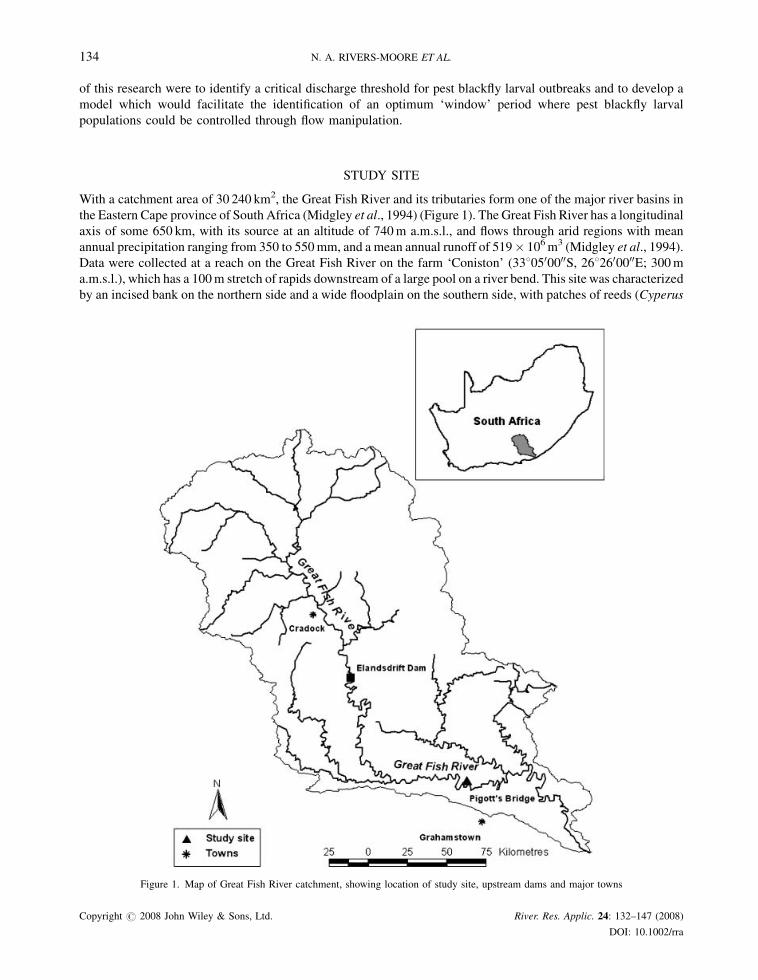
With a catchment area of 30 240 km2, the Great Fish River and its tributaries form one of the major river basins in
the Eastern Cape province of South Africa (Midgley et al., 1994) (Figure 1). The Great Fish River has a longitudinal
axis of some 650 km, with its source at an altitude of 740m a.m.s.l., and flows through arid regions with mean
annual precipitation ranging from 350 to 550mm, and a mean annual runoff of 519� 106m3 (Midgley et al., 1994).
Data were collected at a reach on the Great Fish River on the farm ‘Coniston’ (3380500000S, 2682600000E; 300ma.m.s.l.), which has a 100m stretch of rapids downstream of a large pool on a river bend. This site was characterized
by an incised bank on the northern side and a wide floodplain on the southern side, with patches of reeds (Cyperus
Figure 1. Map of Great Fish River catchment, showing location of study site, upstream dams and major towns
Copyright # 2008 John Wiley & Sons, Ltd. River. Res. Applic. 24: 132–147 (2008)
DOI: 10.1002/rra
PREDICTING OUTBREAK PERIODS OF PEST BLACKFLY 135
sp.) growing on this bank. It was chosen not only because it is a typical blackfly problem ‘hot spot’ on the Great Fish
River because of the suitable hydraulic biotopes which support large populations of S. chutteri, but also because of a
Department of Water Affairs and Forestry (DWAF) gauging weir (Q9H012—Pigott’s Bridge) 500m downstream
of this site which meant daily flow volumes. Measured flows at Pigott’s Bridge weir are a combination of natural
runoff and inflows from tributaries, together with constant-release flows from the upstream Elandsdrift Dam. These
flow releases are determined by a water bailiff in response to weekly flow requests for irrigation water from farmers
downstream of Elandsdrift Dam, and are regulated daily (and sometimes twice daily) to meet these requirements.
The management of these flows is also moderated through a hydrological model (Groenewald, 2006).
CONCEPTUAL MODEL AND GENERAL APPROACH
A model was developed, using inputs of mean daily flow rates and water temperatures from 1 January 1950 to 31
December 2005, to predict optimum periods for flowmanipulation and/or larvicide application for blackfly control.
These control periods were based on mean maximum monthly probabilities and qualitative severity classes of pest
blackfly outbreaks for pre- and post-IBT flows. The central assumptions of this model are that:
� L
Co
arval densities are largely determined by flow velocity, available habitat and water temperature. It is assumed
that availability of food is not a limiting factor, with hydrological influences overriding potential biotic effects
(Statzner et al., 1988). Rivers-Moore et al. (2007) showed that a flow velocity threshold of 1m s�1 exists for
S. chutteri larvae, below which the probability of an outbreak, defined as more than 22 500 larvae m�2 after
Palmer (1994), was minimal;
� T
he duration of the aquatic stage of S. chutteri is 12–45 days and is inversely related to mean daily watertemperature (deMoor, 1982b, 1989). In this model, it was assumed that a linear relationship exists between water
temperature and duration of the aquatic stage, with this duration being estimated from a 7-day moving average of
mean daily water temperatures. It is acknowledged that this is a simplification, since de Moor (1994a)
demonstrated that blackfly pupal durations follow an exponential relationship with water temperatures.
However, it was felt that since the inflection points between water temperature and duration of the aquatic
stage were unknown, a linear model was more conservative and was likely to have a smaller margin of error, than
an exponential model;
� T
he longer the duration of uninterrupted favourable ambient flow (and temperature) conditions, the greater theprobability of an outbreak; and
� T
he probability of an outbreak increases with increased duration of flow exceeding the threshold flow rate.The number of consecutive days the flow rate exceeded the threshold rate, and the duration of the aquatic
subimaginal stage were used to calculate the probability of a pest outbreak of blackfly. The probability of an
outbreak is expected to increase with each consecutive day of favourable conditions and is directly related to the
duration time of the aquatic stage. The probability was estimated as a fraction of the duration of favourable flows
divided by the duration of the aquatic phase, with a maximum of 1.0 when the favourable flow period met or
exceeded the duration of the aquatic stage. (For example, if the duration of the aquatic stage was calculated to be 12
days based on water temperatures, and the number of consecutive days of flow rates exceeding the flow rate
threshold was 6 days, the probability of an outbreak would be 0.5). Consequently, outbreak probabilities changed
on a seasonal basis in response to water temperatures. The severity of an outbreak was measured on a nominal scale
(‘low’, ‘medium’, ‘high’) based on the amount of available hydraulic habitat, which is discharge-dependant.
Probabilities and severities of pest blackfly outbreaks were calculated for both pre- and post-IBT flows. From these
the maximum probability of an outbreak was calculated per month. The means of the maximum probabilities for
each calendar month were then calculated for the pre- and post-IBT periods. The mean monthly duration of
outbreaks at the three levels of severity for probabilities exceeding 0.5 were also calculated in order to identify
critical window-time periods for integrated control using flow manipulation and larvicidal applications. The data
requirements of the model are daily time series of available habitat and water temperature. Model outputs were
verified using the best available data—surveys of farmers along the Great Fish River from 1984 to 1991 for
pyright # 2008 John Wiley & Sons, Ltd. River. Res. Applic. 24: 132–147 (2008)
DOI: 10.1002/rra
136 N. A. RIVERS-MOORE ET AL.
outbreaks of adult blackfly using a 5-point ‘fly worry’ scale (Palmer, 1997), and supplemented using dates of
larvicide application during 2004–2005 in response to blackfly outbreaks. The probability and severity of outbreak
predicted by the model for the month preceding when the highest ‘fly worry’ scale was recorded in each year was
taken to compare observed versus predicted outbreaks, because the duration of the aquatic phase was
approximately 30 days at the time of observed outbreaks of adult blackfly.
DATA COLLECTION
Flow data and cross-sectional curves
Mean daily flow volumes from 1935 to 2005 were obtained from the DWAF (2005) for the gauging weir at
Piggot’s Bridge (Q9H012). These were divided into pre- and post-IBT flow series, viz 1935–1976 and 1977–2005,
reclassified into flow classes based on a log2 scale (Table I), and divided by month. The cumulative successive
frequencies of flows falling within the same flow classes were calculated for pre- and post-IBT flows, in order to
quantify how flow patterns and durations had changed for pre- and post-IBT flows. Pre- and post-IBT annual and
calendar month flow duration curves were plotted in order to determine how flow durations had altered since the
commencement of the IBT.
Based on the principle of continuity (Vogel, 1981), which defines a relationship between surface area of a
channel and the velocity of the associated fluids, site-specific velocity can be related to discharge. This is achieved
through a series of cross-sectional profiles at different discharges, where width measurements are related to depth
and velocity values. The associated width–velocity curves also provide the means of calculating the site-specific
channel area, fromwhich discharge may be estimated using velocities. Width/depth/velocity profiles were recorded
at different flow volumes between October and December 2005 in rapids at Coniston. Owing to the range of flows
under which such profiles were measured, this flow-for-time substitution was regarded as being typical of flow/
velocity conditions throughout the year. Velocities were collected at 0.4-depth at 1m intervals across the section
using a propeller current meter (Scientific Instruments, 1980). While actual current velocities experienced by
S. chutteri larvae are likely to be less than average current velocities, the latter are regarded as being suitable for
estimating hydraulic preferences of benthic invertebrates (Statzner et al., 1988; Davis and Barmuta, 1989). The
integrals of the width–velocity curves were used to estimate the percentage wetted channel area exceeding the
velocity threshold of 1m s�1 out of the wetted area, that is, the effective hydraulic habitat available to S. chutteri
larvae and pupae.
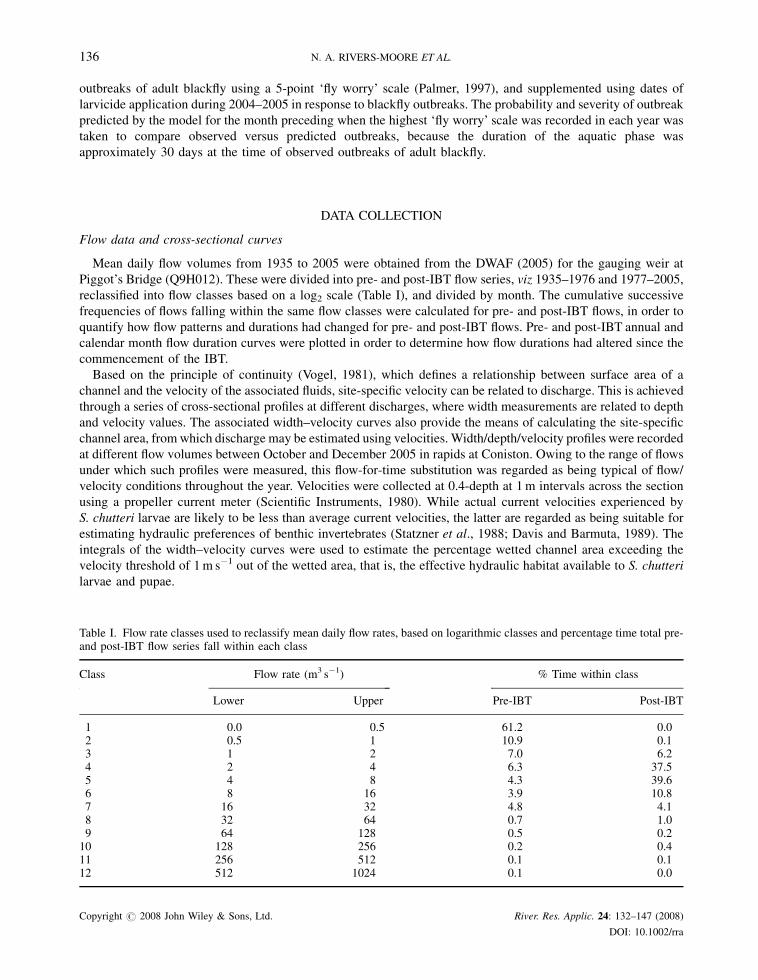
Table I. Flow rate classes used to reclassify mean daily flow rates, based on logarithmic classes and percentage time total pre-and post-IBT flow series fall within each class
Class Flow rate (m3 s�1) % Time within class
Lower Upper Pre-IBT Post-IBT
1 0.0 0.5 61.2 0.02 0.5 1 10.9 0.13 1 2 7.0 6.24 2 4 6.3 37.55 4 8 4.3 39.66 8 16 3.9 10.87 16 32 4.8 4.18 32 64 0.7 1.09 64 128 0.5 0.210 128 256 0.2 0.411 256 512 0.1 0.112 512 1024 0.1 0.0
Copyright # 2008 John Wiley & Sons, Ltd. River. Res. Applic. 24: 132–147 (2008)
DOI: 10.1002/rra
PREDICTING OUTBREAK PERIODS OF PEST BLACKFLY 137
Temperature data
Typically, air temperatures are more readily available than water temperatures. In the absence of a mean daily
water temperature time series of equivalent length to the flow rate time series, the next-best option was to simulate
such a time series. The simplest approach is to develop a statistical model relating readily to available drivers (flow
rates and air temperatures). The relationship between air and water temperature has been well documented (e.g.
Crisp and Howson, 1982; Webb and Nobilis, 1997; Johnson, 2003; Rivers-Moore et al., 2005), and thus the
collection of both time series is necessary for water temperature models from which simulations or analyses can be
derived. Eight months of hourly water and air temperatures were collected at the study site, using Hobo1 data
loggers (Onset, 1999), between 16March and 31 December 2005. Mean daily air temperatures from 1 January 1950
to 31 December 2000 were obtained from a long-term database of minimum andmaximum daily air temperatures at
a minute of a degree grid scale for the study area (Maharaj and Schulze, 2003). A lapse rate of 0.78C per 100m in
altitudinal gain (þ2.48C) was used to adjust for the altitude at Coniston (300m). These air temperatures were
supplemented with minimum and maximum air temperatures from the closest available meteorological station
(Grahamstown; Station code; 0056917 8; location, 33.28308S, 26.50008E, altitude 642m) from 1 January 2001 to
10 May 2005, and adjusted with a lapse rate of 2.48C to compensate for altitudinal differences. Hourly air
temperatures recorded at the study site using a Hobo1 data logger (Onset, 1999) provided mean daily air
temperature inputs from 11 May 2005 to 31 December 2005. Observed water temperatures were not used in the
blackfly model, to maintain consistency in using simulated water temperatures for the entire time period of blackfly
model simulations. The drawback of this approach was that actual stochastic variability in maximum daily water
temperatures was lost in using simulated water temperatures. However, on average simulated and observed
maximum daily water temperatures would be similar, and since the blackfly outbreak model was interpreted by
taking monthly averages, this was not regarded as a significant problem in the simulated water temperature time
series.
RESULTS
Temperature analyses
Mean water temperatures at Pigott’s Bridge (data from the DWAF, 2005) between 9 December 1998 and 18
October 2005 were 18.92� 5.188C, with June and July being the coldest months. In general mean daily water
temperatures were in excess of 108C, with occasional days falling to 88C during thewinter months. The relationship
between water temperature, and air temperature and flow, was defined by using statistical correlations (StatSoft,
2003). A multiple linear regression model (Equation 1; R2¼ 0.57) with a 24-h lag in air temperatures accounted for
the highest amount of variance in modelling mean daily water temperatures. This model was developed to simulate
mean daily water temperatures at the study site from 1 January 1950 to 31 December 2005, which provided input,
together with mean daily flow rates, to the blackfly outbreak model.
WTmean ¼ 8:593� 2:667 logðflowþ 1:0Þ þ 0:477ATmean�1 (1)
where WTmean is mean daily water temperature; flow is mean daily flow rate, with 1.0 added to allow for zero flows
in the log conversion; ATmean�1 is mean daily air temperature lagged by 24 h.
Regressing recorded water temperatures at the site (using the Hobo1 loggers) against water temperatures
recorded at Q9H012 for the period 20 May 2005 to 18 October 2005, yielded an R2 value of 0.99. This suggests a
consistent relationship between these two sources of data. Simulated mean daily water temperatures were
compared with daily water temperatures collected by the DWAF (2005) at Pigott’s Bridge (Q9H012) from 9
December 1998 to 13 November 2005, giving an R2 of 0.55. In general it was observed that the temperature
estimation model tended to under-simulate temperatures less than 158C, and over-simulate temperatures greater
than 158C. Within the water temperature range for the Great Fish River provided above, these discrepancies were
not regarded as serious, with differences between simulated and observed water temperatures only becoming
marked at temperature extremes (<108C and >308C).
Copyright # 2008 John Wiley & Sons, Ltd. River. Res. Applic. 24: 132–147 (2008)
DOI: 10.1002/rra
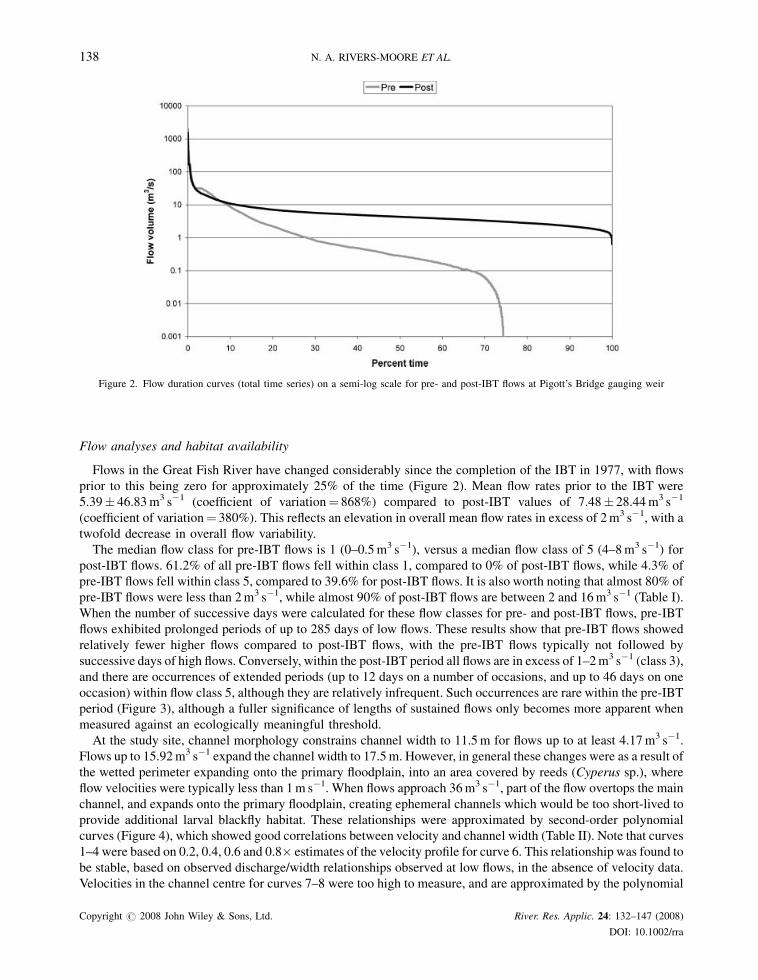
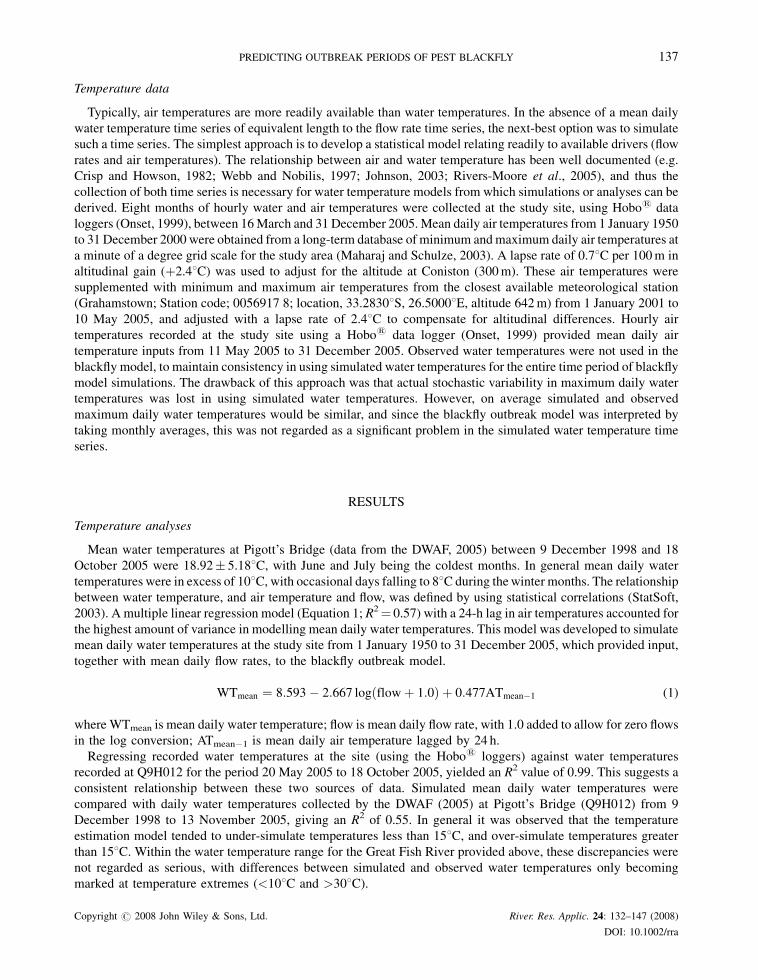
Figure 2. Flow duration curves (total time series) on a semi-log scale for pre- and post-IBT flows at Pigott’s Bridge gauging weir
138 N. A. RIVERS-MOORE ET AL.
Flow analyses and habitat availability
Flows in the Great Fish River have changed considerably since the completion of the IBT in 1977, with flows
prior to this being zero for approximately 25% of the time (Figure 2). Mean flow rates prior to the IBT were
5.39� 46.83m3 s�1 (coefficient of variation¼ 868%) compared to post-IBT values of 7.48� 28.44m3 s�1
(coefficient of variation¼ 380%). This reflects an elevation in overall mean flow rates in excess of 2m3 s�1, with a
twofold decrease in overall flow variability.
The median flow class for pre-IBT flows is 1 (0–0.5m3 s�1), versus a median flow class of 5 (4–8m3 s�1) for
post-IBT flows. 61.2% of all pre-IBT flows fell within class 1, compared to 0% of post-IBT flows, while 4.3% of
pre-IBT flows fell within class 5, compared to 39.6% for post-IBT flows. It is also worth noting that almost 80% of
pre-IBT flows were less than 2m3 s�1, while almost 90% of post-IBT flows are between 2 and 16m3 s�1 (Table I).
When the number of successive days were calculated for these flow classes for pre- and post-IBT flows, pre-IBT
flows exhibited prolonged periods of up to 285 days of low flows. These results show that pre-IBT flows showed
relatively fewer higher flows compared to post-IBT flows, with the pre-IBT flows typically not followed by
successive days of high flows. Conversely, within the post-IBT period all flows are in excess of 1–2m3 s�1 (class 3),
and there are occurrences of extended periods (up to 12 days on a number of occasions, and up to 46 days on one
occasion) within flow class 5, although they are relatively infrequent. Such occurrences are rare within the pre-IBT
period (Figure 3), although a fuller significance of lengths of sustained flows only becomes more apparent when
measured against an ecologically meaningful threshold.
At the study site, channel morphology constrains channel width to 11.5m for flows up to at least 4.17m3 s�1.
Flows up to 15.92m3 s�1 expand the channel width to 17.5m. However, in general these changes were as a result of
the wetted perimeter expanding onto the primary floodplain, into an area covered by reeds (Cyperus sp.), where
flow velocities were typically less than 1m s�1. When flows approach 36m3 s�1, part of the flow overtops the main
channel, and expands onto the primary floodplain, creating ephemeral channels which would be too short-lived to
provide additional larval blackfly habitat. These relationships were approximated by second-order polynomial
curves (Figure 4), which showed good correlations between velocity and channel width (Table II). Note that curves
1–4 were based on 0.2, 0.4, 0.6 and 0.8� estimates of the velocity profile for curve 6. This relationship was found to
be stable, based on observed discharge/width relationships observed at low flows, in the absence of velocity data.
Velocities in the channel centre for curves 7–8 were too high to measure, and are approximated by the polynomial
Copyright # 2008 John Wiley & Sons, Ltd. River. Res. Applic. 24: 132–147 (2008)
DOI: 10.1002/rra
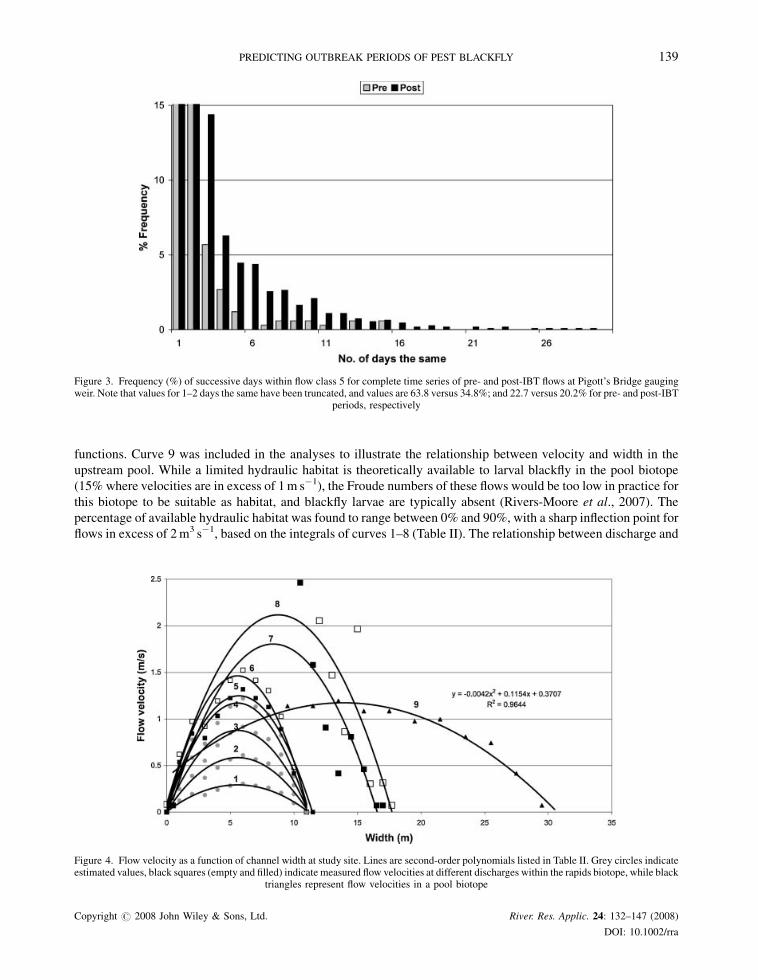
Figure 3. Frequency (%) of successive days within flow class 5 for complete time series of pre- and post-IBT flows at Pigott’s Bridge gaugingweir. Note that values for 1–2 days the same have been truncated, and values are 63.8 versus 34.8%; and 22.7 versus 20.2% for pre- and post-IBT
periods, respectively
PREDICTING OUTBREAK PERIODS OF PEST BLACKFLY 139
functions. Curve 9 was included in the analyses to illustrate the relationship between velocity and width in the
upstream pool. While a limited hydraulic habitat is theoretically available to larval blackfly in the pool biotope
(15% where velocities are in excess of 1m s�1), the Froude numbers of these flows would be too low in practice for
this biotope to be suitable as habitat, and blackfly larvae are typically absent (Rivers-Moore et al., 2007). The
percentage of available hydraulic habitat was found to range between 0% and 90%, with a sharp inflection point for
flows in excess of 2m3 s�1, based on the integrals of curves 1–8 (Table II). The relationship between discharge and
Figure 4. Flow velocity as a function of channel width at study site. Lines are second-order polynomials listed in Table II. Grey circles indicateestimated values, black squares (empty and filled) indicate measured flow velocities at different discharges within the rapids biotope, while black
triangles represent flow velocities in a pool biotope
Copyright # 2008 John Wiley & Sons, Ltd. River. Res. Applic. 24: 132–147 (2008)
DOI: 10.1002/rra
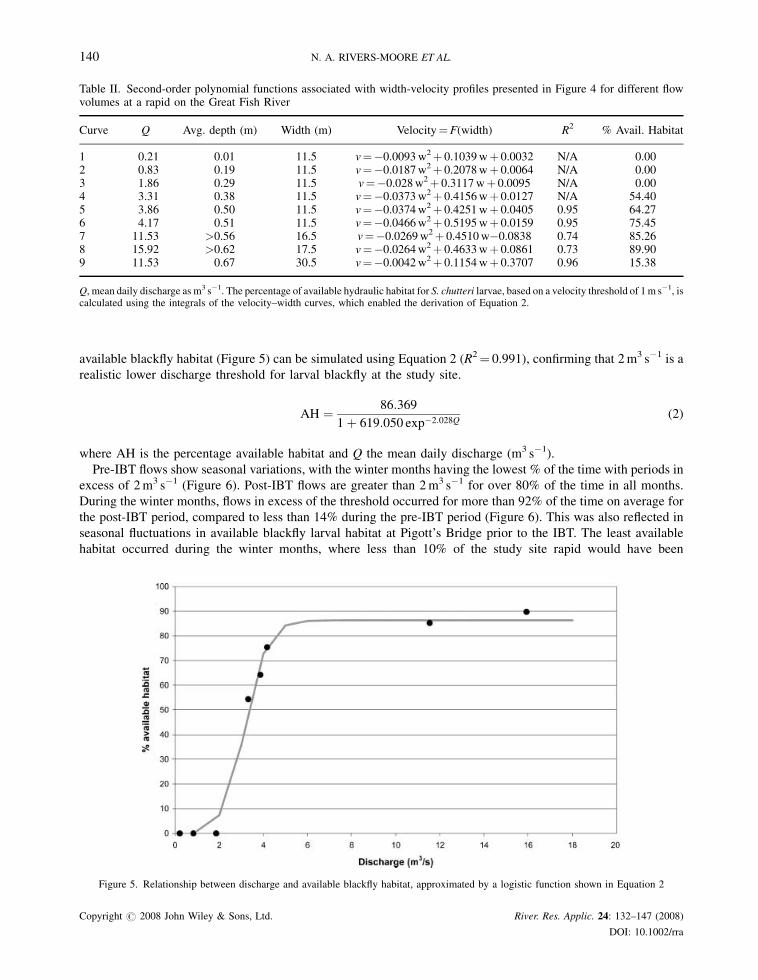
Table II. Second-order polynomial functions associated with width-velocity profiles presented in Figure 4 for different flowvolumes at a rapid on the Great Fish River
Curve Q Avg. depth (m) Width (m) Velocity¼F(width) R2 % Avail. Habitat
1 0.21 0.01 11.5 v¼�0.0093w2þ 0.1039wþ 0.0032 N/A 0.002 0.83 0.19 11.5 v¼�0.0187w2þ 0.2078wþ 0.0064 N/A 0.003 1.86 0.29 11.5 v¼�0.028w2þ 0.3117wþ 0.0095 N/A 0.004 3.31 0.38 11.5 v¼�0.0373w2þ 0.4156wþ 0.0127 N/A 54.405 3.86 0.50 11.5 v¼�0.0374w2þ 0.4251wþ 0.0405 0.95 64.276 4.17 0.51 11.5 v¼�0.0466w2þ 0.5195wþ 0.0159 0.95 75.457 11.53 >0.56 16.5 v¼�0.0269w2þ 0.4510w�0.0838 0.74 85.268 15.92 >0.62 17.5 v¼�0.0264w2þ 0.4633wþ 0.0861 0.73 89.909 11.53 0.67 30.5 v¼�0.0042w2þ 0.1154wþ 0.3707 0.96 15.38
Q, mean daily discharge as m3 s�1. The percentage of available hydraulic habitat for S. chutteri larvae, based on a velocity threshold of 1m s�1, iscalculated using the integrals of the velocity–width curves, which enabled the derivation of Equation 2.
140 N. A. RIVERS-MOORE ET AL.
available blackfly habitat (Figure 5) can be simulated using Equation 2 (R2¼ 0.991), confirming that 2m3 s�1 is a
realistic lower discharge threshold for larval blackfly at the study site.
AH ¼ 86:369
1þ 619:050 exp�2:028Q(2)
where AH is the percentage available habitat and Q the mean daily discharge (m3 s�1).
Pre-IBT flows show seasonal variations, with the winter months having the lowest % of the time with periods in
excess of 2m3 s�1 (Figure 6). Post-IBT flows are greater than 2m3 s�1 for over 80% of the time in all months.
During the winter months, flows in excess of the threshold occurred for more than 92% of the time on average for
the post-IBT period, compared to less than 14% during the pre-IBT period (Figure 6). This was also reflected in
seasonal fluctuations in available blackfly larval habitat at Pigott’s Bridge prior to the IBT. The least available
habitat occurred during the winter months, where less than 10% of the study site rapid would have been
Figure 5. Relationship between discharge and available blackfly habitat, approximated by a logistic function shown in Equation 2
Copyright # 2008 John Wiley & Sons, Ltd. River. Res. Applic. 24: 132–147 (2008)
DOI: 10.1002/rra
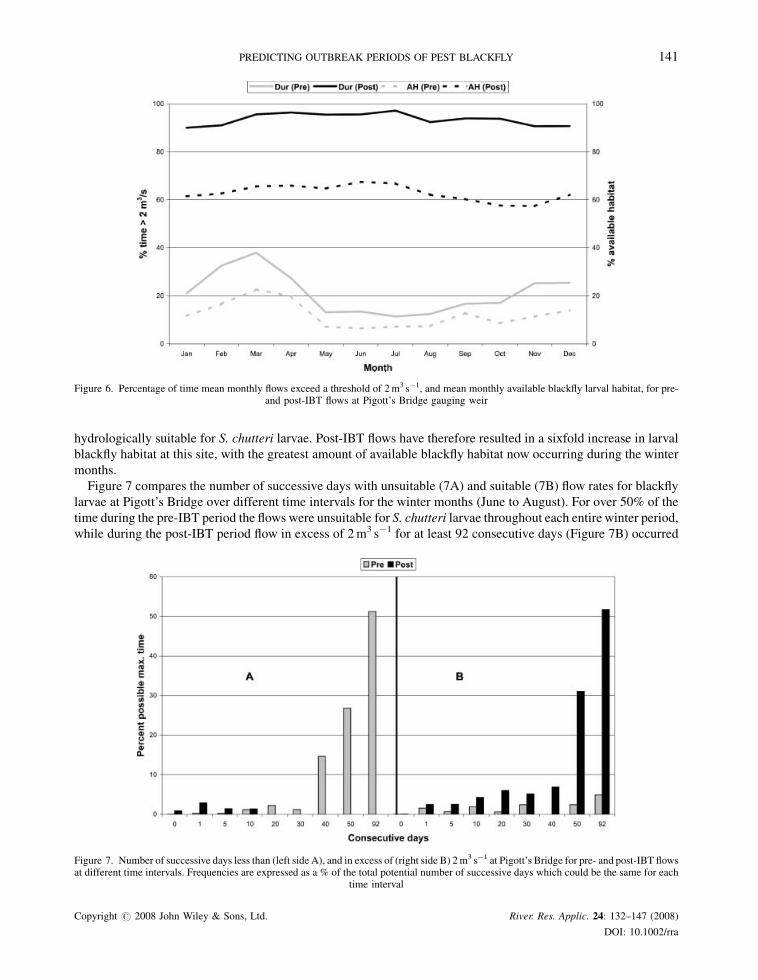
Figure 6. Percentage of time mean monthly flows exceed a threshold of 2m3 s�1, and mean monthly available blackfly larval habitat, for pre-and post-IBT flows at Pigott’s Bridge gauging weir
PREDICTING OUTBREAK PERIODS OF PEST BLACKFLY 141
hydrologically suitable for S. chutteri larvae. Post-IBT flows have therefore resulted in a sixfold increase in larval
blackfly habitat at this site, with the greatest amount of available blackfly habitat now occurring during the winter
months.
Figure 7 compares the number of successive days with unsuitable (7A) and suitable (7B) flow rates for blackfly
larvae at Pigott’s Bridge over different time intervals for the winter months (June to August). For over 50% of the
time during the pre-IBT period the flows were unsuitable for S. chutteri larvae throughout each entire winter period,
while during the post-IBT period flow in excess of 2m3 s�1 for at least 92 consecutive days (Figure 7B) occurred
Figure 7. Number of successive days less than (left side A), and in excess of (right side B) 2m3 s�1 at Pigott’s Bridge for pre- and post-IBT flowsat different time intervals. Frequencies are expressed as a % of the total potential number of successive days which could be the same for each
time interval
Copyright # 2008 John Wiley & Sons, Ltd. River. Res. Applic. 24: 132–147 (2008)
DOI: 10.1002/rra
142 N. A. RIVERS-MOORE ET AL.
very frequently. There are very few occurrences where the number of consecutive days above 2m3 s�1 is 5 days or
less. In general, the frequency of suitable and unsuitable flow conditions has been reversed during the post-IBT
period. The analyses also show that for pre-IBT conditions, low flows typically succeed low flows (i.e. low flows
today will usually be followed by low flows tomorrow), while for post-IBT conditions flows in excess of 2m3 s�1
typically occur in successive periods of more than 1 month.
Model analysis
Within the model (see previous section), the severity of an outbreak is defined by the available habitat, while the
probability of an outbreak is defined by a combination of aquatic stage duration (based on water temperature) and
the duration of consecutive days with suitable habitat conditions (flow in excess of 2m3 s�1). Outbreaks of low
severity were assumed to occur where flow-related available habitat was 0–20%, outbreaks of medium severity
assumed for 21–74% available habitat and high-severity outbreaks assumed when available habitat exceeded 75%.
These are recognized as subjective classes, although they are loosely based on the inflection points of the available
habitat curve (Figure 5).
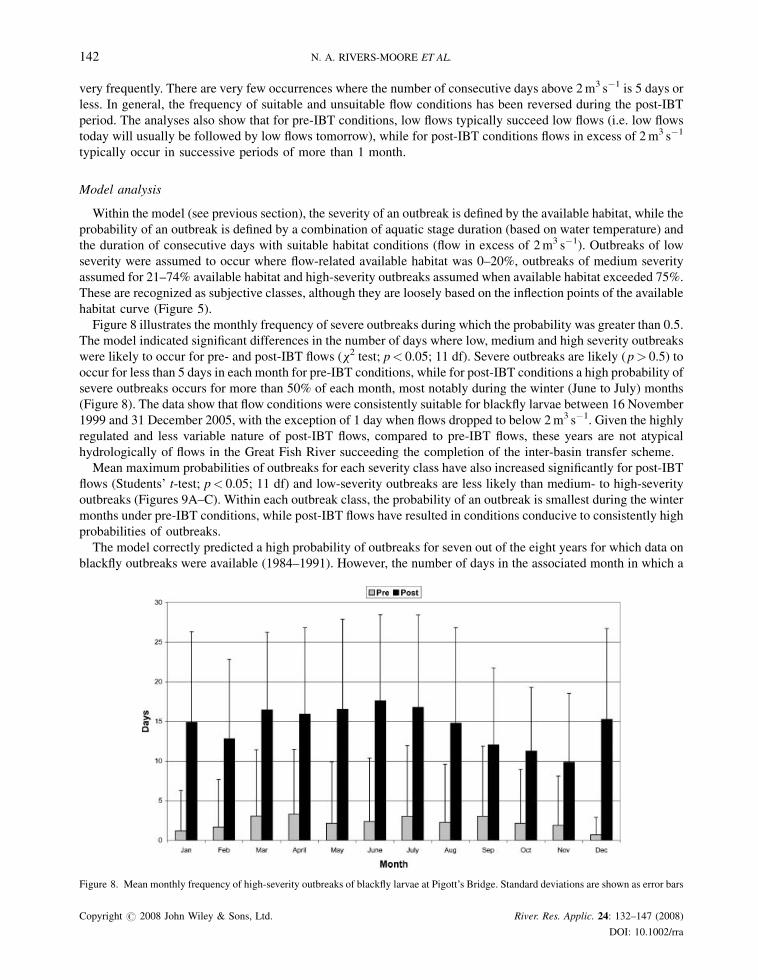
Figure 8 illustrates the monthly frequency of severe outbreaks during which the probability was greater than 0.5.
The model indicated significant differences in the number of days where low, medium and high severity outbreaks
were likely to occur for pre- and post-IBT flows (x2 test; p< 0.05; 11 df). Severe outbreaks are likely (p> 0.5) to
occur for less than 5 days in each month for pre-IBT conditions, while for post-IBT conditions a high probability of
severe outbreaks occurs for more than 50% of each month, most notably during the winter (June to July) months
(Figure 8). The data show that flow conditions were consistently suitable for blackfly larvae between 16 November
1999 and 31 December 2005, with the exception of 1 day when flows dropped to below 2m3 s�1. Given the highly
regulated and less variable nature of post-IBT flows, compared to pre-IBT flows, these years are not atypical
hydrologically of flows in the Great Fish River succeeding the completion of the inter-basin transfer scheme.
Mean maximum probabilities of outbreaks for each severity class have also increased significantly for post-IBT
flows (Students’ t-test; p< 0.05; 11 df) and low-severity outbreaks are less likely than medium- to high-severity
outbreaks (Figures 9A–C). Within each outbreak class, the probability of an outbreak is smallest during the winter
months under pre-IBT conditions, while post-IBT flows have resulted in conditions conducive to consistently high
probabilities of outbreaks.
The model correctly predicted a high probability of outbreaks for seven out of the eight years for which data on
blackfly outbreaks were available (1984–1991). However, the number of days in the associated month in which a
Figure 8. Mean monthly frequency of high-severity outbreaks of blackfly larvae at Pigott’s Bridge. Standard deviations are shown as error bars
Copyright # 2008 John Wiley & Sons, Ltd. River. Res. Applic. 24: 132–147 (2008)
DOI: 10.1002/rra
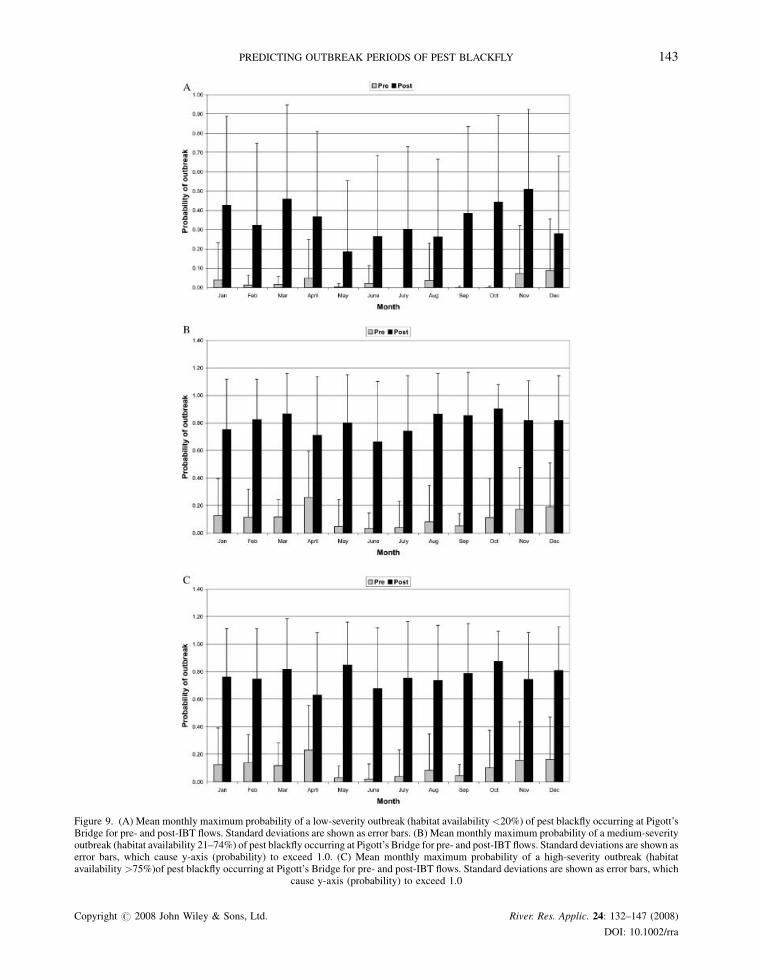
Figure 9. (A) Mean monthly maximum probability of a low-severity outbreak (habitat availability<20%) of pest blackfly occurring at Pigott’sBridge for pre- and post-IBT flows. Standard deviations are shown as error bars. (B) Mean monthly maximum probability of a medium-severityoutbreak (habitat availability 21–74%) of pest blackfly occurring at Pigott’s Bridge for pre- and post-IBT flows. Standard deviations are shown aserror bars, which cause y-axis (probability) to exceed 1.0. (C) Mean monthly maximum probability of a high-severity outbreak (habitatavailability >75%)of pest blackfly occurring at Pigott’s Bridge for pre- and post-IBT flows. Standard deviations are shown as error bars, which
cause y-axis (probability) to exceed 1.0
Copyright # 2008 John Wiley & Sons, Ltd. River. Res. Applic. 24: 132–147 (2008)
DOI: 10.1002/rra
PREDICTING OUTBREAK PERIODS OF PEST BLACKFLY 143
144 N. A. RIVERS-MOORE ET AL.
severe outbreak was predicted to occur was low (<7 days) for five of the eight validation years, where it was
expected that the number of days would have been higher. While applications of a suitable blackfly larvicide
(Vectobac1—commercial formulation of the bacterial larvicide Bacilus thuringiensis var. israelensis de Barjac)
between July and November 2005 coincided with severe outbreak periods predicted by the simulations, there are
other periods when a high probability of severe outbreaks was suggested by the model. Further model verifications
are not possible, due to a lack of data, and would only become possible through an ongoing monitoring programme
documenting the actual occurrence of outbreaks.
DISCUSSION
Flow analyses show that the IBT has resulted in prolonged periods of higher and more stable flows, which are
generally in excess of a critical threshold for S. chutteri larvae of 2m3 s�1, particularly during the winter months.
Water temperature simulations, with supporting observed data, show that, with the exception of occasional days
during June and July when temperatures fall to 8–98C, temperatures continually exceed the maturation threshold of
108C for S. chutteri larvae pupating. Within the study area, water temperatures and food supply were unlikely to be
limiting factors in blackfly lifecycles in the Great Fish River, although seasonal differences in water temperatures
will influence larval size variation and development time, since feeding rate is temperature-dependant (de Moor,
1982a).
Two overlapping generations of S. chutteri larvae develop during winter, which are significantly larger than
larvae that develop during the remainder of the year (de Moor, 1982a). Adult blackfly, which emerge in spring from
the cold-water winter larval populations, are generally larger, with large fat body reserves. Increased size is
associated with increased fecundity in adults, since eggs develop autogenously in the large females (de Moor,
1982a), and such adult females potentially contribute a disproportionately large number of offspring to the next
generation. For example, the largest outbreaks along the Orange River occur in spring each year, stemming from the
highly fecund winter population (Palmer, 1997). de Moor (1982a) points out that the maximum size of the summer
population is strongly influenced by the population size of the first generation of adult flies to emerge after winter.
Figures 7 and 8 suggest that, within the Great Fish River, post-IBT winter flows favour the development of
substantial populations of the large winter-developed individuals. In contrast, during the pre-IBT period,
probabilities of outbreaks were always low.
The most effective control option would be an integrated approach involving flow manipulation at ecologically
significant times (de Moor, 1982b, 1997). Based on a review of the available literature, the greatest emphasis on
blackfly control has been through the use of different larvicides and the effects of abiotic modifiers (water
temperature and turbidity) on the efficacy of these larvicides. Very few examples on the use of flow manipulation to
reduce pest blackfly populations were found in the literature, although they were already identified and proposed as
an effective control option as early as the 1970s (Waters, 1972). Examples of flow manipulation for controlling
larval blackfly were found from the former USSR (Dubitskii, 1981) and South Africa (Howell et al., 1981; deMoor,
1982b, 1997; Car, 1983; de Moor et al., 1986). This is surprising given that changes in water flow have been shown
to greatly influence blackfly larval densities (see for example de Moor, 1994b; Zhang et al., 1998). Flow
manipulation assumes the existence of impoundments upstream to simuliid breeding sites (Car, 1983; de Moor,
1997), as with Elandsdrift Dam. There is consensus that the most effectivewindow time period to control blackfly is
winter, when the majority of the population is in the larval or pupal phase, which if left uncontrolled can lead to
major spring outbreaks (de Moor, 1982b, 1997; Car, 1983; de Moor et al., 1986; Palmer, 1997). Winter shutdowns
of flow to dry out blackfly larvae and pupae by exposing substrate (de Moor, 1982b, 1997; O’Keeffe and de Moor,
1988) target the period of maximum annual population growth, and avoid conflict with irrigation demand
(O’Keeffe and de Moor, 1988). Outputs from the blackfly model (Figure 8) also indicate that favourable conditions
are most prolonged during the winter months under the current flow regime, creating suitable hydraulic habitat at
the study site for high-severity spring outbreaks of blackfly. Suitable pre-winter flow conditions are also conducive
for the build-up of large larval blackfly winter populations which emerge as highly fecund adults.
An annual dry period of up to 3 weeks occurs where releases from Elandsdrift Dam are stopped to allow for
routine maintenance of the canals and sleeve valves below the dam. However, ad hoc releases, which during the
2005 dry period (13 June to 4 July¼ 22 days) were 5 or 8m3 s�1, are carried out in order to keep impoundment
Copyright # 2008 John Wiley & Sons, Ltd. River. Res. Applic. 24: 132–147 (2008)
DOI: 10.1002/rra
PREDICTING OUTBREAK PERIODS OF PEST BLACKFLY 145
levels close to a target of 30% full supply capacity (FSC). Co-ordinated management of releases from
impoundments further upstream from Elandsdrift Dam may thus also be necessary to reduce the chances of excess
flows into Elandsdrift Dam impoundment, increasing FSC levels to more than 30%. During the 2005 dry period,
flows at Pigott’s Bridge varied from 2 to 10m3 s�1, with flows approaching 2m3 s�1 approximately 4 days after at
least 3 successive days of zero releases from Elandsdrift Dam. During this same period, Elandsdrift Dam
impoundment levels varied between 30% and 90% FSC. Simulations of water temperatures at constant flows of 2,
4, 6, 8 and 10m3 s�1 suggest that reducing flows from the current mean July flow rate of 10m3 s�1 to 2m3 s�1 would
result in a potential increase in water temperatures of 1.58C. Thus reducing flows may have some impacts on the
duration of the aquatic stage of S. chutteri. However, it should be possible to ensure that these dry period releases
coincide with the period currently associated with blackfly outbreaks, which was historically the period least
favourable to pest blackfly larvae, that is, July. The length of the dry period should also include a consideration of
the estimated duration of the aquatic stage of blackfly, based on water temperatures. Flow releases should be kept to
a minimum, with the intention of maintaining a target flow of less than 2m3 s�1 for as many days as possible at
Pigott’s Bridge. This model could readily be applied to the remainder of the Great Fish River where blackfly is
known to be a problem (48 blackfly breeding sites over 165 km of river: ca one breeding site every 3.4 km; Palmer,
1997), by determining further width-velocity profiles at additional breeding sites under different flow regimes, and
calibrating the water temperature and available habitat curves for each site. The series of estimated flow thresholds
could be used as inputs into a suitable hydrological model to estimate appropriate upstream dam releases to achieve
these management targets.
A shutdown is recommended during July of 38–40 days (based on the estimated duration of the aquatic stage at
water temperatures of 128C) and a minimum flow threshold of 2m3 s�1. Such an approach would reduce pest
blackfly larval populations to levels which could be further controlled, if necessary, using larvicidal applications.
Larval hydropsychids, as significant predators of S. chutteri larvae, are typically absent in early spring. This is the
time when most of the large larvae have pupated or have already emerged as adults and can be seen as male swarms
around the rapids along the river (deMoor, 1982b, 1992). During this time of the year synchronous breeding of most
of the adults leads to an influx of small hydropsychid larvae which when developing into larger larvae in late spring
to early summer (October to November) then have a significant impact as predators on blackfly larvae again. It is
thus during the late winter to early spring (August to September) that the blackfly larvae develop with minimal
biotic interference (de Moor, 1989), and this then favours exponential population increase at this time of the year.
Assuming that some minimal flows are maintained it is assumed that the proposed flow controls will have minimal
negative effects on hydropsychid populations, since this group was shown to prefer lower flow velocities
(<0.8m s�1) than S. chutteri (Rivers-Moore et al., 2007). If flow reductions could target the period when the
hydropsychid population levels are at their lowest then maximum efficiency in keeping simuliid population levels
in check can be achieved. Further research is needed on the life history of the hydropsychids of the Great Fish River
to optimize integrated control of blackfly populations using both water flow volume regulation and predator control
options. An initial control through flow reductions should achieve better control of pest blackfly in the Pigott’s
Bridge area. Reductions in blackfly larval numbers significantly increase the predator:prey ratio, thereby increasing
the likelihood of additional limited control of larvae by hydropsychids, which are density-independent predators
(de Moor, 1992). Should it be necessary, a follow-up application of a suitable blackfly larvicide (e.g. Vectobac1),
and a second application 28 days later (assuming mean July water temperatures of 128C and an associated lifecycle
duration time, after Palmer, 1997), could be considered. However, it is important to maintain a small population of
simuliids to maintain the ecological functioning of the river, since S. chutteri was present in low numbers prior to
the IBT. Additionally, since S. chutteri are filter-feeders their mode of feeding may be essential in contributing to
the flow of phytoplankton C in aquatic food webs (Parkes et al., 2004).
CONCLUSIONS
Although relatively simple, the flow-temperature model generates information that is useful for predicting the
probability of blackfly outbreaks. Model validation showed that the model correctly predicted the probability, but
not the severity (number of days), of an outbreak. While the data used to validate the model were subjective and
Copyright # 2008 John Wiley & Sons, Ltd. River. Res. Applic. 24: 132–147 (2008)
DOI: 10.1002/rra
146 N. A. RIVERS-MOORE ET AL.
based on a qualitative scale, this suggests that the prediction of the severity of an outbreak may need to be based on
other parameters in addition to available habitat. One such additional refinement to the model (considered
unnecessary at this stage) could have been the calculation of generation times as a function of water temperatures.
For example, a development time of 12 days yields two generations within a 24-day period versus one generation if
water temperatures are lower and result in an aquatic stage of 24 days. The second generation will, however, be
exponentially larger than the first generation, with major implications for outbreak severity. Analyses have shown
that post-IBT flows are typically elevated, with prolonged consecutive periods in excess of a critical threshold of
2m3 s�1 for S. chutteri larvae development at the study site, when compared to pre-IBT flows. This has resulted in a
more than threefold increase in the probable duration of high-severity outbreaks within each month of the year, with
the greatest increase during the winter months. The presence of Elandsdrift Dam upstream of the study site allows
for the option of flow restrictions as part of an integrated control programme to reduce the critical winter larval
blackfly populations. Such a shutdown of water flow involves rescheduling of an existing annual ‘dry period’ for
routine maintenance at Elandsdrift Dam and since it is during the winter months, should not clash with irrigation
demands. If carefully timed it should also not disrupt the larval population of hydropsychid predators. The efficacy
of this approach can only be validated with a series of pre- and post-shutdown surveys of blackfly larval densities.
ACKNOWLEDGEMENTS
We thank the National Research Foundation of South Africa for financial assistance. Zonwabele Zinani, Tarqyn
Human and Sharon Birkholz of the Institute for Water Research are thanked for field assistance. David Forsyth
(Institute for Water Research) is thanked for technical support. Keith Craig of Kwandwe Game Reserve is thanked
for access to field sites. Ben Groenewald and Jackie Oosthuizen of the Department ofWater Affairs and Forestry are
thanked for provision of, assistance with, flow data. Two anonymous reviewers are thanked for their comments and
constructive criticism.
REFERENCES
Bonkewitzz AN, Palmer RW. 1997. BFControl# version 1.0. In Principles of Integrated Control of Blackflies (Diptera: Simuliidae) in South
Africa, Palmer RW. WRC Report No 650/1/97, Water Research Commission, Pretoria.
Car M. 1983. The influence of water-level fluctuation on the drift of Simulium chutteri Lewis 1965 (Diptera: Nematocera) in the Orange River,
South Africa. Onderstepoort Journal of Veterinary Research 50: 173–177.
Carlsson G. 1967. Environmental factors influencing blackfly populations. Bulletin of the World Health Organisation 37(1): 139–150.
Crisp DT, Howson G. 1982. Effect of air temperature upon mean water temperature in streams in the north Pennines and English Lake District.
Freshwater Biology 12: 359–367.
Davis JA, Barmuta LA. 1989. An ecologically useful classification of mean and near-bed flows in streams and rivers. Freshwater Biology 21:
271–282.
de Moor FC. 1982a. Determination of the number of instars and size variation in the larvae and pupae of Simulium chutteri Lewis 1965 (Diptera:
Simuliidae) and some possible bionomical implications. Canadian Journal of Zoology 60: 1374–1382.
de Moor FC. 1982b. A community of Simulium species in the Vaal River near Warrenton Ph.D. Thesis (2 volumes) University of the
Witwatersrand, Johannesburg, p. 317.
de Moor FC. 1986. Invertebrates of the Lower Vaal River, with emphasis on the Simuliidae. In The Ecology of River Systems, Monographiae
Biologicae 60, Davies BR, Walker KF (eds.). W. Jnuk: The Hague; 135–142.
deMoor FC. 1989. Alternative life-history styles in Simuliidae (Insecta, Diptera), 293–316. In Alternative Life-History Styles of Animals, Bruton
MN (ed.). Kluwer Academic Publishers: Dordrecht; 617.
de Moor FC. 1992. Parasites, generalist and specialist predators and their role in limiting the population size of blackflies and in particular
Simulium chutteri Lewis (Diptera: Simuliidae) in the Vaal River, South Africa. Annals of the Cape Provincial Museums (Natural History)
18(13): 271–291.
de Moor FC. 1994a. Aspects of the life history of Simulium chutteri and S. bovis (Diptera; Simuliidae) in relation to changing environmental
conditions in South African Rivers. Verhandlung der Internationalen Vereinigung fur Theoretische und Angewandte Limnologie, 25:
1817–1821.
de Moor FC. 1994b. River flow regulation: cause of and method for the control of pest blackfly outbreaks. The Naturalist 38: 17–24.
de Moor FC. 1997. Regulated rivers: cause of outbreaks and solution for the control of pest blackfly. Lakeline 17(3): 22–23 and 40–43.
de Moor FC, Chutter FM, de Moor IJ. 1986. Drift behaviour and microhabitat selection in the preimaginal stages of Simulium chutteri (Diptera
Simuliidae). Hydrobiologia 133: 143–154.
Copyright # 2008 John Wiley & Sons, Ltd. River. Res. Applic. 24: 132–147 (2008)
DOI: 10.1002/rra
PREDICTING OUTBREAK PERIODS OF PEST BLACKFLY 147
Dubitskii AM. 1981. Blackfly control occasioned by major hydroelectrical projects in the USSR from 1955 to 1965. In Blackflies: The Future for
Biological Methods in Integrated Control, xii, 399 Pages, Laird M (ed.). Academic Press: London; 75–84.
DWAF. 2005. Department of Water Affairs and Forestry, Private Bag X313, Pretoria, 0001, South Africa.
Groenewald B. 2006. Personal Communication. Chief Water Control Officer, Fish-Sundays River GWS, Department of Water Affairs and
Forestry, Private Bag X03, Somerset East, 5850, South Africa.
Howell CG, Begemann GJ, Muir RW, Louw P. 1981. The control of Simulidae (Diptera: Nematocera) in South African rivers by modification of
the water flow volume. Onderstepoort Journal of Veterinary Research 48: 47–49.
Johnson SL. 2003. Stream temperature: scaling of observations and issues for modelling. Hydrological Processes 17: 497–499.
Maharaj M, Schulze RE. 2003. Development of a Database of Gridded Daily Temperature for Southern Africa, ACRUcons report no. 41, WRC
report no. 1156/2/03, Water Research Commission, Pretoria.
Midgley DC, Pitman WV, Middleton BJ. 1994. Surface Water Resources of South Africa 1990. Vol. V -Appendices. WRC Report No. 298/5.1/
94. Water Research Commission, Pretoria.
Mullins W. 2005. Cost-Benefit analysis of controlling pest blackflies along the middle and lower Orange River. In Development of Management
Guidelines for Controlling Pest Blackflies Along the Orange River. WRC Report no. K5/1558, Palmer RW. Water Research Commission,
Pretoria.
O’Keeffe JH, de Moor FC. 1988. Changes in the physico-chemistry and benthic invertebrates of the Great Fish River, South Africa, following an
interbasin transfer of water. Regulated Rivers: Research and Management 2: 39–55.
Onset. 1999. Hobo data loggers. Onset Computer Corporation, 470 MacArthur Blvd., Bourne, MA 02532.
Palmer RW. 1994. A rapid method of estimating the abundance of immature blackflies (Diptera: Simuliidae). Onderstepoort Journal of
Veterinary Research 61: 117–126.
Palmer RW. 1997. Principles of Integrated Control of Blackflies (Diptera: Simuliidae) in South Africa. WRC Report No 650/1/97, Water
Research Commission, Pretoria.
Parkes AH, Kalff J, Boisvert J, Cabana G. 2004. Feeding by black fly (Diptera: Simuliidae) larvae causes downstream losses in phytoplankton,
but not bacteria. Journal of the North American Benthological Society 23: 780–792.
Rivers-Moore NA, Bezuidenhout C, Jewitt GPW. 2005. Modelling of highly variable daily maximum water temperatures in a perennial South
African river system. African Journal of Aquatic Science 30(1): 55–63.
Rivers-Moore NA, de Moor FC, Morris C, O’Keeffe J. 2007. Effect of flow variability modification and hydraulics on invertebrate communities
in the Great Fish River (Eastern Cape province, South Africa), with particular reference to critical hydraulic thresholds limiting larval densities
of Simulium chutteri Lewis (Diptera, Simuliidae). River Research and Applications 23(2): 201–222.
Scientific Instruments. 1980. Scientific Instruments, Inc. 518 West Cherry Street, Milwaukee http:www.scientif.com
Snaddon CD, Davies BR. 1998. A preliminary assessment of the effects of a small South African inter-basin water transfer on discharge and
invertebrate community structure. Regulated Rivers: Research and Management 14: 421–441.
StatSoft, Inc. 2003. STATISTICA (data analysis software system), version 6 www.statsoft.com
Statzner B, Gore JA, Resh VH. 1988. Hydraulic stream ecology: observed patterns and potential applications. Journal of the North American
Benthological Society 7(4): 307–359.
Vogel S. 1981. Life in Moving Fluids: The Physical Biology of Flow. Willard Grant Press: Boston, Mass.
Ward JV, Stanford JA. 1982. Thermal responses in the evolutionary ecology of aquatic insects. Annual Review of Entomology 27: 97–117.
Waters TF. 1972. The drift of stream insects. Annual Review of Entomology 17: 253–272.
Webb BW, Nobilis F. 1997. Long-term perspective on the nature of the air-water temperature relationship: A case study.Hydrological Processes
11: 137–147.
Zhang Y, Malmqvist B, Englund G. 1998. Ecological processes affecting community structure of blackfly larvae in regulated and unregulated
rivers: a regional study. Journal of Applied Ecology 35(5): 673–686.
Copyright # 2008 John Wiley & Sons, Ltd. River. Res. Applic. 24: 132–147 (2008)
DOI: 10.1002/rra
Copyright © 2022 FDOKUMEN