A model of plant isoprene emission based on available reducing power captures responses to...
15
A model of plant isoprene emission based on available reducing power captures responses to atmospheric CO 2 Catherine Morfopoulos 1 , Dominik Sperlich 2,3 , Josep Pe~ nuelas 2,4 , Iolanda Filella 2,4 , Joan Llusi a 2,4 , Belinda E. Medlyn 5 , € Ulo Niinemets 6 , Malcolm Possell 7 , Zhihong Sun 6 and Iain Colin Prentice 5,8 1 Department of Life Sciences, Imperial College, Silwood Park, Ascot, SL5 7PY, UK; 2 CREAF, Cerdanyola del Vall es 08193, Barcelona, Spain; 3 Department of Ecology, University of Barcelona, Diagonal 643, 08028 Barcelona, Spain; 4 CSIC, Global Ecology Unit CREAF-CEAB-UAB, Cerdanyola del Vall es 08193, Barcelona, Spain; 5 Department of Biological Sciences, Macquarie University, North Ryde NSW 2109, Australia; 6 Institute of Agricultural and Environmental Sciences, Estonian University of Life Sciences, Kreutzwaldi 1, Tartu 51014, Estonia; 7 Faculty of Agriculture and Environment, The University of Sydney, Sydney, NSW 2006, Australia; 8 AXA Chair of Biosphere and Climate Impacts, Department of Life Sciences, Grand Challenges in Ecosystems and the Environment and Grantham Institute for Climate Change, Imperial College London, Buckhurst Road, Silwood Park, Ascot, SL5 7PY, UK Author for correspondence: Catherine Morfopoulos Tel: +44 20 7594 2267 Email: [email protected] Received: 15 November 2013 Accepted: 11 February 2014 New Phytologist (2014) 203: 125–139 doi: 10.1111/nph.12770 Key words: black poplar (Populus nigra), hybrid aspen (Populus tremula 9 P. tremuloides), isoprene emission, light response, modelling, photosynthetic electron transport, quantum yield, volatile compounds. Summary We present a unifying model for isoprene emission by photosynthesizing leaves based on the hypothesis that isoprene biosynthesis depends on a balance between the supply of photo- synthetic reducing power and the demands of carbon fixation. We compared the predictions from our model, as well as from two other widely used mod- els, with measurements of isoprene emission from leaves of Populus nigra and hybrid aspen (Populus tremula 9 P. tremuloides) in response to changes in leaf internal CO 2 concentration (C i ) and photosynthetic photon flux density (PPFD) under diverse ambient CO 2 concentra- tions (C a ). Our model reproduces the observed changes in isoprene emissions with C i and PPFD, and also reproduces the tendency for the fraction of fixed carbon allocated to isoprene to increase with increasing PPFD. It also provides a simple mechanism for the previously unexplained decrease in the quantum efficiency of isoprene emission with increasing C a . Experimental and modelled results support our hypothesis. Our model can reproduce the key features of the observations and has the potential to improve process-based modelling of isoprene emissions by land vegetation at the ecosystem and global scales. Introduction Isoprene (2-methyl-1,3-butadiene; C 5 H 8 ) is released into the atmosphere by its main source, terrestrial vegetation. With a total annual emission of c. 0.5 Pg C yr 1 (Guenther et al., 2006, 2012; Arneth et al., 2008), this extremely volatile and reactive molecule is the most important biogenic volatile organic compound (BVOC) produced by plants. Why do certain plants emit isoprene and others do not? What is the advantage for emitters in losing 2% or more of their assimi- lated carbon in the form of isoprene? What are the controls over isoprene production and emission? These questions remain largely unresolved. However, some indications have emerged in recent years thanks to advances in diverse fields from cell physiol- ogy to phylogeny (Li & Sharkey, 2012; Monson et al., 2013; Ni- inemets & Monson, 2013; Sharkey, 2013). Isoprene appears to protect the photosynthetic apparatus from heat and oxidative damage by enhancing membrane stability at high temperatures, and by quenching reactive oxygen species (Sharkey & Yeh, 2001; Vickers et al., 2009; Velikova et al., 2011, 2012; Possell & Lo- reto, 2013). Isoprene is produced in the chloroplast from its immediate precursor dimethylallyl diphosphate (DMADP), which is synthesized via the methylerythritol 4-phosphate (MEP) pathway (Lichtenthaler, 1999; Logan et al., 2000; Sharkey et al., 2008). Isoprene production is therefore controlled by the supply of DMADP, and by the activity of isoprene synthase (IspS) (Rasulov et al., 2009a,b, 2010; Vickers et al., 2010; Li et al., 2011; Monson, 2013). The metabolic controls of the MEP path- way, in relation to isoprene biosynthesis, are just beginning to be understood (Li & Sharkey, 2012; Banerjee et al., 2013; Weise et al., 2013), and the whole pathway controls cannot yet be included in isoprene emission models in a wholly mechanistic manner (Grote et al., 2013; Li & Sharkey, 2013). In addition to its physiological interest, isoprene has sparked attention in climate science because of its impact on atmospheric chemistry and climate. Because of its abundance and reactivity, isoprene emission substantially affects the atmospheric content of tropospheric ozone, methane and secondary organic aerosols (Poisson et al., 2000; Sanderson et al., 2003; Claeys et al., 2004; Heald et al., 2008; Pike & Young, 2009; Nozi ere et al., 2011; Paasonen et al., 2013). To investigate the potential impact of iso- prene on air quality and climate, models for isoprene emission Ó 2014 The Authors New Phytologist Ó 2014 New Phytologist Trust New Phytologist (2014) 203: 125–139 125 www.newphytologist.com Research
Transcript of A model of plant isoprene emission based on available reducing power captures responses to...

A model of plant isoprene emission based on available reducingpower captures responses to atmospheric CO2
Catherine Morfopoulos1, Dominik Sperlich2,3, Josep Pe~nuelas2,4, Iolanda Filella2,4, Joan Llusi�a2,4,
Belinda E. Medlyn5, €Ulo Niinemets6, Malcolm Possell7, Zhihong Sun6 and Iain Colin Prentice5,8
1Department of Life Sciences, Imperial College, Silwood Park, Ascot, SL5 7PY, UK; 2CREAF, Cerdanyola del Vall�es 08193, Barcelona, Spain; 3Department of Ecology, University of Barcelona,
Diagonal 643, 08028 Barcelona, Spain; 4CSIC, Global Ecology Unit CREAF-CEAB-UAB, Cerdanyola del Vall�es 08193, Barcelona, Spain; 5Department of Biological Sciences, Macquarie
University, North Ryde NSW 2109, Australia; 6Institute of Agricultural and Environmental Sciences, Estonian University of Life Sciences, Kreutzwaldi 1, Tartu 51014, Estonia; 7Faculty of
Agriculture and Environment, The University of Sydney, Sydney, NSW 2006, Australia; 8AXA Chair of Biosphere and Climate Impacts, Department of Life Sciences, Grand Challenges in
Ecosystems and the Environment and Grantham Institute for Climate Change, Imperial College London, Buckhurst Road, Silwood Park, Ascot, SL5 7PY, UK
Author for correspondence:Catherine Morfopoulos
Tel: +44 20 7594 2267Email: [email protected]
Received: 15 November 2013
Accepted: 11 February 2014
New Phytologist (2014) 203: 125–139doi: 10.1111/nph.12770
Key words: black poplar (Populus nigra),hybrid aspen (Populustremula9 P. tremuloides), isoprene emission,light response, modelling, photosyntheticelectron transport, quantum yield, volatilecompounds.
Summary
� We present a unifying model for isoprene emission by photosynthesizing leaves based on
the hypothesis that isoprene biosynthesis depends on a balance between the supply of photo-
synthetic reducing power and the demands of carbon fixation.� We compared the predictions from our model, as well as from two other widely used mod-
els, with measurements of isoprene emission from leaves of Populus nigra and hybrid aspen
(Populus tremula9 P. tremuloides) in response to changes in leaf internal CO2 concentration
(Ci) and photosynthetic photon flux density (PPFD) under diverse ambient CO2 concentra-
tions (Ca).� Our model reproduces the observed changes in isoprene emissions with Ci and PPFD, and
also reproduces the tendency for the fraction of fixed carbon allocated to isoprene to increase
with increasing PPFD. It also provides a simple mechanism for the previously unexplained
decrease in the quantum efficiency of isoprene emission with increasing Ca.� Experimental and modelled results support our hypothesis. Our model can reproduce the
key features of the observations and has the potential to improve process-based modelling of
isoprene emissions by land vegetation at the ecosystem and global scales.
Introduction
Isoprene (2-methyl-1,3-butadiene; C5H8) is released into theatmosphere by its main source, terrestrial vegetation. With a totalannual emission of c. 0.5 Pg C yr�1 (Guenther et al., 2006,2012; Arneth et al., 2008), this extremely volatile and reactivemolecule is the most important biogenic volatile organiccompound (BVOC) produced by plants.
Why do certain plants emit isoprene and others do not? Whatis the advantage for emitters in losing 2% or more of their assimi-lated carbon in the form of isoprene? What are the controls overisoprene production and emission? These questions remainlargely unresolved. However, some indications have emerged inrecent years thanks to advances in diverse fields from cell physiol-ogy to phylogeny (Li & Sharkey, 2012; Monson et al., 2013; Ni-inemets & Monson, 2013; Sharkey, 2013). Isoprene appears toprotect the photosynthetic apparatus from heat and oxidativedamage by enhancing membrane stability at high temperatures,and by quenching reactive oxygen species (Sharkey & Yeh, 2001;Vickers et al., 2009; Velikova et al., 2011, 2012; Possell & Lo-reto, 2013). Isoprene is produced in the chloroplast from its
immediate precursor dimethylallyl diphosphate (DMADP),which is synthesized via the methylerythritol 4-phosphate (MEP)pathway (Lichtenthaler, 1999; Logan et al., 2000; Sharkey et al.,2008). Isoprene production is therefore controlled by the supplyof DMADP, and by the activity of isoprene synthase (IspS)(Rasulov et al., 2009a,b, 2010; Vickers et al., 2010; Li et al.,2011; Monson, 2013). The metabolic controls of the MEP path-way, in relation to isoprene biosynthesis, are just beginning to beunderstood (Li & Sharkey, 2012; Banerjee et al., 2013; Weiseet al., 2013), and the whole pathway controls cannot yet beincluded in isoprene emission models in a wholly mechanisticmanner (Grote et al., 2013; Li & Sharkey, 2013).
In addition to its physiological interest, isoprene has sparkedattention in climate science because of its impact on atmosphericchemistry and climate. Because of its abundance and reactivity,isoprene emission substantially affects the atmospheric content oftropospheric ozone, methane and secondary organic aerosols(Poisson et al., 2000; Sanderson et al., 2003; Claeys et al., 2004;Heald et al., 2008; Pike & Young, 2009; Nozi�ere et al., 2011;Paasonen et al., 2013). To investigate the potential impact of iso-prene on air quality and climate, models for isoprene emission
� 2014 The Authors
New Phytologist� 2014 New Phytologist TrustNew Phytologist (2014) 203: 125–139 125
www.newphytologist.com
Research

have been developed (Grote & Niinemets, 2008; Monson et al.,2012; Grote et al., 2013). Many recently published studies haveused the MEGAN model (Guenther et al., 2012), which is basedon the pioneering work of Guenther and co-workers (Guentheret al., 1991, 1993). In MEGAN, a species-specific standard iso-prene emission (Is) is modified by empirical functions thataccount for the observed variations in isoprene emissions as aresult of various environmental controls. Although simple, thisapproach is vulnerable to model overparameterization because ofinteractions among environmental drivers (Niinemets et al.,2010; Sun et al., 2012). Other models have been developed basedon the available knowledge of the underlying biochemical pro-cesses. These include the models of Niinemets et al. (1999) andMartin et al. (2000), and the SIM–BIM model (Zimmer et al.,2000, 2003). Nevertheless, all isoprene emission models remainlargely empirical, and the mechanistic content of current modelsadmits considerable scope for improvement (Monson et al.,2012; Grote et al., 2013).
Although often invoked as a potential driver of isoprene pro-duction (Niinemets et al., 1999; Rasulov et al., 2010; Li & Shar-key, 2012), few studies have quantitatively explored the impactof leaf energetic status on isoprene emissions. We define the leafenergetic status as the balance (or imbalance) between the supplyof photosynthetic induced reducing power and the demands ofcarbon fixation and photorespiration. Here, we investigate thehypothesis that the rate of isoprene biosynthesis depends on theleaf energetic status. We used observations from Populus nigragrown in full sun (this study) and hybrid aspen (Populustremula9 P. tremuloides) grown at two CO2 concentrations (Sunet al., 2012). For each dataset, the experimental protocol allowedus to study short-term variations in isoprene emission, and
associated variations of the electron balance between photosyn-thetic supply and carbon assimilation requirements. Changes inboth isoprene emission and energy balance were obtained bymodifying the light and CO2 conditions of the experiments. Weused these datasets to test a new modelling framework, in whichchanges in leaf energetic status are approximated by the differ-ence between the light- and Rubisco-limited electron fluxes forcarbon assimilation. We used the same data to test the responsesof two of the better known among the published isoprene mod-els: the Guenther et al. (1993) algorithm that underlies MEGAN,and the ‘process-based’ model developed by Niinemets et al.(1999), Niinemets (2004) and modified by Arneth et al. (2007).
Hypothesis
Isoprene is produced in the chloroplast by the MEP pathway, inwhich glyceraldehyde 3-phosphate (G3P) and pyruvate (Pyr) aretransformed into DMADP. The process involves reduction stepsthat require reducing power in the form of NADPH and/or ferre-doxin (Fd) (Charon et al., 1999; Hecht et al., 2001; Seemannet al., 2006; Li & Sharkey, 2012). DMADP is further trans-formed into isoprene by the enzyme IspS. Therefore, isopreneproduction is co-driven by enzymatic activity and NADPH and/or ATP availability (Lichtenthaler, 1999).
Plastid NADPH is provided by the electron transport flux gen-erated by the light reactions of Photosystem II. As reduction stepsin carbon assimilation and photorespiration consume almost allof the NADPH generated, it is common to assume that the totalelectron flux (Jtot, Fig. 1) is the same as the total electron fluxused in carbon assimilation (JCO2+O2). However, in reality, Jtot isalways somewhat larger than JCO2+O2. It has to be so in order to
(a) (b)
Fig. 1 Schematic diagrams of the processes underlying the proposed hypothesis for isoprene emission modelling. The arrow colour scheme is as follows:red, total electron flux generated by light reaction in Photosystem II (Jtot); green, electron flux used in reactions associated with carbon assimilation andphotorespiration (JCO2+O2 ); hashed grey, electron flux used in the MEP pathway (Jiso); grey, electron flux used for other redox reactions. Changes in fluxintensities in situations of (a) high and (b) low demand for carbon assimilation are symbolically represented by changes in arrow width. These schematicdiagrams are illustrative only and the arrows are not fitted to scale. ETC, electron transport chain; MEP, 2-C-methyl-D-erythritol 4-phosphate; NADPH,nicotinamide adenine dinucleotide phosphate.
New Phytologist (2014) 203: 125–139 � 2014 The Authors
New Phytologist� 2014 New Phytologist Trustwww.newphytologist.com
Research
NewPhytologist126

supply NADPH for additional redox reactions in the leaf(Niinemets et al., 1999; Singsaas et al., 2001; Niinemets, 2004).The reduction steps along the MEP pathway constitute some ofthese additional reactions. Thus, Jtot can be expressed asJtot = JCO2+O2
+ Jiso + Jother, where Jiso and Jother represent electronfluxes involved in isoprene production and other redox reactions,respectively, in the leaf. We hypothesize accordingly that theadditional reducing power available for isoprene production isdependent on the extent to which the NADPH requirements ofthe Calvin–Benson and photorespiratory cycles are satisfied(Harrison et al., 2013; Morfopoulos et al., 2013). As illustratedin Fig. 1, the MEP pathway could be envisioned to act like asmall branch circuit, with the greatest influx occurring when thedemand of carbon assimilation for reducing power is least(Rosenstiel et al., 2004; Owen & Pe~nuelas, 2005). However, theMEP pathway alone does not have the capacity to absorb all ofthe excess energy generated. Thus, our hypothesis also suggeststhat isoprene emissions might co-vary with other, more effectiveenergy quenching processes, including the Mehler reaction andthe xanthophyll cycle.
Although the biochemical mechanisms controlling the parti-tioning of the NADPH fluxes inside the plastid are incompletelyunderstood, the nature of the responses of isoprene emission todifferent environmental drivers suggests that this hypothesis iswell founded (Morfopoulos et al., 2013). Indeed, the literatureshows a persistent tendency for plants to increase isoprene emis-sion (and the fraction of assimilated carbon transformed to iso-prene) with increasing leaf energetic status. For example:(1) Isoprene emissions increase with decreasing CO2 concentra-tion (Rosenstiel et al., 2003; Wilkinson et al., 2009; Possell &Hewitt, 2011; Sun et al., 2012).(2) The fraction of assimilated carbon transformed to isopreneincreases with increasing light intensity (Sharkey & Loreto,1993; Harley et al., 1996; Lerdau & Keller, 1997).(3) The temperature optimum for isoprene emissions is lowerthan that of IspS activity, and apparently co-controlled by thetemperature dependences of the electron transport rate and IspSactivity (Monson et al., 1992, 2012; Rasulov et al., 2010).(4) Isoprene emissions decrease in plants fed with nitrate (whichconsumes NADPH in the process of nitrate reduction to ammo-nia), but increase if fed with ammonia directly (Rosenstiel et al.,2004).(5) Isoprene emissions increase when light use efficiencydecreases (Pe~nuelas et al., 2013).
These observations all support the hypothesis that isopreneemissions are influenced by the balance of reducing powerbetween what can be produced by light reactions and what isneeded for carbon assimilation and other major NADPH sinks.
Ideally, to represent this hypothesis quantitatively, we shouldmodel the total electron flux and the dynamics of all relevantelectron sinks. However, in reality, process-based models that cansimulate the total electron transport rate (Jtot) are in an early stageof development (Ye et al., 2013), the partitioning of the addi-tional reducing power between Jother and Jiso remains enigmatic,and the nanomole scale at which isoprene emission occurs (com-pared with the micromole scale of electron flux) makes it
unrealistic to attempt a full mass balance of the competing pro-cesses. Accordingly, our pragmatic approach is to model the ener-getic status of the leaf using the Farquhar model (Farquhar et al.,1980) for photosynthetic carbon assimilation, thus approximat-ing the energetic status of the leaf as the difference between thelight-limited electron flux (J) and the electron flux required tosupport Rubisco-limited photosynthesis (Jv). J is an approxima-tion of the amount of reductant that light reactions can supply,and Jv represents the capacity of Rubisco to absorb this reducingpower. Therefore, energy transfers to processes other than carbonassimilation [Jtot� JCO2+O2
= Jother + Jiso] should be correlatedwith the magnitude of the difference [J� Jv]. Based on thisproxy, we build a model of isoprene emissions that we describefurther in the text. We test the model with data on isoprene emis-sion as a function of internal CO2 concentration (Ci) and photo-synthetic photon flux density (PPFD).
We further test our hypothesis by examining observed andmodelled changes in the fraction of assimilated carbon allocatedto isoprene production. The ratio of isoprene emission to grosscarbon assimilation (Iso/Agross) is a sensitive indicator of the allo-cation of reducing power to the MEP pathway vs the Calvin–Benson cycle (Niinemets et al., 2013). Under a constant leaf tem-perature and CO2 concentration, we would expect the fraction ofassimilated carbon re-emitted as isoprene to be constant, if onlyenzymatic limitations are involved. However, if isoprene produc-tion depends on the energetic status of the leaves, Iso/Agross wouldbe expected to increase with increasing PPFD (Niinemets et al.,2013), as carboxylation becomes progressively Rubisco limited,whilst electron transport continues to increase.
Finally, we examine changes in the quantum efficiency of iso-prene emission (Φiso). Previous studies have reported changeswith environmental conditions (Monson et al., 1992; Loganet al., 2000; Sun et al., 2012). Changes in the quantum efficiencyof CO2 assimilation (ΦCO2) cannot explain changes in Φiso. Theprocesses controlling quantum yields for isoprene are not fullyunderstood. We postulate that differences in the quantum effi-ciency of isoprene emission (Φiso) are driven by the energetic sta-tus of the leaves, and can thus be related to the variation in[J� Jv]. Thus, we expect the quantum yield of isoprene emissionto be lower when the NADPH demand for carbon assimilation ishigher.
We show that our energetic status model is able to reproducechanges in isoprene emission induced by changes in Ci andPPFD, the observed tendency of (Iso/Agross) to increase withincreasing PPFD and the observed increase in Φiso with decreas-ing CO2 concentration.
Materials and Methods
Plant material and growing conditions
In this study, we examine results from experiments conducted ontwo different species: Populus nigra L. and hybrid aspen (Populustremula L.9 P. tremuloidesMichx.).
The first set of experiments was conducted on three saplings ofP. nigra, grown in 15-l pots with a substrate composed of peat
� 2014 The Authors
New Phytologist� 2014 New Phytologist TrustNew Phytologist (2014) 203: 125–139
www.newphytologist.com
NewPhytologist Research 127

and sand (2 : 1) in a nursery (Tres Turons S.C.P., Castellar delVall�es, Catalonia, Spain). Plants were grown in a sunny environ-ment under Mediterranean ambient conditions outdoors for2 months before the measurement (2 May–7 July 2012). Thetypical Mediterranean climate is characterized by seasonal sum-mer drought with warm temperatures and mild winters. This isreflected by the average monthly temperature of 22.8°C inAugust and 7.9°C in January. Mean annual precipitation andtemperature are 723 mm and 15.1°C (1951–2010), respectively(Ninyerola et al., 2000). As a result of high temperature and lowprecipitation, the plants were under conditions of high evapora-tive demand. However, regular irrigation ensured that the sub-strate was held at field capacity throughout this period. Here, weused data from one leaf of each sapling, giving an overall datasetof three sun-adapted individuals.
The second set of experiments was conducted with 2-yr-oldsaplings of hybrid aspen (P. tremula9 P. tremuloides) grownunder two different ambient CO2 concentrations (380 and780 lmol mol�1). These experiments, together with a fulldescription of the materials and methods used, are reported inSun et al. (2012, 2013b), and here only a brief summary ofthe methods is provided. The plants were grown in a custom-made, four-chamber, open gas exchange system. Each individ-ual chamber experienced a 12-h photoperiod at levels of lightbetween 500 and 800 lmol m�2 s�1, day/night air tempera-ture of 28–30/23˚C and air relative humidity of 60%. Twochambers (chambers 1 and 3) were kept at an ambient CO2
concentration of 380 lmol mol�1 (HA-G380), whereas theother two chambers were treated with an elevated CO2 con-centration of 780 lmol mol�1 (HA-G780). Here, we useddata from three leaves in each chamber, giving an overalldataset of six individuals grown at ambient CO2 concentra-tion and six individuals grown at elevated CO2 concentration.For each dataset, the results shown are averaged values acrossindividuals.
Foliage gas exchange analyses and isoprene emission rates
Gas exchange measurements were conducted on individuals ofP. nigra using a Li-Cor LI-6400 portable photosynthesis system(an open gas exchange analyser using a 6-cm2 clamp-on leafcuvette (LI 6400; LI-COR, Inc., Lincoln, NE, USA)). The cali-bration of the infrared gas analyser (IRGA) was performed by themanufacturer < 1 yr before the measurements.
The exhaust tube of the IRGA measure head was con-nected to a Proton-Transfer-Reaction Mass Spectrometer(PTR-MS) system (Ionicon Analytik, Innsbruck, Austria),using tubing material made of Siltek-passivated stainless steel(Restek, Bellefonte, PA, USA). Analyses of emission rates forisoprene were performed simultaneously with gas exchangemeasurements with the PTR-MS. The PTR-MS technique isbased on chemical ionization, specifically non-dissociative pro-ton transfer from H3O
+ ions to most of the commonBVOCs, and has been fully described elsewhere (Lindingeret al., 1998). In our experiment on P. nigra, the PTR-MSdrift tube was operated at 2.1 mbar and 60°C, with an E/N
(electric field/molecule number density) of c. 130 Td (Town-send) (1 Td = 10�17 V cm2). The primary ion signal (H3O
+)was maintained at c. 69 106 counts per second. Theinstrument was calibrated using an aromatic mix standard gas(TO-14A; Restek) and isoprene standard gas with100 nmol mol�1 isoprene in N2 (Abell�o-Linde SA, Barcelona,Spain). Before data acquisition, the leaf cuvette was leftempty in order to analyse the background concentrations ofisoprene, and thereafter to calculate the foliar emission rates.No significant drift in the background of isoprene was foundduring the experiments.
Foliage gas exchange analyses and isoprene emission rates onhybrid aspen were obtained using a Walz GFS-3000 portable gasexchange system and a Fast Isoprene Sensor (FIS; Hills Scientific,Boulder, CO, USA). More information on the methods can befound in Sun et al. (2012, 2013b).
Before each experiment, the leaf was enclosed in the gasexchange system and left under baseline conditions until netassimilation (A), stomatal conductance (gs) and Ci stabilized (typ-ically 20–30 min). For P. nigra, baseline conditions were PPFDof 1000 lmol m�2 s�1, leaf temperature of 30°C, relative humid-ity of 50% (� 10%) and ambient CO2 concentration of the leafchamber (Ca) of 390 lmol mol�1. For hybrid aspen, baselineconditions were PPFD of 500 lmol m�2 s�1, leaf temperature of30°C, relative humidity of 60%, Ca of 380 lmol mol�1 for HA-G380 and Ca of 780 lmol mol�1 for HA-G780. After precondi-tioning the leaf as explained above, two types of response curvewere created: (1) the leaf net assimilation vs internal CO2 con-centration (A/Ci); and (2) the leaf net assimilation vs PPFD (A/PPFD).
CO2 response curves of net assimilation and isopreneemissions
Ci response curves were obtained at a leaf temperature of 30°Cand a quantum flux density of 1000 lmol m�2 s�1 for P. nigraand 500 lmol m�2 s�1 for hybrid aspen. The Ca values used togenerate the A/Ci response curve were:(1) 50? 150? 200? 250? 350?390? 500? 700?800?900? 1200? 2000 (lmol mol�1), for P. nigra;(2) 380? 200? 150? 100? 50? 20? 0?380? 780?1000? 1500? 2000 (lmol mol�1), for HA-G380;(3) 780 ? 380 ? 200 ? 150 ? 100? 50 ? 20 ? 0 ?780? 1000? 1500?2000 (lmol mol�1), for HA-G780.
At every Ca, values of A, isoprene emission rate (Iso) and sto-matal conductance (gs) were recorded when the gas exchange rateswere stable, typically 5–10 min after the change in Ca.
PPFD response curves of net assimilation and isopreneemissions
By applying sequential changes in PPFD, light response curves atdifferent Ca were obtained. Three different Ca values (200, 390and 1000 lmol mol�1) were applied for P. nigra, and two differ-ent Ca values (380 and 780 lmol mol�1) were applied for hybridaspen.
New Phytologist (2014) 203: 125–139 � 2014 The Authors
New Phytologist� 2014 New Phytologist Trustwww.newphytologist.com
Research
NewPhytologist128

The following sequence of PPFD was applied:(1) 2500? 2000? 1750?1500? 1250? 1000?700?500?250?150? 75? 0 (lmol m�2 s�1) for P. nigra;(2) 500 ? 1500 ? 1000? 800 ? 400 ? 200? 120 ? 60? 30?12? 0 (lmol m�2 s�1) for hybrid aspen.
The waiting time between each light intensity was c. 10 min.The data were logged when the rates of A, gs, Ca and Iso were inthe steady state, except for hybrid aspen at PPFD higher than1500 lmol m�2 s�1, where the values were recorded after5–8 min to avoid the development of photoinhibition.
Energetic status model
Our isoprene model is modified in one small (but important)way from that introduced by Harrison et al. (2013) and Morfo-poulos et al. (2013), and deals with the issue of negative valuesfor isoprene emission generated using the first version of themodel (Supporting Information Notes S1; Table S1; Figs S1, S2).In these earlier papers, the isoprene emission rate was assumed tobe linearly related to the energy status of the leaf, whereas, here,the fraction of electrons allocated to isoprene biosynthesis is line-arly related to the energetic status of the leaf:
e ¼ c1 þ c2ðJ � JvÞ Eqn 1
and
Iso ¼ e J fðCiÞ fðT Þ Eqn 2
where Iso is the isoprene emission, f(Ci) is a function of internalCO2 concentration, f(T) is a function of temperature, taking intoaccount the response of enzymatic activity to temperature, J isthe light-limited electron flux, taken to be a non-rectangularhyperbolic function of absorbed PPFD and the maximum elec-tron flux Jmax, following Farquhar et al. (1980), and
Jv ¼ 4VcmaxðCi þ 2C�Þ=ðCi þ K Þ; Eqn 3
which is the electron flux required to support Rubisco-limitedcarbon assimilation. Γ* is the CO2 compensation point in theabsence of mitochondrial respiration in the light, Vcmax is the Ru-bisco carboxylation capacity and K = Kc(1 + [O2]/Ko), where Kc
and Ko are the Michaelis coefficients of Rubisco for CO2 and O2,respectively (Farquhar et al., 1980). The term e in Eqn 2 is notconstant, but varies depending on the energetic status of the leaf,estimated by [J – Jv]. The function f(Ci) in Eqn 2 is chosen totake the value Ci/Γ* when Ci ≤ Γ* and ‘1’ otherwise, and reflectsthe common observation that isoprene emission ceases whenCi < Γ* as a result of a minimum supply of carbon chainsrequired for isoprene synthesis and/or the inhibition of the elec-tron transport rate below Γ* (Dietz et al., 1985; Wolfertz et al.,2003; Rasulov et al., 2009b, 2011; Monson et al., 2012; Sunet al., 2012) This fall-off of isoprene at low Ci is not fully under-stood and is not always observed: the emission of isoprene inCO2-free air has been reported in a few studies (Monson & Fall,1989; Affek & Yakir, 2003; Li & Sharkey, 2012). However,
comparable conditions are not found in natural environments.Using the Ci response curves, changes in the fraction e of thelight-limited electron flux (J) allocated to isoprene production(Eqns 1, 2) were plotted against the corresponding differencebetween light- and Rubisco-limited electron fluxes [J� Jv].Parameters c1 and c2 were obtained from a linear regressionbetween e and [J� Jv] when Ci > Γ* (Figs 2a, 3a,b). Because allour experiments were conducted at a leaf temperature of 30°C,we neglect here the temperature dependence caused by IspS activ-ity, and f(T) is accordingly set equal to unity. Quantum efficien-cies for isoprene production (Φiso) were calculated as the initialslope of isoprene emission vs PPFD, for PPFD < 250 lmolm�2 s�1. The bounds of uncertainty of the energetic status modeldisplayed in the figures represent uncertainties in the estimatedvalues of Vcmax and Jmax in the Farquhar model.
The G93 algorithm
The algorithm developed by Guenther et al. (1993), which is thebasis of the isoprene module of the MEGAN model (Guentheret al., 2012), is the most widely used algorithm for the predictionof isoprene emission by plants. Hereafter, this algorithm isreferred to as G93. In G93, the emission rates of isoprene are cal-culated by multiplying a species-specific standard emission rate(Is) by a set of empirical equations taking into account changes inenvironmental variables. The standard conditions for Is are a leaftemperature of 30°C and an incident PPFD of1000 lmol m�2 s�1. Because, in this study, all the experimentswere conducted at a constant leaf temperature of 30°C, weconsider only changes driven by light intensity:
Iso ¼ IsCL Eqn 4
with
CL ¼ aCL1 PPFD=ffiffið
p1þ a2 PPFD2Þ Eqn 5
where CL1 and a are empirical coefficients. For each lightresponse curve, in order to take into account the CO2 effect onthe standard emission rates, the value of Is was taken as theobserved emission rate at a PPFD of 1000 lmol m�2 s�1, underthe CO2 conditions of the experiment.
The Niinemets model
The Niinemets model (Niinemets et al., 1999) is based on thequantification of the NADPH cost for isoprene synthesis. Itbuilds on the Farquhar model of photosynthesis. The generalconcept is that a temperature-dependent fraction of the electronflux (eN) is used for isoprene production:
eN ¼ Jiso=Jtot Eqn 6
where Jiso is the electron flux required in order to produce aquantity of isoprene and Jtot is the total photosynthetic electronflux, approximated by J, using the Farquhar model:
� 2014 The Authors
New Phytologist� 2014 New Phytologist TrustNew Phytologist (2014) 203: 125–139
www.newphytologist.com
NewPhytologist Research 129

Jtot � J ¼ Ajð4Ci þ 8C�Þ=ðCi � C�Þ Eqn 7
where Aj is the gross assimilation under electron transport-limitedconditions, Ci is the internal CO2 concentration and Γ* is thecompensation point.
The total NADPH cost for isoprene production per mole CO2
assimilated is 1.17 times higher (2.33 NADPH per CO2) than forsugar synthesis (2 NADPH per CO2), and six molecules of CO2
must be assimilated to produce one isoprene molecule. Drawing aparallel with the Farquhar model, Jiso is thus estimated as:
Jiso ¼ 6 Iso 1:17 ð4Ci þ 8C�Þ=ðCi � C�Þ¼ 7:02 Iso ð4Ci þ 8C�Þ=ðCi � C�Þ Eqn 8
Combining Eqns 6–8, the overall model for isoprene emissionbecomes:
Iso ¼ eN J ðCi � C�Þ=ð7:02 ð4Ci þ 8C�ÞÞ ¼ eN=7:02Aj Eqn 9
Because all our experiments were conducted at a leaf tempera-ture of 30°C, we neglect the temperature dependence of eN. Theeffect of changes in CO2 concentration on eN is adapted fromArneth et al. (2007):
eN ¼ eNs Ca s=Ca; Eqn 10
where eNs is the fraction of electrons used for isoprene productionunder the standard conditions of leaf temperature Ts = 30°C,
PPFD = 1000 lmol m�2 s�1 and Ca_s = 390 lmol mol�1. In thisstudy, eNs was estimated from experiment by varying PPFD at aCa of 390 lmol mol�1 for P. nigra and 380 lmol mol�1 forhybrid aspen.
The Farquhar model
The Farquhar et al. (1980) photosynthesis model describesthe limitations on the C3 photosynthetic rate (A) by twomain equations representing the limitations imposed by Ru-bisco-catalysed carboxylation (Vcmax) and RuBP regeneration,which is limited by PPFD and by the maximum electrontransport rate (Jmax). Under Rubisco limited conditions, A isexpressed as:
A ¼ Av � Rd ¼ VcmaxðCi � C�Þ=ðCi þ K Þ � Rd Eqn 11
Av is the gross assimilation under Rubisco-limited conditions,Rd is the mitochondrial respiration in the light and was assumedto be equal to dark respiration divided by 2 (Niinemets et al.,2005; Misson et al., 2010; St Paul et al., 2012). Under electrontransport limitation, A is expressed as:
A ¼ Aj � Rd ¼ ðJ =4ÞðCi � C�Þ=ðCi þ 2C�Þ � Rd Eqn 12
where J is the potential rate of electron transport. J, in turn,depends on PPFD up to a maximum Jmax (de Pury & Farquhar,1997). For each Ca, the averaged value of observed Ci was usedfor the model simulations.
–250 –200 –150 –100 –50 0
0.10
0.15
0.20
0.25
0.30
r2 = 0.938
= 0.309 + 0.001(J Jv)
(a)
J – Jv (µmol m–2 s–1) Ci (µmol mol–1)0 500 1000 1500
010
2030
40Is
opre
ne e
mis
sion
rate
(nm
ol m
–2 s
–1) Energetic status model
data (Populus nigra)
r2 = 0.938
(b)
ε =
Isop
rene
/J
Fig. 2 Isoprene emissions vs internal CO2 concentration (Ci) at a leaf temperature of 30°C and a photosynthetic photon flux density of 1000 lmol m�2 s�1
for Populus nigra. (a) Observed changes in the fraction of electrons used for isoprene production, taken as the ratio of the isoprene emission rate to thelight-limited electron flux for carbon assimilation (e = Iso/J), in response to changes in the energetic status of the leaf, taken as the difference between thelight- and Rubisco-limited electron fluxes for carbon assimilation [J� Jv]. (b) Observed (closed circles) and modelled (solid line) isoprene emission rates inresponse to changes in Ci. The grey shaded area represents uncertainties of the isoprene model as a result of uncertainties in the values of the maximumRubisco carboxylation capacity (Vcmax) and maximum electron flux (Jmax) in the Farquhar model. Error bars represent the maximum and minimum boundsof the isoprene curve.
New Phytologist (2014) 203: 125–139 � 2014 The Authors
New Phytologist� 2014 New Phytologist Trustwww.newphytologist.com
Research
NewPhytologist130

Values of Michaelis–Menten constants, activation and de-acti-vation energies, specificity for Rubisco and their temperature de-pendences were taken from Bernacchi et al. (2002) and Medlynet al. (2005) (Notes S2; Table S2).
For the experiment on P. nigra, probably as a result of thegrowing conditions of the plants (Mediterranean summer sun-shine), the plants adapted their maximum Rubisco capacity(Vcmax) to the prevailing high levels of irradiance and tempera-ture. As a result, under most of the experimental conditions(including a large part of the A/Ci curve), the carbon assimilationwas found to be limited by electron transport and not by Rubiscocapacity. In order to estimate Vcmax, we therefore used the lightresponse curve for assimilation, at a Ca of 200 lmol mol�1 andPPFD ≥ 1500 lmol m�2 s�1, where A was saturating. We calcu-lated Vcmax by minimizing the residual sum of squares (RSS)between the Rubisco-limited equation and the observations. Thecapacity for photosynthetic electron transport (Jmax) wasobtained similarly by minimizing RSS between the light-limitedequation and the assimilation data from all experiments. Forhybrid aspen, Jmax and Vcmax were estimated from A/Ci curves by
minimizing RSS between the Farquhar model and the observa-tions.
Model parameters are summarized in Table 1. Statistical analy-ses were performed using the software R version 2.15.0 (http://www.r-project.org/).
Results
Experiments varying Ci
For each plant type, isoprene emissions showed a strong negativeresponse to changes in Ci (Figs 2b, 3c,d). For P. nigra, the maxi-mum isoprene emissions were c. 33 nmol m�2 s�1 at low Ci (73–174 lmol mol�1), declining to 8 nmol m�2 s�1 at high Ci
(1280 lmol mol�1). Maximum isoprene emission rates (at lowCi) represented up to 2.24% of assimilated carbon (Fig. S3); thispercentage dropped to 0.17% at high Ci. For hybrid aspen, aver-aged isoprene emissions peaked at low Ci (105–140 lmol mol�1)with maxima of c. 21 nmol m�2 s�1 for HA-G380 and25 nmol m�2 s�1 for HA-G780, declining below 4 nmol m�2 s�1
–60 –40 –20 0 20 400.
050.
100.
150.
200.
250.
30
r2 = 0.888 = 0.193 + 0.002 (J Jv)
(a)
= Is
opre
ne/J
0 500 1000 1500
05
1015
2025
3035
Energetic status modelData (HA-G380)
r2 = 0.871
(c)
–60 –40 –20 0 20 40
0.05
0.10
0.15
0.20
0.25
0.30
r2 = 0.937 = 0.219 + 0.003 (J Jv)
(b)
= Is
opre
ne/J
J Jv ( mol m 2 s 1)0 500 1000 1500
010
2030
40
Ci ( mol mol 1)
J Jv ( mol m 2 s 1) Ci ( mol mol 1)
Isop
rene
em
issi
on ra
te (n
mol
m–2
s–1
)Is
opre
ne e
mis
sion
rate
(nm
ol m
–2 s
–1)
Energetic status modelData (HA-G780)
r2 = 0.935
(d)
Fig. 3 Isoprene emissions vs internal CO2
concentration (Ci) at a leaf temperature of30°C and a photosynthetic photon fluxdensity of 1000 lmol m�2 s�1 for hybridaspen (P. tremula9 P. tremuloides).Observed changes in the fraction of electronsused for isoprene production, taken as theratio of the isoprene emission rate to thelight-limited electron flux for carbonassimilation (e = Iso/J), in response tochanges in the energetic status of the leaf,taken as the difference between the light-and Rubisco-limited electron fluxes forcarbon assimilation [J� Jv], for hybrid aspengrown under (a) ambient CO2 concentration(HA-G380; closed circles) and (b) elevatedCO2 concentration (HA-G780; open circles).Observed (circles) and modelled (solid line)isoprene emission rates in response tochanges in Ci for hybrid aspen grown under(c) ambient CO2 concentration (closedcircles) and (d) elevated CO2 concentration(open circles). The grey shaded arearepresents uncertainties of the isoprenemodel as a result of uncertainties in thevalues of the maximum Rubiscocarboxylation capacity (Vcmax) and maximumelectron flux (Jmax) in the Farquhar model.Error bars represent the maximum andminimum bounds of the isoprene curves. Theexperimental details are reported in Sun et al.
(2012, 2013b).
� 2014 The Authors
New Phytologist� 2014 New Phytologist TrustNew Phytologist (2014) 203: 125–139
www.newphytologist.com
NewPhytologist Research 131

at high Ci (1400 lmol mol�1). A decline in isoprene emissionsfor very low values of Ci was observed whatever the growing con-ditions. As highlighted in Sun et al. (2012), isoprene emissionsreached higher rates for individuals grown under elevated CO2
concentrations, contrary to that which is usually assumed. Maxi-mum emission rates represented a loss of assimilated carbon intoisoprene of 5.6% for HA-380 and 6.6% for HA-G780; thispercentage dropped to 0.09% for high values of Ci.
For all experiments, a very strong linear correlation was foundbetween [J� Jv] and the number of electrons e engaged in the iso-prene production pathway, with r2 > 0.89 (Figs 2a, 3a,b). Yet, theresponse of e vs [J� Jv] seems to start to saturate at very negativevalues of [J� Jv] in each dataset. This behaviour might be causedby an overall saturation of the redox state of QA (the primaryacceptor of Photosystem II) associated with a limitation of capac-ity of Jtot that can be observed under high Ci (Dietz et al., 1985).
With parameters obtained from the linear regression of e vs[J� Jv], our model simulated isoprene emissions in response tochanges in Ci with excellent agreement to the observations(r2 = 0.94, 0.87 and 0.93 for P. nigra, HA-G380 and HA-G780,respectively) (Figs 2b, 3c,d).
We also tested the response vs Ci of the Niinemets model cor-rected by the empirical CO2 response function proposed by Ar-neth et al. (2007) (Fig. S4). The Niinemets model reproducedthe data reasonably well, but tended to underestimate the iso-prene emissions for P. nigra, whereas it tended to overestimatethe isoprene emissions for the hybrid aspen experiments. Itshould also be noted that, without the CO2 response functionproposed by Arneth et al. (2007), the Niinemets model wouldshow an increase in isoprene emissions with increasing Ci, imitat-ing the response of Aj.
Experiments varying PPFD
Isoprene emissions For all experiments, isoprene emission ratesincreased with increasing PPFD, with observed maxima for iso-prene emissions inversely related to Ca (and consequently to Ci) –opposite to the net assimilation rates. Observed isoprene emis-sions vs J were found to have a quadratic type of response, in linewith our model (shown for hybrid aspen in Fig. S5).
For P. nigra at each Ca, our model captured the variations inisoprene emissions extremely well with r2 > 0.99 (Fig. 4,Table 2). For Ca of 200 lmol mol�1, however, our model sys-tematically underestimated the observed values. The Niinemetsmodel showed comparable r2 values (Table 2), consistent withthe fact that isoprene emission, in both our model and that of Ni-inemets, is proportional to J. G93 was the only model with acomponent (Is) fitted directly to the observations, yet G93 per-formed less well than the other two models. All models underesti-mated isoprene emission rates at the highest PPFD of2500 lmol m�2 s�1.
For hybrid aspen, all models captured well the variation in iso-prene emissions with PPFD with r2 > 0.88. Yet, our modeltended to systematically underestimate isoprene emissions forHA-G380 (Fig. 5).
Isoprene: assimilation ratios (Iso/Agross) Observed mean Iso/Agross increased with increasing PPFD, regardless of Ca, plant typeor growth conditions. However, the range of Iso/Agross acrossindividuals is considerable. The fraction of assimilated carbonre-emitted as isoprene was inversely related to the CO2 concen-tration. The high ratios of Iso/Agross at low Ca were a result of a
Table 1 Model parameter values at a leaf temperature of 30°C
Data Model Parameter Value Units
Populus nigra Farquhar Jmax 111 (+20 �15) lmolm�2 s�1
Vcmax 169 (+35 �32) lmolm�2 s�1
aCO2 0.27 (+0 �0.03) mol electronmol�1 photonh 0.01 (+0.36 �0) Unitless
Energetic status model c1 0.3099 10�3 Unitlessc2 8.6489 10�7 m2 s lmol�1
Hybrid aspen Farquhar Jmax 88 (+39 �15) lmolm�2 s�1
HA-G380 Vcmax 56 (+6 �17) lmolm�2 s�1
aCO2 0.385* mol electronmol�1 photonh 0.7* Unitless
Energetic status model c1 0.1939 10�3 Unitlessc2 2.879 10�6 m2 s lmol�1
Hybrid aspen Farquhar Jmax 95 (+29 �24) lmolm�2 s�1
HA-G780 Vcmax 59 (+15 �0) lmolm�2 s�1
aCO2 0.385* mol electronmol�1 photonh 0.7* Unitless
Energetic status model c1 0.2199 10�3 Unitlessc2 8.6489 10�7 m2 s lmol�1
All G93 a 0.0027* UnitlessCL1 1.066* Unitless
Farquhar model uncertainties (in parentheses) were obtained by fitting the model to the maximum and minimum bounds of the assimilation curves.*Parameters not fitted to the data; Jmax, maximum electron flux; Vcmax, maximum Rubisco carboxylation capacity; aCO2, quantum yield of electron trans-port; h, curvature parameter of the light response curve; c1 and c2, parameters of our energetic status model; a and CL1, parameters of the G93 algorithm.
New Phytologist (2014) 203: 125–139 � 2014 The Authors
New Phytologist� 2014 New Phytologist Trustwww.newphytologist.com
Research
NewPhytologist132

combination of high isoprene emission rates and low carbonassimilation rates.
Our energetic status model can reproduce an increase in thefraction of carbon allocated to isoprene emission with increasingPPFD (Figs 6, 7). It fails to reproduce absolute values of Iso/Agross; however, it should be noted that the simulated Iso/Agross
includes combined uncertainties of the isoprene model and theFarquhar model.
G93 shows versatility in the simulation of carbon allocated toisoprene emission, with simulated Iso/Agross decreasing withPPFD for P. nigra, but increasing for hybrid aspen.
With the exception of hybrid aspen at Ca = 380 lmol mol�1,the Niinemets model failed to capture the changes in Iso/Agross
with changing PPFD, showing no relationship between Iso/Agross
and PPFD.
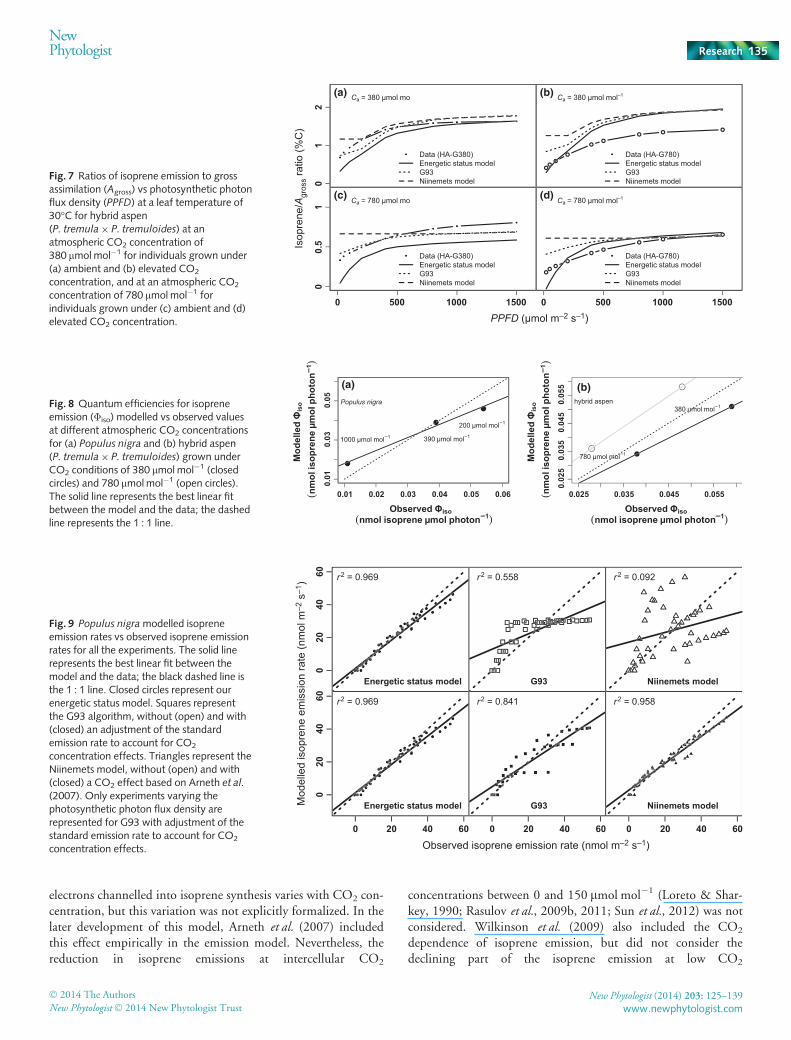
Isoprene quantum efficiencies As predicted by our hypothesis,the observed quantum efficiencies for isoprene production weredependent on the CO2 concentration (Fig. 8). Higher quantumefficiencies correspond to lower Ca, at which the demand forreductant by the Calvin–Benson cycle is lower. Our model cap-tured the observed decrease in Φiso with increasing Ca. However,the model overestimated Φiso at high Ca and underestimated Φiso
at low Ca for P. nigra. The model overestimated Φiso forHA-G380 and underestimated Φiso for HA-G780.
Global results
The overall performance of each model is illustrated in Figs 9and 10. Our energetic status model gave excellent results overall(r2 = 0.97 for P. nigra, r2 = 0.94 for hybrid aspen). No majorpattern was detected in the residuals, although the model has thetendency to underestimate the observations (Figs S6, S7). More-over, this model reproduced the following key features of theobservations:(1) A decrease in isoprene emissions with increasing Ci.(2) An increase in isoprene emissions with increasing PPFD,with maxima inversely proportional to the CO2 concentration.(3) An increase in the proportion of assimilated carbon divertedto isoprene production (Iso/Agross) with increasing PPFD.(4) A decrease in the quantum efficiency of isoprene productionwith increasing CO2 concentration.
With Is adjusted for each experiment, G93 reproduces verywell the observed variations in isoprene emission with PPFD,especially for hybrid aspen (Ci experiments are not included forG93). For P. nigra, the bell-shaped pattern observed in the resid-uals vs fitted values plot (Fig. S6) suggests that the standard lightresponse of G93 is not adapted to fit the observations.
With no empirical adjustment included to account for theCO2 effect, the Niinemets model (r2 = 0.09–0.14) failed toreproduce the observed variations in isoprene emission withPPFD and Ci. Including a CO2 effect in this model, however,caused major improvements (r2 = 0.97–0.89).
Ca = 200 mol mol
(a) DataEnergetic status modelG93Niinemets model
020
4060
Ca = 390 mol mol
(b) DataEnergetic status modelG93Niinemets model
020
4060
(c)
Ca = 1000 mol mol
DataEnergetic status modelG93Niinemets modelIs
opre
ne e
mis
sion
rate
(nm
ol m
–2 s
–1)
020
4060
0 500 1000 1500 2000 2500PPFD (µmol m–2 s–1)
–1
–1
–1
Fig. 4 Isoprene emission rates of Populus nigra vs photosynthetic photonflux density (PPFD) at a leaf temperature of 30°C and three atmosphericCO2 concentrations (Ca): (a) 200 lmol mol�1, (b) 390 lmol mol�1, (c)1000 lmol mol�1. The grey shaded area represents uncertainties of theisoprene model as a result of uncertainties in the values of the maximumRubisco carboxylation capacity (Vcmax) and maximum electron flux (Jmax)in the Farquhar model. Error bars represent the maximum and minimumbounds of the isoprene curves.
Table 2 Isoprene emissions vs changes in photosynthetic photon flux density (PPFD) at different CO2 concentrations (Ca)
Data Ca (lmol mol�1)
Energetic status model G93 Niinemets model
r2 P r2 P r2 P
Populus nigra 200 c. 1 < 1e�5 0.88 < 1e�5 0.99 < 1e�5390 c. 1 < 1e�5 0.86 < 1e�4 0.98 < 1e�5
1000 0.92 < 1e�4 0.56 0.311 0.81 < 1e�3Hybrid aspen 380 c. 1 < 1e�5 c. 1 < 1e�5 0.99 < 1e�5HA-G380 780 0.99 < 1e�5 0.98 < 1e�5 0.94 < 1e�5Hybrid aspen 380 0.98 < 1e�5 0.97 < 1e�5 0.93 < 1e�5HA-G780 780 0.96 < 1e�5 0.93 < 1e�5 0.88 < 1e�4
� 2014 The Authors
New Phytologist� 2014 New Phytologist TrustNew Phytologist (2014) 203: 125–139
www.newphytologist.com
NewPhytologist Research 133

Discussion
We used the Ci and PPFD response curves of assimilation andisoprene emissions for P. nigra (this study) and P. tremula9P. tremuloides (hybrid aspen) (Sun et al., 2012), where changes inbalance between electron supply and electron demand for carbonassimilation purposes were driven by different environmentalvariables. We tested against these data a new model in which iso-prene production is a function of the energetic status of theleaves, alongside two widely used isoprene models: the G93 algo-rithm (Guenther et al., 1993) and the Niinemets model (Niine-mets et al., 1999; Arneth et al., 2007). The new model showedexcellent results and a visible improvement relative to the originalNiinemets model (Figs 9, 10).
Our model finds its origin in the Niinemets model based onthe ‘energetic requirements for isoprene synthesis and leaf photo-synthetic properties’. It keeps the major advantage of its simplic-ity and thus the evident potential for its use in large-scalemodelling, where excessive complexity is to be avoided wherever
possible. Yet, the new model diverges from its prototype in twofundamental ways. First, it links isoprene emission directly to theelectron flux (J) rather than to light-limited assimilation. Second,it links isoprene emission to reductant availability, and thus tran-scribes the original idea of Niinemets et al. (1999) of a ‘competi-tion for electrons between isoprene synthesis and Calvin andphotorespiratory cycles’. The component of electron flux gener-ated by Photosystem II and not used for carbon assimilation andphotorespiration is extremely hard to investigate experimentally(Singsaas et al., 2001). Nevertheless, our hypothesis is supportedby the following: the high positive correlations found betweenthe observations and simulations made with our energetic statusmodel; the fact that measured Iso/Agross increases with increasingPPFD; the fact that observed Φiso is inversely proportional to Ca;strong linearity between the flux of electrons engaged in isopreneproduction and [J� Jv]; and a quadratic type of response ofisoprene emission to J.
In fact, the first derivation of the model of Niinemets et al.(1999) and Niinemets (2004) predicted that the fraction of
0
500
1000
1500
2000
2500
0.5
1.0
1.5
2.0
2.5
3.0 (a)
DataEnergetic status modelG93Niinemets model
Ca = 200 mol mol 1
0
500
1000
1500
2000
2500
DataEnergetic status modelG93Niinemets model
(b)
Ca = 390 mol mol 1
0
500
1000
1500
2000
2500
DataEnergetic status modelG93Niinemets model
Ca = 1000 mol mol 1
(c)
Isop
rene
/Agr
oss r
atio
(%C
)
PPFD (µmol m–2 s–1)
Fig. 6 Ratios of isoprene emission to grossassimilation (Agross) vs photosynthetic photonflux density (PPFD) at a leaf temperature of30°C for Populus nigra at atmospheric CO2
concentrations of (a) 200 lmol mol�1, (b)390 lmol mol�1 and (c) 1000 lmol mol�1.
Ca = 380 mol mol–1
Data (HA-G380)Energetic status modelG93Niinemets model
010
2030
4050 (a)
Ca = 780 mol mol–1
Data (HA-380)Energetic status modelG93Niinemets model
(c)
010
2030
4050
0 500 1000 1500
Ca = 380 mol mol–1
Data (HA-G780)Energetic status modelG93Niinemets model
010
2030
4050 (b)
Ca = 780 mol mol–1
Data (HA-G780)Energetic status modelG93Niinemets model
(d)
010
2030
4050
0 500 1000 1500
Isop
rene
em
issi
on ra
te (n
mol
m–2
s–1
)
PPFD (µmol m–2 s–1)
Fig. 5 Isoprene emission rates for hybridaspen (P. tremula9 P. tremuloides) vsphotosynthetic photon flux density (PPFD) ata leaf temperature of 30°C at twoatmospheric CO2 concentrations (Ca):Ca = 380 lmol mol�1 for individuals grownunder (a) ambient (HA-G380) and (b)elevated (HA-G780) CO2 concentrations;Ca = 780 lmol mol�1 for individuals grownunder (c) ambient (HA-G380) and (d)elevated (HA-G780) CO2 concentrations.The grey shaded area representsuncertainties of the isoprene model as aresult of uncertainties in the values of themaximum Rubisco carboxylation capacity(Vcmax) and maximum electron flux (Jmax) inthe Farquhar model. Error bars represent themaximum and minimum bounds of theisoprene curves.
New Phytologist (2014) 203: 125–139 � 2014 The Authors
New Phytologist� 2014 New Phytologist Trustwww.newphytologist.com
Research
NewPhytologist134
electrons channelled into isoprene synthesis varies with CO2 con-centration, but this variation was not explicitly formalized. In thelater development of this model, Arneth et al. (2007) includedthis effect empirically in the emission model. Nevertheless, thereduction in isoprene emissions at intercellular CO2
concentrations between 0 and 150 lmol mol�1 (Loreto & Shar-key, 1990; Rasulov et al., 2009b, 2011; Sun et al., 2012) was notconsidered. Wilkinson et al. (2009) also included the CO2
dependence of isoprene emission, but did not consider thedeclining part of the isoprene emission at low CO2
Ca = 380 mol mo
Data (HA-G380)Energetic status modelG93Niinemets model
(a)
01
2
Ca = 780 mol mo
Data (HA-G380)Energetic status modelG93Niinemets model
(c)
0 500 1000 15000
10.
5
Ca = 380 mol mol–1
Data (HA-G780)Energetic status modelG93Niinemets model
(b)
Ca = 780 mol mol–1
0 500 1000 1500
Data (HA-G780)Energetic status modelG93Niinemets model
(d)
Isop
rene
/Agr
oss r
atio
(%C
)
PPFD (µmol m–2 s–1)
Fig. 7 Ratios of isoprene emission to grossassimilation (Agross) vs photosynthetic photonflux density (PPFD) at a leaf temperature of30°C for hybrid aspen(P. tremula9 P. tremuloides) at anatmospheric CO2 concentration of380 lmol mol�1 for individuals grown under(a) ambient and (b) elevated CO2
concentration, and at an atmospheric CO2
concentration of 780 lmol mol�1 forindividuals grown under (c) ambient and (d)elevated CO2 concentration.
0.01 0.02 0.03 0.04 0.05 0.06
0.01
0.03
0.05
200 mol mol 1
390 mol mol 11000 mol mol 1
Populus nigra
(a)
Observed iso(nmol isoprene mol photon 1)
Mod
elle
dis
o
( nm
olis
opre
nem
olph
o to n
1 )
Mod
elle
dis
o
( nm
olis
opre
nem
o lph
oto n
1 )
0.025 0.035 0.045 0.055
0.02
50.
035
0.04
50.
055
Observed iso(nmol isoprene mol photon 1)
380 mol mol 1
780 mol mol 1
hybrid aspen
(b)
Fig. 8 Quantum efficiencies for isopreneemission (Φiso) modelled vs observed valuesat different atmospheric CO2 concentrationsfor (a) Populus nigra and (b) hybrid aspen(P. tremula9 P. tremuloides) grown underCO2 conditions of 380 lmol mol�1 (closedcircles) and 780 lmolmol�1 (open circles).The solid line represents the best linear fitbetween the model and the data; the dashedline represents the 1 : 1 line.
Energetic status model
r2 = 0.969 r2 = 0.558 r2 = 0.092
r2 = 0.969 r2 = 0.841 r2 = 0.958
020
4060
G93 Niinemets model
Energetic status model
020
4060
0 20 40 60
G93
0 20 40 60
Niinemets model
0 20 40 60
Observed isoprene emission rate (nmol m–2 s–1)
Mod
elle
d is
opre
ne e
mis
sion
rate
(nm
ol m
–2 s
–1)
Fig. 9 Populus nigramodelled isopreneemission rates vs observed isoprene emissionrates for all the experiments. The solid linerepresents the best linear fit between themodel and the data; the black dashed line isthe 1 : 1 line. Closed circles represent ourenergetic status model. Squares representthe G93 algorithm, without (open) and with(closed) an adjustment of the standardemission rate to account for CO2
concentration effects. Triangles represent theNiinemets model, without (open) and with(closed) a CO2 effect based on Arneth et al.
(2007). Only experiments varying thephotosynthetic photon flux density arerepresented for G93 with adjustment of thestandard emission rate to account for CO2
concentration effects.
� 2014 The Authors
New Phytologist� 2014 New Phytologist TrustNew Phytologist (2014) 203: 125–139
www.newphytologist.com
NewPhytologist Research 135

concentrations. It has been shown that this reduction is associatedwith reduced availability of DMADP and is suggested to indicatelimited NADPH or ATP availability (Rasulov et al., 2009b,2011). Here, the model based on NADPH limitation describedwell the entire CO2 response curve (Figs 2, 3), in line with theexperimental observations of the variation of DMADP pool sizewith [CO2].
A limitation of the present study is that experiments were con-ducted under constant temperature. This has the advantage of de-coupling effects related to NADPH production from effects ofenzyme kinetics. However, isoprene emissions also respondstrongly to temperature, both instantaneously and over longerperiods (Guenther et al., 1991; Pacifico et al., 2009; Laffineuret al., 2011; Sun et al., 2013a). Therefore, an improved under-standing of the controls on isoprene emission for global orregional modelling purposes also requires that the hypothesis pre-sented here be tested and analysed under variations of tempera-ture, as well as PPFD and Ci.
Following the logic of the G93 algorithm, many studies(including ours) have examined isoprene emission under the stan-dard conditions of a leaf temperature of 30°C and a PPFD of1000 lmol m�2 s�1. This might be a limitation, as interactionsbetween different drivers are then neglected. As an example ofthe importance of this limitation, the recent study of Sun et al.(2013a) showed cancellation of the isoprene response to rapidchanges in Ci at higher temperature. Thus, there is a need formore complete experimental studies focusing on the interactionsbetween the effects of simultaneous changes in temperature,PPFD and Ci.
In future model development, it will also be important to con-sider the adaptation of model parameters to long-term variationsin temperature and CO2, and effects of changes caused by leafontogeny – all of which could modify the expression of the IspSgene (Monson, 2013; Rajabi Memari et al., 2013; Rosenkranz &Schnitzler, 2013) and the pool size of DMADP (Sun et al., 2012;Rasulov et al., 2013). The consideration of such changes isneeded to allow the inclusion of acclimation in isoprene emission
on time scales from days to months, and thus eventually to allowthe responses of isoprene emissions to global change to bemodelled in a more explicitly process-based manner than hasbeen possible so far.
Acknowledgements
The research leading to these results has received funding from theEuropean Community’s Seventh Framework Programme (FP72007-2013) under grant agreement no. 238366, and from theEstonian Ministry of Science and Education (institutional grantIUT-8-3) and Estonian Science Foundation (Grant 9253).
References
Affek HP, Yakir D. 2003. Natural abundance carbon isotope composition of
isoprene reflects incomplete coupling between isoprene synthesis and
photosynthetic carbon flow. Plant Physiology 131: 1727–1736.Arneth A, Monson RK, Schurgers G, Niinemets €U, Palmer PI. 2008.
Why are estimates of global terrestrial isoprene emissions so similar (and
why is this not so for monoterpenes)? Atmospheric Chemistry and Physics8: 4605–4620.
Arneth A, Niinemets €U, Pressley S, B€ack J, Hari P, Karl T, Noe S, Prentice I,
Serc�a D, Hickler T et al. 2007. Process-based estimates of terrestrial ecosystem
isoprene emissions: incorporating the effects of a direct CO2–isopreneinteraction. Atmospheric Chemistry and Physics 7: 31–53.
Banerjee A, Wu Y, Banerjee R, Li Y, Yan H, Sharkey TD. 2013. Feedback
inhibition of deoxy-D-xylulose-5-phosphate synthase regulates the
methylerythritol 4-phosphate pathway. The Journal of Biological Chemistry 288:16926–16936.
Bernacchi CJ, Portis AR, Nakano H, von Caemmerer S, Long SP. 2002.
Temperature response of mesophyll conductance. Implications for the
determination of Rubisco enzyme kinetics and for limitations to photosynthesis
in vivo. Plant Physiology 130: 1992–1998.Charon L, Pale-Grosdemange C, Rohmer M. 1999.On the reduction steps in
the mevalonate independent 2-C-methyI-D-erythritol 4-phosphate (MEP)
pathway for isoprenoid biosynthesis in the bacterium Zymomonas mobilis.Tetrahedron Letters 40: 7231–7234.
Claeys M, Graham B, Vas G, Wang W, Vermeylen R, Pashynska V, Cafmeyer J,
Guyon P, Andreae MO, Artaxo P et al. 2004. Formation of secondary organic
aerosols through photooxidation of isoprene. Science 303: 1173–1176.
Energetic status model
020
40
G93 Niinemets model
Energetic status model
020
40
0 20 40
G93
0 20 40
Niinemets model
0 20 40Observed isoprene emission rate (nmol m–2 s–1)
Mod
elle
d is
opre
ne e
mis
sion
rate
(nm
ol m
–2 s
–1)
r2 = 0.944
r2 = 0.944
r2 = 0.551
r2 = 0.968
r2 = 0.139
r2 = 0.887
Fig. 10 Hybrid aspen(P. tremula9 P. tremuloides) modelledisoprene emission rates vs observed isopreneemission rates for all the experiments. Thesolid line represents the best linear fitbetween the model and the data; the blackdashed line is the 1 : 1 line. Closed circlesrepresent our energetic status model.Squares represent the G93 algorithm,without (open) and with (closed) anadjustment of the standard emission rate toaccount for CO2 concentration effects.Triangles represent the Niinemets model,without (open) and with (closed) a CO2
effect based on Arneth et al. (2007). Onlyexperiments varying the photosyntheticphoton flux density are represented for G93with adjustment of the standard emissionrate to account for CO2 concentrationeffects.
New Phytologist (2014) 203: 125–139 � 2014 The Authors
New Phytologist� 2014 New Phytologist Trustwww.newphytologist.com
Research
NewPhytologist136

Dietz K-J, Schreiber U, Heber U. 1985. The relationship between the redox state
of QA and photosynthesis in leaves at various carbon-dioxide, oxygen and light
regimes. Planta 166: 219–226.Farquhar GD, von Caemmerer S, Berry JA. 1980. A biochemical model of
photosynthetic CO2 assimilation in leaves of C3 species. Planta 149: 78–90.Grote R, Monson RK, Niinemets €U. 2013. Leaf-level models of constitutive and
stress-driven volatile organic compound emissions. In: Niinemets €U, Monson
RK, eds. Biology, controls and models of tree volatile organic compound emissions.Berlin, Germany: Springer, 315–355.
Grote R, Niinemets €U. 2008.Modeling volatile isoprenoid emission – a storywith split ends. Plant Biology 10: 8–28.
Guenther AB, Jiang X, Heald CL, Sakulyanontvittaya T, Duhl T, Emmons LK,
Wang X. 2012. The Model of Emissions of Gases and Aerosols from Nature
version 2.1 (MEGAN2.1): an extended and updated framework for modeling
biogenic emissions. Geoscientific Model Development 5: 1471–1492.Guenther AB, Karl T, Harley P, Wiedinmyer C, Palmer PI, Geron C. 2006.
Estimates of global terrestrial isoprene emissions using MEGAN (Model of
Emissions of Gases and Aerosols from Nature). Atmospheric Chemistry andPhysics 6: 3181–3210.
Guenther AB, Monson RK, Fall R. 1991. Isoprene and monoterpene emission
rate variability: observations with eucalyptus and emission rate algorithm
development. Journal of Geophysical Research 96: 10799–10808.Guenther AB, Zimmerman PR, Harley PC, Monson RK, Fall R. 1993. Isoprene
and monoterpene emission rate variability: model evaluations and sensitivity
analyses. Journal of Geophysical Research 98: 12609–12617.Harley P, Guenther AB, Zimmerman P. 1996. Effects of light, temperature and
canopy position on net photosynthesis and isoprene emission from sweetgum
(Liquidambar styraciflua) leaves. Tree Physiology 16: 25–32.Harrison SP, Morfopoulos C, Dani KGS, Prentice IC, Arneth A, Atwell
BJ, Barkley MP, Leishman MR, Loreto F, Medlyn BE et al. 2013.Volatile isoprenoid emissions from plastid to planet. New Phytologist 197:49–57.
Heald CL, Henze DK, Horowitz LW, Feddema J, Lamarque J-F, Guenther
AB, Hess PG, Vitt F, Seinfeld JH, Goldstein AH et al. 2008. Predictedchange in global secondary organic aerosol concentrations in response to
future climate, emissions, and land use change. Journal of GeophysicalResearch 113: D05211.
Hecht S, Eisenreich W, Adam P, Amslinger S, Kis K, Bacher A, Arigoni D,
Rohdich F. 2001. Studies on the nonmevalonate pathway to terpenes: the role
of the GcpE (IspG) protein. Proceedings of the National Academy of Sciences,USA 98: 14837–14842.
Laffineur Q, Aubinet M, Schoon N, Amelynck C, M€uller J, Dewulf J, Van
Langenhove H, Steppe K, Simpraga M, Heinesch B. 2011. Isoprene and
monoterpene emissions from a mixed temperate forest. AtmosphericEnvironment 45: 3157–3168.
Lerdau M, Keller M. 1997. Controls on isoprene emission from trees in a
subtropical dry forest. Plant, Cell & Environment 20: 569–578.Li Z, Ratliff EA, Sharkey TD. 2011. Effect of temperature on
postillumination isoprene emission in oak and poplar. Plant Physiology155: 1037–1046.
Li Z, Sharkey TD. 2012.Metabolic profiling of the methylerythritol phosphate
pathway reveals the source of post-illumination isoprene burst from leaves.
Plant, Cell & Environment 36: 1–9.Li Z, Sharkey TD. 2013.Molecular and pathway controls on biogenic volatile
organic compound emissions. In: Niinemets €U, Monson RK, eds. Biology,controls and models of tree volatile organic compound emissions. Berlin, Germany:
Springer, 119–151.Lichtenthaler HK. 1999. The 1-deoxy-D-xylulose-5-phosphate pathway of
isoprenoid biosynthesis in plants. Annual Review of Plant Physiology and PlantMolecular Biology 50: 47–65.
Lindinger W, Hansel A, Jordan A. 1998.On-line monitoring of volatile organic
compounds at pptv levels by means of proton-transfer-reaction mass
spectrometry (PTR-MS): medical applications, food control and environmental
research. International Journal of Mass Spectrometry and Ion Processes 173: 191–241.
Logan BA, Monson RK, Potosnak MJ. 2000. Biochemistry and physiology of
foliar isoprene production. Trends in Plant Science 5: 477–481.
Loreto F, Sharkey TD. 1990. A gas-exchange study of photosynthesis and
isoprene emission in Quercus rubra L. Planta 182: 523–531.Martin M, Stirling CM, Humphries SW, Long SP. 2000. A process-based
model to predict the effects of climatic change on leaf isoprene emission rates.
Ecological Modelling 131: 161–174.Medlyn BE, Berbigier P, Clement R, Grelle A, Loustau D, Linder S, Wingate L,
Jarvis PG, Sigurdsson BD, McMurtrie RE. 2005. Carbon balance of
coniferous forests growing in contrasting climates: model-based analysis.
Agricultural and Forest Meteorology 131: 97–124.Misson L, Limousin J-M, Rodriguez R, Letts MG. 2010. Leaf physiological
responses to extreme droughts in Mediterranean Quercus ilex forest. Plant, Cell& Environment 33: 1898–1910.
Monson RK. 2013.Metabolic and gene expression controls on the production of
biogenic volatile organic compounds. In: Niinemets €U, Monson RK, eds.
Biology, controls and models of tree volatile organic compound emissions. Berlin,Germany: Springer, 153–179.
Monson RK, Fall R. 1989. Isoprene emission from aspen leaves: influence of
environment and relation to photosynthesis and photorespiration. PlantPhysiology 90: 267–274.
Monson RK, Grote R, Niinemets €U, Schnitzler J-P. 2012.Modeling the
isoprene emission rate from leaves. New Phytologist 195: 541–559.Monson RK, Jaeger CH, Adams WW, Driggers EM, Silver GM, Fall R. 1992.
Relationships among isoprene emission rate, photosynthesis, and isoprene
synthase activity as influenced by temperature. Plant Physiology 98: 1175–1180.Monson RK, Jones RT, Rosenstiel TN, Schnitzler J. 2013.Why only some
plants emit isoprene. Plant, Cell & Environment 36: 503–516.Morfopoulos C, Prentice IC, Keenan TF, Friedlingstein P, Medlyn BE,
Pe~nuelas J, Possell M. 2013. A unifying conceptual model for the
environmental responses of isoprene emissions from plants. Annals of Botany112: 1223–1238.
Niinemets €U. 2004. Costs of production and physiology of emission of volatile
leaf isoprenoids. In: Hemantaranjan A, ed. Advances in plant physiology.Jodhpur, India: Scientific Publishers, 233–268.
Niinemets €U, Cescatti A, Rodeghiero M, Tosens T. 2005. Leaf internal diffusion
conductance limits photosynthesis more strongly in older leaves of
Mediterranean evergreen broad-leaved species. Plant, Cell & Environment 28:1552–1566.
Niinemets €U, Ciccioli P, Noe SM, Reichstein M. 2013. Scaling BVOC
emissions from leaf to canopy and landscape: how different are predictions
based on contrasting emission algorithms? In: Niinemets €U, Monson RK, eds.
Biology, controls and models of tree volatile organic compound emissions. Berlin,Germany: Springer, 357–390.
Niinemets €U, Monson RK. 2013. State-of-the-art of BVOC research: what do
we have and what have we missed? A synthesis. In: Niinemets €U, Monson RK,
eds. Biology, controls and models of tree volatile organic compound emissions.Berlin, Germany: Springer, 509–528.
Niinemets €U, Monson RK, Arneth A, Ciccioli P, Kesselmeier J, Kuhn U,
Lerdau M, Noe SM, Pe~nuelas J, Staudt M. 2010. The emission factor of
volatile isoprenoids: caveats, model algorithms, response shapes and scaling.
Biogeosciences 7: 1809–2010.Niinemets €U, Tenhunen JD, Harley PC, Steinbrecher R. 1999. A model of
isoprene emission based on energetic requirements for isoprene synthesis and
leaf photosynthetic properties for Liquidambar and Quercus. Plant, Cell &Environment 22: 1319–1335.
Ninyerola M, Pons X, Roure JM. 2000. A methodological approach of
climatological modelling of air temperature and precipitation. InternationalJournal of Climatology 20: 1823–1841.
Nozi�ere B, Gonz�alez NJD, Borg-Karlson A-K, Pei Y, Redeby JP, Krejci R,
Dommen J, Prevot ASH, Anthonsen T. 2011. Atmospheric chemistry in
stereo: a new look at secondary organic aerosols from isoprene. GeophysicalResearch Letters 38: L11807.
Owen SM, Pe~nuelas J. 2005.Opportunistic emissions of volatile isoprenoids.
Trends in Plant Science 10: 420–426.Paasonen P, Asmi A, Pet€aj€a T, Kajos MK, €Aij€al€a M, Junninen H, Holst T,
Abbatt JPD, Arneth A, Birmili W et al. 2013.Warming-induced increase in
aerosol number concentration likely to moderate climate change. NatureGeoscience 6: 438–442.
� 2014 The Authors
New Phytologist� 2014 New Phytologist TrustNew Phytologist (2014) 203: 125–139
www.newphytologist.com
NewPhytologist Research 137

Pacifico F, Harrison SP, Jones CD, Sitch S. 2009. Isoprene emissions and
climate. Atmospheric Environment 43: 6121–6135.Pe~nuelas J, Marino G, Llusia J, Morfopoulos C, Farr�e-Armengol G, Filella
I. 2013. Photochemical reflectance index as an indirect estimator of foliar
isoprenoid emissions at the ecosystem level. Nature Communications 4:2604.
Pike RC, Young PJ. 2009.How plants can influence tropospheric chemistry: the
role of isoprene emissions from the biosphere.Weather 64: 332–336.Poisson N, Kanakidou M, Crutzen PJ. 2000. Impact of non-methane
hydrocarbons on tropospheric chemistry and the oxidizing power of the global
troposphere: 3-dimensional modelling results. Journal of Atmospheric Chemistry36: 157–230.
Possell M, Hewitt CN. 2011. Isoprene emissions from plants are mediated by
atmospheric CO2 concentrations. Global Change Biology 17: 1595–1610.Possell M, Loreto F. 2013. The role of volatile organic compounds in plant
resistance to abiotic stresses: responses and mechanisms. In: Niinemets €U,
Monson RK, eds. Biology, controls and models of tree volatile organic compoundemissions. Berlin, Germany: Springer, 209–235.
de Pury DGG, Farquhar GD. 1997. Simple scaling of photosynthesis from leaves
to canopies without the errors of big-leaf models. Plant, Cell & Environment20: 537–557.
Rajabi Memari H, Pazouki L, Niinemets €U. 2013. The biochemistry and
molecular biology of volatile messengers in trees. In: Niinemets €U, Monson
RK, eds. Biology, controls and models of tree volatile organic compound emissions.Berlin, Germany: Springer, 47–93.
Rasulov B, Bichele I, Laisk A, Niinemets €U. 2013. Competition between
isoprene emission and pigment synthesis during leaf development in aspen.
Plant, Cell & Environment 37: 724–741.Rasulov B, Copolovici L, Laisk A, Niinemets €U. 2009a. Postillumination
isoprene emission: in vivo measurements of dimethylallyldiphosphate pool size
and isoprene synthase kinetics in aspen leaves. Plant Physiology 149: 1609–1618.
Rasulov B, H€uve K, Bichele I, Laisk A, Niinemets €U. 2010. Temperature
response of isoprene emission in vivo reflects a combined effect of substrate
limitations and isoprene synthase activity: a kinetic analysis. Plant Physiology154: 1558–1570.
Rasulov B, H€uve K, Laisk A, Niinemets €U. 2011. Induction of a longer term
component of isoprene release in darkened aspen leaves: origin and
regulation under different environmental conditions. Plant Physiology 156:816–831.
Rasulov B, H€uve K, V€albe M, Laisk A, Niinemets €U. 2009b. Evidence that light,
carbon dioxide, and oxygen dependencies of leaf isoprene emission are driven
by energy status in hybrid aspen. Plant Physiology 151: 448–460.Rosenkranz M, Schnitzler J-P. 2013. Genetic engineering of BVOC emissions
from trees. In: Niinemets €U, Monson RK, eds. Biology, controls and models oftree volatile organic compound emissions. Berlin, Germany: Springer, 95–118.
Rosenstiel TN, Ebbets AL, Khatri WC, Fall R, Monson RK. 2004. Induction of
poplar leaf nitrate reductase: a test of extrachloroplastic control of isoprene
emission rate. Plant Biology 6: 12–21.Rosenstiel TN, Potosnak MJ, Griffin KL, Fall R, Monson RK. 2003. Increased
CO2 uncouples growth from isoprene emission in an agriforest ecosystem.
Nature 421: 256–259.Sanderson MG, Jones CD, Collins WJ, Johnson CE, Derwent RG. 2003. Effect
of climate change on isoprene emissions and surface ozone levels. GeophysicalResearch Letters 30: 1936.
Seemann M, Tse Sum Bui B, Wolff M, Miginiac-Maslow M, Rohmer M. 2006.
Isoprenoid biosynthesis in plant chloroplasts via the MEP pathway: direct
thylakoid/ferredoxin-dependent photoreduction of GcpE/IspG. FEBS Letters580: 1547–1552.
Sharkey TD. 2013. Is it useful to ask why plants emit isoprene? Plant, Cell &Environment 36: 517–520.
Sharkey TD, Loreto F. 1993.Water stress, temperature, and light effects on the
capacity for isoprene emission and photosynthesis of kudzu leaves. Oecologia95: 328–333.
Sharkey TD, Wiberley AE, Donohue AR. 2008. Isoprene emission from plants:
why and how. Annals of Botany 101: 5–18.
Sharkey TD, Yeh S. 2001. Isoprene emission from plants. Annual Review of PlantBiology 52: 407–436.
Singsaas EL, Ort DR, DeLucia EH. 2001. Variation in measured values of
photosynthetic quantum yield in ecophysiological studies. Oecologia 128: 15–23.
St Paul NKM, Limousin J-M, Rodr�ıguez-Calcerrada J, Ruffault J, Rambal S,
Matthew LG, Misson L. 2012. Photosynthetic sensitivity to drought varies
among populations of Quercus ilex along a rainfall gradient. Functional PlantBiology 39: 25–37.
Sun Z, H€uve K, Vislap V, Niinemets €U. 2013a. Elevated [CO2] magnifies
isoprene emissions under heat and improves thermal resistance in hybrid aspen.
Journal of Experimental Botany 64: 5509–5523.Sun Z, Niinemets €U, H€uve K, Noe SM, Rasulov B, Copolovici L, Vislap V.
2012. Enhanced isoprene emission capacity and altered light responsiveness in
aspen grown under elevated atmospheric CO2 concentration. Global ChangeBiology 18: 3423–3440.
Sun Z, Niinemets €U, H€uve K, Rasulov B, Noe SM. 2013b. Elevated
atmospheric CO2 concentration leads to increased whole-plant isoprene
emission in hybrid aspen (Populus tremula9 Populus tremuloides). NewPhytologist 198: 788–800.
Velikova V, Sharkey TD, Loreto F. 2012. Stabilization of thylakoid membranes
in isoprene-emitting plants reduces formation of reactive oxygen species. PlantSignaling and Behavior 7: 1–3.
Velikova V, V�aarkonyi Z, Szab�o M, Maslenkova L, Nogues I, Kov�acs L, Peeva
V, Busheva M, Garab G, Sharkey TD et al. 2011. Increased thermostability of
thylakoid membranes in isoprene-emitting leaves probed with three biophysical
techniques. Plant Physiology 157: 905–916.Vickers CE, Possell M, Cojocariu CI, Velikova VB, Laothawornkitkul J,
Ryan A, Mullineaux PM, Hewitt CN. 2009. Isoprene synthesis protects
transgenic tobacco plants from oxidative stress. Plant, Cell & Environment32: 520–531.
Vickers CE, Possell M, Hewitt CN, Mullineaux PM. 2010. Genetic structure
and regulation of isoprene synthase in Poplar (Populus spp.). Plant MolecularBiology 73: 547–558.
Weise SE, Li Z, Sutter AE, Corrion A, Banerjee A, Sharkey TD. 2013.
Measuring dimethylallyl diphosphate available for isoprene synthesis. AnalyticalBiochemistry 435: 27–34.
Wilkinson MJ, Monson RK, Trahan N, Lee S, Brown E, Jackson RB,
Polley HW, Fay PA, Fall R. 2009. Leaf isoprene emission rate as a
function of atmospheric CO2 concentration. Global Change Biology 15:
1189–1200.Wolfertz M, Sharkey TD, Boland W, K€uhnemann F, Yeh S, Weise SE. 2003.
Biochemical regulation of isoprene emission. Plant, Cell & Environment 26:1357–1364.
Ye Z-P, Suggett DJ, Robakowski P, Kang H-J. 2013. A mechanistic model
for the photosynthesis-light response based on the photosynthetic electron
transport of photosystem II in C3 and C4 species. New Phytologist 199:110–120.
Zimmer W, Br€uggemann N, Emeis S, Giersch C, Lehning A, Steinbrecher R,
Schnitzler J-P. 2000. Process-based modelling of isoprene emission by oak
leaves. Plant, Cell & Environment 23: 585–595.Zimmer W, Steinbrecher R, K€orner C, Schnitzler J-P. 2003. The
process-based SIM–BIM model: towards more realistic prediction of
isoprene emissions from adult Quercus petraea forest trees. AtmosphericEnvironment 37: 1665–1671.
Supporting Information
Additional supporting information may be found in the onlineversion of this article.
Fig. S1 Isoprene emissions of Populus nigra vs internal CO2 con-centration (Ci) using the conceptual model from Morfopouloset al. (2013).
New Phytologist (2014) 203: 125–139 � 2014 The Authors
New Phytologist� 2014 New Phytologist Trustwww.newphytologist.com
Research
NewPhytologist138

Fig. S2 Isoprene emissions of Populus nigra vs photosyntheticphoton flux density (PPFD).
Fig. S3 Assimilation curves of Populus nigra.
Fig. S4 Isoprene response to changes in internal CO2 concentra-tion (Ci) using the Niinemets model modified by Arneth et al.(2007).
Fig. S5 Observed isoprene emission rates vs light-limited electronflux (J) for hybrid aspen.
Fig. S6 Supplementary statistics for Populus nigra.
Fig. S7 Supplementary statistics for hybrid aspen.
Table S1 Isoprene emissions vs changes in photosyntheticphoton flux density (PPFD) at different CO2 concentrations
Table S2 Description and values of the parameters of the Farqu-har model used in standard simulations
Notes S1 Comparison of the new energetic status model with theconceptual model from Morfopoulos et al. (2013).
Notes S2 Additional details on the model of photosyntheticcarbon assimilation.
Please note: Wiley Blackwell are not responsible for the contentor functionality of any supporting information supplied by theauthors. Any queries (other than missing material) should bedirected to the New Phytologist Central Office.
New Phytologist is an electronic (online-only) journal owned by the New Phytologist Trust, a not-for-profit organization dedicatedto the promotion of plant science, facilitating projects from symposia to free access for our Tansley reviews.
Regular papers, Letters, Research reviews, Rapid reports and both Modelling/Theory and Methods papers are encouraged. We are committed to rapid processing, from online submission through to publication ‘as ready’ via Early View – our average timeto decision is <25 days. There are no page or colour charges and a PDF version will be provided for each article.
The journal is available online at Wiley Online Library. Visit www.newphytologist.com to search the articles and register for tableof contents email alerts.
If you have any questions, do get in touch with Central Office ([email protected]) or, if it is more convenient,our USA Office ([email protected])
For submission instructions, subscription and all the latest information visit www.newphytologist.com
� 2014 The Authors
New Phytologist� 2014 New Phytologist TrustNew Phytologist (2014) 203: 125–139
www.newphytologist.com
NewPhytologist Research 139