Left hemisphere superiority for visuospatial functions in left-handers
Upload
khangminh22Category
view
5download
0
Strathmore University
SU+ @ Strathmore University Library
Electronic Theses and Dissertations
2019
A Mobile application that enables restaurants
list their left-over food at discounted rates in
Nairobi
Bettirose Njoki Ngugi Faculty of Information Technology Strathmore University
Follow this and additional works at https://su-plus.strathmore.edu/handle/11071/6758
Recommended Citation
Ngugi, B. N. (2019). A Mobile application that enables restaurants list their left-over food at
discounted rates in Nairobi [Thesis, Strathmore University]. http://su-
plus.strathmore.edu/handle/11071/6758
This Thesis - Open Access is brought to you for free and open access by DSpace @Strathmore University. It has been accepted for inclusion in Electronic Theses and Dissertations by an authorized administrator of DSpace @Strathmore University. For more information, please contact [email protected]

A MOBILE APPLICATION THAT ENABLES RESTAURANTS LIST THEIR
LEFT-OVER FOOD AT DISCOUNTED RATES IN NAIROBI
BETTIROSE NJOKI NGUGI
A dissertation submitted in partial fulfillment of the requirements for the
Master of Science Mobile Telecommunications and Innovation at
Strathmore University
Faculty of Information Technology
Strathmore University
Nairobi, Kenya
June 2019
This dissertation is available for Library use on the understanding that it is copyright
material and that no quotation from the thesis may be published without proper
acknowledgement.

ii
Declaration
I declare that this work has not been previously submitted and approved for the award of a
degree by this or any other University. To the best of my knowledge and belief, the thesis contains
no material previously published or written by another person except where due reference is made
in the thesis itself. No part of this thesis may be reproduced without the permission of the author
and Strathmore University
Bettirose Njoki Ngugi
Student No: 091460
Signature:
Date: 8th June 2019
Approval
The dissertation of Bettirose Ngugi was reviewed and approved by the following:
Dr. Bernard Shibwabo
Senior Lecturer - Faculty of Information Technology
Strathmore University
Dr. Joseph Orero
Dean Faculty of Information Technology
Strathmore University
Dr. Ruth Kiraka
Dean, School of Graduate Study
Strathmore University

iii
Dedication
I dedicate this research to my loving parents who have diligently raised me and given me
an opportunity to attend school up to this level, to my two lovely brothers Tom and Jose, who
continually motivate me to be a better sister and role model and to two beautiful women who
ardently pray and inspire me every day to be a strong woman just like them, Pauline Waceke
Githaka – my maternal grandmother – and Beth Njoki Muraya – my paternal grandmother.

iv
Acknowledgements
This research would not have been successful without the grace of God which has been
sufficient every moment of the journey. I am privileged to work with Dr. Bernard Shibwabo as my
supervisor, his constant feedback and insight made the learning process while doing this research
smooth and fulfilling.
Many thanks to Safaricom Foundation for the partial scholarship to undertake this
prestigious program. Without them, I wouldn’t have had the opportunity to hone my skills to
enable me to impact the world positively through technology.
Nobody has been more important to me in pursuit of this project than my supportive family,
mom, dad, Tom and Jose, whose love and guidance are with me in whatever I pursue.
Really grateful to my former boss, Piotr Piwowarczyk for his support while I juggled
school with work and my colleagues for their help and moral support throughout the process. Last
but not the least, I wish to thank my classmates and friends for their constant support and best
wishes. Thank you so much, from the bottom of my heart.

v
List of Abbreviations and Acronyms
API - Application programming interface
ARA - Activities, Resources, and Actors
CSS - Cascading Style Sheets
ERD - Entity Relationship Diagram
ADT - Android Development Tools
FAO - Food and Agriculture Organization
GPS - Global Positioning System
HTML - Hypertext Markup Language
HTTP - Hypertext Transfer Protocol
KAHKC - Kenya Association of Hotel Keepers and Caterers
MWRRG - Metropolitan Waste and Resource Recovery Group
OS - Operating Systems
PHP - Hypertext Preprocessor
REST - Representational state transfer
SCM - Supply chain management
SDK - Software Development Kit
UML - Unified Modelling Language
URL - Uniform Resource Locator
USA - United States of America (USA)

vi
Abstract
Food waste is a huge problem in Kenya and many other countries, in fact, the severity of
the problem borders that of climate change and global warming. Institutions in the catering
industry such as hotels, restaurants, supermarkets and events caterers prepare food every day that
is not all consumed at the end of the day. This is food that is good for human consumption ends
ups as waste most times. More to this, most consumers make food orders but end up having
leftovers on their plates at the end of their meals. Plate waste and vegetable peeling produced
during food preparation process is still consumable by animals such as pigs and dogs, but most
times than not, ends up in waste bins rotting. While this amount of food goes to waste, more and
more people sleep everyday hungry and even more are said not to have a nutritious food to keep
them active and healthy. Food waste contributes to global warming through greenhouse gas
emission comparable to that produced from road transport and mitigating it will have a positive
impact on climate change. This being the case, there is need to bridge the gap between excess food
produced by hospitality institutions and those who need it either for their consumption for human
consumable food or animal consumption for left-over food. This study seeks to help manage food
waste in the hospitality industry, by creating a platform where hotels, restaurants, supermarkets or
just companies in the catering business report excess food and people in need of food sign up and
place their orders for both human consumable food and plate waste suitable for animals. The
organizations have a choice either give up the food for free or charge a small fee. The study
provides data to these organization to help perform predictive analysis on trends with a goal of
enabling them know how much is consumed and keep this in mind when preparing food to avoid
food wastage. The software methodology used is prototyping model. From research, it was
established that in deed food waste is a global problem that needs attention and a mobile
application was created as the front end interface that allows users to browse through meals and
place orders and a backend that allows restaurants to update the mobile application with meals
available for the day.
Keywords: Food waste, hospitality industry, predictive analysis, food waste reduction,
Foodie.

vii
Table of Contents
CHAPTER 1 : INTRODUCTION ................................................................................... 1
1.1 BACKGROUND OF THE STUDY .................................................................................... 1
1.2 PROBLEM STATEMENT ............................................................................................... 2
1.3 RESEARCH OBJECTIVES.............................................................................................. 3
1.4 RESEARCH QUESTIONS ............................................................................................... 3
1.5 SIGNIFICANCE OF THE STUDY ..................................................................................... 3
1.6 SCOPE AND LIMITATIONS ........................................................................................... 4
1.7 CONCLUSIONS ............................................................................................................ 4
CHAPTER 2 : LITERATURE REVIEW ...................................................................... 5
2.1 INTRODUCTION .......................................................................................................... 5
2.2 STAGES AT WHICH FOOD WASTE OCCURS ................................................................ 5
2.3 FOOD WASTE IN THE HOSPITALITY INDUSTRY ........................................................... 7
2.4 CAUSES OF FOOD WASTE GENERATION IN HOUSEHOLDS .......................................... 8
2.5 SUPPLY CHAIN MANAGEMENT ................................................................................... 9
2.6 THE ARA MODEL .................................................................................................... 10
2. 6.1 Activity Layer .................................................................................................. 10
2.6.2 Resources Layer ............................................................................................... 11
2.6.3 Actor Layer ...................................................................................................... 12
2.6.4 Approaches to Food Waste Reduction ............................................................. 12
2.7 EXISTING SOLUTIONS ............................................................................................... 13
2.7.1 Rescuing Leftover Cuisine ............................................................................... 13
2.7.2 Saving Grace Initiative in Abu Dhabi (UAE) .................................................. 14
2.7.3 Food Panda ...................................................................................................... 14
2.7.4 Jumia Food ...................................................................................................... 15
2.8 GAPS AND LIMITATION ON EXISTING TECHNOLOGY ................................................ 15
2.9 CONCLUSION ............................................................................................................ 15
CHAPTER 3 : RESEARCH METHODOLOGY ........................................................ 17
3.1. INTRODUCTION ....................................................................................................... 17

viii
3.2. SOFTWARE METHODOLOGY .................................................................................... 17
3.2.1 Planning Phase ................................................................................................ 17
3.2.2 Requirements Elicitation .................................................................................. 17
3.3 SYSTEM ANALYSIS AND DESIGN METHODS ............................................................. 18
3.4 APPLICATION IMPLEMENTATION .............................................................................. 18
3.5 APPLICATION EVALUATION AND TESTING ............................................................... 19
CHAPTER 4 : SYSTEM DESIGN AND ARCHITECTURE..................................... 20
4.1 INTRODUCTION ........................................................................................................ 20
4.2 SYSTEM DESIGN ....................................................................................................... 21
4.2.1 Data Flow Diagram ......................................................................................... 21
4.2.2 Use Case Diagram ........................................................................................... 22
4.2.3 Sequence Diagram ........................................................................................... 25
4.2.4 Entity Relationship Diagram ........................................................................... 25
4.3 SYSTEM ARCHITECTURE .......................................................................................... 27
4.3.1 Three Tier Architecture.................................................................................... 27
4.4 SYSTEM REQUIREMENTS .......................................................................................... 20
4.4.1 Functional requirements .................................................................................. 20
4.4.2 Non-functional Requirements .......................................................................... 21
CHAPTER 5 : PROTOTYPE BUILDING AND TESTING ...................................... 29
5.1 INTRODUCTION ........................................................................................................ 29
5.2 IMPLEMENTATION ENVIRONMENT............................................................................ 30
5.2.1 Hardware Environment ................................................................................... 30
5.2.2 Software Environment ...................................................................................... 30
5.3 SYSTEM IMPLEMENTATION ...................................................................................... 30
5.3.1 Mobile Application........................................................................................... 31
5.4 SYSTEM TESTING ..................................................................................................... 33
5.4.1 Functional Testing ........................................................................................... 33
5.4.2 Usability Testing .............................................................................................. 36
5.4.3 Compatibility Testing ....................................................................................... 39
5.5 SYSTEM EVALUATION AND VALIDATION ................................................................. 40

ix
5.6 SUMMARY ................................................................................................................ 40
CHAPTER 6 : DISCUSSIONS ...................................................................................... 41
6.1 INTRODUCTION ........................................................................................................ 41
6.2 DISCUSSION IN RELATION TO RESEARCH OBJECTIVES ............................................. 41
6.3 ADVANTAGES OF THE APPLICATION AS COMPARED TO THE CURRENT SYSTEM ....... 42
6.4 LIMITATION OF THE APPLICATION ............................................................................ 43
CHAPTER 7 : CONCLUSIONS ................................................................................... 44
7.1 CONCLUSIONS .......................................................................................................... 44
7.2 RECOMMENDATIONS ................................................................................................ 44
7.3 SUGGESTIONS FOR FUTURE RESEARCH .................................................................... 45
REFERENCES ................................................................................................................ 47
APPENDICES ................................................................................................................. 51
APPENDIX A: USE CASE DIAGRAMS .............................................................................. 51
APPENDIX B: SCREENSHOTS OF EXISTING SOLUTIONS ................................................... 54
APPENDIX C: SCREENSHOTS FOODIE APPLICATION ....................................................... 56
APPENDIX D: QUESTIONNAIRE ...................................................................................... 60
APPENDIX E: USABILITY TESTING AND VALIDATION QUESTIONNAIRE .......................... 63
APPENDIX F: TURN IT IN RESULTS .................................................................................. 65

x
List of Figures
Figure 2.1: Stages of Food Wastage ................................................................................... 6
Figure 2.2: Comparison between Food Waste in Developing and Developed Countries 6
Figure 2.3: Materials Flow Analysis for a Lunch Buffet at a UAE Hotel .......................... 7
Figure 2.4: MFA Results for a Lunch Buffet Vs. a Wedding Buffet at UAE Hotels ......... 8
Figure 3.1: Prototyping Model .......................................................................................... 17
Figure 4.1: Context Diagram ............................................................................................ 22
Figure 4.2: Level 1 Data Flow Diagram ........................................................................... 22
Figure 4.3: Use Case Diagram .......................................................................................... 24
Figure 4.4: Sequence Diagram for the Solution ................................................................ 25
Figure 4.5: Entity Relationship Diagram .......................................................................... 26
Figure 4.6: Three-tier Architecture ................................................................................... 28
Figure 5.1: View Restaurants and Meals .......................................................................... 32
Figure 5.2: Add to Cart Screenshot................................................................................... 32
Figure 5.3: Orders and Making Payment .......................................................................... 33
Figure 5.4: User Friendliness Testing ............................................................................... 37
Figure 5.5: System Functionality Acceptance Testing ..................................................... 37
Figure 5.6: Acceptability .................................................................................................. 38
Figure 5.7: User Interface Aesthetics................................................................................ 39
Figure 5.8: Evaluation and Validation of the Solution ..................................................... 40

xi
List of Tables
Table 4.1: Login/Logout Use case Description ................................................................ 23
Table 4.2: Upload Meals Use Case Table ......................................................................... 24
Table 5.1: Add Restaurant Functionality .......................................................................... 34
Table 5.2: Add Meal Functionality ................................................................................... 34
Table 5.3: View Restaurant Functionality ........................................................................ 34
Table 5.4: View Meals Functionality................................................................................ 34
Table 5.5: Add Meal to Cart Functionality ....................................................................... 35
Table 5.6: Checkout Functionality .................................................................................... 35
Table 5.7: View Animal Food Functionality .................................................................... 35
Table 5.8: View Reports Functionality ............................................................................. 36
Table 5.9: Predefined Available Android Operating System Platforms ........................... 39
Table 5.10: Test Done on Available Browsers ................................................................. 40

1
Chapter 1 : Introduction
1.1 Background of the Study
Food and Agriculture Organization (FAO) defines food waste as food appropriate for
human consumption being discarded, whether or not after it is kept beyond its expiry date or left
to spoil (FAO, 2013). There are many reasons why food goes to waste for example oversupply in
the market or bad consumer eating habits. Every year, one third of food produced globally for
human consumption goes to waste amounting to loss of approximately $680 billion in developed
countries and $310 billion in developing countries (FAO, 2013).
Interestingly, food wasted in Africa can comfortably feed 300 million people (FAO, 2013).
Approximately 870 Million people globally do not eat enough to be healthy and one in eight people
go to bed hungry every day (Stop Wasting Food Movement, 2019). This clearly shows that there
is a gap between people who have surplus food and those in need of it.
There are pressing impacts of climate change, food insecurity and oil in the twenty-first
century and food wastage seems like it will join the list too soon (Munro, Mirosa, Mangan-Walker,
& Pearson, 2016). One fifth of food delivered to hospitality institutions is lost as research shows
(Engstrom & Carlsson-Kanyama, 2015) and this food is wasted in two major ways. The first one
is when edible food is thrown away (Principato, Secondi, & Pratesi, 2015) and the second way is
through food waste during food preparation stage where there are such things as peelings
(Principato et al., 2015). Edible food is thrown away either because it was served and left on plates
or it was cooked and no one ordered it and therefore may go stale and get thrown away.
Recently, France became the first country to ban supermarkets from throwing or destroying
unsold food and instead forced them to donate the food to charity and to the needy (Chrisafis,
2016). This clearly shows that even supermarkets significantly contribute to food waste since they
stock edibles such as bread, drinks and groceries. With France requiring all supermarkets to make
donations to the homeless and less privileged, we could well be on the right direction in managing
the food waste problem.
The effects of food waste are dire, for example the energy that goes into the production,
harvesting, transporting, and packaging of that wasted food generates more than 3.3 billion metric
tons of carbon dioxide (UN Environment, 2019). If food waste were a country, it would be the

2
world's third largest emitter of greenhouse gases, behind the United States of America (USA) and
China (UN Environment, 2019). This study is going to look into this gap by analyzing the problems
in the hospitality industry as regards to food wastage and propose a solution to ensure this surplus
supply of food gets to those in need instead of going to waste.
There are about 9,450 registered caterers and hotels according to the Kenya Association of
Hotel Keepers and Caterers (KAHC) an organization that brings together hotels, lodges,
restaurants, membership clubs and prominent airline caterers in Kenya (Kenya Association of
Hotel-Keepers and Caterers, 2019). These are institutions that are directly involved in preparation
of food for human consumption and usually, this process leads to wastage in form of fruit and
vegetables offcuts such as peelings, spoilt or contaminated raw materials, leftovers from served
meals and unserved residual prepared meals every day.
According to a research conducted by Metropolitan Waste and Resource Recovery Group
in Melbourne (MWRG), total waste volumes generated by hospitality institutions averages
between 1500-2000 tons per annum (Resource Efficient Scotland; Natural Scotland; Catering
Equipment Suppliers Association, 2012). The situation is worse in UK where there is 79000 tons
of food wasted every year and 68M tons in United States of America (Resource Efficient Scotland;
Natural Scotland; Catering Equipment Suppliers Association, 2012).
1.2 Problem Statement
Food waste is a global problem and it takes place at every stage of the supply chain with
institutions in the hospitality industry such as restaurants, supermarkets being participants in the
problem. According to (Kasim, 2007) , food wastage accounts for 46% of all waste produced by
Kenyan hotels. In addition to these statistics, 42 million people in the world do not have enough
to eat (FAO, 2019). Every day, restaurants prepare food expecting customers to come and indulge
but rarely is all the food prepared consumed. Most of the times, the restaurants refrigerate it and
sell the food to the first customers the next day, however, this is unethical since restaurants are
expected to only sell freshly prepared food. This poses a problem to the restaurants on what to do
with excess food in their kitchen at the end of the day, and this problem contributes to the food
wastage problem globally. These statistics clearly shows that there is need to better manage this
waste or even better, reduce it and this study is going to propose a solution to better manage this
problem.

3
1.3 Research Objectives
i. To investigate challenges in the hospitality industry with regards to food wastage.
ii. To review the existing food applications in the hospitality industry.
iii. To develop and test a system that helps manage the food wastage problem in the hospitality
industry.
iv. To validate the system to ensure it solves the food wastage problem.
1.4 Research Questions
i. What are the challenges in the hospitality industry with regards to food wastage?
ii. How have the existing food applications been implemented?
iii. How can the proposed mobile application be developed and tested?
iv. How can the developed mobile application be validated?
1.5 Significance of the Study
During his inauguration speech for his second term in office, President Kenyatta, named
food security as one of the key pillars his government will focus on in the next five years. While
his focus to solve the problem majored in creating an environment where farmers are not entirely
dependent on rainfall to grow food, there is a significant implication of food waste in making a
country food secure. There is need to ensure that the food produced by farmers ends up in citizen’s
plates and not in litter bin as waste food. According to Leopold, 1.3 tons of food produced globally
goes to waste before getting to the market, this is tantamount to a third of all food produced (Obi,
2017).
Clearly, food waste is a global problem that needs to be addressed and given same attention
as climate change since the repercussions are similar. There is need to better manage food wastage
by institutions in the hospitality industry and this study designs a solution that addresses this
problem. The better we can manage the value chain, the better we are able to budget for food as
country.
The main beneficiaries of this research are the hospitality industry institutions such as
restaurants, hotels, airlines, supermarkets and caterers since the platform gives them an alternative
revenue generating channel while helping them solve the food waste problem they experience
every day.

4
1.6 Scope and Limitations
The solution only targets Nairobi, Kenya since the study focuses on the area. More to that,
the solution is a mobile application running on Android platform with a web backend system to be
used for analysis and order/meals tracking and processing. The application offers a platform where
restaurants and institutions in the hospitality industry can advertise their excess food.
1.7 Conclusions
The chapter has discussed the background of the research highlighting the existing food
waste problem. The research aims at developing a mobile application to address the research
objectives and respond to the research question. The next chapter, is the literature review.

5
Chapter 2 : Literature Review
2.1 Introduction
Food waste can be assessed from different angles, this study looks at it from the point at
which food gets to the consumer. Specifically, the study delves into the role and contributions of
institutions in the hospitality industry in food wastage while reviewing what measures that have
been put in place to solve the problem and the gaps that exist at the moment.
In this chapter, the study identifies challenges in the hospitality industry with regards to
food wastage then review architectures of food applications already in use in the industry. The
conclusion finds a gap in the industry that this study fills.
2.2 Stages at Which Food Waste Occurs
Food waste has huge impact on global issues such as climate change, environmental
sustainability and even food security which makes it an issue that cannot be ignored (Block, et al.,
2016). The developing countries contribute 44 percent of world’s food waste and while much of
this waste occurs at the point of transportation, storage and handling of it, there is still a huge part
of it that is caused by consumer habits in the hospitality industry (Lipinski, et al., 2013). Food is
wasted at every stage from the moment it is in the farm to the time it gets to the consumer’s waste
bin (Block et al., 2016). Figure 2.1 depicts the stages at which food waste occurs clearly.

6
Figure 2.1: Stages of Food Wastage (Block, et al., 2016)
Even with food loss occurring at all the mentioned stages, it is important to access wastage
at each stage of the cycle for both developing and developed countries. Figure 2.2 shows that
developing countries account for 7 percent of food wasted at the consumption stage. However, it
is important to note that urban regions experience great levels of food waste at the consumption
stage whether in developed or developing countries (Lipinski et al., 2013).
Figure 2.2: Comparison between Food Waste in Developing and Developed Countries (Lipinski,
et al., 2013)

7
2.3 Food Waste in the Hospitality Industry
There is limited literature on food waste problem in Africa, this also means there is limited
literature on the methods of preventing food wastage. This notwithstanding, there is considerable
amount of food wastage in restaurants, in-flight catering, events such as wedding and corporate
events, hospitals and every institution that is in the hospitality industry. Food waste contributes the
highest percentage of all waste churned in the hospitality industry (Pirani & Arafat, 2015).
According to United Nations, of the 7.3 billion people on the planet, an estimated 805
million - or one in nine - suffered from chronic hunger between 2012 and 2014. As this happens,
in the United States alone, 40 percent of food gets wasted every year—and that amounts to $162
billion in waste annually this is according to Natural Resources Defense Council. Rescuing
Leftover Cuisine, a non-profit organization based in the USA founded in 2013, partners with
hotels, restaurants and catering organizations to collect excess food and donate to the homeless.
Since its inception, the organization has rescued about 458 tonnes of food from hotels in the USA
alone and served 842,659 meals already (Rescuing Leftover Cuisine, 2019).
Pirani and Arafat conducted a research on seventeen restaurants/ hospitality establishments
in United Arabs Emirates (UAE) and used the Material Flow Analysis (MFA) to analyze the stages
at which food is wasted and quantify the food wasted as well (Pirani & Arafat, 2015). Figure 2.3
shows the results of the analysis at a lunch buffet.
Figure 2.3: Materials Flow Analysis for a Lunch Buffet at a UAE Hotel (Pirani & Arafat, 2015)

8
They went ahead did a comparison of this waste in a lunch buffet and waste at wedding in
UAE still. The results gave a unique perspective as shown in Figure 2.4.
Figure 2.4: MFA Results for a Lunch Buffet Vs. a Wedding Buffet at UAE Hotels (Pirani &
Arafat, 2015)
According to Mirosa et al. (2016) plate waste is the single largest source of loss for food
delivered to foodservice institutions. Most of the food waste that are generated in households are
waste such as unused or spoiled cooked food, excess cooked food, vegetable and fruit peelings,
beverages that went stale, undesirable raw food, meat scraps, fresh fruit and vegetables and salad
(Global Ideas, 2016). Fresh, fruit and vegetables (FFVs) are usually among the most-wasted items,
followed by other perishables like bakery and dairy products, meat and fish (Parfitt, Barthel, &
Macnaughton, 2010).
2.4 Causes of Food Waste Generation in Households
One-third (about 1.3 billion tonnes) of all the food produced for human consumption goes
to waste or is lost annually because of inappropriate practices (Ramukhwatho, Plessis, & Oelofse,
2014). A study on food waste conducted in the United Kingdom, for instance, shows that
consumers throw away 31% of the food that they buy and their reason for food being wasted is
that it is left unused or that too much food is prepared and also by buying more food than what is
going to be eaten (Stop Wasting Food Movement, 2019). Cooking habits of households are the
main reason for household food waste. According to the European statistics, households in Europe

9
spent 12.3% of their household budget on food. People in Romania spent 50% on food (EC Europa,
2018), while South African household spent 14% on food (Government of South Africa, 2012).
Some of the reasons that cause this food waste are lack of menu planning before meals and by
buying foods that are not on their shopping list. The majority of fresh fruit and vegetables are
thrown away because it was not used in time or had gone bad or had passed a date label (EC
Europa, 2018).
2.5 Supply Chain Management
Supply chain management (SCM) is a technique that is linked to the adoption of the lean
production system (Othman & Abdul Ghani, 2008). Food supply arrangements feature substantial
complexity, because of the “trade-offs that need to be made regarding availability, perishability
and variability in supply and quality” (Roth et al., 2008, p. 35). Such trade-offs are difficult to
handle due to unpredictable process output and quality variations (Trienekens et al., 2012).
Aramyan et al. (2007) discussed issues differentiating food supply from other chains: seasonality
of production, long production throughput time, and shelf-life constraints. These conditions make
food supply “more complex and harder to manage than other supply chains” (Rajurkar & Jain,
2011, p. 34). Opara (2003) characterized the agro-food sector as fragmented, involving a diverse
range of enterprises: farmers, processors, marketers, and distributors. Accordingly, Aramyan et al.
(2007, p. 304) argued that for improvements of food supply “there is a need to look outside the
boundaries of individual firms.”
Supply chain management (SCM) principles have received increasing attention in the food
sector (Opara, 2003). Van der Vorst et al. (2007) concluded that managers increasingly realized
the significance of “successful coordination, integration, and management of key business
processes across members of their supply chains.” However, Aramyan et al. (2007) claimed that
SCM application is particularly difficult in the food sector and identified four indicators relevant
for performance: efficiency, flexibility, responsiveness, and food quality. Each criterion puts
specific requirements on the design and management of supply arrangements, causing tensions
and conflicts since organizations tend to prioritize their own goals.
Thus, several authors advocate a network approach for improved understanding of food
supply, however this has not yet been done. Therefore, the next few paragraphs are going to assess
the industrial network theory with a concentration on ARA model (activities, resources, and

10
actors). This approach for analyzing industrial reality distinguishes between three central
dimensions of the business landscape: the activities undertaken, the resources used for these
activities, and the actors undertaking the activities and controlling the resources. In reality, the
three dimensions are deeply intertwined. However, by applying three different lenses on a complex
context, the ARA model has shown its usefulness for analyzing various business processes and
situations, such as technological development, business-to-business marketing, purchasing and
supply management, physical distribution and logistics (Håkansson et al., 2009).
2.6 The ARA Model
This is a framework that analyses industrial realities by differentiating three dimensions of
the business that are intertwined. These are activities undertaken, resources utilized while
undertaking these activities and actors that are undertaking the activities and controlling the
resources (Gadde & Amani, 2016). Several researchers have pointed out the importance of the
three dimensions of the ARA model.
Caiazza et al. (2014, p. 464) highlighted the role of multiple and interdependent activities
in production, processing, and distribution in the efforts “to take an agricultural product from the
initial stage of production to the final consumer.” The complexity of the actor layer has been
described in terms of “suppliers of inputs such as seeds, chemicals and machinery, farmers and
other agricultural service providers, processors of agricultural goods, such as manufacturers of
food and beverages, trading companies dealing with agricultural commodities, and retailers, such
as supermarket chains” (Caiazza & Volpe, 2012, p. 922). Finally, Koops et al. (2002) emphasized
the importance of the resource layer by pointing out the complex nature of resource constellations
and their impact on both a firm’s product mix and the design of its processes. Below, central
features (CF) of the three network layers and the associated concepts for analyzing FSNs are
discussed.
2. 6.1 Activity Layer
The activity layer houses activities to be undertaken and they have interdependencies that
are in two forms; serial interdependence and parallel interdependence (Håkansson & Snehota,
1995). Serial interdependence implies that activities have to subscribe to a certain sequence to be
undertaken, which means one activity has to finish first before another starts(Gadde & Amani,
2016). Parallel interdependence involves activities of the same type for example materials handling

11
at a specific stage in the manufacturing and distribution processes. Increasing similarity of
activities enhances the scale of the operations, reducing the cost of the activities.
Coordinating activities is very important in handling interdependencies and the biggest
challenge is handling the combined effect of two interdependencies (Gadde & Amani, 2016).
Organizations try to be as effective as possible on every activity and most times than not tend to
make operations as similar as possible. As this happens, customers on the other hand increasingly
demand for individualized solutions making the situation even more complex. This clearly shows
there need to be a good balance between what the customers need and the operations
available(Håkansson & Snehota, 1995).
2.6.2 Resources Layer
The most important feature in this layer is heterogeneity of resources which means value
of a specific resource element is determined by its utilization(Gadde & Amani, 2016). For
effective resource exploitation deals with resource combination and knowing what type of
resources will be combined is the first issue one has to address. From a network perspective, one
aspect concerns combining firm-internal resources with external resources accessed through others
(Håkansson & Snehota, 1995). For example, Van der Vorst et al. (2007) argued that the first key
decision is determining the key supply chain members with whom to connect to gain access to
their resources. For business in general, external resources have become increasingly important.
The strategic responses to these conditions have been specialization and outsourcing,
making the single company dependent on the resources of business partners (Gadde et al., 2010).
Access to such resources provides consequences in the actor layer, as discussed below. Another
aspect concerns combining physical resources, such as infrastructure, machinery, and vehicles
with organizational resources in terms of knowledge, skills, and intellectual capabilities. The
second issue in resource combining deals with the forms of connections between the resource
elements – or the interfaces between resources (Håkansson et al., 2009). The more two resources
are adapted to each other, the better they will fit together through the improved connection. On the
other hand, resources with such specialized interfaces will be difficult to combine effectively with
other resources. As with activities, there is a trade-off in resource combining between
standardization and individualization requiring managerial handling(Gadde & Amani, 2016).

12
2.6.3 Actor Layer
Engagement of actors enables resources combination and coordination of activities. As the
name suggests, actors act meaning they carry out activities together with other actors. They are
goal oriented and act towards achieving their goals that are transformed into intentions(Håkan,
2011). Actors are individuals or a group of individuals forming say a department or an
organization. The interaction between the actors is of paramount interest for the prosperity of any
business or organization. The interaction can be close and frequent or distant and sparse, with
accompanying consequences in terms of adjusted activities and adapted resources (Gadde &
Amani, 2016). Close and frequent interaction establishes bonds between the actors through the
links between their respective activities and the ties between their resources (Håkansson &
Snehota, 1995). Relationships featuring such patterns are identified as “high involvement”
relationships (Gadde & Snehota, 2000). Distant and sparse interaction implies a “low
involvement” approach, associated with limited actor bonds, resource ties, and activity links.
2.6.4 Approaches to Food Waste Reduction
Extended Shelf Life
Extending shelf life is one of the ways of tackling the food waste problem globally.
Preservation techniques such as chilling, freezing, pasteurization, packaging and sterilization not
only make products last longer but also improve their quality and nutritional value (Gould, 1996).
Lindbom et al. (2014) showed how a dairy producer was able to triple shelf-life for cream
and yogurt through novel packaging techniques. Yogurt features substantial product variety, and
the waste amount varied depending on the demand for the various flavors. For low-demand
yogurts, it was important to capture potential economies of scale. Therefore, these yogurts were
produced in large batches as seldom as possible, which caused waste problems through longer
storage. Accordingly, potential benefits could not be fully exploited since part of the extended
shelf-life was lost through reduced production frequency.
From the perspective of the ARA model, the example illustrates the inter-relations between
the three network layers. Firms tried to reduce the level of waste by modifying the features of the
central resource – the food product. Technological development enabled modifications extending
potential shelf-life. However, the resource layer was also affected by other dynamics, dramatically
increasing product variety regarding product features, packaging sizes, and recipes (Van Donk,

13
2000; Doganis & Sarimveis, 2008). The assortment expansion satisfied customers’ demand for
product differentiation but affected the activity layer in terms of reduced similarity of activities
and lower economies of scale for producers. Extended shelf-life allowed food processors to
improve economies of scale by reducing production frequency, thus increasing the similarities
through larger batches. Yet the same actions reduced actual shelf-life since the imbalance between
production and consumption activities was handled through warehousing. This trade-off between
activities was not entirely negative because inventory-carrying costs in food supply have
traditionally been considered below the cost of lost sales (Ketzenberg & Ferguson, 2008).
The analysis shows that prolonging potential shelf-life does not necessarily affect the
resource layer positively by reducing waste. On the other hand, extended shelf-life may contribute
to efficiency by enabling conditions for increasing the similarity of activities through reduced
production frequency and larger batches. However, complex consumption patterns, together with
a long chain with several storage points, imply that shelf-life extension may not guarantee
consumption before products have reached the “best before date.”
2.7 Existing Solutions
2.7.1 Rescuing Leftover Cuisine
Rescuing Leftover Cuisine is a non-profit food rescue organization, operating in 12 cities
in the United States of America (USA) and headquartered in New York City. It helps manage food
wastage by partnering with hotels that report excess food that is collected and donated to homeless
shelters in the cities they operate in (Rescuing Leftover Cuisine, 2019). More to this, Rescuing
Leftover Cuisine provides services such as food waste consulting, excess food delivery, co-
branding services, and tax credit assistance. It mainly helps manage food waste using three main
approaches;
i. Identify homeless shelters of a needy community and proactively find restaurants, hotels,
and catering companies with excess food in that vicinity that could help support these
disadvantaged communities.
ii. Using a web application, the partner food providers report when excess food is occurring.
The web application is used to engage community members by providing information on
when and where excess food is available.

14
iii. They aim to eliminate as much food waste as possible and bring the remaining excess food
to where it is needed most. They use the data of when food waste occurs in the analysis of
what types of food waste could be avoided, and Rescuing Leftover Cuisine suggests ways
that partner food providers can reduce waste at its root (Rescuing Leftover Cuisine, 2019).
2.7.2 Saving Grace Initiative in Abu Dhabi (UAE)
This is an initiative founded in 2004 by UAE Red Crescent Authority to help reduce food
waste in Abu Dhabi which stands at 19 percent of all waste reaching the country’s landfills
(Todorova, 2013).
The initiative collects leftover food from restaurants, cafes, large gatherings such as
weddings, palaces, hotels and catering companies and distributes it to hundreds of needy families
and labor camps instead of taking it to waste. In 2012, the program delivered 175,000 meals to
needy families and laborers (Pirani & Arafat, 2015).
This solution greatly solves the food waste problem by sharing the left-over food with those
in need. However, it has limitations on the fact that it does not in any way provide data or give
recommendations to the hotels on ways on reducing the food wasted.
2.7.3 Food Panda
This is a global platform that allows people to order for food online. The platform was
founded in 2012 and incorporated as a company and currently has operations in more than 450
cities worldwide with the headquarters sitting at berlin, Germany (Food Panda, 2019). It has
partnered with more than 25000 restaurants worldwide and has a team of about 2500 people spread
across three continents. The platform is available as a web application and as a mobile application.
The user interacts with the platform in four simple steps namely;
i. Search – The user keys in their address and the platform suggests restaurant close to the
area keyed in so the user selects the restaurant he/she desires.
ii. Choose – The user gets a list of foods on the menu of the restaurant selected, the price and
the expected delivery time.
iii. Pay – After the user selects the food, he/she goes ahead and pays via their secure online
platform.

15
iv. Enjoy – After payment is made, the platform prompts for delivery of the food to the user
immediately.
Refer to screenshots of the applications under Appendices
2.7.4 Jumia Food
Jumia Food was formerly known as HelloFood and it enables users to order food online
from a list of several restaurant near them and deliver the food on time. Jumia Food presents online
menus of various restaurants, hotels and coffee shops the user then goes to the website, selects
their present location, select eatery of their choice, browse the menu, place food orders, and waits
to have the food delivered to their doorstep, which may be at home or at work. Payments are made
on delivery either through Mobile payment or cash payment (Jumia, 2019) . Refer to screenshots
of the applications under Appendices
2.8 Gaps and Limitation on Existing Technology
From the literature discussed above, food wastage is a problem globally and Nairobi is no
exception. Most of the existing solutions only help solve delivery of food that the restaurants
prepare for customers. Jumia and Food Panda specifically are e-commerce platforms, with both a
web and a mobile application, that allow restaurants to put up their meals and for users to make
orders online for quick deliveries to their doorsteps. However, they only allow for ordering of
freshly prepared meals only as opposed to excess meals from the restaurants. Which brings out the
gap in that they do not allow restaurants to put up meals that are in excess after their day’s sale or
plate waste for animal food. Rescuing Leftover Cuisine and Saving Grace Initiative solves the food
waste problem as perfectly as this study proposes but there is a gap in that the solution has been
implemented in United States of America and Unite Arabs Emirates respectively and does not
serve Africa leave alone Nairobi, Kenya. More to that, the two programs do not give the hotels
insights that help them better prevent or put measures to reduce food wastage.
2.9 Conclusion
This chapter has had a run through the problem statement, discussing food wastage in the
hospitality industry. The existing solutions and technologies have been reviewed exposing their
limitations and hence paving way for the possibility of adoption of combination of technologies in
the existing models for the proposed system. This being the case, this study came up with an
application that allows restaurants to put out food left over at the end of day for people to book

16
and collect. More to this, the platform offered insights to participating restaurant using collected
data to help them make data driven decisions in their effort to reduce waste in their kitchens.

17
Chapter 3 : Research Methodology
3.1. Introduction
Research design for this study was performed using qualitative and descriptive research
with the location where the study took place being Strathmore University. Purposive sampling was
used to choose the respondents who would participate in the study, and once the data had been
collected and analyzed, the requirements were grouped into functional and non-functional
requirements. The methodology that was used to develop the solution was prototyping.
3.2. Software Methodology
The software methodology used is prototyping model where a prototype (an early
approximation of a final system or product) is built, tested, and then reworked as necessary until
an acceptable prototype is finally achieved from which the complete system or product can now
be developed. The reason for choosing this method is because it ensured that all requirements of
the system were captured gradually during the whole implementation process. Figure 3.1 is a flow
chart showing the steps that were followed in this methodology.
Figure 3.1: Prototyping Model (OMG, 2007)
3.2.1 Planning Phase
This is phase was important in determining what was required to make the study a success.
It laid out the tasks and all the resources needed beforehand to successfully build the system.
3.2.2 Requirements Elicitation
A feasibility study is an assessment of the practicability of a proposed plan, method or a
solution. It was done through reviews of relevant literature on existing systems related to food

18
wastage. The study was performed to analyze and evaluate the impending solution of the proposed
system.
3.3 System Analysis and Design Methods
System analysis and design methods guided the researcher to understand what is needed to
analyze data flow systematically, process data, store data and output information in context of the
study (Kendall & Kendall, 2013).
Unified Modelling Language (UML) was used as the modelling language. This aided in
modelling analysis and design diagrams and make the user requirements clear. Use case
descriptions and diagrams were used to model system functionality. The System Sequence
Diagram modeled the System Flow showing data passing between main entities of the system.
Various entities with corresponding attributes and methods of implementation were modelled
using Class diagrams. The Entity Relationship Diagram was used to model the database showing
tables, attributes and relationships. The Database Schema modeled the table structure showing
fields, data types and descriptions.
3.4 Application Implementation
The prototype comprised of development of a mobile and web application connected to a
central database. Below are approaches that were employed in the development of the application:
i. Mobile Application - the Operating System for the mobile application implementation was
Android. The source code was written in JavaScript using Framework 7 Vue. The
application was compiled using the Android Studio and tested using an Android device.
The application was optimized for Android version 6.0.0 compatible with Android devices
on minimum 5.0.2. JSON was used as the web service that provides the interface between
the Android application and the database.
ii. Web Application - the web-based application was developed using Python programming
language on Django Framework. The website was hosted online on Google App Engine.
Reasons for using Python were; it is an open source platform, it is platform independent; it
supports all major webservers and databases; it has multiple layers of security to prevent
threats and malicious attacks.
iii. Database - the database was developed using the PostgreSQL. The reasons for using
PostgreSQL were; it is an open source platform; it is fully compatible with Python and

19
other platforms; it is secure in that all passwords are encrypted before storage restricting
unauthorized access to the database.
3.5 Application Evaluation and Testing
The prototype went through the following tests to find out whether it is in tandem with the
specified goals of this study:
i) Functional Tests - functional and non-functional tests were performed on the prototype
mobile application using and Android device and a browser for the web application,
ensuring that all requirements are met by the application.
ii) Compatibility Tests - compatibility tests were performed on different mobile and web-
based applications on different Android based platforms and browsers, respectively.
iii) User Tests - these tests were done on the developed application to measure user
satisfaction and collect feedback for refining the prototype. This was done by allowing
different users to use the application then collecting feedback from them.

20
Chapter 4 : System Design and Architecture
4.1 Introduction
This system was designed using Unified Modelling Language and it involved the design
of the system architecture both the front-end and back-end sides of the application outlining the
various requirements needed for the implementation of the application. This involved the
presentation of the context diagrams, sequence diagrams, use case diagrams, entity relationship
diagrams (ERD) and wireframes.
4.2 System Requirements
Below are the functional and non-functional requirements of the system.
4.2.1 Functional requirements
Front-end Functional Requirements
i. Registration – Once the user installs the application on her or his phone, he/she can
register to get a user account. After submitting the details, validation takes place
and the user can login and access all the services on the application.
ii. Login / Log out – The user should be able to login to the system using their user
account details and have access to the list of meals available and place orders.
iii. View meals available – Once a user is logged in, he can browse through the list of
meals available for sale.
iv. Order a meal – Once a user likes a meal, he can place an order for it and this marks
the meal as booked and can be removed from the list of meals available.
v. Pay for a meal – Once the user has placed an order, if the meal is not free but for
sale, the user should be able to pay through the system.
Back-end Functional Requirements
i. Hotel registration – The administrator who is one of the backend users should be
able to register new hotels and provide them a user account.
ii. Upload a meal – the hotels should be able to upload a meal that is available in their
hotels for sale or even to offer for free since it’s the leftovers after a day’s sale.
iii. Delete / edit a meal – the hotels should also be able to edit or delete a meal in case
there is an error in the information provided.

21
iv. Generate reports – the administrator should be able to generate reports from the
system showing informative trends that would be beneficial to these hotels to
reduce food waste.
4.2.2 Non-functional Requirements
i. Security – the system is secure to avoid interception from hackers. User
authentication is key to help make the system secure.
ii. Reliability – the system is highly reliable especially when there is a fault to remain
tolerant even at such an event.
iii. Availability – The system has high availability to allow fast execution of requests
and fast resolution of these requests.
iv. Performance – The general performance of the system is exceptional, with short
time to fetch data from the database and store data to the database.
v. Data retention – the mobile application has a cache to store frequently accessed
data and reduce the number of requests to the database directly.
4.3 System Design
The System Design presented the proposed solution in a logical manner using different
design diagrams. It consists of six components:
i. Data Flow Diagrams
ii. Use Case Diagrams
iii. Entity Relationship Diagram
iv. Sequence Diagram
4.3.1 Data Flow Diagram
A data flow diagrams showed what kind of information would be input to and output from
the system, how the data would advance through the system, and where the data would be stored.
However, it does not show information about the timing of process or information about whether
processes would operate in sequence or in parallel unlike a flowchart which also shows this
information. Figure 4.1 shows the two levels of data flow diagram for the food application.

22
Level 0 Data Flow Diagram (Context diagram)
Figure 4.1: Context Diagram
Level 1 Data Flow Diagram
Figure 4.2: Level 1 Data Flow Diagram
4.3.2 Use Case Diagram
This is a behavioral diagram that shows the functionality provided by a system in terms of
actors, their goals as represented by use cases and any dependencies on those use cases. The main
actors of the system were the hotels that upload meals on the application, customers who booked
23
the meals to pick or get the meals delivered to them and the administrator of the system who
monitors the system and generates reports. Below are the main methods in the system:
i. Login/Log out – users of the system can login and log out of the system.
ii. Upload meals – hotels can upload meals on the platform
iii. View meals available – Customers can view all the meals available on the
application
iv. Order a meal – Customers can place an order for a meal they like
v. Pay for a meal – Customers can pay for meals that are on sale
vi. Edit meal details – hotels can edit meal details posted on the application
vii. Create reports – the administrator can generate reports from the system
viii. Create hotel profiles – The admin can create profiles of hotels in the system so they
can begin uploading meals on to the platform.
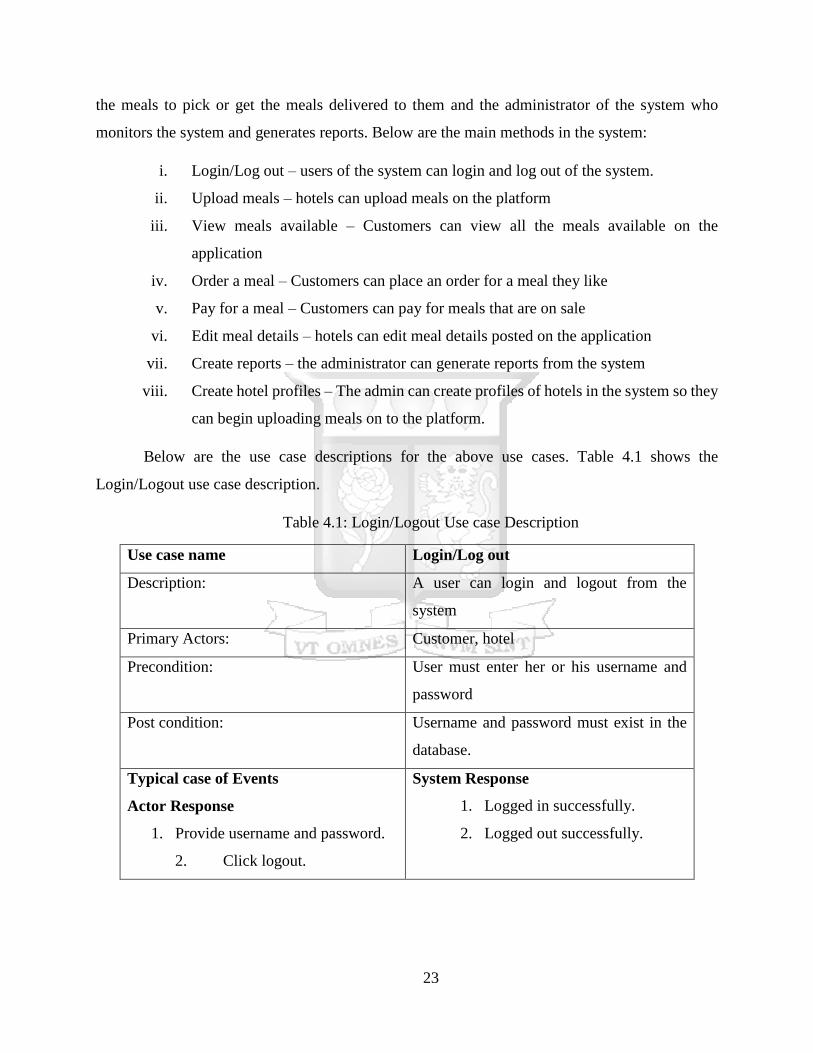
Below are the use case descriptions for the above use cases. Table 4.1 shows the
Login/Logout use case description.
Table 4.1: Login/Logout Use case Description
Use case name Login/Log out
Description: A user can login and logout from the
system
Primary Actors: Customer, hotel
Precondition: User must enter her or his username and
password
Post condition: Username and password must exist in the
database.
Typical case of Events
Actor Response
1. Provide username and password.
2. Click logout.
System Response
1. Logged in successfully.
2. Logged out successfully.

24
Table 4.2: Upload Meals Use Case Table
Use case name Upload meals
Description: Hotel/restaurant uploads leftover meals
available
Primary Actors: Hotel/restaurant
Precondition: Hotel/restaurant must be logged in
Post condition: The available meal table in the database is
updated.
Typical case of Events
Actor Response
1. Details of the meal are added to the
database.
System Response
1. Confirmation message of updated
meal.
The other use case diagrams are illustrated on the Appendices section of this dissertation.
Figure 4.3 shows the use case diagram illustration for the system.
Figure 4.3: Use Case Diagram

25
4.3.3 Sequence Diagram
A sequence diagram is a interaction diagram that shows messages exchanged and their
corresponding occurrence specifications in the lifelines of a system (OMG, 2007). The sequence
diagram on Figure 4.4 shows the messages in the system and the lifelines involved.
Figure 4.4: Sequence Diagram for the Solution
4.3.4 Entity Relationship Diagram
An Entity- Relationship diagram gives an overview of entities such as people, objects or
concepts in a system and how they relate or depend on one another. The entities in this system
were; customer, restaurant, order, meal and bill. Figure 4.5 shows the entity relationship diagram
for the system.

26
Figure 4.5: Entity Relationship Diagram

27
4.3 System Architecture
The front-end user of the system is the customer. He/she is be able to scroll through the
meals put up by hotels and be able to place an order or rather book the food. If the food has been
put up for sale at discounted prices, they are able to make payment via the system.
The back-end users for this system are the hotels uploading the meals on the system and
the system administrator who can monitor the system and generate reports. The hotels are able to
login via the back-end web application and upload meals ready for pick up every day. Once
customers book the meals or place their orders, they can get these notifications and pack the food
ready for pick up.
The administrator is also a back-end user who creates profiles for the hotels that upload the
meals and generate reports from the system.
4.3.1 Three Tier Architecture
This system was built on the three-tier model which has three layers and allows for code
reuse. These layers are;
i. Presentation tier – This is the user interface the user interacts with. It’s the top-level
interface of the system. It is built on a graphic user interface for easy interaction.
ii. Logical tier – This is the layer that controls the applications functionality by
performing detailed processing.
iii. Data tier – This is the tier where information is stored and retrieved. It’s the tier
that keeps data neutral and independent from application servers or business logic.

28
Figure 4.6: Three-tier Architecture (OMG, 2007)

29
Chapter 5 : Prototype Building and Testing
5.1 Introduction
There are three main ways to develop mobile applications, they can be developed as native
applications, web applications or hybrid applications. This variation is brought about by the fact
that cell phones use varied Operating Systems (OS). For example, iPhones use IOS Operating
System, Samsung phones use Android Operating System and Blackberry uses Blackberry
Operating System.
Native applications are developed for a specific target platform, using that platform’s
Software Development Kit (SDK) and frameworks, and the app is tied to that specific phone
Operating System (Ottka, 2015). For example, an Android application is developed with Java
using the Android SDK and the APIs provided by Android and uses platform provided elements
for rendering the UI (Ottka, 2015), same as iOS using Objective-C programming language and
Apple’s framework. The limitation of developing an application natively is having to develop an
application for every platform there is since users will use different phones using varied operating
systems.
Mobile Web applications (Web apps) are implemented using HTML, CSS, and JavaScript,
they use the browser as their runtime environment and thereby capitalize on the good browser
support of mobile platforms (Henning, Hanschke, & Majchrzak, 2013). When using this approach,
developers implement their application as one Web site optimized for mobile devices, which the
Web browser then interprets. Due to the standardized technologies, the Web site can be accessed
in a similar way by mobile browsers on all platforms. However, mobile Web apps cannot use
device specific hardware features such as camera or GPS sensor since they cannot be installed on
the mobile device but are retrieved via a URL.
To resolve the limitations of mobile web applications, while still satisfying the desire to
employ common Web technologies, hybrid approaches emerged as a combination of Web
technologies and native functionality. Their runtime environment largely consists of a Web
rendering engine, wrapped in a native engine. The source code of hybrid apps uses similar
technology like Web apps but additionally has access to an API for platform-specific features. At
runtime, the platform’s Web view—essentially a browser without user controls—interprets the

30
source code to display Web pages. All calls to hardware APIs are relegated to the native wrapper.
Hybrid apps are packaged natively and thus can be (and must be) installed on the device, unlike
Web apps. While their look & feel mostly resembles that of Web apps, they have access to
platform-specific features.
The advantages of hybrid apps are the reasons this application was created using
Framework 7 Vue that is built in JavaScript for the frontend and the backend created using Python
programming.
5.2 Implementation Environment
5.2.1 Hardware Environment
The mobile application runs on Android devices with the following minimum
specifications;
i. Android version 5.0.2
ii. CPU speed 1.3GHz
iii. RAM 2.0GB
iv. Internal Storage 2.0Gb
The web portal runs on any computer with a browser however it is optimized to run on
Google Chrome and Mozilla Firefox browsers.
5.2.2 Software Environment
The mobile application was built for Android platform using JavaScript utilizing
Framework 7 for the user interface. The application was compiled using Cordova and Android
studio Gradle to build the code for the Android platform. The web application for the backend
processes was built using Python on Django framework and Django REST Framework for the API
that the mobile application interacts with. The application data, for both the web application and
mobile application is store in a PostgreSQL database and the application is hosted on Google
Cloud.
5.3 System Implementation
The system was implemented as both an Android mobile application and a website backend
known as Foodie. The website backend enabled the administrator to manage users, meals being
uploaded to the application and view reports which is useful for analysis of the data in the database.

31
5.3.1 Mobile Application
The mobile application allows users to view meals from different restaurants that are
available for ordering. The user can choose the meals they wish to take up and place an order. The
application also allows users to view leftover food from various restaurants that they can place
orders on and give to their animals such as pigs or dogs. From the application, the user can see a
history of their orders and see their profile.
Once a user downloads the application and installs, they first see the splash screen that has
the app logo. The user is then prompted to login to the application of create an account. Once they
have successfully logged into the application, the user is able to see a list of restaurants to choose
from. The user can then select one of the restaurants and see a list of meals available from that
restaurant. The meals are displayed with the discounted amount and the number of plates available.
The user chooses the meal and they are prompted for the number of plates they wish to order, and
they must enter a number smaller or equal to the number of plates available. This is placed on the
cart and the user can continues shopping on the application till they are done. After this they go to
the cart for checkout and they see the total cost and they can make payment. The app has prompt
asking the user if they are sure they want to make a payment to Foodie using MPESA. If they reply
with the affirmative, the payment is recorded in the database and they get information on where to
collect their meals.
System Components
View Restaurants and Meals Available
This screen shows the list of restaurants available in the application with left over meals available
and the meals available. Figure 5.1 shows the view meals available screen of the mobile
application.

32
Figure 5.1: View Restaurants and Meals
Placing a Meal in Your Cart
Figure 5.2 shows the process of placing meals in a cart.
Figure 5.2: Add to Cart Screenshot

33
Orders and Payment
Figure 5.3 shows orders and payment process.
Figure 5.3: Orders and Making Payment
5.4 System Testing
This section describes tests that were performed on both the mobile and web application.
Testing was done on four main areas; functionality tests, usability tests and compatibility tests.
5.4.1 Functional Testing
Functional tests were carried to determine whether the system design and its
implementation was a success or a failure. Different use cases of the system were tested with
results being flagged off as a success or fail. Below are the test cases carried out and their results.
Table 5.1 shows the add restaurant functionality test case.

34
Table 5.1: Add Restaurant Functionality
Utilized use case Add restaurant
Test Parameters Filling a form with details of the restaurant then clicking the submit
button.
Expected Behavior Data is added to the restaurants table in the database successfully
Observed Behavior Data was successfully added to the database
Test Outcome Pass
Table 5.2: Add Meal Functionality
Utilized use case Add meal
Test Parameters Filling a form with details of the meal
Expected Behavior Data is added to the meals table in the database successfully
Observed Behavior Data was successfully added to the database
Test Outcome Pass
Table 5.3: View Restaurant Functionality
Utilized use case View restaurants
Test Parameters After logging in the user sees a list of restaurants
Expected Behavior See a list of restaurants with meals available
Observed Behavior The user can see a list of restaurants to choose from
Test Outcome Pass
Table 5.4: View Meals Functionality
Utilized use case View meals
Test Parameters After logging in and selecting the restaurant, the user sees the meals
available together with the quantities.
Expected Behavior View a list of available meals in the restaurant, quantity available and
price per unit

35
Observed Behavior The user was able to view a list of available meals in the restaurant,
quantity available and price per unit
Test Outcome Pass
Table 5.5: Add Meal to Cart Functionality
Utilized use case Add meal to cart
Test Parameters Select the meal you want, get a prompt to add the quantity you want
then click add to cart
Expected Behavior The meal is successfully added to cart
Observed Behavior The meal was successfully added to cart
Test Outcome Pass
Table 5.6: Checkout Functionality
Utilized use case Checkout
Test Parameters Select cart to see list of items in it
Expected Behavior See a list of items selected on the cart and be able to make payment
and have your order placed
Observed Behavior Payments table and order table should be updated
Test Outcome Pass
Table 5.7: View Animal Food Functionality
Utilized use case View animal food
Test Parameters Login to the mobile app and click the animal food tab
Expected Behavior Get a list of animal food and quantity from different restaurants.
Observed Behavior There was a list of animal food available and quantities
Test Outcome Pass

36
Table 5.8: View Reports Functionality
Utilized use case View reports
Test Parameters Login to the dashboard on the web portal
Expected Behavior Once the dashboard loads, view graphs of the data in the database
Observed Behavior Graphs were present on the on the dashboard page of the web
application
Test Outcome Pass
5.4.2 Usability Testing
End users of the application were involved in usability testing. This group defined the target
population available to use the system. A total of 26 respondents carried out the user testing
practice giving appropriate feedback for the research. 26 respondents were used as these were the
only individuals who created time to be a part of the testing exercise. User testing was done to
achieve the following objectives:
i. User friendliness
ii. functionality
iii. Aesthetics
iv. Acceptance
This section focuses on each of the mentioned objectives in detail. The findings are
presented graphically for an elaborative visual presentation.
i. User Friendliness
The ease of learning and using the application was tested by potential users. The results were
as follows; 90% of the potential users indicated that the application was easy to learn and use.
Figure 5.4 shows a summary of the results.

37
Figure 5.4: User Friendliness Testing
ii. Functionality
Thirty potential users of the application tested the system functionality against the user
specifications. 80% of them indicated that they were very satisfied with the application’s
functionality meaning that the developer achieved most of the user functionality and requirements
specification, 20% indicated that they were satisfied with the application’s functionality meaning
that some of the user specifications were not entirely meet. This result was used to refine the system
until an acceptable application was developed. A summary of the results is shown in Figure 5.5.
Figure 5.5: System Functionality Acceptance Testing
User Friendliness
Good Fair Bad
System Functionality
Yes No

38
iii. Acceptability
To measure if the application was great success user acceptance was tested. 90% of the
potential users gladly accepted the application for use in when looking for affordable food in
restaurants. 10% did not accept the application meaning that there were some aspects about it that
they wish would be different. Since majority of the users gladly accepted the application this test
was a great success. Figure 5.6 provides a summary of these results.
Figure 5.6: Acceptability
iv. Aesthetics
User interface aesthetics is defined by the look and feel of the application design and flow to
its users.84% of the respondents indicated that the application had an attractive presentation. 14%
of the respondents indicated that the application was acceptable while the remaining percentage
indicated that the application was not pleasing to the eyes. A summary of the results can be viewed
in Figure 5.7.
Acceptability
Accept Declined

39
Figure 5.7: User Interface Aesthetics
5.4.3 Compatibility Testing
Compatibility testing was done to ensure that the system; both the mobile and web
application are compatible with the existing platforms. Mobile application was tested on the
existing Android versions while the web application was tested on the all the major web browsers.
Android Platform Testing
The table 5.9 shows tests conducted on predefined and locally available Android platforms.
Table 5.9: Predefined Available Android Operating System Platforms
Android Platform Compatible
Android 7.0 Yes
Android 6.0 Yes
Android 5.0 Yes
84%
14%
12.00%
User Interface Aesthetics
Attractive Presentation Fairly Attractive

40
Web Browser Testing
Table 5.10 shows testing done on available and commonly used web browsers.
Table 5.10: Test Done on Available Browsers
Web Browser Compatibility
Internet Explorer – Version 4 and above Yes
Mozilla Firefox – Version 4 and above Yes
Chrome – all versions Yes
5.5 System Evaluation and Validation
This evaluation was done to ascertain whether the solution helped restaurants with excess
food consumable by humans or animals put it up on the application to help reduce food wastage.
Figure 5.8 shows what the users thought of the implementation and if the system solves the
problem, we can see that majority of the users were very satisfied that the implementation
addresses the problem.
Figure 5.8: Evaluation and Validation of the Solution
5.6 Summary
The system requirement collection stage clarified what functionalities the application
would have. This in turn translated to development of an application that met the set objectives
and the user requirements also. Hence, all the set objectives were met with the implementation of
the application. This was made possible by the methodology used, which allowed iterations while
the product is being implemented to ensure all loopholes are closed and ensure the application is
working as planned.

41
Chapter 6 : Discussions
6.1 Introduction
The aim of this research was to provide a solution to manage the food wastage problem in
the hospitality industry in Kenya. From the research findings, an appropriate solution that involved
developing a mobile application for users who wish to place orders and a web application to upload
food available from the various hotels was created. The web application would be for
administrators of the platform to upload, edit or delete items on the catalogue and also create
accounts for hotels and restaurant to login and check status of their orders. This chapter describes
research findings and achievements, how research objectives were obtained and provides a review
of the application developed, citing advantages and limitations of the developed application.
6.2 Discussion in Relation to Research Objectives
The first objective was to assess the food wastage problem in the hospitality industry and
as discussed in the literature review, food security is still a huge problem in Kenya, and at the same
time, food wastage is also an unsolved problem. Which is ironic, that in a country which is not
able to feed it people sufficiently, it still suffers from food wastage from the little it has. Hotels
serve n-course meals out of which fifty percent of it go to waste, not because the food is non-
consumable, but because it was served at a table but not consumed. Take for instance bread and
butter as a starter, many are the times all bread is not consumed, but when it’s taken back to the
kitchen, it cannot be served to another customer since that is not compliant. So, the bread ends up
in the waste bin, even if it is human consumable.
The second objective was to review the architectures, frameworks and models of existing
food applications in the hospitality industry. There are several applications currently in the
hospitality industry that allow users to order food online and have it delivered to them in the offices
or homes. However, there’s none that allows hotels and restaurants to post their excess food for
users to order. There’s a similar solution though known as Rescuing Leftover Cuisine that is based
in the USA. The solution allows hotels to post their excess food on the platform for donation to
the homeless and children homes. This however has not been implemented in Kenya and that
where the gap is. The models employed in the existing applications has two sections, one that
allows restaurants to report excess food in their kitchens and another that allows users to go through
a catalogue and place an order for any of the meals on the catalogue.

42
The third objective was to create a solution to propose a system that helps manage the food
wastage problem in the hospitality industry. The proposed solution was to create a platform where
hotels and restaurants can report their excess food, whether for human consumption or for animal
consumption and users can access this platform and place an order. Since a huge portion of
residents of Nairobi use smartphones, the solution was a mobile application running on Android
with a web application for administration. Users can login and check meals available at all the
partnering organizations and place an order and all the organizations can report to the administrator
the meals they have available and this can be fed to the web application.
The fourth objective was to validate the system and as discussed in above , the system was
tested on an Android device and a web browser and the results show that the system met the
requirements expected. This validates that the system solves the food wastage problem in the
hospitality industry as was the main objective of this study.
6.3 Advantages of the Application as Compared to the Current System
The applications currently in Kenya only offer a platform where restaurants put up their
meals for sale. They are all e-commerce platforms for food. Foodie has the advantage that it is
solving the food waste problem by allowing restaurants to put up leftover food on the platform that
is either human consumable or for animals. Since the food being put up is not freshly prepared
food, the restaurants can either choose to put it up for free or put it up at huge discounts since the
food would have gone to waste any way. The application is also able to offer reports on the various
dynamics in terms of orders from each restaurant and kind of meals being captured on the website.
With such insights, the restaurants are able to better plan while preparing their meals in the kitchen
to reduce waste.
The application solved the food waste problem, and this is the biggest advantage that the
application over the others. It allows anyone who has access to internet and a smart phone to get
to enjoy food from known restaurants at affordable rates. The application not only allows for
restaurants to put up human consumable food but also animal consumable food. This means 100
percent of the left-over food in restaurants is acceptable on the platform and can be used by either
animal owners, or just people looking to get good meals at a good discount.
Throwing away food has adverse effects to the environment and the application puts the
excess food and left-over food to good use by making it available to people in need of it.

43
6.4 Limitation of the Application
The application has the following limitations:
i. The application is only accessible to Android platform smartphone users
ii. The application requires internet all through to access it.

44
Chapter 7 : Conclusions
7.1 Conclusions
Food wastage is still a huge problem globally and this research was done to create a solution
to help reduce food wastage. The research also sought to find out if the proposed solution, a mobile
application that allows restaurants to report excess food and users to place orders, would be
efficient and acceptable to solve the problem. This study on food waste problem in Kenya is
conclusive on successful implementation and use of the developed application as a tool for
reporting excess food in restaurants and allowing users to book the meals. However, there is still
need for the government to create and implement measures and policies to ensure that the country
has food security and the available food in the ecosystem is not wasted at all.
This study will have impact in the Kenyan industry in that it provides an avenue for
restaurants, hotels, supermarkets and any institution in the hospitality industry to offer food as
donation to the needy for instance children homes or to just citizens who would want to take up
food that is not fresh but still human consumable. Notably, the application also offers a platform
for people who rear animals such as pigs or dogs to take up the expired food, leftover food peeling
and waste from plates for their animals, ensuring that even the waste that would have been left to
the environment to decompose is well utilized.
The study focuses on waste that takes place at the very end of the consumption chain.
However, food wastage happens all throughout the process from when farmers harvest their crops
f to when this harvest gets to the final consumer. Due to limitations of time and resources, this
study focused on the waste that takes place at the final stage of consumption.
7.2 Recommendations
The solution solved the immediate issue of connecting restaurants with excess food with
those in need of it. However, the researcher gave the following recommendations to better improve
the solution:
i. Include a delivery button by partnering with logistics companies such as Sendy to
ensure the food gets to the consumers in time.
ii. Incorporate in-app payment methods for the food being ordered on the application.
iii. Develop for other mobile platforms such as iOS, Blackberry and Windows

45
iv. Develop web application to cater for users using feature phones but have access to
a web browser.
One of the president’s big four agenda is food security, and while this study looks into
ways that can reduce food waste at the consumer stage of the process, there’s need to take care of
the problem from the stage at which farmers harvest to when the food gets to the final consumer.
Studies have shown that more wastage happens at this stage and there is need for further research
to ensure food is reduced at all stages of the process, from the moment food leaves the farms to
the moment it get to the granaries before getting to the final consumer. To achieve this food
security agenda, the government needs to put in place policies that ensures farmers harvests are
well coordinated with the needs of the market and technology can greatly aid in this process to
ensure that at the time the harvest leaves the market, it finds ready market waiting for it and
throughout the transportation process, the viability of the harvest is monitored to reduce wastage
by enduring optimum conditions for the harvest during transit.
There is need for further research into consumer habits and how they lead to food wastage
at any stage of the process and ways they can be influenced to reduce food waste. In addition to
this, it would be helpful to incorporate Internet of Things to the system so that only the food
required is harvested in the farms and delivered to the restaurants to ensure only what is needed is
delivered.
7.3 Suggestions for Future Research
The researcher recommends that for future research, the hospitality industry should be able
to collect data of the eating habits of their customers, frequency on every day of the month to their
institutions and using this data, they will be able to prepare the exact amount of food required with
little or no waste. This will ensure that the farmers will only deliver to these institutions what they
require for that particular time and this will further reduce the wastage from farm products going
bad while in the granary.
Food security is still a huge problem globally, ironically, food waste is also a huge problem
at the same time with the developed countries having the biggest share of the problem. There is
need to bridge the gap through further studies to identify cultural and behavioral habits that may
lead to food wastage and ways these can be influence outside of technology.

46
There is also opportunity for further studies to identify legal implications of restaurants
putting up their excess food up for sale at a discount. In an event that a consumer gets affected by
this food, does the law protect the restaurant that put up the meal or does it protect the consumer?
This would be an interesting study since it could be the reason restaurants have not get warmed up
to the idea of sharing their excess food with people who might be in need of it.

47
References
Block, L. G., Keller, P. A., Williamson, S., Vallen, B., Birau, M. M., Grinstein, A., . . . Tangari,
A. H. (2016). The Squander Sequence: Understanding Food Waste at Each Stage of the
Consumer Decision Making Process. Journal of Public Policy & Marketing. 35.
10.1509/jppm.15.132. .
Chrisafis, A. (2016, February 2016). French law forbids food waste by supermarkets . Retrieved
from The Guardian: https://www.theguardian.com/world/2016/feb/04/french-law-forbids-
food-waste-by-supermarkets
Deutsche Welle. (2019, April 29). Food for thought on World Environment Day. Retrieved from
The GLOBAL IDEAS Blog: http://blogs.dw.de/globalideas/food-for-thought-on-world-
environment-day
FAO. (2013). Food wastage footprint: Impacts on natural resources. Rome: FAO.
FAO. (2019, April 29). SAVE FOOD: Global Initiative on Food Loss and Waste Reduction.
Retrieved from Food and Agriculture Organisation of the United Nations:
http://www.fao.org/save-food/resources/keyfindings/en/
Food Panda. (2019, April 29). Food Panda. Retrieved from Food Panda Foodora:
https://www.foodora.com/
Gadde, L.-E., & Amani, P. (2016). Food supply in a network context: An alternative framing and
managerial consequences in efforts to prevent food waste. British Food Journal, Vol. 118
Issue: 6, https://doi.org/10.1108/BFJ-10-2015-0401, 1407-1421.
Gould, G. W. (1996). Methods for preservation and extension of shelf life. International Journal
of Food Microbiology, 51-64.

48
Hakansson, H., & Snehota, I. (1995). Developing Relationships in Business Networks. London and
Newyork: Routledge.
Heitk¨otter, H., Hanschke, S., & Majchrzak, T. A. (2013). Evaluating Cross-Platform
Development Approach for Mobile Development. Web Information Systems and
Technologies, 8th International Conference (pp. 1-20). Porto, Portugal: Springer Berlin
Heidelberg.
Jumia. (2019, April 29). Jumia Food. Retrieved from Jumia Food Kenya: https://food.jumia.co.ke/
Kasim, A. (2007). Towards a Wider Adoption of Environmental Responsibility in the Hotel Sector.
International Journal of Hospitality & Tourism Administration, 25-49.
Kenya Association of Hotel-Keepers and Caterers. (2019, April 29). KAHC Members Directory.
Retrieved from Kenya Association of Hotel-Keepers and Caterers: http://kahc.co.ke/kahc-
members-directory.php
Lipinski, B., Hanson, C., Lomax, J., Kitinoja, L., Waite, R., & Searchinger, T. (2013, June).
Reducing food loss and waste. Installment 2 of “Creating a Sustainable Food Future” by
World Resources Institute, pp. 1-33.
Munro, H., Mirosa, M., Mangan-Walker, E., & Pearson, D. (2016). Reducing waste of food left
on plates: Interventions based on means-end chain analysis of customers in foodservice
sector. British Food Journal, 2326 - 2343.
Obi, L. (2017, May 14). A third of the world’s food goes to waste after harvest. Nairobi, Kenya.
Retrieved from https://www.nation.co.ke/lifestyle/dn2/world-s-food-goes-to-waste-after-
harvest/957860-3927024-15gw5nw/index.html
OMG. (2007). Specification. A UML Profile for MARTE, Beta 1.

49
Othman, R., & Abdul-Ghani, R. (2008). Supply chain management and suppliers' HRM practice.
Supply chain management and suppliers' HRM practice, 259-262 .
Ottka, S. (2015). Comparison of mobile application development tools for multi-platform
industrial applications. Masters Thesis, Aalto University, School of Science, Espoo.
Retrieved April 29, 2019, from
https://aaltodoc.aalto.fi/bitstream/handle/123456789/16008/master_Ottka_Sanna_2015.p
df?sequence=1
Parfitt, J., Barthel, M., & Macnaughton, S. (2010, September 27). Food waste within food supply
chains: quantification and potential for change to 2050. Philosophical Transactions of the
Royal Society B: Biological Sciences.
Pirani, S., & Arafat, H. A. (2015). Reduction of Food Waste Generation in the Hospitality. Journal
of Cleaner Production, 129 - 145.
Principato, L., Secondi, L., & Pratesi, C. A. (2015). Reducing food waste: an investigation on the
behaviour of Italian youths. BRITISH FOOD JOURNAL, 731-748.
Rescuing Leftover Cuisine. (2019, April 29). Rescuing Leftover Cuisine. Retrieved from Rescuing
Leftover Cuisine: https://www.rescuingleftovercuisine.org/
Resource Efficient Scotland; Natural Scotland; Catering Equipment Suppliers Association. (2012).
Managing Food Waste in the Hospitality and Food Service Industry. London: Resource
Efficient Scotland.
Snehota, I. (2011). New business formation in business networks. The IMP Journal, 1-9.
Stop Wasting Food Movement. (2019, April 29). Food Waste Facts. Retrieved from Stop Wasting
Food Movement: http://stopwastingfoodmovement.org/food-waste/food-waste-facts/

50
Todorova, V. (2013, July 8). Safe to eat leftovers served to most needy across Abu Dhabi. Abu
Dhabi, UAE. Retrieved from https://www.thenational.ae/uae/safe-to-eat-leftovers-served-
to-most-needy-across-abu-dhabi-1.338188
Ventour, L. (2018). The food we waste . Banbury: Material Change for Better Environment.

51
Appendices
Appendix A: Use Case Diagrams
Appendix A.1 shows the view meals available use case description.
Appendix A.1: View Meals Available Use Case Table
Use case name View meals available
Description: Customers can view the meals available in
the various restaurants/ hotels
Primary Actors: Customer
Precondition: Customer must be logged in and the meals
table should have data.
Post condition: Customer must select a hotel
Typical case of Events
Actor Response
1. Select a restaurant to view the
meals.
System Response
1. Show all the meals available in that
restaurant.
Appendix A.2 shows the user description for ordering a meal.
Appendix A.2: Order Meals Use Case Table
Use case name Order a meal
Description: Customers can order a meal
Primary Actors: Customer
Precondition: Customer must be logged in and select a
restaurant.
Post condition: Customer must place meals on a cart
Typical case of Events
Actor Response
System Response
1. Customer gets a notification that
the order has been placed.

52
1. Selects meals to take and places on
a cart to place an order
2. Application prompts for payment
details.
Appendix A.3 shows the use case description for editing meal details.
Appendix A.3: Edit Meals Details Use Case Table
Use case name Edit meal details
Description: The admin and restaurant contact persons
can edit the meal details.
Primary Actors: Admin, restaurant
Precondition: Admin/restaurant must be logged in
Post condition: The meal table in the database is updated.
Typical case of Events
Actor Response
1. Selects a meal to edit and puts
amends to it.
System Response
1. User gets a confirmation message
that the update has been effected.
Appendix A.4 shows the use case description for viewing reports.
Appendix A.4: View Reports Use Case Table
Use case name View reports
Description: Restaurants can view reports on the meals
and orders made.
Primary Actors: Admin, restaurant admin
Precondition: Users must be logged in
Post condition: Users are able to view the reports of the
meals and orders by restaurant
Typical case of Events
Actor Response
1. Logging to the dashboard of the
backend
System Response
1. Shows all reports by restaurant

53
Appendix A.5 shows the use case description for creating restaurant profiles.
Appendix A.5: Create Restaurants Profiles Use Case Table
Use case name Create restaurant profiles
Description: Admin can create restaurant profiles so that
they are able to share meals on the
application.
Primary Actors: admin
Precondition: Must be logged in
Post condition: Restaurants table is updated
Typical case of Events
Actor Response
1. Admin add the details of the
restaurant to the database
System Response
1. System sends a notification that the
restaurant has been added.

54
Appendix B: Screenshots of Existing Solutions
The screenshots below are of a mobile application, Food Panda, that allows users to make
orders for freshly prepared food on the application and have it delivered to the customer’s doorstep.
Appendix B.1: Screenshot of the FoodPanda Web Application
The screenshots below are of an application used largely in Kenya named Jumia Food. Through
the application, users can order for freshly prepared food from the application and track it being
delivered.

55
Appendix B.2: Screenshots of Jumia Mobile application

56
Appendix C: Screenshots Foodie Application
The screenshot below is of Foodie app, and it illustrated the splash screen and the login
pages of the application.
Appendix C.1: Splash screen and Login screen
The screen shot below of the Foodie application show how a user is able to view a list of
all the listed restaurants and can choose the restaurant they wish to place an order with.

57
Appendix C.2: Restaurant and meal available
The screenshot below shows the process of placing the food you wish to get on a cart for
ordering.
Appendix C.3: Placing an order on the application

58
The screenshot below shows the orders one has placed and the cart that is currently empty.
Appendix C.4: Viewing orders and adding to orders to a cart

59
The screenshot below shows the analytics done on the back end of the system.
Appendix C.5: Analytics Report

60
Appendix D: Questionnaire
Dear Respondent,
I am a Masters student in the Faculty of Information Technology, Strathmore University
conducting a research entitled “a mobile application that helps manage food wastage problem in
the hospitality industry in Nairobi”
You have been selected to form part of this study. I kindly request you to complete the
questionnaire below. The information requested is needed for academic purposes only and will be
treated in strict confidence.
Kind Regards,
Bettirose Ngugi.
* Required Fields
SECTION A: BACKGROUND INFORMATION
1. What is your gender? * Mark only one
oval.
Male
Female
2. What is your age group? * Mark only
one oval.
1317
1824
2534
3554
55+
3. What is your relationship status? *
Mark only one oval.

61
Married
Single
Dating
4. What is your occupation? * Mark only
one oval.
Employed
Student
None
SECTION B: Food Waste
5. Have you experienced food waste?
* Mark only one oval.
YES
NO
6. If YES, where?
Mark only one oval.
At home
Restaurant
Event e.g. wedding
School Cafeteria
7. Was the food that went to waste human consumable?
Mark only one oval.
Yes
No
8. Would be comfortable ordering left over food from restaurants that is still high quality and
human consumable?

62
Mark only one oval.
Yes
No

63
Appendix E: Usability Testing and Validation Questionnaire
Section A: Usability Testing
A1. How do you find the user interface of the mobile application based on its look and
feel? (Choose ONE)
o Attractive
o Average
o Not Attractive
A2. Rate the mobile application based on whether the application was easy to learn and
use as a first time user? (Choose ONE)
o Good
o Fair
o Bad
A3. Rate the system functionality based on whether it met the user requirements? (Choose
ONE)
o Yes
o No
A4. Would you use the mobile application in ordering left over food from restaurants?
(Choose ONE)
o Yes
o No
Section B: Validation Testing
B1. Do the functionalities provided by the application solve the food waste problem?
(Choose ONE) *
o Yes
o No
B2. Are you satisfied with solution provided by the application as far as capturing left over
food from restaurant and put it up for sale at discounted rates is concerned? (Choose ONE)*
o Yes
o No
B3. Would you recommend other people to use the application? (Choose ONE)*

64
o Yes
o No

65
Appendix F: Turn it in results
Appendix F.1: Turn it in results
Copyright © 2022 FDOKUMEN


![Credit card guarantees: Reservation policy implications at fine dining restaurants [Conference Presentation]](https://static.fdokumen.com/doc/165x107/6331d35ab6829c19b80bac75/credit-card-guarantees-reservation-policy-implications-at-fine-dining-restaurants.jpg)