A methodology for eliciting, representing, and analysing stakeholder knowledge for decision making...
17
A methodology for eliciting, representing, and analysing stakeholder knowledge for decision making on complex socio-ecological systems: From cognitive maps to agent-based models Sondoss Elsawah a, b, d, * , Joseph H.A. Guillaume a, b , Tatiana Filatova c, 1 , Josefine Rook a , Anthony J. Jakeman a, b a Integrated Catchment Assessment and Management (iCAM), Fenner School of Environment and Society, the Australian National University, Australia b National Centre for Groundwater Research and Training (NCGRT), School of the Environment, Flinders University, GPO Box 2100, Adelaide, SA 5001, Australia c University of Twente, Faculty of Management and Governance (MB), Twente Centre for Studies of Technology and Sustainable Development (CSTM) & Research Institute Deltares, The Netherlands d University of New South Wales, School of Engineering and InformationTechnology, Australian Defence Force Academy, NorthCott Drive, Campbell, Canberra, Australia article info Article history: Received 23 June 2014 Received in revised form 19 November 2014 Accepted 25 November 2014 Available online Keywords: Mental models Qualitative information Quantitative models Decision making Human-environment systems abstract This paper aims to contribute to developing better ways for incorporating essential human elements in decision making processes for modelling of complex socio-ecological systems. It presents a step-wise methodology for integrating perceptions of stakeholders (qualitative) into formal simulation models (quantitative) with the ultimate goal of improving understanding and communication about decision making in complex socio-ecological systems. The methodology integrates cognitive mapping and agent based modelling. It cascades through a sequence of qualitative/soft and numerical methods comprising: (1) Interviews to elicit mental models; (2) Cognitive maps to represent and analyse individual and group mental models; (3) Time-sequence diagrams to chronologically structure the decision making process; (4) All-encompassing conceptual model of decision making, and (5) computational (in this case agent- based) Model. We apply the proposed methodology (labelled ICTAM) in a case study of viticulture irrigation in South Australia. Finally, we use strengths-weakness-opportunities-threats (SWOT) analysis to reflect on the methodology. Results show that the methodology leverages the use of cognitive map- ping to capture the richness of decision making and mental models, and provides a combination of divergent and convergent analysis methods leading to the construction of an Agent Based Model. © 2014 Elsevier Ltd. All rights reserved. 1. Introduction Managing complex socio-ecological systems, such as occur in water resource management, is a multi-actor, multi-scale, and dy- namic decision making process: Multi-actor: actors (e.g. resource consumers, policy makers, managers) employ different strategies and decisions to satisfy their goals and interests. Goals, preferences, and perceptions of the resources differ across and also within actor groups. Such heterogeneity cannot be represented by an average actor for each group, which makes agreements on resource man- agement more difficult to reach (Barreteau et al., 2001; An, 2012). Multi-scale: the complex behaviour of socio-ecological systems is strongly driven by the collective outcomes of decisions made by actors at multiple levels of the system (e.g. individuals, group, organizational). For example, regulations (among other factors) affect individual behaviour, and individual behaviour affects the resource state (Chave and Levin, 2003). * Corresponding author. Integrated Catchment Assessment and Management (iCAM) Centre, The Fenner School of Environment & Society, Room G1.09, Building 48A, The Australian National University, Canberra, ACT 0200, Australia. Tel.: þ61 (0) 2 6125 9021. E-mail address: [email protected] (S. Elsawah). 1 Postal address: P.O. Box 217, 7500 AE Enschede, The Netherlands. Tel.: þ31 53 489 3530; fax: þ31 53 489 4850. Contents lists available at ScienceDirect Journal of Environmental Management journal homepage: www.elsevier.com/locate/jenvman http://dx.doi.org/10.1016/j.jenvman.2014.11.028 0301-4797/© 2014 Elsevier Ltd. All rights reserved. Journal of Environmental Management 151 (2015) 500e516
-
Upload
independent -
Category
Documents
-
view
0 -
download
0
Transcript of A methodology for eliciting, representing, and analysing stakeholder knowledge for decision making...
lable at ScienceDirect
Journal of Environmental Management 151 (2015) 500e516
Contents lists avai
Journal of Environmental Management
journal homepage: www.elsevier .com/locate/ jenvman
A methodology for eliciting, representing, and analysing stakeholderknowledge for decision making on complex socio-ecological systems:From cognitive maps to agent-based models
Sondoss Elsawah a, b, d, *, Joseph H.A. Guillaume a, b, Tatiana Filatova c, 1, Josefine Rook a,Anthony J. Jakeman a, b
a Integrated Catchment Assessment and Management (iCAM), Fenner School of Environment and Society, the Australian National University, Australiab National Centre for Groundwater Research and Training (NCGRT), School of the Environment, Flinders University, GPO Box 2100, Adelaide, SA 5001,Australiac University of Twente, Faculty of Management and Governance (MB), Twente Centre for Studies of Technology and Sustainable Development (CSTM) &Research Institute Deltares, The Netherlandsd University of New South Wales, School of Engineering and Information Technology, Australian Defence Force Academy, NorthCott Drive, Campbell,Canberra, Australia
a r t i c l e i n f o
Article history:Received 23 June 2014Received in revised form19 November 2014Accepted 25 November 2014Available online
Keywords:Mental modelsQualitative informationQuantitative modelsDecision makingHuman-environment systems
* Corresponding author. Integrated Catchment A(iCAM) Centre, The Fenner School of Environment & S48A, The Australian National University, Canberra, ACT2 6125 9021.
E-mail address: [email protected] (S. E1 Postal address: P.O. Box 217, 7500 AE Enschede, T
489 3530; fax: þ31 53 489 4850.
http://dx.doi.org/10.1016/j.jenvman.2014.11.0280301-4797/© 2014 Elsevier Ltd. All rights reserved.
a b s t r a c t
This paper aims to contribute to developing better ways for incorporating essential human elements indecision making processes for modelling of complex socio-ecological systems. It presents a step-wisemethodology for integrating perceptions of stakeholders (qualitative) into formal simulation models(quantitative) with the ultimate goal of improving understanding and communication about decisionmaking in complex socio-ecological systems. The methodology integrates cognitive mapping and agentbased modelling. It cascades through a sequence of qualitative/soft and numerical methods comprising:(1) Interviews to elicit mental models; (2) Cognitive maps to represent and analyse individual and groupmental models; (3) Time-sequence diagrams to chronologically structure the decision making process;(4) All-encompassing conceptual model of decision making, and (5) computational (in this case agent-based) Model. We apply the proposed methodology (labelled ICTAM) in a case study of viticultureirrigation in South Australia. Finally, we use strengths-weakness-opportunities-threats (SWOT) analysisto reflect on the methodology. Results show that the methodology leverages the use of cognitive map-ping to capture the richness of decision making and mental models, and provides a combination ofdivergent and convergent analysis methods leading to the construction of an Agent Based Model.
© 2014 Elsevier Ltd. All rights reserved.
1. Introduction
Managing complex socio-ecological systems, such as occur inwater resource management, is a multi-actor, multi-scale, and dy-namic decision making process:
ssessment and Managementociety, Room G1.09, Building0200, Australia. Tel.: þ61 (0)
lsawah).he Netherlands. Tel.: þ31 53
� Multi-actor: actors (e.g. resource consumers, policy makers,managers) employ different strategies and decisions to satisfytheir goals and interests. Goals, preferences, and perceptionsof the resources differ across and also within actor groups.Such heterogeneity cannot be represented by an average actorfor each group, which makes agreements on resource man-agement more difficult to reach (Barreteau et al., 2001; An,2012).
� Multi-scale: the complex behaviour of socio-ecological systemsis strongly driven by the collective outcomes of decisions madeby actors at multiple levels of the system (e.g. individuals, group,organizational). For example, regulations (among other factors)affect individual behaviour, and individual behaviour affects theresource state (Chave and Levin, 2003).

S. Elsawah et al. / Journal of Environmental Management 151 (2015) 500e516 501
� Dynamic and constantly adaptive: the goals and decision rulesof actors change over time. Actors adapt to changes by learningfrom experience (Sterman, 2000).
This work is motivated by the need to understand and incor-porate human elements (e.g. perceptions, decisions, and actions)into decision making and modelling in complex socio-ecologicalsystems (Janssen, 2002). This need has been supported by find-ings in a range overlapping fields related to decision support forcomplex socio-ecological systems, such as: evidence-based plan-ning, systems resilience, social learning, risk management, decisionscience, and Agent Based Models (ABMs). Their argument can besummarised in four points.
First, people's decisions and actions influence resource usedirectly and indirectly. To change resource-user behaviour and in-fluence the resource dynamics, policies need to understand andtarget factors that influence how people make decisions, how theirdecisions affect the biophysical environment, and the feedbackeffects on future decisions. As Ludwig et al. (1993) point outmanaging natural resources is about managing people rather thanthe resource. Failure to account for micro-level decision making indesigning policies may result in policy-resistant situations wherethe system's response to the policy implementation defeats thedesign purpose (e.g. increase in water prices to manage demandmay lead to an increase in water use by increasing illegal connec-tions to the supply system). In the resilience literature, under-standing and unlocking human elements is a key mechanism forbuilding the adaptive capacity of socio-ecological systems towithstand shocks, and to transform to more resilient futures(Vespignani, 2012).
Second, decision making (intuitive and deliberative) is influ-enced by the implicit and explicit theories that individuals andgroups have about how the world works, should work, and theeffects of actions on things they value (Argyris and shὅn, 1978).When individuals and groups make decisions to satisfy their ownshort term personal interests, this may often lead to long termresource overexploitation and the collapse of dependent economicand ecological systems, a situation commonly known in naturalresource management as resource dilemmas (Moxnes, 1998).Explicitly expressing decision making and underlying assumptions,in a transparent way, gives decision makers an opportunity to:reflect on their practices, explicitly link actions and effects, and seethe rationale behind other's practices. This fosters individual andgroup learning, and improves the prospects for communication,negotiation, trust-building, and hence, collective action (Pahl-Wostl et al., 2007).
Third, whereas there is a wide recognition of the role that in-tegrated modelling and decision support tools can play in inform-ing policy making and stakeholder communication, they are oftencriticised for their limited capacity to address the sheer complexityof the human and social dimensions of complex systems (D€oll et al.,2013). There have been calls to move beyond simple treatments ofhuman response as an input model scenario, or single parameter,and simplistic rational assumptions about human cognition andbehaviour (Pahl-Wostl, 2007a). Forrester (1992) argued that it isnot sufficient to model a “particular decision”, but modellers needto capture and represent the decision rules or guiding protocolsthat generate a flow of decisions.
Finally, to increase a model's perceived utility and adoption ofresults, in particular for non-experts, modelling needs to link to theuser's “reality”, that is, their description of how the systemworks. Ifend users cannot see the relevance of the model to their dailypractices because the model is opaque, and/or the model collideswith how they think and act, there is a greater chance that userswill end up losing confidence in the model. Therefore, there is
scepticism in some modelling literature, for example (Sterman,2000), of the utility of models that embody decision rules thatare not based on empirical study of actual decision making.
A key challenge for addressing these needs is bridging the gapbetween capturing the highly qualitative, subjective and rich na-ture of people's thinking and translating it into formal quantitativedata to be used in decision support tools (Kok, 2009). In light of this,the contribution of this paper is to present a step-wise methodol-ogy for bringing in the perception of stakeholders (qualitative) intoformal simulation models (quantitative) with the ultimate goal ofimproving learning and communication about decision making incomplex systems. This paper has three main objectives:
� Present the methodology (ICTAM) to elicit, represent, and un-derstand individual decision making. It combines a qualitative/soft problem structuring technique (i.e. cognitive mapping) andnumerical models, in this case ABMs.
� Use a case study to understand land and water use decisionmaking in that context, viticulture irrigation, and draw widerlessons from it.
� Reflect on the use of the methodology, using strengths-weakness-opportunities-threats (SWOT) analysis.
The paper is organised around the above objectives. In the nextsection, we present the concepts and methods that we use indeveloping and implementing our methodology. In Section 3, wepresent the step-wise methodology. In Section 4, we use a casestudy to demonstrate the proposed methodology. We reflect on thedesign and implementation of the process in Section 5.
2. Concepts and methods
2.1. Decision making and mental models
Decision making theories are broadly classified into normativeand descriptive perspectives. Classical decision theories articulatehow people “should” make rational decisions. On the other side,descriptive and behavioural decision theories describe how peopleactually make decisions under inevitable limitations (e.g. infor-mation, cognitive, and time constraints). The latter perspective isespecially vital for environment management where actor's de-cisions and actions substantially influence the resource behaviourand outcomes of management policies (Viscusi and Zeckhauser,2006). Instead of cherishing normative assumptions about how apolicy will work, effective planning needs to be informed by anunderstanding of how actors actually make decisions, and howtheir decisions may affect and be affected by changes in resourcestate and planned policies.
Mental models are a descriptive decision theory for explaininghow people make decisions based on how they perceive theirsurrounding world (Craik, 1943; Johnson-Laird, 1983). They arecognitive constructs that people use when perceiving and inter-preting information as a basis for decisions and behaviours. Mentalmodels have the following features (Rouse and Morris, 1986). Theyare:
� subjective;� encompassing of our ideas, perceptions, and beliefs about howthe world works, e.g. cause and effect links;
� incomplete, flawed, and sometimes inconsistent, representa-tion, especially when representing complex systems;
� context-specific and dynamic; people build their mental modelsbased on a particular situation at a particular point of time. Astime passes and context changes, people perceive new infor-mation, and update their mental models;
S. Elsawah et al. / Journal of Environmental Management 151 (2015) 500e516502
� not consciously known by their owners;� hard to access, because of our limited capacity to verbalise ourmental models; and there is an unavoidable risk of changingmental models when we try to access them;
� not inclusive of the affective elements of decision making, suchas emotions.
Mental models have been used in many applied research fields,including: risk communication (e.g.Morgan et al., 2001), learningand education (e.g.Elsawah et al., 2013), humanemachine in-teractions (e.g.Faber et al., 2013), and natural resourcemanagement(e.g.Kolkman and Van der Veen, 2005). There exists a number ofuseful reviews on the progress done onmentalmodelling in variousfields. For example, Jones et al. (2011) give an interdisciplinarysynthesis of theory and methods, with special focus on naturalresourcemanagement applications. Doyle and Ford (1998) flesh outthe concept of a mental model, and how it has been used in dy-namicmodelling. Langan-Fox et al. (2000) shed light on approachesfor eliciting and analysing team mental models.
2.2. Cognitive mapping
Cognitive mapping is a causal mapping technique that isinvoked to represent how an individual perceives a particular issueor system. A cognitive map can be seen as a visual representation ofa person's mental model about a particular issue or situation at aparticular point of time. The term “cognitive map” goes back toTolman (1948), who first used it to describe the mental constructs(in the same sense of a mental model) that human and animals useto navigate alternative pathways. Axelrod (1976) was the first to usecognitive mapping as a method to understand decision making.Since then, cognitive mapping has been exploited in many areasrelated to decision making, such as strategic management (Edenand Ackermann, 1998), organizational change (Narayanan andFahey, 1990), marketing (Reynolds and Gutman, 2001), and natu-ral resource management (Kolkman and Van der Veen, 2005).
In this work, we use Eden's cognitive mapping approach. Eden'smapping approach is grounded on Kelly's Personal Construct The-ory (PCT) (Kelly, 1955). According to the PCT, people continuallydevelop and revise hypothesis depending on how they reasonabout a situation. There are fundamental differences betweenEden's cognitive mapping approach, and other mapping tech-niques, such as mind mapping (Buzan, 1993), even though both usenodes to represent ideas or concepts that a person thinks relevantto a situation. A cognitive map is a hierarchical network of nodesand arrows that represents chains of arguments in the format ofmeans and ends. For example, certain conditions might lead tothese decisions, which in turn might lead to these outcomes. Incognitive maps, whenever possible, ideas are to be formulated asbi-polar statements “A rather than B”. This format gives richness tothe map by capturing individual's preferences, and diversity ofperceptions. Concepts are formulated as “action oriented” state-ments which are clear about the action, and who makes the action.Arrows represent implication, not causality, to capture ambiguitiesabout defining links, and are interpreted as “may lead to”. Anegative link implies that the first pole of the tail statement “maylead to” the second pole of the head statement. Eden and Acker-mann (2010), for example, wrote in length about the theoreticalframework underpinning their cognitive mapping approach.
Cognitive mapping can be used in four ways (Ackermann andEden, 2010): (1) to elicit, represent, and sometimes compare, in-dividual mental models (e.g. Hjortsø, 2004); (2) to support a groupworking on strategy development or analyse a complex issue (e.g.Eden and Ackermann, 2004); (3) to inform quantitative modelbuilding (e.g. El Sawah et al., 2011; Giordano et al., 2013); and (4) to
support the structural analysis of large maps. This paper usescognitive mapping to elicit and represent individual mental modelsas a basis for developing numerical Agent-based Models.
To help visualise the concept of cognitive mapping, we usedcognitive mapping rules to present our mental model of the paper'sobjectives and rationale (See Fig. 1). The paper's ultimate goal is tocontribute to improving learning and communication in complexsocio-ecological systems (concept 1 in Fig. 1). We think that modelsand decision support tools are useful means of supporting this goal(concepts 2 and 3). The use of models depends on their capacity toeffectively capture the complexity of decision making (concept 5),and how relevant and useful model users perceive them to be(concept 4). As discussed earlier, we think the success of modelsand users' perceptions of model's utility will improve if we canbetter incorporate the subjective and highly qualitative nature ofdecision making into formal and numerical modelling (concepts 5and 6). Concepts (7e15) outline our proposed methodology interms of key requirements, methods used, and underpinningassumptions.
2.3. Agent based modelling
ABM is widely used in many fields such as ecology (Grimm andRailsback, 2005), the social sciences (Bonabeau, 2002) includingeconomics (Arthur, 1999; Tesfatsion, 2006), and to study the dy-namics of coupled human-environment systems (Parker et al.,2002; Veldkamp and Verburg, 2004; Filatova et al., 2014).
An ABM represents a system as many autonomous interactingagents, which adapt and co-evolve based on the informationreceived from the environment and each other. ABMs may inte-grate elements of micro-simulation, analytical, mechanistic, sta-tistical, and other data-basedmodels. Their main added value in theworld of simulation techniques is twofold: (1) their capacity torepresent behaviour of human actors more explicitly by modellingof bounded rationality, heterogeneity, interactions, evolutionarylearning and outeof equilibrium dynamics; and (2) their ability tostudy feedbacks between heterogeneous agents and a dynamicheterogeneous representation of the environment. On the other,ABMs are often criticised for their intensive data and computationalresource requirements (Kelly et al., 2013).
Similar to other simulation-based approach, there are two viewsof the role that ABMs can play in studying the dynamics of socialsystems: “models as microworlds”, and “models as boundary-ob-jects” (Zagonel, 2002). According to themicroworld view, an ABM isdeveloped to “objectively” understand how the system “functions”under different scenarios to evaluate policy consequences (e.g.Zhaoet al., 2013). On the other, an ABM can be used as a boundary-objectto help stakeholders negotiate their subjective views and reach ashared understanding (e.g.Barreteau et al., 2001; Pooyandeh andMarceau, 2013).
In regard to how ABMs represent the decisionmaking process ofagents, decisions may be modelled either in a normative or positivefashion, that is, either prescribing how decisions should ideally bemade, or describing how they are actually made. Often, these twoare combined: a scholar often extends a conventional theory ofdecision-making, which might be normative, by relaxing its as-sumptions in the directions that coincide with the most relevantobserved empirical facts and phenomena (i.e. moving towards apositive representation). Thus, ABM studies regularly present abenchmark case, which is designed in accordance with a conven-tional models of how agents should behave (i.e. normative) if theyare rational and have unlimited computational abilities and perfectaccess to information (Axtell, 2005). In addition, several ABM ex-periments are run under more realistic (i.e. positive) assumptionsregarding agents' behaviour (Filatova et al., 2011). Thus, macro-
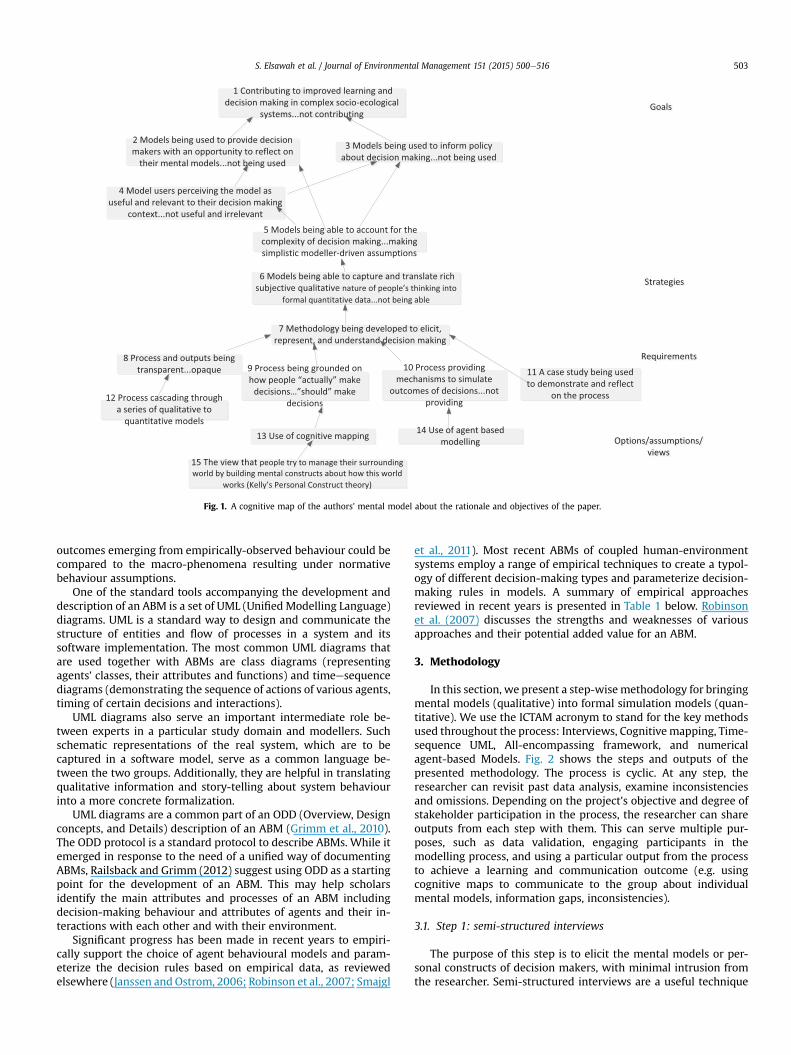
Fig. 1. A cognitive map of the authors' mental model about the rationale and objectives of the paper.
S. Elsawah et al. / Journal of Environmental Management 151 (2015) 500e516 503
outcomes emerging from empirically-observed behaviour could becompared to the macro-phenomena resulting under normativebehaviour assumptions.
One of the standard tools accompanying the development anddescription of an ABM is a set of UML (Unified Modelling Language)diagrams. UML is a standard way to design and communicate thestructure of entities and flow of processes in a system and itssoftware implementation. The most common UML diagrams thatare used together with ABMs are class diagrams (representingagents' classes, their attributes and functions) and timeesequencediagrams (demonstrating the sequence of actions of various agents,timing of certain decisions and interactions).
UML diagrams also serve an important intermediate role be-tween experts in a particular study domain and modellers. Suchschematic representations of the real system, which are to becaptured in a software model, serve as a common language be-tween the two groups. Additionally, they are helpful in translatingqualitative information and story-telling about system behaviourinto a more concrete formalization.
UML diagrams are a common part of an ODD (Overview, Designconcepts, and Details) description of an ABM (Grimm et al., 2010).The ODD protocol is a standard protocol to describe ABMs. While itemerged in response to the need of a unified way of documentingABMs, Railsback and Grimm (2012) suggest using ODD as a startingpoint for the development of an ABM. This may help scholarsidentify the main attributes and processes of an ABM includingdecision-making behaviour and attributes of agents and their in-teractions with each other and with their environment.
Significant progress has been made in recent years to empiri-cally support the choice of agent behavioural models and param-eterize the decision rules based on empirical data, as reviewedelsewhere (Janssen and Ostrom, 2006; Robinson et al., 2007; Smajgl
et al., 2011). Most recent ABMs of coupled human-environmentsystems employ a range of empirical techniques to create a typol-ogy of different decision-making types and parameterize decision-making rules in models. A summary of empirical approachesreviewed in recent years is presented in Table 1 below. Robinsonet al. (2007) discusses the strengths and weaknesses of variousapproaches and their potential added value for an ABM.
3. Methodology
In this section, we present a step-wisemethodology for bringingmental models (qualitative) into formal simulation models (quan-titative). We use the ICTAM acronym to stand for the key methodsused throughout the process: Interviews, Cognitivemapping, Time-sequence UML, All-encompassing framework, and numericalagent-based Models. Fig. 2 shows the steps and outputs of thepresented methodology. The process is cyclic. At any step, theresearcher can revisit past data analysis, examine inconsistenciesand omissions. Depending on the project's objective and degree ofstakeholder participation in the process, the researcher can shareoutputs from each step with them. This can serve multiple pur-poses, such as data validation, engaging participants in themodelling process, and using a particular output from the processto achieve a learning and communication outcome (e.g. usingcognitive maps to communicate to the group about individualmental models, information gaps, inconsistencies).
3.1. Step 1: semi-structured interviews
The purpose of this step is to elicit the mental models or per-sonal constructs of decision makers, with minimal intrusion fromthe researcher. Semi-structured interviews are a useful technique
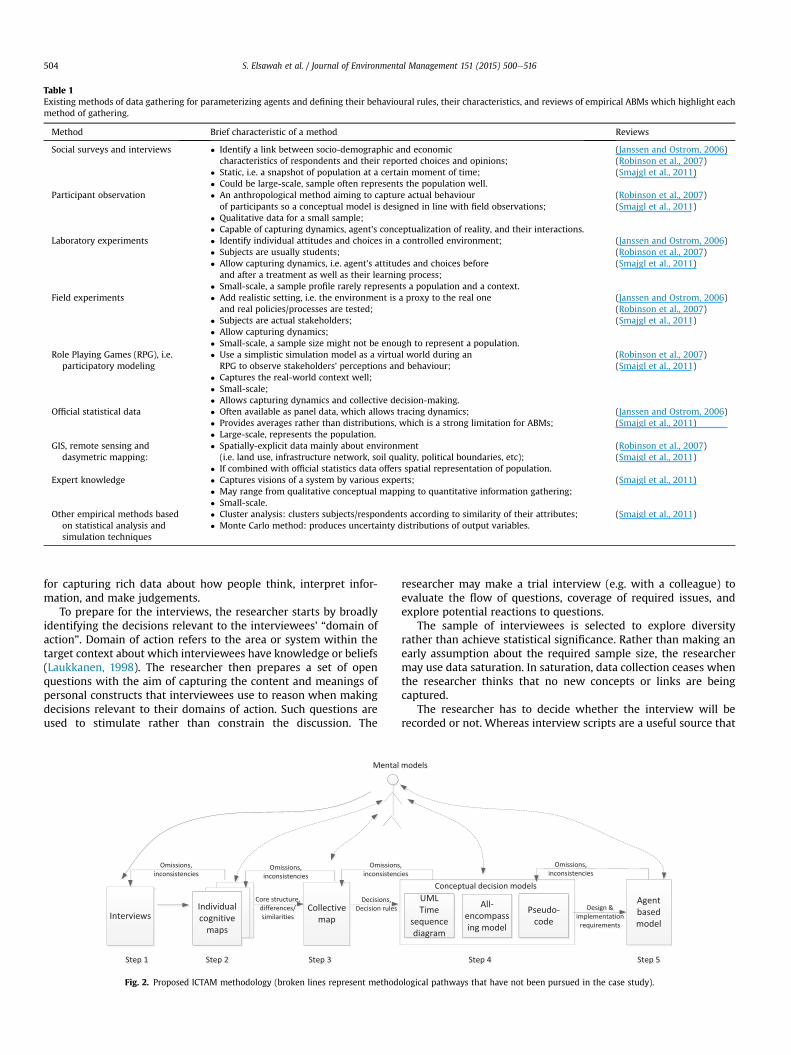
Table 1Existing methods of data gathering for parameterizing agents and defining their behavioural rules, their characteristics, and reviews of empirical ABMs which highlight eachmethod of gathering.
Method Brief characteristic of a method Reviews
Social surveys and interviews � Identify a link between socio-demographic and economiccharacteristics of respondents and their reported choices and opinions;
� Static, i.e. a snapshot of population at a certain moment of time;� Could be large-scale, sample often represents the population well.
(Janssen and Ostrom, 2006)(Robinson et al., 2007)(Smajgl et al., 2011)
Participant observation � An anthropological method aiming to capture actual behaviourof participants so a conceptual model is designed in line with field observations;
� Qualitative data for a small sample;� Capable of capturing dynamics, agent's conceptualization of reality, and their interactions.
(Robinson et al., 2007)(Smajgl et al., 2011)
Laboratory experiments � Identify individual attitudes and choices in a controlled environment;� Subjects are usually students;� Allow capturing dynamics, i.e. agent's attitudes and choices before
and after a treatment as well as their learning process;� Small-scale, a sample profile rarely represents a population and a context.
(Janssen and Ostrom, 2006)(Robinson et al., 2007)(Smajgl et al., 2011)
Field experiments � Add realistic setting, i.e. the environment is a proxy to the real oneand real policies/processes are tested;
� Subjects are actual stakeholders;� Allow capturing dynamics;� Small-scale, a sample size might not be enough to represent a population.
(Janssen and Ostrom, 2006)(Robinson et al., 2007)(Smajgl et al., 2011)
Role Playing Games (RPG), i.e.participatory modeling
� Use a simplistic simulation model as a virtual world during anRPG to observe stakeholders' perceptions and behaviour;
� Captures the real-world context well;� Small-scale;� Allows capturing dynamics and collective decision-making.
(Robinson et al., 2007)(Smajgl et al., 2011)
Official statistical data � Often available as panel data, which allows tracing dynamics;� Provides averages rather than distributions, which is a strong limitation for ABMs;� Large-scale, represents the population.
(Janssen and Ostrom, 2006)(Smajgl et al., 2011)
GIS, remote sensing anddasymetric mapping:
� Spatially-explicit data mainly about environment(i.e. land use, infrastructure network, soil quality, political boundaries, etc);
� If combined with official statistics data offers spatial representation of population.
(Robinson et al., 2007)(Smajgl et al., 2011)
Expert knowledge � Captures visions of a system by various experts;� May range from qualitative conceptual mapping to quantitative information gathering;� Small-scale.
(Smajgl et al., 2011)
Other empirical methods basedon statistical analysis andsimulation techniques
� Cluster analysis: clusters subjects/respondents according to similarity of their attributes;� Monte Carlo method: produces uncertainty distributions of output variables.
(Smajgl et al., 2011)
S. Elsawah et al. / Journal of Environmental Management 151 (2015) 500e516504
for capturing rich data about how people think, interpret infor-mation, and make judgements.
To prepare for the interviews, the researcher starts by broadlyidentifying the decisions relevant to the interviewees' “domain ofaction”. Domain of action refers to the area or system within thetarget context about which interviewees have knowledge or beliefs(Laukkanen, 1998). The researcher then prepares a set of openquestions with the aim of capturing the content and meanings ofpersonal constructs that interviewees use to reason when makingdecisions relevant to their domains of action. Such questions areused to stimulate rather than constrain the discussion. The
Fig. 2. Proposed ICTAM methodology (broken lines represent method
researcher may make a trial interview (e.g. with a colleague) toevaluate the flow of questions, coverage of required issues, andexplore potential reactions to questions.
The sample of interviewees is selected to explore diversityrather than achieve statistical significance. Rather than making anearly assumption about the required sample size, the researchermay use data saturation. In saturation, data collection ceases whenthe researcher thinks that no new concepts or links are beingcaptured.
The researcher has to decide whether the interview will berecorded or not. Whereas interview scripts are a useful source that
ological pathways that have not been pursued in the case study).

S. Elsawah et al. / Journal of Environmental Management 151 (2015) 500e516 505
a researcher can revisit for their analysis, some people may not feelcomfortable talking freely when the recorder is switched on. If theinterviewer feels this might be the case, he/she should not recordthe interview, or offer to turn the recorder off upon the in-terviewee's request. This can be balanced by an effective note-taking practice, where the interviewer tries not to “mentally fil-ter” data by rewording concepts. Interviews are recorded only afterseeking consent from interviewees. The social science and actionresearch literature provides a wealth of resources on the scienceand art of designing and running interviews (e.g.Corbin andStrauss, 2008).
It is useful to have two or three interviewers with each oneassigned a clear role and tasks before the interview. For example,one person can run the interview in order to build rapport, one cantake notes in order to provide interim transcriptions, and one candraw ad-hoc cognitive maps, each of which can help to raisequestions where there are gaps to be filled or clarifications needed.Roles may be re-assigned from one interview to another.
Between interviews, the research team should secure time toreflect on the collected data, and modify the interviewing tech-nique or questions. This might include identifying questions thatwere misunderstood, and need rewording, modifying the priorityof questions, developing new questions to redirect the interviewand address issues that need to be considered in more depth, andidentifying new perspectives to address.
3.2. Step 2: individual cognitive map
The purpose of this step is to use cognitive mapping to representindividual decision making. There are two ways of developingcognitive maps. The first is online mapping where the researcherdevelops the cognitive map “on the go”. This requires good map-ping and interviewing skills, especially in the case of one-on-oneinterviews. The second is offline mapping where the researcherrecords interviews, and develops the map from the interviewtranscript afterwards.
Eden and Ackermann (1998) give a step-by-step guide on therules of building cognitive maps. In the case of using cognitivemapping to inform decision and action modelling, a useful guide-line is to frame statements (as far as possible) in terms of who takesan action, what action is taken and when this action is triggered.Second, statements need to be framed to explicitly capture ele-ments of decisions making, such as: perceiving information,forming judgements and forming expectations. Several mappingtools can be used, such as MS Visio, and Decision Explorer (www.banxia.com).
The structure and content of cognitivemapsmay be validated bysharing them with interviewees, and seeking their feedback. Ifmaps are developed online, then the interviewer can share them atthe end of the interview if time is available. Otherwise, if possible, afollow-up interview may be scheduled.
3.3. Step 3: collective map
The purpose of this step is to merge individual cognitive mapsinto a collective map in order to develop a single unifying view thatencompasses individual views. To help structure the collective mapand define the key issues that determine decision making, it isuseful to start by identifying goals and core concepts. Goals arehead nodes that have no outgoing links. Goals are placed at the topof the collective map.
Core concepts or ‘head nodes’ link together a cluster of nodes,representing a sub-issue. There are two ways/types for identifyingcore concepts:
1. Content-based concepts, which are core because of the meaningof the concept and its relevance to decision making
2. Structure-based concepts, which are core because of their linksto other concepts, as determined by results from the domain,centrality analysis, and feedback (Eden, 2004; Howick et al.,2008).a. In domain analysis, the immediate or local domain of con-
cepts is examined by calculating the number of incoming andoutgoing arrows directly linked to a concept. This gives anindication of the complexity of links to this concept. Therationale is that people talk more about issues that areimportant for them.
b. Complementary to domain analysis, centrality analysis goesbeyond the immediate domain of a concept to examine thecomplexity of links at a number of levels away from theconcept.
c. Feedback analysis is a useful means of identifying key con-cepts and links that need to be included in the collective map.Feedback loops may imply an interesting source of dynamicinteraction between the decision maker and their environ-ment. Of special interest, learning is an essential feedbackmechanism for understanding how people make decisions incomplex and dynamic situations. In small size maps (<100nodes), feedback loops can be identified visually. In large sizemaps, the Decision Explorer software tool can be used to runthe analysis.
Following the links from core concepts and feedback loops helpsidentify ‘triggering concepts’ or ‘source nodes’, which have noincoming arrow, or exogenous factors. Triggering concepts are ofspecial importance in decision making and ABM as they representthe contextual (e.g. changes in climate conditions) and internal (e.g.personal interest and experience) drivers that affect the actor'sdecisions.
The collective map needs to capture similarities as well as dif-ferences among interviewees' mental models. Whereas similaritiesprovide the shared elements in the decision making process, dif-ferences help identify different agent types. Calculating the fre-quency of occurrence of core concepts gives a good indication ofhow this issue is shared among interviewees. Comparing the chainof arguments linked to the core concepts generates insight into thedifferent views surrounding the issue (Eden and Ackermann, 2004).
Moreover, researcher's insights, gained through the interviewsand data analysis, provide a useful input for spotting differences.For example, the researcher may have noticed that a particularsocio-economic characteristic (e.g. household or farm size) isinfluential. In this case, the researcher may add a concept to themap, e.g. “household/farm size being small… big”, and link it to theother relevant concepts. It may be helpful if the researcher keepstrack of such added concepts, and the rationale behind addingthem, in order that they be validated with interviewees.
3.4. Step 4: conceptual decision models
In this step, the collective map is used to develop a sequence ofconceptual decision models. The conceptual models are transitionobjects between conceptual and numerical modelling. They pro-vide more formal implementation-based descriptions of the deci-sion making process. Three sub-steps are undertaken as a part ofthis:
Step 4.1: the purpose of this step is to translate information fromthe collective map to develop a structure for how agents makedecisions. Collective maps give information about:
S. Elsawah et al. / Journal of Environmental Management 151 (2015) 500e516506
(1) types of decisions and actions taken (from the coreconcepts)
(2) who makes a decision (content of the concepts)(3) factors that influence decisions (chain of nodes from source
nodes to the core concepts)(4) information feedback (from the feedback analysis)
The decision making structure is represented by a UML time-esequence diagram that abstracts all functions required to representdecisions identified in the collective map. The diagrams maps outthe chronological sequence of activities that constitute the decisionmaking process, the conditions under which these activities takeplace, and their outcomes. At a very abstract level, the function is tobe seen in terms of three basic elements: information input, pro-cessing, and output. Unlike cognitive and collectivemapping, time isan explicit dimension in theUMLdiagram. The focus is on the logicalflow of information from one function to another. The researchermay revisit the interview scripts and/or individual cognitive maps ifthey think that some information is missing or ambiguous.
Step 4.2: the purpose of this step is to develop an all-encompassing conceptual model to transfer all qualitative in-formation to an ABM framework. This is a divergent-thinkingexercise where researchers go through the timeesequence di-agram and identify what models and data are required toimplement these functions. This step forces the modeller to beexplicit about the transition from qualitative to quantitativemodels. Assumptions and simplifications need to be trans-parent, and checked for consistency with the qualitative data. Inthis step, it is essential to have input from all members in theresearch team. ABM experts provide input about the ABMmodelling and the technical requirements of implementation,while interviewers and mapping analysts provide insights intocapturing the richness of the decision making process.Step 4.3: in this step, ABM modellers develop a pseudo-coderepresentation identifying the defining parts of the conceptualmodel (developed in step 4.2) to be implemented. This is aconvergent-thinking process, including only aspects that arenecessary and practical to implement for a particular use of anABM. While it is possible to create the pseudo-code directlyfrom Step 4.1, the inclusion of Step 4.2 creates awareness of whataspects of the elicited decision making process are beingomitted. This allows reflection on the effect theymight have hadon model outcomes, and makes it easier to develop additionalpseudo-code representations, for instance to explore the effectof uncertainty in model structure on predictions.
3.5. Step 5: an agent based model
The purpose of this step is to use the conceptual decisionmaking to create a detailed agent model that can be executed. Thepseudo-code is translated into an actual code implementation. AnABM can be coded under various platforms (CORMAS, Netlogo,Repast, Matlab, etc.) or languages (e.g. Cþþ, Java, Python). For theinner working of the model, this step involves using additionalquantitative data (from literature reviews, other interviews andsurveys, expert knowledge) to specify thresholds and functionalforms of certain functions used by ABM agents.
4. Case study: viticulture irrigation in Mclaren Vale, SouthAustralia
This work was undertaken in the context of a broader projectthat aims to support revision of groundwater management plan-ning in McLaren Vale, South Australia. The project uses systems
thinking techniques and tools to help stakeholder groups thinkabout the system-wide effects of policies and decisions, explorepossible changes to address existing issues, and improve anticipa-tion of future issues. The McLaren Vale region covers an area ofapproximately 320 square kilometres. The predominant land use isviticulture, irrigated with groundwater and recycled water.Groundwater has been regulated by a groundwater allocation plansince 1999. In an earlier phase of the project, we used a rapidappraisal approach to understand groundwater issues in the area(El Sawah et al., 2011). This raised issues that included the need toconsider the operational impact of policy, account for social andeconomic aspects, and address the perceived gap between plandevelopment and plan administration (e.g. as expressed by anec-dotal evidence of difficulties in trading water). These are preciselythe issues that require understanding of decision making processesas described in the introduction.
The use of the methodology described in this paper was deter-mined by a number of contextual factors. Modelling is seen as acentral part of understanding groundwater dynamics, such that themodelling of decision making processes is necessary in order toincorporate groundwater users' effect on the aquifer. The spatio-temporal distribution of pumping has varying local impacts ongroundwater levels and salinity and therefore ecosystems and in-dividual wells, such that there is a need to consider individualdecision making. ABMs are naturally suited for this purpose. Theproject's emphasis on helping stakeholder groups think about theirsystem required that any modelling be demonstrably grounded inlocal conditions, even if the results eventually coincided with aca-demic literature. We had established a relationship with govern-ment agencies and community members that allowed the potentialfor in-depth one-to-one interviews. These in-depth interviewsmade explicit an individual's private views and behaviours andtherefore make them vulnerable to potential abuse of that infor-mation. We felt that earlier activities showed that intervieweestrusted us and other participants such that they felt comfortablesharing in-depth details. This provided the need and opportunityfor building ABMs through interviews. If there had been conflictbetween stakeholders or they did not trust us, we might haveproceeded differently.
4.1. Step 1: individual on-farm interviews
We conducted in depth semi-structured interviews with 10farmers from the irrigation area in August 2012. Communitymembers in the steering committee that was set up for the projecthelped organize interviews with growers and wineries. In-terviewees were selected to represent different farm types (grapegrowers and wineries, corporate and family business), farm size(small and big), and irrigation sources.
The interview script was structured into two parts which aim toelicit (See Appendix A):
(1) Broad views and perceptions on howwater is managed in thebasin, and their suggestions for improving the managementsystem
(2) Decisions that farmers make as a part of managing theirvineyards, with a special focus on irrigation and groundwateruse. The mapping and analysis presented in this paper focuson the first part.
Interviews were run at interviewees' vineyards. The researchteam included three interviewers; each one assigned the rolesdescribed in Section 3.1. During interviews, we used a crop calendarfor interviewees to explain what and how they make decisionsduring the growing season.
Table
2Anex
tractfrom
afarm
er'sprofile
dev
elop
edaftertheinterviews.
Participan
tMyPU
RPO
SEis
Iam
doingthis
ACTIVITY
Iam
concern
edab
out
theseISSU
ES(alongwithcausallinks
topurpose)
Forim
provingsystem
man
agem
ent,Iwou
ldsu
ggest
(includes
ACTO
R)
Therearefactorsin
the
ENVIRONMEN
T,whichsh
apes
myACTIVTY
Inee
dthis
KNOW
LEDGE/
INFO
RMATION
tocarry
outmyACTIVITY
Ithinkother
stak
eholder
grou
ps
NEE
Dto
THIN
K/
LEARN/KNOW
abou
tFa
rmer
1Kee
pthewine-mak
ing
family
business
Growingwine-grap
ecrop
sDecisionstake
nas
apartof
this:
Whether
tore-estab
lishthe
viney
ardor
maintain
curren
ton
e?(scale:10
e12
years,bloc
k)W
hat
crop
varietyto
grow
?(scale:10
e12
years,bloc
k)W
hen
topickupthecrop
?(scale:season
al)
Cropproductivity,
issu
esincluding
-crop
quality
-crop
yield
-inve
stmen
tpay
back
period
-capital
and
running
costs
Gov
ernmen
tnee
dsto
metre
andlic
ence
stoc
kan
ddom
estic
bores
Improve
irriga
tors
understan
ding
abou
ttheirbo
res,an
dhow
they
fit
into
thesystem
Betterway
sto
enga
geirriga
tors
(e.g.o
ne-to-onemee
tings
rather
than
flye
rs)
Longterm
clim
ateco
nditions
Wea
ther
conditionsduringthe
grow
ingseason
,W
inegrap
emarke
t,W
ineryproduct
specification
sW
ater
allocation
Water
price
Theprocessingtime
forwater
tran
sfer
applic
ations
One-to-O
neen
gage
men
tis
thebe
stway
for
improving
understan
dingan
dad
option
ofstrategy
S. Elsawah et al. / Journal of Environmental Management 151 (2015) 500e516 507
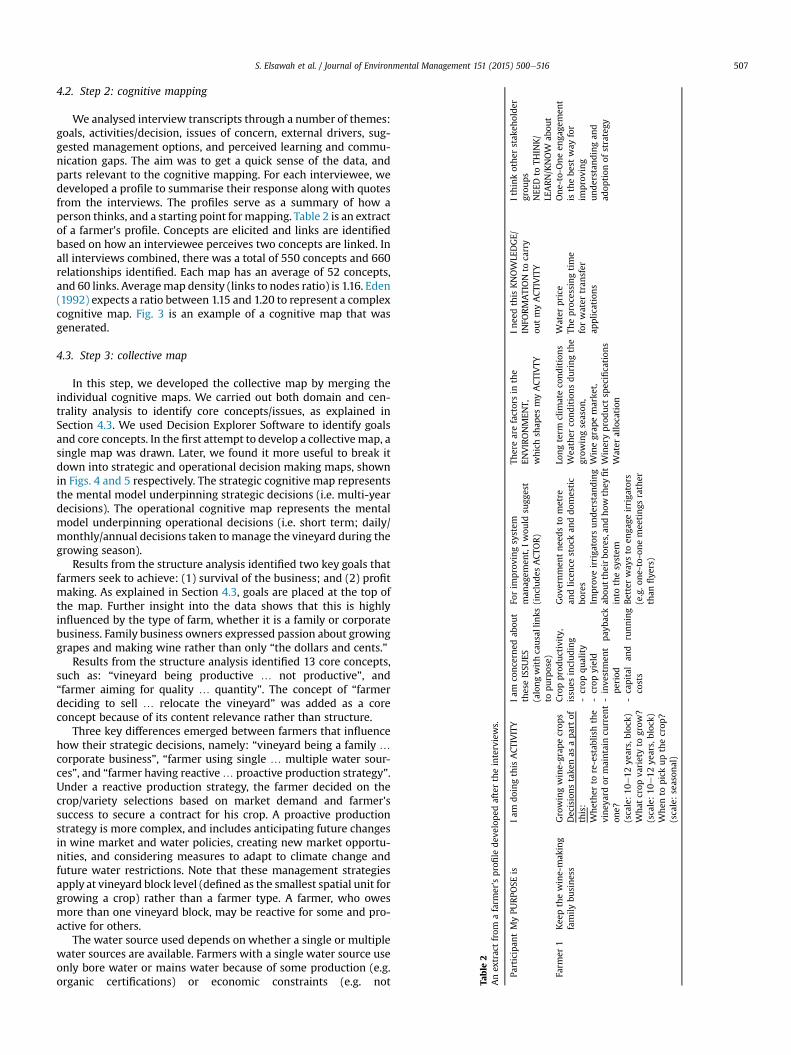
4.2. Step 2: cognitive mapping
We analysed interview transcripts through a number of themes:goals, activities/decision, issues of concern, external drivers, sug-gested management options, and perceived learning and commu-nication gaps. The aim was to get a quick sense of the data, andparts relevant to the cognitive mapping. For each interviewee, wedeveloped a profile to summarise their response along with quotesfrom the interviews. The profiles serve as a summary of how aperson thinks, and a starting point formapping. Table 2 is an extractof a farmer's profile. Concepts are elicited and links are identifiedbased on how an interviewee perceives two concepts are linked. Inall interviews combined, there was a total of 550 concepts and 660relationships identified. Each map has an average of 52 concepts,and 60 links. Averagemap density (links to nodes ratio) is 1.16. Eden(1992) expects a ratio between 1.15 and 1.20 to represent a complexcognitive map. Fig. 3 is an example of a cognitive map that wasgenerated.
4.3. Step 3: collective map
In this step, we developed the collective map by merging theindividual cognitive maps. We carried out both domain and cen-trality analysis to identify core concepts/issues, as explained inSection 4.3. We used Decision Explorer Software to identify goalsand core concepts. In the first attempt to develop a collectivemap, asingle map was drawn. Later, we found it more useful to break itdown into strategic and operational decision making maps, shownin Figs. 4 and 5 respectively. The strategic cognitive map representsthe mental model underpinning strategic decisions (i.e. multi-yeardecisions). The operational cognitive map represents the mentalmodel underpinning operational decisions (i.e. short term; daily/monthly/annual decisions taken tomanage the vineyard during thegrowing season).
Results from the structure analysis identified two key goals thatfarmers seek to achieve: (1) survival of the business; and (2) profitmaking. As explained in Section 4.3, goals are placed at the top ofthe map. Further insight into the data shows that this is highlyinfluenced by the type of farm, whether it is a family or corporatebusiness. Family business owners expressed passion about growinggrapes and making wine rather than only “the dollars and cents.”
Results from the structure analysis identified 13 core concepts,such as: “vineyard being productive … not productive”, and“farmer aiming for quality … quantity”. The concept of “farmerdeciding to sell … relocate the vineyard” was added as a coreconcept because of its content relevance rather than structure.
Three key differences emerged between farmers that influencehow their strategic decisions, namely: “vineyard being a family …
corporate business”, “farmer using single … multiple water sour-ces”, and “farmer having reactive… proactive production strategy”.Under a reactive production strategy, the farmer decided on thecrop/variety selections based on market demand and farmer'ssuccess to secure a contract for his crop. A proactive productionstrategy is more complex, and includes anticipating future changesin wine market and water policies, creating new market opportu-nities, and considering measures to adapt to climate change andfuture water restrictions. Note that these management strategiesapply at vineyard block level (defined as the smallest spatial unit forgrowing a crop) rather than a farmer type. A farmer, who owesmore than one vineyard block, may be reactive for some and pro-active for others.
The water source used depends on whether a single or multiplewater sources are available. Farmers with a single water source useonly bore water or mains water because of some production (e.g.organic certifications) or economic constraints (e.g. not

Fig. 3. An example of a participant's cognitive map.
S. Elsawah et al. / Journal of Environmental Management 151 (2015) 500e516508
economically viable to access recycled water). Multiple-sourceirrigation includes two types:
� Farmers using bore water as a main irrigation source, with thepotential of connecting to the recycled water network in thefuture to top up their supply “just in case” (e.g. due to future cutsin water allocations)
� Farmers using recycled water as a main irrigation source andkeeping some bore water “just in case” (e.g. degradation inrecycled water quality)
As shown in Fig. 4, farmers show two different views aboutinvesting in Managed Aquifer Recharge (MAR). Some farmersperceive an opportunity of capturing and storing runoff water. Theyare interested to know more information about the technical re-quirements, regulation, and economic viability of the investment.On the other side, some farmers are not interested in MAR becausethey personally had heard about bad experiences with MAR.
4.4. Step 4: conceptual decision model
In step 4.1, we translated the information from the strategic andoperational collective maps into a series of UML timeesequencediagrams (See Figs. 6 and 7). Fig. 6 is developed from the opera-tional decision making collective map. It depicts the sequence ofactivities that farmers make during the growing season. Informa-tion from the crop calendar used during the interviews
complemented the collective map about the start and end date ofactivities.
As shown in Fig. 6, farmers decide to irrigate if they think thatthe amount of water available for the crop is not sufficient. Farmersfactor in information from different sources to make their judge-ment. Information sources vary from simple visual inspection of thecrop, to weather data, and soil moisture tests. The weight of in-formation sources depends on subjective factors (e.g. experience),which are captured in the individual cognitive maps. Whereas thesame decision process is repeated monthly, farmers' judgementabout the crop sensitivity to soil moisture stress varies according tothe growing stage of the crop. As the crop approaches the ripeningstage (November to January), water shortage may cause seriousdamage for the crop, in particular impacting quality, which isparamount for crop pricing. These months of the year are whengroundwater irrigation peaks, particularly during dry years.Farmers update their water budget monthly, and calculate howmuch water they may still need during the irrigation season, givenwhat they already have. If farmers sense a possible shortage, theywill start exploring other irrigation options, such as trading (ifpossible). Otherwise, they may consider selling their waterallocation.
For step 4.2, we went through a divergent thinking exercise todevelop an all-encompassing model for translating the UML dia-grams to the ABM framework (See Table 3). As a result, we cata-logued possible implementations for specifying the UMLtimeesequence diagrams, along with resources required forimplementation, such as: quantitative data, complementary
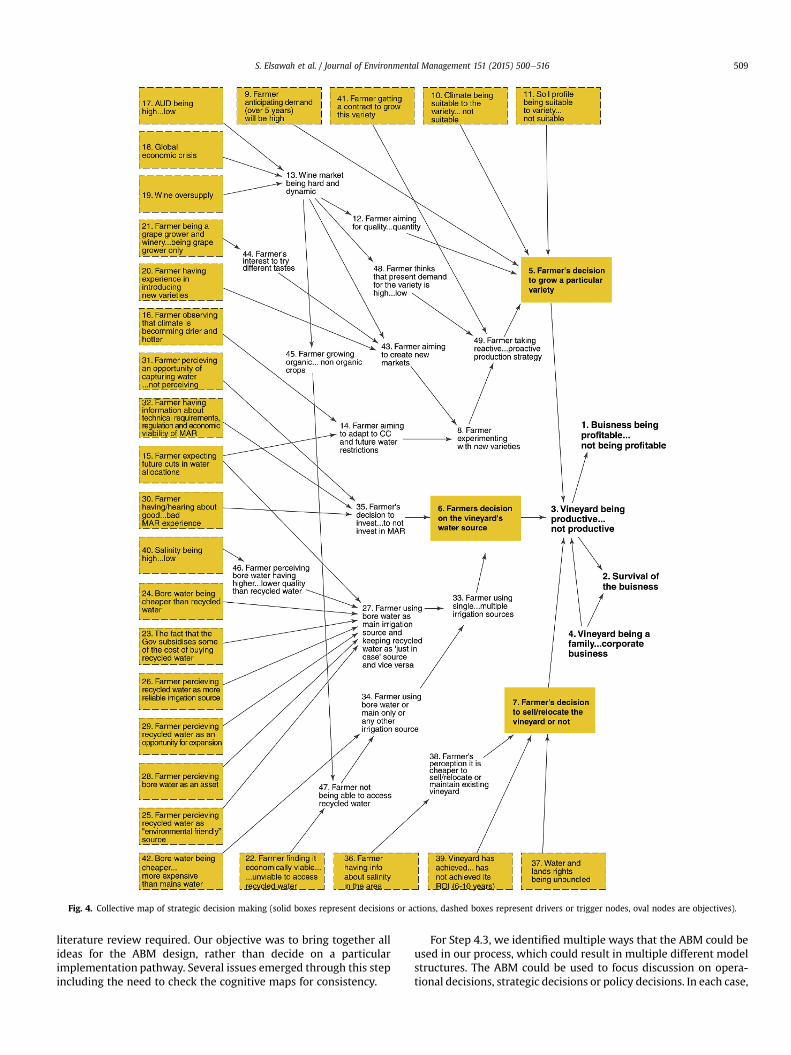
Fig. 4. Collective map of strategic decision making (solid boxes represent decisions or actions, dashed boxes represent drivers or trigger nodes, oval nodes are objectives).
S. Elsawah et al. / Journal of Environmental Management 151 (2015) 500e516 509
literature review required. Our objective was to bring together allideas for the ABM design, rather than decide on a particularimplementation pathway. Several issues emerged through this stepincluding the need to check the cognitive maps for consistency.
For Step 4.3, we identified multiple ways that the ABM could beused in our process, which could result in multiple different modelstructures. The ABM could be used to focus discussion on opera-tional decisions, strategic decisions or policy decisions. In each case,
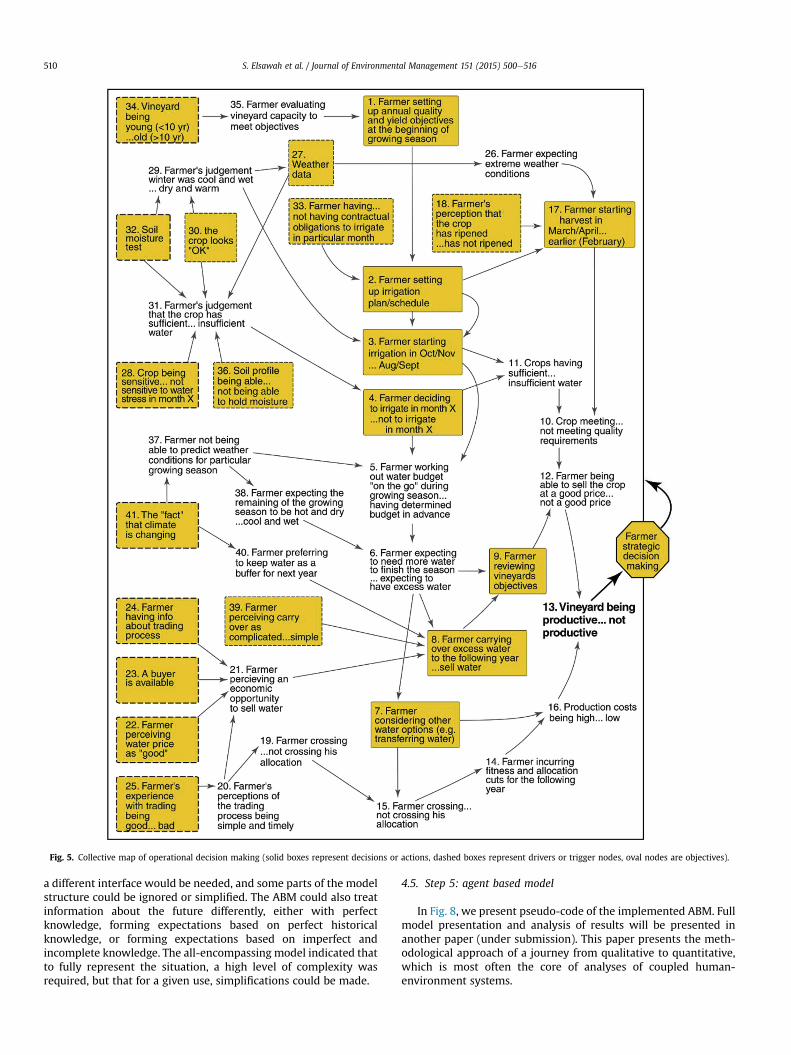
Fig. 5. Collective map of operational decision making (solid boxes represent decisions or actions, dashed boxes represent drivers or trigger nodes, oval nodes are objectives).
S. Elsawah et al. / Journal of Environmental Management 151 (2015) 500e516510
a different interface would be needed, and some parts of the modelstructure could be ignored or simplified. The ABM could also treatinformation about the future differently, either with perfectknowledge, forming expectations based on perfect historicalknowledge, or forming expectations based on imperfect andincomplete knowledge. The all-encompassing model indicated thatto fully represent the situation, a high level of complexity wasrequired, but that for a given use, simplifications could be made.
4.5. Step 5: agent based model
In Fig. 8, we present pseudo-code of the implemented ABM. Fullmodel presentation and analysis of results will be presented inanother paper (under submission). This paper presents the meth-odological approach of a journey from qualitative to quantitative,which is most often the core of analyses of coupled human-environment systems.
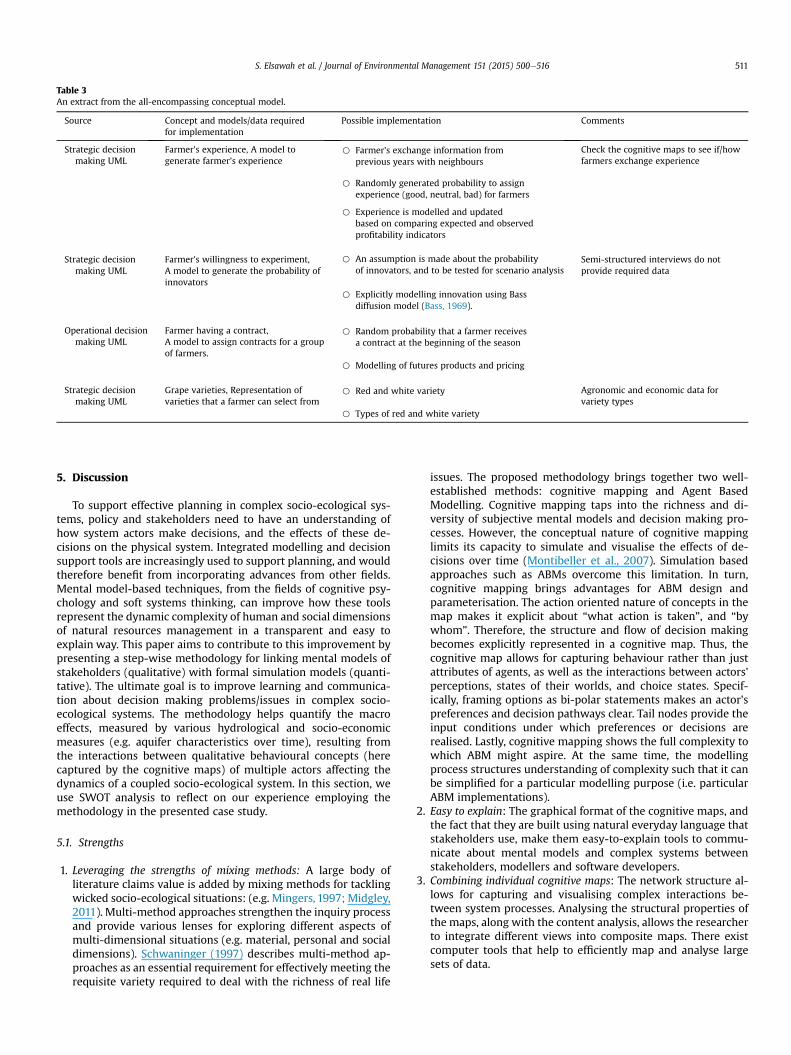
Table 3An extract from the all-encompassing conceptual model.
Source Concept and models/data requiredfor implementation
Possible implementation Comments
Strategic decisionmaking UML
Farmer's experience, A model togenerate farmer's experience
B Farmer's exchange information fromprevious years with neighbours
B Randomly generated probability to assignexperience (good, neutral, bad) for farmers
B Experience is modelled and updatedbased on comparing expected and observedprofitability indicators
Check the cognitive maps to see if/howfarmers exchange experience
Strategic decisionmaking UML
Farmer's willingness to experiment,A model to generate the probability ofinnovators
B An assumption is made about the probabilityof innovators, and to be tested for scenario analysis
B Explicitly modelling innovation using Bassdiffusion model (Bass, 1969).
Semi-structured interviews do notprovide required data
Operational decisionmaking UML
Farmer having a contract,A model to assign contracts for a groupof farmers.
B Random probability that a farmer receivesa contract at the beginning of the season
B Modelling of futures products and pricing
Strategic decisionmaking UML
Grape varieties, Representation ofvarieties that a farmer can select from
B Red and white variety
B Types of red and white variety
Agronomic and economic data forvariety types
S. Elsawah et al. / Journal of Environmental Management 151 (2015) 500e516 511
5. Discussion
To support effective planning in complex socio-ecological sys-tems, policy and stakeholders need to have an understanding ofhow system actors make decisions, and the effects of these de-cisions on the physical system. Integrated modelling and decisionsupport tools are increasingly used to support planning, and wouldtherefore benefit from incorporating advances from other fields.Mental model-based techniques, from the fields of cognitive psy-chology and soft systems thinking, can improve how these toolsrepresent the dynamic complexity of human and social dimensionsof natural resources management in a transparent and easy toexplain way. This paper aims to contribute to this improvement bypresenting a step-wise methodology for linking mental models ofstakeholders (qualitative) with formal simulation models (quanti-tative). The ultimate goal is to improve learning and communica-tion about decision making problems/issues in complex socio-ecological systems. The methodology helps quantify the macroeffects, measured by various hydrological and socio-economicmeasures (e.g. aquifer characteristics over time), resulting fromthe interactions between qualitative behavioural concepts (herecaptured by the cognitive maps) of multiple actors affecting thedynamics of a coupled socio-ecological system. In this section, weuse SWOT analysis to reflect on our experience employing themethodology in the presented case study.
5.1. Strengths
1. Leveraging the strengths of mixing methods: A large body ofliterature claims value is added by mixing methods for tacklingwicked socio-ecological situations: (e.g. Mingers, 1997; Midgley,2011). Multi-method approaches strengthen the inquiry processand provide various lenses for exploring different aspects ofmulti-dimensional situations (e.g. material, personal and socialdimensions). Schwaninger (1997) describes multi-method ap-proaches as an essential requirement for effectively meeting therequisite variety required to deal with the richness of real life
issues. The proposed methodology brings together two well-established methods: cognitive mapping and Agent BasedModelling. Cognitive mapping taps into the richness and di-versity of subjective mental models and decision making pro-cesses. However, the conceptual nature of cognitive mappinglimits its capacity to simulate and visualise the effects of de-cisions over time (Montibeller et al., 2007). Simulation basedapproaches such as ABMs overcome this limitation. In turn,cognitive mapping brings advantages for ABM design andparameterisation. The action oriented nature of concepts in themap makes it explicit about “what action is taken”, and “bywhom”. Therefore, the structure and flow of decision makingbecomes explicitly represented in a cognitive map. Thus, thecognitive map allows for capturing behaviour rather than justattributes of agents, as well as the interactions between actors'perceptions, states of their worlds, and choice states. Specif-ically, framing options as bi-polar statements makes an actor'spreferences and decision pathways clear. Tail nodes provide theinput conditions under which preferences or decisions arerealised. Lastly, cognitive mapping shows the full complexity towhich ABM might aspire. At the same time, the modellingprocess structures understanding of complexity such that it canbe simplified for a particular modelling purpose (i.e. particularABM implementations).
2. Easy to explain: The graphical format of the cognitive maps, andthe fact that they are built using natural everyday language thatstakeholders use, make them easy-to-explain tools to commu-nicate about mental models and complex systems betweenstakeholders, modellers and software developers.
3. Combining individual cognitive maps: The network structure al-lows for capturing and visualising complex interactions be-tween system processes. Analysing the structural properties ofthe maps, along with the content analysis, allows the researcherto integrate different views into composite maps. There existcomputer tools that help to efficiently map and analyse largesets of data.
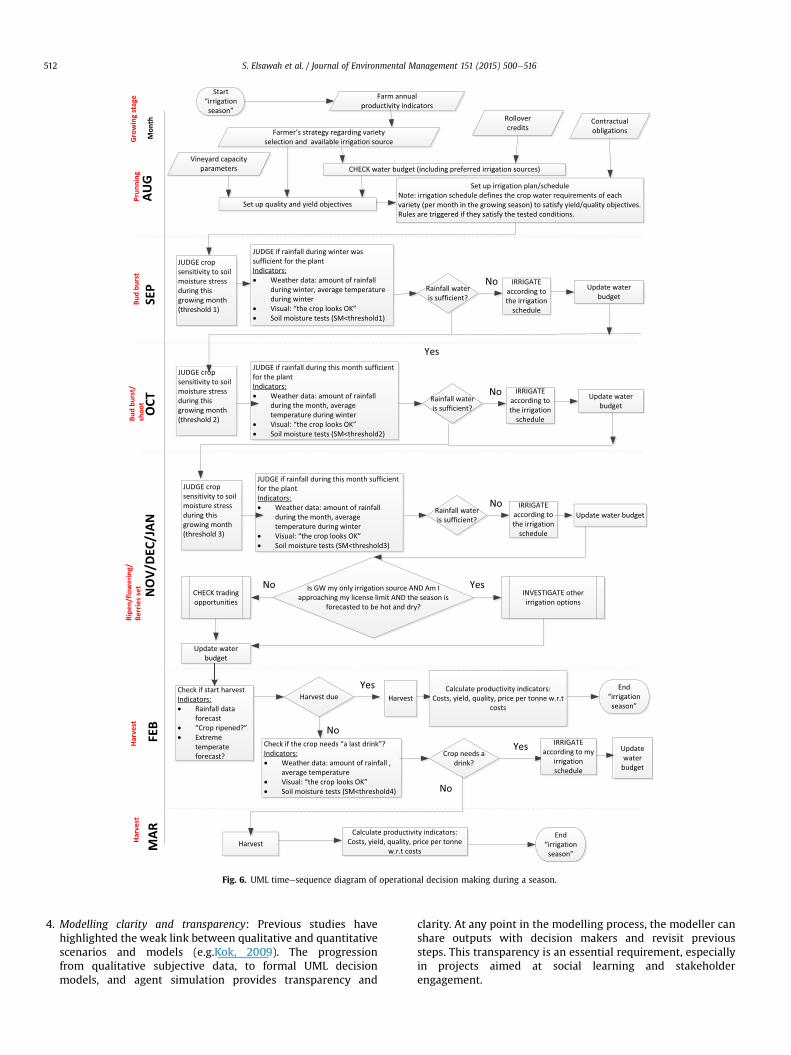
Fig. 6. UML timeesequence diagram of operational decision making during a season.
S. Elsawah et al. / Journal of Environmental Management 151 (2015) 500e516512
4. Modelling clarity and transparency: Previous studies havehighlighted the weak link between qualitative and quantitativescenarios and models (e.g.Kok, 2009). The progressionfrom qualitative subjective data, to formal UML decisionmodels, and agent simulation provides transparency and
clarity. At any point in the modelling process, the modeller canshare outputs with decision makers and revisit previoussteps. This transparency is an essential requirement, especiallyin projects aimed at social learning and stakeholderengagement.
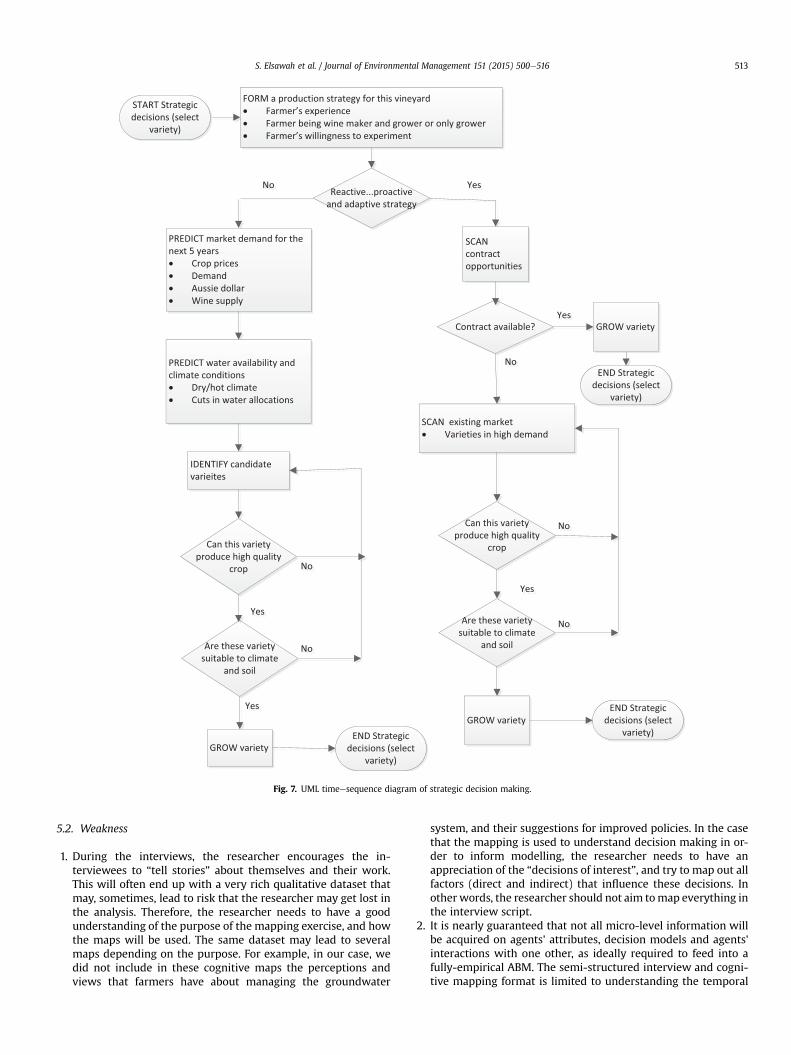
Fig. 7. UML timeesequence diagram of strategic decision making.
S. Elsawah et al. / Journal of Environmental Management 151 (2015) 500e516 513
5.2. Weakness
1. During the interviews, the researcher encourages the in-terviewees to “tell stories” about themselves and their work.This will often end up with a very rich qualitative dataset thatmay, sometimes, lead to risk that the researcher may get lost inthe analysis. Therefore, the researcher needs to have a goodunderstanding of the purpose of the mapping exercise, and howthe maps will be used. The same dataset may lead to severalmaps depending on the purpose. For example, in our case, wedid not include in these cognitive maps the perceptions andviews that farmers have about managing the groundwater
system, and their suggestions for improved policies. In the casethat the mapping is used to understand decision making in or-der to inform modelling, the researcher needs to have anappreciation of the “decisions of interest”, and try to map out allfactors (direct and indirect) that influence these decisions. Inother words, the researcher should not aim tomap everything inthe interview script.
2. It is nearly guaranteed that not all micro-level information willbe acquired on agents' attributes, decision models and agents'interactions with one other, as ideally required to feed into afully-empirical ABM. The semi-structured interview and cogni-tive mapping format is limited to understanding the temporal
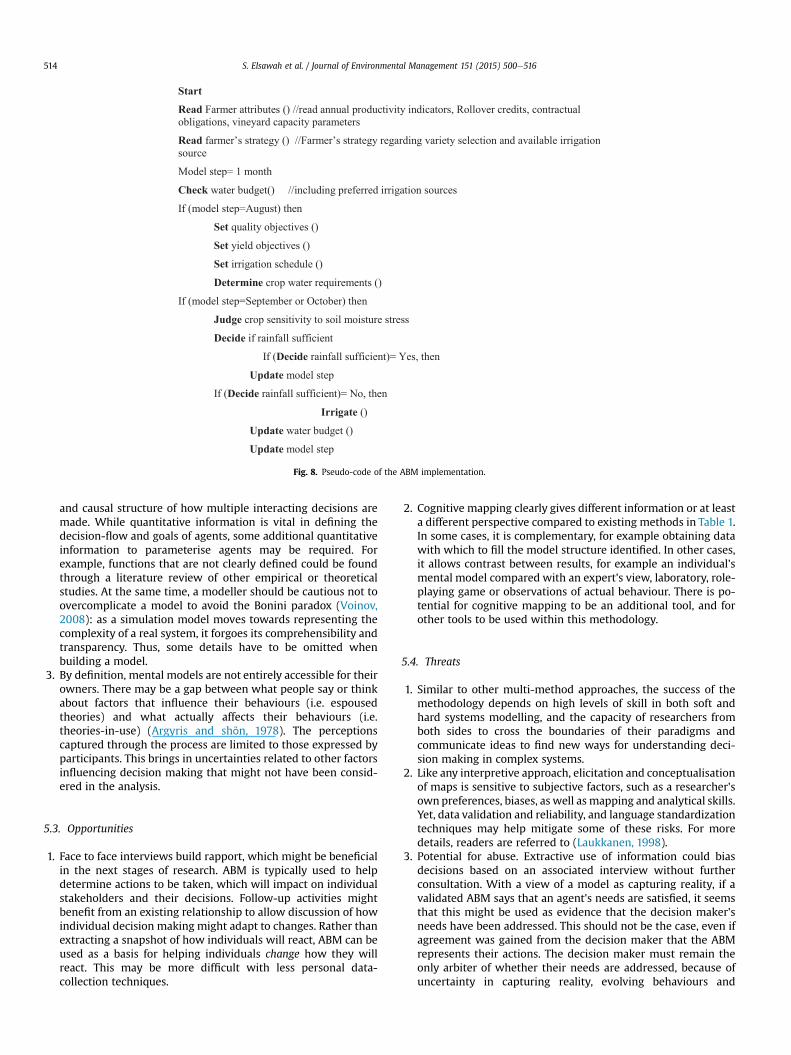
Fig. 8. Pseudo-code of the ABM implementation.
S. Elsawah et al. / Journal of Environmental Management 151 (2015) 500e516514
and causal structure of how multiple interacting decisions aremade. While quantitative information is vital in defining thedecision-flow and goals of agents, some additional quantitativeinformation to parameterise agents may be required. Forexample, functions that are not clearly defined could be foundthrough a literature review of other empirical or theoreticalstudies. At the same time, a modeller should be cautious not toovercomplicate a model to avoid the Bonini paradox (Voinov,2008): as a simulation model moves towards representing thecomplexity of a real system, it forgoes its comprehensibility andtransparency. Thus, some details have to be omitted whenbuilding a model.
3. By definition, mental models are not entirely accessible for theirowners. There may be a gap between what people say or thinkabout factors that influence their behaviours (i.e. espousedtheories) and what actually affects their behaviours (i.e.theories-in-use) (Argyris and shὅn, 1978). The perceptionscaptured through the process are limited to those expressed byparticipants. This brings in uncertainties related to other factorsinfluencing decision making that might not have been consid-ered in the analysis.
5.3. Opportunities
1. Face to face interviews build rapport, which might be beneficialin the next stages of research. ABM is typically used to helpdetermine actions to be taken, which will impact on individualstakeholders and their decisions. Follow-up activities mightbenefit from an existing relationship to allow discussion of howindividual decision making might adapt to changes. Rather thanextracting a snapshot of how individuals will react, ABM can beused as a basis for helping individuals change how they willreact. This may be more difficult with less personal data-collection techniques.
2. Cognitive mapping clearly gives different information or at leasta different perspective compared to existing methods in Table 1.In some cases, it is complementary, for example obtaining datawith which to fill the model structure identified. In other cases,it allows contrast between results, for example an individual'smental model compared with an expert's view, laboratory, role-playing game or observations of actual behaviour. There is po-tential for cognitive mapping to be an additional tool, and forother tools to be used within this methodology.
5.4. Threats
1. Similar to other multi-method approaches, the success of themethodology depends on high levels of skill in both soft andhard systems modelling, and the capacity of researchers fromboth sides to cross the boundaries of their paradigms andcommunicate ideas to find new ways for understanding deci-sion making in complex systems.
2. Like any interpretive approach, elicitation and conceptualisationof maps is sensitive to subjective factors, such as a researcher'sownpreferences, biases, as well as mapping and analytical skills.Yet, data validation and reliability, and language standardizationtechniques may help mitigate some of these risks. For moredetails, readers are referred to (Laukkanen, 1998).
3. Potential for abuse. Extractive use of information could biasdecisions based on an associated interview without furtherconsultation. With a view of a model as capturing reality, if avalidated ABM says that an agent's needs are satisfied, it seemsthat this might be used as evidence that the decision maker'sneeds have been addressed. This should not be the case, even ifagreement was gained from the decision maker that the ABMrepresents their actions. The decision maker must remain theonly arbiter of whether their needs are addressed, because ofuncertainty in capturing reality, evolving behaviours and

S. Elsawah et al. / Journal of Environmental Management 151 (2015) 500e516 515
preferences; and because decision makers are in principle un-aware of their mental models, and therefore can only be reliedon to refute, not confirm their cognitive map.
4. Potential for resistance. Trying to unravel the detail of actionscan be considered invasive and challenging. One respondentcontrasted what they ought to be doing with what they wereactually doing. With trust that this information might not beabused, the process has the potential to help individuals un-derstand how they can improve their decisions, and help otherstakeholders to support this improvement. Without trust, thereis likely to be a negative response, perhaps as an explicit chal-lenge along the lines “Why do you need to know this informa-tion?” or by avoidance behaviours, for example portraying anideal rather than an actual decision-making process, therebygiving a false impression of the operation of the system.
6. Conclusion
In this study, we presented a five step, iterative methodology forlinking mental models of stakeholders (qualitative) to formalsimulation models (quantitative) with the ultimate goal ofimproving understanding and communication about decisionmaking in complex socio-ecological systems. The methodologymakes use of different data collection, mapping, and con-ceptualisation techniques from multiple fields, including: softsystems thinking, cognitive psychology, and agent-based model-ling. We illustrated how the methodology is applied to elicit andrepresent how a group of irrigators make strategic and operationalvineyard management decisions. Our experience shows themethodology is useful for structuring complex decision makingprocesses, and helping to understand interactions between agent'sdecisions and their environmental attributes. The transparentprogression from qualitative to quantitative models makes themethodology best suited for supporting social learning, andstakeholder engagement in policy making (Kelly et al., 2013), whilemaintaining the possibility to quantify macro impacts of theseinteracting actors' decisions. Future applications will help improvethe methodology and how it can be transferred to other casestudies.
Acknowledgements
This work is funded by the National Centre of GroundwaterResearch & Training (SR0800001). We acknowledge the time ofparticipants who took part in this study.
Appendix A. Interview script
Roles
� Researcher 1 (mapping or interviewing)� Researcher 2 (mapping or interviewing)� Researcher 3 (observing and note-taking)
Introduction (Note: keep the introduction as short as possible):
� The project's aim is to develop a model (computer application)to examine the impact of water allocation policies on stake-holder-relevant
� From what we have heard so far, we understand there are nopressing issues, but the model will help look at the future, andidentify minor issues before they are become big.
� We don't want the interview to be only a data-collection exer-cise, but also to enable you to raise any questions or issues youwould like to be heard.
Part I: decision making
1. What crops/varieties do you grow?2. Why do you grow these crops?3. Do you change this from one year to another, or this is pretty
stable?4. How often do you revisit your decision?5. If you decide to grow different crop/variety, what factors will
you consider on making such decision?6. How do you think these factors may change in the future?7. What will you do in response to this change?
Irrigation-related decisions:
8. What are the sources of water do you use?9. What time(s) of the year do you make this decision?
10. On deciding which source to use, what factors do youconsider?
11. What are the costs and benefits of using each source?12. How do you think these factors may change in the future?13. What will you do in response to this change?14. What information sources do you use and need to support
your decision?15. How much water do you usually pump?16. How much water do you usually roll-over?17. What factors affect how much water you pump/rollover?18. Do you consider other people opinion on deciding howmuch
water to pump? If yes, who, and why?19. Do you think your pumping decisions may affect others? If
yes? Who, and how?
Part II: perspectives, cooperation, wrapping
20. Do you think there are decisions that groundwater users(including irrigators) need to cooperate to make? (identifydecision)
21. What factors may affect the cooperation among groundwaterusers to make these decisions?
22. What factors may prevent cooperation among users?23. What are the benefits and costs of cooperation among users?
(judgement about decision outcomes)24. Acknowledge existence of other perspectives, need for
negotiation and possible conflicts (Don't expect all desires tobe met. Be aware of conflicts)
a. Have there been any cases where it's clear that otherpeople's aims or activities clash with yours?b. From what we've discussed, is there anything you think
others don't understand or are not aware of?
25. Thinking of your business future, what issues do concernyou?26. What questions about the future you would like to have
answers for?27. Broaden impact of interview beyond the individual
a. From our discussion, what would you like other stake-holder groups to be aware of?
b. Do you know anybody who would appreciate being ableto share their concerns through this interview process?
c. Are there any issues you raised that you have talked aboutor intend to talk about with others?
S. Elsawah et al. / Journal of Environmental Management 151 (2015) 500e516516
d. Are there any issues you raised that you would want to dosomething about? What's stopping you? What wouldhelp you succeed?
Wrapping up:
� Thanks for your time� Will you be interested in validating data collected� Feedback report
References
An, L., 2012. Modelling human decisions in coupled human and natural systems:review of agent-based models. Ecol. Model. 229, 25e36.
Argyris, C., ShὍn, D.A., 1978. Organizational Learning: a Theory of ActionPerspective. Addison-Wesley.
Arthur, W.B., 1999. Complexity and the economy. Science 284, 107e109.Axelrod, R., 1976. Structure of Decision: The Cognitive Maps of Political Elites.
Princeton University Press, Chichester.Axtell, R., 2005. The complexity of exchange. Econ. J. 115, F193eF210.Barreteau, O., Bousquet, F., Attonaty, J.-M., 2001. Role-playing games for opening the
black box of multi-agent systems: method and lessons of its application toSenegal River Valley irrigated systems. J. Artif. Soc. Soc. Simul. 4, 5e18.
Bass, F., 1969. A new product growth for model consumer durables. Manag. Sci. 15(5), 215e227.
Bonabeau, E., 2002. Agent-based modeling: methods and techniques for simulatinghuman systems. Proc. Natl. Acad. Sci. 99, 7280e7287.
Buzan, T., 1993. The Mind Map Book. BBC Books, London.Chave, J., Levin, S., 2003. Scale and scaling in ecological and economic systems.
Environ. Resour. Econ. 26, 527e557.Corbin, J., Strauss, A. (Eds.), 2008. Basics of Qualitative Research: Techniques and
Procedures for Developing Grounded Theory. Sage.D€oll, C., D€oll, P., Bots, P., 2013. “Semi-quantitative actor-based modelling as a tool to
assess the drivers of change and physical variables in participatory integratedassessments.”.
Doyle, J.K., Ford, D., 1998. Mental models concepts for system dynamics research.Syst. Dyn. Rev. 14, 3e29.
Eden, C., 1992. On the nature of cognitive maps. J. Manag. Stud 29 (3), 261e265.Eden, C., Ackermann, F., 1998. Making Strategy: the JOURNEY of Strategic Man-
agement. Sage Publications, London.Eden, C., Ackermann, F., 2004. Cognitive mapping expert views for policy analysis in
the public sector. Eur. J. Oper. Res. 152 (3), 615e630.Eden, C., 2004. Analyzing cognitive maps to help structure issues or problems. Eur. J.
Oper. Res. 159 (3), 673e686.EL Sawah, S., Guillaume, H.A., Mitchell, M., 2011. Using Participatory Rapid Appraisal
and DPSIR approaches for participatory modelling: a case study for ground-water management in South Australia. In: The International Congress onModelling and Simulation (MODSIM), 12e16 December 2011 Perth, Australia.
Elsawah, S., Mclucas, A., Mazanov, J., 2013. Using a cognitive mapping approach toframe the perceptions of water users about managing water resources: a casestudy in the Australian Capital Territory. Water Resour. Manag. 27, 1e16.
Faber, M., Kuz, S., Mayer, M.P., Schlick, C.M., 2013. Design and implementation of acognitive simulation model for Robotic Assembly Cells. In: 4th InternationalConference on Digital Human Modeling and Applications in Health, Safety,Ergonomics and Risk Management. Springer Berlin Heidelberg, Las Vegas, NV,USA, pp. 205e214.
Filatova, T., Parker, D.C., Van Der Veen, A., 2011. The implications of Skewed riskperception for a Dutch Coastal land Market: insights from an agent-basedcomputational economics model. Agric. Resour. Econ. Rev. 40, 405e423.
Filatova, T., Verburg, P.H., Parker, D.C., Stannard, C.A., 2014. Spatial agent-basedmodels for socio-ecological systems: challenges and prospects. Environ. Model.Softw. 45, 1e7.
Forrester, J.W., 1992. Policies, Decisions and Information Sources for Modeling.Grimm, V., Berger, U., Deangelis, D.L., Polhill, J.G., Giske, J., Railsback, S.F., 2010. The
ODD protocol a review and first update. Ecol. Model. 221, 2760e2768.Grimm, V., Railsback, S.F., 2005. Individual-based Modeling and Ecology. Princeton
University Press.Howick, S., Eden, C., Ackermann, F., Williams, T., 2008. Building Confidence in
Models for Multiple Audiences: the Modelling Cascade.Hjortsø, C., 2004. Enhancing public participation in natural resource management
using Soft OR: an application of strategic option development and analysis intactical forest planning. Eur. J. Oper. Res. 152 (3), 667e683.
Janssen, M.A., 2002. Complexity and Ecosystem Management: the Theory andPractice of Multi-agent Systems. Edward Elgar Publishing Ltd.
Janssen, M.A., Ostrom, E., 2006. Empirically Based, Agent-based Models, 11. Ecologyand Society.
Jones, N.A., Ross, H., Lynam, T., Perez, P., Leitch, A., 2011. Mental models: an inter-disciplinary synthesis of theory and methods. Ecol. Soc. 16, 46e59.
Kelly, G., 1955. The Psychology of Personal Constructs: a Theory of Personality(Norton).
Kelly, R., Jakeman, A.J., Barreteau, O., Borsuk, M.E., Elsawah, S., Hamilton, S.H.,Henriksen, H.J., Kuikka, S., 2013. Selecting among five common modelling ap-proaches for integrated environmental assessment and management. Environ.Model. Softw. 47, 159e181.
Kok, K., 2009. The potential of fuzzy cognitive maps for semi-quantitative scenariodevelopment, with an example from Brazil. Glob. Environ. Change Hum. PolicyDimens. 19, 122e133.
Kolkman, M.J.K.,M., Van Der Veen, A., 2005. Mental model mapping as a new tool toanalyse the use of information in decision-making in integrated water man-agement. Phys. Chem. Earth Parts A/B/C 30, 317e332.
Langan-Fox, J., Code, S., Langfield-Smith, K., 2000. Teammental models: techniques,methods, and analytic approaches. Hum. Factors: J. Hum. Factors Ergon. Soc. 42,242e271.
Laukkanen, M., 1998. Conducting causal mapping research: opportunities andchallenges. In: Eden, C., Spender, J. (Eds.), Managerial and OrganizationalCognition: Theory, Methods and Research. Sage Publications, London.
Ludwig, D., Hilborn, R., Walters, C., 1993. Uncertainty, resource exploitation, andconservation. Lessons hist. Sci. 260 (5104), 17.
Midgley, G., 2011. Theoretical pluralism in systemic action research. Syst. Pract.Action Res. 24, 1e15.
Mingers, J., 1997. Multi-paradgim multimethodology. In: Mingers, J., Gill, A. (Eds.),Multimethodology. John, Wiley & Sons.
Montibeller, G., Belton, V., Lima, M.V.A., 2007. Supporting factoring transactions inBrazil using reasoning maps: a language-based DSS for evaluating accountsreceivable. Decis. Support Syst. 42, 2085e2092.
Morgan, M.G., Fischhoff, B., Bostrom, A., Atman, C.J., 2001. Risk Communication: aMental Models Approach. Cambridge University Press.
Moxnes, E., 1998. Not only the tragedy of the commons: misperceptions of bio-economics. Manag. Sci. 44 (9), 1234e1248.
Narayanan, V.K., Fahey, L., 1990. Evolution of revealed causal maps during decline: acase study of admiral. In: Huff, A.S. (Ed.), Mapping Strategic Thought. JohnWiley & Sons.
Pahl-Wostl, C., Sendzimir, J., Jeffrey, P., Aerts, J., Berkamp, G., Cross, K., 2007. Man-aging change toward adaptive water management through social learning. Ecol.Soc 12 (2).
Pahl-Wostl, C., 2007a. Representation of the Human Dimension in Global WaterAssessments: Current State and Major Challenges for Methodological In-novations. In: Report on the joint TIAS-GWSP workshop held at the Universityof Maryland University College. Adelphi, USA.
Parker, D.C., Berger, T., Manson, S.M. (Eds.), 2002. Agent-based Models of Land-useand Land-cover Change: Report and Review of an International Workshop,October 4-7, 2001. LUCC, Bloomington.
Pooyandeh, M., Marceau, D.J., 2013. A spatial web/agent-based model to supportstakeholders' negotiation regarding land development. J. Environ. Manag. 129,309e323.
Reynolds, T.J., Gutman, J., 2001. Laddering theory, method, analysis, and interpre-tation. In: Reynolds, T.J., Olson, J.C. (Eds.), Understanding Consumer DecisionMaking: the Means-end Approach to Marketing. Library of Congress.
Robinson, D.T., Brown, D., Parker, D.C., Schreinemachers, P., Janssen, M.A.,Huigen, M., Wittmer, H., Gotts, N., Promburom, P., Irwin, E., Berger, T.,Gatzweiler, F., Barnaud, C., 2007. Comparison of empirical methods for buildingagent-based models in land use science. J. Land Use Sci. 2, 31e55.
Rouse, W., Morris, N., 1986. On looking into the black box: prospects and limits inthe search for mental models. Psychol. Bull. 100 (3), 349e363.
Schwaninger, M., 1997. Integrative systems methodology: heuristic for requisitevariety. Int. Trans. Oper. Res. 4, 109e123.
Smajgl, A., Brown, D.G., Valbuena, D., Huigen, M.G.A., 2011. Empirical characteri-sation of agent behaviours in socio-ecological systems. Environ. Model. Softw.26, 837e844.
Sterman, J., 2000. Business Dynamics. Irwin-McGraw-Hill.Tesfatsion, L., 2006. Agent-based computational economics: a constructive
approach to economic theory. In: Tesfatsion, L., Judd, K.L. (Eds.), Handbook ofComputational Economics, Agent-based Computational Economics, vol. 2.Elsevier B.V, Amsterdam.
Tolman, E., 1948. Cognitive maps in rats and men. Psychol. Rev. 55, 189e208.Veldkamp, A., Verburg, P.H., 2004. Modelling land use change and environmental
impact. J. Environ. Manag. 72, 1e3.Vespignani, A., 2012. Modelling Dynamical Processes in Complex Socio-technical
Systems.Viscusi, W.K., Zeckhauser, R.J., 2006. The perception and valuation of the risks of
climate change: a rational and behavioral blend. Clim. Change 77, 151e177.Voinov, A., 2008. Systems Science and Modeling for Ecological Economics. Aca-
demic Press.Zagonel, A.A., 2002. Model conceptualization in group model building: a review of
the literature exploring the tension between representing reality and negoti-ating a social order. In: The 20th International System Dynamics Conference.Palermo, Italy.
Zhao, J., Ximing, C., Zhongjing, W., 2013. Comparing administered and market-based water allocation systems through a consistent agent-based modelingframework. J. Environ. Manag. 123, 120e130.