A Methodology for Analyzing Automated Electronic Classroom ...
85
CRM 96-120 / March 1997 A Methodology for Analyzing Automated Electronic Classroom (AEC) Options and Conversion Decisions G. Thomas Sicilia D ' S BUT 'ON STATEMENT A ^Y^for Public Release Distribution Unlimited Center for Naval Analyses 4401 Ford Avenue »Alexandria, Virginia 22302-1498 I^qMIXMBfflCMM
-
Upload
khangminh22 -
Category
Documents
-
view
1 -
download
0
Transcript of A Methodology for Analyzing Automated Electronic Classroom ...
CRM 96-120 / March 1997
A Methodology for Analyzing Automated Electronic Classroom (AEC) Options and Conversion Decisions
G. Thomas Sicilia
D'S™BUT'ON STATEMENT A ^Y^for Public Release
Distribution Unlimited
Center for Naval Analyses 4401 Ford Avenue »Alexandria, Virginia 22302-1498
I^qMIXMBfflCMM

Approved for distribution: M
Donald J. Cyrhcot, [Pirefctor1
Manpower, Personnel, arid-Training Team Support Planning and Management Division
This document represents the best opinion of CNA at the time of issue. It does not necessarily represent the opinion of the Department of the Navy.
APPROVED FOR PUBLIC RELEASE; DISTRIBUTION UNLBVf ITED For copies of this document, call the CNA Document Control and Distribution Section (703)
Copyright © 1997 The CNA Corporation

REPORT DOCUMENTATION PAGE Form Approved
OMB No. 074-0188 Public reporting burden for this collection of information is estimated to average 1 hour per response, Including the time for reviewing Instructions, searching existing data sources, gathering and maintaining the data needed, and completing and reviewing this collection of information. Send comments regarding this burden estimate or any other aspect of this collection of information, including suggestions for reducing this burden to Washington Headquarters Services, Directorate for Information Operations and Reports, 1215 Jefferson Davis Highway, Suite 1204, Arlington, VA 22202-4302, and to the Office of Management and Budget, Paperwork Reduction Project (0704-0188), Washington, DC 20503
1. AGENCY USE ONLY (Leave blank)
2. REPORT DATE March 1997
3. REPORT TYPE AND DATES COVERED Final
4. TITLE AND SUBTITLE A Methodology for Analyzing Automated Electronic Classroom (AEC) Options and Conversion Decisions
6. AUTHOR(S) GT Sicilia
5. FUNDING NUMBERS C - N00014-96-D-0001
7. PERFORMING ORGANIZATION NAME(S) AND ADDRESS(ES)
Center for Naval Analyses 4401 Ford Avenue Alexandria, Virginia 22302-1498
8. PERFORMING ORGANIZATION REPORT NUMBER
CRM 96-120
9. SPONSORING / MONITORING AGENCY NAME(S) AND ADDRESS(ES) 10. SPONSORING / MONITORING AGENCY REPORT NUMBER
11. SUPPLEMENTARY NOTES
12a. DISTRIBUTION / AVAILABILITY STATEMENT Distribution unlimited
12b. DISTRIBUTION CODE
13. ABSTRACT (Maximum 200 Words) In this study, we explored ways to quantify the costs and benefits of infusing technology into formal Navy schoolhouse training. At the outset, we worked with the Navy sponsor (N75) to identify a set of high interest and potential technologies - Automated Electronic Classroom (AEC) and Video Teletraining (VTT) - to pursue as a first order of business. This report discusses our analysis and findings concerning the use of AEC technology in Navy training. A separate CNA report addresses our findings with respect to the VTT technology. In keeping with the study tasking, we approached the AEC conversion question as a return-on-investment problem.
14. SUBJECT TERMS automation, computer aided instruction, costs, courses (education), education, methodology, technology, training devices, video networks, video teletraining
15. NUMBER OF PAGES 92 16. PRICE CODE
17. SECURITY CLASSIFICATION OF REPORT
Unclassified
18. SECURITY CLASSIFICATION OF THIS PAGE
Unclassified
19. SECURITY CLASSIFICATION OF ABSTRACT
Unclassified
20. LIMITATION OF ABSTRACT
NSN 7540-01-280-5500 Standard Form 298 (Rev. 2-89) Prescribed by ANSI Std. Z39-18 298-102

Acknowledgment
The author acknowledges the contributions of Tim Täte and Bob Calogero of NAVSEA and Hal Cody, Tom Moore, and Doug Delaney of Fleet Technical Support Center Atlantic (FTSCLANT). This study and the methodology documented in this report greatiy benefited from and built on their experience, subject matter expertise, and past analysis. The final product of the effort is largely the result of their knowledge, assistance, and support.

Contents
Summary . 1 Defining AECs 2 Costs and benefits 3 Testing the model 4 Sensitivity analysis 5 Recommendations 5
Introduction 7
Assumptions and constraints 9
Potential uses for the model 11
Return-on-investment (ROI) definitions 15
Conceptual framework for ABC Analysis Tool 17
AEC-related costs and benefits—an overview 21 AEC costs considered in ABC Analysis Tool 21 AEC benefits considered in ABC Analysis Tool 22 Other potential AEC costs and benefits
(not included in ABC Analysis Tool) 23
AEC-related investment costs 27 AEC classroom and lab/LRC automation setup costs ... 27 Course conversion and media selection analysis costs ... 28 Instructional Media Design Report (IMDR) development cost 29
Costs for animations and simulations (A&S) 30 Data conversion to digital format costs 31
AEC-related recurring costs 33 Increased AEC life-cycle cost 33 "Use of AEC technology" training costs 34
AEC-related benefits 35 Reduced student costs 35
Reduced instructor costs 35 Paper management cost reduction 40
ABC Analysis Tool input, default, and output data 43 Input data 43 Default variables and data 44
ABC Analysis Tool output 44 Illustrative examples of ABC Analysis Tool runs 48
Sensitivity analysis ABC Analysis Tool input and default data 57
Sensitivity analysis overview 57 Sensitivity analysis—impact of default ROI planning
factors on ROI 58 Sensitivity analysis—impact of selected input data
values on ROI 60 Sensitivity analysis—impact of selected default data values on ROI 62
Project results, findings, status, and recommended next steps 63
Appendix A: ABC Analysis Tool ROI costs and benefits formulas 65
Overview 65 AEC classroom and lab/LRC automation setup costs ... 66 Course conversion and media selection analysis costs ... 66 Instructional Media Design Report (IMDR) development cost 67
Animations and simulations (A&S) costs 67 Data conversion to digital format costs 67 Increased AEC life-cycle cost 68 "Use of AEC technology" training costs 68 Reduced student costs 69 Reduced instructor costs 69 Paper management cost reduction 74
Appendix B: ABC Analysis Tool listing 75
list of tables 83
Distribution list 85
u
Summary
In this study, we explored ways to quantify the costs and the benefits of infusing technology into formal Navy schoolhouse training. At the outset, we worked with the Navy sponsor (N75) to identify a set of high interest and potential technologies to consider. N75 then prioritized the list and selected two technologies—Automated Electronic Class- room (AEC) and Video Teletraining (VTT)—to pursue as a first order of business. This report discusses our analysis and findings concern- ing the use of AEC technology in Navy training. A separate CNA report1 addresses our findings with respect to the VTT technology.
In keeping with the study tasking, we approached the AEC conversion question as a rerurn-on-investment (ROI) problem. We were able to develop a methodology for quantifying the cost and benefit implica- tions for course-by-course or pipeline-by-pipeline AEC conversion decisions, such as:
• Is it cost-effective to convert a specific paper course/pipeline to an AEC format?
• What are the best AEC course candidates and what return on investment (ROI) would result from the conversions?
• What are the relative costs and benefits of one form of AEC implementation versus another for a course, set of courses, or the Navy at large?
We formalized the methodology into a simple, easy-to-use, Excel- based model, which we called the AEC Business Case Analysis Tool, or ABC Analysis Tool. The model, which currently addresses Core, A- School and C-School training, estimates the relative costs and benefits of converting a paper-based course or set of courses to an AEC format.
1. Steven W. Belcher. Methodology for Analyzing the Costs and Benefits of Video Teletraining (VTT), Mar 1997 (CNA Research Memorandum 96-117).

Defining AECs
One of our first tasks was to establish a working definition for the term AEC within the Navy training paradigm. The Navy POM 98 Training Technology Assessment (Automated Electronic Classroom), dated 1 March 1996, defines AECs as "classrooms equipped to pro- vide instructors with the capability of delivering curriculum materials in an electronic (non-paper) format." In a broader context, an AEC is a training delivery system that makes wide use of automation in managing and delivering classroom training. In general, the Navy AEC conceptual model is based on the following building blocks and assumptions:
• Materials related to the course curriculum are available in an automated form, and the classroom management of these materials is supported by some type of information support system or software.
• The training delivery involves computer-based animations, sim- ulations, and materials in a "non-paper" format.
• There is significant use of the computer in both managing and teaching the course.
Upon reflection, the AEC definitions lead to two interesting observa- tions. First, the AEC is really a combination or integration of training technologies and innovations. Therefore, supporters legitimately claim the benefits derived from the individual components as AEC benefits. Examples include the following:
• Shorter courses are possible because of the course optimiza- tion, which often takes place as part of the course conversion (which is based on Instructional System Design (ISD)) from a paper-based to a computer-based AEC format.
• Less instructor personalization time (to "personalize" or "indi- vidualize" the instructional material by infusing real-life per- sonal examples and experiences) is required for a course when the curriculum materials are automated via such systems as Authoring Instructional Materials (AIM) and supported by such information management systems as the Training Integra- tion Manager System (TIMS).

Both of the items cited would result in benefits at some level on their own. However, they are integral parts of the AEC "model," so it is appropriate to include their collective benefits under the AEC banner.
The second observation concerns the scope of the AEC definition and the latitude available under it. In fact, the Navy is pursuing a number of different AEC implementations or designs. These range from simple automated "live boards" run by the instructor to fully automated classrooms with integrated instructor and student work stations.
The methodology developed in this study is designed to apply for every AEC implementation. However, each different AEC design has unique characteristics that could affect its associated costs and bene- fits. Our solution to this problem was to ensure that the model addressed the potential costs and benefit areas and to use the model's input and default data values to capture the unique characteristics associated with different AEC designs. In this way, the ABC Analysis Tool can be used for any AEC implementation provided the compa- rable input and default data are available for the design under consideration.
Costs and benefits
The ABC Analysis Tool estimates the cost implications of a number of cost drivers. The major items considered are:
• The cost to set up or establish an AEC classroom (s)
• The cost to convert and optimize a paper-based course to an AEC format
• The recurring (ADP-based) operation and maintenance "life cycle" costs associated with an AEC course
• The reduced student and instructor costs due to the shorter course length associated with an AEC course
• The reduced instructor preparation and personalization costs associated with the easier-to-use AEC software
• The reduced technical documentation paper management
costs associated with an AEC course.
The study considered several other costs and savings that were not
included in this preliminary version of the model. These costs, listed
below, should be studied and analyzed further in follow-on efforts:
• Differences in attrition behavior—no data found in study
• Differences in cost to develop and revise courses
• Other costs that at first appear to be small relative to the costs
included in the model.
Testing the model
As part of the study, we developed a set of test data, which we used to
develop, test, validate, describe, and illustrate the model. This test data set borrows heavily from and is keyed to the conceptual model being pursued and implemented within the NAVSEA community. The key features or elements of the NAVSEA AEC concept are:
• A full complement of networked student and instructor auto-
mated workstations
• AIM/TIMS course management software
• ISD-based conversion and optimization of the paper-based
courseware to an AEC environment.
Our test data set was developed with the NAVSEA subject matter
experts and tracks with their experience and planning factors. To reit-
erate, the data are test (best possible) data for one of the AEC options
being tested and implemented in the Navy. We believe the factors
(based on NAVSEA experience) provide a good starting point for esti-
mating the AEC costs and benefits. They are only a starting point,
however, because the Navy schools, CNET, and the other system com-
mands may have additional (and different) experience and insight.
These caveats aside, the test data set is credible and demonstrates the
feasibility of developing the data needed for the model. Furthermore,
even in its present form, the test data allows us to describe and

illustrate the model and should provide some valuable (if limited) insight for the Navy.
Sensitivity analysis
The model features the built-in ability to test the sensitivity (in terms of ROI values) of its input and default data. We used the test data developed for the ET Core course to demonstrate the model's sensi- tivity analysis capabilities for the input and default variables. The sen- sitivity analysis results, discussed in the report and summarized below, both show the power of the model and provide useful insight.
ROI (savings/ investment)
Base case (test data for ET core course) 2.95 25% change in student volume 10% change in ROI 25% change in course length 2% change in ROI 40% change in default class day AEC
reduction factor 30% change in ROI 20% change in default lab day AEC
reduction factor 20% change in ROI
The above numbers are based on test data for a single course (the ET core course) for a 5-year period and a zero inflation, growth, and dis- count rate. The results show that the computed potential payoff of the AEC for the course (the estimated ROI) is about 3 to 1. It also shows how the ROI varies with changes in key parameters and dem- onstrates how the model can be used to test the values used in the model.
Recommendations
Based on our study, we offer the following three recommendations:
1. Validate the model across a meaningful set of courses, such as those currently planned for conversion to an AEC format.
2. Address other AEC constructs (e.g., no student classroom work- stations) being pursued in the Navy. Determine which AEC

conceptual models to address, define default values for each AEC construct addressed, and validate results.
3. Consider costs and benefits excluded in this preliminary effort with a focus on course and Navy-wide attrition under a paper- based versus an AEC-based course format.

Introduction
The purpose of this N75-sponsored study was to review the costs and benefits of converting paper-based courses and/or training pipelines to an Automated Electronic Classroom (AEC) format and to develop an approach, or methodology, for quantifying these costs and bene- fits. Another study goal, if possible, was to develop a model or analyt- ical tool for assessing the potential payoff of converting from a paper- based course to an AEC-based format.
One of the first questions to address in the study was, what is an AEC? The Navy POM 98 Training Technology Assessment (Automated Elec- tronic Classroom), dated 1 March 1996, defines AECs as "classrooms equipped to provide instructors with the capability of delivering cur- riculum materials in an electronic (non-paper) format." In the broader context, an AEC is a training delivery system that makes wide use of automation in managing and delivering classroom training.
The AEC definition is very general and the Navy is pursuing several different AEC operational models. These range from simple auto- mated "live boards" run by the instructor to fully automated class- rooms with integrated instructor and student work stations. Yet, despite the differences, all of the Navy AEC implementations share a common set of requirements and assumptions, including:
• The course curriculum and related materials are available in an automated form, and the classroom management of these materials is supported by some type of information support system or software.
• The training delivery involves computer-based animations, sim- ulations, and materials in a "non-paper" format.
• There is significant use of the computer in both managing and teaching the course.
The challenge for our study was to develop a methodology that is gen- eral enough to cover all the Navy AEC configurations and yet detailed enough to capture the cost-benefit implications of the individual implementations.
We approached the AEC conversion question as an ROI problem. We focused on building an ROI-based tool for estimating the cost and benefit implications of AEC conversion. The model developed in the study, called the AEC Business Case Analysis Tool, or ABC Analysis Tool, estimates the relative costs and benefits of converting a paper- based course or set of courses to an AEC format. The model is valid for all AEC implementations and uses default data variables to reflect the characteristics and impact of individual AEC configurations.
The ABC Analysis Tool is designed to be simple to use, to support high- level analysis, and to provide a flexible "what if analysis capability. The model, which currendy addresses Core, A-School, and C-School train- ing, could be used to identify high-potential (high-ROI) applications and screen out lower payoff ones. So it should support a front-end, or "first step," analysis in the course conversion decision process.
A typical use envisioned for the model would be as a first-line filter that is run against a large number of courses or pipelines to identify good candidates (in terms of the estimated ROI value) for conversion to an AEC format. Under this vision, the high-ROI candidates would then be subjected to further course-specific and subject-matter-based review and (if appropriate) conversion. The model is designed to add value to and augment the existing detailed analysis and review cur- rently associated with AEC conversion decisions. It is not designed to replace them.
The ABC Analysis Tool is applicable for all standing courses and for training associated with new systems currently in the acquisition cycle for which the program manager has recommended paper-based courses or training pipelines. Typical management questions address- able by the model include:
• Is it cost-effective to convert a specific paper course/pipeline to an AEC format?
• What are the best AEC course candidates, and what return on investment would result from the conversion?

Assumptions and constraints
The ABC Analysis Tool and models like it require many assumptions. Most of these (such as factors, equations and default values) address details needed to define the inner working of the model and are dis- cussed in the model description sections of the report.
This section focuses on three higher order assumptions and con- straints that shape and, in a sense, form a foundation for the model. The first assumption is that the model must be easy to use and must require only a modest amount of readily available input data to run. The second addresses the relative quality of training provided under a well-designed paper-based and AEC-based format and the training strategy assumed for the two ways to deliver training. The third involves the costing approach and types of cost included in the model.
At the outset of the study, we recognized that the requirement was for a valid, simple, easy-to-use, and flexible tool. These requirements or constraints tend to work at cross purposes and raised several model design questions. On one hand, to be valid, a model must have enough data to be sensitive to the course or training application being addressed. On the other hand, models that require large amounts of detailed data tend to not pass the easy-to-use and flexible criteria.
The model development goal was to define and refine the input data requirements to the point that any course manager or training spon- sor would have the data needed to run the model. The result—the ABC Analysis Tool—requires only aggregate and readily available input data.
We accomplished our "low input data requirement" goal by making extensive use of model-resident default data. These data can easily be modified or tailored to reflect a particular need or specific AEC appli- cation. But, default values are changed only on an as-needed or excep- tion basis. The sections of this report that describe the model address both the input and default data requirements.

The second major assumption deals with the paper-based versus AEC-
based training quality and training approach. The relative quality of
training provided by a traditional paper-based and AEC-based train-
ing is a contested issue. Traditionalists strongly believe that the tried-
and-true paper-based approach is the most productive way to train.
The AEC training advocates believe the AEC training experience is
better and is more productive. In fact, those favoring AECs cite a
growing amount of education and DOD evidence that indicate the
power of automated data versus paper, and point out that AEC-like
environments (as opposed to paper) are becoming more the norm
for the youth of the nation.
The model addresses the training quality question by assuming that
both paper-based and AEC-based course alternatives train to the same
standard and that the training provided by the two alternatives is
equivalent. As discussed in this report, the current default values
assume that, while both the AEC-based and the paper-based course
alternatives achieve a common training standard, the AEC course
does it in less time.
In terms of training approach, a real power of AEC-based training is
its ability to allow a student to progress at his or her own pace. The
paper-based approach by necessity is more lockstep in nature. There
is intuitive and documented evidence that a self-paced approach has merit in terms of improved and quicker training. Consistent with cur-
rent procedures, however, the model assumes that both the paper
and AEC alternatives will be group paced. This again works against a
perceived strength of the AEC format.
The third major assumption is tied to fact that the ABC Analysis Tool
estimates the relative cost benefit of an AEC conversion relative to its
paper-based alternative. Consistent with this assumption or design
decision, the model only attempts to capture differences between the
paper-based and AEC-based training alternative. Therefore, it is
implicitly assumed that only the costs computed in the model are
different for a paper versus an AEC course. All other costs and param-
eters are assumed to be the same or at least comparable for the two
training delivery alternatives.
10

Potential uses for the model
The ABC Analysis Tool is designed to support multiple levels of Navy decision-makers. At the highest levels (SecNav and OpNav) the model can be used to evaluate, quantify, and defend AEC technology- related analysis, decisions, and policies. Typical users at this level are the N7 and N8 policy offices, the Program Executive Officers (PEO), and the system Program Management Officers (PMO).
At the fleet and operational levels, the ABC Analysis Tool can help evaluate the implications of AEC training solutions for identified existing issues and problems. At the systems command and school lev- els, it can provide an easy-to-use means to improve training and save resources.
We identified several functional uses for the ABC Analysis Tool during the study that helped shape the development process. These potential uses are listed and discussed below:
• Incorporate the ABC Analysis Tool into Navy Training Plans.
• Use the ABC Analysis Tool to support the Training Technology Baseline Assessment Memorandum (BAM) and other head- quarters analysis requirements.
• Use the ABC Analysis Tool to address Navy Training Require- ment Review NTRR requirements.
• Institutionalize the ABC Analysis Tool by integrating it with existing data sets and analysis tools.
A Navy Training Plan (NTP) is required for each new aircraft, equip- ment, system, subsystem, and nonhardware or total ship development that goes through the Navy acquisition process. The NTP is a detailed training blueprint for the new system. It is designed to ensure that the training for a new system is well defined, is fully coordinated, and con- siders total Navy costs and efficiency.
11

Despite the Navy emphasis, attention, and policy on training, a full review of all the training alternatives for a system is often difficult to accomplish. First, the program manager is responsible for developing the training for the new system but not for the support or life-cycle management of the training. In addition, the program manager typi- cally must fund training within the program acquisition budget. Not surprisingly, paper-based training alternatives that require lower ini- tial investment but higher operations and support costs often are rec- ommended.
The resource sponsor training office is responsible for the review of the system training plan recommended by the system program office. This training system review is part of the milestone 3 acquisition review for a new system. The goal of the milestone 3 training review in part is to address total Navy training over the life of the system. Thus, it is the logical point for reviewing whether an AEC or other training alternative should be pursued. However, it is very difficult to assess the full Navy (development, student, support and life cycle) costs in a consistent manner and there is no standard methodology, data formats, data definition, and corporate data sets established for doing so.
The concept forwarded in this study is that the ABC Analysis Tool could provide a standardized approach and data to support the required training analysis at milestone 3 of the acquisition process. This could be accomplished by providing the model to program man- agers and discussing how the resulting ROI was considered in the ensuing training recommendations. Alternatively, the program man- ager could provide the required input data and the resource manager could run the model to ensure that total Navy training costs were con- sidered in the recommended training plan.
The policy level uses of the model are based on the type of cost-ben- efit questions that arise in the normal course of business. The model would also be useful in meeting the need for quick and consistent "what if analysis and for quantifying and defending policies and funding levels/decisions.
At the systems command and operational command levels, the ABC Analysis Tool would be valuable for reviewing questions and address-
12
ing issues raised by the fleet. The tool could be useful for staffers as they participate and address concerns raised by the Surface Warfare Training Requirement Review (SWTRR) or the Submarine Inte- grated Underwater Surveillance System Requirement Review (SITRR).
Finally, the ABC Analysis Tool could be integrated and linked to exist- ing databases and analysis approaches that need to quickly assess the potential payoff of the AEC training alternative. An example of the database linkage could be running the tool against all the courses in the NITRAS database to estimate the possible ROI of converting all the courses and identifying the high-payoff candidates. Another example could be to run the model with the developmental NAVSEA IETM database to identify the courses with large documentation requirements that would not require a data conversion step. In still another scenario, the tool could be used for a media selection or training evaluation analysis model to assess the payoff and costs of the AEC alternative.
13

Return-on-investment (ROI) definitions
The ABC Analysis Tool is an ROI-based model. It computes the esti- mated return the Navy would realize if it made the investment decision to convert a paper-based course or set of courses to an AEC format. The return part of the ROI computation is defined as the expected benefits (in terms of cost savings or cost avoidance) divided by the investment costs for a specified period of time and discount rate:
ROI = Benefits (savings)/AEC investment costs .
The costs and savings considered in the model are total Navy costs. That is, they are not restricted to the Navy training accounts. The model also does not distinguish between whether the benefits are sav- ings (reductions from the budget) or cost avoidances (reductions in required but currently unfunded costs that can be avoided by convert- ing to an AEC format). Simply put, the Navy will decide how to apply the reductions and there is no inherent identifier as to whether the reductions are savings or cost avoidances. If the Navy uses the reduc- tions to lower the Navy budget, savings result. If the Navy applies the reductions against other shortages or funding problems (as often is the case for training), the reductions result in cost avoidances.
In some areas, the cost of doing business under an AEC is greater than the comparable paper-based course. These recurring AEC costs reduce the net savings associated with an AEC alternative. The model com- putes the recurring AEC costs and subtracts them from the savings computed for the AEC alternative. (That is, a net savings is computed by estimating the benefits of the AEC relative to the paper course and subtracting any identified recurring cost of doing business under an AEC.) The consideration of AEC recurring modifies the ROI formula as follows:
ROI = Benefits (savings) - AEC recurring costs/AEC investment costs .
15

Several parameters, or factors, affect an ROI computation and must be considered. A very important one is the period of time considered in computing the ROI value. Several values could be used, such as:
• Life of AEC classroom
• POM cycle
• Some specified period of consideration (e.g., 10 years).
The current model default value for the planning period is the 5-year POM cycle.
Other factors related to the planning period include the inflation rate, real growth rate, and discount rate assumed for the planning period. The current model default for each of these factors is zero.
16

Conceptual framework for ABC Analysis Tool
The ABC Analysis Tool computes the ROI associated with the conver- sion of a paper-based course to an AEC format. This computation requires the model to estimate the investment costs, the recurring costs and the savings/benefits associated with the conversion. This section provides an overview of the conceptual framework, or foun- dation, for the model.
Investment costs are based on two events—the conversion of the paper-based course and the setup of the AEC classrooms. Starting with the course conversion, the model assumes that a prescribed set of steps is needed to convert a course. Each step has associated costs, which the ABC Analysis Tool attempts to capture.
The conversion process (and the steps that constitute it) is consistent with Navy training policy and the approach used by NAVSEA in its AEC classroom developments. The process is also consistent with and follows Instructional System Design (ISD) principles and rules. The key steps in the conversion process are:
• Convert the paper-based course at the training objectives level of detail.
• Perform a media analysis of the course training objectives.
• Incorporate the results of the media analysis into the course Instructional Media Design Report (IMDR).
• Develop the animations and simulations identified in the media analysis and documented in the IMDR.
• SGML tag and convert data.
The first step (conversion at the training objectives level of detail) involves transcribing and automating the paper-based course training objectives. These training objectives then become the starting point
17
or source data for a full media analysis, the second step in the conver-
sion process. In the media analysis, the training developer identifies
redundancies, inefficiencies, and areas in the paper-based training
objectives that could be assisted with simple animations and/or more
complete simulations. The net result of this process is a course-
specific training plan or design that meets the training objectives of
the original paper-based course but does so in less time using the opti-
mization and power of the animations/simulations associated with
the AEC alternative. As noted in the assumptions discussion, we
assume that the AEC and paper-based courses train to the same stan-
dard. Consistent with this assumption, all of the classroom benefits
associated with the AEC option are tied to course length.
The third step in the process takes the result of the media analysis and
incorporates it into the IMDR required for all Navy courses. In many ways, the IMDR is the detailed blueprint for the AEC-based course. The fourth step in the process involves the actual development of the
animations and more detailed simulations identified in the media analysis and spelled out in the IMDR.
The final step, when necessary, is to use the Standard Graphic
Markup Language (SGML) to convert the technical manuals and
technical documentation associated with the course into an auto-
mated Electronic Technical Manual (ETM) format. Documents and materials already authored in an ETM format do not require this step
in the conversion process. In addition, AEC approaches that do not
SGML tag all the media would require different factors.
Although the first four steps are required in some form for any paper-
to-AEC course conversion, there can be and are variations. For instance, the media analysis step could be minimized or essentially
eliminated with the result that the AEC course would merely "show
the pages" of the paper-based course with little or no change. Taken
to its extreme, this approach would result in the paper-based course
shown on a computer screen. Such an approach would not take
advantage of the AEC delivery capability, and the resulting AEC
course could be more costly than the paper-based one it replaced.
The default values associated with such a cut rate or "low impact" con-
version approach could be very different from the one currently
18
incorporated in the ABC Analysis Tool. That is, while the model would apply for the different conversion approaches and AEC con- ceptual models, the resulting ROI values (based on the default values used) might be very different.
The AEC classroom setup cost is the second major driver in the AEC investment cost computation. The ABC Analysis Tool assumes that the AEC setup cost for a given course is the product of the number of AEC classrooms required for the course and unit cost to establish or set up a classroom.
As discussed in the cost section, the model computes the number of AEC classrooms required and uses a default value for the unit setup cost of a typical Core, A-School, and C-School course. Again, one must recognize that the unit cost is a default value. The current defaults reflect the NAVSEA AEC model, but the model (with the appropriate default values) is just as valid and appropriate for other classroom designs or concepts.
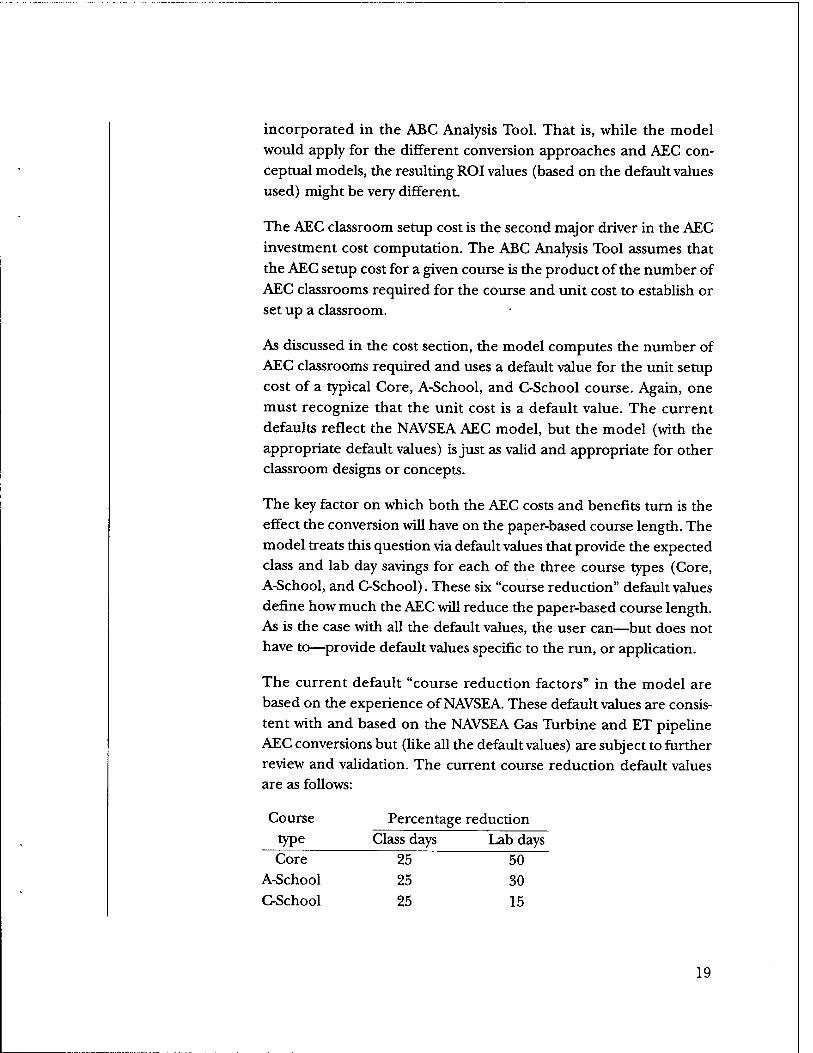
The key factor on which both the AEC costs and benefits turn is the effect the conversion will have on the paper-based course length. The model treats this question via default values that provide the expected class and lab day savings for each of the three course types (Core, A-School, and C-School). These six "course reduction" default values define how much the AEC will reduce the paper-based course length. As is the case with all the default values, the user can—but does not have to—provide default values specific to the run, or application.
The current default "course reduction factors" in the model are based on the experience of NAVSEA. These default values are consis- tent with and based on the NAVSEA Gas Turbine and ET pipeline AEC conversions but (like all the default values) are subject to further review and validation. The current course reduction default values are as follows:
Course Percentage reduction type Class days Lab days Core 25 50
A-School 25 30 C-School 25 15
19
AEC-related costs and benefits—an overview
This section of the report describes the AEC costs considered in the ABC Analysis Tool. Consistent with its design, the model addresses
only the costs incurred during a course conversion and the costs
expected to be different for a paper-based and AEC-based training option.
The costs addressed in the ABC Analysis Tool are broken down into
elements, or areas. Some of these elements tend to be more expen-
sive for the AEC option; collectively, they constitute a net cost of the AEC conversion. Other cost elements are less expensive for the AEC. These costs collectively define the benefit (savings) associated with
the AEC relative to the paper-based course option.
The costs and benefits considered in the study are listed below, and
the ones included in the ABC Analysis Tool are discussed in subse-
quent sections. More detailed information about costs, benefits, and the inner workings of the ABC Analysis Tool are provided in the appendices. These appendices collectively provide details on the model's cost and benefit formulas and variables, its parameters, input variables, and default variables and values. The appendices and the topics they address are as follows:
• Appendix A discusses the ABC Analysis Tool computations in detail.
• Appendix B provides a listing of a model run for the ET Core
course and the actual formulas used in the model's Excel spreadsheets.
AEC costs considered in ABC Analysis Tool
AEC-related costs are those for which an AEC training option is
expected to be greater than the comparable costs associated with a
21

traditional paper-based course. There are two types of AEC-related
costs considered in the ABC Analysis Tool. The first includes the one-
time investment costs needed to set up and establish the AEC-based
course(s). The investment costs considered in the ABC Analysis Tool
are:
• AEC classroom and lab/LRC automation setup costs
• Course conversion and media selection analysis costs
• IMDR development costs
• Data tagging and conversion costs.
The second type of costs are the recurring costs that reflect the higher
cost of doing business under an AEC versus a paper-based course.
The recurring costs, as the name implies, continue or recur over the
life of the course. Recurring costs are those associated with the day-to- day operation of a AEC classroom that either do not occur for a paper-based course or occur at a significantly reduced cost. The two
recurring costs addressed in the ABC Analysis Tool are:
• Increased AEC life-cycle costs
• "Use of AEC technology" training costs.
AEC benefits considered in ABC Analysis Tool
The AEC-related benefits addressed in the ABC Analysis Tool are
items that typically cost less for an AEC-based course than its paper-
based counterpart. The drivers for the AEC benefits are the expected
shorter course length, the elimination of paper management func-
tions needed for a paper-based course, and the reduction in time
needed for an instructor to prepare to teach the course. The benefits
addressed in the ABC Analysis Tool that result from these drivers are:
• Student savings (due to the shortened course length)
• Instructor savings (due to the shortened course length, and
reduced preparation/personalization time)
• Course related technical material and technical documenta-
tion (TM/TD) paper management savings.
22

Other potential AEC costs and benefits (not included in ABC Analysis Tool)
Several potential AEC-related costs that were considered in the study are not currently included in the model. Some of these include:
• Loss training time due to AEC equipment and software downtime
• Requirements for AEC courses to maintain backup paper mate- rial as a hedge against downtime
• AEC hardware/software component and system theft, upgrade, and replacement
• Loss of classroom space for other (than AEC training) purposes
• Duplicative overhead, management, and support cost for AEC and paper courses within a school or training community.
The major reasons for not including these "other" costs are lack of information and/or evidence that the costs are valid or significant across a large sample of courses. In fact, most of the "other" costs may well reflect transition issues that would be resolved as the Navy gains more experience with AECs and "works the kinks out of the system." Of course, the excluded costs with perceived merit could and should be researched further in subsequent efforts.
Like the cost area, there are several AEC-related benefits claimed for AEC courses that are not captured in the model. Some of the poten- tial savings identified during the study include:
• Lower setback and course/Navy attrition rates
• Instructor and student paper management savings
• AEC classroom sharing among classes and courses
• Lower simulator, training equipment, and training device cost
• Less per-student support (due to shorter course).
The attrition savings could be a major factor in the AEC conversion ROI computation. However, while there is some preliminary limited
23
data that points toward lower attrition, we did not find enough docu-
mented experience or data to include this potentially major saving in
the model. The study recommendation is to pursue this line of
research to determine if there is an impact on school and Navy attri-
tion and to assess the cost/saving implications.
The second item listed is related to the paper management savings
included in the ABC Analysis Tool. While the model addresses the
"non-classroom" management costs, it does not include the time
needed to revise and keep current the instructor and student copies
of the technical materials associated with the course. This function,
typically performed by the course instructor, can require a great deal
of time to accomplish for a given course. The difficulty in addressing
this cost is the lack of data and the likely differences in both the way
the function is accomplished and the amount of effort needed to do it across all Navy courses.
The third item focuses on decisions to use high-sided AEC investment
cost estimates in the model. In general, the ABC Analysis Tool does
not account for the types of savings associated with increased use of
AEC courses and sharing of AEC classrooms across classes or courses
at a school. For instance, as the number of AEC courses increase at a school, there will be additional AEC classrooms, ADP equipment, software, and support staff available, and this will lead to opportuni-
ties for efficiencies that are not possible with a single AEC course.
Some other assumptions that lead to high-end cost estimates include:
• A constant lab/learning resource center (LRC) automation
cost per AEC classroom is assumed regardless of how many
classrooms are established for the course or school. (This unit lab/LRC automation cost would likely decrease as the number of AECs increases.)
• The costing assumes that an AEC classroom is dedicated to a
single class for the length of the course and that there is a single
shift of training for the course. Thus, the model assumes that
the AEC classroom is not shared with other classes or courses
for the length of the class using it. (This is one of the restric- tions that we recommend relaxing in future versions of the
model.)
24
The fourth item listed is tied to the fact that animations and simula- tions are integral parts of an AEC course and that the AEC classroom is an automated environment. Therefore, it can be argued that the requirement for training equipment and training devices would be decreased or at least the amount of time spent on them would be less for an AEC than it would be for a paper-based course. This saving is difficult to quantify and appears too small for most courses relative to the other factors considered in the model.
The final item deals with the fact that, taken in the aggregate, shorter courses mean that less schoolhouse support and infrastructure is needed per student. This is especially true as the number of AEC courses increases. Developing credible estimates for this type of effect is difficult and problematic for the ABC Analysis Tool, which focuses on a course-by-course process.
25
AEC-related investment costs
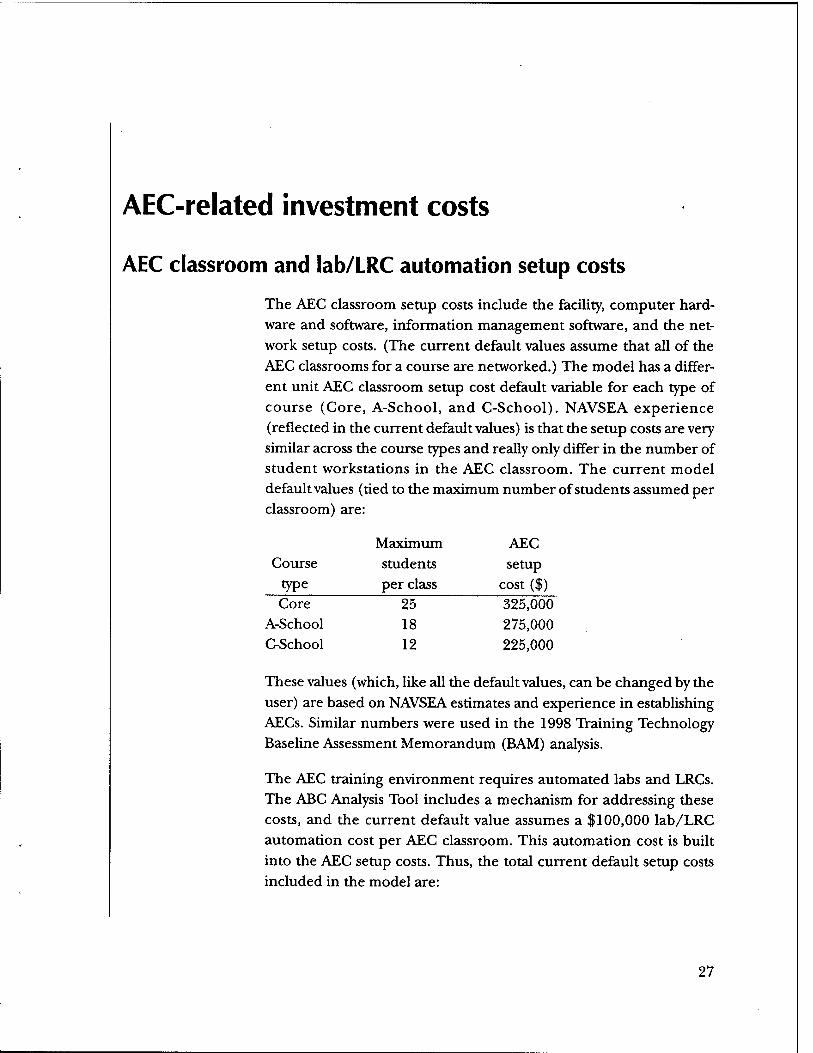
AEC classroom and lab/LRC automation setup costs
The AEC classroom setup costs include the facility, computer hard- ware and software, information management software, and the net- work setup costs. (The current default values assume that all of the AEC classrooms for a course are networked.) The model has a differ- ent unit AEC classroom setup cost default variable for each type of course (Core, A-School, and C-School). NAVSEA experience (reflected in the current default values) is that the setup costs are very similar across the course types and really only differ in the number of student workstations in the AEC classroom. The current model default values (tied to the maximum number of students assumed per classroom) are:
Maximum AEC Course students setup
type per class cost($) Core 25 325,000
A-School 18 275,000 C-School 12 225,000
These values (which, like all the default values, can be changed by the user) are based on NAVSEA estimates and experience in establishing AECs. Similar numbers were used in the 1998 Training Technology Baseline Assessment Memorandum (BAM) analysis.
The AEC training environment requires automated labs and LRCs. The ABC Analysis Tool includes a mechanism for addressing these costs, and the current default value assumes a $100,000 lab/LRC automation cost per AEC classroom. This automation cost is built into the AEC setup costs. Thus, the total current default setup costs included in the model are:
27
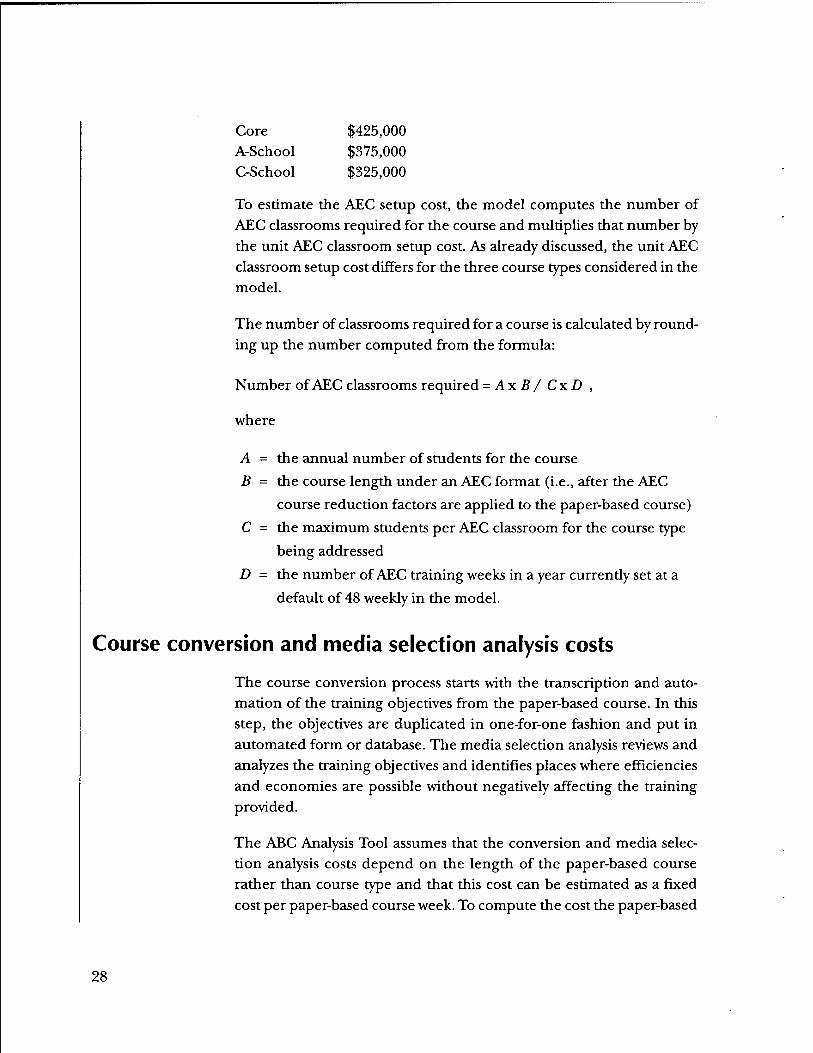
Core $425,000 A-School $375,000 C-School $325,000
To estimate the AEC setup cost, the model computes the number of AEC classrooms required for the course and multiplies that number by the unit AEC classroom setup cost. As already discussed, the unit AEC classroom setup cost differs for the three course types considered in the model.
The number of classrooms required for a course is calculated by round- ing up the number computed from the formula:
Number of AEC classrooms required = Ax B / CxD ,
where
A - the annual number of students for the course
B = the course length under an AEC format (i.e., after the AEC
course reduction factors are applied to the paper-based course)
C = the maximum students per AEC classroom for the course type
being addressed
D = the number of AEC training weeks in a year currentiy set at a
default of 48 weekly in the model.
Course conversion and media selection analysis costs
The course conversion process starts with the transcription and auto- mation of the training objectives from the paper-based course. In this step, the objectives are duplicated in one-for-one fashion and put in automated form or database. The media selection analysis reviews and analyzes the training objectives and identifies places where efficiencies and economies are possible without negatively affecting the training provided.
The ABC Analysis Tool assumes that the conversion and media selec- tion analysis costs depend on the length of the paper-based course rather than course type and that this cost can be estimated as a fixed cost per paper-based course week. To compute the cost the paper-based
28

course length (a required model input) is converted to course weeks. This number is then multiplied by the per-week conversion cost default value. The current default value, based on NAVSEA/ FTSCLANT experience, is $10,000 per paper-based course week.
Instructional Media Design Report (IMDR) development cost
An IMDR, a detailed blueprint for a course, is required for all Navy courses. Because the conversion of a course to an AEC format will change the course, the cost to revise or develop an IMDR must be included as an AEC investment costs.
The ABC Analysis Tool assumes that IMDR development costs associ- ated with the AEC-based course depend on the length of the AEC- based course rather than course type. It also assumes that there is a fixed charge to define or set up the IMDR that is incurred for all courses (regardless of course length) and a second (lower cost) to develop the IMDR once the setup has been accomplished.
The model estimates this cost by using the course length for the paper-based course (required input data for the model) and default values. First, the paper-based course length is used to compute the AEC course length (based on the course reduction default variables already discussed). The resulting AEC-based course length is con- verted to AEC course weeks. Next, a default value is used to estimate the cost to set up and format the IMDR. The setup cost is associated with the first week of the course. A second, lower default IMDR devel- opment cost value is assumed for the remaining weeks of the course.
The cost formula for the IMDR development costs is:
IMDR development costs = IMDR setup cost + (AEC course weeks -1)
x continuing IMDR development cost per week .
The current default values, based on NAVSEA/FTSCLANT experi- ence, assume a $10,000 IMDR setup cost and a $500 continuing devel- opment cost for each additional AEC course week.
29

Costs for animations and simulations (A&S)
The A&S costs address the requirement to develop the animations and simulations associated with an AEC course. Animations and sim- ulations are key elements in an AEC course and are one of the major reasons an AEC-based can meet the course learning objectives in less time than a paper-based course. The A&S needs for a course are iden- tified in the course media selection analysis and are documented in the course IMDR.
The A&S development investment costs has the form:
A&S development costs = AxBx C+ DxExF,
where
A = number of AEC class days
B = unit A&S development costs per class day
C = number of A&S per class day
D = number of AEC lab days
E = unit A&S development costs per lab day
F = number of A&S per lab day.
The ABC Analysis Tool uses default values to estimate the animations and simulations required by course type and the unit costs per A&S. The model assumes that each AEC class day and lab day will require animations. The model further assumes the number of A&S needed per day and the average cost per A&S.
The model calls for two sets of A&S-related default values. The first set of six values estimates the average number of A&S per class and lab day for each of the three course types. The second set of values estimates the unit A&S development costs for a class and lab day. These A&S unit cost default values are assumed to be constant over the three course types.
The current NAVSEA/FTSCLANT-based default values call for a $5,000-per-class-day A&S and $50,000-per-lab-day A&S development cost. The default values of A&S needed per class and lab day are:
30

Course A&S per A&S per type class day lab day Core 10 7
A-School 10 4 C-School 10 2
Data conversion to digital format costs
The data conversion investment costs address the requirement to con- vert and automate all the paper-formatted technical material (techni- cal manuals, technical documentation, NEC rating, etc.) associated with a course. This conversion consists of using the Standard Graphic Markup Language (SGML) to "tag" the technical materials and con- vert them into an electronic form. Materials already authored in an Interactive Electronic Technical Manual (IETM) do not have to con- verted. Therefore, the conversion step (and the cost that goes with it) may not be needed for some or all of the technical materials associ- ated with a paper-based course.
The ABC Analysis Tool requires the number of volumes of technical material associated with a paper-based course as input. It also requires that the user indicate whether the technical material already exists in an automated form. The model uses default values to estimate on aver- age how many pages there are per volume of technical material and the per-page cost to tag and automate the paper-formatted material.
The default values currendy used in the model are 200 pages per tech- nical volume and $10 per page to convert a page using SGML. This SGML cost is consistent with NAVSEA IETM and AEC course conver- sion experience to SGML tag and convert to an IETM in Electronic Book Technology (EBT) format. As already noted, AEC treatments that only make partial use of SGML tagged materials would require different values and parameters.
31

AEC-related recurring costs
Increased AEC life-cycle cost
The increased AEC life-cycle cost accounts for the fact that an AEC classroom is automated and is more expensive to operate and main- tain than the traditional paper-based classrooms. The costs consid- ered include both ADP-related support staff and contractual support. The functions addressed include operation and maintenance of the AEC classroom equipment and software. Thus, the life-cycle costs are intended to cover the resources required to ensure that the hardware and software remains current and operating.
The ABC Analysis Tool assumes that each AEC-based course will have a full-time network administrator and will have one additional ADP support staffer for each additional three AEC classrooms (rounded up). The model also assumes that ADP support contractor will be used for each course and that the annual support contract funding level will be 10 percent (a default value) of the total AEC classroom setup and lab/LRC automation cost.
The ABC Analysis Tool costing formula for the annual increased AEC life-cycle costs has the form:
Increased AEC life-cycle costs = A + B+ C ,
where
A = the cost of the network administrator [a default value]
B = (the number of AEC classrooms/classrooms supported per
ADP staffer [a default value]) x the annual cost of a ADP
support staffer [a default value]
C = the total AEC setup investment costs x the AEC support
contract factor [a default value].
33

The current default values (test data) in the ABC Analysis Tool are:
• $40,000 per year for a network administrator
• $30,000 per year for an ADP support staffer
• AEC support contract factor: 10%.
The annual increased AEC life-cycle cost is applied for each of the years in the planning period (default value is 5 years).
"Use of AEC technology" training costs
The annual "use of AEC technology" training costs include the cost to train the students and new instructors how to use the AEC software and capabilities. It also includes the annual training needed to main- tain currency for the network administrator and ADP support staffers.
The model assumes that each new instructor (one over the instructor tour length times the number of the course instructor billets) requires one week of training (a default value). It also assumes that the net- work administrator and ADP staffers require a week of training (a default value) each year to maintain currency. Students are assumed to need one day of training (a default value) for the course or set of AEC courses considered in the application under consideration.
In addition to the default values for network administrator and ADP support staff already discussed, the model relies on default values for the annual cost of an instructor and the daily cost for a student. The annual instructor and daily student default values currently in the model are $43,000 and $100, respectively.
The annual "use of technology" cost is applied for each of the years in the planning period (default value is 5 years).
34

AEC-related benefits
Reduced student costs
The annual reduced student cost benefit is computed by a formula of the form:
Reduced student cost = AxBxC,
where
A = the number of students in a course (a required model input)
B = the reduction in the paper-based course length resulting from
conversion to an AEC format (computed in the model)
C = the daily cost per student (a default value).
The course length reduction results from subtracting the AEC-based course length from the paper-based course length. The default value for the daily student cost currendy in the model is $100. The annual benefit is applied for each year of the planning period (default value is 5 years).
Reduced instructor costs
The reduced instructor cost benefit is built around a computed number of instructor billets saved per year under the AEC course rel- ative to the paper-based course. This instructor billet saving is then multiplied by the annual instructor cost (a default value currendy set at the 1995 E6 level of $43,000) for each year in the planning period (a default value currendy set at 5 years). The instructor billets saved are determined by subtracting the model computed AEC-based course instructor billets from the comparable paper-based course bil- lets (a required model input).
35

There are two sources of instructor-related savings considered in the ABC Analysis Tool. The first results from the reduced course length for an AEC-based course relative to a paper-based one. The second is tied to savings associated with an instructor's preparation and person- alization (P&P) for an AEC course relative to a paper-based course.
The estimated savings associated with the shorter course length starts with some required input data for the paper course. These include:
• The total number of instructor billets associated with the paper- based course
• The annual number of student entrants (entrants)
• The number of class and lab days
• The class and lab day student-instructor ratios.
Using these numbers, the model computes the average number of days a year spent in instruction (class room or lab) for the paper- based course and the corresponding "instructor-days-to-instructor-bil- lets ratio" as follows:
Class Instructor Days (CID) = (course class days x entrants)/
(classroom student-instructor ratio) Lab Instructor Days (LID) = (course lab days x entrants)/
(lab student-instructor ratio) Total Instructor Days (TID) = CED + LID
Instructor-Days-to- Instructor-Billets Ratio = TID/total instructor billets
Note that the instructor-days-to-instructor-billets ratio measures the percentage of the instructor's time spent on instruction versus other preparation and "overhead" activities. The model assumes that the instructor-days-to-instructor-billets ratio computed for the paper- based course will also hold for the AEC-based course.
The model computes the AEC course instructor billets requirements (before considering changes in the P&P times) in two steps. First, it computes the CID, LID, and TID for the AEC course. To make these calculations, the model uses the AEC class and lab days, the maxi- mum AEC class size (a default variable), and the paper-based course
36

Stepl
lab day student-instructor ratio. Second, it uses the AEC course TID and the paper-based course instructor-days-to-instructor-billets ratio defined above to compute the required AEC course instructor billets (again without considering changes in the P&P times). The actual cal- culation is:
AEC course instructor billets (without modified P&P effect) = TID
(for the AEC course)/instructor-days-to-instructor-billets ratio (for paper-based course) .
Thus, the model scales the paper-based instructor billet number to reflect changes in course length and class size but keeps the same loading and overhead factors assumed for the paper course. At this point, the number of AEC instructor billets does not explicitly reflect any reductions due to reduced instructor preparation and personal- ization time. This calculation is a little involved and takes several steps to explain.
In the first step, we define the default variables and values used in the model to address the preparation and personalization (P&P) times for paper-based and AEC courses. Next, in step 2, we use the results of step 1 to estimate the percentage of the paper-based instructor bil- lets devoted to P&P. In the third step, we compute how the reduced P&P times affect the instructor workforce. Finally, in step 4, we com- pute how the improvement identified in step 3 would reduce the P&P weights calculated in step 2, and we apply this change to the "scaled" AEC instructor billets number discussed above.
The ABC Analysis Tool uses the following definitions for instructor preparation and personalization times:
• Preparation time: The time spent by new instructors to become familiar with the course. This usually involves a new instructor observing a course for one class convening.
• Personalization time: The time required by an instructor to individualize the material in the instructor guide for the class (Personalization time is required for new instructors and for all instructors at course revision.)
37

Step 2
As noted, the AEC preparation time (with the current default values) for new instructor is equal to the course length since it involves sitting through the course for both the paper-based and AEC courses. The personalization time, on the other hand, is assumed to be different for the two training alternatives.
Personalization time estimates for new instructors are based on default values that identify the personalization time required per training day (class days and lab days). The current default values assume that there are military instructors and the number of "new" instructors is computed as 1 over the instructor tour length, which is a default value currenüy set at 3 years. These default values could be also be set for the average "tour length" of civilian instructors if appropriate for a course under review.
The personalization for course revisions are more complicated as additional default values are needed to estimate how many revisions occur per year and what percentage of the course is changed per revi- sion. (The current default values assume one course revision a year affecting 25 percent of the course days.)
The current personalization default values are:
Personalization Paper-based default values course AEC course
New instructor 1 day/course day .5 day/course day Course revision .25 day/course day .125 day/course day
The paper-based course instructor billets must include a provision factor, or weight, for preparation and personalization activities. We can compute how many instructor P&P days are implied by the default values discussed in step 1 for a paper-based course. That is, using the current 3-year default value for instructor tour length, one-third of the instructor workforce (the new instructors) requires 2 days (1 for preparation and 1 for personalization) for each class and lab day. In addition, two-thirds of the instructor workforce must deal with personalizing the course revisions (.25 times the total number of class and lab days). The combined P&P effect is:
38

Step 3
Paper-based course P&P effect = instructor billets * (1/3*2 + 2/3*.25) * (class + lab days) = 5/6 * instructor billets * (class + lab days) .
This number can then be used to develop a weighting factor by con- verting it to an annual number and dividing it by the number of instructor billets to yield:
Paper-based course P&P weight = (5/6 * instructor billets * (class + lab days) * (1/working
days per year)/instructor billets
(The weight for the ET Core run provided in appendix B is 41 percent.)
In this step, we compute the P&P improvements assumed in the default values for an AEC. These results can be summarized as follows:
Paper-based course P&P effect New instructors 1/3 of instructor billets x 2 x course
training days Revision 2/3 of instructor billets x .25 x course
training days Combined 5/6 of instructor billets x course
training days Improved P&P effect
New instructors 1 /3 of instructor billets x 1.5 x course training days
Revision 2/3 of instructor billets x .125 x course training days
Combined 7/12 of instructor billets x course training days
Difference (improvement) 3/12 of instructor billets x course training days
Thus, the assumed default values yield a 30-percent reduction (from 10/12 to 7/12) in the P&P activities.
39
Step 4
In this step, we multiply the P&P reduction factor computed in step 3
by the paper-based P&P factor developed in step 2. This adjustment
rate is then multiplied by the computed AEC instructor billets (which
are the paper-based instructor billets scaled for course length and
class size). The result is the instructor reductions attributed to
improved P&P activities.
The instructor billet saving is computed by subtracting the AEC
instructor billets from the paper-based course billets. The AEC billets
are computed by subtracting the P&P reduction just discussed from
the "scaled" AEC instructor number discussed earlier.
Paper management cost reduction
The ABC Analysis Tool includes two types of costs and excludes a third one in capturing the paper management cost reduction benefit
associated with an AEC course conversion. One of the "included"
costs covers reproducing the paper copies of the technical materials
for the course and shipping them to the schools. (This cost is
incurred by the technical material manager rather than the school.)
The second cost considered is that of the school technical librarians
who distribute the materials to the students and maintain school library copies.
The copying and shipping cost is based on the number of technical
volumes associated with the course (a required model input) and
three default values. The first estimates the number of pages per
volume of technical material. As already mentioned, this variable is
currently set at 200 in the model. The second default value estimates
the total number of pages that are revised per technical volume in a
year. The current default value for this variable is 50. The third
default value estimates the per page cost of copying and shipping the
copies of the technical materials to the school. This variable is cur-
rendy set at a low-sided value of $.05 in the model.
For the second cost considered, that associated with the school tech-
nical librarians, the model computes the total number of technical
40
material copies required for the paper-based course. It then uses default values to estimate the annual cost of a technical librarian and the number of copies a technical librarian can support in a year. The current default values incorporated in the model assume that a tech- nical librarian is an E5 with and annual cost of $35,000 and assumes that a technical librarian can maintain (distribute and control) 1,000,000 technical volume copies per year.
41

ABC Analysis Tool input, default, and output data
This section of the report describes the input, default variables, and output produced by the ABC Analysis Tool, The section also describes the use of the model via illustrative examples based on the ET training pipeline courses. (A full listing of the model, including the formulas, is also provided in appendix B.)
Input data
By design, the application-specific data input required to run the ABC Analysis Tool are very modest. Table 1 shows the required input as it appears in the model. As shown, there is limited course identifier data required (course name, type, and number), as well as course volume data (instructor billets and number of students), and some course content data (type of course, course length and class/lab days, stu- dent-instructor ratios, and number of volumes of technical material).
Table 1. ABC Analysis Tool course-specific input data
Course title
Course ID
Course type (1 = Core, 2 = A-School, 3 = C-School) Course length (in calendar days) Course class days Course lab days Student entrants (annual total) Students per class Instructor billets
Class day student instructor ratio
Lab day student instructor ratio
Volumes of course related paper technical material
Format of technical materials (0 = exists in IETM format, 1 = exists only in paper format)
43

Default variables and data
As highlighted throughout this report, the ABC Analysis Tool design is based on simple input data requirements and wide use of default values that can be, but do not have to be, tailored by the user for a par- ticular course or run of the model. Therefore, the set of default values used in the model play a key role in the ROI computations. It is very important that the user review the default values against the situation or course being analyzed and adjust them as appropriate.
The need to review and tailor the default values is especially impor- tant in using the model in its current prototype form. As noted, the goal of this initial development effort was to design a methodology and exercise it with test data that are "as good as possible in the time available." Consistent with this thrust, we focused on the model, vari- ables, and formulas. As expected, further analysis and validation are needed to define the best possible set or sets of default values that will be valid for all the different courses, communities, and AEC imple- mentation schema being tried and considered across the Navy.
After acknowledging the test data status of the current default values, we are very comfortable with them in the prototype model and believe they are quite reasonable for the NAVSEA AEC conversions and implementations. The study was very fortunate and benefited greatly by the support, cooperation, experience, and subject matter expertise provided by NAVSEA and the FTSCLANT.
The set of default variables (and values) currently included in the ABC Analysis Tool model are provided in table 2.
ABC Analysis Tool output
The output format shown in table 3 lists the costs, benefits, and com- puted ROI for the course or courses reviewed and the default values used for the run of the model. The model also produces a set of "intermediate values" used in the cost and benefit computations that provide useful information on the course estimates developed by the model. For instance, the estimated course length and required number of AEC classrooms is computed and provided in this section of the model output.
44

Table 2. ABC Analysis Tool default variables and values
Variable Value
Planning factors
Planning period (integer values - default = POM period) 5
. Discount rate (decimal values - default = 0.0) 0%
Inflation rate (decimal values - default = 0.0) 0%
Real growth rate (decimal values - default = 0.0) 0%
Achievable percent course reductions (AEC over paper-based course)
Class days - Core courses 0.25
Class days - A-School courses 0.25
Class days - C-School courses 0.25
Lab days - Core courses 0.50
Lab days - A-School courses 0.30
Lab days - C-School courses 0.15
AEC course days per paper course days
Class days - Core courses 0.75 Class days - A-School courses 0.75
Class days - C-School courses 0.75 Lab days - Core courses 0.50
Lab days - A-School courses 0.70
Lab days - C-School courses 0.85
AEC classroom setup costs (includes lab/LRC automation at $100K)
Core courses 425 A-School courses 375 C-School courses 325
Maximum AEC classroom size (number of student work stations)
Core courses 25 A-School courses 18 C-School courses 12
AEC classroom network, equipment, and SW support cost in $000
Annual network administrator cost (1 per course) 40
Annual cost per ADP support staffer 30 ' AEC classroom per ADP staffer 3
-
AEC classroom equipment and SW support cost as a percent of setup cost 0.1
45

Table 2. ABC Analysis Tool default variables and values (continued)
Variable Value
AEC course conversion costing
Conversion and optimization (cost per week in $000) 10
IMDR development (for first week in $000) 10
IMDR development (for each additional week in $000) 0.5
Animations and simulations per AEC course instruction day
Class days (all course types) 10
Lab days - Core courses 7
Lab days - A-School courses 4
Lab days - C-School courses 2
Unit animation and simulation costs
Class days in $000 5
Lab days in $000 50
"Use of AEC technology" training
New instructor training (weeks) 1
Network/support staff (weeks of annual training) 1
Students training days (once per pipeline) 1
instructor preparation and personalization days per instruction day
Preparation (for both paper and AEC courses) 1
Personalization (for paper courses) 1
Personalization (for AEC courses) 0.500
Personalization (for paper course revisions - assumes 25 percent of course revised) 0.250
Personalization (for AEC course revisions - assumes 25 percent of course revised) 0.125
Other ABC Tool default values
Maximum training weeks per year 48
Pages per technical volume 200
Pages per technical volume changed a year 50
Technical documents copies per student 1
Per page data conversion costs (to lETMs) in $000 0
Course revisions per year 1
Instructor tour length (in years) 3
Copies (volumes x students) managed per technical librarian 10,000
Annual technical librarian cost in $000 35
Pre-school copying and distribution cost/page in $000 0
Annual instructor billet costs in $000 43
Daily student costs in $000 0
46

Table 3. ABC Analysis Tool computations ($000)
Intermediate calculations
Total instructor days (paper course)
Instructor days per instructor billet (paper course) AEC class days
AEC lab days
AEC course length
AEC course weeks
AEC classroom size
AEC class rooms
Unit AEC setup cost
Computed preparation and personalization man-years - paper course
Preparation and personalization MY percent of instructors billets - paper course Total instructor days (AEC course) Number of AEC instructors (without reduced personalization time effect)
Reduction in AEC instructors due to reduced personalization time effect
Final number of AEC instructors (with reduced personalization time effect)
AEC investment costs
AEC classroom setup
Conversion and optimization IMDR development Animations and simulations Data conversion Subtotal
AEC recurring costs (annual costs summed over planning period) AEC life cycle
"Use of AEC technology" training Subtotal
AEC benefits (annual savings summed over planning period) Reduced student costs Reduced instructor costs
Reduced paper management costs
Subtotal
ROi value
47

Illustrative examples of ABC Analysis Tool runs
This section provides examples of the test runs made in developing the prototype ABC Analysis Tool. The input and default data used in runs depicted in this section are test data, and the reader is cautioned not to read too much into the results. Although we believe the ROIs shown to be approximately correct, the purpose of the discussion is describe the model and how it can be used.
Two runs are discussed. The first (also addressed in appendix B) addresses an analysis of a single course, and the second shows how the model can be used for a multicourse training pipeline. The courses selected for the examples are the Combat Systems Technical Core Course (A-l 00-0139) and the ET A-School Strand (A-l 00-140) .which constitute the ET pipeline. This particular pipeline was selected because, at the time of the study, NAVSEA was analyzing and discuss- ing possible conversion of the pipeline to an AEC format.
Most of the input and default data used in the example runs came from NAVSEA ET analysis materials. However, because the primary intent of this effort was to test the model (rather than use it to analyze course tradeoffs), we augmented the NAVSEA materials with test data when needed.
The first example provided in table 4 is for the A-School Core course A-100-0139. Using the admitted test input and default data, the model shows a 2.9 ROI over 5 years for converting this course. This means that the Navy would realize a 3:1 return in its AEC conversion investment for this one course over a 5-year period (with the assump- tions made for the run).
The A-100-0139 course and test run (shown in table 4) is also used as the basis for the ABC Analysis Tool sensitivity analysis discussion in the next section.
The second example (table 5) shows how the ABC Analysis Tool can be used to review conversion of a training pipeline. The example is based on the ET pipeline and shows how simple use of the Excel soft- ware allows the user to address the combined effect of converting more than one course.
48

Table 4. ABC Analysis Tool: illustrative example for Combat Systems Technical Core Course
Input variable name Course title
Course-specific input data
Course ID
Course type (1 = Core, 2 = A-School, 3 = C-School)
Course length (in calendar days)
Course class days Course lab days Student entrants (annual total) Students per class Instructor billets
Class day student Instructor ratio
Lab day student instructor ratio
Volumes of course related paper technical material
Format of tech materials (0 = exists in IETM format, 1 = exists only in paper format)
Default values used in ABC Analysis Tool Planning Factors
Planning period (integer values - default = POM period) Discount rate (decimal values - default = 0.0) Inflation rate (decimal values - default = 0.0) Real growth rate (decimal values - default = 0.0)
Achievable percentage course reductions (AEC over paper-based course) Class days - Core courses Class days - A-School courses Class days - C-School courses Lab days - Core courses
Lab days - A-School courses Lab days - C-School courses
AEC course days per paper course days Class days - Core courses
Class days - A-School courses
Class days - C-School courses
Lab days - Core courses
Lab days - A-School courses
Lab days - C-School courses
Combat Systems Technical Core
A-100-0139
1
166
78
40 2,880
25 106 25
10
2 1
5 0% 0% 0%
0.25 0.25 0.25 0.50 0.30
0.15
0.75 0.75 0.75
0.50 0.70
0.85
49

Table 4. ABC Analysis Tool: illustrative example for Combat Systems Technical
Core Course (continued)
AEC classroom setup costs (includes lab/LRC automation @ $100K)
Core courses 425
A-School courses 375
C-School courses 325
Maximum AEC classroom size (number of student work stations)
Core courses 25
A-School courses 18
C-School course 12
AEC classroom network, equipment and SW support cost in $000
Annual network administrator cost (1 per course) 40
Annual cost per ADP support staffer 30
AEC classrooms per ADP staffer 3
AEC classroom equipment and SW support cost as a percentage of setup cost 0.1
AEC course conversion costing
Conversion and optimization (cost per week in $000) 10
IMDR development (for first week in $000) 10
IMDR development (for each additional week in $000) 0.5
Animations and simulations per AEC course instruction day
Class days (all course types) 10
Lab days - Core courses 7
Lab days - A-School courses 4
Lab days - C-School courses 2
Unit animation and simulation costs
Class days in $000 5
Lab days in $000 50
"Use of AEC technology" training
New instructor training (weeks) 1
Network/support staff (weeks of annual training) 1
Students training days (once per pipeline) 1
Instructor preparation and personalization time per instruction day
Preparation (for both paper and AEC courses) 1
Personalization (for paper courses) 1
50

Table 4. ABC Analysis Tool: illustrative example for Combat Systems Technical Core Course (continued)
Personalization (for AEC courses) 0.500
Personalization (for paper course revisions - assumes 25 percent of course revised) 0.250
Personalization (for AEC course revisions - assumes 25 percent of course revised) 0.125
Other ABC Tool default values Maximum training weeks per year 48
Pages per technical volume 200
Pages per technical volume changed a year 50
Technical documents copies per student 1
Per page data conversion costs (to lETMs) in $000 0 Course revisions per year 1
Instructor tour length: (in years) 3
Copies (volumes x students) managed per technical librarian 10,000 Annual technical librarian cost in $000 35 Pre-school copying and distribution cost/page in $000 0 Annual instructor billet costs in $000 43 Daily student costs in $000 0
ABC Analysis Tool computations ($000) Intermediate calculations
Annual student instructor days (paper course)
Annual student instructor days per instructor billet (paper course) AEC class days AEC lab days AEC course length AEC course weeks AEC classroom size AEC classrooms Unit AEC setup cost
Computed preparation and personalization man-years - paper course
Preparation and personalization man-year percentage of instructor billets - paper course
Annual student instruction days (AEC course)
Number of AEC instructors (without reduced personalization time effect)
Reduction in AEC instructors due to reduced personalization time effect
Final number of AEC instructors (with reduced personalization time effect)
20,506
193
59
20
110 16 25 39
425
44
41%
12,499
65 5
60
51
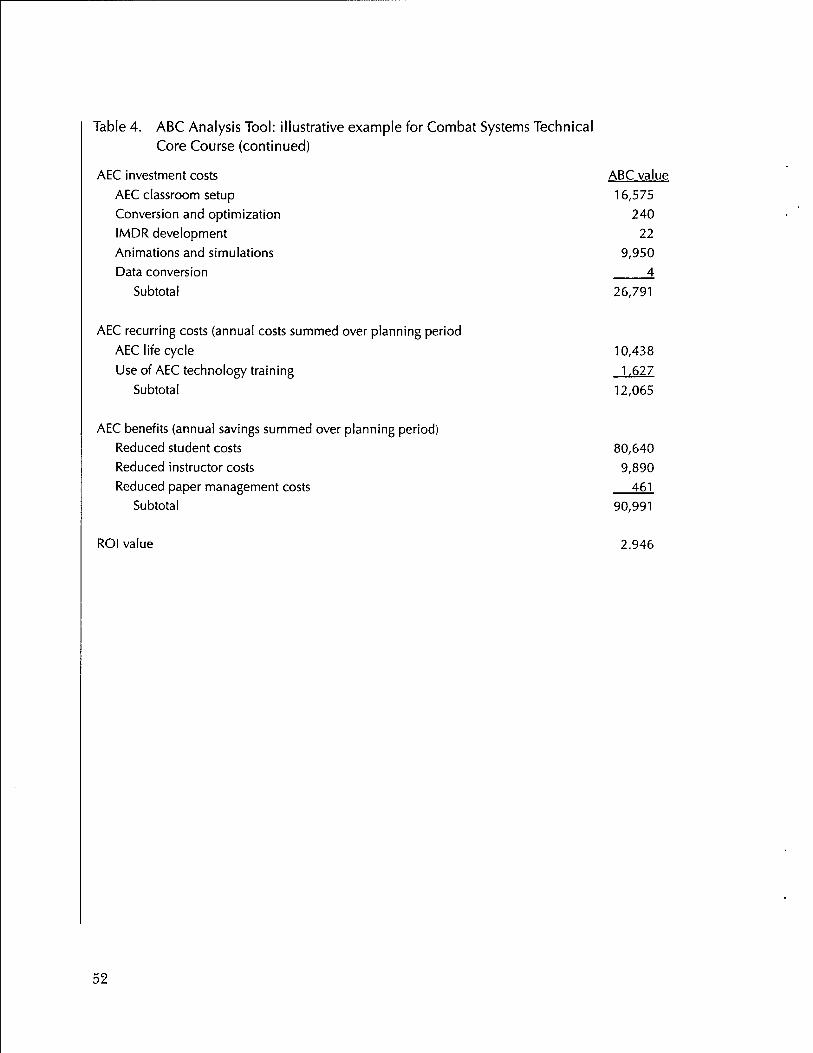
Table 4. ABC Analysis Tool: illustrative example for Combat Systems Technical
Core Course (continued)
AEC investment costs ABC value
AEC classroom setup 16,575
Conversion and optimization 240
IMDR development 22
Animations and simulations 9,950 Data conversion 4
Subtotal 26,791
AEC recurring costs (annual costs summed over planning period
AEC life cycle 10,438
Use of AEC technology training 1,627
Subtotal 12,065
AEC benefits (annual savings summed over planning period) Reduced student costs 80,640
Reduced instructor costs 9,890
Reduced paper management costs 461
Subtotal 90,991
ROI value 2.946
52
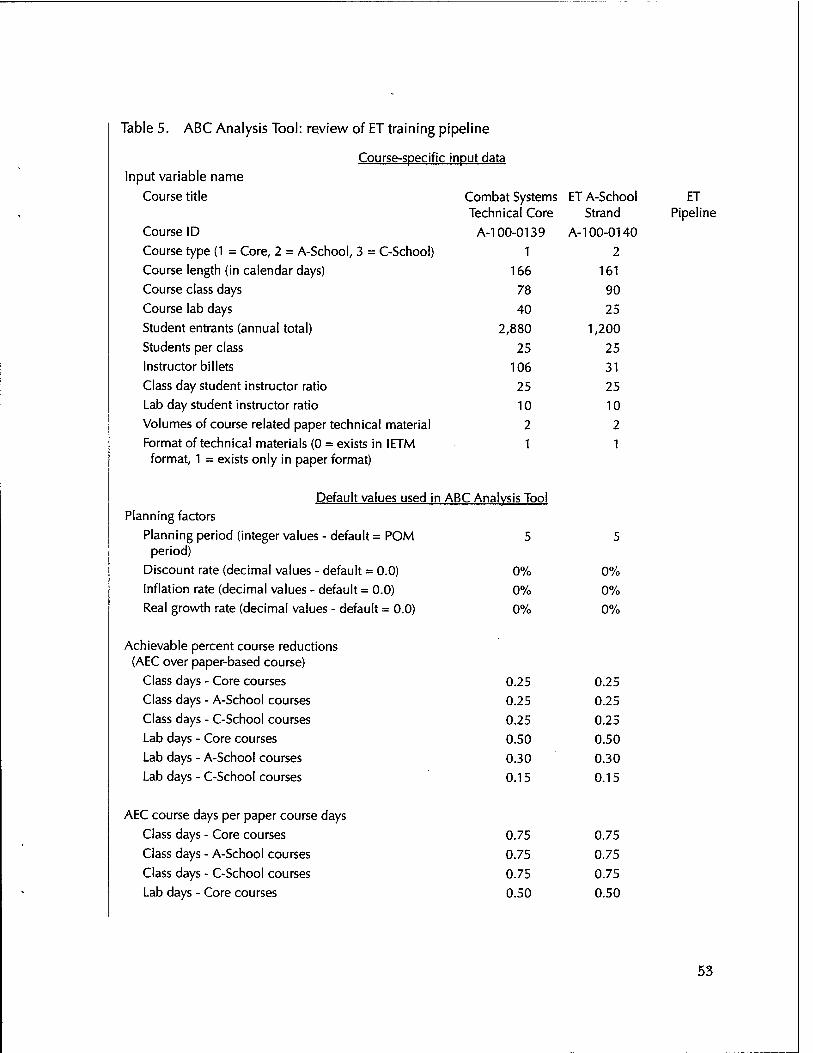
Table 5. ABC Analysis Tool: review of ET training pipeline
Course-specific input data Input variable name
Course title
Course ID
Course type (1 = Core, 2 = A-School, 3 = C-School) Course length (in calendar days) Course class days
Course lab days
Student entrants (annual total) Students per class
Instructor billets
Class day student instructor ratio Lab day student instructor ratio
Volumes of course related paper technical material
Format of technical materials (0 = exists in IETM format, 1 = exists only in paper format)
Default values used in ABC Analysis Tool Planning factors
Planning period (integer values - default = POM 5 period)
Discount rate (decimal values - default = 0.0) Inflation rate (decimal values - default = 0.0) Real growth rate (decimal values - default = 0.0)
Achievable percent course reductions (AEC over paper-based course)
Class days - Core courses Class days - A-School courses
Class days - C-School courses
Lab days - Core courses
Lab days - A-School courses Lab days - C-School courses
AEC course days per paper course days
Class days - Core courses
Class days - A-School courses
Class days - C-School courses Lab days - Core courses
Zombat Systems Technical Core
ET A-School Strand
ET Pipeline
A-100-0139 A-100-0140 1 2
166 161
78 90
40 25
2,880 1,200
25 25
106 31
25 25 10 10
2 2 1 1
0% 0% 0% 0% 0% 0%
0.25 0.25 0.25 0.25
0.25 0.25
0.50 0.50
0.30 0.30 0.15 0.15
0.75 0.75
0.75 0.75
0.75 0.75
0.50 0.50
53

425 425 375 375 325 325
25 25 18 18
12 12
40 40 30 30 3 3
0.1 0.1
Table 5. ABC Analysis Tool: review of ET training pipeline (continued)
Lab days - A-School courses 0.70 0.70
Lab days - C-School courses 0.85 0.85
AEC classroom setup costs (includes lab/LRC automation at $100K)
Core courses
A-School courses
C-School courses
Maximum AEC classroom size (number of student work stations)
Core courses
A-School courses
C-School courses
AEC classroom network, equipment and SW support cost in $000
Annual network administrator cost (1 per course) Annual cost per ADP support staffer AEC classroom per ADP staffer
AEC classroom equipment and SW support cost as a percent of setup cost
AEC course conversion costing
Conversion and optimization (cost per week in $000) IMDR development (for first week in $000)
IMDR development (for each additional week in $000)
Animations and simulations per AEC course instruction day
Class days (all course types)
Lab days - Core courses
Lab days - A-School courses
Lab days - C-School courses
Unit animation and simulation costs Class days in $000
Lab days in $000
"Use of AEC technology" training
New instructor training (weeks)
54
10 10 10 10 0.5 0.5
10 10 7 7 4 4 2 2
5 5 50 50
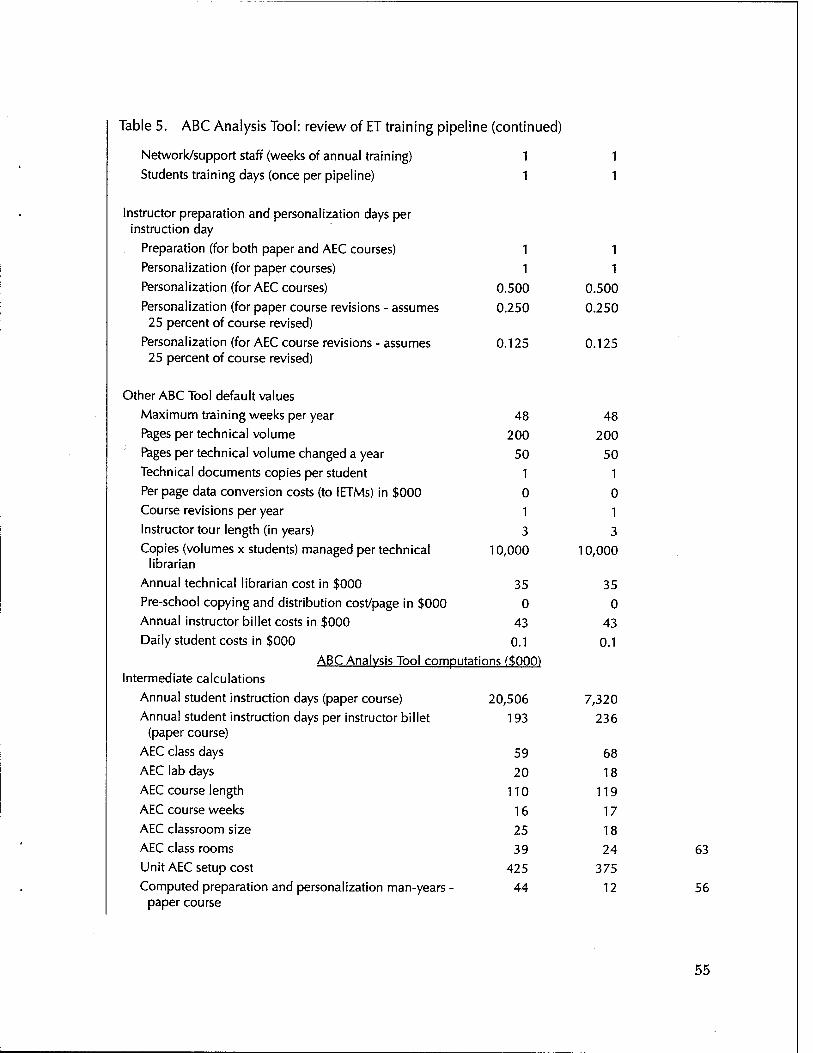
Table 5. ABC Analysis Tool: review of ET training pipeline (continued)
Network/support staff (weeks of annual training) 1 1
Students training days (once per pipeline) 1 1
. Instructor preparation and personalization days per instruction day
Preparation (for both paper and AEC courses) 1 1
Personalization (for paper courses) 1 1
Personalization (for AEC courses) 0.500 0.500
Personalization (for paper course revisions - assumes 0.250 0.250 25 percent of course revised)
Personalization (for AEC course revisions - assumes 0.125 0.125 25 percent of course revised)
Other ABC Tool default values
Maximum training weeks per year 48 48
Pages per technical volume 200 200
Pages per technical volume changed a year 50 50
Technical documents copies per student 1 1
Per page data conversion costs (to lETMs) in $000 0 0
Course revisions per year 1 1
Instructor tour length (in years) 3 3
Copies (volumes x students) managed per technical 10,000 10,000 librarian
Annual technical librarian cost in $000 35 35
Pre-school copying and distribution cost/page in $000 0 0
Annual instructor billet costs in $000 43 43
Daily student costs in $000 0.1 0.1
ABC Analysis Tool computations ($000)
Intermediate calculations
Annual student instruction days (paper course) 20,506 7,320
Annual student instruction days per instructor billet 193 236 (paper course)
AEC class days 59 68
AEC lab days 20 18
AEC course length 110 119
AEC course weeks 16 17
AEC classroom size 25 18 ' AEC class rooms 39 24 63
Unit AEC setup cost 425 375
. Computed preparation and personalization man-years - 44 12 56 paper course
55

Table 5. ABC Analysis Tool: review of ET training pipeline (continued)
Preparation and personalization man-year percent of instructors billets - paper course
Total instructor days (AEC course)
Number of AEC instructors (without reduced personalization time effect)
Reduction in AEC instructors due to reduced personalization time effect
Final number of AEC instructors (with reduced personalization time effect)
AEC investment costs
AEC classroom setup
Conversion and optimization
IMDR development
Animations and simulations
Data conversion
Subtotal
41% 40%
12,499 6,600
64.6 28.0 92.6
5.3 2.5 7.8
60 26 86
ABC value ABC value
16,575 9,000 25,575
240 230 470
22 21 3
9,950 7,000 16,950
4 4 8
26,791 16,255 43,046
AEC recurring costs (annual costs summed over planning period)
AEC life cycle
"Use of AEC technology" training
Subtotal
10,438
1.627
12,065
5,900
670
6,570
16,338
2,297
18,635
AEC benefits (annual savings summed over planning period)
Reduced student costs
Reduced instructor costs
Reduced paper management costs
Subtotal
ROI value
80,640 25,200 105,840
9,890 1,075 10,965
461 192 654
90,991
2.946
26,467
1.224
117,458
2.296
56

Sensitivity analysis ABC Analysis Tool input and default data
Sensitivity analysis overview
This section of the report uses the illustrative example introduced in the last section and presented in table 4 to show the power and capa- bility of the ABC Analysis Tool to perform sensitivity analysis of the model input and default values. We also discuss how the validated model could be used to develop Navy planning factors and/or esti- mates of the elasticity of these variables on the ROI. (In this discussion, we define the elasticity of a variable (say, variable x) to be the percent change in the ROI that would result from a 1-percent change in the value of x from a baseline number.)
To see how the sensitivity analysis is accomplished, assume that vali- dated data have been developed and the model has been exercised for a meaningful set of courses or pipelines. This set of courses and the related input data values, default data values and ROI values becomes the baseline for the sensitivity analysis. Starting with one of the courses, the analyst can vary an input or default data value (say, input variable x) and note the implication this change has on the ROI. In fact, sequentially running the model for a range of values of x will lead to a set of ROI values. These pairs of variable x values and associated ROI values can be used to generate a curve that reflects how (for this one course and for the set of input and default values) the ROI is related to the input value assumed for variable x.
Replicating the sensitivity analysis for an input variable x (or a group of variables) over several courses will yield a family of "ROI value versus input variable x value" curves. The first approximation of a elasticity can be computed from the curves, and the set of curves can be reviewed and studied for similarities and (very approximate) elasticities.
57

We can demonstrate the ABC Analysis Tool sensitivity analysis capabil- ity with the test data and prototype model results for the Combat Sys- tems Technical Core course (A-l00-0139). That is, we will use the data and model output for course A-l 00-0139 (provided in table 4 and appendix B) as the baseline for this sensitivity analysis discussion.
The material discussed in the following sections will provide insight on the sensitivity of the model and the ROI values computed by it. The real intent of the discussion, however, is to show how the model allows a sensitivity analysis. The complete sensitivity analysis will be accomplished after the model is fully validated and more complete data (rather than the test data used in this report) are collected for a meaningful sample of Navy courses.
Sensitivity analysis—impact of default ROI planning factors on ROI
The planning factors (the number of planning periods, the discount rate, the inflation rate, and the growth rate) are key variables in deter- mining the ROI associated with any course conversion. This section addresses how varying these factors affects the ROI value computed by the ABC Analysis Tool. The baseline for this discussion is the model run depicted in table 4 for course A-l00-1039, which produced an ROI of 2.95.
Table 6 summarizes the impact on the ROI value (changes from the test baseline run for course A-l 00-1039) of varying the length of the planning period considered in the ROI calculation. The different planning default values considered in the sensitivity analysis are:
• Baseline length of the planning period: 5 years (POM cycle)
• Full set of values considered: 3-, 4-, 5-, 6-, and 7-year planning periods.
Table 6 shows the effect of holding all the input and default values at the values shown in table 4 and allowing the number of periods to vary as indicated. The changes reflected in the table track because considering another year increases the annual benefits (numerator of the ROI formula) but not the initial investment (denominator).
58

The implication of this result is (for the default planning factors assumed) that one can compute a 1-year ROI and then infer the cor- responding ROI value for a longer period by multiplying the 1-year ROI by the number of years desired for the planning period.
Table 6. ABC Analysis Tool sensitivity analysis: length of planning period impact on ROI
Planning period (years) 3 4 5 6 7 ROI value 1.77 2.38 2.95 3.54 4.12
Percentage change in ROI value from baseline
-40 -20 - 20 40
The last line of the table shows that the ROI value changes at the same rate as the planning period. For example, a 20-percent change in the planning period (from 5 years to 4 or 6 years) results in a 20-percent change in the ROI value.
The next table holds the planning period constant at the default 5 years and varies first the discount rate assumed and then the infla- tion/growth rate. (The growth and inflation rate both affect future costs and savings in the same way.) The values considered in table 7 are as follows:
• Discount rate
— Baseline: 0 percent
— Additional values considered: 0, 2.5, 5.0, 7.5, and 10.0 percent
• Inflation/real growth
— Baseline: 0 percent
— Additional values considered: 0, 2.5, 5.0, 7.5, and 10.0 percent
Again, the changes reflected in the table are consistent with what might be expected. That is, larger discount rates decrease the com- puted ROI while increased inflation/growth increases it (in current dollars).
59

Table 7. ABC Analysis Tool sensitivity analysis: discount rate and inflation/growth rate impact on ROI
Discount rate impact on ROI
Discount rate (%) 0.0 2.5 5.0 7.5 10.0
ROI value 2.95 2.80 2.67 2.54 2.41
Percentage change in ROI value from baseline 0 -5 -10.5 -16 -18
Inflation and/or growth rate impact on ROI
Inflation rate (%) 0.0 2.5 5.0 7.5 10.0
ROI value 2.95 3.02 3.26 3.42 3.60
Percentage change in ROI value from baseline - +5 +9.5 +14 +22
Sensitivity analysis—impact of selected input data values on ROI
This section provides some preliminary results for a sensitivity analysis of the input data for course A-100-1039. Table 8 shows the impact of the student volume input variable on the ROI. Changing the student volume has a "tag along" impact on the number of class instructors required for the course. As mentioned, test data were used as a basis for the values in the table.
Table 8. ABC Analysis Tool sensitivity analysis: student volume (and related instructor billets) impact on ROI
Percentage changes
Student entrants Instructor billets
ROI value
Percentage change in ROI value from baseline
The changes reflected in the table "go the right direction" but are not linear or symmetric around the baseline. Much of this is because there are changes in both the denominator (the investment cost) and the numerator of the ROI calculation. However, further analysis is required to gain a firmer understanding and assess the full implica- tions of the results noted.
60
-50 -25 - 25 50 1,440 2,160 2,880 3,600 4,320
53 79 106 133 159 2.09 2.62 2.95 3.23 3.41
-29 -11 — +10 +16
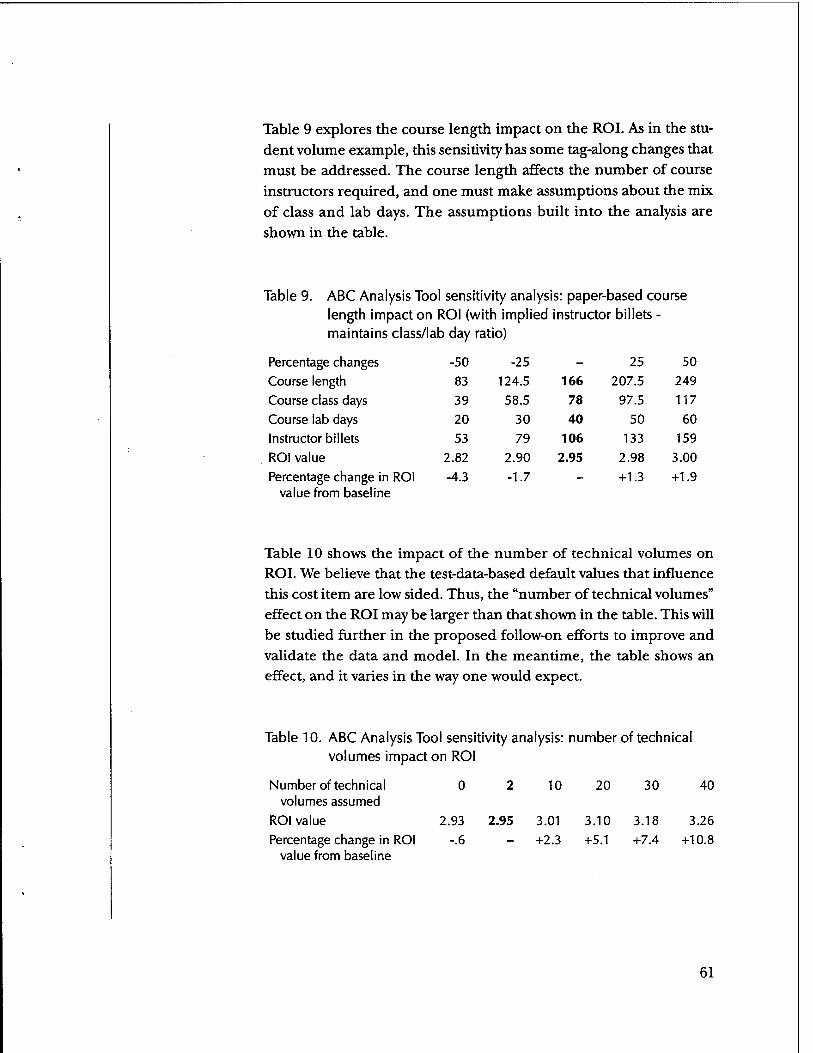
Table 9 explores the course length impact on the ROI. As in the stu-
dent volume example, this sensitivity has some tag-along changes that
must be addressed. The course length affects the number of course
instructors required, and one must make assumptions about the mix
of class and lab days. The assumptions built into the analysis are
shown in the table.
Table 9. ABC Analysis Tool sensitivity analysis: paper-based course length impact on ROI (with implied instructor billets - maintains class/lab day ratio)
Percentage changes Course length Course class days Course lab days Instructor billets ROI value Percentage change in ROI
value from baseline
Table 10 shows the impact of the number of technical volumes on ROI. We believe that the test-data-based default values that influence
this cost item are low sided. Thus, the "number of technical volumes"
effect on the ROI may be larger than that shown in the table. This will
be studied further in the proposed follow-on efforts to improve and
validate the data and model. In the meantime, the table shows an effect, and it varies in the way one would expect.
Table 10. ABC Analysis Tool sensitivity analysis: number of technical volumes impact on ROI
-50 -25 - 25 50
83 124.5 166 207.5 249
39 58.5 78 97.5 117
20 30 40 50 60
53 79 106 133 159
2.82 2.90 2.95 2.98 3.00
-4.3 -1.7 _ +1.3 +1.9
Number of technical volumes assumed
0 2 10 20 30 40
ROI value 2.93 2.95 3.01 3.10 3.18 3.26
Percentage change in ROI value from baseline
-.6 - +2.3 +5.1 +7.4 +10.8
61

Sensitivity analysis—impact of selected default data values on ROI
Tables 11 and 12 demonstrate the model's ability to vary the default values. The examples selected are two critical default variables in the ROI computation—the class day and lab day savings expected via a course conversion.
Table 11. ABC Analysis Tool sensitivity analysis: lab days saved under AEC impact on ROI
Class days saved per paper class day
.05 .15 .25 .35 .45
AEC class day per paper class day
.95 .85 .75 .65 .55
ROI value 1.43 2.08 2.95 3.84 4.90
Percentage change in ROI value from baseline
-51 -30 - +30 +66
0.30 .40 0.50 .60 0.70
0.70 .60 0.50 .40 0.30
1.83 2.36 2.9507 3.65 4.31
-38 -20 _ +24 +46
Table 12. ABC Analysis Tool sensitivity analysis: class days saved under AEC impact on ROI
Lab days saved/paper lab day
AEC lab days/paper lab day ROI value
Percentage change in ROI value from baseline
In the tables, we vary the stated default core course class and lab day values of 25 and 50 percent, respectively. As shown, the values selected for these default variables are significant. For class days, a 40-percent change (a .25 factor to a .15 reduction factor) yields about a 30-percent change in the ROI value. This corresponds to an elastic- ity of .75. There is even a larger elasticity for lab days, in which a 20-percent change (50 to 40 percent) results in a 20-percent change in the ROI—an elasticity of 1.
62

Project results, findings, status, and recommended next steps
The purpose of this study was to explore ways to quantify the cost impli- cations of the decision to convert a paper-based course to an AEC for- mat. The project met this objective by developing a simple AEC return- on-investment (ROI) model. This model (the AEC Business Case Anal- ysis Tool, or ABC Analysis Tool) is available in prototype form for Navy use.
The model was developed by focusing on the NAVSEA AEC conversion experience and was verified using the best test data available within the time and resource constraints of the project. Much of the test data used to populate the model is based on the NAVSEA AEC concept and NAVSEA experience. Even in its current prototype form, the model is a unique, valuable tool for analyzing and estimating the ROI implica- tions of a wide range of AEC decisions and planning questions.
More effort is required to finalize the model and capture its full poten- tial and value. The remaining tasks involve finalizing and validating the model for all Navy AEC operational concepts, courses, and communi- ties and helping the Navy use the tool for analysis purposes. Some of the remaining tasks for the development effort include:
• Validating the default data needed for the model and addressing the best set of data for the different AEC operational concepts and implementations used (or under study) within the Navy
• Selecting and analyzing the data associated with a set of courses to serve as a base case for model validation and sensitivity analysis.
• Visiting and working with CNET schools to validate the model and collect input/default values for "base case" courses
• Identifying and validating the estimated ROI sensitivity to input and default variables (for base case courses)
63

• Developing and defining some "rules of thumb" for consider- ing AEC conversion decisions.
In addition to the above tasks, work is needed to:
• Articulate, compare, and contrast some of the major concep- tual models and AEC software tools and systems used to manage and integrate the AEC teaching materials
• Research the impact of AEC on course and Navy-wide attrition, quantify cost implications, and include in ABC model
• Support integration of ABC model into Navy Training Plan, NTRR, and BAM
• Explore and flesh out costs and savings omitted from existing ABC model and scope out the availability and need for similar tools for other training technologies (e.g., the assumption that an AEC classroom is only used for a single shift and a single course needs to be validated).
Given the limited Navy resource levels and number of tasks that must be addressed, we recommend a logical but modest continuation for this effort. The recommended effort would:
• Perform the data validation efforts discussed in the report
• Address, quantify, and accommodate in the model the different AEC operational concepts working and under discussion in the Navy
• Compare, contrast, and assess the different classroom manage- ment information systems
• Explore the impact of AEC training on attrition by reviewing available data and, if appropriate, adding the cost implication of this review into the model
• Perform a sensitivity analysis of the model and help the Navy institutionalize, and use the model for analytical purposes.
64

Appendix A
Appendix A: ABC Analysis Tool ROI costs and benefits formulas
Overview
The ABC Analysis Tool considers two types of AEC-related costs. The
first is the one-time investment costs needed to set up and establish
the AEC-based course (s). The investment costs considered in the ABC Analysis Tool are:
• AEC classroom and lab/learning resource center (LRC) auto- mation setup costs
• Course conversion and media selection analysis costs
• Instructional Media Design Report (IMDR) development costs
• Data tagging and conversion costs.
The second type of costs are the recurring costs that reflect the higher
cost of doing business under an AEC versus a paper-based course.
Recurring costs, those associated with the day-to-day operation of an
AEC classroom, either do not occur for a paper-based course or occur at a significantly reduced cost. The two recurring costs addressed in the ABC Analysis Tool are:
• Increased AEC life-cycle cost
• "Use of AEC technology" training.
The AEC-related benefits addressed in the ABC Analysis Tool are:
• Student savings (due to the shortened course length)
• Instructor savings (due to the shortened course length and reduced preparation/personalization time)
65
Appendix A
• Course-related technical material and technical documenta-
tion (TM/TD) paper management savings.
AEC classroom and lab/LRC automation setup costs
AEC setup cost = number of AEC classrooms x unit AEC classroom
setup cost.
Number of AEC classrooms = Ax B/ CxD ,
where
A = the annual number of students for the course
[a required model input]
B = the AEC course length in weeks
= roundup (AEC course length/7)
AEC course length = roundup (7/5 x (achievable class day reduction [a default value]) x number paper course
class days [a required model input] + achievable lab day reduction [a default value] x number paper course lab
days [ a required model input])
C = the maximum students per AEC classroom for the course type being addressed [a default value set for each course type]
D = the number of AEC training weeks in a year [a default value].
Unit AEC classroom setup cost is a default variable for each type of
course considered (Core, A-School, and C-School).
Course conversion and media selection analysis costs
Conversion and media selection analysis costs = number of course
weeks x the unit weekly conversion and optimization cost.
= roundup (paper course length [a required model input]/7)
x unit conversion and optimization cost [a default value]
66

Appendix A
Instructional Media Design Report (IMDR) development cost
IMDR cost = IMDR setup cost [a default value] + roundup (paper
course length [a default value] - 7) x IMDR develop-
ment costs [a default value].
Animations and simulations (A&S) costs
A&S development costs = costs to develop A&S for class days + the cost
to develop A&S for lab days. The form of the cost formula is:
A&S development costs = AxBxC + D\ExF,
where
A = number of AEC class days
= (1 - achievable class day reduction [a default value]) x number
of paper course class days [a required model input]
B = class day unit A&S development costs [a default value]
C = number of A&S per class day [a default value]
D = number of AEC lab days
= (1 - achievable lab day reduction [a default value]) x number
of paper course lab days [a required model input]
E = lab day unit A&S development costs [a default value]
F = number of A&S per lab day [a default value].
Data conversion to digital format costs
Data conversion costs = number of volumes of technical material for
the paper course [a required model input] x pages per volume [a default
value] x conversion cost per page [a default value].
67
Appendix A
Increased AEC life-cycle cost
The annual increased AEC life-cycle cost is applied for each of the
years in the planning period (default value is 5 years).
The ABC Analysis Tool costing formula for the annual increased AEC
life-cycle costs has the form:
Increased AEC life-cycle costs = A + B + C ,
where
A = the cost of the network administrator [a default value]
B = (the number of AEC classrooms [defined earlier in this section]) /
(the number of classrooms supported per staff [a default
value]) x (the annual cost of an ADP support staffer [a default
value])
C = total AEC setup investment costs [defined earlier in this section] x
AEC support contract factor [a default value].
"Use of AEC technology" training costs
The annual "use of technology" cost is applied for each of the years in the planning period (default value is 5 years). "Use of AEC technol-
ogy" training costs = new instructor training costs + student training
costs + network administrator/ADP support staff training cost,
where
new instructor training costs = number of AEC course instructor
billets [defined in following discussion] x 1 /instructor tour length [a
default value] x training per instructor [a default value] x cost per
instructor [a default value]
student training costs = number of students [a required model input] x
training per student [a default value] x cost per student [a default
value]
68
Appendix A
network administrator/ADP support staff training cost = number of
network administrator and ADP support staffers [a model-computed
number already discussed] x training for network administrator and
ADP support staffers [a default value] x cost for network administra-
tor and ADP support staffers [a default value].
Reduced student costs
The annual reduced student costs benefit is computed by a formula of the form:
Reduced student cost = AxBx C ,
where
A = the number of students in a course [a required model input]
B = the reduction in the paper-based course length resulting from
conversion to an AEC format [computed in the model]
= paper course length [a required model input] - the AEC course
length [already defined and discussed]
= roundup (paper-based course length/7) [a required model
input] - roundup (AEC course length/7)
C - the daily cost per student [a default value]
The annual benefit is then applied for each year of the planning period (default value is 5 years).
Reduced instructor costs
The reduced instructor cost benefit is built around a computed number of instructor billets saved per year under the AEC course rel- ative to the paper-based course. This instructor billet saving is then multiplied by the annual instructor cost (a default value currently set
69
Appendix A
at the 1995 E6 level of $43,000) for each year in the planning period (a default value currently set at 5 years). The instructor billets saved are determined by subtracting the model computed AEC-based course instructor billets from the comparable paper-based course bil- lets [a required model input].
The ABC Analysis Tool considers two sources of instructor-related sav- ings. The first results from the reduced course length for an AEC- based course relative to a paper-based one. The second is tied to sav- ings associated in instructor course preparation and personalization (P&P) for an AEC-based relative to a paper-based course.
The estimated savings associated with the shorter course length starts with some required input data for the paper course, including:
• The total number of instructor billets associated with the paper- based course
• The annual number of student entrants (entrants)
• The number of class and lab days
• The class and lab day student-instructor ratios.
Using these numbers, the model computes the average number of days a year spent in instruction (class room or lab) for the paper- based course and the corresponding "instructor-days-to-instructor- billets ratio" as follows:
Class Instructor Days (CID) = (course class days x entrants)/ (classroom student-instructor ratio)
Lab Instructor Days (LID) = (course lab days x entrants)/ (lab student-instructor ratio)
Total Instructor Days (TID) = CID + LID Instructor-Days-to- = TID/total instructor billets.
Instructor-Billets Ratio
Note that the instructor-days-to-instructor-billets ratio measures the percentage of the instructor's time spent on instruction versus other preparation and "overhead" activities. The model assumes that the instructor-days-to-instructor-billets ratio computed for the paper- based course will also hold for the AEC-based course.
70

Appendix A
Stepl
The model computes the AEC course instructor billets requirements
(before considering changes in the preparation and personalization
times) in two steps. First, it computes the CID, LID, and TID for the
AEC course. To make these calculations, the model uses the AEC class
and lab days, and the maximum AEC class size (a default variable).
Second, it uses the AEC course TID and the paper-based course
instructor-days-to-instructor-billets ratio defined above to compute the required AEC course instructor billets (again without considering changes in the P&P times). The actual calculation is:
AEC course instructor billets (without modified P&P effect) = TID
(for the AEC course) instructor-days-to-instructor-billets ratio (for
paper-based course)
Thus, the model scales the paper-based instructor billet number to
reflect changes in course length and class size but keeps the same load- ing and overhead factors assumed for the paper course. At this point,
the number of AEC billets does not explicitly reflect any reductions
due to reduced instructor preparation and personalization time. This
calculation is a little involved and takes several steps to explain.
In the first step, we define the default variables and values used in the model to address the preparation and personalization (P&P) times for paper-based and AEC courses. In step 2, we use the results of step 1 to estimate the percentage of the paper-based instructor billets devoted to P&P. In the third step, we compute how the reduced P&P times
affect the instructor workforce. Finally, in step 4, we compute how the
improvement identified in step 3 would reduce the P&P weights calcu- lated in step 2, and we apply this change to the "scaled" AEC instructor billets number discussed above.
The ABC Analysis Tool uses the following definitions for instructor preparation and personalization times:
• Preparation time: The time spent by new instructors to become
familiar with the course. This usually involves a new instructor
observing a course for one class convening.
71

Appendix A
• Personalization time: The time required by an instructor to
individualize the material in the instructor guide for the class (Personalization time is required for new instructors and for all
instructors at course revision).
As noted, the AEC preparation time (with the current default values)
for new instructor is equal to the course length since it involves sitting
through the course for both the paper-based and AEC courses. The
personalization time, on the other hand, is assumed to be different
for the two training alternatives.
Personalization time estimates for new instructors are based on
default values that identify the personalization time required per
training day (class days and lab days). (The number of new instruc-
tors is computed as 1 over the instructor tour length, which is a
default value currently set at 3 years.) The personalization for course
revisions is more complicated because additional default values are needed to estimate how many revisions occur per year and what per- cent of the course is changed per revision. (The current default values assume one course revision a year affecting 25 percent of the
course days.)
The current personalization default values are:
Personalization
default values Paper-based
course AEC course
New instructor Course revision
1 day/course day
.25 day/course day
.5 day/ course day
.125 day/course day
Step 2
The paper-based course instructor billets must include a provision factor, or weight, for preparation and personalization activities. We can compute how many instructor P&P days are implied by the default values discussed in step 1 for a paper-based course. That is, using the current 3-year default value for instructor tour length, one-third of the instructor workforce (the new instructors) requires 2 days (1 for preparation and 1 for personalization) for each class and lab day. In addition, two-thirds of the instructor workforce must deal
72

Appendix A
Step 3
with personalizing the course revisions (.25 times the total number of class and lab days). The combined P&P effect is:
Paper-based course P&P effect
= instructor billets * (1/3*2 + 2/3*.25) * (class + lab days)
= 5/6 * instructor billets * (class + lab days) .
This number can then be used to develop a weighting factor by con- verting it to an annual number and dividing it by the number of instructor billets to yield:
Paper-based course P&P weight
= (5/6 * instructor billets * (class + lab days) * (1/working
days per year)/instructor billets
(The weight for the ET Core run provided in appendix B is 41 percent.)
In this step, we compute the P&P improvements assumed in the default values for an AEC. These results can be summarized as follows:
Paper-based course P&P effect
New instructors
Revision
Combined
Improved P&P effect
New instructors
Revision
Combined
Difference (improvement')
1/3 of instructor billets x 2 x course
training days
2/3 of instructor billets x .25 x course training days
5/6 of instructor billets x course training days
1/3 of instructor billets x 1.5 x course training days
2/3 of instructor billets x .125 x course training days
7/12 of instructor billets x course training days
3/12 of instructor billets x course training days
73
Step 4
Appendix A
Thus, the assumed default values yield a 30-percent reduction (from 10/12 to 7/12) in the P&P activities.
In this step, we multiply the P&P reduction factor computed in step 3 by the paper-based P&P factor developed in step 2. This adjustment rate is then multiplied by the computed AEC instructor billets (which are the paper-based instructor billets scaled for course length and class size). The result is the instructor reductions attributed to improved P&P activities.
The instructor billet saving is computed by subtracting the AEC instructor billets from the paper-based course billets. The AEC billets are computed by subtracting the P&P reduction just discussed from the "scaled" AEC instructor number discussed earlier.
Paper management cost reduction
The ABC Analysis Tool includes the costs to reproduce the paper copies of the technical materials for the course and ship them to the schools (incurred by the technical material manager rather than the school) and the school technical librarian's cost to distribute the materials and maintain the school's library copy or copies.
The copying and shipping costs equals the sum of number of techni- cal volumes [a required model input] plus the revisions per year [a default value] times the pages per volume [a default value] times the cost per page [a default value].
The cost of the school technical librarian is equal to the number of volumes [a required model input] times the copies per student [a default value] times cost per librarian [a default value] divided by the copies that can be managed per librarian [a default value].
74
Appendix B
Appendix B: ABC Analysis Tool listing
This appendix provides an Excel listing of the ABC Analysis Tool as of 31 October 1996. The run provided uses the test data discussed in the report for the ET Core course. The appendix also includes a listing of the ABC formulas that were extracted from ABC Excel spreadsheets.
75

Appendix B
Row 1 AEC Business Case (ABC) Analysis Tool (As of 15 February 1997)
2 3 Course Specific Input Data
4
5 Input Variable Name Input Values
6 Course Title Combat Systems
Technical Core 7 Course ID A-100-0139 8 Course Type (1=Core, 2=A School, 3=C School)
1 9 Course Length (In Calendar Days)
166 10 Course Class Days
78
11 Course Lab Days 40
12 Student Entrants (Annual Total) 2,880 13 Students per Class
25 14 Instructor Billets
106 15 Class Day Student Instructor Ratio
25 16 Lab Day Student Instructor Ratio
10 17 Volumes of Course Related Paper Technical Material
2 18 Format of Tech Materials (0= Exists in IETM Format, 1= Exists only in
Paper Format) 1 19
20 Default values used in ABC Analysis Tool 21 22 Planning Factors: 23 Planning Period (Integer Values -- Default = POM Period)
5 24 Discount Rate (Decimal Values -- Default = 0.0) 0% 25 Inflation Rate (Decimal Values - Default = 0.0) 0% 26 Real Growth Rate (Decimal Values -- Default = 0.0) 0% 27 28 Achievable Percent Course Reductions (AEC Over Paper-Based
Course): 29 Class Days ~ Core Courses
76
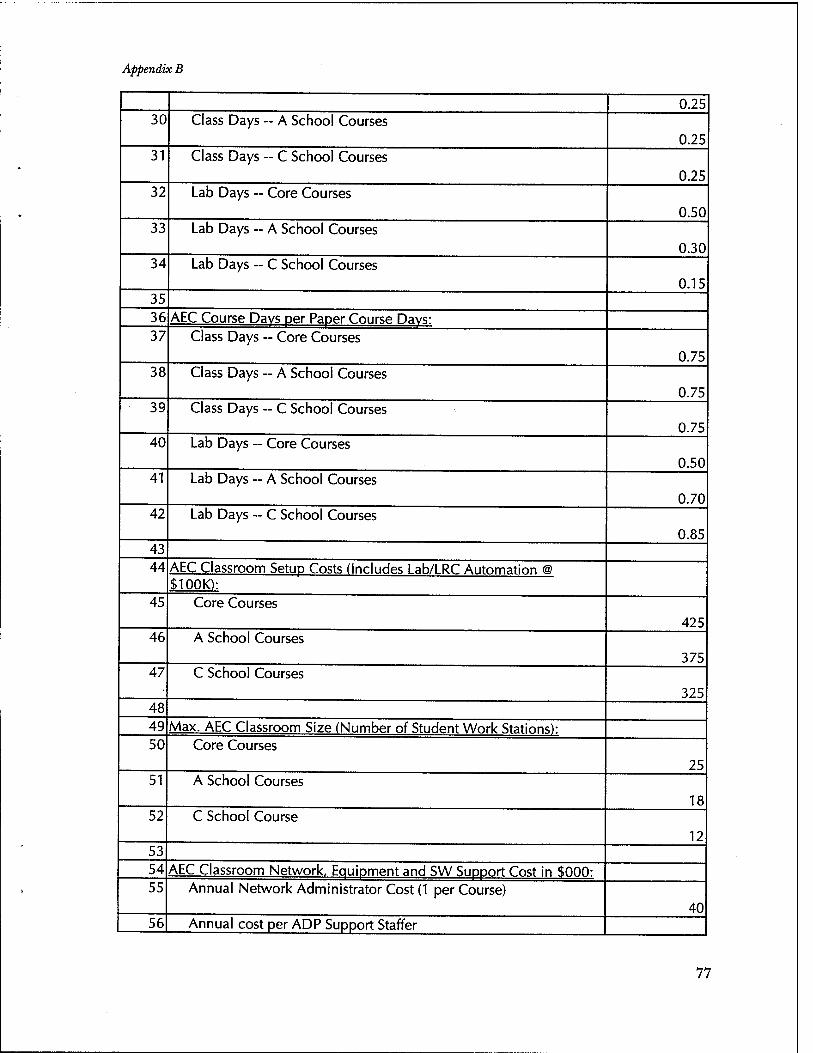
Appendix B
0.25 30 Class Days — A School Courses
0.25 31 Class Days - C School Courses
0.25 32 Lab Days ~ Core Courses
0.50 33 Lab Days - A School Courses
0.30 34 Lab Days - C School Courses
0.15 35 36 AEC Course Davs per Paoer Course Davs: 37 Class Days - Core Courses
0.75 38 Class Days - A School Courses
0.75 39 Class Days - C School Courses
0.75 40 Lab Days — Core Courses
0.50 41 Lab Days - A School Courses
0.70 42 Lab Days - C School Courses
0.85 43 44 AEC Classroom Setup Costs (Includes Lab/LRC Automation @
$100K): 45 Core Courses
425 46 A School Courses
375 47 C School Courses
325 48 49 Max. AEC Classroom Size (Number of Student Work Stations): 50 Core Courses
25 51 A School Courses
18 52 C School Course
12 53 54 AEC Classroom Network, Equipment and SW Support Cost in $000: 55 Annual Network Administrator Cost (1 per Course)
40 56 Annual cost per ADP Support Staffer
77

Appendix B
30
57 AEC Classrooms per ADP staffer 3
58 AEC Classroom Equip and SW Support Cost as a % of Setup Cost 0.1
59 60 AEC Course Conversion Costing: 61 Conversion and Optimization (Cost per Week in $000)
10
62 IMDR Development (For First Week in $000) 10
63 IMDR Development (For Each Additional Week in $000) 0.5
64 65 Animations and Simulations per AEC Course Instruction Dav: 66 Class Days (All Course Types)
10 67 Lab Days — Core Courses
7
68 Lab Days — A School Courses 4
69 Lab Days — C School Courses 2
70 71 Unit Animation and Simulation Costs: 72 Class Days in $000
5
73 Lab Days in $000 50
74 75 "Use of AEC Technology" Training:
76 New Instructor Training (Weeks) 1
77 Network/Support Staff (weeks of Annual Training) 1
78 Students Training days (Once per Pipeline) 1
79 80 Instructor Preparation and Personalization Davs per Instruction Dav: 81 Preparation (For Both Paper and AEC Courses)
1
82 Personalization (For Paper Courses) 1
83 Personalization (For AEC Courses) 0.500
84 Personalization (For Paper Course Revisions-Assumes 25% of Course Revised)
0.250
85 Personalization (For AEC Course Revisions-Assumes 25% of
78

Appendix B
Course Revised) 0.125 86 87 Other ABC Tool Default Values: 88 Maximum Training Weeks per Year
48 89 Pages per Technical Volume
200 90 Pages per Tech Volume Changed a Year
50 91 Technical Documents Copies per Student
1 92 Per page Data Conversion Costs (To lETMs) in $000
0 93 Course Revisions per Year
1 94 Instructor Tour Length: (in Years)
3 95 Copies (Volumes x Students) Managed per Tech Librarian 10,000 96 Annual Technical Librarian Cost in $000 35 97 Pre-School Copying and Distribution Cost/Page in $000
0 98 Annual Instructor Billet Costs in $000
43 99 Daily Student Costs in $000
0 100 101
102 ABC Analysis Tool Computations ($ 000)
103
104 Intermediate Calculations 105 Total Instructor Days (Paper Course) 20,506 106 Instructor Days per Instructor Billet (Paper Course)
193 107 AEC Class Days
59 108 AEC Lab Days
20 109 AEC Course Length
110 110 AEC Course Weeks
16 111 AEC Classroom Size
25 112 AEC Class Rms.
39 113 Unit AEC Setup Cost
425
79
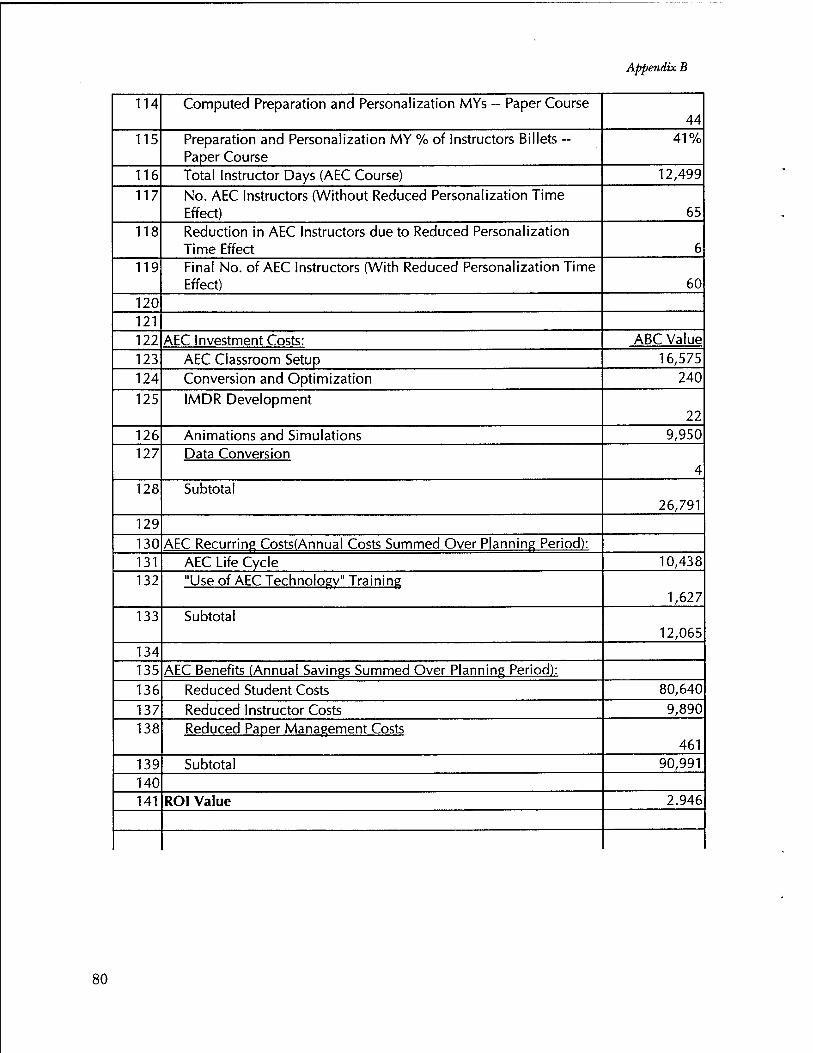
Appendix B
114 Computed Preparation and Personalization MYs - Paper Course 44
115 Preparation and Personalization MY % of Instructors Billets - Paper Course
41%
116 Total Instructor Days (AEC Course) 12,499
117 No. AEC Instructors (Without Reduced Personalization Time Effect) 65
118 Reduction in AEC Instructors due to Reduced Personalization Time Effect 6
119 Final No. of AEC Instructors (With Reduced Personalization Time Effect) 60
120 121 122 AEC Investment Costs: ABC Value
123 AEC Classroom Setup 16,575
124 Conversion and Optimization 240
125 IMDR Development 22
126 Animations and Simulations 9,950 127 Data Conversion
4 128 Subtotal
26,791 129
130 AEC Recurring Costs(Annual Costs Summed Over Planning Period): 131 AEC Life Cycle 10,438 132 "Use of AEC Technology" Training
1,627
133 Subtotal 12,065
134 135 AEC Benefits (Annual Savings Summed Over Planning Period):
136 Reduced Student Costs 80,640
137 Reduced Instructor Costs 9,890
138 Reduced Paper Management Costs 461
139 Subtotal 90,991
140 141 ROI Value 2.946
80

Appendix B
ABC Analysis Tool formulas
Intermediate Calculations (Rows 104-119) Total Instructor Days (Paper Course) (Row 105)
= (C10*C12)/C15 + (C11*C12)/C16
Instructor Days -to Instructor Billets Ratio (Paper Course) (Row 106) =C105/C14
AEC Class Days (Row 107) = IF(C8=1,C11*C40,IF(C8=2,C11*C41,IF(C8=3,C11*C42,0)))
AEC Lab Days (Row 108) = IF(C8=1,C11*C40,IF(C8=2)C11*C41,IF(C8=3,C11*C42,0)))
AEC Course Length (Row 109) = ROUNDUP(7/5*IF(C8=1,C10*C37+C11 *C40,
IF(C8=2,C10*C38+C11*C41JF(C8=3,C10*C39+C11*C42,0))),0)
AEC Course Weeks (Row 110) =ROUNDUP((C109/7),0)
AEC Classroom Size (Row 111) =IF(C8=1,C50JF(C8=2,C51JF(C8=3,C52,0)))
AEC Class Rms.(Row 112) =(ROUNDUP(Cl 10*C12/(C88*C111),0))
Unit AEC Setup Cost (Row 113) =IF(C8=1,C45,IF(C8=2,C46,IF(C8=3,C47,0)))
Computed Preparation and Personalization MYs — Paper Course (Row 114) =(C14*l/C94*(C81+C82)*C9*5/7)/(C88*5) + (C14*((C94- l)/C94)*C84*C9*5/7) / (C88*5)
Preparation and Personalization MY % of Instructors Billets — Paper Course(Row 115) =C114/C14
Total Instructor Days (AEC Course) (Row 116) = (C107*C12)/ (DF(C8=1,C50,IF(C8=2,C51,IF(C8=3,C52,0)))) + (C108*C12)/C16
No. AEC Instructors (Without Reduced Personalization Time Effect) (Row 117) = C116*1/006
Reduction in AEC Instructors due to Reduced Personalization Time Effect (Row 118) =ROUNDUP( (Cl 17* 1/C94*(C82-C83)*C 109*5/7) / (C88*5) + (C117*((C94-l)/C94)*(C84-C85)*C109*5/7) / (C88*5),0)
Final No. of AEC Instructors (With Reduced Personalization Time Effect) (Row 119) =ROUNDUP(C117 - (C117*l/C94*(C82-C83)*C109*5/7) / (C88*5) - (C117*((C94-l)/C94)*(C84-C85)*C109*5/7) / (C88*5),0)
AEC Investment Costs: (Rows 123-128)
AEC Classroom Setup (Row 123) =(ROUNDUP(ROUNDUP(Cl 10,0)*C12/(C88*C111),0))*C113
Conversion and Optimization (Row 124)
81

Appendix B
=ROUNDUP(C9/7,0)*C61 IMDR Development (Row 125)
=C62+ROUNDUP((C9-7)/7,0)*C63 Animations and Simulations (Row 126)
=IF(C8=1,ROUNDUP(C37*C10,0)*C66*C72+ROUNDUP(C40*C11,0)*C67 *C73,IF(C8=2,ROUNDUP(C38*C 10,0) *C66*C72+ROUNDUP(C41 *C 11,0) * C68*C73,IF(C8=3,ROUNDUP(C39*C10,0)*C66*C72+ROUNDUP(C42*C1 1,0)*C69*C73)))
Data Conversion (Row 127) =C18*C17*C89*C92
Subtotal (Row 128) =SUM(C123:C127)
AEC Recurring Costs(Annual costs over planning period): (Rows 131 -1.33)
AEC Life Cycle (Row 131)
=sumitpdig(C23,C24,C25,C26)*(C55+C58*C123+C56*(ROUNDUP(ROUN DUP(C110,0)*C12/(C88*C111)/C57,0)))
"Use of AEC Technology" Training (Row 132) =sumitpdig(C23,C24,C25,C26)*(C76/52*(C14*C98/C94+C55+C56*(ROUN DUP(C110*C12/(C88*C111)/C57,0))) + C12*C78*C99)
Subtotal (Row 133) =SUM(C131:C132
AEC Benefits (Annual savings over planning period): Rows (136 - 139)
Reduced Student Costs (Row 136)
=sumitpdig(C23,C24,C25,C26)*C99*C12*(C9-C109) Reduced Instructor Costs (Row 137)
= (C14 -Cl 19) *C98 *sumitpdig(C23,C24,C25,C26) Reduced Paper Management Costs (Row 138)
=( (C17*C12/C95)*C96 + (C17*C12)*(C89+C90)*C97 ) * sumitpdig(C23,C24,C25,C26)
Subtotal (Row 139) =SUM(C136:C138)
ROI Value (Row 141) =(C139-C133)/C128
82
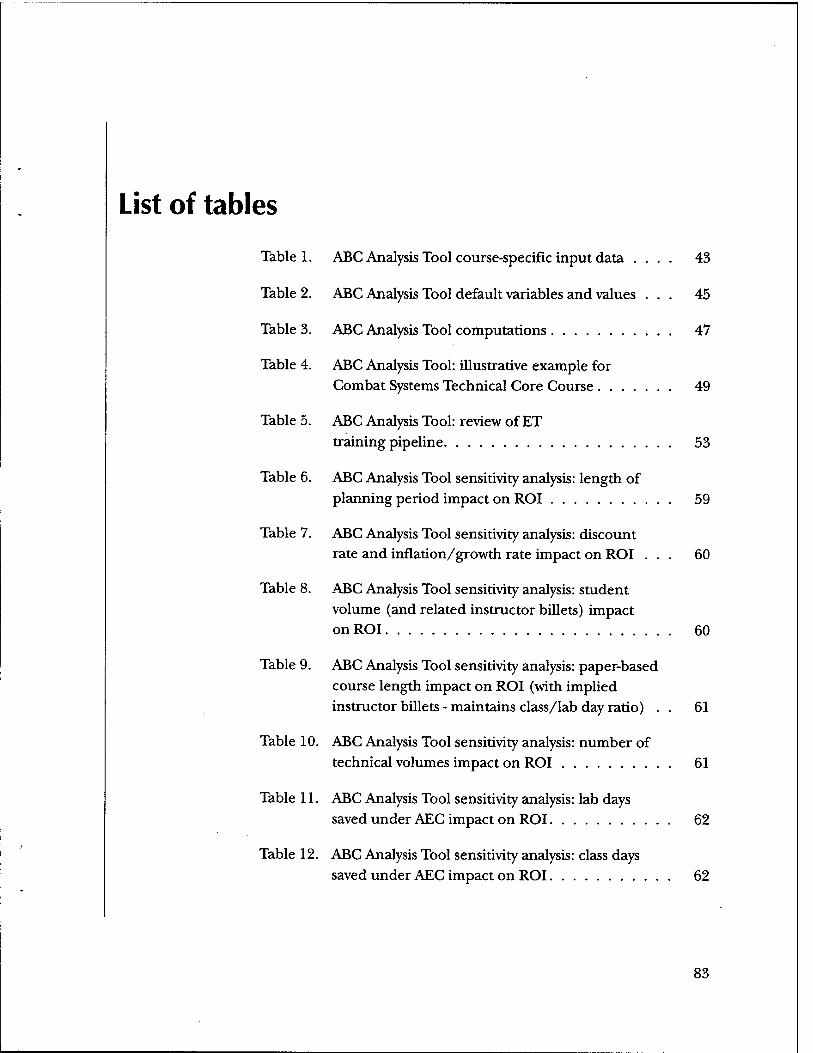
-
List of tables
Table 1. ABC Analysis Tool course-specific input data .... 43
Table 2. ABC Analysis Tool default variables and values . . . 45
Table 3. ABC Analysis Tool computations 47
Table 4. ABC Analysis Tool: illustrative example for Combat Systems Technical Core Course 49
Table 5. ABC Analysis Tool: review of ET
training pipeline 53
Table 6. ABC Analysis Tool sensitivity analysis: length of planning period impact on ROI 59
Table 7. ABC Analysis Tool sensitivity analysis: discount rate and inflation/growth rate impact on ROI . . . 60
Table 8. ABC Analysis Tool sensitivity analysis: student
volume (and related instructor billets) impact on ROI 60
Table 9. ABC Analysis Tool sensitivity analysis: paper-based
course length impact on ROI (with implied
instructor billets - maintains class/lab day ratio) . . 61
Table 10. ABC Analysis Tool sensitivity analysis: number of
technical volumes impact on ROI 61
Table 11. ABC Analysis Tool sensitivity analysis: lab days saved under AEC impact on ROI 62
-* Table 12. ABC Analysis Tool sensitivity analysis: class days
saved under AEC impact on ROI 62
83

Distribution list Research Memorandum 96-120
SNDL FJA13
FKA1A
FKA1B
FKA1G
FKR31
FT1
FT78
NAVPERSRANDCEN SAN DIEGO CA Atta: CODE 13
COMNAVAIRSYSCOM WASHINGTON DC Atta: PMA205
COMSPAWARSYSCOM WASHINGTON DC Atta: CODE05L
COMNAVSEASYSCOM WASHINGTON DC Atta: CODE04PT
NAVTRASYSCEN ORLANDO Atta: CODE111A2 Atta: CODE 4972 Atta: CODE49T
CNET PENSACOLA FL Atta: T2 Atta: N5 Atta: N52 Atta: N5212 Atta: N532
NETPDTC PENSACOLA FL Atta: CODEN7
OPNAV N201 N4J N6T N7 N7B N75
Atta: N813 N869T N879C N889F N889H N951G
5 COPIES
85