A method to incorporate prior information into score test for genetic association studies
10
METHODOLOGY ARTICLE Open Access A method to incorporate prior information into score test for genetic association studies Sergii Zakharov 1,2* , Garrett HK Teoh 1 , Agus Salim 3 and Anbupalam Thalamuthu 4* Abstract Background: The interest of the scientific community in investigating the impact of rare variants on complex traits has stimulated the development of novel statistical methodologies for association studies. The fact that many of the recently proposed methods for association studies suffer from low power to identify a genetic association motivates the incorporation of prior knowledge into statistical tests. Results: In this article we propose a methodology to incorporate prior information into the region-based score test. Within our framework prior information is used to partition variants within a region into several groups, following which asymptotically independent group statistics are constructed and then combined into a global test statistic. Under the null hypothesis the distribution of our test statistic has lower degrees of freedom compared with those of the region-based score statistic. Theoretical power comparison, population genetics simulations and results from analysis of the GAW17 sequencing data set suggest that under some scenarios our method may perform as well as or outperform the score test and other competing methods. Conclusions: An approach which uses prior information to improve the power of the region-based score test is proposed. Theoretical power comparison, population genetics simulations and the results of GAW17 data analysis showed that for some scenarios power of our method is on the level with or higher than those of the score test and other methods. Keywords: Prior information, Association analysis, Score test, Rare variants Background In spite of the success of genome-wide association stud- ies (GWAS) in identifying hundreds of common single nucleotide polymorphisms (SNPs) associated with dis- eases and complex traits (http://www.genome.gov/gwa studies/), in many cases the proportion of heritability ex- plained by these discovered SNPs is low [1-3]. One of the potential explanations of this observation is that rare variants (usually defined as those with minor allele fre- quency below 1%), which are absent from conventional GWAS studies, are responsible for the missing heritabil- ity. Indeed, there is strong evidence that rare variants are associated with some complex traits [4-8]. When performing rare variants association analysis re- searchers face significant methodological challenges. The single SNP approach, which is popular in GWA studies, is underpowered when applied in rare variants associ- ation studies with moderate sample size due to low allele count for each individual rare variant. To overcome this problem, testing multiple rare variants within a region has been recommended [9,10], and a number of region- based rare variants tests have been proposed [11-15]. However, these novel methodologies may still be under- powered for association studies with moderate sample size [16]. This motivates the development of statistical methods that utilize prior information with the purpose of improving power. Currently, much biological informa- tion is publicly available, such as the prediction of degree of deleteriousness of non-synonymous variants (PolyPhen http://genetics.bwh.harvard.edu/pph2/, SIFT http://sift.bii. a-star.edu.sg/), SNP prioritization (FastSNP http://fastsnp. ibms.sinica.edu.tw), functional SNP annotation (SNPnexus http://www.snp-nexus.org/) etc. Although several methods * Correspondence: [email protected]; [email protected] 1 Human Genetics, Genome Institute of Singapore, 60 Biopolis Street, #02-01 Genome, Singapore 138672, Singapore 4 Centre for Healthy Brain Ageing (CHeBA), School of Psychiatry, University of New South Wales, Sydney, Australia Full list of author information is available at the end of the article © 2014 Zakharov et al.; licensee BioMed Central Ltd. This is an open access article distributed under the terms of the Creative Commons Attribution License (http://creativecommons.org/licenses/by/2.0), which permits unrestricted use, distribution, and reproduction in any medium, provided the original work is properly cited. Zakharov et al. BMC Bioinformatics 2014, 15:24 http://www.biomedcentral.com/1471-2105/15/24
-
Upload
independent -
Category
Documents
-
view
0 -
download
0
Transcript of A method to incorporate prior information into score test for genetic association studies
Zakharov et al. BMC Bioinformatics 2014, 15:24http://www.biomedcentral.com/1471-2105/15/24
METHODOLOGY ARTICLE Open Access
A method to incorporate prior information intoscore test for genetic association studiesSergii Zakharov1,2*, Garrett HK Teoh1, Agus Salim3 and Anbupalam Thalamuthu4*
Abstract
Background: The interest of the scientific community in investigating the impact of rare variants on complex traitshas stimulated the development of novel statistical methodologies for association studies. The fact that many ofthe recently proposed methods for association studies suffer from low power to identify a genetic associationmotivates the incorporation of prior knowledge into statistical tests.
Results: In this article we propose a methodology to incorporate prior information into the region-based score test.Within our framework prior information is used to partition variants within a region into several groups, followingwhich asymptotically independent group statistics are constructed and then combined into a global test statistic.Under the null hypothesis the distribution of our test statistic has lower degrees of freedom compared with thoseof the region-based score statistic. Theoretical power comparison, population genetics simulations and results fromanalysis of the GAW17 sequencing data set suggest that under some scenarios our method may perform as well asor outperform the score test and other competing methods.
Conclusions: An approach which uses prior information to improve the power of the region-based score test isproposed. Theoretical power comparison, population genetics simulations and the results of GAW17 data analysisshowed that for some scenarios power of our method is on the level with or higher than those of the score testand other methods.
Keywords: Prior information, Association analysis, Score test, Rare variants
BackgroundIn spite of the success of genome-wide association stud-ies (GWAS) in identifying hundreds of common singlenucleotide polymorphisms (SNPs) associated with dis-eases and complex traits (http://www.genome.gov/gwastudies/), in many cases the proportion of heritability ex-plained by these discovered SNPs is low [1-3]. One ofthe potential explanations of this observation is that rarevariants (usually defined as those with minor allele fre-quency below 1%), which are absent from conventionalGWAS studies, are responsible for the missing heritabil-ity. Indeed, there is strong evidence that rare variantsare associated with some complex traits [4-8].
* Correspondence: [email protected]; [email protected] Genetics, Genome Institute of Singapore, 60 Biopolis Street, #02-01Genome, Singapore 138672, Singapore4Centre for Healthy Brain Ageing (CHeBA), School of Psychiatry, University ofNew South Wales, Sydney, AustraliaFull list of author information is available at the end of the article
© 2014 Zakharov et al.; licensee BioMed CentrCommons Attribution License (http://creativecreproduction in any medium, provided the or
When performing rare variants association analysis re-searchers face significant methodological challenges. Thesingle SNP approach, which is popular in GWA studies,is underpowered when applied in rare variants associ-ation studies with moderate sample size due to low allelecount for each individual rare variant. To overcome thisproblem, testing multiple rare variants within a regionhas been recommended [9,10], and a number of region-based rare variants tests have been proposed [11-15].However, these novel methodologies may still be under-powered for association studies with moderate samplesize [16]. This motivates the development of statisticalmethods that utilize prior information with the purposeof improving power. Currently, much biological informa-tion is publicly available, such as the prediction of degreeof deleteriousness of non-synonymous variants (PolyPhenhttp://genetics.bwh.harvard.edu/pph2/, SIFT http://sift.bii.a-star.edu.sg/), SNP prioritization (FastSNP http://fastsnp.ibms.sinica.edu.tw), functional SNP annotation (SNPnexushttp://www.snp-nexus.org/) etc. Although several methods
al Ltd. This is an open access article distributed under the terms of the Creativeommons.org/licenses/by/2.0), which permits unrestricted use, distribution, andiginal work is properly cited.
Zakharov et al. BMC Bioinformatics 2014, 15:24 Page 2 of 10http://www.biomedcentral.com/1471-2105/15/24
that use prior information have been proposed [17-20], fur-ther research is needed to utilize prior knowledge more effi-ciently [21] and to expand statistical tools available forresearchers.In this article we propose a method that incorporates
prior information into the region-based score test. Withinour framework, prior information is used to partitionSNPs within a genomic region of interest into groups.Then within each group asymptotically independent SNPscores are combined into a one degree of freedom (d.f.)chi-squared statistics. These group statistics are then usedto construct a global test for a region. The proposed meth-odology has several distinct advantages. First of all, the de-grees of freedom of our test statistic equals to the numberof groups, which may be much less than the number ofSNPs within a region. Secondly, under partitioning thatapproximately separates associated variants from neutralones (“informative” partitioning) the proposed method ef-ficiently handles noise introduced by neutral variants. We
1
3
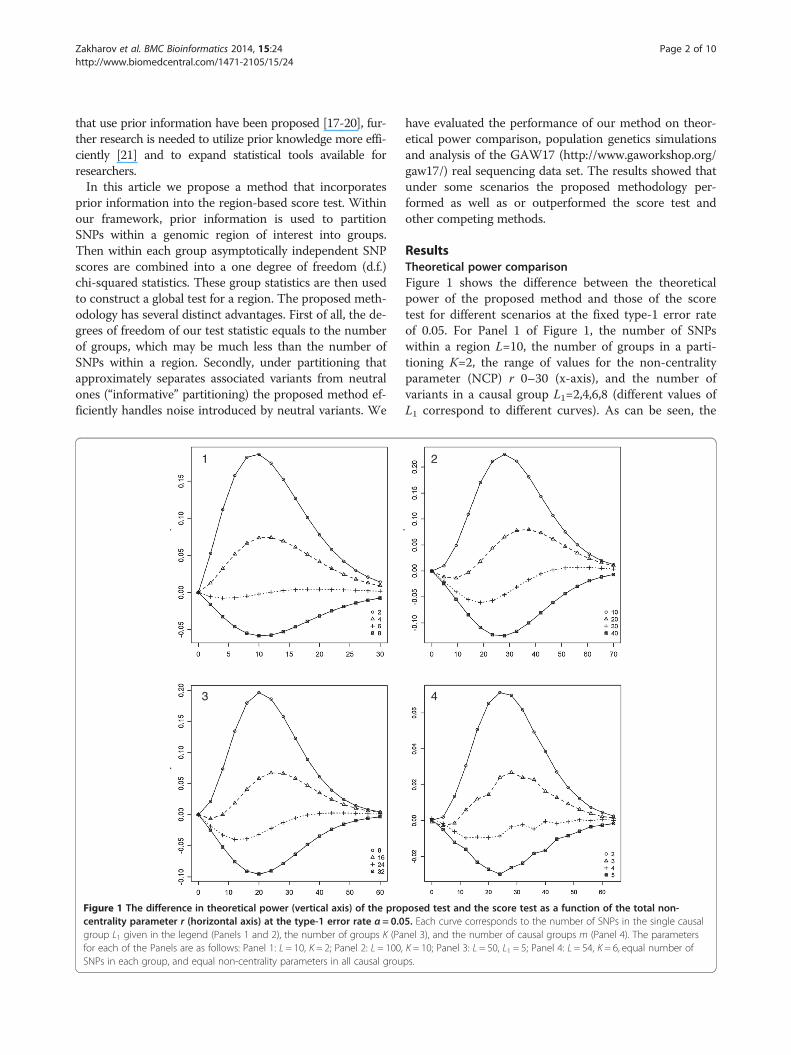
Figure 1 The difference in theoretical power (vertical axis) of the procentrality parameter r (horizontal axis) at the type-1 error rate α = 0.0group L1 given in the legend (Panels 1 and 2), the number of groups K (Pafor each of the Panels are as follows: Panel 1: L = 10, K = 2; Panel 2: L = 100,SNPs in each group, and equal non-centrality parameters in all causal grou
have evaluated the performance of our method on theor-etical power comparison, population genetics simulationsand analysis of the GAW17 (http://www.gaworkshop.org/gaw17/) real sequencing data set. The results showed thatunder some scenarios the proposed methodology per-formed as well as or outperformed the score test andother competing methods.
ResultsTheoretical power comparisonFigure 1 shows the difference between the theoreticalpower of the proposed method and those of the scoretest for different scenarios at the fixed type-1 error rateof 0.05. For Panel 1 of Figure 1, the number of SNPswithin a region L=10, the number of groups in a parti-tioning K=2, the range of values for the non-centralityparameter (NCP) r 0–30 (x-axis), and the number ofvariants in a causal group L1=2,4,6,8 (different values ofL1 correspond to different curves). As can be seen, the
2
4
posed test and the score test as a function of the total non-5. Each curve corresponds to the number of SNPs in the single causalnel 3), and the number of causal groups m (Panel 4). The parametersK = 10; Panel 3: L = 50, L1 = 5; Panel 4: L = 54, K = 6, equal number ofps.
Zakharov et al. BMC Bioinformatics 2014, 15:24 Page 3 of 10http://www.biomedcentral.com/1471-2105/15/24
power gain of the proposed method reached as high as15 percent when the number of SNPs in the causalgroup L1 was not large. However, the power of the pro-posed test was lower than those of the score test whenL1 was large. This can be explained from the formula(3), which implies that with an increase in the numberof variants in a causal group L1 and fixed NCP r thevalue of the group statistic H1 monotonically decreases.Also, it is noticeable that with an increase in NCP r up tosome point the power difference also increased when L1was small, whereas the power difference decreased for largevalues of L1. For very large values of NCP r the power dif-ference became close to 0 as theoretical powers of bothtests tended to 1. Similar conclusions can be obtained fromPanel 2 of Figure 1 which shows the results for the scenariowith the following parameters: L=100, K=10, varying NCPr (x-axis), and varying L1=10,20,30,40.To investigate the impact of the number of groups K
on power the following model was considered (Panel 3of Figure 1): L=50, L1=5, and K=8,16,24,32. As can beseen, the power difference is below zero for large valuesof K and above zero for small values of K. This may beexplained by the fact that the test statistic T1 (4) is dis-tributed as chi-squared random variable with K d.f.Thus, for the fixed NCP r and increasing value of K thepower of the proposed method monotonically decreases.Alongside the models considered above, it is important
to include a scenario when causal variants are split be-tween several groups. Panel 4 of Figure 1 depicts thepower difference under the following model: L = 54, K =6, and the number of causal groups m = 2,3,4,5. Also,for simplicity of presentation it was assumed that eachgroup contained equal number of variants (54/6 = 9),and NCP r was split equally between all causal groups.For this scenario the calculation of theoretical distribu-tion of T1 (4) was done using 500,000 simulations of teststatistics under the alternative hypothesis, as equation(6) cannot be used here. As can be seen from Panel 4 ofFigure 1, our methodology could gain power if associ-ated SNPs were split between several groups. When thenumber of causal groups became large, our method wasslightly worse than the score test. It should be noted thatfor all models the maximum power gain of our method(and equivalently the maximum power loss) was achievedwhen the power of the score test was around 50%. Conclu-sions similar to those above can be derived from Additionalfile 1 which shows the same scenarios for the fixed type-1error rate set at the genome-wide level assuming 35,000genes (α = 0.05/35000).
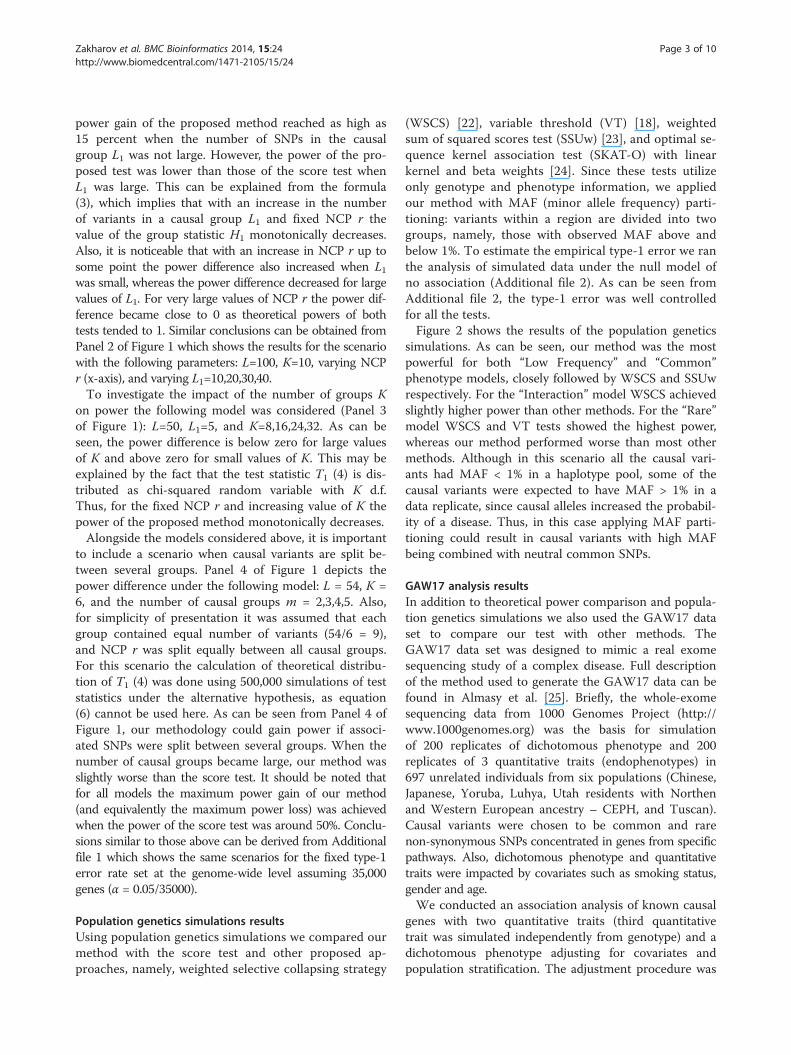
Population genetics simulations resultsUsing population genetics simulations we compared ourmethod with the score test and other proposed ap-proaches, namely, weighted selective collapsing strategy
(WSCS) [22], variable threshold (VT) [18], weightedsum of squared scores test (SSUw) [23], and optimal se-quence kernel association test (SKAT-O) with linearkernel and beta weights [24]. Since these tests utilizeonly genotype and phenotype information, we appliedour method with MAF (minor allele frequency) parti-tioning: variants within a region are divided into twogroups, namely, those with observed MAF above andbelow 1%. To estimate the empirical type-1 error we ranthe analysis of simulated data under the null model ofno association (Additional file 2). As can be seen fromAdditional file 2, the type-1 error was well controlledfor all the tests.Figure 2 shows the results of the population genetics
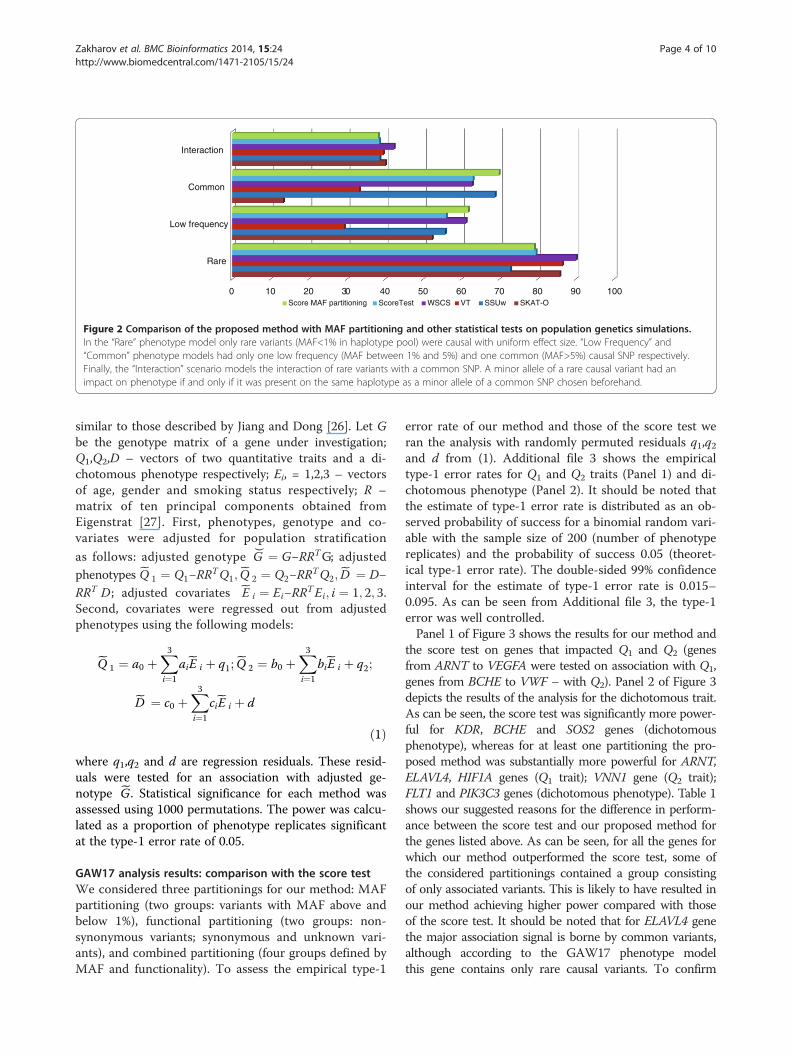
simulations. As can be seen, our method was the mostpowerful for both “Low Frequency” and “Common”phenotype models, closely followed by WSCS and SSUwrespectively. For the “Interaction” model WSCS achievedslightly higher power than other methods. For the “Rare”model WSCS and VT tests showed the highest power,whereas our method performed worse than most othermethods. Although in this scenario all the causal vari-ants had MAF < 1% in a haplotype pool, some of thecausal variants were expected to have MAF > 1% in adata replicate, since causal alleles increased the probabil-ity of a disease. Thus, in this case applying MAF parti-tioning could result in causal variants with high MAFbeing combined with neutral common SNPs.
GAW17 analysis resultsIn addition to theoretical power comparison and popula-tion genetics simulations we also used the GAW17 dataset to compare our test with other methods. TheGAW17 data set was designed to mimic a real exomesequencing study of a complex disease. Full descriptionof the method used to generate the GAW17 data can befound in Almasy et al. [25]. Briefly, the whole-exomesequencing data from 1000 Genomes Project (http://www.1000genomes.org) was the basis for simulationof 200 replicates of dichotomous phenotype and 200replicates of 3 quantitative traits (endophenotypes) in697 unrelated individuals from six populations (Chinese,Japanese, Yoruba, Luhya, Utah residents with Northenand Western European ancestry – CEPH, and Tuscan).Causal variants were chosen to be common and rarenon-synonymous SNPs concentrated in genes from specificpathways. Also, dichotomous phenotype and quantitativetraits were impacted by covariates such as smoking status,gender and age.We conducted an association analysis of known causal
genes with two quantitative traits (third quantitativetrait was simulated independently from genotype) and adichotomous phenotype adjusting for covariates andpopulation stratification. The adjustment procedure was
0 10 20 30 40 50 60 70 80 90 100
Rare
Low frequency
Common
Interaction
Score MAF partitioning ScoreTest WSCS VT SSUw SKAT-O
Figure 2 Comparison of the proposed method with MAF partitioning and other statistical tests on population genetics simulations.In the “Rare” phenotype model only rare variants (MAF<1% in haplotype pool) were causal with uniform effect size. “Low Frequency” and“Common” phenotype models had only one low frequency (MAF between 1% and 5%) and one common (MAF>5%) causal SNP respectively.Finally, the “Interaction” scenario models the interaction of rare variants with a common SNP. A minor allele of a rare causal variant had animpact on phenotype if and only if it was present on the same haplotype as a minor allele of a common SNP chosen beforehand.
Zakharov et al. BMC Bioinformatics 2014, 15:24 Page 4 of 10http://www.biomedcentral.com/1471-2105/15/24
similar to those described by Jiang and Dong [26]. Let Gbe the genotype matrix of a gene under investigation;Q1,Q2,D – vectors of two quantitative traits and a di-chotomous phenotype respectively; Ei, = 1,2,3 – vectorsof age, gender and smoking status respectively; R –matrix of ten principal components obtained fromEigenstrat [27]. First, phenotypes, genotype and co-variates were adjusted for population stratification
as follows: adjusted genotype G⌣ ¼ G−RRTG; adjusted
phenotypes Q 1 ¼ Q1−RRTQ1; Q 2 ¼ Q2−RR
TQ2; D ¼ D−RRT D ; adjusted covariates E i ¼ Ei−RRTEi; i ¼ 1; 2; 3.Second, covariates were regressed out from adjustedphenotypes using the following models:
Q 1 ¼ a0 þX3i¼1
aiE i þ q1; Q 2 ¼ b0 þX3i¼1
biE i þ q2;
D ¼ c0 þX3i¼1
ciE i þ d
ð1Þwhere q1,q2 and d are regression residuals. These resid-uals were tested for an association with adjusted ge-notype G. Statistical significance for each method wasassessed using 1000 permutations. The power was calcu-lated as a proportion of phenotype replicates significantat the type-1 error rate of 0.05.
GAW17 analysis results: comparison with the score testWe considered three partitionings for our method: MAFpartitioning (two groups: variants with MAF above andbelow 1%), functional partitioning (two groups: non-synonymous variants; synonymous and unknown vari-ants), and combined partitioning (four groups defined byMAF and functionality). To assess the empirical type-1
error rate of our method and those of the score test weran the analysis with randomly permuted residuals q1,q2and d from (1). Additional file 3 shows the empiricaltype-1 error rates for Q1 and Q2 traits (Panel 1) and di-chotomous phenotype (Panel 2). It should be noted thatthe estimate of type-1 error rate is distributed as an ob-served probability of success for a binomial random vari-able with the sample size of 200 (number of phenotypereplicates) and the probability of success 0.05 (theoret-ical type-1 error rate). The double-sided 99% confidenceinterval for the estimate of type-1 error rate is 0.015–0.095. As can be seen from Additional file 3, the type-1error was well controlled.Panel 1 of Figure 3 shows the results for our method and
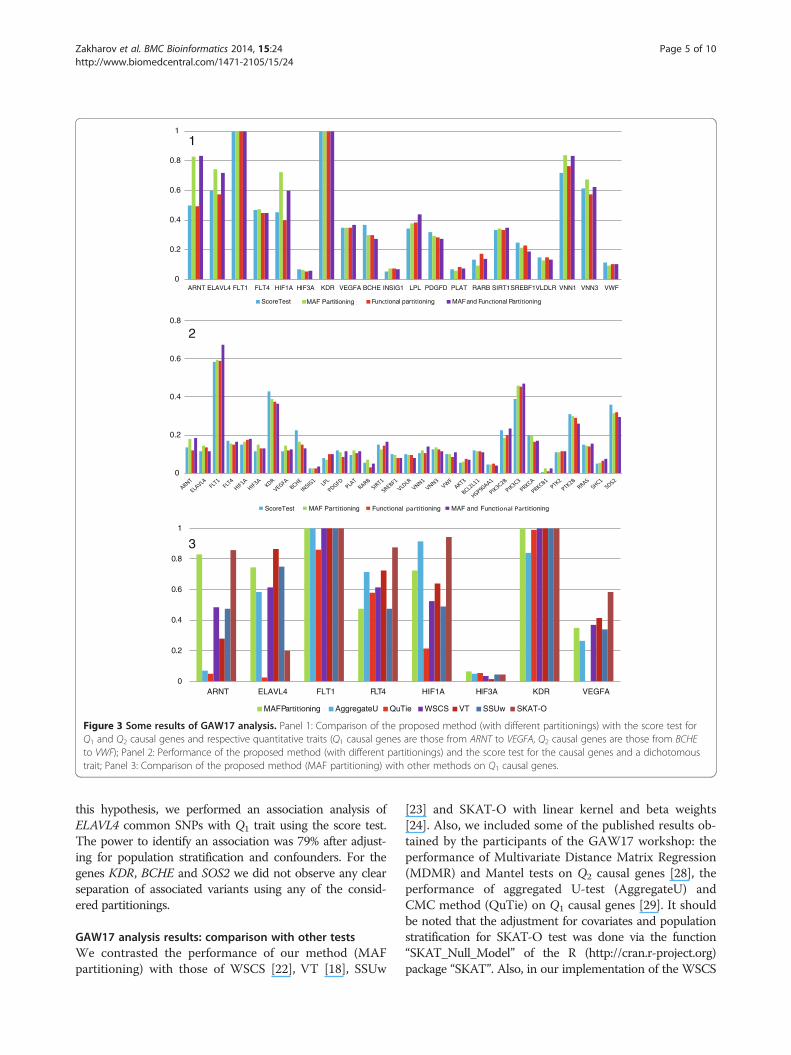
the score test on genes that impacted Q1 and Q2 (genesfrom ARNT to VEGFA were tested on association with Q1,genes from BCHE to VWF – with Q2). Panel 2 of Figure 3depicts the results of the analysis for the dichotomous trait.As can be seen, the score test was significantly more power-ful for KDR, BCHE and SOS2 genes (dichotomousphenotype), whereas for at least one partitioning the pro-posed method was substantially more powerful for ARNT,ELAVL4, HIF1A genes (Q1 trait); VNN1 gene (Q2 trait);FLT1 and PIK3C3 genes (dichotomous phenotype). Table 1shows our suggested reasons for the difference in perform-ance between the score test and our proposed method forthe genes listed above. As can be seen, for all the genes forwhich our method outperformed the score test, some ofthe considered partitionings contained a group consistingof only associated variants. This is likely to have resulted inour method achieving higher power compared with thoseof the score test. It should be noted that for ELAVL4 genethe major association signal is borne by common variants,although according to the GAW17 phenotype modelthis gene contains only rare causal variants. To confirm
0
0.2
0.4
0.6
0.8
1
ARNT ELAVL4 FLT1 FLT4 HIF1A HIF3A KDR VEGFA
MAFPar oning AggregateU QuTie WSCS VT SSUw SKAT-O
0
0.2
0.4
0.6
0.8
ScoreTest MAF Par oning Func onal oning MAF and Func oning
0
0.2
0.4
0.6
0.8
1
ARNT ELAVL4 FLT1 FLT4 HIF1A HIF3A KDR VEGFA BCHE INSIG1 LPL PDGFD PLAT RARB SIRT1SREBF1VLDLR VNN1 VNN3 VWF
ScoreTest MAF Partitioning Fun onal par oning MAFand Fun onal Par oning
2
3
1
Figure 3 Some results of GAW17 analysis. Panel 1: Comparison of the proposed method (with different partitionings) with the score test forQ1 and Q2 causal genes and respective quantitative traits (Q1 causal genes are those from ARNT to VEGFA, Q2 causal genes are those from BCHEto VWF); Panel 2: Performance of the proposed method (with different partitionings) and the score test for the causal genes and a dichotomoustrait; Panel 3: Comparison of the proposed method (MAF partitioning) with other methods on Q1 causal genes.
Zakharov et al. BMC Bioinformatics 2014, 15:24 Page 5 of 10http://www.biomedcentral.com/1471-2105/15/24
this hypothesis, we performed an association analysis ofELAVL4 common SNPs with Q1 trait using the score test.The power to identify an association was 79% after adjust-ing for population stratification and confounders. For thegenes KDR, BCHE and SOS2 we did not observe any clearseparation of associated variants using any of the consid-ered partitionings.
GAW17 analysis results: comparison with other testsWe contrasted the performance of our method (MAFpartitioning) with those of WSCS [22], VT [18], SSUw
[23] and SKAT-O with linear kernel and beta weights[24]. Also, we included some of the published results ob-tained by the participants of the GAW17 workshop: theperformance of Multivariate Distance Matrix Regression(MDMR) and Mantel tests on Q2 causal genes [28], theperformance of aggregated U-test (AggregateU) andCMC method (QuTie) on Q1 causal genes [29]. It shouldbe noted that the adjustment for covariates and populationstratification for SKAT-O test was done via the function“SKAT_Null_Model” of the R (http://cran.r-project.org)package “SKAT”. Also, in our implementation of the WSCS
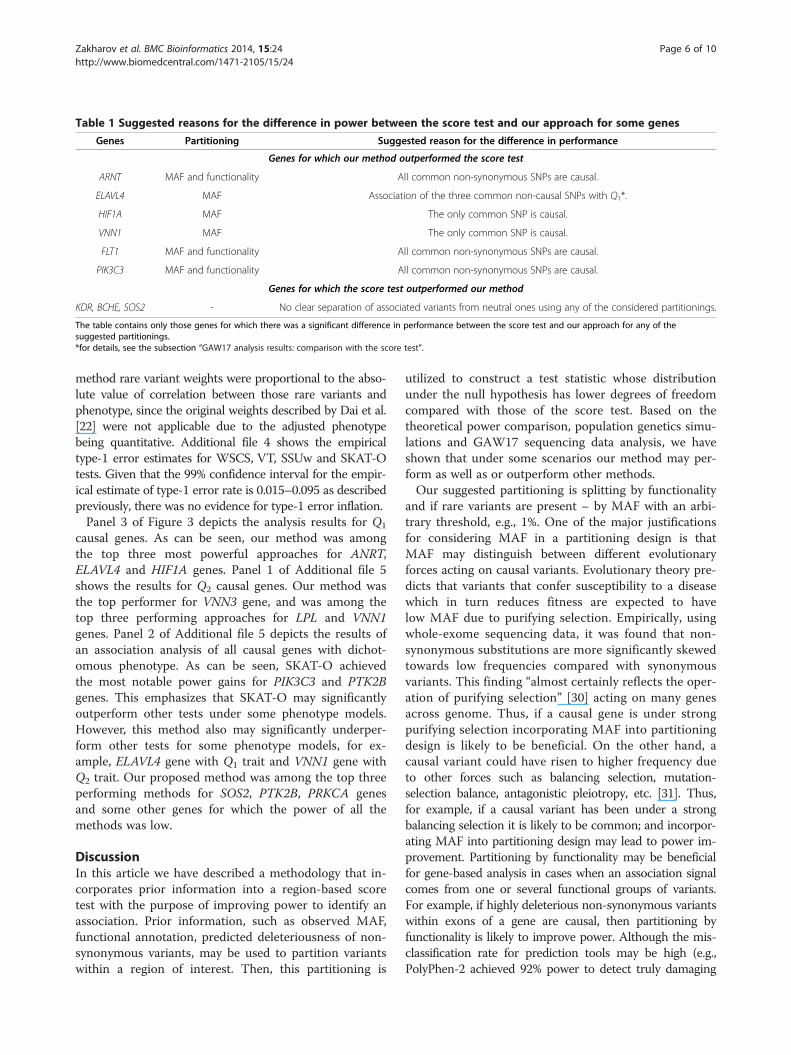
Table 1 Suggested reasons for the difference in power between the score test and our approach for some genes
Genes Partitioning Suggested reason for the difference in performance
Genes for which our method outperformed the score test
ARNT MAF and functionality All common non-synonymous SNPs are causal.
ELAVL4 MAF Association of the three common non-causal SNPs with Q1*.
HIF1A MAF The only common SNP is causal.
VNN1 MAF The only common SNP is causal.
FLT1 MAF and functionality All common non-synonymous SNPs are causal.
PIK3C3 MAF and functionality All common non-synonymous SNPs are causal.
Genes for which the score test outperformed our method
KDR, BCHE, SOS2 - No clear separation of associated variants from neutral ones using any of the considered partitionings.
The table contains only those genes for which there was a significant difference in performance between the score test and our approach for any of thesuggested partitionings.*for details, see the subsection “GAW17 analysis results: comparison with the score test”.
Zakharov et al. BMC Bioinformatics 2014, 15:24 Page 6 of 10http://www.biomedcentral.com/1471-2105/15/24
method rare variant weights were proportional to the abso-lute value of correlation between those rare variants andphenotype, since the original weights described by Dai et al.[22] were not applicable due to the adjusted phenotypebeing quantitative. Additional file 4 shows the empiricaltype-1 error estimates for WSCS, VT, SSUw and SKAT-Otests. Given that the 99% confidence interval for the empir-ical estimate of type-1 error rate is 0.015–0.095 as describedpreviously, there was no evidence for type-1 error inflation.Panel 3 of Figure 3 depicts the analysis results for Q1
causal genes. As can be seen, our method was amongthe top three most powerful approaches for ANRT,ELAVL4 and HIF1A genes. Panel 1 of Additional file 5shows the results for Q2 causal genes. Our method wasthe top performer for VNN3 gene, and was among thetop three performing approaches for LPL and VNN1genes. Panel 2 of Additional file 5 depicts the results ofan association analysis of all causal genes with dichot-omous phenotype. As can be seen, SKAT-O achievedthe most notable power gains for PIK3C3 and PTK2Bgenes. This emphasizes that SKAT-O may significantlyoutperform other tests under some phenotype models.However, this method also may significantly underper-form other tests for some phenotype models, for ex-ample, ELAVL4 gene with Q1 trait and VNN1 gene withQ2 trait. Our proposed method was among the top threeperforming methods for SOS2, PTK2B, PRKCA genesand some other genes for which the power of all themethods was low.
DiscussionIn this article we have described a methodology that in-corporates prior information into a region-based scoretest with the purpose of improving power to identify anassociation. Prior information, such as observed MAF,functional annotation, predicted deleteriousness of non-synonymous variants, may be used to partition variantswithin a region of interest. Then, this partitioning is
utilized to construct a test statistic whose distributionunder the null hypothesis has lower degrees of freedomcompared with those of the score test. Based on thetheoretical power comparison, population genetics simu-lations and GAW17 sequencing data analysis, we haveshown that under some scenarios our method may per-form as well as or outperform other methods.Our suggested partitioning is splitting by functionality
and if rare variants are present – by MAF with an arbi-trary threshold, e.g., 1%. One of the major justificationsfor considering MAF in a partitioning design is thatMAF may distinguish between different evolutionaryforces acting on causal variants. Evolutionary theory pre-dicts that variants that confer susceptibility to a diseasewhich in turn reduces fitness are expected to havelow MAF due to purifying selection. Empirically, usingwhole-exome sequencing data, it was found that non-synonymous substitutions are more significantly skewedtowards low frequencies compared with synonymousvariants. This finding “almost certainly reflects the oper-ation of purifying selection” [30] acting on many genesacross genome. Thus, if a causal gene is under strongpurifying selection incorporating MAF into partitioningdesign is likely to be beneficial. On the other hand, acausal variant could have risen to higher frequency dueto other forces such as balancing selection, mutation-selection balance, antagonistic pleiotropy, etc. [31]. Thus,for example, if a causal variant has been under a strongbalancing selection it is likely to be common; and incorpor-ating MAF into partitioning design may lead to power im-provement. Partitioning by functionality may be beneficialfor gene-based analysis in cases when an association signalcomes from one or several functional groups of variants.For example, if highly deleterious non-synonymous variantswithin exons of a gene are causal, then partitioning byfunctionality is likely to improve power. Although the mis-classification rate for prediction tools may be high (e.g.,PolyPhen-2 achieved 92% power to detect truly damaging
Zakharov et al. BMC Bioinformatics 2014, 15:24 Page 7 of 10http://www.biomedcentral.com/1471-2105/15/24
variants at 20% type-1 error rate over HumDiv data [32]),our method may still benefit from grouping variants byfunctional significance, since this is an effective way to givemore emphasis on variants that are more likely to be causal[33]. The benefit of using functional information was dem-onstrated in several simulations and candidate gene se-quencing studies [18,34,35].There are a few limitations of the proposed methodology.
First, it is unknown in advance which prior information isrelevant for a given genomic region. Prior information thatdoes not help to uncover groups of associated variants islikely to have negative impact on statistical power. Second,the test statistic (3) is, in general, not invariant with respectto the ordering of SNPs. This can be seen, for example, whenthe covariance matrix V is invariant with respect to permuta-tion of elements of the score vector U (e.g., all the cross-SNPcovariances are the same, and diagonal variances are equal).So, for any SNP ordering the Cholesky decomposition A isthe same; hence, the test statistic is, in general, dependent onordering. To clarify the ambiguity the ordering of SNPs ac-cording to a position on a chromosome may be assumed.
ConclusionsA novel statistical approach that incorporates prior in-formation in a region-based score test with the purposeof improving power has been proposed. Theoreticalpower comparison, population genetics simulations andthe results of the GAW17 data set analysis showed thatunder some scenarios our method may perform as wellas or outperform other methods.
MethodsConsider a rare variants association study of a genomicregion with a dichotomous or quantitative trait. Let usintroduce the following notations: genotype matrix G ={gnl, n = 1,…,N, l = 1,…, L} coded as minor allele counts,where n and l are indices for individuals and variants re-spectively; N × 1 vector of genotypes for the lth variantgl = {gnl, n = 1,…,N}; mean of genotype for the lth variant�gl ; phenotype vector Y = {yn, n = 1,…,N}, mean of pheno-type �Y . Consider the generalized linear model g(Ey) = b0+Gb, where b = {b1,…, bL} is a vector of regression coef-ficients, and g is a monotone link function. The scoretest statistic used to test an association of phenotypewith genotype is as follows [36]:
T0 ¼ UTV −1U ; ð2Þ
where U ¼XNn¼1
yn−�Yð Þ gnl−�g l� �( )L
l¼1
is the vector of scores,
V ¼ Cov Gð ÞXNn¼1
yn−�Yð Þ2 is L×L the score covariance matrix as-
sumed to be non-singular, and Cov Gð Þ ¼ Cov gl; gl0� �� �L
l;l0¼1
is the L × L genotype covariance matrix. Under the null
hypothesis (none of the variants is associated with pheno-type) T0 asymptotically follows chi-squared distributionwith rank(V) degrees of freedom (d.f.). Under the alterna-tive hypothesis (at least one variant is associated withphenotype) the asymptotic distribution of (2) can be ap-proximated by a non-central chi-squared distribution.Following is the description of our proposed method.
First, let us transform the coordinates of score vectorU to be asymptotically independent under the nullhypothesis. If we denote C = (AT)−1, where matrix A is aCholesky decomposition of V (V =ATA), the vector S =CU, under the null hypothesis, is asymptotically distrib-uted as a standard multivariate normal random vector(since Cov(CU) =CCov(U)CT = (AT)− 1VA− 1 = (AT)− 1(ATA)A− 1 = I). It should be noted that under the alternative hy-pothesis S is approximately distributed as a multivariatenormal random vector with nonzero mean and unit covari-ance matrix under the assumption of V being a reasonableapproximation for the covariance matrix of U [37]. In gen-eral, any other decomposition of the covariance matrix V ofthe form V =ATA can be used. We apply Cholesky decom-position because it is fast to compute even for big covari-ance matrices.Next, let us describe group statistics. Consider parti-
tioning of L SNPs within a region into K disjoint groupsGk, k = 1,…, K of size Lk, k = 1,…, K. This partitioning isdone using prior information, for example: by observedMAF (below and above some arbitrary frequency thresh-old); by functional annotation (non-synonymous andsynonymous for exon sequencing studies; exonic, in-tronic, 3′UTR, 5′UTR and intergenic for gene-basedstudies); by functional significance for non-synonymousSNPS (benign, probably and possibly damaging fromSIFT or PolyPhen output) etc. For each group let us de-
fine tk ¼Xl∈Gk
s2l ; k ¼ 1;…;K , where sl, l = 1,…, L is the lth
coordinate of the vector S. It should be noted that parti-tioning based on prior to S, since S = (AT)−1 U is thevector U in a new basis, which is the set of column vec-tors of the matrix AT (old basis is a standard basis).Since the vector S is multivariate normal with unit co-variance matrix, tk, k = 1,…, K are asymptotically inde-pendent. Under the null hypothesis tk asymptoticallyfollows central chi-squared distribution with Lk degreesof freedom, whereas under the alternative hypothesis atleast one of the tk, k = 1,…, K is distributed as a non-central chi-squared random variable. Let us denote as Pland Pl
−1 cumulative distribution function (CDF) of cen-tral chi-squared random variable with l d.f. and its in-verse respectively. Group statistics Hk are defined asfollows:
Hk ¼ P−11 PLk tkð Þð Þ: ð3Þ
Zakharov et al. BMC Bioinformatics 2014, 15:24 Page 8 of 10http://www.biomedcentral.com/1471-2105/15/24
It should be noted that under the null hypothesis Hk
follows a central chi-squared distribution with 1 d.f.Finally, the test statistic of our proposed method is:
T1 ¼XKk¼1
Hk : ð4Þ
Under the null hypothesis T1 is distributed as a chi-squared random variable with K d.f. Large value of T1
indicates the deviation from the null hypothesis. Trans-formation (3) is used to decrease the degrees of freedomof the final test, as some of the groups Gk, k = 1,…, Kmay contain only neutral variants. If kth group does notcontain associated SNPs, group Gk contributes only 1 d.f. tothe final test, whereas it adds Lk d.f. to the score test. Thus,under “informative” partitioning our proposed method maygain power compared with the score test.There are few notes that should be taken into account
when applying our method. First, the theoretical ap-proximation for distribution of tk may not hold undermoderate sample sizes. Hence, in all our simulations andreal data application we used the empirical CDF of tk,denoted as Fk, obtained via 1000 permutations under thenull hypothesis. Instead of PLk tkð Þ in (3) we calculated aGaussian kernel CDF estimate Fk(tk) with a multi-stageplug-in bandwidth of Polansky and Baker [38]. R (http://cran.r-project.org) package ‘kerdiest’ contains all the ne-cessary algorithms. Second, the covariance matrix V mayhappen to be computationally or exactly singular when,for example, considering a region with high LD betweencommon SNPs. In general, to avoid singularity issues weapply Monroe-Penrose pseudoinverse in (2) instead of V−1.This pseudoinverse is uniquely defined and equals thestandard inverse matrix when V is non-singular. From thesame considerations instead of usual Cholesky factoringwe used generalized Cholesky decomposition, which iswell defined for square symmetric positive semi-definitematrices. If V is non-singular, the generalized Cholesky de-composition equals the usual Cholesky factoring. Also, itshould be noted that in general our test statistic is not in-variant with respect to the ordering of variants within a re-gion. To clarify the ambiguity we assume the ordering ofSNPs according to a position on a chromosome (see the“Discussion” section).
Theoretical power calculationsTo evaluate our method we compared its theoreticalpower with those of the score test. Denote the non-centrality parameter (NCP) of the test statistic (2) underthe alternative hypothesis as r (the connection between rand effect size is provided in the Additional files 6 and7). Also, we will use the notations Pl,r and Pl,r
−1 for theCDF of non-central chi-squared random variable with l
d.f. and NCP r and its inverse respectively. The power ofthe score test with type-1 error rate α is:
1−PL;r q1−α;L� �
; ð5Þ
where q1−α,L is 1 − α quantile of the chi-squared distribu-tion with L d.f. Let us assume that all the causal SNPsare uncorrelated with other SNPs within a region, andthat they are in one of the K groups (without loss ofgenerality, let it be the first group k = 1). Then, thepower of the proposed test is:
1−P H1 þ χ2K−1 < q1−α;K� �
; ð6Þ
sinceXKk¼2
hk follows a central chi-squared distribution
with K − 1 d.f., because all associated SNPs are in thefirst group. The probability in (6) can be computed usingthe convolution of two CDFs as follows:
P H1 þ χ2K−1 < q1−α;K� �
¼Zq1−α;K0
P H1 < q1−α;K−x� �
dPK−1 xð Þ:
ð7ÞUnder the alternative hypothesis non-centrality par-
ameter of T0 and those of t1 are equal, since both sta-tistics include all the associated SNPs within a region.
Thus, the distribution of H1 is P−11 PL1 χ2L1;r
� �� �, and the
integrand in the equation (7) can be calculated as P
H1 < q1−α;K−x� �
¼ PL1;r P−1L1 P1 q1−α;K−x
� �� �� �. This al-
lows us to compute the theoretical power of ourmethod.
Population genetics simulationsBoyko et al. [39] found a simple two-epoch expansionmodel to be one of the best-fit models for population gen-etics simulations of African-American genotype. Also, theauthors found strong evidence of selective effects acting onnew amino acid replacing mutations and inferred thedistribution of those selective effects. The scaled populationselection coefficient (defined as a selection coefficientmultiplied by twice the effective population size) was as-sumed to follow a negative gamma distribution with thefollowing parameters: shape 0.184 and scale 8200. Mutationrate was set at 1.8 × 10⁻⁸ per nucleotide per generation.The selective disadvantage was additive. Using the forwardsimulator SFS_CODE (http://sfscode.sourceforge.net) withthe parameters described above, we generated 100 haplo-type pools for a 3 kb coding genomic region. Each haplo-type pool contained 4000 haplotypes. In our simulations weconsidered only non-synonymous variants. To generate adata replicate we first selected a haplotype pool at random.
Zakharov et al. BMC Bioinformatics 2014, 15:24 Page 9 of 10http://www.biomedcentral.com/1471-2105/15/24
Within that pool we sampled a pair of haplotypes at ran-dom and added those haplotypes to form a multi-site geno-type of an “individual”. Dichotomous phenotype wasassigned based on this multi-site genotype using a linear lo-gistic model through which we controlled the odds ratiosof causal variants. The probability of a disease conditionalon the wild type genotype was set at 1% for all phenotypemodels.We considered four phenotype scenarios. For the first
model called “Rare” randomly chosen 50% of rare vari-ants (defined as those with MAF<1%) within a haplotypepool were assigned to be causal with uniform odds ratioof 3. For the “Low Frequency” scenario one randomlychosen low frequency SNP (MAF between 1% and 5%in a haplotype pool) was causal with odds ratio of 2.5.If there was no SNP with MAF between 1% and 5% in ahaplotype pool, we selected a SNP with the lowest MAFabove 5%. For the “Common” scenario one commonSNP with MAF>5% in a haplotype pool was causal andhad the odds ratio of 1.5. Finally, the “Interaction” sce-nario models the hypothesized interaction of commonand rare variants in RET gene associated with Hirsch-sprung’s disease [40,41]. The simulation framework forthis scenario was previously described by Liu and Leal[42]. Briefly, 50% of rare variants were assigned to becausal. Each causal rare minor allele increased the oddsof a disease by 6 times if and only if it was present onthe same haplotype as a minor allele of a common SNPrandomly chosen beforehand.Sample sizes were the following: 500 cases and 500
controls for “Rare”, “Low frequency” and “Common”scenarios; 1000 cases and 1000 controls for “Interaction”model. In total 1000 data replicates were generated foreach scenario. Power was estimated as a proportion ofdata replicates significant at a fixed type-1 error of 0.05.For all the statistical tests 1000 permutations were ap-plied to estimate a significance level.
Additional files
Additional file 1: The difference in theoretical power (vertical axis)between the proposed test and the score test as a function of thetotal non-centrality parameter r (horizontal axis) at the genome-wide type-1 error rate α = 0.05/35000. Each curve corresponds tothe number of SNPs in the causal group L1 given in the legend(Panels 1 and 2), number of groups K (Panel 3), and number ofcausal groups m (Panel 4). The parameters for each of the Panels are asfollows: Panel 1: L = 10, K = 2; Panel 2: L = 100, K = 10; Panel 3: L = 50,L1 = 5; Panel 4: L = 54, K = 6, equal number of SNPs in each group, andequal non-centrality parameters in all causal groups.
Additional file 2: The estimate of empirical type-1 error rate of theproposed method with MAF partitioning, the score test, VT, WSCS,SSUw and SKAT-O for population genetics simulations. The theoreticaltype-1 error was assumed to be 0.05. The data for the estimate ofthe type-1 error was generated using the null phenotype model: noassociation of genotype with phenotype.
Additional file 3: The estimate of empirical type-1 error rate of theproposed method with different partitionings and those of thescore test for the causal genes in GAW17 data. The theoretical type-1error was assumed to be 0.05. Panel 1: Q1 and Q2 causal genes andrespective quantitative trait (Q1 causal genes are those from ARNT toVEGFA, Q2 causal genes are those from BCHE to VWF); Panel 2: causalgenes and dichotomous trait.
Additional file 4: The estimate of empirical type-1 error rate ofWSCS, VT, SSUw and SKAT-O tests for the causal genes in GAW17data. The theoretical type-1 error was assumed to be 0.05. Panel 1: Q1
and Q2 causal genes and respective quantitative trait (Q1 causal genesare those from ARNT to VEGFA, Q2 causal genes are those from BCHE toVWF); Panel 2: causal genes and a dichotomous trait.
Additional file 5: Some results of GAW17 analysis. Panel 1:Comparison of the proposed method (MAF partitioning) with othermethods on Q2 causal genes; Panel 2: Comparison of the proposedmethod (MAF partitioning) with other methods on causal genes and adichotomous phenotype.
Additional file 6: The link between the non-centrality parameterand the effect size for the region-based score test. The derivation ofthe equation connecting the non-centrality parameter (NCP) and the ef-fect size for a region-based score test, and the description of assumptionsfor illustrating the dependence of NCP on the effect size in Additional file 7.
Additional file 7: The non-centrality parameter (vertical axis) as afunction of the effect size (relative risk) of each causal variant (hori-zontal axis) under the assumptions described in Additional file 6.Curves within each panel correspond to the number of causal variantswithin the region. The assumptions are as follows: all variants within aregion are independent; all the causal variants have the same MAF andthe same effect size; 500 cases and 500 controls. The MAF of the causalvariants are as follows: Panel 1 – 1%; Panel 2 – 0.5%; Panel 3 – 0.25%:Panel 4 – 0.125%.
Competing interestsThe authors declare that they have no competing interests.
Authors’ contributionsSZ, AS and AT conceived the study. SZ and AT designed the experiments. SZand GHKT conducted the experiments and performed the analysis. SZ wrotethe manuscript. All authors read and approved the final manuscript.
AcknowledgementsWe would like to thank the GAW17 workshop organizers for their permissionto use their data in our research. Preparation of the Genetic AnalysisWorkshop 17 Simulated Exome Data Set was supported by the GAW grant,R01 GM031575, and in part by NIH R01 MH059490. The workshop usedsequencing data from the 1000 Genomes Project (www.1000genomes.org).
FundingThis work was supported by the Agency for Science, Technology andResearch (A*STAR, Singapore). The first author is a recipient of the SingaporeInternational Graduate Award.
Author details1Human Genetics, Genome Institute of Singapore, 60 Biopolis Street, #02-01Genome, Singapore 138672, Singapore. 2Saw Swee Hock School of PublicHealth, National University of Singapore, 16 Medical Drive, Singapore 117597,Singapore. 3Department of Mathematics and Statistics, La Trobe University,Bundoora, VIC 3086, Australia. 4Centre for Healthy Brain Ageing (CHeBA),School of Psychiatry, University of New South Wales, Sydney, Australia.
Received: 3 July 2012 Accepted: 17 January 2014Published: 22 January 2014
References1. Maher B: Personal genomes: the case of the missing heritability. Nature
2008, 456:18–21.
Zakharov et al. BMC Bioinformatics 2014, 15:24 Page 10 of 10http://www.biomedcentral.com/1471-2105/15/24
2. Park J-H, Wacholder S, Gail MH, Peters U, Jacobs KB, Chanock SJ, Chatterjee N:Estimation of effect size distribution from genome-wide association studiesand implications for future discoveries. Nat Genet 2010, 42(7):570–575.
3. Schork NJ, Murray SS, Frazer KA, Topol EJ: Common vs. rare allelehypotheses for complex diseases. Curr Opin Genet Dev 2009,19(3):212–219.
4. Ahituv N, Kavaslar N, Schackwitz W, Ustaszewska A, Martin J, Hébert S,Doelle H, Ersoy B, Kryukov G, Schmidt S, et al: Medical sequencing at theextremes of human body mass. Am J Hum Genet 2007, 80(4):779–791.
5. Azzopardi D, Dallosso AR, Eliason K, Hendrickson BC, Jones N, Rawstorne E,Colley J, Moskvina V, Frye C, Sampson JR, et al: Multiple rarenonsynonymous variants in the adenomatous polyposis coli genepredispose to colorectal adenomas. Cancer Res 2008, 68(2):358–363.
6. Bowes J, Lawrence R, Eyre S, Panoutsopoulou K, Orozco G, Elliott K, Ke X,Morris A, Thomson W, Worthington J, et al: Rare variation at the TNFAIP3locus and susceptibility to rheumatoid arthritis. Hum Genet 2010,128(6):627–633.
7. Cohen JC, Pertsemlidis A, Fahmi S, Esmail S, Vega GL, Grundy SM, HobbsHH: Multiple rare variants in NPC1L1 associated with reduced sterolabsorption and plasma low-density lipoprotein levels. Proc Natl Acad SciU S A 2006, 103(6):1810–1815.
8. Haller G, Torgerson DG, Ober C, Thompson EE: Sequencing the IL4 locus inAfrican Americans implicates rare noncoding variants in asthmasusceptibility. J Allergy Clin Immunol 2009, 124(6):1204–1209. e1209.
9. Li B, Leal M: Methods for detecting associations with rare variants forcommon diseases: application to analysis of sequence data. Am J HumGenet 2008, 83:311–321.
10. Madsen B, Browning S: A groupwise association test for rare mutationsusing a weighted sum statistic. PLoS Genet 2009, 5:e1000384.
11. Bansal V, Libiger O, Torkamani A, Shork JN: Statistical analysis strategies forassociation studies involving rare variants. Nat Rev Genet 2011, 11:773–785.
12. Han F, Pan W: A data-adaptive sum test for disease association with mul-tiple common or rare variants. Hum Hered 2010, 70(1):42–54.
13. Li Y, Byrnes AE, Li M: To identify associations with rare variants, justWHaIT: weighted haplotype and imputation-based tests. Am J Hum Genet2010, 87(5):728–735.
14. Neale BM, Rivas MA, Voight BF, Altshuler D, Devlin B, Orho-Melander M,Kathiresan S, Purcell SM, Roeder K, Daly MJ: Testing for an unusualdistribution of rare variants. PLoS Genet 2011, 7(3):e1001322.
15. Quintana MA, Berstein JL, Thomas DC, Conti DV: Incorporating modeluncertainty in detecting rare variants: the Bayesian risk index. GenetEpidemiol 2011, 35(7):638–649.
16. Luedtke A, Powers S, Petersen A, Sitarik A, Bekmetjev A, Tintle N: Evaluatingmethods for the analysis of rare variants in sequence data. BMC Proc2011, 5(Suppl 9):S119.
17. Chen G: Enhancing the discovery of rare disease variants throughhierarchical modeling. BMC Proc 2011, 5(Suppl 9):S16.
18. Price AL, Kryukov GV, de Bakker PIW, Purcell SM, Staples J, Wei L-J, Sunyaev SR:Pooled association tests for rare variants in exon-resequencing studies. Am JHum Genet 2010, 86(6):832–838.
19. Teng M, Wang Y, Wang G, Jung J, Edenberg H, Sanford J, Liu Y: Prioritizingsingle-nucleotide variations that potentially regulate alternative splicing.BMC Proc 2011, 5(Suppl 9):S40.
20. Wei P, Liu X, Fu Y-X: Incorporating predicted functions of nonsynon-ymous variants into gene-based analysis of exome sequencing data:a comparative study. BMC Proc 2011, 5(Suppl 9):S20.
21. Namkung J, Raska P, Kang J, Liu Y, Lu Q, Zhu X: Analysis of exomesequences with and without incorporating prior biological knowledge.Genet Epidemiol 2011, 35(S1):S48–S55.
22. Dai Y, Jiang R, Dong J: Weighted selective collapsing strategy fordetecting rare and common variants in genetic association study.BMC Genet 2012, 13(1):7.
23. Basu S, Pan W: Comparison of statistical tests for disease association withrare variants. Genet Epidemiol 2011, 35(7):606–619.
24. Lee S, Wu MC, Lin X: Optimal tests for rare variant effects in sequencingassociation studies. Biostatistics 2012, 13(4):762–775.
25. Almasy L, Dyer T, Peralta J, Kent J, Charlesworth J, Curran J, Blangero J:Genetic Analysis Workshop 17 mini-exome simulation. BMC Proc 2011,5(Suppl 9):S2.
26. Jiang R, Dong J: Detecting rare functional variants using a wavelet-basedtest on quantitative and qualitative traits. BMC Proc 2011, 5(Suppl 9):S70.
27. Price AL, Patterson NJ, Plenge RM, Weinblatt ME, Shadick NA, Reich D:Principal components analysis corrects for stratification in genome-wideassociation studies. Nat Genet 2006, 38(8):904–909.
28. Chung D, Zhang Q, Kraja A, Borecki I, Province M: Distance-based phenotypicassociation analysis of DNA sequence data. BMC Proc 2011, 5(Suppl 9):S54.
29. Li M, Fu W, Lu Q: An aggregating U-Test for a genetic association studyof quantitative traits. BMC Proc 2011, 5(Suppl 9):S23.
30. Gibson G: Rare and common variants: twenty arguments. Nat Rev Genet2012, 13(2):135–145.
31. Kryukov GV, Pennacchio LA, Sunyaev SR: Most rare missense alleles aredeleterious in humans: implications for complex disease and associationstudies. Am J Hum Genet 2007, 80(4):727–739.
32. Adzhubei IA, Schmidt S, Peshkin L, Ramensky VE, Gerasimova A, Bork P,Kondrashov AS, Sunyaev SR: A method and server for predictingdamaging missense mutations. Nat Meth 2010, 7(4):248–249.
33. Kiezun A, Garimella K, Do R, Stitziel NO, Neale BM, McLaren PJ, Gupta N,Sklar P, Sullivan PF, Moran JL, et al: Exome sequencing and the geneticbasis of complex traits. Nat Genet 2012, 44(6):623–630.
34. Sul JH, Han B, He D, Eskin E: An optimal weighted aggregated associationtest for identification of rare variants involved in common diseases.Genetics 2011, 188(1):181–188.
35. Tavtigian SV, Oefner PJ, Babikyan D, Hartmann A, Healey S, Le Calvez-KelmF, Lesueur F, Byrnes GB, Chuang S-C, Forey N, et al: Rare, evolutionarilyunlikely missense substitutions in ATM confer increased risk of breastcancer. Am J Hum Genet 2009, 85(4):427–446.
36. Sha Q, Zhang Z, Zhang S: An improved score test for genetic associationstudies. Genet Epidemiol 2011, 35(5):350–359.
37. Self SG, Mauritsen RH: Power/sample size calculations for generalizedlinear models. Biometrics 1988, 44(1):79–86.
38. Polansky AM, Baker ER:Multistage plug—in bandwidth selection for kerneldistribution function estimates. J Statist Comput Simul 2000, 65(1–4):63–80.
39. Boyko AR, Williamson SH, Indap AR, Degenhardt JD, Hernandez RD,Lohmueller KE, Adams MD, Schmidt S, Sninsky JJ, Sunyaev SR, et al:Assessing the evolutionary impact of amino acid mutations in thehuman genome. PLoS Genet 2008, 4(5):e1000083.
40. Fitze G, Appelt H, König IR, Görgens H, Stein U, Walther W, Gossen M,Schreiber M, Ziegler A, Roesner D, et al: Functional haplotypes of the RETproto-oncogene promoter are associated with Hirschsprung disease(HSCR). Hum Mol Genet 2003, 12(24):3207–3214.
41. Fitze G, Schierz M, Kuhlisch E, Schreiber M, Ziegler A, Roesner D, SchackertHK: Novel intronic polymorphisms in the RET proto-oncogene and theirassociation with Hirschsprung disease. Hum Mutat 2003, 22(2):177–177.
42. Liu DJ, Leal SM: A novel adaptive method for the analysis of next-generation sequencing data to detect complex trait associations withrare variants due to gene main effects and interactions. PLoS Genet 2010,6(10):e1001156.
doi:10.1186/1471-2105-15-24Cite this article as: Zakharov et al.: A method to incorporate priorinformation into score test for genetic association studies. BMCBioinformatics 2014 15:24.
Submit your next manuscript to BioMed Centraland take full advantage of:
• Convenient online submission
• Thorough peer review
• No space constraints or color figure charges
• Immediate publication on acceptance
• Inclusion in PubMed, CAS, Scopus and Google Scholar
• Research which is freely available for redistribution
Submit your manuscript at www.biomedcentral.com/submit