households' livelihood security and coping strategies in a ...

Journal of Environment and Earth Science www.iiste.org
ISSN 2224-3216 (Paper) ISSN 2225-0948 (Online)
Vol.4, No.2, 2014
1
A Look into Households Water Use Behaviour in Irepodun Local
Government Area of Kwara State, Nigeria
ASHAOLU, Eniola Damilola1* ONUNDI, Falilat Temitope2 1. Department of Geography and Environmental Management, Faculty of Social Sciences
University of Ilorin, P.M.B 1515, Ilorin, Nigeria 2. Department of Urban and Regional Planning, Faculty of Environmental Sciences
University of Ilorin, P.M.B 1515, Ilorin, Nigeria * E-mail of the corresponding author: [email protected]
Abstract Water is a vital resource, and the importance of its management, use and allocation cannot be overemphasized. Water is either use for domestic, industrial or agricultural purposes to satisfy human needs and development in a society. This study attempts to look into household water use behaviour in Irepodun Local Government Area of Kwara State, Nigeria with a view to determine who sources, allocates and uses most indoor water in the households, and for what purpose. A tool known as water diary was modified and incorporated into this study to be able to gather the necessary information that would serve the purpose of the study. Irepodun LGA has eleven wards, 30 households were sampled at random in each of these wards to give a total of 330 households. Percentages and charts were used in the analysis which revealed that 53.25% and 47.65% of the surveyed households were female and male respectively. The result shows that female sources 76.67%, allocates 91.82% and uses 78.07% of the total indoor household’s water resource. It is therefore concluded that female are the principal actors in household water use/management and should be at the center of regional domestic water resource management. Keywords: Water Use, Water Diary, Households, Behavior, Allocation, Resource
1. Introduction
The importance of water as a resource has brought about various approaches to enable proper and efficient management, to meet the various needs of individuals and the society at large. Studies from the past and present have tried to understand household or individual water use or demand by trying to model water use or consumption and thereby attributing water use or demand to the social characteristics of the households or individuals involved. Studies from different parts of the world have shown that household level water demand and use varies considerably across different domestic settings, including urban, rural and cultural settings. From these studies, use and demand of water by households has been attributed to a function of different factors such as type of house, socioeconomic status, climate, educational campaign (Joy et al., 2005), time to collect water, income, sex, number of women in a household, price of water (Ayanshola et al., 2010; Mu et al, 1990), number of person per family, cultural origin, age of head of households and number of rooms per households (Darr et al., 1975). Some attributed water use or demand to ability or willingness to pay (Ifabiyi, 2011; Calkin et al., 2002; Joysasundara, 1999). None of these studies, especially in Nigeria, have tried to understand household’s water use behavior by investigating who sourced and allocate water use in the households. Other unanswered questions include: which gender uses most water and for what purpose? What time and day of the week is the most water used and why? Water is a vital resource, and the importance of its management, use and allocation cannot be overemphasized. Water is used for domestic, industrial or agricultural purposes, to satisfy human needs and development in a society. In any of these sectors, understanding management, allocation and use behavior is very important to human and social development. Every individual in the society belongs to a unit or subset of the society called a household. Therefore, understanding household water use behavior is an important quest to understanding how this resource is sourced, allocated and managed within the household to maximize the use of this vital resource in the face of uncertain future climate and water availability. A number of researchers have revealed that an important tool in the understanding of household water use behavior is the use of water diary. This tool is design in such a way that the household water use is recorded for what purpose, the volume and time of usage. This diary enables us to understand that households are efficient water managers which are not often recognized. It reveals who sourced and allocate water use in a household, that is, which gender has the overriding power on water use and allocation in a given households. It also expose the volume of water use by individuals as well as water use behavior and behavioral change in households (Lahiri-Dutt and Harriden, 2008; Graymore and Harriden, 2011; Harriden, 2012; Harriden, 2013). The robustness of this method was confirmed in a pilot trail conducted in the Australian Capital Territory by Lahiri-Dutt and Harriden (2008). According to Harriden (2009) the water diary represents a mix of quantitative and qualitative research techniques

Journal of Environment and Earth Science www.iiste.org
ISSN 2224-3216 (Paper) ISSN 2225-0948 (Online)
Vol.4, No.2, 2014
2
to capture the data required to open the black box of intra household water use to critical investigation. This method of understanding household water use behavior is efficient and detailed because it enables the householders to participate actively in the survey. Participants in such surveys in developed countries were volunteers. The volunteers recorded their water use for a period of seven days (one week), in diaries provided by the researchers. However, as simple and detailed as this approach is in understanding household water use behavior and what it can revealed about household water allocation and conservation, it successful application in a developing country like Nigeria is bleak. The reason for these is not difficult to anticipate, as it is very difficult to get volunteers in this part of the world. The potential volunteers ask for monetary incentives, what they stand to gain from such survey and complain about bad governance. In view of the problems of recruiting volunteers, the survey was conducted using a structured questionnaire, with a water diary incorporated in order to get a view of what is obtainable where water diary is used in the developed world. The approach and method will be discussed fully under the segment set aside for the research methods. It is however hoped that this study would enable us to understand household water use behavior in a developing countries of Africa, and Nigeria in particular. Therefore, household water use behaviour is studied in Irepodun Local Government Area of Kwara state, Nigeria with a view to understand who allocates and sources for water in the households, who uses the highest volume of water and for what purposes within the sampled households and the general pattern of indoor water use in the research area.
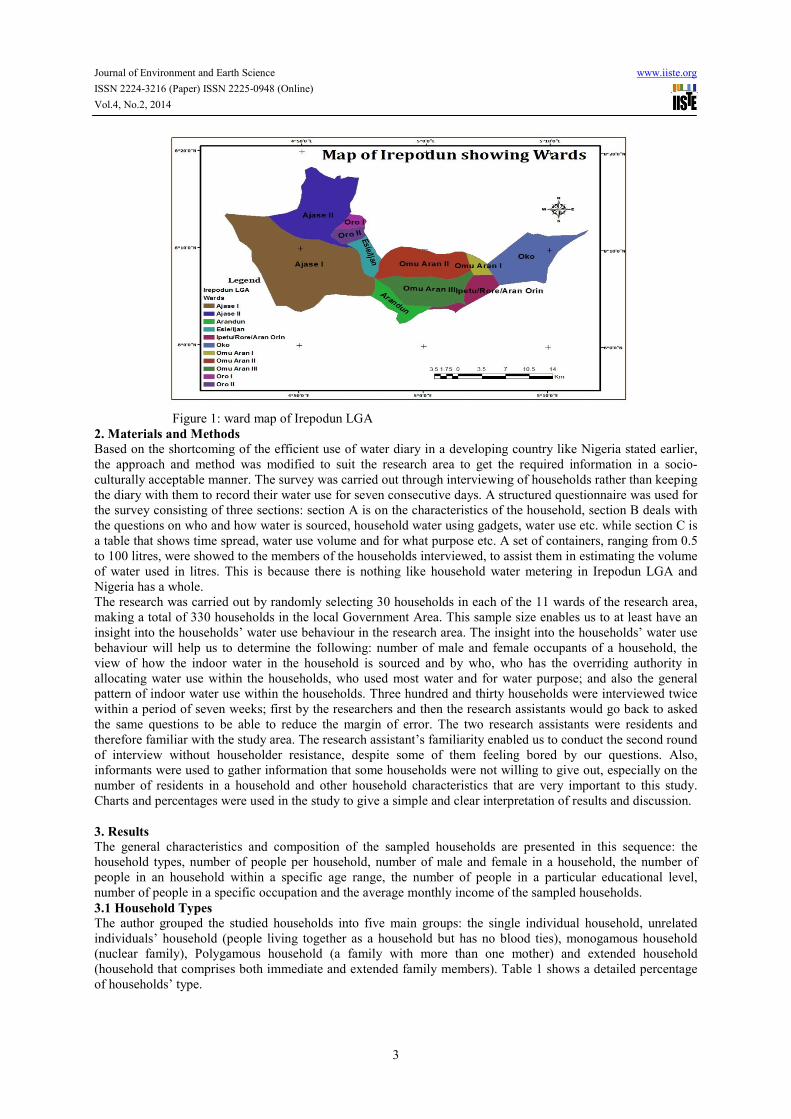
1.2 The Research Area The area lies between latitude 8° N and 8° 25' N and between longitude 4° 40' E and 5° 30' E. Irepodun local Government was created out of Igbomina/Ekiti Division in 1976, as a result of Local Government reform initiated by the military administration. It has two districts: Ajasse Ipo and Omu. Omu-Aran is the Local Government Headquarter; it has eleven wards (Omu-Aran I, Omu-Aran II, Omu-Aran III, Oro I, Oro II, Ajase Ipo I, Ajase Ipo II, Esie/Ijan, Oko, Arandun and Ipetu/Rore/Aran Orin) and six area Offices for Administrative Services. It shares boundaries with Ifelodun L.G.A to the North, Osun to the South, Ekiti and Offa L.G.A to the east and West respectively. Irepodun L.G.A has an area of 737km2 and a population of 148,610 people (2006 census). Irepodun Local Government area has alternating climate of wet and dry season. The wet season lasted for six months, April to November with about 1100mm-1500mm of rain. The dry season starts in November and finishes in April. The season is characterized with prevailing winds. The wet season is accompanied by the south westerly wind which originates from the Atlantic Ocean while dry season is characterised by harmattan wind being in the tropical region. The area lies in the savannah zone and the vegetation is characterised by full grasses and shrubs. This is encouraged by high rainfall, high temperature, high relative humility, the climate condition favour the growth of food crops such as cassava, maize, guinea corn etc. The area is on a gentle undulating land which falls within the older sedimentary rocks. The area is drained by short swift flowing stream and most of their streams are seasonal. The only important river in this area is river Oshin. The soil is edaphic in nature containing natural mineral resources such as granite, quartz, feldspar, columbite, tantalite i.e. water is not retained on the surface for long. The people in the study area are predominantly farmers (subsistence) and trading is also another common activities. The nomadic Fulani practice animal husbandry in some communities of the study area. Also, the area is noted for its handicrafts, including pottery, weaving, dyeing, leather works and embroidery making. They have small scale industries and these include black smithing, machine repairing, bicycle repairing, photography, block making, bread industries, gari processing, candles and school chalk making, steel doors and windows; leather products, pots enamel wares among others. Few of the population also engaged in banking and insurance services. The map of the research area is shown in figure 1.
Journal of Environment and Earth Science www.iiste.org
ISSN 2224-3216 (Paper) ISSN 2225-0948 (Online)
Vol.4, No.2, 2014
3
Figure 1: ward map of Irepodun LGA
2. Materials and Methods Based on the shortcoming of the efficient use of water diary in a developing country like Nigeria stated earlier, the approach and method was modified to suit the research area to get the required information in a socio-culturally acceptable manner. The survey was carried out through interviewing of households rather than keeping the diary with them to record their water use for seven consecutive days. A structured questionnaire was used for the survey consisting of three sections: section A is on the characteristics of the household, section B deals with the questions on who and how water is sourced, household water using gadgets, water use etc. while section C is a table that shows time spread, water use volume and for what purpose etc. A set of containers, ranging from 0.5 to 100 litres, were showed to the members of the households interviewed, to assist them in estimating the volume of water used in litres. This is because there is nothing like household water metering in Irepodun LGA and Nigeria has a whole. The research was carried out by randomly selecting 30 households in each of the 11 wards of the research area, making a total of 330 households in the local Government Area. This sample size enables us to at least have an insight into the households’ water use behaviour in the research area. The insight into the households’ water use behaviour will help us to determine the following: number of male and female occupants of a household, the view of how the indoor water in the household is sourced and by who, who has the overriding authority in allocating water use within the households, who used most water and for water purpose; and also the general pattern of indoor water use within the households. Three hundred and thirty households were interviewed twice within a period of seven weeks; first by the researchers and then the research assistants would go back to asked the same questions to be able to reduce the margin of error. The two research assistants were residents and therefore familiar with the study area. The research assistant’s familiarity enabled us to conduct the second round of interview without householder resistance, despite some of them feeling bored by our questions. Also, informants were used to gather information that some households were not willing to give out, especially on the number of residents in a household and other household characteristics that are very important to this study. Charts and percentages were used in the study to give a simple and clear interpretation of results and discussion.
3. Results The general characteristics and composition of the sampled households are presented in this sequence: the household types, number of people per household, number of male and female in a household, the number of people in an household within a specific age range, the number of people in a particular educational level, number of people in a specific occupation and the average monthly income of the sampled households.
3.1 Household Types The author grouped the studied households into five main groups: the single individual household, unrelated individuals’ household (people living together as a household but has no blood ties), monogamous household (nuclear family), Polygamous household (a family with more than one mother) and extended household (household that comprises both immediate and extended family members). Table 1 shows a detailed percentage of households’ type.
Journal of Environment and Earth Science www.iiste.org
ISSN 2224-3216 (Paper) ISSN 2225-0948 (Online)
Vol.4, No.2, 2014
4
Table 1: Household Types in Irepodun LGA of Kwara State (%)
Wards Single
Individual
Unrelated
Individual
Monopoly
Polygamous
Extended
1 Omu aran I 6.7 3.3 53.3 20 16.7
2 Omu aran II 13.3 6.7 50 23.3 6.7
3 Omu aran III 16.7 n/a 56.6 16.7 10
4 Oro I 6.7 n/a 83.3 6.7 3.3
5 Oro II 16.7 6.7 53.3 13.3 10
6 Ajasepo I 10 n/a 56.7 23.3 10
7 Ajasepo II 13.3 n/a 63.3 16.7 6.7
8 Esie/Ijan 6.7 n/a 80 10 3.3
9 Oko 6.7 n/a 63.3 20 10
10 Arandun n/a n/a 66.7 23.3 10
11 Ipetu/Rore/Aran-orin
3.3 n/a 60 26.7 10
Irepodun Total 10 2 62 18 8
Source: Field Survey (2013) In the sampled households 2% represented unrelated individual household, while 18% is the polygamous household type and the largest household type in the research area is the monogamous household type that made up about 62% of the sampled households. This percentage (62%) explained the most common type of household in the research area which is the monogamous and the least type of household is the unrelated individual household. The reason for this small percentage of unrelated individual household may be because of the culture and tradition of the people of the research area where you rarely find people that have no blood ties living together to form a household.
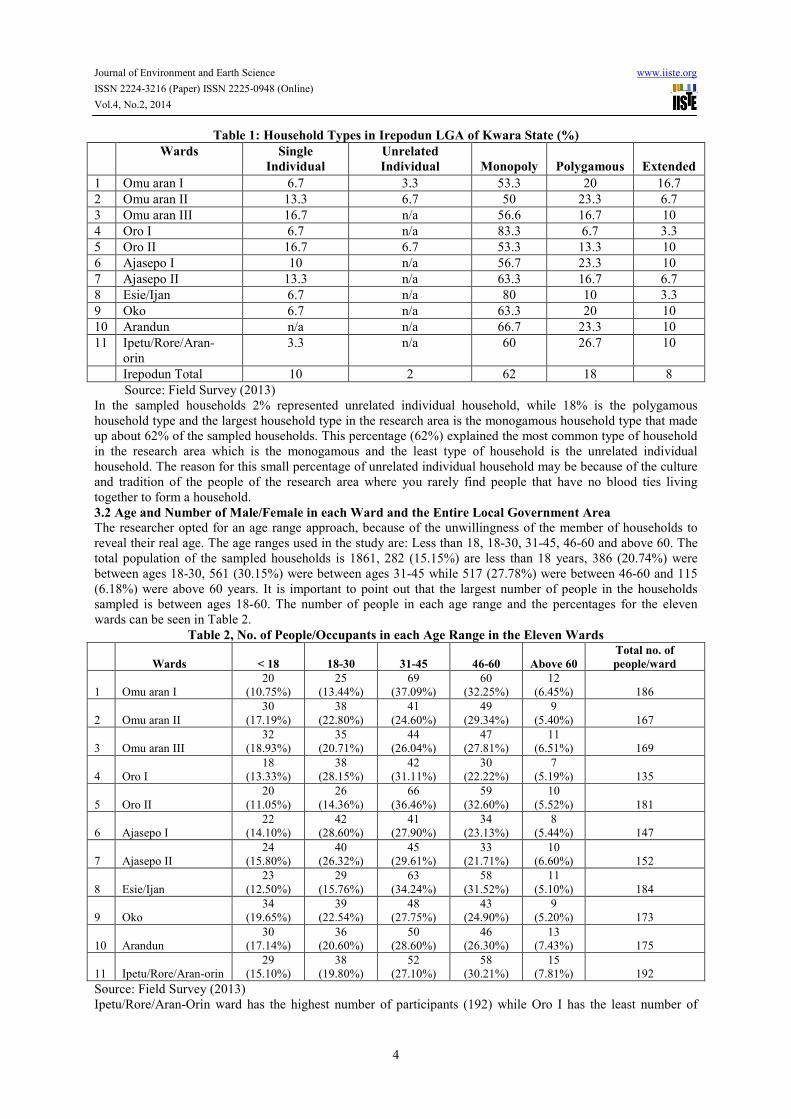
3.2 Age and Number of Male/Female in each Ward and the Entire Local Government Area The researcher opted for an age range approach, because of the unwillingness of the member of households to reveal their real age. The age ranges used in the study are: Less than 18, 18-30, 31-45, 46-60 and above 60. The total population of the sampled households is 1861, 282 (15.15%) are less than 18 years, 386 (20.74%) were between ages 18-30, 561 (30.15%) were between ages 31-45 while 517 (27.78%) were between 46-60 and 115 (6.18%) were above 60 years. It is important to point out that the largest number of people in the households sampled is between ages 18-60. The number of people in each age range and the percentages for the eleven wards can be seen in Table 2.
Table 2, No. of People/Occupants in each Age Range in the Eleven Wards
Wards
< 18
18-30
31-45
46-60
Above 60
Total no. of
people/ward
1
Omu aran I
20 (10.75%)
25 (13.44%)
69 (37.09%)
60 (32.25%)
12 (6.45%)
186
2
Omu aran II
30 (17.19%)
38 (22.80%)
41 (24.60%)
49 (29.34%)
9 (5.40%)
167
3
Omu aran III
32 (18.93%)
35 (20.71%)
44 (26.04%)
47 (27.81%)
11 (6.51%)
169
4
Oro I
18 (13.33%)
38 (28.15%)
42 (31.11%)
30 (22.22%)
7 (5.19%)
135
5
Oro II
20 (11.05%)
26 (14.36%)
66 (36.46%)
59 (32.60%)
10 (5.52%)
181
6
Ajasepo I
22 (14.10%)
42 (28.60%)
41 (27.90%)
34 (23.13%)
8 (5.44%)
147
7
Ajasepo II
24 (15.80%)
40 (26.32%)
45 (29.61%)
33 (21.71%)
10 (6.60%)
152
8
Esie/Ijan
23 (12.50%)
29 (15.76%)
63 (34.24%)
58 (31.52%)
11 (5.10%)
184
9
Oko
34 (19.65%)
39 (22.54%)
48 (27.75%)
43 (24.90%)
9 (5.20%)
173
10
Arandun
30 (17.14%)
36 (20.60%)
50 (28.60%)
46 (26.30%)
13 (7.43%)
175
11
Ipetu/Rore/Aran-orin
29 (15.10%)
38 (19.80%)
52 (27.10%)
58 (30.21%)
15 (7.81%)
192
Source: Field Survey (2013) Ipetu/Rore/Aran-Orin ward has the highest number of participants (192) while Oro I has the least number of
Journal of Environment and Earth Science
ISSN 2224-3216 (Paper) ISSN 2225-0948 (Online)
Vol.4, No.2, 2014
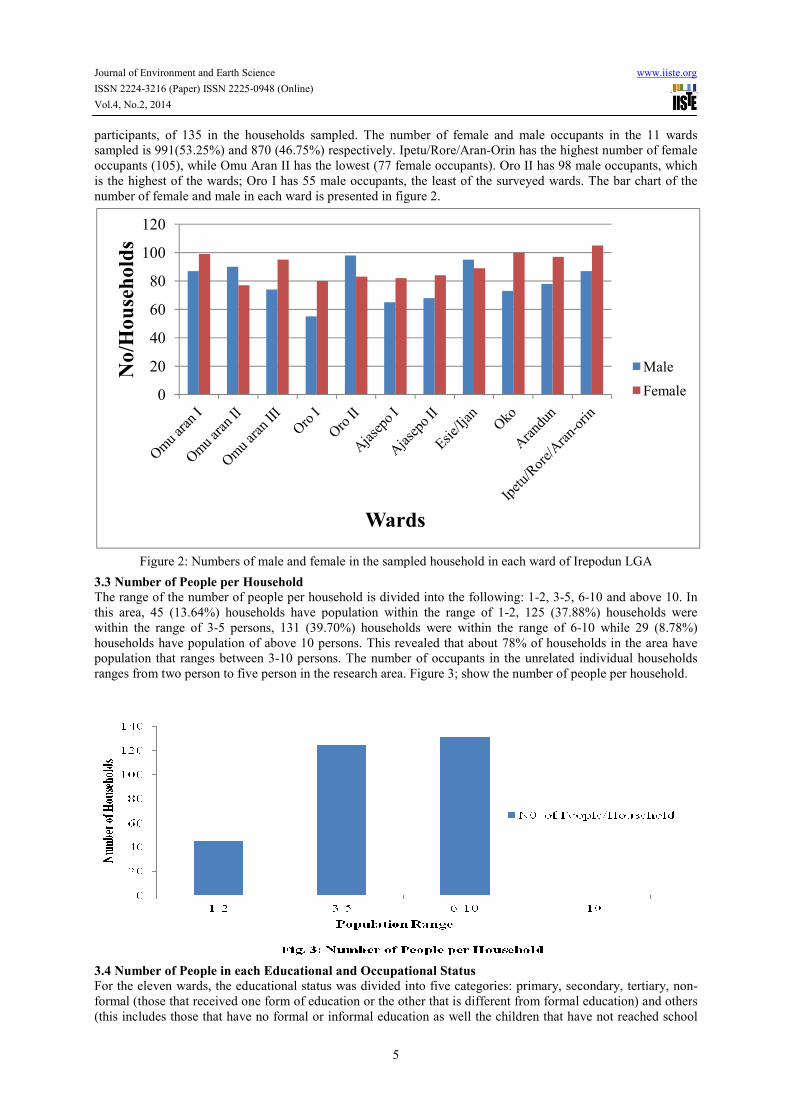
participants, of 135 in the households sampled. The number of female and male occupants in the 11 wards sampled is 991(53.25%) and 870 (46.75%) respectively. Ipetu/Rore/Aranoccupants (105), while Omu Aran II has the lowest (77 female occupants).is the highest of the wards; Oro I has 55 male occupants, the least of the surveyed wards. The bar chart of the number of female and male in each ward is presented in figure 2.
Figure 2: Numbers of male and female in t
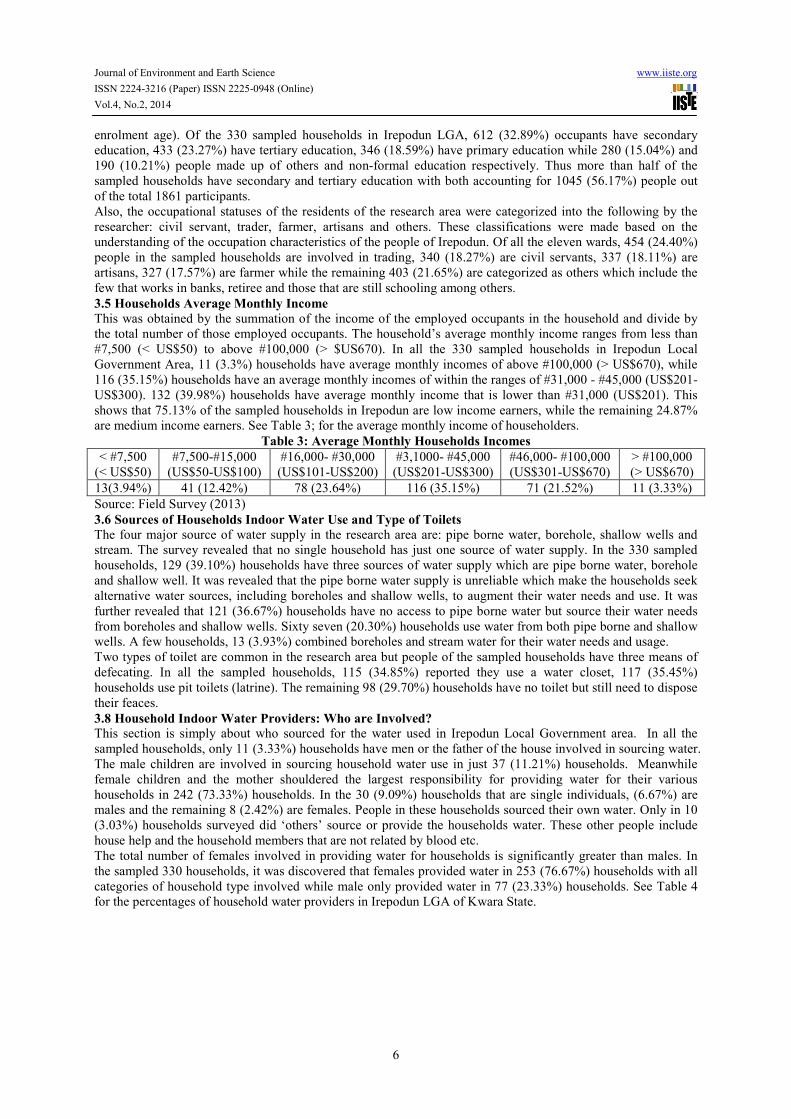
3.3 Number of People per Household
The range of the number of people per household is divided into the following: 1this area, 45 (13.64%) households have population within thewithin the range of 3-5 persons, 131 (39.70%) households were within the range of 6households have population of above 10 persons. This revealed that about 78% of households in the area have population that ranges between 3-10 persons. The number of occupants in the unrelated individual households ranges from two person to five person in the research area. Figure 3; show the number of people per household.
3.4 Number of People in each Educat
For the eleven wards, the educational status was divided into five categories: primary, secondary, tertiary, nonformal (those that received one form of education or the other that is different from formal education) and other(this includes those that have no formal or informal education as well the children that have not reached school
0
20
40
60
80
100
120
No
/Ho
use
ho
lds
0948 (Online)
5
households sampled. The number of female and male occupants in the 11 wards sampled is 991(53.25%) and 870 (46.75%) respectively. Ipetu/Rore/Aran-Orin has the highest number of female occupants (105), while Omu Aran II has the lowest (77 female occupants). Oro II has 98 male occupants, which is the highest of the wards; Oro I has 55 male occupants, the least of the surveyed wards. The bar chart of the number of female and male in each ward is presented in figure 2.
Figure 2: Numbers of male and female in the sampled household in each ward of Irepodun LGA
3.3 Number of People per Household The range of the number of people per household is divided into the following: 1-2, 3-5, 6this area, 45 (13.64%) households have population within the range of 1-2, 125 (37.88%) households were
5 persons, 131 (39.70%) households were within the range of 6households have population of above 10 persons. This revealed that about 78% of households in the area have
10 persons. The number of occupants in the unrelated individual households ranges from two person to five person in the research area. Figure 3; show the number of people per household.
3.4 Number of People in each Educational and Occupational Status
For the eleven wards, the educational status was divided into five categories: primary, secondary, tertiary, nonformal (those that received one form of education or the other that is different from formal education) and other(this includes those that have no formal or informal education as well the children that have not reached school
Wards
www.iiste.org
households sampled. The number of female and male occupants in the 11 wards Orin has the highest number of female
Oro II has 98 male occupants, which is the highest of the wards; Oro I has 55 male occupants, the least of the surveyed wards. The bar chart of the
he sampled household in each ward of Irepodun LGA
5, 6-10 and above 10. In 2, 125 (37.88%) households were
5 persons, 131 (39.70%) households were within the range of 6-10 while 29 (8.78%) households have population of above 10 persons. This revealed that about 78% of households in the area have
10 persons. The number of occupants in the unrelated individual households ranges from two person to five person in the research area. Figure 3; show the number of people per household.
For the eleven wards, the educational status was divided into five categories: primary, secondary, tertiary, non-formal (those that received one form of education or the other that is different from formal education) and others (this includes those that have no formal or informal education as well the children that have not reached school
Male
Female
Journal of Environment and Earth Science www.iiste.org
ISSN 2224-3216 (Paper) ISSN 2225-0948 (Online)
Vol.4, No.2, 2014
6
enrolment age). Of the 330 sampled households in Irepodun LGA, 612 (32.89%) occupants have secondary education, 433 (23.27%) have tertiary education, 346 (18.59%) have primary education while 280 (15.04%) and 190 (10.21%) people made up of others and non-formal education respectively. Thus more than half of the sampled households have secondary and tertiary education with both accounting for 1045 (56.17%) people out of the total 1861 participants. Also, the occupational statuses of the residents of the research area were categorized into the following by the researcher: civil servant, trader, farmer, artisans and others. These classifications were made based on the understanding of the occupation characteristics of the people of Irepodun. Of all the eleven wards, 454 (24.40%) people in the sampled households are involved in trading, 340 (18.27%) are civil servants, 337 (18.11%) are artisans, 327 (17.57%) are farmer while the remaining 403 (21.65%) are categorized as others which include the few that works in banks, retiree and those that are still schooling among others.
3.5 Households Average Monthly Income This was obtained by the summation of the income of the employed occupants in the household and divide by the total number of those employed occupants. The household’s average monthly income ranges from less than #7,500 (< US$50) to above #100,000 (> $US670). In all the 330 sampled households in Irepodun Local Government Area, 11 (3.3%) households have average monthly incomes of above #100,000 (> US$670), while 116 (35.15%) households have an average monthly incomes of within the ranges of #31,000 - #45,000 (US$201-US$300). 132 (39.98%) households have average monthly income that is lower than #31,000 (US$201). This shows that 75.13% of the sampled households in Irepodun are low income earners, while the remaining 24.87% are medium income earners. See Table 3; for the average monthly income of householders.
Table 3: Average Monthly Households Incomes
< #7,500 (< US$50)
#7,500-#15,000 (US$50-US$100)
#16,000- #30,000 (US$101-US$200)
#3,1000- #45,000 (US$201-US$300)
#46,000- #100,000 (US$301-US$670)
> #100,000 (> US$670)
13(3.94%) 41 (12.42%) 78 (23.64%) 116 (35.15%) 71 (21.52%) 11 (3.33%)
Source: Field Survey (2013)
3.6 Sources of Households Indoor Water Use and Type of Toilets The four major source of water supply in the research area are: pipe borne water, borehole, shallow wells and stream. The survey revealed that no single household has just one source of water supply. In the 330 sampled households, 129 (39.10%) households have three sources of water supply which are pipe borne water, borehole and shallow well. It was revealed that the pipe borne water supply is unreliable which make the households seek alternative water sources, including boreholes and shallow wells, to augment their water needs and use. It was further revealed that 121 (36.67%) households have no access to pipe borne water but source their water needs from boreholes and shallow wells. Sixty seven (20.30%) households use water from both pipe borne and shallow wells. A few households, 13 (3.93%) combined boreholes and stream water for their water needs and usage. Two types of toilet are common in the research area but people of the sampled households have three means of defecating. In all the sampled households, 115 (34.85%) reported they use a water closet, 117 (35.45%) households use pit toilets (latrine). The remaining 98 (29.70%) households have no toilet but still need to dispose their feaces.
3.8 Household Indoor Water Providers: Who are Involved?
This section is simply about who sourced for the water used in Irepodun Local Government area. In all the sampled households, only 11 (3.33%) households have men or the father of the house involved in sourcing water. The male children are involved in sourcing household water use in just 37 (11.21%) households. Meanwhile female children and the mother shouldered the largest responsibility for providing water for their various households in 242 (73.33%) households. In the 30 (9.09%) households that are single individuals, (6.67%) are males and the remaining 8 (2.42%) are females. People in these households sourced their own water. Only in 10 (3.03%) households surveyed did ‘others’ source or provide the households water. These other people include house help and the household members that are not related by blood etc. The total number of females involved in providing water for households is significantly greater than males. In the sampled 330 households, it was discovered that females provided water in 253 (76.67%) households with all categories of household type involved while male only provided water in 77 (23.33%) households. See Table 4 for the percentages of household water providers in Irepodun LGA of Kwara State.

Journal of Environment and Earth Science www.iiste.org
ISSN 2224-3216 (Paper) ISSN 2225-0948 (Online)
Vol.4, No.2, 2014
7
Table 4: Households Water Providers in Irepodun LGA of Kwara State (%)
Wards
Father
Male Child
Mother &
Female Child
Self
Others
1 Omu aran I n/a 6.67 83.33 6.67 3.33
2 Omu aran II 6.67 13.33 60 13.33 6.67
3 Omu aran III n/a 16.66 66.67 16.67 n/a
4 Oro I 3.33 13.33 76.67 6.67 n/a
5 Oro II 10 16.66 50 16.67 6.67
6 Ajasepo I n/a 6.67 83.33 10 n/a
7 Ajasepo II 3.33 10 73.33 13.33 n/a
8 Esie/Ijan n/a n/a 93.33 6.67 n/a
9 Oko 6.67 16.66 70 6.67 n/a
10 Arandun n/a 26.67 73.33 n/a n/a
11 Ipetu/Rore/Aran-orin 6.67 13.33 76.67 3.33 n/a
Irepodun Total 3.33 12.72 73.33 9.10 1.52
Source: Field survey (2013)
3.9 Household Indoor Water Allocation: By Whom?
When water is sourced for household use, some groups of people have an overriding power on how it is used and for what purpose. The results of this study do not assign any indoor water use allocation to male in households that comprises of both male and female. Male only allocate water use in single individual household type in which he is the only occupants. In the 330 households sampled, mother and female child allocates indoor water use in 291 (88.18%) households. There are 30 (9.09%) households that are single individuals, out of which 22 (6.67%) are males and the remaining 8 (2.42%) are females. Only in 9 (2.73%) households that others allocate or determine the quantity of indoor water used, out of these 9 households 5 are unrelated household type which means who provides water in such household determine the quantity that is used. Table 5 shows the households indoor water allocation in Irepodun LGA.
Table 5: Household Water Allocation in Irepodun LGA of Kwara State (%)
Wards
Mother &
Female Child
Self
Others
1 Omu aran I 90 6.67 3.33
2 Omu aran II 80 13.33 6.67
3 Omu aran III 83.33 16.67 n/a
4 Oro I 93.33 6.7 n/a
5 Oro II 76.67 16.66 6.67
6 Ajasepo I 90 10 n/a
7 Ajasepo II 86.67 13.33 n/a
8 Esie/Ijan 93.33 6.67 n/a
9 Oko 93.33 6.67 n/a
10 Arandun 86.67 n/a 13.33
11 Ipetu/Rore/Aran-orin 96.67 3.33 n/a
Irepodun Total 88.18 9.09 2.73
Source: Field Survey (2013) In gender terms, female allocates indoor household water use in 303 (91.82%) households out of the 330 households sampled. The remaining 27 (8.18%) households where male allocates water are the single individual households that where 22 were male and 5 households that are unrelated individual type of household.
3.10 Estimates of Daily Indoor Water Use: By Whom for What?
The various indoor water use activities that are considered in this study include: dish washing, laundry, toilet flushing, bathing, cooking, drinking, teeth brushing/face cleaning and house cleaning. For each of the activity, the total daily use in each ward and the average daily household use were estimated. Also, the average daily household indoor water use and total daily indoor water use for all the activities were calculated for each wards and Irepodun in general. See Table 6 for the estimates of the daily in household indoor water use in Irepodun LGA.

Journal of Environment and Earth Science www.iiste.org
ISSN 2224-3216 (Paper) ISSN 2225-0948 (Online)
Vol.4, No.2, 2014
8
Table 6: Estimates of Daily Household Indoor Water Use in Irepodun LGA of Kwara State (Litres)
Wards
Dishes
washing
*
Laundry
Toilet
Flushing
Bathing
Cooking
Drinking
Teeth
brushing,
face &
hand
washing
House
Cleaning
Ward
Total
1 Omu aran I 12 (360)
75 (2250)
20 (280)
49.6 (1488)
31.7 (950)
9.3 (279)
3.1 (93)
15.8 (474)
216.5 (6174)
2 Omu aran II 12.7 (381)
79 (2370)
22 (330)
44.5 (1336)
28.8 (865)
8.35 (250.5)
2.8 (83.5)
16.2 (486)
214.35 (6102)
3 Omu aran III 11.85 (355.3)
72 (2160)
18.5 (240.5)
50.7 (152.1)
29.5 (885)
8.45 (253.5)
2.81 (84.5) 15.06 (452)
208.87 (5952)
4 Oro I 12.48 (374.4)
82.5 (2475)
21 (231)
40.5 (1215)
26.5 (795)
6.75 (202.5)
2.25 (67.5) 15.96 (479)
207.94 (5839.4)
5 Oro II 10.20 (305)
73.2 (2196)
20 (240)
54.3 (1629)
31.0 (930)
9.05 (271.5)
3.01 (90.5) 14.63 (439)
215.39 (6100.8)
6 Ajasepo I 12.08 (362.4)
76 (2280)
21.5 (215)
39.2 (1176)
27.2 (816)
9.8 (294)
2.45 (73.5) 16.4 (492)
204.64 (5708.9)
7 Ajasepo II 11.50 (345)
70 (2100)
19.8 (178.2)
40.5 (1216)
28.0 (840)
10.13 (304)
2.53 (76)
16.86 (506)
199.32 (5565.2)
8 Esie/Ijan 9.70 (291)
68.8 (2064)
18.9 (2079)
49.1 (1472)
31.0 (930)
11.04 (331.2)
3.06 (92)
15.6 (468)
207.2 (7727.2)
9 Oko 10.50 (315)
69.6 (2088)
19 (133)
46.13 (1384)
30.5 (915)
9.8 (294.1)
2.88 (86.5) 16.06 (482)
204.47 (5697.6)
10 Arandun 8.60 (258)
58 (1740)
16.8 (134.4)
46.6 (1400)
31 (930)
10.5 (315)
2.92 (87.5) 14.03 (421)
188.45 (5285.9)
11 Ipetu/Rore/Aran-orin
9.00 (270)
64.5 (1935)
18.5 (92.5)
51.2 (1536)
32 (960)
9.6 (288)
3.2 (96)
16.56 (497)
204.56 (5674.5)
Irepodun Total 120.61 (3617.3)
788.6 (23685)
216 (4153.6)
512.33 (15373)
327.2 (9816)
102.77 (3083.3)
31.01 (930.5)
173.16 (5196)
Source: field survey (2013) Note: Figures outside are the average volume of water used per household for each activity while the figures in parentheses are the total estimates for the sampled households. However, the survey was conducted in the rainy season; therefore the estimates for the dry period may be different. * Laundry were done by most of the households on weekends, thus, its estimate is not daily but more of a weekly. In 133 (40.30%) households, mother does the cooking; the female child cooks in 116 (35.15%) households while the male child is involved in cooking in just 26 (7.88%) households. The daily average water use for cooking in Irepodun is 327.2L while the daily total for the sampled households is 9816L. This revealed that female used 8180L (83.33%) of the estimated 9816L total of daily water used for cooking in Irepodun while the remaining 1636L (16.67%) were used by male in cooking. It is important to note that cooking was done twice a day in most households between 6am-9am and 5pm-8pm in the area. Some of the households wash their dishes twice a day while more than 50% of the household do dishes once a day. The study revealed that, female child wash the dishes in 129 (39.10%) households, the mother washes the dishes in 97 (29.39%) households while male children are involved in dish washing in 40 (12.12%) households. In total, females wash dishes in 256 (77.58%) households while males wash dishes in 74 (22.42%) households. The daily average water use in washing dishes in Irepodun is 120.61L. The daily total of water use in washing dishes for the sampled households is 3617.3L. This revealed that females used 2805.76L (77.57%) of the estimated daily total of 3617.3L of water used for washing dishes in Irepodun while the remaining 811.54L (22.43%) were used by male in washing dishes. The mother and the female child do the laundry in most of the sampled households. Female child does the laundry in 9 7(29.39%) households, the mother does laundry in 99 (30%) households while the male child is involved in laundry in 44 (13.33%) households. House help, member of the extended family and the unrelated individuals are the people that do laundry in 38 (11.52%) households. In total, female do laundry in 224 (67.88%) households while male do the laundry in 106 (32.12%) households. The weekly average water use in doing laundry in Irepodun is 788.6L while the weekly total of water use in doing laundry for the sampled households is 23685L. This revealed that female used 16076.48L (67.88%) of the estimated weekly total of 23685L of water used for doing laundry in Irepodun while the remaining 7608.52L (32.12%) were used by male in doing laundry; this is in agreement with Harriden (2009) that female use more water in laundry than male. House cleaning is done by female in 275 (83.33%) households while male engaged in house cleaning in 55 (16.67%) households. The total household indoor water use on house cleaning is 5196L, female used 4331.25L (83.36%) and male uses just 884.75L (16.64%). Eight household indoor water uses were examined but the gender water use of four water chores was calculated and is represented in Table 7.
Journal of Environment and Earth Science
ISSN 2224-3216 (Paper) ISSN 2225-0948 (Online)
Vol.4, No.2, 2014
Table 7, percentage of gender water chores use in households
s/n Water chores
1 Cooking
2 Dishes washing
3 Laundry
4 House cleaning
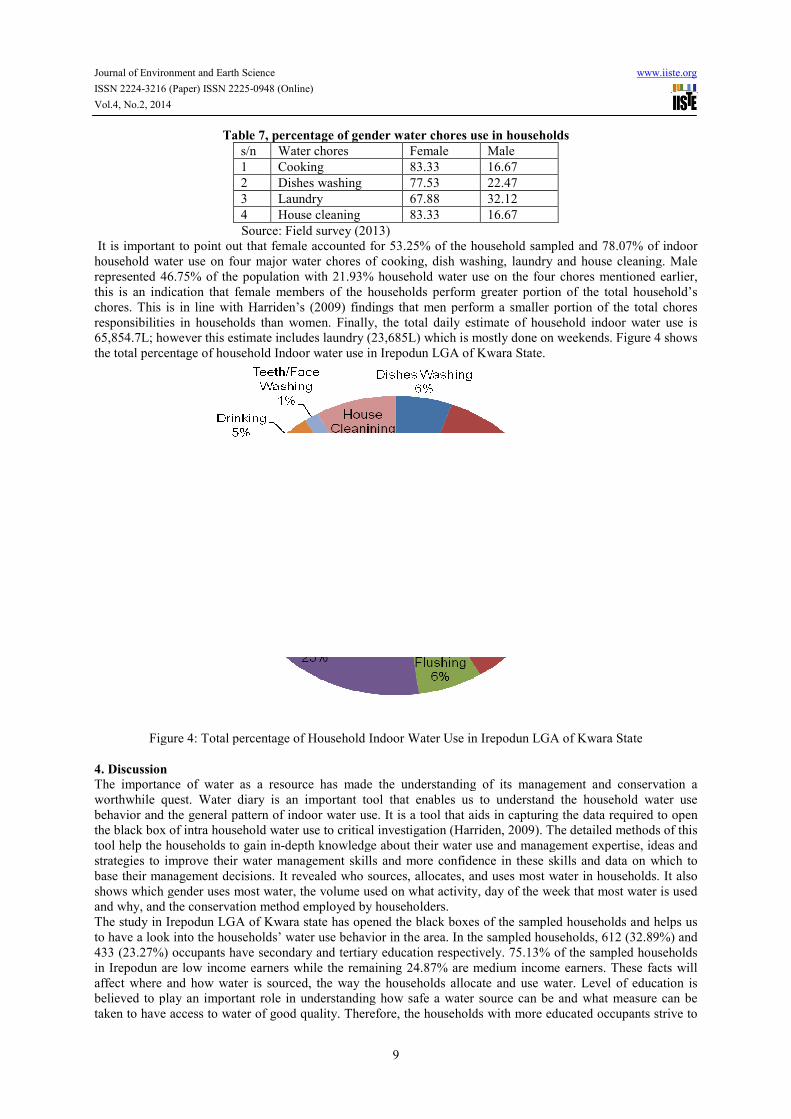
Source: Field survey (2013) It is important to point out that female accounted for 53.25% of the household sampled and 78.07% of indoor household water use on four major water chores of cooking, dish washing, laundry and house cleaning. Male represented 46.75% of the population withthis is an indication that female members of the households perform greater portion of the total household’s chores. This is in line with Harriden’s (2009) findings that men perform a smalleresponsibilities in households than women. Finally, the total daily estimate of household indoor water use is 65,854.7L; however this estimate includes laundry (23,685L) which is mostly done on weekends. Figure 4 shows the total percentage of household Indoor water use in Irepodun LGA of Kwara State.
Figure 4: Total percentage of Household Indoor Water Use in Irepodun LGA of Kwara State
4. Discussion
The importance of water as a resource has made the understanding of its maworthwhile quest. Water diary is an important tool that enables us to understand the household water use behavior and the general pattern of indoor water use. It is a tool that aids in capturing the data required to open the black box of intra household water use to critical investigation (Harriden, 2009). The detailed methods of this tool help the households to gain in-depth knowledge about their water use and management expertise, ideas and strategies to improve their water manbase their management decisions. It revealed who sources, allocates, and uses most water in households. It also shows which gender uses most water, the volume used on what activity, daand why, and the conservation method employed by householders.The study in Irepodun LGA of Kwara state has opened the black boxes of the sampled households and helps us to have a look into the households’ water use be433 (23.27%) occupants have secondary and tertiary education respectively. 75.13% of the sampled households in Irepodun are low income earners while the remaining 24.87% are medium income earnaffect where and how water is sourced, the way the households allocate and use water. Level of education is believed to play an important role in understanding how safe a water source can be and what measure can be taken to have access to water of good quality. Therefore, the households with more educated occupants strive to
0948 (Online)
9
percentage of gender water chores use in households
Water chores Female Male
Cooking 83.33 16.67
Dishes washing 77.53 22.47
Laundry 67.88 32.12
House cleaning 83.33 16.67
Source: Field survey (2013) It is important to point out that female accounted for 53.25% of the household sampled and 78.07% of indoor
household water use on four major water chores of cooking, dish washing, laundry and house cleaning. Male represented 46.75% of the population with 21.93% household water use on the four chores mentioned earlier, this is an indication that female members of the households perform greater portion of the total household’s chores. This is in line with Harriden’s (2009) findings that men perform a smaller portion of the total chores responsibilities in households than women. Finally, the total daily estimate of household indoor water use is 65,854.7L; however this estimate includes laundry (23,685L) which is mostly done on weekends. Figure 4 shows
al percentage of household Indoor water use in Irepodun LGA of Kwara State.
Figure 4: Total percentage of Household Indoor Water Use in Irepodun LGA of Kwara State
The importance of water as a resource has made the understanding of its management and conservation a worthwhile quest. Water diary is an important tool that enables us to understand the household water use behavior and the general pattern of indoor water use. It is a tool that aids in capturing the data required to open
ck box of intra household water use to critical investigation (Harriden, 2009). The detailed methods of this depth knowledge about their water use and management expertise, ideas and
strategies to improve their water management skills and more confidence in these skills and data on which to base their management decisions. It revealed who sources, allocates, and uses most water in households. It also shows which gender uses most water, the volume used on what activity, day of the week that most water is used and why, and the conservation method employed by householders. The study in Irepodun LGA of Kwara state has opened the black boxes of the sampled households and helps us to have a look into the households’ water use behavior in the area. In the sampled households, 612 (32.89%) and 433 (23.27%) occupants have secondary and tertiary education respectively. 75.13% of the sampled households in Irepodun are low income earners while the remaining 24.87% are medium income earnaffect where and how water is sourced, the way the households allocate and use water. Level of education is believed to play an important role in understanding how safe a water source can be and what measure can be
s to water of good quality. Therefore, the households with more educated occupants strive to
www.iiste.org
It is important to point out that female accounted for 53.25% of the household sampled and 78.07% of indoor household water use on four major water chores of cooking, dish washing, laundry and house cleaning. Male
21.93% household water use on the four chores mentioned earlier, this is an indication that female members of the households perform greater portion of the total household’s
r portion of the total chores responsibilities in households than women. Finally, the total daily estimate of household indoor water use is 65,854.7L; however this estimate includes laundry (23,685L) which is mostly done on weekends. Figure 4 shows
Figure 4: Total percentage of Household Indoor Water Use in Irepodun LGA of Kwara State
nagement and conservation a worthwhile quest. Water diary is an important tool that enables us to understand the household water use behavior and the general pattern of indoor water use. It is a tool that aids in capturing the data required to open
ck box of intra household water use to critical investigation (Harriden, 2009). The detailed methods of this depth knowledge about their water use and management expertise, ideas and
agement skills and more confidence in these skills and data on which to base their management decisions. It revealed who sources, allocates, and uses most water in households. It also
y of the week that most water is used
The study in Irepodun LGA of Kwara state has opened the black boxes of the sampled households and helps us havior in the area. In the sampled households, 612 (32.89%) and
433 (23.27%) occupants have secondary and tertiary education respectively. 75.13% of the sampled households in Irepodun are low income earners while the remaining 24.87% are medium income earners. These facts will affect where and how water is sourced, the way the households allocate and use water. Level of education is believed to play an important role in understanding how safe a water source can be and what measure can be
s to water of good quality. Therefore, the households with more educated occupants strive to
Journal of Environment and Earth Science www.iiste.org
ISSN 2224-3216 (Paper) ISSN 2225-0948 (Online)
Vol.4, No.2, 2014
10
source for their households water from the safe sources, unlike those with primary or no formal education who does not really care about how safe the sources of their water is. These care-free attitudes of those with low educational status have serious implication on health and sanitation of the people. How and where the water is sourced has a direct relationship on how it is allocated and used within various households. Water from pipe borne and boreholes are usually rationed in the households and mostly use for drinking and cooking purposes. This is because these two sources were considered to be the only safe sources among the existing water sources in the area. The four major source of water supply in the area are: piped borne water, borehole, shallow wells and stream. There is no household that has a single source of water supply in the area. This may be attributed to the fact that majority of the people in the research area are low income earner. The pipe borne water in the area is not reliable and households search for alternatives to augment their water supply. All the households combined two or more sources together to be able to have sufficient water for use in the households. However, there are challenges in sourcing for water and this includes: inadequate water points, faulty taps and few boreholes in some areas which led to long queue of people waiting to fetch water. These problems mentioned may influence indoor water use behavior, this is because the longer the minutes it takes to source for water, the more rational the use and allocation. For example, a household that spent 2 hours to get 25 litres of water will be very rational in its usage because of the fear of spending more hours in search of water. The implication is less water will be used and the level of sanitation will be very poor. Water closet and pit latrine are the two common types of toilet in Irepodun but the households have three means of disposing their feaces. We were made to understand that these households without toilets defecate in their houses and dispose it off into the nearby bushes while others defecate in an open space in the early hours of the morning or late in the evening. The type of toilet or the means of defecating determines the volume of water used for flushing and cleaning up after defecating. It is certain that the households with water closets used more water for flushing and cleaning up compare to households with pit toilets and those without toilets. This also has an implication on the sanitation practices of the households in the area as a whole. It was discovered that there are always quarrels on who to source for water or one occupant using water sourced by the other occupant(s) in the unrelated individual households. Though, there are issues like this in the households with close blood relations too but they seem to resolve it earlier and better than the unrelated individual households. This is as a result of close family tie in the culture of the people of the research area. The aforementioned problem is an indication that providing water for household use is a very serious responsibility which members of the unrelated households are always avoiding. Another reason why people avoid water collecting is because it is a high time/energy task with low status/regard within the household and community. One of the participant argued that he cannot be a “water fetching slave” to anyone since there is no incentive or monetary value attached to the task. The study revealed that the people that are involved in getting water for the various households are female. That is, women play an important role in fetching and making water available for household use. This would have an effect on their time and productivity. The more time they spent in getting or making water available in their various home the more time they lost in fulfilling other responsibility. This can be seen in the work of Ifabiyi et al. (2010) where women lost considerable productivity time in their quest to make water available for their households. This study further revealed that female possessed the overriding power to allocate indoor water in households sampled. The reason for this veto power on who use what water may be because they (female) are the providers in the first place. This is because they bear the burden of providing the water, if it is used carelessly and not conserved for indoor water activity that matters most. Women used most water in all the sampled households. They even determine water use in households where males are the providers, their level of involvement in household chores may also be another reasons for this sole right in allocating indoor water use in households. However, there are cases of the male member of the households using more than the volume of water allocated to them thereby leading to argument and disagreements. This problem has led the female members of some households to embark on “water sourcing strike” on few occasions to pass across their message to male that are less involved in sourcing for water but uses more for activity considered unimportant by the providers. The study further revealed that about 82.5% of the sampled households use most water on the weekends with about 18% having no specific day of the week which they use most water. Most households use more water on the weekends because laundries were done mostly at weekends between 8am-1pm. A few of the households with flush toilets, have various containers where they keep the water they used for laundry and later use it for flushing the toilet. This revealed the level of their indoor water management and conservation by reusing used water thereby saving more water. Also, the 8% that does not have specific day they use most water may be due to the composition of the household in terms of age and occupation (some member of the household trade or work very close to the house) which give them more access to indoor water use. However water drinking and toilet flushing

Journal of Environment and Earth Science www.iiste.org
ISSN 2224-3216 (Paper) ISSN 2225-0948 (Online)
Vol.4, No.2, 2014
11
in households that have water closets take no specific patterns but depends on when anybody is thirsty or after food and the time the toilet is used. Most of the sampled household takes their bath once a day but there are few exceptional cases. However, the number of time they take their bath may be different if the survey is done in the dry period when water is scarce and the weather is harsh.
5. Conclusion This study tries to understand the household indoor water use behavior in Irepodun LGA of Kwara state, Nigeria with a view to determine who sourced, allocates and use most water in the households. This study has helped the households in Irepodun LGA to gain in-depth knowledge about their water use and management expertise, ideas/strategies to improve their water management skills and more confidence in these skills and data on which to base their management decisions .The study revealed that female is the main actors in determining how households water is sourced, used and allocate which can be ascribed to the fact that they engaged in most household water chores. Based on this, the role of women in domestic water management should not be underestimated. To have any meaningful domestic water project and management in Irepodun LGA, women should be included in part of the plans and even be chosen to chair a committee on domestic water management in such community because they provide, allocate and use most of this resource in domestic chores. Therefore, they may be diligent in managing this resource and making any domestic water supply project a success since they are directly involved in what appears to be their sole responsibility. However, empowering women would go a long way to improve domestic water management in the Local Government Area and Nigeria as a whole.
Acknowledgement Special thanks to Kate Harriden of Fenner School of Environment and Society, Australian National University, New Flows Research, Australia for her comments when the questionnaire is being designed for this study and also on the final manuscript.
References Ayanshola A. M., Sule B. F. & Salami A. W. (2010). Modelling of Residential Water Demand at Household
Level in Ilorin, Nigeria. Journal of research Information in Civil Engineering 7(1): 59-68. Calkins B., Larue B., & Vezina M. (2002). Willingness to pay for Drinking Water in the Sahara: the case of
Decientza in Mali, Textbook of Economics and Rural Sociology, 64:37-56. Darr P., Feldman S. L., & Karmen C. S. (1975). Socio-economic factors affecting domestic water demand in
Israel. Water Resources Research. 11(6): 805-809. Ifabiyi I. P. (2011). Willingness to Pay for Water at Household Level in Ilorin, Kwara State, Nigeria, Global
Journal of Human Social Science 11(2): 15-24. Ifabiyi I. P., Usman B. A., Orire I.O., & Aledare A. (2010). Productive time of women and water supply in
Ijumu, Local Government Area, Kogi state, Nigeria. Global Journal of Human Social Sciences. 10(5):45-52.
Joysasundara J., Kotagama H. B., & Weenshewa J. (1999). Willingness to Pay for Drinking Water. Tropical
Agricultural Research. 11: 301-307. Graymore M. & Harriden K. (2011). Water use diaries: A tool for household water management. In Conference
Proceeding Efficient11 29 March-2 April, 2011, Dead Sea, Jordan. Harriden Kate (2009). A methodology for differentiating (measuring gender) intra-household water use: Water
Diary 2008. Final research report for the Gender and Water Alliance (GWA) July 2009. Available at: http://www.water.anu.edu.au/pdf/2009/ final_report_waterdiary.pdf Accessed on 06/05/2013.
Harriden Kate (2012). The Water Diary: A Participatory Household Water Use Research Method In: Michelle et al. (eds) Pipes, Ponds and People: Adaptive water management in dry lands, Vurrn Press, Mount Helen, Australia. Pp. 171-193
Harriden Kate (2013). Water diaries: generate intra-household water use data, Journal of Water, Sanitation and
Hygiene for Development. 3:1 Joy P., Holloway D., & Randolph B. (2005). Water use and the built environment: patterns of water consumption
in Sydney. City Future Research Center, Paper No. 1. Dec. 2005. Faculty of the Built Environment. University of Wales; Kensington. NSW 052. Australia. 86pp.
Lahiri-Dutt K. & Harriden K. (2008). Act on Gender: A Peep into Intra-household Water Use in the Australian Capital (ACT) Region. Rural Society 18(3): 230-243.
Mu X., Whittington D., & Briscoe J. (1990). Modeling village water demand behavior: a discrete choice approach. Water Resources Research. 26(4): 521-529.
Copyright © 2022 FDOKUMEN