Angiogenic Cytokines Are Antibody Targets During Graft-versus-Leukemia Reactions
Upload
independentCategory
view
4download
0
A longitudinal study of angiogenic (placental growth factor) andanti-angiogenic (soluble endoglin and soluble VEGF receptor-1)factors in normal pregnancy and patients destined to developpreeclampsia and deliver a small-for-gestational-age neonate
Roberto Romero, MD1,2, Jyh Kae Nien, MD1, Jimmy Espinoza, MD1,3, David Todem, PhD4,Wenjiang Fu, PhD4, Hwan Chung, PhD4, Juan Pedro Kusanovic, MD1, Francesca Gotsch,MD1, Offer Erez, MD1, Shali Mazaki-tovi, MD3, Ricardo Gomez, MD5, Sam Edwin, PhD1,Tinnakorn Chaiworapongsa, MD3, Richard J. Levine, MD6, and Ananth Karumanchi, MD7
1 Perinatology Research Branch, National Institute of Child Health and Human Development, NIH, DHHS,Bethesda, Maryland and Detroit, Michigan, USA
2 Center for Molecular Medicine and Genetics, Wayne State University, Detroit, Michigan, USA
3 Department of Obstetrics and Gynecology, Wayne State University/Hutzel Hospital, Detroit, Michigan,USA
4 Department of Epidemiology, Michigan State University, East Lansing, Michigan, USA
5 Center for Perinatal Diagnosis and Research (CEDIP), Hospital Dr. Sótero del Río, P. Universidad Católicade Chile, Puente Alto, Chile
6 Division of Epidemiology, Statistics, and Prevention Research, National Institute of Child Health andHuman Development, Department of Health and Human Services, Bethesda, Maryland, USA
7 Departments of Medicine, Obstetrics & Gynecology, Beth Israel Deaconess Medical Center and HarvardMedical School, Boston, MA, USA
AbstractIntroduction—Accumulating evidence suggests that an imbalance between pro-angiogenic [i.e.vascular endothelial growth factor (VEGF) and placental growth factor (PlGF)] and anti-angiogenicfactors [i.e. soluble VEGF receptor-1 (sVEGFR-1, also referred to as sFlt1) is involved in thepathophysiology of preeclampsia (PE). Endoglin is a protein that regulates the pro-angiogenic effectsof transforming growth factor β, and its soluble form has been recently implicated in thepathophysiology of PE. The objective of this study was to determine if changes in maternal plasmaconcentration of these angiogenic and anti-angiogenic factors differ prior to development of diseaseamong patients with normal pregnancies, and those destined to develop PE (preterm and term) or todeliver an SGA neonate.
Methods—This longitudinal nested case-control study included 144 singleton pregnancies in thefollowing groups: 1) patients with uncomplicated pregnancies who delivered appropriate forgestational age (AGA) neonates (n=46); 2) patients who delivered an SGA neonate but did notdevelop PE (n=56); and 3) patients who developed PE (n=42). Longitudinal samples were collectedat each prenatal visit, which was scheduled at four-week intervals from the first or early second
Address correspondence to: Roberto Romero, M.D., Chief, Perinatology Research Branch, NICHD, NIH, DHHS, Wayne StateUniversity/Hutzel Women's Hospital, 3990 John R, Box 4, Detroit, MI 48201, USA, Telephone: (313) 993-2700, Fax: (313) 993-2694,e-mail: [email protected].
NIH Public AccessAuthor ManuscriptJ Matern Fetal Neonatal Med. Author manuscript; available in PMC 2008 November 25.
Published in final edited form as:J Matern Fetal Neonatal Med. 2008 January ; 21(1): 9–23. doi:10.1080/14767050701830480.
NIH
-PA Author Manuscript
NIH
-PA Author Manuscript
NIH
-PA Author Manuscript

trimester until delivery. Plasma concentrations of soluble endoglin (s-Eng), sVEGFR-1 and PlGFwere determined by specific and sensitive ELISA.
Results—1) Patients destined to deliver an SGA neonate had higher plasma concentrations of s-Eng throughout gestation than those with normal pregnancies; 2) patients destined to develop pretermPE and term PE had significantly higher concentrations of s-Eng than those with normal pregnanciesat 23 and 30 weeks, respectively (for preterm PE: p<0.036 and for term PE: 0=0.002); 3) patientsdestined to develop PE (term or preterm) and those who delivered an SGA neonate had lower plasmaconcentrations of PlGF than those with normal pregnancy throughout gestation, and the maternalplasma concentration of this analyte became detectable later among patients with pregnancycomplications, compared to normal pregnant women; 4) there were no significant differences in theplasma concentrations of sVEGFR-1 between patients destined to deliver an SGA neonate and thosewith normal pregnancies; 5) patients destined to develop preterm and term PE had a significantlyhigher plasma concentration of sVEGFR-1 at 26 and 29 weeks of gestation than controls (p=0.009and p=0.0199, respectively); and 6) there was no significant difference in the increment of sVEGFR-1between control patients and those who delivered an SGA neonate (p=0.147 at 25 weeks andp=0.8285 at 40 weeks).
Conclusions—1) Changes in the maternal plasma concentration of s-Eng, sVEGFR-1 and PlGFprecede the clinical presentation of PE, but only changes in s-Eng and PlGF precede the delivery ofan SGA neonate; and 2) differences in the profile of pro-angiogenic and anti-angiogenic response tointrauterine insults may determine whether a patient will deliver an SGA neonate, develop PE, orboth.
Keywordsintrauterine growth restriction; placental disease; SGA; IUGR; preterm birth; soluble Flt-1;longitudinal; growth curve model; pregnancy
IntroductionPreeclampsia (PE) and small for gestational age (SGA) neonates share several mechanisms ofdisease, such as chronic uteroplacental ischemia [1-8] and endothelial cell dysfunction[9-15]. However, it is unclear why pregnant women with similar insults develop, while othersdeliver an SGA neonate but do not develop PE. Accumulating evidence suggests that animbalance between pro-angiogenic factors [i.e. vascular endothelial growth factor (VEGF) andplacental growth factor (PlGF)] and anti-angiogenic factors [i.e. soluble VEGF receptor-1(sVEGFR-1, also referred to as sFlt1) and the soluble form of endoglin (s-Eng)] participate inthe pathophysiology of PE. Indeed, patients with PE have higher plasma concentrations ofsVEGFR-1[16-25] and s-Eng [26,27], and lower plasma concentration of VEGF [16,19] andPlGF [16,19,28] than patients with normal pregnancies. These differences have been observedbefore the clinical presentation of PE [19,21,27,29-36].
Endoglin (CD105) is a homodimeric transmembrane glycoprotein, which is considered to bethe functional co-receptor for transforming growth factor (TGF)-β1 and TGF-β3 [37-39]. TGF-β induces migration and proliferation of endothelial cells [40]. The soluble form of endoglin(s-Eng) is considered to have anti-angiogenic effects, and shedding has been proposed toaccount for circulating s-Eng [41]. This anti-angiogenic factor has been recently implicated inthe pathophysiology of PE, based on the following observations: 1) s-Eng inhibits endothelialfunction in vitro; 2) administration of endoglin induces hypertension in vivo; 3) the combinedadministration of s-Eng and sVEGFR-1 to pregnant rats induced hypertension, proteinuria andfetal growth restriction; 4) endoglin mRNA is up-regulated (3-5 fold) in the placenta of womenwith PE compared to women without this disorder; and 5) similarly, the endoglin protein
Romero et al. Page 2
J Matern Fetal Neonatal Med. Author manuscript; available in PMC 2008 November 25.
NIH
-PA Author Manuscript
NIH
-PA Author Manuscript
NIH
-PA Author Manuscript

expression is increased in placentas from patients with preeclamptic, as demonstrated byWestern Blot analysis, and localized to the syncytiotrophoblast by immunofluorescence [26].
The objective of this study was to determine if changes in maternal plasma concentration ofthese angiogenic and anti-angiogenic factors differ prior to development of disease amongpatients with normal pregnancies, those destined to develop PE (preterm and term) or to deliveran SGA neonate.
Material and MethodsStudy design
This longitudinal nested case-control study comprised 144 patients with singleton pregnancieswith the following diagnosis: 1) those with uncomplicated pregnancies who deliveredappropriate for gestational age (AGA) neonates (controls; n=46); 2) patients who delivered anSGA neonate (n=56) and 3) patients who developed PE (n=42). The latter group was sub-divided in preterm (<37 weeks, n=16) and term (≥37 weeks, n=26) PE, according to thegestational age at which PE was diagnosed.
Plasma samples were obtained at the time of each prenatal visit, scheduled at four-weekintervals from the first or early second trimester until delivery. A maximum of six sampleswere collected per patient.
SGA was diagnosed as a birth weight below the 10th percentile for gestational age [42]. PEwas diagnosed in the presence of systolic blood pressure ≥140 mmHg or diastolic bloodpressure ≥90 mm Hg on at least two occasions, four hours to one week apart, and proteinuria≥300 mg in a 24 hours urine collection, or one dipstick with ≥2+. Patients with PE wereclassified into “preterm” (<37 weeks) and “term” (≥ 37 weeks) PE according to the gestationalage at diagnosis. All pregnant women signed a consent form approved by the HumanInvestigation Committee of Sotero del Rio Hospital, Santiago-Chile and the InstitutionnalReview Board of the National Institute of Child Health and Human Development.
Sample collection and human soluble endoglin (s-eng), sVEGFR-1 and PlGF immunoassaysBlood samples were collected into tubes containing EDTA. The samples were centrifuged andstored at −70°C. Laboratory personnel were blinded to clinical diagnosis. Maternal plasmaconcentrations of s-Eng, sVEGFR-1 and PlGF were determined by sensitive and specificimmunoassays (R&D Systems. Minneapolis, MN USA). All three immunoassays utilized asandwich enzyme immunoassay technique and had been validated for plasma determinationsof the analytes. The sensitivity, inter- and intra-assay coefficients of variation for each analyteobtained in our laboratory are described in Table S-I (Supplemental material available online).
Statistical AnalysisDescriptive analysis—Comparisons among groups were performed using Mann-Whitneytest for continuous variables and Chi-square or Fisher's exact test for categorical variables.
Longitudinal analysis of angiogenic related factors—Prospective (forward) andretrospective (backward) analyses were performed to assess the change in plasmaconcentrations of angiogenic-related factors over time using parametric growth curve models.Prospective analysis considered the changes in plasma analyte concentrations from the initialvisit until either the clinical diagnosis of PE or delivery (in cases of SGA and normalpregnancies). Conversely, the retrospective analysis considered the gestational age at whichPE was diagnosed or delivery occurred (in cases of SGA and normal pregnancies) as the starting
Romero et al. Page 3
J Matern Fetal Neonatal Med. Author manuscript; available in PMC 2008 November 25.
NIH
-PA Author Manuscript
NIH
-PA Author Manuscript
NIH
-PA Author Manuscript

time point, and the changes of analyte concentrations were modeled in decreasingchronological order, to the initial visit.
The growth curve model of each analyte was derived using linear mixed effects models [fixedeffects + random effects], which included a polynomial function of the gestational age for theprospective analysis and the number of weeks before the development of disease or deliveryfor the retrospective analysis. The fixed effect component of the models includes time-dependent (e.g., gestational age) and time-independent (e.g., baseline clinical characteristics)covariates, as well as the clinical diagnosis (normal pregnancy, SGA, and PE). The randomeffect component of the models examines the deviation of each individual from the averageprofile of each diagnostic group, which allows adjustment for unknown variability amongpatients [43].
Growth curve models were fitted to the transformed plasma concentration [log (1+concentration)] of each analyte adjusting for baseline and clinical risk factors. This logtransformation also has a variance stabilization property [44]. This logarithmic transformationwas employed to achieve normality. The fixed effect component included diagnosis, body massindex (BMI), maternal age, and up to the fifth order polynomial terms of gestational age ornumber of weeks before diagnosis or delivery. The random effect component includes theintercept (baseline concentration), linear and quadratic effects of gestational age or number ofweeks before diagnosis or delivery. Statistical significance of fixed effects was assessed usingF-tests based on “robust sandwich estimates for the variance,”[43,45-48] which yieldsasymptotically consistent covariance matrix estimates without making distributionalassumptions and even if the assumed model underlying the parameter estimates is incorrect.Random effects were assessed employing likelihood ratio tests with a mixture of Chi-squaredistributions [43].
The polynomial order (up to fifth) was determined by the following steps: 1) smoothing thelog transformed analyte to identify a growth curve pattern of each diagnosis group, and thenfitting a polynomial of a high enough order to capture the previously identified trend and 2)determining the polynomial order by testing on the parameter significance of the highest orderterm and keeping the order of the highest order of statistical significance. This ensures thepolynomial will capture the growth curve trend and yield as little bias as possible.
A piece-wise growth curve model was fitted to maternal plasma PlGF concentration and thePlGF/s-Eng ratio for each diagnostic group. The first part of this model assigned a zero valueto the plasma PlGF concentration when this analyte was undetectable in early pregnancy. Thesecond part of the model is a growth curve which starts at the elevation time. The group-specificelevation time was defined as the gestational age before and at which the PlGF concentrationwas zero (undetectable concentration) and after which the PlGF elevated to become detectable.The growth curve model was fitted with a fourth order polynomial (with gestational age as anindependent variable) to the concentration of PlGF or the PlGF/s-Eng ratio. The group-specificelevation time was then estimated by solving the growth curve polynomial equation for eachdiagnostic group. A bootstrap method was used to compute the standard error of the estimatedelevation time [49]. Hypothesis testing on the differences in the elevation time betweendiagnosis groups was conducted with a non-parametric statistical permutation test [49].
The statistical package SAS version 9.1 (SAS Institute Inc., Cary, NC, USA) was used forfitting mixed effects models (PROC MIXED), and the statistical package R (version 2.1.1) forthe graphical display of the plasma concentration of the analytes during gestation. A p-valueof <0.05 was considered significant.
Romero et al. Page 4
J Matern Fetal Neonatal Med. Author manuscript; available in PMC 2008 November 25.
NIH
-PA Author Manuscript
NIH
-PA Author Manuscript
NIH
-PA Author Manuscript

ResultsDemographic and clinical characteristics of patients in the three study groups
The demographic and clinical characteristics of the study groups are displayed in Table I.Patients who developed PE (preterm or term) had a significantly higher proportion of nulliparaewomen than normal pregnancies. A significantly lower proportion of smokers were observedin patients who developed PE at term, as compared to normal pregnancies (Table I).
Maternal plasma concentrations of PlGF, s-Eng and sVEGFR-1 in normal pregnancyAmong patients with normal pregnancy outcome, plasma s-Eng and sVEGFR-1 increased withadvancing gestational age. In contrast, plasma PlGF concentrations followed a bell-shapedcurve (see Figures 1 – 3). Figures S1 and S2 display the change in the ratio of both PlGF/s-Eng with gestational age (see supplemental material). These results are based upon the forwardmodeling of analyte concentrations as a function of gestational age.
s-Eng in Preeclampsia and SGA neonatesPatients who delivered an SGA neonate had a significantly higher plasma concentration of s-Eng from ten weeks of gestation onwards than the controls (p<0.0001; see Figure 4). Amongwomen who developed PE, the increment in plasma s-Eng in patients destined to developpreterm PE surpassed that of patients with normal pregnancies at 13 weeks and becamesignificant at 23 weeks (p=0.036; Figure 4). In patients destined to develop PE at term, thematernal plasma concentration of s-Eng became significantly higher than in the case of normalpatients at 30 weeks (p=0.002).
Backward analysis indicated that patients destined to deliver an SGA neonate had asignificantly higher plasma s-Eng concentration than controls up to 30 weeks before delivery(Figure 5). In other words, a higher maternal plasma concentration of s-Eng was detectable inthese women from the first trimester onwards (Figure 4). It is noteworthy that the elevation ofs-Eng after 25 weeks was more pronounced in the second trimester of pregnancy in patientswho developed preterm PE than in those who delivered SGA neonates (Figure 4).
Placental growth factor in Preeclampsia and SGA neonatesThe maternal plasma concentration of PlGF throughout gestation in normal pregnancy couldbe described with a curvilinear function in which the concentration increased from the firsttrimester onwards, peaked at approximately 33 weeks, and decreased slowly toward term(Figure 6).
Patients destined to develop PE (term or preterm) and those who delivered an SGA neonatehad lower plasma concentration of PlGF throughout gestation than controls (Figure 6). Thesedifferences were statistically significant at ten weeks of gestation for SGA and term PE(p=0.0009 and p<0.001, respectively) and 11 weeks for preterm PE (p=0.0145).
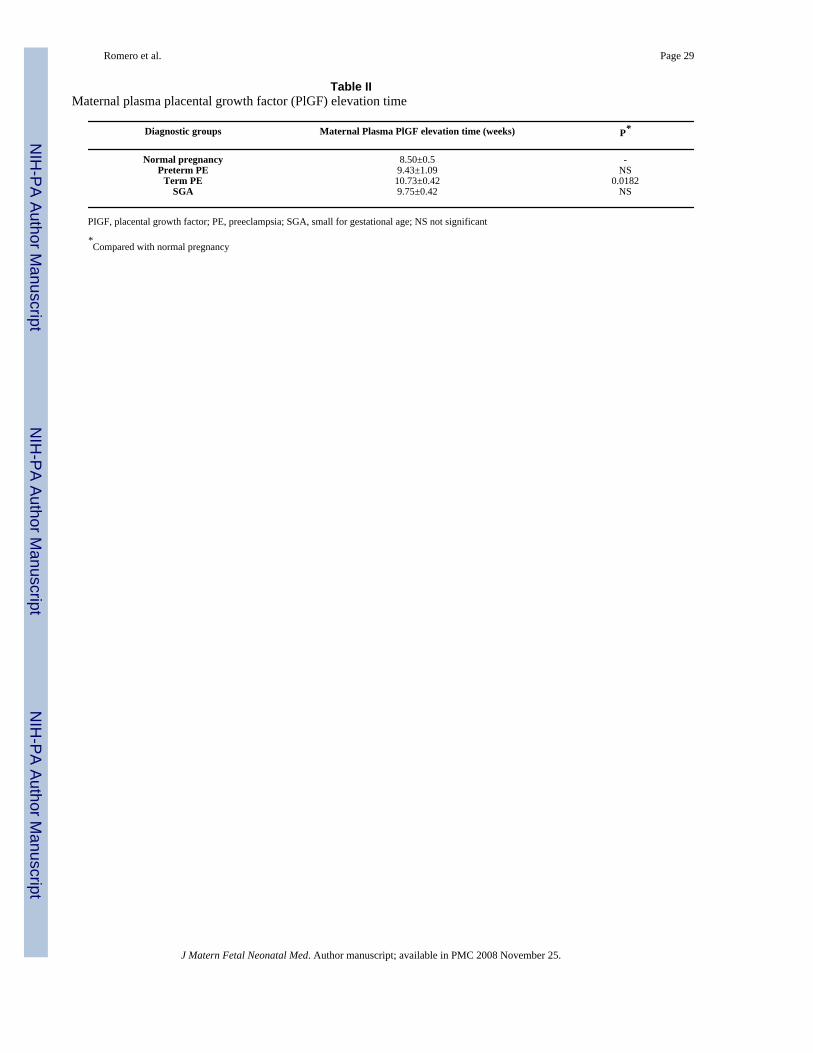
Sixty-nine percent (11/16) of patients destined to develop preterm PE, 69% (18/26) of thosedestined to develop term PE, as well as 84% (47/56) of patients who delivered an SGA neonatehad undetectable plasma concentrations of PlGF in early pregnancy (first and early secondtrimester). In contrast, only 33% (15/46) of controls had undetectable plasma concentrationsof PlGF (p<0.0001). Plasma PlGF concentration became detectable on average at 10.7 (± 0.4)weeks, 9.4 (± 1.1) weeks and 9.7 (± 0.4) weeks of gestation in patients with PE at term, pretermPE and SGA neonates, respectively. Among normal pregnancies, the plasma concentration ofPlGF became detectable on average at 8.5 (± 0.5) weeks of gestation. Pairwise root comparisonsindicated that the PlGF elevation time was significantly different between normal pregnantpatients and those destined to develop PE at term (p=0.0182), but not significantly different
Romero et al. Page 5
J Matern Fetal Neonatal Med. Author manuscript; available in PMC 2008 November 25.
NIH
-PA Author Manuscript
NIH
-PA Author Manuscript
NIH
-PA Author Manuscript

between normal pregnancy and preterm PE or SGA (p>0.05 for both comparisons; see TableII). Similar results were obtained when comparing the PlGF/s-Eng ratio among study groups,except that there was a significant delay in the elevation time among patients who deliveredan SGA neonate compared with normal pregnancy (p=0.0303) (see Table III).
The maternal concentration of PlGF peaked in all pregnant women. The gestational age atwhich this peak was reached, however, differed dramatically among groups. In women whohad normal pregnancy, the peak was reached after 30 weeks. In contrast, the peak developedat earlier gestational age in patients with complications of pregnancy. Women destined todevelop preterm PE displayed such a peak before 25 weeks, whereas in patients destined tohave SGA neonates and term PE, such a peak was reached after 25 weeks (approximately 27weeks; see Figure 6).
Backward analysis indicated that patients destined to develop preterm and term PE, and thosedestined to deliver an SGA neonate, had a significantly lower plasma PlGF concentration 12,20 and 16 weeks before the clinical presentation of the disease when compared to controls(p=0.0485, p<0.0001 and p=0.0401, respectively; see Figure 7).
sVEGFR-1 in Preeclampsia and SGA neonatesPatients destined to develop preterm and term PE had a significantly higher plasmaconcentrations of sVEGFR-1 at 26 and 29 weeks of gestation than controls (p=0.009 andp=0.0199, respectively), and significantly higher concentrations of sVEGFR-1 at 25 and 30weeks than those destined to deliver an SGA neonate (p<0.001 and p=0.0021, respectively).However, there was no difference in the increment of sVEGFR-1 between control patients andthose who delivered an SGA neonate (p=0.147 at 25 weeks and p=0.08285 at 40 weeks) (Figure8). Backward analysis indicated that patients who developed preterm and term PE had asignificantly higher plasma sVEGFR-1 concentration seven and eleven weeks before theclinical diagnosis of the disease (Figure 9).
The mean plasma concentration and 95% confidence interval of each analyte in the differentpregnancy complications are displayed in Figure 10. The mean analyte concentration of thenormal pregnancy group is added to each plot for comparison.
PlGF/endoglin ratioThe maternal plasma PlGF/endoglin ratio throughout gestation in normal pregnancy could bedescribed with a curvilinear function in which the concentration increased from the firsttrimester onwards, peaked at approximately 28 weeks and decreased slowly toward term (seeFigure S1 in the Supplemental material).
Patients destined to develop PE (term or preterm) and those who delivered an SGA neonatehad lower plasma PlGF/endoglin ratio throughout gestation than controls. These differenceswere statistically significant at ten weeks of gestation for SGA (p=0.0008), preterm PE(p=0.0341) and term PE (p <0.0001) (see Figure S3 in the Supplemental material).
Backward analysis indicated that patients who developed preterm PE and those who deliveredan SGA neonate had a significantly lower plasma PlGF/endoglin ratio than women with normalpregnancies 20 weeks before the clinical diagnosis (p<0.0001 and p=0.0002, respectively), andten weeks before the diagnosis of term PE (p=0.0002) (see Figure S4 in the Supplementalmaterial).
Romero et al. Page 6
J Matern Fetal Neonatal Med. Author manuscript; available in PMC 2008 November 25.
NIH
-PA Author Manuscript
NIH
-PA Author Manuscript
NIH
-PA Author Manuscript

PlGF/sVEGFR-1 ratioThe maternal plasma PlGF/sVEGFR-1 ratio throughout gestation in normal pregnancy couldbe described with a curvilinear function in which the concentration increased from the firsttrimester onwards, peaked at approximately 28 weeks, and decreased slowly toward term (seeFigure S2 in the Supplemental material).
Patients destined to develop preterm PE and those who delivered an SGA neonate had lowerplasma PlGF/sVEGFR-1 ratio from 15 weeks onwards than controls. These differences werestatistically significant at 15 weeks of gestation for SGA (p=0.01) and preterm PE (p=0.01),and at 21 weeks onwards for term PE (p=0.03) (see Figure S5 in the Supplemental material).
Backward analysis indicated that patients who developed preterm and term PE had asignificantly lower plasma PlGF/sVEGFR-1 ratio 20 (p<0.0001) and 14 weeks (p=0.01) beforethe clinical diagnosis, respectively. Patients destined to deliver an SGA neonate had asignificantly lower plasma PlGF/sVEGFR-1 ratio 15 weeks (p=0.04) before delivery (seeFigure S6 in the Supplemental material). Of note, PlGF/sVEGFR-1 ratio was very similarbetween patients destined to develop term and preterm PE ten weeks before the clinicalpresentation of these diseases.
DiscussionPrincipal findings of the study
The key observations of the study are that changes in the concentrations of pro-angiogenic(placental growth factor) and anti-angiogenic factors (s-Eng and sVGFR-1) occur prior to thedevelopment of the disease in women destined to develop PE. Similar results, but not changesin sVEGFR-1, were observed in those destined to deliver an SGA neonate. Moreover, womendestined to deliver an SGA neonate and those destined to develop PE had a lower plasmaconcentration of PlGF than women with normal pregnancies from the first trimester ofpregnancy onwards.
Of major interest is that the pattern of change is different in women destined to develop SGAneonates or PE (preterm or term). Specifically, we found that patients destined to deliver anSGA neonate had a higher plasma concentration of s-Eng than normal pregnancies from tenweeks of gestation onwards. In contrast, patients destined to develop preterm PE and term PEhad higher plasma concentration of s-Eng after 24 weeks of gestation. Changes in maternalplasma concentration occurred relatively late in patients who developed preterm and term PEat 26 and 29 weeks, respectively.
Preeclampsia and SGA: two distinct phenotypes of an anti-angiogenic stateOur results are consistent with recent reports that PE is associated with an anti-angiogenic state,as demonstrated by high plasma concentrations of sVEGFR-1 [16,19-21] and s-Eng [26,27],and low plasma or serum concentrations of PlGF [16,19,28]. However, our study furtherdemonstrates that patients destined to deliver an SGA neonate show changes in the maternalplasma concentration of s-Eng and PlGF, but not sVEGFR-1, and that these changes differ intiming and magnitude from those of patients destined to develop preterm or term PE.
Placental vascular development: the role of Endoglin, PlGF, VEGF and sVEGFR-1The regulation of vascular growth and remodeling, also known as angiogenesis, is consideredto be central to normal placental and fetal growth and development [50-52]. In the humanplacenta, angiogenesis has been proposed to be biphasic with peaks at mid gestation and atterm, resulting from endothelial proliferation early in pregnancy and vascular remodeling inthe second half of pregnancy [53].
Romero et al. Page 7
J Matern Fetal Neonatal Med. Author manuscript; available in PMC 2008 November 25.
NIH
-PA Author Manuscript
NIH
-PA Author Manuscript
NIH
-PA Author Manuscript

Angiogenesis is regulated by at least three growth factor families, including: vascularendothelial growth factors (VEGF), angiopoietins and Erphrins [54]. Other factors proposedto regulate angiogenesis include: fibroblast growth factors, transforming growth factors α andβ, tumor necrosis factor α, Interleukin-8, hepatocyte growth factor, angiogenin, and membersof the Notch family.[52,55,56] Recent evidence indicates that angiogenesis requires thesequential activation of several receptors, including Tie1, Tie2, and platelet derived growthfactor receptor β, by ligands in endothelial and mural cells [57]. However, VEGF signalingrepresents a critical rate-limiting step in physiological angiogenesis [57].
VEGF family and its receptorsThe VEGF are a family of structurally related dimeric proteins whose members include VEGF-A, VEGF-B, VEGF-C, VEGF-D and PlGF [56]. The function of VEGF is to promote survival,migration, and differentiation of endothelial cells, as well as mediate vascular permeability[55,56]. VEGF exerts its biologic effect through VEGFR-2, whereas the precise function ofVEGFR-1 is still a subject of debate. Most investigators believe that VEGFR-1 might not bea receptor transmitting a mitogenic signal, but rather a “decoy” receptor that prevents thebinding of VEGF to VEGFR-2 [56]. The “decoy” function can be performed not only by thetransmembrane, but also the soluble isoform (sVEGFR-1) [56], which is generated by splicevariant of VEFGR-1 gene. sVEGFR-1 contains the extracellular ligand-binding, but lacks thesignaling tyrosine kinase domain [56,58] and, thus, is considered to be an anti-angiogenicfactor.
A growing body of evidence indicates that vascular growth in the placenta is locally regulatedby sVEGFR-1 produced by the placenta. This evidence includes: 1) in situ hybridization studiesdemonstrated that sVEGR-1 mRNA is expressed in villous and extravillous trophoblast; 2)sVEGFR-1 protein is present in the supernatant from villous cultures; and 3) sVEGFR-1 hasbeen reported to be present in the serum of patients with uncomplicated pregnancies, but notin non-pregnant women [58]. However, more recent reports indicate that the plasma and serumof healthy non-pregnant individuals have also detectable levels of sVEGFR-1 of monocyte andendothelial cell origin,[59], indicating that sVEGFR-1 may contribute to the fine regulation ofVEGF bioavailability in both pregnant and non-pregnant women [59]. This fine regulation isof paramount importance as continuous low levels of VEGF are required for endothelial cellproliferation and survival [60]. An additional mechanism by which sVEGFR-1 may regulatethe bioavailability of VEGF is the formation of heterodimers with the VEGF receptors in thecell surface, abolishing their signal transduction [59].
Placental growth factor (PlGF)PlGF is a major member of the VEGF family, which is a ligand for VEGFR-1 that enhancesthe angiogenic response of VEGF [61,62]. This has been proposed to be accomplished by: 1)intermolecular cross-talk between VEGFR-1 and VEGFR-2 (transphosphorylation andactivation of VEGFR-2 following activation of VEGFR-1 by PlGF); 2) PlGF displacement ofVEGF from sVEGFR-1, making more VEGF available to bind VEGFR-2; and 3) PlGFhomodimers can destabilize inactive heterodimers of VEGFR-2 and sVEGFR-1, making moreVEGFR-2 available for the formation of functional homodimers [61,62]. Low plasma PlGFconcentrations are detectable in non-pregnant women (44 ± 4.7 pg/ml), but the plasmaconcentration of this pro-angiogenic factor is substantially higher in pregnant women [34].
Endothelial cells release minimal amounts of PlGF but, when activated, produce abundantamounts of PlGF [62]. In addition, other cell types (including vascular smooth muscle cells,inflammatory cells, bone marrow cells, neurons and many tumor cells) also produce PlGF[61,63-65]. In vitro studies demonstrated that hypoxia may regulate the expression of PlGF inplacental tissues. Indeed, incubation of isolated human term syncytiotrophoblast under hypoxic
Romero et al. Page 8
J Matern Fetal Neonatal Med. Author manuscript; available in PMC 2008 November 25.
NIH
-PA Author Manuscript
NIH
-PA Author Manuscript
NIH
-PA Author Manuscript

conditions reduced the mRNA PlGF expression by 75% [66]. Similarly, hypoxia reduced thePlGF concentrations in the supernatant of primary cytotrophoblast cultures [67]. Thus, it ispossible that chronic uteroplacental ischemia may account for the low maternal plasmaconcentration of PlGF in patients destined to develop PE or deliver an SGA neonate.
Endoglin and s-EngEndoglin is a functional co-receptor for TGF-β1 and TGF-β3 [37-39]. TGF-β induces migrationand proliferation of endothelial cells via the ALK1 pathway. However, TGF-β can have theopposite effect if the ALK5 pathway is activated [40]. Endoglin has been proposed to regulatethe balance between these two opposite pathways [40].
Endoglin is primarily expressed in endothelial cells [68], but is also present in macrophages[69,70], erythroid precursors [71], syncytiotrophoblast, [72] activated monocytes [69], andstromal cells[ 73,74]. The mechanism by which the soluble form of endoglin is generated isunclear. However, it has been proposed that shedding may account for the circulating s-Engin normal individuals and those with pathological conditions associated with abnormalangiogenesis [41]. The soluble form of endoglin has been proposed to reduce the bioavailabilityof TGF-β1, thus inhibiting its signaling pathway [75]. Recently, the anti-angiogenic effect ofs-Eng has been confirmed by in vitro experiments, which demonstrated that recombinant s-Eng inhibited endothelial tube formation on Matrigel to the same extend as s-VEGFR-1[26].Moreover, this anti-angiogenic factor has been reported to contribute to the pathophysiologyof PE, as demonstrated by animal experimentation in which adenoviral expression of s-engand sVEGFR-1 in pregnant animals was associated with a nephrotic-range proteinuria, severehypertension, fetal growth restriction and biochemical evidence of HELLP (hemolysis,elevated liver enzymes, low platelets) syndrome [26].
Longitudinal studies are required to describe changes over time in angiogenic and anti-angiogenic factors
Most studies conducted to date have focused on the examination of the concentration of manyanalytes including angiogenic and anti-angiogenic factors at the time of the diagnosis of thedisease. Such studies, however, can not determine the temporal relationship in the profile of aset of analytes and the clinical onset of the disease; in other words, whether the changes precedeor follow the onset of clinical disease. This information is crucial in establishing a cause andeffect relationship between analytes and disease states, and exploring whether or not theirdetermination would have predictive clinical value.
Analytical strategies for a longitudinal study of angiogenic and anti-angiogenic factors inpregnancy and their implications for this report
This study was conducted to determine if and when the plasma concentration of three factorsinvolved in the control of angiogenesis changed in patients who subsequently developedpreeclampsia and SGA. Precise answers to these questions required a longitudinal study, butalso the use of statistical methods specifically designed to draw valid inferences in the contextof longitudinal analysis.
The key characteristic of a longitudinal study is that repeated observations are made on thesame subject. Therefore, the data generated from a subject tend to be intercorrelated [76]. Incontrast, cross-sectional studies include each subject only once. Longitudinal studies arepowerful research approaches to characterize what are called “cohort” and “age” effects [76,77]. An age effect is the study of changes sustained by an individual over time (i.e.transformations in the concentration of angiogenic factors with gestational age). A cohort effectrefers to the differences among individuals due to baseline characteristics. Longitudinal studiesare more effective than cross-sectional studies in examining age and cohort effects [76].
Romero et al. Page 9
J Matern Fetal Neonatal Med. Author manuscript; available in PMC 2008 November 25.
NIH
-PA Author Manuscript
NIH
-PA Author Manuscript
NIH
-PA Author Manuscript

The interdependence of longitudinal data poses statistical challenges derived not only from thelack of cohesion of the observations made about a particular subject, but also the fact that theobservations may be taken at different points in time (i.e. gestational age), and some of theobservations might be missing [76]. Even though some investigators have analyzedlongitudinal data using a cross-sectional approach, and such an approach results in loss ofstatistical power to address specific questions. Although, one can argue that large cross-sectional and longitudinal studies analyzed with a cross-sectional approach (e.g. time pointanalysis) may yield similar results, the crux of the question is often whether or not the studyis large enough. Moreover, there is the fundamental issue of whether the results of a cross-sectional analytical approach can be extrapolated to answer inherent longitudinal questions(e.g. growth, which is space over time and, thus, requires a longitudinal design and analysis).Using a cross-sectional analytical approach to longitudinal data could enhance the likelihoodof a type I error because of the multiple comparisons conducted in data, which are notindependent.
One popular approach in analyzing longitudinal studies is to employ repeated measure analysisof variance. This technique, however, generally assumes that the measurements are taken atequal time points and that no data is missing. Such criteria are rarely met, even in the case ofplanned studies with human data. Another approach is to use the generalized estimatingequations (GEE), where the investigators are interested in the relationship between the responsevariable (in this study, the concentration of the analytes) and the covariates (i.e. diagnosticgroup, BMI, nulliparity, etc.), but not in the intra-subject correlation. Since the study of thechange in the concentrations of angiogenic and antiangiogenic factors in the same subject wasof primary importance in this study, GEE models were not deemed suitable. The missing datapattern in the study does not meet the requirement of GEE which is “missing completely atrandom” [78]. In this specific study, maternal plasma concentrations for analytes are missingif patients are delivered preterm (SGA or preterm preeclampsia). Another approach is thetransition Markov model, which relies on previous observations from the same individual and,therefore, is susceptible to missing values.
We have used a general linear mixed effect model (GLMEM) approach because the emphasisof this analytical approach is subject-specific and also provides information about group-effects(i.e. diagnostic category such as SGA, PE, or normal pregnancy). The three key componentsof GLMEM are: 1) a fixed effect; 2) a random effect; and 3) measurement error. The fixedeffect component captures the differences in the mean concentrations of the analytes betweendiagnostic groups (normal pregnancy, SGA, PE). The random effect examines the deviationof each individual from the average profile of each diagnostic group, and this allows adjustmentfor unknown variability in the concentration of the analytes among patients. Finally, themeasurement error component of the model is estimated from the residuals. to the fact that thesandwich estimation of the variance used in this study yields an unbiased estimation of thestandard errors of the fixed effects should be emphasized. This assures valid inferences fromthe analysis.
A particularly challenging statistical aspect of this study was to characterize the behavior ofmaternal plasma concentration of PlGF. While s-Eng and sVEGFR-1 were detectable throughpregnancy in all patients, PlGF was not. In general, PlGF became detectable in the late firsttrimester of pregnancy, and its concentrations increased with gestational age and subsequentlydecreased or even became non–detectable before the end of pregnancy. Preliminary analysisindicated that the time at which PlGF became detectable in early pregnancy or non-detectablein late pregnancy contained important information about the membership of a particular patientin a diagnosis group (normal pregnancy, PE or SGA). To address the question of thedetectability of PlGF at a given gestational age and subsequent pregnancy outcome, a piece-wise growth curve model was fitted. This means that a different growth model equation was
Romero et al. Page 10
J Matern Fetal Neonatal Med. Author manuscript; available in PMC 2008 November 25.
NIH
-PA Author Manuscript
NIH
-PA Author Manuscript
NIH
-PA Author Manuscript

fitted for different gestational age intervals. Such an approach was required because theconcentration of PlGF was not detectable in early pregnancy in at least the first two samplesin some women. The conventional mixed effect model would not allow accurate estimationsof the parameters in such cases.
Most figures used to illustrate our results displayed the modeled concentrations of theangiogenic-related factors as function of gestational age. However, we have shared all datapoint with the readers by presenting the raw observations for each patient in Figure S7 on thesupplemental material available on the journal's website. Our discussion will focus on themodel-based figures, as they represent the most accurate summary of the data. The scientificstrength and advantages of employing longitudinal methods of analysis rather than a cross-sectional analytical approach for this type of study are now well understood by members ofthe statistical community.
An elevated concentration of maternal plasma s-Eng in the first trimester predisposes to thedelivery of an SGA neonate
An anti-angiogenic state has been implicated as a mechanism of disease in PE [16,19,20,27].However, recent evidence suggest that it may be a mechanism of disease in other obstetricalsyndromes as well, such as fetal death,[79] mirror syndrome,[80] and SGA [20]. Indeed, Levineet al. [27] reported that normotensive patients who delivered an SGA neonate have a highermaternal serum concentration of s-Eng compared to controls beginning at 17 to 20 weeks ofgestation, and that difference was higher at 37 to 42 weeks. The observation reported hereinthat mothers destined to deliver an SGA neonate had higher plasma concentrations of s-Engin the first trimester of pregnancy than patients who had a normal pregnancy and also patientswho developed PE (preterm and at term) is novel and noteworthy for several reasons. First, itindicates that a chronic anti-angiogenic state may exist in early pregnancy and may bedetectable by measuring the plasma concentrations of this soluble factor. In contrast to Levineet al, [27] angiogenic and anti-angiogenic factors were measured in plasma rather than serum.We believe that plasma is more likely to truly reflect the circulating anti-angiogenic state ratherthan serum which contains factors liberated ex vivo from the platelets. Second, the profile ofmaternal plasma concentrations of s-Eng is dramatically different among patients whosubsequently developed SGA and PE. Specifically, the mean concentration of s-Eng becamesignificantly higher in patients destined to developed preterm PE at 23 weeks than that ofpatients destined to deliver an SGA neonate (and 30 weeks in those destined to developed PEat term). Third, it is of interest that the maternal plasma concentration of s-Eng remained higherthrough the entire duration of pregnancy in women destined to deliver an SGA neonate thanin those who had a normal pregnancy. Further studies are required to determine the clinicalvalue of such determinations in the prediction of both SGA and PE. Backward analysisindicates that a significant elevation in the plasma concentration of s-Eng is detectable 30 weeksbefore delivery in SGA, and ten weeks before the diagnosis of preterm and term PE. Theseobservations have implications for the timing of blood sampling for prediction purposes.
Maternal plasma sVEGFR-1 in Preeclampsia and SGAMaynard et al [16] reported the central observation that sVEGFR-1 participates in thepathophysiology of PE, and Levine et al [19], as well as Chaiworapongsa et al [21],demonstrated that the maternal plasma concentrations of this anti-angiogenic factor increasesfive to ten weeks prior to the development of the disease. The findings in the current studyconfirm that maternal plasma concentrations of sVEGFR-1 increased prior to the diagnosis ofPE (Figure 3 and Figure 10), and that a significant difference was detected seven weeks priorto the diagnosis of preterm PE and 11 weeks prior to the diagnosis of term PE. It should benoted that we could not demonstrate a difference in the plasma concentration of sVEGFR-1 inpatients who delivered an SGA at any point in gestation. We have previously reported that
Romero et al. Page 11
J Matern Fetal Neonatal Med. Author manuscript; available in PMC 2008 November 25.
NIH
-PA Author Manuscript
NIH
-PA Author Manuscript
NIH
-PA Author Manuscript

mothers who delivered an SGA neonate had a higher median concentration of sVEGFR-1 thannormal pregnant women [20]. An explanation for the different results could lie in the syndromicnatures or multiple etiologies of SGA. Our previous results were based on a loarge number ofSGA patients who had abnormal uterine/umbilical atery Doppler velocimetries. Two clearimplications of our findings are that changes in the plasma concentrations of sVEGFR-1 areunlikely to have predictive value for SGA (without consideration of Doppler), and that thechanges prior to the diagnosis of PE occurred late in the natural history of the clinical disease.
Placental growth factor in PE and SGAOur study confirmed the findings of Tidwell et al that the maternal plasma concentrations ofPlGF follow a curvilinear profile which increases for the first trimester toward the beginningof the third trimester, and then demonstrates a slight decrease as term approaches [29].Moreover, the results of this study are consistent with accumulating evidence that a lowmaternal plasma concentration of PlGF in the second trimester is associated with the deliveryof an SGA neonate [30-32,81,82]. Of major interest is that the maternal plasma concentrationof PlGF in patients who delivered an SGA neonate or developed PE (term or preterm) wassignificantly lower than patients who had a normal pregnancy in the first trimester as well asthrough the rest of pregnancy. Backward analysis indicated that maternal plasmaconcentrations of PlGF were significantly lower in patients destined to deliver an SGAneonate16 weeks prior to delivery but, importantly, 20 weeks before diagnosis in patientsdestined to develop preterm PE and 12 weeks before term PE.
A novel observation reported herein is that the time at which PlGF becomes detectable was8.5 ± 0.51 weeks of gestation in normal pregnancy, with a major delay in patients withpregnancy complications: 9.4 ± 1.1 weeks for preterm PE, 10.7 ± 0.4 weeks for term PE and9.8 ± 0.4 weeks for SGA. Collectively, these observations suggest that maternal plasmaconcentration of PlGF at early gestational ages may have a major predictive value for both PEand SGA.
Maternal plasma PlGF/s-endoglin ratio in Preeclampsia and SGAWe computed the PlGF/s-Eng ratio to have an index of the balance of angiogenic and anti-angiogenic factors. PlGF was placed in the numerator because its concentrations are sometimesundetectable and a value 0 in the denominator (i.e. s-Eng/PlGF ratio) would render calculationimpossible. The profile of the PlGF/s-Eng ratio (see Figure S3 for forward analysis and FigureS4 for backward analysis) was very similar to that of PlGF (see Figure 6 and Figure 7). A majorfinding is that this ratio appears to offer great promise in the prediction of the different diseasephenotypes, and comparison with the determination of s-Eng and PlGF alone for classification/prediction purposes is justified.
Maternal plasma PlGF/sVEGFR-1 ratio in Preeclampsia and SGAThis ratio was not different among women with normal pregnancy and those destined todeveloped PE (term and preterm) or SGA in the first trimester and early second trimester ofpregnancy. Therefore, this ratio is less informative in terms of prediction/classification thanthe PlGF/endoglin ratio.
The results reported in this study confirm that preeclampsia and SGA are conditions associatedwith an anti-angiogenic state. However, other pregnancy complications are also characterizedby an anti-angiogenic state such as placental abruption, [83] “mirror syndrome,”[84-86]preeclampsia with parvovirus-induced hydrops, [87] and unexplained fetal death [79].
Romero et al. Page 12
J Matern Fetal Neonatal Med. Author manuscript; available in PMC 2008 November 25.
NIH
-PA Author Manuscript
NIH
-PA Author Manuscript
NIH
-PA Author Manuscript

ConclusionsCollectively, our results indicate that patients destined to deliver an SGA neonate show changesin the plasma concentration of pro- and anti-angiogenic factors from the first trimester ofpregnancy onwards, and these changes differ from those in patients destined to develop pretermor term PE.
ImplicationsThe determination of maternal plasma concentrations of pro- and anti-angiogenic factors inthe first trimester of pregnancy may help in the identification of patients destined to deliver anSGA neonate. Thus, it provides the opportunity for prophylactic interventions aimed atcorrecting and/or preventing fetal growth deceleration.
Supplementary MaterialRefer to Web version on PubMed Central for supplementary material.
AcknowledgementsThis research was supported by the Intramural Research Program of the National Institute of Child Health and HumanDevelopment, NIH, DHHS.
Reference List1. Campbell S, Diaz-Recasens J, Griffin DR, Cohen-Overbeek TE, Pearce JM, Willson K, Teague MJ.
New doppler technique for assessing uteroplacental blood flow. Lancet 1983;1:675–677. [PubMed:6132039]
2. Harrington KF, Campbell S, Bewley S, Bower S. Doppler velocimetry studies of the uterine artery inthe early prediction of pre-eclampsia and intra-uterine growth retardation. Eur J Obstet GynecolReprod Biol 1991;42(Suppl):S14–S20. [PubMed: 1809604]
3. Bower S, Schuchter K, Campbell S. Doppler ultrasound screening as part of routine antenatal scanning:prediction of pre-eclampsia and intrauterine growth retardation. Br J Obstet Gynaecol 1993;100:989–994. [PubMed: 8251470]
4. Harrington K, Cooper D, Lees C, Hecher K, Campbell S. Doppler ultrasound of the uterine arteries:the importance of bilateral notching in the prediction of pre-eclampsia, placental abruption or deliveryof a small-for-gestational-age baby. Ultrasound Obstet Gynecol 1996;7:182–188. [PubMed: 8705410]
5. Dekker GA, Sibai BM. Etiology and pathogenesis of preeclampsia: current concepts. Am J ObstetGynecol 1998;179:1359–1375. [PubMed: 9822529]
6. Albaiges G, Missfelder-Lobos H, Lees C, Parra M, Nicolaides KH. One-stage screening for pregnancycomplications by color Doppler assessment of the uterine arteries at 23 weeks' gestation. ObstetGynecol 2000;96:559–564. [PubMed: 11004359]
7. Papageorghiou AT, Yu CK, Bindra R, Pandis G, Nicolaides KH. Multicenter screening for pre-eclampsia and fetal growth restriction by transvaginal uterine artery Doppler at 23 weeks of gestation.Ultrasound Obstet Gynecol 2001;18:441–449. [PubMed: 11844162]
8. Papageorghiou AT, Yu CK, Nicolaides KH. The role of uterine artery Doppler in predicting adversepregnancy outcome. Best Pract Res Clin Obstet Gynaecol 2004;18:383–396. [PubMed: 15183134]
9. Roberts JM, Taylor RN, Musci TJ, Rodgers GM, Hubel CA, McLaughlin MK. Preeclampsia: anendothelial cell disorder. Am J Obstet Gynecol 1989;161:1200–1204. [PubMed: 2589440]
10. Redman CW, Sacks GP, Sargent IL. Preeclampsia: an excessive maternal inflammatory response topregnancy. Am J Obstet Gynecol 1999;180:499–506. [PubMed: 9988826]
11. Poston L, Chappell LC. Is oxidative stress involved in the aetiology of pre-eclampsia? Acta PaediatrSuppl 2001;90:3–5. [PubMed: 11332954]
12. Roberts JM, Lain KY. Recent Insights into the pathogenesis of pre-eclampsia. Placenta 2002;23:359–372. [PubMed: 12061851]
Romero et al. Page 13
J Matern Fetal Neonatal Med. Author manuscript; available in PMC 2008 November 25.
NIH
-PA Author Manuscript
NIH
-PA Author Manuscript
NIH
-PA Author Manuscript

13. Johnson MR, Anim-Nyame N, Johnson P, Sooranna SR, Steer PJ. Does endothelial cell activationoccur with intrauterine growth restriction? BJOG 2002;109:836–839. [PubMed: 12135223]
14. Redman CW, Sargent IL. Latest advances in understanding preeclampsia. Science 2005;308:1592–1594. [PubMed: 15947178]
15. Ness RB, Sibai BM. Shared and disparate components of the pathophysiologies of fetal growthrestriction and preeclampsia. Am J Obstet Gynecol 2006;195:40–49. [PubMed: 16813742]
16. Maynard SE, Min JY, Merchan J, Lim KH, Li J, Mondal S, Libermann TA, Morgan JP, Sellke FW,Stillman IE, et al. Excess placental soluble fms-like tyrosine kinase 1 (sFlt1) may contribute toendothelial dysfunction, hypertension, and proteinuria in preeclampsia. J Clin Invest 2003;111:649–658. [PubMed: 12618519]
17. Koga K, Osuga Y, Yoshino O, Hirota Y, Ruimeng X, Hirata T, Takeda S, Yano T, Tsutsumi O,Taketani Y. Elevated serum soluble vascular endothelial growth factor receptor 1 (sVEGFR-1) levelsin women with preeclampsia. J Clin Endocrinol Metab 2003;88:2348–2351. [PubMed: 12727995]
18. Tsatsaris V, Goffin F, Munaut C, Brichant JF, Pignon MR, Noel A, Schaaps JP, Cabrol D, FrankenneF, Foidart JM. Overexpression of the soluble vascular endothelial growth factor receptor inpreeclamptic patients: pathophysiological consequences. J Clin Endocrinol Metab 2003;88:5555–5563. [PubMed: 14602804]
19. Levine RJ, Maynard SE, Qian C, Lim KH, England LJ, Yu KF, Schisterman EF, Thadhani R, SachsBP, Epstein FH, et al. Circulating angiogenic factors and the risk of preeclampsia. N Engl J Med2004;350:672–683. [PubMed: 14764923]
20. Chaiworapongsa T, Romero R, Espinoza J, Bujold E, Mee KY, Goncalves LF, Gomez R, Edwin S.Evidence supporting a role for blockade of the vascular endothelial growth factor system in thepathophysiology of preeclampsia. Young Investigator Award. Am J Obstet Gynecol 2004;190:1541–1547. [PubMed: 15284729]
21. Chaiworapongsa T, Romero R, Kim YM, Kim GJ, Kim MR, Espinoza J, Bujold E, Goncalves L,Gomez R, Edwin S, et al. Plasma soluble vascular endothelial growth factor receptor-1 concentrationis elevated prior to the clinical diagnosis of pre-eclampsia. J Matern Fetal Neonatal Med 2005;17:3–18. [PubMed: 15804781]
22. McKeeman GC, Ardill JE, Caldwell CM, Hunter AJ, McClure N. Soluble vascular endothelial growthfactor receptor-1 (sFlt-1) is increased throughout gestation in patients who have preeclampsiadevelop. Am J Obstet Gynecol 2004;191:1240–1246. [PubMed: 15507947]
23. Shibata E, Rajakumar A, Powers RW, Larkin RW, Gilmour C, Bodnar LM, Crombleholme WR, NessRB, Roberts JM, Hubel CA. Soluble fms-like tyrosine kinase 1 is increased in preeclampsia but notin normotensive pregnancies with small-for-gestational-age neonates: relationship to circulatingplacental growth factor. J Clin Endocrinol Metab 2005;90:4895–4903. [PubMed: 15886253]
24. Staff AC, Braekke K, Harsem NK, Lyberg T, Holthe MR. Circulating concentrations of sFlt1 (solublefms-like tyrosine kinase 1) in fetal and maternal serum during pre-eclampsia. Eur J Obstet GynecolReprod Biol 2005;122:33–39. [PubMed: 15935542]
25. Robinson CJ, Johnson DD, Chang EY, Armstrong DM, Wang W. Evaluation of placenta growthfactor and soluble Fms-like tyrosine kinase 1 receptor levels in mild and severe preeclampsia. Am JObstet Gynecol 2006;195:255–259. [PubMed: 16813756]
26. Venkatesha S, Toporsian M, Lam C, Hanai J, Mammoto T, Kim YM, Bdolah Y, Lim KH, Yuan HT,Libermann TA, et al. Soluble endoglin contributes to the pathogenesis of preeclampsia. Nat Med2006;12:642–649. [PubMed: 16751767]
27. Levine RJ, Lam C, Qian C, Yu KF, Maynard SE, Sachs BP, Sibai BM, Epstein FH, Romero R,Thadhani R, et al. Soluble endoglin and other circulating antiangiogenic factors in preeclampsia. NEngl J Med 2006;355:992–1005. [PubMed: 16957146]
28. Torry DS, Wang HS, Wang TH, Caudle MR, Torry RJ. Preeclampsia is associated with reduced serumlevels of placenta growth factor. Am J Obstet Gynecol 1998;179:1539–1544. [PubMed: 9855593]
29. Tidwell SC, Ho HN, Chiu WH, Torry RJ, Torry DS. Low maternal serum levels of placenta growthfactor as an antecedent of clinical preeclampsia. Am J Obstet Gynecol 2001;184:1267–1272.[PubMed: 11349200]
Romero et al. Page 14
J Matern Fetal Neonatal Med. Author manuscript; available in PMC 2008 November 25.
NIH
-PA Author Manuscript
NIH
-PA Author Manuscript
NIH
-PA Author Manuscript

30. Tjoa ML, van Vugt JM, Mulders MA, Schutgens RB, Oudejans CB, van Wijk IJ. Plasma placentagrowth factor levels in midtrimester pregnancies. Obstet Gynecol 2001;98:600–607. [PubMed:11576575]
31. Chappell LC, Seed PT, Briley A, Kelly FJ, Hunt BJ, Charnock-Jones DS, Mallet AI, Poston L. Alongitudinal study of biochemical variables in women at risk of preeclampsia. Am J Obstet Gynecol2002;187:127–136. [PubMed: 12114900]
32. Taylor RN, Grimwood J, Taylor RS, McMaster MT, Fisher SJ, North RA. Longitudinal serumconcentrations of placental growth factor: evidence for abnormal placental angiogenesis in pathologicpregnancies. Am J Obstet Gynecol 2003;188:177–182. [PubMed: 12548214]
33. Thadhani R, Mutter WP, Wolf M, Levine RJ, Taylor RN, Sukhatme VP, Ecker J, Karumanchi SA.First trimester placental growth factor and soluble fms-like tyrosine kinase 1 and risk forpreeclampsia. J Clin Endocrinol Metab 2004;89:770–775. [PubMed: 14764795]
34. Krauss T, Pauer HU, Augustin HG. Prospective analysis of placenta growth factor (PlGF)concentrations in the plasma of women with normal pregnancy and pregnancies complicated bypreeclampsia. Hypertens Pregnancy 2004;23:101–111. [PubMed: 15117604]
35. Levine RJ, Thadhani R, Qian C, Lam C, Lim KH, Yu KF, Blink AL, Sachs BP, Epstein FH, SibaiBM, et al. Urinary placental growth factor and risk of preeclampsia. JAMA 2005;293:77–85.[PubMed: 15632339]
36. Parra M, Rodrigo R, Barja P, Bosco C, Fernandez V, Munoz H, Soto-Chacon E. Screening test forpreeclampsia through assessment of uteroplacental blood flow and biochemical markers of oxidativestress and endothelial dysfunction. Am J Obstet Gynecol 2005;193:1486–1491. [PubMed: 16202744]
37. Barbara NP, Wrana JL, Letarte M. Endoglin is an accessory protein that interacts with the signalingreceptor complex of multiple members of the transforming growth factor-beta superfamily. J BiolChem 1999;274:584–594. [PubMed: 9872992]
38. Lastres P, Letamendia A, Zhang H, Rius C, Almendro N, Raab U, Lopez LA, Langa C, Fabra A,Letarte M, et al. Endoglin modulates cellular responses to TGF-beta 1. J Cell Biol 1996;133:1109–1121. [PubMed: 8655583]
39. Letamendia A, Lastres P, Botella LM, Raab U, Langa C, Velasco B, Attisano L, Bernabeu C. Roleof endoglin in cellular responses to transforming growth factor-beta. A comparative study withbetaglycan. J Biol Chem 1998;273:33011–33019. [PubMed: 9830054]
40. Goumans MJ, Valdimarsdottir G, Itoh S, Rosendahl A, Sideras P, ten Dijke P. Balancing the activationstate of the endothelium via two distinct TGF-beta type I receptors. EMBO J 2002;21:1743–1753.[PubMed: 11927558]
41. Fonsatti E, Del Vecchio L, Altomonte M, Sigalotti L, Nicotra MR, Coral S, Natali PG, Maio M.Endoglin: An accessory component of the TGF-beta-binding receptor-complex with diagnostic,prognostic, and bioimmunotherapeutic potential in human malignancies. J Cell Physiol 2001;188:1–7. [PubMed: 11382917]
42. Gonzalez RP, Gomez RM, Castro RS, Nien JK, Merino PO, Etchegaray AB, Carstens MR, MedinaLH, Viviani PG, Rojas IT. A national birth weight distribution curve according to gestational age inchile from 1993 to 2000. Rev Med Chil 2004;132:1155–1165. [PubMed: 15631202]
43. Verbeke G, Molenberghs G. Linear Mixed Models for Longitudinal Data. 200044. Sen A, Srivastava M. Unequal variances 1990;First:111–131.45. Huber PJ. The behavior of maximum likelihood estimates under nonstandard conditions 1967;1:221–
223.46. White H. Maximum likelihood estimation of misspecified models. Econometrica 1982;50:1–25.47. Liang KY, Zeger SL. Longitudinal Data Analysis using Generalized Linear Models. Biometrika
1986;73:13–22.48. Carroll, RJ.; Wang, S.; Simpson, DG.; Stromberg, AJ.; Ruppert, D. The sandwich (robust covariance
matrix) estimator; 1998. p. 1-16.http://www.stat.tamu.edu/ftp/pub/rjcarroll/sandwich.pdf49. Efron B, Tibshirani R. An Introduction to the Bootstrap. 200350. Wulff C, Wilson H, Dickson SE, Wiegand SJ, Fraser HM. Hemochorial placentation in the primate:
expression of vascular endothelial growth factor, angiopoietins, and their receptors throughoutpregnancy. Biol Reprod 2002;66:802–812. [PubMed: 11870089]
Romero et al. Page 15
J Matern Fetal Neonatal Med. Author manuscript; available in PMC 2008 November 25.
NIH
-PA Author Manuscript
NIH
-PA Author Manuscript
NIH
-PA Author Manuscript

51. Carmeliet P. Mechanisms of angiogenesis and arteriogenesis. Nat Med 2000;6:389–395. [PubMed:10742145]
52. Yancopoulos GD, Davis S, Gale NW, Rudge JS, Wiegand SJ, Holash J. Vascular-specific growthfactors and blood vessel formation. Nature 2000;407:242–248. [PubMed: 11001067]
53. Mayhew TM. Fetoplacental angiogenesis during gestation is biphasic, longitudinal and occurs byproliferation and remodelling of vascular endothelial cells. Placenta 2002;23:742–750. [PubMed:12398814]
54. Gale NW, Yancopoulos GD. Growth factors acting via endothelial cell-specific receptor tyrosinekinases: VEGFs, angiopoietins, and ephrins in vascular development. Genes Dev 1999;13:1055–1066. [PubMed: 10323857]
55. Matsumoto T, Claesson-Welsh L. VEGF receptor signal transduction. Sci STKE 2001;2001:RE21.[PubMed: 11741095]
56. Ferrara N, Gerber HP, LeCouter J. The biology of VEGF and its receptors. Nat Med 2003;9:669–676. [PubMed: 12778165]
57. Ferrara N. Vascular endothelial growth factor: basic science and clinical progress. Endocr Rev2004;25:581–611. [PubMed: 15294883]
58. Clark DE, Smith SK, He Y, Day KA, Licence DR, Corps AN, Lammoglia R, Charnock-Jones DS.A vascular endothelial growth factor antagonist is produced by the human placenta and released intothe maternal circulation. Biol Reprod 1998;59:1540–1548. [PubMed: 9828203]
59. Barleon B, Reusch P, Totzke F, Herzog C, Keck C, Martiny-Baron G, Marme D. Soluble VEGFR-1secreted by endothelial cells and monocytes is present in human serum and plasma from healthydonors. Angiogenesis 2001;4:143–154. [PubMed: 11806246]
60. Luttun A, Carmeliet P. Soluble VEGF receptor Flt1: the elusive preeclampsia factor discovered? JClin Invest 2003;111:600–602. [PubMed: 12618513]
61. Autiero M, Luttun A, Tjwa M, Carmeliet P. Placental growth factor and its receptor, vascularendothelial growth factor receptor-1: novel targets for stimulation of ischemic tissuerevascularization and inhibition of angiogenic and inflammatory disorders. J Thromb Haemost2003;1:1356–1370. [PubMed: 12871269]
62. Autiero M, Waltenberger J, Communi D, Kranz A, Moons L, Lambrechts D, Kroll J, Plaisance S, DeMol M, Bono F, et al. Role of PlGF in the intra- and intermolecular cross talk between the VEGFreceptors Flt1 and Flk1. Nat Med 2003;9:936–943. [PubMed: 12796773]
63. Beck H, Acker T, Puschel AW, Fujisawa H, Carmeliet P, Plate KH. Cell type-specific expression ofneuropilins in an MCA-occlusion model in mice suggests a potential role in post-ischemic brainremodeling. J Neuropathol Exp Neurol 2002;61:339–350. [PubMed: 11939589]
64. Iyer S, Acharya KR. Role of placenta growth factor in cardiovascular health. Trends Cardiovasc Med2002;12:128–134. [PubMed: 12007738]
65. Luttun A, Tjwa M, Moons L, Wu Y, Angelillo-Scherrer A, Liao F, Nagy JA, Hooper A, Priller J, DeKlerck B, et al. Revascularization of ischemic tissues by PlGF treatment, and inhibition of tumorangiogenesis, arthritis and atherosclerosis by anti-Flt1. Nat Med 2002;8:831–840. [PubMed:12091877]
66. Shore VH, Wang TH, Wang CL, Torry RJ, Caudle MR, Torry DS. Vascular endothelial growth factor,placenta growth factor and their receptors in isolated human trophoblast. Placenta 1997;18:657–665.[PubMed: 9364601]
67. Nagamatsu T, Fujii T, Kusumi M, Zou L, Yamashita T, Osuga Y, Momoeda M, Kozuma S, TaketaniY. Cytotrophoblasts up-regulate soluble fms-like tyrosine kinase-1 expression under reduced oxygen:an implication for the placental vascular development and the pathophysiology of preeclampsia.Endocrinology 2004;145:4838–4845. [PubMed: 15284201]
68. Gougos A, Letarte M. Identification of a human endothelial cell antigen with monoclonal antibody44G4 produced against a pre-B leukemic cell line. J Immunol 1988;141:1925–1933. [PubMed:3262644]
69. Lastres P, Bellon T, Cabanas C, Sanchez-Madrid F, Acevedo A, Gougos A, Letarte M, Bernabeu C.Regulated expression on human macrophages of endoglin, an Arg-Gly-Asp-containing surfaceantigen. Eur J Immunol 1992;22:393–397. [PubMed: 1537377]
Romero et al. Page 16
J Matern Fetal Neonatal Med. Author manuscript; available in PMC 2008 November 25.
NIH
-PA Author Manuscript
NIH
-PA Author Manuscript
NIH
-PA Author Manuscript

70. O'Connell PJ, McKenzie A, Fisicaro N, Rockman SP, Pearse MJ, d'Apice AJ. Endoglin: a 180-kDendothelial cell and macrophage restricted differentiation molecule. Clin Exp Immunol 1992;90:154–159. [PubMed: 1395096]
71. Buhring HJ, Muller CA, Letarte M, Gougos A, Saalmuller A, van Agthoven AJ, Busch FW. Endoglinis expressed on a subpopulation of immature erythroid cells of normal human bone marrow.Leukemia 1991;5:841–847. [PubMed: 1961019]
72. Gougos A, St Jacques S, Greaves A, O'Connell PJ, d'Apice AJ, Buhring HJ, Bernabeu C, van MourikJA, Letarte M. Identification of distinct epitopes of endoglin, an RGD-containing glycoprotein ofendothelial cells, leukemic cells, and syncytiotrophoblasts. Int Immunol 1992;4:83–92. [PubMed:1371694]
73. St Jacques S, Cymerman U, Pece N, Letarte M. Molecular characterization and in situ localizationof murine endoglin reveal that it is a transforming growth factor-beta binding protein of endothelialand stromal cells. Endocrinology 1994;134:2645–2657. [PubMed: 8194490]
74. Rokhlin OW, Cohen MB, Kubagawa H, Letarte M, Cooper MD. Differential expression of endoglinon fetal and adult hematopoietic cells in human bone marrow. J Immunol 1995;154:4456–4465.[PubMed: 7722302]
75. Calabro L, Fonsatti E, Bellomo G, Alonci A, Colizzi F, Sigalotti L, Altomonte M, Musolino C, MaioM. Differential levels of soluble endoglin (CD105) in myeloid malignancies. J Cell Physiol2003;194:171–175. [PubMed: 12494455]
76. Diggle P, Heagerty P, Liang KY, Zeger SL. Introduction 2002;Second:1–21.77. Pahwa, P.; Blair, T. Statistical Model for the Analysis of Longitudinal Data; 2002. p.
1-4.http://www.cacr.ca/news/2002/0204pahwa.htm78. Diggle P, Heagerty P, Liang KY, Zeger SL. Missing Values in Longitudinal Data 2002;Second:282–
318.79. Espinoza J, Chaiworapongsa T, Romero R, Kim YM, Kim GJ, Nien JK, Kusanovic JP, Erez O, Bujold
E, Goncalves LF, et al. Unexplained fetal death: Another anti-angiogenic state. J Matern FetalNeonatal Med 2007;20:495–507. [PubMed: 17674262]
80. Espinoza J, Romero R, Nien JK, Kusanovic JP, Richani K, Gomez R, Kim CJ, Mittal P,Chaiworapongsa T, Hassan S. A role for the anti-angiogenic factor sVEGFR-1 in the “mirrorsyndrome” (Ballantyne's syndrome). J Matern Fetal Neonatal Med 2006;19:607–613. [PubMed:17118734]
81. Bersinger NA, Odegard RA. Second- and third-trimester serum levels of placental proteins inpreeclampsia and small-for-gestational age pregnancies. Acta Obstet Gynecol Scand 2004;83:37–45. [PubMed: 14678084]
82. Crispi F, Dominguez C, Llurba E, Martin-Gallan P, Cabero L, Gratacos E. Placental angiogenicgrowth factors and uterine artery Doppler findings for characterization of different subsets inpreeclampsia and in isolated intrauterine growth restriction. Am J Obstet Gynecol 2006;195:201–207. [PubMed: 16545329]
83. Signore C, Mills JL, Qian C, Yu K, Lam C, Epstein FH, Karumanchi SA, Levine RJ. Circulatingangiogenic factors and placental abruption. Obstet Gynecol 2006;108:338–344. [PubMed:16880304]
84. Espinoza J, Nien JK, Kusanovic JP, Richani K, Gomez R, Kim CJ, Mittal P, Chaiworapongsa T,Romero R. A role of the anti-angiogenic factor sVEGFR-1 in the ‘mirror syndrome’ (Ballantyne'ssyndrome). Am J Obstet Gynecol 2005;193:S134.
85. Rana S, Venkatesha S, DePaepe M, Chien EK, Paglia M, Karumanchi SA. Cytomegalovirus-inducedmirror syndrome associated with elevated levels of circulating antiangiogenic factors. Obstet Gynecol2007;109:549–552. [PubMed: 17267891]
86. Stepan H, Faber R. Elevated sFlt1 level and preeclampsia with parvovirus-induced hydrops. N EnglJ Med 2006;354:1857–1858. [PubMed: 16641410]
Romero et al. Page 17
J Matern Fetal Neonatal Med. Author manuscript; available in PMC 2008 November 25.
NIH
-PA Author Manuscript
NIH
-PA Author Manuscript
NIH
-PA Author Manuscript

Figure 1.Maternal plasma concentration of soluble endoglin [log(1+s-Eng)] in normal pregnancies. Thesolid line represents the mean plasma concentration of s-Eng and the dotted lines the 95%confidence interval.
Romero et al. Page 18
J Matern Fetal Neonatal Med. Author manuscript; available in PMC 2008 November 25.
NIH
-PA Author Manuscript
NIH
-PA Author Manuscript
NIH
-PA Author Manuscript
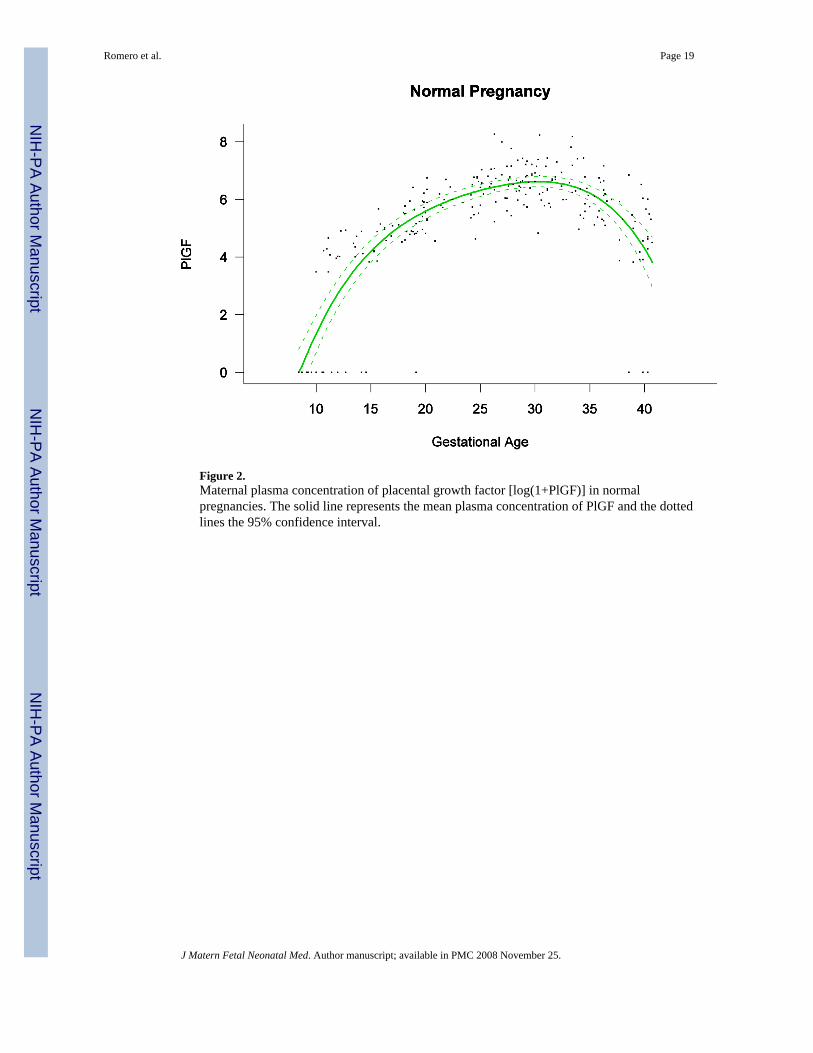
Figure 2.Maternal plasma concentration of placental growth factor [log(1+PlGF)] in normalpregnancies. The solid line represents the mean plasma concentration of PlGF and the dottedlines the 95% confidence interval.
Romero et al. Page 19
J Matern Fetal Neonatal Med. Author manuscript; available in PMC 2008 November 25.
NIH
-PA Author Manuscript
NIH
-PA Author Manuscript
NIH
-PA Author Manuscript
Figure 3.Maternal plasma concentration of soluble vascular endothelial growth factor receptor-1 [log(1+sVEGFR-1)] in normal pregnancies. The solid line represents the mean plasma concentrationof sVEGFR-1 and the dotted lines the 95% confidence interval.
Romero et al. Page 20
J Matern Fetal Neonatal Med. Author manuscript; available in PMC 2008 November 25.
NIH
-PA Author Manuscript
NIH
-PA Author Manuscript
NIH
-PA Author Manuscript

Figure 4.Forward analysis of the maternal plasma concentration of endoglin soluable (s-Eng) in patientswith normal pregnancies and those with pregnancy complications. Patients who delivered anSGA neonate had a significantly higher plasma concentration of s-Eng from ten weeks ofgestation onwards than controls (p<0.0001). The increment in plasma s-Eng in patients destinedto develop preterm PE surpassed that of patients with normal pregnancies at 13 weeks andbecame significant at 23 weeks. In patients destined to develop PE at term, the maternal plasmaconcentration of s-Eng became significantly higher that that of normal patients at 30 weeks.
Romero et al. Page 21
J Matern Fetal Neonatal Med. Author manuscript; available in PMC 2008 November 25.
NIH
-PA Author Manuscript
NIH
-PA Author Manuscript
NIH
-PA Author Manuscript

Figure 5.Backward analysis of the maternal plasma concentration of soluble endoglin (s-Eng) in patientswith normal pregnancies and those with pregnancy complications. Patients destined to deliveran SGA neonate had a significantly higher plasma s-Eng concentration than controls up to 30weeks before delivery.
Romero et al. Page 22
J Matern Fetal Neonatal Med. Author manuscript; available in PMC 2008 November 25.
NIH
-PA Author Manuscript
NIH
-PA Author Manuscript
NIH
-PA Author Manuscript

Figure 6.Forward analysis of the maternal plasma concentration of placental growth factor (PlGF) inpatients with normal pregnancies and those with pregnancy complications. Patients destinedto develop PE (term or preterm) and those who delivered an SGA neonate had lower plasmaconcentration of PlGF throughout gestation than controls. These differences were statisticallysignificant at ten weeks of gestation for SGA and term PE and at 11 weeks for preterm PE.
Romero et al. Page 23
J Matern Fetal Neonatal Med. Author manuscript; available in PMC 2008 November 25.
NIH
-PA Author Manuscript
NIH
-PA Author Manuscript
NIH
-PA Author Manuscript
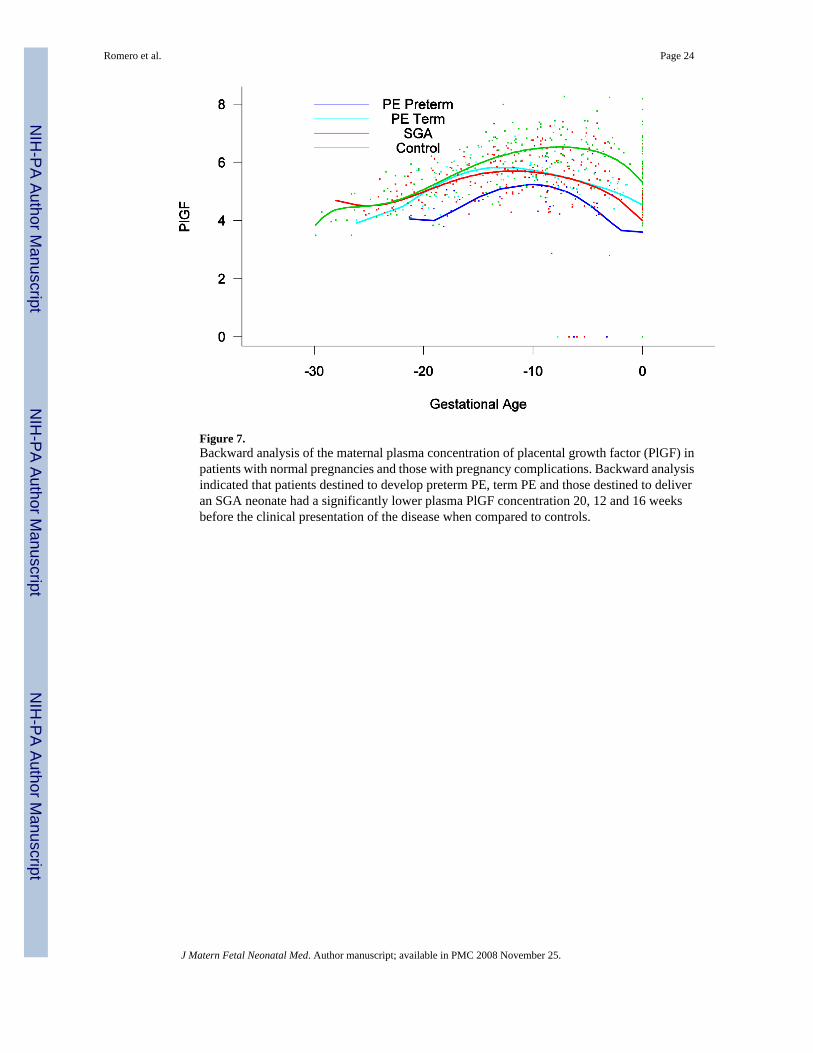
Figure 7.Backward analysis of the maternal plasma concentration of placental growth factor (PlGF) inpatients with normal pregnancies and those with pregnancy complications. Backward analysisindicated that patients destined to develop preterm PE, term PE and those destined to deliveran SGA neonate had a significantly lower plasma PlGF concentration 20, 12 and 16 weeksbefore the clinical presentation of the disease when compared to controls.
Romero et al. Page 24
J Matern Fetal Neonatal Med. Author manuscript; available in PMC 2008 November 25.
NIH
-PA Author Manuscript
NIH
-PA Author Manuscript
NIH
-PA Author Manuscript

Figure 8.Forward analysis of the maternal plasma concentration of soluable vascular endothelial growthfactor receptor-1 (sVEGFR-1) in patients with normal pregnancies and those with pregnancycomplications. Patients destined to develop preterm term and term PE had a significantly higherplasma concentrations of sVEGFR-1 at 26 and 29 weeks of gestation, respectively, thancontrols. However, there was no difference in the increment of sVEGFR-1 between controlpatients and those who delivered an SGA neonate.
Romero et al. Page 25
J Matern Fetal Neonatal Med. Author manuscript; available in PMC 2008 November 25.
NIH
-PA Author Manuscript
NIH
-PA Author Manuscript
NIH
-PA Author Manuscript

Figure 9.Backward analysis of the maternal plasma concentration of sVEGFR-1 in patients with normalpregnancies and those with pregnancy complications. Patients who developed preterm andterm PE had a significantly higher plasma sVEGFR-1 concentration 7 and 11 weeks before theclinical diagnosis of the disease.
Romero et al. Page 26
J Matern Fetal Neonatal Med. Author manuscript; available in PMC 2008 November 25.
NIH
-PA Author Manuscript
NIH
-PA Author Manuscript
NIH
-PA Author Manuscript

Figure 10.Mean and 95% confidence interval of the maternal plasma concentration of each analyte [log(1+analyte)] in patients who developed PE (term and preterm) as well as those who deliveredan SGA neonate. The mean analyte concentration of the normal pregnancy group (solid greenline) was added to each plot for comparison.
Romero et al. Page 27
J Matern Fetal Neonatal Med. Author manuscript; available in PMC 2008 November 25.
NIH
-PA Author Manuscript
NIH
-PA Author Manuscript
NIH
-PA Author Manuscript

NIH
-PA Author Manuscript
NIH
-PA Author Manuscript
NIH
-PA Author Manuscript
Romero et al. Page 28Ta
ble
ID
emog
raph
ic a
nd c
linic
al c
hara
cter
istic
s of t
he st
udy
grou
ps (N
=144
)
Nor
mal
Pre
gnan
cies
(n=4
6)SG
A (n
=56)
p1PE
at <
37 w
eeks
(n=1
6)p2
PE a
t ≥ 3
7 w
eeks
(n=2
6)p3
Mat
erna
l Age
(yea
rs)
30 (1
8-43
)25
(16-
41)
NS
27 (1
9-42
)N
S30
(18-
43)
0.02
Pre-
preg
nanc
y he
ight
(cm
)15
6 (1
40-1
66)
153
(143
-174
)N
S15
6 (1
48-1
68)
NS
156
(146
-170
)N
SPr
e-pr
egna
ncy
wei
ght (
kg)
58 (4
2-82
)57
(41-
87)
NS
61 (4
9-11
0)N
S59
(42-
92)
NS
BM
I23
.9 (1
8.3-
32)
23.9
(17.
1-38
.2)
NS
24.1
(19.
9-41
.9)
NS
23.2
(18.
2-32
.9)
NS
Nul
lipar
ity (%
)26
.1 (1
2/46
)53
.6 (3
0/56
)0.
009
68.8
(11/
16)
0.00
665
.4 (1
7/26
)0.
003
GA
at e
nrol
lmen
t12
(8-1
5)12
(6-1
5)N
S12
(8-1
5)N
S12
(8-1
5)N
SG
A a
t del
iver
y40
(37-
43)
39 (3
5-42
)N
S34
(30-
36)
<0.0
0138
(38-
42)
<0.0
01Sm
oker
22.7
(10/
44)
14.3
(8/5
6)N
S0/
16N
S3.
8 (1
/26)
0.04
Birt
h w
eigh
t33
75 (2
650-
4390
)25
40 (1
420-
2850
)<0
.001
1755
(107
0-36
00)
<0.0
0131
60 (2
280-
4280
)0.
01D
eliv
ery
< 37
wee
ks0/
4610
.7 (6
/56)
0.03
100
(16/
16)
<0.0
010/
26-
SGA
neo
nate
0/46
100
(56/
56)
<0.0
0162
.5 (1
0/16
)<0
.001
26.9
(7/2
6)<0
.001
SGA
, sm
all f
or g
esta
tiona
l age
; PE,
pre
ecla
mps
ia; B
MI,
body
mas
s ind
ex; G
A, g
esta
tiona
l age
; NS,
not
sign
fican
t. D
ata e
xpre
ssed
as m
edia
n (r
ange
) and
per
cent
age (
prop
ortio
n). p
1 : co
mpa
rison
bet
wee
n
norm
al p
regn
anci
es a
nd S
GA
; p2 :
com
paris
on b
etw
een
norm
al p
regn
anci
es a
nd p
rete
rm P
E; a
nd p
3 : c
ompa
rison
bet
wee
n no
rmal
pre
gnan
cies
and
term
PE.
NS:
not
sign
ifica
nt
J Matern Fetal Neonatal Med. Author manuscript; available in PMC 2008 November 25.
NIH
-PA Author Manuscript
NIH
-PA Author Manuscript
NIH
-PA Author Manuscript
Romero et al. Page 29
Table IIMaternal plasma placental growth factor (PlGF) elevation time
Diagnostic groups Maternal Plasma PlGF elevation time (weeks) P*
Normal pregnancy 8.50±0.5 -Preterm PE 9.43±1.09 NS
Term PE 10.73±0.42 0.0182SGA 9.75±0.42 NS
PIGF, placental growth factor; PE, preeclampsia; SGA, small for gestational age; NS not significant
*Compared with normal pregnancy
J Matern Fetal Neonatal Med. Author manuscript; available in PMC 2008 November 25.

NIH
-PA Author Manuscript
NIH
-PA Author Manuscript
NIH
-PA Author Manuscript
Romero et al. Page 30
Table IIIMaternal plasma placental growth factor (PlGF)/soluble endoglin (s-Eng) ratio elevation time
Diagnostic groups Maternal Plasma PlGF/s-eng ratio elevation time(weeks)
P*
Normal pregnancy 8.50±0.70 -Preterm PE 10.49±1.03 NS
Term PE 11.14±0.40 0.0256SGA 10.24±0.41 0.0303
PIGF, placental growth factor; s-Eng, soluble endoglin; PE, preeclampsia; SGA, small for gestational age; NS, not significant
*Compared with normal pregnancy
J Matern Fetal Neonatal Med. Author manuscript; available in PMC 2008 November 25.
Copyright © 2022 FDOKUMEN