A hidden reservoir of integrative elements is the major source of recently acquired foreign genes...
13
Genome Biology 2009, 10:R65 Open Access 2009 Cortez et al. Volume 10, Issue 6, Article R65 Research A hidden reservoir of integrative elements is the major source of recently acquired foreign genes and ORFans in archaeal and bacterial genomes Diego Cortez, Patrick Forterre and Simonetta Gribaldo Address: Institut Pasteur, Département de Microbiologie, Unité de Biologie Moléculaire du Gène chez les Extrêmophiles, Rue du Dr Roux, 75 724 PARIS cedex 15, France. Correspondence: Patrick Forterre. Email: [email protected]. Simonetta Gribaldo. Email: [email protected] © 2009 Cortez et al.; licensee BioMed Central Ltd. This is an open access article distributed under the terms of the Creative Commons Attribution License (http://creativecommons.org/licenses/by/2.0), which permits unrestricted use, distribution, and reproduction in any medium, provided the original work is properly cited. Integrative elements and new genes <p>A large-scale survey of potential recently acquired integrative elements in 119 archaeal and bacterial genomes reveals that many recently acquired genes have originated from integrative elements</p> Abstract Background: Archaeal and bacterial genomes contain a number of genes of foreign origin that arose from recent horizontal gene transfer, but the role of integrative elements (IEs), such as viruses, plasmids, and transposable elements, in this process has not been extensively quantified. Moreover, it is not known whether IEs play an important role in the origin of ORFans (open reading frames without matches in current sequence databases), whose proportion remains stable despite the growing number of complete sequenced genomes. Results: We have performed a large-scale survey of potential recently acquired IEs in 119 archaeal and bacterial genomes. We developed an accurate in silico Markov model-based strategy to identify clusters of genes that show atypical sequence composition (clusters of atypical genes or CAGs) and are thus likely to be recently integrated foreign elements, including IEs. Our method identified a high number of new CAGs. Probabilistic analysis of gene content indicates that 56% of these new CAGs are likely IEs, whereas only 7% likely originated via horizontal gene transfer from distant cellular sources. Thirty-four percent of CAGs remain unassigned, what may reflect a still poor sampling of IEs associated with bacterial and archaeal diversity. Moreover, our study contributes to the issue of the origin of ORFans, because 39% of these are found inside CAGs, many of which likely represent recently acquired IEs. Conclusions: Our results strongly indicate that archaeal and bacterial genomes contain an impressive proportion of recently acquired foreign genes (including ORFans) coming from a still largely unexplored reservoir of IEs. Background Integrative elements (IEs) such as viruses and plasmids and their associated hitchhiking elements, transposons, inte- grons, and so on, mediate the movement of DNA within genomes and between genomes, and play a key role in the emergence of infectious diseases, antibiotic resistance, biotransformation of xenobiotics, and so on [1-3]. Traces of IE activity have been highlighted in many prokaryotic genomes, which carry different repertoires of inserted prophages, plasmids, transposons and/or genomic islands Published: 16 June 2009 Genome Biology 2009, 10:R65 (doi:10.1186/gb-2009-10-6-r65) Received: 25 March 2009 Revised: 4 June 2009 Accepted: 16 June 2009 The electronic version of this article is the complete one and can be found online at http://genomebiology.com/2009/10/6/R65
-
Upload
independent -
Category
Documents
-
view
3 -
download
0
Transcript of A hidden reservoir of integrative elements is the major source of recently acquired foreign genes...

Open Access2009Cortezet al.Volume 10, Issue 6, Article R65ResearchA hidden reservoir of integrative elements is the major source of recently acquired foreign genes and ORFans in archaeal and bacterial genomesDiego Cortez, Patrick Forterre and Simonetta Gribaldo
Address: Institut Pasteur, Département de Microbiologie, Unité de Biologie Moléculaire du Gène chez les Extrêmophiles, Rue du Dr Roux, 75 724 PARIS cedex 15, France.
Correspondence: Patrick Forterre. Email: [email protected]. Simonetta Gribaldo. Email: [email protected]
© 2009 Cortez et al.; licensee BioMed Central Ltd. This is an open access article distributed under the terms of the Creative Commons Attribution License (http://creativecommons.org/licenses/by/2.0), which permits unrestricted use, distribution, and reproduction in any medium, provided the original work is properly cited.Integrative elements and new genes<p>A large-scale survey of potential recently acquired integrative elements in 119 archaeal and bacterial genomes reveals that many recently acquired genes have originated from integrative elements</p>
Abstract
Background: Archaeal and bacterial genomes contain a number of genes of foreign origin thatarose from recent horizontal gene transfer, but the role of integrative elements (IEs), such asviruses, plasmids, and transposable elements, in this process has not been extensively quantified.Moreover, it is not known whether IEs play an important role in the origin of ORFans (open readingframes without matches in current sequence databases), whose proportion remains stable despitethe growing number of complete sequenced genomes.
Results: We have performed a large-scale survey of potential recently acquired IEs in 119 archaealand bacterial genomes. We developed an accurate in silico Markov model-based strategy to identifyclusters of genes that show atypical sequence composition (clusters of atypical genes or CAGs) andare thus likely to be recently integrated foreign elements, including IEs. Our method identified ahigh number of new CAGs. Probabilistic analysis of gene content indicates that 56% of these newCAGs are likely IEs, whereas only 7% likely originated via horizontal gene transfer from distantcellular sources. Thirty-four percent of CAGs remain unassigned, what may reflect a still poorsampling of IEs associated with bacterial and archaeal diversity. Moreover, our study contributes tothe issue of the origin of ORFans, because 39% of these are found inside CAGs, many of whichlikely represent recently acquired IEs.
Conclusions: Our results strongly indicate that archaeal and bacterial genomes contain animpressive proportion of recently acquired foreign genes (including ORFans) coming from a stilllargely unexplored reservoir of IEs.
BackgroundIntegrative elements (IEs) such as viruses and plasmids andtheir associated hitchhiking elements, transposons, inte-grons, and so on, mediate the movement of DNA withingenomes and between genomes, and play a key role in the
emergence of infectious diseases, antibiotic resistance,biotransformation of xenobiotics, and so on [1-3]. Traces ofIE activity have been highlighted in many prokaryoticgenomes, which carry different repertoires of insertedprophages, plasmids, transposons and/or genomic islands
Published: 16 June 2009
Genome Biology 2009, 10:R65 (doi:10.1186/gb-2009-10-6-r65)
Received: 25 March 2009Revised: 4 June 2009Accepted: 16 June 2009
The electronic version of this article is the complete one and can be found online at http://genomebiology.com/2009/10/6/R65
Genome Biology 2009, 10:R65

http://genomebiology.com/2009/10/6/R65 Genome Biology 2009, Volume 10, Issue 6, Article R65 Cortez et al. R65.2
[4-7]. These few characterized IEs are most likely only areflection of a more diverse and still unknown IE universethat shapes bacterial and archaeal genomes [8].
The importance of IEs in the origin of ORFans (open readingframes (ORFs) without matches in current sequence data-bases) [9] is still controversial. Indeed, the source of ORFansremains a major mystery of the post-genomic era since, con-trary to previous expectations, their proportion remains sta-ble despite the increasing number of complete genomesequences available [10]. It has been suggested that ORFansare either misannotated genes, rapidly evolving sequences,newly formed genes, or genes recently transferred from notyet sequenced cellular or viral genomes [10,11]. The possibil-ity that ORFans originate from the integration of elements ofviral origin is appealing since viral genomes themselvesalways contain a high proportion of ORFans [12,13]. Consist-ent with this hypothesis, Daubin and Ochman [14] noticedthat ORFans from γ-Proteobacteria share several featureswith viral ORFans (for example, small size, AT-rich) and sug-gested that 'ORFans in the genomes of free-living microor-ganisms apparently derive from bacteriophages andoccasionally become established by assuming roles in key cel-lular functions.' However, Yin and Fisher [10] recentlyreported that, on average, only 2.8% of all cellular ORFanshave homologues in current viral sequence databases, raisingdoubts about the hypothesis of a viral origin of ORFans, andproposed that 'lateral transfer from viruses alone is unlikelyto explain the origin of the majority of ORFans in the majorityof prokaryotes and consequently, other, not necessarily exclu-sive, mechanisms are likely to better explain the origin of theincreasing number of ORFans.' More recently, the sameauthors found that only 18% of viral ORFans (ORFs presentin only one viral genome) have homologues in archaeal orbacterial genomes, and concluded that 'phage ORFans play alesser role in horizontal gene transfer to prokaryotes' [12].
Several in silico methods based on composition have beenconceived in the past few years to identify foreign genes thatwere recently acquired by cellular genomes, such as atypicalG+C content, atypical codon usage, Markov model (MM)-based approaches, and Bayesian model (BM)-basedapproaches [5,6,15-22]. MM approaches are based on one-order Markov chains to identify those ORFs that have a com-position different from genes that are likely native [15],whereas BM approaches identify those ORFs with under-rep-resented compositions with respect to the composition of thewhole genome (see [16] for details). Composition-basedmethods are based on the idea that foreign DNA fragmentsacquired either from distant cellular sources or from IEs canbe identified by the fact that they harbor atypical sequencesignatures with respect to the host genome. Indeed, genomicsignatures differ between distantly related organisms [23]and it has been shown that viruses and plasmids might keepa distinct dinucleotide signature with respect to that of theirhosts [24-26]. The accuracy of most of the compositional
methods designed to detect horizontally transferred geneshas not been validated statistically. Here, we have sought toquantify more precisely the role of IEs in the introduction offoreign genes in bacterial and archaeal genomes and in theorigin of ORFans. We have developed an accurate and statis-tically validated MM-based strategy to search 119 archaealand bacterial genomes for 'clusters of atypical genes' (CAGs),since these likely represent recently integrated foreign ele-ments, including IEs.
Results and discussionIdentification of atypical ORFsRecently, using in silico horizontal gene transfer (HGT) sim-ulations in the Escherichia coli K12 genome, we tested theperformances of different composition-based methods: atyp-ical G+C composition, atypical codon usage, MM approaches,and BM approaches [15]. Whereas the first two methods dis-played rather low performance, the MM and BM approacheswere able to detect artificially introduced foreign genes quiteaccurately [15]. Here, we have extended the MM approach bytaking advantage of the availability of a large number ofgenomes from closely related organisms. The general strategyis the following (Figure 1): for different groups of closelyrelated genomes, a dataset of conserved orthologues (hereaf-ter referred to as 'core genes') is extracted (Figure 1a); this isused to build for each genome a refined Markov probabilitymatrix that represents its genomic composition signature(Figure 1b); then, for a given genome, the MM model analyzeseach ORF by taking into account the Markov probabilitymatrix of the core genes dataset and the composition of theORF under study (Figure 1c); the MM model calculates foreach ORF an index that represents the likelihood of that ORFto have a composition similar to the core genes dataset (Fig-ure 1d); for each ORF, one million random sequences are gen-erated based on the Markov probability matrix of the coregene dataset, and their Markov indexes are calculated (Figure1e); finally, ORFs having a Markov index above a defined cut-off are considered as atypical (Figure 1f).
We selected 19 groups of closely related archaeal and bacte-rial genomes (for example, same genus or order, 119 genomesin total) representing a good sampling of prokaryotic diver-sity. To define 'core genes' datasets, best bi-directionalBLASTP searches were performed with the ORFs of eachgenome against those of the other members of the group. Allhits having a bit score higher than 30% of the bit score of theseed against itself were considered as orthologues [27]. Thecore genes datasets are essential for the MM to work properly.In fact, its ability to detect atypical ORFs depends entirely onthe probability matrix of the model. For instance, if very fewgenes are included in the core genes dataset, the matrix willbe small and this will increase the number of detected atypicalgenes artificially. On the other hand, a larger probabilitymatrix (an extreme case being a matrix built with all the genesof a genome) would reduce dramatically the model's detec-
Genome Biology 2009, 10:R65

http://genomebiology.com/2009/10/6/R65 Genome Biology 2009, Volume 10, Issue 6, Article R65 Cortez et al. R65.3
tion ability for atypical ORFs. Thus, it is essential to define foreach genome an optimal dataset of core genes to obtain thebest performance of the MM model. For each analyzedgenome, we created 11 datasets of core genes: all the genes inthe genome, orthologues present in 10% of the group'sgenomes, orthologues present in 20% of the group's genomes,and so on, up to orthologues present in 100% of the group'sgenomes. Then, for each genome, we built 11 MMs based onthese different core genes datasets (Figure 2a). We tested theefficiency of our MM approach, the BM approach, and a GC%approach to detect atypical ORFs by performing in silico HGTsimulations in all 119 archaeal and bacterial genomes (Figure2b; Materials and methods). We performed two types of HGTsimulations using all 11 different core genes datasets. In thefirst simulation we chose 100 ORFs from the other 118genomes (Figure 2c) and these were introduced in silico in thegenome under analysis. We then determined the number ofsimulated HGTs that were detected as atypical (true positives,expected to be high). In the second simulation, we chose 100random ORFs from a strict core genes dataset (that is, genesconserved in all genomes of the group, thus assumed to benative; Figure 2c) and we determined the average number ofthese that were detected as atypical (false positives, expectedto be low; Figure 2d; see Materials and methods). For bothsimulations, the results were analyzed by a one-tailed test
with different distribution cut-offs (0.l% to 5%). Then, weidentified the core genes dataset and the cut-off for which theaverage detection of simulated HGT (true positives) was thehighest but the average detection of native core genes (falsepositives) was the lowest (Figure 2e). These parametersallowed the definition of an optimal core genes dataset andcut-off for each genome analyzed (Table S1 in Additional datafile 1), which is thus independent of the evolutionary scale ofeach group of genomes analyzed. The HGT simulations werecarried out with the same random ORFs for the three models(MM, BM and GC% approaches). Although there were no sig-nificant differences between the MM and BM methods in thenumber of false positives, the MM method had a statisticallysignificantly higher rate of detection of true positives than theBM and the GC models (Figure 2f-h).
Identification of CAGsWe thus applied the MM method to detect ORFs with atypicalcomposition in the 19 groups of closely related archaeal andbacterial genomes, using the optimal genome-specific coregenes datasets and cut-offs. This led to the identification of58,487 ORFs of atypical composition in the 119 genomes(Table 1; Table S1 in Additional data file 1). As a control, ahigh fraction (85%) of the ORFs that localized within 275already annotated integrated elements were detected as atyp-
Markov model-based strategyFigure 1Markov model-based strategy. (a) An optimal core genes dataset is determined, and (b) a Markov probability matrix is built. (c) For a given genome, each ORF is analyzed using a Markov model that takes into account the Markov probability matrix of the core gene dataset and the composition of the ORF under study. (d) Fore each ORF the model calculates an index that represents the likelihood of that ORF having a composition similar to the core genes dataset. (e) One million random sequences are generated based on the Markov probability matrix of the core genes dataset, and their Markov indexes are calculated. (f) ORFs having a Markov index below a defined threshold of the distribution of random sequence indexes are considered as atypical.
0 1
0 1
0 1
Genome
1Genome
2
Genome
3
Genome
4
Genome
1
ORF1
ORF2
ORFn
...
aOptimal core
genes dataset for
genome 1
Pi1j1 … … … Pi1jn
… … … … …
… … … … …
Pinj1 … … … Pinjn
bMarkov probability matrix
e
Generation of one million
random sequences
Distribution of
Markov indexes from
random sequences
Pi1j1 … … … Pi1jn
… … … … …
… … … … …
Pinj1 … … … Pinjn
=
=
=
cORF’s
Markov index
0.46
0.95
0.24
d
Fre
qu
en
cy
Fre
qu
en
cy
Fre
qu
en
cy
defined cut off
for genome 1
defined cut off
for genome 1
defined cut off
for genome 1
0 MM index 1
0 MM index 1
0 MM index 1
Non-
atypical
Non-
atypical
AtypicalPi1j1 … … … Pi1jn
… … … … …
… … … … …
Pinj1 … … … Pinjn
Pi1j1 … … … Pi1jn
… … … … …
… … … … …
Pinj1 … … … Pinjn
=
=
=
Genome Biology 2009, 10:R65

http://genomebiology.com/2009/10/6/R65 Genome Biology 2009, Volume 10, Issue 6, Article R65 Cortez et al. R65.4
ical by our method, while only 56% of them were detected asatypical by the BM approach and 36% by the GC% approach(data not shown). This confirms that recently integrated for-eign elements harbor a sequence signature distinct from thatof their hosts that can be detected with appropriate method-ologies.
We then searched for atypical genes that cluster together,since these may be recently integrated foreign elements. Weused a sliding window of ten ORFs that moved along thegenome sequence [16,18], and every time seven or more ORFsin that window showed an atypical composition we defined acluster (that may thus also include non-atypical genes). Thisthreshold of seven genes was based on the distribution ofatypical versus non-atypical genes observed in annotated IEs.We applied this protocol to each of the 119 genomes and iden-tified a total of 2,377 CAGs (Table 1; Table S1 in Additionaldata file 1). The CAGs include as high as 13% of all ORFs ana-
lyzed (Table 1; Table S1 in Additional data file 1), indicatingthat the integration of foreign elements into archaeal and bac-terial genomes is very frequent. We verified whether ourmethod has a tendency to identify clusters of small atypicalORFs; however, ORFs included in CAGs have statistically thesame size distribution as core genes (Figure S1 in Additionaldata file 2).
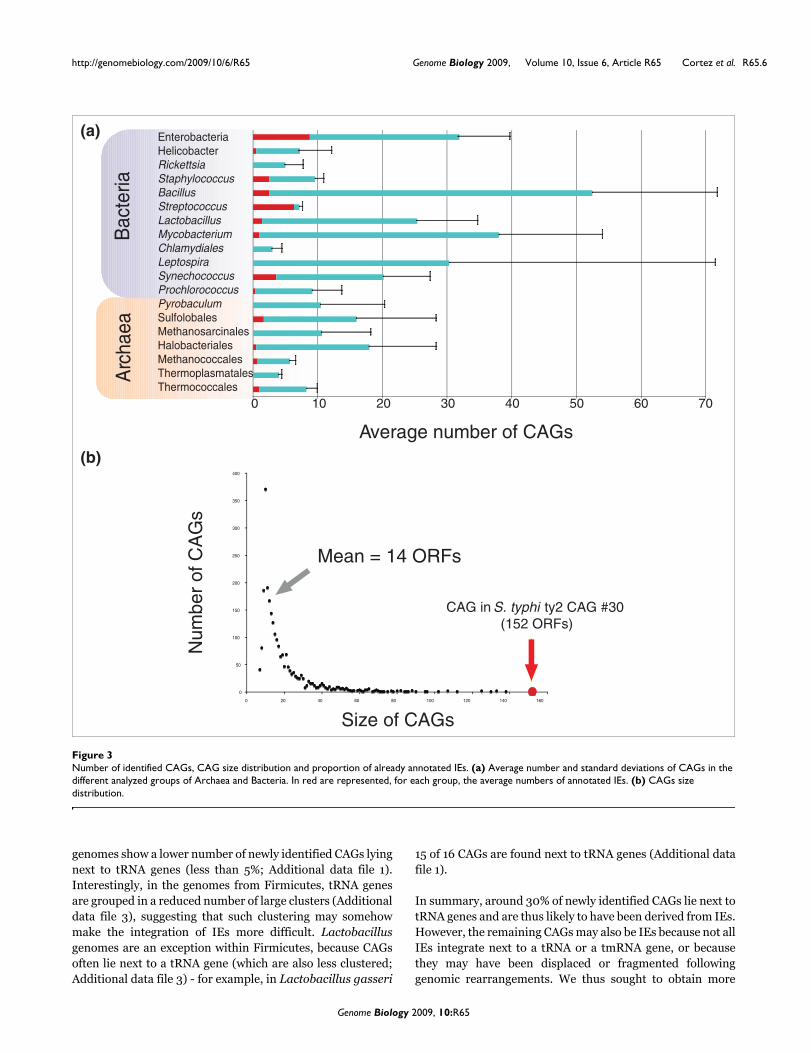
The number of CAGs varied greatly among and within groupsof genomes (Figure 3a), being, on average, between 10 and30, with a minimal number for Rickettsia and Chlamydia(that is, zero in Rickettsia typhi, Rickettsia prowazekii,Chlamydia abortus and Chlamydia felis) (Table S1 in Addi-tional data file 1). The size of CAGs (expressed as the numberof ORFs included) varied from seven (by definition) to severalhundreds (up to a 152 ORF CAG in the γ-proteobacterium Sal-monella typhi ty2; Figure 3b). Interestingly, archaealgenomes harbor, on average, half as many CAGs as Bacteria
HGT simulationsFigure 2HGT simulations. (a) Eleven core gene datasets for each analyzed genome were determined and, for each genome, 11 Markov models were built based on these different gene datasets. (b) The efficiency of our MM approach, the BM approach, and a GC% approach to detect foreign ORFs was tested by performing in silico HGT simulations using a variety of core gene datasets. (c) For the HTG simulations, 100 genes were chosen from the other 118 genomes and 100 random core ORFs were in silico introduced in the genome under analysis. (d) The average number of these ORFs that were detected as atypical (false positives, expected to be low) was determined. (e) After 100 simulations we searched for the core genes dataset and the cut-off where the average detection of simulated HGT was the highest but the average detection of native core genes was the lowest. (f-h) Average result after 100 HGT simulations for the 119 analyzed genomes using the MM, BM and GC% methods with species-specific core gene datasets and cut-offs. Blue dots represent the average number of true positives detected. Green dots represent the average number of false positives detected. The MM method had a significantly higher rate of detection of true positives than the BM method (Wilcoxon test W = 11,849, P-value < 2.2 e-16, means = 86.8 and 74.8 for the MM and BM methods, respectively; and Wilcoxon-test W = 13,824, P-value < 2.2 e-16, means = 86.8 and 52.6 for MM and GC%, methods, respectively). No significant differences were found between the MM and BM methods in the detection of false positives (Wilcoxon-test W = 8,359, P-value = 0.0311, means = 12.4 and 11.0 for the MM and BM methods, respectively).
0 1
Genome
1Genome
2
Genome
3Genome
4
Genome
1
Markov model
Bayesian model
GC% model
Fre
quency
Cut-offs: from
0.1% to 5%
a b
c
11 core gene datasets
d
1
MM index of
native gene xi
MM index of
foreign gene yi
0
Random genes from
118 genomes
and random core genes
100 simulations
Selection of
species-specific
core gene dataset
and cut-off
Bacteria Bacteria Bacteria
0
20
40
60
80
100
0
20
40
60
80
100
0
20
40
60
80
100
Archaea Archaea Archaea
Ave
rag
e n
um
be
r o
f g
en
es d
ete
cte
d a
s a
typ
ica
l
0
100
0
100
Ave
rag
e n
um
be
r o
f g
en
es d
ete
cte
d a
s a
typ
ica
l
0
100
Ave
rag
e n
um
be
r o
f g
en
es d
ete
cte
d a
s a
typ
ica
l
f Markov model test results Bayesian model test results GC% model test results g h
e
Genome Biology 2009, 10:R65
http://genomebiology.com/2009/10/6/R65 Genome Biology 2009, Volume 10, Issue 6, Article R65 Cortez et al. R65.5
(Additional data file 1), suggesting that Archaea are somehowless prone than Bacteria to the integration of foreign ele-ments. Nevertheless, some archaeal genomes exhibit a highnumber of CAGs, such as Haloquadratum walsbyi (32 CAGs)and Sulfolobus solfataricus (28 CAGs). In these two cases,the great majority of CAGs are concentrated within specificregions of the chromosome, near potential replication termi-nation areas, at 150° from OriC in H. walsbyi and between thesecond and the third origin of replication in S. solfataricus(two regions in H. walsbyi and one in S. solfataricus; Addi-tional data file 3). Moreover, small clusters of native genes(from 5 to 30 ORFs) separate these CAGs, suggesting thatchromosomal rearrangements may have fragmented a largerintegrated original element (Additional data file 3). Somebacterial groups also exhibited a very high number of CAGs.Mycobacterium, Lactobacillus, Bacillus and enterobacteriagenomes are good examples, because they all contain between30 and 100 CAGs (Additional data file 1).
As mentioned for H. walsby, we noticed an enrichment ofCAGs in particular chromosomal regions, which are sepa-rated by small clusters of native genes (Additional data file 3).Furthermore, the frequency of CAGs in archaeal and bacterialgenomes is inversely proportional to their size, indicating thatlarger CAGs are less frequent than smaller ones (Figure 3a).This suggests again that CAGs are quickly fragmented and/or
eroded following integration. Moreover, CAGs are enriched inpseudogenes, since they include 32% of all pseudogenes (ofthose annotated in bacterial genomes together with thoserecently identified in a large number of archaeal genomes[28]) (data not shown).
Origin of CAGsThe number of CAGs corresponding to already annotated IEsis larger in well-annotated genomes such as those fromenterobacteria and Streptococcus (Figure 3a, red), while forthe majority of other genomes the number of newly identifiedCAGs is high (Figure 3a, blue).
tRNA and tmRNA genes are well known integration points forIEs [29,30]. In archaeal and bacterial genomes, around 40%of already annotated IEs are found next to tRNA and tmRNAgenes (Additional data file 3). Moreover, a significant propor-tion of all newly identified CAGs (33.27%) also lies next to atRNA or tmRNA gene (Table S1 in Additional data file 1),strongly indicating that many of these may be recentlyacquired IEs. In some groups, the number of newly identifiedCAGs representing potential recently acquired IEs appearsparticularly important. For instance, in enterobacteria,Streptococcus, Prochlorococcus and Thermoplasmatales,between 40% and 50% of their CAGs lie next to tRNA genes.On the contrary, all groups of closely related Firmicutes
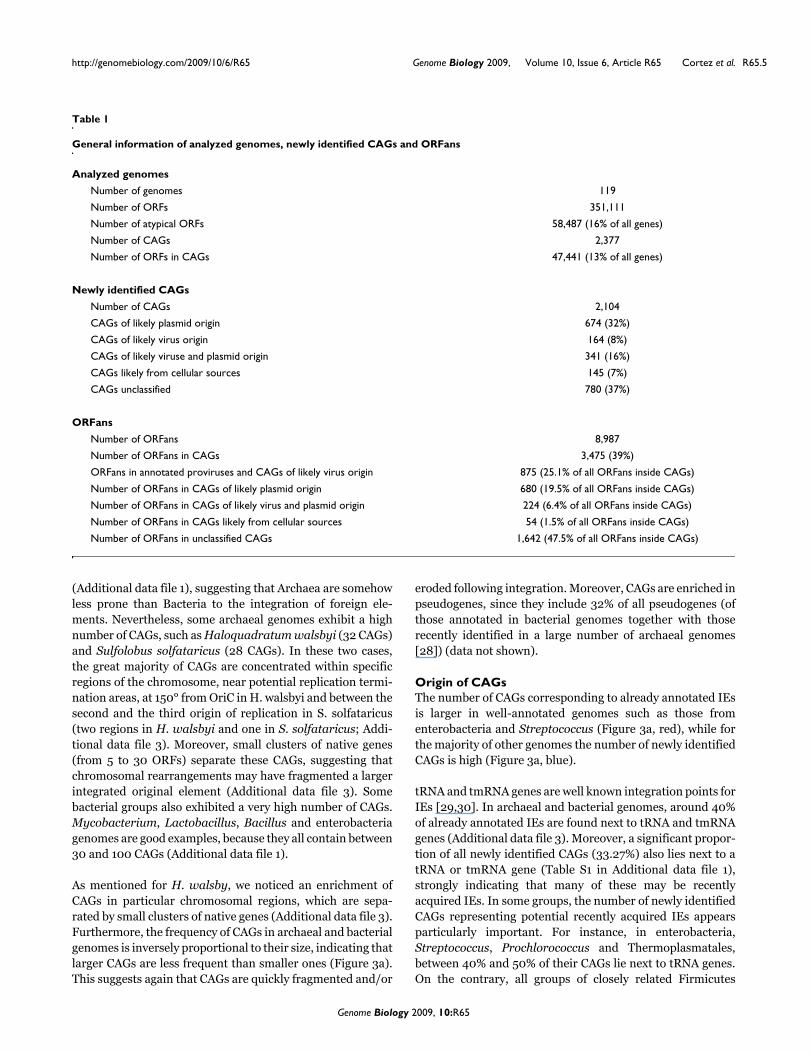
Table 1
General information of analyzed genomes, newly identified CAGs and ORFans
Analyzed genomes
Number of genomes 119
Number of ORFs 351,111
Number of atypical ORFs 58,487 (16% of all genes)
Number of CAGs 2,377
Number of ORFs in CAGs 47,441 (13% of all genes)
Newly identified CAGs
Number of CAGs 2,104
CAGs of likely plasmid origin 674 (32%)
CAGs of likely virus origin 164 (8%)
CAGs of likely viruse and plasmid origin 341 (16%)
CAGs likely from cellular sources 145 (7%)
CAGs unclassified 780 (37%)
ORFans
Number of ORFans 8,987
Number of ORFans in CAGs 3,475 (39%)
ORFans in annotated proviruses and CAGs of likely virus origin 875 (25.1% of all ORFans inside CAGs)
Number of ORFans in CAGs of likely plasmid origin 680 (19.5% of all ORFans inside CAGs)
Number of ORFans in CAGs of likely virus and plasmid origin 224 (6.4% of all ORFans inside CAGs)
Number of ORFans in CAGs likely from cellular sources 54 (1.5% of all ORFans inside CAGs)
Number of ORFans in unclassified CAGs 1,642 (47.5% of all ORFans inside CAGs)
Genome Biology 2009, 10:R65
http://genomebiology.com/2009/10/6/R65 Genome Biology 2009, Volume 10, Issue 6, Article R65 Cortez et al. R65.6
genomes show a lower number of newly identified CAGs lyingnext to tRNA genes (less than 5%; Additional data file 1).Interestingly, in the genomes from Firmicutes, tRNA genesare grouped in a reduced number of large clusters (Additionaldata file 3), suggesting that such clustering may somehowmake the integration of IEs more difficult. Lactobacillusgenomes are an exception within Firmicutes, because CAGsoften lie next to a tRNA gene (which are also less clustered;Additional data file 3) - for example, in Lactobacillus gasseri
15 of 16 CAGs are found next to tRNA genes (Additional datafile 1).
In summary, around 30% of newly identified CAGs lie next totRNA genes and are thus likely to have been derived from IEs.However, the remaining CAGs may also be IEs because not allIEs integrate next to a tRNA or a tmRNA gene, or becausethey may have been displaced or fragmented followinggenomic rearrangements. We thus sought to obtain more
Number of identified CAGs, CAG size distribution and proportion of already annotated IEsFigure 3Number of identified CAGs, CAG size distribution and proportion of already annotated IEs. (a) Average number and standard deviations of CAGs in the different analyzed groups of Archaea and Bacteria. In red are represented, for each group, the average numbers of annotated IEs. (b) CAGs size distribution.
Num
ber
of C
AG
s
0
50
100
150
200
250
300
350
400
0 20 40 60 80 100 120 140 160
Size of CAGs
Mean = 14 ORFs
CAG in S. typhi ty2 CAG #30
(152 ORFs)
(b)
Bacte
ria
Arc
haea
(a)
Average number of CAGs
0 10 20 30 40 50 60 70
Enterobacteria
Helicobacter
Rickettsia
Staphylococcus
Bacillus
Streptococcus
Lactobacillus
Mycobacterium
Chlamydiales
Leptospira
Synechococcus
Prochlorococcus
Pyrobaculum
Sulfolobales
Methanosarcinales
Halobacteriales
Methanococcales
Thermoplasmatales
Thermococcales
0 10 20 30 40 50 60 70
Genome Biology 2009, 10:R65

http://genomebiology.com/2009/10/6/R65 Genome Biology 2009, Volume 10, Issue 6, Article R65 Cortez et al. R65.7
information on the source of our newly identified CAGs byanalyzing their gene content. For this, we developed a proba-bilistic approach that would help us determine if a given CAGis of IE origin by looking at its gene content. This approach isbased on the calculation of the probability to have a certainnumber of homologues in a database of known IE sequences.Briefly, it calculates, using Monte Carlo simulations, the mostprobable source at 95% confidence intervals. Nevertheless,for this approach to work, IE sequences must represent a sep-arate gene pool from cellular sequences. Therefore, we firstcompared a local database containing all ORFs from anno-tated IEs (annotated IE database) with a local database con-taining all our species-specific core genes from all genomesanalyzed (core database), with the complete viral genomedatabase available at NCBI (as for January 2009; viral data-base) (Figure 4a, b), and with the complete plasmid genomedatabase at NCBI (as for January 2009; plasmid database)(see Materials and methods). As expected, annotated IEsshare a large number of homologues with the NCBI viral data-base (36.9%; Figure 4) and with other annotated IEs (55.2%;Figure 4), generally from closely related genomes (data notshown), indicating the existence of evolutionarily related IEs.Interestingly, the annotated IE database has in common onlya minor fraction of homologues with the core database (3.2%;Figure 4) and with the plasmid database (6.9%; Figure 4).Consistently, core genes share a rather low number of homo-logues with the viral database (1.2%; Figure 4) and with theplasmid database (11.1%; Figure 4). These results clearly indi-
cate that the pools of viral genes and plasmid genes are sepa-rated from the pool of core genes.
Given this clear distinction, we could apply our probabilisticapproach to distinguish the newly identified CAGs that arerelated to known viruses and plasmids (see Materials andmethods). Since annotated IEs are clearly related to viruses,we incorporated them into the viral database. We calculated95% confidence intervals able to assign a CAG as related toviral or plasmid sources. To do so, we artificially constructed1,000 clusters containing different numbers of ORFs (7 > n <152) and analyzed the presence of homologues in the viral andplasmid databases. Next, for each n we built a distribution ofprobabilities and defined 95% confidence intervals. CAGswere then assigned a given origin (viral or plasmid) if thenumber of homologues was above the 95% confidence inter-val corresponding to their size (see Materials and methods fordetails). As expected, 95% of annotated IEs were correctlyassigned as of viral origin (data not shown). For the newlyidentified CAGs, 21% were assigned as of plasmid origin (Fig-ure 5a, green), 8% as of viral origin (Figure 5a, red) and 4% asof plasmid/viral origin (CAGs with equal probabilities ofbeing of plasmid and viral origin; Figure 5a, yellow). Never-theless, the origin of an important proportion of newly iden-tified CAGs (67%) could not be assigned to either viral orplasmid sources by this approach. This may be due to the factthat these CAGs are related to viral or plasmid sources thatare not yet sequenced and thus not included in the viral andplasmid databases. In order to reduce this bias, we added totheir corresponding databases the ORFs from all newly iden-tified CAGs that were assigned to viral or plasmid origin, andwe performed a second round of analysis. All CAGs assignedto viral or plasmid origins were then added to their corre-sponding databases, and the analysis was repeated. At thefifth iteration, no more CAGs could be assigned. After thisnew analysis, aimed at correcting a bias in the original data-bases, the percentage of newly identified CAGs assigned toplasmid origin was raised to an average of 32% (Figure 5b,green; Table 1), while the percentage of CAGs assigned to viralorigin remained almost unchanged (8% on average; Figure5b, red and blue; Table 1). Interestingly, the number of CAGsof plasmid/viral origin increased to an average of 16% (Figure5b, yellow; Table 1; see, for example, enterobacteria and Sul-folobales). These results indicate that the majority of newCAGs correspond to large IE families of both plasmid andviral origin.
After this database correction, not only just a few specificgroups, but many archaeal and bacterial genome groups wereshown to harbor high proportions of newly identified CAGsassigned to either plasmid, viral, or plasmid/viral origins(Figure 5b, grey arrows). For instance, we were able to deter-mine that H. walsbyi harbors a large fragmented plasmid ina particular genomic region (Additional data file 3) since themajority of CAGs in this region are statistically related to plas-mids (Additional data file 3). S. solfataricus also contains a
Proportion of homologues from annotated IEs, newly identified CAGs, and core genes in various databasesFigure 4Proportion of homologues from annotated IEs, newly identified CAGs, and core genes in various databases. Proportion of homologues of ORFs from annotated IEs in the core genes database, the viral database, the plasmid database and the annotated IE database, as well as the proportion of homologues of core genes in the viral database and the plasmid database.
55.2%
6.9%3.2%
36.9%
1.2%11.1%
Annotated IEdatabase
Plasmiddatabase
Viraldatabase
Coredatabase
Genome Biology 2009, 10:R65

http://genomebiology.com/2009/10/6/R65 Genome Biology 2009, Volume 10, Issue 6, Article R65 Cortez et al. R65.8
Genome Biology 2009, 10:R65
CAGs of likely IE origin based on probabilistic analysisFigure 5CAGs of likely IE origin based on probabilistic analysis. (a) Proportion of newly identified CAGs of plasmid origin (green) for each analyzed group; proportion of identified CAGs of viral origin (red); proportion of newly identified CAGs of viral/plasmid origin (yellow); proportion of newly identified CAGs of cellular origin (blue); proportion of newly identified CAGs that are unassigned (violet). (b) Same as in (a) but after database correction. Each group's average number of CAGs is indicated in parentheses. Grey arrows indicate the groups with the highest proportions of newly identified CAGs classified as IEs.
0% 10% 20% 30% 40% 50% 60% 70% 80% 90% 100%
0% 10% 20% 30% 40% 50% 60% 70% 80% 90% 100%
Ba
cte
ria
Arc
ha
ea
Ba
cte
ria
Arc
ha
ea
Enterobacteria (32)
Helicobacter (7.2)
Rickettsia (5)
Staphylococcus (9.5)
Bacillus (52)
Streptococcus (7.1)
Lactobacillus (25.4)
Mycobacterium (38)
Chlamydiales (3)
Leptospira (30.3)
Synechococcus (20.2)
Prochlorococcus (9.2)
Pyrobaculum (10.5)
Sulfolobales (16)
Methanosarcinales (10.6)
Halobacteriales (18)
Methanococcales (5.7)
Thermoplasmatales (4)
Thermococcales (8.2)
Prio
r to d
ata
ba
se
co
rrectio
nA
fter d
ata
ba
se
co
rrectio
n
0 10 20 30 40 50 60 70 80 90 100
0 10 20 30 40 50 60 70 80 90 100
Average number of CAGs (%)
Average number of CAGs (%)
(a)
(b)

http://genomebiology.com/2009/10/6/R65 Genome Biology 2009, Volume 10, Issue 6, Article R65 Cortez et al. R65.9
large fragmented element, which is equally related to virusesand plasmids (Additional data file 3). In fact, many otherCAGs in the genomes of Sulfolobales are also related to bothviral and plasmid sequences (Figure 5b; Additional data file3). A similar case is observed in the genomes of enterobacte-ria (Figure 5b; Additional data file 3).
It is interesting to note that the major source of recentlyacquired IEs can change from group to group. For instance, inall genomes of Firmicutes and Halobacteriales, the greatmajority of CAGs are related to plasmids, whereas inProcholococcus, Streptococcus and Methanococcales, theyare rather related to viruses (Figure 5b; Additional data file3). The analyses of Leptospira interrogans and Mycobacte-rium leprae genomes nicely reflect the different histories thatcan lead to a high number of CAGs in a given genome. L.interrogans harbors 80 CAGs including more than 1,400genes (Additional data file 1). On the contrary, M. leprae har-bors 58 CAGs including 1,500 genes, but over 40% of its ORFsare annotated as pseudogenes. Here, CAGs do not representIEs being erased but rather reflect the important genomicreduction that is ongoing in this species (Figure 5b; Addi-tional data files 1 and 3). To summarize, 56% are likelyrecently acquired IEs.
To test the origin of the remaining CAGs, we repeated thesame probabilistic analysis against the cellular database. Only4% (7% after database correction) could be assigned as beingof cellular origin, meaning that these may be either elementsrecently acquired by HGT from cellular sources, or else clus-ters of atypical native genes (Figure 5b; Additional data files 1and 3).
The origin of the remaining 37% of newly identified CAGsremained unassigned even after database correction (Figure5b, violet; Table 1). Given the current under-representation ofviral/plasmid diversity in public sequence databases ratherthan cellular diversity, these elements are probably membersof new families of IEs that have no sufficient viral/plasmidrelatives in current sequence databases to be unambiguouslyassigned based on our probabilistic approach. Importantly,only 5.96% of newly identified CAGs have homologues (<e-5)in four local viral metagenomic databases (see Material andmethods), but these databases may be also be biased towardsparticular viral lineages.
ORFan distribution in CAGsWe identified 8,428 ORFans in the 119 complete genomes(defined as ORFs presenting no Blast hits against the nr data-base at the NCBI below an e-value of 0.001 [9]; see Materialsand methods; Table 1; Table S1 in Additional data file 1).These ORFans are thus likely to be genes of very recent origin.Nearly all of them (96%) have atypical sequence compositionand they are, on average, statistically smaller than non-ORFans (Figure S2 in Additional data file 2). Interestingly,
this is also valid for ORFans from complete sequenced viralgenomes (Figure S2 in Additional data file 2).
We analyzed the distribution of these ORFans. We observethat 39% of all ORFans lie inside CAGs (Table 1), and a χ2 sta-tistical test shows that this is more frequent than would beexpected by chance only (Figure S3 in Additional data file 2).Importantly, genomes with a high number of ORFans (morethan 200; Additional data file 1), such as those of L. interro-gans, Methanosarcina acetivorans, H. walsbyi, and Lacto-bacillus casei, have around 50% of their ORFans inside CAGs.Moreover, not only small ORFans, but also ORFans withmore than 100, 150 and 200 amino acids (thus likely to begenuine coding genes rather than misannotated genes), areoverrepresented in CAGs (37.8%, 37.3% and 37.4%, respec-tively; data not shown). Interestingly, even if CAGs inferred tobe of plasmid origin are more numerous, ORFans are moreabundant in CAGs inferred to be of viral origin (25.1%; Figure6a, red) than in CAGs inferred to be of plasmid origin (19.5%;Figure 6a, green). Moreover, 6.4% of ORFans lie in CAGsinferred to be of plasmid/viral origin (Figure 6a, yellow), andonly 1.5% of ORFans lie inside CAGs inferred to be of cellularorigin (Figure 6a, blue). However, a significant proportion of
ORFan distributionFigure 6ORFan distribution. (a) Distribution of ORFans in CAGs: ORFans in CAGs of viral origin (red); ORFans in CAGs of plasmid origin (green); ORFans in CAGs of viral/plasmid origin (yellow); ORFans in CAGs of cellular origin (blue); and ORFans in unassigned CAGs (violet). (b) Proportion of ORFans inside CAGs of different sizes. Data were normalized according to the number of CAGs in each category.
(a)
(b)
0
10
20
30
40
50
[min-10[ [10-20[ [20-30[ [30-40[ [40-50[ [50-max]
Viral origin
25.1%
No
rma
lize
d p
rop
ort
ion
of
OR
Fa
ns in
sid
e C
AG
s
CAG sizes (in number of ORFs)
Plasmid origin
19.5%
Viral/Plasmid origin
6.4%
Cellular origin
1.5%
Unassigned
47.5%
Genome Biology 2009, 10:R65

http://genomebiology.com/2009/10/6/R65 Genome Biology 2009, Volume 10, Issue 6, Article R65 Cortez et al. R65.10
ORFans (47.5%) lie inside unclassified CAGs (Figure 6a, vio-let).
Finally, large CAGs (that is, containing 40 or more ORFs)harbor proportionally more ORFans than smaller CAGs (Fig-ure 6b). Since larger CAGs may be more recent than smallerones (these likely deriving from disruption of larger CAGs),this suggests that recently acquired CAGs contain proportion-ally more ORFans, and that these are rapidly removed fromcellular genomes. The remaining 61% of ORFans do not lie inany CAG. However, if we relax the criterion for CAG defini-tion (from four up to six atypical genes), nearly a third of themlie in small CAGs, which may represent the remnants of olderIEs (data not shown).
ConclusionsIt is widely assumed that most cellular genomes harbor IEs,but their proportion has not been quantified on a large scale.With this study, we show that the use of a MM-based methodto identify ORFs with atypical composition in groups ofclosely related genomes, coupled to the identification ofCAGs, their genomic context and gene content, is a powerfulapproach to identify foreign elements that have recently inte-grated into archaeal and bacterial genomes. This strategyallowed us to recognize all previously annotated IEs and todetect new CAGs that are likely of viral or plasmid origin in alarge number of archaeal and bacterial genomes.
The MM approach that we have developed could have manyuseful applications. In particular, it may help automaticgenome annotation (detection of IEs in newly sequencedgenomes) and will allow an exhaustive description of all IEfamilies in sequenced archaeal and bacterial genomes. OurMM method could also be very useful to determine if an ORFof interest belongs to an IE. For instance, we have recentlyused it to show that a conserved ORF (AFV3) from virusesinfecting Crenarchaeota has a unique homologue outside thisviral group that lies inside a CAG corresponding to a conjuga-tive transposon in the genome of Bacillus subtilis [31,32].Interestingly, this transposon is related to a large family ofCAGs that includes many of our newly identified CAGs, aswell as annotated prophages, 'free-living' phages and plas-mids from Firmicutes [31]. This result highlights unsuspectedand still largely unknown links between the archaeal and bac-terial IE worlds.
Our results are also different from those recently reported byHsiao and colleagues [6], who used a method based on atypi-cal dinucleotide composition to identify genomic islands in 63prokaryotic genomes. However, in contrast to our MM strat-egy, they failed to identify more than half of already anno-tated IEs. This significant difference between the twomethodologies underscores the importance of performingHGT simulations to test statistically a method's accuracyprior to its application.
Importantly, we found that several bacterial and archaealgenomes contain an impressive number of CAGs, whereasothers contain only a few. These results are not correlatedwith gene number nor with the evolutionary proximity of thegenomes in a given group. Different bacteria and archaea arethus differently prone to acquire IEs. This may be linked todifferent adaptation strategies under high selection pressures[33] and might be related to a general mechanism for nichedifferentiation in microbial species [34] by increasing thegenetic variability via the acquisition of foreign genetic mate-rial.
Among our newly identified CAGs, a large number areinferred to be of plasmid origin. This indicates that plasmidintegration is highly frequent, which is at odds with previousreports. For example, Nakamura and colleagues [16] con-cluded that most of the atypical ORFs that they identified arefrom distant cellular sources since only 30% of these havehomologues in viral or plasmid sequence databases. Weshowed that these databases are, in fact, biased towardsviruses and plasmids from particularly well-characterizedorganisms. When this bias was corrected, a larger number ofCAGs could, in fact, be assigned to plasmid/viral origin.Future increases in the number of available new viral, plas-mid and cellular sequences will allow the large number ofCAGs that remained unclassified in our analysis to be classi-fied and may also be of viral or plasmid origin.
Importantly, our results contribute to the issue of the originof ORFans in archaeal and bacterial genomes. In fact, a largepercentage of ORFans were found to lie in CAGs, half of whichare new CAGs of likely viral or plasmid origin. The number ofORFans included in CAGs increased to up to 60% if we alsoconsidered smaller CAGs (two to six genes) that might beremnants of older/fragmented IEs.
The IE origin of most recent ORFans is consistent with therecurrent observation that viral and plasmid genomes alwayscontain a higher proportion of ORFans than cellular genomes[13]. Our data are in agreement with those reported byDaubin and Ochman for γ-Proteobacteria [14] and indicatethat the IE origin of ORFans is a phenomenon that shapesequally the genomes of both archaea and bacteria. Conse-quently, the reported low number of ORFans with homo-logues in viral databases [10], or else the reported lownumber of viral ORFans with homologues in bacterial orarchaeal genomes [12], is very likely due to a large under-rep-resentation of viral and plasmid diversity in current sequencedatabases.
Our analysis strongly suggests that the variable component ofa particular genome with respect to its closely related kin(that is, ORFans) has its origin in a still largely unsequenced(hidden) reservoir of IE sequences. Consistently, directmicroscopic observations and metagenomic data indicatethat viruses are the most abundant entities and the greatest
Genome Biology 2009, 10:R65

http://genomebiology.com/2009/10/6/R65 Genome Biology 2009, Volume 10, Issue 6, Article R65 Cortez et al. R65.11
source of gene diversity on Earth [8,35,36]. The hidden IEreservoir hypothesis also explains why the proportion ofORFans remains stable despite the growing number of newgenome sequences. We predict that this proportion will startdecreasing only with a more exhaustive sequencing of all IEsassociated with a particular bacterial or archaeal species. Thestudy of the expression profiles, functions and structures ofthese ORFans should become one of the priorities of post-genomics studies.
Materials and methodsAnalyzed genomesThe following groups of closely related genomes were ana-lyzed. Group I, Archaea: Thermococcales, four genomes;Methanosarcinales, three genomes; Halobacteriales, fourgenomes; Thermoplasmatales, three genomes; Sulfolobales,three genomes; Methanococcus, seven genomes; Pyrobacu-lum, four genomes. Group II, Bacteria: γ-Proteobacteria(Escherichia, Salmonella and Yersinia), 13 genomes; ε-Pro-teobacteria (Helicobacter), four genomes; α-Proteobacteria(Rickettsia), five genomes; Firmicutes (Bacillus, 11 genomes;Staphylococcus, 12 genomes; Streptococcus, 6 genomes;Lactobacillus, 10 genomes); Actinobacteria, (Mycobacte-rium), ten genomes; Chlamydia, 7 genomes; Spirochaetes(Leptospira), three genomes; Cyanobacteria (Synechococ-cus, five genomes; Prochlorococcus, five genomes). The com-plete list of species is given in Table S1 in Additional data file1. All genomes were obtained from the NCBI database [37].
ModelsEleven first-order Markov-based models were constructed foreach genome for each different core genes dataset. The mod-els take into account the Markov probability matrix of the dif-ferent core genes datasets and the composition of the ORFunder study. The model is based on the mathematic formulasdescribed in [38], and summarized below:
where S(m) is the Markov index for the m sequence, h issequence length of the gene m, P(xy) set ORFi are the dinu-cleotide probabilities found in the ORF i under study, andP(xy)set coregeneX% are the dinucleotide probabilities cal-culated from the core genes dataset calculated from genesequences from the organisms under study having ortho-logues in at least X% of the group's genomes.
The model calculates for each ORF an index that representsthe likelihood of that ORF to have a similar composition tothe core genes dataset (that is, a Markov index close to one fora given ORF means that its composition is similar to that ofthe core genes dataset). In order to assess significance cut-offs for Markov indexes, we applied the following statistics
(based on the method described in [16]) and Monte Carlosimulations; for every ORF of a particular group analyzed,one million random sequences were generated based on theMarkov model probability matrix of the core genes dataset,and the Markov index of each of these random sequences wascalculated. Then, the results were analyzed by a one-tailedtest with different distribution cut-offs (0.l% to 5%). An ORFhaving a Markov index above a specific cut-off was then con-sidered as atypical. The Bayesian model was built as detailedin Nakamura et al. [16] but with our different core genes data-sets and our Monte Carlo simulations to define statisticalthresholds. The GC% model looks for the differences betweena give ORF and a dataset of core sequences by looking at theGC% variability in the third codon base. The model wasapplied using the different core genes datasets and our MonteCarlo simulations to define statistical thresholds. Genes thatare atypical per se (approximately 10% of all core genes ana-lyzed), such as genes coding for ribosomal proteins or genessmaller than 150 nucleotides, were excluded from furtheranalysis.
Horizontal gene transfer simulationsThe MM, BM and GC% approaches were evaluated using insilico HGT simulations in order to test their performancesunder different genomic backgrounds. The 119 genomes wereanalyzed and 100 simulations were performed using the coregenes datasets and a variety of cut-offs (0.1% to 5%). HigherMarkov orders were also tested, but these showed lower spe-cificity (that is, higher numbers of false positives; data notshown), probably because with our Markov chain approachthe increase in the Markov order reduces considerably thequantity of information that can be obtained from the genesequence, especially for small genes. To evaluate the averageperformances of the models, we applied a Wilcoxon-test.
Homology searchesAll ORFs contained in annotated IEs (10,651 ORFs) andnewly identified CAGs (36,790) were searched by BLASTP[39] against: a local database of all annotated IEs in the 119genomes; complete plasmid sequences available at the NCBI;complete viral genomes at the NCBI; a local database of coregenes in the 119 genomes (from the selected core genes data-set after the HGT simulations; 194,554 genes); and ORFs innewly identified CAGs. Bit-score is useful when comparingBLAST results obtained from different databases searchesbecause it remains constant, unlike the e-value, whichchanges depending on the size of the database. We thereforedefined the homology cut-off between two sequences whenthe bit-score of the BLAST hit was above 30% of the bit-scoreof the query protein against itself (maximum bit-score value)[27]. We also performed BLASTP searches against fourmetagenomic databases available at the SDSU Center for Uni-versal Microbial Sequencing: 'The marine viromes of fouroceanic regions' [35].
S mh
P xy set ORFiP xy set coregeneX
i
h
( )log ( )
log ( ) %=
⎡⎣ ⎤⎦⎡⎣ ⎤⎦=
−1
1
11
∑
Genome Biology 2009, 10:R65

http://genomebiology.com/2009/10/6/R65 Genome Biology 2009, Volume 10, Issue 6, Article R65 Cortez et al. R65.12
Gene content probabilistic analysisOne-thousand clusters of size n, where n goes from 7 ORFs(smaller CAG by definition) up to 152 ORFs (larger CAGfound) were artificially built using ORFs from the 119 ana-lyzed genomes. We then counted, for all clusters of n size, thenumber of homologues they have in the viral genome data-base, the plasmid genome database and the core genes data-base. ORFs were allowed to have only one homologue in eachdatabase in order to reduce any possible biases due to thepresence of closely related sequences in the database thatwould falsely increase the number of homologues for a givenORF. Based on these data, we built three distributions ofprobabilities (one for each of the above-mentioned data-bases), and from these distributions we were able to calculatea 95% confidence interval. We could then determine whichCAGs are of viral or plasmid or cellular origin by counting thenumber of homologues their ORFs show in the viral genomedatabase and the plasmid database and the core genes data-base. For instance, a CAG of size 'x' that has 'y' homologues inthe plasmid database could be considered of plasmid originwhen 'y' was above the 95% confidence interval calculatedfrom the distribution of homologues in the plasmid databaseof the 1,000 random clusters of size 'x'.
Detection of ORFansAll ORFs in the 119 analyzed genomes were searched byBLASTP against the nr database at the NCBI (as of January2009) [37]. When no hits were found below an e-value of0.001, ORFs were considered as ORFans [9]. We correctedthe list of ORFans by eliminating potential misannotatedORFs. In fact, 1,859 potential ORFans were found in morethan one genome by using a BLASTN search (cut-off was fixedat 50% of bit score of the query sequence against itself). Foreach genome, we calculated the expected number of ORFansinside CAGs given the total number of ORFs in the genome,the total number of ORFs in CAGs, and the total number ofORFans. Because the data had a normal distribution, a χ2 testwas performed to determine if the number of ORFans insideCAGs was higher than expected by chance only. To analyze ifCAGs are enriched in genes of small size and because data hada normal distribution, a one-way ANOVA test followed by aTukeyHSD statistical test were performed between all thegroups of CAGs and 1,000 randomly chosen core genes.
StatisticsAll statistical tests were performed with the R package [40].All other analyses were performed using in-house developedPerl scripts.
AbbreviationsBM: Bayesian model; CAG: cluster of genes with atypicalcomposition; HGT: horizontal gene transfer; IE: integrativeelement; MM: Markov model; ORF: open reading frame.
Authors' contributionsDC carried out all analyses and simulations. DC, SG and PFconceived the study, interpreted the results and wrote thepaper. All authors read and approved the final manuscript.
Additional data filesThe following additional data are available with the onlineversion of this paper: Table S1, listing all detailed informationon CAGs for the 122 analyzed genomes (Additional data file1); supplementary Figures S1, S2 and S3 (Additional data file2); detailed results from the 119 analyzed genomes (Addi-tional data file 3).Additional data file 1Detailed information on CAGs for the 122 analyzed genomesDetailed information on CAGs for the 122 analyzed genomes.Click here for fileAdditional data file 2Figures S1, S2 and S3Figure S1 shows the statistical results of the sizes of CAGs' ORFs with respect to the size of core genes. Figure S2 shows the statistics of ORF and ORFan sizes. Figure S3 shows the results of a χ2 test on the frequencies of ORFans inside and outside CAGs.Click here for fileAdditional data file 3Detailed results from the 119 analyzed genomesDetailed results from the 119 analyzed genomes.Click here for file
AcknowledgementsWe thank Samuel Karlin, David Prangishvili, Peter Redder, AlexisCriscuolo, and Elie Desmond for helpful suggestions and comments. Weacknowledge the support of CONACYT to DC.
References1. Gogarten JP, Townsend JP: Horizontal gene transfer, genome
innovation and evolution. Nat Rev Microbiol 2005, 3:679-687.2. Canchaya C, Fournous G, Chibani-Chennoufi S, Dillmann ML, Brus-
sow H: Phage as agents of lateral gene transfer. Curr OpinMicrobiol 2003, 6:417-424.
3. Frost LS, Leplae R, Summers AO, Toussaint A: Mobile genetic ele-ments: the agents of open source evolution. Nat Rev Microbiol2005, 3:722-732.
4. Canchaya C, Fournous G, Brussow H: The impact of prophageson bacterial chromosomes. Mol Microbiol 2004, 53:9-18.
5. Karlin S: Detecting anomalous gene clusters and pathogenic-ity islands in diverse bacterial genomes. Trends Microbiol 2001,9:335-343.
6. Hsiao WW, Ung K, Aeschliman D, Bryan J, Finlay BB, Brinkman FS:Evidence of a large novel gene pool associated with prokary-otic genomic islands. PLoS Genet 2005, 1:e62.
7. Mantri Y, Williams KP: Islander: a database of integrativeislands in prokaryotic genomes, the associated integrasesand their DNA site specificities. Nucleic Acids Res 2004,32:D55-58.
8. Hambly E, Suttle CA: The viriosphere, diversity, and geneticexchange within phage communities. Curr Opin Microbiol 2005,8:444-450.
9. Siew N, Azaria Y, Fischer D: The ORFanage: an ORFan data-base. Nucleic Acids Res 2004, 32:D281-283.
10. Yin Y, Fischer D: On the origin of microbial ORFans: quantify-ing the strength of the evidence for viral lateral transfer.BMC Evol Biol 2006, 6:63.
11. Siew N, Fischer D: Analysis of singleton ORFans in fullysequenced microbial genomes. Proteins 2003, 53:241-251.
12. Yin Y, Fischer D: Identification and investigation of ORFans inthe viral world. BMC Genomics 2008, 9:24.
13. Prangishvili D, Garrett RA, Koonin EV: Evolutionary genomics ofarchaeal viruses: unique viral genomes in the third domain oflife. Virus Res 2006, 117:52-67.
14. Daubin V, Ochman H: Bacterial genomes as new gene homes:the genealogy of ORFans in E. coli. Genome Res 2004,14:1036-1042.
15. Cortez DQ, Lazcano A, Becerra A: Comparative analysis ofmethodologies for the detection of horizontally transferredgenes: a reassessment of first-order Markov models. In SilicoBiol 2005, 5:581-592.
16. Nakamura Y, Itoh T, Matsuda H, Gojobori T: Biased biologicalfunctions of horizontally transferred genes in prokaryoticgenomes. Nat Genet 2004, 36:760-766.
17. Ochman H, Lawrence JG, Groisman EA: Lateral gene transfer andthe nature of bacterial innovation. Nature 2000, 405:299-304.
18. Garcia-Vallve S, Romeu A, Palau J: Horizontal gene transfer in
Genome Biology 2009, 10:R65

http://genomebiology.com/2009/10/6/R65 Genome Biology 2009, Volume 10, Issue 6, Article R65 Cortez et al. R65.13
bacterial and archaeal complete genomes. Genome Res 2000,10:1719-1725.
19. Ou HY, Chen LL, Lonnen J, Chaudhuri RR, Thani AB, Smith R, GartonNJ, Hinton J, Pallen M, Barer MR, Rajakumar K: A novel strategy forthe identification of genomic islands by comparative analysisof the contents and contexts of tRNA sites in closely relatedbacteria. Nucleic Acids Res 2006, 34:e3.
20. Lawrence JG, Ochman H: Amelioration of bacterial genomes:rates of change and exchange. J Mol Evol 1997, 44:383-397.
21. Hayes WS, Borodovsky M: How to interpret an anonymous bac-terial genome: machine learning approach to gene identifi-cation. Genome Res 1998, 8:1154-1171.
22. van Passel MW, Bart A, Thygesen HH, Luyf AC, van Kampen AH,Ende A van der: An acquisition account of genomic islandsbased on genome signature comparisons. BMC Genomics 2005,6:163.
23. Campbell A, Mrazek J, Karlin S: Genome signature comparisonsamong prokaryote, plasmid, and mitochondrial DNA. ProcNatl Acad Sci USA 1999, 96:9184-9189.
24. van Passel MW, Bart A, Luyf AC, van Kampen AH, Ende A van der:Compositional discordance between prokaryotic plasmidsand host chromosomes. BMC Genomics 2006, 7:26.
25. Monier A, Claverie JM, Ogata H: Horizontal gene transfer andnucleotide compositional anomaly in large DNA viruses.BMC Genomics 2007, 8:456.
26. Mrazek J, Karlin S: Distinctive features of large complex virusgenomes and proteomes. Proc Natl Acad Sci USA 2007,104:5127-5132.
27. Lerat E, Daubin V, Moran NA: From gene trees to organismalphylogeny in prokaryotes: the case of the gamma-Proteo-bacteria. PLoS Biol 2003, 1:E19.
28. van Passel MW, Smillie CS, Ochman H: Gene decay in archaea.Archaea 2007, 2:137-143.
29. She Q, Peng X, Zillig W, Garrett RA: Gene capture in archaealchromosomes. Nature 2001, 409:478.
30. Williams KP: Integration sites for genetic elements in prokary-otic tRNA and tmRNA genes: sublocation preference ofintegrase subfamilies. Nucleic Acids Res 2002, 30:866-875.
31. Keller J, Leulliot N, Cambillau C, Campanacci V, Porciero S, Prangish-villi D, Forterre P, Cortez D, Quevillon-Cheruel S, van Tilbeurgh H:Crystal structure of AFV3-109, a highly conserved proteinfrom crenarchaeal viruses. Virol J 2007, 4:12.
32. Auchtung JM, Lee CA, Monson RE, Lehman AP, Grossman AD: Reg-ulation of a Bacillus subtilis mobile genetic element by inter-cellular signaling and the global DNA damage response. ProcNatl Acad Sci USA 2005, 102:12554-12559.
33. Sobecky PA, Coombs JM: Horizontal gene transfer in metal andradionuclide contaminated soils. Methods Mol Biol 2009,532:455-472.
34. Coleman ML, Sullivan MB, Martiny AC, Steglich C, Barry K, Delong EF,Chisholm SW: Genomic islands and the ecology and evolutionof Prochlorococcus. Science 2006, 311:1768-1770.
35. Angly FE, Felts B, Breitbart M, Salamon P, Edwards RA, Carlson C,Chan AM, Haynes M, Kelley S, Liu H, Mahaffy JM, Mueller JE, NultonJ, Olson R, Parsons R, Rayhawk S, Suttle CA, Rohwer F: The marineviromes of four oceanic regions. PLoS Biol 2006, 4:e368.
36. Weinbauer MG, Rassoulzadegan F: Are viruses driving microbialdiversification and diversity? Environ Microbiol 2004, 6:1-11.
37. NCBI Database [http://www.ncbi.nlm.nih.gov/]38. Durbin R: Biological Sequence Analysis: Probabilistic Models of Proteins and
Nucleic Acids Cambridge: Cambridge University Press; 1998. 39. Altschul SF, Madden TL, Schaffer AA, Zhang J, Zhang Z, Miller W, Lip-
man DJ: Gapped BLAST and PSI-BLAST: a new generation ofprotein database search programs. Nucleic Acids Res 1997,25:3389-3402.
40. R Project [http://www.r-project.org/]
Genome Biology 2009, 10:R65
http://www.ncbi.nlm.nih.gov/entrez/query.fcgi?cmd=Retrieve&db=PubMed&dopt=Abstract&list_uids=9089078
http://www.ncbi.nlm.nih.gov/entrez/query.fcgi?cmd=Retrieve&db=PubMed&dopt=Abstract&list_uids=9089078
http://www.ncbi.nlm.nih.gov/entrez/query.fcgi?cmd=Retrieve&db=PubMed&dopt=Abstract&list_uids=9847079
http://www.ncbi.nlm.nih.gov/entrez/query.fcgi?cmd=Retrieve&db=PubMed&dopt=Abstract&list_uids=9847079
http://www.ncbi.nlm.nih.gov/entrez/query.fcgi?cmd=Retrieve&db=PubMed&dopt=Abstract&list_uids=9847079
http://www.ncbi.nlm.nih.gov/entrez/query.fcgi?cmd=Retrieve&db=PubMed&dopt=Abstract&list_uids=9254694