
A GLOBAL DATABASE OF DOMESTIC AND INTERNATIONAL TOURIST NUMBERS AT NATIONAL AND SUBNATIONAL LEVEL
28
A GLOBAL DATABASE OF DOMESTIC AND INTERNATIONAL TOURIST NUMBERS AT NATIONAL AND SUBNATIONAL LEVEL Andrea Bigano a,b , Jacqueline M. Hamilton c , Maren Lau c , Richard S.J. Tol c,d,e and Yuan Zhou f,c a Fondazione Eni Enrico Mattei, Milan, Italy b Centre for Economic Studies, Catholic University of Leuven, Belgium c Research unit Sustainability and Global Change, Hamburg University and Centre for Marine and Atmospheric Science, Hamburg, Germany d Institute for Environmental Studies, Vrije Universiteit, Amsterdam, The Netherlands e Engineering and Public Policy, Carnegie Mellon University, Pittsburgh, PA, USA f International Max Planck Research School of Earth System Modelling, Hamburg, Germany November 2, 2004 Working Paper FNU-54 Abstract We present a new, global data base on tourist destinations. The data base differs from other data bases in that it includes both domestic and international tourists; and it contains data, for the most important destinations, data at national level as well as at lower administrative levels. Missing observations are interpolated using statistical models. The data are freely accessible on the internet. Key words Tourism, data JEL Classification L83 1. Introduction Recreation and tourism is one of the largest industries of the world, some even say the largest. Yet, information on tourism is hard to get. Although there is a wealth of data, there are few comprehensive, internally consistent data-sets. If one were to ask the question “Where do tourists go?” the answer would be vague. The World Tourism Organisation collects data at the national level (WTO, 2003), so that the answer would be that “France is the most popular destination of international tourists”. France, however, is a big and diverse country; in
-
Upload
independent -
Category
Documents
-
view
0 -
download
0
Transcript of A GLOBAL DATABASE OF DOMESTIC AND INTERNATIONAL TOURIST NUMBERS AT NATIONAL AND SUBNATIONAL LEVEL

A GLOBAL DATABASE OF DOMESTIC AND INTERNATIONAL TOURIST NUMBERS AT NATIONAL AND SUBNATIONAL LEVEL
Andrea Biganoa,b, Jacqueline M. Hamiltonc, Maren Lauc, Richard S.J. Tolc,d,e and Yuan Zhouf,c
a Fondazione Eni Enrico Mattei, Milan, Italy b Centre for Economic Studies, Catholic University of Leuven, Belgium c Research unit Sustainability and Global Change, Hamburg University and Centre for Marine and Atmospheric Science, Hamburg, Germany d Institute for Environmental Studies, Vrije Universiteit, Amsterdam, The Netherlands e Engineering and Public Policy, Carnegie Mellon University, Pittsburgh, PA, USA f International Max Planck Research School of Earth System Modelling, Hamburg, Germany
November 2, 2004
Working Paper FNU-54
Abstract We present a new, global data base on tourist destinations. The data base differs from other data bases in that it includes both domestic and international tourists; and it contains data, for the most important destinations, data at national level as well as at lower administrative levels. Missing observations are interpolated using statistical models. The data are freely accessible on the internet.
Key words
Tourism, data
JEL Classification L83
1. Introduction Recreation and tourism is one of the largest industries of the world, some even say the largest. Yet, information on tourism is hard to get. Although there is a wealth of data, there are few comprehensive, internally consistent data-sets. If one were to ask the question “Where do tourists go?” the answer would be vague. The World Tourism Organisation collects data at the national level (WTO, 2003), so that the answer would be that “France is the most popular destination of international tourists”. France, however, is a big and diverse country; in

Limousin, tourists are few and far between.1 If one instead turns to survey data, say of German tourists, the most common type of international tourist, one would find reasonable geographical detail for the most popular destinations, but for less popular choices, countries are grouped. 5.8% of German tourists go to the Balearic Islands, and 0.3% to Southern Africa (FUR, 1998). A further problem is that international tourism is only one part. Domestic tourism is important too. Most US tourists never leave their country, but their numbers are far bigger than the Germans’. This paper attempts to fill these gaps. It presents a new data-base that (a) combines domestic and international tourism, (b) has destinations at national and subnational level, and (c) interpolates missing observations.
Section 2 discusses the data, definitions, sources, problems and interpolation algorithms. Section 3 shows and interprets the results. Here, we present maps with all data and tables with selections. The entire data-set will be put in the public domain once peer-reviewed. Section 4 concludes. The Appendix contains a list of all data-sources.
2. The data
2.1. International arrivals and departures
The data on international arrivals and departures for 1995 are taken from the World Resources Databases (WRI, 2000).2 Although 1995 is a while back, it is the year with the most comprehensive international coverage; countries are slow to report tourism numbers. There are two major problems with this dataset. Firstly, for some countries, the reported data are arrivals and departures for tourism only. For other countries, the data are arrivals and departures for all purposes. Unfortunately, it is impossible to correct for this.3 Secondly, there are missing observations, particularly with regard to departures.
For arrivals, 181 countries have data but 26 do not. We filled the missing observations with a statistical model, viz.
(1) 7 3 2 5
0.97 0.96 0.07 2.21 3.03 0.092
ln 5.97 2.05 10 0.22 7.91 10 7.15 10 0.80ln
139; 0.54
i i i i
adj
A Area T T Coast Y
N R
− − −= + ⋅ + − ⋅ + ⋅ +
= =
i
where A denotes total arrivals, Area is land area (in square kilometre); T is annual average temperature for 1961-1990 (in degrees Celsius) averaged over the country, Coast is length of coastline (in kilometres), and Y is per capita income; i indexes destination country. This model is the best fit4 to the observations for the countries for which we do have data.5 The
1 This may come as a surprise, as Limousin is both pleasant and beautiful. However, it cannot compete with the its neighbouring departments, which have a better infrastructure as well as a coast (Guillore, personal communication, 2004). 2 The reported departures from the Czech Republic were divided by 10; comparison to earlier and later years shows that the 1995 data have a typographical error. 3 However, we did correct the Polish departure data. According to Statistic Poland, only 12% of the reported international departures are tourists (Central Statistical Office Poland, http://www.stat.gov.pl/english/serwis/polska/rocznik11/turyst.htm) 4 The estimation procedure started with a large number of explanatory variables, including precipitation, number of world heritage sites, political stability and a range of other indicators. Explanatory variables that are individually and jointly insignificant were eliminated. The shown specification results. We experimented with different representations of temperature (e.g., temperature of the hottest month); the annual average temperature describes the data best. 5 The data on per capita income were taken from WRI (2000), supplemented with data from CIA (2002); the data on area and the length of international borders are from CIA (2002); the data on temperature from New et al. (1999). All data can be found at http://www.uni-hamburg.de/Wiss/FB/15/Sustainability.
2

total number of tourists increases from 55.2 million (observed) to 56.5 million (observed + modelled). The 26 missing observations constitute only 2% of the international tourism market.
For departures, the data problem is more serious: 107 countries report but 99 do not;6 46.5 million departures are reported, against 56.5 million arrivals, so that 18% of all international tourists have an unknown origin. We filled the missing observations with a statistical model, viz.,
(2) 3 2 2
17.05 0.17 16.82 4.22 0.09 0.13
2
ln 1.51 0.18 4.83 10 5.56 10 0.86ln 0.23ln
99; 0.66
ii i i
i
adj
D T T Border Y AreaPop
N R
− −= − + ⋅ − ⋅ + −
= =
i
where D denotes departures (in number), Pop denotes population (in thousands) and Border is the number of countries with shared land borders; i indexes the country of origin. This model is the best fit7 to the observations for the countries for which we do have data.8 This leads to a total number of departures of 48.2 million, so we scaled up all departures9 by 17% so that the total number of observed and modelled departures equals the total number of observed and modelled arrivals.
2.2. Domestic tourism
For most countries, the volume of domestic tourist flows is derived using 1997 data contained in the Euromonitor (2002) database. For some other countries, we rely upon alternative sources, such as national statistical offices, other governmental institutions or trade associations. Data are mostly in the form of number of trips to destinations beyond a non-negligible distance from the place of residence, and involving at least one overnight stay. For some countries such data format was not available, and we resorted to either the number of registered guests in hotels, campsites, hostels etc., or the ratio between the number of overnight stays and the average length of stay. The latter formats underestimate domestic tourism by excluding trips to friend and relatives; nevertheless we included such data for completeness.
In general, the number of domestic tourists is less than the regional population; however, in 22 countries, people take domestic holidays more than once per year. A look at the characteristics of such countries shows that these are generally rich countries, endowed with plenty of opportunities for domestic tourism and large (or at least medium-sized). This definition fits in particular Scandinavian countries (e.g., 4.8 domestic tourists per resident in Sweden) but also Canada, Australia, and the USA.10 In the USA, the combination of a large national area, a large number of tourist sites, high income per capita and a willingness to
6 These are mostly African countries and small dependencies; however, data from Pakistan and Taiwan are also missing. Luxemburg is the only OECD country without departures data. 7 The estimation procedure started with a large number of explanatory variables. Explanatory variables that are individually and jointly insignificant were eliminated. 8 The data on population were taken from WRI (2000), the data on the number of land borders were taken from CIA (2002). 9 Scaling up only the interpolated departures leads to distortions, as many small countries do not report departures data. Besides, countries have less of an interest in counting departures than in counting arrivals, so departures are probably underreported even if there are data available. Note that by equating total arrivals and total departures numbers, we assume that tourists visit one country per trip only. 10 Poland, ranking 8th, is particularly active notwithstanding substantially lower per capita income than the rest of the top 10 countries; this may be because (illegal) seasonal labour migration is registered as tourism.
3

travel long distances contribute to explain why, on average, an average American took a domestic holiday 3.7 times in 1997. Distance from the rest of the world is also important, and this is most probably the explanation for Australia and New Zealand.
We filled the missing observations using two regressions. We interpolated total tourism numbers using
(3) 0.83 0.10
2
ln 1.67 0.93ln
63; 0.60
ii
i
adj
T YPop
N R
= − +
= =
The ratio of domestic and international holidays was interpolated using
(4) ( )
1 1 1
1.19 0.42 0.30 0.32 1.11
7
0.12 1.24
2
ln 3.75 0.83 10 ln 0.93 10 ln 0.16 10 0.29 10
0.16 4.43 10 ln
63; 0.36
ii i i
i
i i
adj
D Area Coast T TT
Y Y
N R
− − −
−
= − + ⋅ + ⋅ + ⋅ − ⋅
+ − ⋅
= =
3 2i
−
Data sources are as above. The temperature parameters are not statistically significant from zero at the 5% level, but they are jointly significant. “Observations” for 1995 were derived from 1997 observations by dividing the latter by the population and per capita income growth between 1995 and 1997, correcting the latter for the income elasticity of (3) and (4).
For the total (domestic and foreign) number of tourists, the world total is 12.0% higher if we include the interpolated tourist numbers, that is, 4.0 billion versus 3.6 billion tourists. The observed world total include those countries for which we have observed both domestic tourists and international arrivals. For domestic tourists only, the observations add up to 3.1 billion tourists, and 3.5 billion tourists with interpolation, a 12.1% increase.
Note that Equations (3) and (4) can be used to derive international departures, just like Equation (2). The correlation coefficient between these two alternatives is 99.8%. We prefer (2) for its simplicity.
2.3. Regional tourism
Regional tourism data was taken from national statistical offices or tourism authorities. One exception is Canada, for which we had to look at the provincial statistical offices instead. Another exception is the EU, where we relied on the supranational statistical office EuroStat, using data on NUTS2, sometimes NUTS1 or NUTS311 level. Unfortunately, the EU data does not cover all of the EU countries; none of the accession countries has regional data, and not even all of the original EU countries report regional data; for these countries, we resort to the number of tourist beds.
The regional tourism data comes in all sorts of specifications: tourists, tourists in hotels, bed nights, border crossings, expenditures, hotel capacities (beds), or pleasures parties. For every country for which we have regional information, we used whatever information we had to give each region its share in the nation. We use this share to apportion the national data to the regions.
11 NUTS0 is national, NUTS4 and NUTS5 municipal, and NUTS1-3 are somewhere in between, depending on the country; NUTS4 and NUTS5 are now LAU1 and LAU2.
4

Thus, in our data base, regional tourism numbers equal the national number (from the international data bases) times the regional share (from the national data base). We do this so that the tourism numbers in countries and parts of countries all derive from a single, internally consistent, international data base. Supplementary, national data is used only for within-country patterns.
For most countries, regional tourism is reported separately for domestic tourists and international tourists. Domestic regional tourism patterns are generally very different than international regional tourism patterns. Some countries report only on international tourists, and a few on domestic and international tourists combined; most countries that report only hotel capacities do not distinguish between domestic and international tourists. For those countries, we assume that domestic and international tourists behave the same, for want of better information: Although the differences between domestic and international patterns are clear, one cannot predict the domestic pattern from the international pattern or vice versa.
Regional tourism data seldom extends over more than a few years, and data is typically more recent than 1995, the base year for our national statistics. We use the year closest to 1995.
We searched for regional tourism data for all countries that are in the top 25 of international, domestic, or total tourist destinations.12 The countries for which we have regional data cover 79% of all international tourism, 78% of all domestic tourism. For countries without regional data, we use the area of the region, essentially assuming that tourists spread evenly over a country.
3. Results Table 1 shows the 10 countries with the highest tourism demand, measured in number of tourists. The United States leads in domestic tourism, followed by China, India, Brazil and, surprisingly, the United Kingdom. The top 10 countries cover 77.9% of all domestic tourism. In international tourism, Germany leads, followed by the USA, the UK, Russia and Malaysia. Ranks 4 and 5 are surprising, as is Hungary in rank 10. Probably, temporary labour migration is misclassified as tourism. The top 10 countries cover 60.2% of all international tourism. Table 1 also shows total (domestic plus international) tourism demand. This ranking is dominated by domestic tourism. The top 5 is identical, but below that Germany and France advance at the expense of Poland. The top 10 countries cover 73.4% of world tourism demand.
Table 2 shows the 10 countries with the highest tourism supply, measured in number of tourists. For domestic tourism, supply equals demand. France is the most popular destination for international tourists, followed by the USA, Spain, Italy and the UK. The top 10 destinations cover 52.2% of all supply. Table 2 also shows total (domestic plus international) tourism supply. Again, the ranking is dominated by domestic tourism. The USA is the most popular tourist destination, followed by China, India, Brazil and the UK. France, the most popular destination for international tourists, ranks sixth. The top 10 covers 72.0% of world tourism supply.
Figure 1 shows the numbers of domestic tourists per country. Countries with larger and richer populations have more domestic tourists. Figure 2 shows the numbers of international departures per country. Countries with larger and richer populations have more international tourists, but compared to Figure 1, income matters more. Another factor is that smaller countries have more international departures. An exception in Figures 1 and 2 is Russia,
12 Countries for which we tried but failed to find regional data are Algeria, Brazil, Chile, Colombia, Egypt, Morocco, New Zealand, Russia, South Korea, Tunisia, and Vietnam.
5

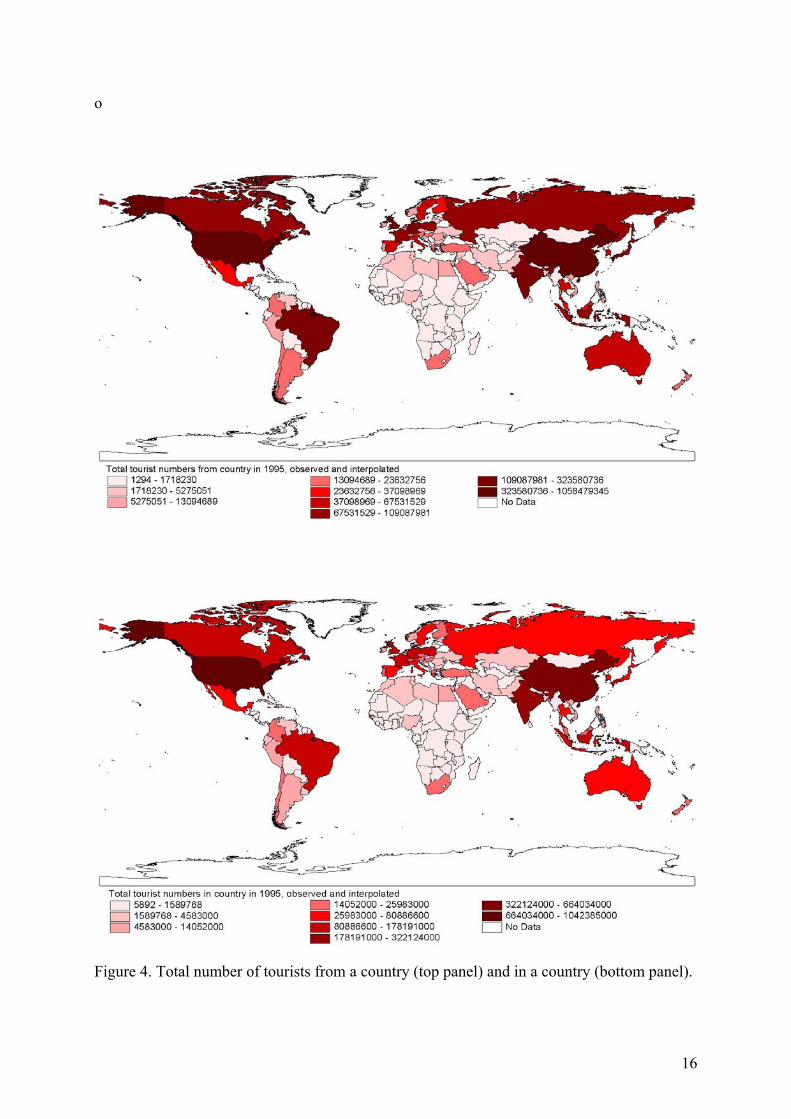
which has little domestic tourism and a lot of international tourism for its size and income. Figure 3 shows international arrivals. North America, Western and Central Europe, Russia and China are the most important destinations. Tropical countries and countries of the Southern Hemisphere receive only a fraction of international tourists. Figure 4 shows the total number of tourists from and in a country. Figure 4 confirms that domestic tourism dominates international tourism, as already seen from Tables 1 and 2. The clear exceptions are Canada and Russia where there are substantially less tourists coming in than going out. Figure 5 shows the share of international tourists from and in a country. People from larger countries are less inclined to take a foreign holiday (but their numbers still add up, see Figure 1), and people in Western and Central Europe are more so inclined. In Africa, West Asia and Latin America, the pattern is more erratic, also because of the interpolation of data, but people from poorer countries are more inclined to take a foreign holiday (as only the very wealthy travel). The share of international in total tourist numbers is higher in Southern Europe and Mexico than elsewhere in Europe and North America. The pattern for Africa, West Asia and Latin America is again more erratic; however, if the majority of the holiday makers from a country go abroad, then the tourism sector within that country is logically dominated by foreign visitors.
Table 3 shows the 25 regions with the highest share in the tourism market. For international tourists, the three most popular destinations are Paris (Ile de France), London and Hong Kong. Other popular cities are Singapore (11th), Venice (Veneto, 12th), New York (13th), Madrid (20th), Macau (22nd) and Mexico City (Distrito Federal, 24th) although cities like Barcelona (in Cataluña, 8th) and Rome (in Lazio, 19th) also attract many tourists. Outside the cities, the Balearic Islands and the Provence are most popular, followed by the Pearl River Delta (Guangdong),13 Andalucia, Ontario and Yucatan (Quintana Roo). Tirol (14th) is the most popular mountain destination; Tirol is popular in summer too.
For domestic tourism, the situation is completely different. The top 4 destinations are in the USA (California, Florida, Texas and New York), followed by Sichuan and Beijing in China and Madhya Pradesh in India. The rest of the top 25 is mostly China, India and the USA. As domestic tourism outnumbers international tourism by far, the list of most popular tourist destinations is almost identical to the list of domestic destinations. Paris, number 1 on the list of international tourist destinations, ranks 24th on the all tourists list (and 84th on the domestic list); London ranks 52nd, Hong Kong 83rd.
The regional distribution of tourists is very skewed. For international tourists, the Gini coefficient is 85%, for domestic tourists even 90%; for all tourists, it is 88%.
Figure 6 shows the regional distribution of domestic and international tourists in North America. For domestic tourists, the US and the southern half of Canada are most popular, with California, Florida, New York, Texas and Ontario standing out. For international tourists, the pattern is different. Firstly, Canada and Mexico gain in importance, because there are more people from the US travelling to Canada and Mexico than vice versa. Secondly, the US interior attracts almost no international visitors.
Figure 7 shows the regional distribution of domestic and international tourists in Southeast Asia. Java stands out in domestic tourism, while Thailand and Malaysia are more important for international tourism. In Thailand, domestic tourism is spread more or less evenly over the country, whereas international tourists are concentrated in three places.
Figure 8 shows the regional distribution of domestic and international tourists in East Asia. Domestic tourists in China are more or less evenly spread over the eastern half of the country,
13 Guangdong derives its popularity from its proximity to and ties with Hong Kong (Chow, 1988); it also borders Macau.
6

but avoid the west and the north. International tourists in China are almost all on the seaboard, particularly Guangdong, and in Beijing. Tourist in South Korea prefer the east over the west. Tourists spread evenly over Japan.
Figure 9 shows the regional distribution of domestic and international tourists in Europe. International tourists are concentrated in selected places along the Mediterranean, the southern Alps, and London. Other areas that stand out for being more popular than the surrounding areas include North-Holland (Amsterdam), Hamburg, Berlin, the area around Prague, and the Baltic coast of Poland; the land-locked heart of South-West France stands out for being less popular. Domestic tourists are more evenly spread than are international tourists. The west of England and Wales, the Atlantic coast of France, northern Germany and Bavaria are important destinations for domestic tourists, while Krete, Mallorca and North-Holland hardly feature on the map.
Together, Figures 6-9 show that domestic tourists and international tourists have different preferences. It is no surprise that long distance travellers would expect different things from a holiday than would short distance travellers. In Western Europe, where distances are shorter, travel agencies, advertisements and reputations are likely explanations.
4. Discussion and conclusion We present a new, global database of domestic and international tourist numbers at the national and subnational level. The database is publicly available and should serve students of tourism, whether in academia, government or business. We also show selected results.
A few results are worth emphasizing. First, domestic tourism is far more important than is international tourism. Second, China, India, Brazil and Indonesia are important tourism markets, surpassing Germany, France and Japan in either supply or demand or both. Third, cities are magnets for international tourists; domestic tourists show considerably less interest. In general, domestic tourists travel to different places than do international tourists. Fourth, the spatial concentration of tourism is very high.
As with any database, the number of caveats is large. International tourism movements are hard to measure, as tourists mix with other travellers, other travellers disguise as tourists, and some borders are easier to cross unnoticed than others. Domestic tourism movements are even harder to track. We relied as much as we could on comprehensive, internationally consistent databases, but had to supplement this data with data from other sources. Even so, there is a fair degree of interpolation in our database. We use data from different years, and had to re-scale observations to our base year of 1995.
A number of issues present themselves for future work. Obviously, the database will need to be updated to more recent years when those data become available. At the moment, we present the number of tourists per year. Tourism is seasonal, however, and the quarterly or even monthly numbers would be much more useful. Besides the number of tourists, length of stay, expenditures, and resource use would be good additions, as would be a characterisation of the destinations.
Nonetheless, the database here presented is one of a kind, and hopefully as useful to others as it promises to be to us. Updates, corrections, and additions are more than welcome, under the condition that the data will remain in the public domain.
7

Acknowledgements
Alvaro Calzadilla, Poul Grashof, Marie Guillore, Malgorzata Zbylut and particularly Jenny Behm helped with the data and the maps. The CEC DG Research through the DINAS-Coast project (EVK2-2000-22024), the US National Science Foundation through the Center for Integrated Study of the Human Dimensions of Global Change (SBR-9521914), the International Max Planck Research School of Earth System Modelling, the Ecological and Environmental Economics Programme of the International Centre for Theoretical Physics, and the Michael Otto Foundation for Environmental Protection provided welcome financial support. All errors and opinions are ours.
References Alberta Advantage (2003), Frequently Requested Alberta Tourism Statistics, Edmonton.
BC Stats (2003), Tourism Industry Monitor Annual 2002, British Colombia Ministry of Management Services, Vancouver.
Chow, W.S. (1988), ‘Open Policy and Tourism between Guangdong and Hong Kong’, Annals of Tourism Research, 15, 205-218.
CIA (2002), The World Factbook 2002. Central Intelligence Agency, Washington, D.C. http://www.cia.gov/cia/publications/factbook
Euromonitor (2002), Global Market Information Database, http://www.euromonitor.com/gmid/default.asp
FUR (1998), Die Reiseanalyse RA98, Forschungsgemeinschaft Urlaub und Reisen / Zentralarchiv für empirische Sozialforschung, Cologne.
Guillore, M. (2004), Tourism officer Economic Mission of the French Embassy in Italy, personal communication, 14th October 2004.
ITA (2004a), Overseas Visitors to Select US States and Territories, Office of Travel and Tourism Industries, Department of Commerce, Washington, D.C.
ITA (2004b), Canadian Visitation to US Census Regions/States for One or More Nights, Office of Travel and Tourism Industries, Department of Commerce, Washington, D.C.
New, M., Hulme, M. and P.D. Jones, 1999: Representing Twentieth Century Space-Time Climate Variability, Part I: Development of a 1961-1990 Mean Monthly Terrestrial Climatology. Journal of Climate, 12, 829-856.
Nova Scotia Department of Tourism and Culture (2004), Tourism Outlook 2004, Halifax.
Ontario Ministry of Tourism and Recreation (2004), Person Visits in Ontario, 2001-2002, Toronto.
Rule, S., J. Struwig, Z. Langa, J. Viljoen and O. Bouare (2001), South African Domestic Tourism Survey: Marketing the Provinces, Human Science Research Council, South African Tourism and Department of Environment Affairs and Tourism, Pretoria.
Secretaria de Turismo y Deportes (2003), Cantidad de Plazas en Hoteles, Buenos Aires.
Statistics Canada (2004), Trips by Canadians in Canada, Toronto.
Statistics Sasketchewan (2003), Statistical Yearbook, Regina.
Tourism PEI (2003), Economic Impact: Tourism 2002, Tourism Prince Edward Island, Charlottetown.
8

Tourisme Quebec (2004), Le Tourisme au Quebec: Bilan 2002 et Resultats Preliminaires 2003, Tourisme Quebec, Montreal.
US Census Bureau (2002), Statistical Abstract of the United States : Arts, Entertainment, and Recreation (No. 1238: Domestic Travel Expenditures by State), US Census Bureau, Washington, D.C.
Yukon Department of Tourism and Culture (2004), Yukon Border Crossing Statistics, Whitehorse.
WRI (2002), World Resources Database 2002-2003. World Resources Institute, Washington, D.C., USA
WTO (2003), Yearbook of Tourism Statistics, World Tourism Organisation, Madrid.
9

Table 1. Top 10 tourist origins for domestic holidays, international holidays, and all holidays, by tourist numbers (millions).
Domestic International Total Country Number Country Number Country Number United States 999.0 Germany 87.4 United States 1058.5 China 644.0 United States 59.5 China 649.3 India 320.0 United Kingdom 49.1 India 323.6 Brazil 176.2 Russian Federation 25.0 United Kingdom 182.7 United Kingdom 133.6 Malaysia 24.2 Brazil 179.2 Indonesia 107.0 France 21.9 Germany 169.6 Poland 86.7 Canada 21.3 Indonesia 109.1 Germany 82.2 Italy 18.7 Canada 102.3 Canada 80.9 Japan 17.9 France 96.4 Japan 77.8 Hungary 15.3 Japan 95.7
10

Table 2. Top 10 tourist destinations, per country, for domestic holidays, international holidays, and all holidays, by tourist numbers (millions).
Domestic International Total Country Number Country Number Country Number United States 999.0 France 60.0 United States 1042.4 China 644.0 United States 43.4 China 664.0 India 320.0 Spain 39.3 India 322.1 Brazil 176.2 Italy 31.1 Brazil 178.2 United Kingdom 133.6 United Kingdom 23.5 United Kingdom 157.1 Indonesia 107.0 Hungary 20.7 France 134.5 Poland 86.7 Mexico 20.2 Indonesia 111.3 Germany 82.2 China 20.0 Poland 105.9 Canada 80.9 Poland 19.2 Canada 97.9 Japan 77.8 Austria 17.2 Germany 97.0
11

Table 3. Top 25 tourism destinations, per region, for domestic holidays, international holidays, and all holidays, by market share (percentage). Data in italics are interpolated, not observed.
International Domestic Total
Region Country Share Region Country Share Region Country Share
Île de France France 3.43 California United States 3.66 California United States 3.29London United Kingdom 1.88 Florida United States 2.49 Florida United States 2.29Hong Kong China 1.80 Texas United States 1.90 Texas United States 1.66Illes Balears Spain 1.71 New York United States 1.71 New York United States 1.62Provence-Alpes -Côte d'Azur
France
1.45 Sichuan
China
1.52 Sichuan
China
1.32
Guangdong China 1.34 Beijing China 1.48 Beijing China 1.31Andalucia Spain 1.32 Madhya Pradesh India 1.33 Illinois United States 1.15Cataluña Spain 1.32 Illinois United States 1.31 Madhya Pradesh India 1.14Ontario Canada 1.22 Jiangsu China 1.24 Jiangsu China 1.10Quintana Roo Mexico 1.14 Shandong China 1.23 Shandong China 1.07Singapore Singapore 1.13 Nevada United States 1.17 Nevada United States 1.06Veneto Italy 1.12 Shanghai China 1.13 Guangdong China 1.04New York United States 1.10 Zhejiang China 1.03 Shanghai China 1.00Tirol Austria 1.10 Rajasthan India 1.02 Zhejiang China 0.91Florida United States 1.02 Guangdong China 0.99 Rajasthan India 0.88California United States 0.99 Amazonas Brazil 0.94 Ontario Canada 0.88Canarias Spain 0.86 Maharashtra India 0.94 Amazonas Brazil 0.81Toscana Italy 0.80 New Jersey United States 0.90 Maharashtra India 0.81Lazio Italy 0.76 Uttar Pradesh India 0.88 New Jersey United States 0.80Comunidad de Madrid Spain 0.75 Pennsylvania United States 0.87 Pennsylvania United States 0.77San Marino San Marino 0.74 Georgia United States 0.87 Georgia United States 0.77Macau China 0.74 Hubei China 0.86 Uttar Pradesh India 0.76Rhône-Alpes France 0.73 Andhra Pradesh India 0.82 Hubei China 0.75Distrito Federal Mexico 0.66 Ontario Canada 0.82 Île de France France 0.75Lombardia Italy 0.62 Liaoning China 0.81 Andhra Pradesh India 0.71
12

Figure 1. Domestic holidays per country, observed and interpolated (shaded).
13

Figure 2. International departures per country, and observed and interpolated (shaded).
14

Figure 3. International arrivals per country, observed and interpolated (bottom panel).
15
o
Figure 4. Total number of tourists from a country (top panel) and in a country (bottom panel).
16

Figure 5. The share of outbound tourists in all tourists from a country (top panel) and the share of international tourists in all tourists in a country (bottom panel).
17

Figure 6. Regional share of tourists in North America, domestic (top panel) and foreign (bottom panel).
18

Figure 7. Regional share of tourists in South-East Asia, domestic (top panel) and foreign (bottom panel).
19
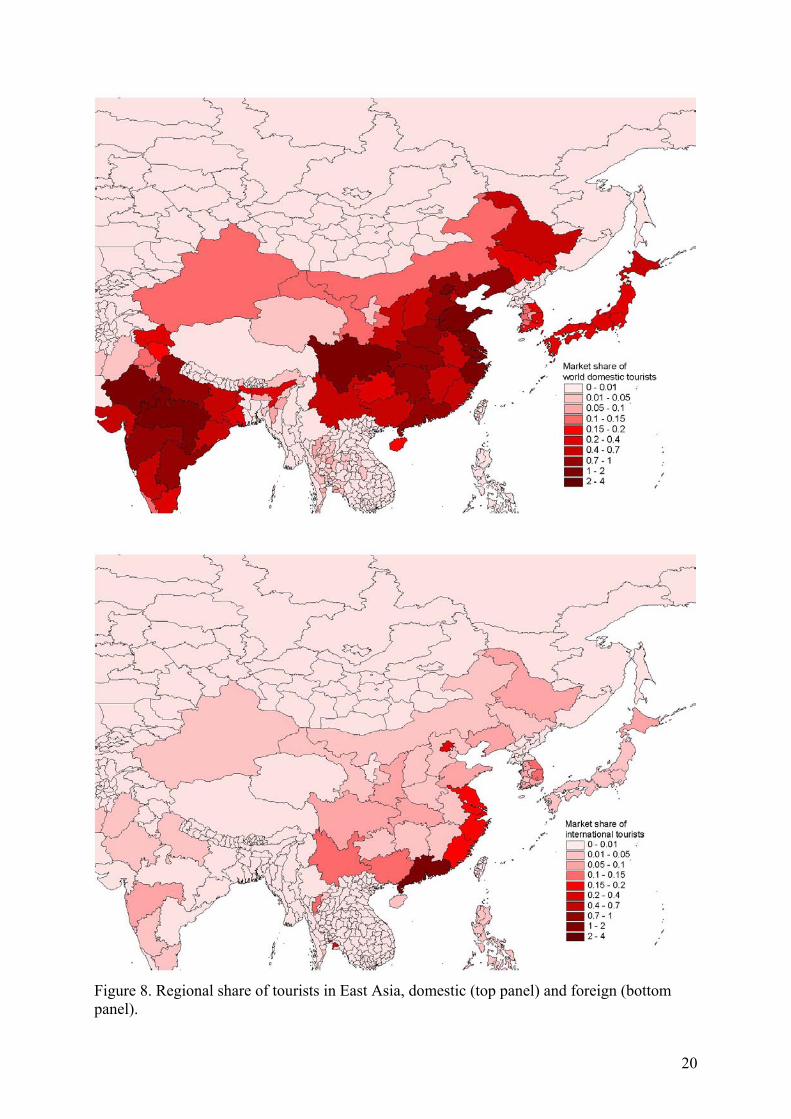
Figure 8. Regional share of tourists in East Asia, domestic (top panel) and foreign (bottom panel).
20

Figure 9. Regional share of tourists in Europe, domestic (top panel) and foreign (bottom panel).
21

Appendix Data sources
International tourism
WRI, 2002: World Resources Database 2002-2003. World Resources Institute, Washington, D.C., USA. http://www.earthtrends.wri.org/ Domestic tourism
Country Source Link YearAlbania Euromonitor http://www.euromonitor.com/gmid/default.asp 1997
Argentina Euromonitor http://www.euromonitor.com/gmid/default.asp 1997
Australia Euromonitor http://www.euromonitor.com/gmid/default.asp 1997
Austria Euromonitor http://www.euromonitor.com/gmid/default.asp 1997
Belgium
Nationaal Instituut voor de Statistiek, Statistiek van Toerisme en Hotelwezen http://www.statbel.fgov.be/figures/d73_nl.asp#1 1997
Bosnia and Herzegovina
Federal Office of Statistics http://www.fzs.ba/Podaci/OSNOVNE%20INFORMACIJE%20O%20FEDEng.htm 2001
Brazil
Tourism in the Northeast of Brazil, Banco do Nordeste, Fortaleza, Brazil http://www.bnb.gov.br/english/progturismo/conteudo/pg-06.htm 1998
Bulgaria Euromonitor http://www.euromonitor.com/gmid/default.asp 1997
Cambodia Leisure Cambodia http://www.leisurecambodia.com/Leisure_Cambodia/No.09/phrase_month.htm 2000
Cameroon http://www.tourism-21.org/f/infos/stats/cameroun.htm 1999
Canada Euromonitor http://www.euromonitor.com/gmid/default.asp 1997
Chile Euromonitor http://www.euromonitor.com/gmid/default.asp 1997
China National Tourism Administration http://www.chinatour.com/data/data.htm 1997
Colombia El Pais, 14th January 2003 http://elpais-cali.terra.com.co/paisonline/notas/Enero142003/A814N1.html 2002
Cote d'Ivoire Euromonitor http://www.euromonitor.com/gmid/default.asp 1997
Croatia Euromonitor http://www.euromonitor.com/gmid/default.asp 1997
Cuba Euromonitor http://www.euromonitor.com/gmid/default.asp 1997
Cyprus Euromonitor http://www.euromonitor.com/gmid/default.asp 1997
Czech Rep Statistical Office http://www.czso.cz/eng/figures/9/92/e190899/data/tab4.pdf 1997
Denmark Euromonitor http://www.euromonitor.com/gmid/default.asp 1997
Egypt Euromonitor http://www.euromonitor.com/gmid/default.asp 1997
Estonia http://www.hurmaster.ee/eng/tourism1.htm 1997
Fiji Bureau of Statistics http://www.statsfiji.gov.fj/f_tourism.html 2001
Finland Statistics Finland http://www.mek.fi/web/MekEng/publish.nsf/(PublishedSheets2)/ 6E68D04CECBC7560C2256D750025FACC?openDocument&sheetList=TourismStatistics 2002
France
INSEE - Direction du Tourisme - Partenaires régionaux http://www.tourisme.gouv.fr/STAT-CONJ/statistiques.htm#hotellerie 2000
Germany Federal Statistical Office http://www.destatis.de/basis/e/tour/tourtab8.htm 1997
Greece National Tourism Organization http://www.gnto.gr/2/01/eb10012.html 1997
22

Hong Kong Euromonitor http://www.euromonitor.com/gmid/default.asp 1997
Hungary Euromonitor http://www.euromonitor.com/gmid/default.asp 1997
Iceland Statistics Iceland http://www.hagstofa.is/template44.asp?PageID=932 2002
India
Express Hotelier & Caterer (January 6, 2003) http://www.tourismofindia.com/misc/time.htm 2000
Indonesia Tourism Indonesia (2003) http://www.tourismindonesia.com/news/270303.asp 2001
Ireland Research & Strategic Planning Fáilte Ireland http://www.failteireland.ie/downloads/Domestic_Brief_2002.doc 1997
Italy
Istituto Nazionale di Statistica- Rilevazione sul movimento nelle strutture ricettive 1999
http://www.istat.it/Comunicati/Fuori-cale/ il-Turiscmo-nel-1999-e-le-aspettativ.htm 1999
Japan
Statistics Bureau of the Ministry of Public Management, Home Affairs, Posts and Telecommunications http://www.stat.go.jp/english/data/shakai/2.htm 1996
Kenya Euromonitor http://www.euromonitor.com/gmid/default.asp 1997
Korea, Rep Euromonitor http://www.euromonitor.com/gmid/default.asp 1997
Latvia Central Statistical Bureau http://www.csb.lv/Satr/rad/N1a.cfm?akurs03=N1a 1997
Liechtenstein
Amt für Volkswirtschaft / Statistik
http://llvweb.liechtenstein.li/lisite/html/liechtenstein/ index.jsp?treeId=WIRT_en_EN&topicId=0.2.2&sync=true 1995
Lithuania
Statistics Lithuania, State Border Guard Service, Department of Tourism http://www.tourism.lt/statist/compendium.htm 1997
Luxembourg Euromonitor http://www.euromonitor.com/gmid/default.asp 1997
Macau Euromonitor http://www.euromonitor.com/gmid/default.asp 1997
Macedonia Euromonitor http://www.euromonitor.com/gmid/default.asp 1997
Malaysia Euromonitor http://www.euromonitor.com/gmid/default.asp 1997
Mali Euromonitor http://www.euromonitor.com/gmid/default.asp 1997
Mexico http://nt.presidencia.gob.mx/Informes/2002Fox2/ website/docs/pdfs/2info_anexo_344-348.pdf 1997
Morocco
Haut Commissariat au Plan, Direction de la Statistique http://www.statistic.gov.ma/tourisme.htm 2000
Netherlands
Centraal Bureau voor de Statistiek, Continue Vakantie Onderzoek, and Euromonitor http://www.euromonitor.com/gmid/default.asp 1997
New Zealand Euromonitor http://www.euromonitor.com/gmid/default.asp 1997
Norway Euromonitor http://www.euromonitor.com/gmid/default.asp 1997
Oman
Ministry of Commerce & Industry, Directorate General of Tourism http://www.mocioman.gov.om/tourism/statistics.html 1997
Pakistan Euromonitor http://www.euromonitor.com/gmid/default.asp 1997
Peru Euromonitor http://www.euromonitor.com/gmid/default.asp 1997
Philippines Euromonitor http://www.euromonitor.com/gmid/default.asp 1997
Poland Euromonitor http://www.euromonitor.com/gmid/default.asp 1997
Portugal Instituto Nacional de Estatistica http://www.ine.pt/prodserv/indicadores/quadros.asp?CodInd=56 2 002
Puerto Rico
Puerto Rico Business Review, (2003) Vol 27 N.4, Government Development Bank http://www.gdb-pur.net/Economia/PRBusiness/PRBusinessEsp.htm 2001
Romania Euromonitor http://www.euromonitor.com/gmid/default.asp 1997Russian Federation Euromonitor http://www.euromonitor.com/gmid/default.asp 1997
Singapore Euromonitor http://www.euromonitor.com/gmid/default.asp 1997
23

Slovakia Euromonitor http://www.euromonitor.com/gmid/default.asp 1997
Slovenia Tourism, Hotels and Restaurants Association
http://www.gzs.si/sloexport/ default.asp?MenuID=51&Menu=Tourism%20and%20Catering#stat 1997
South Africa The Mercury, 13 December 1996 http://www.und.ac.za/und/indic/archives/indicator/winter97/Tdomest.htm 2000
Spain Euromonitor http://www.euromonitor.com/gmid/default.asp 1997
Swaziland Euromonitor http://www.euromonitor.com/gmid/default.asp 1997
Sweden Euromonitor http://www.euromonitor.com/gmid/default.asp 1997
Switzerland
Reisemarkt Schweiz, St. Gallen. 1999 and 2000/01 http://old.stnet.ch/marketing/pass/files/Switzerland02.pdf 1998
Taiwan Euromonitor http://www.euromonitor.com/gmid/default.asp 1997
Thailand Tourism Authority http://www.tat.or.th/stat/web/static_index.php 1997
Tunisia Central Bank, Annual Report, 2002 http://www.bct.gov.tn/francais/download/report/fiche9.pdf 2000
Turkey
Ministry of Tourism, Accommodation Statistics http://www.tursab.org.tr/english/profile/domestic.htm 1998
United Arab Emirates Euromonitor http://www.euromonitor.com/gmid/default.asp 1997United Kingdom Euromonitor http://www.euromonitor.com/gmid/default.asp 1997
United States Euromonitor http://www.euromonitor.com/gmid/default.asp 1997
Viet Nam UNDP Viet Nam Country Office http://www.undp.org.vn/mlist/develvn/031999/post62.htm 1997
Regional tourism
Country Source Year Notes Argentina Secretaria de Turismo y Deportes (2003) 2002 Number of hotel beds Australia Bureau of Tourism Research http://www.btr.gov.au/ 1996
(international) 1998 (domestic)
International and domestic visitor nights
Austria EuroStat 1995 Arrivals of residents and non-residents, NUTS2
Belgium EuroStat 1995 Arrivals of residents and non-residents, NUTS2
Bulgaria EuroStat 1995 Total arrivals, NUTS3 Canada Statistics Canada (2004) 1998 Trips Alberta Alberta Advantage (2003) 1998 Person trips Prince Edward Island
Tourism PEI (2003) 1998 Pleasure parties
Nova Scotia Nova Scotia Department of Tourism and Culture (2004) 2002-3 Non-resident visitation Quebec Tourisme Quebec (2004) 2002-3 Number of tourists Ontario Ontario Ministry of Tourism and Recreation (2004) 2001-2 Overnight visits Manitoba Ryan Schultz, Travel Manitoba, personal communication, 2004 2001-2 Person visits Sasketchewan Statistics Sasketchewan (2003) 1998 Purchases of goods and
services British Colombia BC Stats (2003) 1998 Visitor entries Yukon, NW Territories, Nunavut
Yukon Department of Tourism and Culture (2004) 1998 Border crossings
Newfoundland This study 1995 Ratio of international visitors to Canadian visitors assumed equal to that of Quebec
New Brunswick This study 1995 Ratio of international visitors to Canadian visitors assumed equal to that of Quebec and Nova Scotia averaged
China China Statistical Yearbook 2002 http://www.stats.gov.cn
2001, 2003 Number of domestic and foreign tourists
Cyprus EuroStat 1995 Number of beds, NUTS3
Czech Republic EuroStat 1995 Number of beds, NUTS3
Denmark EuroStat 1995 Arrivals of residents and non-residents, NUTS3
24

Finland EuroStat 1995 Arrivals of residents and non-residents, NUTS2
France EuroStat 1995 Arrivals of residents and non-residents, NUTS2
Germany EuroStat 1995 (Saxony: 1998)
Arrivals of residents and non-residents, NUTS2
Greece EuroStat 1995 Arrivals of residents and non-residents, NUTS2
Hungary EuroStat 1995 Number of beds, NUTS3
India http://www.directories-today.com/i_tourism.htm 1997 Number of foreign tourists; only for the 10 most popular states
Indonesia Bureau of Planning and Statistics http://www.bps.go.id/sector/tourism/tables.shtml
1998 Number of domestic and foreign hotel guests
Ireland EuroStat 1995 Number of beds, NUTS3
Italy EuroStat 1995 Arrivals of residents and non-residents, NUTS2
Japan Statistics Bureau Number of employees in all lodging places for domestic tourists, hotels for foreign tourists
Malaysia http://www.tourism.gov.my/statistic/statistics.asp 2000 Number of domestic and foreign tourists; data for cities and tourist resorts
Mexico Sectretaria de Turismo http://datatur.sectur.gob.mx/jsp/index.jsp
2003 Number of domestic and foreign tourists; missing data for Colima, Tamaulipas and Yucatan
Netherlands EuroStat 1994 Arrivals of residents and non-residents, NUTS2
Norway EuroStat 1995 Arrivals of residents and non-residents, NUTS2
Poland EuroStat 1995 Number of beds, NUTS3
Portugal EuroStat 1995 Arrivals of residents and non-residents, NUTS2
Romania EuroStat 1995 Number of beds, NUTS3
Slovakia EuroStat 1995 Number of beds, NUTS3
South Africa Foreign: Statistics South Africa
http://www.statssa.gov.za/publications/P6442/P6442January1997.pdf Domestic: Rule et al. (2001)
1995-7 Number of foreign bednights; number of domestic tourism trips
Spain EuroStat 1995 Arrivals of residents and non-residents, NUTS2
Switzerland EuroStat 1995, 1998 Arrivals of residents and non-residents, NUTS2
Sweden EuroStat 1995, 1998 Arrivals of residents and non-residents, NUTS2
Thailand Tourism Authority of Thailand 2003 Number of domestic and foreign hotel guests
Turkey http://www.tourismturkey.org/ 1997 Number of beds in licensed accommodation establishments by region, downscaled to province
UK EuroStat 1998 Arrivals of residents and non-residents, NUTS2
USA ITA (2004a,b), US Census Bureau (2002) 1999 Expenditures by domestic tourists, number of foreign tourists
Other countries This study 1995 Number of domestic and foreign tourists proportional to the area of the region
http://www.statssa.gov.za/publications/P6442/P6442December1996.pdf
25

Working Papers
Research Unit Sustainability and Global Change
Hamburg University and Centre for Marine and Atmospheric Science
Bigano, A., J.M. Hamilton and R.S.J. Tol (2004), The impact of climate on holiday destination choice, FNU-55 (submitted)
Bigano, A., J.M. Hamilton, M. Lau, R.S.J. Tol and Y. Zhou (2004), A global database of domestic and international tourist numbers at national and subnational level, FNU-54 (submitted)
Susandi, A. and R.S.J. Tol (2004), Impact of international emission reduction on energy and forestry sector of Indonesia, FNU-53 (submitted)
Hamilton, J.M. and R.S.J. Tol (2004), The Impact of Climate Change on Tourism and Recreation, FNU-52 (submitted)
Schneider, U.A. (2004), Land Use Decision Modelling with Soil Status Dependent Emission Rates, FNU-51 (submitted)
Link, P.M., U.A. Schneider and R.S.J. Tol (2004), Economic impacts of changes in fish population dynamics: the role of the fishermen’s harvesting strategies, FNU-50 (submitted)
Berritella, M., A. Bigano, R. Roson and R.S.J. Tol (2004), A General Equilibrium Analysis of Climate Change Impacts on Tourism, FNU-49 (submitted)
Tol, R.S.J. (2004), The Double Trade-Off between Adaptation and Mitigation for Sea Level Rise: An Application of FUND, FNU-48 (submitted)
Erdil, Erkan and Yetkiner, I. Hakan (2004), A Panel Data Approach for Income-Health Causality, FNU-47
Tol, R.S.J. (2004), Multi-Gas Emission Reduction for Climate Change Policy: An Application of FUND, FNU-46 (submitted)
Tol, R.S.J. (2004), Exchange Rates and Climate Change: An Application of FUND, FNU-45 (submitted)
Gaitan, B., Tol, R.S.J, and Yetkiner, I. Hakan (2004), The Hotelling’s Rule Revisited in a Dynamic General Equilibrium Model, FNU-44 (submitted)
Rehdanz, K. and Tol, R.S.J (2004), On Multi-Period Allocation of Tradable Emission Permits, FNU-43 (submitted)
Link, P.M. and Tol, R.S.J. (2004), Possible Economic Impacts of a Shutdown of the Thermohaline Circulation: An Application of FUND, FNU-42 (forthcoming, Portuguese Economic Journal)
Zhou, Y. and Tol, R.S.J. (2004), Evaluating the costs of desalination and water transport, FNU-41 (submitted to Water Resources Research)
Lau, M. (2004), Küstenzonenmanagement in der Volksrepublik China und Anpassungsstrategien an den Meeresspiegelanstieg,FNU-40 (submitted to Coastline Reports)
Rehdanz, K. and Maddison, D. (2004), The Amenity Value of Climate to German Households, FNU-39 (submitted)
Bosello, F., Lazzarin, M., Roson, R. and Tol, R.S.J. (2004), Economy-wide Estimates of the Implications of Climate Change: Sea Level Rise, FNU-38 (submitted)
Schwoon, M. and Tol, R.S.J. (2004), Optimal CO2-abatement with socio-economic inertia and induced technological change, FNU-37 (submitted)
Hamilton, J.M., Maddison, D.J. and Tol, R.S.J. (2004), The Effects of Climate Change on International Tourism, FNU-36 (submitted to Journal of Sustainable Tourism)
Hansen, O. and R.S.J. Tol (2003), A Refined Inglehart Index of Materialism and Postmaterialism, FNU-35 (submitted)
Heinzow, T. and R.S.J. Tol (2003), Prediction of Crop Yields across four Climate Zones in Germany: An Artificial Neural Network Approach, FNU-34 (submitted to Climate Research)
Tol, R.S.J. (2003), Adaptation and Mitigation: Trade-offs in Substance and Methods, FNU-33 (submitted)
26
Tol, R.S.J. and T. Heinzow (2003), Estimates of the External and Sustainability Costs of Climate Change, FNU-32 (submitted) Hamilton, J.M., Maddison, D.J. and Tol, R.S.J. (2003), Climate change and international tourism: a simulation study, FNU-31 (submitted to Global Environmental Change) Link, P.M. and R.S.J. Tol (2003), Economic impacts of changes in population dynamics of fish on the fisheries in the Barents Sea, FNU-30 (submitted) Link, P.M. (2003), Auswirkungen populationsdynamischer Veränderungen in Fischbeständen auf die Fischereiwirtschaft in der Barentssee, FNU-29 (Essener Geographische Arbeiten, 35, 179-202) Lau, M. (2003), Coastal Zone Management in the People’s Republic of China – An Assessment of Structural Impacts on Decision-making Processes, FNU-28 (submitted) Lau, M. (2003), Coastal Zone Management in the People’s Republic of China – A Unique Approach?, FNU-27 (China Environment Series, Issue 6, pp. 120-124; http://www.wilsoncenter.org/topics/pubs/7-commentaries.pdf ) Roson, R. and R.S.J. Tol (2003), An Integrated Assessment Model of Economy-Energy-Climate – The Model Wiagem: A Comment, FNU-26 (forthcoming in Integrated Assessment) Yetkiner, I.H. (2003), Is There An Indispensable Role For Government During Recovery From An Earthquake? A Theoretical Elaboration, FNU-25 Yetkiner, I.H. (2003), A Short Note On The Solution Procedure Of Barro And Sala-i-Martin for Restoring Constancy Conditions, FNU-24 Schneider, U.A. and B.A. McCarl (2003), Measuring Abatement Potentials When Multiple Change is Present: The Case of Greenhouse Gas Mitigation in U.S. Agriculture and Forestry, FNU-23 (submitted) Zhou, Y. and Tol, R.S.J. (2003), The Implications of Desalination to Water Resources in China - an Economic Perspective, FNU-22 (Desalination, 163 (4), 225-240) Yetkiner, I.H., de Vaal, A., and van Zon, A. (2003), The Cyclical Advancement of Drastic Technologies, FNU-21 Rehdanz, K. and Maddison, D. (2003) Climate and Happiness, FNU 20 (submitted to Ecological Economics) Tol, R.S.J., (2003), The Marginal Costs of Carbon Dioxide Emissions: An Assessment of the Uncertainties, FNU-19 (forthcoming in Energy Policy). Lee, H.C., B.A. McCarl, U.A. Schneider, and C.C. Chen (2003), Leakage and Comparative Advantage Implications of Agricultural Participation in Greenhouse Gas Emission Mitigation, FNU-18 (submitted). Schneider, U.A. and B.A. McCarl (2003), Implications of a Carbon Based Energy Tax for U.S. Agriculture, FNU-17 (submitted). Tol, R.S.J. (2002), Climate, Development, and Malaria: An Application of FUND, FNU-16 (submitted). Hamilton, J.M. (2003), Climate and the Destination Choice of German Tourists, FNU-15 (revised and submitted). Tol, R.S.J. (2002), Technology Protocols for Climate Change: An Application of FUND, FNU-14 (forthcoming in Climate Policy). Rehdanz, K (2002), Hedonic Pricing of Climate Change Impacts to Households in Great Britain, FNU-13 (submitted to Climatic Change). Tol, R.S.J. (2002), Emission Abatement Versus Development As Strategies To Reduce Vulnerability To Climate Change: An Application Of FUND, FNU-12 (submitted to Environment and Development Economics). Rehdanz, K. and Tol, R.S.J. (2002), On National and International Trade in Greenhouse Gas Emission Permits, FNU-11 (submitted). Fankhauser, S. and Tol, R.S.J. (2001), On Climate Change and Growth, FNU-10 (forthcoming in Resource and Energy Economics). Tol, R.S.J.and Verheyen, R. (2001), Liability and Compensation for Climate Change Damages – A Legal and Economic Assessment, FNU-9 (Energy Policy, 32 (9), 1109-1130). Yohe, G. and R.S.J. Tol (2001), Indicators for Social and Economic Coping Capacity – Moving Toward a Working Definition of Adaptive Capacity, FNU-8 (Global Environmental Change, 12 (1), 25-40). Kemfert, C., W. Lise and R.S.J. Tol (2001), Games of Climate Change with International Trade, FNU-7 (Environmental and Resource Economics, 28, 209-232). Tol, R.S.J., W. Lise, B. Morel and B.C.C. van der Zwaan (2001), Technology Development and Diffusion and Incentives to Abate Greenhouse Gas Emissions, FNU-6 (submitted to International Environmental Agreements). Kemfert, C. and R.S.J. Tol (2001), Equity, International Trade and Climate Policy, FNU-5 (International Environmental Agreements, 2, 23-48).
27

Tol, R.S.J., Downing T.E., Fankhauser S., Richels R.G. and Smith J.B. (2001), Progress in Estimating the Marginal Costs of Greenhouse Gas Emissions, FNU-4. (Pollution Atmosphérique – Numéro Spécial: Combien Vaut l’Air Propre?, 155-179). Tol, R.S.J. (2000), How Large is the Uncertainty about Climate Change?, FNU-3 (Climatic Change, 56 (3), 265-289). Tol, R.S.J., S. Fankhauser, R.G. Richels and J.B. Smith (2000), How Much Damage Will Climate Change Do? Recent Estimates, FNU-2 (World Economics, 1 (4), 179-206) Lise, W. and R.S.J. Tol (2000), Impact of Climate on Tourism Demand, FNU-1 (Climatic Change, 55 (4), 429-449).
28