A GLOBAL / COUNTRY STUDY REPORT ON “PAKISTAN ...
175
1 A GLOBAL / COUNTRY STUDY REPORT ON “PAKISTAN” Submitted to Gujarat Technological University IN PARTIAL FULFILLMENT OF THE REQUIREMENT OF THE AWARD FOR THE DEGREE OF MASTER OF BUSINESS ADMINISTRATION S.R. LUTHRA INSTITUTE OF MANAGEMENT (Inst. Code: 805) MBA PROGRAMME Affiliated to Gujarat Technological University, Ahmedabad May 2012
-
Upload
khangminh22 -
Category
Documents
-
view
0 -
download
0
Transcript of A GLOBAL / COUNTRY STUDY REPORT ON “PAKISTAN ...

1
A
GLOBAL / COUNTRY STUDY REPORT
ON
“PAKISTAN”
Submitted to
Gujarat Technological University
IN PARTIAL FULFILLMENT OF THE
REQUIREMENT OF THE AWARD FOR THE DEGREE OF
MASTER OF BUSINESS ADMINISTRATION
S.R. LUTHRA INSTITUTE OF MANAGEMENT (Inst. Code: 805)
MBA PROGRAMME
Affiliated to Gujarat Technological University, Ahmedabad
May 2012

2
TABLE OF CONTENTS
Sr. NO. Particulars Page
NO.
PART I
1 History 2
2 Geography & Topology 8
3 Political & Legal Environment 13
4 Trade & Commerce 19
5 Macro Economic Environment 25
6 Capital Market 32
7 International Trade 39
8 Agriculture 45
9 Manufacturing 50
10 Services 55
PART II
1 Marine Industry 61
2 Iron & Steel Industry 71
3 Pharmaceutical Industry 80
4 Gems & Jewelry Industry 90
5 Leather, Meat & Poultry Industry 100
6 Chemical & Fertilizer Industry 110
7 Textile & Apparel Industry 122
8 Cereals & Pulses 130
9 Fruits & Vegetables 139
10 Dry – Fruits & Spices 143
Bibliography
Annexure

3
HISTORY

4
Pakistan contains the archeological remains of an urban civilization dating back 4,500 years.
Alexander the Great’s empire included the Indus Valley in 326 B.C. His successors founded
the Indo-Greek kingdom of Bactria based in what is today Afghanistan and extending to
Peshawar. Following the rise of the Central Asian Kushan Empire in later centuries, the
Buddhist culture of Afghanistan and Pakistan, centered on the city of Taxila, experienced a
cultural renaissance known as the Gandhara period.
Economy of Pakistan
Pakistan has a semi-industrialized economy and a rapidly developing country. The growth of
economy are situated along the Indus River. Diversified economies of Karachi and Punjab's
urban centers coexist with lesser developed areas in other parts of the country. Despite being
a very poor country in 1947, its economic growth rate has been better than the global average
during the subsequent four decades, but certain policies led to slowdown in the late 1990s.
Recently, wide-ranging economic reforms have resulted in a stronger economic outlook and
increased growth specifically in the manufacturing and financial sectors. Since the 1990s,
there has been an improvement in the foreign exchange position and rapid growth
in currency reserves. Pakistan's gross domestic product, as measured by purchasing power
parity, is estimated to be $475.4 billion while its per capita income is at $2,942. The poverty
rate in Pakistan is estimated to be between 23% and 28%.
GDP growth was steady during the mid-2000s at a rate of 7%; however, slowed down during
the Economic crisis of 2008 to 4.7%. A large inflation rate of 24.4% and a low savings rate,
and other economic factors, continue to make it difficult to sustain a high growth
rate. Pakistan's GDP is US$167 billions, which makes it the 48th-largest economy in the
world or 27th largest by purchasing power adjusted exchange rates. Today, it is regarded as
having the second largest economy in South Asia.
The structure of the economy has changed from a mainly agricultural base to a strong service
base. Agriculture now only accounts for 20% of the GDP, while the service sector accounts
for 53% of the GDP. Significant foreign investments have been made in several areas
including telecommunications, real estate and energy. Other important industries include
apparel and textiles, food processing, chemicals manufacture, and the iron and steel
industries. Pakistan's exports in 2008 amounted to $20.62 billion (USD).
5
Demographic view of Pakistan
The estimated population of Pakistan in 2010 was over 170 million making it the world's
sixth most-populous country, behind Brazil and ahead of Bangladesh. In 1951 Pakistan had a
population of 34 million. The population growth rate stands at 1.6%. It is expected that by
2030, Pakistan will overtake Indonesia as the largest Muslim country in the world.
Life expectancy at birth is 63 years for females and 62 years for males as of 2006 compared
to the healthy life expectancy at birth which was 54 years for males and 52 years for females
in 2003. Expenditure on health was at 2% of the GDP in 2006. It is a multilingual country
with more than sixty languages being spoken. English is the official language of Pakistan and
used in official business, government, and legal contracts, and Punjabi has a plurality of
native speakers. Urdu is the lingua franca and national language in Pakistan. Punjabi is the
regional language of Punjab. Saraiki is also spoken in the larger area of Punjab
province. Pashto is the provincial language of Khyber Pakhtunkhwa. Sindhi is the provincial
language of Sindh and Balochi is the provincial language of Balochistan.
The World Bank considers Pakistan a low-income country. GDP is around $166 billion at the
official exchange rate. The population numbered some 167 million in 2008 with a 1.81%
growth rate. No more than 55.0% of adults are literate, and life expectancy is about 64 years.
In FY 2008-2009, the GDP growth rate was 3.7%, and unemployment was estimated at 14%.
Year-over-year consumer price inflation averaged 13.6% in 2009. Main inflation drivers
include food and utility prices, the Pakistani rupee’s depreciation versus the U.S. dollar, and
higher international commodity prices. Low levels of spending in the social services and high
population growth have contributed to persistent poverty and unequal income distribution.
Pakistan's extreme poverty and underdevelopment are key concerns, specifically in rural
areas.
Religion in Pakistan
About 97 % of all Pakistanis are Muslims. Official documentation states that Sunni Muslims
constitute 77 % of the population and that adherents of Shia Islam make up an additional 20
%. Christians, Hindus, and members of other religions each account for about 1 % of the
population.

6
Literature
Pakistani literature originates from when Pakistan gained its nationhood as a sovereign state
in 1947. The common and shared tradition of Urdu literature and English literature of South
Asia was inherited by the new state. Over a period of time, a body of literature unique to
Pakistan has emerged all major Pakistani languages, including Pushto, Seraiki, Balochi,
Urdu, English, Punjabi and Sindhi.
Music
It ranges from traditional styles such as Qawwali and Ghazal to more modern forms that fuse
traditional Pakistani music with Western music. Pakistani music is represented by a wide
variety of forms.
Drama and theatre
These are very similar to stage plays in theatres. They are performed by well-known actors
and actresses in the Lollywood industry. The dramas and plays deal with many themes from
life events, often with a humorous touch. Pakistani poetry is the best.
Architecture
Mohenjo Daro, Harappa and Kot Diji belong to the pre-Islamic era settlements. The rise
of Buddhism and the Persian and Greek influence led to the development of the Greco-
Buddhist style, starting from the 1st century CE. The high point of this era was reached with
the culmination of the Gandhara style. An example of Buddhist architecture is the ruins of the
Buddhist monastery Takht-i-Bahi in Khyber-Pakhtunkhwa..
Recreation and sports
The official national sport of Pakistan is field hockey with squash and cricket also very
popular. The national cricket team has won the Cricket World Cup once (in 1992), were
runners-up once (in 1999), and co-hosted the games twice (in 1987 and 1996). Additionally,
they have also won the ICC World Twenty20 once (in 2009), and were runners-up (in 2007).
The team has also won the Australasia Cup in 1986, 1990, and 1994.

7
Cuisine
Urban centres of the country offer an amalgamation of recipes from all parts of the country,
while food with specific local ingredients and tastes is available in rural areas and villages.
Besides the main dishes of salan, with or without meat and cooked with vegetables or lentils,
there are a number of provincial specialties such as biryani, karahi, and tikka, in various
forms and flavours, eaten alongside a variety of breads such as naan,chapati and roti.
Ramadan
The holiest month of the Islamic Calendar, which is a month of fasting from sunrise to sunset
and self discipline, it is widely observed in Pakistan.
Eid celebrations
The two Eids, Eid ul-Fitr and Eid ul-Adha, commemorate the passing of the month of fasting,
Ramadan, and the willingness of Ibrahim to sacrifice his son Ishmael for God. On the night
before Eid, people search for the new moon to mark the end of Ramadan and arrival of Eid
ul-Fitr. On Eid ul-Fitr, money is given for charity and as gifts to young children. On Eid ul-
Adha, people may also distribute meat to relatives and neighbors and donate food for charity.
Muharram (Ashura)
In Pakistan, the first ten days of Muharram are observed officially. The 10th day of
Muharram is marked in the memory of Imam Hussain (Aliahsalam), the grandson of
Muhammad, who was a martyr, along with 72 family members, friends and followers during
the Battle of Karbala.
Independence Day
On August 14, the people of Pakistan celebrate the day Pakistan gained its independence
from British India and formed an independent state for Muslims.
8
National Dress
The national dress of Pakistan is Shalwar Qameez (for both men and women. It consists of a
long, loose fitting tunic with very baggy trousers. The men's version consists of solid,
masculine colours, and is almost always accompanied by a collar and buttons (similar to a
polo shirt). Men often wear an outer waistcoat over the shalwar kameez.
The sherwani or achkan with karakul hat is the recommended dress for male government
employees and officials, as it is not specifically associated with any of the provinces. Most
male government officials wear the formal black sherwani on state occasions.
The women's version almost never contains collar and buttons but is often embroidered and
consists of feminine colors and may feature lace or flower patterns.
Ethnic groups
Pakistanis are diverse, many possessing dark hair and eyes but light coloured eyes and light
coloured hair do occur in significant portions of the population as well. The
typical Pakistani can range from light to dark brown skin tones with a few exceptions in
mountainous regions of the north. Many of the people inhabiting Pakistan's western regions
share genetic affinities with ethnic groups in Iran, Afghanistan and Tajikistan. While the
racial features of each ethnic group in Pakistan are not uniform, Chitrali's and some of
the Dardic tribes in the north are the most Caucasoid phenotypically, followed by the
Pashtuns, Kashmiris, Balochis, Punjabis, and Sindhis, Muhajirs, and Seraikis. Pakistan's
genetic diversity is due to various factors including the numerous waves of migration from
other regions and include Aryans mainly in smaller amounts Greeks,
Iranians, Arabs, Turks, Scythians, Afghans to name a few and also because of its geopolitical
location straddling the Iranian Plateau, Central Asian, Tibetan and South Asian genetic
spheres and as a result, the phenotypic expression of its people is reflective of this diversity.
Large influxes of refugees from the surrounding nations have further exacerbated this change
(Muhajirs from India in 1947, Kashmiris refugees in 1948, Iranians in 1978, Afghans in th
1980s, Tajiks and Iraqis in 2001 etc..)
9
GEOGRAPHY &
TOPOLOGY

10
Pakistan is situated in South Asia. Pakistan’s southern boundary with 1,064 km of
coastline is The Arabian Sea.
The country is extended into a total area of 796,095 sq km and is nearly four times the size of
the United Kingdom. The country extends more than 1,800 km to the Khunjerab Pass on
China' border, From Gwadar Bay in its south-eastern corner. It is divided into four main
provinces: Sindh, Punjab, Khyber Pakhtun Khwa and Balochistan.
The country has a great agricultural economy including canals irrigating a major part of its
cultivated land. The major crops are Wheat, cotton, rice, millet and sugar cane. In abundance
in different parts of the country the fruits are grown like: mangos, oranges, bananas and
apples. The major natural resources are natural gas, coal, salt and iron. The country has a
growing industry. In its economy, Cotton, Textiles, sugar, cement, and chemicals play an
important role.
It is having such physical regions as a) the western offshoots of Himalayas which cover its
northern and north western parts of which the highest peak K-2 rises to 8611 meters above
sea level; b) the Balochistan plateau c) The Potohar Plateau and salt range and d) The Indus
plain, the most fertile and densely populated area of the country. It gets its sustenance from
the Indus River and its tributaries.
Bordering Countries- Afghanistan, Iran, India and China
Land Area- 307,374 square miles (796,095 sq km)
Coastline- 650 miles (1,046 km)
Highest Point- K2 at 28,251 feet (8,611 m)
Major Cities- Pakistan has seven cities Karachi, Lahore, Faisalabad, Rawalpindi, Multan,
Hyderabad, and Gujranwala.
Principal Rivers- The main rivers are the Indus (2,749 kilometers within Pakistan) and its
tributaries: the Chenab (730.6 kilometers), Ravi (680.6 kilometers), Jhelum (611.3
kilometers), and Sutlej (530.6 kilometers). As a result of seasonal variations in water flows

11
and the presence of substantial irrigation structures, the navigable portions of these rivers are
generally small and unconnected
Land Boundaries- Pakistan is sharing borders with Afghanistan (2,430 kilometers), China
(523 kilometers), India (2,912 kilometers), and Iran (909 kilometers).
Natural Resources- The natural resources are the most important economic tool that
includes arable land, chromite, coal, copper, fireclay, gypsum, iron, limestone, oil, natural
gas, rock salt, and silica sand.
Land Use- Approximately 22 million hectares are used for cultivation, of which nearly 16
million hectares are actually sown, with the remainder left fallow. About 13.5 million
hectares of the sown area are irrigated, and 6.5 million hectares are sown more than once per
year. Pakistan has an extensive but inefficient canal system for irrigation, and much of the
crop area is rain fed, but precipitation tends to be unevenly distributed throughout the year.
Industries- 40% of working population is employed in agriculture. Industries includes
chemical, petro chemical, cement, dairy, fertilizers, leather, oil and Gas, paper, pulp and
sugar industries and so on. As 9.2 million hectares are unused but believed to be cultivable,
so this area can be used for cultivation for agro based industries such as fertilizer, sugar
industries, cotton industries etc. so as to increase the country’s total GDP.
Duration of Climate :-
Season Duration
Cold season Mid Nov to Mid April
Hot Season Mid April to Mid June
Warm Season Mid September to Mid Nov
Monsoon season Mid July to Mid September
Topography
Pakistan is an oblong stretch of land between the Arabian sea and Karakoram mountains,
lying diagonally between 24° N and 37° N latitudes and 61° E and 75° E longitudes, and
covering an area of 87.98 million hectares. Pakistan is located on a great landmass, north of
the Tropic of Cancer (between Latitudes 24 degree and 27 degree )

12
More than two-thirds of Pakistan is arid or semiarid. In the northern areas of Pakistan, the
forest-clad hills give way to lofty ranges, including 60 peaks over 6,700 m (22,000 ft) high.
K-2 (Godwin Austen), at 8,611 m (28,250 ft), is the second-highest mountain in the world.
The principal ranges, trending NW – SE , include several Himalayan ranges—notably the Pir
Panjal and Zaskar—leading into the Karakoram Mountains. The Indus is the principal river of
Pakistan. Its major tributaries are the Jhelum, Chenab, Ravi, and Sutlej.
Table of Irrigable Area and Area Covered by Forest
Forest Type NWFP Punjab Sindh Balochistan Northern
Areas
Azad
Kashmir
Total
Coniferous 1105 29 - 131 285 361 1911
Irr. Plantations - 142 82 - 2 - 226
Riverain
Forests
- 51 241 5 - - 297
Scrub Forests 115 340 10 163 658 1 1287
Coastal Forests - - 345 - - - 345
Mazri Lands 24 - - - - - 24
Linear Pltns. 2 4 - - - - 6
Private Pltns. 159 - - - - - 159
Range Lands 150 2683 490 787 2104 195 6409
TOTAL: 1555 3249 1168 1086 3049 557 10664
Pakistan: Breakdown of forest types, 2010
Primary forest (1000 ha | % of forest area) 0 0
Other naturally regenerated forest (1000 ha | % of forest area) 1347 80
Planted Forest (1000 ha | % of forest area) 340 20
13
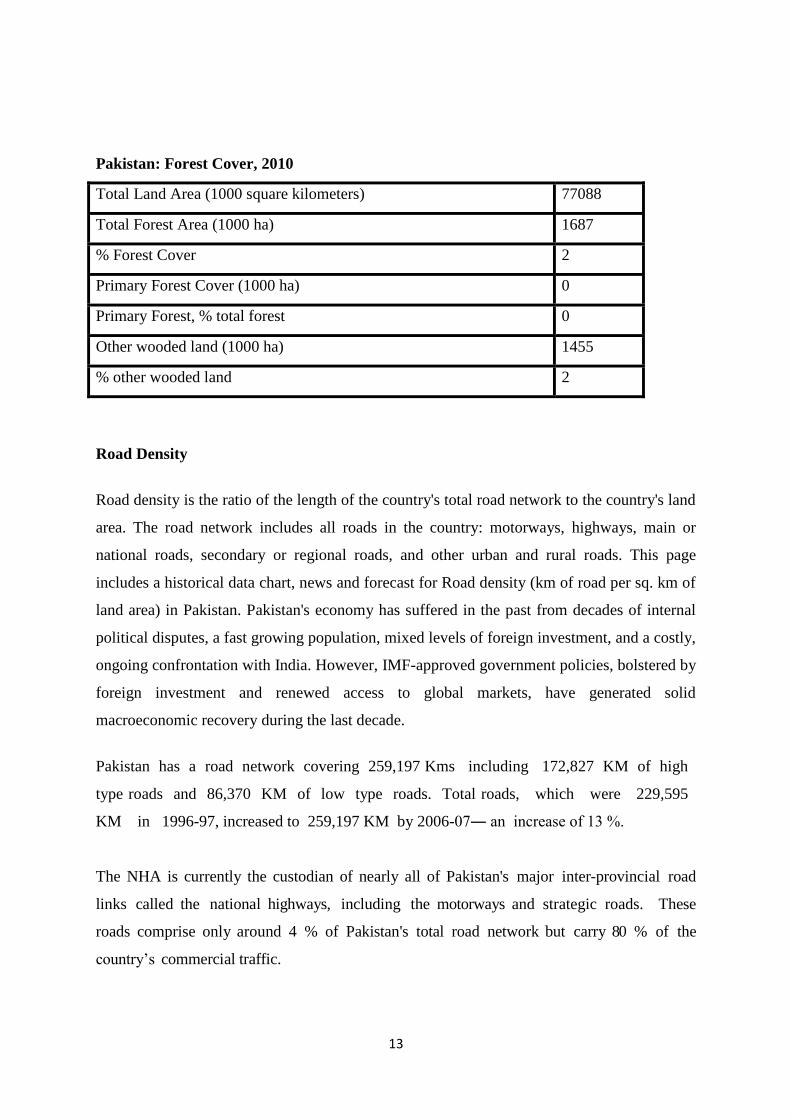
Pakistan: Forest Cover, 2010
Total Land Area (1000 square kilometers) 77088
Total Forest Area (1000 ha) 1687
% Forest Cover 2
Primary Forest Cover (1000 ha) 0
Primary Forest, % total forest 0
Other wooded land (1000 ha) 1455
% other wooded land 2
Road Density
Road density is the ratio of the length of the country's total road network to the country's land
area. The road network includes all roads in the country: motorways, highways, main or
national roads, secondary or regional roads, and other urban and rural roads. This page
includes a historical data chart, news and forecast for Road density (km of road per sq. km of
land area) in Pakistan. Pakistan's economy has suffered in the past from decades of internal
political disputes, a fast growing population, mixed levels of foreign investment, and a costly,
ongoing confrontation with India. However, IMF-approved government policies, bolstered by
foreign investment and renewed access to global markets, have generated solid
macroeconomic recovery during the last decade.
Pakistan has a road network covering 259,197 Kms including 172,827 KM of high
type roads and 86,370 KM of low type roads. Total roads, which were 229,595
KM in 1996-97, increased to 259,197 KM by 2006-07― an increase of 13 %.
The NHA is currently the custodian of nearly all of Pakistan's major inter-provincial road
links called the national highways, including the motorways and strategic roads. These
roads comprise only around 4 % of Pakistan's total road network but carry 80 % of the
country’s commercial traffic.

14
POLITICAL & LEGAL
ENVIRONMENT

15
situation of Pakistan
Executive Branch
Main office holders
Office Name Party Since
President Asif Ali Zardari PPP 9 September 2008
Prime Minister Yousaf Raza Gillani PPP March 25, 2008
Legislative Branch
The bicameral federal legislature consists of the Senate (upper house) and National Assembly
(lower house). According to Article 50 of the Constitution, the National Assembly, the Senate
and the President together make up a body known as the Majlis-i-Shoora (Council of
Advisers).
Senate
The chairman of the Senate, under the constitution, is next in line to act as president should
the office become vacant and until such time as a new president can be formally elected. Both
the Senate and the National Assembly can initiate and pass legislation except for finance
bills. Only the National Assembly can approve the federal budget and all finance bills.
National Assembly of Pakistan
Members of the National Assembly are elected by universal adult suffrage (formerly twenty-
one years of age and older but the seventeenth amendment changed it to eighteen years of
age.).
Judicial Branch
The judiciary includes the Supreme Court, provincial high courts, District & sessions Courts,
Civil and Magistrate courts exercising civil and criminal jurisdiction. Some federal and
provincial courts and tribunals such as Services court, Income tax & excise court, Banking
court and Boards of Revenue's Tribunals are as well established in all province

16
Political Parties and Elections
SOURCE: Election Commission Of Pakistan, Adam Carr's Electoral Archive
Supreme Court
The Supreme Court has original, appellate, and advisory jurisdiction. The Chief Justice of the
Supreme Court is appointed by the president; the other Supreme Court judges are appointed
by the president after consultation with the chief justice. The chief justice and judges of the
Supreme Court may remain in office until age sixty-five: now 68 years and this is also
another clause of seventeenth amendment.
Federal Shariat Court (FSC) of Pakistan
FSC is a court which has the power to examine and determine whether the laws of the
country comply with Shari'a law. It consists of 8 Muslim judges appointed by the President of
Pakistan after consulting the Chief Justice of this Court. Appeal against its decisions lie to the
Shariat Appellate Bench of the Supreme Court, consisting of 3 Muslim judges of the
Supreme Court and 2 Ulema, appointed by the President. If any part of the law is declared to
be against Islamic law, the government is required to take necessary steps to amend such law
appropriately.
17
Provincial & High Courts
In every province, there is one High Court. Currently all four provinces Punjab, Sindh,
Khyber Pakhtunkhwa and Balochistan have High courts, respectively called Lahore High
Court, Sindh High Court, Peshawar High Court, and Balochistan High Court.
Major laws governing Pakistan
The major laws governing Pakistan are
Labour Policy - Issued by the Government of Pakistan lays down the parameters for the
growth of trade unionism, the protection of workers’ rights, the settlement of industrial
disputes, and the redress of workers’ grievances.
Child Labour Policy - Child below the age of 14 shall not be engaged in any factory or mine
or in any other hazardous employment. All forms of forced labour and traffic in human
beings are prohibited.
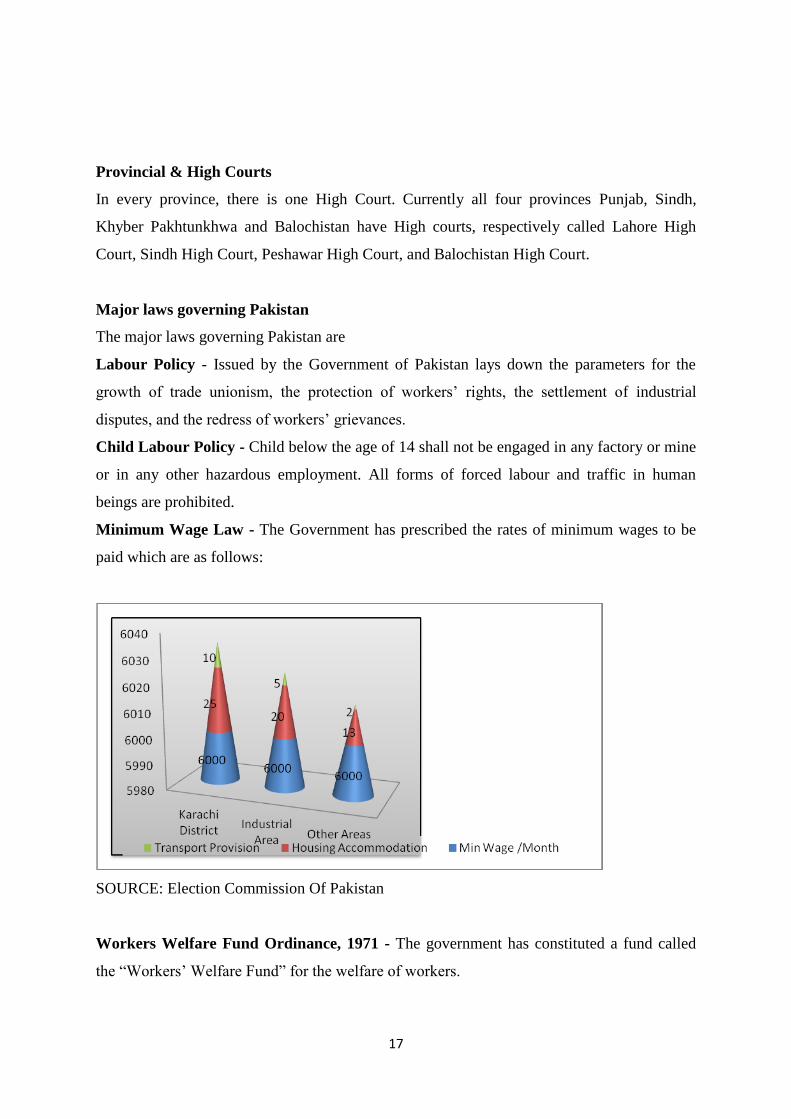
Minimum Wage Law - The Government has prescribed the rates of minimum wages to be
paid which are as follows:
SOURCE: Election Commission Of Pakistan
Workers Welfare Fund Ordinance, 1971 - The government has constituted a fund called
the “Workers’ Welfare Fund” for the welfare of workers.

18
Employees’ Old Age Benefits Act, 1976 - The 1976 Employees Old Age Benefits Act is
applicable to every industry or establishment where five or more persons are employed
directly or indirectly. The Employee Old Age Benefits Institute (the Institute) formed under it
collects and receives contributions, donations, bequests and all other payments. It deals with
pensions, invalidity pension, widow’s pensions, old age grants and other benefits, out of
contribution payable to the Institute by every employer of industry.
Employment—Legal Requirements - A typical work week is 48 hours for a full-time
employee, six days a week, eight hours a day. No employee can be required to work more
than nine hours a day without payment of overtime (double wages) and no more than 624
hours total during a one-year period. U.S. companies and government offices tend to follow a
shortened five-day work week of 42 to 45 hours. Seasonal (or outdoor) businesses serve as
the exception to this rule. There are no restrictions on hiring foreign employees, though prior
to doing so a company needs to obtain permission from the Board of Investment (BOI).
Legal and Registration of a Business
A business in Pakistan may be organized as a sole proprietorship, a partnership, or as a public
or private limited company. Foreign investors generally establish limited companies. They
must register with the Securities & Exchange Commission of Pakistan Company registration
offices are located in each of the provincial capitals and also in Islamabad and Multan.
Foreign and domestic investors are free to establish and own business enterprises in all
sectors of the economy with the exception of five restricted sectors: arms and munitions, high
explosives, currency/mint operations, nonindustrial alcohol, and radioactive substances.
Private entities are similarly free to acquire and dispose of their interests in business
enterprises.
Corporate and Employer Tax Obligations
Tax residency for a business: A company is considered resident for a tax year if it is
incorporated or formed by or under any law in force in Pakistan, the control and management
of its affairs is situated wholly in Pakistan at any time in the year, or if it is a provincial
government or a local authority in Pakistan.
Corporate taxes: Corporate income tax, social security tax, corporate pension contribution,
and value-added tax may all apply.
19
License requirements
Specialised Businesses
In Pakistan, certain businesses have been declared specialised and in addition to corporate
and tax requirements, a specific license is required to commence such businesses. Such
businesses are Banking Companies, Non‐ Banking Finance Companies, Security Service
Providing Companies, Corporate Brokerage Houses, Money Exchange Companies, a
Company which invests in Arms and Ammunition, Security Printing, Currency and Mint,
High Explosives and Radio Active Substances. Certain conditions e.g. as to minimum capital,
qualification of directors, corporate structure and area of operations etc. are required to be
complied with to obtain these licenses. However, the conditions for grant of license may vary
from business to business.
Foreign Investors in Pakistan
A foreign investor may establish an independent business with any of above mentioned
corporate structures. He can establish a sole proprietorship, can enter into partnership with
any local person or foreigner and even can establish a company with or without participation
of local shareholder(s) and director(s). If a foreign enterprise wishes to establish a business in
Pakistan as a part of its international operations, in addition to the said corporate structures it
can obtain registration with Board of Investment – Government of Pakistan, for opening of a
branch office, marketing office or liaison office. Companies Ordinance 1984 imposes certain
restrictions on the operations of the enterprise.
20
TRADE &
COMMERCE
21
TRADE, COMMERCE AND INDUSTRY
India Pakistan Trade Relations are facilitated by the Federation of Indian Chambers and
Commerce (FICCI) and the Federation of Pakistan Chambers of Commerce & Industry
(FPCCI). FICCI and FPCCI are the representatives of the trade and business community of
their respective countries. The main objective of these two chambers of commerce is to
facilitate trade and business opportunities between India and Pakistan. Further, their common
goal is to increase ethical business activities between each other and within all South Asian
nations. India Pakistan trade relations are focused on some policies.
Manufacturing Sector:
100% equity holding is allowed to the foreign investors on industrial projects,
which do not require any formal permission from the government of Pakistan.
No Objection Certificates (NOC) is not required for setting-up a business unit in
Pakistan except for areas that are marked as negative for business development.
Non-manufacturing sector:
Registration of the companies with Security Exchange Commission of Pakistan under the
Companies Ordinance, 1984 is a must. Further, the State Bank of Pakistan's relevant
provisions are to be met accordingly for making investments in Pakistan or setting up
a business in Pakistan. The government of Pakistan has further eased the investment norms
for the Pakistani repatriates to facilitate investment into Pakistan's domestic market.
Foreign investment in Pakistani market are now allowed in sectors like
Service
Infrastructure
Social and Agriculture
Export of Pakistan
Textile
Textile could be termed as the backbone of Pakistan's economy. It provides employment
to 38 % of overall labour force of the country and accounts for 27 % of value addition in

22
the manufacturing sector. The size of the cotton crop is not only higher (10.7 million
bales), but it exceeded the current year's target (9.7 million bales).
Carpets
The main buyers of carpets and rugs are Germany and USA. Pakistan's carpet and rug
industry is facing stiff competition in recent years. China, India and Iran have devalued
their currencies considerably and are giving us stiff competition.
Raw cotton
Cotton is the main cash crop and contributes significantly to the national economy. It
accounts for 11.5% of value added in agriculture and about 2.8% of GDP. In addition to
providing raw material is a major export item.
Rice
Rice is the second largest staple food crop in Pakistan and is also a major export item. It
accounts for 6.6% in value added in agriculture and 1.6% in GDP.
Leather
During the last 20 years, the industry has flourished by using trained and skilled
operations. The percentage share of leather in total export was 8.1% in 2000-01.The
industry has a potential to increase exports to 1 billion dollars in a span of ten years by
promotion of leather footwear.
Vegetable
Production of Mung and Mash has increased by 10.2 % and 8.0 %; respectively while the
production of Masoor declined by 5.9 % during 2000-01.
Production or potato and onion are estimated to have decreased by 7.6 and 9.2 %,
respectively while production of chillies is estimated to increase by 42.0 % in 2000-01
over the last year.
Fruits
Fruit’s is one of Pakistan's major exports. There are many units working in the Fruits
fields. They are producing good Fruits. Pakistan Fruits is famous around the world. Many
Fruits shows are arranged in Expo center Karachi to show the quality Fruits of Pakistan.
Fish

23
Pakistan also exports a reasonable quantity of shrimp and fish and earns a substantial
amount of foreign exchange. Thus, during the calendar year 2000, 84693 m. tons of
fishery products were exported to Japan, USA, UK, Germany, Middle East and other
countries.
The total number of persons engaged in fisheries sector is estimated at 360,000. Out of
which, 135,000 persons (37.5 %) were engaged in marine sector and 225,000 (62.5 %) in
inland fisheries.
Sports goods
Pakistan Sports Goods is famous around the world. Many Sports Goods shows are
arranged in Expo Center Karachi to show the quality Sports Goods of Pakistan.
Sugar
Its shares in value added in agriculture and GDP are 6.4 % and 1.5 %, respectively.
Sugarcane was cultivated on an area of 961 thousand hectares during the current fiscal
year, showing a decline of 4.9 % over the last estimated at 43608 thousand tonnes which
is lower by almost 5.9 %, as compared with last year.
Import of Pakistan
Textile machinery
The trade volume of supply of Textile Machinery, which showed an increase of 20 %
during the year, is set to register a further 25-30 % increase during the year 2005.
Electrical machinery
The total imports of Electrical Machinery in this year $12.85 billion as against the total
imports of $10.33 billion. Pakistan has imported 8,442,611 MT (metric tons) of Electrical
products in this year at the cost of $1.694 billion and 6,792,071 MT at the cost of $1.3
billion, while the country imported 9,228,545 MT Electrical Products at the cost of $1.57
billion and 7,140,384
Silk yarn
The imports, of Silk Yarn remained at $524 million as against the imports of $406 million
in the previous year. The country imported $97.9 million construction and mining
machinery, which was in 2001-02 imported at the cost of $118 million. Pakistan imported
Silk Yarn worth $211 million.

24
Plastic
The provincial government is said to have ordered purchase of 20 million woven
polypropylene (WPP) bags for storage of wheat this year. The government was buying
20,000 bales of 1,000 bags each. About 7,000 bales are bought at the rate of Rs12.79 per
bag against last year's Rs12.25 per bag and the remaining 13,000 bales at the rate of
Rs13.15 per bag.
Medical product
The government has reduced the customs duty from 10% to 5% on import of medical
equipment and apparatus based on the use of X-rays or other radiation which were used
for diagnostic purposes in the hospitals and medical institutions.
Iron, Steel and Aluminum
Pakistan Steel is one of the important ventures in public sector industries, which is aimed
at providing basic raw material to local high-tech industries in the country. The installed
capacity of 1.1 million tonnes of raw steel is extendable up to 3 million tonnes. The main
products of Pakistan Steel are coke, pig iron, billets, hot rolled coils / sheets, galvanized
sheets etc.
Pakistan's Import and Export Indicators and Statistics at a Glance (2010)
IMPORTS

25
EXPORTS
Leading from world bank (year by year chart)

26
MACRO ECONOMIC
ENVIRONMENT

27
The macro environment will influence performance, and the amount of the influence will
depend on how much of the company's business is dependent on the overall
economy. Cyclical industries, for example, are heavily influenced by the macro environment.
Macro environment is basically a combination of a number of factors. Macro environment
is beyond the control of an individual of a firm. Macro environment is formed by
the policies of the rule as well as the general conditions in the world. The Macro environment
of Pakistan constitutes of the following:
Technological: Pakistan man a developing country is much behind the developed countries
in technology. However, the previous government be very supportive of technology due to
which a dramatic change in the telecommunications and other mechanical industries were
seen.
Political/Legal: Pakistan is a politically unstable country these days. The government is new
and faces a number of problems such as corrupt individuals, internal terrorism, external
pressure etc. The legal condition is also very serious as the Chief Justice of Pakistan himself
is aggression a war against the government for getting his rightful status.
Economic: There is a lot of inflation and the country is dependent on IMF for all its desires.
Socio-cultural: The society is modernizing day by day. People are getting away from their
old culture, especially within the modern and urban areas.
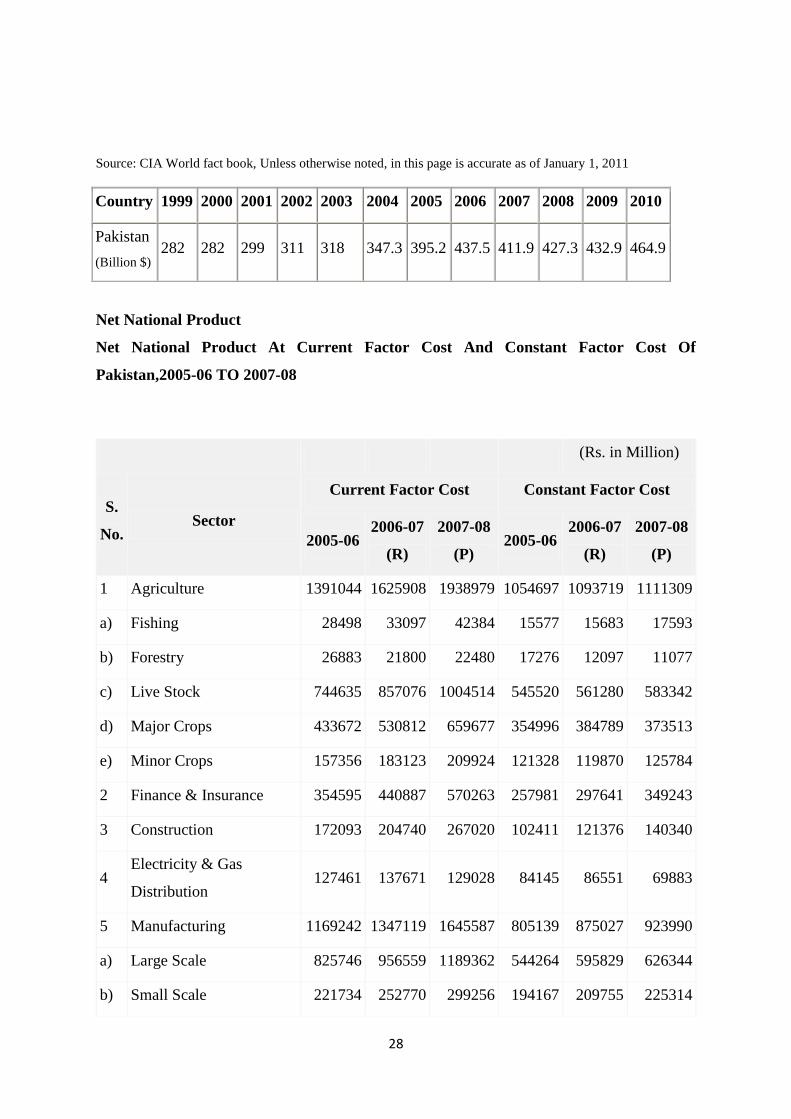
Gross Domestic Product
28
Source: CIA World fact book, Unless otherwise noted, in this page is accurate as of January 1, 2011
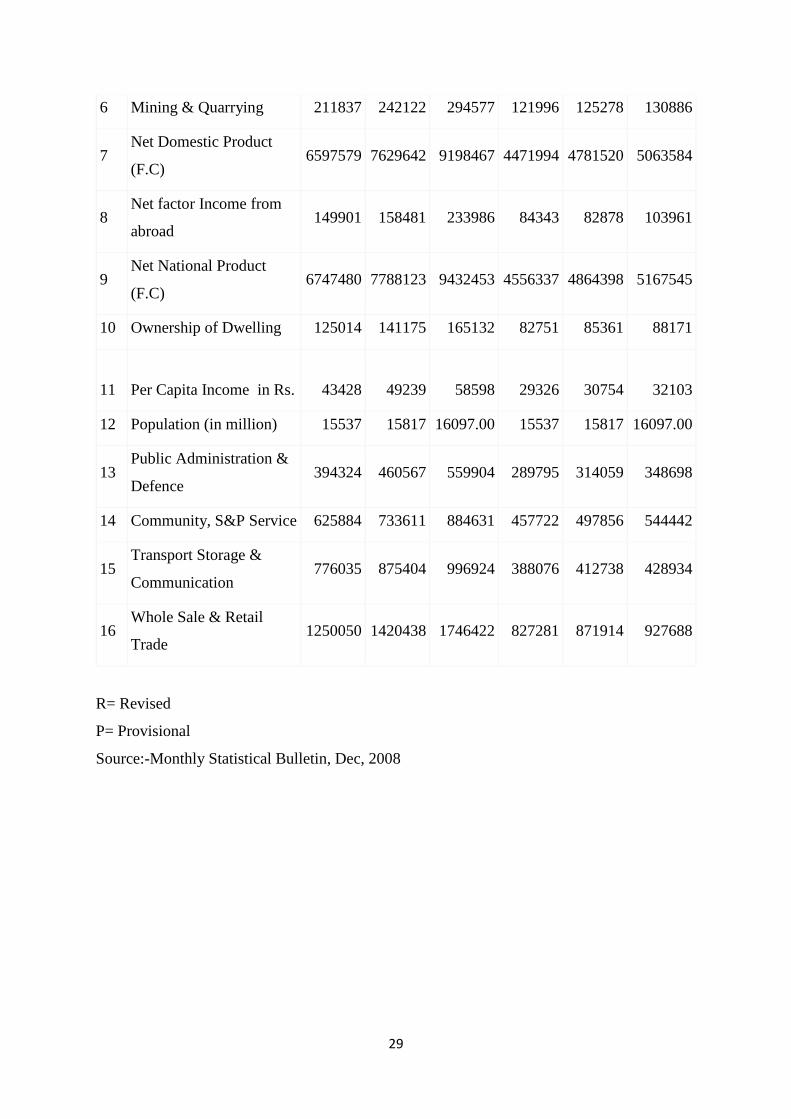
Net National Product
Net National Product At Current Factor Cost And Constant Factor Cost Of
Pakistan,2005-06 TO 2007-08
(Rs. in Million)
S.
No. Sector
Current Factor Cost Constant Factor Cost
2005-06 2006-07
(R)
2007-08
(P) 2005-06
2006-07
(R)
2007-08
(P)
1 Agriculture 1391044 1625908 1938979 1054697 1093719 1111309
a) Fishing 28498 33097 42384 15577 15683 17593
b) Forestry 26883 21800 22480 17276 12097 11077
c) Live Stock 744635 857076 1004514 545520 561280 583342
d) Major Crops 433672 530812 659677 354996 384789 373513
e) Minor Crops 157356 183123 209924 121328 119870 125784
2 Finance & Insurance 354595 440887 570263 257981 297641 349243
3 Construction 172093 204740 267020 102411 121376 140340
4 Electricity & Gas
Distribution 127461 137671 129028 84145 86551 69883
5 Manufacturing 1169242 1347119 1645587 805139 875027 923990
a) Large Scale 825746 956559 1189362 544264 595829 626344
b) Small Scale 221734 252770 299256 194167 209755 225314
Country 1999 2000 2001 2002 2003 2004 2005 2006 2007 2008 2009 2010
Pakistan
(Billion $) 282 282 299 311 318 347.3 395.2 437.5 411.9 427.3 432.9 464.9
29
6 Mining & Quarrying 211837 242122 294577 121996 125278 130886
7 Net Domestic Product
(F.C) 6597579 7629642 9198467 4471994 4781520 5063584
8 Net factor Income from
abroad 149901 158481 233986 84343 82878 103961
9 Net National Product
(F.C) 6747480 7788123 9432453 4556337 4864398 5167545
10 Ownership of Dwelling 125014 141175 165132 82751 85361 88171
11
Per Capita Income in Rs.
43428
49239
58598
29326
30754
32103
12 Population (in million) 15537 15817 16097.00 15537 15817 16097.00
13 Public Administration &
Defence 394324 460567 559904 289795 314059 348698
14 Community, S&P Service 625884 733611 884631 457722 497856 544442
15 Transport Storage &
Communication 776035 875404 996924 388076 412738 428934
16 Whole Sale & Retail
Trade 1250050 1420438 1746422 827281 871914 927688
R= Revised
P= Provisional
Source:-Monthly Statistical Bulletin, Dec, 2008
30
0
1000
2000
3000
4000
5000
6000
7000
1 3 5 7 9 11
India
Pakistan
Year
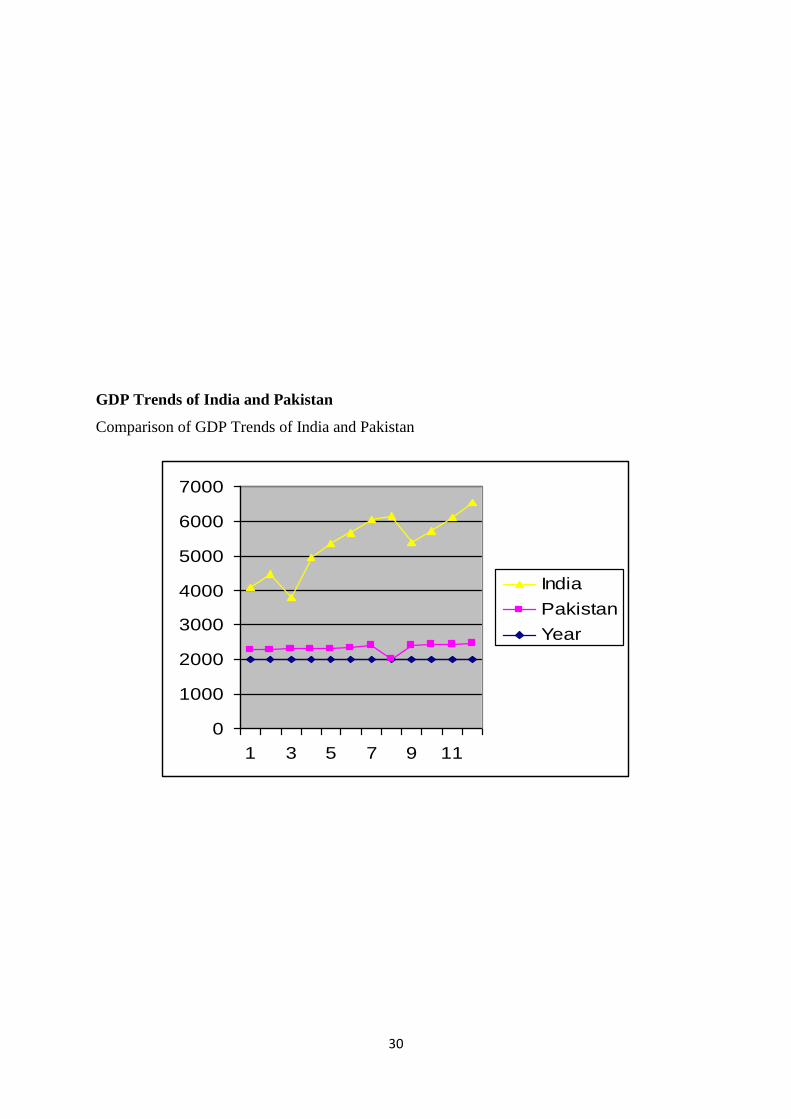
GDP Trends of India and Pakistan
Comparison of GDP Trends of India and Pakistan

31
Per Capita Income
Comparison of per capital income of India Pakistan
comparisition of per capital
income
0
1000
2000
3000
4000
1 3 5 7 9 11
Year
pe
r c
ap
ita
l in
co
me
Year
India (Us $)
Pakistan (Us
$)
Economy today
Due to inflation and economic crisis worldwide, Pakistan's economy reached a state
of Balance of Payment crisis. "The International Monetary Fund bailed out Pakistan in
November 2008 to avert a balance of payments crisis and in July last year increased the loan
to $11.3 billion from an
By October 2007, Pakistan raised back its Foreign Reserves to $16.4 billion. Exceptional
policies kept Pakistan's trade deficit controlled at $13 billion, exports boomed to $18 billion,
revenue generation increased to become $13 billion and attracted foreign investment of $8.4
billion.
Forex Rates Pakistan
Forex is short for foreign exchange also known as FX. Forex is to assist international trade
and investment and Forex market is one of the largest and most liquid financial markets in the

32
world with an average traded value that exceeds $1.9 trillion per day and includes all of the
currencies in the world. Forex Rates Pakistan updated multiple times during the day.
Interest Rates
The benchmark interest rate in Pakistan was last reported at 13.5 %. In Pakistan, interest rates
decisions are taken by the State Bank of Pakistan. The official interest rate is the discount
rate. From 1992 till 2010, its average interest rate was 12.78 % reaching an historical high of
20% in October of 1996 and a record low of 7.50 % in November of 2002.

33
CAPITAL MARKET

34
Trading at FY12 Price Earning Ratio (PER), Pakistan equities reflect 26 % discount to
historical mean of over 50 % discount to regional comparable markets. Conversely put,
Pakistan equities currently reflect forward earning yield of 14% compared to 6 % for the
region and 5% for India and China. Moreover, excluding very few scripts, which are
currently trading at premium valuations, the rest of the market is actually as cheap as forward
PER and 20 % in terms of forward earning yield.
Foreign Investment and KSE Index
Source:- Ministry of Finance, Government of Pakistan
Reserve Requirements Ratio

35
Global Equity Markets The leading stock markets of the world observed high growth
during the fiscal year 2010-11 ranging from 8.1 % in Japan to the highest market return up to
66.8 % as peace dividend in Sri Lanka.
Global Index
Source:-Invisor securities
Market capitalization (july – may)
Source :- Ministry of Finance, Government of Pakista
36
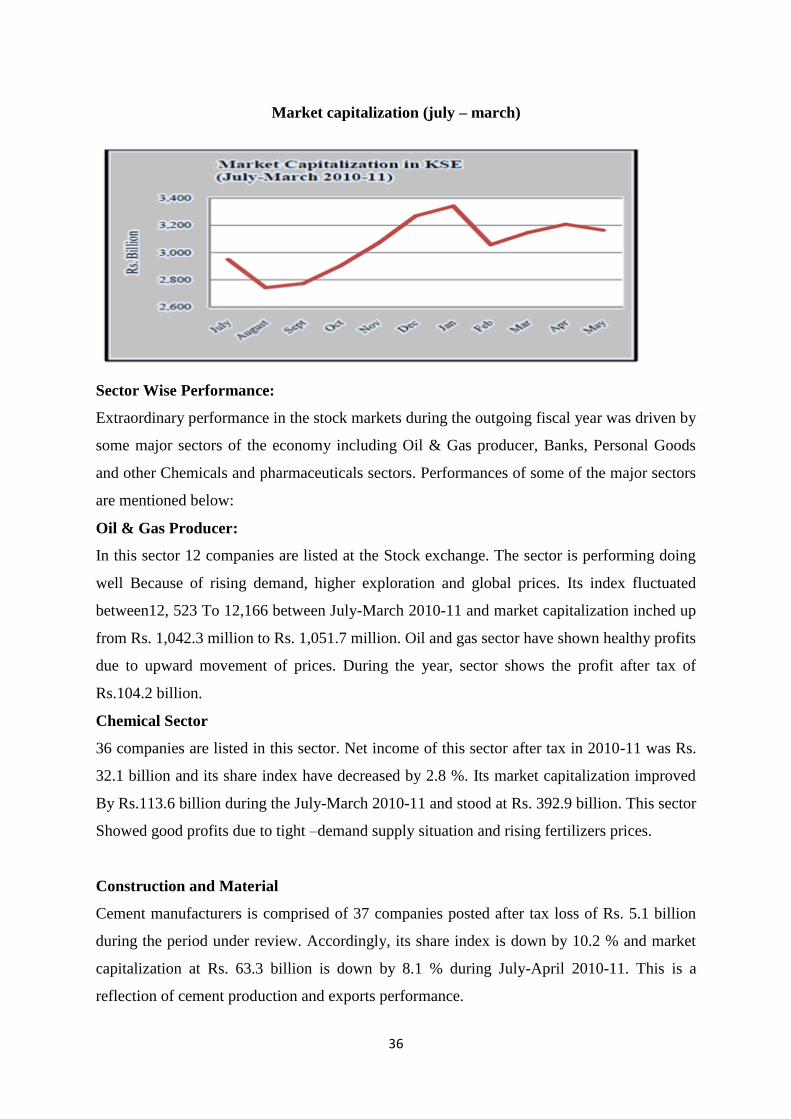
Market capitalization (july – march)
Sector Wise Performance:
Extraordinary performance in the stock markets during the outgoing fiscal year was driven by
some major sectors of the economy including Oil & Gas producer, Banks, Personal Goods
and other Chemicals and pharmaceuticals sectors. Performances of some of the major sectors
are mentioned below:
Oil & Gas Producer:
In this sector 12 companies are listed at the Stock exchange. The sector is performing doing
well Because of rising demand, higher exploration and global prices. Its index fluctuated
between12, 523 To 12,166 between July-March 2010-11 and market capitalization inched up
from Rs. 1,042.3 million to Rs. 1,051.7 million. Oil and gas sector have shown healthy profits
due to upward movement of prices. During the year, sector shows the profit after tax of
Rs.104.2 billion.
Chemical Sector
36 companies are listed in this sector. Net income of this sector after tax in 2010-11 was Rs.
32.1 billion and its share index have decreased by 2.8 %. Its market capitalization improved
By Rs.113.6 billion during the July-March 2010-11 and stood at Rs. 392.9 billion. This sector
Showed good profits due to tight –demand supply situation and rising fertilizers prices.
Construction and Material
Cement manufacturers is comprised of 37 companies posted after tax loss of Rs. 5.1 billion
during the period under review. Accordingly, its share index is down by 10.2 % and market
capitalization at Rs. 63.3 billion is down by 8.1 % during July-April 2010-11. This is a
reflection of cement production and exports performance.
37
Fixed Line Communication
The sector of 5 companies is affected by saturation of mobile communication in the country
and the total after tax profit was Rs.7 billion. Market capitalization of the sector decreased
from Rs. 83.8 billion to 69 billion during July-March 2010-11. Its share index also decreased
to 8392 points from 10191 points at the end of March 2011.
Food Producers.
The sector having 61 sugar dominated companies posted total after tax profit of Rs.11.9
billion. The Share index moved up from 12,625 to 19,824 during July-March 2010-11. Its
market capitalization increased by 58.2 % to 282.9 billion.
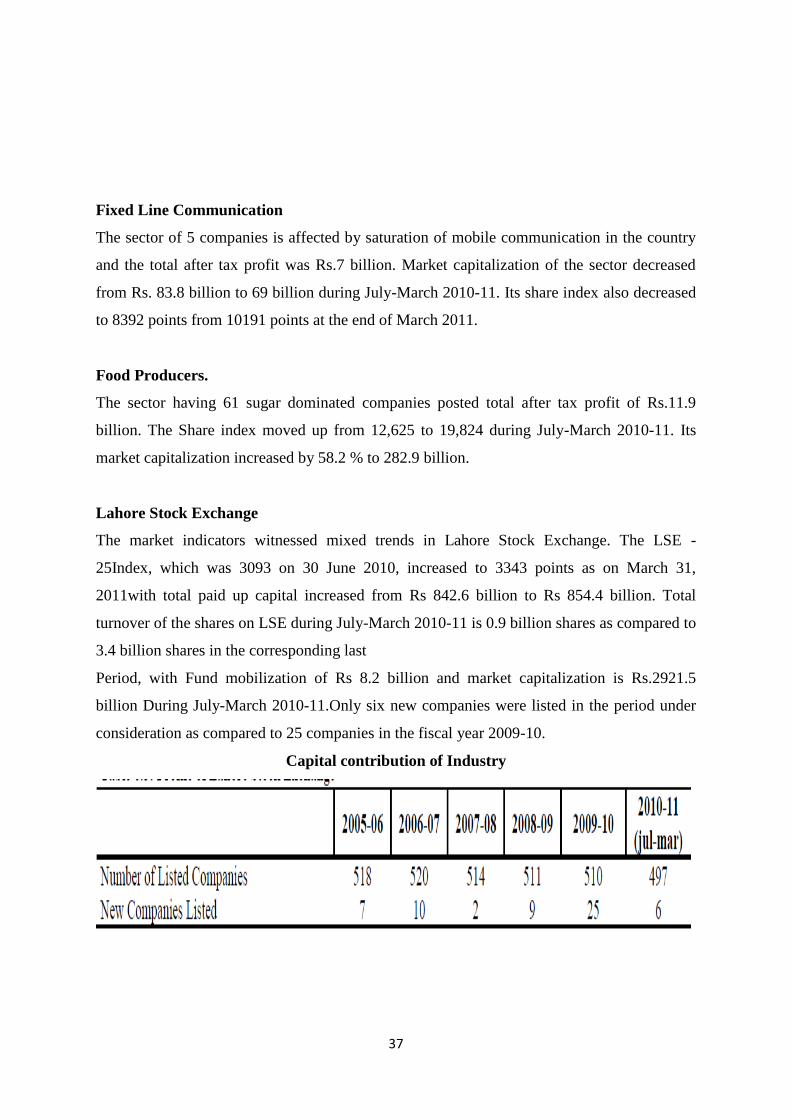
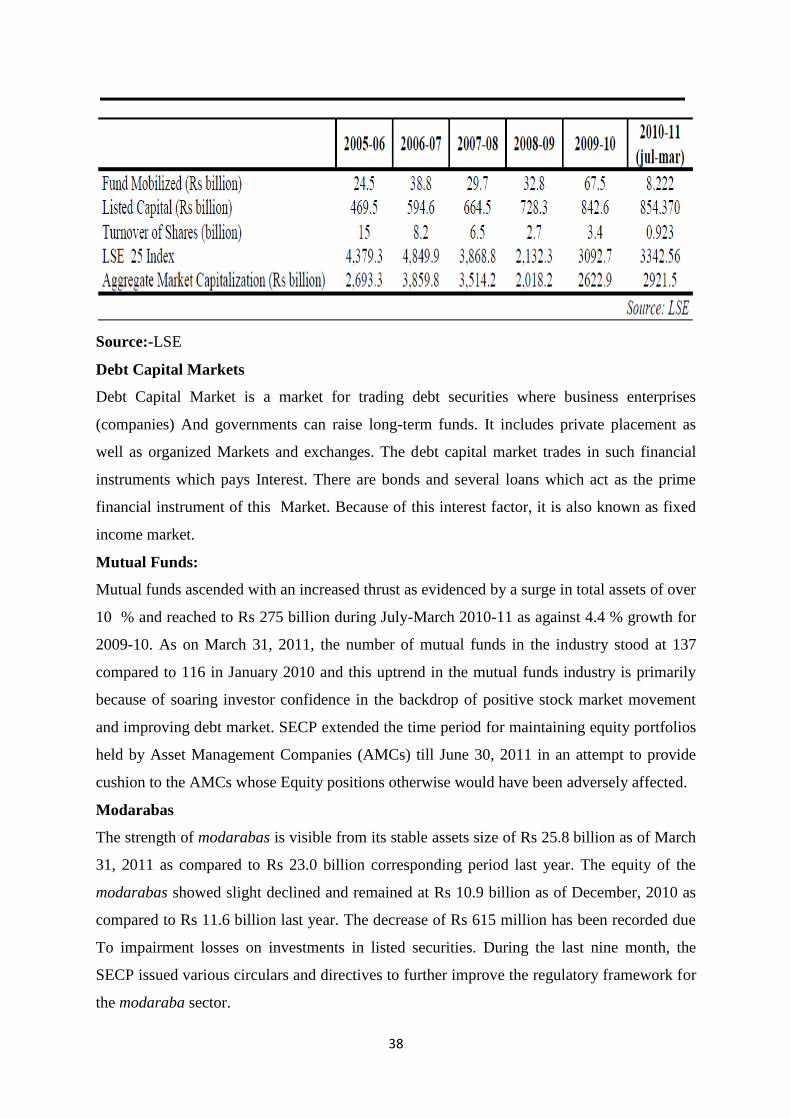
Lahore Stock Exchange
The market indicators witnessed mixed trends in Lahore Stock Exchange. The LSE -
25Index, which was 3093 on 30 June 2010, increased to 3343 points as on March 31,
2011with total paid up capital increased from Rs 842.6 billion to Rs 854.4 billion. Total
turnover of the shares on LSE during July-March 2010-11 is 0.9 billion shares as compared to
3.4 billion shares in the corresponding last
Period, with Fund mobilization of Rs 8.2 billion and market capitalization is Rs.2921.5
billion During July-March 2010-11.Only six new companies were listed in the period under
consideration as compared to 25 companies in the fiscal year 2009-10.
Capital contribution of Industry
38
Source:-LSE
Debt Capital Markets
Debt Capital Market is a market for trading debt securities where business enterprises
(companies) And governments can raise long-term funds. It includes private placement as
well as organized Markets and exchanges. The debt capital market trades in such financial
instruments which pays Interest. There are bonds and several loans which act as the prime
financial instrument of this Market. Because of this interest factor, it is also known as fixed
income market.
Mutual Funds:
Mutual funds ascended with an increased thrust as evidenced by a surge in total assets of over
10 % and reached to Rs 275 billion during July-March 2010-11 as against 4.4 % growth for
2009-10. As on March 31, 2011, the number of mutual funds in the industry stood at 137
compared to 116 in January 2010 and this uptrend in the mutual funds industry is primarily
because of soaring investor confidence in the backdrop of positive stock market movement
and improving debt market. SECP extended the time period for maintaining equity portfolios
held by Asset Management Companies (AMCs) till June 30, 2011 in an attempt to provide
cushion to the AMCs whose Equity positions otherwise would have been adversely affected.
Modarabas
The strength of modarabas is visible from its stable assets size of Rs 25.8 billion as of March
31, 2011 as compared to Rs 23.0 billion corresponding period last year. The equity of the
modarabas showed slight declined and remained at Rs 10.9 billion as of December, 2010 as
compared to Rs 11.6 billion last year. The decrease of Rs 615 million has been recorded due
To impairment losses on investments in listed securities. During the last nine month, the
SECP issued various circulars and directives to further improve the regulatory framework for
the modaraba sector.

39
Leasing
The leasing sector in It faces multitude problems like liquidity issues, low capitalization,
limited sources for resource mobilization, high cost of funds, level of non-performing assets
and Limited outreach. SECP enhanced the validity of licenses issued to Non-Banking
Financial Companies (NBFCs) from one year to three years for providing operational
flexibility to them. system would gain grip and substance. So far, nine pension funds have
been launched under the VPS.
Derivative Markets
In order to provide investors with basic hedging instruments, financing options and increased
nvestment alternatives, deliverable futures contracts and cash-settled futures contracts are
available for trading at the three stock exchanges. Additionally stock index Futures Contract
based on the KSE 30 Index and Sectoral Indices for oil and gas sector and banking sector are
available at the Karachi Stock Exchange (KSE).
The success of FDI policies can be judged by the size of the inflows of foreign capital. If we
critically analyse the pattern of foreign direct investment inflows over the last two decade, it
is found that It performed poorly in this field. Lack of political stability has been the hallmark
of It during the last fifty years. It has never had an elected government to survive long enough
to be voted out of office. The importance of infrastructure can be realized from the fact, that
it plays the same role in generating investment as soil plays in cropping. The inadequacy of
physical infrastructure creates a bottleneck in the investment process and will negative impact
the decisions of the prospective investors.

40
INTERNATIONAL
TRADE

41
International trade allows us to expand our markets for both goods and services that
otherwise may not have been available to us. Owing to competition, a country can obtain
optimum advantage from its buying and selling in the world only through having adequate
knowledge of trade data.
Pakistan's Import and Export Indicators and Statistics at a Glance (2010)
GRAPH NO: 1 Pakistan Trade
Source: www.pakgov.pk
Exports
Manufacturing still works with relatively basic technologies, generates few value-added products,
and has a narrow production base, i.e., it does not diversify into many different product groups.
Textiles are Pakistan's primary industry, and in 1999 accounted for 8.5 % of the gross domestic
product, 31 % of total investment, 38 % of industrial employment, and almost 60 % of total exports.
It is Asia's eighth-biggest textiles exporter, with export revenues of US$5.7 billion in the first half of
2000. Export growth has been declining since a recent peak of 6.1 % in 1996. The trend is reversing,
encouraged by large cotton crops in the past 2 years which have lifted output to about 11 million
bales (each bale weighing 170 kilograms), the bulk of which is consumed at home, and large-scale
capital investment to modernize plants. However, progress is still expected to fall short of targets,
notably to be among Asia's top 5 exporters with sales of US$14 billion by 2005.

42
Cumulative exports by various countries
Imports
It imports were worth 3806 Million USD in August of 2011. It imports mainly petroleum,
petroleum products, machinery, plastics, transportation equipment, edible oils, paper and
paperboard, iron and steel and tea. Its major import partners are: European Union, China,
Saudi Arabia, United Arab Emirates and United States.
Countries July-2011 to Aug. 2011 July-2010 to Aug. 2010
Value %Shares Value %Shares
Total 354096.65 100 296417.15 100
USA 63000.05 17.79 58289.42 19.66
Afganistan 38366.12 10.83 24558.16 8.28
UAE 33218.89 9.38 26831.13 9.05
UK 19925.68 5.63 15914.10 5.37
China 19904.71 5.63 16040.83 5.41
Germany 19553.18 5.52 14613.08 4.93
Belgium 9916.45 2.80 7787.15 2.63
Itlay 9724.63 2.75 8188.21 2.76
Netherlands 8653.71 2.44 5506.02 1.86
Bangladesh 8483.64 2.40 8861.19 2.99
Spain 8305.16 2.35 6593.80 2.22
Turkey 6855.74 1.94 8650.19 2.92
France 6037.09 1.7 4665.34 1.57
Saudi Arabia 5827.17 1.65 6409.33 2.16
Kenya 4842.42 1.37 1390.29 .47
Hong kong 4501.38 1.27 6805.25 2.30
India 4422.08 1.25 3586.72 1.21
South Africa 4343.49 1.23 3070.76 1.04
Korea 4230.36 1.19 2939.29 .99

43
Countries shares in international trade with Pakistan
IMPORT BY ECONOMIC category
Exports Imports
Countries Share % Countries Share %
US 15.87 US 4.81
UAE 12.85 UAE 9.8
Afghanistan 8.48 Saudi Arabia 10.54
UK 4.7 India 4.02
China 4.4 Kuwait 4.73
- - Malaysia 4.43
- - China 15.37

44
Export by Economic category
(Source:www.ministryoffinance.pk)
statistic data on imports and exports

45
VALUE BY FOREIGN TRADE

46
AGRICULTURE

47
Pakistan's total land area is about 803,940 square kilometers. About 48 million hectares, or 60
%, is often classified as unusable for forestry or agriculture consists mostly of deserts,
mountain slopes, and urban settlements. Some authorities, however, include part of this area
as agricultural land on the basis that it would support some livestock activity even though it is
poor rangeland. Thus, estimates of grazing land vary widely--between 10 % and 70 % of the
total area.
The Agriculture Sector continues to play central role in Pakistan’s economy. It is the 2nd
largest sector, accounting for over 21% of GDP , and remains by far the largest employer,
absorbing 45% of the country’s total labor force. Nearly 62% of the country’s population
resides in rural areas, and directly or in directly linked with agriculture for livelihood.
Despite its critical importance to growth, exports, incomes and food security, the agriculture
sector has been suffering from secular decline.

48
Agriculture Growth
Agriculture Growth (%)
Year Agriculture Major Crops Minor Crops Livestock
2003‐04 2.4 1.7 3.9 2.9
2004‐05 6.5 17.7 1.5 2.3
2005‐06 6.3 ‐3.9 0.4 15.8
2006‐07 4.1 7.7 ‐ 1.0 2.8
2007‐08 1 ‐6.4 10.9 4.2
2008‐09 4 7.3 ‐1.7 3.5
2009‐10(P) 2 ‐0.2 ‐1.2 4.1
(P): Provisional Source: Federal Bureau of Statistics
Comparative Agriculture Growth Rate
Country Name 2006 2007 2008 2009 2010
India 4.2 5.8 -0.1 0.4 5
Pakistan 6.3 4.1 1 4 2
China 5 3.7 5.4 4.2 4.5
Thailand 5 1.2 4.2 1.3 -2.2
Malaysia 5.2 1.3 4.3 0.4 ..
Source: World Bank Data
Agriculture Growth Rate of Pakistan
No. Year Growth Rate Target Difference
1. 2009-10 2.0% 3.8% -1.8%
2. 2008-09 4.7% 3.5% +1.2%
3. 2007-08 1.5% 4.8% -3.3%
4. 2006-07 5.0% – –
5. 2005-06 2.5% 4.2% -1.7%
6. 2004-05 7.9% 4.0% +3.9%

49
Contribution of Agriculture in the Economy
More specifically; the agricultural sector plays an important part in Pakistan's economy by:
Contributing 24 % towards GDP;
Providing food to about 130 million people;
Earning about 60 % of the country's total export earnings;
Providing employment to 47 % of the total work force;
Providing the main source of livelihood for the rural population of Pakistan;
Providing raw materials for many industries and a market for many locally produced
industrial products.
Private Sector Institutions
As mentioned, agriculture remain to be an important economic contributor as in fact It is
the largest producers and suppliers of agricultural products according to the 2005 Food
and Agriculture Organization. It likewise ranks high with respect to farm output. It is the
fifth in the Muslim world and worldwide it ranks within the two twenty farm output
contributors.
Major crops, accounting for 31.1 % of agricultural value added, registered a negative
growth of 4.0 % for second year in a row mainly because of decrease in production of rice
and cotton by 29.9 and 11.3 %, respectively. Major crops, such as, wheat, rice, cotton and
sugarcane account for 90 % of the value added in the major crops. The value added in
major crops accounts for 31 % of the value added in the agriculture. Thus, four major
crops (wheat, rice, cotton, and sugarcane) on average, contribute 28 % to the value
added in overall agriculture and 5.9 % to GDP.
Production Of major crops
Production of Major Crops (’000 Tons)
Year Cotton
(000 bales) Sugarcane Rice Maize Wheat
2004 - 05 14265 47244 5025 2797 21612
-42 (11.6) -3.6 -47.4 -10.8
2005 - 06 13019 44666 5547 3110 21277
(8.7) (5.5) -10.4 -11.2 (1.6)
50
Source: Ministry of Food and Agriculture
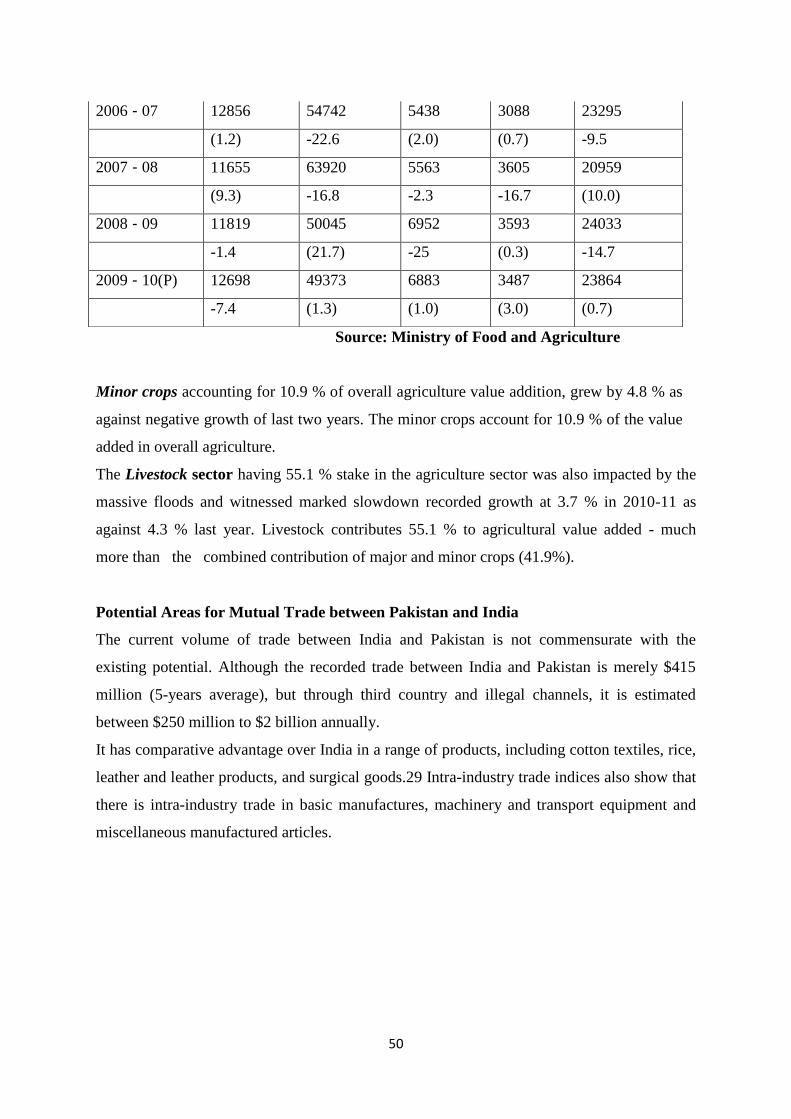
Minor crops accounting for 10.9 % of overall agriculture value addition, grew by 4.8 % as
against negative growth of last two years. The minor crops account for 10.9 % of the value
added in overall agriculture.
The Livestock sector having 55.1 % stake in the agriculture sector was also impacted by the
massive floods and witnessed marked slowdown recorded growth at 3.7 % in 2010-11 as
against 4.3 % last year. Livestock contributes 55.1 % to agricultural value added - much
more than the combined contribution of major and minor crops (41.9%).
Potential Areas for Mutual Trade between Pakistan and India
The current volume of trade between India and Pakistan is not commensurate with the
existing potential. Although the recorded trade between India and Pakistan is merely $415
million (5-years average), but through third country and illegal channels, it is estimated
between $250 million to $2 billion annually.
It has comparative advantage over India in a range of products, including cotton textiles, rice,
leather and leather products, and surgical goods.29 Intra-industry trade indices also show that
there is intra-industry trade in basic manufactures, machinery and transport equipment and
miscellaneous manufactured articles.
2006 - 07 12856 54742 5438 3088 23295
(1.2) -22.6 (2.0) (0.7) -9.5
2007 - 08 11655 63920 5563 3605 20959
(9.3) -16.8 -2.3 -16.7 (10.0)
2008 - 09 11819 50045 6952 3593 24033
-1.4 (21.7) -25 (0.3) -14.7
2009 - 10(P) 12698 49373 6883 3487 23864
-7.4 (1.3) (1.0) (3.0) (0.7)

51
MANUFACTURING

52
Pakistan's manufacturing sector accounts for about 25% of GDP. Cotton textile production
and apparel manufacturing are Pakistan's largest industries, accounting for about 51.4% of
total exports. Other major industries include food processing, beverages, construction
materials, clothing, and paper products. Manufacturing sector growth has slowed in the last 2
years due to energy shortages and capacity constraints. However, the sector is forecast to
grow 5.5% for FY 2010. Despite government efforts to privatize large-scale parastatal units,
the public sector continues to account for a significant proportion of industry. The
government seeks to diversify the country's industrial base and bolster export industries. Net
foreign investment in Pakistani industries is only 0.5% of GDP. Pakistan's search for
additional foreign direct investment has been hampered by concerns about the security
situation, domestic and regional political uncertainties, and questions about judicial
transparency.
Cost of production of manufacturing sector of Pakistan

53
Composition to the Manufacturing Sector
SOUR
CE: India Reporting Country from Monthly Statistics of Foreign Trade
Manufacturing Sector Of Pakistan
Year 2006 2007 2008 2009 2010
Industry 26.9 26.9 26.8 24.3 23.6
i. Mining & Quarrying 3.1 3.1 3.0 2.9 2.5
ii. Manufacturing 19.1 19.0 19.7 17.1 17.1
a) Large-Scale 14.0 14.0 14.8 12.4 12.4
b) Small-Scale 3.4 3.4 3.4 3.3 3.2
c) Slaughtering 1.7 1.7 1.5 1.4 1.5
iii. Construction 2.5 2.7 2.6 2.4 2.2
iv. Electricity and Gas
Distribution
2.1 2.1 1.5 1.8 1.8
Source: Federal Bureau of Statistics
Note: S & P = Social & Public P = Provisional

54
PRODUCTION DATA OF SELECTED LARGE SCALE MANUFACTURING
ITEMS (July-March-2010-11)
Sr.
No.
ITEM NAME
NO.
OF
UNITS
2010-11
JUL-MARCH
(in tons)
%
CHANGES
1 Sugar 84 3,892,141 26.46%
2 Cigarettes 07 47,458 (04.14)%
3 Cotton yarn 215 220,041 01.91%
4 Cotton cloth 439 6,736,130 01.32%
5 Jute goods 10 66,686 (14.44)%
6 Paper & board 55 345,283 02.86%
7 Soda ash $ caustic 04 405,245 (05.01)%
8 Fertilizer total 14 4,471,287 (16.61%)
9 Sheet/float glass 07 10,150 (16.61)%
10 Cement ® 31 20,781 (09.67)%
11 Bicycles ® 04 267,800 (19.31)%
12 Steel sector 168 891,318 (15.09)%
13 Steel melters 300 1,213,046 (03.08)%
14 Auto sector 24 1,364,388 17.52%
15 Motor cycle ® 76 1,194,567 18.73%
Total weightage= 44.5101%
TEXTILES AND CLOTHING
Pakistan’s total imports of textile and clothing in FY09 stood at $65.3 million (of which 85.6
% was raw cotton imports).
IRON& STEEL
Steel with a production capacity of 1.1 million tons of raw steel per annum, with a built-in
potential to expand capacity to over 3 million tons per annum.
CHEMICALS AND PHARMACEUTICALS

55
During FY09, the total imports of chemicals (fertilizers, insecticides, plastic materials,
medicinal products, and other organic and inorganic chemicals) stood at $2.8 billion, an
increase of 29.5 % over the last year. During the FY08-09 the automotive industry
contributed over Rs 30 billion to the government exchequer in the form of duties and taxes,
with a contribution of Rs 17 billion from the top four manufacturers alone.
AUTOMOBILES
The vehicle manufacturers alone employ around 10,000 workers with more than 100,000
people working in the vendor industry. Presently, the automobile Industry mainly comprises.
SMALL AND MEDIUM ENTERPRISES (SMES)
Two million small and medium enterprises (SMEs) spread across the country contribute 30 %
to GDP and generate around 25 % of the manufacturing sector’s export earnings. The SMEs
constitute 90 % of the business and are responsible for 80 % of non- farm based employment.
Over 90 % SMEs are very small in size, both in terms of investment and workforce.

56
SERVICE

57
The services sector has risen to 53.3 % in 2010-11 which is the highest share in last two
decades. The services sector grown by 4.1 % against the target of 4.7 % and actual outcome
of 2.9 % the services sector had made a contribution of 90 % to the GDP growth.
The sector consists of the following sub-sectors are as: Transport, storage and
communication; wholesale & retail trade; finance and insurance, ownership of dwellings;
public administration and defense, and social services. The current year’s performance is
dominated by public administration and defense and social services where the value addition
grown by 13.2 % and 7.1 % respectively. The former reason of 50 % pay rise for government
servants and higher defense spending, and the later because of logistics support and flood
generated social activities.
Finance and insurance sector has displayed a contraction in value addition for the last three
years as its value addition decreased on average by 8.4 %. Finance and insurance sector was
recorded negative growth of 6.3 % in 2010-11 as against contraction of 11.3 % last year.
Transport, Storage and Communication sub sector had depicted to a sharp deceleration in
growth during the last three years as it grown on average 2.5 % in as compared to 3.8 % has
witnessed in the last eight years preceding three years. And mechanized road transport has
been depicted a growth of 2.8 %, followed by storage (3.8 %). The value addition of It
Railways has been declined substantially. Other sectors also showed that declines are;
communication (12.1 %) and pipeline transport (15.9 %).
Wholesale and retail trade sector is mainly based on the margins taken by traders on the
transaction of commodities that traded in the wholesale and retail market. In 2010-11, this
sector grown at 3.9 % as compared to 4.6 % of last year and the target for the year of 5.1 %.
Public administration and defense posted a stellar growth of 13.2 % as compared to 2.5 %
in last year. The estimates of this sector are mainly based on budgeted figures of federal,
provincial, district and local governments. The performance of this sector far outstripped the
target of 5.0 % mainly because of a positive change in the wage component of public sector
employees, and an increase in defense and security related expenditures also.
Ownership of Dwellings had remained constant at 3.5 % for the past 5 years but it was badly
impacted by other factors. Social Services Sector grown by 7.1 % which is slightly more than
the target of 5.0 % but lower than last year’s actual growth of 7.8 %.

58
Education In Educational Sector, there is 0.5% increase in the fiscal year (2010-2011). And
spending of government on education is Rs.95.442 million. According to year of 2009-10 the
literacy rate is 57.7%. Public sector has an enrollment of 25,213,894 (67%) in various
categories of educational institutions, where as 12,248,990 (33%) enrollment is in the private
sector. There is the total teaching staff is 1,363,501, out of which 0.756 million (56%) is in
the public sector and 0.606 million (44%) in the private sector. And out of the total 1.363
million teachers, 0.617 million (47%) are male teachers and 0.695 million (53%) are female
teachers.
Health In case of the Ministry of Health of It is a government agency is responsible for
Pakistan's health system. The specific health projects as under:
National Programme for Family Planning & Primary Health Care
National Maternal, Neonatal and Child Health (MNCH) Programme
National Programme for Prevention and Control of Hepatitis
National AIDS Control Programme
National Tuberculosis Control Programme
Tourism is governed through the Board of Directors headed by the Minister for Tourism. It
received more than 500,000 tourists per annual. However, this number has now come down to
near zero figures since 2008 due to the instability in the country and many countries declaring
It as unsafe and dangerous to visit. An amount of Rs. 1.28 billion is planned to be spent
during MTDF 2005-10 for the promotion of tourism, in promoting infrastructure and its
improvement.
The Services sector contributes 53.8% to Pakistan’s GDP. Its major sub sectors are under such
as Finance and Insurance, Transport and Storage, Wholesale and Retail Trade, Public
Administration and Defense. Services contribution to our GDP is gradually increases. During
the current period of financial downturn, the services sector has been a major contributor to
growth. The services sector grown at the rate of 4.1% as against 2.9% last year. The main
contributors to this growth are as public admin and defense (13.2%) and social services sector.
Export and Import of Services
Year 2009 -10 2010 -11
Imports of services ( million $) 6911 7590
Exorts of services ( million $ ) 5229 5455

59
Export and Import of Services
Source:http://www.commerce.gov.pk/.../Services_%20Export_Web_%20Page.pdf
IMPORTS AND EXPORTS OF PAKISTAN SERVICES
Table 2: Export Receipts by Major Groups of Services (Amount in Million)
Services October July- October % Change
2011 2011 2010 2011-12 2010-11
Pak Rs. US $
services
Transportation 11,230 128 119 513 477 7.7
Travel 2,353 27 26 112 102 9.6
Communication
Services 1,417 16 17 62 65 -4.2
Construction
Services 51 1 1 8 7 2.5
Insurance
Services 443 5 3 39 9 350.0
Financial
Services 543 6 2 23 27 -13.0
Computer &
Information
Services
1,414 16 15 77 61 25.5
Royalties & 59 1 1 2 1 58.6

60
License fees
Other Business
Services 4,251 49 61 248 245 1.1
Personal,cultural
&ecreational
Services
6 0 0 0 0 -14.3
Government
services 18,933 218 175 565 497 13.7
Export of
Services 40,698 467 420 1,649 1,491 10.6
Major MNC’s in Pakistan
The multinational companies have been invested Rs. 60 million in It. Initially, the British and
European trading and business houses had taken the lead as they had been present in this area for a
long time period. However, today USA leads with 25% investment, followed by UK (13%),
International lending institutions (11%), Germany (6%), Japan (3.25%). Also recently, Japan's
investment in the automobile industry has increased substantially, thereby increasing its share
List of multinational corporations working in Pakistan
SECTOR WISE BREAKUP
BANKING Engineering
• Citibank Siemens
• HSBC Medicines
• Al-Falah Bank Novartis
• Royal Bank Of Scotland Aventis
• Standard Charter Bank
• Pak al Saudi Bank
• Crescent Commercial Bank
• Dubai Islamic Bank

61
Telecommunication and IT
• Mobilink
• Warid Telecom
• Telenor
• Wateen Telecom
• China Mobile

62
MARINE INDUSTRY
63
Introduction
In past, It has faced many difficulties in mercantile scenario. Due to nationalization there was
a change in shipping industry. So, because of that there was a healthy competition in shipping
between public and private sector. A new policy was introduced to boost private investment
in shipping sector.
Mostly, the international trade is carried out through the sea and it is noticed that 36.3% GDP
was due to this. There are many dispute like heavy dependence, continental mindset of the
ruling elite which result to negligence of maritime sector. This resulted to problem such as
deteriorated the existing infrastructure, non performing shipping industry, declining merchant
marine and unexploited offshore natural resources. The Pakistan navy receives the list
priority in the armed force.
Seaborne trade is the backbone of Pakistani economy; the domestic shipping industry has
remained neglected in the past. The number of ships in the national flag carrier, the Pakistan
National Shipping Corporation, has steadily shrunk. At present, the Pakistani merchant fleet
transports only 5% of the total seaborne trade as against the 40% outlined by the United
Nations Commission on Trade and Development (UNCTAD) for national carriers. $1.5
billion in foreign exchange annually on freight charges, which is approximately 2.2% of the
GDP which the country uses. Uninterrupted flow of seaborne trade is important not only for
economic growth but also for national security of the country simply because of the reason
that the economy and national security are interdependent. It is heavily dependent on
importing energy resources.
The two main elements of maritime strategy for Pakistan are seaborne trade and shipping
industry. The main factor that affects the marine sector of Pakistan is declining merchant
marine growth. The decline stage of marine industry is due to ill advised economic policies,
capital intensive shipping nature, unabated public corruption and the prevalent geo political
situation. There are two main reason of neglecting marine industry i.e. there was no ability to
generate the revenue from shipping industry and there was a negative impression to spend
hard and earned resources.
The maritime fisheries industry was started by It when it has no partition of the resources, no
fish harbour just fish processing plant was available. The new fish harbour was constructed at

64
Karachi port in 1958. The fishing fleet grew and become mechanized. Total fish production
was 522 200 metric tons out of which 26 000 metric tons are of shrimps.
In the Pakistan Economy, the fishery plays an important role. The total employment in
fishery industry is around 379 000 employees. Moreover, 400 000 employees are employed
in ancillary industries. Fishery is the main source of export earnings. It has enough fishery
resources through the coastline of about 814 km. The livelihood of population of costal area
around Sindh and Balochistan was depended on fisheries.
It is endowed with rich fishery potential. It is located in the northern part of the Arabian Sea
and has a coastline of about 1120 km with a broad continental shelf and its Exclusive
Economic Zone extends upto 200 miles from the coast. In Pakistan, there are many marine
and inland fishery resources which has potential upto 1 million tones. It majorly include 250
demersal fish species, 50 small pelagic fish species, 15 medium sized pelagic species and 20
large pelagic fish species.
Mechanized docked boats: There are over 4,000 boats of this kind registered. it constitute
shrimp trawlers and as well as gillnetters. Both are also locally made of wood, according to
traditional design and fitted with 80-220 hp diesel engines. The average length of a trawler is
10–25 m while that of a gillnetter is 15–35 m. For transportation, many trawlers have
a transom stern.
Mechanized sailboats: This boat is made of wood and equipped with two or more outboard
engines, but generally smaller than docked vessels, they are locally called 'hora' boats. Most
of these sailboats now operate in freshwater bodies. 'Doonda' boats are
fiber scrapped lifeboats, with an average length of 7–10 m and 22–33 hp engines.
Role of marine industry in economy
The Pakistani marine sector has the potential to contribute significantly in the overall
economic growth in many ways. A prosperous shipping industry can help in saving foreign
exchange, reduce freight cost and thus promote country’s foreign trade. It can also earn
revenues from profitable shipping operation, create added employment opportunities, and
assure adequate and reliable shipping services. Ports are providing the link between the sea
and land transports and are a great source of revenue generation.

65
The Pakistani shipbuilding industry is facing severe financial difficulties in the absence of
work and continuously burdening government resources for its existence. Since a strategic
capability, the country cannot afford to permanently lose; immediate attention is required to
make it financially self-sustaining. At present, the activity is restricted to living resources in
terms of marine fisheries which are a major source of employment in coastal areas. The
Pakistani fishermen activities are largely confined to territorial waters, and a vast expanse of
the Exclusive Economic Zone (EEZ) remains unexploited. Fish is exported in raw form as
against a value-added product in the absence of modern processing plants, which would
provide a greater margin of profit.
Structure of marine industry
This sector offers employment to over one million people and most of which work as
fishermen. There are 38 processing units out of which 27 are used for freezing. Their total
capacity is about 450 tons per day. Their average capacity utilization is 25%. However, only
21 out of the 27 freezing plants are functioning. The other 11 are used for canning. The total
installed capacity for these canning plants is 106 MT/day. However, only one is functioning.
Areas where marine fishing is carried out are Karachi, Gwadar and Pasni.
The biggest and most important harbour for fishing in Pakistan is Karachi harbour.
Infrastructure facilities are available include 10 floating piers with a berthing capacity of 32
vessels on both sides. There is also an ice/oil supply bunker available for future
accommodation of 300 tons/day flake ice plant and an oil dispensing station. This harbour is
handling over 2000 vessels.
Other harbours in Pakistan do not have the relevant infrastructure for transport such as roads
and utilities of fisheries. The Korangi fish harbour was constructed to divert congestion from
the Karachi harbour and to promote deep-sea fishing. And It has a 709-meter long jetty.
However, though recently a few deep-sea vessels have begun to use the harbour facilities, it
is still not operational. The Gwadar harbour is the third important harbour in It and has a 416
meter long and 65 meter wide jetty.

66
Fisheries sector is a source of livelihood for the coastal population. A part from marine
fisheries, inland fisheries (based in rivers, lakes, ponds, dams etc.) is also very important
activity throughout the country. During the year 2010-11, a total of 86,680 MT of fish and
fishery products were exported to earn $ 197.3 million. China, Thailand, Malaysia, Middle
East, Sri Lanka, Japan, etc. are buyer of Pakistan’s fishery product.
PORTS AND SHIPPING
a) Karachi Port Trust (KPT)
The Karachi Port Trust (KPT) has established an annual cargo handling record of over 41.4
million tons during 2010-11, indicating an increase of 6.9% over 2009-2010. There has also
been remarkable increase in all types of cargo handling.
Cargo Handled at Karachi Port (000 Ton)
Year import % change Export % change total % change
2007 -08 25,518 9.4 11,675 55.3 37,193 20.6
2008 -09 255,368 -0.6 13,364 14.5 38,732 4.1
2009 -10 27,892 9.9 13,528 1.23 41,420 6.9
Source: KPT

67
b) Gwadar Port
In March 2008, The Gwadar Port started operations with biggest ship of any port of Pakistan
namely 76000 DWT Panamax Bulker POS Glory which discharged a total of 63000 M. Tons
of wheat. In 31st January 2011, Gwadar port carrying a total cargo of 2,286,781 M.Tons.
Cargo Handled at Gwadar Port (000 Ton)
Year Import % change Export % change total % change
2007 -08 231.639 - - - 231.639 -
2008– 09 2055.142 787.22 - - 2055.142 -
2009 - 10 705.969 191.11 - - 705.969 -
Source: Gwadar Port Trust
c) Port Qasim Authority
Port Qasim is first industrial and commercial Port of It and it is handling 40% shipping of the
country. Qasim Authority (PQA) handled a volume of 13.019 million tones cargo during
2010-11, as compared to 13.276 million tones handled during 2009-10, showing a decline of
2 %. Port qasim has import volume of 10.181 million tones in 2010 and it was 9.853 million
tones in 2009, increase of 3%.
In contract, the export cargo decrease to 2.838 million tons in 2010 and it was 3.422 million
tons in 2009, a decline of 17%, due to flood in the country. Port qasim handled total of 5.225
million tones of containerized cargo during Jul-Dec. 2010 as against the 4.573 million tones
handled during last year 2009-10, an increase of 14%.
Cargo Handled at Port Qasim Authority: (000 Ton)
Period Import % change Export % change total % change
2007 - 08 21502 10 4922 2 26424 9
2008 - 09 19445 -10 5584 16 25030 -5
2009 - 10 19226 1 6380 14 25,626 2
Source: Qasim Port Authority
Pakistan national Shipping Corporation
The total revenues of Pakistan National Shipping Corporation group for the quarter ended
March 31, 2011 were Rs 2,552 million (including Rs. 1,043million from PNSC),next two
quarter volume of PNSC group was Rs. 6772 million. This volume was Rs. 5583 million of 3
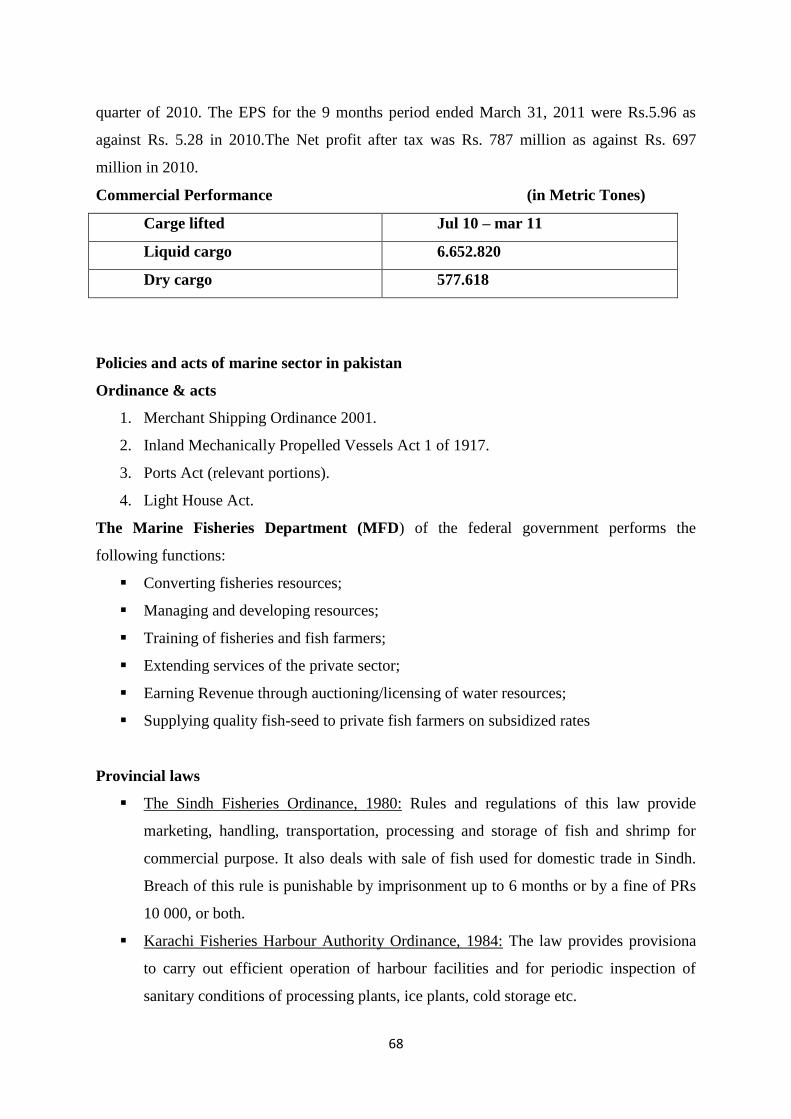
68
quarter of 2010. The EPS for the 9 months period ended March 31, 2011 were Rs.5.96 as
against Rs. 5.28 in 2010.The Net profit after tax was Rs. 787 million as against Rs. 697
million in 2010.
Commercial Performance (in Metric Tones)
Carge lifted Jul 10 – mar 11
Liquid cargo 6.652.820
Dry cargo 577.618
Policies and acts of marine sector in pakistan
Ordinance & acts
1. Merchant Shipping Ordinance 2001.
2. Inland Mechanically Propelled Vessels Act 1 of 1917.
3. Ports Act (relevant portions).
4. Light House Act.
The Marine Fisheries Department (MFD) of the federal government performs the
following functions:
Converting fisheries resources;
Managing and developing resources;
Training of fisheries and fish farmers;
Extending services of the private sector;
Earning Revenue through auctioning/licensing of water resources;
Supplying quality fish-seed to private fish farmers on subsidized rates
Provincial laws
The Sindh Fisheries Ordinance, 1980: Rules and regulations of this law provide
marketing, handling, transportation, processing and storage of fish and shrimp for
commercial purpose. It also deals with sale of fish used for domestic trade in Sindh.
Breach of this rule is punishable by imprisonment up to 6 months or by a fine of PRs
10 000, or both.
Karachi Fisheries Harbour Authority Ordinance, 1984: The law provides provisiona
to carry out efficient operation of harbour facilities and for periodic inspection of
sanitary conditions of processing plants, ice plants, cold storage etc.

69
Coastal Development Authority Act of Sindh, 1994: It gives the legal basis for
planning, development, operation, management and maintenance of coastal areas, and
development of fisheries, livestock, horticulture and agriculture etc.
The Balochistan Sea Fisheries Act No. IX 1971: It provides authority for control of
fishing craft, licenses of fishery and processing of fish and products of fishery in the
protective water of it along the coast of Balochistan. Breach of any provision is
punishable by 1 month imprisonment or PRs 5 000 fine, or both.
Karachi Fisheries Harbour (Control and Management) Regulations 1991: It came into
existence on 30th
Jan 1992. The act lays down the regulations for the proper
management of the Karachi Fisheries Harbour.
The Coastal Development Authority Act Sindh Act No. XXVIII 1994: The act covers
development of operations, management and maintenance of coastal areas including
fisheries development, livestock, horticulture and agriculture.
Federal laws
Exclusive Fishery Zone Act, 1975: The law provisions are in accordance with the
provisions providing for in the Law of the Sea Convention. and cover Licensing and
fishing management operation in the EEZ of the country
West Pakistan Fisheries Rules, 1965
The Pakistan Animal Quarantine (Import and Export of Animal and Animal Products)
Ordinance, 1979: The law gives control of the import and export of animals and
products of animal, and issues the health certificates to regulate the trade and to
prevent the introduction or spread of diseases.
Territorial Waters and Maritime Zones Act, 1976
Pakistan Environmental Protection Act, 1997
The Agricultural Produce (Grading and Marketing) Act, 1937: The act is providing
the authority and control for the grading and marketing of agricultural produce. It
includes provision of Dry fish, shell fish and fishmeal.
Pakistan Fish Inspection and Quality Control Act, 1997: The law gives a detailed
description of conditions required for registration of processing plants for export ice
factories, fish handling on board fishing vessels, landing places, and processing of
fish establishments.
70
SWOT ANALYSIS
Strength:
Shipping industry in It can easily handle capital flow and Pakistan ports have enough
capital for meeting their daily needs.
Shipping industry and yard has been developing at gawadar which is a developing
port.
Pakistan’s shipping industry has skilled and knowledgeable labor. In shipping
industry, labor is more important for development so it is a big strength of Pakistan.
There are main three ports in It namely Qasim, KPT, gawadar port. This port are
doing most of the trading in It.
Weakness:
There is unnecessary charges on import and export in it and pakistan government is
also increasing this charges.
There is no regular time arrival of shipment in it. There is delay in shipment which
can affect negatively for development if shipping industry,
PNSC and other ports and shipping industry are over staffed. So expenses of this over
staffed are high.
The management of it port industry is not as per the mark. There is no management
efficiency. so it produce inferior quality services.
For development of shipping industry, there is a need of coordination with transport
sectors which are not developed.
Trading from country port Qasim, KPT, gawadar port are more expensive than
regional ports.
Opportunities:
Pakistan has Lucrative strategic geographic location. So it can develop more and more
opportunities with other country. It is also developing its trade with india.
Pakistan announced its intention to begin normalizing trade relations with India,
ultimately granting India MFN status. This means that Pakistan’s tariffs on Indian
imports would receive the same treatment as imports from its other trading partners.
MFN status was a building block of the General Agreement on Tariffs and Trade
(GATT) system, which required that GATT members treat each other equally and
prohibited discrimination among its members. India and Pakistan were original
members of the GATT.

71
Threats:
Some countries like India,or china are supporting their economics development by
reducing their import. So it can affect negatively to trade of pakistan.
There is high duty and taxes applied on trade.
In the world, it has poor image because of political reason, terrorism. So there is less
chance of development.
Nontariff barriers and infrastructure challenges remain as it is.

72
IRON & STEEL
INDUSTRY

73
Steel is a metal consist of Iron. It includes the content of carbon between 0.2 % to 2.1 % by
weight which depends on grade. Carbon is the most common element of iron. There are many
other alloying materials in Iron such as manganese, chromium, vanadium, and tungsten.
These elements act as a hardening agent of Iron which prevents dislocations in the iron atom
crystal lattice from sliding past one another.
“The Iron and steel Industry” is talked commonly and together as if it were a single entity.
But infact, historically steel and Iron were separated products. Steel Industry is an Indicator
of Economic Progress as it plays the critical role in infrastructure and for overall economic
development.
In recent years, there was a massive increase in the demand for steel recent years because of
the boom un India and China. During 2000 to 2005, The demand for steel increased by 6% in
all over the world. Since 2000, several Indian and Chinese steel firms have risen to
prominence like Tata Steel (which bought Corus Group in 2007), Shanghai Baosteel Group
Corporation and Shagang Group. ArcelorMittal is however the world's largest steel producer.
China was at the Top in steel production with about one-third of the world share: Japan,
Russia, and the US followed respectively stated by the by the British Geological Survey,
2005.
Annual Steel Production in Million Metric Tone:
Souce: World Steel Association

74
Top 10 steel-producing countries:
Rank Country 2011 2010 %2011/2010
1 China 695.5 638.7 8.9
2 Japan 107.6 109.6 -1.8
3 United States 86.2 80.5 7.1
4 India 72.2 68.3 5.7
5 Russia 68.7 66.9 2.7
6 South Korea 68.5 58.9 16.2
7 Germany 44.3 43.8 1.0
8 Ukraine 35.3 33.4 5.7
9 Brazil 35.2 32.9 6.8
10 Turkey 34.1 29.1 17.0
Uses:
Iron and steel is being used very commonly and widely in the construction of roads,
buildings, railway, appliances and other infrastructure. Most large modern structures, such as
stadiums and skyscrapers, bridges, and airports, are supported by a steel skeleton. Even those
with a concrete structure will employ steel for reinforcing. In cars also, despite the huge
usage of aluminum, it is used widely. Use of the steel is also there in variety of other
construction materials such as screws, nuts, and bolts. Many other application of steel are
also there such as shipbuilding, pipeline transport, mining, offshore construction, aerospace,
white goods (e.g. washing machines), heavy equipment such as bulldozers, office furniture,
steel wool, tools, and armour in the form of personal vests or vehicle armour (which is better
known as rolled homogeneous armour in this role).
Steel Industry of Pakistan
Pakistan established a steel mill which is based on kalabagh iron ore, coal mining and other
minerals which has covered the area of 11 miles (18 km) approx with the help of M/S Krupp
of Germany, in 1956.The project was shelved by the former Pakistan Prime Minister Mr. Z.

75
A. Bhutto. (Mr. Z. A. Bhutto wanted to set up Pakistan Steel Project at Sindh which was
supposed to be depended on 100% imported iron ore rather than local ore of Kalabagh)
A German company M/S Salzgitter produced 5000 tonnes of quality steel from 15000 tonnes
of iron ore, at kalabagh with help and in observation of international industrial experts, which
was sold to Volkswagen Company, in the year 1966, June.
Volkswagen offered to set up kalabagh steel Mill (with the capacity of production of 800000
tonnes per annum (mt py)) based on kalabagh iron ore and imported coal at an estimated cost
of Rs. 1.542 billion which includes forign exchange cost of Rs. 878 million, in August 1967.
Loans for this big project were offered by some of European banks, which conformation of
financial and technical stability and viability of the project. PIDC selected a site with about
80% raw materials available within appox 11 miles (18 km). Visits of Chinese and Korean
companies’ experts (in March, 2011) for setting up Steel Mill at Kalabagh give the proof of
viability and sustainability of the project
In 1972, Chines and Korean Companies’ experts found that there is substantial quantity of
iron ore in Nokkyndi, which is an area of Balochistan. Sustainailty and viability for steel
production in Balochistan was also confirmed by steel experts from America and Japan and
they also recommended to establish a mini steel mill in Balochistan. After upgradation, this
ore was found suitable for Pakistan Steel Mill. According to“The News” of January 31, 1999
It was confirmed that Government gave consideration to the offer of establishing mini Steel
mill in Balochistan from China and Iran. In April, 1968, the offer from Russia for Kalabagh
Steel Mill Project was accepted by President General and the project agreement was signed
by the next President General Yahya Khan.
Subsequently, it was transpired that Russia was not having the technology to produce Steel
fom the Kalabagh iron ore. The site of the Steel mill project were shifted to Karachi instead
of reviewing the German Offers based on local raw materials. It was established with
comparatively inferior and bad Machinery. The estimated cost of the construction of Pakistan
Steel Mill was approximately Rs.14.287 billion and it was commissioned at a cost of Rs. 24.7
billion in 1985. It had the initial capacity of 1100000 tonnes per annum (mt py). In last 17
years, on an average 70% to 80% capacity of production of 1100000 mtpy has been utilized
approximately. The installed machinery was inefficient to use full capacity. While the
Pakistan Steel Mill (commissioned in 1985) had produced about 750000 tonnes steel in 1991
with the man power of 28000 employees including 4000 temporary employees, a Brazilian
Steel Mill , which was set up in 1956 with the help of technology and Machinery of Japan,

76
were producing 4.3 million tones steel annually with the man power of 13000 employees. (a
comparison by “Newsweek”, November 4, 1991).
It did not take long for Pakistan to realize that the progress of industrial and economical and
country development would be not possible without having an independent iron and steel
producing plant. The more dependence on imports of iron ore can create serious setback to
the development of country along with an extraordinary high import bill of iron ore which is
next to impossible to bear.
In 1968, Pakistan Government decided to the Karachi Steel Project was sponsored in the
public sector in which a separate Corporation, under the Companies Act. In pursuing of this
decision, Pakistan Steel Mills Corporation Limited was set as a private limited company to
set up and run steel mills at Karachi. In January, 1969 Pakistan Steel Mills Corporation
entered into an agreement with exporter of the USSR, V/O Tyaz Prom to prepare the
feasibility report for the foundation of a coastal-based integrated steel mill at Karachi.
The Pakistan Steel Mills
PSM, it is one of the state-owned producers of heavy iron products and long rolled steel
in Karachi, Sindh Province of Pakistan. The Pakistan Steel Mill is the country's largest
industrial undertaking in steel and having a production capacity of 1.1 million tonnes of steel.
From the construction inputs of the company the various and enormous dimensions of the
project undertaken can be visualised involving the use of 1.29 million cubic meters of
concrete, 5.70 million cubic meters of earth work (second to Tarbela Dam), 330,000 tonnes
of machinery, steel structures and electrical equipment.
The unloading activity and conveyor system of goods and output at Port Qasim is the 3rd
largest in the world and the company is having largest industrial water reservoir having a
Profile of Pakistan Steel Mills
Name of the Organization Pakistan Steel Mills Corporation (PVT) LTD
Foundation Stone Laid on 30th
December, 1973
Location 40 Km East of Karachi
Production Capacity 1.1 Million Tonn of Steel Expandable upto 3.0 Million Tonn per
annum
Main Products Coke, Pig Iron, Billets, Cold Rolled Sheets, Hot Rolled Sheets,
Galvanized Sheet.

77
capacity of 110 million imperial gallons (500,000 m3) per day as compare to other companies
in Asia. The company’s sea water channel is2.5 km long and it is connected to the sea water
circulation system to the plant site with a consumption of 216 million imperial gallons
(980,000 m3) of sea water per day. Being having such high capacity only 18 % of this
capacity is actually in use and the chairman of the mills has requested for a government
bailout of Rs12 billion to prevent their closure.
The Founder of Pakistan Steel Mills (PSM)
Prof. Dr. Niaz Muhammad, Wahab siddiqui and Russian scientist Mikhail Koltokof are the
real founders of Pakistan Steel Mills. Among these people the hard work of Niaz Muhammad
was such so that thousands of scientists and technical staff got trained by him. He received a
pride of performance from the Government of Pakistan and was nominated for the global
prize.
Location and site
At a distance of 40 km Southeast of Karachi Pakistan Steel is located at Bin Qasim which is
near Port Muhammad Bin Qasim. The location founded to be a preferable location, alongside
a tidal creek and having a wind direction away from the Karachi city.The area which is
covered by the company is spread out over an area of 18,660 acres (75.5 km2) (about 29
square miles (75 km2)) including 10,390 acres (42 km
2) for the main plant, 8,070 acres
(33 km2) for the township and 200 acres (0.8 km
2) for the 110 MG water reservoir.
In addition to this, it has leasehold rights over an area of {convert|7520|acre|km2|0} for the
quarries of limestone and dolomite in the Makli and Jhimpir areas of Thatta district.
Steel Mills In Private Sector
In early 70’s About 15 Arc furnaces of capacity 5 mt were installed in the private sector and
these private players started their production to support Pakistan Steel Mills in producing
steel in the country. And now, in different areas of Pakistan about more than 140 steel
melting induction furnaces are installed which are meeting steel requirement of It by
producing good quality steel. As compare to induction furnaces Arc furnaces are more
expensive and take comparatively longer production time, so Arc furnaces are replaced by
induction furnaces by most of the private sector in steel industry. Steel is produced by using
latest technology induction furnaces by private factories and they are trying their best to
compete with the international market.
Compare to private sector producing 30 million ( including billet, rebars, channel and angle
etc), Pakistan Steel mills is producing about 1 million ton per year steel. The any other
requirements are fulfilled with ship breaking and other steel products.

78
Trade between India & Pakistan
There is a great emphasis for improving the economic and commercial relation between India
and Pakistan in recent times. The liberalization for trade between India and Pakistan has
become a growing and important issue at international level. It is an attention demanding
issue at both regional and bilateral level meetings. From the last few years, the global trend of
regional economic cooperation has been rapidly gaining the importance. Because of
globalization and the world trade organization are making such variation necessary, the
global trend of regional economic cooperation has become very strong and constant.
The situation is not the same in south Asia, rather it is disappointing. The intra-regional trade
is in stagnant position at less than 2 % of the total trade in the last five years. Similarly, in
bilateral trade between the two largest economies and trading nations, India and Pakistan,
there is no reflection of any remarkable progress because of the unfriendly relation between
these two countries.
Pakistan’s Trade Policy With India
It has adopted a conscious strategy to gradually open trade with India, particularly in sectors
in which it is not so competitive. While It allows all kinds of exports to India, it had
maintained a positive list of 687 items which were officially importable from India. In
pursuance of the South Asian Preferential Trade Agreement (SAPTA) negotiations, the
positive list of importable items was expanded by 81 items to a total of 768 items and further
to 773 items in February 2006. On the other hand, India does not impose equivalent formal
restrictions on exports to or imports from It, but other restrictions (e.g. on travel, remittances,
banking, customs clearance) are generally believed to have a similar effect, especially as
regards imports.
Trade Performance Comparison
Exports Of Iron And Steel (2010, In Usd Thousands) cO
Sr. No. Particulars Details /
Figure
Details /
Figure
1 Rank 18 103
2 Country India Pakistan
3 Exports in Value 6996223 31294
4 Exports as a share of total 3.1700 0.1500
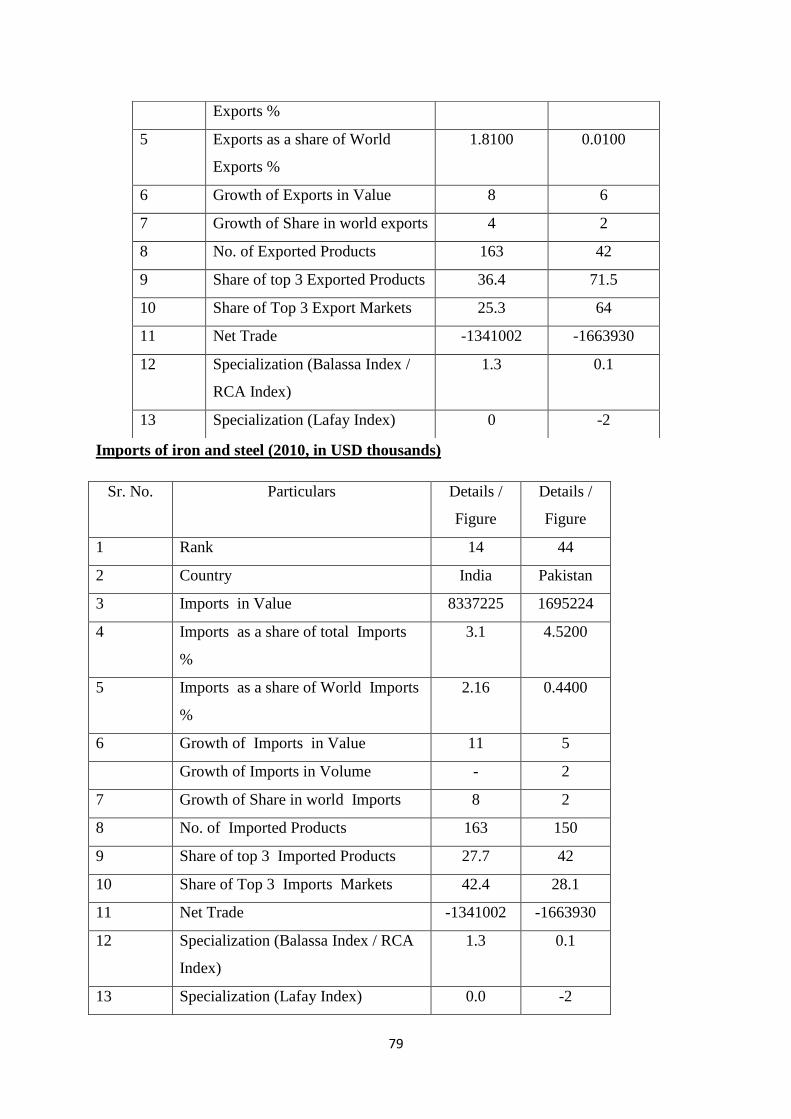
79
Imports of iron and steel (2010, in USD thousands)
Exports %
5 Exports as a share of World
Exports %
1.8100 0.0100
6 Growth of Exports in Value 8 6
7 Growth of Share in world exports 4 2
8 No. of Exported Products 163 42
9 Share of top 3 Exported Products 36.4 71.5
10 Share of Top 3 Export Markets 25.3 64
11 Net Trade -1341002 -1663930
12 Specialization (Balassa Index /
RCA Index)
1.3 0.1
13 Specialization (Lafay Index) 0 -2
Sr. No. Particulars Details /
Figure
Details /
Figure
1 Rank 14 44
2 Country India Pakistan
3 Imports in Value 8337225 1695224
4 Imports as a share of total Imports
%
3.1 4.5200
5 Imports as a share of World Imports
%
2.16 0.4400
6 Growth of Imports in Value 11 5
Growth of Imports in Volume - 2
7 Growth of Share in world Imports 8 2
8 No. of Imported Products 163 150
9 Share of top 3 Imported Products 27.7 42
10 Share of Top 3 Imports Markets 42.4 28.1
11 Net Trade -1341002 -1663930
12 Specialization (Balassa Index / RCA
Index)
1.3 0.1
13 Specialization (Lafay Index) 0.0 -2

80
Trade Integration between Pakistan And India
Pakistan and India are the two most popular and largest economies of the South Asian
Region. However, official bilateral trade remains negligible and neither country falls in the
category of top ten trading partners of each other partly due to their history of being relatively
closed economies. India’s foreign trade openness remained low at 31 % than 38 % for It and
the average for South Asia (65 %) and ASEAN countries (144 %) in 2003.
India’s share in Pakistan’s total exports remained less than one %, whereas in total imports, it
fluctuated within a narrow range of 1.36 to 2.66 % during the last five years (FY01-05).
Pakistan’s share in India’s total exports averaged 0.45 % whereas in imports it constituted
only 0.11 % during FY 1999-00 to FY04.
Compared to the actual trade worth $476 million in FY04, the potential of bilateral trade
based on FY04 data has been worked out at $5.2 billion in the SBP study. This can be
compared with other estimates of $1.85 billion in a World Bank study, using fixed effects
gravity model of bilateral trade based on 2001 data, $6.5 billion in the Indian Council for
Research on International Economic Relations (ICRIER) study of December 2004, using the
augmented gravity model specification, and the informal estimates at around $10 to $15
billion quoted in the Karachi Chamber of Commerce.
81
PHARMACUTICAL
INDUSTRY

82
It has a very vibrant and forward looking Pharma Industry. At the time of independence in
1947, there was hardly any pharma industry in the country. Today it has about 400
pharmaceutical manufacturing units. The Pharmaceutical Industry meets around 70% of the
country's demand of Finished Medicine. The local pharma market, in terms of share market
is almost evenly divided between the Nationals and the Multinationals.
The National pharma industry has shown a progressive growth over the years. It has invested
substantially to upgrade itself and now the majority industry is following Good
Manufacturing Practices (GMP), in accordance with the domestic as well as international
Guidance. Currently the industry has the capacity to manufacture a variety of product ranging
from simple pills to sophisticated Biotech, Oncology and Value Added Generic compounds.
Although pharmaceutical and healthcare sectors of Pakistan are expanding and evolving
rapidly, about half the population has no access to modern medicines. Clearly this presents an
opportunity, but much more work needs to be done by the government and industry's
stakeholders. The value of pharmaceuticals sold in 2010 exceeded US$1.4bn and value of
medicines sold is expected to exceed US$2.3 B by 2012.
The pharmaceutical market is developing, with a large population and economic progress
evident, but per capita drug spending was rather low at around US$9.30 in 2010. Private
spending is 65% of total healthcare expenditure sourced through out-of pocket payments,
international aid and religious or charitable institutions. Pharmaceutical spending accounts
for less than 1% of the country's GDP. The share of generics is also likely to increase further
as major drugs come off-patent in the near term, to the likely benefit of the generics-
dominated local industry.
The pharma industry of Pakistan is relatively young in the international markets with an
export turnover of over US$ 100 Million as of 2007. It boasts of quality producers and many
units are approved by regulatory authorities all over the world. Like domestic market the
sales in international market have gone almost double during last five years. The industry is
focusing to an Export Vision of USD 500 Million by 2013. In the meantime, exports are also
likely to be boosted by global opportunities.
The Pakistan Pharmaceutical Industry is providing high quality essential drugs at affordable
prices to Millions. Technologically, strong and self reliant National Pharmaceutical Industry
is not only playing a key role in promoting and sustaining development in the vital field of
medicine within the country, but is also well set to take on the international markets.

83
Historical background
There were two small units which were unable to meet the local demand, at the time of
independence. The rest of the medicines were imported. The decision taken in 1972 to abolish
brand names, restrict availability of essential drugs to 850, fix maximum retail prices across the
board and freely allow local manufacturer of all the essential drugs was in fact a life line for the
national segment of the industry. Due to inaccessibility of new researched medications, this
policy was ultimately reversed in 1976.There were only 3636 registered drugs in 1977. The
number however rose to 6228 in 1981, and almost 9900 were reported in 1999. At the end of
1999, there were 300 registered units producing medicines and other pharmaceuticals. The last
10 years have been eventful for the industry as they have developed a large number of domestic
manufacturers. In 2006 there were over 400 licensed pharmaceutical companies in Pakistan.
Today, the industry has developed technology, production and an infrastructure of imports. It has
Domestic companies which are quite confident of doing good business.
Pharmaceutical sector faces immense challenges
Pharmaceutical Industry is one of the major manufacturing industries in Pakistan providing
employment to thousands of people directly and indirectly. The industry, however, is facing
many challenges, which are hindering its growth. The major challenge faced by the industry is
the complete freezing of price of pharmaceutical products since 2001.
The prices of pharmaceutical products are determined by Ministry of Health and the Ministry has
not increased the prices since 2001. With medicine prices still at the 2001 while the fuel,
electricity, labour wages, and raw materials' prices sky-rocketing at a rate which makes all
percentages meaningless, pharmaceutical companies have to weather large cuts in their profit
margins, to the extent that many are finding it hard to keep up with their expenses.It is the only
country in the entire Asian region that has not given its pharma and biotech industry tax-breaks
and R & D incentives. Government's requirement that drug production lines should be separate is
raising cost and reducing the ability of local manufacturers to compete not only in the global
market but even at home. Most of the raw material is imported from different countries of the
world. If rupee depreciates against the dollar, it raises the cost of raw material which adversely
affects profitability of the local manufacturers.
Presently, 411 local pharmaceutical manufacturers are in the market, while 30 multinational
companies are producing medicines in It. The industry's turnover is $ 1.9 billion approximately,
with exports contributing only $ 85 million. The pharmaceutical industry is trying to increase its
exports to $ 600 million till the end of 2011, a target that can be made realistic and attainable
84
only if the Government solves the problems being faced by pharmaceutical industry. Pakistan's
pharmaceutical industry is considered to be one of the cheapest pharmaceutical industries in the
world which is producing medicines at the cheapest rate, maintaining the quality and packaging
according to the world standard.
If Ministry of Health allows the manufacturers to set the prices of medicines according to the
situation in the market, it will be a great incentive for the industry. The Ministry can still regulate
the prices of limited drug molecules, as the Government of India is doing.
Government of India is setting the prices of only 74 drug molecules which are mentioned by
WHO as essential medicines. The probability of establishing a cartel by the manufacturers is
very small considering the sheer number of players working in the industry.
In the past, Govt has given incentives like tax-breaks, R & D and tax rebate to textile and IT
sectors. Provided with these incentives, these sectors have performed reasonably well. If such
incentives are offered for the pharmaceutical industry, the exports of pharmaceutical products
can be increased exponentially.
The pharmaceutical market– review
The macro environmental indicators for the Pakistani pharmaceutical market are positive
despite economic concerns. Economically, the Economist Intelligence Unit (EIU) projects
that It will be the fourth smallest economy in the Asia Pacific region covered by Espicom in
2016. In GDP per capita terms, It will rank the second lowest in the Asia Pacific region in
2016. According to the EIU, It will remain heavily dependent on multilateral institutions and
bilateral donors for concessional loans and emergency aid. Demographically, the EIU
projects that It will have the fourth largest population in the Asia Pacific region by 2016. The
elderly population represents a very small proportion of the population; it will be the lowest
rate in the Asia Pacific region by 2016.
Intellectual property rights (IPR) continue to be a major concern amid patent issues and the
prevalence of counterfeit drugs. Despite being a signatory to the WTO TRIPS agreement,
Pakistan’s IPR protection for pharmaceuticals is very weak. It remains on the US Trade
Representative’s (USTR) Priority Watch List in 2011. The USTR stated that It needs to
improve the protection against unfair commercial use of pharmaceutical test data, and should
establish an effective system to address the patent issues of pharmaceutical products. The
Pakistan Medical Association alleges that nearly half of drugs available in the country are
counterfeit and that the population spends around three-quarters of their household health
budget on drugs, half of which may be fake or unfit for human consumption.

85
Pakistan’s pharmaceutical market is small and equally split between multinational and
domestic companies. Espicom projects the market to grow at a fairly high single-digit CAGR
in dollar terms during the forecast period. By 2016, it will be the 11th largest pharmaceutical
market in the Asia Pacific region covered by Espicom. The pharmaceutical market in It is
dominated by locally manufactured pharmaceuticals, predominantly generic drugs, which
meet around 90% of country’s needs in 2011. Imported retail medicaments account for the
remainder of the market, although manufacturers rely heavily on imported raw materials for
production. Multinational companies account for around half of the market by value,
although local producers have a far greater share in terms of volume.
CURRENT SITUATION OF PHARMACEUTICAL INDUSTRY
The pharmaceutical market comprises of large Multinational Companies which are producing
and marketing research based products and also other big and small National companies
which pre-dominantly produce and market generic products. Out of total market of US$ 2
billion, 53.3% is captured by Multinationals and 46.7% is taken up by National companies.
The top 50 companies enjoy more than 80% market share. There are 20 multinationals in the
top 50 companies, while the top 100 companies have 94.0% market share. Only 2
manufactures are involved in the manufacture of raw materials. Having no recourse to a
single price increase since December 2001, the pharmaceutical sector is under pressure to
maintain its profitability in the face of inflationary pressures and currency devaluation. The
total outlay on the health sector is budgeted at Rs.38.0 billion, which has increased by 15.8
% over last year. The existing network of medical services consists of 12,260 hospitals,
113,000 doctors practicing, 4582 dispensaries, 5301 Basic Health Units (BHU), 552 Rural
Health Centers (RHC), 906 Maternity and Child Health Centers (MCH) and 289 Tuberculosis
Centers (TBC). total expenditure on health has increased from PKR 4.37 billion to PKR 6.04
billion, which is 31.86% higher than the last year.( as of 2010).
GROWTH OF PHARMACEUTICAL INDUSTRY
Total population of It is approximately 161 million (2010 statistics) and the
population growth rate is 2%.
Pharmaceutical industry in It is at PKR 70.89 billion and growing at 12.9% per annum
($ 2 billion) and showing a positive trend hence attracting local and foreign
investment in It.
Since 1999, 2,500 new drugs have been registered.

86
Although it registered a fairly robust growth during 2009-10, the total market in It remains
small in relation to the population size.
IMPORTS AND EXPORTS OF PHARMACEUTICAL INDUSTRY
Nearly 95% ( Approx $ 450 million) of the basic raw material used for manufacturing
is imported from countries like China, India, Japan, UK, Germany and others.
Aided by the conducive policy initiatives, Pak firms have emerged successful in the
export front, as well. According to reports, It exported drugs worth fifty million US
dollars during the year 2009. Middle East, Far East, Africa, Ceylon and Latin
American countries are other locations where Pakistani drugs are now being exported.
Imports 2006-2009
Product group: - Medicaments (including veterinary medicaments)
Value 2006
US$ '000
Value 2007
US$ '000
Value 2008
US$ '000
Value 2009
US$ '000
Value 2010
US$ '000
24,518 1,28,259 1,54,605 1,51269 1,93,174
Product group: - Medicinal and pharmaceutical products.
Value 2001
US$ '000
Value 2002
US$ '000
Value 2003
US$ '000
Value 2004
US$ '000
Value 2005
US$ '000
1,06,020 95,863 1,19,236 1,20,238 1,41,359
ROLE OF GOVERNMENT
The total outlay on the health sector is budgeted at Rs.38.0 billion, which increased by 15.8
% in 2010 over last year. Government of Pakistan had invested Rs.8 billion in the
pharmaceutical industry since 1999 to guarantee good quality drugs at competitive prices.
Pakistan Health Ministry is considering constituting a committee comprising of the World
Health Organization (WHO), Pakistan Pharmaceutical Manufacturers Association (PPMA)
and Health Ministry to keep check on the quality of drugs available in the market. According
to statistics by Ministry of Health 41.2% of the Pakistani population cannot afford procuring
medicines due to high prices in the country. Tariff protection is generally allowed to
encourage local manufacture of APIs. Federal Government is working on the important
subject of DRA and will make sure that it accommodates the expectations and objectives of
the local pharmaceutical industry without compromising on good standards
The government has set up an independent Drug Registration and Pricing Authority. In
Pakistan the Ministry of Industries decides about the drug pricing. In the biotechnology

87
sector, It has initiated many programs. It is planning to set up biotechnology plant worth
Rs.400 million to meet the growing needs of quality medicines in the country. The move is
being taken in the field of medicine by the private sector in collaboration with investors the
plant would start production within the next few years.
SWOT ANLYSIS
Strength:
With a tradition of half a century and over 400 manufacturing plants, pharmaceutical
manufacturing has a strong base with over 160,000 highly skilled employees. Over 30
faculties of pharmacy and many allied disciplines feed this industry and it is technically
capable of formulating almost all forms of drugs and medicines like tablets, capsules,
injectables and others.
Weakness:
Pharmaceutical basic raw material (manufacturing) Industry is the backbone to the finished
drug (formulation) industry. Despite development of the formulation industry, there has not
been a corresponding development in the manufacture of basic raw materials needed to
support the manufacture of pharmaceuticals. Nearly 92% of basic raw material is being
imported in large quantities from USA, UK, Germany, Japan and China at relatively high
cost in comparison to our neighboring countries.
Opportunity:
The size of the pharmaceutical market in It is Rs.101 Billion (USD 1.2 Billion) and it is
growing at a rate of about 12 - 15% per annum. There are presently 448 manufacturing units
in It and there are 28 multinational companies operating in the country which have a 50%
market share, suggesting that the market is quality-sensitive. Export of pharmaceuticals is
limited, presently worth only USD 100 million, and these are destined mainly for African,
Central Asian and South-East Asian countries. European, Australian and American markets
remain beyond the industry’s reach owing to lack of the requisite manufacturing standards.
Amongst the manufactured exports, pharmaceuticals rank seventh but more impressive is
their growth which is twice the overall export growth of It. There is a need for manufacturing
facilities in It that are of standards that would lead the way into the quality segment of the
sector with approval of developed regulators such at TGA of Australia, MHRA of UK,
EMEA of EU and FDA of US. The growth of the generic prescribing in these regulated
markets presents great opportunity for quality manufacturing and the demand in the US will
rise exponentially with the introduction of healthcare reform in that country.
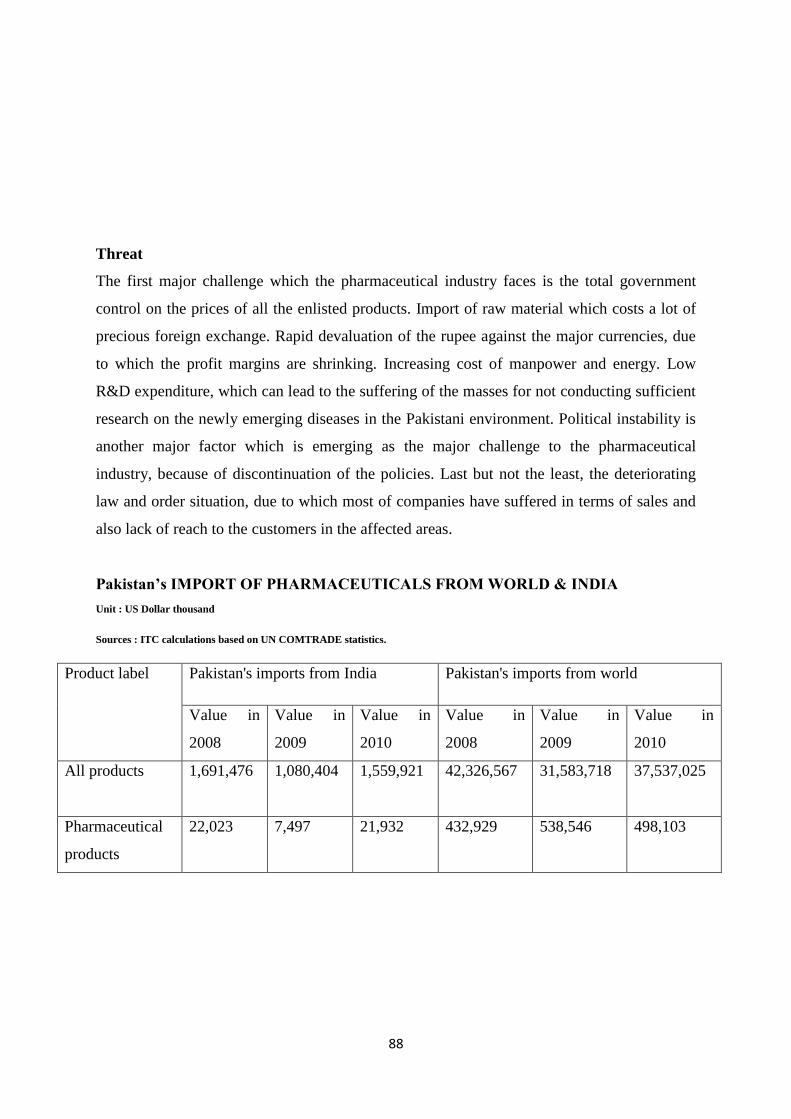
88
Threat
The first major challenge which the pharmaceutical industry faces is the total government
control on the prices of all the enlisted products. Import of raw material which costs a lot of
precious foreign exchange. Rapid devaluation of the rupee against the major currencies, due
to which the profit margins are shrinking. Increasing cost of manpower and energy. Low
R&D expenditure, which can lead to the suffering of the masses for not conducting sufficient
research on the newly emerging diseases in the Pakistani environment. Political instability is
another major factor which is emerging as the major challenge to the pharmaceutical
industry, because of discontinuation of the policies. Last but not the least, the deteriorating
law and order situation, due to which most of companies have suffered in terms of sales and
also lack of reach to the customers in the affected areas.
Pakistan’s IMPORT OF PHARMACEUTICALS FROM WORLD & INDIA
Unit : US Dollar thousand
Sources : ITC calculations based on UN COMTRADE statistics.
Product label Pakistan's imports from India Pakistan's imports from world
Value in
2008
Value in
2009
Value in
2010
Value in
2008
Value in
2009
Value in
2010
All products 1,691,476 1,080,404 1,559,921
42,326,567 31,583,718 37,537,025
Pharmaceutical
products
22,023 7,497
21,932 432,929 538,546 498,103

89
Figure 1
Sources : ITC calculations based on UN COMTRADE statistics.
Unit : US Dollar thousand
Sources : ITC calculations based on UN COMTRADE statistics.
Product label Pakistan's imports from India Pakistan's imports from world
Value in
2008
Value
in 2009
Value
in 2010
Value in
2008
Value in
2009
Value in
2010
Human & animal
blood; antisera,
vaccines, toxins,
micro-organism
cultu
18122 4942 11584 154430 193902 180454
Medicament
mixtures (not
3002, 3005, 3006),
put in dosage
3832 2165 9912 252158 297830 278505
Medicament
mixtures (not
3002, 3005, 3006)
not in dosage
69 390 293 12828 15919 12758

90
Pharmaceutical
goods, specified
sterile products
sutures, laminaria,
b
0 0 86 10444 26995 18281
Dressings
packaged for
medical use
0 0 57 2953 3809 8093
Glands & extracts,
secretions for
organ therapeutic
uses; heparin & it
0 0 0 116 89 13

91
GEMS & JEWELLERY
INDUSTRY

92
Gems and Jewellery industry in It is as old as the history of Indus civilization. It is bestowed
with availability of raw material and skillful labour which contributed greatly for the
establishment of Gems and Jewellery in It. Karachi is the main commercial hub of Gems and
Jewellery supplying 60% of total demand to other parts of the country. Other important
centers are Lahore, Rawalpindi, Hyderabad, Faisalabd and Peshawar specially for Gems.
The global demand of gold is more than 2500 tones and Pakistan’s consumption is more than
100 tones which makes It worlds 10th largest market .Gold is usually imported from Gulf
States and western countries. In the Gem sector It is full of natural resources. Unmatched
quality of Ruby, Emerald, topaz, aqua marine, fluorite lais-lazuli which are mined from the
valleys of Gilgit, Hunza, Swat, Azad Kashmir and Chitral due to unavailability of gem
cutting and polishing facilities.
Gems are exported in a raw form which brings nothing as compared to its real worth. Gems
and Jewellery industry may be attributed as small family oriented industry with skill and
traditional mindset. Overall all marketing linkages are missing and interpersonal cut throat
competition and a narrow vision presents the scenario of under developing industry in It.
GEMS AND JEWELLERY CLUSTER IN KARACHI
Past:
Since independence Karachi remained the hub of commercial activities. Skillful labour and
market access were the chief factors which contributed greatly in the establishment of this
industry in Karachi. The artisans of migrated families from India with traditional Delhi and
Jaipur traditions established small business in Sarafa Bazaar near Kharadar, thus, became the
first commercial market of jewellery in this Cluster. Sadder, Tariq Road, Liaqatabad, Hyderi
and Clifton are other potential markets in this cluster. Among all these markets Sadder plays
very pivotal role in the Jewellery and Gem sector.
Present:
Karachi cluster of Gems and Jewellery may be regarded as advanced and organized as
compared to other areas in Pakistan because of greater market access, consumption and
availability of raw material. Currently there are more than 5000 units of Gems and Jewellery
employing more than five lacs people. Sarafa Bazar, Saddar, and other markets are very
potential market selling mostly items of traditional designs. All the leading manufacturers
and Exporters are based in Saddar market which controls not only the business in Karachi but
of Pakistan. Total Gold consumption in Pakistan is more than 100 tones in which official
imports is more than 30 tones, other comes through unofficial channels. In Pakistan there are

93
four officially importers of Gold namely Al Rahim, Pardesi, ARY and Tessori. On all import
of Gold ,Pakistan levies $1 Custom Duty on every tolla (11.66 grams) of bullion .On the
jewellery Pakistan levies 25% Custom Duty, 15% Sales tax and 5% Income tax.. Most
manufacturing is concentrated in small family workshops employing between two to four
people. Jewellery of 22 carats dominates with 95% share of the market. In the Gems sector
Karachi comes after Peshawar which is the main commercial center. In the Karachi cluster
there are more than 500 units dealing with precious and semi precious stones. As Pakistan’s
studded jewellery is very popular that’s why both Gems and Jewellery Cluster grew side by
side in the Karachi.
Future:
Gems and Jewellery cluster has a very promising future . Gems and Jewellery industry in
Pakistan has a great potential because of availability of raw material and skillful labor. On
special events like Weddings and Birthdays people use Gold. Consumption of Gold is great
in rural areas This is a precious item so it also plays its role as in the form of Savings. Due to
Government liberalized policies for gold new avenues are opened for the Export market
which is still in the developmental stage, there is 20- 25 % profit in the export of these
precious items in the international market. The volume of this business is underestimated
because of various regulatory agencies like Income Tax and Customs and smuggling. Gems
and Jewellery Cluster could be dynamic provided necessary steps are taken for the
development of this sector. Export Promotion Bureau has taken great initiatives to develop
and train this sector and in this regard it has established three training institutes in Karachi,
Lahore and Peshawar. Currently Export Promotion Bureau is working on the idea of
establishing Dazzle Park in Karachi where all modern facilities be provided to the jewellers.
It is expected that in the 21st century when the world is going to be globalized these people
will get benefit from this facility and help themselves to develop their business on modern
lines.
Smes, main actors and their inter linkages
Following are Public and Private institutions and organizations which can play their part for
the development of SMEs in Pakistan specially in the GEM AND Jewellery sector.
A). Players on a National Level
All Pakistan Gem Merchants & Jewellery Association.
All Pakistan Commercial Exporters Of Precious & Semi-precious Stones
Pakistan Gem Manufacturers & Exporters Association.
Members of APGMJA
94
Raw material Supplier.
Federation of Pakistan Chamber of Commerce & Industries.
Small & Medium Entrepreneur Development Authority.
Sind Small Industries Corporation.
Small Business Finance Corporation.
Commercial Banks.
Export Promotion Bureau
All Pakistan gem merchants & jewellery association
APGMJA is a registered Trade Organization established in October 1970 with the aim and
objective to look after the best interests of Gem and Jewellery Merchants, Miners, and
Exporters in Pakistan. At present it has more than 1000 members with Head office at Saddar
Karachi. The performance of APGMJA is not quite satisfactory because of ongoing litigation
and rifts among members and Office bearers. Ongoing rifts and grudges among members
have created a mess in the affairs of the association. Because of grouping and politics, the
common manufacturers and merchants are sufferers. Due to not taking of matters of its
members’ problems seriously so many small association emerged which are not registered in
the FPCCI.
All Pakistan commercial exporters association of rough& unpolished precious & semi-
precious stones
This is another association based in Peshawar for the welfare of gem merchants and exporters
of this area. As compared to APGMJA this is organized but its area of influence in limited
only in NWFP province. Their performance for the development of this sector is quite
satisfactory, especially in the field of training and participation in the international fairs and
delegation.
Pakistan gem manufacturers & exporters association
This is small and inactive association, which is not registered .Its founder, is Ex- Chairman of
APGMJA. Now they have established their own association to address their problems with
the Government. Its role in the policy matters is quite satisfactory. The members of this
Association are the members of APGMJA but due to rifts and grudges they are doing their
job.
Members of all Pakistan gem merchants and Jewellery Association
These are also the members of APGMJA Recently their membership has been cancelled.
They gathered on this platform when the main Association canceled their membership. They
95
are basically the Association of Exporters who claims many difficulties due to litigation and
rifts.
Raw material supplier
These are the agents who provide Gold (Bullion), precious and semi- precious Stones and
other material for the manufacturing of Jewellery. Basically Pakistan imports Gold from the
Dubai or Switzerland. There are officially four Importers of Gold in Pakistan viz, ARY, Al-
Rahim, Pardesi and Tessori. Bullion market is the main market for local supply. It has been
observed that whole market is monopolized by the main parties. Due to daily changing of
international market rates they control local market. Gold is a precious item, which is
recycled again and again. Amount of recycled gold and smuggled one can easily available to
the local manufacturers Exporters use imported gold on zero percentage and in this way they
have edge over the common manufacturer.
Federation of Pakistan chambers of commerce industry
Since its inception in 1950, the FPCCI has also advocated the collective opinion, concern and
aspiration of the private sector. It is the main trade body, which has a great say in the policy
matters with the Government. FPCCI serves as a bridge between the private sector and the
Government. FPCCI tackles efficiently various problems of Trade Export, Development of
Industrialization and foreign Investment. All other associations are registered in this forum.
Small & medium entrepreneur development authority
This organization mission statement is to Develop Small and Medium Entrepreneurs in
Pakistan. Since its establishment it has presented a lot of schemes but no one could be
materialized still. Gems and jewellery industry is on its agenda to develop but still it had not
produced fruitful results. This authority provides technical assistance to the SMEs and assists
in the coordination of financial institutions. Even in all such exercise it is to
monitor the performance of those SMEs. Karachi Gem and Jewellery Cluster have not
achieved required assistance from this.
Sind small industries corporation
This is established in 1972 by the Sind Government. This is an official body committed to
promoting the development of handicrafts and in turn the economic betterment of the
working craftsman. SIC is not only provides education an assistance to working craftsman in
the field of designing but also the quality control and working of the products. Recently State
Bank of Pakistan has suspended their financial assistance because of misuse of loans. SSIC
has established various Display Centers and Training Centers in the interior of Sind but For
Gems and Jewellery it has not played any significant role.
96
Small business finance corporation
Small Business Finance Corporation (SBFC) is a Development Finance Institution (DFI)
established by the Government of Pakistan in 1972, primarily to assist Small and Medium
Entrepreneurs for self employment and setting up cottage industries. The focus of SBFC’s
operations is to cater to the financing and technical assistance needs of Small and Medium
Enterprises. Recently it has merged with the Regional Development Finance Corporation and
renamed as SME bank since January 1, 2002. SME Bank (SBFC) generally adopts a program
Lending approach for its financing activities. According to this approach, specific sectors
with large SME presence have been identified and specific lending schemes have been
designed targeting these sectors.
Commercial banks
In Pakistan there is a good number of commercial Banks who provide financial assistance to
the businessman. History of such assistance showed very negative trends as such loans were
granted to the favorites. Such loans were never returned thus produced no good results.
Export promotion bureau
Export Promotion Bureau is an attached Department in the Ministry of Commerce. Its
function is to facilitate export trade in Pakistan and provide trade information to the
entrepreneurs in Pakistan. In that cause it provides funds and special packages to the
exporters. As Gems & Jewellery is in the developmental category of EPB that’s why EPB
trying its best to help boost this industry in Pakistan. EPB introduces new markets and
technology to the businessman and in this regard it gives subsidies. For the skill development
in Gems & jewellery it has established three institutes in Karachi, Lahore and Peshawar.
B) International actors
� World Gold Council
� United Nation Industrial Development Organization
World gold council
WGC is an international organization based in Italy .The main purpose of WGC is to create
the market for Gold in a potential market. They provide information, skill and technology in
World’s leading markets. Due to great consumption and skilled labour Pakistan is in the
focus of their activities. Initially the response to WGC was slow by gold traders but now it is
jointly working with leading goldsmiths. WGC has also conducted various design shows in
the jewellery and results were positive.

97
United Nations industrial development organization
UNIDO is a specialized agency of United Nations. This organization provides technical and
financial assistance from developed countries. Till this time Pakistan was not on those
countries where they supported Developmental Projects. Some projects are being run by
UNIDO in India. Recently Pakistan has been selected for such type of projects.
Interlinkages among various actors
On a national level there are various actors who are supposed to develop SMEs in the
Pakistan. It is a harsh reality that Government has taken great interest in the development of
large manufacturing Sector but small and medium were not encouraged at that level. Despite
that, various actors were established to develop these SMEs but in certain areas their
performance is poor. The main problem of SMEs is unawareness, lack of Finance, traditional
manufacturing, unavailability of modern tools. The role of many state and private
organizations for the development of Small and Medium Sector needs to be enhanced more.
From time to time Government helped to establish various institutions and policies but all
such measures were not specific that’s why such institutes didn’t perform better as it was
desired. Financial assistance has been provided but many loans were not repaid because of
political support.
All the entrepreneurs have also problem with the Government’s regulatory Authority i.e.
Income Tax and Customs. Government has an again and again tried to make simplify the
procedures for tax collection. In pursuing the liberalized trade Government has offered
various tax relaxation and reduction of duties. In the Gems and Jewellery industry
Government has allowed Zero % import to the exporters who has to Re-Export within time
period. FPCCI and trade associations are representatives from Trade community. Their role
in the development of SMEs is satisfactory but it can play better role for the development of
SMEs because they know better what these want. For the promotion of trade and industry
EPB gets involved with them. For the skill development, Export Promotion Bureau has
established many institutes like Gems and Jewellery Institute in Karachi and Peshawar.
SWOT analysis
Strengths
-Availability of raw materials specially gems and semi precious stones.
-Skilled labour
-Comparative advantage in the studded Jewellery.

98
-State’s liberalized policies i.e. Zero % Import of Gold and export facilitation.
-Availability of Finance, which can be utilized.
-Availability of Technical Skill through training Institutes.
-Large number of Entrepreneurs.
-Wide local market for consumption.
-Information Technology.
-Easy Access to International markets.
-Recognition in the Global market.
Weaknesses
-Illiteracy
-Cut throat competition.
-Rudimentary Methods.
-No use of new technology.
-Labour is costly.
-High rate of utility charges and tax regulations
-Not easy entry in the business
-Traditional Designs and no innovations
-Not getting benefits from training Institutes.
-Export is nominal.
-Not utilization of International Markets.
-Having no any affiliation with International Gold Organization
-Non availability of Hallmarking and Assaying.
-Smuggling
-Under invoicing
Opportunities
-Globalization and free trade.
-Competition at international level
-Access to new marketing information and skill.
-New and unexplored markets.
-Easy process of affiliation with International organizations.
-Free and transparent trade.
-Reduced role of State.
-Quality Standards.

99
Threats
-Globalization and free Trade.
-Competition with international manufacturing expertise.
-Quality standards.
-Unmatched customer Demand/ satisfaction
-Reduced rate of competencies.
-losing of international buyers.
Exports of gems and jewellery of Pakistan
Comparative export of selected item during july-Jan 2010-2011
Value in Million US$ Unit value $ per units
Quantity Value Unit value
Gems (MT) 12 2.5 208333.3
Jwellery 237.1
Comparative export of selected item during july-Jan 2011-2012
Value in Million US$ Unit value $ per units
Quantity Value Unit value
Gems (MT) 5 1.9 380000
Jwellery 362.5
Imports of gems and jewellaery of pakistan
Comparative export of selected item during july-Jan 2010-2011
Value in Million US$ Unit value $ per units
Quantity Value Unit value
Jwellery (KG) 1899 70.4 37072.1

100
Comparative export of selected item during july-Jan 2011-2012
Value in Million US$ Unit value $ per units
Quantity Value Unit value
Jwellery 1780 93.6 52584.3

101
LEATHER, MEAT &
POULTRY INDUSTRY

102
Leather industry, including leather products, is the second largest export earning sector after
textiles. Currently, this sector is contributing around $800 million a year but has the potential
to multiply volume of exports with the improvement of quality and diversification indifferent
range of products, specially garments and footwear. Basically, it is a job-oriented sector
providing employment to a very large segment of the society besides earning foreign
exchange for the country. The leather finishing and made ups industries represent an
important sector in Pakistan, contributing almost more than half a billion US dollars in
foreign exchange earnings to the national exchequer. The leather industry consists of six sub-
sectors namely, Tanning, Leather. Footwear, Leather Garments, Leather Gloves, Leather
Shoe Uppers, and Leather Goods.
PROBLEMS FACED BY THE INDUSTRY
1. Quality
Good quality leather is mostly exported and is not available for high value-added Leather
Garments & Leather Products. Leather garments in Pakistan are made mostly from low grade
& medium grade leather. Lack of proper training and inadequacy of skills in slaughtering are
among the most important factors leading raw hides and skins towards lower grades or even
to rejection. Furthermore, inadequate knowledge of preservation techniques and lack of
sufficiently designed collection and storage facilities may cause problems that are associated
with the lowering of the quality and quantity of raw material. Hence, the need for
strengthening training facilities for manpower at all levels through hiring of experts.
The quality of raw hides and skins generally depends upon the quality of livestock. The hides
and skins removed out of young and healthy cattle may be taken as the best in its quality
provided the conditions in which these are removed and also their collection, preservation
and storage is satisfactory. In fact, there are many factors which affect the quality of leather at
pre-slaughtering, during slaughtering and post-slaughtering stages. It is estimated that around
20-25 % of the hides and skins are affected by pre-slaughtering damages, like skin-cuts,
rashes, diseases, injuries etc.
2. Cost of production
Cost of production is also very high in Pakistan as compared to our competitors like China
and India. The high cost of various inputs especially utilities and taxes make our products
uncompetitive in international markets.

103
3. The issue of chrome
Chromium III salts are used extensively in the tanning process. Approximately 90% of the
leather manufactured is tanned using chromium III. This is because chromium is the most
efficient and versatile tanning agent available and it is relatively cheap. It has been used in
the leather industry for almost 100 years and when it was introduced as an alternative to
vegetable tanning extracts from oak bark and similar sources, it heralded a new era for the
leather industry. It reduced the time taken within the tanning process from months to days,
and offered leathers with properties that were previously unattainable. The leather industry
only uses chromium in its safest and most stable form - chromium III.
4. Energy Issues
Generally, a leather unit consumes over 0.97-1.87 MJ i.e. 270-300 KWh of energy to produce
100ft2 of finished leather. The absence of energy efficient technologies and lack of proper
maintenance of steam pipes, steam traps and insulation are causing wastage of significant
amount of energy in most leather processing units.
5. Environmental challenge
Leather tanneries in Pakistan produce all three categories of waste: wastewater, solid waste
and air emissions. However, wastewater is by far the most important environmental challenge
being faced by Pakistan's tanneries.
6. Wastewater
Although the exact quantity varies widely between tanneries, a normal requirement of around
50-60 liters of water per kilogram of hide is suggested. ETPI's sample audits of tanneries in
Pakistan show that in some cases the consumption of water is as high as three times the
suggested requirement. The overall water discharge also demonstrates a high degree of
seasonal and daily fluctuation. For most part, the current practice is to discharge this water
into the local environment without any treatment.
7. Solid Waste
Two types of solid wastes (tanned and untanned) are generated from leather production
processes. Solid waste include dusted curing salts, raw trimmings, wet trimmings, dry
trimmings, wet shavings, dry shavings, buffing, and packaging material. It is estimated that
for a tannery averaging 10,000 kilograms of skins per day, a total of some 5,500 kilograms of
solid waste would be produced per day.

104
8. Air Emissions
There are two sources of air pollution from tanneries in Pakistan. The first relates to
emissions from generators (diesel-based and operated only during power breakdowns) and
from boilers. Emissions were found to be well below the NEQS level. Ammonia emission
during processing and washing of drums, though intermittent but important has adverse
effects on workers health. Hydrogen sulphide emission during mixing of acid and alkaline
wastewater in drain is also a serious health hazardous. Segregated discharge of acidic and
alkaline effluent can help to avoid the hydrogen sulphide gas emission.
TRADE POLICY
The leather garment industry strongly recommended for imposition of 20 % export duty on
export of semi-finished and finished leather in the forthcoming trade policy. This would help
availability of good quality leather produced locally. 'Fox Furs' are much in demand abroad.
This should be removed from negative items list under import/export order. Export of
garments using allowable fox fur trimmings for decoration should also be permitted for
boosting export of value added leather garments. There is an immediate need for
establishment of a Leather Board in Pakistan which should operate as an independent body
and funded by the government from export development fund. The board should be headed
by a person exporting value-added leather products.
Export Data

105
Import Data
SWOT Analysis of the Leather Industry
STRENGTH
Easy availability of raw material
Management skills learned through experience
Easy availability of labor

106
Presence of institutional supports for technical, services, designing, manpower and
marketing
Export market in Europe and USA and far East Export friendly government policies
WEAKNESSES
Insufficient level of modernization and technology up gradation
Low labor productivity
Lack of confidence among SMEs for further growth
Lack of skilled labor
Environmental problems
Lack of market information(for SMEs)
OPPORTUNITIES
Room for capacities utilization
Scope for bulk supply of finished leather to big Units.
Product diversification & new markets
THREATS
Competition from regional players such as china, India, Turkey, Thailand, Indonesia etc.
New regulations of environmental and social compliance
INTRODUCTION TO PAKISTAN’S MEAT INDUSTRY
Al Shaheer Corporation is one of the leading meat exporters of Pakistan. The company
specializes in exporting free range grass fed beef and mutton to the Middle East, including
Dubai, Kuwait, Oman and Muscat.
APMEPA- All Pakistan Meat Exporters & Processor

107
Association
Pakistan has begun taking the tentative first steps towards becoming a major international
player in an industry in which the country has a strong competitive advantage: the global red
meat trade.
At a time when Pakistani businessmen have a hard time selling even high-quality products to
foreign customers due to Pakistan’s negative country brand, meat processing companies
report customers practically begging for Pakistani red meat to be exported to countries in the
Middle East and Southeast Asia.
Size of the opportunity
The halal food market, at just over $640 billion a year worldwide, is one of the largest
opportunities in the food and agribusiness sector. It is also one that plays to the unique
advantages of being based out of Pakistan.
Halal meat is also one of the fastest growing segments within the global food trade. Between
2001 and 2009, the global beef trade grew at an average of 10.4 % to reach just over $30
billion, according to data available from the UN Food and Agriculture Organisation (FAO).
However, the market for halal beef imports in the Middle East and Southeast Asia alone grew
by over 18.2 % to reach just under $2 billion a year during that same period.
Pakistan’s market share within this rapidly growing market is a paltry 2.9 %. However,
Pakistani exporters seem to be determined to make up for lost time. In the six years ending in
2009, Pakistani red meat exports have risen by an average of 68.6 % a year, though
admittedly from a very low base.
SWOT ANALYSIS OF MEAT OF PAKISTAN
STRENGTH
Pakistan has yet to capture even a small share of the global Halal market worth more than
2 trillion dollars despite its strength on 100% being a Muslim country.
In Middle East, Pakistan is considered as Makah for Halal food and without any doubt
food products imported from Pakistan are automatically considered as Halal.
Meat, grains and other agriculture produce are regularly exported to Middle Eastern
countries but this is not enough.
108
WEAKNESS
The labor is not skilled and they are not aware about the new technological machines of
slaughting, as compare with other countries which are exporting slaughtered meat.
The animal farming is not modernized to get efficient meat production per animal.
Pakistan is the 6th largest cattle breeder and world’s leading poultry breeder of the world
but our exports are still lacking far behind reason being not having good farming and
breeding pastures.
OPPORUNITY
The competitors of meat are not too much in Pakistan.
In European countries there is lot of demand of halal meat because halal meat is much
more hygienic and good for health, latest research also approved it, in Europe people
prefer more halal meat.
Pakistan should also focus on the other new meat markets other than Arabian markets like
Malaysia, Iran and Europe etc.
The urgent measures must be adopted for introduction and development of mea breed in
Pakistan so that meat production per animal can be enhanced.
THREATS
There is a risk factor of spoiling of meat, due to the late air freight and cancellation of
flight.
Sometimes the space is unavailable.
History & Development of Poultry Industry of Pakistan
Poultry culture in South Asian countries is expanding rapidly and the rate of growth of
commercial layer and broiler (meat producing) farms is phenomenal to meet the ever
increasing demand for proteins through poultry meat and eggs. In Pakistan, poultry industry
had made contribution to food production and it plays a vital role in the economy of the
country. Rising of poultry in Pakistan has virtually proven a profitable enterprise because it is
the best source of cheap and nutritious food .
Advantages

109
The poultry meat and egg production over many decades have shown positive growth in the
overall performances of the livestock sector and it has now reached a stage where its impact
is obvious on the national economy of the country. Poultry keeping business is one of the
most promising source of additional income. Besides, this poultry farming has a number of
advantages.
It produces much needed protein, food. It serves as a source of income and employment to
many and it has good returns.
Poultry keeping is becoming more and more capital intensive, and it is very profitable. The
income from poultry business begins to emerge within 8 to 9 weeks for broiler or 20 to 22
weeks for layers.
The income from layers (hens) begins to appear within 8 to 10 weeks, for broilers or 18 to 20
weeks for layers. According to the economic survey (94-95), 2.35 kg / capita per year eggs
were available in Pakistan during this period.
Disadvantages
Newcastale disease, Marek's disease, Infectious ronchitis, Gum-boro disease, fowl pox,
myco-plasmosis, coccidiosis, lymphoid, adino virus hydro-pericardium etc. are very
common diseases. This has a tremendous effect on the growth of the birds. The excess uses
of meat also has ill-effects on the health of their users, because the feed they eat contains lots
of unhygenic ingredients. Therefore the chickens should be vaccinated regularly and
properly.
SWOT Analysis of Poultry Industry
Strengths
Develop training program for poultry farmers
Government role and support
Require government incentive
Growth in small business
Weaknesses
Poor management
Lack of trained worker
110
Unhygienic condition
Diseases
Not availability of space
Processing plant
High cost
Adoption of new vaccines
Opportunities
Scope for frozen company
Scope for restaurant
Career opportunities
Advantage for small business person
Economic beneficial
Threats
Bird flu
Export of grains
Heavy duty charge on incubator
Present crisis

111
CHEMICALS AND
FERTILIZERS
INDUSTRY
112
Chemical industry development in Pakistan has been classified into (i) the primary sector
chemical industry and (ii) the secondary sector chemical industry. Primary sector industries
are large-scale, capital intensive industries comprising refineries, petrochemicals, natural
gas, metallurgical and mineral based projects. They also provide feedstocks for the
secondary chemical industry. Secondary industries are based on feedstocks either derived
from primary sector industries, or other alternative sources of raw materials. The secondary
sector industries form the basis for the proposed “Chemical Industry Development - Vision
2030”.
Primary sector industries which provide feedstocks for the development of secondary sector
chemical industries, as well as other alternative sources of feedstocks consist of:
(i) Petroleum and petrochemical refineries. These provide petrochemical intermediate
chemicals, which form the building blocks for the production of a very large number of
secondary chemicals, such as polymers, fibers, pharmaceuticals, drugs, dyes and colours,
insecticides, pesticides, resins, paints, pigments, specialty chemicals, and a very large
number of consumer and construction materials and products.
(ii) Natural gas based chemicals, which consist of methanol and ammonia. These can also be
used for the production of a large number of secondary chemicals.
(iii) Metallurgical metals and non-metals based secondary chemicals and products.
Present Growth
Every product or service used by mankind involves the use of chemicals in one form or
another. The food we eat, the plants we grow, the consumer/durable goods and services we
use to sustain the quality of life; indeed our very survival against disease is dependent on
chemicals. Modern agriculture is heavily dependent on chemical fertilizers, insecticides,
pesticides, micro-nutrients, soil treatment chemicals, etc., for improving productivity and
meeting the demands of fast growing population, Similarly, all industries, such as, iron and
steel, textile, leather, sugar, plastics, rubber, ceramics, glass, pharmaceutical, etc., are also
heavily dependent on chemicals and will continue to be so in the foreseeable future.
Strengths
Emerging Industry:
The Construction Chemical Industry is at a nascent stage. So there is a long way to go for the
industry. The life of the industry goes with the construction industry, which is the end user of
113
the Construction Chemical products. It is estimated that the life of the Indian Construction
Chemical Industry will last atleast for fifteen years. Huge Growth Potential: The Indian
Construction Chemical Industry has a huge potential to grow. Even at today’s nascent stage
the industry is growing at the rate of fifteen %, which is almost double than that of the current
GDP rate of India. Today the end users are not aware of the construction chemical usage and
its benefits.
Improves the Productivity: The construction chemicals improves the productivity of the
construction sector by increasing the life of the structures, decreasing the abrasions,
increasing bond strength and other qualities which the chemicals impart to the construction
works if used on correct time and in correct manner.
WEAKNESS
Improper Customer Services: The industry is not emphasizing on the marketing activities.
As a result there is lack of technical personnels in the marketing department of the
organisations. The repercussion results in improper customer services.
Costly Products: The use of the construction chemicals increases the cost to the developers
by two to five %. Also the standard products are costlier than that of the sub standard
products. Moreover construction chemicals are value-adding inputs for the construction
industry.
Low Awareness: Around eighty five % of the construction industry personnels are not aware
of the concept of construction chemicals. They are not aware of the productivity
improvement and value addition for the construction works if the chemicals are used on
proper time and in proper manner.
OPPORTUNITIES:
SAARC Countries: The SAARC countries lack the well organised construction chemical
industry. This is a great opportunity for the Indian Construction Chemical Industry to target
the SAARC countries for the penetration of their products in the country where there is lack
of branded and improved products.
Exports: The cost of manufacturing is low is India as compared to that of the western
nations. Also the organised player not compromise in the quality and hence there is a good
opportunity to target the other western nations where the construction activity is increasing.
Low Labour Cost: The labour cost in India is lower than that of in the western nations. If the
labours are endowed with better skills the cost of production can be decreased.
114
Foreign Direct Investments: The Government’s decision to introduce hundred % FDI in
construction industry has opened a great opportunity for the industry growth. The overseas
organisations will improve the quality of construction and hence will increase the use of
standard construction chemical applications in the construction industry to give better quality
of construction work products.
THREATS:
Stricter Environment Regulations: The Environment Regulations are getting stricter day by
day. The Government is passing laws to conserve the environment. These regulations if not
maintained by the industry can hamper the growth of the Construction Chemical Industry.
Lack of Technical Guidance: The result of the application of construction chemicals
depends mainly on the way or manner in which the chemical has been used. The application
of the chemicals requires an excellent technical guidance to get the best results out of such
costly products.
Government policies and its drawback
In-Country Policies –
The Government has no constraints on the usage of construction chemical
in the structures or in the Government projects except the projects funded by
world development organisations. This provides an unfavorable opportunity for
the developers to save the input cost to get a better quality structures.
Depreciating Foreign Currency:
During the last financial year 2009 – 2010 the value of dollar depreciated considerably. This
hampered the exports of the overall goods. The depreciating foreign currency decreases the
purchasing power of the importers, hence hampers the exports.

115
TRADE SCENARIO OF PAKISTAN
The Structure of Pakistan’s Trade
Source :- Ministry of Chemical , Plastic and Petrochemicals,Pakistan

116
ORGANIC CHEMICAL
Source :- Ministry of Chemical , Plastic and Petrochemicals,Pakistan
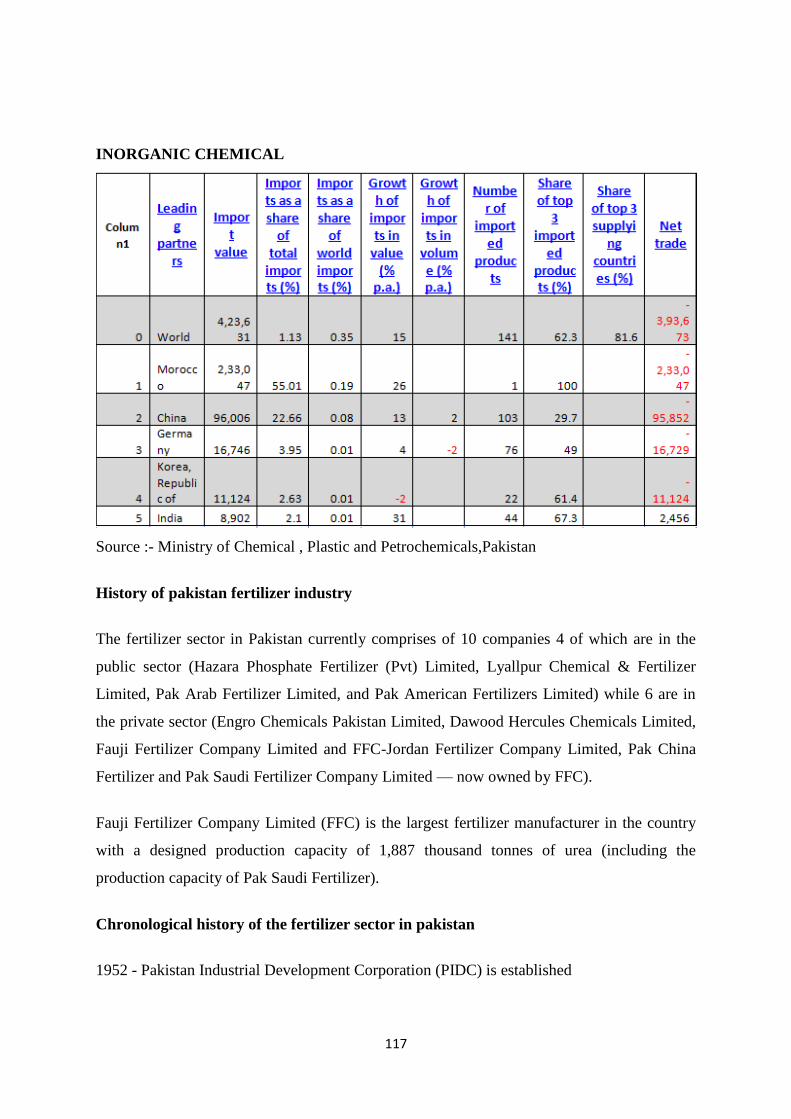
117
INORGANIC CHEMICAL
Source :- Ministry of Chemical , Plastic and Petrochemicals,Pakistan
History of pakistan fertilizer industry
The fertilizer sector in Pakistan currently comprises of 10 companies 4 of which are in the
public sector (Hazara Phosphate Fertilizer (Pvt) Limited, Lyallpur Chemical & Fertilizer
Limited, Pak Arab Fertilizer Limited, and Pak American Fertilizers Limited) while 6 are in
the private sector (Engro Chemicals Pakistan Limited, Dawood Hercules Chemicals Limited,
Fauji Fertilizer Company Limited and FFC-Jordan Fertilizer Company Limited, Pak China
Fertilizer and Pak Saudi Fertilizer Company Limited — now owned by FFC).
Fauji Fertilizer Company Limited (FFC) is the largest fertilizer manufacturer in the country
with a designed production capacity of 1,887 thousand tonnes of urea (including the
production capacity of Pak Saudi Fertilizer).
Chronological history of the fertilizer sector in pakistan
1952 - Pakistan Industrial Development Corporation (PIDC) is established
118
1957 - Lyallpur Chemicals and Fertilizers Limited (LCFL) is set up and designed to produce
Single SuperPhosphate (SSP)
1958 - Pak American Fertilizer Limited (PAFL) is commissioned and designed to produce
ammonium sulphate
1962 - National Gas Fertilizer Factory is set up producing Urea, Ammonium Nitrate, and
Nitric Acid
1965 - Esso Pakistan Fertilizer Company Limited (EPFC) is incorporated and designed to
produce urea 1968 Designed Capacity of PAFL is increased
1973 - National Fertilizer Development Corporation (NFDC) is established with an
authorized share capital of 1000m. It's mandate is to manage the existing fertilizer factories
and to establish additional factories.
1976 - Capacity of LCFL is doubled
1978 - NGFF is renamed Pak Arab Fertilizers after 48% stake is acquired by Government of
Abu Dhabi
1980 - Pak Saudi Fertilizer Company is established designed to produce urea
1982 - Pak China Fertilizers Limited (PCFL) goes into commercial production. It is designed
to produce urea - Fauji Fertilizer is established
1985 - Hazara Phosphate Fertilizer Limited is incorporated and is designed to produce
Granulated Single Super Phosphate Fertilizer.
1986 - Government deregulates prices of nitrogenous fertilizers
1989 - Fertilizer Policy is announced providing incentives for fresh investment in the sector
1991 - Esso (Exxon) announces its intentions to sell 75% of its holdings in EPFC. Engro
Chemicals Pakistan Limited is formed
1998 - FFC Jordan is established. It is the first company to locally manufacture Diammonium
phosphate (DAP) in the country

119
The deregulation of the fertilizer sector began in 1986 and slowly the government has
removed fertilizer price controls and subsidies, liberalized fertilizer imports and distribution
and privatized fertilizer plants.
SWOT
Strengths
new product line. Adding some new unit can enhance the production capacity of the plants.
about the balanced use of fertilizer, demand for the fertilizer will increase.
Weakness
the stated price.
gy and also lack in resources.
Opportunities
products, industry can attract more customers and can retain customers by satisfying their
needs.
ction by WTO since 2005, so there are more chances of export.
the demands.
Threats
he main raw material, load shedding of natural gas is big threat.
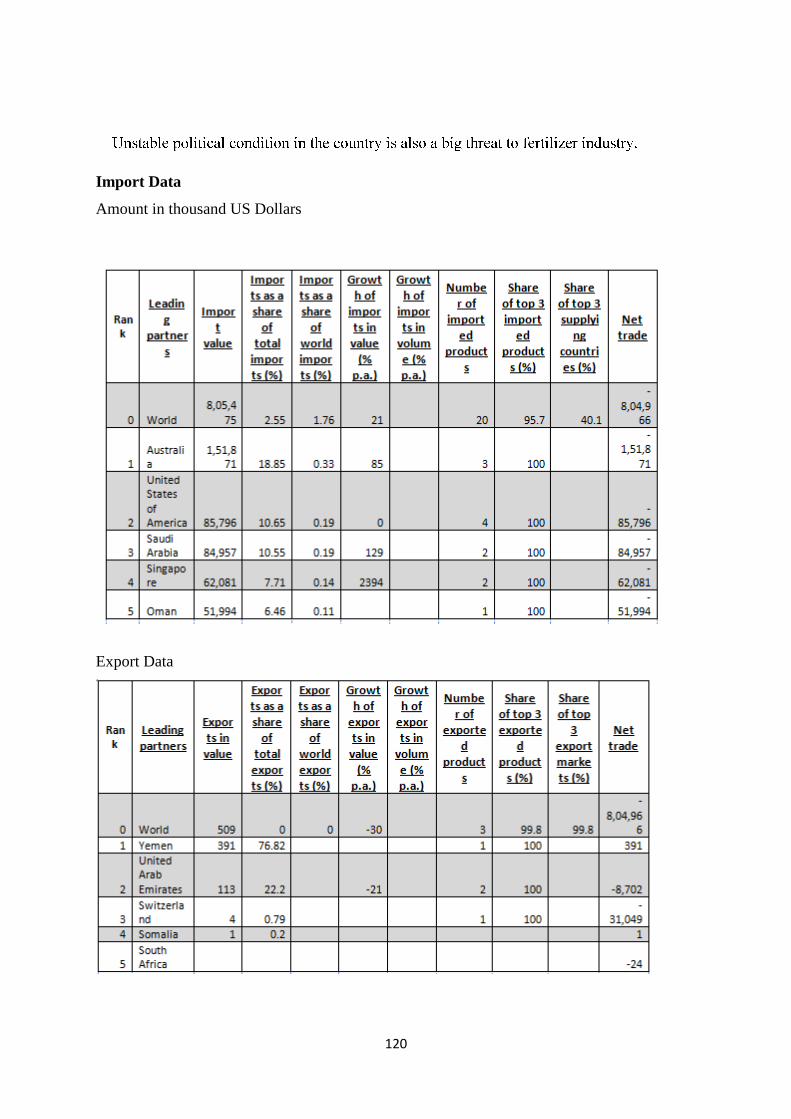
120
Import Data
Amount in thousand US Dollars
Export Data
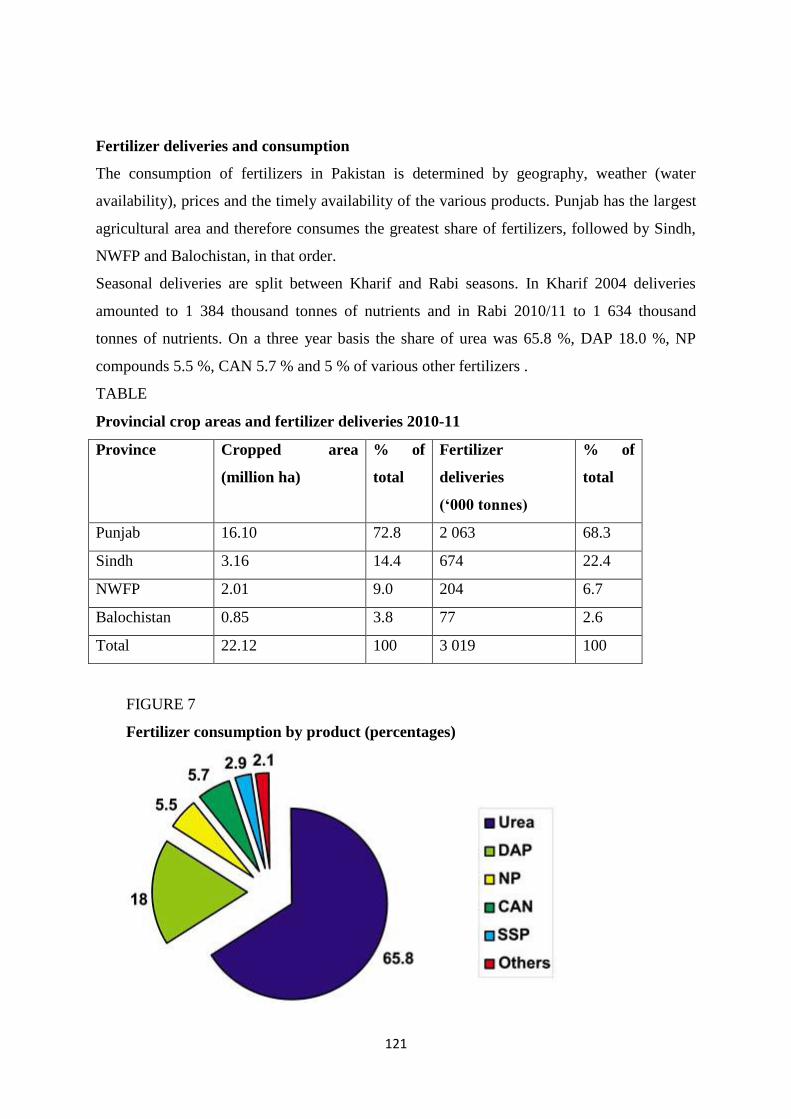
121
Fertilizer deliveries and consumption
The consumption of fertilizers in Pakistan is determined by geography, weather (water
availability), prices and the timely availability of the various products. Punjab has the largest
agricultural area and therefore consumes the greatest share of fertilizers, followed by Sindh,
NWFP and Balochistan, in that order.
Seasonal deliveries are split between Kharif and Rabi seasons. In Kharif 2004 deliveries
amounted to 1 384 thousand tonnes of nutrients and in Rabi 2010/11 to 1 634 thousand
tonnes of nutrients. On a three year basis the share of urea was 65.8 %, DAP 18.0 %, NP
compounds 5.5 %, CAN 5.7 % and 5 % of various other fertilizers .
TABLE
Provincial crop areas and fertilizer deliveries 2010-11
Province Cropped area
(million ha)
% of
total
Fertilizer
deliveries
(‘000 tonnes)
% of
total
Punjab 16.10 72.8 2 063 68.3
Sindh 3.16 14.4 674 22.4
NWFP 2.01 9.0 204 6.7
Balochistan 0.85 3.8 77 2.6
Total 22.12 100 3 019 100
FIGURE 7
Fertilizer consumption by product (percentages)

122
The forecasting of fertilizer demand is effected using econometric as well as agronomic
techniques. It is projected that over the next 10 years fertilizer nutrient consumption will
grow at the rate of 2 to 3 % per annum.
FIGURE-8
Monthly pattern of fertilizer nutrient deliveries (three year average 2010/12);
total 2.97 million tonnes
Source:-Ministry of Commerce and Industry, Pakistan

123
TEXTILE AND
APPAREL INDUSTRY

124
The textile sector enjoys a pivotal position in the exports of Pakistan. In Asia, Pakistan is the
8th
largest exporter of textile products. The contribution of this industry to the total GDP is
8.5%. It provides employment to about 15 million people, 30% of the country work force of
about 49 million. The annual volume of total world textile trade is US$18 trillion which is
growing at 2.5 %. Out of it, Pakistan’s share is less than one %. The development of the
Manufacturing Sector has been given the highest priority since Pakistan’s founding with
major stress on Agro-Based Industries. For Pakistan which was one of the leading producers
of cotton in the world, the development of a Textile Industry making full use of its abundant
resources of cotton has been a priority area towards industrialization.
At present, there are 1,221 ginning units, 442 spinning units, 124 large spinning units and 425
small units which produce textile products. The textile industry of Pakistan has a total
established spinning capacity of 1550 million kgs of yarn, weaving capacity of 4368 million
square metres of fabric and finishing capacity of 4000 million square metres. The industry
has a production capacity of 670 million units of garments, 400 million units of knitwear and
53 million kgs of towels.
The industry consists of large-scale organized sector and a highly fragmented cottage / small-
scale sector. The various sectors that are a part of the textile value chain are: Spinning, most
of the spinning industry operates in an organized manner with in-house, weaving, dying and
finishing facilities. Weaving comprises of small and medium sized entities. The processing
sector, comprising dyeing, printing and finishing sub-sectors, only a part of this sector is
operating in an organized state, able to process large quantities while the rest of the units
operate as small and medium sized units.
Pakistan is the world’s 4th largest producer and 3rd largest consumer of cotton. The Textile
and Clothing Industry has been the main driver of the economy for the last 50 years in terms
of foreign currency earnings and jobs creation.

125
Table no. 1 Export of Textile and Clothing (Us $ millions)
1990 2000 2004 2005 2006 2007 2008
WORLD
TEXTILE
104354 157295 195541 202657 220367 240364 250198
WORLD
CLOTHING
108129 197722 260569 276802 309142 345830 361888
TOTAL 212483 355017 456110 479479 529509 586194 613086
PAKISTAN
TEXTILE
2663 4532 6125 7087 7469 7371 7186
PAKISTAN
CLOTHING
1014 2144 3023 3604 3907 3806 3906
TOTAL 3677 6676 9151 10691 11376 11177 11092
PERCENTAGE
OF WORLD
TRADE
1.77% 1.88% 2.01% 2.23% 2.15% 1.91% 1.81%
Ministry of Trade
The polyester filament yarn manufacturing activity has slowed down and currently a large
scale imports from China has compelled local industry to close down and only 6 units with
operational capacity of 55851 M. Tons supply polyester filament yarn. The local production
filament fabrics is not picking up as their exports sales are not feasible and local market is
heavily flooded with smuggled goods. The Production of Polyester Filament Yarn is approx.
60,337 Tons per annum and imports during the period July – March 2010 is 116,964 M. Tons
as against 89,362 M. Tons during July – March 2009.
Art Silk and Synthetic Weaving Industry
Art Silk and Synthetic Weaving Industry has developed over the time on cottage based Power
Looms Units comprising of 08 to 10 looms spread all over the country. There are
approximately 90,000 looms in operation of which 30,000 looms are working on blended
yarn and 60,000 looms on filament – yarn. Besides, there are some mobile looms which
become operational on market demand. The major concentration is in Karachi- Faisalabad,
Gujranwala, and Jalalpur Jattan as well as in the un-settled area (Bare –Swat – Khyber
Agency and Wazirstan).
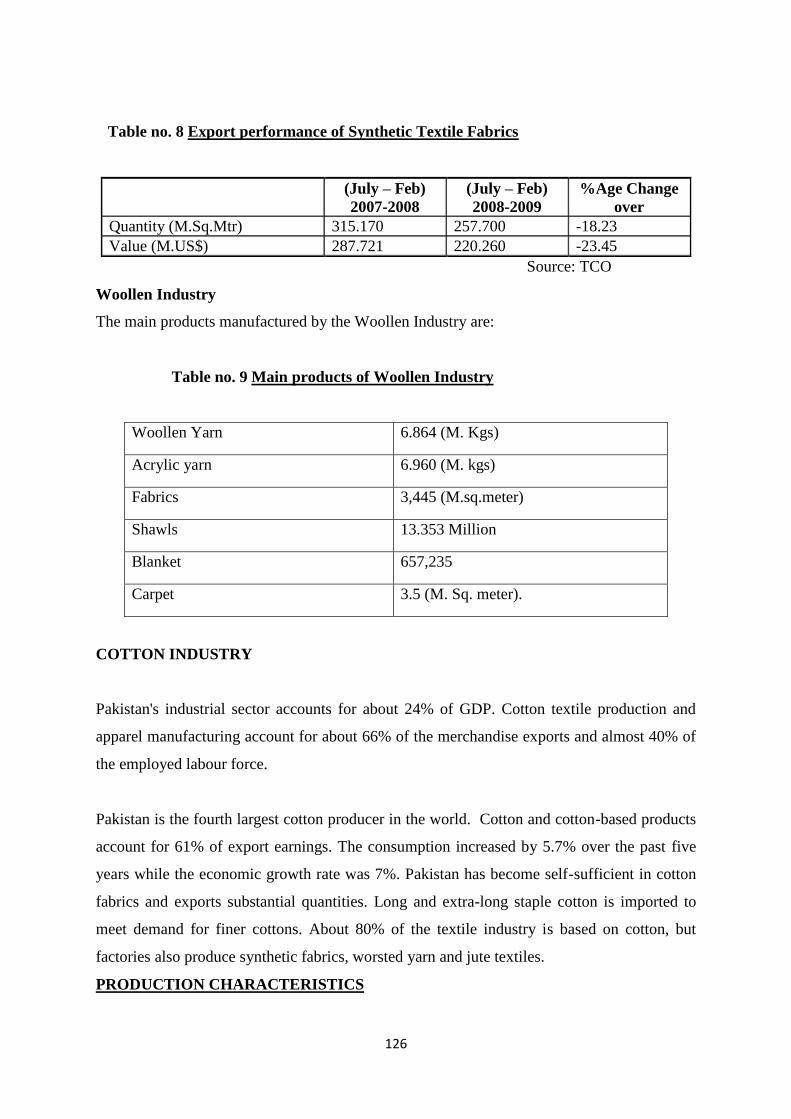
126
Table no. 8 Export performance of Synthetic Textile Fabrics
(July – Feb)
2007-2008
(July – Feb)
2008-2009
%Age Change
over
Quantity (M.Sq.Mtr) 315.170 257.700 -18.23
Value (M.US$) 287.721 220.260 -23.45
Source: TCO
Woollen Industry
The main products manufactured by the Woollen Industry are:
Table no. 9 Main products of Woollen Industry
Woollen Yarn 6.864 (M. Kgs)
Acrylic yarn 6.960 (M. kgs)
Fabrics 3,445 (M.sq.meter)
Shawls 13.353 Million
Blanket 657,235
Carpet 3.5 (M. Sq. meter).
COTTON INDUSTRY
Pakistan's industrial sector accounts for about 24% of GDP. Cotton textile production and
apparel manufacturing account for about 66% of the merchandise exports and almost 40% of
the employed labour force.
Pakistan is the fourth largest cotton producer in the world. Cotton and cotton-based products
account for 61% of export earnings. The consumption increased by 5.7% over the past five
years while the economic growth rate was 7%. Pakistan has become self-sufficient in cotton
fabrics and exports substantial quantities. Long and extra-long staple cotton is imported to
meet demand for finer cottons. About 80% of the textile industry is based on cotton, but
factories also produce synthetic fabrics, worsted yarn and jute textiles.
PRODUCTION CHARACTERISTICS
127
The major cotton producing areas in Pakistan are Punjab and Sindh. Approximately 80% of
cotton is produced in Punjab and the rest in Sindh. According to recent figures, there are
approximately 1.3 million cotton farmers. 3 million hectares are currently allocated for cotton
farming with an average farm size of 4 hectares. However, planting area and production
strategy are influenced by a number of factors such as weather and government policy. As of
2005 there were approximately 1.5 million cotton farms. The planting season takes place
from February to June and the harvest from August to December. Cotton yields have been
increasing due to improved practices, greater experience with biotech varieties, and
availability of higher quality inputs. Lack of irrigation is increasingly becoming a major
cause for concern and noticeably affected 2007/08 cotton production.
The main varieties planted in Pakistan are CIM 496 in Punjab and NIAB-78, and CRIS-134
in Sindh. The staple is short and medium (although it mostly medium). A major impediment
to the cotton production process in Pakistan is the prevalence of mealy bugs and more
importantly, the cotton leaf curl virus (CLCV). Biotech has just been recently introduced to
Pakistan. According to recent reports the Pakistani government just approved field trials
biotech cotton and. although it will not officially be commercially and officially approved for
at least another season, it is expected to surpass 70% of the planted area in 2009/10.
STRUCTURE OF INDUSTRY
In Pakistan, there are a number of government agencies and private initiatives that regulate
and support the cotton sector. The Ministry of Food, Agriculture and Livestock, the
agriculture departments in provinces where the cotton is grown and the Pakistan Cotton
Central Committee are directly involved in the different aspects of the cotton production
sector. Similarly, there are organizations and research institutes related to improving
production cotton production and quality such as the Central Cotton Research Institute and
Center of Excellence for Molecular Biology. Finally there are the institutions responsible for
the oversight of the textile industry such as the Ministry of Textile and the Textile
Commissioner’s Office.
ISSUES
The cotton industry suffers from a variety problems. Although Pakistan is the 4th largest
producer of raw cotton it is still far behind in productivity per unit of area when compared
with the yields being realized in some other major cotton growing countries. Yields are not
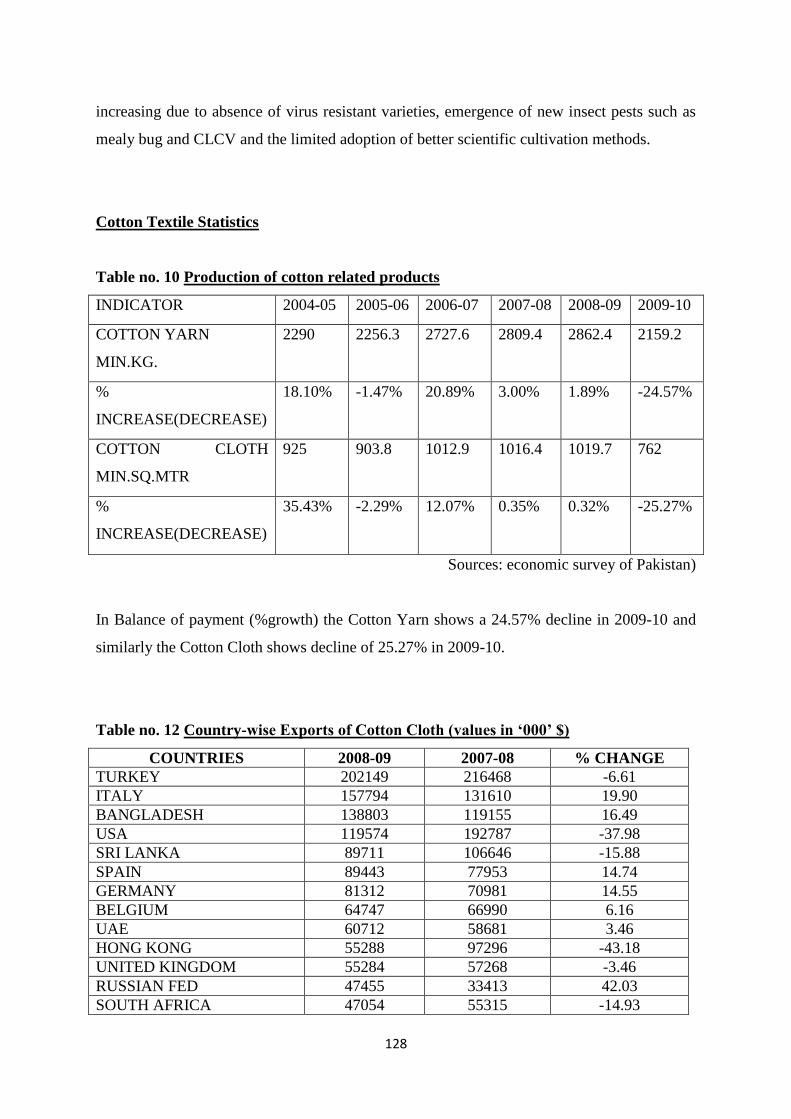
128
increasing due to absence of virus resistant varieties, emergence of new insect pests such as
mealy bug and CLCV and the limited adoption of better scientific cultivation methods.
Cotton Textile Statistics
Table no. 10 Production of cotton related products
INDICATOR 2004-05 2005-06 2006-07 2007-08 2008-09 2009-10
COTTON YARN
MIN.KG.
2290 2256.3 2727.6 2809.4 2862.4 2159.2
%
INCREASE(DECREASE)
18.10% -1.47% 20.89% 3.00% 1.89% -24.57%
COTTON CLOTH
MIN.SQ.MTR
925 903.8 1012.9 1016.4 1019.7 762
%
INCREASE(DECREASE)
35.43% -2.29% 12.07% 0.35% 0.32% -25.27%
Sources: economic survey of Pakistan)
In Balance of payment (%growth) the Cotton Yarn shows a 24.57% decline in 2009-10 and
similarly the Cotton Cloth shows decline of 25.27% in 2009-10.
Table no. 12 Country-wise Exports of Cotton Cloth (values in ‘000’ $)
COUNTRIES 2008-09 2007-08 % CHANGE
TURKEY 202149 216468 -6.61
ITALY 157794 131610 19.90
BANGLADESH 138803 119155 16.49
USA 119574 192787 -37.98
SRI LANKA 89711 106646 -15.88
SPAIN 89443 77953 14.74
GERMANY 81312 70981 14.55
BELGIUM 64747 66990 6.16
UAE 60712 58681 3.46
HONG KONG 55288 97296 -43.18
UNITED KINGDOM 55284 57268 -3.46
RUSSIAN FED 47455 33413 42.03
SOUTH AFRICA 47054 55315 -14.93

129
CHINA 45598 49972 -8.75
NETHERLANDS 44324 30046 47.52
PORTUGAL 42338 42356 -0.04
INDIA 40429 50164 -19.41
EGYPT UAR 36760 25387 44.80
GREECE 31300 32844 -4.70
MEXICO 27675 19527 41.73
SAUDI ARABIA 24239 25928 -6.51
ARGENTINA 23238 20686 12.34
LITHUANIA 22811 16052 42.11
BRAZIL 22248 9140 143.41
CHILE 20807 19665 5.81
POLAND 17114 19135 -10.56
KENYA 14258 14945 -4.60
AUSTRALIA 11807 14028 -15.83
FINLAND 11493 12235 -6.06
OTHERS COUNTRIES 364846 345873 5.49
TOTAL 2010611 2026547 -0.79
Source: Trade development Authority of Pakistan (TDAP)
Table no. 13 Major Commodities Export from Pakistan
(VALUES IN ‘000 $)
SR. COMMODITIES JULY-JUNE CHANGES IN
VALUE
JULY-JUNE
(% of share)
2009-10 2008-09 In values In % 2009-10 2008-09
1. COTTON
FABRICS
18,00,055
19,55,289
-1,55,234
-7.94
9.33
11.05
2. KNITWEAR
(HOSIERY )
17,64,959
17,40,753
24,206
1.39
9.15
9.84
3.
BED WARE
17,44,250 17,35,015
9,235
0.53
9.04
9.81
4. COTTON YARN
14,33,094
11,14,821
3,18,273
28.55
7.43
6.30
5. READY MADE 12,30,019
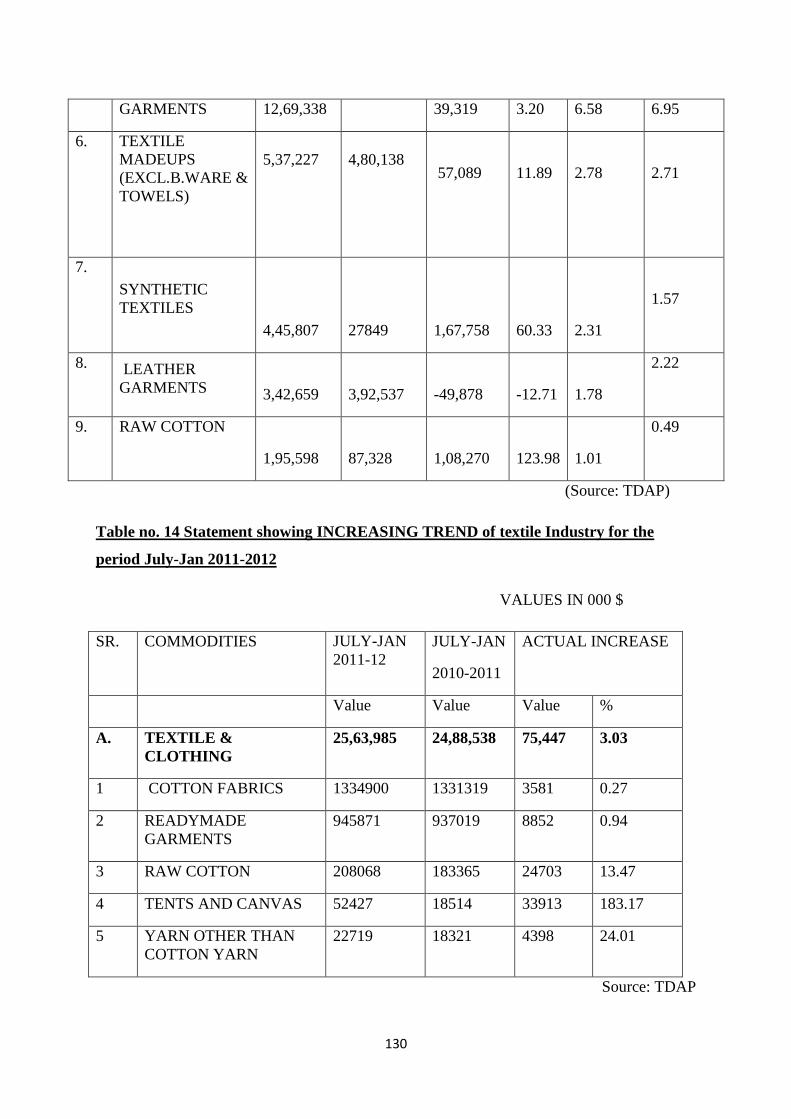
130
GARMENTS 12,69,338 39,319 3.20 6.58 6.95
6. TEXTILE
MADEUPS
(EXCL.B.WARE &
TOWELS)
5,37,227
4,80,138
57,089
11.89
2.78
2.71
7.
SYNTHETIC
TEXTILES
4,45,807 27849
1,67,758
60.33
2.31
1.57
8. LEATHER
GARMENTS
3,42,659
3,92,537
-49,878
-12.71
1.78
2.22
9. RAW COTTON
1,95,598
87,328
1,08,270
123.98
1.01
0.49
(Source: TDAP)
Table no. 14 Statement showing INCREASING TREND of textile Industry for the
period July-Jan 2011-2012
VALUES IN 000 $
SR. COMMODITIES JULY-JAN
2011-12
JULY-JAN
2010-2011
ACTUAL INCREASE
Value Value Value %
A. TEXTILE &
CLOTHING
25,63,985 24,88,538 75,447 3.03
1 COTTON FABRICS 1334900 1331319 3581 0.27
2 READYMADE
GARMENTS
945871 937019 8852 0.94
3 RAW COTTON 208068 183365 24703 13.47
4 TENTS AND CANVAS 52427 18514 33913 183.17
5 YARN OTHER THAN
COTTON YARN
22719 18321 4398 24.01
Source: TDAP

131
CEREALS AND
PULSES

132
TOTAL IMPORT-EXPORT OF PAKISTAN
(Table 1.1)
EXPORTS & IMPORTS OF PAKISTAN
VALUE IN MILLIONS U.S.$
Years Exports %
increase
Imports %
increase
2001-2002 9,135 -1% 10,340 -4%
2002-2003 11,160 22% 12,220 18%
2003-2004 12,313 10% 15,592 28%
2004-2005 14,391 17% 20,598 32%
2005-2006 16,451 14% 28,581 39%
2006-2007 16,976 3% 30,540 7%
2007-2008 19,052 12% 39,966 31%
2008-2009 17,688 -7% 34,822 -13%
2009-2010 19,290 9% 34,710 0%
2010-2011 24,810 29% 40,414 16%
From the above table its indicates that export is increased three times in ten years and import
is increased nearly four times in last ten years , in addition Pakistan not reported any surplus
in last ten years as we know it is an underdeveloped country.
Domestic Agricultural Policy Overview
Agricultural policy is aimed at maintaining a growth rate higher than population growth.
The average agricultural growth rate for the past forty years was 4.3 %. As arable land is
limited to about 25% of total land area, increased productivity is critical. The GOP plans to
increase yields through biotechnology, better water and crop management practices and
focused research and extension. Availability of agricultural credit and inputs has improved.
Crop production is heavily dependent upon irrigated water systems fed by snowmelt and
monsoon rains. Improvements to Pakistan’s irrigation system—one of the world’s largest—
are critical to the future success of this sector.

133
Pulses of Pakistan:
Pulses have been a staple in the Pakistani diet for decades. They are often referred to as the
“common man’s meat” and an important source of protein for the poor. Domestic pulse
consumption is increasing and currently exceeds a million tons a year. Pulses are grown both
in the Kharif (spring planted) and Rabi (fall planted) seasons under non-irrigated conditions
and depend largely on monsoon and winter rains for growth. No significant breakthrough in
domestic production is anticipated in the near term due to the importance of competing crops
such as wheat, rice, and cotton. With no major breakthrough in domestic production evident,
imports are increasing, reaching an estimated valued at $402.5 million in 2010/11.
Total Pulse Import
PAKISTAN’S TOTAL PULSE IMPORTS ($ MILLIONS)
Year 2006-07 2007-08 2008-09 2009-10 2010-11
Total
Imports
245 202 236 262 402.5
Import of Pulses 2009-10
PAKISTAN’S IMPORT OF PULSES 2009-10
Name of Pulse Qty (000 Tons)
Chickpeas(Garbanzos/Kabuli) 150
Dry/YellowPeas 106
Lentils 68
DesiChickpeas 51
KidneyBeans 47
Others 23
Total 445
Imports account for about 37% of Pakistan’s total consumption of pulses. In 2010-11,
imports of pulses totaled valued at $402.5 million compared to 2009-10, valued at $236
million. U.S. pulse exports to Pakistan are typically shipped in containers. Imports from the
United States making Pakistan an increasingly important market for U.S. pulses. Canada
(which typically ships pulses in bulk) was the major supplier of pulses (mostly yellow peas,
green peas, and chickpeas) to Pakistan.

134
India and Myanmar are traditional suppliers of pulses to Pakistan due to their geographic
proximity and ability to grow similar types of pulses, (black gram, red gram, green gram and
Kidney beans).
Production and consumption of Pulses
PAKISTAN’S PRODUCTION AND CONSUMPTION OF PULSES IN 2009-10
Name of pulse Production Consumption
Qty (000
Tons)
% of
total
Qty (000
Tons)
% of
total
Desi chickpeas 562 73% 613 51%
Mung beans 119 16% 119 10%
Dry/yellow peas 54 7% 160 13%
Lentils 11 1% 79 7%
Blake matpe 11 1% 0 0%
Chickpeas(garbanzos/Kabuli) 0 0% 150 12%
Kidney beans 0 0% 47 4%
Others 8 1% 42 3%
Total 765 100% 1210 100%
Total Pulses Import
PAKISTAN’S TOTAL PULSES IMPORT BY ORIGIN
Country
2006-07
2007-08
2008-09
2009-10
TONS 000
USD
TONS 000
USD
TONS 000
USD
TONS 000
USD
Australia 75,124 39,183 6,567 4,540 73,654 39,120 41,204 28,742
Canada 175,291 63,604 51,682 32,893 97,036 64,685 91,564 57,443
India 19,049 14,153 55,307 39,101 31,872 24,156 50,620 38,583
Myanmar 64,160 40,912 66,852 42,006 59,678 34,565 43,775 32,951
United States 19,549 8,115 29,662 13,994 23,769 16,443 57,259 26,890
UnitedKingdom 26 11 2 1 48 47 - -
Pakistan imported 628.508 tons of pulses during the fiscal year 2010-11 as compared to the
import of the commodity of 444.976 tons during the fiscal year 2009-10, showing a rise of
183.532 tons or 41.25 %, the official statistics say.

135
Cereals production, consumption and Import Export Data:
Export of Rice
PAKISTAN’S EXPORT OF RICE
Year Value (Million Rs)
2006-2007 68,285.90
2007-2008 117,088.10
2008-2009 154,762.90
2009-2010 183,370.30
2010-2011 184,674.60
Production and consumption of Jawar
PAKISTAN’S PRODUCTION AND CONSUMPTION OF JAWAR (1000 MT)
Year production Percentage Consumption Percentage
2007 151 -2.58% 153 -3.16%
2008 145 -3.97% 149 -2.61%
2009 145 0.00% 180 20.81%
2010 145 0.00% 145 -19.44%
2011 145 0.00% 145 0.00%
(Source: United States Department of Agriculture)
Import of Jawar
PAKISTAN’S IMPORT OF JAWAR (1000 MT)
Year Import Percentage
2007 2 -33.33%
2008 4 100.00%
2009 35 775.00%
2010 0 -100.00%
2011 0 NA
(Source: United States Department of Agriculture)
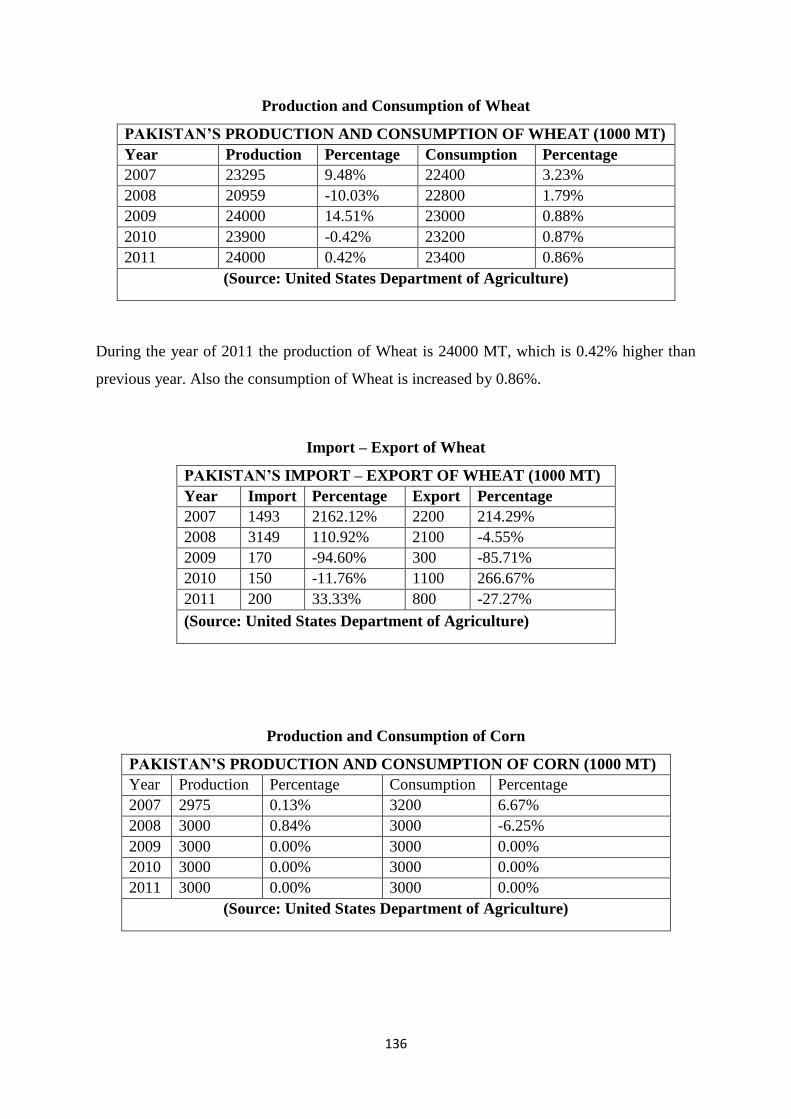
136
Production and Consumption of Wheat
PAKISTAN’S PRODUCTION AND CONSUMPTION OF WHEAT (1000 MT)
Year Production Percentage Consumption Percentage
2007 23295 9.48% 22400 3.23%
2008 20959 -10.03% 22800 1.79%
2009 24000 14.51% 23000 0.88%
2010 23900 -0.42% 23200 0.87%
2011 24000 0.42% 23400 0.86%
(Source: United States Department of Agriculture)
During the year of 2011 the production of Wheat is 24000 MT, which is 0.42% higher than
previous year. Also the consumption of Wheat is increased by 0.86%.
Import – Export of Wheat
PAKISTAN’S IMPORT – EXPORT OF WHEAT (1000 MT)
Year Import Percentage Export Percentage
2007 1493 2162.12% 2200 214.29%
2008 3149 110.92% 2100 -4.55%
2009 170 -94.60% 300 -85.71%
2010 150 -11.76% 1100 266.67%
2011 200 33.33% 800 -27.27%
(Source: United States Department of Agriculture)
Production and Consumption of Corn
PAKISTAN’S PRODUCTION AND CONSUMPTION OF CORN (1000 MT)
Year Production Percentage Consumption Percentage
2007 2975 0.13% 3200 6.67%
2008 3000 0.84% 3000 -6.25%
2009 3000 0.00% 3000 0.00%
2010 3000 0.00% 3000 0.00%
2011 3000 0.00% 3000 0.00%
(Source: United States Department of Agriculture)
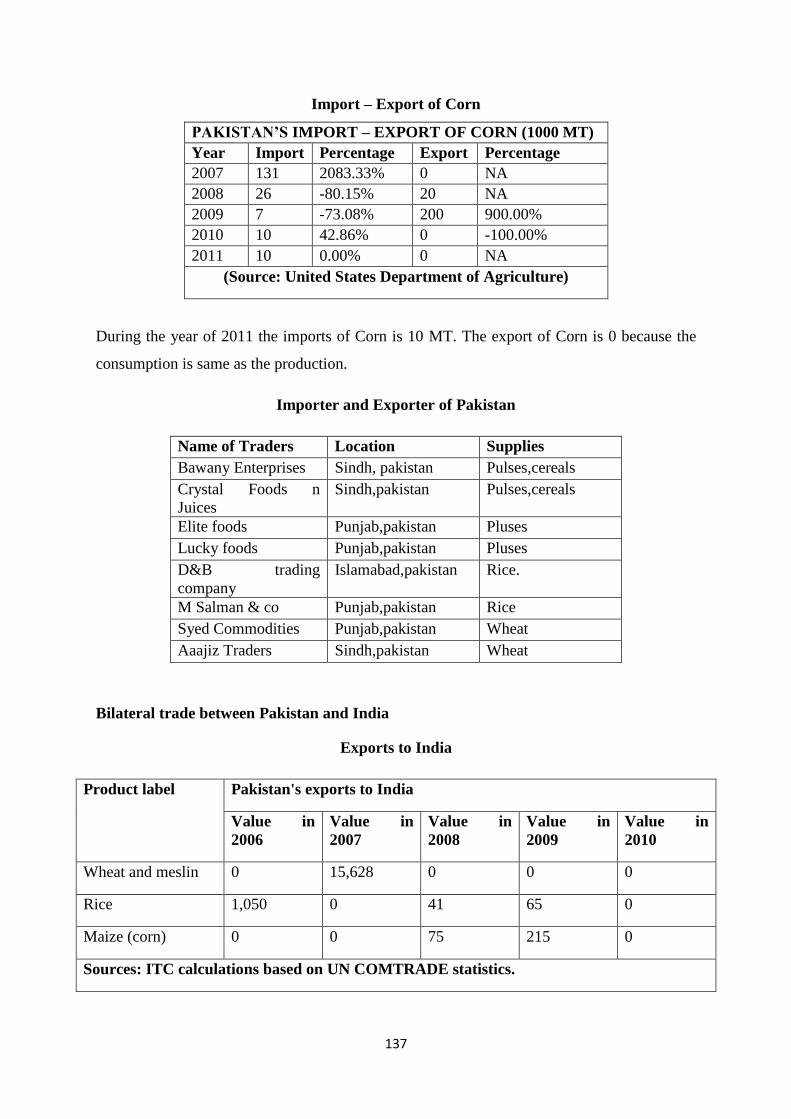
137
Import – Export of Corn
PAKISTAN’S IMPORT – EXPORT OF CORN (1000 MT)
Year Import Percentage Export Percentage
2007 131 2083.33% 0 NA
2008 26 -80.15% 20 NA
2009 7 -73.08% 200 900.00%
2010 10 42.86% 0 -100.00%
2011 10 0.00% 0 NA
(Source: United States Department of Agriculture)
During the year of 2011 the imports of Corn is 10 MT. The export of Corn is 0 because the
consumption is same as the production.
Importer and Exporter of Pakistan
Name of Traders Location Supplies
Bawany Enterprises Sindh, pakistan Pulses,cereals
Crystal Foods n
Juices
Sindh,pakistan Pulses,cereals
Elite foods Punjab,pakistan Pluses
Lucky foods Punjab,pakistan Pluses
D&B trading
company
Islamabad,pakistan Rice.
M Salman & co Punjab,pakistan Rice
Syed Commodities Punjab,pakistan Wheat
Aaajiz Traders Sindh,pakistan Wheat
Bilateral trade between Pakistan and India
Exports to India
Product label Pakistan's exports to India
Value in
2006
Value in
2007
Value in
2008
Value in
2009
Value in
2010
Wheat and meslin 0 15,628 0 0 0
Rice 1,050 0 41 65 0
Maize (corn) 0 0 75 215 0
Sources: ITC calculations based on UN COMTRADE statistics.

138
Imports from India
Product label Pakistan's imports from India
Value in
2006
Value in
2007
Value in
2008
Value in
2009
Value in
2010
Grain sorghum 0 20 55 690 6,482
Buckwheat, millet
and canary seed
0 339 899 1,381 1,872
Maize (corn) 603 81 36,346 6,312 1,612
Rice 0 0 0 0 626
Sources: ITC calculations based on UN COMTRADE statistics.
SWOT Analysis:
Strengths
• Availability of cheap labour.
• Fertile land.
• Suitable environment for banana cultivation.
• Interest of farmers and landowners in this sector.
• Govt.’s supporting institutions.
• Availability of markets, local as well as international.
Weaknesses
• Lack of awareness.
• Lack of information about new technologies.
• Water shortage (they can overcome this problem by using new techniques).
• Character of middlemen or contractors.
• Improper transportation facilities.
• Direct marketing problems.
• Bad infrastructure.
• Absence of cold storages.
Opportunities
139
• Increasing demand locally and in international markets.
• Introduction of new technologies.
• New research and development in this sector.
• Introduction of new machineries.
• New Research and techniques to control diseases.
• Drip irrigation and other new techniques to overcome water shortage.
140
FRUITS AND
VEGETABLES

141
Composition of GDP for agriculture
Contribution of agriculture in economy
During the year 2009‐ 10, the overall performance of agriculture sector has been weaker
than target. Against a target of 3.8 %, and previous year’s performance of 4.0 %, agriculture
is estimated to have grown by 2.0 %. Major crops, accounting for 32.8 % of agricultural
value added, registered a negative growth of 0.2 % as against robust growth of 7.3 % last
year. Minor crops contributing 11.1 % to overall agriculture posted negative growth of 1.2 %.
The agricultural sector plays an important Role in Pakistan's economy by;
contributing 23 % towards GDP;
providing food to about 130 million people;
earning about 60 % of the country's total export earnings;
providing employment to 47 % of the total work force;
providing the main source of livelihood for the rural population of Pakistan;
Providing raw materials for many industries and a market for many locally produced
industrial products.
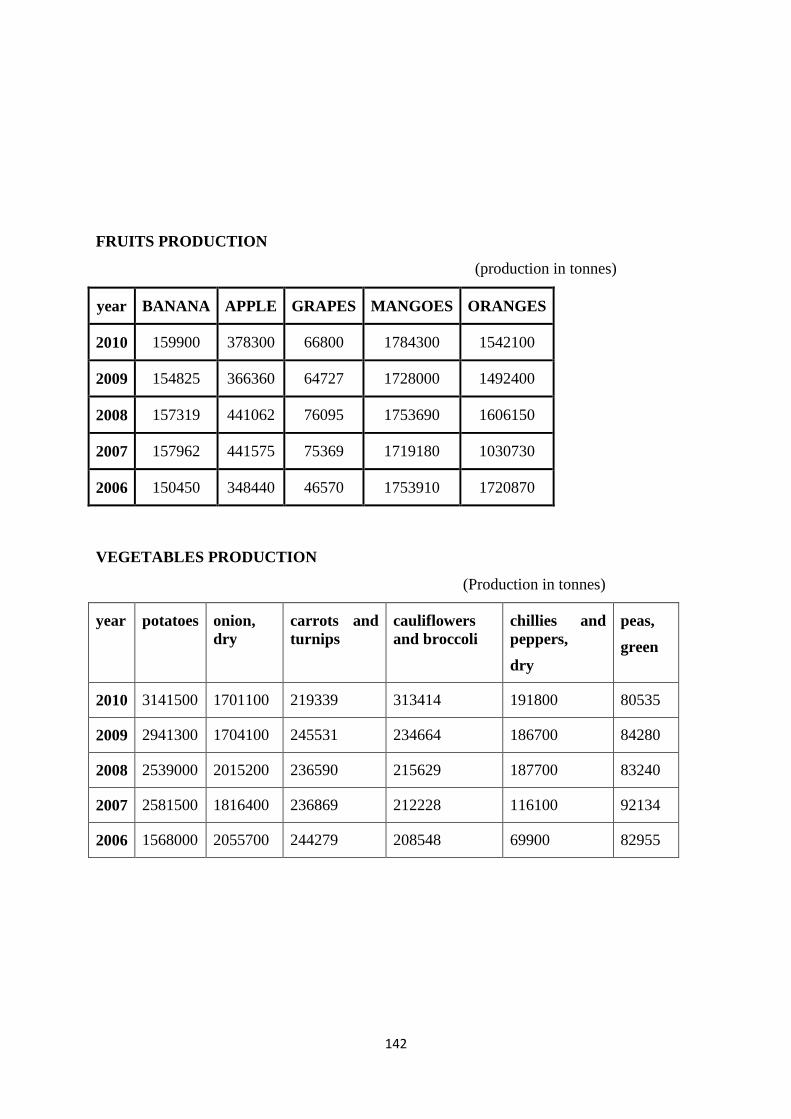
142
FRUITS PRODUCTION
(production in tonnes)
year BANANA APPLE GRAPES MANGOES ORANGES
2010 159900 378300 66800 1784300 1542100
2009 154825 366360 64727 1728000 1492400
2008 157319 441062 76095 1753690 1606150
2007 157962 441575 75369 1719180 1030730
2006 150450 348440 46570 1753910 1720870
VEGETABLES PRODUCTION
(Production in tonnes)
year potatoes onion,
dry
carrots and
turnips
cauliflowers
and broccoli
chillies and
peppers,
dry
peas,
green
2010 3141500 1701100 219339 313414 191800 80535
2009 2941300 1704100 245531 234664 186700 84280
2008 2539000 2015200 236590 215629 187700 83240
2007 2581500 1816400 236869 212228 116100 92134
2006 1568000 2055700 244279 208548 69900 82955

143
Comparative Position of fruits and vegetables sector of Pakistan
List of trading partners
The following is a list of Pakistan's main trading partners as of 2011.
Country Percentage of
imports
Percentage of
exports
Percentage of total
trade
European Union 12.1 22.6 15.8
China 19.1 7.9 15.4
United Arab
Emirates 10.4 7.9 9.6
United States 5.2 17.1 9.2
Saudi Arabia 10.5 2.3 7.8
Kuwait 5.4 0.4 3.8
Malaysia 4.1 0.8 3.0
Japan 3.6 1.6 3.0
India 3.3 1.3 2.6
Afghanistan 0.3 7.0 2.5
Iran 2.9 1.4 2.4
Singapore 3.2 0.4 2.3
144
Some of the problems impacting mango trade are summarized below:
General:
Cost of inputs: water, fertilizer, pesticide, and electricity tariff
Emerging disease problems e.g. declining productivity syndrome
(Lack of) value addition: no systematic effort
(Little) varietal development: inadequate research capacity
Poor quality management practices
(Poor) storage & processing: limited capacity e.g. cool chain, low processing levels
Intermediaries: from growers to retailers /exporters.
(Inefficient) marketing: no strategic planning.
(Unreliable) shipment: faces problem.
INDIAN TRADERS STOP VEGETABLE SUPPLY TO PAKISTAN
Agencies
7th January, 2011
AMRITSAR: In a retaliatory move against export of onions to India through land
route, the Amritsar-based vegetable exporters Friday refused to send trucks carrying
tomatoes and other vegetables to Pakistan via Attari-Wagah land route.
“Today, we will not export vegetables to Pakistan because Pakistan government has put a ban
on onion export to India,” vegetable trader Anil Mehra said according to Indian media.
This decision was taken today collectively by about 40 vegetables exporters based at
Amritsar. “We took this decision because when we needed vegetables (onion), Pakistan has
simply banned the export of essential item,” he said adding that the traders were not bothered
about the losses which they would face because of not sending vegetables to neighboring
country.
Almost 70 trucks carrying vegetables including tomatoes, ginger, chilies have been withheld
by vegetable exporters and were not sent for customs clearance.

145
BILATERAL TRADE BETWEEN PAKISTAN AND INDIA
Product : 20 Vegetable, fruit, nut, etc food preparations
Sources : ITC calculations based on UN COMTRADE statistics
Unit : US Dollar thousand
Product
code Product label
Pakistan's exports to India Pakistan's exports to
world
Value
in
2007
Value
in
2008
Value
in
2009
Value
in
2010
Value
in
2007
Value
in
2008
Value
in
2009
Value
in
2010
'2009
Fruit &
vegetable juices,
unfermented
880 879 2,007 1,587 16,45
0
18,60
8
16,69
8
22,24
5
'2001
Cucumbers,
gherkins and
onions preserved
by vinegar
3 7 9 15 2,098 2,712 3,233 3,387
'2006 Sugar preserved
fruits and nuts 0 0 0 0 416 12 14 39
'2008 Preserved fruits
nes 4 0 0 0 375 635 334 391
'2004
Prepared or
preserved
vegetables nes
(incl. frozen)
0 0 0 0 127 182 135 376
'2005
Prepared or
preserved
vegetables nes
(excl. frozen)
0 0 0 0 636 1,060 1,438 1,936
'2002
Tomatoes
prepared or
preserved
0 0 19 0 80 303 307 726
'2007 Jams &fruit
jellies 4 0 0 0 2,216 2,069 2,227 1,874

146
LIST OF IMPORTING MARKETS FOR A
PRODUCT EXPORTED BY PAKISTAN
TABLE NO.: 11
Product : 2009 Fruit & vegetable juices, unfermented
Sources : ITC calculations based on UN COMTRADE statistics
Unit : US Dollar thousand
Importers
Exported
value in
2006
Exported
value in
2007
Exported
value in
2008
Exported
value in
2009
Exported
value in
2010
India 727 880 879 2,007 1,587
United Kingdom 695 944 813 834 1,094
United States of America 283 341 422 504 592
United Arab Emirates 227 46 93 37 172
Saudi Arabia 15 9 1 32 133
Australia 254 19 37 62 127
Canada 143 151 160 93 83
LIST OF PRODUCTS EXPORTED BY PAKISTAN
detailed products in the following category : 20 Vegetable, fruit, nut, etc food preparations
Sources : ITC calculations based on UN COMTRADE statistics
Unit : US Dollar thousand
Product label
Exported
value in
2006
Exported
value in
2007
Exported
value in
2008
Exported
value in
2009
Exported
value in
2010
Fruit & vegetable juices,
unfermented 13,353 16,450 18,608 16,698 22,245
Cucumbers, gherkins and
onions preserved by
vinegar
1,404 2,098 2,712 3,233 3,387
Prepared or preserved
vegetables nes (excl.
frozen)
523 636 1,060 1,438 1,936
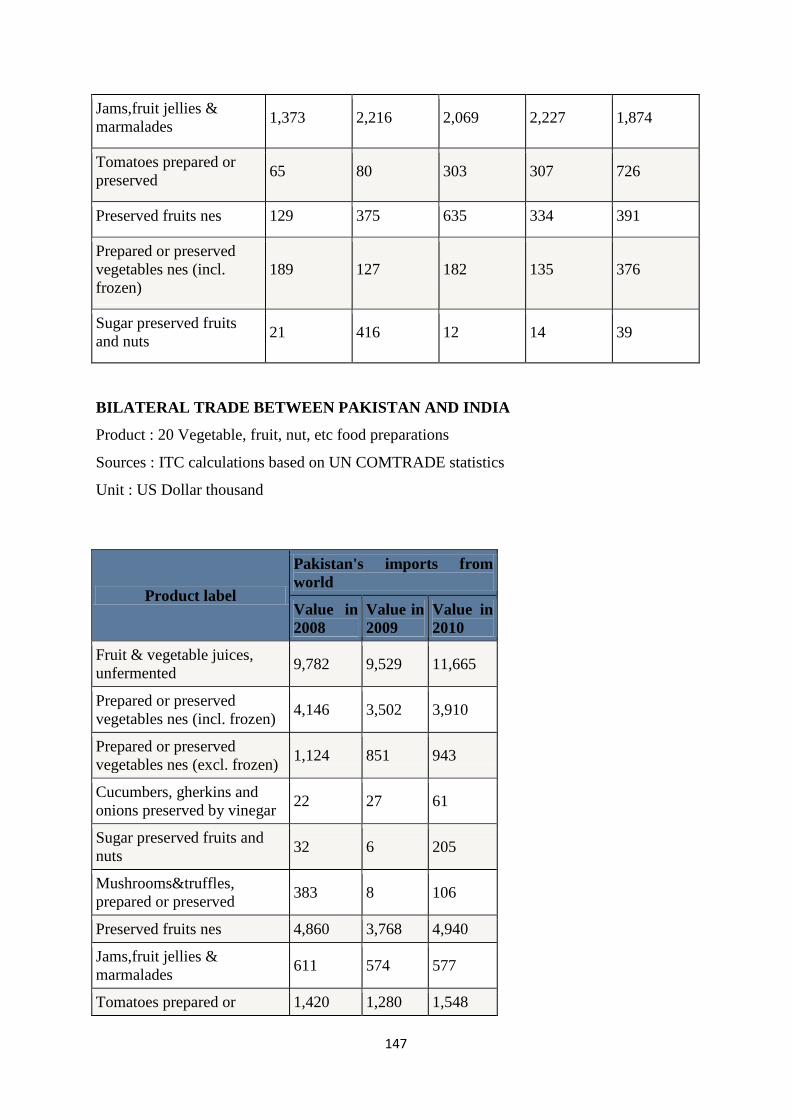
147
Jams,fruit jellies &
marmalades 1,373 2,216 2,069 2,227 1,874
Tomatoes prepared or
preserved 65 80 303 307 726
Preserved fruits nes 129 375 635 334 391
Prepared or preserved
vegetables nes (incl.
frozen)
189 127 182 135 376
Sugar preserved fruits
and nuts 21 416 12 14 39
BILATERAL TRADE BETWEEN PAKISTAN AND INDIA
Product : 20 Vegetable, fruit, nut, etc food preparations
Sources : ITC calculations based on UN COMTRADE statistics
Unit : US Dollar thousand
Product label
Pakistan's imports from
world
Value in
2008
Value in
2009
Value in
2010
Fruit & vegetable juices,
unfermented 9,782 9,529 11,665
Prepared or preserved
vegetables nes (incl. frozen) 4,146 3,502 3,910
Prepared or preserved
vegetables nes (excl. frozen) 1,124 851 943
Cucumbers, gherkins and
onions preserved by vinegar 22 27 61
Sugar preserved fruits and
nuts 32 6 205
Mushrooms&truffles,
prepared or preserved 383 8 106
Preserved fruits nes 4,860 3,768 4,940
Jams,fruit jellies &
marmalades 611 574 577
Tomatoes prepared or 1,420 1,280 1,548

148
SWOT Analysis of Food–Processing Industry
strengths
Plenty of availability of raw material
Priority status for agro-processing given by the central Government
Large network of manufacturing facilities all over the country
Large domestic market
Weaknesses
Less availability of infrastructural facilities
Lack of quality control and testing methods
Inefficient supply chain
High requirement of working capital.
Inadequately developed linkages between R&D.
Seasonality of raw material
Opportunities
Large crop and material base offering a vast potential for agro processing activities
Setting of SEZ/AEZ and food parks for providing added incentive to develop greenfield
projects
Rising income levels and changing consumption patterns
Favourable demographic profile and changing lifestyles
Integration of development in contemporary technologies such as electronics, material
science, bio-technology etc. offer vast scope for rapid improvement and progress
Opening of global markets
Threats
Affordability and cultural preferences of fresh food
High inventory carrying cost
High taxation
149
DRY FRUITS AND
SPICES

150
God has been merciful for it has given Pakistan in abundance dry fruits like almonds, figs,
pistachio, walnuts, pine nuts (chilghoza) dates (in Sindh and adjoining areas) and peanuts.
And Peanuts are very big in size and to bear seeds then peanuts grown in Sindh. But the
market sources state that local peanuts have abundance of nourishment. Before advances it is
perhaps need to inform regretfully that the 80 % of dry fruits demands are fulfilled through
legal or illegal imports such as almonds from America through Dubai. So an exact estimate of
consumption is inconceivable.
Unfortunately the farmers do not consider growing dry fruits as rewarding as compared to
other crops. As a result there has been a progressive decline in the quantum of production.
Almond - The kings of nuts, Cashew - It's actually a seed, Saffron - The mark of
tradition & purity, Pistachio - The 'Happy Nut', Walnuts - Just a handful everyday,
Figs – all you need to live , Apricot - The famous fruit, Raisin - Far more than a dried
Import (in tones) 2005 2006 2007 2008 2009
Almonds Shelled 3128 3358 3902 5269 2833
Almonds, with shell 3150 2563 2336 2053 2350
Export (in tones)
Almonds Shelled 31 227 221 280 102
Almonds, with shell 9 20 13 115 41
Import (in tones)
Pistachios 874 2971 3359 4204 1736
Export (in tones)
Pistachios 5 8 19 18 2
Import (in tones)
Walnuts, with shell 16 18 25 3 1
Export (in tones)
Walnuts, with shell 396 93 577 255 237
Import(in tones)
Raisins 2967 6123 8279 8887 1956
Export(in tones)
Raisins 247 157 231 198 95

151
SPICES
Major spice crops in world trade
As a world trade value, the most spice crops from the tropical regions are pepper, capsicums,
nutmeg/mace, cardamom, allspice/pimento, vanilla, cloves, ginger, cinnamon and cassia, and
turmeric. There are coriander, cumin, mustard, and sesame seeds and the herbs sage, oregano,
thyme, bay and the mints are the most important spice crops from non-tropical environments.
And these have characteristics and environmental needs of the crops to dominate the global
spice trade
Import (in tones) 2005 2006 2007 2008 2009
Chillies and peppers, dry 731 19 1010 28356 3246
Chillies and peppers, green 122 0 25 1230 65
Export (in tones)
Chillies and peppers, dry 2968 7408 6376 2633 4027
Chillies and peppers, green 0 0 1 1 3
Import (in tones)
Nutmeg, mace and
cardamoms
2455 2806 3941 2649 3368
Export (in tones)
Nutmeg, mace and
cardamoms
0 0 0 44 6
Import (in tones)
Ginger 32701 48249 56881 60140 58177
Export (in tones)
Ginger 0 0 121 193 284
Import (in tones)
Cinnamon (canella) 3639 3860 4193 4727 4089
Cloves 639 699 1142 1601 787
Garlic 51030 48789 64047 114055 83793
Export (in tones)
Cinnamon (canella) 15 0 1 0 1

152
Cloves 0 0 0 0 1
Garlic 51 274 1079 5813 766
PRESENT SCENARIO
Total value of exports: US$20.29 billion (2010)
Primary exports - commodities: Cotton yarns, Fabrics, Fresh and dry fruits, Finished
leather, Sugar and molasses, Fertilizers, Marble, Precious and semi-precious stones, Textile
and clothing articles, Knotted carpets, Water coolers, Sports goods.
Total value of imports: US$32.71 billion (2010)
Primary imports - commodities: Iron and steel, Auto components and spares,
Pharmaceuticals, Raw materials, Tea, Non-metallic mineral products, Plastic materials,
Intermediaries for chemicals, Agro-based raw materials, IT-related software, Bicycles,
Vegetables and meat.
MAJOR PLAYERS
Primary export & import partners: US, UAE, Afghanistan, UK, China, Saudi Arabia,
Kuwait, Malaysia and India.
Total Export Partner

153
Total Import Partner
TRADE WITH INDIA & WORLD
Product label Pakistan's exports to
India
Pakistan's exports to
world (Dry fruits)
(in tones) Value
in 2008
Value
in 2009
Value
in 2010
Value
in 2008
Value
in 2009
Val
ue
in
2010
Dates, figs,pineapples,
mangoes, avocadoes, guavas
35384 44638 44165 66670 83790 8095
4
Dried fruit 899 77 469 13407 30244 2586
2
Nuts nes 3 167 399 4713 2044 5408
P Product label Pakistan's exports to
India
Pakistan's exports to
world (Spices)
(in tones)
Ginger,saffron,turmeric,
thyme, bay leaves & curry
341 252 449 19,011 23,196 32,0
61
Cinnamon and cinnamon-
tree flowers
0 0 0 0 3 5
Nutmeg, mace and
cardamons
0 0 0 61 35 36
Pepper, peppers and
capsicum
0 5 0 5,046 6,939 5,72
2

154
Product label Pakistan's imports
from India
Pakistan's imports from
world (Dry fruits)
(in tones) 2008 2009 2010 2008 2009 2010
Brazil nuts, cashew nuts
& coconuts 92 297 648 9527 12927 10389
Nuts nes 0 0 65 69901 73641 84226
Dried fruit 89 134 50 5753 7276 6403
Dates, figs,pineapples,
mngoes, avocadoes,
guavas
34 2 10 3406 1737 2555
Product label Pakistan's imports
from India
Pakistan's imports from
world (Spices)
(in tones) 2008 2009 2010 2008 2009 2010
Pepper, peppers and
capsicum 18,831 426
14,3
09
27,72
1 12,068 25,752
Seeds of anise,
badian,fennel,coriander,
cumin, etc.
4,854 6,182 5,10
2 9,183 10,390 10,284
Ginger,saffron,turmeric,
thyme, bay leaves & curry 257 348
3,39
6
33,00
8 35,473 47,520
Nutmeg, mace and
cardamons 3,717 2,999
2,31
2 8,878 9,134 8,932
Cinnamon and cinnamon-
tree flowers 171 149 171 2,617 3,805 3,570
Cloves 0 30 71 4,387 2,569 3,692
PAKISTAN'S EXPORT AND IMPORTS (DRY FRUITS)
PAKISTAN's Export (dry fruits In Amount)
Country Amount (USD)
INDIA 4551284

155
UNITED ARAB
EMIRATES 48699
CANADA 9183.52
KUWAIT 8998.13
SOUTH AFRICA 7518.81
UNITED KINGDOM 7405.87
UNITED STATES 6821.85
Table-1.13
PAKISTAN's total Imports (dry fruits) during the period, value US $:83772161249.3001
Million.
Country Amount (USD)
IRAN, ISLAMIC
REPUBLIC OF 420995
INSTALLATIONS IN
INTERNATIONAL
WATERS 10578.1
UNITED STATES 7428.59
CHINA 1575
MALAYSIA 329.58
UNITED ARAB
EMIRATES 139.5
CHILE 108.28
There are major Export destination of dry fruits market is Europe, Russian Federation,
Central Asia, Gulf States, India and Iran. Also numbers of dry fruit exporters have been
received orders from many countries and they are picking dry fruits from local wholesale
markets and even also from retailers to meet the demands.
PAKISTAN'S EXPORT AND IMPORTS (SPICES)
Country
Am PAKISTAN's Export (Spices in
Amount)
SAUDI ARABIA 19625.9
AFGHANISTAN 14927.7

156
KUWAIT 11759.8
ZAMBIA 496.4
Country PAKISTAN's import (Spices in Amount)
THAILAND 21624.6
GERMANY 500
UNITED KINGDOM 85.68
Price list of Pakistan spices
Spices Price/40 Kg.
Kunri (Dandicut) 7600 to 8000
Cumminseed white (Zeera) 10000 to 11000
Cumminseed black (Zeera) 12000 to 14000
Ajwan 3200 to 3800
Turmeric Gantha 8500 to 9500
Coriander seed No.1 6000 to 7000
Coriander seed No. 2 5500 to 6000
Fenugreek (Methi) 3000 to 3400
Tamarind 1850 to 2150
Garlic 4800 to 5200
Plum Dry 10500 to 12000
SWOT ANALYSIS OF SPICE AND DRY FRUITS MARKET IN PAKISTAN
Strengths
Large export oriented industry
Self financed based industry, medium investment required
Competitive advantage due to indigenous raw material and skilled labour at cheap
rates.
Wide availability of manpower with available skills and personalized knowledge of
raw material and prices.
Weaknesses

157
The level of technology being used is very low. This not only reduces the production
capacity of the smaller manufacturers, but also affects the quality of their product,
thereby affecting their competitive edge in the international markets. If canning is
done by untrained staff could cause bugling and thereby fungus attacks which could
damage the production even at 100 % spoilage rate.
Opportunities:
Growing export of spices and dry fruits from Pakistan.
Growing demand for ready made mixed spices & dry fruits.
New markets being developed for enhancing Horizontal penetration in various
segments
Pakistani economy has achieved 7% plus GDP and promoted confidence of
foreign & local investors.
Threats
Monopolistic competition of major market players.
Sometimes high wastage due to improper storage
Lack of modern technology and skilled workers
Short storage life of raw material and inadequate post harvest facilities.

158
Bibliography
Jere R. Behrman & Ryan Schneider, 1993. "An International Perspective on
Pakistani Human Capital Investments in the Last Quarter Century," The Pakistan
Development Review, Pakistan Institute of Development Economics, vol. 32(1),
pages 1-68.
Morduch, Jonathan, 1994. "Poverty and Vulnerability," American Economic
Review, American Economic Association, vol. 84(2), pages 221-25, May.
Townsend, Robert M, 1995. "Consumption Insurance: An Evaluation of Risk-
Bearing Systems in Low-Income Economies," Journal of Economic Perspectives,
American Economic Association, vol. 9(3), pages 83-102, Summer.
Nancy Birdsall & David Ross & Richard Sabot, 1993. "Underinvestment in
Education: How Much Growth has Pakistan Foregone?," The Pakistan Development
Review, Pakistan Institute of Development Economics, vol. 32(4), pages 453-499.
Jacoby, Hanan G & Skoufias, Emmanuel, 1997. "Risk, Financial Markets, and
Human Capital in a Developing Country," Review of Economic Studies, Wiley
Blackwell, vol. 64(3), pages 311-35, July.
Alderman, Harold, 1996. "Saving and economic shocks in rural Pakistan," Journal
of Development Economics, Elsevier, vol. 51(2), pages 343-365, December.
Summers, Lawrence H., 1992. "Investing in all the people," Policy Research
Working Paper Series 905, The World Bank.
Investment opportunities in Pakistan – available from:
http://investinpakistan.org/investment-opportunities.php
Salman, A. 20-22 Aug. 2010, “Empirical analysis of portfolio investments in
Pakistan”, Advanced Computer Theory and Engineering (ICACTE), 2010 3rd
International Conference, Volume: 5 On page(s): V5-242 - V5-246.
Ahmad, N. 1999. Fertilizer scenario in Pakistan: policies and development. In: Proc.
Conference on Agriculture and Fertilizer Use by 2010. NFDC Publication 2/99.
Islamabad.
Ahmad, N. & Chaudhry, A. G. 2000. Fertilizer use at farm level. NFDC
publication 4/2000. Islamabad.

159
Ahmad, N. 2000. Integrated plant nutrition management in Pakistan: status and
opportunities. In: Proc. Symposium on Integrated Plant Nutrition Management,
NFDC. pp:18-37. Islamabad.
Ahmad, N. & Rashid, M. 2003. Fertilizers and their use in Pakistan. Extension
Guide. Islamabad.
Ahmad, N. & Muhammad, T. 1998. Fertilizer plant nutrient management and self
reliance in agriculture. The Pakistan Development Review 37:4, 217-233.
FAO/UNESCO. 1974. Soil Map of the World 1:5 000 000. Volume I. Legend.
UNESCO, Paris.
FAO. Web Site: http://www.fao.org/ag/aquastat. Rome.
Government of Pakistan. 1994. 1990 Census of agriculture. Agricultural Census
Organization. Economic Affairs and Statistics Division. Islamabad.
Government of Pakistan. 2001. Water resources development. Ten year perspective
development plan. Planning Commission. pp 277-292. Islamabad.
Government of Pakistan. 2003. Agricultural statistics: 2001-02 Ministry of Food,
Agriculture and Livestock. Islamabad.
Government of Pakistan. 2003. Pakistan Economic Survey 2002-03. Ministry of
Finance. Islamabad.
NFC-National Fertilizer Corporation of Pakistan Ltd. 1981. A study on
differential impact of fertilizer price increase on its use in Pakistan: Fertilizer use
pattern in Pakistan Rabi 1980-81. NFC-NFDC. Islamabad.
NFDC. 1989. Crop response to fertilizer. NFDC Publication 4/89. Islamabad.
Economy Survey Report 2009-10 and 2010-11 Major Commodity data Retrieved
from http://www.finance.gov.pk/survey_1011.html
Size of the Sector: http://countrystudies.us/pakistan/49.htm
Comparative Agriculture Growth rate Retrieved from the
http://search.worldbank.org/data?qterm=agricultue+growth+rate+country+vise&_type_exact
=Indicators
Major Commodity Produced retrieved from the Economy Survey Report 2009-10 and
2010-11 http://www.finance.gov.pk/survey_1011.html
Sectorial Agriculture growth rate of Pakistan retrieved from the
http://www.einfopedia.com/agriculture-growth-rate-of-pakistan.php

160
Export and Import data retrieved from the
http://www.indexmundi.com/agriculture/?country=pk&commodity=sorghum&graph=imports
Multinational company information retrieved from the
http://thennews.com.pk/Todayprintwritername.aspx
Dr.Ishrat, H. (2011, March 24). Retrieved from www.news.com.pk
Haque, A. (Nov,1993 ). Role of multinational companies in Pakistan economy.
Economic Review .
Pakistan, G. o. (2011). Retrieved from http://www.finance.gov.pk/survey_1011.html
Akhtar, D. S. ( 21 June 2006. ). State Bank of Pakistan.
Pakistan, G. o. (2011). Retrieved from
http://www.commerce.gov.pk/Downloads/Services_%20Export_Web_%20Page.pdf
http://www.fpcci.com.pk/pdf_view.asp?name=Trade%20with%20India&pdf=/produc
ts/subcat_pdf_79.pdf
http://www.trademap.org/countrymap/Bilateral_TS.aspx
Heritage. 5 November 2011
<http://www.heritage.gov.pk/html_Pages/map_of_Pakistan.htm>.
nationsencyclopedia. <http://www.nationsencyclopedia.com/Asia-and-
Oceania/Pakistan-TOPOGRAPHY.html#ixzz1aBC3qhl6>.
November 2011 < http://www.tradingeconomics.com/pakistan/road-density-km-of-
road-per-sq-km-of-land-area-wb-data.html>.
saarctourism. November 2011 <http://pakistan.saarctourism.org/pakistan-facts.html>.
www.pakistan.gov.pk
www.infopak.gov.pk
www.nationsencyclopedia.com
2 March 2012
<http://legacy.intracen.org/appli1/TradeCom/TP_EP_IC.aspx?IN=72&YR=2010>http
://legacy.intracen.org/appli1/TradeCom/TP_IP_IC.aspx?IN=72&YR=2010
wikipedia. March 2012 < http://en.wikipedia.org/wiki/Steel>.
March 2012
<http://en.wikipedia.org/wiki/World_Steel_Association>.http://www.worldsteel.org/
media-centre/press-releases/2012/2011-world-crude-steel-production.html
<http://en.wikipedia.org/wiki/Pakistan_Steel_Mills>.
<http://www.fieo.org/view_section.php?id=0,548,549>

161
<http://www.trademap.org/countrymap/Bilateral_TS.aspx>
http://en.wikipedia.org/wiki/Economy_of_Pakistan#Structure_of_economy
http://en.wikipedia.org/wiki/Economy_of_Pakistan
http://www.moip.gov.pk/
http://www.infopak.gov.pk/
http://www.commerce.gov.pk/wp-content/themes/moc/export/Export(Dec2010).htm
http://www.economywatch.com/world_economy/pakistan/
http://www.paktechsearch.com/industryLink.asp
http://www.imf.org/external/np/fin/tad/exfin2.aspx?memberKey1=760&date1key=20
11-10-08
http://www.worldbank.org.pk/WBSITE/EXTERNAL/COUNTRIES/SOUTHASIAE
XT/PAKISTANEXTN/0,,menuPK:293077~pagePK:141132~piPK:141109~theSiteP
K:293052,00.html
http://devdata.worldbank.org/AAG/pak_aag.pdf
http://web.worldbank.org/WBSITE/EXTERNAL/COUNTRIES/0,,PAGESIZE:10~m
enuPK:177680~pagePK:169643~piPK:169646~theSitePK:136917~COUNTRYCOD
E:PAK,00.html?countrylist=PAK
http://web.worldbank.org/WBSITE/EXTERNAL/PROJECTS/0,,countrycode:PK~me
nuPK:64820014~pagePK:64492269~piPK:64492312~subTitle:Active+Projects~theSi
tePK:40941,00.html
www.tdap.gov.pk/tdap-statistics.php
www.smeda.org.pk/main.php?id=34
www.pgjdc.org/
www.gjepc.org
www.sbp.org
www.pakistantrade.org
www.iptn.co.uk
Comparison of GDP of India and Pakistan:
http://www.google.co.in/publicdata/explore?ds=d5bncppjof8f9_&met_y=ny_gdp_mk
tp_cd&idim=country:PAK&dl=en&hl=en&q=gdp+trends+of+pakistan#ctype=l&strai
l=false&nselm=h&met_y=ny_gdp_mktp_cd&scale_y=lin&ind_y=false&rdim=countr
y&idim=country:PAK:IND&ifdim=country&hl=en&dl=en

162
Data of GDP for the year 2000 to 2010:
http://www.indexmundi.com/g/g.aspx?c=pk&v=66
Details of Pakistani Currency: http://en.wikipedia.org/wiki/Pakistani_rupee
For the interest rate of Pakistan: http://www.tradingeconomics.com/pakistan/interest-
rate
Foreign Exchange Rate in Pakistan: http://hamariweb.com/finance/forex/
Theory of National Product and Gross National Product:
http://www.investordictionary.com/definition/net-national-product
Data of sector wise Net National Product of Pakistan:
http://www.khyberpakhtunkhwa.gov.pk/Departments/BOS/nwfpdev-statis-
nationalaccounts-tab-144.php
Data of Purchasing Power Parity for the year 2000 to 2010:
http://www.indexmundi.com/g/g.aspx?v=65&c=pk&l=en
What is Macro Environment
http://www.investopedia.com/terms/m/macro-environment.asp#axzz1hN4vSqOO
Principles of Economics
Mankiw, N.G., Principles of Economics (6th
Edition), Mason , South-Western
Cengage Learning
For overview of the leather industry in pakistan:
http://legacy.intracen.org/appli1/TradeCom/TP_IP_CI_HS4.aspx?IN=42&RP=586&
YR=2010&IL=42%20%20Articles%20of%20leather,%20animal%20gut,%20harness,
%20travel%20goods&TY=I
About meat industry:
http://www.regencymeat.com/
Future of meat industry:
http://www.meattradenewsdaily.co.uk/news/260511/pakistan___big_plans_for_meat_
industry.aspx
Association for meat industry in Pakistan:
http://www.apmepa.com/about/purpose-objectives/
http://www.apmepa.com/about/our-aim-goal/
About poultry industry:
http://www.pakissan.com/english/agri.overview/history.development.poultry.industry.
pakistan.shtml

163
Trading data of different industries of Pakistan:
http://legacy.intracen.org/appli1/TradeCom/TP_IP_CI_HS4.aspx?TY=I&IN=42&RP
=586&YR=2007
For SWOT analysis of leather industry:
http://www.unido.org/fileadmin/user_media/UNIDO_Worldwide/Offices/UNIDO_Of
fices/Pakistan/Leather_DS_Qamar_Zaman_18-7-06.pdf
file:///K:/GLOBAL%20RESEARCH/Culture_of_Pakistan.htm
file:///K:/GLOBAL%20RESEARCH/History_of_Pakistan.htm
en.wikipedia.org/wiki/History_of_Pakistan
asianhistory.about.com/od/pakistan/p/PakistanProf.htm
www.infoplease.com/ce6/world/A0860200.html
www.storyofpakistan.com/
www.historyguy.com/new_and_recent_conflicts.html
www.kwintessential.co.uk/resources/global-etiquette/pakistan.htm
en.wikipedia.org/wiki/Pakistan
www.bbc.co.uk/2/hi/americas/country_profiles/1157960.stm
www.bbc.co.uk/2/hi/americas/country_profiles/1157960.stm
www.pakistan.alloexpat.com/pakistan.../people_language_religion_p...
www.eastasiaforum.org/.../improving-india-pakistan-relations-throug..
en.wikipedia.org/wiki/Economy_of_Pakistan
en.wikipedia.org/wiki/Culture_of_Pakistan
https://mailattachment.googleusercontent.com/attachment/?ui=2&ik=bcb98c5cc0&vi
ew=att&th=135f5cc61088e664&attid=0.3&disp=safe&realattid=f_gzkqm4ae2&zw&
saduie=AG9B_P8mHi2BR1Ji3GcRDiIh14nU&sadet=1331270374000&sads=mefo9i
0QXNxHWhp6EF60Vdfnv9E
http://www.iisd.org/tkn/pdf/tkn_compliance_pakistan.pdf
http://www.imaritime.com/backoffice/published_files/Trends%20in%20indian%20shi
pping.pdf
http://www.scribd.com/document_downloads/direct/56933452?extension=pdf&ft=13
31142511<=1331146121&uahk=F2o38OC4VTArvsKPAMN47xeI9+Y
http://kms1.isn.ethz.ch/serviceengine/Files/ISN/91098/ipublicationdocument_singled
ocument/81b52e22-95ef-4634-a982-acccf1475cbc/en/79.pdf

164
http://en.wikipedia.org/wiki/Fishing_in_Pakistan
http://www.dtic.mil/cgi-bin/GetTRDoc?AD=ADA486565
http://icpsr.org.ma/?Page=showInstitute&InstituteID=DMFWWK97&CountryID=Pa
kistan
http://mercantilemarine.gov.pk/Body/Functions/Functions.htm
http://ipaki.com/business/government-policies/merchantmar.htm
http://www.trademap.org/tradestat/Bilateral_TS.aspx
http://www.iie.com/publications/pb/pb09-15.pdf
http://www.pildat.org/Publications/publication/FP/MFNStatusandTradebetweenPakist
anandIndia_PakPerspective_Jan2012.pdf
http://www.pakistan.gov.pk/divisions/ContentInfo.jsp?DivID=10&cPa
th=91_97_357&ContentID=1001
http://www.wisard.org/wisard/shared/asp/generalinfoserver/intermediate.asp?Instituti
onID=12012
AMB Country Credit Risk Report Dated : Sept 28,2011 From,
Http://Www3.Ambest.Com.
Investment Climate Of Pakistan From, Http://Investinpakistan.Org.
Companies Ordinance Year 1984 From, Http://Www.Tahseenbutt.Com.
Political Situation In Pakistan From, http://www.bhutto.org.
Constitution of Pakistan And Politics of Pakistan From, http://en.wikipedia.org.
Overview Of Pharmaceutical Industry In Pakistan, from Http://En.Wikipedia.Org
Pharmaceutical market review by EPISON Published Date: Feb17,2012, from
Http://Www.Espicom.Com.
Pharmaceutical Sector Faces Immense Challenges Published Date: Jan 04,2009, from
Http://Www.Nation.Com.Pk/
Pakistan Pharmaceutical Industry, from
Http://Www.Ppma.Org.Pk/Ppmaindustry.Aspx
International Journal Of Research Studies In Management (2012 April, Volume 1
Number 1, 39-45).
Government of Pakistan, Ministry of Finance. <http://www.finance.gov.pk> .
Accessed August 2001.
Harrison, Selig S. India and Pakistan: The First Fifty Years. Cambridge: Woodrow
Wilson Center Press, 1999.

165
Naipaul, V. S. Among the Believers. Harmondsworth: Penguin, 1982.
Noman, Omar. Pakistan: Political and Economic History since 1947. London: Kegan
Paul, 1990.
U.S. Department of State. FY 2001 Country Commercial Guide: Pakistan.
http://faostat.fao.org/DesktopDefault.aspx?PageID=567#ancor
http://www.dawn.com/2011/01/07/indian-traders-stop-vegetable-supply-to-
pakistan.html
http://www.dawn.com/2012/02/15/barriers-to-be-removed-for-trade-relation-with-
india-fahim.html
http://www.infopak.gov.pk/LandPeople.aspx
http://tribune.com.pk/story/164694/the-rise-of-pakistan-in-the-global-meat-trade/
http://www.apmepa.com/
http://www.apmepa.com/about/purpose-objectives/
http://apmepa.com/upload/APMEPA-Members-List.pdf
http://www.intracen.org/country/pakistan/
http://legacy.intracen.org/appli1/TradeCom/TP_IP_CI.aspx?RP=586&YR=2009
http://www.paktechsearch.com/Leather.asp
http://www.paktechsearch.com/Leather.asp
www.indexmundi.com/
http://tribune.com.pk/story/276111/trade-with-india-unrestricted-export-of-farm-
products-suggested/
http://www.pakistantoday.com.pk/2011/12/07/news/profit/trade-relations-with-india-
in-agriculture/

166
ANNEXURES
1) Profile of pakistan
Capital Islamabad
33°40′N 73°10′E
Largest city Karachi
Official language(s) Urdu (national)
English
Recognized regional languages Balochi, Pashto, Punjabi,Saraiki, Sindhi
Demonym Pakistani
Government Federal Parliamentary republic
President Asif Zardari (PPP)
Prime Minister Yousaf Gillani (PPP)
Chief Justice Iftikhar Chaudhry
Chair of Senate Farooq Naek (PPP)
House Speaker Fahmida Mirza (PPP)
Legislature Majlis-e-Shoora
Upper House Senate
Lower House National Assembly
Formation
Pakistan Declaration 28 January 1933
Pakistan Resolution 23 March 1940
Independence from the United Kingdom
Declared 14 August 1947
Islamic Republic 23 March 1956
Area
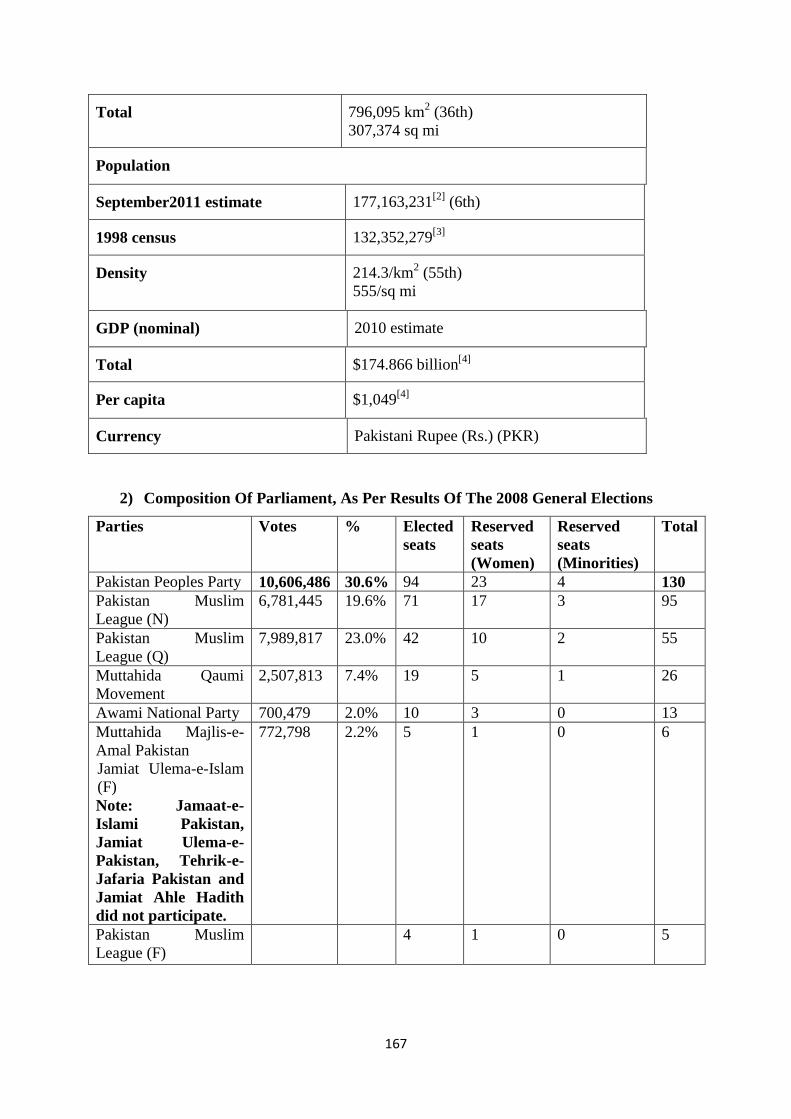
167
Total 796,095 km2 (36th)
307,374 sq mi
Population
September2011 estimate 177,163,231[2]
(6th)
1998 census 132,352,279[3]
Density 214.3/km2 (55th)
555/sq mi
GDP (nominal) 2010 estimate
Total $174.866 billion[4]
Per capita $1,049[4]
Currency Pakistani Rupee (Rs.) (PKR)
2) Composition Of Parliament, As Per Results Of The 2008 General Elections
Parties Votes % Elected
seats
Reserved
seats
(Women)
Reserved
seats
(Minorities)
Total
Pakistan Peoples Party 10,606,486 30.6% 94 23 4 130
Pakistan Muslim
League (N)
6,781,445 19.6% 71 17 3 95
Pakistan Muslim
League (Q)
7,989,817 23.0% 42 10 2 55
Muttahida Qaumi
Movement
2,507,813 7.4% 19 5 1 26
Awami National Party 700,479 2.0% 10 3 0 13
Muttahida Majlis-e-
Amal Pakistan
Jamiat Ulema-e-Islam
(F)
Note: Jamaat-e-
Islami Pakistan,
Jamiat Ulema-e-
Pakistan, Tehrik-e-
Jafaria Pakistan and
Jamiat Ahle Hadith
did not participate.
772,798 2.2% 5 1 0 6
Pakistan Muslim
League (F)
4 1 0 5

168
Pakistan Peoples Party
(Sherpao)
140,707 0.4% 1 0 0 1
National Peoples Party 1 0 0 1
Balochistan National
Party (Awami)
1 0 0 1
Independents 18 0 0 18
Total 34,665,978 100% 266 60 10 336
SOURCE: Election Commission Of Pakistan, Adam Carr's Electoral Archive
3) Policy Parameters

169
4) Forex Rates Pakistan
Updated at: 24 Dec, 2011
Currency
Symbol
PKR
U.S. Dollar USD 87.77
UAE Dirham AED 23.89
British Pound GBP 136.99
Saudi Arabian Riyal SAR 23.4
Australian Dollar AUD 89.76
Canadian Dollar CAD 87.92

170
5) Sources of Raw Materials and Process Technologies for Chemical Industry
Development in Pakistan
The sector wise classification of chemical industry in Pakistan is as follows:
6) Bilateral Trade between India and Pakistan:
Sources : ITC calculations based on UN COMTRADE statistics
Unit: US Dollar thousand

171
Produ
ct
code
Product label
Pakistan's exports to
India Pakistan's exports to world
Value
in 2008
Value
in
2009
Value
in
2010
Value
in 2008
Value in
2009
Value in
2010
'7204
Ferrous waste
and scrap;
remelting
scrap ingots
or iron or steel
1,461 14 2,494 6,854 6,650 13,855
'7212
Flat-rolld prod
of iron/non-
al/s wd less
than
600mm,clad
0 0 0 2 97 0
'7216
Angles,
shapes and
sections of
iron or non-
alloy steel
0 0 0 8,347 3,889 5,376
'7228
Bars&rods,oth
er alloy steel;
hollow drill
bars, etc.
0 0 0 69 119 56
'7203
Ferrous prod
obt by dir
reductn of iron
ore (minimum
pure iron of
99.9
0 0 0 0 29 107
'7220
Flat-rolled
products of
stainless
steel, of a
width of less
0 0 0 5 1 0

172
than 600mm
'7224
Alloy steel in
ingots/other
primary form
nes
0 0 0 194 0 16
'7201
Pig iron and
spiegeleisen
in pigs
0 0 0 289 0 0
'7206
Iron and non-
alloy steel in
ingots or other
primary forms,
nes
34 0 0 160 12 14
'7219
Flat-rolled
products of
stainless
steel, of a
width of
600mm or
more
0 0 0 207 689 48
'7205
Granules and
powders, of
pig iron,
spiegeleisen,
iron or steel
0 0 0 18,231 2,008 9,843
'7210
Flat-rolled
prod of iron or
non-al/s
wd>/=600mm,
clad, plated or
coated
0 0 0 148 631 4
'7214
Bars&rods of
iron/non-al/s,
nfw than
forged, hr,
hd,/hot-
0 0 0 2 0 2

173
extruded
'7221
Bars&rods,
hot-rolled, in
irregularly
wound coils,
of stainless
steel
0 0 0 0 1 18
'7222
Bars & rods of
stainless steel
nes; angles,
shapes
0 0 0 35 114 70
'7226
Flat-rolld
products of
other alloy
steel of a
width of less
than 600mm
0 0 0 1 36 18
'7227
Bars&rods,hot
-rolled,in
irregularly
wound coils,of
other alloy
steel
0 0 0 11 0 0
'7207
Semi-finished
products of
iron or
nonalloy steel
0 0 0 0 15 0
'7208
Flat-rolld
products of
iron/non-al/s
wdth>/=600m
m,hr,not clad
0 0 0 1,834 3,510 172
'7209
Flat-rolld prod
of iron/non-
alloy steel
wd>/=600mm,
0 0 0 0 98 0

174
cr,not clad
'7211
Flat-rolled
prod of
iron/non-al/s
wd less than
600mm,not
clad
0 0 0 1 5 696
'7215
Bars & rods of
iron or non-
alloy steel nes
0 0 0 0 8 0
'7229 Wire of other
alloy steel 0 0 0 15 22 0
'7213
Bars & rods,
hr, in irreg
wound coils,
of iron or non-
alloy steel
0 0 0 19 9 24
'7223 Wire of
stainless steel 0 0 0 47 4 1
'7217
Wire of iron or
non-alloy
steel
0 0 0 458 185 89
'7218
Stainless
steel in
ingots/other
primary forms
0 0 0 492 97 881
'7225
Flat-rolled
products of
other alloy
steel, of a
width of
600mm or
more
0 0 0 54 12 0

175
'7202 Ferro-alloys 0 0 0 0 34 0