A Framework for Inclusive Digital Storytelling for Cultural ...
368
A Framework for Inclusive Digital Storytelling for Cultural Tourism in Thailand A thesis submitted for the degree of Doctor of Philosophy Kittichai Kasemsarn College of Engineering, Design and Physical Sciences Department of Design Brunel University, London November 2017
-
Upload
khangminh22 -
Category
Documents
-
view
0 -
download
0
Transcript of A Framework for Inclusive Digital Storytelling for Cultural ...

A Framework for Inclusive Digital Storytelling for Cultural Tourism in Thailand
A thesis submitted for the degree of Doctor of Philosophy
Kittichai Kasemsarn College of Engineering, Design and Physical Sciences
Department of Design
Brunel University, London
November 2017

i
Abstract
Thailand has been extremely successful in promoting itself as a cultural country, with
tourism being the country’s primary source of income. However, cultural tourism for
Thai people is considered to be a niche market, and little attention has been paid to
the topic, compared to mass tourism. Moreover, Thai visitors have little motivation to
visit actual historical sites and read the story displayed as part of exhibitions. This
research aims to create, detail and evaluate a framework for inclusive digital storytelling to increase diversity and motivation for cultural tourism in Thailand.
To broaden and increase the potential tourism market, this PhD research applies
inclusive design principles as ‘understanding and designing for diversity’ by
identifying potential Thai customers into five diverse groups (youth, older adults,
disabled people, non-cultural tourists, and cultural tourists), and presents reports
regarding the barriers and drivers for achieving this. To increase the motivation of
Thai tourists, this PhD research adopts digital storytelling as ‘the guideline for
creating storytelling’ to increase motivation among the five diverse groups, and
illustrates how this was done in the second study. However, an issue arises if Thai
people (particularly older adults and disabled people) cannot access or understand
how to use this type of digital technology. These problems can in turn create
opportunities for applying inclusive designs to digital technology in an effort to
understand users’ behavioural needs; this is presented in the third study. Finally, the
fourth study evaluates the framework detailed from the previous three studies in
order to answer the primary research question: “How could inclusive design and
digital storytelling principles be applied to facilitate cultural tourism in Thailand?” This PhD research can suggest and establish links between three key areas and
devise and detail a new framework to increase diversity and motivation for cultural tourism for Thai visitors in Thailand which is original and interdisciplinary.

ii
Declaration I hereby declare that I am the author of this PhD research. I authorise Brunel University to lend this thesis to other institutions or individuals for the purpose of scholarly research. Signature Kittichai Kasemsarn Date: I further authorise Brunel University to reproduce this PhD research by photocopying or by other means, in total or in part, at the request of other institutions or individuals for the purpose of scholarly research. Signature Kittichai kasemsarn Date:

iii
Publications from this PhD (2013-2017)
International journal articles
1. Kasemsarn, K. and Nickpour, F. (2017). Barriers and Drivers in Cultural Tourism for Five Groups in Thailand. Journal of Tourism and Leisure Studies. 2 (3): 1-20
2. Kasemsarn, K. and Nickpour, F. (2017). Inclusive Digital Storytelling to Understand Audience’s Behaviour. The International Journal of Visual Design 11 (4): 35-51.
Thailand journal article
1. Kasemsarn, K. and Nickpour, F. (2015). The Challenge of Digital Storytelling for Cultural Tourism. Journal of The Faculty of Architecture KMITL, 20(1), 154-164.
International Conferences (2015-2017)
1. Kasemsarn, K. and Nickpour, F. (2015). Inclusive design: the future trend of cultural tourism. Paper presented at TOURAVEL 2015, Istanbul Turkey, 18-20 June 2015.
2. Kasemsarn, K. and Nickpour, F. (2015). Inclusive Design in Cultural Tourism: Identification of Drivers and Barriers for Five Groups in Bangkok. Paper presented at Include 2015, the 8th International Conference on Inclusive Design, Royal College of Art, London, 17-18 September 2015.
3. Kasemsarn, K., and Nickpour, F. (2015). Inclusive Design in Cultural Tourism: Identifying Barriers and Drivers for Five Groups in Bangkok, Thailand. Paper presented at CWUAAT, 8th Cambridge Workshop on Universal Access and Assistive technology, Fitzwilliam College, University of Cambridge, 21-23 March 2016.
4. Kasemsarn, K. and Nickpour, F. (2016). A Conceptual Framework for Inclusive Digital Storytelling to Increase Diversity and Motivation for Cultural Tourism in Thailand. Paper presented at Universal Design 2016 (UD2016), York, 21-24 August 2016. http://dspace.brunel.ac.uk/handle/2438/14381
Research award
1. The best concept or narrative in human-centred design, titled “A Conceptual Framework for Inclusive Digital Storytelling in Cultural Tourism”. HCDI Competition, 'Designing in 2024 – After 50 years of the Internet', Brunel University London, 18 September 2014.

iv
Poster presentation at Brunel University
1. A conceptual Framework for Inclusive Digital Storytelling in Cultural Tourism. Poster presented at Brunel University Research Student Conference 2014, 11-12 March 2014, Brunel University London.
2. A conceptual Framework for Inclusive Digital Storytelling in Cultural Tourism. Poster presented at School of Engineer Research Conference 2014 (ResCon14), 23-26 June 2014, Brunel University London.
3. Increasing Motivation and Diversity in Cultural Tourism: Integration of Inclusive Design and Digital Storytelling to facilitate Cultural Tourism. Poster presented at Brunel University Research Student Conference 2015, 17-18 March 2015, Brunel University London.
4. A Conceptual Framework for Inclusive Digital Storytelling to Increase Diversity and Motivation for Cultural Tourism in Thailand. Poster presented at Brunel University Research Student Conference 2016, 25-26 May 2016, Brunel University London.

v
Acknowledgement
First and foremost, This PhD research was supported by Office of the Higher
Education Commission, Thailand (2013-2017). I am grateful for the assistance given
by this government organisation to support funding throughout four years of my study.
I would like to express my great appreciation to Dr. Farnaz Nickpour and Professor
David Harrison for their valuable suggestions and comments during all stages of this
research.
I wish to thank all the survey, interview and observation participants from all four
studies throughout this PhD research. Without their helps, this PhD research could not be possible.
My special thanks and gratitude are reserved for my wife, Pitchamon Kasemsarn, and my son, Thinnakrit Kasemsarn, for their support and encouragement.
Finally, I would like to thank my parents for their encouragement throughout this PhD research

vi
Contents
Abstract i Declaration ii Publications from this PhD (2013-2017) iii
Acknowledgement v Contents vi List of figures vii List of tables xiv List of appendices xviii
Chapter 1: Introduction 1 1.1 Overview and research motivation 2
1.1.1 Research problems 2
1.1.2 Research opportunities 3
1.2 Research question 4
1.3 Scope of this PhD research 5
1.4 Aim and objectives 7
1.5 Thesis structure 7
Chapter 2: Literature analysis and synthesis 11
2.1 Introduction 12
2.2 Cultural Tourism 13
2.2.1 Types of tourism 13
2.2.2 The landscape of cultural tourism 14
2.2.3 The importance, relevance and applications of cultural tourism 18
2.2.4 Cultural tourism in Thailand 22
2.3 Challenges and opportunities in Cultural Tourism 23
2.3.1 Cultural Tourism - issues and potentials 23
2.3.2 Increasing diversity in Cultural Tourism 26
2.3.3 Why ‘inclusive design’ for cultural tourism? 28
2.3.4 Opportunities for inclusive design within cultural tourism 30
2.3.5 Increasing motivation in Cultural Tourism 33
2.3.6 Why digital storytelling for cultural tourism? 34
2.3.7 Opportunities for digital storytelling within cultural tourism 35

vii
2.4 Inclusive design - increasing diversity: 37
2.4.1 Definition of inclusive design 37
2.4.2 History and background of inclusive design 40
2.4.3 Inclusive Design, Universal Design, and Design for All 41
2.4.4 Applications of inclusive design and universal design in economy, industry and
media
4
2.4.5 Inclusive tourism 48
2.4.6 Principles of inclusive design 50
2.5 Digital storytelling – increasing motivation: 53
2.5.1 Definition of digital storytelling 53
2.5.2 History and background of digital storytelling 56
2.5.3 Applications of digital storytelling 57
2.5.4 Digital storytelling in cultural tourism from 2000-2010 and 2010-2016 58
2.5.5 Trends in digital storytelling for cultural tourism from 2000-2010 and 2010-2016 65
2.5.6 Digital storytelling guidelines 66
2.6 Inclusive Digital Storytelling for Cultural Tourism – a first combined approach 74
2.6.1 Why digital storytelling for inclusive design 74
2.6.2 Opportunities for digital storytelling and inclusive design: 75
2.6.3 Challenges of inclusive digital storytelling in this study 76
2.7 Synthesis of the initial framework 78
2.8 Summary 80
Chapter 3: Research Methodology 81 3.1 Introduction 82
3.2 Research Strategy 82
3.2.1 Research Strategies in Social Science 83
3.2.2 Research Strategies in Design 85
3.2.3 Adopting a Research Strategy 86
3.3 Research Methodologies in Three Areas: cultural tourism, inclusive design and
digital storytelling
87
3.3.1 Aim 89
3.3.2 Main Issues 89
3.3.3 Data-Collection Methods 90
3.3.4 Sampling Techniques and Sample Size 91
3.4 A Brief History of Design Research 91
3.5 Comparison Between Design Research Methodologies 92
3.5.1 Design Research Methodology (DRM) 92
3.5.2 Centre for Design Research (CDR) Model 93
3.5.3 CAD Centre Model 93
3.5.4 n-dim Model 94

viii
3.6 Constructing a Design Research Methodology (Adapting DRM) 95
3.6.1 Research Clarification 95
3.6.2 Descriptive Study 1 (DS1) 98
3.6.3 Prescriptive Study (PS) 99
3.6.4 Descriptive Study 2 (DS2) 102
3.7 Analytical process 103
3.8 Summary 108
Chapter 4: Barriers and Drivers in Cultural Tourism for Five Groups in Thailand
112
4.1 Introduction 113
4.2. Research Method 114
4.2.1 The sample sizes 114
4.2.2 Systematic sampling 116
4.2.3 Questionnaire development 117
4.2.4 Pre-test and Pilot test 119
4.3 Research question1: what are the barriers and drivers in cultural tourism among
five different groups?
121
4.3.1 Results 121
4.3.2 Barriers 123
4.3.3 Drivers 126
4.4 Discussion for research question1: what are the barriers and drivers in cultural
tourism among five different groups?
127
4.4.1 Barriers 127
4.4.2 Drivers 129
4.5 Research question 2: Are there any differences in answers between scaling and
open-ended questions?
131
4.5.1 Result 131
4.5.2 Barriers 131
4.5.3 Drivers 136
4.5.4 Discussion 138
4.6 Summary 140
4.6.1 Key insights 140
4.6.2 Study implications 142
4.6.3 Study Limitations 143
4.6.4 Detailing the framework 145

ix
Chapter 5: Constructing the Digital Storytelling: Guidelines to Increase Motivation in Cultural Tourism for Five Groups in Thailand
147
5.1. Introduction 148
5.2
Research question 1: What are the digital storytelling guidelines that focus
specifically to cultural tourism?
150
5.2.1 The new digital storytelling construction 150
5.2.2 Research method 153
5.2.3 Results 153
5.3 Research question 2: How can the digital storytelling guidelines be used to
motivate cultural tourism for five different groups in Thailand?
155
5.3.1 Research method: interviewing digital storytelling experts 155
5.3.2 Results and discussion 158
5.4 Summary 171
5.4.1 Research question 171
5.4.2 Implication of this study 174
5.4.3 Study limitations 176
5.4.4 Detailing the framework 177
Chapter 6: Inclusive digital storytelling to understand audiences’ behaviour
179
6.1 Introduction 180
6.1.1 Definition of ‘Inclusive digital storytelling’ 181
6.1.2 Why using digital mobile devices to watch digital storytelling? 182
6.2 Research methods 183
6.2.1 The sample sizes 183
6.2.2 The observation plan 183
6.2.3 The criteria for choosing a short video and animation 185
6.3 Results 186
6.3.1 Demographic profile 186
6.3.2 Percentage and average time of participants who can complete the task and
negative - positive comments in all stages
188
6.3.3 Results from all stages 193
6.4 Discussion 206
6.4.1 Reaching (accessibility and understanding) 206
6.4.2 Engaging (usefulness, usability, desirability) 208
6.5 Summary 213

x
6.5.1 Research question 213
6.5.2 Study Implications 217
6.5.3 Study Limitations 220
6.5.4 Detailing the framework 222
Chapter 7: Evaluation of an Inclusive Digital Storytelling for Cultural Tourism (IDST for CT) Framework
224
7.1 Introduction 225
7.1.1 Presenting a framework for inclusive digital storytelling for cultural tourism (IDST
for CT) in Thailand
226
7.1.2 Creating an interactive framework 229
7.2 Research method 231
7.2.1 Identifying participants in this study 231
7.2.2 Questionnaire development 232
7.2.3 Pilot test 233
7.3 Results 236
7.3.1 Demographic results 236
7.3.2 Evaluation of the framework 237
7.3.3 Open-ended answers 247
7.4 Discussion 251
7.4.1 RQ1: How usable is the IDST for CT framework? 251
7.4.2 RQ2: How desirable is the IDST for CT framework? 253
7.4.3 RQ3: Are there statistically significant differences in answers between the four
groups of participants?
253
7.4.4 RQ4: What changes or additions should be made to improve IDST for CT
framework?
255
7.4.5 RQ5: What do participants like and dislike in the IDST for CT framework? 256
7.5 Summary 257
7.5.1 Research question 257
7.5.2 Study limitations 259
Chapter 8: Conclusion and further work 261
8.1 Key conclusion 262
8.2 Research aims and objectives 263
8.2.1 Research objective 1: To provide a better understanding of the current situation
for three main factors: 1) cultural tourism, 2) inclusive design and 3) digital
storytelling.
264
8.2.2 Research objective 2: To create an initial IDST for CT framework 265
8.2.3 Research objective 3: To detail and strengthen an initial IDST for CT framework 267

xi
from three empirical studies
8.2.4 Research objective 4: To evaluate the usability and desirability within the IDST for
CT framework that embodies findings from three empirical studies
273
8.2.5 What is known now that was not known prior to this PhD research? 275
8.3 Contribution to knowledge 276
8.3.1 Suggesting a link between digital storytelling, inclusive design and cultural tourism 276
8.3.2 Creating a new framework for inclusive digital storytelling to increase diversity and
motivation for cultural tourism in Thailand which is original and interdisciplinary
277
8.3.3 Providing the tourism industry and researchers with an understanding of the
trends of cultural tourism and preparing them to face new challenges by applying
digital storytelling and inclusive design
278
8.3.4 Academic contribution to knowledge 280
8.4 Implications and impacts of this thesis 281
8.4.1 How to use this PhD research to benefit Thailand 282
8.4.2 Facilitating the Thai government, tourism industry, designers, directors, individual
users and researchers in how to use the IDST for CT framework
273
8.4.3 Impacts of this framework on international tourists 283
8.5 Limitations 284
8.5.1 General limitations 284
8.5.2 Specific limitations 285
8.6 Further works 287
8.7 Summary 288
References 292
Appendices 312

xii
List of figures
Figure 1.1 PhD research structure 10
Figure 2.1 Types of tourism (Mieczkowski, 1995, p. 459) 14
Figure 2.2 WGBH’s Rear Window captioning system in a movie theatre (O’Connell
and Goldberg, 2011) 46
Figure 2.3 Duratech handheld device used in theme parks and museums (O’Connell
and Goldberg, 2011)
47
Figure 2.4 An inclusive design process (Clarkson et al., 2007) 52
Figure 2.5 The virtual Smithsonian tour (http://www.mnh.si.edu/panoramas) 58
Figure 2.6 The Eternal Egypt project (www.eternalegypt.org) 59
Figure 2.7 The gas chambers of Auschwitz (panorama.auschwitz.org) 59
Figure 2.8 The Sarajevo Survival Tools virtual environment
(http://h.etf.unsa.ba/srp/project.htm)
60
Figure 2.9 The Virtual Museum of Iraq (www.virtualmuseumiraq.cnr.it) 61
Figure 2.10 The Westwood Experience application (Wither et al., 2010) 62
Figure 2.11 CHESS application at the Acropolis Museum (Pujol et al., 2012) 63
Figure 2.12 Show Taiwan Android application
(http://www.androidapps.biz/app/show.taiwan, 2013)
63
Figure 2.13 Stedr application (http://stedr.blogspot.co.uk, 2016) 64
Figure 2.14 A framework for inclusive digital storytelling to increase diversity and
motivation for cultural tourism in Thailand 79
Figure 3.1 Design Research Model (Blessing and Chakrabarti, 2009) 92
Figure 3.2 CDR research methodology (Tang, 1991) 93
Figure 3.3 CAD research methodology (Duffy & O'Donnell, 1998) 93
Figure 3.4 n-dim research methodology (Subrahmanian, et al., 1997) 94
Figure 3.5 The overall research plan adapting with DRM 97
Figure 4.1 The link between inclusive design and cultural tourism in this chapter 114
Figure 4.2 Yamane’s formula to calculate sample size (Yamane, 1967) 115
Figure 4.3 Reliability test by using Chronbach’s Alpha 120
Figure 4.4 Questionnaire distributions for five groups in many places 123
Figure 4.5 The results of the study presenting with the top barriers and drivers for
each group
146
Figure 5.1 The link between digital storytelling and cultural tourism in this chapter 149
Figure 5.2 Thai experts during interviewing 157
Figure 5.3 The results of the study presenting with the top recommendation for each
group
178
Figure 6.1 The link between inclusive design and digital storytelling in this chapter 181

xiii
Figure 6.2 This study set up two cameras; 1.) a super-wide-angle view (GoPro Hero4
Black); 2.) a video camera zooming close up to the iPad screen
188
Figure 6.3 The number of participants who need help and their average time to
complete the task
190
Figure 6.4 The number of participants who need help at each stage 210
Figure 6.5 The results of the study presenting with diverse audiences’ behaviour in
terms of reaching and engaging with digital mobile devices
223
Figure 7.1 A framework for inclusive digital storytelling for cultural tourism (IDST for
CT) in English 227
Figure 7.2 A framework for inclusive digital storytelling for cultural tourism (IDST for
CT) in Thai 228
Figure 7.3 An interactive framework — basic version 229
Figure 7.4 An interactive framework when users click on the ‘elements’ button 230
Figure 7.5 An interactive framework when users click on the ‘results’ button 230
Figure 8.1 A framework for inclusive digital storytelling for cultural tourism (IDST for
CT) in Thailand. 266
Figure 8.2 Barriers and drivers for five groups presented in Chapter 4 268
Figure 8.3 A set of guidelines to create digital storytelling for five groups presented in
Chapter 5
270
Figure 8.4 Key findings from diverse audiences in terms of reaching and engaging
with digital mobile devices from Chapter 6
272

xiv
List of tables
Table 2.1 Definitions of cultural tourism from several sources 15
Table 2.2 Keywords in cultural tourism with similarities from many sources 17
Table 2.3 The positive effects and importance of cultural tourism 18
Table 2.4 Applications of cultural tourism 20
Table 2.5 Main problems in cultural tourism 24
Table 2.6 Three concepts to increase diversity in cultural tourism 28
Table 2.7 Definitions of inclusive design from several sources 38
Table 2.8 Keywords from definitions of inclusive design 39
Table 2.9 Comparison between inclusive and universal design 41
Table 2.10 Application of inclusive design in different areas 42
Table 2.11 Universal Design – Relevant Disciplines (Preiser, 2011) 44
Table 2.12 Inclusive design in five design areas (Fletcher et al., 2013) 44
Table 2.13 Principles of inclusive design adopted in this thesis 52
Table 2.14 Definitions of digital storytelling from several sources 53
Table 2.15 Keywords from definition of digital storytelling from many sources 55
Table 2.16 Applications in digital storytelling in different areas 57
Table 2.17 Trends of digital storytelling in online museums from 2000 to 2010) 65
Table 2.18 Trends of digital storytelling in online museums from 2010 to 2016 66
Table 2.19 List of digital storytelling guidelines from eight experts 67
Table 2.20 The seven elements of digital storytelling (Lambert, 2006) 69
Table 2.21 Five elements of digital storytelling (Paul and Fiebich, 2005) 70
Table 2.22 Take six: Elements (Porter, 2004) 70
Table 2.23 Six elements of digital storytelling (Salpeter, 2005) 71
Table 2.24 Story elements (Ohler, 2008) 72
Table 2.25 Expanded and modified digital storytelling elements (Robin, 2008) 72
Table 2.26 Models for digital storytelling and interactive narratives (Schafer, 2008) 73
Table 2.27 A 10-step development checklist for creating an interactive project (Miller,
2012)
74
Table 2.28 Definition of ‘Inclusive digital storytelling’ 77
Table 3.1 Research strategies adopted for this PhD research 87
Table 3.2 Comparisons of research methodologies in three areas 88
Table 3.3 Comparison between design research methodologies 95
Table 3.4 Review-based and comprehensive in this thesis 98
Table 3.5 design research methodology (DRM) in this study 111
Table 4.1 Aim and objectives of the study 113
Table 4.2 Bangkok population calculated for sample size of 90% confidence 115

xv
Table 4.3 Total population in this study 116
Table 4.4 Skip interval for five groups 117
Table 4.5 Barriers and drivers collected from literature review 117
Table 4.6 Demographic results from five groups (500 respondents) 121
Table 4.7 Mean scores of barriers in cultural tourism for five groups 124
Table 4.8 Mean scores of drivers in cultural tourism for five groups 126
Table 4.9 Mean scores for barriers and drivers in the top five to cultural tourism
among five groups
130
Table 4.10 Open-ended answers for barriers to cultural tourism among five groups 132
Table 4.11 Open-ended answers for drivers to cultural tourism among five groups--
open-ended responses
136
Table 5.1 Aim and objective of the chapter 148
Table 5.2 Lists of digital storytelling guidelines from eight experts 151
Table 5.3 The new digital storytelling guidelines composed from the work of eight
digital storytelling experts
154
Table 5.4 17 expert profiles in digital storytelling who are interviewed 156
Table 5.5 All 11 interview questions for experts 157
Table 5.6 Digital Storytelling Guidelines for Cultural Tourism from 17 Experts and
the number of people who made them in [ ]
158
Table 5.7 The new digital storytelling guidelines composed of eight digital
storytelling experts
172
Table 6.1 Aim and objectives of the study 180
Table 6.2 Definition of ‘Inclusive digital storytelling’ 182
Table 6.3 Locations to set up observations for five different groups 183
Table 6.4 11 user journey stages to watch video and animation from IPad 184
Table 6.5 Details of videos and animations on YouTube presented to participants 186
Table 6.6 Demographic information for all five groups 187
Table 6.7 Percentage of participants who can complete the task and their and
average time (seconds)
189
Table 6.8 Negative comments during all stages from all participants and the number,
of people who made them
191
Table 6.9 Positive comments during all stages from all participants, and the number
of people who made them
192
Table 6.10 Negative and positive comments during stage 1 from all participants 194
Table 6.11 Negative and positive comments during stage 2 from all participants 196
Table 6.12 Negative and positive comments during stage 3 from all participants 197
Table 6.13 Negative and positive comments during stage 4 from all participants 198
Table 6.14 Negative and positive comments during stage 5 from all participants 200
Table 6.15 Negative and positive comments during stage 6 from all participants 201
Table 6.16 Negative and positive comments during stage 7 from all participants 202

xvi
Table 6.17 Negative and positive comments during stage 8 from all participants 203
Table 6.18 Negative and positive comments during stage 9 from all participants 204
Table 6.19 Negative and positive comments during stage 10 from all participants 205
Table 6.20 Negative and positive comments during stage 11 from all participants 206
Table 6.21 Percentage and average time of all participants who can complete all
tasks
214
Table 6.22 Usefulness from all participants 214
Table 6.23 Usability problems from all participants 215
Table 6.24 Values and benefits of use from all participants 216
Table 6.25 Summary of reaching and engaging with digital storytelling from all five
groups
217
Table 7.1 Aim and objectives of the study 225
Table 7.2 Research questions of this study related to objectives 225
Table 7.3 Three empirical studies in this framework 226
Table 7.5 Four groups of participants in this study 231
Table 7.6 Definition of Kirkpatrick evaluation model 233
Table 7.7 Time to read and complete the survey from participants in the pilot test
stage (minutes)
233
Table 7.8 Improved questions after pilot tests 234
Table 7.9 Questionnaire structure 235
Table 7.10 Demographic results from four groups (123 respondents) 236
Table 7.11 Results in ‘reaction’ from four groups 238
Table 7.12 Results in ‘learning’ from the four groups 240
Table 7.13 Results in ‘behaviour’ for the four groups 241
Table 7.14 Results in ‘results’ for the four groups 243
Table 7.15 Results in ‘desirability’ for the four groups 245
Table 7.16 Open-ended answers from the four groups 247
Table 7.17 Open-ended answers from four groups 248
Table 7.18 Open-ended answers from four groups 249
Table 7.19 Open-ended answers from four groups 250
Table. 7.20 Total mean for usability test for the four groups 252
Table. 7.21 Total mean for desirability test for the four groups 253
Table 7.22 A one-way ANOVA to compare for significant differences between means
for the four groups
254
Table 7.23 Results from a Scheffe post hoc test 254
Table 7.24 Open-ended answers about changes and additions for the IDST for CT
framework
255
Table 7.25 Open-ended answers about like and dislike for the IDST for CT framework 256
Table 8.1 Research objectives for this thesis 264
Table 8.2 Three empirical studies in this thesis 267

xvii
Table 8.3 Summary of reaching and engaging with digital storytelling from all five
groups
273
Table.8.4 Total mean from five factors for four groups 274
Table 8.5 Limitations in the four empirical studies 285
Table 8.6 Three empirical studies in this thesis 290

xviii
Lists of appendices
Appendix A1 Research ethics Barriers and Drivers in Cultural Tourism for Five Groups in Thailand – mentioned in Chapter 4
312
Appendix A2 Research ethics Constructing the Digital Storytelling: Guideline to Increase Motivation in Cultural Tourism for Five Groups in Thailand – mentioned in Chapter 5
313
Appendix A3 Research ethics Inclusive digital storytelling to understand audiences’ behaviour – mentioned in Chapter 6
314
Appendix A4 Research ethics Evaluation of an Inclusive Digital Storytelling for Cultural Tourism (IDST for CT) Framework – mentioned in Chapter 7
315
Appendix B1 Questionnaire – mentioned in Chapter 4 316
Appendix B2 Interview questions – mentioned in Chapter 5 323
Appendix B3 Observation Schedule – mentioned in Chapter 6 327
Appendix B4 Online questionnaire – mentioned in Chapter 7 332
Appendix C1 Applications of cultural tourism – mentioned in Chapter 2 339
Appendix C2 Applications of inclusive design in economy, industry and media –
mentioned in Chapter 2
340
Appendix C3 Trends in digital storytelling for cultural tourism – mentioned in
Chapter 2
344

1
Chapter 1: Introduction
1.1 Overview and research motivation
1.1.1 Research problems
Lack of diversity
Lack of motivation
The situation of cultural tourism in Thailand
1.1.2 Research opportunities
Increasing diversity in cultural tourism – inclusive design (ID)
Increasing motivation in cultural tourism – digital storytelling (DST)
Combining inclusive design and digital storytelling – a framework for inclusive digital storytelling for cultural tourism in Thailand
1.2 Research question
How could inclusive design and digital storytelling principles be applied to facilitate cultural
tourism in Thailand?
1.3 Scope of this PhD research
Five groups of Thai people as main participants
Limited use in Thailand
Four groups of end users of this framework
Scope of digital storytelling in this PhD research
Scope of inclusive design in this PhD research
1.4 Aim and objectives
1.5 Thesis structure

2
1.1 Overview and research motivation The term ‘cultural tourism’ refers to ‘movements of persons for essentially cultural
motivations, such as study tours, performing arts and cultural tours, travel to festivals
and other cultural events and visits to sites and monuments’ (UNWTO 2008). In a
world troubled by conflicts based on misunderstandings, cultural tourism can help
improve understanding among different groups and strengthen cultural harmony.
However, there are many issues in various areas of cultural tourism, including
diversity, motivation, management and funding, marketing and branding, and personal experience.
1.1.1 Research problems
• Lack of diversity Several studies state that one of the important problems is a lack of diversity among cultural tourists (Keogh, 1990; Silberberg, 1995; O'Leary, Morrison, and Alzua, 1998; Lord, 1999; McKercher, 2002; UNESCO, 2003; Martin et al., 2004; Chantachon, 2006; Nasing, Rodhetbhai and Keeratiburana, 2014). Consequently, the tourism industry has tended to focus on tourists who are already interested in cultural tourism (Silberberg, 1995; Lord, 1999; UNESCO, 2003).
This problem could lead to several issues; Firstly, if there are less cultural visitors,
then the economy in the local area will not develop (Madden 2001; Stoddard et al.,
2006; Kay, Wong and Polonsky, 2009; Chou, 2013; Webster and Ivanov, 2014;
Mowforth and Munt, 2015). Subsequently, less tourists can lead to lower social
engagement in people (Howard, 2001; Hill, 2004; Upright, 2004; Kay, Wong and
Polonsky, 2009; Kim, Uysal and Sirgy, 2013; Lee, 2013). Furthermore, a lower level
of visitors could result in a reduction of financial support from the government and
industry (Brooks, 2003; Lewis and Brooks, 2005; Kim et al., 2007; Kay, Wong and
Polonsky, 2009).
• Lack of motivation At cultural sites, visitors have little motivation to read the story displayed behind the
exhibitions and to visit real places (Rizvic et al., 2012). Moreover, the reason why
tourists do not have the motivation to visit is that they do not understand, appreciate,
entertain and enjoy stories in cultural tourism (Schouten, 1995; Timothy, 1997; Moscardo, 2000; Halewood and Hannam, 2001; NHB, 2005; Boukas, 2008).
• The situation of cultural tourism in Thailand

3
Cultural tourism is considered a significant feature of the Thai society and a major
contributor to Thai economy. It could be applied to develop the local economy and to
develop the identity of many cities and locations. However, currently, a lack of
conservation and Thai visitors have been the main problems for cultural tourism in
Thailand. Moreover, at cultural sites (i.e. temples, museums, historical places), there
are a number of international tourists more than Thai tourists. This is because Thai
people, especially young people consider cultural tourism as old fashioned, not
interesting and not trendy. They want to spend their holiday in department stores
rather than going to museums. Many studies recommend that the tourism industry
and the government should attract new local visitors and motivate them to visit
cultural sites (Chaisorn, 1993; Hiranyahat, 2001; Buarapa, 2006; Pakpinpet, 2008).
Furthermore, to increase the number of Thai tourists and their motivation, a unique
selling point for each place should be chosen, and consideration should be given to what the Thai tourists really need (Chantachon, 2006).
1.1.2 Research opportunities
These problems highlight a good opportunity to further facilitate cultural tourism by
increasing visitors’ diversity and motivation.
• Increasing diversity in cultural tourism – inclusive design (ID) To broaden and increase the potential market, this PhD research draws upon
inclusive design principles which is applied as ‘understanding and designing for
diversity’. Inclusive design aims to make products and services accessible to the
widest range of users possible, irrespective of impairment, age, or capability. In
addition, it has been used to investigate, understand, and meet the needs of the
people (The British Standards Institute, 2005; Langdon, Persad and Clarkson, 2010).
• Increasing motivation in cultural tourism – digital storytelling (DST) To increase tourists’ motivation, this PhD research adopts digital storytelling, which
is widely used to explain all types of stories, narratives, films, and novels in the
design process of digital systems (Miller, 2012; Ryan, 2008; Schafer, 2008; Ohler,
2013; Cunsolo et al., 2013). In applying digital storytelling, a variety of techniques,
such as plots, characters, conflict, humour, and competition are used to promote and

4
advertise; however, this is not hard-sell advertising (Miller, 2012; Alcantud et al., 2014; Wexler et al., 2014).
Additionally, many cultural and heritage sites around the world have been widely
digitised as virtual museums or use applications with digital storytelling, making
difficult stories or subjects seem more alive and connected to viewers (Tolva and Martin, 2004; Hein, 2014; Cunsolo et al., 2013).
At present, several local communities in Thailand have adopted cultural tourism to
develop their own economies and increase income by attracting more visitors
through storytelling (Meekaew and Srisontisuk, 2012). Thailand, in particular, has so
many stories, folk tales, arts, traditions, and festivals that could be used as unique
selling points to attract cultural tourists (George 2005; Meekaew and Srisontisuk 2012).
• Combining inclusive design and digital storytelling – a framework for inclusive digital storytelling for cultural tourism in Thailand
An initial inclusive digital storytelling (IDST) for cultural tourism (CT) framework was
constructed through the literature review and analysis in Chapter 2 to identify
relationships, problems, and opportunities between the following three main factors:
1.) Lack of diversity (ID and CT) – by researching barriers and drivers to engaging in
cultural tourism among five different Thai groups.
2.) Lack of motivation (DST and CT) – by creating guidelines for digital storytelling to
motivate five Thai groups to engage in cultural tourism.
3.) Lack of understanding of the user’s behaviour while engaging with digital
storytelling (ID and DST) – by understanding user behaviour in five Thai groups.
Subsequently, the initial IDST for CT framework was populated and further detailed
through three empirical studies in Chapters 4, 5 and 6, respectively addressing items
No 1, 2, and 3 above.
1.2 Research question
This chapter illustrates research problems and opportunities in cultural tourism by
applying inclusive design to increase diversity, and using digital storytelling to
increase motivation in cultural tourism for Thai visitors. This PhD research sets up
the research question and success criteria as listed below:

5
• Research question: How could inclusive design and digital storytelling
principles be applied to facilitate cultural tourism in Thailand? • Success criteria: Creating an inclusive digital storytelling for cultural tourism
(IDST for CT) framework supported by empirical data from four studies that
provides the tourism industry and researchers with an understanding of the
trends of cultural tourism and preparing them to face new challenges by applying digital storytelling and inclusive design.
1.3 Scope of this PhD research
• Five groups of Thai people as main participants This PhD research focuses on five groups of people in Bangkok, Thailand as the main participants:
1.) Youth (fifteen to twenty-four years old): Many tourism industries ignore this group,
since they assume that cultural tourism is only for mature people, not for the younger
generation (NHB, 2005). However, The Scottish Executive also states that young tourists are
a very important target group for cultural tourism, since this group will be the future adult
cultural tourists. Therefore, the tourism industry, and the government, should know their
demographic profiles, barriers, drivers and behaviours, in order to predict the future trends in
cultural tourism (Executive, 2001).
2.) People with disabilities: Ozturk, Yayli and Yesiltas (2008) suggest that this group is
significant and they are very loyal customers. They tend to come back to the places that are
suitable for their accessibility. Therefore, opening up this tourism market can result in a
higher income for the tourism industry (Arellano, 2003).
3.) Older adults (over sixty years old): This is because the average age of the world
population is increasing, whilst people are also living longer, and are becoming healthier and
wealthier (Magnus, 2009; D’Hudson and Saling, 2010). Moreover, this group has a lot of free
time and money to spend on services and facilities.
4.) Established cultural tourists: The criteria to identify cultural tourists depended on
how many cultural trips they make annually. If more than four trips are made per
year, a tourist could be classified as cultural tourist (Mandala Research, LLC, 2013).
5.) People uninterested in cultural tourism (i.e. non-cultural tourists): Some
researchers explain that non-cultural tourists are very difficult to specify, and have no criteria

6
by which to identify them, compared to people who are interested in cultural tourism
(Bennett, 1994; Milner, et al., 2004; Kay, Wong and Polonsky, 2009). Therefore, this study
includes non-cultural tourists as a potential group for cultural tourism.
• Focus on Urban Thailand and Thai tourists (national tourism) Two studies (Chapter 4 – barriers and drivers, and Chapter 6 – inclusive digital
storytelling to understand audiences’ behaviour) were set up in the city of Bangkok in
Thailand. One study (Chapter 5 – a set of digital storytelling guidelines) focused on
Thai audiences only. Thus, the findings of this PhD research are mainly focused on
Thai visitors and one urban area within Thailand and may not be representative or
applicable to other regions.
• Four groups of end users of this framework
In Chapter 7 as the evaluation stage, the fourth study was set up using online
questionnaires to collect quantitative data from the potential end-users of the IDST
for CT framework. This PhD research targets students and four groups of experts
from both academia and industry; these are experts in the following fields: 1.) Thai
cultural tourism; 2.) Thai inclusive design; 3.) Thai digital storytelling, and 4.)
international inclusive design, digital storytelling and cultural tourism.
• Scope of digital storytelling in this PhD research
The term ‘digital storytelling’ is too broad. It could be applied to a range of media (i.e.
computers, mobile devices, electronic kiosks), formats (websites, applications, online
games), areas (education, games, museums, entertainment, journalism), and
systems (interactive and non-interactive systems). Thus, this thesis focuses on
creating the non-interactive digital storytelling guidelines to motivate five groups in Thailand to engage in cultural tourism. The key issue for such
guidelines is to create good stories and content that can be created by everyone, not just professionals, and used on many technology platforms in the future.
• Scope of inclusive design principles in this PhD research
This PhD research adopts an Inclusive design strategy (Waller et al., 2015) as ‘understanding diversity’ to include a wide range of potential tourists in cultural
tourism and ‘designing for diversity’ to offer guidelines and results from three
empirical studies and to present the final framework to increase diversity and
motivation in cultural tourism.

7
1.4 Aim and objectives
This PhD research aims to create, develop and evaluate a framework for inclusive
digital storytelling to increase diversity and motivation for cultural tourism in Thailand. The research objectives are as follows:
1. To provide a better understanding of the current situation and relevant
applications for three main areas: 1) cultural tourism, 2) inclusive design and 3)
digital storytelling (Chapter 2).
2. To create an initial inclusive digital storytelling for cultural tourism framework (Chapter 2).
3. To develop and detail an initial inclusive digital storytelling for cultural tourism framework from three empirical studies (Chapters 4,5,6).
4. To evaluate the usability and desirability of the inclusive digital storytelling for
cultural tourism framework that embodies the findings from three empirical studies (Chapter 7).
1.5 PhD research structure
The eight chapters in this PhD research are summarised as follows:
Chapter 1: Introduction
This chapter will illustrate the overview and motivation for this PhD research, scope of research, aims and objectives and structure.
Chapter 2: Literature analysis and synthesis
This chapter will provide a better understanding of the current situation and
applications of the three main fields of study in tis PhD research; 1) cultural tourism,
2) inclusive design and 3) digital storytelling. An initial framework is outlined based
on identifying, reviewing and analysing these three main areas.
Chapter 3: Research methodology

8
This chapter will present the planned research strategies, methodology and methods
that will be used throughout this PhD research. The Design Research Methodology
(DRM) is presented in four stages: research clarification to identify the problems and
present the research question; descriptive study 1 (DS-1) to review and analyse
three factors; prescriptive study (PS) to develop and detail the initial framework by
using empirical data from three studies; and descriptive study 2 (DS-2) to evaluate the final framework.
Chapter 4: Barriers and drivers in cultural tourism for five groups in Thailand
This chapter will illustrate the relationship between inclusive design and cultural
tourism to broaden and increase the potential market. 500 questionnaires are
designed, conducted and analysed, aiming to identify barriers and drivers in cultural tourism in Thailand, for five diverse groups of Thai people.
Chapter 5: Constructing digital storytelling: guidelines to increase motivation in cultural tourism for five groups in Thailand
This chapter will present the link between digital storytelling and cultural tourism to
increase the motivation of potential visitors. 17 expert interviews are designed,
conducted and analysed, aiming to create and propose digital storytelling guidelines
to motivate five diverse groups of Thai people in Thailand to engage in cultural tourism.
Chapter 6: Inclusive digital storytelling to understand audiences’ behaviour
This chapter will explore the link between inclusive design and digital storytelling. 50
observation sessions are designed, conducted and analysed, aiming to understand
the behaviour of five diverse groups of Thai audience, in terms of reaching
(accessibility and understanding) and engaging with (usefulness, usability, desire) digital storytelling on digital mobile devices.
Chapter 7: Evaluation of the inclusive digital storytelling for cultural tourism framework (IDST for CT)
In the previous chapters, three studies were carried out to detail the framework using
three research methods (500 questionnaires, 17 interviews and 50 observations).

9
This chapter will evaluate the IDST for CT framework based on five factors: ‘reaction’, ‘learning’, ‘behaviour’, ‘results’, and ‘desirability’.
Chapter 8: Conclusion and further work
This chapter will discuss and summarise the findings of this PhD research by
presenting research objectives, contribution to knowledge, limitations and further
work.

10
Figure 1.1: PhD research structure
Chapter 1Introduction
Chapter 2Literature analysis and synthesis
Chapter 3Research methodology
Chapter 4Barriers and drivers in cultural tourism for five groups in
Thailand
Chapter 5Constructing the digital storytelling: guideline to increase motivation in cultural tourism for five groups in Thailand
Chapter 6Inclusive digital storytelling to understand audiences’
behaviour
Chapter 7Evaluation of the inclusive digital storytelling for cultural
tourism framework
Chapter 8Conclusion and further work
To detail the initial framework by collecting three empirical data
The initial framework is constructed
The framework is evaluated

11
Chapter 2: Literature analysis and synthesis 2.1 Introduction 2.2 Cultural Tourism
2.2.1 Types of tourism 2.2.2 The landscape of cultural tourism 2.2.3 The importance, relevance and applications of cultural tourism 2.2.4 Cultural tourism in Thailand
2.3 Challenges and opportunities in Cultural Tourism
2.3.1 Cultural Tourism - issues and potentials 2.3.2 Increasing diversity in Cultural Tourism 2.3.3 Why ‘inclusive design’ for cultural tourism? 2.3.4 Opportunities for inclusive design within cultural tourism 2.3.5 Increasing motivation in Cultural Tourism 2.3.6 Why digital storytelling for cultural tourism? 2.3.7 Opportunities for digital storytelling within cultural tourism
2.4 Inclusive design - increasing diversity:
2.4.1 Definition of inclusive design 2.4.2 History and background of inclusive design 2.4.3 Inclusive Design, Universal Design, and Design for All 2.4.4 Applications of inclusive design 2.4.5 Inclusive Tourism 2.4.6 Principles of inclusive design
2.5 Digital storytelling - increasing motivation:
2.5.1 Definition of digital storytelling 2.5.2 History and background of digital storytelling 2.5.3 Applications of digital storytelling 2.5.4 Digital storytelling in cultural tourism from 2000-2010 and 2010-2016 2.5.5 Trends in digital storytelling for cultural tourism from 2000-2010 and 2010-2016 2.5.8 Digital storytelling guidelines
2.6 Inclusive Digital Storytelling for Cultural Tourism – a first combined approach
2.6.1 Why digital storytelling for inclusive design 2.6.2 Opportunities for digital storytelling and inclusive design: 2.6.3 Challenges of inclusive digital storytelling in this study
2.7 Synthesis of the initial framework
2.8 Summary

12
2.1 Introduction
This chapter integrates the principles of cultural tourism, inclusive design, and digital
storytelling. It aims to explore, illustrate, and suggest links between these factors in
order to position the research question: “How could inclusive design and digital
storytelling principles be applied to facilitate cultural tourism in Thailand?” The
literature review, analysis, and synthesis will provide information to explore and support this question.
Initially, this chapter will review the literature in three key areas: cultural tourism,
inclusive design, and digital storytelling. Next, it will present the links and possibilities
of using digital storytelling applied with inclusive design to serve cultural tourism, and discuss existing situations in terms of problems, gaps, and opportunities.
The first link between inclusive design and cultural tourism advocates the increase of
diversity by researching barriers and drivers in cultural tourism among different
potential tourist groups. It demonstrates how the industry and government
organisations may be better able to recognise the significance of neglected groups
and increase accessibility and inclusivity for these people. Such new perspective
requires inclusive design, conceived as understanding and designing for diversity. In
addition, tourists have a wide variety of needs, including the barriers and drivers for
engaging in cultural tourism. In order to design effective promotion, marketing and
awareness strategies, marketers and other stakeholders involved must be aware of these barriers and aim to address them.
The second link between digital storytelling and cultural tourism advocates
increasing motivation. In applying digital storytelling, a variety of techniques that are
not hard-sell advertising, such as plots, characters, conflict, humour, and competition, are used to promote and advertise.
The third link between inclusive design and digital storytelling advocates adoption of
inclusive design principles in this technological field in order to understand users’
needs, which can thereby inform the industry, designers, and researchers, and help to create a system that supports all users.
The chapter aims to achieve the following outcomes: 1) explore and offer a review of
three key areas; 2) illustrate the links between the three areas in terms of problems,

13
gaps, and opportunities; 3) present the initial framework for inclusive digital storytelling to increase diversity and motivation for cultural tourism in Thailand.
2.2 Cultural tourism
2.2.1 Types of tourism
In general, tourism includes both mass and alternative tourism. Mass tourism is
identified as large numbers of people seeking their holidays in popular resort
attractions. In contrast, alternative tourism is defined as ‘special interest tourism’ or
‘responsible tourism’ and involves alternative forms of tourism, with emphasis on
understanding residents’ way of living and the local natural environment (Smith and
Eadington, 1992).
Alternative tourism can be defined as “forms of tourism that are made to be friendly
to the environment and to respect social and cultural values of the communities, and
which allow both hosts and guests to enjoy positive and worthwhile interaction and
shared experiences” (Wearing and Neil, 2000, p. 38). Cater et al. (1994) describe
alternative tourism as comprising small scale, locally owned activities. They explain
that this contrasts with mass tourism, which is often characterised by large-scale
multinational concerns and repatriates the profits to offshore countries (Cater et al.,
1994). The characteristics of alternative tourism include its friendly environmental
and social impacts, in addition to its commitment to developing the local economy
and agriculture. Finally, alternative tourism supports the involvement of local
residents and sees them as central to the tourism development process (Smith and
Eadington, 1992; Wearing and Neil, 2000).

14
Figure 2.1 Types of tourism (Mieczkowski, 1995, p. 459)
2.2.2 The landscape of cultural tourism
The definition of cultural tourism
The definitions that were reviewed were collected from:
• Dictionary: 'Dictionary of Travel, Tourism and Hospitality Terms (Medilk,
2002)
• Journal papers (more than 100 citations): (Craik, 1995; Silberberg, 1995;
Stebbins, 1996; Lord, 1999; Prentice, 2001; Smith, 2009)
• Organisations and Institutes: ICOMOS: International Scientific Committee
on Cultural Tourism (ICOMOS, 1976); (International Scientific Committee on
Cultural Tourism (ICOMOS, 1997): ATLAS Cultural Tourism Research Project
(ATLAS, 2009); The United Nations World Travel Organisation (UNWTO,
2008)

15
Table 2.1 Definitions of cultural tourism from several sources
No. Source Definitions and references Keywords
1. Dictionary “Cultural tourism: General term referring to leisure
travel motivated by one or more aspects of the culture
of a particular area.”
('Dictionary of Travel, Tourism and Hospitality Terms',
Medilk, 2002)
- Travel
- Motivated
- The culture
2. Journal
papers
“Visits by persons from outside the host community
motivated wholly or in part by interest in the historical,
artistic, scientific or lifestyle/heritage offerings of a
community, region, group or institution” (Silberberg,
1995, p.361)
- Visits by persons
- Outside the host
- Community
- Motivated
-The history
“Cultural tourism is a genre of special interest tourism
based on the search for and participation in new and
deep cultural experiences, whether aesthetic,
intellectual, emotional, or psychological.” (Stebbins,
1996, p. 338)
-Special interest tourism
-Cultural experiences
“As tourism constructed, proffered and consumed
explicitly or implicitly as cultural appreciation, either as
experiences or schematic knowledge gaining”
(Prentice, 2001, p. 8)
- Cultural appreciation
-Experiences or
schematic knowledge
gaining
“…tourism is a culture industry in the sense that it
markets cultural products to tourists as cultural
experiences”
(Craik, 1995, p.87)
- A culture industry
- Cultural experiences”
3. Organizati
ons and
Institutes
“Cultural tourism is that form of tourism whose object
is, among other aims, the discovery of monuments and
sites. It exerts on these last a very positive effect
insofar as it contributes - to satisfy its own ends - to
their maintenance and protection. This form of tourism
justifies in fact the efforts which said maintenance and
protection demand of the human community because
of the socio-cultural and economic benefits which they
bestow on all the populations concerned.” (ICOMOS,
1976)
-The discovery of
monuments and sites
-Maintenance and
protection demand of
the human community
“Cultural tourism can be defined as that activity which -Activity which enables

16
enables people to experience the different ways of life
of other people, thereby gaining at first hand an
understanding of their customs, traditions, the physical
environment, the intellectual ideas and those places of
architectural, historic, archaeological or other cultural
significance which remain from earlier times. Cultural
tourism differs from recreational tourism in that it seeks
to gain an understanding or appreciation of the nature
of the place being visited.” (ICOMOS Charter for
Cultural Tourism, 1997).
people to experience the
different ways of life
-An understanding of
their custom
-Appreciation of the
nature of the place
being visited.”
Conceptual Definition
• “The movement of persons to cultural
attractions away from their normal place of
residence, with the intention to gather new
information and experiences to satisfy their
cultural needs”.
Technical Definition
• “All movements of persons to specific cultural
attractions, such as heritage sites, artistic and
cultural manifestations, arts and drama outside
their normal place of residence”. (ATLAS,
2009)
-The movement of
persons
-Cultural attractions
-New information and
experiences to satisfy
their cultural needs
-All movements of
persons
- Cultural attractions
(Broad definition)
• “All movements of persons might be included
in the definition because they satisfy the
human need for diversity, tending to raise the
cultural level of the individual and giving rise
to new knowledge, experience and
encounters.
(Narrow definition)
• “Movements of persons for essentially cultural
motivations such as study tours, performing
arts and cultural tours, travel to festivals and
other cultural events, visits to sites and
monuments.” (UNWTO: The United Nations
World Travel Organization”, 2008)
-All movements of
persons
-To raise the cultural
level
-New knowledge,
experience and
encounters.
- Movements of persons
-Cultural motivations

17
The similarities between all presented cultural tourism definitions could be grouped. A few commonalities are listed on the table 2.2.
Table 2.2 Keywords in cultural tourism with similarities from many sources
No. Keywords References
1. Movement of persons • Movements of persons (Narrow definition) (UNWTO,
2008)
• All movements of persons (Broad definition)
(UNWTO, 2008)
• The movement of persons (ATLAS, 2009)
• Visits by persons (Silberberg, 1995, p.361)
2. Motivation • Motivated ('Dictionary of Travel, Tourism and
Hospitality Terms', Medilk, 2002)
• Motivated (Silberberg, 1995, p.361)
• Cultural motivation (UNWTO, 2008)
3. Culture • The culture ('Dictionary of Travel, Tourism and
Hospitality Terms', Medilk, 2002)
• Cultural appreciation (Prentice, 2001, p. 8)
• To raise the cultural level (UNWTO, 2008)
4. Experience
• Cultural experience (Stebbins, 1996, p. 338)
• Experiences or schematic knowledge gaining
(Prentice, 2001, p. 8)
• Cultural experience (Craik, 1995, p.87)
• Activity which enables people to experience the
different ways of life (ICOMOS Charter for Cultural
Tourism, 1997).
• -New knowledge, experience and encounters
(UNWTO, 2008)
• -New information and experiences to satisfy their
cultural needs (ATLAS, 2009)
5. Understanding • An understanding of their custom (ICOMOS Charter
for Cultural Tourism, 1997)
6. Cultural destinations • Cultural attractions (ATLAS, 2009)
• The discovery of monuments and sites (ICOMOS,
1976)
• The historical (Silberberg, 1995, p.361)

18
After reviewing a wide range of definitions from many sources and grouping
keywords with similarities, this study has selected the following definition that covers all keywords (culture, experience, persons or people, motivation, history, movement):
“Movements of persons for essentially cultural motivations such as study tours,
performing arts and cultural tours, travel to festivals and other cultural events, visits
to sites and monuments” (UNWTO, 2008).
2.2.3 The importance, relevance and applications of cultural tourism
A number of studies illustrate that cultural tourism is important for various reasons.
To clarify this statement, several general and current trends influencing the market
for cultural tourism and its future are presented below. This section aims to identify
the positive effects and importance of cultural tourism that may be applied to
inclusive design and digital storytelling areas with similar contexts. Table 2.3
illustrates the importance of cultural tourism both generally and currently. In addition,
the key insights demonstrated below present several gaps, problems, and
opportunities in cultural tourism.
Table 2.3 The positive effects and importance of cultural tourism
General importance of cultural tourism
Current importance of cultural tourism
Economic development or regeneration (Bianchini 1990; Herrero et al., 2006; Myerscough, 1988; Richards, 2007). Economic and social impact to increase local production and employment (UNESCO, 2003) Establishment and reinforcement of an identity (UNESCO, 2003)
Preservation of the cultural and historical heritage (UNESCO, 2003) Increased quality of tourism (Holcomb, 1999; Kapodini-Dimitradi, 1999)
Changing trend from escapism to enrichment (Lord, 1999; OECD, 2009)
Intensification of terrorist attacks: decreased tourisms in mass events (Smeral, 2003) Higher levels of education (Berki, 2004) Increasing in ageing population (Lord, 1999; Silberberg,1995; UNESCO, 2003) Increasing economic role of women (Lord, 1999; UNESCO, 2003) Increasing numbers of gen-x tourists (Lord, 1999; UNESCO, 2003) Increasing use of the internet and technology (Buhalis and Licata, 2002; Buhalis and Zoge, 2007; Hall and Williams, 2008; Hjalager, 2002; Lord, 1999; Longhi, 2009; UNESCO, 2003)

19
The ‘Baltic Cultural Tourism Policy’ study (UNESCO, 2003) states that currently, the
world is troubled by conflicts based on misunderstandings, but cultural tourism can
create more in-depth understanding among people and promote cultural harmony.
This implies that cultural tourism does not only serve to promote tourism, preserve
cultural and historical heritage, and reinforce a city’s identity, but also to promote
communication and integration worldwide. Hence, cultural tourism should be
combined with digital storytelling and adapted with inclusive design to extend itself to
as many target groups as possible.
However, the results of low-tourist visits in cultural destinations could lead to several
issues. Firstly, cultural places are significant for the local economy. If there are less
cultural tourists, then the economy in the local area will not develop (Madden, 2001;
Stoddard, et al., 2006; Kay, Wong and Polonsky, 2009; Chou, 2013; Webster and
Ivanov, 2014; Mowforth and Munt, 2015). Secondly, heritage and cultural attractions
can enhance community engagement in each area. Lower visitor numbers can lead
to less social engagement of people (Howard, 2001; Hill, 2004; Upright, 2004; Kay,
Wong and Polonsky, 2009; Kim, Uysal and Sirgy, 2013; Lee, 2013). Thirdly, most
cultural places are funded by the government to provide value for the widest range of
visitors. Low visitor numbers could result in a reduction of the budget or financial
support from the public (Brooks, 2003; Lewis and Brooks, 2005; Kim, et al., 2007;
Kay, Wong and Polonsky, 2009).
In summary, cultural tourism can bring economic development or regeneration
(Bianchini, 1990; Herrero et al., 2005; Myerscough, 1988; Richards, 2007), generate
economic and social impact (UNESCO, 2003), establish and reinforce an identity
(UNESCO, 2003), preserve cultural and historical heritage (UNESCO, 2003), and
increase the quality of tourism (Holcomb, 1999; Kapodini-Dimitradi, 1999). Cultural
tourism is more in line with current trends, given the intensification of terrorist attacks
(Smeral, 2003), the increase in the education level (Berki, 2004) and ageing
population (Lord, 1999; Silberberg,1995), the growing economic role of women and
gen-X tourists (Lord, 1999), and the increasing use of the internet and technology
(Buhalis and Licata, 2002; Buhalis and Zoge, 2007; Hall and Williams, 2008;
Hjalager, 2002; Longhi, 2009; Lord, 1999). These factors provide new opportunities

20
for the tourism industry and for research that applies digital storytelling and inclusive
design.
Applications of cultural tourism
Following the globalisation trend, the applications of both conventional tourism and
cultural tourism will shape and influence various areas (UNESCO, 2003). Table 2.4
summarises the applications of cultural tourism from various studies in six areas,
including innovation and technology, economics, politics, environment, demographics, and society.
Table 2.4 Applications of cultural tourism Applications
Details
1. Innovation and technology
- Three-dimensional (3D) virtual tours (Cho and Fesenmaier, 2001) - 3D interactive websites (Fiore, Kim and Lee, 2005) - Digital maps (Raggam and Almer, 2005) - Virtual characters in real time for tourists (Abad, Sorzabal and Linaza, 2005) - Telepresence (Steuer, 1992) - Ambient Intelligence (AI; Manes, 2003) - Information and communication technologies (Buhalis, 2003) - Transportation (Stern, 2006)
2. Economics
- Globalisation (Third World Network, 2001) - Rising income (Crouch, 1994) - Deregulation/liberalisation (Dwyer et al., 2008) - Rising trade and investment (Dwyer et al., 2008) - Diffusion of information technology (Dwyer et al., 2008)
3. Politics - International power (NIC, 2004) - Security (NIC, 2004) - Peace, safety, security, and political stability (Cavlek, 2002; Dwyer et al., 2008) - Regional and ethnic conflicts (Dwyer et al., 2008; NIC, 2004). - Networks (Chamber of Regions, 2009) - To stimulate investment by private individuals (Chamber of Regions, 2009) - Support ICTs (Chamber of Regions, 2009)
4. Environment
- Climate change (Dwyer et al., 2008) - Natural resource depletion (Dwyer et al., 2008) - Fossil fuel-based energy sources (Dwyer et al., 2008) Loss of biodiversity (UNEP, 2003)
5. Demographics
- Population and ageing (Cetron, 2001) - Urbanisation (United Nations, 2005; UNWTO, 2002) - Changing social structures (Gerkovich, 2005) - Health (Cetron, 2001; Pollock and Williams, 2000) - Changing work patterns (Gerkovich, 2005) - Gender (Iida, 2005)
6. Society - Money rich – time poor (Willmott and Graham, 2001)

21
- Individualism (Alford, 2005; Education Commission of the United States, 1999) - Seeking a variety of experiences (Elliot and Johns,1993) - Learning (UNWTO, 2002). - Seeking value for money (Nordin, 2005) - Safety conscious (Lepp and Gibson, 2003)
Although the possible applications of cultural tourism are linked to many areas as
listed above, this study focuses only on innovation and technology related to digital
storytelling, and the demographic aspect related to inclusive design.
• Innovation and technology Innovation, the internet, multimedia, and technology have been applied by many
tourism companies and are focused on the tourists. The results provide insights for
tourism managers, and the tourism business has changed to include customer-
oriented technologies (Aldebert, Dang and Longhi, 2011). This technology has
changed the structure of the tourism industry and developed a range of opportunities
and threats. Technology not only helps tourists to purchase tourism services and
products, but also assists globalisation by providing applications for companies to
develop, manage, and distribute their tourism services and products worldwide
(Aldebert, Dang and Longhi, 2011; Buhalis and Law, 2008). Additionally, the latest
innovations offer challenges and opportunities for digital storytelling to apply new
technology, multimedia, websites, and interactive media to promote and present cultural tourism.
• Demographics Cetron (2001) and Smeral (2003) articulate the trend ‘population and ageing’ (i.e.
that senior tourists are a new segment of tourists) will have a significant impact on
the worldwide tourism market, as these older adults have more time and money to
spend on their travel. Moreover, after 2010 the baby boomers will reach retirement
age, going from baby boomers to senior boomers (Cetron, 2001; Smeral, 2003). In
order to compete in the predicted future 350 billion-sized senior market, tourism will
have to offer more four-day journeys. Leisure tourism and/or short time tourism has a
positive future and chances for growth (Opaschowski, 2001). This is surely an
opportunity for inclusive design. From a textbook ‘Design Meets Disability’, Pullin
(2009) predicts the future of inclusive design in ‘age meets business’. This trend

22
means that there will be a number of opportunities for older customers of products
and services that meet their needs.
Moreover, there are many aspects including Urbanisation (include key references),
Changing Social Structures (Gerkovich, 2005), Health (Pollock and Williams, 2000;
Cetron, 2001), Changing work patterns (Gerkovich, 2005) and Gender (Lida, 2005)
in terms of demographics. These are further detailed in Appendix C1.
2.2.4 Cultural tourism in Thailand Cultural tourism is considered a significant feature of the Thai economy and society.
It could be applied to develop the local economy and increase the identity of many
cities. At present, several local communities in Thailand have adopted cultural
tourism to develop their own economies and increase income by attracting more
visitors through storytelling (Meekaew and Srisontisuk, 2012). Thailand, in particular,
has so many stories, folk tales, arts, traditions, and festivals that could be used as
unique selling points to attract cultural tourists (George, 2005; Meekaew and
Srisontisuk, 2012). Moreover, Thailand is very successful in promoting itself as a
cultural country, as illustrated by the number of tourists who visit the country
(George, 2005; Meekaew and Srisontisuk, 2012; Nasing, Rodhetbhai, and
Keeratiburana, 2014).
However, currently, the lack of conservation and visitors has been the main problem
in cultural tourism in Thailand. Furthermore, the architecture, buildings, and
environment at historical sites have been abandoned by local communities (Laomee,
2009; Nasing, Rodhetbhai, and Keeratiburana, 2014). Moreover, at cultural sites (i.e.
temples, museums, historical places), there are a number of international tourists
more than Thai tourists. This is because Thai people, especially young people
consider cultural tourism as old fashioned, not interesting and not trendy. Many
studies recommend that the tourism industry and the government should attract new
visitors and motivate them to visit cultural sites. Moreover, they should increase the
accessibility and improve the environment and conveniences for tourists (Chaisorn,
1993; Hiranyahat, 2001; Buarapa, 2006; Pakpinpet, 2008). Furthermore, to increase
the number of tourists and their motivations, a unique selling point for each place
should be chosen, and consideration should be given to what the tourists really need

23
(Chantachon, 2006). Nasing, Rodhetbhai, and Keeratiburana (2014) point out that
the strength of cultural sites in Thailand is their attractiveness, but the weaknesses
are information services and public conveniences.
Although cultural tourism is the main source of income for Thailand, the study of
cultural tourism from the tourist’s perspective has not been given much attention.
Oftentimes, research studies in this area are not directly related to cultural tourism.
Thus, this study focuses primarily on cultural tourism and investigates the barriers
and drivers in cultural tourism for five diverse groups.
2.3 Challenges and opportunities in Cultural Tourism
2.3.1 Cultural Tourism - issues and potentials
There are a number of issues in various areas of cultural tourism, including diversity,
motivation, management and funding, marketing and branding, and personal
experience, as shown in Table 2.5. Several studies state that one of the important
problems is a lack of diversity among cultural tourists. This means that there are just
a few groups of tourists who are already interested in cultural tourism (Keogh, 1990;
Silberberg, 1995; Aluza, O’Leary and Morrison, 1998; Lord, 1999; McKercher, 2002;
UNESCO, 2003; Martin et al., 2004; Chantachon, 2006; Nasing, Rodhetbhai and
Keeratiburana, 2014). Moreover, this issue can lead to further problems. If there are
few customers, the government is less likely to fund and invest money to redevelop
and maintain cultural sites, and tourism industries will not spend money to advertise
or set up programmes to attract more tourists. If there is no advertising, marketing,
and support from the government and industries, tourists will have little motivation to
visit historical sites. However, some areas (i.e. management or branding) are not the
main focus in design research area. This thesis focuses mainly on two problems in
cultural tourism: lack of diversity and lack of motivation.

24
Table 2.5 Main problems in cultural tourism
Areas Details and research Diversity • Cultural tourism is currently a niche market, receiving little attention compared to
mass tourism (UNESCO, 2003). • The tourism industry tends to focus upon the 15 percent of tourists who are
already interested in cultural tourism (Silberberg, 1995; Lord, 1999). • The U.S. tourism industry overlooks people with disabilities (Ray and Ryder,
2003; Yau, McKercher and Packer, 2004). • New cultural tourists should be attracted. The tourism industry should seek to
engage more segments of society (McKercher, 2002). • The tourism industry should more often aim to use a community-involvement
approach (Keogh, 1990). • Cultural tourism lacks diversity. There are only a few groups of cultural tourists.
Moreover, tourism industries have not identified other groups of potential cultural tourists (O'Leary, Morrison, and Alzua, 1998; Martin et al., 2004).
• There is a lack of community participation in the cultural tourism process (Swain, 1995; Xia, 1999).
• Many teenagers have no understanding and appreciation of cultural places (NHB, 2005).
• There is only one group of cultural tourists: those who are educated, mature, and with a high income (Herbert et al., 1989).
• There are limited numbers of tourists, so what tourists really need should be considered (Chantachon, 2006; Nasing, Rodhetbhai and Keeratiburana, 2014).
Motivation • Many visitors have no motivation to read the information displayed in exhibitions or to visit cultural places (Rizvic et al., 2012).
• If tourists’ interests are taken into consideration, this may lead them to visit, understand, and appreciate cultural sites and museums (Boukas, 2008; NHB, 2005).
• It is very difficult to identify and describe the motivations and needs of tourists with disabilities (Yau, McKercher and Packer, 2004).
• It is unclear how best to attract and motivate people with disabilities to visit cultural places (Allan, 2013).
• Most tourists lack the motivation to visit cultural places. They need enjoyable and entertaining experiences (Schouten, 1995; Moscardo, 2000; Halewood and Hannam, 2001).
• Tourists have no motivation to visit cultural places because they do not understand cultural tourism (Timothy, 1997).
Management and funding
• There is a lack of renovation in heritage sites (Das and Acharjee, 2013). • Scarce funds in heritage sites are significant problem, leading to a lack of visitor
management and inadequate protection of the site (Das and Acharjee, 2013). • There is no cooperation between political entities and cultural sites (Boyd and
Timothy, 2001; Timothy, 1997). • Tourists are not satisfied with the management of cultural places (Reisinger and
Turner, 2003; Chen and Chen, 2010; Yuksel, Yuksel and Yasin, 2010). • Infrastructural facilities in cultural places are often inadequate (Das and
Acharjee, 2013). • The architecture, buildings, and local environment at historic sites have been
abandoned by local communities (Laomee, 2009; Nasing, Rodhetbhai and Keeratiburana 2014).
• The government should increase accessibility and improve the cultural environment and conveniences offered to tourists (Chaisorn, 1993; Hiranyahat, 2001; Buarapa, 2006; Pakpinpet, 2008).

25
Marketing and branding
• Tourists lack loyalty and the willingness to visit cultural places (Oppermann, 2000).
• Most tourists lack brand loyalty in cultural tourism (Uncles, Dowling, and Hammond, 2003).
• There is a general lack of advertising and promotion of cultural products and tourism (Das and Acharjee, 2013).
Personal experience
• Tourists do not have involvement (i.e. understanding, personal experience, etc.) in cultural sites (Prebensen, Woo,Chen and Uysal,2012).
• Many tourists do not have personal experiences with culture sites (Klaus and Mak-lan, 2012).
• Tourists’ attitudes towards cultural tourism are old-fashioned (Lee, Graefe and Burns, 2007).
• Lack of diversity Cultural tourism is currently a niche market, with little attention paid to it compared to
mass tourism (UNESCO 2003). Additionally, the tourism industry tends to focus
upon the tourists who are already interested in cultural tourism (Keogh, 1990;
Silberberg 1995; Aluza, O‟Leary, and Morrison, 1998; Lord 1999; McKercher, 2002;
UNESCO 2003; Martin et. al., 2004; Chantachon 2006; Nasing, Rodhetbhai, and
Keeratiburana, 2014). There is therefore an opportunity to increase the diversity of
audience for cultural tourism by appealing to other groups of potential customers.
However, the results of lower visitor numbers in cultural destinations could lead to
several issues. First, cultural places are significant for the local economy. If there are
less cultural tourists, then the economy in the local area will not develop (Madden,
2001; Stoddard et al., 2006; Kay, Wong, and Polonsky, 2009; Chou, 2013; Webster
and Ivanov, 2014; Mowforth and Munt, 2015). Second, heritage and cultural
attractions can enhance community engagement in each area. Lower visitor
numbers can lead to less social engagement of people (Howard, 2001; Hill, 2004;
Upright, 2004; Kay, Wong, and Polonsky, 2009; Kim, Uysal, and Sirgy, 2013; Lee,
2013). Third, most cultural places are funded by the government to provide value for
the widest range of visitors. Low visitor numbers could result in a reduction of the
budget or financial support from the public (Brooks, 2003; Lewis and Brooks, 2005;
Kim, Cheng, and O’Leary, 2007; Kay, Wong, and Polonsky, 2009).
Competition between tourism organisations, moreover, means that effective
marketing strategies are required to attract visitors, with important strategies like
segmentation, targeting, and positioning to understand what customers really want

26
and to support them. In addition, several tourist attractions have begun to design
products and services for specific groups (Fodness, 1994; Kale, Mcintyre, and Weir,
1987; Reisinger and Mavondo, 2002; Hays, Page, and Buhalis, 2013; Kavoura and
Katsoni, 2013).
To broaden and increase the potential market, this study draws upon “inclusive
design” principles. Inclusive design aims to make products, services and
environments accessible to the widest range of users possible, irrespective of
impairment, age, or capability. In addition, it has been used to investigate,
understand, and meet the needs of diverse people (British Standards Institute, 2005;
Langdon, Persad, and Clarkson, 2008).
• Lack of motivation However, at cultural sites, visitors have no motivation to read the story displayed
behind the exhibitions and to visit to the real places (Rizvic et al., 2012). Moreover,
the reason why tourists do not have motivation to visit is that they do not understand,
appreciate, entertain and enjoy stories in cultural tourism (Schouten, 1995; Timothy, 1997; Moscardo, 2000; Halewood and Hannam, 2001; NHB, 2005; Boukas, 2008).
These problems highlight a good opportunity to further facilitate cultural tourism to
increase visitors’ motivation. To increase tourists’ motivation, this study adopts digital
storytelling, which is widely used to explain all types of stories, narratives, films, and
novels in the design process of digital systems (Ryan, 2008; Schafer, 2008; Miller, 2012; Ohler, 2013; Cunsolo et al., 2013).
2.3.2 Increasing diversity in Cultural Tourism Williams and O’Reilly (1998) state that diversity means any attribute people use to
tell themselves that another person is different by using visible and remarkable
demographic characteristics (e.g. race, sex and age). Many areas, regions and
countries are planning strategies to attract more visitors, especially cultural places
that have a few visitors. However, there are only a handful studies in the field of increasing diversity in cultural tourism.
To attract older adults and people with disabilities, The United Nations (2003)
suggests that firstly, the tourism industry should identify places, zones or areas

27
having potential for growth, but small amount of visitors as niche markets for a new
source of visitors. Furthermore, they should seek out the barriers of the market and
remove those barriers for wheelchair-users. The United Nations (2003) specifically
recommends that marketers and researchers who are responsible for increasing
diversity should remove those barriers. By doing so, this could increase this market segment and create a competitive advantage.
To increase the number of non-cultural tourists, Silberberg (1995, p. 362) states that
‘not every cultural product is willing or able to attract tourists, not every person is
interested in culture’. Silberberg (1995, p. 363) also recommends that ‘the strategy
for cultural products is to move more of them along the continuum from willing to
ready to able, the strategy for increasing the market focuses on widening the appeal
of culture from the small percentage to larger percentages motivated in part, as an
adjunct to another motivation, or to accidental cultural tourists’.
Lastly, Project M was conducted by National Heritage Board (NHB) (2005) to
increase the awareness of culture amongst the youth. This project could lead up to a
70% increase in visitors to NHB museums in 2005 (more than 822,000 compared to
the previous year’s 480,292). NHB (2005) concluded that Project M could increase
teenagers’ understanding and appreciation of cultural places. Furthermore, the
reason why teenagers are not attracted to cultural tourism is because they do not
understand heritage sites adequately. Moreover, Boukas (2008) supports Project M
in that the awareness of youth tourists can be increased by studying their behaviour
and discovering in what they are interested. If their interests are taken into
consideration, this may lead them to visit, understand and appreciate cultural sites
and museums (Boukas, 2008; NHB, 2005). From these three studies, the concepts
to increase diversity in cultural tourism for four target groups can be summarised on
table 2.6

28
Table 2.6 Three concepts to increase diversity in cultural tourism
Authors and year Target How to increase diversity in cultural tourism
United Nations, 2003 People with disabilities and older adults
Seeking and removing barriers and creating barrier-free tourism for visitors.
Silberberg (1995 Non cultural tourists Widening from the small percentage to larger percentages cultural tourists.
National Heritage Board – NHB (2005)
Youth Studying their behaviors and seeking what they are interested in.
These three suggestions can be linked to inclusive design concepts which refer to
‘the design of mainstream products and/or services that are accessible to, and
usable by, as many people as reasonably possible ... without the need for special
adaptation or specialised design.’ (The British Standards Institute, 2005). Initially,
inclusive design seeks to find and remove barriers to cultural tourism. It can break
down barriers and offer solutions that can benefit as many people as possible
(CABE, 2006). Moreover, the Americans with Disabilities Act of 1990 illustrates that
barrier-free stages are necessary for disabled people. Dong, Keates, and Clarkson
(2004) comment that inclusive design can explore drivers and barriers so that drivers
can be supported and barriers can be erased. Therefore, to broaden and increase
the potential market, this study applies inclusive design principle as ‘understanding
and designing for diversity’.
2.3.3 Why ‘inclusive design’ for cultural tourism? Tourists have a wide variety of needs, including in terms of the barriers and drivers
to engaging in cultural tourism. In order to design effective marketing strategies,
marketers thus need to be aware of these barriers and aim to remove them. Dong,
Keates, and Clarkson (2004) further argue that inclusive design can be used to
explore drivers and barriers, so that drivers can be supported and barriers can be
erased. Therefore, to broaden and increase the potential market for cultural tourism,
this study draws upon inclusive design theory by seeking barriers and drivers in cultural tourism for five groups of Thai potential customers
• Older adults: the attempt to understand, and include, disabled and ageing
people as customers is a new phenomenon (Burnett and Baker, 2001;
Hudson, 2010). However, most of the tourism industry seems to ignore this

29
group of people, and treat them as a general group that are not much different
from general tourists (Shaw and Coles, 2004). Moreover, the average age of
the world population is increasing, and is predicted to continue increasing,
whilst people are also living longer, and are becoming healthier and wealthier.
Forecasts predict that in 2050, the number of ageing people will reach
approximately 22 per cent of the world’s population (Magnus, 2009). In the
US, the market for senior tourism is more important because ‘baby boomers’,
who were born between 1946 and 1964, will then be older adults. This age
group is considered to be a powerful consumption group (D’Hudson and
Saling, 2010). Moreover, this group has a lot of free time and money to spend
on services and facilities, such as a ramp for a wheel chair or medical staff,
who can support them.
• Disabled people: currently, the number of people with disabilities is
approximately ten per cent of the total world population globally (Disabled
World (TM), 2012). Ray and Ryder (2003) state that this rate is rising, and
they have more money to spend than one would assume. Ozturk, Yayli and
Yesiltas (2008) suggest that people with disabilities are significant and are
very loyal customers. They tend to come back to the places that are suitable
for their accessibility. Therefore, opening up this tourism market can result in
a higher income for the tourism industry (Arellano, 2003). This concept is
linked to Shaw-Lawrence’s statement: ‘it is essential that countries that wish
to expand their incoming travel markets should have the necessary facilities in
place and an understanding of how to service the special needs of tourists
with disabilities’ (Shaw-Lawrence, 1999, p.8).
• People who are uninterested in cultural tourism completely (non-cultural tourists): Kay, Wong and Polonsky (2009), state that most studies tend to
place an emphasis on people who are already interested in tourism, and try to
increase the number of this group only. However, there are fewer studies
focusing on why non-tourists or non-cultural tourists travel, especially on
barriers and drivers for cultural tourism. Some researchers explain that non-
tourists are very difficult to specify, and have no criteria by which to identify
them, compared to people who are interested in cultural tourism (Bennett,
1994; Milner, et al., 2004; Kay, Wong and Polonsky, 2009). Moreover, studies

30
about non-tourists mostly focus on demographic profiles and reasons for not
travelling, rather than barriers and drivers. Therefore, this study includes non-
cultural tourists as a potential group for cultural tourism.
• Youth: many tourism industries ignore this group, since they assume that
cultural tourism is only for mature people, not for the younger generation
(NHB, 2005). The National Heritage Board in Singapore (NHB) (2005)
concluded that the reason why teenagers are not often attracted to cultural
tourism is because they do not understand heritage sites adequately. This
means that the awareness of young tourists could be higher if a better
understanding about their behaviours and what they want, is provided.
Boukas (2008) also supports the idea that the interests of young tourists can
be identified by studying their behaviour. If their interests are taken into
consideration, this may prompt them to visit, understand, and appreciate
cultural sites and museums (NHB, 2005; Boukas, 2008). The Scottish
Executive also states that young tourists are a very important target group for
cultural tourism, since this group will be the future adult cultural tourists.
Therefore, the tourism industry, and the government, should know their
demographic profiles, barriers, drivers and behaviours, in order to predict the
future trends in cultural tourism (Executive, 2001).
Therefore, this study, which applies an inclusive design principle, is differentiated
from other research by categorising all potential cultural tourists in Thailand into five
groups (youth, older adults, people with disabilities, non-cultural tourists, and cultural
tourists), and exploring their barriers and drivers for cultural tourism using both
Likert-scaling and open-ended questions.
2.3.4 Opportunities for inclusive design within cultural tourism
This section illustrates challenges and opportunities for current research in terms of
inclusive design and the tourism industry. The key insights demonstrated below
present a number of gaps, problems and opportunity in these cultural tourism issues
of inclusive design studies.

31
• Inclusive design for the tourism industry Burnett and Baker (2001) state that the attempt to understand and include disabled
and ageing people as customers is a new phenomenon. However, most of the
tourism industry seems to ignore such people and considers them as a general
group which is not different from general tourists (Shaw and Coles, 2004).
Ozturk, Yayli, and Yesiltas (2008) present that people with disabilities are significant
customers. Therefore, opening up this tourism market can result in a higher income
for the tourism industry (Arellano, 2003). This concept is linked to Shaw-Lawrence’s
statement ‘it is essential that countries that wish to expand their incoming travel
markets should have the necessary facilities in place and an understanding of how to
service the special needs of tourists with disabilities’ (Shaw-Lawrence, 1999, p. 8).
Ray and Ryder (2003) comment that the rate of disability is significantly rising and
they have more money to spend than one would assume. Currently the rate of
disability is approximately 10% of the world’s total population of 650 million people
(Disabled World (TM), 2012). Moreover, disability tourism has represented a growing
niche market of the tourism business. It is evaluated that the market share of
disability tourism is worth around 117 billion USD per annum (Bizjak, et al., 2011).
Significantly, it was found that no country in Asia and the Pacific had ever done any
research into travel patterns for accessible tourism that made experiences available
to those with disabilities.
According to the 2007 American Community Survey of the U.S. Census Bureau
(2009), 41.2 million people (above five years old) (i.e. approximately 15 percent of
the U.S. population) have a kind of disability, and around 41 percent of adults aged
65 years old and older have a kind of disability. More significantly, Darcy and
Daruwalla (1999) argue that physically disabled people actually need to travel more
frequently than people without any disability.
In the developed world, there is disability discrimination law that supports accessible
tourism and inclusive design in the accessibility standards of buildings. However, in
the developing world, especially in the Asia-Pacific region, only 5 of the 28 countries
have such discrimination law to ensure accessibility and mobility for disabled
persons (ESCAP, 2008). It could therefore be implied that tourism for disabled

32
people is currently in its first stage and needs the tourism industry and government
to support it.
However, an in-depth understanding of senior tourism is lacking, especially in terms
of cultural tourism and inclusive design. Although studies present information and
data in senior tourism, most of them focus on consumer behaviour, basic
information, and demographics (Chen and Shoemaker, 2014; Lepisto, 1985). Hence,
this is a new opportunity to study senior tourism in the context of the relationship
between inclusive design and cultural tourism.
As mentioned above, people with disabilities and older adults represent a growing
market for the tourism industry (Ozturk, Yayli, and Yesiltas, 2008). In addition, the
tourism industry in the U.S. is saturated with products and services and is engaged
in high competition (Huh and Singh, 2007). As a result, this competition leads some
tourism marketers to differentiate and target new customers overlooked by their
competitors (Huh and Singh, 2007).
• Inclusive design for tourists Several researches have investigated the criteria of tourists with regards to hotel
selection. However, information about accessible accommodation is poorly
documented. In general, there is neither a room layout nor specific detail for people
with disabilities compared to non-disabled rooms (Darcy, 2010; O’Neill and Ali
Knight, 2000). Moreover, most hotel managers do not recognise disabled people as
potential customers (O’Neill and Ali Knight, 2000).
Westcott (2004) comments that disabled and senior tourists are loyal customers
since they will return to accommodation which provides good accessibility. Moreover,
other people can benefit from this, such as parents with babies and people with
temporary injuries. Therefore, the tourism industry should take advantage of
accessible tourism accommodation by providing more information on accessibility
and providing specific details of room layout, etc. Darcy (2010) states that this
additional cost is so small compared to the benefits that the hotels would receive. In
particular, inclusive design could be adopted in this case in order to understand
disabled people’s needs in room and hotel design information, presentation and
promotion that are relevant to them. Additionally, it will be more efficient and effective

33
for the hotel industry.
2.3.5 Increasing motivation in Cultural Tourism
Motivation is the driving force of individuals, which directs them to act in a particular
way (Mayo and Jarvis, 1981). In the field of tourism, Pearce et al. (1998) suggest two relevant questions for travel motivation research:
• “Why do certain groups of tourists travel?” This question identifies the
psychology of tourists as an important push factor.
• “Why do people go to a certain place?” This question identifies the tourist
destination as a pull factor.
Many researchers argue that there are two essential drivers in travel motivation.
‘Push’ motivation, as a socio-psychological motive, is a desire and inspiration that
influences an individual to travel, whereas ‘pull’ motivation is associated with the
attributes of a particular place and involves the desire to visit a preferred destination
(Crompton, 1979; Goodall, 1988; Yuan and McDonald, 1990; Fluker and Turner,
2000). In tourism research, push and pull theory has been generally accepted as a useful framework for explaining travel motivation and destination attributes.
In terms of cultural tourism, there is no specific travel motivation model. However,
Crompton’s (1979) well-known discussion about the motivations of average travellers
presents seven socio-psychological motivations that emerge from within the visitors,
and are thus push (intrinsic) factors. These are: escape from a perceived mundane
environment, exploration and evaluation of self, relaxation, prestige, regression,
enhancement of kinship relationships, and facilitation of social interaction). Two
cultural motivations, novelty and education, represent the influence of preferred places and are pull (extrinsic) factors.
Additionally, the idea of push and pull motivation has been widely adopted in
advertising and promotion as a part of marketing strategies. A push strategy is to
create demand through promotion to induce customers to buy a product. A pull
strategy uses marketing research and branding to motivate customers to seek out a product (Wells, Burnett and Moriarty, 2000; Kotler, Bowen and Makens, 2003).

34
This concept is connected to digital storytelling methods in advertising and
promotion. Digital storytelling can be applied in both push and pull marketing
strategies. Push marketing may involve advertising using digital media, such as viral
marketing, short stories, applications, websites, or games with a number of
techniques in storytelling used to directly attract visitor motivation. For example,
customers may be told about interesting or unseen locations and the importance of
being cultural tourists, are shown the latest exhibition or festivals, and are
encouraged to ‘find themselves’ by travelling (Miller, 2008). In pull marketing, digital
storytelling can be applied to create branding and increase travellers’ motivation to
visit cultural places, by describing interesting cultural site and telling them about the
history of a place to make them feel proud about it (Wells, Burnett and Moriarty,
2000; Kotler, Bowen and Makens, 2003).
Moreover, by using digital storytelling, online users can see the story or background
behind an exhibition, in both virtual and physical museums, that can increase their
motivation to visit cultural places (Hein, 2000; Tolva and Martin, 2004; Rizvic et al.,
2012). Therefore, digital storytelling can enhance the connection between places
and people, link the past and the present, apply push and pull factors, and represent
cultural experiences as real life opportunities. Thus, digital storytelling is a valuable tool in the challenge of increasing motivation in cultural tourism.
2.3.6 Why digital storytelling for cultural tourism? At cultural sites, visitors have no motivation to read the story displayed behind the
exhibitions and to visit to the real places (Rizvic et al., 2012). These problems
highlight a good opportunity to further facilitate cultural tourism to increase visitors’
motivation. To increase tourists’ motivation, this study adopts digital storytelling,
which is widely used to explain all types of stories, narratives, films, and novels in the
design process of digital systems (Miller, 2012; Ryan, 2008; Schafer, 2008; Ohler,
2013; Cunsolo et al., 2013). For this thesis, digital storytelling is defined as a medium
that “uses personal digital technology to combine a number of media into a coherent narrative” (Ohler, 2013).
However, regarding the creation of digital storytelling, there is no guideline focusing
specifically on cultural tourism for potential viewers, especially older adults and

35
disabled people, who are not target groups. Most guidelines regarding digital
storytelling focus on educational purposes in classrooms and game designs.
Moreover, Tenh, Shiratuddin, and Harun (2012) stated that experts have presented a
number of theories. Moreover, in each theory, a variety of elements are redundant.
Therefore, the aim of this study is to create and propose a digital storytelling
guideline to motivate all five groups to engage in cultural tourism.
2.3.7 Opportunities for digital storytelling within cultural tourism
• Digital storytelling in cultural media Due to its digital media, technique and presentation, digital storytelling is one of the
best methods for use on websites, social media and other forms of online media
(Hein, 2000; Tolva and Martin, 2004; Kaelber, 2007; Rizvic et al., 2012; Chen, Kao
and Kuo, 2014; Floch and Jiang, 2015). Online museums, applications or websites
can present museum collections, history and stories online without a watcher having
to leave home. However, both physical and online museums share the same
problem: that visitors have no motivation to read through every text displayed behind the exhibits (Kaelber, 2007; Rizvic et al., 2012).
Many studies have tried to establish the appropriate method to attract users to gain
the maximum amount of formal information. Additionally, they have researched “how
to enhance the viewer’s experience and learning in such environments” (Kaelber,
2007; Rizvic et al., 2012). As a result, digital storytelling is introduced as a new
method that will enable visitors to explore an online museum, guided by storytelling.
This way the users can learn about the context of the displayed objects and be
motivated to explore all of them by means of entertainment.
Moreover, by using digital storytelling, online tourists can experience a story or
background behind an exhibition, both virtually and in the real museum. Also, results
from previous studies present the finding that digital storytelling can increase online
users’ motivation to visit the real places (Hein, 2000; Tolva and Martin, 2004; Rizvic
et al., 2012; Floch and Jiang, 2015). This concept could be applied to different kinds
of cultural presentation such as stories about archaeological sites which are difficult
to access physically. Rizvic et al. (2012) conclude that this technique will effectively enhance online users experience and motivation to visit the real cultural places.

36
Sundstedt et al. (2004) believe that the field of virtual technology illustrates a new
opportunity for online users to access the virtual recreations of different heritage and
cultural sites. Furthermore, this technology can present precise data about the actual
place and provide digital storytelling to attract online visitors interest. In addition, it
increases a site’s accessibility to both researchers and general tourists. For
example, some historical sites might be too expensive to visit, too inhospitable, too
far away, too fragile, too dangerous, or no longer exist (Paquet and Viktor, 2005). As
an alternative for cultural tourism, virtual models with digital storytelling can present
interaction with historical items or fragile objects that cannot be handled in the real
world (Paquet and Viktor, 2005). This is the opportunity that digital storytelling and virtual technology can provide to support cultural tourism regarding accessibility.
• The latest technology in digital storytelling and cultural tourism As new technologies are developed, the potential uses for digital storytelling within
other sectors will continue to increase in both number and importance. Digital
storytelling can recreate an experience virtually. Moreover, it can reach physically
inaccessible places and offer universal communication in many languages, leading
to an improved visitor experience (Wither et al., 2010; Pujol et al., 2012; Keil et al., 2013; Floch and Jiang, 2015).
In the early stages, most digital storytelling was presented on the websites
assembling a collection of formal information (Hein, 2014; Tolva and Martin, 2004).
Next, they tried to adapt storytelling to create a user experience, but the problem
was the limited technology and Internet speed (Jones, 2002; Rizvic et al., 2012).
Nowadays, most of digital storytelling have moved into mobile phone applications
with very high technology, such as the mobile device’s sensor, GPS
(Christodoulakis, 2014), augmented reality (AR) (Wither et al., 2010), mixed reality
(MR) and 4D technology (Tarantilis et al., 2011). The advanced technology in digital
storytelling presented previously can create a more realistic experience which links
the real locations and formal information together to increase the user’s motivation to visit the real sites (Wither et al., 2010; Pujol et al., 2012; Floch and Jiang, 2015).
Additionally, compared with previous digital storytelling in online museums which
tried to present one content for all users, current cultural applications allow users to
customise, personalise and share information to social media. In particular, sharing

37
can attract more users to visit cultural applications because they will follow, discuss and share what they are interested in with friends (Pujol et al., 2012).
However, recommendations about how to simplify information have not changed
since 2000. Most studies emphasise that ‘less is more’. In particular, due to the rapid
change in mobile device technology, some projects try to focus on the latest
innovation instead of creating simple stories. Online visitors need a simple and easy
story structure to understand. Therefore, the key issue in digital storytelling is to
create good stories and content that can be reused on many technology platforms in
the future.
In the future, the tourism industry, museums and cultural sites will tend to develop
more high technology to present the data more interactively and realistically in order
to deliver a successful visitor experience. Therefore, interactive technology in cultural
tourism, guiding the user’s experience and increasing motivation, seems to be the
new trend in the field. However, the key is how to apply and integrate these
technologies effectively with good, simple content that can be reused on many
platforms, resulting in meaningful, desirable and effective cultural tourism experiences.
2.4 Inclusive design - increasing diversity:
2.4.1 Definition of inclusive design
Dong, Clarkson, and Ahmed (2004) state that the early definition of inclusive design
focused on products and buildings, and was later adapted to services and
communications. Coleman (2001) also states that the context of inclusive design is
recognised by the demographic, legal, and technological trends. Therefore, it is
useful to consider definitions of inclusive design. Various definitions were collected from academic journals, university websites, and organisation websites as follows:
• Academic journal: more than 50 citations (Langdon, Persad, and Clarkson,
2010)
• University website: (Inclusive Design Research Centre, OCAD University,
2013)

38
• Organisation websites: Design Council, Royal College of Arts
(http://www.designcouncil.info, 2013); Inclusive Design Toolkit, University of
Cambridge (www.inclusivedesigntoolkit.com, 2013); (The British Standards
Institute, 2005)
Table 2.7 Definitions of inclusive design from several sources
No. Source Definitions and references Keywords
1. Academic
journal
“Inclusive design aims to make products and services
accessible to the widest range of users possible
irrespective of impairment, age or capability.”
(Langdon, Persad, and Clarkson, 2010, p. 510)
- Accessible
- The widest range of
users
- Impairment, age or
capability
2. University
website
“Design that considers the full range of human diversity
with respect to ability, language, culture, gender, age
and other forms of human difference.”
(Inclusive Design Reseach Centre, OCAD University,
2013)
- The full range of
human
- Diversity
- Human difference
- Ability, language,
culture, gender, age
3. Organisation’s
Websites
Organization
“It is a general approach to designing in which
designers ensure that their products and services
address the needs of the widest possible audience,
irrespective of age or ability. Two major trends have
driven the growth of Inclusive Design (also known as
Design for All and as Universal Design in the USA) -
population ageing and the growing movement to
integrate disabled people into mainstream society.”
(Design Council, Royal College of Arts,
http://www.designcouncil.info/inclusivedesignresource/)
- The widest possible
audience
- Irrespective of age
or ability
- Population ageing
- Growing disabled
people
Inclusive design emphasizes the contribution that
understanding user diversity makes to informing these
decisions. User diversity covers variation in
capabilities, needs, and aspirations. (Inclusive Design
Toolkit 2013, University of Cambridge)
- User diversity
- Variation in
capabilities, needs,
and aspirations
“A process whereby designers, manufacturers and
service providers ensure that their products and
services address the needs of the widest possible
audience” (Department of Trade and Industry UK, DTI,
2000)
- The widest possible
audience

39
The similarities between all presented inclusive design definitions could be grouped.
A few commonalities are listed on the table 2.8.
Table 2.8 Keywords from definitions of inclusive design
No. Keywords References
1. Range of users
• The widest range of users (Langdon, Persad, and
Clarkson, 2010)
• The full range of human (Inclusive Design Reseach
Centre, OCAD University, 2013)
• The widest possible audience (Design Council,
Royal College of Arts)
The widest possible audience (Department of Trade
and Industry UK, DTI, 2000)
• As many people as possible (The British Standards
Institute, 2005)
2. Diversity
• Diversity and Human difference (Inclusive Design
Reseach Centre, OCAD University, 2013)
• User diversity (Inclusive Design Toolkit 2013,
University of Cambridge)
3. Accessibility
• Accessible (Langdon, Persad, and Clarkson, 2010)
• Accessible (The British Standards Institute, 2005)
4. Impairment
• Impairment, age or capability (Langdon, Persad, and
Clarkson, 2010)
• Ability, language, culture, gender, age (Inclusive
Design Reseach Centre, OCAD University, 2013)
• Irrespective of age or ability, Population ageing,
Growing disabled people (Design Council, Royal
College of Arts)
5. Universal
• Variation in capabilities, needs, and aspirations
(Inclusive Design Toolkit 2013, University of
Cambridge)
"The design of mainstream products and/or services
that are accessible to, and usable by, as many people
as reasonably possible ... without the need for special
adaptation or specialised design."
(The British Standards Institute, 2005)
- Accessible to
- Usable by
- As many people as
possible
- Without special
adaptation

40
• Without special adaptation (The British Standards
Institute, 2005)
After reviewing a wide range of definitions from many sources, and grouping
keywords with similarities, this study has selected the definition that covers all keywords (range of users, diversity, accessibility, impairment, universal):
"The design of mainstream products and/or services that are accessible to, and
usable by, as many people as reasonably possible ... without the need for special
adaptation or specialised design"
(The British Standards Institute, 2005).
2.4.2 History and background of inclusive design
The term ‘inclusive design’ emerged in the mid-1990s as a synthesis of insights
reaching back to the 1960s. It combined design with social issues such as ageing,
disability, and social equality. The exhibition ‘New Design for Old’ (Manley, 1986)
was held in the Victoria and Albert Museum in 1986. The aim of this was to present
an age-friendly future regarding older adults’ lifestyles and needs. Thus, a number of
leading designers were asked to rethink products and elements in homes for the target group – ageing people.
Next, in 1989, Helen Hamlyn set up a foundation to improve ageing peoples’ lives.
The first step was to fund the program DesignAge at the Royal College of Art (RCA) to enhance design for elderly people (Laslett, 1989).
The first conference on inclusive design was held by the Ergonomics Society and
DesignAge in 1992, and was attended by 176 delegates. The majority of participants
were from industry, design, ergonomics, and medicine. The conference proceedings
were published by Applied Ergonomics (Coleman and Pullinger, 1993). The most
successful speech stated, “We have to conduct our lives as far as possible not
simply in remembrance of our former but in the presence of our future selves”
(Laslett, 1989, p. 22). This concept shifted “the focus from ‘them’ to ‘us’, not just for
future generation, but for all of our futures” (Clarkson and Coleman, 2015, p. 3).

41
Clarkson and Coleman (2015) also confirm that the 1992 conference shifted the
focus of inclusive design from the margins to the mainstream market, or from small groups of people (i.e. elderly, disabled people) to the potential mass market.
The term ‘inclusive design’ was coined in 1994 (Coleman, 2001). In the early stage,
inclusive design focused mainly on ageing and disabled people. However, this
changed when the first academic book on inclusive design was published in 2003
(Clarkson et al.). The book set up the scope of inclusive design as involving both
ageing and social inclusion of people with disabilities. Moreover, it presented design
tools, methods, and a future vision gathered from design, the research community, industry, and experts (Clarkson and Coleman, 2015).
2.4.3 Inclusive Design, Universal Design, and Design for All
Inclusive design refers to "the design of mainstream products and/or services that
are accessible to, and usable by, as many people as reasonably possible ... without
the need for special adaptation or specialised design" (The British Standards
Institute, 2005). This study will use the definition of universal design that states that
“universal design is the design of products and environments to be usable by all
people, to the greatest extent possible, without the need for adaptation or specialised design” (Mace, 1998).
The terms ‘inclusive design’ and ‘universal design’ have been widely used in
research studies; however, it is important to determine the difference between the
two. Table 2.9 below compares the similarities and differences between various studies of inclusive design and universal design in various contexts.
Table 2.9 Comparison between inclusive and universal design Similarity
Difference
Target audience: • People with disabilities, older adults,
and everyone
Meaning: • Usability to as many people as
possible
Origins: • Universal design - industrial and
architectural design • Inclusive design - product design.
Focus: • Inclusive design - individual is multi-
faceted. • Universal design for everyone

42
In the above table, it is clear that there are some significant similarities and
differences between inclusive design and universal design. However, universal
design was first introduced in industrial and architectural design relating to the built
environment, while inclusive design was originally intended for product design. This
suggests that for the built environment concept, the target group is the whole
population. Therefore, universal design was primarily intended to create a common
design that would work for everyone. In contrast with the product design concept, it
focuses mainly on decision making in the context of people. Universal design tries to
focus on the notion of the individual as multi-faceted, and on each design need
presented by each individual. However, the inclusive design’s needs will arise from
factors or characteristics of people (Design for All Foundation, 2003; Klironomos et
al., 2005; Preiser and Ostroff, 2001; Waller et al., 2013).
2.4.4 Applications of inclusive design and universal design in economy, industry and media
Table 2.10 summarises the applications of inclusive design and universal design
from various studies in seven areas. However, this study focuses only on design
industry and media related to the PhD research. Applications in other areas are
further detailed in Appendix C2.
Table 2.10 Application of inclusive design in different areas
Applications
Details
\1. Business • A positive issue of business strategy and design practice (Clarkson et al., 2003)
• To strengthen business opportunities (Clarkson and Coleman, 2013) • Brand and market advantage (Clarkson and Coleman, 2013) • Innovation for accessibility and usability (Clarkson and Coleman, 2013)
2. Economics
• The Potential Support Ratio (PSR), the number of people aged 15 to 64 who could support one person over 65 (Clarkson and Coleman, 2013)
• the most cost-effective solution to economic case (Frye, 2013) • Knowing the needs of older consumers is becoming more important due
to an increasingly ageing and simultaneously declining population (Krauss, 2011)

43
3. Social impact
• The desirability of social cohesion and inclusivity (Clarkson and Coleman, 2013)
• the accessibility of public buildings, spaces, and services that can support social inclusion (Clarkson and Coleman, 2013)
• Improving the quality of people’s lives through design in areas such as architecture, urban design, and public space (Clarkson et al., 2003)
• Designing products more user-friendly for all target groups in the society (Meyer-Hentschel and Meyer-Hentschel, 2004).
4. Politics
• Supporting the increase in the social participation of older adults and people with disabilities (Krauss, 2011).
• Politicians encourage the advancement of inclusive design concepts as competitive advantages (Krauss, 2011).
5. Education
• Introducing students to eight issues of diversity: ethnicity, race, class, gender, age, physical ability/disability, mental ability/disability, and religion (Tauke, 2010)
• Providing inclusive design into several classes of design such as product, media, architectural, and urban design (Tauke, 2010).
• Universal Design in Education: Teaching Non-traditional Students (Bowe, 2000)
• Universal Design for Learning (UDL) (Rose and Meyer, 2002) 6. Design industry
• Inclusive design and universal design in design areas (Preiser, 2011; Fletcher et al., 2013)
7. Media
• Television: Video Description • Multimedia and the Web: Web caption and description web tools to
create accessible web-based media. • Theatrical motion pictures access: For blind users and deaf users) • Environmental media - Captioning and description to live events,
including interactive multimedia exhibits, museums, theme parks, and sporting centres.
• Radio: For deaf drivers - text display for captioning; for blind users - a speech interface for digital radio command.
Design industry
Preiser (2011) states that universal design has been defined as making products,
spaces and buildings, urban infrastructure, and information technology accessible to
and usable by almost all people. Therefore, there are a great number of design
approaches applied with inclusive and universal design, used by designers,
managers and groups, healthcare and rehabilitation employees, and individuals
dealing with disabilities. Examples of these disciplines and design applications are presented below.

44
Table 2.11 Universal Design – Relevant Disciplines (Preiser, 2011)
Disciplines Examples of Universal Design Applications Industrial Design - Product Design Utensils, tools, furniture, equipment Graphic Design Directories and guidance systems Fashion Design Clothing for various disabilities Interior Design Accessible design of dwellings, offices, and other
spaces and places Architecture Equal access and circulation for all user groups and
levels of disabilities Urban Design and Planning
Accessible design of transportation facilities, university campuses and communities in general
Information Technology Access to services and internet commerce Health Facility Planners Accessible hospital, rehabilitation, and care facilities
Fletcher et al. (2013) also specify how to apply inclusive design into five design
areas as follows:
Table 2.12 Inclusive design in five design areas (Fletcher et al., 2013)
Disciplines
Examples of inclusive design applications
Industrial design
Universal design creates more interest among industrial designers than other disciplines of design. Fletcher et al. (2013) support that the demographic argument for design anticipating diversity of age and ability supports an orientation to function and the need to spark market appetite.
Technology design
A sub-set of industrial design is technology design, which has developed its relationship to universal design differently. Early conflict between inclusive design and assistive technology experts has created a commitment to promoting universal design as a baseline for standard products with assistive technology for individual users with limitations.
Architecture
As licensed professionals, architects accept the largest responsibility among the design professions with legal mandates for accessibility. Fletcher et al. (2013) state that they could be sued for failure to meet the requirements of the law.
Interior design
In general, interior design has presented a more positive response to inclusive design than architecture. In universities, interior designers are required to take a class on ‘human factors’ to graduate. Currently, new requirements for accredited interior design classes include ‘universal design’ as a concept that must be applied and understood. As a result, interior design students are more aware of the significance of inclusive design.
Urban design
Urban Design Planning in the U.S. has been enjoying renewal with the growth of major cities. Fletcher et al. (2013) state that the planning community in the U.S. vaguely embraces universal design. In addition, standards of accessibility are legally required and expected, but the philosophy of inclusive design is absent.

45
Media
In the study “Universal Design in Media”, O’Connell and Goldberg (2011) illustrate
that universal and inclusive design become urgent as media is increasingly embedded into everyday life.
• Television Television Closed Captioning: In 1972, the WGBH Educational Foundation
broadcast the first television program for deaf or hard-of-hearing viewers by using
captions. Nowadays, built-in captioning is recognised as the best example of
universal design.
Television—Video Description: Video description also began at WGBH in 1990
under its trademark, ‘Descriptive Video Service or DVS’. This service has descriptive
narration inserted in the natural pauses in dialogue, communicating key features such as actions, settings, and gestures.
Digital Television Transition: WGBH takes part in the deliberations of the
Advanced Television Systems Committee (ATSC). Additionally, the DTV captioning
standard, EIA-708, presents new features such as up to 63 caption services, multiple
caption windows, multiple font choices, viewer-sizable fonts, as well as additional colour, border, and drop shadow options.
• Multimedia and the Web O’Connell and Goldberg (2011) note that multimedia integrates dynamic and
interactive features such as video, audio, text, graphics, and animation. Furthermore, most multimedia is packaged within web-delivered software, DVDs, and websites.
Currently, the formats of media via the web such as WindowsMedia, QuickTime,
Flash, and RealMedia can present captions and descriptions as well as user
controls. Moreover, WGBH have produced a suite of web caption and description web tools to create accessible web-based media.
• Theatrical motion pictures access: From film to D-Cinema O’Connell and Goldberg (2011) suggest that disabled people with hearing or vision
loss need to experience first-run movies in theatres at any time in any theatre with the
same freedom as the sighted and hearing population. For blind users, new

46
technologies have been set up at hundreds of theatres throughout the United States.
DVS Theatrical can present video description via infrared or FM listening systems to enable blind users to listen by using headsets, without disturbing other people.
For deaf users, the Rear Window Captioning System presents captions on a light-
emitting diode (LED) mounted at the rear of a theatre, enabling deaf and hard-of-
hearing audiences to use transparent plastic panels to read the captions. Moreover,
the reflective panels can be adjustable, and users can sit anywhere in the theatre (O’Connell and Goldberg, 2011).
Figure 2.2 WGBH’s Rear Window captioning system in a movie theatre (O’Connell and Goldberg, 2011)
• Environmental media Captioning and description can provide access to live events, including interactive
multimedia exhibits, museums, theme parks, and sporting centres. There are
handheld devices offering captions and navigation features to control description.
For example, WGBH has developed handheld devices with MoPix systems that
present a visitor’s experience at venues including Disney theme parks, the Whitney
Museum of American Art, the Baseball Hall of Fame, and national park visitors’
centres throughout the country. WGBH has also enhanced devices for in-flight

47
entertainment to allow users to access captioned media with user interfaces on seat-
back screens. Furthermore, these installations can be adapted for bus shelters,
taxis, hotel lobbies, and other public and private places (O’Connell and Goldberg,
2011).
Figure 2.3 Duratech handheld device used in theme parks and museums (O’Connell and Goldberg, 2011)
• Radio O’Connell and Goldberg (2011) illustrate that the new technology, Hybrid DIGITAL
(HD) radio, can broadcast multiple channels from a single radio station and show
text display for captioning. These technologies can easily enable access to radio
reading services and new services such as audio description and text displays for
disabled users. Significantly, new radio designs are being developed to implement
accessible controls, displays, and menu options for blind users, such as a speech
interface for digital radio command. For deaf drivers, text display from radio about
traffic, weather, or emergency alerts can offer critical safety benefits.
In summary, a great number of applications and disciplines are affected by inclusive
design and universal design. However, could inclusive design be effectively applied
to cultural tourism? This question has not been addressed in previous studies, and
most of the existing literature is focused on seven primary areas: business issues
(Clarkson and Coleman, 2013; Ostroff, 2011), economic issues (Clarkson and
Coleman, 2013; Frye, 2013; Krauss, 2011), social issues (Clarkson and Coleman,
2013; Clarkson et al., 2003; Frye, 2013), political issues (Frye, 2013; Krauss, 2011;
Preiser, 2011), education issues (Krauss, 2011; Ostroff, 2011; Preiser, 2011), design

48
issues (Fletcher, et. al, 2013; Preiser, 2011; Reed and Monk, 2011), and media
issues (O’Connell and Goldberg, 2011). Therefore, this study presents an
opportunity to focus on the relationship between inclusive design and cultural
tourism.
2.4.5 Inclusive tourism In recent years, there has been an increasing interest in ‘inclusive tourism’ for
disabled people and older adults as the new growing tourism niche market (Bizjak et al., 2011).
‘Inclusive tourism’ is defined as “a global movement to ensure the full social
participation of all persons with disabilities in travel, citizenships, and cultural
contribution – and in the process to ensure the same for everyone” (Rains, 2007, p.
1). Rains (2009) also states the definition of inclusive tourism as “the application of
Universal Design by the tourism industry to its products at every phase of their
lifespan from conceptualisation to retirement and replacement” (p. 39). This means
that inclusive tourism must be systematically applied in all stages of the design
process such as product, service, and policy lifecycles. The process looks at
everyone (i.e. children, adults, seniors, people with disabilities, pregnant women, etc.) in all their diverse abilities at all stages of the lifecycle.
However, another term that is closely related to inclusive tourism is ‘accessible
tourism’. Accessible tourism can be defined as the ability of “… all people, regardless
of having a disability or not, to travel to another country, within the country and to any
place, attraction or event they wish to visit” (Radet, 2002, p. 17). Darcy and Dickson
(2009) also state that “accessible tourism enables people with access requirements,
including mobility, vision, hearing and cognitive dimensions of access, to function
independently and with equity and dignity through the delivery of universally designed tourism products, services and environments” (p. 34).
• The difference between inclusive tourism and accessible tourism
Rains (2007) points out the difference between inclusive tourism and accessible
tourism by explaining that accessible tourism could be possible for any tourist

49
destination to be accessible. However, accessible tourism focuses mainly on accessibility and does not include attitudes and experiences.
In contrast, inclusive tourism includes all stakeholders, such as travellers, tourism
industries, marketers, designers, and architects in order to achieve the best outcome
for all. This includes the experiences and attitudes of travellers, who are recognised as valuable customers.
• Accessibility and experience are the main focus
Preiser (2001) argues that the problem with accessible tourism, inclusive tourism, or
universally accessible design in tourism is the concept of ‘visitability’ (or accessibility)
– the ability of a disabled person to enter a place (Nasar and Evans-Cowley, 2007;
Preiser, 2001). There are only some destinations developing accessibility for
disabled persons (Craeger, 2007). Moreover, universal design in tourism is the
process that focuses on ‘accessibility and planning’ for ageing, disabled people, and
people across the lifespan (Darcy and Dickson, 2009; Steinfeld and Shea, 2001).
A number of studies state that universal/inclusive design in tourism focuses on
‘accessibility’ as a central rather than an add-on compliance. For instance, an
environmental approach to inclusive mobility should take into account wheelchair-
users, families with prams, shoppers with trolleys, and tourists with luggage. In
addition, interior and exterior lighting should be designed and considered for people
with low vision (Darcy and Dickson, 2009; Michopoulou, 2015; Ozturk et al., 2008;
Pagán, 2012; Sedgley et al., 2011).
The Designing for the 21st Century III conference on universal design focused on
tourism, disability, and ageing in the area of ‘accessibility’ (Walsh, 2004). Moreover,
families with children or babies, temporarily injured people, and pregnant women are
all considered as a part of inclusive design for cultural tourism. These groups of
people have similar needs to ageing and disabled people and can benefit from this
issue being addressed (ESCAP, 2000). This means that product, graphic, and
interior designers and architects should focus on how to create accessibility in every
user journey stage for all groups of people (i.e. signs and information: easy to read
typeface, contrasting colour or background; doorways: minimum width 85 cm and no

50
steps; pathway width: at least 180 cm wide; bathroom: wheelchair accessible; Darcy
and Dickson, 2009; Michopoulou, 2015; Pagán, 2012)
2.4.6 Principles of inclusive design
1. Inclusive design strategy (Waller et al., 2015) Waller et al. (2015) present the success criteria and the inclusive design strategy in
the paper Making the case for inclusive design as follows:
• Understanding diversity
Businesses can broaden their customer base by considering a range of user journey
stages such as at home, at work, holidays, and a number of environmental factors
(i.e. rain, cold weather, ambient lighting; Elton and Nicolle, 2010). Moreover, most
commercial businesses or organisations should focus on a wide range of users, from
‘fully able users’ to the minority of users with disabilities (Chamberlain and Yoxall,
2012; Waller et al., 2015).
• Responding to this diversity with informed design decisions
A range of people (ages, capabilities, social backgrounds, and cultures) have a
range of needs, desires, and preferences. Inclusive design does not aim to design
one product for all groups, but it can guide the development of an appropriate design
for diversity. The main problem in this age is that almost all products and services
tend to focus on young users. Sometimes, the older and disabled markets are non-
existent. Thus, inclusive design aims to extend potential targets to cover the entire
‘Population Pyramid’. Inclusive design can respond to and design for diversity
through: 1) developing a portfolio of products to cover a range of diversity types; 2)
ensuring that the product has clear target users; and 3) making guided decisions to
improve the success criteria.
This thesis adopts the above strategies as ‘understanding diversity’. This means
including a wide range of cultural tourists in cultural tourism and ‘responding to this
diversity with informed design decisions’. In this way, it is possible to offer guidelines
and results from studies one to three and present the framework to increase diversity
and motivation in cultural tourism.

51
2. Principles of inclusive design (CABE, 2006)
CABE (2006) presents the five principles of inclusive design as follows:
• People: to involve as many people as possible in the design process
• Diversity and difference: to understand the barriers of a wide range of
people (i.e. tourists with luggage, people with disabilities, older adults, etc.)
• Choices: by understanding diversity and their barriers, it can break barriers
and offer solutions for every user.
• Flexibility: Understanding and designing how the building will be used and
who will use it.
• Convenience to use: it can provide convenient and enjoyable buildings to
use for every user.
The ‘flexibility’ and ‘convenience to use’ principles mainly focus on interior,
environment, and building factors. However, this thesis focuses on the principles of
‘people’ to include all potential cultural tourists; ‘diversity’ to seek out their barriers
and strive to understand them; and ‘choices’ to offer solutions in studies one to three.
3. Inclusive design process (Clarkson et al., 2007)
Clarkson et al. (2007) state that inclusive products or services are designed by
starting from a perceived need and developing appropriate solutions accordingly.
This idea can be explained using the ‘waterfall model of inclusive design’ (Clarkson
et al., 2007). This model aims to minimise the potential exclusion and is explained in
detail as follows:
• Discover: to systematically explore the perceived need leading to an
understanding
• Translate: to convert understanding into a completed description leading to
requirements
• Create: to create preliminary concepts leading to concepts
• Develop: the final product or service leading to solutions

52
Figure 2.4 An inclusive design process (Clarkson et al., 2007)
This thesis will apply the model as follows:
• Discover: this study presents the main problems in cultural tourism and sets
up the three key areas of cultural tourism, inclusive design, and digital
storytelling.
• Translate: based on the ‘discover’ stage, the findings from the literature
review will be analysed and synthesised leading to the initial framework.
• Create: this thesis details the framework by setting up three studies, leading
to the final framework supported with empirical data.
• Develop: the evaluation of the final framework will be tested with experts to
answer the research question.
Table 2.13 Principles of inclusive design adopted in this thesis Principles Adopted inclusive design principles
Inclusive design strategy
‘Understanding diversity’ – to include a wide range of cultural tourists ‘Responding to this diversity with informed design decisions’ – to present the framework to increase diversity and motivation in cultural tourism
Principles of inclusive design
People: to include all potential cultural tourists Diversity: to seek out their barriers and drivers to understand them Choices: to offer solutions in studies one to three
Inclusive design process
Discover: presenting the main problems in cultural tourism Translate: findings from the literature review will be analysed and synthesised, leading to the initial framework Create: detailing the final framework supported with empirical data Develop: evaluating the final framework

53
2.5 Digital storytelling – increasing motivation: 2.5.1 Definition of digital storytelling The term ‘digital storytelling’ is widely used to explain all types of stories, narratives,
films, and novels in the design process of digital systems (Miller, 2008; Ohler, 2013;
Ryan, 2008; Schafer, 2008). Due to its vast overuse, the meaning of the term has become unclear. Definitions were collected from the following sources:
• Academic books: (more than 10 citations) 1) Digital storytelling in the
classroom (Ohler, 2013); 2) Investigations on Digital Storytelling: The
Development of a Reference Model (Schafer, 2008); 3) Digital Storytelling: A
creator's guide to interactive entertainment (Miller, 2008)
• University course outline: Ohio State University’s website for Digital
Storytelling course (2013)
• Organisation websites: The University of Houston
(www.digitalstorytelling.coe.uh, 2013); The Centre for Digital Storytelling
(www.storycenter.org, 2013)
Table 2.14 Definitions of digital storytelling from several sources
No Sources Definitions and references Keywords
1. Academic books
“Digital storytelling (DST) uses personal digital
technology to combine a number of media into a
coherent narrative”
“Digital storytelling in the classroom”, (Ohler, 2013,
p.16)
- Personal digital
-technology
- A number of
media
- A coherent
narrative
“Digital storytelling is to tell stories with digital means,
which includes digital media material, such as digital
images or sound, as well as software applications
which support or even generate stories. Digital
storytelling combines and shares aspects of computer
graphics, virtual environments, virtual humans,
behavioral animation, theatre, play and story writing,
knowledge management, psychology and semiotics.”
“Investigations on Digital Storytelling, The
Development of a Reference Model” (Schafer, 2008, p.
- Digital media
material
- A variety of
media

54
3)
“Digital storytelling is narrative entertainment that
reaches the audience via digital technology and media.
Additionally, digital storytelling techniques can make a
dry or difficult subject more alive and engaging to the
viewers”
“Digital Storytelling: A creator's guide to interactive
entertainment”, (Miller, 2008, p. 4)
- Narrative
entertainment
- Digital
technology and
media
- Alive and
engaging to the
viewers
2. University’s course outline
“Most basically, a digital story is a short (3-5 minute)
movie which uses images, voice, and music to tell a
story. There are a variety of media that can be used to
create digital stories and a variety of reasons for
creating them”
Ohio State University’s website in Digital Storytelling
course (2013)
- A short (3-5
minute) movie
- A variety of
media
3. Organization’s websites
“Digital storytelling at its most basic core is the
practice of using computer-based tools to tell stories.
There are a wealth of other terms used to describe this
practice, such as digital documentaries, computer-
based narratives, digital essays, electronic memoirs,
interactive storytelling, etc.; but in general, they all
revolve around the idea of combining the art of telling
stories with a variety of multimedia, including graphics,
audio, video, and Web publishing.”
The University of Houston
(www.digitalstorytelling.coe.uh, 2013)
- Computer-
based tools
- Telling stories
- A variety of
multimedia
“Modern expression of the ancient art of storytelling.
Throughout history, story- telling has been used to
share knowledge, wisdom, and values. Stories have
taken many different forms. Stories have been adopted
to each successive medium that has emerged, from
the circle of the campfire to the silver screen, and now
the computer screen.”
The centre for digital storytelling (www.storycenter.org,
2013)
- Modern
storytelling
- Many different
forms
- Share
knowledge ,
wisdom, and
values

55
From Table 2.14, the similarities between all presented digital storytelling definitions could be grouped. A few commonalities are listed on the Table 2.15
Table 2.15 Keywords from definition of digital storytelling from many sources
No. Keywords References
1. Computer-based tool
• Computer-based tools (The University of Houston,
2013)
• Modern storytelling (The center for digital storytelling,
2013)
2. A variety of media
• Digital technology and media (Miller, 2008)
• A number of media (Ohler, 2013)
• Digital media material (Schafer, 2008)
• A variety of media (Schafer, 2008)
• A variety of media (Ohio State University’s website in
Digital, 2013)
• Telling stories with a variety of multimedia (The
University of Houston, 2013)
• Many different forms (The center for digital storytelling,
2013)
3. A short personal project
• A short (3-5 minute) movie (Ohio State University’s
website in Digital Storytelling course, 2013)
• Personal digital technology (Ohler, 2013)
4. Narrative and share stories
• Coherent narrative (Ohler, 2013)
• Narrative entertainment (Miller, 2008)
• Alive and engaging to the viewers (Miller, 2008)
• Share knowledge , wisdom, and values (The center for
digital storytelling, 2013)
After reviewing a wide range of definitions from many sources and grouping
keywords with similarities, the definition has been selected that covers all relevant
keywords (computer-based tool, a variety of media, a short personal project, narrative, shared stories):

56
“Digital storytelling is narrative entertainment that reaches the audience via digital technology and media. Additionally, digital storytelling techniques can make a dry or difficult subject more alive and engaging to the viewers” (Miller, 2008, p. 4).
2.5.2 History and background of digital storytelling
Dana Atchley, a media artist and stage performer who used oral storytelling and
digital media, first coined the term ‘digital storytelling’ in the late 1980s. In one
particular performance, Atchley sat on the stage and projected homemade videos
and his family photos on the screen, talking about his experiences (Bull and Kajder
2004; Chung, 2007; McLellan, 2006; Wales, 2012). Joe Lambert, a theatre producer,
joined with Atchley and started to develop this art form as digital storytelling. It is the
combination of several art forms, including theatre, digital art, storytelling, and
design. However, the key point of the work is to support the general public to use this
media form to share their own stories, using the current available media (McLellan, 2006; Wales, 2012).
The Centre for Digital Storytelling (CDS) as a non-profit organisation was set up in
the early 1990s in California, USA. This centre set up digital storytelling workshops
for people who did not have a digital storytelling or artistic background. The
workshops originally encouraged people to present their personal experiences with
digital technology as the core medium (Lambert, 2006; McLellan, 2006). After his
observation of the CDS’s workshops, Lambert presented seven elements needed to
create digital storytelling works. Following this, a number of organisations, such as
the BBC and Digital Storytelling Asia initially adopted many projects from the CDS to
broadcast, and later developed their own digital storytelling projects (McLellan, 2006).
Wales (2012) points out that the definition of digital storytelling was originally “the
presentation of personal narratives highlighting important lived experiences” (Robin
2008, p. 224). Lambert also maintains that the key point of digital storytelling from
the CDS’s workshops is to support general people to create their own short stories of
around 3-5 minutes by using voice, still pictures, videos, music, and sounds as the
core elements (Lambert, 2006; McLellan, 2006).

57
2.5.3 Applications of digital storytelling Technologies in digital storytelling presentation continue to advance rapidly, and the
possibilities for using digital storytelling in many areas are growing. There are many
studies presenting applications for digital storytelling in many sectors presented in
Table 2.16.
Table 2.16 Applications in digital storytelling in different areas Applications Details
1. Marketing, advertising and promotion
• Applying stories for negotiation, persuasion, sales presentation, planning,
and communication (Sumi, 2010; Schafer, 2008; Lambert, 2013; Spicer
and Miller, 2014; Greene et al., 2015).
• The best way to convince someone is by telling a story (McKee, 2003)
• Viral marketing: Telling friends, and sharing content (Miller, 2008; Spicer
and Miller, 2014; Greene et al., 2015)
• Advertising and promotion by various means such as the Internet, mobile
devices, iTV, video games, virtual reality, smart toys and theme park
rides (Miller, 2008)
2. Management
• For action research, innovation and new product development (Boyce,
1996)
• Telling or presenting a company’s story (Swap et al., 2001; Nonaka and
Konno; 2008; Sumi, 2010; Lambert, 2013; Nesteruk, 2014).
• To motivate an audience through effective presentation with formal data
and entertainment (Boyce, 1996; McLellan, 2006; Nesteruk, 2014).
3. Education
• Using digital storytelling for educational purposes (Roussuo, 2004; Miller,
2008; Yang and Wu, 2012; Lambert, 2013; Clausen et al., 2014).
• An instructional tool that teachers use to introduce content and capture
students’ attention (Robin, 2008)
• For teachers: To motivate and enhance student understanding effectively
(Burmark, 2004; Muller, Eklund and Sharma, 2006; Kobayashi, 2012;
Lambert, 2013).
• For students: To apply their research, organize their ideas, express
opinions, and construct narrative storytelling (Robin, 2008).
4. Personal motivation
• Telling their stories about everyday life events (Schafer, 2008; Lambert,
2013).
5. Media and entertainment
• Journalism: Using for multimedia reporting or digital storytelling (Lambert,
2013)

58
• Video games: Interactive narratives and game designs (Pausch et al.,
1996; Hung et al., 2012; Lambert, 2013; Yang and Chang, 2013; Marsh
et al., 2014).
• To encourage the motivation and learning of users (Göbel et al., 2009;
Yang and Chang, 2013).
2.5.4 Digital storytelling in cultural tourism from 2000-2010 and 2010-2016
Examples of digital storytelling works from 2000 to 2010
This section illustrates the examples of online museums that use digital storytelling
techniques to promote cultural tourism from 2000 to 2010. The aim is to provide an
overall picture of existing online museums that use digital storytelling and to present
features, strength and weakness of this media.
1. The virtual Smithsonian tour (http://www.mnh.si.edu/panoramas, 2002)
Figure 2.5 The virtual Smithsonian tour (http://www.mnh.si.edu/panoramas)
Research problem: Many people might never have the chance to visit the actual
Smithsonian museums (Jones, 2002).
Features: 1) High-resolution images, video and audio clips, and artefacts that rotate
in 3D. 2) Hotspots that contain artefacts that rotate in 3D and morph into other
artefacts, high-resolution images, video and audio clips and more. 3) Two versions
for both low (modem) and high-speed (broadband) connections. 4) The mobile
version of the tour is being updated to include hotspots.

59
2. The Eternal Egypt project (www.eternalegypt.org, 2004)
Figure 2.6 The Eternal Egypt project (www.eternalegypt.org)
Research problem: As the information from the various museums throughout the
country and archaeological websites is so interrelated, this project has developed to treat the country as a single virtual museum (Tolva and Martin, 2004).
Features: 1) A collection of high-resolution zoomable pictures. 2) Three-dimensional
views of artefacts. 3) 360° images – interactive panoramic views of locations in
Egypt. 4) Animations helping to illustrate and explain artefacts. 5) Up-to-date CCTV
– web cameras providing up-to-date interactive views from certain locations in Egypt. 6) Library about Egyptian culture.
3. The gas chambers of Auschwitz (panorama.auschwitz.org, 2007)
Figure 2.7 The gas chambers of Auschwitz (panorama.auschwitz.org)

60
Research problem: Auschwitz attracts many visitors each year. However, the
physical site is currently difficult to get and includes remnants of the past that are
physically inaccessible (Kaelber, 2007).
Features: 1.) Eight themed virtual halls, set up in eight historic periods. 2)
Information sheets. 3) Three-dimensional models that can be rotated by the user. 4)
Video, films, animations and reconstructions. 5) Three main languages offered
(Italian, English and Arabic).
4. The Sarajevo Survival Tools virtual environment (http://h.etf.unsa.ba/srp/project.htm,2009)
Figure 2.8 The Sarajevo Survival Tools virtual environment (http://h.etf.unsa.ba/srp/project.htm)
Research problem: Today people live at a fast pace, with little time for culture and
education. In Bosnia and Herzegovina museums have fewer and fewer visitors, often
only school children and occasional tourists. This project was created to motivate
visitors to explore the whole collection displayed in the virtual museum (Rizvic et al., 2012).
Features: 1) It contains objects created and used by the citizens of Sarajevo during
the almost four-year period the city was under siege (1992–1996). 2) Text
information for every object. 3) A gallery of photos for every object. 4) A movie and
an interactive 3D model for every object.

61
5. The Virtual Museum of Iraq (www.virtualmuseumiraq.cnr.it, 2009)
Figure 2.9 The Virtual Museum of Iraq (www.virtualmuseumiraq.cnr.it)
Research problem: It is difficult to integrate between humanistic approaches
(archaeological data and historical sources) and recent scientific methodologies
(Cultraro et al., 2009).
Features: 1.) Eight themed virtual halls, set up in eight historic periods. 2)
Information sheets. 3) Three-dimensional models that can be rotated by the user. 4)
Video, films, animations and reconstructions. 5) Three main languages offered
(Italian, English and Arabic).

62
Examples of digital storytelling works from 2010 to 2016
This section presents some examples of the latest cultural media in the field of digital
storytelling from 2010 to 2016. The aim is to present the features, strengths and
weaknesses of current media and compare this with the previous period (digital
storytelling from 2000 to 2010).
1. The Westwood Experience: connecting stories to locations via mixed reality (Wither et al., 2010)
Figure 2.10 The Westwood Experience application (Wither et al., 2010)
Research problem: Most tour guides take visitors to heritage sites and start telling
the stories behind the sites, but those places look different now from how they would
have appeared in the past. This can limit the visitor’s experience and imagination.
However, current technology allows us to combine the real location with mixed reality
effects.
Features: 1.) The application uses mixed reality (MR), including images, audio and
augmented reality (AR), to link the real location and the past; 2.) The story is about
the mayor of Westwood introducing and taking a tour of Westwood in 1949; 3.)
Users have to walk around 1.1 miles and all interaction and the narrative of the story will be presented along the way.

63
2. CHESS (Cultural Heritage Experiences through Socio-personal interactions and Storytelling) (www.chessexperience.eu, 2011)
Figure 2.11 CHESS application at the Acropolis Museum (Pujol et al., 2012)
Research opportunity: This project can personalise information in museums to create custom stories.
Features: 1.) The project allows users to log-in and fill out a short quiz to gather
visitors’ preferences and find out what they are interested in; 2.) Each user’s
information is personalised to create an interactive storytelling experience; 3.) The
project targets two levels of end-users: 3.1) visitors – they will use mobile phones to
obtain and interact with information from the system; and 3.2) authors – they will use the application to create stories.
3. Show Taiwan (http://www.androidapps.biz/app/show.taiwan, 2013)
Figure 2.12 Show Taiwan Android application (http://www.androidapps.biz/app/show.taiwan, 2013)

64
Research opportunity: This study applies a ‘kindergarten approach to learning’
(imagine, create, play, share, reflect and back to imagine) (Resnick, 2007) using a
co-creating process for educational purposes to create a location-based guide
application that integrates multimedia as in museum tours (Chen, Kao and Kuo, 2014)
Features: 1.) Using the concept of an e-book, each chapter has (1) a photograph
with text, (2) a photograph with text and audio and (3) a video clip without a text
caption or audio; 2.) The users can build their own private information resource; 3.)
Geographic location is set by using the GPS signal; and 4.) The Google map is used for navigation.
4. Stedr (Android application, 2015) (Floch and Jiang, 2015)
Figure 2.13 Stedr application (http://stedr.blogspot.co.uk, 2016)
Research problem: Many places that people pass in their everyday lives have so
many stories behind them. However, these stories remain unknown or have been
lost.
Features: This application offers users the ability to personalise their profile and
location through augmented reality (AR). There are three main features in this
application: 1.) discovery: users can browse contents, information or stories; 2.)

65
sharing: users can share stories, comments and pictures and ‘like’ social media; and 3.) creation: users can create stories through media (pictures, texts or video).
2.5.5 Trends in digital storytelling for cultural tourism from 2000-2010 and 2010-2016
This section has outlined digital storytelling trends in cultural tourism media from two
time periods (2000–2010 and 2010–2016) presented in Table 2.17 and 2.18. Details
are further presented in Appendix C3.
Table 2.17 Trends of digital storytelling in online museums from 2000 to 2010
From 2000 to 2010 Topics Details Creating visitor experience
• From ‘on view’ exhibitions into ‘visitor’s experience’ (Hilde, 2000; Rizvic et al., 2012).
• From ‘assembling collectibles’ to fostering visitor experience (Tolva and Martin, 2004)
• Using advanced technologies such as 3D animation, graphics, movies and high-resolution images to create realistic experience (Tolva and Martin, 2004).
3D technology
• The ability to link virtual 3D objects, stories and information (Jones, 2002).
• 3D presentations can increase users interest more than a simple image does (Cultraro et al., 2009).
• Interactive presentation is more striking than one-way communication (Cultraro et al., 2009).
• Using state-of-the art technology with storytelling, especially on 3D images, can lead online users to have a new museum experience (Jones, 2002).
Accessibility
• Digital storytelling can enhance a story, present information and create mood and tone behind physically inaccessible places (Kaelber, 2007).
• Using digital storytelling as a universal form of communication – offering a number of languages (Tolva and Martin, 2004)
Less is more information
• An overload of information and data in online museums can affect a visitor’s subjective experience (Tolva and Martin, 2004).
• How to simplify complex information, not only engaging but also understandable for a variety of online visitors (Tolva and Martin, 2004; Cultraro et al., 2009).
High-speed bandwidth Internet requirements
• The latest web-enhanced presentations require newer and higher bandwidth internet connections (Jones, 2002)
• Some applications require an up-to-date web browser and plug-ins to be installed (Tolva and Martin, 2004)
• Not everyone can access the presentations (Tolva and Martin, 2004)

66
Table 2.18 Trends of digital storytelling in online museums from 2010 to 2016
From 2010 to 2016 Topics Details User experience (UX)
• Many current applications apply user experience (UX) (Wither et al., 2010; Pujol et al., 2012; Floch and Jiang, 2015).
• For example, studying the user’s profile, demographics, interests, cognitive or conceptual change, perception of value and inspiration
Personalisation and sharing on social media
• This allows users to give feedback, rate or answer questions about their interests, and they will then be presented with specific information matching their interests (Pujol et al., 2012).
• To provide a smooth experience for each user visiting the museum (Pujol et al., 2012).
• Current cultural media try to support users to customise, personalise and share their interests on social media rather than just presenting one type of information for all visitors (Pujol et al., 2012; Floch and Jiang, 2015).
Mobile device technology
• Regarding GPS, we can use a map presenting the surrounding locations and identify the social context (who is near you) to increase a good experience in cultural tourism (Christodoulakis et al., 2013; Christodoulakis, 2014).
• Adopting GPS in a mobile device’s sensor to locate users and show maps.
• Augmented reality (AR) can present stories at the real sites through the camera and screen of a mobile device (Wither et al., 2010; Pujol et al., 2012; Floch and Jiang, 2015)
Keep it simple
• The cost of interactive technology is very expensive (Floch and Jiang, 2015).
• It is better to focus on creating good stories and content that can be reused on many technology platforms (Floch and Jiang, 2015).
• Users only need a simple, easy to understand, uncomplicated story structure (Wither et al., 2010; Pujol et al., 2012; Floch and Jiang, 2015).
2.5.6 Digital storytelling guidelines
In order to create digital storytelling, there are a number of guidelines presented by
experts. This study sought to collect all digital storytelling guidelines in all categories.
The criterion for selection was that each guideline must have more than ten citations
in academic books and journal articles; the eight most relevant digital storytelling guidelines are listed below, and further explained in Table 2.19
1. The seven elements of digital storytelling (Lambert, 2002)
2. Five elements of DST (Paul and Fiebich, 2005)
3. Take six: Elements (Porter, 2005)
4. Six elements of DST (Salpeter, 2005)
5. Story elements (Ohler, 2008)
6. Expanded and modified digital storytelling elements (Robin, 2008)

67
7. Models for digital storytelling and interactive narratives (Shcafer, 2008)
8. A 10-step development checklist for creating an interactive project (Miller,
2012)
This study categorises all eight guidelines by their purpose: 1) general (Lambert,
2002; Porter, 2005; Salpeter, 2005); 2) educational (Ohler, 2008; Robin, 2008); 3)
interactive entertainment (games, applications, or new technologies; Schafer, 2008;
Miller, 2012); and 4) journalism (Paul and Fiebich, 2005). These guidelines are
specifically designed to support the storytellers to create digital storytelling for
different purposes with specific elements. Nevertheless, with many guidelines and
elements, it is difficult to decide which guidelines or elements should be used to
create digital storytelling for cultural tourism. In addition, there are both non-
interactive and interactive forms. Therefore, the creation of a new digital storytelling
guideline for cultural tourism by comparing all elements of the guidelines of experts
is necessary. It will not only involve eliminating some redundant elements, but also refining the focus to be specifically on cultural tourism.
Table 2.19 List of digital storytelling guidelines from eight experts
Author and year
Guidelines/ books
Elements of each guideline Category Citations
1. Lambert (2002)
The seven elements of digital storytelling Digital storytelling: Capturing lives, creating community
• A point of view • A dramatic question • Emotional content • The gift of your voice • The power of the
soundtrack • Economy • Pacing
General 631
2. Paul and Fiebich (2005)
Five elements of DST The elements of digital storytelling
• Media • Action • Relationship • Context • Communication
Journalism 31
3. Porter (2005)
Take six: Elements Digitales: The art of telling digital stories
• Living in your story • Unfolding lessons
learning • Developing creative
tension • Economising the story
told • Showing not telling • Developing
craftsmanship
General 12

68
4. Salpeter (2005)
Six Elements of DST Telling tales with technology: Digital storytelling is a new twist on the ancient art of the oral narrative
• Personal • Begin with the story or
script • Concise • Use readily-available
source materials • Include universal story
elements • Involve collaboration
General 46
5. Ohler (2008)
Story elements Digital storytelling in the classroom: New media pathways to literacy, learning, and creativity
• Point of view • Emotional
engagement • Tone • Spoken narrative • Soundtrack music • Role of video and
performance • Creativity and
originality • Time, story length, and
economy
Education 230
6. Robin (2008)
Expanded and modified digital storytelling elements Digital storytelling: A powerful technology tool for the 21st century classroom
• The overall purpose of the story
• The narrator’s point of view
• A dramatic question or questions
• Quality of the images, video, and other multimedia elements
• Use of a meaningful audio soundtrack
• The choice of content • Pacing of the narrative • Good grammar and
language usage • Economy of the story
detail • Clarity of voice
Education 289
7. Shcafer (2008)
Dimension star models for digital storytelling and interactive narratives Investigations on digital storytelling the development of a reference model
• Concreteness • User contribution • Coherence • Continuity • (Conceptual) Structure • Stage • Virtuality • Spatiality • Control • Interactivity • Collaboration • Immersion
Interactive entertainment (games, applications, new technologies)
11
8. Miller (2012)
A 10-step development checklist for creating an interactive project
• Premise and purpose • Audience and market • Medium, platform and
genre • Narrative/gaming
elements
Interactive entertainment (games, applications, new technologies)
274

69
Digital storytelling: A creator's guide to interactive entertainment
• User’s role and point of view
• Characters • Structure and interface • Fictional world and
setting • User engagement • Overall look and
sound
1. Lambert’s guideline (2006) Lambert was the first person to support Atchley, the first media artist who integrated
oral storytelling and digital media in the late 1980s. Lambert is the founder of CDS
(Centre of Digital Storytelling, USA) and set up workshops to support people to tell
their own stories with digital techniques. After observations of digital storytelling
projects from his workshops, Lambert introduced a guideline with seven elements as
listed in Table 2.20 to guide storytellers to develop their works (Lambert, 2006). This
guideline focuses on non-interactive digital storytelling and telling personal stories.
He always encourages people to present stories about their life and personal
experiences, and to narrate by themselves. This is seen in the most important and
first element, ‘point of view’ (Lambert, 2006).
Table 2.20 The seven elements of digital storytelling (Lambert, 2006)
Elements Description
1. Point of view
What is the main point of the story and what is the perspective of the author?
2. A dramatic question
A key question that keeps the viewer's attention and will be answered by the end of the story
3. Emotional content
Serious issues that come alive in a personal and powerful way and connect the audience to the story
4. The gift of your voice
A way to personalise the story to help the audience understand the context
5. The power of the soundtrack
Music or other sounds that support and embellish the story
6. Economy Using just enough content to tell the story without overloading the viewer 7. Pacing
The rhythm of the story and how slowly or quickly it progresses

70
2. Paul and Fiebich’s guideline (2005) Paul and Fiebich (2005) examined many projects of digital storytelling in their study
from the School of Journalism and Mass Communication, University of Minnesota
and The Media Centre. This guideline is different from others that were mostly
adapted from Lambert’s. Paul (2004) explains that they focused on journalistic
storytelling and interactivity, and describe it as interactive multimedia for journalism
(Paul, 2004; Paul and Fiebich, 2005). They present five elements for creating digital
storytelling as listed in Table 2.21.
Table 2.21 Five elements of digital storytelling (Paul and Fiebich, 2005)
Elements Description
Media
Media refers to the material(s) used to create the story package. Unique to the digital story space is the ability to use any type and combination of media.
Action
Action refers to behaviour of the content, which consists of movement within the content or a movement of content that requires user action.
Relationship Relationship refers to the connection and level of interactivity between the user and content.
Context Context refers to how the story links to the relevant external information or material.
Communication Communication refers to the mode of communication in the progress of story content.
3. Porter’s guideline (2004) Porter has worked as a digital storytelling consultant at summer camps. She
presents her guideline as six elements of digital storytelling in her book, Digitales:
The art of telling digital stories. Porter was inspired by Lambert’s digital storytelling
guideline to tell stories from the storyteller’s point of view and personal experience,
rather than focusing on the narrative that is not related to the storyteller (Porter,
2004).
Table 2.22 Take six: Elements (Porter, 2004)
Elements Description
Living inside your story
Each story should be told from first person perspective, narrated with your own voice with your personal and emotional experience of the event
Unfolding lesson learned
Each story needs to have a point that is revealed in the end
Developing creative tension
Creatively using tension and pacing in evolving the story and at the same time engaging the audience through to the end

71
Economising the story told
Preserving the essence of the tale; using the fewest words and images to make your point
Showing not telling
The use of vivid details to reveal feelings and information rather than being directly stated in the story
Developing craftsmanship
Good craftsmanship creatively combines media elements to convey significant meaning
4. Salpeter’s guideline (2005) Salpeter’s (2005) article, “Telling tales with technology”, presents a guideline of how
to create digital storytelling works, with examples. From her observations of digital
storytelling projects, Salpeter (2005) created six elements to develop digital
storytelling projects as shown in Table 2.23. Kuan, Shiratuddin, and Harun (2012)
suggest that this guideline is similar to Lambert’s (2006) and Porter’s (2004)
guidelines. However, Salpeter does not mention whether this guideline is adapted
from other experts. Like Lambert’s guideline, Salpeter concentrates on telling stories
from the storyteller’s personal experience.
Table 2.23 Six elements of digital storytelling (Salpeter, 2005)
Elements Description
Personal
The narrator is encouraged to personalise the tale, making it clear how the people or events in the story impacted his or her life.
Begin with the story/script
Digital story creators are expected to narrow into their story, writing and even recording their script before they ever begin digitising images, importing sound effects, or using video editing tools.
Concise This means tight editing and a very specific focus. Use readily available source materials
Create a story with the minimum materials and technology.
Include universal story elements
Good stories include essential elements such as conflict, transformation, and closure.
Involve collaboration
Workshop participants give and receive feedback on their stories and scripts.
5. Ohler’s guideline (2008) Ohler (2008), the author of the textbook Digital storytelling in the classroom: New
media pathways to literacy, learning, and creativity, states that he focuses
specifically on how to use digital storytelling in classrooms. From his experience in
using digital storytelling with teachers and students, he created eight elements of
digital storytelling as shown in Table 2.24.

72
Ohler explains in his book that this guideline was inspired by Lambert’s guide, but he
adapted it for educational purposes. However, Ohler does not emphasise the first-
person point of view like Lambert. He states that teachers should not restrict the way
to present to just one pattern; point of view should be illustrated based on the
student’s own decision (Ohler, 2008).
Table 2.24 Story elements (Ohler, 2008) Elements Description
Point of view The range of the point of view that can be employed in digital stories is vast
and is constrained only by whatever perspective it wanted to be imposed Emotional Engagement
Storyteller having enough finesse to attract the audiences (either emotionally or impartially)
Tone Tones may divert story to a different genre or moods Spoken Narrative Storyteller gives narrative the appropriate amount of focus in their story Soundtrack music
Music used in an appropriately supportive role
Role of video and performance
Choose the suitable visual image to be used based on time and technology consuming
Creativity and originality
Teacher must have clear expectation and require a certain percentage of media, as digital tools can encourage students to be creative storytellers, but not guarantee originality
Time, story length, and economy
Limit the story length and input, enforce economy
6. Robin’s guideline (2008) Robin (2008) created this guideline by adapting Lambert’s (Kuan et al., 2012) and
published it in the book Digital storytelling: A powerful technology tool for the 21st
century classroom. The purpose of this guideline was to evaluate students’ works at the University of Houston (Robin, 2008).
Table 2.25 Expanded and modified digital storytelling elements (Robin, 2008)
Elements Description
The overall purpose of the story
Establishes a purpose early on and maintains a clear focus throughout.
The narrator’s point of view
The point of view is well developed and contributes to the overall meaning of the story.
A dramatic question or questions
A meaningful dramatic question is asked and answered within the context of the story.
The choice of content
The content creates a distinct atmosphere or tone that matches different parts of the story. The images may communicate symbolism and/or metaphors.
Clarity of voice Voice quality is clear and consistently audible throughout the presentation. Pacing of the narrative
The pace (rhythm and voice punctuation) fits the story line and helps the audience really “get into” the story.

73
Use of a meaningful audio soundtrack
Music stirs a rich emotional response that matches the story line well. Images coordinated with the music.
Quality of the images, video and other multimedia elements
Images create a distinct atmosphere or tone that matches different parts of the story. The images may communicate symbolism and/or metaphors.
Economy of the story detail
The story is told with exactly the right amount of detail throughout. It does not seem too short or too long.
Good grammar and language usage
Grammar and usage were correct (for the dialect chosen) and contributed to clarity, style, and character development.
7. Schafer’s guideline (2008) Schafer presents her 12-point digital storytelling guideline, called the ‘dimension star
model’, as her PhD research, and published it in the text book Investigations on
Digital Storytelling – The Development of a Reference Model (Schafer, 2008).
However, this guideline focuses mainly on interactive digital storytelling as listed in
Table 2.26.
Table 2.26 Models for digital storytelling and interactive narratives (Schafer, 2008)
Elements Description
Concreteness Origin of the source of the construct of story User contribution User makes contribution to the story structure by interacting with the system Coherence The contextual relationship of the story elements Continuity Describes the smoothness and chronological order of the story Structure Describes the dramatic arc that a story follows and its elements: actors, story
object, themes, and events Cognitive effort Level of the energy necessary for the user to mentally create a story Virtuality
The degree to which the activity of storytelling takes place in the real environment of the user or in a virtual world
Spatiality The impact of (real or virtual) space toward the development of the story Control The degree of controllability: how much the user is able to govern the story’s
progress Interactivity The degree to which the user has the option to be actively engaged in the
environment of the story Collaboration The option to interact with other users in the creation or experience of the story Immersion The degree of immersion: how much the user is drawn into the story
8. Miller’s guideline (2012)
Miller (2012) presents a ten-point checklist for creating interactive digital storytelling
in her book, Digital storytelling: A creator's guide to interactive entertainment. This
book and the guideline emphasise interactive media only (i.e. video games,

74
websites, interactive television, mobile devices, etc.). Moreover, Miller (2012)
compares old and new (interactive or online) storytelling tools and explains how to
adapt this guideline to use in each media.
Table 2.27 A 10-step development checklist for creating an interactive project (Miller, 2012)
Elements Description
Premise and purpose
What is the core idea and purpose of the project?
Audience and market
Who is the user?
Medium, platform, and genre
What is the media (e.g. mobile phones, TV, or the Internet)? What type of platform (hardware)? (e.g. a computer, a console game, a mobile phone) What genre does it fall into? (e.g. simulation or action)
Narrative/gaming elements
What are the major events or challenges during the narrative?
User’s role and point of view
What point of view will the user use? (first person or third person)
Characters What function do characters serve? (adversaries, helper figures or allies) Structure and interface
What is the starting place? How will the user navigate the project?
Fictional world and setting
What is the world and where is it set?
User engagement What is the important goal by the end of this work? Overall look and sound
What kinds of visuals will you use (e.g. video, animation, graphics) Is it realistic or fantasy environment? How do you plan to use sound in your work?
2.6 Inclusive Digital Storytelling for Cultural Tourism – a first combined approach 2.6.1 Why digital storytelling for inclusive design
Nevertheless, digital storytelling is useful and popular, but one problem is that all
content is on a digital format (i.e., digital mobile devices, smartphones, interactive
systems, laptops, and computers). This leads to questions about whether people
(especially older adults and disabled people) are unable to access and understand
this form of technology (Gill and Perera, 2003; Russell et al., 2008; Fuglerud and
Sloan, 2013; Orso et al., 2015; Tsai et al., 2015). In addition, different groups of
users have their own problems, behaviours, and experiences when using digital devices (Gill and Perera, 2003; Alonso, 2015).

75
Hence, this is an opportunity to apply inclusive design to this technology to
understand users’ needs to inform the industry, designers, and researchers and help
create a system that supports all users (Gill and Perera, 2003; Dong et al., 2006;
Chan et al., 2009; Fuglerud and Sloan, 2013). This could be adapted to any product
and service and accessible to the widest range of users possible, irrespective of
impairment, age, or capability. Moreover, there is a need to investigate, understand,
and meet the needs of people (British Standards Institution, 2005; Langdon, Persad
and Clarkson, 2010). This means that this study adopts the concept of inclusive
design for digital storytelling to understand the behaviours of all potential groups of
people, especially older adults and disabled people.
2.6.2 Opportunities for digital storytelling and inclusive design:
• Commercial issues There are only a few studies examining digital technologies applied with inclusive
design for products and services in real life. Gill and Perera (2003) illustrate that the
industry aims for stylish enhanced digital media with a high return on investment, but
digital media applied with inclusive design is a nascent method still trying to find its
feet (Gill and Perera, 2003). Moreover, from the view of businesses, different groups
of disabled users have different needs that must be met. In addition, many ageing
people and people with disabilities, especially visually impaired people, want the
minimum of confusion for practical systems. This is the main issue with combining
business and the inclusive design concept, and leads to a conflict between the industry and some users (Alonso, 2015; Gill and Perera, 2003).
However, by adopting an inclusive design approach and finding out what users want,
the mission of businesses could be complemented. For example, an iTV application
could support an elderly lady to buy groceries, because she may purchase things
that she is not usually able to buy if having to go out on her own (Gill and Perera,
2003). Dong et. al (2006) also propose that inclusive design could be applied for
commercial uses to raise long-term profits and enhance companies’ competitive
edge, and could help to produce better products for all customers.

76
• Barriers for older adults and people with disabilities The use of rich multimedia programs or applications has brought challenges
regarding many issues. While the use of these technologies can improve learning
experiences for students, digital media could become a barrier for some older adults
and people with disabilities (Freire et. al, 2009). Furthermore, recent studies have
raised the concern that current products and services are produced without
consideration of older adults. Researchers explain that this problem may be due to
the declining capabilities of the ageing people and people with disabilities. However,
Chan et al. (2009) conclude that an inclusively modified design based on principles
derived from research results could enable effective use of digital products and
services for all people. Therefore, as the proportion of older adults continues to
increase, research, products, and services applied with the inclusive design concept
should increase to support and satisfy them, as all types of users can experience the
benefit.
In summary, due to recent trends in industrialised countries, the population is older,
living longer, healthier, and wealthier than ever, and is predicted to become even
older (Administration on Aging, 2012; de Barrosa, Leitãob and Ribeiroa, 2014;
European Commission, 2012). Additionally, older adults are becoming more
experienced with new technology and have a better academic education. New
technologies are increasingly widespread throughout the world and are easily
accessible to everyone, including ageing and disabled people, who have traditionally
had difficulties in using new information and communication technologies. While
these technologies are increasingly used to cover all needs, there is insufficient
research about the usability of digital technology for older adults and people with disabilities (de Barrosa, Leitãob and Ribeiroa, 2014).
2.6.3 Challenges of inclusive digital storytelling in this study
• Creating the definition of inclusive digital storytelling Inclusive design in this study is imperative to ensure that everyone can follow digital
storytelling. In order to adapt inclusive design with digital storytelling, this study will
offer a definition of inclusive digital storytelling (IDST) as shown in the Table 2.28,
postulating that Inclusive digital storytelling is narrative entertainment that reaches

77
and engages as many audiences as reasonably possible via digital technology and
media.
Table 2.28 Definition of ‘Inclusive digital storytelling’
Terms Definitions
Inclusive design
The design of mainstream products and/or services that are accessible to, and
usable by, as many people as reasonably possible ... without the need for special
adaptation or specialised design.
Digital storytelling
Digital storytelling is narrative entertainment that reaches the audience via digital
technology and media. Additionally, digital storytelling techniques can make a dry
or difficult subject more alive and engaging to the viewers
Inclusive digital storytelling
Inclusive digital storytelling is narrative entertainment that reaches and engages as
many audiences as reasonably possible via digital technology and media.
• Exploring audiences’ ability to reach and engage with digital storytelling
In order to understand audiences’ ability to reach and engage with digital storytelling
on digital mobile devices, inclusive design is applied to categorise diversity of
cultural tourists in Bangkok, Thailand as: youths (15-24 years); people with
disabilities; older adults (those over 60), established cultural tourists, and people
uninterested in cultural tourism (i.e., non-cultural tourists). This section aims to
present the inclusive digital storytelling (IDST) principle to understand diverse
audiences in terms of reaching (accessibility and understanding) and engaging with
(usefulness, usability, desire) digital storytelling on digital mobile devices to create a
system that supports all users. To achieve this aim, research method - observation is
applied and user journey stages are designed. Five groups of participants are asked
to watch digital storytelling and asked to talk out loud about their feelings, and
understanding at every stage.

78
2.7 Synthesis of the initial framework
Studies in the related areas of cultural tourism, inclusive design, and digital
storytelling were analysed in order to identify relationships, gaps, problems, and
opportunities. In analysing cultural tourism, the main problems were established: lack
of diversity and lack of motivation.
• Lack of diversity (inclusive design and cultural tourism): To broaden and
increase the potential market, this study draws upon inclusive design
principles as ‘understanding and designing for diversity’ by researching
barriers and drivers to engaging in cultural tourism among five different
groups. • Lack of motivation (digital storytelling and cultural tourism): To increase
tourists’ motivation, this study adopts digital storytelling by creating and
proposing a digital storytelling guideline to motivate all five groups to engage
in cultural tourism. • Lack of understanding of the user’s behaviour whilst watching digital
storytelling (inclusive design and digital storytelling): This study adopts
the concept of inclusive design for digital storytelling to understand the
behaviours of all five groups of people, especially older adults and disabled
people, to ensure that everyone can understand digital storytelling.
In order to resolve these problems, the research question was posed: “How could
inclusive design and digital storytelling principles be applied to cultural tourism in
Thailand?”. Moreover, a framework for inclusive digital storytelling to increase
diversity and motivation for cultural tourism in Thailand has been constructed from the literature review and analysis and is presented in Figure 2.13.

79
Figure 2.14 A framew
ork for inclusive digital storytelling to increase diversity and motivation for cultural tourism
in Thailand

80
2.8 Summary
This literature analysis and synthesis has covered three key topics (cultural tourism,
inclusive design, and digital storytelling). It was intended to present the background and review of these three areas as follows:
• Cultural tourism: 1). Types of tourism; 2). The landscape of cultural tourism;
3). The importance, relevance and applications of cultural tourism; and 4).
Cultural tourism in Thailand
• Inclusive design: 1). Definition of inclusive design; 2). History and
background of inclusive design; 3). Inclusive Design, Universal Design, and
Design for All; 4). Applications of inclusive design; 5). Inclusive Tourism; and
6). Principles of inclusive design
• Digital storytelling: 1). Definition of digital storytelling; 2). History and
background of digital storytelling; 3). Applications of digital storytelling; 4).
Digital storytelling in cultural tourism from 2000-2010 and 2010-2016; 5).
Trends in digital storytelling for cultural tourism from 2000-2010 and 2010-
2016; and 6). Digital storytelling guidelines
The following section presents the problems and opportunities of inclusive design
and digital storytelling and the relationship between them in the field of cultural
tourism. As stated in the present chapter, cultural tourism is considered to have a
lack of diversity and motivation. To increase diversity, it could be linked to the
concept of inclusive design, aiming to make products and services accessible to the
widest range of users possible, irrespective of impairment, age, or capability. To
increase tourists’ motivation, this study applies digital storytelling. However, digital
storytelling is available in digital formats only, which could be a barrier for some
groups who are not familiar with the technology. Therefore, this study suggests
forming a link between inclusive design and digital storytelling, in order to understand
and include diverse audiences. Finally, a framework for inclusive digital storytelling to
increase diversity and motivation for cultural tourism in Thailand is proposed to
answer the research question: “How could inclusive design and digital storytelling
principles be applied to facilitate cultural tourism in Thailand?”

81
Chapter 3: Research Methodology 3.1 Introduction
3.2 Research Strategy
3.2.1 Research Strategies in Social Science
Applied and Pure Research Quantitative and Qualitative Research Methods Positivism and Interpretivism Objectivism and Subjectivism Exploratory, Descriptive and Explanatory
3.2.2 Research Strategies in Design
Frayling (1993) Classification of Art and Design Research Cross (1999) Design Research Taxonomy Fallman’s (2008) Interaction Design Research Model
3.2.3 Adopting a Research Strategy
3.3 Research Methodologies in Three Areas: cultural tourism, inclusive design and digital storytelling
3.3.1 Aims
3.3.2 Main Issues
3.3.3 Data-Collection Methods
3.3.4 Sampling Techniques and Sample Size
3.4 A Brief History of Design Research
3.5 Comparison Between Design Research Methodologies
3.5.1 Design Research Methodology (DRM)
3.5.2 Centre for Design Research (CDR) Model
3.5.3 CAD Centre Model
3.5.4 n-dim Model
3.6 Constructing a Design Research Methodology (DRM)
3.6.1 Research Clarification
3.6.2 Descriptive Study 1 (DS1)
3.6.3 Prescriptive Study (PS)
3.6.4 Descriptive Study 2 (DS2)
3.7 Analytical process
3.8 Summary

82
3.1 Introduction
The literature analysis presented in Chapter 2 established that one current problem
in cultural tourism is lack of diversity and motivation. In order to address these
issues, this PhD research focuses upon two fields i.e. inclusive design to increase
diversity, and digital storytelling to increase motivation in cultural tourism, and aims
to present an initial framework embodying these areas. All studies in this research
collect empirical data from potential cultural tourists (Study 1), digital storytelling
experts (Study 2), digital storytelling users (Study 3) and cultural tourism, inclusive
design and digital storytelling experts (Study 4). The research strategy, methodology and methods for data collection and analysis are discussed in this chapter.
Chapter 3 presents the planned research methods and strategies that will be used
throughout. Initially, it starts with reviews and comparisons of various research
strategies, and discusses how they may be adapted for this PhD research in three
key areas: Tourism Studies, Human-Computer Interaction (HCI), and Design
Research. Next, four research methodologies in design area are reviewed and
analysed and the most suitable - Design Research Methodology (DRM) - is
selected for application in this PhD research. Lastly, the DRM is presented in four
stages: research clarification to identify the problems and present the research
question, descriptive study 1 (DS-1) to review and analyse three factors, prescriptive
study (PS) to develop and detail the initial framework by using empirical data from three studies, and descriptive study 2 (DS-2) to evaluate the final framework.
3.2 Research Strategy
Walsh and Wigens (2003) explain that a research strategy is often considered as the
method used to investigate and collect data. Moreover, Nickpour (2012, p. 58)
asserts that a “research strategy is used as a general umbrella term to cover
approaches, perspectives, aspects and types of research”. This section provides an
illustrative review of some relevant research strategies in the social sciences and
design.

83
3.2.1 Research Strategies in Social Science
• Applied and Pure Research
Pure research aims to advance knowledge. The outcomes of pure research are new
theories, ideas or ways of thinking. However, applied research aims to solve specific
research problems and questions, and is applied with a specific goal. In summary,
the difference between these two terms is the research goal: Pure research has no
specific goal, whereas applied research has to answer a particular question
(Blanche, et al., 2006). This PhD is applied research as it concerns a research
question that needs to be addressed.
• Quantitative and Qualitative Research Methods
Robson (2011) points out that qualitative research is exploratory and intended to
gather knowledge, opinions, and motivations in order to develop an initial
understanding. It is used to uncover hidden trends and to delve deeper into main
problems in order to uncover and comprehend the way people think. Methods in this
research mainly depend on verbal narrative and non-structured methods (i.e.
interviews, focus groups, etc.). In contrast, quantitative research is used to gather
numerical data by using statistics to examine cause-effect relationships between
factors, and depends on structured techniques (i.e. surveys, questionnaires, etc.) (Bryman and Teevan, 2005).
This thesis uses a mixed-method (both qualitative and quantitative) to gather
different types of data. In specific, in Studies 1 and 4, a quantitative method is
applied involving a relatively large number of participants (Study 1- 500 participants
and Study 4 -123 participants) and evaluated using statistical analysis. Qualitative
methods are applied in Studies 2 and 3, in order to receive in-depth information from digital storytelling experts (Study 2) and five diverse groups of users (Study 3).
• Positivism and Interpretivism
Crotty (1998) explains that positivism and interpretivism (or anti-positivism) are the
two main research approaches in social sciences. Positivists use the same
quantitative techniques as scientific research to collect data (i.e. surveys, official
statistics, etc.) because of its reliability and validity. In contrast, interpretivists believe

84
that people are different and apply qualitative techniques to collect data (i.e. observations, interviews, etc.)
• Objectivism and Subjectivism
Objectivism focuses on logical theory or knowledge based on empirical or external
facts (Friedman 2003). However, subjectivism states that the truth is based on
personal opinion. A statement or knowledge could be true for one researcher, but false for another. In this thesis, objectivism and subjectivism could be applied as:
Objectivism: Lockton (2013, p. 92) states that design research is “rational
problem solving”. Thus, Study 1 seeks to find out about barriers and drivers in
cultural tourism in Thailand for five groups considered as objectivism to
explain phenomena, solving-problems and presenting empirical facts.
Subjectivism: in this thesis, Study 2 interviews experts about the guidelines of
constructing digital storytelling, and Study 3 observes how users watch digital
storytelling through various devices. Therefore, these studies are considered
as examples of subjectivism because they depend on the opinions of groups
of experts and users.
• Exploratory, Descriptive and Explanatory
Robson (2011) and Yin (2009) point out that exploratory research aims to explore
and set up problems to present insights for further investigation. This type of
research stresses new ideas, understanding and knowledge. However, there is no
plan for statistical analysis.
Descriptive research aims to establish complete and accurate empirical data. The
statistics and research methodology is fully planned (i.e. participants, sample recruitment, methods, etc.).
Explanatory research (or causal research) aims to identify cause-and-effect
relationships, and concentrates mainly on analysing the situation or considering the relationships between variables.
Nickpour (2012) explains that exploratory research is set up as the first stage of
research in order to uncover problems and questions that have not yet been

85
addressed. Next, descriptive research goes beyond exploratory research and
establishes the methodology for the study, which is designed to solve and answer
the research question. Explanatory research is the most comprehensive way of
presenting data and cause-and-effect relationships.
3.2.2 Research Strategies in Design
• Frayling (1993) Classification of Art and Design Research
Frayling (1993) presents three research strategies in design in his text book
Research in Art and Design: research into (art and) design, research through (art and) design, and research for (art and) design.
• Research through (art and) design includes developing new design products
or methods and understanding the design process (Pontis, 2010).
• Research into design includes theoretical and/or historical investigation.
• Research for design focuses on the development of new artefacts in designs to visually present new knowledge (Pontis, 2010).
This research aims to construct a framework that will increase diversity and
motivation in cultural tourism. The approach fits into research into design.
Zimmerman et al., (2007) argue that research through design focuses on making the right things to change the situation from the current in order to improve it.
• Cross (1999) Design Research Taxonomy
Cross (1999, p. 6) states that knowledge in design is classified into three key
sources: people, processes and products. He also presents research design
taxonomy into three main categories as follow:
• Design epistemology: study of designerly ways of knowing
• Design praxeology: study of the practices and processes of design
• Design phenomenology: study of the form and configuration of artefacts
To some extent, there is a degree of design praxeology in the research background,
literature analysis (Chapter 2) and in the three empirical studies that detail the initial

86
framework (Chapters 4, 5, and 6). Design epistemology comes into the evaluation by
inclusive design, digital storytelling and cultural tourism experts on how the
framework is used to increase diversity and motivation in practice (Chapter 7).
• Fallman’s (2008) Interaction Design Research Model
Fallman (2008) presents the triangle shaped model of design research activity in
three main areas: practice, studies and exploration. He focuses mainly on interaction
design that is different from other related areas (i.e. HCI, CSCW, computer science,
etc.).
Design Practice: This concerns interactive design works outside of the academic arena, such as commercial works or client commissions.
Design Exploration: Fallman (2008) points out that the most significant question for
design exploration is “what if?”. It always concerns “problem-solving” Schön (1983)
and “transcendence”(Ehn, 1988). In summary, design exploration emphasises the
synthetic process to seek or test the new idea, asking “what if?”
Design Studies: This closely imitates traditional academic disciplines in design. The
goal is to create an intellectual discipline and contribute knowledge. The main
activities are conferences, workshops and group discussions. Fallman (2008, p. 9)
summarises that “design studies focuses on describing and understanding rather than creating and changing, and aims to form a cumulative body of knowledge”.
3.2.3 Adopting a Research Strategy
A number of research strategies from social sciences were reviewed in terms of their
approach, perspective and purpose. Design research strategies were reviewed
regarding design research categories, taxonomy, types and applications. This thesis adopts research strategies presented in the table below.

87
Table 3.1 Research strategies adopted for this PhD research
Areas Research Strategies
Adopted Research Strategy
General/ Social Sciences
Types Applied research Pure research
Applied research
Quantitative Qualitative
Mixed method Quantitative (Study 1 and 4) Qualitative (Study 2 and 3)
Approach Positivism Interpretivism (Anti- Positivism)
Mixed method Positivism (Study 1 and 4) Interpretivism (Study 2 and 3)
Point of views
Objectivism Subjectivism
Objectivism (Study 1 and 4) Subjectivism (Study 2 and 3)
Purpose Exploratory Descriptive Explanatory
Exploratory and Descriptive
Design Categories Research through design Research into design Research for design
Research into design
Taxonomy Design epistemology Design praxeology Design phenomenology
Design praxeology (Chapters 2, 4, 5, 6) Design epistemology (Chapter 7)
Applications Design practice Design exploration Design studies
Design exploration and Design studies
3.3 Research Methodologies in Three Areas: cultural tourism, inclusive design and digital storytelling
As this PhD research explores and combines three key fields (cultural tourism, digital
storytelling and inclusive design), a number of research methodologies in Tourism
Studies, HCI and Design Research were reviewed, and the strengths and
weaknesses of each methodology were presented in Table 3.2. Accordingly, below
textbooks were identified as having the highest number of citations in their subject area:
• Tourism Studies: Research Methods for Leisure and Tourism: A Practical
Guide (Veal, 2006) - 1771 citations
• Human- Computer Interaction: Research Methods in Human-Computer
Interaction (Lazar, et al., 2010) - 896 citations
• Design research: DRM: A Design Research Methodology (Blessing and Chakrabati, 2009) - 701 citations

88
Table 3.2 Comparisons of research methodologies in three areas
Areas Research methodologies Details Aim Tourism Studies 1. Market research
2. Positioning 3. Consumer behaviour
Human- Computer Interaction
1. Understanding 2. Engineering 3. Re-engineering 4. Evaluating
Design Research 1. Increasing understanding 2. Development and validation of knowledge, methods and tools
Main Issues Tourism Studies Policymaking, planning and managing Human- Computer Interaction
Users, factors and systems
Design Research 1. Lack of overview of existing research 2. Lack of use of results in practice 3. Lack of scientific rigour.
Data-collection Methods
Tourism Studies Ethnography, interviewing, life histories, focus groups, personal diaries, case studies, surveys, content analysis
Human-Computer Interaction
Ethnography, interviews, focus groups, eye tracking, usability testing, task analysis, laboratory experiments, questionnaires
Design Research Observation, participant observation, interviews, simultaneous verbalisation (audio or video taped), diary keeping, recording the evaluation of documents through snapshots, computer simulations, documents (case history, compilation, archival analysis), product data (product family data), questionnaires
Sampling Techniques (How to recruit samples)
Tourism Studies 1. Probability sample 2. Non-probability sampling
Human- Computer Interaction
1. Random 2. Systematic 3. Stratified 4. Multi-stage clustered 5. Quotas
Design Research N/A Sample Size Tourism studies Various calculation formulas
Human- Computer Interaction
N/A
Design Research N/A Validity Tourism Studies Internal and external validity
Human- Computer Interaction
Internal validity, external validity, repeatability
Design Research Internal and external validity

89
3.3.1 Aim
The aim of the Tourism Studies research is: 1) market research (market profiles,
tourism marketing plans), 2) positioning (market segmentation, positioning), and 3)
understanding consumer behaviours (forecasting studies, leisure needs) (Veal,
2006).
The aim of the HCI research is: 1) understanding (finding the meaning of studies
phenomena), 2) engineering (developing new systems), 3) re-engineering (improving
existing systems by redeveloping them), and 4) evaluating (accessing or validating products, theories or methods) (Kjeldskov and Graham, 2003).
The aim of the design research is: 1) increasing understanding of the phenomena of
design in all its complexity, and 2) development and validation of knowledge,
methods and tools to improve the observed situation in design (Blessing and Chakrabati, 2009).
The aim of HCI research and Design Research are similar in certain ways because
they focus on both theory and practice-based development, and start with the
understanding, development (products, systems, methods or tools) and evaluation to
validate and improve. However, the aim of Tourism Studies research concerns
theoretical aspects and links with other business areas (i.e. marketing, consumer behaviour, management, positioning, etc.).
3.3.2 Main Issues
The main issues in Tourism Studies are: 1) policy-making (the statement of
principles), 2) planning (strategies to implement policies), and 3) managing (the process of implementing policies and plans) (Veal, 2006).
The main issues in HCI are: 1) Understanding users (user interfaces, the users), 2)
factors (organisational factors, environmental factors, health and safety factors,
comfort factors, task factors, productivity factors,etc.), and 3) system (constrains, system functionality) (Lazar, et al., 2010).

90
The main issues in design research are: 1) Lacking an overview of existing research,
2) The lack of use of results in practice, and 3) the lack of scientific rigour (Blessing and Chakrabarti 2009).
Main issues in Tourism Research are all areas in business and management:
policymaking, planning and managing. In HCI, the main issues concern science and
technology: users, factors and system. The lack of skills in conducting systematic Design Research needs to be addressed and solved.
Regarding the lack of an overview of existing research, Blessing and Chakrabarti
(2009) explain that even though the number of papers published has increased
rapidly, the standard of them has decreased (i.e. absence of a clear overview,
results, empirical data, technical terms etc.) (Samuel and Lewis, 2001).
Regarding lack of use of results in practice, Blessing and Chakrabarti (2009) argue
that results mostly end up in publications and rarely in practical design work. This is
highlighted because the research aims to improve design in both theoretical and
practical aspects. Hence, the results in design research should affect practical work
as well. Samuel and Lewis (2001) argue that lack of scientific rigour means that
design research is insufficiently complex and disciplined. This requires implementing
a variety of research methods that are unfamiliar to designers.
3.3.3 Data-Collection Methods
All data-collecting approaches in the three areas are qualitative and quantitative.
However, in Tourism Studies, a number of methods focus on secondary data
analysis, such as case studies, content analysis, life histories, etc. In HCI, a number
of methods concentrate on experiments in the laboratory or controlled areas using
technological devices, such as eye tracking, usability testing, etc. Design research
mainly deploys qualitative methods such as observation, interviews, simultaneous verbalisation and focus groups.

91
3.3.4 Sampling Techniques and Sample Size
In Tourism Studies, there are numerous techniques to recruit samples presented in
textbooks, such as probability and non-probability samples. There are also a number
of formulas to calculate sample sizes (Veal, 2006). There are five sampling
techniques to recruit in HCI, but there is no method to calculate the amount of
participants; there are no sampling techniques or sample-size calculations presented
in the textbook. This could be because these techniques are for quantitative, not
qualitative, methods. Design research mainly focuses on qualitative methods,
however this could be seen as a weakness because of lacking scientific rigour (Samuel and Lewis, 2001; Blessing and Chakrabarti, 2009).
3.4 A Brief History of Design Research
Nigel Cross provides a background about design research in the book, Designerly
Ways of Knowing, (Cross, 2007, pp. 119-127) where he argues that Le Corbusier, a
modern movement designer, established the design methods in the 1960s. Initially,
design methodology was perceived as an orderly, systematic procedure for design
solution (Downton, 2003, p. 39; Gedenryd, 1998). Moreover, in 1962, the conference
in design methods firstly established the term ‘design methodology’ as “the
procedures or methods for designing as a valid scientific research subject”
(Gedenryd, 1998, p. 19). Later, the Design Research Society in England and the
Design Studies Journal were founded to support this. The approach has endured from the 1970s up until today (Cross, 2007b, p. 47; Downton, 2003, p. 41).
Next, in 1981, Archer (1995, p. 6) published the textbook, Systematic Methods for
Designers, and presented the science of design research as: “1) systematic, 2) an
enquiry to find answers, 3) goal-directed to follow the task description, 4) knowledge-
directed to go further in providing information, and 5) communicable to be
understandable for audiences”.
However, Cross (2007) argued that, whilst research methods might be necessary in
the area of science, they were not required in the practice of design because results
could not be repeated and should not be copied. Professor Donald Schon also
supported the concept that design practitioners usually know their work better than

92
they could explain. Accordingly, Schon developed the theory of applying social
science methods, rather than fitting design into prescribed and structured
methodologies. At that time, social science researchers began to use ethnography in
their work, and it was thought that this method could help designers to understand
their users’ needs (Frankel, 2009a; Wasson, 2000, p.380). This concept continues to influence designers today.
3.5 Comparison Between Design Research Methodologies
This chapter presents four examples of design research methodologies briefly: 1)
Design research methodology (DRM), 2) Centre for Design Research (CDR) model, 3) CAD Centre model, and 4) n-dim model.
3.5.1 Design Research Methodology (DRM)
This description-based model combines both descriptive and prescriptive elements
in four stages: it starts with a research clarification to the first descriptive study,
followed by prescriptive and the second descriptive study. This model is scientifically
rigorous because it includes an evaluation stage to assess the effect of prescriptive
and practical work, and is suitable for doctoral degree projects that have a three-year timeframe.
Figure 3.1 Design Research Model (Blessing and Chakrabarti, 2009)

93
3.5.2 Centre for Design Research (CDR) Model
This model is an iterative cycle of observation, analysis and intervention. The
strength of this design methodology is that the three steps of observation (observe,
analyse and intervene) are repeated many times. This guarantees the quality of the
research, but could take too much time. Generally, this research methodology requires three years to complete, and so is suitable for a PhD (Tang, 1991)
Figure 3.2 CDR research methodology (Tang, 1991)
3.5.3 CAD Centre Model
This model is based on description and prescription in research. Originally, the CAD
model was created for AI design. Description presents the terms in reality and
prescription presents them as envisaged reality. Although it was created for AI design, it could be adapted to many contexts (Duffy & O'Donnell, 1998).
Figure 3.3 CAD research methodology (Duffy & O'Donnell, 1998)

94
3.5.4 n-dim Model
This model can increase practicality and be used in design research by focusing on
the development of tools in the industry. It presents iterative cycles of description
and implementation at the top and evaluates design tools at the bottom. It can
combine both valid academic contributions with the industry’s needs to create the new tools (Subrahmanian, et al., 1997)
Figure 3.4 n-dim research methodology (Subrahmanian, et al., 1997)
This section compares several useful research methodologies in design summarised
in Table 3.3. Each model combines useful and relevant elements and structures.
However, the majority of these design methodologies mainly focus on qualitative
methods, such as observation (CDR, CAD and n-dim); only DRM focuses on both
qualitative and quantitative methods. Moreover, the CAD and n-dim models focus
specifically on AI in design and engineering design. Therefore, this PhD research
chooses DRM as the main methodology by mixing both quantitative (questionnaires
in Study 1 and online questionnaires in Study 4) and qualitative (interviews in Study
2 and observations in Study 3) methods. DRM allows the researcher to evaluate the
final work (i.e. the research framework in this study) to answer the research question in Descriptive Study 1 (DS-1).

95
Table 3.3 Comparison between design research methodologies
Citation Authors/ year Fields of Application
Research Strategy
Research Method
Design Research Methodology (DRM)
701 Blessing and Chakrabarti (2009)
Design Qualitative Quantitative
All qualitative and quantitative methods
Center for Design Research (CDR) Model
692 Tang (1991) Design, Social Sciences
Qualitative Mainly observation
CAD Centre Model
30 Duffy and O'Donnell (1998)
AI in Design Computer Mode Design Process Management
Qualitative Mainly observation
n-dim Model
45 Subrahmanian, et al., (1997) Engineering
Design
Qualitative Observations of design practice
3.6 Constructing a Design Research Methodology (Adapting DRM)
3.6.1 Research Clarification
This stage is designed to identify the research goals, problems, questions and
related areas or factors to be reviewed. In this study, cultural tourism is analysed in
terms of two research problems: lack of diversity and motivation. This stage will
clarify the current understanding, develop an initial reference model, and propose
approaches to address research problems through introduction and application of
inclusive design to increase diversity, and digital storytelling to increase motivation in
cultural tourism by framing the research question as ‘How could inclusive design and
digital storytelling principles be applied to facilitate cultural tourism in Thailand?’
Lastly, success criteria and measurable success criteria are identified to judge the
RC DS-1 PS-1 DS-2

96
results and evaluate the outcome of the study. Details of this section are presented below:
1. Identifying the overall topics of interest
• Cultural tourism is considered to be a niche market and little attention has
been paid to it.
• Visitors are not diverse and have little motivation to visit cultural places and
engage with the stories and information provided
2. Clarifying the current understanding and expectations
• To increase the diversity of tourists, this study applies inclusive design
principles as ‘understanding and designing for diversity’.
• To increase the motivation of tourists, this study adopts digital storytelling as
‘the guideline to increase motivation’.
3. Clarifying criteria, main questions and hypotheses
• Research question: “How could inclusive design and digital storytelling
principles be applied to facilitate cultural tourism in Thailand?” • Success criteria: Creating the IDST for CT framework to address increasing
diversity and motivation in CT, supported with empirical data from three
studies
• Success measurable criteria: Usability and desirability of the IDST for CT framework
4. Selecting type of research
• Study 1: Quantitative (questionnaire)
• Study 2: Qualitative (interview)
• Study 3: Qualitative (observation)
• Study 4: Quantitative (online questionnaire)
5. Determining areas of relevance and contribution
• Cultural tourism, inclusive design and digital storytelling

97
6. Formulating Overall Research Plan
Figure 3.5 The overall research plan adapting with DRM
Goals
Understanding
Support Evaluation
Research clarification“How could inclusive design and digital storytelling principles be applied to
facilitate cultural tourism in Thailand?”
Descriptive study I
Review & analysis: digital storytelling, inclusive design and cultural tourism
Creating the initial framework
Prescriptive Study
Study 1: Barriers and Drivers in Cultural Tourism for Five Groups in ThailandStudy 2: Constructing the Digital Storytelling Guideline to Increase Motivation in Cultural Tourism for Five Groups in ThailandStudy 3: Inclusive Digital Storytelling to Understand Audience Behaviour
Descriptive Study II
Study 4: Evaluation of the framework for increasing diversity and motivation in cultural tourism

98
3.6.2 Descriptive Study 1 (DS1)
The aim of DS-1 is to provide a better understanding of the current situation in this
PhD research by identifying, reviewing and analysing the three main factors: 1)
Cultural Tourism, 2) Inclusive Design and 3) Digital Storytelling. In review-based DS-
1, the importance and various applications of these factors are defined. This study
reviews examples and trends of digital storytelling works in cultural tourism from two
time periods: 2000-2010 and 2010-2016.
Comprehensive DS-1 analyses the opportunities between three factors to explain
their relation to each other before considering literature concerning those
relationships as: 1) inclusive design and cultural tourism, 2), digital storytelling and
cultural tourism and 3) digital storytelling and inclusive design. Lastly, the initial
framework for inclusive digital storytelling to increase diversity and motivation for
cultural tourism in Thailand is created from the literature review; the analysis is
presented at the end of Chapter 2. This initial framework will be developed and
addressed in detail in the prescriptive stage, which will be composed of three studies
and evaluated in descriptive study 2.
Table 3.4 Review-based and comprehensive in this thesis Review-based DS-I
Cultural tourism
Inclusive design
Digital storytelling
-Types of tourism -The landscape of cultural tourism -The importance, relevance and applications of cultural tourism -Cultural tourism in Thailand
-Definition of inclusive design -History and background of inclusive design -Inclusive Design, Universal Design, and Design for All -Applications of inclusive design -Inclusive Tourism -Principles of inclusive design
-Definition of digital storytelling -History and background of digital storytelling -Applications of digital storytelling -Digital storytelling in cultural tourism from 2000-2010 and 2010-2016 -Trends in digital storytelling for cultural tourism from 2000-2010 and 2010-2016 -Digital storytelling guidelines
RC DS-1 PS-1 DS-2

99
Comprehensive DS-I Challenges and opportunities in Cultural Tourism
Inclusive Digital Storytelling for Cultural Tourism – a first combined approach
-Cultural Tourism - issues and potentials -Increasing diversity in Cultural Tourism -Why ‘inclusive design’ for cultural tourism? -Opportunities for inclusive design within cultural tourism -Increasing motivation in Cultural Tourism -Why digital storytelling for cultural tourism? -Opportunities for digital storytelling within cultural tourism
-Why digital storytelling for inclusive design -Opportunities for digital storytelling and inclusive design: -Challenges of inclusive digital storytelling in this study
3.6.3 Prescriptive Study (PS)
Blessing and Chakrabarti (2009) state that design research is used to support and
improve design in both academia and industry. Moreover, developing design support
in a research project should be systematic. Therefore, empirical data, results, and
studies collected systematically provide vital information for the development of
design frameworks and principles for product development.
The prescriptive study aims to develop and strengthen the initial framework
presented previously by collecting empirical data and presenting the results of the
relationship from three key areas – cultural tourism, inclusive design and digital
storytelling. This stage (PS-1) sets up three studies and reports with the criteria of
the prescriptive study from DRM: 1) Task Clarification, 2) Conceptualisation, 3)
Elaboration, 4) Realisation, and 5) Support Evaluation (Blessing and Chakrabarti, 2009).
RC DS-1 PS-1 DS-2

100
Study 1: Barriers and Drivers in Cultural Tourism for Five Groups in Thailand
• Problem: Most of the tourism industry focuses upon only 15 per cent of
tourists • The desired situation: This study tries to seek out the remaining 85 per cent
of tourists to increase diversity in cultural tourism
• Aim: To investigate what are the barriers and drivers for cultural tourism in the
context of five different groups.
• Value: The industry and government organisations may be better able to
recognise the significance of neglected groups and increase accessibility for
these people.
• Method: Quantitative method; 500 questionnaires (100 for each group) • Participants: Five groups of people (1. Youth; 2. Older adults; 3. Disabled
people; 4. Non-cultural tourists; 5.Cultural tourists)
• Validation: 1).Yamane’s formula to calculate sample size; 2). Skip interval -
as the criteria to select samples; 3). Pre-test and Pilot test; 4). Reliability test
was done by using Chronbach’s Alpha and 5). 2 multiple coders to compare
open-end answers • How to evaluate: 1). Mean and S.D. scores and 2). Coding method
• Research question 1: What are the barriers and drivers in cultural tourism
among five different groups?
• Research question 2: Are there any differences in answers between close-ended and open-ended questions?
Study 2: Constructing the Digital Storytelling: Guideline to Increase Motivation in Cultural Tourism for Five Groups in Thailand
• Problem: 1).Visitors have no motivation to read the story displayed behind
exhibitions and visit actual sites and 2). There is no DST guideline focusing
specifically on cultural tourism
• The desired situation: The DST guideline to increase the motivation in CT • Aim: To create and propose a digital storytelling guideline to motivate five
groups in Thailand to engage in cultural tourism.
Value: 1).This study centralises many general guidelines of digital storytelling

101
into the single guideline and 2). It creates a new digital storytelling guideline
for five groups representing specifically the motivation for cultural tourism.
• Method: Qualitative method; The 17 structured interviews focus on how to
use the guideline of digital storytelling to motivate cultural tourism for the five
groups.
• Participants: Four groups of people;1.) Thai academic experts; 2.) Thai
young industrial experts; 3.) Thai experienced industrial experts and 4.)
International academic and industrial experts
• Validation: 1). three multiple coders to create DST guideline; 2). Pilot test
and 3). two Multiple coders to compare interview results
• How to evaluate: Coding method • Research question 1: What is the digital storytelling guideline that focuses
specifically to cultural tourism?
• Research question 2: How can the digital storytelling guideline be used to
motivate cultural tourism for five different groups in Thailand?
Study 3: Inclusive digital storytelling to understand audiences’ behaviour
• Problem: DST is useful and motivated, but some people (especially older
adults and disabled people) cannot access and understand this form of
technology • The desired situation: Insights into diverse audiences in terms of reaching
and engaging with digital storytelling
• Aim: To understand diverse audiences in terms of reaching (accessibility and
understanding) and engaging with (usefulness, usability, desire) storytelling
on digital devices.
• Value: 1). Insights about diverse audiences in terms of reaching of and
engaging with DST and 2). This study can inform industry, designers, and
researchers to understand diverse users and create DST that includes and
supports various groups of users
• Method: qualitative method; 50 observations (10 for each group). The
participants will be asked to use a mobile device (ipad) to visit Youtube and
watch 1.) short movie and 2.) short animation

102
• Participants: Five groups of people (1. Youth; 2.Older adults; 3. Disabled
people; 4. Non-cultural tourists; 5.cultural tourists)
• Validation: 1). Watching recorded video and discussion after observation with
three staff; 2). Pilot test and 3). Three multiple coders to compare results
• How to evaluate Mean scores and coding method • Research question 1: What are the diverse audiences’ behaviour in terms of
reaching with digital mobile devices
• Research question 2: What are the diverse audiences’ behaviour in terms of
engaging with digital mobile devices
3.6.4 Descriptive Study 2 (DS2)
This stage evaluates the assumptions presented in the initial framework in DS-1 and
supported with empirical results from PS (Blessing and Chakrabarti, 2009). It
presents the structure to evaluate the DRM criteria accordingly: 1) reviewing existing
documentation, 2) determining evaluation focus, and 3) developing evaluation plan(s) (Blessing and Chakrabarti, 2009).
This research provides the measurable success criteria in the Research Clarification
stages (RC) as: usability and desirability of the IDST for CT framework. This is the
purpose of the evaluation study, and reason behind using 120 online questionnaires
that will be distributed into four main users of this framework, both in Thailand and internationally.
1. Reviewing existing documentation
• Study 1: Barriers and Drivers in Cultural Tourism for Five Groups in Thailand
• Study 2: Constructing the Digital Storytelling: Guideline to Increase
Motivation in Cultural Tourism for Five Groups in Thailand
• Study 3: Inclusive digital storytelling to understand audiences’ behaviour
RC DS-1 PS-1 DS-2

103
2. Determining evaluation focus
• Aim: To evaluate the usability and desirability of a framework for increasing
diversity and motivation in cultural tourism
• Method: Online questionnaires distributed to four groups; 1).Thai cultural
tourism experts and students; 2.) Thai inclusive design expert and students;
3.) Thai digital storytelling experts and students; and 4). International experts from all above groups
3. Developing Evaluation Plan(s)
• Online questionnaire:18 items of questions (14 Likert scale and 4 open-
ended questions)
• Statistics: 1). Mean scores and S.D. and 2). ANOVA test to identify the differences between the groups.
4. Undertaking evaluation(s)
• See results on Chapter 7
3.7 Analytical process
3.7.1 Study 1: barriers and drivers in cultural tourism for five groups in Thailand
Qualitative analysis
The key findings of open-ended answers were synthesised into a qualitative report.
Responses to open-ended questions were analysed and structured using thematic
coding analysis (Saldaña, 2015), and multiple coders (one senior and two junior
researchers) in order to increase the reliability of data analysis.
In Chapter 4, Table 4.10 presents the barriers and Table 4.11 the drivers to cultural
tourism among five groups, identified through their open-ended responses.

104
Validity (accuracy of observation)
• Providing guidelines, checklists, objectives, and processes to all staff at all
stages of data collection to ensure each staff member explained and collected
data correctly.
• It can be assumed that qualitative findings – barriers and drivers for cultural
tourism in Thailand – were likely valid, due to the overall high number of five
groups of participants included in all five groups (N=500).
• To translate the data correctly, the researcher translated all results from Thai
to English. Next, the researcher asked a professional translator to double-
check and correct all data again.
• A systematic checking of coding by three coders (one senior and two junior
researchers) of the open-ended answers coded manually.
• A systematic final quality check of the coding by all coders to discuss and
summarise all data.
Reliability (replicability)
This study can be assured by testing using a pre-test and pilot test, with content
validity ensured by three experts (one design expert, one language expert, and one
statistics expert). In addition, the result from a reliability test applying Cronbach’s
alpha was 0.907 > 0.900 (excellent) (Burns and Bush, 2013). This means that this
questionnaire had a very high standard of reliability.
The process of data collection and coding analysis can guarantee the validity of our
analyses and support reliability by providing all details in the questionnaire;
additionally, staff members were guided properly to understand the process and to
give advices to respondents. In case of coding, all coders were presented with
details and objectives before coding to understand the logic of the processes
involved.
3.7.2 Study 2: constructing digital storytelling – guideline for increasing motivation in cultural tourism for five groups in Thailand

105
Qualitative analysis
The results of the interview material were transcribed from voice recordings to documents
and translated from Thai to English by the researcher. A professional translator was asked to
double-check and correct (if needed) all interview transcripts. All interview data were
analysed and coded by three coders (one senior and two junior researchers) using thematic
coding analysis (Saldaña, 2015), thus increasing the reliability of data analysis. In Chapter 5,
Table 5.6 illustrates digital storytelling guidelines for cultural tourism by 17 experts.
Validity (accuracy of observation)
• By explaining backgrounds (how to create the digital storytelling guideline),
results from the previous study (barriers and drivers for all five groups) aim,
objectives and processes to all interviewees to ensure that each participant
can understand the questions clearly.
• All interviews, both online (Skype) and face-to-face, were video and voice
recorded to be double-checked and proofed, if necessary.
• To translate the data correctly, firstly, the researcher translated all interview
results from Thai to English. Secondly, all data were proofed by a professional
translator to double-check and correct (if needed) data.
• A systematic checking of coding of the interviews, coded manually, by three
coders (one senior and two junior researchers).
• A systematic final quality check of the coding by all coders to discuss and
summarise all data.
• All interviewees were selected from four groups with high standards of criteria:
(1) Thai academic experts with an academic position or a doctoral degree in a
related area; (2) Thai industrial experts with more than five years of
experience; (3) young Thai industrial experts with less than five years’
experience; (4) international academic and industrial experts.
Reliability (replicability)
Initially, the interview questions and plans were tested using three pilot test cases
(Thai academic experts, Thai industrial experts, and young Thai industrial experts);
this process reviewed the understanding of questions, the flow of the structured

106
interview, the timing of interviews, and assisted in developing the interview into its
most recent version.
The interview process began by reviewing the backgrounds and findings of the first
study to better understand several groups of people’s needs. In the case of coding,
all coders were presented with findings from the first study, and the background of
digital storytelling guidelines. This process also aimed to provide a better
understanding of the logic of the interviews.
3.7.3 Chapter 6: study 3 – inclusive digital storytelling to better understand audience behaviour
Qualitative analysis
Following observations, the researcher and two staff members watched the recorded video
of the interviews and transcribed the voice recordings into spreadsheets. Next, the
researcher translated from Thai to English and asked a professional translator to double-
check their translation. Then, to obtain a coding analysis from the qualitative data, using
thematic coding analysis (Saldaña, 2015), three coders (one senior and two junior
researchers) discussed and grouped all comments into themes and sub-themes, as negative
and positive comments.
Validity (accuracy of observation)
• Prior to the observation stage, the researcher clearly explained all 11 user
journey stages, as well as the aims and objectives of each stage to all staff
members.
• In this observation, it can be assumed that the qualitative data – comments
from 11 user journey stages for all five groups – were likely valid, due to the
number of participants from five groups (N=50)
• In terms of translation, the researcher translated all transcripts from Thai to
English. Then, a professional translator rechecked the translation and
discussed it with the researcher.
• A systematic checking of the coding of observation data, coded manually, by
three coders (one senior and two junior researchers).

107
• A systematic final quality check of the coding by all coders to discuss and
summarise all data into themes and sub-themes, as presented in this chapter.
Reliability (replicability)
Prior to observations, this study set up a pilot test with four people (two older adults
and two disabled people) to test timing and errors while watching digital storytelling.
The results indicated that many participants felt awkward about being recorded with
the video camera placed at the front of the interviews. Hence, the researcher
changed from using a DSLR camera to using a GoPro, a much smaller-sized
camera. Additionally, the researcher reduced some user journey stages to save time.
Regarding coding analysis, all three coders were presented with the aims and
objectives of the dissertation, information about previous studies, as well as the
current study as a third body of research to better understand the logic of the current
study.
3.7.4 Study 4: evaluation of a framework for inclusive digital storytelling for cultural tourism (IDST for CT) in Thailand
Qualitative analysis
The answers to four open-ended questions (items 15 to 18) were analysed and
transcribed into a qualitative report. Data to open-ended questions were analysed by
multiple coders (one senior and two junior researchers) and structured using
thematic coding analysis (Saldaña, 2015) in a bid to analyse answers to research
question four: what changes or additions should be made to improve IDST for the CT
framework? as well as research question five: what do participants like and dislike in
the IDST for CT framework?
Validity (accuracy of observation)
• The initial version of the online questionnaire was reviewed by three experts
in different areas and developed into the final version.
• Due to the number of respondents (N=123), it can be assumed that qualitative
data were likely valid.

108
• To translate the open-ended answers correctly, the researcher translated all
results from Thai to English. Next, the researcher asked a professional
translator to double check the translation and to make corrections where and
if needed.
• A systematic checking of the coding of the open-ended answers, coded
manually, by three coders (one senior and two junior researchers).
• A systematic final quality check of the coding by all coders to discuss and
summarise all data.
Reliability (replicability)
This study was verified using a pilot test that included nine participants (including designers,
cultural tourism users, and digital storytelling users). Participants’ comments addressed the
topics of user-friendliness, confusion, and suggestion. As a result, the final version of this
online questionnaire was reduced from 26 to 18 items. Regarding coding analysis, all coders
were presented with the primary aim, objectives, research problems, and questions of this
dissertation, as well as the background of the fourth study to better understand the logic of
this online survey.
The process of data collection can support reliability by classifying participants into four
groups, using criteria such as: (1) Thai cultural tourism users (academia, industry, students);
(2) Thai inclusive design users (academia, industry, students); (3) Thai digital storytelling
users (academia, industry, students); (4) international inclusive design, digital storytelling,
and cultural tourism users (academia, industry, students).
3.8 Summary
• Research Strategies in Social Sciences and Design
This PhD research is considered to be applied research because of its specific goals
and mixed methodology (i.e. quantitative and qualitative research). Additionally, it
adopts a mixed method research approach which concerns Positivism and
Interpretivism. Objectivism (Studies 1 and 4) and Subjectivism (Studies 2 and 3) are
applied as points of view. Lastly, the research purpose is set up as Exploratory and Descriptive.

109
This thesis is recognised as ‘Research into design’, as design taxonomy, design
praxeology (Chapters 2, 4, 5 and 6) and design epistemology (Chapter 7) are applied. This study is considered as design exploration and design studies.
• Comparison of Research Methodologies in Tourism Studies, HCI and Design Research
This chapter started with the comparisons between three areas in terms of research
methodologies. Firstly, Tourism studies aims to link data with other business sectors
and focuses on main issues in business and management areas. In terms of data
collection, a number of methods also focus on secondary data analysis. Additionally, there are many techniques to collect samples and formulas to calculate sample size.
In HCI research, the aims are similar to design research in that they try to create
both theory and practice-based development. The main issues in HCI are science
and technology. Methods in data collection are set up in the laboratory with
technological devices. Additionally, there are five sampling techniques, but there is
no method to calculate the number of participants.
Some of the main issues in design research are: lack of proper research and not
knowing how to use it in reality. Design research is mainly qualitative, which is why it
sampling techniques and methods for calculating sample size are not generally very common.
This study has tried to ensure some of the main issues in design research are
addressed, the lack of using results in practice and the lack of scientific rigour by
offering empirical results that designers, researchers or tourism industry
professionals can make real use of. This study has adoptedtechniques to collect
samples and formulas to calculate sample sizes from Tourism Studies in Study 1
and statistics to present similarities and differences in Study 4 in order to strengthen
scientific rigour.
• Comparison of Design Research Methodologies
This chapter reviewed and compared four research methodologies in design (DRM,
CDR, CAD Centre and n-dim models) and concluded that three out of four are

110
qualitative. Furthermore, CAD n-dim models are mainly used on AI in design and
engineering design. Although the CDR model could be applied in both Design and
Social Science areas, this methodology requires a three-year study period that only
uses observation. However, only DRM could be applied in both qualitative and
quantitative methods and focused specifically on design areas. Moreover, DRM also
includes an evaluation stage for researchers or designers to evaluate the final results.
• Designing a Research Methodology (DRM)
The four stages of DRM as applied in this research are as follows:
Research Clarification: Two of the main problems in cultural tourism are lack of
diversity and motivation. This research intends to address these two issues by
introducing and applying two external fields, i.e. inclusive design to increase
diversity, and digital storytelling to increase motivation in cultural tourism. Therefore,
the research question is proposed as: “How could inclusive design and digital storytelling principles be applied to facilitate cultural tourism in Thailand?”
DS-1: This stage reviews and analyses the three main fields in order to provide a
better understanding of the current situation in cultural tourism and the ways forward:
1) Cultural tourism, 2) Inclusive design and 3) Digital storytelling. In review-based
DS-1, these three fields are defined, and their importance and various applications
are considered. The opportunities between three fields and the relationships
between them are illustrated in comprehensive DS-1. Lastly, the initial framework for
inclusive digital storytelling (IDST) to increase diversity and motivation for cultural tourism in Thailand is constructed, developed in PS, and evaluated in DS-2.
PS: In order to develop and detail the initial framework by collecting empirical data,
this stage presents three studies with the link between them: 1) Study 1 illustrates
the link between inclusive design and cultural tourism, 2) Study 2 illustrates the link
between digital storytelling and cultural tourism, and 3) Study 3 represents the link between inclusive design and digital storytelling.
DS-2: This stage evaluates the final framework presented in DS1, detailing the empirical data from three studies in PS to answer the research question.

111
Table 3.5 design research methodology (DRM) in this study
Stages Studies and methods Results 1. Research Clarification
- Identify research problems - Set up research question
“How could inclusive design and digital storytelling principles be applied to facilitate cultural tourism in Thailand?”
2. Descriptive Study 1 (DS1)
Literature review, analysis and synthesis
Initial framework for inclusive digital storytelling
3. Prescriptive study (PS)
1.Inclusive design and cultural tourism (500 Questionnaires)
Barriers and drivers to cultural tourism for five groups in Thailand
2. Digital storytelling and cultural tourism (17 experts interviews)
The digital storytelling guideline for five groups in Thailand
3. Inclusive design and digital storytelling (50 observations)
Five groups reaching of and engaging with digital storytelling
4. Descriptive Study 2 (DS2)
Evaluation of the final framework (126 online questionnaire)
Framework evaluated

112
Chapter 4: Barriers and Drivers in Cultural Tourism for Five Groups in Thailand
4.1. Introduction
4.2. Research Method
4.2.1 The sample sizes
4.2.2 Systematic sampling
4.2.3 Questionnaire development
4.2.4 Pre-test and Pilot test
4.3 Research question1: what are the barriers and drivers in cultural tourism among five diverse groups?
4.4 Discussion for research question1
4.5 Research question 2: Are there any differences in answers between scaling and open-ended questions?
4.6. Summary
4.6.1 Research question Research question 1 Research question 2
4.6.2. Study implications
Marketing Management
4.6.3 Study Limitations
1. The sample size
2. Likert scaling questionnaire
3. Lack of prior research
4. Access
5. Limited use in Thailand
6. Gender imbalance
4.6.4 Detailing the framework

113
4.1. Introduction
The literature review chapter illustrated useful information about the relationship
between three key factors; inclusive design, digital storytelling and cultural tourism to
create the framework for inclusive digital storytelling to increase diversity and motivation for cultural tourism in Thailand for Thai people.
However, in order to complete the final framework, this chapter focused on one of the
main problems in cultural tourism that is ‘lack of diversity’ and presented results of
the link between inclusive design and cultural tourism. This is because cultural
tourism is a niche market to which little attention has been paid, especially compared
to mass tourism. To broaden and increase the potential market, this study draws
upon inclusive design principles to identify barriers and drivers in cultural tourism for
five groups: 1) youth; 2) people uninterested in cultural tourism (non-cultural tourists);
3) older adults; 4) people with disabilities; and 5) cultural tourists. By researching
barriers and drivers to engaging in cultural tourism among different groups, the
industry and government organisations may be better able to recognise the
significance of neglected groups and increase accessibility for these people. The aim
and objectives of this chapter are in the Table 4.1. Moreover, this chapter aims to answer the research questions:
• Research question 1: What are the barriers and drivers in cultural tourism
among five diverse groups?
• Research question 2: Are there any differences in answers between close-
ended and open-ended questions? Table 4.1 Aim and objectives of the study
Aim Objectives 1. To investigate what are the barriers and drivers for cultural tourism in the context of five different groups.
1.1 To identify the barriers (why they do not) for cultural tourism among five groups of potential customers 1.2 To identify the drivers (why they do) for cultural tourism among five groups of potential customers 1.3 To compare the differences between close-ended and open-ended answers to seek out the neglected barriers and drivers within the context of Thailand’s cultural tourism.

114
Figure 4.1 The link between inclusive design and cultural tourism in this chapter
To achieve these objectives, 500 questionnaires were distributed to five groups in
various locations in Bangkok, Thailand from 1 to 30 August 2015. This study, which
applies an inclusive design principle, is differentiated from other research by
categorising all potential cultural tourists in Thailand into five groups (youth, older
adults, people with disabilities, non-cultural tourists, and cultural tourists), exploring
and comparing their barriers and drivers for cultural tourism using both Likert-scaling
and open-ended questions. Although cultural tourism is the main source of income
for Thailand, the study of cultural tourism from the tourist’s perspective is not enough.
Often the studies in this area are not directly related to cultural tourism. Therefore,
this is a good opportunity to investigate the barriers and drivers in cultural tourism of
five different groups.
4.2. Research Method
4.2.1 The sample size
This quantitative-causal study seeks to identify the drivers and barriers that affect the
willingness of different groups to engage in cultural tourism. It focuses on five groups
of people in Bangkok, Thailand: youth (fifteen to twenty-four years), people with

115
disabilities, older adults (over sixty years), established cultural tourists, and people
uninterested in cultural tourism (i.e., non-cultural tourists). According to the study
from Mandala Research, LLC (2013), most cultural tourists take around 3.6 trips
annually. These statistics have been reported by other studies for more than twenty
years (Mandala Research, LLC 2013). Therefore, this study uses the criteria of the
number of trips to identify cultural tourists. Tourists at the museum will be asked how
many cultural trips they make annually. If more than four trips are made per year, they will be considered as cultural tourists.
The sample sizes for the five groups were calculated using Yamane’s formula
(Yamane 1967) with an error margin of 10 percent and with a confidence coefficient
of 90 percent. The number of populations in this study is known (finite population).
Hence, the Yamane formula is more appropriate than other formulas to calculate
sample sizes. The sample size for the study was calculated from the Bangkok
population: youth (1,403,096), older adults (800,036), and people with disabilities
(65,966) (National Statistical Office 2015).
Figure 4.2 Yamane’s formula to calculate sample size (Yamane, 1967)
Where, n = the sample size, N = the size of population, e = the error of 5 percentage points.
Table 4.2 Bangkok population calculated for sample size of 90% confidence
Bangkok population Total Sample size of 90% confidence Youth (15-24 years) 1,403,096 n = 1,403,096
1 + 1,403,096 x (0.10) 2 n = 99.99
Older adult (over 60 years)
800,036 99.98
People with disabilities
65,966 99.84

116
Table 4.3 Total population in this study
No. Population Number of participants: 1. Youth 100 2. Older adult 100 3. Disabled people 100 4. Non-interest cultural tourists 100 5. Cultural tourists 100
To gather information, 500 questionnaires (100 for each group) were distributed in
underground train stations, parks, and cultural and historical sites for a period of one
month. Respondents were asked to indicate the extent to which various barriers and
drivers were important to them on a seven-point Likert scale (1 = strongly disagree, 2
= disagree, 3 = somewhat disagree, 4 = neutral, 5 = somewhat agree, 6 = agree and
7 = strongly agree). Many studies recommend that data from Likert scale would
become less accurate when below five or above seven (Bouranta, Chitiris, &
Paravantis, 2009). Moreover, Lewis (1993) suggests that seven-point Likert scale
could result in stronger correlations with t-test or any statistic results. The time for
completion of the questionnaire varied from five to ten minutes. The questionnaire
consists of three parts: Part 1 consists of eight questions concerned with
demographic profile using the “nominal scale” (gender, age, education, marital
status, type of disability, monthly income). Part 2 consists of twenty-five questions
focused on barriers in cultural tourism. Part 3 consists of twenty-six questions
regarding drivers in cultural tourism, using the Likert scale and open-ended questions.
4.2.2 Systematic sampling
Systematic sampling, a way to select a random sample systematically, and skip
interval were used as the criteria to select samples in this study. “Skip interval is
calculated by dividing the number of names on the list by the sample size in the
following formula: Skip interval = population list size/ sample size” (Burns and Bush, 2013, pp.337)

117
Table 4.4 Skip interval for five groups
Diversity Location to distribute questionnaires
Population in each location/ a day
Skip interval
Youth Siam train station 295,272
295,272/ 100 = 2,952
Older adults Lumpini Park 12,000
12,000/ 100 = 120
Disabled people
Baanphrapradaeng disability foundation
490 490/ 100 = 4.9
Non-cultural tourists
Asok, Sala Daeng, Victory monument train station
197,079
197,079/ 100 = 1,970
Established cultural tourists
Museum siam 694
694/ 100 = 6.94
From the table 1, a skip interval of youth at Siam train station was 2,952. This means
that every 2,952 youth was selected into the sample. For older adults, a skip interval
at Lumpini Park was 120 and 4.9 for disabled people at Baanphrapradaeng disability
foundation. A skip interval for Non-cultural tourists is 1,970 and 6.94 for cultural tourists.
4.2.3 Questionnaire development
From the literature review, there is a range of perceived barriers and drivers. This
study collects and groups them into ten broad themes and adopts them as barriers
and drivers in the questionnaire.
Table 4.5 Barriers and drivers collected from literature review
Barriers Drivers
1. Personal interest
• Uncomfortable experience, not entertaining (Davies and Prentice, 1995; Migliorino and Cultural Perspectives, 1998; Kay and Wong, 2009; OMRG, 2006)
• Not relevant or of interest; have different interests (Crawford and Godbey, 1987; Henderson, et al., 1988; Bennett, 1994; Davies and Prentice, 1995; Tian, et al.,1996; Prentice, et al., 1997; Milner, et al., 2004; National Heritage Board – NHB (2005) Old and unfashionable (National Heritage Board –
1. New experience
• New experiences and different lifestyles (Crompton, 1979; You, at el., 2008; Shi, 2010)
• Meeting new and different people (Kozak, 2002; Hsu, Cai and Wong, 2007; You, at el., 2008; Jonsson and Devonish, 2008; Mohammad and Som, 2010; Shi, 2010; Allan, 2013)
• Personal rewards (Hsu, Cai and Wong, 2007)
2. Escaping from Daily Routine
• Visiting a place that I have not visited

118
NHB (2005); Rentschler, 2006; Swanson and Davis, 2006; Kay, Wong and Polonsky, 2009)
2. Time
• Lack time to attend (Crawford and Godbey, 1987; Henderson, et al., 1988; Davies and Prentice, 1995; Tian, et al., 1996; Samdahl and Jekubovich, 1997; Migliorino and Cultural Perspectives, 1998; Geissler, et al., 2006; Kay and Wong, 2009; Milner, et al., 2004; Rentschler, 2006)
• Inconvenient opening times and activity schedules (Crawford and Godbey, 1987; Henderson, et al., 1988; Davies and Prentice, 1995; Tian, et al., 1996; Samdahl and Jekubovich, 1997; Migliorino and Cultural Perspectives, 1998; Milner, et al., 2004; Geissler, et al., 2006; Rentschler, 2006; Kay and Wong, 2009)
3. Understanding
• Lack of past engagement (Crawford and Godbey, 1987; Bennett, 1994; Davies and Prentice, 1995; Tian, et al., 1996; Prentice, et al., 1997; Kay and Wong, 2009)
• Poor past experience (Crawford and Godbey, 1987; Bennett, 1994; Davies and Prentice, 1995; Tian, et al., 1996; Prentice, et al., 1997; Kay and Wong, 2009)
• Lack of information about where to go (Blazey, 1987; Huang and Tsai, 2003)
4. Health
• Physical well-being (Rose and Graesser, 1981; Blazey, 1987; Romsa and Blenman, 1989; Huang and Tsai, 2003)
• Medical problems (LaGrow, 1990) 5. Finance
• Lack of concession pricing (Henderson, et al., 1988; Tian, et al., 1996; Prentice, et al., 1997; Samdahl and Jekubovich, 1997; Kirchberg, 1998; Rentschler, 2006; Kay and Wong, 2009)
• Overall and supplementary costs (Blazey, 1987; Romsa and Blenman, 1989; Davies and Prentice, 1995; Migliorino and Cultural Perspectives, 1998; Huang and Tsai, 2003; Rentschler, 2006; Kay and Wong, 2009)
6. Fear
• Fear of travelling alone (LaGrow, 1990; Huang and Tsai, 2003)
before (Hsu, Cai and Wong, 2007; You, at el., 2008; Mohammad and Som, 2010)
• Getting away from home or mundane environment (Crompton, 1979; Kozak, 2002; Awaritefe, 2004; Kim, 2007; Jonsson and Devonish, 2008; You, at el., 2008; Mohammad and Som, 2010; Shi, 2010)
• Seeking adventure (Kozak, 2002; Jonsson and Devonish, 2008; Shi, 2010)
3. Gaining Knowledge
• Increasing knowledge about foreign destinations, people and things (Kozak, 2002; Jang and Wu, 2006; Hsu, Cai and Wong, 2007; Jonsson and Devonish, 2008; You, at el., 2008; Mohammad and Som, 2010)
• Education/ learning (Crompton, 1979; Kim, 2007)
4. Relaxation
• Just relaxing (Crompton, 1979; Kozak, 2002; Awaritefe, 2004; Jang and Wu, 2006; Kim, 2007; Shi, 2010)
• Spending time with family/friends (Kozak, 2002; Jonsson and Devonish, 2008)
5. Culture
• Visiting historical/cultural sites (Kozak, 2002; Jonsson and Devonish, 2008; Shi, 2010)
• Interesting/ unique culture or environment (Awaritefe, 2004)
6. Prestige
• Prestige, pride and patriotism (Crompton, 1979; Hsu, Cai and Wong, 2007)
• Nostalgia (Hsu, Cai and Wong, 2007) 7. Information
• Recommendation from friends/acquaintances (Awaritefe, 2004)
• Pre-trip information (You, at el., 2008; Shi, 2010)
8. Advertising and branding
• Attractive and contemporary presentation (National Heritage Board – NHB, 2005)
• Advertising in media (National Heritage Board – NHB, 2005)
• Engaging online communities (National Heritage Board – NHB, 2005)
9. Destination attractiveness
• Location/accessibility/nearness of

119
• Fear of hassles (Huang and Tsai, 2003) • Embarrassing aspects of visible
disabilities (LaGrow, 1990) 7. Communication
• Interactions of individuals and social environments (Crawford and Godbey, 1987; Smith and Austin, 1991)
• Lack of self-confidence (Crawford and Godbey, 1987)
8. Products/ Places
• Poor quality offerings (Davies and Prentice, 1995; Migliorino and Cultural Perspectives, 1998; Geissler, et al., 2006; Kay and Wong, 2009)
• Only for education and information (National Heritage Board – NHB, 2005)
• Security concerns (Blazey, 1987) 9. Physical Access
• Physically difficult to get to (Crawford and Godbey, 1987; Kennedy, Smith and Austin, 1991; Tian, et al., 1996; Prentice, et al., 1997; Kay and Wong, 2009)
• Difficult to access via public transport (Prentice, et al., 1997; Migliorino and Cultural Perspectives, 1998; Rentschler, 2006; Kay and Wong, 2009)
• Architectural barriers (e.g., cramped seating areas and unwieldy doors) (Crawford and Godbey, 1987; ODO, 2005)
10. Accommodation
• Accessibility of airplanes, hotels and restaurants (Kennedy, Smith and Austin, 1991; ODO, 2005; Harris Interactive Market Research, 2006)
• Service of staff (Kennedy, Smith and Austin, 1991; ODO, 2005; Harris Interactive Market Research, 2006)
tourist site (Awaritefe, 2004; Kim, 2007; Shi, 2010)
• Convenience of transportation (You, at el., 2008)
• Low costs (cheap food/accommodation/other facilities) (Awaritefe, 2004; Jang and Wu, 2006; Hsu, Cai and Wong, 2007; Kim, 2007)
• Outstanding scenery (You, at el., 2008) 10. Cultural media
• Online museums, applications or websites (Kaelber, 2007; Payne, et al., 2010; Rizvic, et. al., 2013)
• Animation, VDO presentation, short movie (Kaelber, 2007; Payne, et al., 2010; Rizvic, et. al., 2013)
• VDO game about cultural stories (Michael and Chen, 2006; Bopp, 2008; Göbel, et al., 2009; Pausch, et al.,1996)
4.2.4 Pre-test and Pilot test
The pre-test and pilot test were conducted for a period of one month. First, a pre-test
of an in-person survey of sixteen young participants was tested in terms of 1) flow of
the questionnaire, 2) length, and 3) respondent’s interest and attention. The results
obtained helped develop a revised version of the questionnaire by removing unclear
questions, improving legibility by using larger text, and addition of more graphics
(facial expressions on the Likert scale) and pictures of cultural tourism. Next, content
validity was tested by three experts (one design expert, one language expert and one

120
statistics expert). Moreover, Rovinelli and Hambleton’s (1976) Index of Item-
Objective Congruence (IOC indexes) were calculated from three experts. The
experts were asked to consider whether the scoring criteria addressed all aspects of
barriers and drivers in cultural tourism for five groups and matched the objectives of
this study. The experts rated the scoring criteria: 1 = item clearly match objective; 0 =
uncertain, and -1 = item does not clearly match objective. The IOC data from the
questionnaire showed that the content validity of the barriers was twenty-five out of
twenty-eight and the drivers was twenty-six out of twenty-nine. This scoring had
satisfied IOC’s criteria over 0.5.
Thirty-five participants (youth, people with disability, older adults, non-cultural
tourists) took part in a pilot test to help develop the final version based on seven
issues: 1) clarity, 2) length, 3) interest, 4) problems, 5) good points, 6) bad points,
and 7) changes needed. Most common participant comments included: “easy to
understand”, “not too long”, “it can capture the interest throughout the time”, “after
finishing this questionnaire, I am interested in cultural tourism more than previously”,
“you should have more questions about people with disabilities or a separate
section”. Next, a reliability test was undertaken using Cronbach’s Alpha. The
instrument could present a high degree of reliability if the value of Cronbach’s Alpha
obtained was as follows: 0.9 (excellent), > 0.8 (good), > 0.7 (acceptable), > 0.6
(questionable), > 0.5 (poor), and < 0.5 (unacceptable) (Burns and Bush 2013). From
the output of reliability statistics obtained, Cronbach’s Alpha value of 0.907 > 0.900, it
was concluded that this research instrument had very high reliability.
Figure 4.3 Reliability test by using Chronbach’s Alpha

121
4.3 Research question1: what are the barriers and drivers in cultural tourism among five diverse groups?
4.3.1 Results
Table 4.6 Demographic results from five groups (500 respondents)
Factor Youth Older Adults
People with Disabilities
Non-cultural Tourists
Established Cultural Tourists
1. Gender Male 37 36 66 34 41 Female 63 64 34 66 59
2. Age 15–17 31 - 1 8 4 18–22 49 - 2 28 22 23–25 20 - 2 1 27 26–34 - - 9 31 18 35–45 - - 13 27 25 46–59 - - 35 5 3 60–65 - 58 18 - 1 66–75 - 36 11 - - 76–85 - 6 6 - - 85+ - 3 - -
3. Education Primary/Secondary 8 29 67 5 10 High school 32 11 7 11 8 Diploma/Certificate 5 7 9 12 7 Undergraduate 51 38 2 64 58 Post-graduate or above
2 5 1 7 16
Other 2 4 14 - 1 4. Marital Status
Single 31 53 62 74 Married 62 38 37 16 Other 6 9 1 7
5. Type of Disability Vision 16 Hearing 7 Mobility 74 Mental health 1 Intellectual functioning
2
Cognitive/learning Long-term health conditions
6. Monthly income (Thai bath) Below 5,000 bath 35 3 78 9 12 5,000–10,000 bath 24 26 3 24 17 10,001–20,000 bath 10 41 2 24 27 20,001–30,000 bath 9 9 2 12 8 30,001–50,000 bath 2 9 9 19 Above 50,000 bath 4 5 16 11
7. How many trips did you spend for “cultural tourism”? Never 11 16 56 13 1–3 trips/year 30 27 28 45 4–6 trips/year 20 28 2 13 58

122
7–9 trips/year 13 11 3 9 14 Above 9 trips/year 25 18 10 20 28
Table 4.6 presents the demographic data for the five participant groups. The
quantitative results indicated that: most youth (49% - 49 respondents) were aged
eighteen to twenty-two; 58% of older adults (58 respondents) were sixty to sixty-five
years; 35% of people with disabilities (35 respondents) were forty-six to fifty-nine
years; 31% of non-cultural tourists (31 respondents) were twenty-six to thirty-four
years; and 27% of established cultural tourist (27 respondents) were twenty-three to
twenty-five years. The largest group of the youth (51% - 51 respondents), 38% of
older adults (38 respondents), 64% of non-cultural tourists (64 respondents), and
58% of established cultural tourists (58 respondents) had an undergraduate
education level. However, the majority of people with disabilities (67% - 67
respondents) had a primary/secondary education level. In term of spending on
cultural tourism, the largest portion of youth (30% - 30 respondents) and non-cultural
tourists (45% – 45 respondents) spent one to three trips a year, while the largest
portion of established cultural tourists (58% – 58 respondents) spent four to six trips
a year. However, the most striking piece of data reported that the majority of
respondents with disabilities, i.e. 56% of people with disabilities (56 respondents) had
never travelled. Lastly, 28% of older adults (28 respondents) spent four to six trips a
year.

123
Figure 4.4 Questionnaire distributions for five groups in many places
4.3.2 Barriers
For youth and non-cultural tourists, “a lack of time to attend” received the highest
score (4.55 = somewhat agree and 4.26 = neutral) of all barrier factors. The same
factor was also identified as the most and least important respectively by established
cultural tourists (scoring 4.11 = neutral and 2.05 = disagree). For older adults,
meanwhile, the item “difficult to access via public transport” recorded the highest
mean value of (4.46 = neutral) while “poor past experience” scored lowest (2.81 =
disagree). For people with disabilities, “physical well-being” was prioritised (5.41 =
somewhat agree), with concerns about “interactions with individuals and social
environment” scoring the lowest mean value (2.50 = somewhat disagree).

124
The results obtained from the respondents regarding barriers to engaging in cultural
tourism are presented in Table 4.7. The scale ranges from “strongly disagree” (1) to “strongly agree” (7), with mean scores indicate as
• 1.00-1.49 = Strongly disagree • 1.50-2.49 = Disagree • 2.50-3.49 = Somewhat disagree • 3.50-4.49 = Neutral • 4.50-5.49 = Somewhat agree • 5.50-6.49 = Agree • 6.50-7.00 = Strongly agree
For youth and non-cultural tourists, “a lack of time to attend” received the highest
score (4.55 = somewhat agree and 4.26 = neutral) of all barrier factors. The same
factor was also identified as the most and least important respectively by established
cultural tourists (scoring 4.11 = neutral and 2.05 = disagree). For older adults,
meanwhile, the item “difficult to access via public transport” recorded the highest
mean value of (4.46 = neutral) while “poor past experience” scored lowest (2.81 =
disagree). For people with disabilities, “physical well-being” was prioritised (5.41 =
somewhat agree), with concerns about “interactions with individuals and social
environment” scoring the lowest mean value (2.50 = somewhat disagree).
Table 4.7 Mean scores of barriers in cultural tourism for five groups
Barriers Youth Older Adults
People with
Disabilities
Noncultural Tourists
Established Cultural Tourists
1. Personal interest Uncomfortable experience, not entertaining
3.20 (SD1.694)
2.93 (SD1.500)
3.75 (SD2.359)
3.24 (SD1.685)
3.23 (SD1.855)
Not relevant or of interest; have different interests
3.67 (SD1.627)
3.26 (SD1.535)
3.63 (SD2.312)
3.61 (SD1.820)
3.50 (SD1.806)
Old and unfashionable 2.49 (SD1.210)
2.91 (SD1.598)
2.85 (SD2.269)
2.66 (SD1.641)
2.62 (SD1.615)
2. Time
Lack of time to attend 4.55
(SD1.919) 4.30
(SD1.778) 3.95
(SD2.472) 4.26
(SD2.008) 4.11
(SD1.941) Inconvenient opening times and activity schedules
4.41 (SD1.818)
4.04 (SD1.504)
3.83 (SD2.353)
3.88 (SD1.903)
4.11 (SD2.013)
3. Understanding
Lack of past engagement 3.33 (SD1.505)
3.42 (SD1.441)
3.57 (SD2.273)
3.45 (SD1.817)
3.31 (SD1.689)
Poor past experience 2.48 2.86 3.22 2.57 2.61

125
(SD1.460) (SD1.317) (SD2.222) (SD1.616) (SD1.469) Lack of information on where to go
4.22 (SD1.845)
3.90 (SD1.578)
4.08 (SD2.461)
3.55 (SD1.828)
3.58 (SD1.903)
4. Health
Physical well-being 2.39
(SD1.635) 3.71
(SD1.585) 5.41
(SD2.132) 2.33
(SD1.764) 2.69
(SD2.544)
Medical problems 2.06
(SD1.615) 3.38
(SD1.563) 3.79
(SD2.651) 1.99
(SD1.467) 2.27
(SD1.612) 5. Finance
Lack of concession pricing 3.37 (SD3.581)
3.28 (SD1.504)
3.95 (SD2.463)
2.79 (SD1.996)
2.94 (SD1.962)
Overall costs and supplementary costs
3.64 (SD2.087)
3.59 (SD1.385)
3.93 (SD2.166)
3.62 (SD2.117)
3.14 (SD1.779)
6. Fear
Fear to travel alone 3.37 (SD2.126)
3.44 (SD1.661)
4.06 (SD2.632)
2.96 (SD2.020)
2.66 (SD1.805)
Fear of hassles 3.80 (SD2.025)
3.63 (SD1.481)
4.60 (SD2.470)
3.08 (SD1.785)
2.93 (SD1.789)
Embarrassing aspects of visible disabilities
1.66 (SD1.293)
3.02 (SD1.715)
3.04 (SD2.344)
1.95 (SD1.373)
2.05 (SD1.425)
7. Communication Interactions with individuals and social environment
2.32 (SD1.632)
3.04 (SD1.360)
2.50 (SD2.057)
2.25 (SD1.591)
2.22 (SD1.256)
Lack of self-confidence 2.45
(SD1.763) 3.18
(SD1.495) 3.37
(SD2.432) 2.07
(SD1.451) 2.32
(SD1.447) 8. Products/Places
Poor quality offerings 3.47
(SD1.806) 3.60
(SD1.531) 3.88
(SD2.366) 3.50
(SD1.925) 3.63
(SD1.796) Only for education and information
3.47 (SD1.514)
3.54 (SD1.472)
3.67 (SD2.308)
3.71 (SD1.876)
3.30 (SD1.621)
Security concerns 3.69
(SD1.846) 3.89
(SD1.566) 4.56
(SD2.421) 3.98
(SD1.884) 3.48
(SD1.858) 9. Physical Access
Physically difficult to get to 4.35
(SD1.755) 4.30
(SD1.721) 5.04
(SD2.152) 4.08
(SD1.862) 3.89
(SD1.852) Difficult to access via public transport
4.44 (SD1.836)
4.46 (SD1.654)
5.24 (SD2.244)
4.20 (SD1.853)
3.74 (SD1.724)
Architectural barriers (e.g., cramped seating areas and unwieldy doors)
3.24 (SD1.545)
4.19 (SD1.563)
5.02 (SD2.227)
3.99 (SD1.781)
3.37 (SD1.796)
10. Accommodation Accessibility of airplanes, hotels, restaurants, etc.
3.39 (SD1.588)
3.90 (SD1.584)
4.77 (SD2.298)
4.02 (SD1.933)
3.48 (SD1.727)
Service of staff 3.96 (SD1.818)
3.87 (SD1.572)
4.24 (SD2.348)
3.92 (SD1.859)
3.81 (SD1.737)

126
4.3.3 Drivers
For young people, “outstanding scenery” received the highest score (5.50 = agree)
while older adults reported being motivated by the prospect of “visiting a place that I
have not visited before” (5.14 = somewhat agree). For people with disabilities,
“prestige, pride, and patriotism” was rated highest (5.89 = agree). Non-cultural
tourists indicated “spending time with family/friends” as the biggest driver for
engaging in cultural tourism (5.48 = somewhat agree) while established cultural
tourists were more interested in “increasing knowledge about foreign destinations,
people, and things” (5.69 = agree). The item “video game about cultural stories”
received the lowest score from every group (youth: 3.85 = neutral; older adults: 3.38
= somewhat disagree; people with disabilities: 1.65 = disagree; non-cultural tourists:
3.54 = neutral; cultural tourists: 4.34 = neutral).
Table 4.8 Mean scores of drivers in cultural tourism for five groups
Drivers Youth Older Adults
People with
Disabilities
Non-cultural Tourists
Established Cultural Tourists
1. New Experience New experiences and different lifestyles
5.32 (SD1.663)
4.96 (SD1.555)
5.33 (SD2.045)
5.33 (SD1.798)
5.44 (SD1.773)
Meeting new and different people
4.66 (SD1.854)
4.81 (SD1.510)
5.31 (SD2.014)
4.81 (SD1.873)
4.79 (SD1.760)
Personal rewards 4.47
(SD1.766) 4.90
(SD1.454) 5.84
(SD1.774) 4.99
(SD1.732) 4.96
(SD1.708) 2. Escaping from Daily Routine Visiting a place that I have not visited before
5.36 (SD1.494)
5.14 (SD1.399)
5.51 (SD2.120)
5.36 (SD1.567)
5.48 (SD1.574)
Getting away from home or mundane environment
5.10 (SD1.583)
5.07 (SD1.325)
5.68 (SD1.792)
4.89 (SD1.705)
5.16 (SD1.754)
Seeking adventure 4.97
(SD1.638) 4.73
(SD1.403) 4.94
(SD2.226) 5.02
(SD1.614) 5.32
(SD1.606) 3. Gaining Knowledge Increasing knowledge about foreign destinations, people and things
4.93 (SD1.612)
4.81 (SD1.417)
5.59 (SD1.849)
5.29 (SD1.578)
5.69 (SD1.475)
Education/ learning 4.88
(SD1.635) 4.78
(SD1.481) 5.46
(SD1.883) 5.29
(SD1.591) 5.49
(SD1.662) 4. Relaxation
Just relaxing 5.24
(SD1.572) 5.01
(SD1.403) 5.84
(SD1.668) 5.46
(SD1.642) 5.39
(SD1.641) Spending time with family/friends
5.41 (SD1.583)
4.93 (SD1.529)
5.22 (SD2.082)
5.48 (SD1.547)
5.30 (SD1.712)

127
5. Culture
Visiting historical/cultural sites 4.89 (SD1.556)
4.76 (SD1.310)
5.49 (SD1.941)
5.26 (SD1.495)
5.30 (SD1.528)
Interesting/unique culture or environment
5.20 (SD1.463)
4.93 (SD1.252)
5.40 (SD1.938)
5.46 (SD1.592)
5.54 (SD1.580)
6. Prestige
Prestige, pride, and patriotism 5.15
(SD1.527) 4.86
(SD1.198) 5.89
(SD1.746) 5.14
(SD1.804) 5.46
(SD1.581)
Nostalgia 4.28 (SD1.798)
4.64 (SD1.443)
4.82 (SD2.213)
4.49 (SD1.778)
4.95 (SD1.769)
7. Information Recommendation from friends/acquaintances
4.36 (SD1.650)
4.31 (SD1.496)
4.33 (SD2.288)
4.46 (SD1.702)
4.68 (SD1.617)
Pre-trip information 4.52
(SD1.542) 4.28
(SD1.485) 4.00
(SD2.441) 4.74
(SD1.694) 4.86
(SD1.665) 8. Advertising and Branding Attractive and contemporary presentation
4.85 (SD1.672)
4.31 (SD1.369)
4.51 (SD2.336)
4.65 (SD1.684)
5.23 (SD1.648)
Advertising from media 4.35
(SD1.749) 3.97
(SD1.440) 4.34
(SD2.377) 4.45
(SD1.714) 4.55
(SD1.759)
Engaging online communities 4.36
(SD1.750) 3.85
(SD1.723) 2.55
(SD2.335) 4.50
(SD1.883) 4.62
(SD1.674) 9. Destination Attractiveness Location/accessibility/distance or nearness
4.83 (SD1.511)
4.37 (SD1.629)
4.26 (SD2.415)
4.79 (SD1.816)
5.03 (SD1.627)
Convenience of transportation 4.86
(SD1.682) 4.46
(SD1.609) 5.55
(SD2.032) 4.88
(SD1.742) 5.31
(SD1.633) Low cost/expenses (cheap food/accommodation/other facilities)
4.67 (SD1.871)
4.55 (SD1.515)
4.68 (SD2.309)
4.63 (SD1.721)
5.01 (SD1.808)
Outstanding scenery 5.50 (SD1.547)
4.78 (SD1.438)
5.09 (SD2.289)
5.20 (SD1.690)
5.60 (SD1.491)
10. Cultural Media Online museums, applications, or websites
4.26 (SD1.661)
4.04 (SD1.528)
2.40 (SD2.265)
4.58 (SD1.724)
4.76 (SD1.593)
Animation, VDO presentation, short movie
4.16 (SD1.650)
3.96 (SD1.514)
2.49 (SD2.236)
4.09 (SD1.886)
4.77 (SD1.611)
Video game about cultural stories
3.85 (SD1.855)
3.38 (SD1.681)
1.65 (SD1.388)
3.54 (SD1.909)
4.34 (SD1.755)
4.4 Discussion for research question1: what are the barriers and drivers in cultural tourism among five different groups?
4.4.1 Barriers
This study identified some similarities and differences between the top five barriers
identified by the five groups. Table 4.9 presents mean scores for the top five barriers
and drivers to cultural tourism among five groups. For example, the items “difficult to

128
access via public transportation” and “physically difficult to get to” were applicable to
all five groups while “lack of time to attend” applied to four groups excluding people
with disabilities. Three groups including older adults, people with disabilities and non-
cultural tourists identified “architectural barriers” as important, along with
“inconvenient opening times and activity schedules.” Thus, these items can be
considered as significant for all five groups.
The most important issues accepted by all groups as significant barriers were
“difficult public transportation for access” and “physically difficult to get to.” This
confirmed the findings from a number of previous studies, including research about
cultural places that are physically difficult to reach (Tian, Crompton, and Witt 1996;
Prentice, Davies, and Beeho 1997; Kay, Wong, and Polonsky 2009; Pathak 2014)
and the difficulty of accessing some historical places via public transportation
(Rentschler 2006; Garcia et al. 2013; Kantawateera et al. 2014). The lack of public
transport is a problem, for example, if tourists cannot afford their own cars. Kay,
Wong, and Polonsky (2009) suggest that such physical barriers have a significant
impact, while Prentice, Davies, and Beeho (1997) state that some tourists are
unwilling to use public transportation due to poor accessibility.
A “lack of time to attend” was identified as important by four groups except people
with disabilities, while “inconvenient opening times and activity schedules” were an
issue according to three groups including youth, older adults and established cultural
tourists. However, these factors received lower scores from people with disabilities.
Several other studies suggest that cultural tourists and non-visitors consider time
constraints a critical barrier to engaging with cultural tourism (Crawford and Godbey
1987; Henderson, Stalnaker, and Taylor 1988; Davies and Prentice 1995; Tian,
Crompton, and Witt 1996; Milner, Jago, and Deery 2004; Kay, Wong, and Polonsky
2009; Fodness 2016). In this study, time concerns were ranked the most significant
factor by young people, noncultural tourists, and cultural tourists alike; it is generally
a concern for all visitors. Inconvenient opening times and activity schedules are also
cited as a problem in many studies (Samdahl and Jekubovich 1997; Migliorino 1998;
Rentschler 2006; Kay, Wong, and Polonsky 2009).

129
Older adults, people with disabilities and non-cultural tourists identified “architectural
barriers (e.g., cramped seating areas and unwieldy doors)” as significant, although
this same factor received lower scores from young people and established cultural
tourists. This means that physical barriers do not affect young people and cultural
tourists as much as they do with older adults, people with disabilities, and noncultural
tourists.
4.4.2 Drivers
From the top five drivers identified by the five groups (see Table 4.9), the most
popular motivating factors for engaging in cultural tourism were identified as “visiting
a place that I have not visited before” and “just relaxing”, each of which was picked
by four groups excluding people with disabilities. The item “new experiences and
different lifestyles” was also identified as important by three groups including youth,
older adults and non-cultural tourists.
Three groups (youth, older adults, and non-cultural tourists) said that exposure to
“new experiences and different lifestyles” was an important driver for engaging with
cultural tourism. This finding is consistent with prior research that has identified
interests, enjoyment, and experiences as intrinsic drivers to motivate tourists to
engage in tourism activities (Crompton 1979; Yau, McKercher, and Packer 2004; Kim
and Ritchie 2014). This could imply that, for the five groups studied, internal drivers
are more important than external ones. For example, Neulinger (1974) states that
several tourism studies indicate that leisure is intrinsically motivated, without
expectation of extrinsic rewards.
Research on disabled tourism, meanwhile, confirms that people with disabilities have
the same intrinsic need to engage in travel activities as their nondisabled
counterparts (Darcy and Daruwalla 1999; Yau, McKercher, and Packer 2004; Wu,
Chang, and Hsieh 2014; Altinay et al. 2016).
“Visiting a place that I have not visited before” was prominent amongst four groups
apart from people with disabilities. This driver is related to similar finding from
Crompton (1979), who states that some tourists go on vacation to change their
environment, no matter how comfortable their environments are. This may also

130
explain why “just relaxing” was selected by four groups in this study - apart from
established cultural tourists - as a number of studies state that tourists mostly feel
physically exhausted when they return home but that travelling can be mentally
relaxing (Crompton 1979; Kozak 2002; Kim, Cheng, and O’Leary 2007).
Some studies also state that relaxation is the most significant motivation in tourism,
especially in the holiday season, regardless of the places visited and travelers’
nationalities, since people tend to use their vacations to relax emotionally and
physically (Kozak 2002; Tsephe and Obono 2013). Krippendorf (1987) and Kim,
Cheng, and O’Leary (2007) further state that relaxation and getting away from routine
are the top psychological factors for travelling.
Table 4.9 Mean scores for barriers and drivers in the top five to cultural tourism among five groups
Barriers and
Drivers Five Different Groups of Respondents
Barriers
Youth Older Adults
People with Disabilities
Non-cultural Tourists
Established Cultural Tourists
1. Lack of time to attend (4.55)
1. Difficult to access via public transport (4.46)
1. Physical well-being (5.41)
1. Lack of time to attend (4.26)
1. Lack of time to attend (4.11)
2. Difficult to access via public transport (4.44)
2. Lack of time to attend (4.30)
2. Difficult to access via public transport (5.24)
2. Difficult to access via public transport (4.20)
2. Inconvenient opening times and activity schedules (4.11)
3.Inconvenient opening times and activity schedules (4.41)
3. Physically difficult to get to (4.30)
3. Physically difficult to get to (5.04)
3. Physically difficult to get to (4.08)
3. Physically difficult to get to (3.89)
4. Physically difficult to get to (4.35)
4. Architectural barriers (e.g. cramped seating areas and unwieldy doors) (4.19)
4.Architectural barriers (e.g. cramped seating areas and unwieldy doors) (5.02)
4. Accessibility of airplanes, hotels, restaurants, etc. (4.02)
4. Service of staff (3.81)
5. Lack of information about where
5. Inconvenient opening times and activity schedules
5.Accessibility of airplanes, hotels,
5. Architectural barriers (e.g.
5. Difficult to access via public

131
to go (4.22) (4.04) restaurants, etc. (4.77)
cramped seating areas and unwieldy doors) (3.99)
transport (3.74)
Drivers
1. Outstanding scenery (5.50)
1. Visiting a place that I have not visited before (5.14)
1. Prestige, pride and patriotism (5.89)
1. Spending time with family/friends (5.48)
1. Increasing knowledge about foreign destinations, people and things (5.69)
2. Spending time with family/friends (5.41)
2. Getting away from home or mundane environment (5.07)
2. Personal rewards (5.84)
2. Just relaxing (5.46)
2. Outstanding scenery (5.60)
3. Visiting a place that I have not visited before (5.36)
3. Just relaxing (5.01)
3. Just relaxing (5.84)
3.Interesting/ unique culture or environment (5.46)
3.Interesting/ unique culture or environment (5.54)
4. New experiences and different lifestyles (5.32)
4. New experiences and different lifestyles (4.96)
4. Getting away from home or mundane environment (5.68)
4. Visiting a place that I have not visited before (5.36)
4.Education/ learning (5.49)
5. Just relaxing (5.24)
5.Interesting/unique culture or environment (4.93)
5. Increasing knowledge about foreign destinations, people and things (5.59)
5. New experiences and different lifestyles (5.33)
5. Visiting a place that I have not visited before (5.48)
4.5 Research question 2: Are there any differences in answers between scaling and open-ended questions?
4.5.1 Result
Although cultural tourism is significant for all groups, there is a lack of studies within
the context of Thailand’s cultural tourism. An illustrative literature review resulted in
no related data about barriers to, and drivers of, cultural tourism in Thailand.
Consequently, in structuring the scaling questions, this study referred to already
identified barriers and drivers from other studies not conducted in Thailand.
Therefore, the objective of this section is to compare the close-ended and open-
ended answers in order to identify potential similarities and differences between

132
drivers and barriers to cultural tourism in Thailand and elsewhere, and to seek out
the neglected barriers and drivers within the context of Thailand’s cultural tourism.
This could potentially help inform industry, researchers, and government
organisations regarding the neglected barrier and driver items for five different
groups in the context of Thailand. In order to research, develop and deliver effective
cultural tourism in Thailand, stakeholders involved need to consider these barriers
and drivers as the real needs and aspirations of five Thai groups.
4.5.2 Barriers
Table 4.10 Open-ended answers for barriers to cultural tourism among five groups
Group Theme Subtheme
Value (number
of mentions)
Youth
Transportation traffic jams, difficult to go, poor public transportation, travel cost is high, too far from my home, and no private car
47
Weather too hot, poor weather 24 Social Issues no one (friends, family) to go with,
too crowded and group tours 20
Advertising and Presentation
bad presentation and information, old-fashioned, no information on where to go
12
Facilities poor facilities – dirty toilets, environment 9 Safety criminals & pickpockets, some places
too commercial – bad image 6
Older Adults
Transportation traffic jams, difficult to go, poor transportation, not convenient to travel - too far
46
Weather too hot, poor weather 36 Social Issues do not like long holiday – too crowded,
too crowded, some tourists’ manners not proper, service of staff
20
Facility and Accommodation
dirty toilets, lack of facilities, full of rubbish, accommodation not suitable
8
Advertising and presentation
no information where to go, no staff to explain, presentation difficult to understand
4
People with
Disabilities
Transportation difficult to travel to, not convenient to travel for people with disabilities, traffic jams
28
Weather too hot, poor weather 13 Disability Problems
no disabled toilet, vision problems, communication problems, bad service for people with disabilities, no accessibility (ramp), cannot travel alone
13
Social Issues No one to take me out, no one to take care, too crowded
11
Non- Transportation traffic jams, difficult to get to, not convenient on 34

133
cultural Tourists
public transportation, too far, taking too long a time
Weather too hot, poor weather 25 Social Issues too crowded, some tourists’ manners not proper 16
Facilities no parking, not enough toilets, no facilities, dirty toilets, poor accommodation
10
Safety too dangerous, some cultural events are dangerous
5
Advertising and Presentation
not interesting presentation, too much text and information
5
Cultural Tourists
Transportation No convenient transportation, poor transportation, traffic jams, difficult to go to, too far
26
Weather too hot, poor weather 25 Advertising and
Presentation poor and old fashioned presentation, poor organisation and management, some places too commercial, no information on where to go, no advertising and promotion for historical places
21
Social Issues some tourists’ manners not proper, too crowded 17 Safety not safe, criminals, pickpockets, taxi cheats 8
Facilities dirty toilets, no parking 5
Responses to open-ended questions were analysed using thematic coding analysis
(Saldaña, 2015) by multiple coders (one senior and two junior researchers) in order
to increase reliability of data analysis. Table 4.10 presents the barriers to cultural
tourism among five groups, identified through their open-ended responses.
• Youth For youth, “transportation” (n=47) (traffic jams, difficult to go, poor public
transportation, travel cost high, too far from home, and no private car) was the most
significant barrier. This result is related to the second-ranked Likert-scale question
“physical access.” Moreover, it was found that many open-ended responses were
different, compared to close-ended answers such as:
• Weather (n=24) (too hot, poor weather)
• Social issues (n=20) (no friends or family to go with, too crowded, group tours)
• Advertising and presentation (n=12) (bad presentation and information, old-
fashioned, no information on where to go)
• Facilities (n=9) (poor facilities, dirty toilets, environment)

134
• Safety (n=6) (criminals and pickpockets, some places too commercial, bad
image).
• Older adults For older adults, “transportation” (n=46) (traffic jams, difficult to go, poor
transportation, not convenient to travel, too far) was mentioned as the most
significant barrier. Moreover, it was found that some issues identified through open-
ended questions were different to those highlighted through close-ended questions.
These included:
• Weather (n=36) (too hot, poor weather)
• Social issues (n=20) (do not like long holidays, too crowded, some tourists’
manners not proper, service of staff)
• Facilities and accommodation (n=8) (dirty toilets, lack of facilities, full of
rubbish, accommodation not suitable)
• Advertising and presentation (n=4) (no information on where to go, no staff to
explain, presentation is difficult to understand).
• Disabled people
For people with disabilities, “transportation” (n=28) (difficult to travel, not convenient
to travel for people with disabilities, traffic jams) was the most significant barriers.
Moreover, it was found that the answers to many open-ended questions were
different compared to close-ended questions such as:
• Disability problems (n=13) (no accessible toilet, vision problems,
communication problems, bad service for people with disabilities, no
accessibility (ramp), cannot travel alone)
• Weather (n=12) (too hot)
• Social issues (n=11) (no one to take me out, no one to take care of me, too
crowded).
• Non-cultural tourists For non-cultural tourists, similarly, “transportation” (n=34) (traffic jams, difficult to get
there, not convenient on public transportation, too far, taking too long a time) was the

135
most significant barrier. Moreover, it was found that many open-ended responses
were different compared to close-ended choices such as:
• Weather (n=25) (too hot, poor weather)
• Social issues (n=16) (too crowded, some tourists’ manners not proper)
• Facilities (n=10) (no parking, not enough toilets, no facilities, dirty toilets,
poor accommodation)
• Safety (n=5) (too dangerous, some cultural events dangerous)
• Advertising and presentation (n=5) (not interesting presentation, too much
text and information).
• Cultural tourists For cultural tourists, consistent with all other four groups, “transportation” (n=26) (no
convenient transportation, poor transportation, traffic jams, difficult to go, too far) was
the most significant barrier. Barriers identified through open-ended questions which
were different compared to close-ended options included:
• Weather (n=25) (too hot, poor weather)
• Advertising and presentation (n=21) (poor and old fashioned presentation,
poor organisation and management, some places too commercial, no
information on where to go, no advertising and promotion from historical
places)
• Social issues (n=17) (some tourists’ manners not proper, too crowded)
• Safety (n=8) (not safe, criminals, pickpockets, taxi cheats)
• Facilities (n=5) (dirty toilets, no parking).

136
4.5.3 Drivers
Table 4.11 Open-ended answers for drivers to cultural tourism among five groups--
open-ended responses
Group Theme Subtheme
Value (number
of mentions)
Youth Prestige learning about the past, doing homework 9
Financial Issues having money, overall costs 7 Weather good weather 4
Older Adults
Culture knowing and seeing Thai culture, nostalgia, preserving and promoting Thai culture, seeing original Thai culture (plays)
25
Time free time 11 Presentation
and Activity
interesting presentations, exhibitions and events, taking pictures, fun activities
9
Religion going to temples, donating to temples 7 Financial Issues winning the lottery, having money, not too
expensive 5
Information reading the reviews 2 People
with Disabilities
Religion donating to temples, going to temples 12 Financial Issues winning the lottery, having money 6
Accessibility good accessibility, ramp, toilets 2
Noncultural Tourists
Facilities enough parking, indoor exhibitions, good food, good environment, student discount
9
Financial Issues having money, not too expensive 8 People good people, not too crowded 6 Religion donating to temples 5 Weather good weather 4
Cultural Tourists
Prestige seeking identity of Thai culture, preserving and promoting culture, seeing the real cultures, learning about cultures
Presentation and
Activity
interesting presentation, hi-technology, interactive activity or adventure
11
Financial Issues reasonable price 3 Facilities good facilities 2

137
Table 4.11 presents the drivers to cultural tourism among five groups, identified
through their open-ended responses.
• Youth For youth, most open-ended and close-ended responses were similar. However,
while the item “prestige” was similar to a close-ended answer but it was different in
the details, such as learning about the past and doing homework. Moreover, some
open-ended themes were different compared to close-ended issues such as:
• Prestige (n=9) (learning about the past, doing homework).
• Financial issues (n=7) (having money, overall costs).
• Weather (n=4) (good weather).
• Older adults For older adults, some open-ended themes were different compared to close-ended
issues such as:
• Culture (n=25) (knowing and seeing Thai culture, nostalgia, preserving and
promoting Thai culture, seeing original Thai culture (plays))
• Time (n=11) (free time)
• Presentation and activity (n=9) (interesting presentations, exhibitions and
events, taking pictures, fun activities)
• Religion (n=7) (going to temples, to donate to temples)
• Financial issues (n=5) (winning the lottery, having money, not too expensive)
• Information (n=2) (reading from reviews).
• People with disabilities For people with disabilities, some open-ended responses were different compared to
close-ended responses. These included:
• Religion (n=12) (donating money to temples, going to temples).
• Financial issues (n=6) (winning the lottery, having money).
• Accessibility (n=2) (good accessibility, ramps, toilets).

138
• Non-cultural tourists For non-cultural tourists, these included:
• Facilities (n=9) (enough parking, indoor exhibitions, good food, good
environment, student discount)
• Financial issues (n=8) (having money, not too expensive)
• People (n=6) (good people, not too crowded)
• Religion (n=5) (donating to temples)
• Weather (n=4) (good weather).
• Cultural tourists For cultural tourists, “prestige” (n=19) (seeking identity of Thai culture, preserving and
promoting culture, seeing real cultures, learning about cultures) was the most
significant barrier. This result is related to the first rank of the close-ended results:
gaining knowledge (5.69) (increasing knowledge about foreign destinations, people
and things, education/learning). Moreover, some answers were among the identified drivers different to those in close-ended responses.
• Presentation and activity (n=11) (interesting presentation, hi-technology,
interactive activity or adventure).
• Finance (n=3) (reasonable price).
• Facilities (n=2) (good facilities).
4.5.4 Discussion
Results from open-ended questions highlighted “transportation” as the most
significant barrier mentioned by all groups. This was consistent with findings from
close-ended questions. However, some transportation subthemes identified through
open-ended questions were different. These included: traffic jams, no convenient
public transportation, no convenient travel for people with disabilities, too far, taking
too long a time from home, poor transportation, travel cost high, and no private car.
These findings reinforce the importance of “transportation” as a key and common
barrier identified through both close-ended and open-ended responses. Meanwhile,
there are some differences specific to Thai context, especially in the case of traffic

139
jams and poor transportation. Transportation is an essential area of improvement to
be considered by the Thai government and tourism organisations.
Interestingly, open-ended responses highlighted “weather” (too hot, poor weather) as
the second most significant barrier common across all five groups. This is while the
literature review did not identify this factor as a barrier to cultural tourism. In fact,
most foreign tourists travelling to Thailand state warm weather as one main
motivation for choosing Thailand as travel destination. This could be considered as a
good example in explaining the context-dependent nature of barriers and drivers to
cultural tourism and the limitations to results driven from literature analysis. In this
case, the tourism industry and the Thai government could explore options to solve
this problem (e.g., setting up air conditioning in museums or exhibitions, setting up
events or festivals in winter).
Another open-ended barrier covered by all groups is the “social issues.” All groups
stated that social issues (e.g., having no one (friends, family) to go with, too crowded
and some tourists’ manners not proper) were considered as their main concerns. It is
worth noting that most respondents stated that they do not like crowds of tourists,
especially on holidays or at festivals. Moreover, in regard to “some tourists’ manners
not proper” comment, most people stated that sometimes foreign tourists do not
know and appreciate Thai traditions, especially in old temples. It is important for
cultural destinations to have good management and improved systems to control the
number of tourists. Moreover, there should be information or instructions for foreign
tourists informing them regarding the restrictions in temples or historical places in
Thailand and encouraging appropriate manners.
The last barrier raised by all five groups is “facilities” (dirty toilets, no accessible
toilets, not enough toilets, lack of facilities, full of rubbish, accommodation not
suitable for older adults, no parking, no accessibility ramps, no facilities). Although
this factor did not score highly, it was considered as a common barrier to all
respondents. This is while the literature review findings suggested ‘facilities’ as a
barrier mainly impacting older adults and people with disabilities. This implies the
need for general and large-scale improvements to facilities in cultural places in
Thailand.

140
“Advertising and presentation” (bad presentation and information, poor and old-
fashioned style, no information on where to go, no staff to explain, presentation
difficult to understand, no advertising and promotion for historical places) was
another barrier commonly raised by four groups expect people with disabilities.
Tourism organisations and the Thai government should consider improving
information provision, presentation and suitable advertisement to all groups to
promote cultural tourism and attract key target audiences.
Most open-ended drivers were similar to those identified through close-ended
responses. “Financial issues” (having money, overall costs, winning the lottery, not
too expensive, reasonable price) seemed common across all five groups. This is
while the literature review, had not identified any of these as potential drivers to
cultural tourism. Accordingly, it could be argued that Thai people considered cultural
tourism as an expensive reason for travelling. Therefore, tourism organisations and
the Thai government could aim to provide appropriate information regarding cultural
tourism as for instance, many cultural places are free to access.
Another interesting driver identified through open-ended responses was “religion”
(going to temples, donating to temples). While this was not considered a significant
driver to cultural tourism in other studies, in Thailand, donation is one of the popular
traditions and as .most people are Buddhists, visiting Buddhist temples could act as
one major motivation. In addition, older adults and people with disabilities stated that
donating to temples is one main activity that leads them to go out. This could provide
valuable insight to the tourism industry to design appropriate initiatives and
programmes to attract Thai tourists, especially for older adults, people with
disabilities, and non-cultural tourists.
4.6. Summary
4.6.1 Key insights
This chapter illustrated the relationship between inclusive design and cultural tourism
to broaden and increase the potential market. The aim is to identify barriers and
drivers in cultural tourism for five groups: 1) youth; 2) people uninterested in cultural

141
tourism (non-cultural tourists); 3) older adults; 4) people with disabilities; and 5)
cultural tourists. Furthermore, it focused on addressing these research questions:
• Research question 1: What are the barriers and drivers in cultural tourism among five different groups?
According to Table 4.9, the most common barrier in cultural tourism cited by the five
groups appeared to relate to ‘transportation’ (e.g., ‘difficult public transportation to
access’ and ‘physically difficult to get to’). However, except for disabled people,
barriers about time (e.g., ‘lack of time to attend’ and ‘inconvenient opening hours’)
were also important. Architecture barriers, meanwhile, were identified as a significant
barrier for three groups (older adults, disabled people and non- cultural tourists), but
not for young people and cultural tourists. However, compared to barriers, drivers for
engaging in cultural tourism seem to differ more between groups. Only three items
‘visiting a place that I have not visited before’, ‘just relaxing’ and ‘new experiences
and different lifestyles’, were included in the top five for the majority of groups. By
contrast, some barriers to cultural tourism in Thailand, such as ‘difficulty accessing
public transportation’, sites being ‘physically difficult to get to’, a ‘lack of time’,
‘architectural barriers’ and ‘inconvenient opening times and activity schedules’, were common to more groups.
• Research question 2: Are there any differences in answers between close-ended and open-ended questions?
For the opened-ended section, the main objective is to seek out the neglected
barriers and drivers within the context of Thailand’s cultural tourism. From data in
barriers (transportation, weather, social factors, facilities, and advertising and
presentation) and drivers (financial issues and religion), these open-ended answers
are common for five groups and different from the scaling answer section collected
from other research. This is because, in close-ended questions, the researcher
collected data and questions from other countries’ studies during the literature review
stage. However, in the open-ended sections, Thai respondents answered their real
barriers and drivers. This is particularly true when discussing topics that few studies
have researched or when dealing with cultural differences. This means that the Thai
government, tourism organisations and tourism industry designers and researchers
should consider the open-ended answers as specific barriers and drivers in the
context of Thai cultural tourism.

142
The next chapter will address another main problem for cultural tourism, ‘lack of
motivation to read or visit the actual places’. This problem highlights a good
opportunity to facilitate further cultural tourism to increase the motivation of visitors by
using digital storytelling. The aim of the next study is to create and propose a digital storytelling guideline to motivate five groups in Thailand to engage in cultural tourism
4.6.2. Study implications
• Marketing
From a marketing perspective, these five groups can be targeted more effectively if
the tourism industry can present and develop advertising campaigns that counter the
different barriers and respond to the various drivers of each group. However, tourism
marketers must understand that cultural tourists are not homogeneous. Therefore,
marketing decision makers need to understand both the barriers and drivers for these
groups, as this study presented. Moreover, in terms of drivers, only three drivers—
“visiting a place that I have not visited before,” “just relaxing,” and “new experiences
and different lifestyles”—were common reasons for most of the groups. Therefore,
the Tourism Authority of Thailand could use these as guidelines to set up and design
accessible cultural tourist routes for walking or biking, with the concept of one
district/one cultural place(s), to help new visitors with their ambitions (visiting new
places, relaxation, and new experiences).
• Management The results of this study could also contribute to management, in both government
and tourism organisations in Thailand. For example, issues related to transportation
(e.g., difficulty accessing sites via public transport) were identified by all five groups,
however, changing the whole system of public transportation in Thailand would be a
complicated, large-scale and long-term project. This study recommends that tourist
organisations create tour routes with private transport, such as buses or vans that
could cater for older tourists and wheelchair users, offering to collect tourists from
starting points in the popular areas (e.g., hotels, tourist centres, or tourist spots).
Four groups also highlighted concerns about a lack of free time and inconvenient
opening hours. Tourism industry should consider establishing appropriate

143
programmes in respond to this and to promote these to their potential customers,
especially the youth. Architectural barriers were further identified as significant by
three groups (older adults, people with disabilities, and non-cultural tourists). This
study suggests that Thailand should establish a Thai Disability Act to provide and
support accessibility and inclusivity for people with disabilities and older adults (e.g.,
ramps on the footpaths and building entrances). Additionally, the Thai government
and tourism organisations should consult with landscape architects to create barrier-
free access to cultural sites.
4.6.3 Study Limitations 1. The sample sizes
The researcher calculated sample sizes from Yamana’s formula (Yamane, 1967),
which resulted in 100 participants for each group. Moreover, when deciding the
criteria to select participants, this study chose “Skip interval = population list
size/sample size” (Burns & Bush, 2013, pp. 337). However, the skip interval for some
groups was too high (one youth from 2,952 at the Siam train station, and one person
from 1,970 non-cultural tourists at the train stations). It was also impossible to count
every person in reality because the train stations were too crowded. Hence, the
researcher and staff agreed to count overall groups of people instead of counting one
by one. For example, the group of people walking was around 100.
Suggestion: In order to lower the skip interval rate, the researcher recommends
choosing locations that are not too crowded or in controlled areas, as doing so will allow the researcher to accurately count the number of people one by one.
2. Likert scaling questionnaire
Upon distributing the questionnaire, many of the disabled people and older adults
said they were not familiar with the scaling answer, especially for seven scales.
Hence, the researcher had to use ‘words’ instead of numbers for evaluation (i.e. very
low, low, quite low, medium, quite high, high, very high). However, when participants
answered the open-ended questions, they were able to understand and responded very well.

144
Suggestion: If participants are older adults or disabled people, the researcher
recommends avoiding complicated ways of answering (i.e. Likert scale questions). These groups need simple, easy and quick ways to answer.
3. Lack of prior research
Due to the lack of factors regarding cultural tourism in Thailand, the researcher
collected barriers and drivers from other countries’ studies during the literature
review. However, in the open-ended questions, many participants reported different
barriers and drivers when compared with the scaling questions. For example,
numerous other studies considered the ‘weather’ as the most important driver to
encourage people to visit Thailand. However, Thai people considered weather as a barrier to stop them from travelling.
Suggestion: The researcher recommends using open-ended questions in the survey to gain true responses from participants.
4. Access
In this study, the survey was set up in a number of official government locations: 1.)
The Baanphrapradaeng Disabled Foundation for disabled people and 2.) The
Museum Siam, which is frequented by cultural tourists. The researcher and staff
contacted these places and sent the cover letter and questionnaire, which were approved in two months.
Suggestion: If the researcher needs to contact official places in Thailand (i.e.
government offices, public organisations, foundations), they have to send an official
cover letter and questionnaire; a process that typically takes a least two months to be
approved.
5. Regional sample in Thailand
The study sample was taken from city of Bangkok in Thailand. Thus, the research
was limited to one urban area within the country and the results may not be
representative or applicable to other regions. As a result, it is difficult to generalise

145
the findings about barriers and drivers to other areas which may have different
cultural, socio-demographic or economic contexts.
Suggestion: Further research should be conducted in other rural and urban areas in
Thailand, as well as to compare these barriers and drivers in other countries and
contexts. This would help assess universal validity and practicality of the results and
indicate to what extent the barriers and drivers identified in this research, are
generalisable in other contexts.
6. Gender imbalance
In this study, participant recruitment followed a volunteer-based model and
participant gender ration could not be an option. As a results, there was a gender
imbalance in four groups as: youth (male: 37 and female: 63), older adults (male: 36
and female 64), people with disabilities (male: 66 and female: 34), non-cultural
tourists (male: 34 and female: 59). During participant recruitment, females were
observed to be more inclined to accept to participate rather than men, resulting in the
existing male/female ratio. Female overrepresentation in both close-ended and open-
ended responses and the potential bias it might introduce to study results should be
further considered.
Suggestion: Further research should consider the factor about genders and control it to balance both genders.
4.6.4 Detailing the framework
From the results of this study, the IDST framework was detailed on the link between
inclusive design and cultural tourism to increase diversity in cultural tourism. The
detailed data presented with the top barriers and drivers for each group is illustrated on the Figure 4.5.

146
Figure 4.5 The results of the study presenting with the top barriers and drivers for each group

147
Chapter 5: Constructing the Digital Storytelling: Guidelines to Increase Motivation in Cultural Tourism for Five Groups in Thailand 5.1. Introduction 5.2 Research question 1: What are the digital storytelling guidelines that focus specifically to cultural tourism?
5.2.1 The new digital storytelling construction
5.2.2 Research method
5.2.3 Results
5.3 Research question 2: How can the digital storytelling guidelines be used to motivate cultural tourism for five different groups in Thailand?
5.3.1 Research method: interviewing digital storytelling experts
5.3.2 Results and discussion
5.4 Summary 5.4.1 Research question
Research question 1
Research question 2
5.4.2 Implication of this study
Cultural places
User experience design (UX)
Personalisation technique
Local engagement
5.4.3 Study limitations
1. Interviewees – a lack of academic background
2. Misunderstanding in digital storytelling
3. Interviewees – a lack of experience with some groups
4. Limited use with Thai users
5.4.4 Detailing the framework

148
5.1. Introduction This chapter was started by the second main problem in cultural tourism that is ‘lack
of motivation’ and presented results of the link between digital storytelling and
cultural tourism. This is because at cultural sites, visitors have little motivation to
read the stories displayed behind exhibitions and to visit actual sites. This problem
highlights a good opportunity to facilitate further cultural tourism to increase the
motivation of visitors by using digital storytelling. However, to create digital
storytelling, there is no guideline focusing specifically on cultural tourism for potential
viewers, especially older adults and disabled people, who are not target groups. This
chapter aims to answer the research questions: and the aim and objectives of this
chapter are in the Table 5.1:
• Research question 1: What are the digital storytelling guidelines that focus
specifically on cultural tourism?
• Research question 2: How can the digital storytelling guidelines be used to
motivate cultural tourism for five different groups in Thailand?
Table 5.1 Aim and objective of the chapter
Aims Objectives To create and propose digital
storytelling guidelines to motivate five
groups in Thailand (youth, older
adults, disabled people, non-cultural
tourists, and cultural tourists) to
engage in cultural tourism.
1.1) To create the new guidelines of
digital storytelling combined from
eight main sources.
1.2) To illustrate how to use the
digital storytelling guidelines to
increase motivation in cultural tourism
for five diverse Thai groups.

149
Figure 5.1 The link between digital storytelling and cultural tourism in this chapter
This study collects and creates 11 elements for non-interactive digital storytelling: 1).
the storyteller’s point of view; 2). a key question; 3). the core idea and purpose; 4).
emotional content; 5). story structure; 6). economy; 7). the rhythm of the story; 8).
the storyteller’s voice; 9). soundtrack; 10). quality of media; and 11). background and
characters. Seventeen face-to-face and online interviews (Skype) were conducted
from December 2015 to March 2016 focusing on how to use each element of digital
storytelling to motivate cultural tourism among the five groups.
Based on the original purpose of digital storytelling that is low-budget and non-
professional project, everyone could create their own digital stories. Therefore, the
key issue in the guidelines is to create good stories and content that can be created
by everyone, not just professionals and used on many technology platforms in the
future.

150
5.1.1 Why digital storytelling for cultural tourism? At cultural sites, visitors have no motivation to read the story displayed behind the
exhibitions and to visit to the real places (Rizvic et al., 2012). To increase tourists’
motivation, this study adopts digital storytelling, which is widely used to explain all
types of stories, narratives, films, and novels in the design process of digital systems
(Miller, 2012; Ryan, 2008; Schafer, 2008; Ohler, 2013; Cunsolo et al., 2013).
In applying digital storytelling, a variety of techniques such as plots, characters,
conflict, humour, and competition are used to promote and advertise that are not
hard-sell advertising (Miller, 2012; Alcantud et al., 2014; Wexler et al., 2014).
Additionally, a number of cultural and heritage sites around the world have been
widely digitised as virtual museums or applications with digital storytelling, making
difficult stories or subjects seem more alive and connected to viewers (Tolva and
Martin, 2004; Hein, 2014; Cunsolo et al., 2013).
5.2 Research question 1: What are the digital storytelling guidelines that focus specifically to cultural tourism? 5.2.1 The new digital storytelling construction Regarding the creation of digital storytelling, there is no guideline focusing
specifically on cultural tourism for potential viewers, especially older adults and
disabled people, who are not target groups. Most guidelines regarding digital
storytelling focus on educational purposes in classrooms and game designs.
Moreover, Tenh, Shiratuddin, and Harun (2012) state that experts have presented a
number of theories. Moreover, in each theory, a variety of elements are redundant.
This study seeks to collect all digital storytelling guidelines in all categories. The
criterion for selection is that each guideline has more than 10 citations in academic
books and journal articles; the guidelines are presented as eight digital storytelling
guidelines in Table 5.2 However, all of them focus on general, educational,
journalism, and interactive entertainment purposes.
However, in Table 5.2, some elements in the digital storytelling guidelines are
shared, but some of them are unique to a particular guideline. Tenh, Shiratuddin,
and Harun (2012) raise the question of how to know which elements are really

151
needed in a digital storytelling guideline. Therefore, the creation of the new digital
storytelling guidelines by comparing all elements of the guidelines of these famous
experts will not only involve refining and eliminating some redundant elements but
also focus specifically on cultural tourism.
Table 5.2 Lists of digital storytelling guidelines from eight experts Author
and year Guidelines/ books
Elements of each guideline Category Citation
1. Paul and Fiebich (2005)
Five Elements of DST The elements of digital storytelling
• Media • Action • Relationship • Context • Communication (5)
Journalism 31
2. Porter (2005)
Take six: elements Digitales: The art of telling digital stories
• Living in your story • Unfolding lessons
learning • Developing creative
tension • Economizing the story
told • Showing not telling • Developing
craftsmanship (6)
General 12
3. Salpeter (2005)
Six Elements of DST Telling Tales with Technology: Digital Storytelling Is a New Twist on the Ancient Art of the Oral Narrative
• Personal • Begin with the story or
script • Concise • Use readily-available
source materials • Include universal story
elements • Involve collaboration
(6)
General 46
4. Lambert (2006)
The seven Elements of Digital Storytelling Digital storytelling: Capturing lives, creating community
• A point of view • A dramatic question • Emotional content • The gift of your voice • The power of the
soundtrack • Economy • Pacing (7)
General 631
5. Ohler (2008)
Story elements Digital storytelling in the classroom: New media pathways to literacy, learning, and creativity
• Point of view • Emotional
engagement • Tone • Spoken narrative • Soundtrack music • Role of video and
performance • Creativity and
originality
Education 230

152
• Time, story length and economy (8)
6. Robin (2008)
Expanded and modified digital storytelling elements Digital storytelling: A powerful technology tool for the 21st century classroom
• The overall purpose of the story
• The narrator’s point of view
• A dramatic question or questions
• Quality of the images, video & other multimedia elements
• Use of a meaningful audio soundtrack
• The choice of content • Pacing of the narrative • Good grammar and
language usage • Economy of the story
detail • Clarity of voice (10)
Education 289
7. Schafer (2008)
Dimension star Models for Digital Storytelling and Interactive Narratives
• Concreteness • User contribution • Coherence • Continuity • (Conceptual) Structure • Stage • Virtuality • Spatiality • Control • Interactivity • Collaboration • Immersion (12)
Interactive entertainment(games, applications, new technologies)
11
8. Miller (2012)
A 10-step development checklist for creating an interactive project
Digital storytelling: A creator's guide to interactive entertainment
• Premise and purpose • Audience and market • Medium, platform and
genre • Narrative/ gaming
elements • User’s role and point
of view • Characters • Structure and interface • Fictional world and
setting • User engagement • Overall look and
sound (10)
Interactive entertainment (games, applications, new technologies)
274
This study categorises all eight guidelines by their purpose: (1). general (Porter,
2005; Salpeter, 2005; Lambert, 2013); (2). educational (Ohler, 2008; Robin, 2008);
(3). interactive entertainment (games, applications, or new technologies) (Schafer,
2008; Miller, 2012); and (4). journalism (Paul and Fiebich, 2005). These guidelines
are specifically designed to support the storytellers to create digital storytelling for

153
different purposes with specific elements. Nevertheless, with many guidelines and
elements, it is difficult to decide which guidelines or elements should be used to
create digital storytelling for cultural tourism. In addition, there are both non-
interactive and interactive forms.
5.2.2 Research method To create new digital storytelling guidelines for cultural tourism, this study collects
and creates four main themes and 11 subthemes from the eight digital storytelling
guidelines presented in Table 5.3.The process of constructing the new guideline was
that each element in every guideline was initially written on a separate card. Sixty-
four elements were derived from the eight guidelines: (1). six elements from Take Six
(Porter, 2005); (2). five elements from digital storytelling (Paul and Fiebich, 2005);
(3). six elements from DST (Salpeter, 2005); (4). the seven elements of digital
storytelling (Lambert, 2013); (5). eight story elements (Ohler, 2008); (6). 10
expanded and modified digital storytelling elements (Robin, 2008); (7). 12 elements
from the Dimension Star models for digital storytelling and interactive narratives
(Schafer, 2008); and (8). 10 steps from a development checklist for creating an
interactive project (Miller, 2012). In addition, the researcher asked three PhD
students undertaking major design research at Brunel University London as coders
to group all non-interactive digital storytelling elements in common according to the
similarity of definitions. Elements that do not match will not be considered in the
guidelines.
5.2.3 Results After a discussion, all the coders agree to group the elements into four main themes
and 11 subthemes. The construction of these guidelines is illustrated in Table 5.3 to
depict it clearly. The first theme is ‘initial questions’, composed of basic information
about setting up the main concept and purpose before designing the digital
storytelling. The elements in this theme are as follows: (1). the storyteller’s point of
view; (2). a key question; (3). the core idea and purpose; and (4). emotional content.
The second theme is ‘scripting’, which deals with how to develop the story from
beginning to end and how to simplify the amount of information. The elements in this
theme are as follows: (5). story structure; (6). economy; (7). the rhythm of the story.
The third theme is ‘media choices’. This theme mainly involves which media to use

154
and how to choose the proper voice and soundtrack to improve viewers’ experience.
The elements in this theme are as follows: (8). the storyteller’s voice; (9). the
soundtrack; and (10). the quality of the media. The last theme is ‘audience
experience’. It involves the location of the story and the actor to attract people’s
interest. The element in this theme is (11). the background.
Table 5.3 The new digital storytelling guidelines composed from the work of eight
digital storytelling experts
Themes Sub themes Explanation 1. Initial questions
1. The storyteller’s point of view
What is the main point of the story and what is the perspective of the author? (Lambert, 2006)
2. A key question
A key question that keeps the viewer's attention and will be answered by the end of the story. (Lambert, 2006)
3. The purpose Established a purpose early on and maintains a clear focus throughout. (Robin, 2008)
4. Emotional Content
Good stories include essential elements such as conflict, transformation, and closure. (Salpeter, 2005)
2. Scripting 5. Story structure
What are the major events or challenges during the narrative? (Miller, 2012)
6. Economy Using just enough content to tell the story without overloading the viewer. (Lambert, 2006)
7. The rhythm of the story
The rhythm of the story and how slowly or quickly it progresses. (Lambert, 2006)
3. Media choices
8. The storyteller’s voice
Storyteller gives narrative the appropriate amount of focus in their story. (Ohler, 2008)
9. Soundtrack Music or other sounds that support and embellish the story. (Lambert, 2006)
10. Quality of media
What is the media (e.g. mobile phones, TV or the Internet)?
4. Audience experience
11. Background and characters
What is the world and where is it set?

155
5.3 Research question 2: How can the digital storytelling guidelines be used to motivate cultural tourism for five diverse groups in Thailand?
5.3.1 Research method: interviewing digital storytelling experts After the creation of the new digital storytelling guidelines, 17 face-to-face and online
interviews (Skype) were conducted from December 2015 to March 2016. The aim of
this section is to answer the question “how to use digital storytelling elements to
increase motivation in cultural tourism for five different groups?”. Before the
interviews, experts were presented with the results of the first study about the
barriers and drivers of the five groups with respect to cultural tourism to understand
these users. The structured interviews, presented in Table 5.5, focused on how to
use each element of the digital storytelling guidelines to motivate cultural tourism for
the five groups based on the data from the first study. In addition, the 17 interviews
were separated into four groups: (1). Thai academic experts with an academic
position (i.e., assistant professor, associate professor, or professor) or a doctoral
degree in a related area; (2). Thai industrial experts with more than five years of
experience in digital storytelling; (3.) young Thai industrial experts with less than five
years of experience in digital storytelling; and (4). international academic and
industrial experts with at least five international publications or worldwide broadcast
experience in digital storytelling.

156
Table 5.4 17 expert profiles in digital storytelling who are interviewed No. Categories Interviewee
and their countries
Gender Age Occupation Academic position (for a lecturer)
Experience in digital storytelling
1. International academic and industrial experts
Expert 1 (Bosnia and Herzegovina)
Female 48 years
A lecturer Associate Professor
15 years
2. Expert 2 (Denmark)
Male 40 years
Director and Animator
- 19 years
3. Expert 3 (England)
Female 40 years
A lecturer - 6 years
4. Expert 4 (Malaysia)
Male 34 years
A lecturer - 5 years
5. Thai academic experts
Expert 5 Male 62 years
A lecturer Associate Professor
30 years
6. Expert 6 Female 45 years
A lecturer - 20 years
7. Expert 7 Female 51 years
A lecturer Assistant Professor
29 years
8. Expert 8 Male 51 years
A lecturer Assistant Professor
15 years
9. Expert 9 Male 39 years
A lecturer Assistant Professor
15 years
10. Thai industrial experts
Expert 10 Female 32 years
Art director/ story designer
10 years
11. Expert 11 Male 33 years
Animation supervisor
- 10 years
12. Expert 12 Male 30 years
Story board artist
- 10 years
13. Expert 13 Female 39 years
Head of animator
- 15 years
14. Expert 14 Male 31 years
Director - 10 years
15. Young Thai industrial experts
Expert 15 Female 25 years
Animator - 4 years
16. Expert 16 Female 25 years
Concept artist
- 4 years
17. Expert 17 Female 27 years
Concept artist
- 5 years

157
Figure 5.2 Thai experts during interviewing
Table 5.5 All 11 interview questions for experts No. Elements Questions Q1 The storyteller’s
point of view What ‘The storyteller’s point of view’ (the 1st or 3rd point of view) will you use in digital storytelling to increase motivation in cultural tourism for five different groups and why?
Q2 A key question What style of ‘A key question’ (The main concept or a question that will be answered by the end. For example, what is the origin of Thai people?) will you use in digital storytelling to increase motivation in cultural tourism for five different groups and why?
Q3 The purpose What ‘purposes’ (such as to initially understand the meaning of cultural tourism, to be impressed or to lead them going out…) will you set up in digital storytelling to increase motivation in cultural tourism for five different groups?
Q4 Emotional Content
What style of ‘Emotional Content’ (high-low, stable-swing emotions or mood -tone feelings) will you use in digital storytelling to increase motivation in cultural tourism for five different groups?
Q5 Story structure What style of ‘Story structure’ (basic – one or no climax or many climaxes) will you use in digital storytelling to increase motivation in cultural tourism for five different groups?
Q6 Economy What ‘Economy’ (the level of amount of information – high, moderate, low) will you use in digital storytelling to increase motivation in cultural tourism for five different groups and why?
Q7 The rhythm of the story
What style of ‘The rhythm of the story’ (slow, moderate or fast rhythm) will you use in digital storytelling to increase motivation in cultural tourism for five different groups and why?
Q8 The storyteller’s voice
Is it necessary to use ‘The storyteller’s voice’ and what style of voice will you use in digital storytelling to increase motivation in cultural tourism for five different groups?
Q9 Soundtrack What style of ‘Soundtrack’ will you use in digital storytelling to increase motivation in cultural tourism for five different groups?
Q10 Quality of media What ‘Media’ will you use in digital storytelling to increase motivation in cultural tourism for five different groups and why?
Q11 Background and characters
What ‘Background’ (The real, surreal, fantasy world or locations) will you set up in digital storytelling to increase motivation in cultural tourism

158
for five different groups and why?
5.3.2 Results and discussion Raw data from the interviews were coded by the three coders and categorised into
themes. The results of the interview are presented in Table 5.6 below to summarise
experts’ recommendations concerning 11 elements.
Table 5.6 Digital Storytelling Guidelines for Cultural Tourism from 17 Experts and the
number of people who made them in [ ] Digital Storytelling Elements
Diversity of People Youth Older adults Disabled
people Non-cultural tourists
Established cultural tourists
1. The storyteller’s point of view What is the main point of the story and what is the perspective of the author? (Lambert, 2013)
The 1st person point of view of a young person [14]
The 1st person point of view of an older adult [14]
The 1st person point of view of disabled person [12]
The 1st person point of view of celebrities, movie stars or famous people [14]
The 1st person point of view of real famous travelers [13]
2. A key question A key question that keeps the viewer's attention and will be answered by the end of the story (Lambert, 2013).
1. Relate to their taste and trends [4] 2.Seeking new experience and new perspective [3] 3. Interested in games, cartoons, superhero or movie stars [2] 3. Challenging, complex and linked to the next stage [2]
1. Related to religion, senior love going to temple to donate [4] 2. The concept of the family trip [3] 3. How to better physical health or better living [3]
1. Related to religion, this group love going to temple to donate [5] 2. Culture tourism is for all groups, including disable people [2] 3. Accessibility or transportation [2]
1. Benefits of being cultural tourists [3] 2. Financial issue [2] 3. See new things [2]
1. Unseen, interesting locations and unique information [7] 2. New and interesting perspective [2] 3. Cultural tourism can lead to other benefits
3. The purpose Established a purpose early on
1. To understand the meaning of cultural tourism [8]
1. To understand the meaning of cultural tourism [8]
1. To understand the meaning of cultural tourism [8]
1. To understand the meaning of cultural tourism [9]
1. To understand the meaning of cultural tourism [6]

159
and maintains a clear focus throughout (Robin, 2008).
2. To seek out the new experience and perspective [4] 3.To realise the importance of cultural tourism [3]
2. To remind them about the past [3] 3. To see the benefits of cultural tourism [2]
2. The meaning of cultural tourism [8] 3. To provide information about accessibility and disability [6].
2. To open a new world, new experiences and new friends [3] 3. To provide interesting information [3]
2. To present interesting and in-depth information [5] 3. To visit unseen places [3]
4. Emotional Content Good stories include essential elements such as conflict, transformation, and closure (Salpeter, 2005).
1. High emotion [10] 2. Exciting and positive emotional content [5] 3. A lot of conflicts [5]
1. Stable and moderate emotion [12] 2. Positive emotion [4] 3. No conflict [3] 3. Avoid sadness & negative meaning [3]
1. Stable and moderate emotion [6] 2. Positive feelings [3] 3. Not too serious or stressful [3]
1. High and strong emotional content [9] 2. Creating a peak point and a lot of conflicts [4]
1. Moderate and formal emotional content [8] 2. Emotion is not necessary for this group [2]
5. Story structure What are the major events or challenges during the narrative? (Miller, 2012)
1. Complex, strange, many peak points and climaxes [8] 2. New, innovative and trendy structure [4] 3. Simple & Basic structure [3]
1. Simple, basic and conservative style [5] 2. They need direct information [4] 3. No need to use gimmick, trick or hidden plot [3]
1. Basic, conservative and stable structure, no climax, [12] 2. One climax point [5] 3. Do not like fast and new structure [2]
1. Complex, strange, many peak points and climaxes [7] 2. Structure should be concise and short [5] 3. New, innovative and trendy structure [3]
1. Simple & Basic structure [5] 2. Complex, strange, many peak points and climaxes [4] 3. One or no climax [3].
6. Economy Using just enough content to tell the story without overloading the viewer (Lambert, 2013).
1. Less, concise and short information [9] 2. Choose only one point/ concept [4] 3. Interesting information [3] Types of information: 1. Use a hidden story & gimmick to attract them to find out more [3] 2. Use environmental
1. Low amount, concise and short information [7] 2. Moderate information [2] 2. No one wants in-depth information [2] Types of information: 1. Use a hidden story & gimmick to attract them to find out more [4] 2. Not too new or updated,
1. Low amount, but necessary information [4] 2. High amount of information about accessibility [3] 2. Choose only one point/ concept [3] Types of information: 1. Present information about accessibility [3]
1. Low amount, concise and short information [10] 2. Interesting information [5] 3. Choose only one point/ concept [4] Types of information: 1. Use a hidden story & gimmick to attract them to find out more [4]
1. Low amount, but necessary information [8] 2. Choose only one point/ sentence [4] 3. Useful and interesting information [3] Types of information: 1. Use a hidden story & gimmick to attract them to find out more [4] 2. Use environmental

160
pictures [2] they cannot remember well [2]
2. Use a hidden story or gimmick to attract them to find out more [2]
2. Use environmental pictures [2]
pictures [3]
7. The rhythm of the story The rhythm of the story and how slowly or quickly it progresses (Lambert, 2013).
Fast rhythm [8] Example: 1. Like a Hollywood movie or advertising they are familiar with [4] 2. Such as advertising, music videos or movie trailers [2]. 3. Compared to music: pop [2]
Slow rhythm [8] Example: 1. Depend on the story: Adventure movie: fast rhythm; Romantic or dramatic movie: slow rhythm [5]
Slow rhythm [7] Example: 1. Depend on the story: Adventure movie: fast rhythm; Romantic or dramatic movie: slow rhythm [5]
Fast rhythm [8] Example: 1. Such as advertising, music videos, Hollywood movies or movie trailers [5]. 2. Depend on the story: Adventure movie: fast rhythm; Romantic or dramatic movie: slow rhythm [4] 3. Compared to music: pop [3]
Standard rhythm [5] Example: 1. Depend on the story: Adventure movie: fast rhythm; Romantic or dramatic movie: slow rhythm [4] 2. Standard like a Hollywood movie [2] 3. Such as advertising, music videos or movie trailers [2]
8. The storyteller’s voice Storyteller gives the narrative the appropriate amount of focus (Ohler, 2008).
1. Voice is necessary [6]. 2. Not necessary [5] Style of voice: 1. Present positive or funny tone, Thai people always love comedy [3] 2. Depends on story and screenwriting [2] 3. Lively, swing and fluctuate voice [2]
1. Voice is necessary [8] 2. Not necessary [1] Style of voice: 1. Present positive or funny tone, Thai people always love comedy [4] 2. Calm, peaceful and stable voice [2] 3. Depends on story and screenwriting [2]
1. Voice is necessary [8] Not necessary [2] Style of voice: 1. Present positive or funny tone. Thai people always love comedy [3] 2. Calm, peaceful and stable voice [2]
1. Voice is necessary [6]. 2. Not necessary [5] Style of voice: 1. Present positive or funny tone. Thai people always love comedy [3] 2. Lively, swing and fluctuate voice [2
1. Voice is not necessary [4]. 2. Voice is necessary [3] Style of voice: 1. Present positive, lively or funny tone. Thai people always love comedy [4] 2. Depend on the story and objectives [3] - We can use any style [2]
9. Soundtrack Music or other sounds that support and embellish the story (Lambert,
Necessary [5] Style of soundtrack: 1.Contemporary or popular music, such as pop [6]. 2. Soundtrack - relate to their ages, taste and
Necessary [6] Style of soundtrack: 1. Simple and easy-listening [8] 2. Older or traditional Thai songs to feel nostalgia [4]
Necessary [4] Style of soundtrack: 1. This group is too broad. It depends on their ages, educational background and types of
Necessary [3] Style of soundtrack: 1. This group is too broad. It depends on their ages [4] 2. Contemporary, popular and
Not necessary [6] Style of soundtrack: 1. Simple and easy-listening [3] 2. Contemporary, popular and

161
2013). lifestyles [5] 3. Trendy music [5]
3. Traditional Thai song, but not pure 100 percent [3]
disabilities [8] 2. Simple and easy-listening [6] 3. Contemporary or popular music [3]
Trendy music [4] 3. Simple and easy-listening [3]
Trendy, not necessarily traditional Thai songs [2] 3. It depends on their ages [2]
10. Quality of media What is the medium (e.g., mobile phones, TV or the Internet)? (Miller, 2004)
1. Mobile devices [10] 2. Video games [5] 3. Social media [4] Recommendation: 1. They do not watch television [4] 2. Use only hi-tech devices [2]
1.Television [10] 2. Mobile devices [8] 3. Radio [3] Recommendation: 1. They are not familiar with hi-technology [3]
1. Television can cover many types of disabilities [7] 2. Mobile devices [3] 3. As many media as possible (many categories of people with disabilities) [4] Recommendation: - Too broad group. It depends on their ages and types of disabilities [6]
1. Mobile devices 2. As many media as possible (too broad and varied group) [4] 3.Social media [4] Recommendation: 1. This group is too broad and varied, using as many media as possible to cover all people [3]
1.Mobile devices [5] 2. As many media as possible [5] 3. Websites [4] Recommendation: 1. Focus on content, not presentation [3] 2. Love reading books and magazines [2]
11. Background and characters What is the world and where is it set? (Shcafer, 2008)
Background: 1. Fantasy, surreal, ideal or imagined world [8] 2. Real, beautiful and interesting locations, to create real experience [8] 3.The hi-tech or virtual world with new technology, such as the 4d movie [5] Characters: 1. Use characters that relate and are popular to this group [4]
Background: 1. The real world, locations, and characters only [13] 2. Set up location that the target group live in real life [3] 3. - Set up locations from the past to feel nostalgia [3] Characters: Use real older characters who are popular with this group [3]
Background: 1. The real world, locations, and characters only [9] 2. Real world that they cannot access in real life. [3] 3. Set up location that the target group live in real life [3] Characters: 1. Use real older characters who are popular with this group [3]
Background: 1. Real, beautiful and interesting locations [8] 2. A fantasy and surreal world [4] 3. The virtual world with new technology, such as the 4d movie [4] Characters: 1. Use real older characters who are popular with this group [3]
Background: 1. The real world and location [10] 2. Surreal, sci-fi or technological world [4] 3. A fantasy world, it can grab their attention [2] Characters: 1. Use real and professional presenters who are popular with each group to make them believe [3]

162
1. The storyteller’s point of view “What is the main point of the story and what is the perspective of the author?”
(Lambert, 2013)
Results: The majority of experts state that they prefer to use the first-person point of
view for all groups. This technique can make the viewers feel that the storytellers are
talking directly to them, easily connecting with members of all the groups.
Furthermore, for youth, older adults, and disabled people, the storytellers should tell
stories through characters who are the same age as the target groups. Youth in
particular will believe a younger rather than an older character. In addition, regarding
non-cultural tourists, the experts state that this group is too broad and large.
Therefore, we should use movie stars or other famous people to attract them.
Finally, established cultural tourists do not care about movie stars or celebrities.
Hence, we should attract them by using famous travellers or academic persons in
the field.
Discussion: The first-person point of view is the main factor in digital storytelling
(Lambert, 2013; Ohler, 2008; Robin, 2008; Alcantud et al., 2014; Wexler et al., 2014;
Sarıca and Usluel, 2016). Lambert (2013) and Ohler (2008) consider this factor the
first element of their guidelines. Moreover, Lambert (2013) states that digital
storytelling initially focuses on personal lives and stories. It is originally used to help
general people, not professionals, to tell their personal stories using their own
voices. Robin (2008) states that the storyteller should present with his or her own
perspective to create a strong connection with viewers. However, Ohler (2008)
states in his book Digital Storytelling in the Classroom: New Media Pathways to
Literacy, Learning, and Creativity that we should not restrict digital storytelling to the
first-person perspective. This is because his guideline focuses on how to use digital
storytelling in the classroom. Teachers and students can use different points of view
to suit the classroom purposes. This means that use of the first- or third-person point
of view depends on the purpose of the digital storytelling. However, the results of this
study focus on cultural tourism, and the experts suggest that the first-person
perspective is preferable.

163
2. A key question
“A key question...keeps the viewer's attention and will be answered by the end of the
story” (Lambert, 2013).
Results: The most interesting issue arises regarding older adults and disabled
people. Most experts recommend that we should design a concept and question
related to religion, as members of these groups love going to temples to donate.
Moreover, for older adults, storytellers can include the concept of the family trip and
better physical health or better living, such as “This is your personal reward” or “If
your family asked you about these places, how would you answer?” Moreover, for
the disabled group, we should emphasise that cultural tourism is for all groups,
including disabled people, accessibility or transportation, or dreams or something
that they want to do but cannot, such as “This is your personal reward”, “Are you
ready to go travelling?” or “Travelling together?”
However, for other groups, the results vary. For example, for established cultural
tourists, most experts indicate that this group does not care about the concept or
story. They just want an unseen, new experience, interesting locations, and unique
information. However, if the storytellers need to set up a key question for this group,
it should be challenging and unique, not just simple question, such as “Do you know
this place? Do you want to know more?” or “Increasing knowledge and experience”.
Regarding non-cultural tourists, experts state that this group does not know much
about cultural tourism, so we should create advertising about the benefits of being
cultural tourists, such as “How is cultural tourism good for us?” Moreover, the
question should relate to financial issues because cultural tourism is more expensive
than general tourism. The youth group always seeks new experiences and
perspectives and is interested in games, cartoons, superheroes, or movie stars.
Therefore, we should stay updated about their latest tastes and trends to set up a
key question, such as “Do you want to know about new things, experiences, or
perspectives?”, “Seeking a slow lifestyle?”, or “Getting away from the city?”
Discussion: Robin (2008) states that a direct-to-the-point and interesting question
matched to the viewers’ interest can keep the audience throughout the story.
Therefore, if we know what their interests and trends are, we can set up the key

164
question. For older adults and disabled people, this finding is supported by the first
study, which indicates that these groups’ drivers for cultural tourism is religion
activities (going to temples and to donating to them). According to other studies, not
including Thailand, this issue is not considered a significant driver. However, in
Thailand, most people are Buddhists. In addition, donation is a popular tradition.
Older adults and disabled people answered that donating to temples is the main
activity that leads them to travel. Hence, the tourism industry should use this data to
design programmes to attract Thai tourists, especially older adults, disabled people,
and non-cultural tourists (Kasemsarn and Nickpour, 2016)
Youth and cultural tourists want new experiences or unseen places. This matches
the first study, which shows that exposure to ‘new experiences and different
lifestyles’ is an important driver for engaging with cultural tourism (Kasemsarn and
Nickpour, 2016). Moreover, many studies support the notion that interests,
enjoyment, and experiences are the main drivers to motivate tourists to engage in
tourism (Crompton, 1979; Yau et al., 2004; Kim and Ritchie, 2014).
3. The purpose
“Establish a purpose early on and maintain a clear focus throughout” (Robin, 2008).
Results: The purpose factor is very interesting because experts agree that the term
‘cultural tourism’ is very new. Most Thai people are unfamiliar with it and do not
understand its importance. Therefore, we should present the meaning and
importance of cultural tourism for all groups as the initial purpose. However,
regarding secondary purposes, there are different details for each group. For youth
and non-cultural tourists, experts recommend that we present a story of seeking new
experiences, friends, and perspectives and show them that the Thai culture is very
interesting. This is because they consider cultural tourism boring and old-fashioned
rather than interesting. For older adults, we should focus on reminding them about
the past and spending time with their families. The disabled group is concerned
about being a burden to others. Therefore, we should provide information about
accessibility and disability. Finally, established cultural tourists want interesting and
in-depth information or to visit unseen places.

165
Discussion: Robin (2008) states that this element is the most important and should
be considered the first factor because the purpose can lead the whole story from
beginning to end. Moreover, cultural tourism is considered a niche market compared
to mass tourism. General tourists do not pay attention to it (UNESCO, 2003).
Furthermore, most cultural tourism industries focus on cultural tourists, who
comprise just 15 percent of all tourists (Silberberg, 1995; Lord, 1999). Hence, this is
a good opportunity to present the meaning and importance of cultural tourism to all
groups.
4. Emotional Content “Good stories include essential elements such as conflict, transformation, and
closure” (Salpeter, 2005).
Results: The findings of this factor can be separated into two groups. First, youth
and non-cultural tourists prefer ‘high emotion’; youth in particular like exciting,
positive emotional content with a lot of conflict, whereas older adults, disabled
people, and established cultural tourists prefer ‘moderate emotion’ that is not too
serious or stressful. Moreover, in terms of the type of emotion, all groups except
older adults prefer comedy movies, optimism, and positive thinking. This is because
Thai people are not too serious and they really love comedy shows. Some experts
argue that, to attract Thai people, comedy is the best solution. However, to attract
older adults, we should focus on reminding them of the past, nostalgia, or travelling
into the past because this group prefers to think about the past.
Discussion: Lambert (2013), Porter (2004), and Ohler (2008) confirm that this
element, emotional content, is a significant factor. This is because emotions (i.e.,
sadness, happiness, or pleasure) are a main part of all stories. Moreover, Lambert
(2013) states that emotional content that comes from the true story of the storyteller
can make an impact and touch the audience.
Furthermore, ‘developing creative tension’, derived from Porter’s guideline, can
attract the audience’s attention. Porter also confirms that to, build the right
momentum for the story, the storyteller should know what the audience is interested
in. Therefore, we can attract them to watch until the end (Porter, 2004; Alcantud et
al., 2014; Wexler et al., 2014 Sarıca and Usluel, 2016). However, Ohler (2008)

166
states in his book that, in some cases, digital storytelling does not require emotional
content. This is because his book focuses on the educational purpose of digital
storytelling, where the objective is not to raise feelings but to convey fact.
5. Story structure
“What are the major events or challenges during the narrative?” (Miller, 2012)
Results: Regarding older adults, disabled people, and established cultural tourists,
experts recommend that this group does not like a complex story structure. They
need a direct and simple story that is easy to understand. In contrast, youth need
something new, innovative, and trendy in the story to attract their interest like trendy
Hollywood movies, so we should study viral and trendy social media. Moreover, non-
cultural tourists are not interested in cultural tourism. Therefore, we should try
complex, strange stories with many peak points and climaxes to attract them. In
terms of the types of story, for older adults and disabled people, we should focus on
the ‘relationship of friends and family’ theme. Non-cultural tourists are interested in
fun, amusing, and exciting stories and in finding out who they are. Youth are
interested in the following themes: (1) fun, amusing, and exciting; (2) love,
adventure, winners, and challenges; and (3) stories related to friends, not family.
Discussion: All groups prefer a different story structure. This matches Schafer’s
(2008) observation that structure is about how actors, mood, tone, story, locations,
and themes flow together. Therefore, good digital storytelling should have a very
clear storyline with a starting point, middle, climax, and end. This means that the
story for each group may have different structures. Storytellers should know what
their target groups like and dislike or trends to create a story structure that matches
their interests.
6. Economy
“Use just enough content to tell the story without overloading the viewer” (Lambert,
2013).
Results: Experts recommend that, because of the short form of digital storytelling,
storytellers do not have enough time to include much information. Therefore, we
should use just a small amount of concise information for all groups. Moreover, in
terms of techniques to present data, they state that using a hidden story and

167
gimmick to attract them to learn more is the best trick for all groups except disabled
people. This group needs specific information about accessibility.
Discussion: This finding is reflected in several guidelines for digital storytelling,
including those for general, educational, and interactive purposes, which recommend
using simple and sufficient messages (Porter, 2005; Salpeter, 2005; Lambert, 2013;
Ohler, 2008; Robin, 2008). According to Salpeter (2005), digital storytelling should
be short, concise, and simple without exaggerating. Moreover, the technology
support should be minimal and escalate only the core idea of the story. Because of
its short form, digital storytelling encourages the storyteller to eliminate unnecessary
material and emphasise a simple story (Ohler, 2008). Furthermore, it is should be
short and simple with a meaningful message (Lambert, 2013; Porter, 2005).
Floch and Jiang (2015) suggest that, because of current technology, digital
storytelling is mixed with audio, text, and video, and the latest interactive systems
rapidly change. Therefore, many companies focus on high technology rather than
content. Floch and Jiang (2015) recommend that storytellers should emphasise good
and simple content reused in several technology formats. Many studies also support
the finding that users need a simple, easy-to-understand, uncomplicated story
structure (Wither et al., 2010; Pujol et al., 2012; Floch and Jiang, 2015).
7. The rhythm of the story
“The rhythm of the story and how slowly or quickly it progresses” (Lambert, 2013).
Results: For youth and non-cultural tourists, because of their characteristics – short
concentration and love of excitement – we should present them with a fast rhythm,
like that of Hollywood movies, music videos, or movie trailers they are familiar with.
Older adults and disabled people are not familiar with the speed and rhythm of
Hollywood movies. Therefore, we should use a slow rhythm, like that of a romantic or
dramatic movie. Because established cultural tourists are not interested in watching
movies, we should use a standard rhythm. However, because there is a wide range
of disabilities, the criteria for rhythm for this group depend on their ages and types of
disabilities.

168
Discussion: Lambert (2013) and Robin (2008) state that the storyteller should know
when to pause, stop, and move the story to make it faster or slower. Furthermore,
they should emphasise pacing to match the target audiences. Digital storytelling with
the proper rhythm can attract the audience better.
8. The storyteller’s voice
“The storyteller gives the narrative the appropriate amount of focus” (Ohler, 2008).
Results: Experts recommend that, for all groups, a narrative voice is necessary
because Thai people are familiar with having a narrator while watching
documentaries, short films, or movies. Moreover, the voice should have a positive or
funny tone because Thai people always love comedy. However, they recommend
that the storyteller should use voice when pictures cannot tell the detailed story; for
example, the voice can present information about constructing temples. Moreover,
for youth, we should use both a narrative voice and subtitles because they often turn
the volume off when using mobile phones.
Discussion: This result is the same as that of many experts on digital storytelling
who agree that the voice is a necessary factor, especially use of the storyteller voice
(Ohler, 2008; Robin, 2008; Lambert, 2013; Pozzebon and Calamai, 2015). Lambert
(2013) point, out that, when the storyteller presents his or her own story, the voice
can attract and connect directly and emotionally to the audience. Moreover, the
quality of the voice must be clear from the beginning to the end and illustrate the
moods of the story (Robin, 2008; Pozzebon and Calamai, 2015). Ohler (2008) states
that use of the voice is the original and traditional form of storytelling. However,
though technology has enabled digital storytelling, the voice is still a significant
aspect and universal element to connect storytellers and audiences.
9. Soundtrack
“Music or other sounds...support and embellish the story” (Lambert, 2013).
Results: Soundtracks are necessary for all groups except established cultural
tourists. However, the soundtrack styles should be quite different. Youth love funny,
contemporary, or popular music, such as pop or a style related to their age, taste,
and lifestyle. Older adults and established cultural tourists like simple and easy-
listening music; in particular, older adults love older or traditional Thai songs to feel

169
nostalgia. However, the groups of disabled people and non-cultural tourists are very
broad. Therefore, the soundtrack depends on their age, educational background,
and types of disabilities.
Discussion: Lambert (2006) illustrates that this element is necessary but not
compulsory. Moreover, it can strengthen audience feelings by combining visuals and
the narrative voice to attract people’s interest in the story. However, he states that
using an instrumental form without vocals is preferable (Lambert, 2006; Robin, 2008;
Pozzebon and Calamai, 2015). Ohler (2008) states that music is second to narrative
voice and must not be louder than the voice. Moreover, if we turn off the music, the
story and content should still stand strong.
10. Quality of media
“What is the medium (e.g., mobile phones, TV or the Internet)?” (Miller, 2004)
Results: There are only two answers to this question: applications on mobile
devices and television. For youth, non-cultural tourists, and established cultural
tourists, experts recommend using only mobile devices. They state that, nowadays,
most young people do not watch television. They prefer high-technology devices
(i.e., smartphones and digital tablets). However, the group of non-cultural tourists is
too broad and varied. Therefore, experts recommend using as many media as
possible to cover all people in this group. Moreover, for older adults and disabled
people, a majority of experts agree that television is still the main media they use.
However, the disabled group is too broad, and the media they prefer depend on their
ages and types of disabilities. For example, young disabled people may use
smartphones or tablets, but older disabled people may prefer to watch television.
Discussion: The findings are similar to those of many studies stating that there is a
trend of young people using the Internet through mobile devices (i.e., smart phones
and handheld tablet devices) rather than via laptops and personal computers
(Barnard, 2013; Rand et al., 2015). Users point out that it is easier than using a
computers or laptops. Moreover, users can use touchscreens, with no more
keyboards and mouses required.

170
Furthermore, in the case of older adults, several studies confirm that digital devices
are still the most significant barrier for this group. They mostly state that the interface
of digital devices is very hard to understand and use compared to what they are
familiar with (i.e., television or radio) (Worden et al., 1997; Chadwick-Dias et al.,
2003; Fox et al., 2004). This is the biggest barrier because all digital storytelling is
done on digital platforms (i.e., mobile phones, digital mobile devices, computers, or laptops) (Christodoulakis, 2014).
11. Background and characters
“What is the world and where is it set?” (Schafer, 2008).
Results: The majority of experts agree that all groups prefer to watch the real world,
locations, and characters only, not animation or surreal movies. They point out that
this guideline focuses specifically on cultural tourism. Therefore, viewers would like
to see interesting and real places, not just drawings. Moreover, only realistic pictures
can attract them to travel. However, youth are also interested in fantasy, surreal,
ideal, or imagined worlds. We can use both reality and fantasy to attract them. For
characters, we should use real, popular characters for all groups. Experts state that
most viewers will believe someone in the same age group, especially if they are
popular or celebrities. Therefore, we should use these characters to make viewers
believe.
Discussion: This result differs from those of studies that do not focus mainly on
locations or stages of the story. Only Schafer (2004), presenting the ‘stage’ as the
main element, and Miller’s (2012), ‘fictional work and setting’ emphasise this factor.
This is because this research tries to attract people to be interested in cultural
tourism. Therefore, presenting an interesting location is the best way to increase
their interest. This could be supported by the result from the first study stating that
‘visiting a place that I have not visited before’ is the main driver for four groups. This
driver is related to a finding from Crompton (1979), who states that some tourists go
on vacation because of beautiful and interesting scenery to change their
environment, no matter how comfortable their environments are.
In fact, the main purpose of movies is not to attract viewers to travel. However,

171
surprisingly, several studies throughout the world confirm that people are motivated
to visit the locations they see in the movies. (Riley and Van Doren, 1992; Tooke &
Baker, 1996; Busby and Klug, 2001; Connell, 2005; Iwashita, 2008; Bolan et al.,
2011; Gjorgievski et al., 2012; Suni and Komppula, 2012).
Riley and Van Doren (1992) explain that this is because, when people watch movies,
they are able to experience beautiful and interesting destinations without a hard sell.
Movies can affect the motivation to visit locations seen in the movie. Croy (2010)
states that movies can create awareness, motivations, and expectations among
people about visiting the real locations.
Bolan et al. (2011) conducted a qualitative study in the UK, collecting from 161
respondents information about what factors from movies can lead viewers to travel.
The data indicate that ‘scenery’ (43%) ranks as the first film factor, followed by
‘narrative/story’ (20%) and ‘characters’ (10%). These data are supported by a survey
conducted in 2004 in the UK indicating that eight out of 10 British people decided to
travel because of movies. Moreover, one out of five have plans to travel to the places
featured in their favourite movies (Hudson & Ritchie, 2006). This point can be used
to help in creating digital storytelling for cultural tourism as a significant motivational
driver.
5.4 Summary 5.4.1 Research questions
This study starts with the problem that, in cultural places, most tourists have no
motivation to read the story displayed. This issue can lead to a good opportunity to
increase visitors’ motivation to engage in cultural tourism using digital storytelling.
Furthermore, it focused on addressing these research questions:
• Research question 1: What are the digital storytelling guidelines that focus
specifically on cultural tourism?
This study centralises many general guidelines for digital storytelling into the single
guidelines. As stated previously, there is no guideline for non-interactive digital
storytelling focusing specifically on cultural tourism, especially for Thailand. Next, the
proposed guidelines of digital storytelling, composed of 11 elements, were created

172
based on the work of eight experts (Porter, 2005; Schafer, 2004; Salpeter, 2005;
Paul and Fiebich, 2005; Lambert, 2013; Ohler, 2008; Robin, 2008; Miller, 2012).
Table 5.7 The new digital storytelling guidelines composed of eight digital storytelling
experts
Themes Sub themes Explanation 1. Initial questions
1. The storyteller’s point of view
What is the main point of the story and what is the perspective of the author? (Lambert, 2006)
2. A key question
A key question that keeps the viewer's attention and will be answered by the end of the story. (Lambert, 2006)
3. The core idea and purpose
Established a purpose early on and maintains a clear focus throughout. (Robin, 2008)
4. Emotional Content
Good stories include essential elements such as conflict, transformation, and closure. (Salpeter, 2005)
2. Scripting 5. Story structure
What are the major events or challenges during the narrative? (Miller, 2012)
6. Economy Using just enough content to tell the story without overloading the viewer. (Lambert, 2006)
7. The rhythm of the story
The rhythm of the story and how slowly or quickly it progresses. (Lambert, 2006)
3. Media choices
8. The storyteller’s voice
Storyteller gives narrative the appropriate amount of focus in their story. (Ohler, 2008)
9. Soundtrack Music or other sounds that support and embellish the story. (Lambert, 2006)
10. Quality of media
What is the media (e.g. mobile phones, TV or the Internet)?
4. Audience experience
11. Background and characters
What is the world and where is it set?
• Research question 2: How can the figital storytelling guidelines be used to
motivate cultural tourism for five different groups in Thailand?
The guidelines were reviewed and interviewed by 17 Thai and international experts
and presented in the Table 5.6. Some results are interesting. For example, regarding
the first element, ‘the storyteller’s point of view’, experts recommend that the first-
person point of view should be used for all groups because telling stories via the
storyteller’s own perspective is the main issue in digital storytelling. For ‘the purpose’

173
element, experts suggest that storytellers should inform all groups about basic
information of cultural tourism, such as the meaning of cultural tourism. They state
that the term ‘cultural tourism’ is very new to Thai people. Therefore, we should
present to them what it is and why it is important. In regard to the ‘economy’, experts
suggest that, because of the shortened form of digital storytelling, using small
amounts of information will be enough for all groups. In terms of the ‘storyteller’s
voice’, this element is still necessary for all groups. This is because the storytellers
use their own voices to tell the story from the beginning to the end. The next
interesting point is that the ‘quality of media’ involves only two main types: mobile
devices and television. This is the same as the results of other studies indicating that
older adults are not familiar with the new technology, in contrast to young people.
The last interesting issue is ‘background and characters’; experts recommend that,
for all groups, storytellers should present only real locations, not fantasy, to attract
visitors because the story is about cultural tourism. They stated that most viewers
need to see real, interesting, and beautiful locations, not fantasy or animation.
Based on the results, it is obvious that non-interactive digital storytelling for cultural
tourism in Thailand is mainly about
• The first-person point of view
• Showing the meaning and importance of cultural tourism.
• Simplicity and brevity
• Using the storyteller’s voice to narrate
• Presenting real locations, not fantasy
These keywords can inform recommendations about how to simplify information
through storytelling. In particular, because of the rapid change in mobile device
technology, some projects try to focus on the latest innovation instead of creating
simple stories. Online visitors need a simple and easy story structure to understand.
Therefore, the key issue in the guidelines is to create good stories and content that
can be created by everyone, not just professionals and used on many technology
platforms in the future.
In conclusion, this study could not claim that following the guidelines can guarantee
the success of digital storytelling for cultural tourism for every target group.

174
Nevertheless, the digital storytelling guidelines are created, commented and
reviewed by 17 experts systematically. If the storytellers, researchers and users aim
to increase motivation for cultural tourism, then the guidelines could be appropriated
and result in positive impact.
5.4.2 Implication of this study • Cultural places
In the future, the tourism industry, museums and cultural sites will tend to develop
more high technology to present the data more realistically in order to deliver a
successful visitor experience. Therefore, digital storytelling in cultural tourism,
guiding the user’s experience and increasing motivation, seems to be the new trend
in the field. However, the key is how to apply and integrate these technologies
effectively with good, simple content that can be reused on many platforms, resulting
in meaningful, desirable and effective cultural tourism experiences. Therefore, these
guidelines are suitable for storytellers or researchers to use these data to understand
digital storytelling guidelines that match each group in the context of Thailand.
Finally, it creates new digital storytelling guidelines from expert interviews for five
groups representing specifically the motivation for cultural tourism in Thailand.
• User experience design (UX)
In these days, many current digital applications apply user experience (UX) to
design, evaluate and develop projects (Wither et al. 2010; Pujol et al. 2012; Floch
and Jiang 2015). For example, in case of CHESS (www.chessexperience.eu 2011),
the project starts by studying the user’s profile, demographics, interests, cognitive or
conceptual change, perception of value and inspiration. Finally, it creates a specific
user model that links between social media and augmented reality (AR). Pujol et al.
(2012) also recommend that the UX process should be tested with real users in real
locations with real experiences.
However, Law et al. (2009) suggest that user experience is very subjective and
dynamic over time. There are a number of factors, such as users, trends, society,
period of time and countries. This is the main problem about using UX design. UX
designers should be aware of this issue and test their works with each group.

175
Nevertheless, designers and storytellers can apply these guidelines into both non-
interactive and interactive form. This is because the guidelines are composed of 11
elements focusing on creating the story to attract five groups (youth, older adults,
disabled people, non-cultural tourists, established cultural tourists). Furthermore,
these guidelines can illustrate recommendations from experts about how to create
digital storytelling in the area of cultural tourism. As a result of this study, UX
designers can use this data to adapt into many digital applications on many
platforms.
• Personalisation technique Previous digital storytelling in museums tried to focus on the content on a device as
one content for all users. Nowadays, most cultural heritage museums adopt
personalisation methods, illustrating what each group is interested in. This allows
users to give feedback, age group, rate or answer questions about their interests,
and they will then be presented with specific information matching their interests.
The aim of the personalisation is to provide a smooth experience for each user
visiting the museum (Pujol et al. 2012).
Floch and Jiang (2015) support users who have different interests and there are
many stories and much information online. Most users would like to obtain, search,
filter and personalise the information they are interested in easily. Therefore, in order
to personalise the digital storytelling application, it is very important to understand
their information, needs and history. Lastly, designers can use these guidelines to
create personalisation data for all five groups presented with specific information.
• Local engagement Based on the original purpose of digital storytelling that is low-budget and non-
professional project, everyone could create their own digital stories. Moreover,
creating digital storytelling does not require the hi-end equipment, only mobile
phones, basic digital cameras and free editing programs are acceptable. There are
several digital storytelling projects that support local people to create stories showing
about their towns, lifestyles, social values and local identity. Hence, members in any
local place could be trained in workshops by adapting these guidelines to create

176
simple digital stories from their personal ideas to attract people to go to cultural
places or understand local lifestyles. The projects which adopted the guidelines
could be personal presentations about their cities, historical places, daily life stories,
cultural events or festivals that can connect outsiders with the local community. This
is because cultural tourism originally does not emphasise on transportation,
shopping or accommodation, but focus mainly on the understanding and connecting
with local cultures, lifestyles and histories. Furthermore, digital storytelling can
increase the relationships between people and historical places or festivals, the past
and present through local story telling. As a result, this can lead to sustain
community engagement for long term promoting and preserving cultural sites, local
cultures and traditions and increase local economy in their own cities also.
5.4.3 Study limitations 1. Interviewees – a lack of academic background This study interviewed 17 digital storytelling experts from both academic and
industrial groups, with the topic of how to use 11 elements to increase motivation in
cultural tourism. When the researcher interviewed two academic experts in the pilot
tests, there was no problem. However, in the real study, some industrial digital
storytelling experts did not understand the 11 elements clearly. They said they had
never studied such an approach in the academic area and could not offer advice on
how to make each element work. Therefore, the researcher had to change the style,
from structured interviews to unstructured interviews, asking the interviewees to
freely explain how to create digital storytelling for cultural tourism for each group.
Suggestion: The researcher recommends the use of a pilot test with all participant
groups. For example, in this case, the researcher should test the interview with both
academic and industrial experts before the real test in order to determine any
problems. 2. Misunderstanding in digital storytelling When the researcher contacted the interviewees by email and telephone, some of
them refused to join the study, stating that they did not know the term ‘digital
storytelling’. Hence, the researcher had to explain the definition and give clear
examples of digital storytelling. This also happened in the first study because the
majority of participants had never heard the word ‘cultural tourism’ before.

177
Suggestion: As a way of increasing the acceptance rate, the researcher
recommends providing the definitions of any technical terms in the email sent to
interviewees.
3. Interviewees – a lack of experience with some groups This interview set up the questions for five groups. Sometimes, experts refused to
give suggestions for the groups they had never worked with (i.e. older adults and
disabled people). However, the researcher presented the interviewees with the
results from the first study, focusing in particular on the barriers (why they did not go)
and drivers (why they did go) for each group.
Suggestion: The researcher recommends the provision of details, data and/or
results for interviewees, especially when it comes to certain specific information.
Disabled people and older adults are the groups that digital storytelling experts have
the least experience working with. 4. Limited use with Thai users These guidelines were originally created to target Thai audiences, based on the
results of the previous study, which explored the barriers and drivers for Thai
participants. Moreover, out of the 17 experts interviewed, 13 were Thai and 4 were
international. As such, the findings might not be appropriate to other countries,
especially when it comes to recommendations related to Thai culture.
Suggestion: The researcher recommends other studies to create their own
guidelines for the specific topics they wish to use. If they need to target Thai users,
this guideline is appropriate. However, if they plan to target international users, they
should re-evaluate the guideline.
5.4.4 Detailing the framework From the results of this chapter, the IDST framework was detailed on the link
between digital storytelling and cultural tourism to increase motivation in cultural
tourism. The detailed data presented with the top recommendation for each group is
illustrated on the Figure 5.3.

178
Figure 5.3 The results of the study presenting with the top recom
mendation for each group

179
Chapter 6: Inclusive digital storytelling to understand audiences’ behaviour
6.1. Introduction
6.1.1 Definition of ‘Inclusive digital storytelling’
6.1.2 Why using digital mobile devices to watch digital storytelling?
6.2 Research methods
6.2.1 The sample sizes
6.2.2 The observation plan
6.2.3 The criteria for choosing a short video and animation
6.3 Results
6.3.1 Demographic profile
6.3.2 Percentage and average time of participants who can complete the task and negative - positive comments in all stages
6.3.3 Results from all stages
6.4 Discussion
6.4.1 Reaching (accessibility and understanding)
6.4.2 Engaging (usefulness, usability, desirability)
6.5 Summary
6.5.1 Research question Research question 1: What are the diverse audiences’ behaviour in terms of reaching with digital mobile devices Research question 2: What are the diverse audiences’ behaviour in terms of engaging with digital mobile devices
6.5.2 Study Implications
Digital inclusion Teaching older adults and disabled people
6.5.3 Study Limitations
1. Internet connection
2. Low educational levels for some groups
3. The length of video and animation was too long
4. Low acceptance rate for the observation
5. Access
6.5.4 Detailing the framework

180
6.1. Introduction
In order to complete the final framework, this chapter was started by the link between
inclusive design and digital storytelling. Watching digital storytelling on mobile
devices is convenient and popular, but an issue arises if people (especially older
adults and disabled people) cannot access or understand how to use this form of
technology. Moreover, some groups of users have problems with and different
experiences when using digital mobile devices. These problems in turn create
opportunities to apply inclusive designs to digital technology to understand users’
behavioural needs when watching digital storytelling.
The aim and objectives of this chapter are in the table 6.1. Moreover, this chapter aims to answer the research questions:
• Research question 1: What are the diverse audiences’ behaviour in terms of
reaching with digital mobile devices
• Research question 2: What are the diverse audiences’ behaviour in terms of
engaging with digital mobile devices Table 6.1 Aim and objectives of the study
Aim Objectives
1. to present the inclusive digital
storytelling (IDST) principle to
understand diverse audiences in terms
of reaching (accessibility and
understanding) and engaging with
(usefulness, usability, desire) digital storytelling on digital mobile devices.
1.1 To understand users’ ability to
reach with digital storytelling on digital mobile devices
1.2 To understand users’ ability to
engage with digital storytelling on digital mobile devices
To achieve this aim, 50 observations divided into five groups (youths, older adults,
disabled people, non-cultural tourists, and cultural tourists) were set up in Thailand.

181
The participants were asked to use a digital mobile device (an iPad mini 1) to visit
YouTube and search for a short video and animation about tourism. They were
asked to complete eleven user journey stages to test users’ ability to access and
understand the format, as well as engaging with usefulness, usability, and desirability when watching videos on a mobile device.
Figure 6.1 The link between inclusive design and digital storytelling in this chapter
6.1.1 Definition of ‘Inclusive digital storytelling’
Nevertheless, digital storytelling is useful and popular, but one problem is that all
content is on a digital format (i.e., digital mobile devices, smartphones, interactive
systems, laptops, and computers). This leads to questions about whether people
(especially older adults and disabled people) are unable to access and understand
this form of technology (Gill & Perera, 2003; Russell et al., 2008; Fuglerud & Sloan,
2013; Orso et al., 2015; Tsai et al., 2015).
This means that this study adopts the concept of inclusive design for digital
storytelling to understand the behaviours of all potential groups of people, especially
older adults and disabled people. Inclusive design in this study is imperative to

182
ensure that everyone can follow digital storytelling. In order to adapt inclusive design
with digital storytelling, this study will offers a definition of inclusive digital storytelling
(IDST) as shown in the Table 4.2, postulating that IDST is narrative entertainment
that reaches and engages as many audiences as reasonably possible via digital
technology and media.
Table 6.2 Definition of ‘Inclusive digital storytelling’
Terms Definitions
Inclusive design
The design of mainstream products and/or services that are accessible to, and
usable by, as many people as reasonably possible ... without the need for special
adaptation or specialised design.
Digital storytelling
Digital storytelling is narrative entertainment that reaches the audience via digital
technology and media. Additionally, digital storytelling techniques can make a dry
or difficult subject more alive and engaging to the viewers
Inclusive digital storytelling
Inclusive digital storytelling is narrative entertainment that reaches and engages as
many audiences as reasonably possible via digital technology and media.
6.1.2 Why using digital mobile devices to watch digital storytelling?
There is a recent trend to access the Internet through digital mobile devices such as
smartphones and handheld tablet devices, rather than laptops and desktop
computers (Barnard et al., 2013). Touchscreen technology in tablet devices allows
users to swipe, tap or pinch the screen directly. This is more naturalistic than using a
computer mouse or a keyboard. Moreover, it is used as a self-training equipment for
some disable people having problems in finger dexterity also (Barnard et al., 2013;
Rand et al., 2015). Besides, this study tests some people who have never used the
Internet or computers before. On a digital tablet, people can use a touchscreen,
without the need for a keyboard or mouse, which could be easier than using a desktop computer or a laptop.

183
6.2 Research methods 6.2.1 The sample sizes
This qualitative study seeks to understand audiences’ ability to reach and engage with
digital storytelling on digital mobile devices, focusing on five groups in Bangkok, Thailand:
youths (15-24 years); people with disabilities; older adults (those over 60), established
cultural tourists, and people uninterested in cultural tourism (i.e., non-cultural tourists). To
achieve this aim, 50 observations – 10 for each group – were set up in Bangkok from June to September 2016, in the following locations:
Table 6.3 Locations to set up observations for five different groups
Groups of people Number of participants
Locations to set up the observations
1. Youth 10 The Siam Centre department store
2. Older adults 10 The Ban Bang Khae social welfare development centre
3 .Disabled people 10 The Baanphrapradaeng Disabled Foundation
4. Non-cultural tourists
10 Underground train stations
5 .Cultural tourists 10 Museum Siam
6.2.2 The observation plan
The observation schedule consisted of three parts. The first was eight questions to
gain a demographic profile of respondents (gender, age, education, monthly income,
type of disability; how many days/year spent on cultural and mass tourism; and
experience with digital devices); the second part consisted of six stages of watching videos on an iPad; and the third was five stages of watching animation on an iPad.

184
Table 6.4 11 user journey stages to watch video and animation from IPad
Participants were asked to use a digital mobile device (the iPad Mini, version 1) to
visit YouTube and search for and watch a short video and animation. They were
asked to talk out loud about what they saw, their thoughts, and their feelings at every
User journey stages Activities
Rou
nd 1
1. Unlocking a mobile device
- Give an iPad mini 1 to the participants
- Ask them to unlock the screen to access the home page
2. Opening the ‘YouTube’ application
- Ask the users to find the Youtube icon on the first page of IPad - Click the icon to open the Youtube application
3. Accessing the ‘Search’ icon
- Ask them to find the ‘Search’ icon to search for videos on Youtube
- Click the ‘Search’ icon to open the search panel
4. Typing the movie title - Ask them to type the movie tile ‘I hate Thailand’ on the search panel
5. Clicking on the ‘Play’ icon and watching the movie
- Ask them to click on the ‘Play’ icon and watch the video
- Ask them to comment on every issue when watching (understand or not; like or dislike, etc.)
6. Closing the movie window
- Ask them to find the ‘Close’ icon
- Click the ‘Close’ icon to turn off the video window
Rou
nd 2
7. Accessing the ‘Search’ icon
- Ask them to find the ‘Search’ icon in Youtube again (round 2)
- Click the ‘Search’ icon to open the search panel
8. Typing the animation title
- Ask them to type the animation tile ‘Jinxy Jenkins, Lucky Lou’ on the search panel
9. Clicking on the ‘Play’ icon and watching the animation
- Ask them to click on the ‘Play’ icon and watch the animation
- Ask them to comment on every issue when watching (understand or not; like or dislike, etc.)
10. Closing the animation window
- Ask them to find the ‘Close’ icon
- Click the ‘Close’ icon to turn off the video window
11. Closing the application - Ask them to find the ‘Close’ icon
- Click the ‘Close’ icon to turn off the Youtube application

185
stage. The time to complete all tasks varied from 30 to 60 minutes. During the
observations, each participant was recorded by two video cameras and a voice-
recording device. The first camera (a GoPro Hero4 Black) was set up in front of
participants, recording with a super-wide-angle view to capture all their activities and
actions. The second camera was a video camera zooming close up to the iPad
screen. All participants were asked to complete 11 user journey stages to test their
ability to reach (accessibility, understanding) and engage with (usefulness, usability,
desirability) videos on a mobile device. The 11 stages consist of two rounds;
watching videos (round 1) and animations (round 2). Round 1 was composed of: (1),
unlocking a mobile device; (2), opening the application YouTube; (3), accessing the
‘Search’ icon on YouTube; (4), typing the video name ‘I hate Thailand’; (5), finding
the icon ‘Play’ to watch the video; (6), closing the video. Round 2 consisted of: (7),
accessing the ‘Search’ icon on YouTube; (8), typing the video name ‘Jinxy Jenkins,
Lucky Lou’; (9), using the icon ‘Play’ to watch the animation; (10), closing the animation; (11), closing the application.
6.2.3 The criteria for choosing a short video and animation
The criteria for choosing a video and digital storytelling animation to test are: (1), its
length should not exceed six minutes; (2), the total number of views on YouTube
should be over one million, to reflect its popularity; (3), it should have received
international awards for its good quality and acceptance; (4); it should be a story about tourism. The details about the videos are illustrated in Table 6.5.

186
Table 6.5 Details of videos and animations on YouTube presented to participants
Title I hate Thailand Jinxy Jenkins, Lucky Lou
A film by The Tourism Authority of Thailand
(TAT) Michael Bidinger and Michelle Kwon
Types of digital storytelling
Video Animation
Published 18 Nov., 2014 31 Jul., 2014
Time 5.21 minutes 3.51 minutes
Views 3,650,547 views (15 May 2016) 1,129,618 views (15 May 2016)
Awards 4 international awards (http://www.tatnews.org, 2016)
14 international awards (https://www.youtube.com/watch?v=OuJ4BBQ0nhc, 2016)
6.3 Results
6.3.1 Demographic profile
The results indicate that the average age of the young people was 19.6, while for
older adults it was 83.2 years; for disabled people the average was 39.4 years, for
non-cultural tourists 28.1 years, and established cultural tourists, 22.1 years. The
majority of young people (10 respondents), non-cultural tourists (8 respondents), and
established cultural tourists (10 respondents) had an undergraduate level of
education. However, the majority of older adults (5 respondents) had a
primary/secondary level education, and disabled people (5 respondents) had no
education. In term of the disabled participants, the group was composed of five
people with a mobility-based disability and five people with intellectual functioning or
cognitive/learning difficulties. In terms of experience in using digital mobile devices
(smart phones and digital tablets), the most experienced group was established

187
cultural tourists (5.4 years), following by non-cultural tourists (4.75 years), young people (4.5 years), disabled people (0.7 years), and older adults (0.1 year).
Table 6.6 Demographic information for all five groups
Factor Youths Older adults
Disabled people Non-cultural tourists
Established cultural tourists
1. Gender
• Male 5 - 4 4 3
• Female 5 10 6 6 7
2. Average age 19.6 83.2 39.4 28.1 22.1
3. Education
• Primary/Secondary 5 2
• High school 2 1 1
• Diploma/ Certificate 2 1
• Undergraduate 10 2 8 10
• Post-graduate or above
• Others (no education) 1 5
4. Type of disability 5 Mobility
5 Intellectual functioning or cognitive/learning
5. Experience using digital mobile devices
4.5 years
0.1 year
(9 persons have no experience)
0.7 year
(7 persons have no experience)
4.75 years
5.4 years

188
Figure 6.2 this study set up two cameras; 1.) a super-wide-angle view (GoPro Hero4 Black); 2.) a video camera zooming close up to the iPad screen
6.3.2 Percentage and average time of participants who can complete the task and negative - positive comments in all stages
The results obtained regarding the number of participants who completed the task and
the average time (in seconds) are illustrated in Table 6.7 In addition, negative and

189
positive comments from participants coded by two coders are presented in Tables 6.8 and 6.9.
Table 6.7 Percentage of participants who can complete the task and their and average time (seconds)
User journey stages Youths Older adults
Disabled people
Non-cultural tourists
Cultural tourists
Experience with digital mobile devices
4.5 years 0.1 year
0.7 year 4.75 years
5.4 years
% Time % Time % Time % Time
% Time
Rou
nd 1
1. Unlocking mobile devices
100 1.6 20 10.5 60 17.2 100 4.3 100 1.9
2. Opening the application ‘YouTube’
100 1.6 30 34 50 14.9 100 2.7 100 2
3. Accessing the ‘Search’ icon
90 5.6 20 26.6 30 30.9 100 2.2 100 2.2
4. Typing the movie title ‘I hate Thailand’
100 20.6 0 63.2 20 31.6 100 23.3
100 21.3
5. Clicking on the ‘Play’ icon and watching the movie
100 1.1 30 4 60 2.6 100 1.8 100 1.9
6. Closing the movie window
100 1.6 30 12.3 50 2.8 100 4.3 100 1.7
Rou
nd 2
7. Accessing the ‘Search’ icon
100 1.2 50 10.4 60 10.3 100 1.6 100 1.7
8. Typing the animation title ‘Jinxy Jenkins, Lucky Lou’
100 29.8 10 60.7 30 45.7 100 33.6
100 16.8
9. Clicking on the ‘Play’ icon and watching the animation
100 1.4 50 3.4 60 10.4 100 1.6 100 1.6
10. Closing the animation window
100 1.4 50 8.8 70 5.6 100 2.7 100 1.4
11. Closing the application 100 1.4 50 10.4 70 29.9 100 2.2 100 1.7
Mean 99 6.1 30 22.2 50 18.3 100 7.3 100 4.9

190
Figure 6.3 The number of participants w
ho need help and their average time to
complete the task

191
Table 6.8 Negative comments during all stages from all participants and the number, of people who made them
User journey stages
Youth Older adults
Disabled people
Non-cultural tourists
Cultural tourists
Rou
nd 1
1. Unlocking mobile devices
Not suitable for complicated work [2]
Fear of new technology [5]
Knowledge barrier [5]
Lack of familiarity [5]
Health problems [2]
Addiction concerns [2]
Addiction concerns [8]
2. Opening the application ‘YouTube’
iPad/IOS unfamiliarity [3]
Usability issue – touchscreen [4]
Usability issue – touchscreen [5]
Lack of experience – YouTube [2]
N/A
3. Accessing ‘Search’ icon
N/A Interface unfamiliarity [5]
Usage constraint – physical condition [6]
Lack of experience – YouTube [2]
N/A
4. Typing the movie title ‘I hate Thailand’
N/A English language barriers [5]
Typing difficulties [3]
English language barriers [2]
N/A
5. Clicking on ‘Play’ icon and watching the movie
Horizontal frame preference [4]
Usage constraint – physical condition [4]
Usability issue – touchscreen [5]
Horizontal frame preference [3]
Internet signal problem [2]
6. Closing the movie window
N/A Usage constraint – physical condition [4]
Size of icons [4]
Size of icons [2]
Size of icons [1]
Rou
nd 2
7. Accessing ‘search’ icon
N/A Poor memory [3]
Size of icons – too small [3]
Size of icons – too small [1] No icon hint [1]
N/A
8. Typing the animation title ‘Jinxy Jenkins, Lucky Lou’
Complicated title [2]
English language barriers [3]
English language barriers [2]
Complicated title [2]
Complicated title [2]
9. Clicking on ‘Play’ icon and watching the animation
N/A Speaker problem [3]
Usability issue – touchscreen [3]
Internet signal problem [2]
Internet signal problem [2]

192
10. Closing the animation window
N/A Usage constraint – physical condition [3]
Size of icons –too small [3]
Size of icons – too small [4]
N/A
11. Closing the application
N/A Interface unfamiliarity [5]
Interface unfamiliarity [2]
N/A N/A
Table 6.9 Positive comments during all stages from all participants, and the number of people who made them
User journey stages
Youths Older adults
Disabled people
Non-cultural tourists
Cultural tourists
Rou
nd 1
1. Unlocking mobile devices
Convenience – format [3]
Convenience – watching video [2]
Convenience – similar to smartphone [3]
Convenience – size [3]
Convenience – anytime, anywhere [5]
2. Opening the application ‘YouTube’
Ease of accessing application [2]
Ease of accessing application [2]
Ease of accessing application [1]
N/A Ease of accessing application [3]
3. Accessing ‘Search’ icon
Familiarity – similar to Android [2]
N/A Meaning of icon [2]
N/A N/A
4. Typing the movie title ‘I hate Thailand’
Keyboard usability – size [3]
N/A N/A N/A N/A
5. Clicking on ‘Play’ icon and watching the movie
Convenience – big screen [2]
N/A Convenience –anytime, anywhere [2]
Convenience –anytime, anywhere [2]
Convenience – big screen [1]
6. Closing the movie window
Familiarity – similar to Android [2]
N/A N/A N/A N/A
Rou
nd 2
nd 2
7. Accessing ‘Search’ icon
N/A Remembered instructions [3]
N/A Remembered instructions [2]
N/A
8. Typing the animation title ‘Jinxy Jenkins, Lucky Lou’
N/A N/A N/A N/A N/A

193
9. Clicking on ‘Play’ icon and watching the animation
N/A Remembered instructions [2]
Convenience –anytime, anywhere [1]
N/A N/A
10. Closing the animation window
Convenience – size [2]
Remembered instructions [2]
Remembered instructions [3]
N/A N/A
11. Closing the application
N/A N/A Remembered instructions [2]
N/A N/A
6.3.3 Results from all stages
• Stage 1: ‘Unlocking a mobile device.’
The task of this stage is to let participants try to unlock the iPad’s screen, without any
help from staff. All youths, non-cultural tourists, and cultural tourists can unlock the
screen. However, only 20 percent of the older adults and 60 percent of disabled
people were able to finish this task. Moreover, for older adults, the reason why they
were unable to do so is the factor ‘fear of new technology’ (‘I have never used this
kind of digital device before and am afraid to use it because I have never used it
before), which received the highest number of all negative comments. For disabled
people, both a ‘knowledge barrier’ (‘No one has taught me; I need someone to teach
how to use it and if someone teaches me, maybe I will use it’) and ‘unfamiliarity’ (‘If it
is not too complicated – so many icons and interfaces – I would like to try it; I would
prefer it to be smaller, lighter, and involving buttons, like TV remote control; I would
prefer it to be cheaper and involving buttons, not a touchscreen; I prefer buttons, like
the old versions of mobile phones) received the highest number of negative
comments.
1 Unlocking
mobile device
2 Opening
the application
3 Accessing the ‘Search
icon’
4 Typing the movie title
5 Watching the movie
6 Closing
the movie window
7Accessing the ‘Search
icon’
8Typing the animation
title
9Watching
the animation
10Closing
the animation window
11 Closing
the application

194
Table 6.10 Negative and positive comments during stage 1 from all participants
Negative comments during stage 1
Themes Comments Mentions
Y 1. Not suitable for complicated work [2]
- It cannot be used seriously like laptops or computers for working
1
- I can use to use the Internet only, not for working 1 O 1. Fear of new
technology [5] - I never used this kind of digital devices 3
- I am afraid to use it because I never used this before 2 2. Knowledge barrier [3]
- No one gives me to try 1
- If someone teach me, I would try 1 - No one teaches me 1 3. Usability issue – size [6]
- This device is too heavy. 1
- It is too small 1 - the alphabet and keyboards are too small 1 4. Not interested [2] - It is interesting device, but I have no reason to use. 1 - I do not play games, watch movies or social media. So,
I do not need this. 1
5. Self-perception barrier [2]
- I am too old to learn how to use 1
- I am too old to try using digital devices 1 6. Usability issue – touchscreen [5]
- Significantly, I do not know how to use touchscreen 2
- If there are buttons, I would like to try. 3 D 1. Lack of familiarity
[5] -If it is not too complicated (so many icons and interfaces), I would like to try.
1
- If it is smaller, lighter and using buttons, like TV remote, I will prefer to use.
1
- If it is cheaper and using buttons, not touchscreen, I will prefer to use.
1
- I prefer button, like the old version of mobile phone. 1 - I prefer using buttons rather than touchscreen 1 2. Fear of new technology [3]
- I am not used to this technology 1
- It is an electronic digital device. I am afraid to use. 1 - I am afraid to use touchscreen 1 3. Financial barrier [2]
- IPad is very expensive. 2
N 1. Health problem [2] - It can make your eyesight worse. Moreover, you will not have good relationship with others
2
2. Addiction concerns [2]
- I can be addicted, if I cannot manage my time 2
C 1. Addiction concerns [8]
- The negative point is that you will be addicted. 1
- The bad point is that you might become socially addicted.
1
- However, it can make you addicted. 1 - However, we mostly spend a lot of time to use social
media from this device. 1
- I spend a lot of time too long in a day to use it [2] 1 - However, I can be addicted, if I cannot manage my
time. 1
- However, some people are addicted. They use tablets 1

195
or smart phone all days. 2. Convenience – anytime anywhere [5] (other comment)
- I can search and access information I need very fast. Convenience – anytime anywhere
1
- I can update news or any information I am interested. 1 - It is very easy to use and work also. 1 - The good point is that it is very easy to connect to the
Internet. 1
- I think tablets are very useful. You can use social media or upload files anytime in anyplace.
1
Positive comments during stage 1
Themes Comments Mentions Y 1. Convenience –
format [3] - I can use it instead of computers and laptops 1
- It is very light weight and handy, compared to laptop. Moreover, it is bigger than smart phones. So when I read many texts, it is easier.
1
- IPads or tablets are in the middle between computers and smartphones. This is a good point.
1
C 1. Convenience- watching video [2]
- If it is more convenient to watch movie or TV series, I would like to try.
2
D 1. Convenience – similar to smart phone [3]
- It is a very convenient device [2] 2
- For me, it is quite easy to use because I have used smart phone.
1
N 1. Convenience – size [3]
Tablets are something that is in between laptops and smart phones. So, it is lightweight and handy. It is very convenient to use outside and inside [2]
2
The good point is very convenient to use 1 I can search and access information I need very fast. 1
C 1. Convenience – anytime anywhere [5]
- I can search and access information I need very fast. Convenience – anytime anywhere
1
- I can update news or any information I am interested. 1 - It is very easy to use and work also. 1 - The good point is that it is very easy to connect to the
Internet. 1
- I think tablets are very useful. You can use social media or upload files anytime in anyplace.
1
2. Usefulness - features [2]
- There are so many functions and features, such as calculator, games, email.
1
- I love the technology. This device can make us call with camera and many high technology features.
1
• Stage 2: Opening the application YouTube
This stage required participants to click on the iPad screen to open the application
1 Unlocking
mobile device
2 Opening
the application
3 Accessing the ‘Search
icon’
4 Typing the movie title
5 Watching the movie
6 Closing
the movie window
7Accessing the ‘Search
icon’
8Typing the animation
title
9Watching
the animation
10Closing
the animation window
11 Closing
the application

196
YouTube. All young people, non-cultural tourists, and cultural tourists were able to
do so. However, only 30 percent of older adults and 50 percent of disabled people
could do the same. The reason why older adults were unable to complete is ‘usability
issue – touchscreen’ (‘This is my first time using a touchscreen. So, I am afraid to
use it – please help me; I do not know how heavily I have to press on the icon’). For
disabled people, ‘usability issue – touchscreen’ (‘I do not know how to press the icon
(how much pressure to apply) on the touchscreen; I never use touchscreens. So, I
do not want to try; I cannot control the touchscreen and how hard I must press my
finger to slide the screen’) was also the main barrier.
Table 6.11 Negative and positive comments during stage 2 from all participants
Negative comments during stage 2
Themes Comments Mentions Y 1. iPad/IOS
unfamiliarity [3] - Some icons are quite different because I mostly use Android.
1
- I am not familiar with Mac OS system and interface. I use Android.
2
O Usability issue – touchscreen [4]
- This is my first time to use touchscreen. So, I am afraid to use, please help me.
3
-- I do not know how heavy I have to press on the icon 1 Usage constraint – physical condition [2]
- The icon is too small. I need eyeglasses [2] 2
English language barriers [1]
- The screen is full of English language. I cannot read [1] 1
D Usability issue – touchscreen [5]
- I do not know how to press icon on (how much pressure) touchscreen.
2
- I never use touchscreen. So, I do not want to try. 2 - I cannot control touchscreen and how hard of my
finger to slide the screen. 1
Interface unfamiliarity [2]
- I do not know where the icon is .
1
- I do not know how to click. 1 Usage constraint – physical condition [2]
- My fingers are not good in typing something small.
1
- I cannot control it well. 1 English language barriers [1]
- There is no Thai language, only in English [1] 1
N Lack of experience – YouTube [2]
- I am not sure which application. Normally, I never used Youtube
2
C N/A N/A Positive comments during stage 2
Themes Comments mentions Y Ease of accessing
application [2] - It is more convenient to click just an icon rather than type the full address
2
O Ease of accessing application [2]
- It is easier than I thought, just one click [2]
2
Familiarity [1] - I have experience to use (games and chat). So, it is 1

197
easy to click Youtube icon D Ease of accessing
application [1] - It is very easy to click on the icon Youtube rather than typing full address on the website.
1
N N/A N/A C Ease of accessing
application [3] It is very easy to click on icon.
3
Familiarity [1] - I have used this for a very long time, Youtube. I am familiar with the icon.
1
• Stage 3: Accessing the ‘Search’ icon on YouTube
This task requires participants to find the ‘Search’ icon on YouTube and click on the
icon. All non-cultural tourists and cultural tourists were able to do so. However, only
90 percent of youths, 20 percent of older adults, and 30 percent of disabled people
could. The main reason older adults could not complete the task was ‘interface
unfamiliarity’ (‘I cannot find it. I do not understand about icons; I mostly use the iPad
to play games. So, I do not know where the search icon is’). For disabled people, the
highest score was for ‘usage constraint – physical condition’ (‘My eyes are not good;
I cannot see it clearly; my fingers are not good at typing something small; it needs to
be bigger’).
Table 6.12 Negative and positive comments during stage 3 from all participants
Negative comments during stage 3
Themes Comments Mentions Y N/A N/A O Interface unfamiliarity
[5] - I cannot find it. I do not understand about icon.
2
- For the new users, they cannot find it at the first time. 1 - Mostly, I use IPad to play games. So, I do not know
where the search icon is. 1
- In my case, I never used it before. So, I do not know where it is.
1
English language barriers [2]
- There is only English, not Thai.
2
Usage constrain - physical condition [1]
- I need eyeglasses. 1
D Usage constraint – physical condition [6]
- my eyes are not good
1
- I cannot see it clearly. 1 - I cannot see something small. 1
1 Unlocking
mobile device
2 Opening
the application
3 Accessing the ‘Search
icon’
4 Typing the movie title
5 Watching the movie
6 Closing
the movie window
7Accessing the ‘Search
icon’
8Typing the animation
title
9Watching
the animation
10Closing
the animation window
11 Closing
the application

198
- It is too small 1 - My fingers are not good in typing something small 1 - It should be bigger. 1 Interface unfamiliarity [4]
- I cannot find icon ‘search’. Where is it? Do I need to go back to the main page?
1
I cannot find. It is very difficult for me. 1 - It is too difficult for me. I am afraid to try. 1 - I do not know where it is. 1
N Lack of experience – Youtube [2]
- I never used Youtube. So, I am not used to it.
2
Size of icon [2] The icon is too small. 2 Positive comments during stage 3
Themes Comments Mentions Y Familiarity – similar
to Android [2]
- The interface of Youtube on IPad is the same as in Android. So, I have no problem to use.
1
- The same as Android. 1 C N/A N/A D Meaning icon [2]
other comment I like the meaning of icon ‘magnifying glass’. It is easier to understand.
2
N N/A N/A C N/A N/A
• Stage 4: Typing the movie title ‘I hate Thailand’
This stage requires participants to type the video title ‘I hate Thailand’ on the iPad
keyboard. All youth, non-cultural tourists and cultural tourists were able to do so, but
no older adults and 20 percent of disabled people completed the task. The highest
scoring barrier for older adults is ‘English language barriers’ (‘I do not know English; I
have never typed in English before’). For disabled people, ‘typing difficulties’ (‘I am
good in typing in Thai rather than in English; I am better at typing in Thai’) received the highest score.
Table 6.13 Negative and positive comments during stage 4 from all participants
Negative comments during stage 4
Themes Comments mentions Y N/A N/A O English language
barriers [5] - I do not know English [3]
3
- There is English only 1
1 Unlocking
mobile device
2 Opening
the application
3 Accessing the ‘Search
icon’
4 Typing the movie title
5 Watching the movie
6 Closing
the movie window
7Accessing the ‘Search
icon’
8Typing the animation
title
9Watching
the animation
10Closing
the animation window
11 Closing
the application
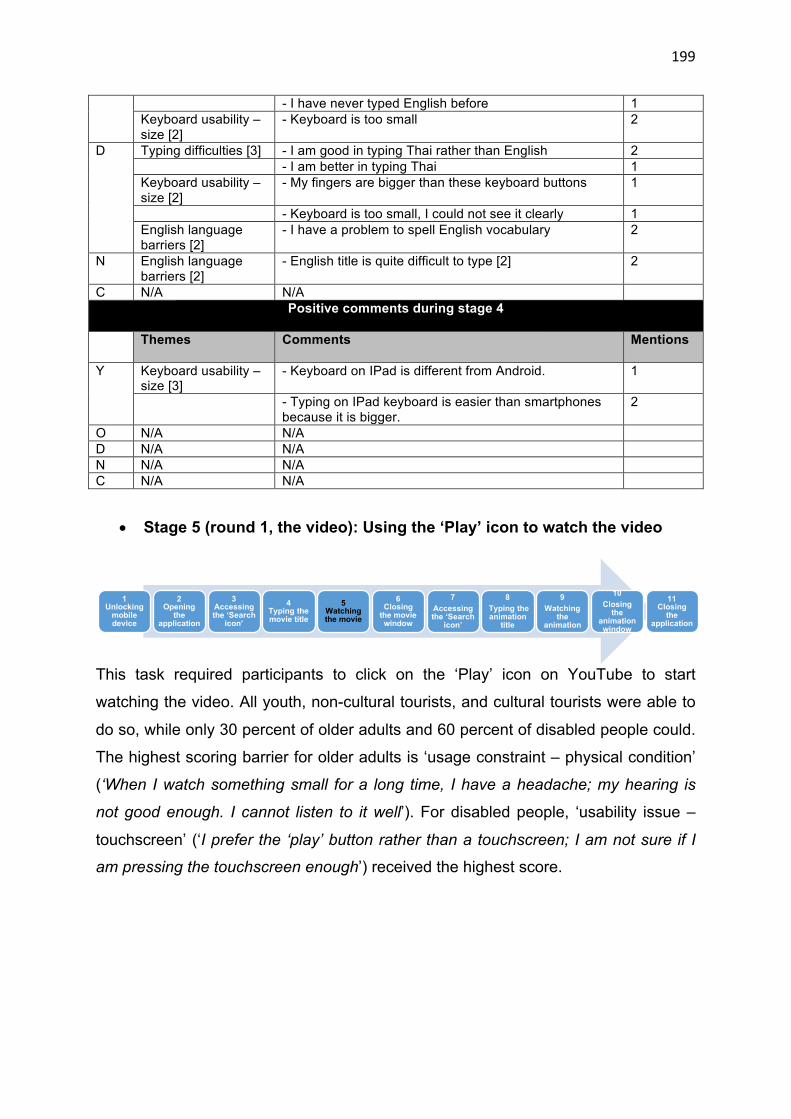
199
- I have never typed English before 1 Keyboard usability – size [2]
- Keyboard is too small 2
D Typing difficulties [3] - I am good in typing Thai rather than English 2 - I am better in typing Thai 1 Keyboard usability – size [2]
- My fingers are bigger than these keyboard buttons
1
- Keyboard is too small, I could not see it clearly 1 English language barriers [2]
- I have a problem to spell English vocabulary 2
N English language barriers [2]
- English title is quite difficult to type [2] 2
C N/A N/A Positive comments during stage 4
Themes Comments Mentions
Y Keyboard usability – size [3]
- Keyboard on IPad is different from Android. 1
- Typing on IPad keyboard is easier than smartphones because it is bigger.
2
O N/A N/A D N/A N/A N N/A N/A C N/A N/A
• Stage 5 (round 1, the video): Using the ‘Play’ icon to watch the video
This task required participants to click on the ‘Play’ icon on YouTube to start
watching the video. All youth, non-cultural tourists, and cultural tourists were able to
do so, while only 30 percent of older adults and 60 percent of disabled people could.
The highest scoring barrier for older adults is ‘usage constraint – physical condition’
(‘When I watch something small for a long time, I have a headache; my hearing is
not good enough. I cannot listen to it well’). For disabled people, ‘usability issue –
touchscreen’ (‘I prefer the ‘play’ button rather than a touchscreen; I am not sure if I
am pressing the touchscreen enough’) received the highest score.
1 Unlocking
mobile device
2 Opening
the application
3 Accessing the ‘Search
icon’
4 Typing the movie title
5 Watching the movie
6 Closing
the movie window
7Accessing the ‘Search
icon’
8Typing the animation
title
9Watching
the animation
10Closing
the animation window
11 Closing
the application

200
Table 6.14 Negative and positive comments during stage 5 from all participants
Negative comments during stage 5
Themes Comments mentions
Y Horizontal frame preference [4]
I prefer watching by horizontal frame. So, I need to use two hands to hold it.
4
Screen brightness [2] When watching movie outdoor, the screen is not bright enough.
2
Not familiarity – format [2]
Mostly, I watch video by smart phone and computer, not IPad.
2
Speaker problem [1] Speaker is not too loud enough for outdoor watching. 1 No subtitle [1] There should be subtitle because sometimes I watch
video in the train or bus. I do not want other people know what I am watching
1
O Usage constrain – physical condition [4]
When I watch something small for a long time, I will have an headache.
2
My hearing is not good enough. I cannot listen it well. 2 D Usability issue –
touchscreen [5] I prefer ‘play’ button rather touchscreen. 4
I am not sure I press touchscreen enough. 1 Usability issue – size [2]
It is quite heavy because I have been watching for almost 5 minutes.
2
Usage constrain – physical condition [1]
My fingers cannot touch it properly. 1
N Horizontal frame preference [3]
I need to enlarge the screen by changing into horizontal frame.
3
Internet signal problem [2]
Internet signal is not good enough for watching video on Youtube.
2
Usability issue – sound [1]
I need earphone. I cannot listen well outdoor. 1
C Internet signal problem [2]
When watching movie outdoor, it depends on the Internet signal also.
2
Familiarity [1] I already watched it before. 1 Positive comments during stage 5
Themes Comments mentions Y Convenience – big
screen The screen is larger than smart phone. It is really good for watching movies.
2
O N/A N/A D Convenience –
anytime anywhere [2]
So, I can watch movie anytime anywhere. 1
This means that I can watch movies or news later. 1 N N/A N/A C Convenience – big
screen [1] It is easier to watching compared to smart phones. 1

201
• Stage 6 (round 1, the video): Closing the movie
This stage required participants to click on the ‘Close’ icon to close the video titled ‘I
hate Thailand’ on YouTube. All youth, non-cultural tourists, and cultural tourists were
able to do so, while 30 percent of older adults and 50 percent of disabled people
completed the task. For older adults, ‘usage constraint – physical condition’ (‘I need
to use eyeglasses. The icon is very small; I have a problem with my eyesight. I
cannot see details or small things well’) received the highest score. For disabled
people, ‘size of icons’ (‘The icon ‘close’ is very small size; my finger is bigger than
this button’) received the highest score.
Table 6.15 Negative and positive comments during stage 6 from all participants
Negative comments during stage 6
Themes Comments mentions
Y N/A N/A O Usage constraint –
physical condition [4] - I need to use eyeglasses. The icon is very small
3
- I have a problem with my eyesight. I cannot see details or small things well.
1
D Size of icons [4] - The icon ‘close’ is very small Size of icons 3 - My finger is bigger than this button. 1 Interface unfamiliarity [3]
- I do not know where it is. 2
- I never used it. So, I do not know how to close. 1 N Size of icons [2] - I cannot find the icon to close. 1
- My finger is bigger than this icon. 1 C N/A N/A
Positive comments during stage 6 Themes Comments mentions Y Familiarity – similar
to Android [2] (other comments)
- The interface system is the same as Android. It is easy because I am used to it.
2
O N/A N/A D N/A N/A N N/A N/A
1 Unlocking
mobile device
2 Opening
the application
3 Accessing the ‘Search
icon’
4 Typing the movie title
5 Watching the movie
6 Closing
the movie window
7Accessing the ‘Search
icon’
8Typing the animation
title
9Watching
the animation
10Closing
the animation window
11 Closing
the application

202
• Stage 7 (round 2, animation): Accessing the ‘Search’ icon on YouTube
All youths, non-cultural tourists, and cultural tourists were able to complete this task,
but only 50 percent of older adults and 60 percent of disabled people could. For
older adults, ‘poor memory’ (‘I cannot remember how to do this’) is the main reason
they could not complete the task. For disabled people, ‘size of icons – too small’
(‘The icon ‘Search’ is very difficult to find. It should be bigger’) received the highest score.
Table 6.16 Negative and positive comments during stage 7 from all participants
Negative comments during stage 7
Themes Comments mentions Y N/A N/A O Poor memory [3] - I cannot remember how to do. 3
Size of icons [1] - It is too small to see. 1 D Size of icons [3] - Icon ‘search’ is very difficult to find out. It should be
bigger. 1
- Icon is too small. 2 Poor memory [2] - I cannot remember where the search is. 2
N Size of icons [1] - The icon is too small, not clear.
1
No icon hint [1] - There should be explanation how to use about each icon.
1
Positive comments during stage 7
Themes Comments mentions Y Meaningful icon [1] - Magnifying glass is very good icon because it is very
easy to understand its meaning. 1
O Remembered instructions [3]
- Let me try again. Oh, it is over here (the icon).
2
- This time, I can remember it 1 D Remembered
instructions [2] - This time, after I know how to do and where the icon is. It is easier [2]
2
N N/A N/A C N/A N/A
1 Unlocking
mobile device
2 Opening
the application
3 Accessing the ‘Search
icon’
4 Typing the movie title
5 Watching the movie
6 Closing
the movie window
7Accessing the ‘Search
icon’
8Typing the animation
title
9Watching
the animation
10Closing
the animation window
11 Closing
the application

203
• Stage 8 (round 2, animation): Typing the movie title ‘Jinxy Jenkins, Lucky Lou’
All young people, non-cultural tourists, and cultural tourists were able to type on the
keyboard. However, only 10 percent of older adults and 30 percent of disabled people
completed the task. The reason why older adults could not complete is the same factor
as mentioned in round 1 – ‘English language barriers’ (‘I cannot understand the English
language, alphabet, or vocabulary; I have a problem spelling English words’). For
disabled people, ‘English language barriers’ (‘I have a problem spelling English words; I
cannot understand the English alphabet’) also received the highest score.
Table 6.17 Negative and positive comments during stage 8 from all participants
Negative comments during stage 8
Themes Comments mentions Y Complicated title [2] - Could you please pronounce the title again? I never
heard this. 1
- This title is not English. It is very difficult to remember to type.
1
O English language barriers [3]
- I cannot understand English language.
1
- I cannot understand English alphabets and vocabularies.
1
- I have a problem to spell English alphabets. 1 D English language
barriers [2] Moreover, I have a problem to spell English words also.
1
I cannot understand English alphabets. 1 Usage constraint – physical condition [1]
- My fingers are not good in typing something small. I cannot control it well.
1
Complicated title [1] - The title is too complicated and long. 1 Interface unfamiliarity [1]
I am not used to IPad. Usually I use Android
1
N Complicated title [2] This English title is too long and difficult to type. 1 C Complicated title [2] - Personally, if you need to create a clip for Thai, you
should name the title easier. 1
- Is this English or French? I cannot remember, please write down on the paper.
1
1 Unlocking
mobile device
2 Opening
the application
3 Accessing the ‘Search
icon’
4 Typing the movie title
5 Watching the movie
6 Closing
the movie window
7Accessing the ‘Search
icon’
8Typing the animation
title
9Watching
the animation
10Closing
the animation window
11 Closing
the application

204
• Stage 9 (round 2, animation): Using the ‘Play’ icon to watch the animation
All youths, non-cultural tourists, and cultural tourists were able to complete this task,
while only 50 percent of older adults and 60 percent of disabled people could do so.
For older adults, ‘speaker problem’ (‘The speaker is not loud enough’) received the
highest score in terms of negative comments. For disabled people, ‘usability issue –
touchscreen’ (‘I prefer to use a ‘play’ button, rather than a touchscreen’) received the highest score.
Table 6.18 Negative and positive comments during stage 9 from all participants
Negative comments during stage 9
Themes Comments mentions Y Horizontal frame
preference [3] I prefer watching by horizontal frame. So, I need to use two hands to hold it.
3
Screen brightness [2] When watching movie outdoor, the screen is not bright enough.
2
Speaker problem [1] Speaker is not too loud enough for outdoor watching, especially in this animation. There is no sound.
2
No subtitle [1] There should be character’s voice. 1 O Speaker problem [3] Speaker is not loud enough. 3
Usage constrain – physical condition [2]
When I watch something small for a long time, I will have an headache.
2
Usability issue – size [2]
The screen is quite small compared television. 2
D Usability issue – touchscreen [3]
I prefer ‘play’ button rather touchscreen. 3
Usage constrain – physical condition [1]
My fingers cannot touch it properly. 1
N Internet signal problem [2]
Internet signal is not good enough for watching video on Youtube.
2
Usability issue – sound [1]
I need earphone. I cannot listen well outdoor. 1
C Internet signal problem [2]
When watching movie outdoor, it depends on the Internet signal also.
2
Positive comments during stage 9
Themes Comments mentions Y N/A N/A O Remembered
instructions [2] This time I can remember the play button. 2
D Convenience –anytime anywhere [1]
So, I can watch movie anytime anywhere. 1
N N/A N/A C N/A N/A
1 Unlocking
mobile device
2 Opening
the application
3 Accessing the ‘Search
icon’
4 Typing the movie title
5 Watching the movie
6 Closing
the movie window
7Accessing the ‘Search
icon’
8Typing the animation
title
9Watching
the animation
10Closing
the animation window
11 Closing
the application
205
• Stage 10 (round 2, animation): Closing the animation
All youths, non-cultural tourists, and cultural tourists were able to close the video, but
only 50 percent of older adults and 70 percent of disabled people could. The
comment ‘usage constraint – physical condition’ (‘It is too small. I have problems with
my eyesight’) received the highest score for older adults. For disabled people, ‘size
of icons – too small’ (‘It is still difficult for me, the icon is very small’) received the highest score.
Table 6.19 Negative and positive comments during stage 10 from all participants
Negative comments during stage 10
Themes Comments mentions Y N/A N/A O Usage constraint –
physical condition [3] - It is too small. I have a problem with my eyesight 2
Poor memory [2] - I cannot remember again 2 Interface unfamiliarity [1]
- I am not used to it. I would like to use buttons, like TV remote control.
1
D Size of icons – too
small [3] - The icon is too small. 2
- It is still difficult for me, icon is very small. 1
N Size of icons – too small [4]
The icon should be bigger 2
Interface unfamiliarity 1 I need times to find where it is. 1
C N/A N/A Positive comments during stage 10
Themes Comments mentions Y Convenience – size
[2] - Very easy for me. IPad is bigger than smart phones. 1
- Sometimes when I close some features on smart phones, I always did the wrong one. However, icons and texts on IPad are bigger, I really love it.
1
O Remembered instructions [2]
This time, I can remember. 2
D Remembered instruction [3]
- This time, after I know how to do and where the icon is. It is easier.
2
- It is easier, not too difficult like the first time. 1 N N/A N/A C N/A N/A
1 Unlocking
mobile device
2 Opening
the application
3 Accessing the ‘Search
icon’
4 Typing the movie title
5 Watching the movie
6 Closing
the movie window
7Accessing the ‘Search
icon’
8Typing the animation
title
9Watching
the animation
10Closing
the animation window
11 Closing
the application

206
Stage 11: Closing the application
This stage required participants to close the YouTube application. All youths, non-
cultural tourists, and cultural tourists were able to close Youtube, but only 50 percent
of older adults and 70 percent of disabled people completed the task. For older
adults, ‘interface unfamiliarity’ (‘I have never closed any website or video; I do not
know where it is’) received the highest score. For disabled people, ‘interface unfamiliarity’ (‘I cannot find the icon to close it’) was also the main reason.
Table 6.20 Negative and positive comments during stage 11 from all participants
Negative comments during stage 11
Themes Comments mentions Y N/A N/A O Interface unfamiliarity
[5] - I do not know where it is
4
I have never closed any website and video 1 Size of icons [2] - It is too small. 2 Usage constraint – physical condition [2]
- I have a problem with my eyesight
2
D Interface unfamiliarity [2]
- I cannot find the icon to close. 2
N N/A N/A C N/A N/A
Positive comments during stage 11
Themes Comments mentions Y N/A N/A O N/A N/A D Remembered
instructions [2] (other comment)
- After you teach me, it is easier. 2
N N/A N/A C N/A N/A 6.4 Discussion
6.4.1 Reaching (accessibility and understanding)
Table 6.7 shows that only three groups (youths, non-cultural tourists, and cultural
tourists) were able to complete the tasks with an almost 100-percent success rate
1 Unlocking
mobile device
2 Opening
the application
3 Accessing the ‘Search
icon’
4 Typing the movie title
5 Watching the movie
6 Closing
the movie window
7Accessing the ‘Search
icon’
8Typing the animation
title
9Watching
the animation
10Closing
the animation window
11 Closing
the application
207
(99 percent for youths, and 100 percent for non-cultural tourists and cultural tourists)
and with very fast timing (the mean for all 11 stages: youth = 6.1 seconds; non-
cultural tourists = 7.3 seconds; cultural tourists = 4.9; compared to older adults =
22.2 and disabled people = 18.3). This could be because of their lengthy experience
using digital mobile devices (youth = 4.5 years; non-cultural tourists = 4.7 years;
cultural tourists = 5.4 years), compared to older adults (0.1 years) and disabled people (0.7 years).
Relatively few older adults and disabled people were able to do complete the tasks,
and with very slow timing. In Stage 4, in particular, typing the movie title ‘I hate
Thailand’ received the lowest percentages (0 percent for older adults and 20 percent
for disabled people). The low rate of accessibility for older adults and disabled
people when using digital mobile devices in this study is the same finding as that of
many other studies. Most research states that older adults try to avoid using digital
devices, are slower to complete tasking using them, and make more errors than
young people (Rogers et al., 2005; Czaja et al., 2006; Kang & Yoon, 2007; Orso et
al., 2015). The research by Kang and Yoon (2007) tested young (20-29 years) and
older (46-59 years) people attempting to complete a series of tasks on digital
devices. They were asked to perform the same tasks, and were monitored. The
results indicated that older adults were slower at completing all tasks and committed
more errors than young people, which is corroborated by the results of this study.
Table 6.8 reveals that the reason why they were unable to complete the tasks is that
they did not understand how to use the device. For older adults, ‘fear of new
technology’ received the highest score in Stage 1, while ‘interface unfamiliarity’
received the highest score in Stages 3 and 11. For disabled people, ‘knowledge
barrier’ and ‘unfamiliarity’ received the highest score in Stage 1, while ‘interface
unfamiliarity’ was the main reason in Stage 11. The reason why they were unable to
complete most tasks could be because they do not understand mobile digital devices.
Furthermore, Table 6.8 shows that for older adults and disabled people, most
negative comments for each stage concern ‘physical accessibility.’ Only ‘fear of new
technology’ and ‘poor memory,’ as stated by older adults, and the ‘knowledge barrier’
for disabled people are ‘psychosocial issues.’ ‘Physical accessibility,’ related to the

208
issue of interface design, was the main problem found during observations. In
comparison, youths, non-cultural tourists, and cultural tourists were able to complete
almost all tasks, with a big gap between them and the older adults (30 percent) and
disabled people (50 percent). This result can be explained by other research.
Interface design for older adults is very difficult, due to the large cultural and
experience gap between young designers and senior people (Eisma et al., 2003; Orso et al., 2015).
Moreover, Gill and Perera (2003) write that the industry aims to create stylish,
enhanced digital platforms with a high return on investment, and digital platforms
with inclusive designs are still a nascent idea without a firm market position.
Moreover, from the business perspective, different groups of disabled users have
different needs to be met; many ageing people and people with disabilities,
especially visually impaired people, want minimum confusion when using practical
systems or designs. This is the main problem between business and the inclusive
design concept, and leads to conflict between the industry and some users’ desires
(Dong et al., 2006; Fuglerud et al., 2015). By adopting an inclusive design approach
and finding out what people want and their problems, the mission of the industry
could be enhanced. Dong et al. (2006) and Fuglerud et al. (2015) also support the
idea that inclusive design can be applied for commercial use to raise long-term
profits and enhance companies’ competitive edge, and help to produce better
products for all customers.
6.4.2 Engaging (usefulness, usability, preferences)
• Usefulness
Table 6.9 shows participants’ positive comments, indicating that all groups believe the iPad is a very useful product in terms of ‘convenience.’
For youths, it is convenience in terms of ‘format’ (‘I can use it instead of computers
and laptops; it is very lightweight and handy, compared to a laptop. Moreover, it is
bigger than a smartphones, so when I read a lot of text, it is easier. iPads or tablets
are in the middle between computers and smartphones. This is a good point’) and
‘big screen’ (‘The screen is larger than that of a smartphone. It is really good for
watching movies’).

209
Older adults mostly state that it is convenient for ‘watching videos’ (‘It is more
convenient to watch movie or TV series, so I would like to use it’) and ‘anytime,
anywhere’ (‘I can watch news and TV programmes from this device, anytime,
anywhere’).
For disabled people, it is convenient in terms of being ‘similar to a smartphone’ (‘It is
quite easy to use because I have used smartphones’) and ‘anytime, anywhere’ (‘So,
I can watch a movie anytime, anywhere’).
For non-cultural tourists, it is convenient because of the ‘size’ (‘Tablets are
something in between laptops and smartphones. So, they are lightweight and handy.
They are very convenient to use outside and inside; I can search and access
information I need very faster than on a computer’) and ‘anytime, anywhere’ (‘I can
watch any movie anytime, anywhere. This is a good point of the iPad’).
For cultural tourists, it is convenient because of the ‘anytime, anywhere’ factor (‘I
think tablets are very useful. You can use social media or upload files anytime,
anyplace; I can search and access information I need very fast, anytime, anywhere’)
and ‘big screen’ (‘It is easier to watch on, compared to smartphones’).
From this, it could be implied that all groups consider digital mobile devices to be
useful and convenient product in terms of ‘format,’ ‘big screen,’ ‘watching videos,’ ‘anytime, anywhere,’ ‘similar to smartphone,’ and ‘size.’

210
• Usability
Figure 6.4 The number of participants who need help at each stage
During the observation, participants were asked to complete all tasks without
instruction. However, if they could not finish them and needed help, they could ask
staff to teach them. This table illustrates the number of participants who could not
complete the tasks and needed more instruction. From Figure 1, it can be seen that
only two groups (older adults and disabled people) had more usability problems than
all other groups at all stages. Moreover, most older adults and disabled people
stated that their main problems were ‘usability issues – touchscreen’; ‘usage
constraint – physical condition’; ‘typing difficulties’; ‘English language barriers’; ‘poor memory’; and ‘size of icons – too small.’
In Stage 4 in particular, ‘typing the movie title’ (rounds 1 and 2 on video and
animation), three groups (youths, non-cultural tourists, and cultural tourists) had
completion rates of 100 percent. However, no older adults (average time = 63.2
seconds) and two disabled people (31.6 seconds) finished it in the first round, and
one older adult (60.7 seconds) and three disabled people (45.7 seconds) completed
it in the second round. This means that typing is the most difficult task for these two
0 0 0 0 0 0 0 0 0 0 00 0 0 0 0 0 0 0 0 0 0
7
5
7
8
4
5
4
7
4
3
5
8
7
8
10
7 7
5
9
5 5 5
0 0
1
0 0 0 0 0 0 0 00.00.51.01.52.02.53.03.54.04.55.05.56.06.57.07.58.08.59.09.5
10.0
Parti
cipan
ts w
ho n
eed
help
Stage 1 Stage 2 Stage 3 Stage 4 Stage 5 Stage 6 Stage 7 Stage 8 Stage 9 Stage 10 Stage 11All user journey stages
Youth Older adults Disabled people Non-cultural tourists Cultural tourists

211
groups.
In addition, older adults and disabled people had a problem not only with typing,
especially using an English keyboard, but also with the English language. Designers
or directors should be aware of the name of the movie title. If they need to target
older or disabled people, they should try to avoid using the English name. Moreover,
older and disabled people complained that the keyboard was too small. If interface
designers can develop or enlarge the keyboard, this could attract the attention of
these groups.
• Desirability
Desire to learn how to use iPad
However, there is a considerable misconception about older adults’ attitude,
compared to the result of this study. Table 6.8, depicting the negative comments,
reveals that ‘fear of new technology’ (‘I am afraid to use it because I never used such
a device before’) received the highest score, followed by knowledge barriers (‘If
someone teach me, I would try; no one gives me to try’). Older adults commented
that the reason why they are afraid is because no one helps them to try; however, if
someone were to teach them, they would try. This issue is similar to the issues
affecting disabled people, who also commented that no one teaches them, but would
try, if someone were to do so. This indicates that some older adults and disabled
person are willing to learn how to use such devices.
Of the reasons why older adults and disabled people prefer not to use an iPad, the
answer ‘No one teaches me’ ranks highly for both older adults and disabled people.
This is similar to some studies, which state that older adults would like to try digital
devices to remain engaged with modern society (Kurniawan, 2008; Tsai et al., 2015).
Moreover, Goddard and Nicolle (2012) support the idea that older people are interested in modern devices, but they are not designed with their abilities in mind.
Many studies confirm that inappropriate interface designs, both in the past and in the
present, are still the most significant barrier preventing older adults from trying digital
devices without learning. The studies indicate that the standard interface is much
harder to use for older people, which can force them into digital exclusion (Worden et

212
al., 1997; Tsai et al., 2015). Some older people who have no experience with
technology are considered to suffer from “technological alienation” (Morris, 1992; Hill
et al., 2015; Tsai et al., 2015). An absence of experience with digital technology not
only causes digital exclusion, but also increases social exclusion (Valentine et al.,
2002; Hill et al., 2015). It is important to find an effective solution to include this
group in current technological trends.
Negative experiences when using technology are caused by a lack of experience
and support (Todman & Drysdale, 2004). Nevertheless, encouraging older people to
try digital devices can lead them to more positive attitudes (Danowski & Sacks, 1980;
Morris, 1992; Hill et al., 2015; Tsai et al., 2015). Besides, Orso et al., (2015) tested
how older adults were able to successfully use software programme for interactive
television. After training, they presented several positive opinions and are positively
engaged with the interactive system and contents. This could be summarised that
older adults are willing to learn, adapt the technology to their everyday life and are
favourable for the benefit of new technology (Russell et al., 2008; Orso et al., 2015)
Orso et al. (2015) and Roque and Boot (2016) state that there is a big gap between
young and older people in the use of digital devices, especially mobile devices.
Training and teaching them is one way to ensure that this group can receive the
benefits of this technology. For this, Holzinger et al. (2012) suggest that designers
should focus not only on technological and physical aspects, but also psychological
and sociological facets. They also confirm that the aim is to let designers – and
especially young designers – grapple with the problems faced by older people at
every user stage.
The success of digital mobile devices depends on end-user friendly interface design;
this is the most significant factor (Peischl et al., 2012). This study also claims that
useful, usable, and accessible navigation is the key to concern. Hence, designers
should develop a system or platform that can encourage older people and disabled
people to use digital devices, make them understand the devices easily, and help
them to pursue more sophisticated skills. Moreover, beginners’ classes should be
provided for some groups who are unfamiliar with digital mobile devices.

213
6.5 Summary
6.5.1 Research questions
This study integrated the principles of inclusive design and digital storytelling as
inclusive digital storytelling (IDST). The aim of IDST is to understand diverse
audiences in terms of reaching (accessibility and understanding) and engaging with
(usefulness, usability, preferences) digital mobile devices. Furthermore, it focused on
addressing these research questions:
• Research question 1: What are the diverse audiences’ behaviour in
terms of reaching with digital mobile devices In terms of accessibility and understanding, youths, non-cultural tourists, and cultural
tourists completed all tasks at a rate of almost 100 percent (100 percent for cultural
tourists and non-cultural tourists; 99 percent for youth), while few older adults and
disabled people were able to do so (50 percent for disabled people and 30 percent
for older adults). Moreover, in terms of understanding, there are only disabled people
and older adults who spend time slower than average as presented in the Table 6.24 This could be summarised as that only these two groups have problems using digital
mobile devices in terms of accessibility and understanding. Most negative comments
at all stages by these two groups concerned ‘physical accessibility.’ However, in
terms of ‘psychosocial issues,’ these two groups stated that they were willing to
learn, if someone were to teach them. Furthermore, in terms of understanding,
‘interface unfamiliarity,’ ‘knowledge barrier,’ and ‘unfamiliarity’ are the main barriers
for older adults and disabled people.

214
Table 6.21 Percentage and average time of all participants who can complete all
tasks
Percentage of participants who can complete all tasks (accessibility)
Average time of participants to complete all tasks (understanding)
Diversity Percentage Diversity Average time (seconds)
Faster or slower than average
1. Cultural tourists
100% 1. Cultural tourists 4.9 Faster than average 58.4%
2. Non-cultural tourists
100% 2. Youth 6.1 Faster than average 48.2%
3. Youth 99% 3. Non-cultural tourists 7.3 Faster than average 38%
4. Disabled people
50% 4. Disabled people 18.3 Slower than average 55%
5. Older adults 30% 5. Older adults 22.2 Slower than average 55%
• Research question 2 : What are the diverse audiences’ behaviour in terms of engaging with digital mobile devices
Usefulness
As for the usefulness factor, all groups considered digital mobile devices to be useful
and convenient products because of the ‘format,’ the ability to ‘watch videos’, ‘similar
to smartphone,’ ‘bigger size’ and ‘anytime, anywhere’ as shown in the Table 6.25
Table 6.22 Usefulness from all participants
Diversity Themes Comments
1. Youth Convenience – format
I can use it instead of computers and laptops; it is very lightweight and handy, compared to a laptop. Moreover, it is bigger than a smartphones, so when I read a lot of text, it is easier. iPads or tablets are in the middle between computers and smartphones. This is a good point’
2. Older adults Convenience – watching video
It is more convenient to watch movie or TV series, so I would like to use it
3. Disabled Convenience – It is quite easy to use because I have used

215
people similar to smartphone
smartphones
4. Non-cultural tourists
Convenience – bigger size
Tablets are something in between laptops and smartphones. So, they are lightweight and handy. They are very convenient to use outside and inside; I can search and access information I need very faster than on a computer
5. Cultural tourists
Convenience – anytime, anywhere
I think tablets are very useful. You can use social media or upload files anytime, anyplace; I can search and access information I need very fast, anytime, anywhere
Usability
For usability, it could be summarised that only two groups (older adults and disabled
people) have usability problems at all stages. In Stage 4 in particular, for ‘typing the
movie titles,’ no older adults and only two disabled people finished the task in the
first round, and one older adult and three disabled people completed it in the second
round. This means that typing is the most difficult task for these two groups. They
also had problems typing with the English keyboard, in addition to with the English
language. Additionally, most older adults and disabled people stated that their main
problems were ‘usability issue – touchscreen,’ ’usage constraint – physical
condition,’ ‘typing difficulties,’ ‘English language barriers,’ ‘poor memory,’ and ‘size of icons – too small.’
Table 6.23 Usability problems from all participants
Diversity Results
Older adults Problems with all tasks, especially ‘typing’ and ‘English language barriers’
Disabled people
Youth
No problem with any task Non-cultural tourists
Cultural tourists
Desirability
In terms of desirability, older adults and disabled people pointed out that they would
like to learn how to use a digital device because of its usefulness. However, they

216
commented that no one had taught them and that if someone were to teach them,
they would try to use them. This shows that some older adults and disabled people
are willing to learn how to use digital devices. After teaching older adults and
disabled people in the first round, they were more skilled when attempting the task in
the second round. The older adults who completed tasks from round 1 to round 2
increase from eight to 16. The equivalent figure for disabled people rose from 16 to
22. This means that older adults and people with disabilities are able to develop their
digital skills – in this case, using an iPad – if they are taught properly.
Table 6.24 Values and benefits of use from all participants
Diversity Values/ benefits of use
Older adults Prefer to use, if already taught
Disabled people
Youth
Prefer to use Non-cultural tourists
Cultural tourists
Digital storytelling is powerful means of increasing interest in every area, especially
in the field of cultural tourism. However, this media is available on digital platforms
only. This might be a barrier for some groups who are not familiar with the new
technology; hence, an inclusive digital storytelling (IDST) is necessary to cater to
diverse users’ needs. The outcomes of this study are: (1), to provide insights about
diverse audiences in terms of reaching and engaging with digital mobile devices, and
(2), to inform the industry, designers, and researchers who would like to understand diverse users’ preferences and needs and create a system that supports all groups.

217
Table 6.25 Summary of reaching and engaging with digital storytelling from all five groups
Youth Older adults Disabled people
Non cultural tourists
Cultural tourists
1. Accessibility 99% 30% 50% 100% 100%
2. Understanding Faster than average 48.2%
Slower than average 55%
Slower than average 55%
Faster than average 38%
Faster than average 58.4%
3. Usefulness (convenience in terms of…)
Format Watching video
Similar to smartphone
Bigger size Anytime, anywhere
4. Usability No problem with any task
Problems with all tasks, especially ‘typing’ and ‘English language barriers’
Problems with all tasks, especially ‘typing’ and ‘English language barriers’
No problem with any task
No problem with any task
5. Desirability Prefer to use
Prefer to use, if already taught
Prefer to use, if already taught
Prefer to use
Prefer to use
6.5.2 Study Implications
• Digital inclusion
Nowadays, digital mobile devices are very popular throughout society and for a
number of different activities (updating news, online banking, checking weather
forecast, pay online bills, etc.). However, for older adults and those with disabilities,
this technology is a significant barrier, which often prevents them from trying. Without
digital mobile devices, they could be locked out of the advantages of digital
technology. Moreover, inexperience with digital mobile devices not only leads older
adults and disabled people to become digitally excluded, it also decreases social
inclusion. This point is a very serious issue, and a solution to include these groups
into the realm of digital technology is needed. Some studies argue that these groups
would actually like to learn digital devices as a way of remaining involved in the
digital society, but these devices are not designed to support them. Based on the

218
results of this study, it is apparent that these groups would be better equipped to
learn new technology if they had been taught how to do so properly. Therefore, if
digital companies or organisations decided to support some projects to help users
have a positive experience with this technology, such users could become more
confident when using these devices in the future. Furthermore, the evidence
suggests that disadvantaged users are willing to learn and use such technology in
their everyday lives as a way of maintaining digital inclusion.
• Increased usability
From the findings of this study, older adults and disabled people faced usability
problems in every stage of the technological process, in particular: ‘usability issues –
touchscreen’; ‘usage constraint – physical condition’; ‘typing difficulties’; ‘English
language barriers’; ‘poor memory’; and ‘size of icons – too small.’ This is because
the digital mobile device (iPad) was not designed for these groups to watch
storytelling. In fact, many of the users consider the visual decorations, animated
icons and sophisticated interactive systems as useless systems. Ultimately, they
need bigger, less colourful, simpler and easier to understand icons and interface.
This type of decorated high technology causes them a number of difficulties in using
and selecting the icons they need. Therefore, UX designers or interface designers
should use the information from this study to attract disadvantaged users to use and
easily understand digital mobile devices. For example, many participants
commented that the icons were too small. Therefore, designers should revise the
icons, making them bigger and easier to understand with a brief description (simple;
not too complicated or colourful). Moreover, another significant barrier is typing on an
English keyboard. If they wish to target older Thai adults and disabled people,
designers and/or directors should try to avoid using English title when watching the
story. However, it is impossible for the digital industry to produce a digital mobile
device version for these groups only. This study recommends adding more interface
options for older adults or disabled people, so they can choose and customise the
format themselves. In conclusion, designers should apply the findings of this study to
improve and increase usability rate in digital mobile device for these groups; not only for watching videos, but also for everyday life uses.

219
• Teaching older adults and disabled people
The total number of older adults who completed the tasks from round 1 was only 8
(average time: 106.1 seconds). This increase to 16 older adults in the second round,
with the time reduced to 83.3 seconds. Moreover, for disabled people, the total
number of participants completing all tasks was 16 (151.2 seconds) in the first round.
This increased to 22 people (72 seconds) in the second round. However, the task
that gave them problems, even in the second round, remained typing the movie title.
In round 2 in particular, the title was too long and complicated.
This relates to the results of Micaela et al. (2014), who conducted the research to
train 54 older adults who were computer novices to use a tablet (iPad) for 15 hours
per week for three months. The study found that training can improve cognitive skills
and help adults engage in social and everyday activities, such as banking. Moreover,
after training, older people can complete many tasks necessary for their daily living.
This is very significant point because nowadays, people live in a digital society. We
complete everyday life activities through the Internet and mobile devices, so
connectivity could help older adults improve their quality of life.
Dickinson, et al. (2005) set up the study to teach 15 older adults to use email for two
weeks. They found that after learning, the amount of problems that participant faced
and needed help with decreased significantly.
From this data, it can be summarised that older adults and people with disabilities
are able to develop their digital skills – in this case, using an iPad to watch videos– if
we teach them properly. Moreover, the positive experience from being taught
properly how to use digital devices can make participants more confident in using
computers and the Internet. In addition, they can become capable of further digital
exploration; meaning that the industry can develop appropriate systems for inexperienced users who are unlikely to use digital devices.

220
6.5.3 Study Limitations
1. Internet connection
Based on time spent observing participants watching videos on Youtube in five
locations, the researcher and staff had to use an iPad mini with an internet SIM card.
However, some older adults (The Ban Bang Khae Social Welfare Development
Centre) and disabled people (The Baanphrapradaeng Disabled Foundation) lived in
the suburbs of Bangkok; an area with an unstable internet connection when
compared to the city centre. Consequently, the iPad screen was generally choppy and occasionally froze for a while when the participants were watching the video.
Suggestion: For this issue, the researcher recommends that all participants be
observed in controlled areas that have Wi-Fi (i.e. in a university, office or department
store with high-speed internet), as this would result in the factor of high or low signal of internet becoming less of an issue.
2. Low educational levels for some groups
This study recruited disabled people from The Baanphrapradaeng Disabled
Foundation, and older adults from The Ban Bang Khae Social Welfare Development
Centre. Both are foundations established by the government to help poor people.
The demographic profiles reveal that five of the disabled people and one of the older
adults had received no education. Moreover, there were five older adults who had
only reached primary or secondary school. This factor may lower the overall
observation scores for these two groups. This also highlights an interesting issue in
Thailand, where disabled people generally have a lower chance of reaching higher
education. This is in part due to the lack of facilities (i.e. a ramp, disabled toilet, automatic door), especially in the schools or universities.
Suggestion: The researcher recommends contacting schools or part-time courses for disabled people and older adults rather than the government foundation.

221
3. The length of video and animation was too long
This study used a video that was 5.21 minutes in length and an animation that lasted
3.51minutes to test how users reacted to watching videos on an iPad. However,
some participants, especially older adults and disabled people, suggested that the
videos were too long. This was particularly the case for the animation, which was
considered somewhat boring by the majority of those asked. Moreover, some
participants (cultural tourists, the youth, non-cultural tourists) refused to join the observation on the basis that the length of the whole process was too long.
Suggestion: The researcher recommends choosing videos and/or animations that
are as short as possible when observing older adults and disabled groups. Moreover, older adults prefer to watch videos with real actors rather than animations.
4. Low acceptance rate for the observation
Before the observation, the researchers and staff asked participants to sign up for
the £10 gift voucher of a Thai department store. However, when they knew that the
whole process would take around 30 to 60 minutes, and that they would be recorded
by two video cameras, the majority refused. Therefore, the acceptance rate of joining
the observation was too low (around 10%), especially for the youth, as well as
cultural and non-cultural tourists.
Suggestion: The researchers should set up the whole process so that it takes as
little time as possible in order to attract as many participants to join in. Another option is to increase the amount of vouchers offered.
5. Access
This study set up the observation in a number of official government locations: 1.)
The Ban Bang Khae Social Welfare Development Centre for older adults; 2.) The
Baanphrapradaeng Disabled Foundation for disabled people and 3.) The Museum
Siam, which is frequented by cultural tourists. The researcher contacted these

222
offices and sent the observation plan and questions to be approved. However, the process was too long, and took around two months to be approved.
Suggestion: If the research has to contact official offices (i.e. government offices,
public organisations, foundations) rather than private companies in Thailand when
dealing with vulnerable groups, disabled people and older adults, they should be prepared to wait at least one to two months for the process to be approved.
6.5.4 Detailing the framework
From the results of this study, the IDST framework was detailed on the link between
inclusive design and digital storytelling to understand diverse audiences’ behaviour in
terms of reaching and engaging with digital mobile devices. The detailed data
presented with the five factors for all groups is illustrated on the Figure 6.4.

223
Figure 6.5 The results of the study presenting with diverse audiences’ behaviour in term
s of reaching and engaging with digital m
obile devices

224
Chapter 7: Evaluation of the Inclusive Digital Storytelling for Cultural Tourism (IDST for CT) Framework 7.1 Introduction
7.1.1 Presenting the framework for inclusive digital storytelling for cultural tourism (IDST for CT) in Thailand
7.1.2 Creating an interactive framework
7.2 Research method
7.2.1 Identifying participants in the study
7.2.2 Questionnaire development 7.2.3 Pilot test
7.3 Results
7.3.1 Demographic results 7.3.2 Evaluation of the framework 7.3.3 Open-ended responses
7.4 Discussion
7.4.1 RQ1: How usable is the IDST for CT framework? 7.4.2 RQ2: How desirable is the IDST for CT framework? 7.4.3 RQ3: Are there statistically significant differences in answers between the four expert groups? 7.4.4 RQ4: What changes or additions should be made to improve IDST for CT framework? 7.4.5 RQ5: What do participants like and dislike in the IDST for CT framework?
7.5 Summary
7.5.1 Research question 7.5.2 Study limitations

225
7.1 Introduction In the Descriptive Study 1 (DS1) stage, the initial framework was constructed from a literature review, analysis and synthesis. Next, in the Prescriptive Study (PS) stage,
three studies were carried out to detail the framework by three research methods
(500 questionnaires, 17 interviews and 50 observations). Regarding Descriptive
Study 2 (DS2) as evaluation stage, the fourth study was set up by using an online
questionnaire as the research method to collect quantitative data from the end-users
of this framework. This study targets four groups of experts (academia, industry) and
students: 1.) Thai cultural tourism; 2.) Thai inclusive design; 3.) Thai digital
storytelling, and 4.) International inclusive design, digital storytelling and cultural
tourism. Total expected respondents from all four groups are 120 samples (30 for
each group). The aim and objectives of this chapter are in Table 7.1. Moreover, this
chapter aims to answer five research questions presented in Table 7.2:
Table 7.1 Aim and objectives of the study Aim Objectives 1. To evaluate the usability and desirability within the framework for inclusive digital storytelling for cultural tourism
1. To evaluate the framework in terms of reaction, learning, behaviour, results and desirability
2. To identify statistically significant differences in answers between four groups for the framework
3. To identify opinions (open-ended answers) of
four groups regarding the framework?
Table 7.2 Research questions of this study related to objectives
Research questions Objectives 1. How usable is the IDST for CT framework? 1.1 2. How desirable is the IDST for CT framework? 1.1 3. Are there statistically significant differences in answers between the four groups of participants?
1.2
4. What changes or additions should be made to improve IDST for CT framework?
1.3
5. What do participants like and dislike in the IDST for CT framework? 1.3

226
7.1.1 Presenting a framework for inclusive digital storytelling for cultural tourism (IDST for CT) in Thailand
Previous chapters have reported and detailed results of the framework from three
empirical studies through Chapters 4, 5 and 6. They were based on the prescriptive
stage from Design Research Methodology (DRM) to develop and strengthen the
initial framework. The details and results of this framework were composed of three
studies below:
Table 7.3 Three empirical studies in this framework
Study Topics Studies and methods Results Chapters 1. Barriers and Drivers in
Cultural Tourism for Five Groups in Thailand
Inclusive design and cultural tourism (500 Questionnaires)
Results about barriers and drivers for five groups
4
2. Constructing the Digital Storytelling: Guideline to Increase Motivation in Cultural Tourism for Five Groups in Thailand
Digital storytelling and cultural tourism (17 experts’ interviews)
The digital storytelling guideline for five groups
5
3. Inclusive digital storytelling to understand audiences’ behaviour
Inclusive design and digital storytelling (50 observations)
Data for five groups in terms of reaching for and engaging with digital storytelling
6
Both IDST for CT frameworks in English and Thai versions have been constructed
and presented in Figure 7.1 and 7.2.

227
Figure 7.1 A framew
ork for inclusive digital storytelling for cultural tourism (ID
ST for CT) in English

228
Figure 7.2 A framew
ork for inclusive digital storytelling for cultural tourism (ID
ST for CT) in Thai

229
7.1.2 Creating an interactive framework
Regarding the research method adopted in this study, namely online questionnaires,
this thesis creates the interactive framework in English and Thai versions to allow users to click on ‘elements’, ‘results’ and ‘view large’, presented on the left of the monitor screen. When users click on ‘elements’, they can view factors from every
study (i.e. five potential groups of tourists, 11 elements of digital story guideline, and
five factors to understand user behaviours). While clicking on ‘results’, users can
read details of the findings from three studies. However, there are a lot of details and
small texts. Thus, the ‘view large’ button can allow users to read the graphic clearly.
The English and Thai interactive framework can be accessed at the following link:
English version: http://joekasemsarn.comeze.com/
Thai version: http://thaiframework.comeze.com/
Figure 7.3 An interactive framework — basic version

230
Figure 7.4 An interactive framework when users click on the ‘elements’ button
Figure 7.5 An interactive framework when users click on the ‘results’ button

231
7.2 Research method 7.2.1 Identifying participants in this study The total expected number of respondents from all four groups are 120 samples (30
for each group), presented in Table 7.5. The aim of this survey is to evaluate the
usability and desirability within the framework. This study uses an online
questionnaire from Google documents dated from 15 April to 15 May 2017, which
was distributed across the four groups as follows:
Table 7.5 Four groups of participants in this study
Target groups Number 1. Thai cultural tourism experts (academia, industry) and students 30 2. Thai inclusive design experts (academia, industry) and students 30 3. Thai digital storytelling experts (academia, industry) and students 30 4. International inclusive design, digital storytelling and cultural
tourism experts (academia, industry, and students) 30
This survey is a web-based survey that everyone can visit. An online survey has
many advantages over conventional surveys such as: cheaper than other types,
easily analyses data, reducing time and resources, and reducing human errors
leading to increasing reliability (Robson, 2012). However, the reason this study
adopted an online survey is to contact international inclusive design, digital
storytelling and cultural tourism experts (academia, industry) and students from
many countries, especially for experts interviewed in the second study (i.e. experts
from University of Sarajevo, University of Surrey, University Utara Malaysia,
Malaysia, and many experts from the USA). To gather data, online questionnaires
were sent via email to these four groups.
1.) Thai cultural tourism users (academia, industry, students).
The criteria for both academic and industrial experts require that they have more
than 5 years’ experience working in tourism or cultural tourism. Students were
required to be studying cultures, tourism or tourism management as their major. To
gather information, online questionnaires were distributed by email to staff and
students at the Museum Siam (https://www.museumsiam.org/), Rattanakosin
Exhibition Hall Museum (nitasratthanakosin.com).

232
2.) Thai inclusive design users (academia, industry, students).
The criteria for both academic and industrial users were to have more than 5 years’
experience working in graphic, product or inclusive design. Students must be
majoring in design. Online questionnaires were distributed by email to staff and
students at the Graphic design, Communication Art and Design Department, KMITL
(www.arch.kmitl.ac.th).
3.) Thai digital storytelling users (academia, industry, students).
The criteria for both academic and industrial users were to have more than 5 years’
experience working in film, animation or advertising. Students must be majoring in
film, communication design or photography. Online questionnaires were distributed
by email to staff and students at the Photography, Film and Digital Media
Department, KMITL (www.arch.kmitl.ac.th), Anya Animation (www.anya.co.th/), and
The Monk studio (www.themonkstudio.com).
4.) International inclusive design, digital storytelling and cultural tourism users
(academia, industry, students).
The criteria for both international academic and industrial experts were to have more
than 5 years’ experience working abroad in inclusive design, digital storytelling and
cultural tourism. Students must be studying these three majors. Online
questionnaires were distributed by email to staff and students at the Broadcast
Design Department, the University of Sarajevo (Bosnia and Herzegovina)
(www.etf.unsa.ba), the Digital World Research Centre, the University of Surrey (UK)
(www.surrey.ac.uk/dwrc/), the University Utara Malaysia, Malaysia (www.umk.edu),
Matthew Luhn Studio (matthewluhnstory.com), the Cartoon Saloon (Republic of
Ireland) (www.cartoonsaloon.ie/contact/), and the Department of Design, Brunel
University London (https://www.brunel.ac.uk/design).
7.2.2 Questionnaire development 1. Kirkpatrick evaluation model (1975) (citation 7135) This is a well-established model for evaluating new processes or tools in both
academia and industry (Phillips, 1990; Ahmed, 2000; McGinley, 2012; Lockton,
2013), providing a conceptual framework for evaluation criteria and data collection.
This model has been used originally for evaluating training programmes. However, it

233
has been adopted for design research. For example, Dong and Clarkson (2005)
used this model to evaluate the impact of i-design inclusive design toolkits.
Moreover, McGinley (2012) and Lockton (2013) used this model to evaluate their
design toolkits in their PhD dissertations.
This thesis adds one more design factor into the evaluation stage — ‘desirability’.
The logic for using this design factor is that the Kirkpatrick evaluation model is a
general evaluation model, not a design purposed model. In many cases, usability,
usefulness and accessibility are tested systematically and theoretically with good
results, but the users do not want to use it in reality. Hence, desirability is added to
indicate this framework is perceived as effective in practical works.
Table 7.6 Definition of Kirkpatrick evaluation model Evaluation mode
Definition (Kirkpatrick, 1975, pp. 19-24) Definition (McGinley, 2012, pp. 244)
1. Reaction
“[H]ow those who participate in the program react to it. . . a measure of customer satisfaction”
What participants think of the proposition
2. Learning
“[T]he extent to which participants change attitudes, improve knowledge, and/or increase skill as a result of attending the program.”
What participants learn from the proposition
3. Behaviour “[T]he extent to which change in behaviour has occurred because the participant attended the training program.”
The impact of the proposition
4. Results
“[T]he results that occurred because the participants attended the program.”
Fitness for purpose of the proposition
5. Desirability (McGinley, 2012)
N/A Was the proposition perceived as appropriate
7.2.3 Pilot test
Table 7.7 Time to read and complete the survey from participants in the pilot test stage (minutes) Inclusive designer Cultural tourism users Digital storytelling
users Average
time 1. 2. 3. 4. 5. 6. 7. 8. 9. Female
(23-25) Female (26-34)
Female (26-34)
Female (26-34)
Male (35-45)
Male (35-45)
Male (35-45)
Male (35-45)
Female (36-34)
Time to ‘read’ Framework
2.2 6.4 5.5 4.2 6.5 5.5 5.7 3.2 4.5 4.85
Time to ‘fill out’ survey
18.37 10.3 10.1 13.1 14.2 13.8 12.3 14.3 15.2 13.51
Total time (minutes)
20.57 16.7 15.6 17.3 20.7 19.3 18 17.5 19.7 18.36
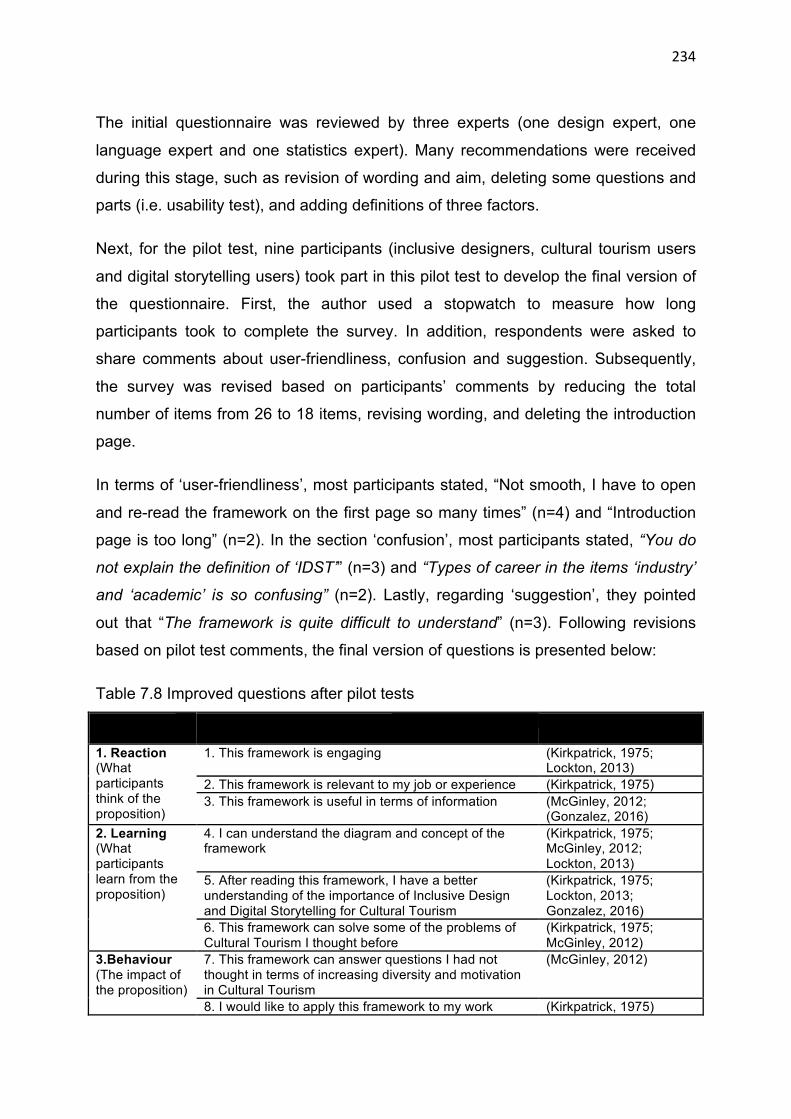
234
The initial questionnaire was reviewed by three experts (one design expert, one
language expert and one statistics expert). Many recommendations were received
during this stage, such as revision of wording and aim, deleting some questions and
parts (i.e. usability test), and adding definitions of three factors.
Next, for the pilot test, nine participants (inclusive designers, cultural tourism users
and digital storytelling users) took part in this pilot test to develop the final version of
the questionnaire. First, the author used a stopwatch to measure how long
participants took to complete the survey. In addition, respondents were asked to
share comments about user-friendliness, confusion and suggestion. Subsequently,
the survey was revised based on participants’ comments by reducing the total
number of items from 26 to 18 items, revising wording, and deleting the introduction
page.
In terms of ‘user-friendliness’, most participants stated, “Not smooth, I have to open
and re-read the framework on the first page so many times” (n=4) and “Introduction
page is too long” (n=2). In the section ‘confusion’, most participants stated, “You do
not explain the definition of ‘IDST’” (n=3) and “Types of career in the items ‘industry’
and ‘academic’ is so confusing” (n=2). Lastly, regarding ‘suggestion’, they pointed
out that “The framework is quite difficult to understand” (n=3). Following revisions
based on pilot test comments, the final version of questions is presented below:
Table 7.8 Improved questions after pilot tests Evaluation mode
Questions Reference
1. Reaction (What participants think of the proposition)
1. This framework is engaging (Kirkpatrick, 1975; Lockton, 2013)
2. This framework is relevant to my job or experience (Kirkpatrick, 1975) 3. This framework is useful in terms of information (McGinley, 2012;
(Gonzalez, 2016) 2. Learning (What participants learn from the proposition)
4. I can understand the diagram and concept of the framework
(Kirkpatrick, 1975; McGinley, 2012; Lockton, 2013)
5. After reading this framework, I have a better understanding of the importance of Inclusive Design and Digital Storytelling for Cultural Tourism
(Kirkpatrick, 1975; Lockton, 2013; Gonzalez, 2016)
6. This framework can solve some of the problems of Cultural Tourism I thought before
(Kirkpatrick, 1975; McGinley, 2012)
3.Behaviour (The impact of the proposition)
7. This framework can answer questions I had not thought in terms of increasing diversity and motivation in Cultural Tourism
(McGinley, 2012)
8. I would like to apply this framework to my work (Kirkpatrick, 1975)

235
9. I would like to introduce the concept of this framework to others
(Kirkpatrick, 1975; Lockton, 2013)
10. I can use this framework in my work (Kirkpatrick, 1975) 4. Results (Fitness for purpose of the proposition)
11. I think Inclusive Design could be used to increase diversity in Cultural Tourism
12. I think this framework could be used to increase motivation in Cultural Tourism
13. This framework can help increase diversity and motivation in Cultural Tourism
5. Desirability (McGinley, 2012) Was the proposition perceived as appropriate
14. I would like to use this framework to increase diversity and motivation for Cultural Tourism
(McGinley, 2012)
6. Open-end questions
15. What changes or improvements would you suggest in order to make this framework more useful?
(McGinley, 2012)
16. What pieces of knowledge or factors would you suggest being included in this framework to increase diversity and motivation to Cultural Tourism?
(McGinley, 2012)
17. Please mention top three things you dislike about this framework?
(Lund, 2001)
18. Please mention top three things you like about this framework?
(Lund, 2001)
The final questionnaire was separated into three sections. The first section included
the study’s aim which is “to evaluate the usability and desirability of a framework for
increasing diversity and motivation in cultural tourism”, target groups of the survey
(cultural tourism experts and students, inclusive design expert and students and
digital storytelling experts and students), and definitions of three factors. Section two
included 14 Likert’s scaling items from the Kirkpatrick evaluation model (reaction,
learning, behaviour, results) (Kirkpatrick, 1975), desirability (McGinley, 2012), and
four open-ended questions. The final section included eight items about
demographic information.
Next, online questionnaires in both English and Thai languages were uploaded
online via Google forms, available at:
English version: https://goo.gl/forms/v2qKISn853VvRI033
Thai version: https://goo.gl/forms/oUfLeCcnxRqDg5aJ2
Table 7.9 Questionnaire structure Sections Details of the survey Section 1 Introduction, the target audience of this survey, the aim and definitions of three factors Section 2 14 Likert’s scaling questions from the Kirkpatrick evaluation model
• Reaction • Learning • Behaviour

236
• Results • Desirability
4 open-ended questions Section 3 Nominal scale: demographic information (i.e. education, type of career, year of
experience, the country they currently live in – for international users) 7.3 Results 7.3.1 Demographic results
Table 7.10 demographic results from four groups (123 respondents) Factor Thai cultural
tourism experts and students
Thai inclusive design experts and students
Thai digital storytelling experts and students
International experts and students
Total participants 37 22 38 27 1. Gender
Male 6 5 18 14 Female 31 17 20 13
2. Age 18-22 6 3 6 - 23-25 13 3 7 - 26-34 12 12 5 6 35-45 4 2 13 18 46-59 2 2 7 3 60-65 - - - - 66-75 - - - - 76-85 - - - - 85+ - - - -
3. Education Primary/Secondary - - - 1 High school - - - - Diploma/Certificate 10 6 18 3 Undergraduate 26 14 18 7 Post-graduate 1 2 2 13 PhD degree - - - 3
4. Type of career Experts (academic & industry)
24 19 29 18
Students 13 3 9 9 5. Experience
1-5 years 33 8 16 10 6-10 years - 7 4 6 11-15 years 2 5 12 8 16-20 years 2 - 2 - Above 20 years - 2 4 3
6. Monthly income for a month (Thai baht) (1 USD = 35 baht)
Below 5,000 baht - 3 3 5,000 – 10,000 baht
6 - 3
10,001 – 25,000 bath
22 3 9
25,001 – 50,000 baht
7 7 12
50,001 – 100,000 - 7 9

237
baht Above 10000 baht 2 2 7. Monthly income for a month (USD) (for international participants only)
Below 500 USD 6 500-1150 USD 8 1151 – 3000 USD 6 3001-5000 USD 1 5001 -10000 USD 5 Above 10000 USD
8. What is the country you currently live in? (for international participants only) Thailand 4 UK 10 European countries - USA 4 Asian countries 7 Others 2
Table 7.10 illustrates the demographic information for the four groups. This data
indicates that most Thai cultural tourism experts and students (83.8% - 31
respondents); 77.3% of Thai inclusive design experts and students (17 respondents);
and 52.6% of Thai digital storytelling experts and students (20 respondents) were
female while 51.9% of the International experts and students (14 respondents) were
male.
Moreover, most Thai cultural tourism experts and students (35.1% - 13 respondents)
were aged twenty-three to twenty-five years; 54.5% of Thai inclusive design experts
and students (12 respondents) were aged twenty-six to thirty-four years; 34.2% of
Thai digital storytelling experts and students (13 respondents) and 66.7% of
International experts and students (18 respondents) were aged thirty-five to forty-five
years. The largest group of Thai cultural tourism (64.9% - 24 respondents); Thai
inclusive design (86.4% - 19 respondents); Thai digital storytelling (76.3% - 29
respondents); and International participants (66.7% -18 respondents) were experts
(academic & industry).
7.3.2 Evaluation of the framework The data obtained from the respondents regarding five evaluation factors was
presented below. The scale ranges from “strongly disagree” (1) to “strongly agree”
(7), with mean scores indicated below:

238
• 1.00-1.49 = Strongly disagree • 1.50-2.49 = Disagree • 2.50-3.49 Somewhat disagree • 3.50-4.49 = Neutral • 4.50-5.49 = Somewhat agree • 5.50-6.49 = Agree • 6.50-7.00 = Strongly agree
Reaction
Reaction means “what participants think of the proposition” (McGinley, 2012, pp.
244). In terms of ‘reaction’, the mean of all four groups is 5.33 (somewhat agree) and
SD. = 1.08. This section explored the participant’s opinions to the IDST for CT
framework through three questions (Q1-3): 1). this framework is engaging; 2). this
framework is relevant to my job or experience; and 3). this framework is useful in
terms of information. Participants were asked to rate the scaling answers from 1
(strongly disagree) to 7 (strongly agree). The mean score for each group was ranked
in the following table:
Table 7.11 Results in ‘reaction’ from four groups Rank Groups Mean SD. 1. Thai digital storytelling group 5.95 0.84 2. Thai inclusive design group 5.31 0.86 3. International group 5.37 1.19 4. Thai cultural tourism group 4.68 0.98 Total 5.33 (somewhat agree) 1.08
Figure 7.6 One-way ANOVA of ‘reaction’ for the four groups
A one-way between subjects ANOVA was conducted to compare a significant
difference between the mean of ‘reaction’ for the four groups. From Figure 7.6, there
was a statistically significant effect of ‘reaction’ at the p<.05 level for the four groups
[F(3,120) = 10.63, p =.000]

239
Since Figure 7.6 illustrated a statistically significant result, this study needed to
compute a Scheffe post hoc test. The post hoc test was compared each group to
every other group of participants. The results of the Scheffe post hoc test were
reported in Figure 7.7
Figure 7.7 Scheffe post hoc analysis of ‘reaction’ for the four groups
Post hoc analyses using the Scheffe post hoc criterion for significance indicated that
the Thai digital storytelling group was significantly higher (M=5.95, SD.=0.84) than in
Thai cultural tourism group (M=4.68, SD. =0.98).
This data suggests that in ‘reaction’, there was no statistically significant difference
between the three groups (Thai digital storytelling, Thai inclusive design, and
international group). However, the Thai digital storytelling group (m=5.95) ranked this
factor significantly higher than the Thai cultural tourism group (m=4.68).

240
Learning McGinley (2012) explains the terms ‘learning’ in design research as “what
participants learn from the proposition” (McGinley, 2012, pp. 244). The mean of
learning from all four groups is 5.20 (somewhat agree) and SD. = 1.06. This section
explored the participant's opinions to the IDST for CT framework through three
questions (Q4-6) which are: 1). I can understand the diagram and concept of the
framework; 2). after reading this framework, I have a better understanding of the
importance of inclusive design and digital storytelling for cultural tourism; and 3). this
framework can solve some of the problems of Cultural Tourism I thought before. The
mean score for each group was ranked in the following table:
Table 7.12 Results in ‘learning’ from the four groups Rank Groups Mean SD. 1. Thai digital storytelling group 5.50 1.31 2. Thai inclusive design group 5.24 1.00 3. International group 5.08 0.90 4. Thai cultural tourism group 4.96 0.85 Total 5.20 (somewhat agree) 1.06
Figure 7.8 One-way ANOVA of ‘learning’ for the four groups A one-way between subjects ANOVA was conducted to compare a significant
difference between the mean of ‘learning’ for the four groups.
From Figure 7.8, there was no statistically significant effect of ‘learning’ at the p>.05
level for the four groups [F (3,120) = 1.82, p =.147]. This data suggests that in
‘learning’, there was no statistically significant difference between the four groups.

241
Behaviour ‘Behaviour’ in case of design research is “The impact of the proposition” (McGinley,
2012, pp. 244). The mean of behaviour from all four groups is 4.85 (somewhat
agree) and SD. = 1.17. This section explored the participant’s opinions to the IDST
for CT framework through four questions (Q7-10) which are: 1). this framework can
answer questions I had not thought in terms of increasing diversity and motivation in
Cultural Tourism; 2). I would like to apply this framework to my work; 3). I would like
to introduce the concept of this framework to others; and 4). I can use this framework
in my work. The mean score for each group was ranked in the following table:
Table 7.13 Results in ‘behaviour’ for the four groups Rank Groups Mean SD. 1. Thai digital storytelling group 5.55 1.08 2. Thai inclusive design group 4.86 1.20 3. International group 4.78 0.911 4. Thai cultural tourism group 4.18 1.04 Total 4.85 (somewhat agree) 1.17
Figure 7.9 One-way ANOVA of ‘behaviour’ for four groups A one-way between subjects ANOVA was conducted to find if there was a significant
difference between the mean of ‘behaviour’ for the four groups. From Figure 7.9,
there was a statistically significant effect of ‘behaviour’ at the p<.05 level for the four
groups [F(3,120) = 10.51, p =.000].
Since Figure 7.9 illustrated a statistically significant result, this study needed to
compute a Scheffe post hoc test. The post hoc test was compared each group to
every other group of participants. The results of the Scheffe post hoc test were
reported in Figure 7.10

242
Figure 7.10 Scheffe post hoc analysis of ‘behaviour’ for the four groups
Post hoc analyses using the Scheffe post hoc criterion for significance indicated that
the Thai digital storytelling group was significantly higher (M=5.55, SD.=1.08) than in
Thai cultural tourism group (M=4.18, SD. =1.04) and international group (M=4.78,
SD.=0.911).
This data suggests that for ‘behaviour’, there was no statistically significant
difference between the two groups (Thai digital storytelling and Thai inclusive
design). However, the Thai digital storytelling group (M=5.55) ranked this factor
significantly higher than Thai cultural tourism group (M=4.18) and international group
(M=4.78).
Results Results are defined as “fitness for purpose of the proposition” (McGinley, 2012, pp.
244). The mean of results from all four groups is 5.67 (agree) and SD. = 1.01. This
section explored the participant’s opinions to the IDST for CT framework through
three questions (Q11-13) which are: 1). I think inclusive design could be used to

243
increase diversity in cultural tourism; 2). I think this framework could be used to
increase motivation in cultural tourism; and 3). this framework can help increase
diversity and motivation in cultural tourism. The mean score for each group was
ranked in the following table:
Table 7.14 Results in ‘results’ for the four groups Rank Groups Mean SD. 1. Thai digital storytelling group 6.19 0.65 2. Thai inclusive design group 5.39 1.04 3. Thai cultural tourism group 5.61 0.89 4. International group 5.25 1.26 Total 5.67 (agree) 1.01
Figure 7.11 One-way ANOVA of ‘results’ for the four groups A one-way between subjects ANOVA was conducted to compare a significant
difference between the mean of ‘results’ for the four groups. From Figure 7.11, there
was a statistically significant effect of ‘results’ at the p<.05 level for the four groups
[F(3,119) = 6.05, p =.001].
Since Figure 7.11 illustrated a statistically significant result, this study needed to
compute a Scheffe post hoc test. The post hoc test was compared each group to
every other group of participants. The results of the Scheffe post hoc test were
reported in Figure 7.12

244
Figure 7.12 Scheffe post hoc analysis of ‘results’ for the four groups
Post hoc analyses using the Scheffe post hoc criterion for significance indicated that
Thai digital storytelling group was significantly higher (M=6.19, SD.=0.65) than in
Thai inclusive design group (M=5.39, SD. =1.04) and international group (M=5.25,
SD.=1.26).
This data suggests that in ‘results’, there was no statistically significant difference
between the two groups (Thai digital storytelling and Thai cultural tourism group).
However, the Thai digital storytelling group (M=6.19) ranked this factor significantly
higher than the Thai inclusive design group (M=5.39) and international group
(M=5.25).
Desirability
Desirability means “was the proposition perceived as appropriate?” (McGinley, 2012,
pp. 244). The mean of results from all four groups is 5.11 (somewhat agree) and SD.
= 1.38. This section explored the participant’s opinions to the IDST for CT framework
through one questions (Q14) which is: I would like to use this framework to increase

245
diversity and motivation for cultural tourism. The mean score for each group was
ranked in the following table:
Table 7.15 Results in ‘desirability’ for the four groups Rank Groups Mean SD. 1. Thai digital storytelling group 6.00 0.92 2. Thai inclusive design group 4.86 1.39 3. Thai cultural tourism group 4.72 1.40 4. International group 4.59 1.33 Total 5.11 (somewhat agree) 1.38
Figure 7.13 One-way ANOVA of ‘desirability’ for the four groups A one-way between subjects ANOVA was conducted to compare a significant
difference between the mean of ‘results’ for the four groups. Figure 7.13 illustrates
there was a statistically significant effect of ‘results’ at the p<.05 level for the four
groups [F(3,120) = 9.246, p =.000].
Since Figure 7.13 illustrates a statistically significant result, this study needed to
compute a Scheffe post hoc test. The post hoc test was compared each group to
every other group of participants. The results of the Scheffe post hoc test were
reported in Figure 7.14.

246
Figure 7.14 Scheffe post hoc analysis of ‘desirability’ for the four groups
Post hoc analyses using the Scheffe post hoc criterion for significance indicated that
the Thai digital storytelling group was significantly higher (M=6.00, SD.=0.92) than in
the Thai cultural tourism group (M=4.72, SD. =1.40), Thai inclusive design group,
(M=4.86, SD. =1.39) and international group (M=4.59, SD.=1.33).
This data suggests that in ‘desirability’, there was a statistically significant difference
between all four groups. However, the Thai digital storytelling group (M=6.00) ranked
this factor significantly higher than the Thai cultural tourism group (M=4.72), Thai
inclusive design group (M=4.86), and international group (M=4.59).

247
7.3.3 Open-ended answers
• What changes or improvements would you suggest in order to make this framework more useful?
Table 7.16 Open-ended answers from the four groups Theme Subtheme Value
(number of mentions)
1. Presenting more details [20]
Providing more details 8 Providing additional information through relevant links, references, etc.
5
Each group’s details 3 Presenting research methods and sampling 2 More groups of people 2
2. Improving graphics and style [13]
Providing a more stylish layout 7 Providing a better interactive system 6
3. Simplifying the framework [12]
Reducing texts in the framework 9 Clarifying diversity 3
4. Linking with mixed media [10]
Using offline and online media 7 Media link 3
5. Testing the framework [9]
Setting up the workshop 5 Setting a prototype digital storytelling 4
Table 7.16 illustrates the participants’ comments to the open-ended question in part
1. These comments were in response to the question “What changes or
improvements would you suggest in order to make this framework more useful?”
Open-ended answers were analysed using thematic coding analysis (Saldaña, 2015)
by three coders (one senior and two junior researchers) in order to increase the
reliability of data analysis.
First, most participants need to improve this framework by ‘presenting more details’
(n=20) (providing more details, providing additional information through relevant
links, references, etc., each group’s details, presenting research methods and
sampling, more groups of people). Some comments on this theme state that “There
should be conclusion, recommendation parts”, “This is too general presentation. You
should present more details of each group”. Moreover, some interesting comments
point out that “I need to know in-depth information and conclusion just one group of
people. I do not need to know general results for all groups”.

248
Next, most participants need ‘improving graphics and style’ (n=13) (providing more
stylish layout, providing a better interactive system). Some interesting comments
state that “Graphics should be animated or moved or change artwork to be more
stylish”. The following ranks are ‘simplifying the framework’ (n=12), ‘linking with
mixed media’ (n=10) and ‘testing the framework’ (n=9).
From these comments, it could be summarised that participants want to change this
framework by adding more details, improving graphics to be more stylish, simplifying
the framework, linking with both online and offline media, and testing this framework.
• What pieces of knowledge or factors would you suggest being included in this framework to increase diversity and motivation to Cultural Tourism?
Table 7.17 Open-ended answers from four groups Theme Subtheme Value
(number of mentions)
1. Elements of framework with working examples [15]
More barriers and drivers for cultural tourism 4 Cultural tourism taxonomy 3 Providing practical examples of how to use the framework 3 Details about digital storytelling 3
Including user journey stages 2 2. Including more target
groups [12] New target groups (kids, family, pregnant women, patients)
7
Increasing international diversity of tourists 5 3. Factor descriptions
[12] More descriptions of factors 7 Description and criteria for each group 2
Presenting research problems 3 4. Cultural tourism and
digital storytelling examples [5]
Cultural tourism examples 3 Digital storytelling examples 2
Table 7.17 presents comments in response to the question “What pieces of
knowledge or factors would you suggest to be included in this framework to increase
diversity and motivation to Cultural Tourism?”
For the first factor, participants would have liked ‘elements of the framework with
working examples’ (n=15) (more barriers and drivers for cultural tourism, cultural
tourism taxonomy, providing practical examples of how to use the framework,
including user journey stages) to be included. Some comments state “Present user

249
journey stages for each group as a part of inclusive design”, “Adding barrier-free
design principles” or “Showing how to adapt the framework in reality”.
Next, most participants would have liked ‘more target groups’ (n=12) (new target
groups (kids, family, pregnant women, patients), international diversity of tourists) to
be included. Some interesting comments state “Add Western/Eastern people since
they might have different backgrounds and may have a different point of view in
IDST”. Other factors are ‘factor descriptions’ (n=12) and ‘cultural tourism and digital
storytelling’ (n=5).
• Please mention the top three things you ‘like’ in this framework?
Table 7.18 Open-ended answers from four groups Theme Subtheme Value
(number of mentions)
1. Understanding diversity [41]
Diversity and inclusion of tourist groups 15 Rare information on diverse target groups 11 The importance of diversity in cultural tourism 7 Grouping tourists by demographics 5 Usefulness of information in diversity 3
2. Clarity of information [38]
Easy for all to understand 32 Clarity of graphics and design 3 Making formal data understandable 3
3. Increasing knowledge [24]
Better understanding of CT 12 New knowledge in digital storytelling 11 New knowledge in cultural tourism 7 New knowledge in inclusive design 4
4. Innovative and inclusive framework [21]
Innovative framework 11 Informative framework 9 Multilingual 1
Table 7.18 illustrates open-ended answers in response to the question “Please
mention the top three things you like in this framework?” The first point is
‘understanding diversity’ (n=41) (diversity and inclusion of tourist groups, rare
information in diverse target groups, the importance of diversity in cultural tourism,
grouping tourists by demographics, usefulness of information in diversity). Some
comments state “I like the idea that you separated many target groups” and “This
framework focuses on disabled people and older adults that are very rare
information”.

250
The next good point is ‘clarity of information’ (n=38) (easy for all to understand,
clarity of graphics and design, making formal data understandable). Some interesting
comments are “The framework is very easy to understand” and “I can understand
problems with each group easily”. The next points are ‘Increasing knowledge’ (n=24)
and ‘innovative and inclusive framework’ (n=21).
• Please mention top three things you ‘dislike’ in this framework?
Table 7.19 Open-ended answers from four groups Theme Subtheme Value
(number of mentions)
1. Complex and confusing– not for everyone [38]
Complexity of framework 17 Not for general users 10 A lot of technical terms 4 Not sure where to start 4 Difficult to understand 3
2. Lack of information and explanation [35]
Lack of clear explanation 14 Lack of details 14 Lack of introduction 7
3. Design and graphics problems [26]
Confusing graphics 12 Lacks simplicity 8 Too small fonts and too much text 6
4. Framework – requiring improvement [25]
Lack of explanation of research methodology 10 Lacking practical examples — how to use 4 Too long to read 4 Needs additional target groups 4 Unclear – process of digital storytelling 3
5. Needs testing and improvement [22]
Too theoretical and impractical 11 Technical and financial issues of digital storytelling 8 Need for validation 3
Table 7.19 presents the participants’ comments in response to the question “Please
mention top three things you dislike in this framework?”
The first issue is ‘complex and confusing– not for everyone’ (n=38) (complexity of
framework, not for general users, a lot of technical terms, not sure where to start,
difficult to understand). Some comments included “This framework requires
educated people to understand, not for everyone” and “Usability, usefulness,
accessibility and desirability, these are not common words”.

251
The next issue is ‘lack of information and explanation’ (n=35) (lack of clear
explanation, details and introduction). Some participants state “Some technical terms
should be explained” and “I would like to know the different between tourism and
cultural tourism”.
The next issues participants do not like are ‘design and graphics problems’ (n=26),
‘framework – requiring improvement’ (n=25), ‘needs testing and improvement’
(n=22).
7.4 Discussion 7.4.1 RQ1: How usable is the IDST for CT framework?
This framework was evaluated through four factors, such as reaction, learning,
behaviour, and results (Kirkpatrick, 1975). Overall, the framework was evaluated
positively as presented below:
Reaction: Four groups of participants rate the framework in terms of ‘reaction’ at
5.33 (somewhat agree). This means that most participants considered this
framework engaging, related to their experience, and useful in information.
Learning: Four groups of participants rate the framework in terms of ‘learning’ at
5.20 (somewhat agree). Most participants considered this framework as
understandable, increase their understanding of cultural tourism, inclusive design
and digital storytelling. Moreover, participants somewhat agree that this framework
can solve problems in cultural tourism.
Behaviour: Four groups of participants rate the framework in terms of ‘behaviour’ at
4.85 (somewhat agree). This means that the majority of participants somewhat agree
that this framework can increase diversity and motivation. Moreover, they would like
to apply and introduce this framework in their work.
Results: This factor is about setting up tangible results or goals and evaluating if the
framework can achieve these set goals. In this study, the goals are to increase
diversity and motivation in cultural tourism. Four groups of participants rated the

252
framework in terms of ‘results’ at 5.67 (agree). The majority of participants agree that
inclusive design and digital storytelling principles applied in this framework can
increase diversity and motivation in cultural tourism.
The mean for the Thai digital storytelling group is the highest in every factor: reaction
= 5.95 (agree); learning = 5.50 (agree); behaviour = 5.55 (agree); and results = 6.19
(agree). This means that this group considered the framework related to their work,
was understandable, and that they would like to introduce this to others.
However, the Thai cultural tourism group received the lowest mean in reaction = 4.68
(somewhat agree); learning = 4.96 (somewhat agree); and behaviour = 4.18
(neutral). This means that this group is the group who least considered this
framework related to their experience, cannot increase their understanding and do
not recommend this framework to others.
Moreover, the International group received the lowest mean in results (5.25 =
somewhat agree). This means that they are the group that least agrees this
framework can increase diversity and motivation and least agrees with the statement
they ‘prefer to use it’.
Table. 7.20 Total mean for usability test for the four groups Reaction (what participants think of the proposition) Rank Groups Mean SD. 1. Thai digital storytelling group 5.95 (agree) 0.84 2. Thai inclusive design group 5.31 0.86 3. International group 5.37 1.19 4. Thai cultural tourism group 4.68 (somewhat agree) 0.98 Total 5.33 (somewhat agree) 1.08 Learning (what participants learn from the proposition) Rank Groups Mean SD. 1. Thai digital storytelling group 5.50 (agree) 1.31 2. Thai inclusive design group 5.24 1.00 3. International group 5.08 0.90 4. Thai cultural tourism group 4.96 (somewhat agree) 0.85 Total 5.20 (somewhat agree) 1.06 Behaviour (the impact of the proposition) Rank Groups Mean SD. 1. Thai digital storytelling group 5.55 (agree) 1.08 2. Thai inclusive design group 4.86 1.20 3. International group 4.78 0.911 4. Thai cultural tourism group 4.18 (neutral) 1.04 Total 4.85 (somewhat agree) 1.17 Results (fitness for purpose of the proposition) Rank Groups Mean SD.

253
1. Thai digital storytelling group 6.19 (agree) 0.65 2. Thai inclusive design group 5.39 1.04 3. Thai cultural tourism group 5.61 0.89 4. International group 5.25 (somewhat agree) 1.26 Total 5.67 (agree) 1.01 Total for all usability test 5.26 (somewhat agree) 1.08 7.4.2 RQ2: How desirable is the IDST for CT framework? This factor is a significant variable in design research since it can indicate if
participants prefer to use this framework in reality. Four groups of participants rated
the framework in terms of ‘desirability’ at 5.11 (somewhat agree). This means that
they somewhat agree to use the framework.
The mean for the Thai digital storytelling group is the highest in desirability = 6.00
(agree). This means that this group considered the framework related to their works,
was understandable, and that they would like to introduce and use this framework in
reality. However, the International group received the lowest mean in desirability
(4.59 = somewhat agree). This means that they are the group least likely to prefer to
use it.
Table. 7.21 Total mean for desirability test for the four groups Desirability (was the proposition perceived as appropriate ?) Rank Groups Mean SD. 1. Thai digital storytelling group 6.00 (agree) 0.92 2. Thai inclusive design group 4.86 1.39 3. Thai cultural tourism group 4.72 1.40 4. International group 4.59 (somewhat agree) 1.33 Total for desirability test 5.11 (somewhat agree) 1.38 7.4.3 RQ3: Are there statistically significant differences in answers between the four groups of participants? A one-way ANOVA between subjects was conducted to compare a significant
difference between means for the four groups. Table 7.22 shows there were
statistically significant effects of ‘reaction, behaviour, results, and desirability’ at the
p<.05 level for the four groups. There was only one factor, ‘learning’, that was not
statistically significant.

254
After using a Scheffe post hoc test to compare each group to every other group of
participants, the results indicated that the Thai digital storytelling group ranked
significantly higher than 1.) the Thai cultural tourism group in ‘reaction’; 2.) the Thai
cultural tourism group and international group in ‘behaviour’; 3.) the Thai inclusive
design group and international group in ‘results’; and 4.) all groups in ‘desirability’.
This could imply that in every evaluation stage, the Thai digital storytelling group
considered this framework as an important, interesting and understandable
framework. Especially, in desirability, there was a statistically significant difference
between all three groups. This means that the Thai digital storytelling group prefer to
use this framework in reality.
Table 7.22 A one-way ANOVA to compare for significant differences between means for the four groups Evaluation mode Sig. P. Statistical significance Reaction .000 p< .05 Yes Learning .147 p>.05 No Behaviour .000 p< .05 Yes Results .001 p< .05 Yes Desirability .000 p< .05 Yes Table 7.23 Results from a Scheffe post hoc test Evaluation mode Statistical significance Reaction Thai digital storytelling group (m=5.95) > Thai cultural tourism group
(m=4.68) Learning - Behaviour Thai digital storytelling group (M=5.55) > Thai cultural tourism group
(M=4.18) and international group (M=4.78)Results Thai digital storytelling group (M=6.19) > Thai inclusive design group
(M=5.39) and international group (M=5.25)Desirability Thai digital storytelling group (M=6.00) > Thai cultural tourism group
(M=4.72), Thai inclusive design group (M=4.86) and international group (M=4.59).

255
7.4.4 RQ4: What changes or additions should be made to improve IDST for CT framework?
Table 7.24 Open-ended answers about changes and additions for the IDST for CT
framework Open-ended questions Themes Changes or improvements
1. Presenting more details [n=20] 2. Improving graphics and style [n=13] 3. Simplifying the framework [n=12] 4. Linking with mixed media [n=10] 5. Testing the framework [n=9]
New pieces of knowledge or factors
1. Elements of framework with working examples [n=15] 2. Including more target groups [n=12] 3. Factor descriptions [n=12] 4. Cultural tourism and digital storytelling examples [n=5]
Regarding changes, from the first question, participants want to change this
framework by adding more details, improving graphics to be more stylish, simplifying
the framework, linking with both online and offline media, and testing this framework.
In the future, this framework could be improved by adding details and results (i.e.,
demographic information, results and conclusion of the five groups from the three
studies) in the additional link. Moreover, in terms of simplifying and improving
graphics, it could be simplified by presenting only the basic version of the framework
with animation and an interactive system. People can click on the icons to know
details of what they are interested later. Furthermore, this interactive framework
could be presented in a booklet as mixed media. Lastly, this study should set up a
workshop to create a prototype of digital storytelling to test its practical application.
With regards to additions, from these comments, new factors that should be included
are ‘elements of framework’ (i.e. more barriers and drivers, user journey stages,
examples on how to use this framework, etc.). Some participants pointed out that
they need to know more about barriers and drivers, but the framework only presents
the top barriers and drivers. In addition, there should be a part to explain how to
adapt the framework in reality in both academic and industry sectors. This issue
matches to the previous answer that participants need to improve the framework by
‘presenting more details’ [n=20].
Additionally, this framework should add new target group (i.e. kids, family or
international tourists, etc.) and provide descriptions of technical terms. Cultural

256
tourism, digital storytelling, and inclusive design are very new, academic terms.
Moreover, people need to know the criteria to choose participants from the five
groups.
Lastly, there should be examples of cultural tourism and digital storytelling. This is
because these two terms are quite new. Many people are confused about the
difference between tourism and cultural tourism. This could be better explained by
using short movies and digital storytelling works. There should be an additional link
or icon to click and provide real-life examples.
7.4.5 RQ5: What do participants like and dislike in the IDST for CT framework?
Table 7.25 Open-ended answers about like and dislike for the IDST for CT framework Open-ended questions Themes Like in this framework 1. Understanding diversity [n=41]
2. Clarity of information [n=38] 3. Increasing knowledge [n=24] 4. Innovative and inclusive framework [n=21]
Dislike in this framework
1. Complex and confusing– not for everyone [n=38] 2. Lack of information and explanation [n=35] 3. Design and graphics problems [n=26] 4. Framework – requiring improvement [n=25] 5. Needs testing and improvement [n=22]
The first positive aspect is ‘understanding diversity’ received the highest mention
[n=41]. This is the strong point of this framework that categorises target group of
cultural tourists into five groups, especially data about disabled people and older
adults. However, in terms of ‘clarity of information’ [n=38], many participants stated
that it is easy to understand in both data and graphics. This contrasts with the
previous question where they state that the framework is ‘complex and confusing–
not for everyone’ [n=38]. Interestingly, the number of people who mention both
negative and positive issues are the same [n=38]. This could suggest that some of
them can understand the framework clearly, but some cannot fully understand this
concept. Furthermore, people like ‘increasing knowledge’ because they can
understand the definition and knowledge of three keywords, especially regarding
diversity and motivation in cultural tourism. Lastly, the reason they like this is
because the ‘innovative and inclusive framework’ tries to present complicated data
into graphics and illustrates the links between the three areas.

257
In conclusion, the majority of participants need to know more details in every target
group, but in a simple form.
In terms of negative aspects, the first rank relates to the complicated framework - not
everyone can use it. Most of them explain that they are not familiar with the
academic framework and the technical terms, especially the PhD framework. This is
because some participants are from industry and students. Thus, they need simple
guidelines that could be easily adapted into practical works. This issue matches the
answer about improving and simplifying the framework. Moreover, from the issue
‘lack of information’, this study has tried to simplify the framework by avoiding adding
too much data. However, due to a large amount of information in the framework,
there are consequently ‘design and graphics problems’ that make this framework too
complicated regarding the layout. Moreover, in terms of ‘framework – requiring
improvement’ and ‘needs testing and improvement’, some participants need to read
more details and examples on how to adapt and use it. However, a one-page
framework cannot present all the information that participants require.
Thus, this framework should be improved by presenting a basic version, but hiding
in-depth information in the icons. People can click to read additional details in what
they are interested. Moreover, the improved future version should be a simple and
clear framework, but hiding in-depth details and information in the icons.
7.5 Summary 7.5.1 Research question
RQ1: How usable is the IDST for CT framework? RQ2: How desirable is the IDST for CT framework? The IDST for CT framework was evaluated through five factors and received total
means for:
• Usability at 5.26 of out 7 (somewhat agree) • Desirability at 5.11 out of 7 (somewhat agree)
Furthermore, means in the five stages for all groups were: ‘reaction’ (5.33 =
somewhat agree); ‘learning’ (5.20 = somewhat agree); ‘behaviour’ (4.85 = somewhat
agree); ‘results’ (5.67 = agree); and ‘desirability’ (5.11 = somewhat agree).

258
The mean for the Thai digital storytelling group received the highest in every factor,
especially in ‘results’ (6.19 = agree) and ‘desirability’ (6.00 = agree). However, the
Thai cultural tourism group received the lowest mean in reaction (4.68 = somewhat
agree), learning (4.96 = somewhat agree), and behaviour (4.18 = neutral). Moreover,
the International group received the lowest mean in results (5.25 = somewhat agree)
and desirability (4.59 = somewhat agree).
RQ3: Are there statistically significant differences in answers between the four groups of participants?
From the results, there were statistically significant differences for ‘reaction (.000),
behaviour (.000), results (.001), and desirability’ (.000) at the p<.05 level for the four
groups, but not for ‘learning’ (.147).
The results from the Scheffe post hoc test indicated that the Thai digital storytelling
group was significantly higher than 1.) the Thai cultural tourism group in ‘reaction’;
2.) the Thai cultural tourism group and international group in ‘behaviour’; 3.) the Thai
inclusive design group and international group in ‘results’; and 4.) all groups in
‘desirability’.
RQ4: What changes or additions should be made to improve IDST for CT framework? In terms of changes, participants want to change this framework by ‘presenting more
details’ [n=20], ‘improving graphics and style’ [n=13], ‘simplifying the framework’
[n=12], ‘linking with mixed media’ [n=10], and ‘testing this framework’ [n=9].
Regarding additions, new factors that should be included are ‘elements of framework
with working examples’ [n=15] (i.e. more barriers and drivers, user journey stages,
example of how to use this framework, etc.), ‘including more target groups’ [n=12]
(i.e. kids, family or international tourists, etc.), providing ‘factor descriptions’ [n=12]
and ‘cultural tourism and digital storytelling examples’ [n=5].

259
RQ5: What do users like and dislike in this framework? The first positive aspect is ‘understanding diversity’ [n=41], ‘clarity of information’
[n=38], ‘increasing knowledge’ [n=24], and ‘innovative and inclusive framework’
[n=21].
Overall, most participants recommended having more in-depth details and data for
every target group in every study, but in a simple form. The framework could be
developed into a basic version, but hiding information in the icons. Therefore, users
can click further information to read more about what they are interested in.
The first negative aspect is about ‘complex and confusing – not for everyone’ [n=38],
followed by ‘lack of information and explanation’ [n=35], ‘design and graphics
problems’ [n=26], ‘framework – requiring improvement’ [n=25], and ‘needs testing
and improvement’ [n=22].
7.5.2 Study limitations A gender imbalance In this study, online questionnaires were sent to all participants. As a result, there
was a gender imbalance in the two groups: Thai inclusive design experts and
students (male: 5 and female: 17) and Thai cultural tourism experts and students
(male: 6 and female: 31). Due to the limitations of an online survey, the researcher
could not choose gender and couldn’t foretell who would fill out the survey, as
compared to a face-to-face survey. This led to the existing male/female imbalanced
ratio in the two groups.
Suggestion: further research should consider controlling the gender ratio, especially
in an online survey.
Low rate of response One of the main problems in this study was the low rate of responses in every group,
especially in the Thai cultural tourism group. Robson (2011) addressed this issue by
stating that a drawback of online surveys is poor response rates compared to other
methods. However, Robson (2011) also suggests that researcher should apply
strategies to attract a greater number of responses and improve the rate of

260
responses. In this study, the period of data collection was extended from one month
to two months due to the low rate of survey responses, namely less than 40%.
Suggestion: To solve this problem, researchers should increase the period of time
to collect online data and increase the number of participants being sent surveys.
Type of career imbalance Due to the drawback of online surveys, there was an imbalance in type of career in
every group: Thai cultural tourism group (experts: 24 and students: 13), Thai
inclusive design group (experts: 19 and students: 3), Thai digital storytelling group
(experts: 29 and students: 9), and International group (experts: 18 and students: 9).
Although the online survey was sent to both experts and students at the same rate,
the ratio was too different. However, this study sent online surveys to many groups
with profiles. As a result, the researcher could not predict how many experts and
students would fill out the form.
Suggestion: researchers should control some demographic data from online
surveys by selecting only one target group at a time. Thus, the researcher can
monitor the number of participants to match the expected rate of response.
Mobile phone format preference This study presented an interactive framework on the website format designed to fit
computer screens only. However, many participants stated that they preferred to
watch the framework and fill out the online survey on their mobile phone. The
majority of participants also suggested that they do not work on a computer screen
all the time. In addition, some participants worked outside, not in an office. Some of
them refused to complete this survey due to their limitation regarding the use of
computers. Maybe the reason this study received a low rate of responses was due to
these issues.
Suggestion: Further research should consider designing a framework for mobile
phone format since most people prefer to use mobile phones. This could increase
the rate of response to online surveys.

261
Chapter 8: Conclusion and further work
8.1 Key conclusion
Addressing the research question
8.2 Research aims and objectives
8.2.1 Research objective 1: To provide a better understanding of the current situation and relevant applications for three main areas: 1) cultural tourism, 2) inclusive design and 3) digital storytelling.
8.2.2 Research objective 2: To create an initial inclusive digital storytelling for cultural tourism framework.
8.2.3 Research objective 3: To develop and detail an initial inclusive digital storytelling for cultural tourism framework from three empirical studies
8.2.4 Research objective 4: To evaluate the usability and desirability of the inclusive digital storytelling for cultural tourism framework that embodies the findings from three empirical studies
8.2.5 What is known now that was not known prior to this PhD research?
8.3 Contribution to knowledge
8.3.1 Suggesting and establishing links between digital storytelling, inclusive design and cultural tourism
8.3.2 Devising and detailing a framework for inclusive digital storytelling to facilitate cultural tourism for Thai visitors in Thailand
8.3.3 Providing the tourism industry and researchers with an understanding of the trends of cultural tourism and preparing them to face new challenges by applying digital storytelling and inclusive design.
8.3.4 Academic contribution to knowledge
8.4 Implications of this thesis
8.4.1 How to use this PhD research to benefit Thailand 8.4.2 Supporting the government, tourism industry, designers, and researchers on how to use the IDST for CT framework.
8.4.3 Impacts of this framework on international tourists
8.5 Limitations
8.5.1 General limitations
8.5.2 Specific limitations
8.6 Further works
8.7 Summary

262
This chapter summarises the conclusions made in this PhD research addressing the
research question, aim and objectives, contributions to knowledge, implications and
limitations. The research aim and objectives (Section 8.2) are restated and each
objective is addressed based on the key conclusions.
8.1 Key conclusion
Addressing the research question
This PhD research started by focusing on lack of diversity and motivation as one of
the main problems in cultural tourism in Thailand. To address this problem, the following research question was proposed:
• Research question: How could inclusive design and digital storytelling
principles be applied to facilitate cultural tourism in Thailand?
In this PhD research, inclusive design was applied as ‘understanding and designing
for diversity’ (Waller et al., 2015). In terms of ‘understanding diversity’, this PhD
research focused on a wide range of potential cultural tourists, from ‘fully able users’
to minority users with disabilities and categorised them into five different groups
(youth, older adults, people with disabilities, non-cultural tourists, and cultural
tourists). With regards to ‘designing for diversity’, this PhD research applied inclusive
design into all studies and illustrated results in the framework, to increase diversity
and inclusion in cultural tourism.
Digital storytelling was adopted as ‘a guideline to create motivation in cultural
tourism’. This PhD research has centralised many general guidelines for digital
storytelling into a single set of guidelines composed of 11 elements, and interviewed
Thai and international experts on how to use them to increase motivation for all five
groups.
To answer the research question in this PhD research, a framework for inclusive
digital storytelling (IDST) for cultural tourism (CT) in Thailand was created,
developed and detailed. This framework is original, since it for the first time,
combines three areas, cultural tourism, inclusive design and digital storytelling.

263
Moreover, this framework is interdisciplinary, since it combines empirical knowledge
from three studies using diverse methods (500 questionnaires, 17 expert interviews, and 50 observations), converged into one framework.
8.2 Research aims and objectives
This PhD research aimed to create, develop and evaluate a framework for inclusive
digital storytelling to increase diversity and motivation for cultural tourism in Thailand. The research objectives were as follows:
1. To provide a better understanding of the current situation and relevant
applications for three main areas: 1) cultural tourism, 2) inclusive design and 3) digital storytelling (Chapter 2).
2. To create an initial inclusive digital storytelling for cultural tourism framework (Chapter 2).
3. To develop and detail an initial inclusive digital storytelling for cultural tourism framework from three empirical studies (Chapters 4,5,6).
4. To evaluate the usability and desirability of the inclusive digital storytelling for
cultural tourism framework that embodies the findings from three empirical studies
(Chapter 7).
Table 8.1 summaries the PhD research objectives and major findings in Chapter 2,4,5,6 and 7.

264
Table 8.1 Research objectives and key findings for this PhD research
Objectives Approach
Chapter Major finding
1. To provide a better understanding of the current situation and relevant applications for three main areas: 1) cultural tourism, 2) inclusive design and 3) digital storytelling
Literature review and analysis
2 Review and analysis of the three factors to explain their relation to each other
2. To create an initial inclusive digital storytelling for cultural tourism framework
Literature review and analysis
2 An initial IDST for CT framework is created
3. To develop and detail an initial inclusive digital storytelling for cultural tourism framework from three empirical studies
Questionnaire, interviews and observations
4,5,6 - Barriers and drivers in cultural tourism - Digital storytelling guidelines for cultural tourism - Understanding diverse audiences whilst they engage with digital storytelling
4. To evaluate the usability and desirability of the inclusive digital storytelling for cultural tourism framework that embodies the findings from three empirical studies
Online questionnaire
7 Confirmation as useful and desirable to users
8.2.1 Research objective 1: To provide a better understanding of the current situation and relevant applications for three main areas: 1) cultural tourism, 2) inclusive design and 3) digital storytelling
The first objective was to provide a better understanding of the current situation and relevant
applications of three main areas of this PhD research. This objective was achieved through
literature review and analysis in Chapter 2.
• Inclusive design and cultural tourism Cultural tourism is considered a niche market and suffers from a lack of diversity
compared to mass tourism. Moreover, the tourism industry mostly pays attention to
tourists who are already interested in and motivated for cultural tourism and ignores
attracting new cultural tourists. Thus, there is an opportunity to increase the diversity
of potential cultural tourists. Moreover, tourists have a wide diversity and therefore
variety of drivers and barriers to engage in cultural tourism, including needs,
difficulties, expectations and motivations. This PhD research applied the principle of
inclusive design and aimed to identify new and diverse potential cultural tourists by
exploring their drivers and barriers, in order for the drivers to be further supported,
and barriers to be removed.

265
• Digital storytelling and cultural tourism
At cultural sites, visitors are not motivated to engage with the stories displayed
behind the exhibitions and to visit to real places. These problems highlighted a good
opportunity to further facilitate cultural tourism to increase visitors’ motivation using
digital storytelling. However, when creating of digital storytelling content, there were
no guidelines focusing specifically on cultural tourism for potential visitors, especially
those older adults and people with disabilities, who were not typical target groups.
Therefore, the aim of this study was to create and propose a digital storytelling guideline to motivate five diverse groups of Thai people to engage in cultural tourism.
• Digital storytelling and inclusive design One of the main aspects of digital storytelling is that most content is provided in
digital format. This issue led to questions about whether people (especially older
adults and people with disabilities) were unfamiliar with and unable to access this
form of technology. Hence, there was an opportunity to apply inclusive design to
digital storytelling to understand users’ needs in order to inform the industry,
designers, and researchers, and to help create a system that supported a diverse
range of potential users. Thus, this PhD research presented an understanding of the
behaviour of five diverse potential user groups, whilst engaging with digital storytelling through digital devices.
8.2.2 Research objective 2: To create an initial inclusive digital storytelling for cultural tourism framework
The second objective was to create an initial IDST for CT framework. This objective
was achieved through literature review and analysis in Chapter 2, to identify
relationships, gaps, problems, and opportunities between three main fields. The
analysis was summarised below:
• Lack of diversity (inclusive design and cultural tourism): To broaden and
increase the potential market, this PhD research drew upon inclusive design
principles as ‘understanding and designing for diversity’ by researching
barriers and drivers to engaging in cultural tourism among five different
groups.

266
• Lack of motivation (digital storytelling and cultural tourism): To increase
tourists’ motivation, this PhD research adopted digital storytelling by creating
and proposing the digital storytelling guidelines to motivate all five groups to
engage in cultural tourism. • Lack of understanding of the user’s behaviour whilst watching digital
storytelling (inclusive design and digital storytelling): This PhD research
applied the principle of inclusive design to understand the behaviour of five
diverse groups of Thai people to observe understanding of digital storytelling
at various stages.
To resolve these three main problems, a framework for inclusive digital storytelling to
increase diversity and motivation for cultural tourism in Thailand was created in Figure 8.1.
Figure 8.1 A framework for inclusive digital storytelling for cultural tourism (IDST for
CT) in Thailand.

267
8.2.3 Research objective 3: To develop and detail an initial inclusive digital storytelling for cultural tourism framework from three empirical studies
The third objective was to develop and detail initial framework. This was achieved via
three empirical studies in Chapters 4, 5 and 6. The framework was detailed based on
the prescriptive stage from the DRM that aimed to develop the initial framework, by
collecting empirical data and presenting the results of the relationship from three key
fields. This stage (PS-1) set up three studies and reported them as follows:
Table 8.2 Three empirical studies in this PhD research
Study Topics Studies and methods Results 1. Barriers and drivers in cultural tourism
for five groups in Thailand
Inclusive design and cultural tourism (500 Questionnaires)
Results about barriers and drivers for five groups
2. Constructing the digital storytelling: guideline to increase motivation in cultural tourism for five groups in Thailand
Digital storytelling and cultural tourism (17 expert interviews)
The digital storytelling guideline for five groups
3. Inclusive digital storytelling to understand audiences’ behaviour
Inclusive design and digital storytelling (50 observations)
Data for five groups in terms of reaching out and engaging with digital storytelling
Study 1: Barriers and drivers in cultural tourism for five groups in Thailand
This aim of this study was to identify barriers and drivers in cultural tourism for five
groups of Thai people to answer the research question: What are the barriers and
drivers in cultural tourism among five different groups? The results were presented in
Table 4.9 in Chapter 4 in full detail. Figure 8.2 shows the key findings presented in
the inclusive design and cultural tourism section of the framework.

268
Figure 8.2 Barriers and drivers for five groups presented in Chapter 4
Key findings on barriers and drivers are also outlined below as follows.
Barriers • ‘Transportation’ (e.g. difficult to access public transportation and physically
difficult to get to) was common to all five groups of Thai people.
• ‘Time’ (e.g. a lack of time to attend and inconvenient opening hours) applied
to four groups, except people with disabilities.
• ‘Architectural barriers’ was common to three groups (older adults, disabled
people and non-cultural tourists), but did not apply to young people and

269
cultural tourists.
Drivers • ‘Visiting a place not visited before’ applied to four groups, all except people
with disabilities.
• ‘Just relaxing’ was common among four groups except cultural tourists.
• ‘New experiences and different lifestyles’ was applied to three groups except
people with disabilities and cultural tourists.
These most common barriers and drivers to cultural tourism were cited by almost all
groups and were considered significant issues. This means that the Thai
government, tourism organisations and tourism industry designers and researchers
should consider these as specific barriers and drivers in the context of Thai cultural tourism.
Study 2: Constructing digital storytelling: guidelines to increase motivation in cultural tourism for five groups in Thailand
This study aimed to create guidelines to increase Thai visitors’ motivation to engage
in cultural tourism using digital storytelling. Furthermore, it focused on addressing the
research questions: What are the digital storytelling guidelines that focus specifically
on cultural tourism? and How can the guidelines be used to motivate cultural tourism
in Thailand for five different groups of Thai people? Figure 8.3 shows the key
findings presented in the digital storytelling and cultural tourism section of the
framework.

270
Figure 8.3 A set of guidelines to create digital storytelling for five groups presented in Chapter 5
This study converged various general digital storytelling guidelines into one single
set of guidelines, which included 11 sections; 1). the storyteller’s point of view; 2). a
key question; 3). the core idea and purpose; 4). emotional content; 5). story
structure; 6). economy; 7). the rhythm of the story; 8). the storyteller’s voice; 9).
soundtrack; 10). quality of media, and 11). background and characters.
Consequently, 17 experts were interviewed on how to use the converged guideline

271
to motivate cultural tourism for five different groups in Thailand. The detailed results
were presented in Table 5.6 in Chapter 5. Some key findings are outlined below.
Results suggested these digital storytelling elements as significant and applicable to
all five Thai groups:
• The storyteller’s point of view – The first-person point of view
• The core idea and purpose – Showing the meaning and importance of
cultural tourism.
• Economy – Simplicity and brevity.
• The storyteller’s voice – Using the storyteller’s voice to narrate.
• Background and characters – Presenting real locations, not fantasy.
Study 3: Inclusive digital storytelling to understand audiences’ behaviour The aim of this study was to understand diverse audiences in terms of reaching
(accessibility and understanding) and engaging with (usefulness, usability,
preferences) digital mobile devices. Furthermore, it focused on addressing these
research questions: What are the diverse audiences’ behaviour in terms of reaching
and engaging with digital mobile devices? Figure 8.4 shows the key findings
presented in the inclusive design and digital storytelling section of the framework.
The key findings are also presented in Table 8.3.

272
Figure 8.4 Key findings from diverse audiences in term
s of reaching and engaging with digital m
obile devices from C
hapter 6

273
Table 8.3 Summary of reaching and engaging with digital storytelling from all five Thai groups
Young people
Older adults Disabled people
Non- cultural tourists
Cultural tourists
1. Accessibility 99% 30% 50% 100% 100% 2. Understanding Faster than
average 48.2%
Slower than average 55%
Slower than average 55%
Faster than average 38%
Faster than average 58.4%
3. Usefulness (convenience in terms of…)
Format Watching video
Similar to smartphone
Bigger size Anytime, anywhere
4. Usability No problem with any task
Problems with all tasks, especially typing and English language barriers
Problems with all tasks, especially typing and English language barriers
No problem with any task
No problem with any task
5. Desirability Prefer to use
Prefer to use, if already taught
Prefer to use, if already taught
Prefer to use
Prefer to use
Some key findings in terms of accessibility, understanding and usability included:
Youth, non-cultural tourists and cultural tourists had no major problems in almost all
stages. However, older adults and disabled people faced various problems using digital mobile devices in terms of the accessibility, understanding and usability.
However, in terms of the desirability, all groups stated they preferred to watch digital
storytelling through digital devices. Also, older adults and disabled people are willing
to learn how to use digital devices, provided it is taught to them.
8.2.4 Research objective 4: To evaluate the usability and desirability of the inclusive digital storytelling for cultural tourism framework that embodies the findings from three empirical studies
The IDST for CT framework was evaluated in Chapter 7 using five factors, including
reaction, learning, behaviour, results (Kirkpatrick, 1975) and desirability (McGinley,
2012). Overall, the framework was evaluated positively as presented in Table 8.4 below:

274
Table.8.4 Total mean from five factors for four groups
Reaction (what participants think of the proposition) Rank Groups Mean SD. 1. Thai digital storytelling group 5.95 (agree) 0.84 2. Thai inclusive design group 5.31 0.86 3. International group 5.37 1.19 4. Thai cultural tourism group 4.68 (somewhat agree) 0.98 Total 5.33 (somewhat agree) 1.08 Learning (what participants learn from the proposition) Rank Groups Mean SD. 1. Thai digital storytelling group 5.50 (agree) 1.31 2. Thai inclusive design group 5.24 1.00 3. International group 5.08 0.90 4. Thai cultural tourism group 4.96 (somewhat agree) 0.85 Total 5.20 (somewhat agree) 1.06 Behaviour (the impact of the proposition) Rank Groups Mean SD. 1. Thai digital storytelling group 5.55 (agree) 1.08 2. Thai inclusive design group 4.86 1.20 3. International group 4.78 0.911 4. Thai cultural tourism group 4.18 (neutral) 1.04 Total 4.85 (somewhat agree) 1.17 Results (fitness for purpose of the proposition) Rank Groups Mean SD. 1. Thai digital storytelling group 6.19 (agree) 0.65 2. Thai inclusive design group 5.39 1.04 3. Thai cultural tourism group 5.61 0.89 4. International group 5.25 (somewhat agree) 1.26 Total 5.67 (agree) 1.01 Total for all usability test 5.26 (somewhat agree) 1.08 Desirability (was the proposition perceived as appropriate?) Rank Groups Mean SD. 1. Thai digital storytelling group 6.00 (agree) 0.92 2. Thai inclusive design group 4.86 1.39 3. Thai cultural tourism group 4.72 1.40 4. International group 4.59 (somewhat agree) 1.33 Total for desirability test 5.11 (somewhat agree) 1.38
The IDST for CT framework was evaluated using five factors and received a total
mean of 5.26 (somewhat agree) for usability and 5.11 (somewhat agree) for
desirability. Furthermore, the mean in five stages for all groups were: ‘reaction’ at
5.33 (somewhat agree); ‘learning’ at 5.20 (somewhat agree); ‘behaviour’ at 4.85
(somewhat agree); ‘results’ at 5.67 (agree); and ‘desirability’ at 5.11 (somewhat agree).
The Thai digital storytelling group considered the framework most related to their works, understandable, and were likely to introduce and use this framework.

275
However, the Thai cultural tourism group considered the framework least related to
their experience, and stated it could not increase their understanding and did not
recommend this framework to others. Moreover, the international group was the
group who agreed the least that this framework could increase diversity and motivation, and they had the least preference to use it.
The results indicated that the Thai digital storytelling expert group scored
significantly higher than: 1.) the Thai cultural tourism expert group in ‘reaction’; 2.)
the Thai cultural tourism expert group and international group in ‘behaviour’; 3.) the
Thai inclusive design expert group and international expert group in ‘results’; and 4.) for all expert groups in ‘desirability’.
This could imply that in every evaluation stage, the Thai digital storytelling group
considered this framework as important, interesting and understandable. Especially
in desirability, there was a statistically significant difference from three expert groups.
This means that the Thai digital storytelling group would prefer to use this
framework.
8.2.5 What is known now that was not known prior to this PhD research?
Prior to this PhD research, no study has attempted to link the three areas of cultural tourism,
inclusive design, and digital storytelling. Many studies that link inclusive design with tourism
tend to focus on one group only (older adults or disabled individuals) in terms of accessible
tourism, and do not focus on cultural tourism specifically. Moreover, research presenting
digital storytelling guidelines mainly focuses on one specific group in typical areas such as
education, interactive systems, or game design. Some studies have focused on digital
storytelling and cultural tourism, but exclude certain groups, particularly older adults and
disabled individuals. Furthermore, several research pieces have studied the behaviour of
older adults using digital mobile devices, but also emphasise only one group, and do not
focus on digital storytelling.
• The relationships between the three areas
This PhD research presents the relationships between three factors and presents the
following: (1) barriers and drivers for five diverse groups of potential Thai cultural tourists in
order to increase diversity; (2) a set of guidelines for digital storytelling in cultural tourism to
motivate five groups; (3) an understanding of five diverse groups in terms of their reaching
out to and engaging with digital mobile devices to help create a system that supports all

276
users, and that informs the industry, designers, and researchers accordingly. These data will
be useful for solving two main problems in cultural tourism, i.e. a lack of diversity and
motivation.
• The newly created framework Prior to this PhD research, no specific framework has been designed that combines the
above noted three areas, or that suggest how to solve the primary issues in cultural tourism.
This research offers a theoretically and empirically informed structure (the framework) that is
interdisciplinary (combining three distinct disciplines) and original. This is because the
framework was constructed from three studies, adopting both qualitative and quantitative
methods (500 questionnaires, 17 expert interviews, and 50 observations), with subsequent
results being implemented into the final framework.
8.3 Contribution to knowledge
8.3.1 Suggesting and establishing links between digital storytelling, inclusive design and cultural tourism
This PhD research has identified, explored and further informed a triadic relationship
between three distinctive disciplines i.e. cultural tourism, inclusive design and digital
storytelling, through a theoretically and empirically informed approach.
Through linking the problems and opportunities in cultural tourism, inclusive design
and digital storytelling, a link between these three areas was identified. This link was
further explored and detailed between each of the two areas through separate
studies. Consequently, the link between all three areas was established and further
evaluated. The context for the identification, exploration and detailing of this triadic
relationship, was cultural tourism for Thai people in Thailand.
The three links established, offer novel and original knowledge as follows:
• Inclusive design and cultural tourism – presents barriers and drivers for
five diverse groups of potential cultural tourists.
• Digital storytelling and cultural tourism – illustrates a set of guidelines for
digital storytelling in cultural tourism to motivate five diverse groups.

277
• Digital storytelling and inclusive design – provides understanding of five
diverse groups in terms of their reaching for and engaging with digital mobile
devices.
In terms of inclusive design and cultural tourism, there is a lack of diversity in cultural
tourism. This problem can lead to several issues, such as a weaker economy in the
local area, less social engagement of local people, and a reduction in financial
support from the government. Thus, this PhD research applied inclusive design
principles to identify a diverse range of potential tourists and explore their barriers
and drivers to cultural tourism, in order to increase diversity.
Regarding digital storytelling and cultural tourism, there is a lack of motivation for
tourists to engage with the stories related to cultural features. This could be due to
lack of understanding, appreciation, entertainment of enjoyment of these stories.
Therefore, this PhD research applied digital storytelling as a guideline to motivate
five diverse groups of cultural tourists to better engage with cultural tourism.
In terms of digital storytelling and inclusive design, digital storytelling is available in
digital formats only, which could pose a barrier for a diverse group of people for
various reasons. Therefore, this PhD research investigated the concept of inclusive
digital storytelling to understand users’ needs in order to help create a system that
supports all users, and to inform the industry, designers, and researchers
accordingly.
8.3.2 Devising and detailing a framework for inclusive digital storytelling to facilitate cultural tourism
The main contribution of this PhD research, the inclusive digital storytelling (IDST)
framework for cultural tourism (CT), is an original and interdisciplinary contribution to
knowledge. The IDST framework, for the first time links and combines three
distinctive and diverse disciplines and areas of research in an attempt to offer a
theoretically and empirically informed structure (i.e. the framework) in order to
facilitate a specific topic (i.e. cultural tourism), within a specific context i.e. for Thai people in Thailand.

278
The new IDST for CT framework resulting from this PhD research is interdisciplinary,
since it connects and converges three distinct disciplines and areas of research in
an attempt to address key issues in cultural tourism i.e. lack of diversity and
motivation. This framework integrates theoretical knowledge from all three key fields
and combines it with empirical knowledge from three studies using diverse methods
(500 questionnaires, 17 expert interviews, and 50 observations), converged into one
framework. The framework presents inclusive design to broaden the diversity of
cultural tourists and digital storytelling to increase the motivation of cultural tourists.
Moreover, it presents the issues between inclusive design and digital storytelling as lack of understanding of user’ behaviour while engaging with digital storytelling.
The new IDST for CT framework resulting from this PhD research is original, since it
for the first time, combines three fields i.e. cultural tourism, inclusive design and
digital storytelling. The IDST framework investigates cultural tourism through
inclusive design by identifying barriers and drivers of five diverse groups of potential
cultural tourists. It also presents guidelines for digital storytelling, focusing mainly on
cultural tourism for five diverse groups. Furthermore, it illustrates an understanding
of five diverse groups of users when engaging with digital storytelling. No such studies or triadic framework existed prior to this PhD research.
8.3.3 Providing the tourism industry and researchers with an understanding of the trends of cultural tourism and preparing them to face new challenges by applying digital storytelling and inclusive design.
The literature review from Chapter 2 stated that most of the tourism industry seems
to ignore disabled people and older adults and considers them as a general group
(Shaw and Coles, 2004). However, in the future, the tourism industry will be
saturated and in high competition. This means that the tourism industry should target
new customers that have currently been overlooked.
Moreover, the average age of the world population is increasing, and is predicted to
continue increasing, whilst people are also living longer and are becoming healthier
and wealthier. In 2050, the number of ageing people will reach approximately 22 per
cent of the world’s population (Magnus, 2009). Regarding people with disabilities,

279
Ozturk, Yayli and Yesiltas (2008) suggest that this group is significant since they are
very loyal customers and tend to come back to the places that are suitable for their
accessibility. Consequently, opening up this tourism market can result in a higher
income for the tourism industry (Arellano, 2003).
Therefore, this is the opportunity to apply inclusive design into the area of cultural
tourism. This is because it aims to make products, services and environments
accessible to the widest range of users possible, irrespective of impairment, age, or
capability (British Standards Institute, 2005; Langdon, Persad and Clarkson, 2008).
This study adopts the concept of inclusive design for cultural tourism to understand
the barriers and drivers of all potential audiences of cultural tourism through research
and to engage diverse and different groups in cultural tourism, which is presented in
Chapter 4. Therefore, the industry may be better able to recognise the significance of
neglected groups and increase accessibility and inclusivity for these potential
customers.
In terms of digital storytelling in the future, the tourism industry, museums and
cultural sites will tend to further develop technology to present the data more
interactively and realistically to deliver a successful visitor experience (i.e. virtual
museums, virtual presentations, applications, websites, games, interactive
presentations, etc.). As a result, digital storytelling is imperative to attract both
researchers and general tourists, using a range of presentation techniques (i.e. plots,
characters, conflict, and soundtracks) that are not hard-sell advertising (Miller, 2012;
Alcantud et al., 2014; Wexler et al., 2014).
Moreover, digital storytelling can present physically inaccessible places (i.e. those
that are too expensive to visit, too inhospitable, too far away, too fragile, too
dangerous, or no longer exist) and offer inclusive accessibility in multiple languages
(Paquet and Viktor, 2005; Wither et al., 2010; Pujol et al., 2012; Keil et al., 2013; Floch and Jiang, 2015).
Therefore, digital storytelling in cultural tourism, through increasing motivation,
seems to be the new trend in tourism. However, the key is how to apply and
integrate the latest technologies effectively with good, simple content that can be
reused on many platforms in the future. The guidelines to create digital storytelling

280
for cultural tourism presented in Chapter 5 are necessary for future trends in cultural tourism.
8.3.4 Academic contribution to knowledge
The academic data presented in this PhD research can serve as the groundwork for future
studies on cultural tourism, inclusive design, and digital storytelling, as it presents a set of
barriers and drivers for potential tourists, a set of guidelines for creating digital storytelling
works, designed by experts, and a set of user requirements for watching digital storytelling,
sourced from five groups of viewers. Hence, this research contributes to the academic body
of knowledge and combines data collected from tourists, as well as from experts presenting
different research methods (survey, interview, and observation). This PhD research
produced a range of academic contributions to knowledge, including the following.
1). Presenting a set of barriers and drivers for cultural tourism in Thailand from five groups,
which researchers can apply and adopt, and a process for categorising all potential cultural
tourists. Prior to this study, a set of requirements (e.g., barriers, drivers, needs, suggestions)
about cultural tourism in Thailand never exist, particularly for specific groups (i.e., older
adults and individuals with disabilities). The majority of research in this area focuses on
management and archeology in tourism. Moreover, this study adopted the concept of
inclusive design to increase diversity, by categorising potential cultural tourists into five
groups, the criteria of which other studies can apply in future research to identify tourism
needs.
2). Creating digital storytelling guidelines to increase motivation in cultural tourism. Prior to
this study, most research in this field have emphasised how to use digital storytelling in
classrooms, or the use of interactive systems, entertainment, or game design. Some studies
have focused on cultural tourism (e.g., online museums, applications), but have focused
mainly on one group as representative of cultural tourists. The current study created a set of
guidelines to create digital storytelling works for five groups. Hence, other studies can apply
the data of the present research to create digital storytelling works that match user needs,
particularly in the case of older adults and individuals with disabilities, for whom there is
currently limited information available.
3). Presenting user behaviour, exhibited while watching digital storytelling. Prior to this study,
most studies have focused on only one group (primarily older adults) when testing digital
mobile devices. However, this study presents a set of user requirements from five groups of

281
potential cultural tourists. This was effected by creating 11 users’ journey stages in a bid to
observe user behaviour. Hence, other studies can adopt these user journey stages and the
requirements of the five groups to their own studies. Importantly, the present study highlights
the likes and dislikes of users in terms of watching digital storytelling. The tourism industry
can apply the data in this area, as presented in the current research, to develop digital
storytelling work that match user needs.
8.4 Implications and impacts of this thesis
8.4.1 How to use this PhD research to benefit Thailand
• Digital inclusion in Thailand: For Thai older adults and those with disabilities, digital technology is a significant
barrier. However, the finding of this PhD research (Chapter 6) suggests that Thai
disadvantaged users (people with disabilities and older adults) are willing to learn
and use such technology in their everyday lives as a way of maintaining digital
inclusion. Findings from the study could help remove and reduce these digital
barriers.
• Insights into five key audiences of cultural tourism in Thailand
These Thai five groups can be targeted more effectively if the Thai tourism industry
can present and develop advertising campaigns that counter the different barriers
and reflect the various drivers of each group.
• Digital storytelling guideline for Thai cultural places
In the future, the Thai tourism industry, museums and cultural sites will tend to
develop more high technology interactions in order to present the data more
realistically and attractively. This PhD research creates a new digital storytelling
guideline (Chapter 5) for five Thai groups representing specifically the motivation for
cultural tourism in Thailand.
• Thai local public engagement This PhD research could support Thai local people in creating and sharing stories
about their hometowns, lifestyle, social values and local identity. Hence, members of
any Thai locality could be trained in workshops by adapting and adopting this

282
guideline to create simple digital stories from their personal ideas to attract visitors to
cultural places and understand local lifestyles.
• Training and familiarising Thai older adults and people with disabilities
The total number of Thai older adults and disabled people who could complete the
task of using iPad to watch digital storytelling movies increased double from round 1
to round 2 after they were taught. These groups are well capable of developing their
digital skills – if well taught and induced.
8.4.2 Supporting the government, tourism industry, designers, and researchers on how to use the inclusive digital storytelling for cultural tourism framework
This PhD research can benefit both areas of research (CT, DST and ID researchers)
and practice (the government, tourism industry, designers). The IDST for CT
framework could be used by several groups as follows:
• Researchers: The triadic relationship of the three fields, and the theoretically
and empirically informed results presented in the framework regarding
barriers and drivers, guidelines to digital storytelling and users’ behaviour
regarding digital devices can benefit researchers and be inform new research.
• Tourism industry: The framework could be used to understand the potential
for diversifying cultural tourists, especially including disabled people and older
adults who are currently marginalised groups. Focusing on new groups of
customers could lead to market differentiation by targeting new customers
overlooked by their competitors. DST principles could help inform decision
making and developments regarding digital marketing, advertisement and
curation.
• Thai government: Transportation was identified as a common key barrier to
all five potential visitor groups. Moreover, architectural barriers were identified
as significant older adults, people with disabilities and non-cultural tourists).
This will need infrastructure investment, planning and support for the
government. Building on the insights form this PhD research, it is suggested
that Thailand should establish a Thai Disability Act to provide and support

283
accessibility and inclusivity for people with disabilities and older adults.
• Designers, directors and screenwriters: Designers, especially user
experience (UX) designers can apply this framework to create both non-
interactive and interactive applications or websites. The results from all three
key areas could be used to understand user barriers and drivers and user
behaviour in digital storytelling. Moreover, the framework could be used as a
design process guideline to support communications between designers,
marketers and clients. Directors and screenwriters can similarly use the
results to understand barriers and drivers to target groups and digital
storytelling guidelines to create stories that match with audiences’ capabilities
and expectations, especially people with disabilities and older adults, who
most directors state they had no previous experience of working with.
8.4.3 Impacts of this framework on international tourists
This framework was originally designed to attract Thai tourists only, using data
distributed to Thai respondents in three studies. However, this framework can be
applied to attract international tourists as well, particularly youth, older adults, and
people with disabilities, by understanding barriers and drivers, guidelines for creating
digital storytelling, and understanding user behaviour while they are engaged in
watching digital storytelling. In terms of older adults and people with disabilities, the
user requirements of Thai and international groups are not entirely different; they
share some aspects and requirements, e.g., ramps, an accessible environment,
experience using digital devices, and trends and styles when watching movies and
listening to music. Moreover, in the case of youth, currently, trends change globally
and rapidly due to the presence of the Internet and social media. This means that
youth throughout the world tend to share the same interests as a result of watching
the latest Hollywood films, or because they are exposed to new trends on social
media (e.g., YouTube, Facebook, and Instagram). However, cultural tourists have
specific requirements and trends individually. Additionally, cultural differences and
interests also exist. Non-cultural tourists comprise the largest group with different
interests, and these can be extremely broad. It can be difficult to identify what they
require within an international scope. Hence, this framework can be applied to attract

284
some groups of international tourists (youth, older adults, and disabled individuals), but will not be as useful in the context of cultural and non-cultural tourists.
8.5 Limitations
This PhD research aimed to create, develop and evaluate a framework for inclusive
digital storytelling to increase diversity and motivation for cultural tourism in Thailand.
For this aim, four empirical studies were set up. Each of the empirical studies had
limitations and this was discussed in previous chapters. However, this section
presents a summary to understand the overall and specific limitations and suggestions for this PhD research.
8.5.1 General limitations
• A gender imbalance This PhD research did not control the participant gender ratio due to volunteer-based
recruitment throughout all studies. As a result, there was an issue regarding gender
imbalance in two studies. For example, in Chapter 4, there was a gender imbalance
in four groups: young people (male: 37 and female: 63), older adults (male: 36 and
female 64), people with disabilities (male: 66 and female: 34), non-cultural tourists
(male: 34 and female: 59). Moreover, in Chapter 7 – evaluation stage, there was a
gender imbalance in two groups: the Thai inclusive design experts and students
(male: 5 and female: 17) and the Thai cultural tourism experts and students (male: 6
and female: 31). This could generally imply that more Thai women tended to agree
to participate in the studies than men. Thus, further studies should consider
controlling the gender ratio to balance the rate of participant gender.
• Access
Two studies (Chapters 4 and 6) were set up in official government locations. The
processes (i.e. sending the questionnaire to be approved, research plans and official
letters) took around two months. Especially in the case of one specific Disabled
Foundation, the proposal and questionnaires had to be further approved by a
psychologist and a government representative. During the survey (Chapter 4) and

285
observations (Chapter 6), psychologists were also accompanying the researchers
and staff to observe. Thus, for a researcher to set up a study in an official place in
Thailand, they must expect and be prepared for a rather long preparation and
approval process.
• Misunderstanding and lack of familiarity with technical terms
There were some technical terms in the three empirical studies that participants
could not understand. This sometimes led to refusal to participate. In specific,
Chapter 4 presented ‘inclusive design’ and ‘cultural tourism’; Chapter 5 presented
‘digital storytelling’ and ‘cultural tourism’; and Chapter 7 proposed all three technical
terms. Therefore, the researcher had to clearly explain the terms and provide useful
and relevant examples. Hence, to increase the rate of acceptance, the researcher
should provide very clear definitions of technical terms and examples in emails and on the questionnaire.
8.5.2 Specific limitations
Limitations specific to each study conducted in this PhD research, are presented in Table 8.5 below.
Table 8.5 Limitations in the four empirical studies
Study Study limitations Suggestion
1. Likert scaling questionnaire Many of the disabled people and older adults said they were not familiar with the scaling answer.
The researcher recommends avoiding complicated ways of answering for older adults and disabled people.
Access The survey was set up in several official government locations, which were approved in two months.
The researcher recommends sending an official cover letter and questionnaire early.
Limited use in Thailand The study was taken from the city of Bangkok in Thailand. Thus, the research was limited to one urban area within the country.
Further research should be conducted in other rural and urban areas in Thailand.
A gender imbalance Due to a volunteer-based survey, there was a gender imbalance in four groups: young people (male: 37 and female: 63), older adults (male: 36 and female 64), people with disabilities (male: 66 and female: 34), non-cultural tourists (male: 34 and female: 59)
Further research should consider gender and control it to balance both genders.

286
2. Misunderstanding in digital storytelling Many interviewees refused to join the study, stating that they did not know the term ‘digital storytelling’.
The researcher recommends providing the definitions for any technical terms in the email sent to interviewees.
Interviewees – a lack of experience with some groups Sometimes experts refused to give suggestions for the groups they had never worked with (i.e. older adults and disabled people).
The researcher recommends the provision of details, data and/or results for interviewees, especially when it comes to certain specific information.
Limited use with Thai users This guideline was originally created to target Thai audiences. Moreover, out of the 17 experts interviewed, 13 were Thai and 4 were international.
The researcher recommends other studies to create their own guidelines for the specific topics they wish to use.
3. Internet connection Older adults and disabled people participants lived in the suburbs of Bangkok; an area with an unstable internet connection. Consequently, the iPad screen was generally choppy and occasionally froze for a while when the participants were watching the video.
The researcher recommends that all participants be observed in controlled areas that have Wi-Fi.
Low educational levels for some groups The demographic profiles reveal that five of the disabled people and one of the older adults had received no education. This factor may lower the overall observation scores for these two groups.
The researcher recommends contacting schools or part-time courses for disabled people and older adults rather than the government foundation.
The length of video and animation was too long This study used a video that was 5.21 minutes in length and an animation that lasted 3.51minutes. However, some participants, especially older adults and disabled people, suggested that the videos were too long and boring. Moreover, some participants (cultural tourists, the youth, non-cultural tourists) refused to join due to its length.
The researcher recommends choosing videos and/or animations that are as short as possible when observing older adults and disabled groups.
Low acceptance rate for the observation When participants knew that the whole process would take around 30 to 60 minutes, and that they would be recorded by two video cameras, the majority refused.
The researchers should set up the whole process so that it takes as little time as possible. Another option is to increase the number of vouchers offered.
4. A gender imbalance Online questionnaires were sent to all participants. As a result, there was a gender imbalance in two groups as: Thai inclusive design experts and students (male: 5 and female: 17) and Thai cultural tourism experts and students (male: 6 and female: 31).
Further research should consider controlling the gender ratio, especially in online surveys.
Low rate of response One of the main problems in this study was low rate of responses in every group, especially Thai cultural tourism group.
Researchers should increase the period to collect online data and increase the number of participants who it will be sent to.
Type of career imbalance There was imbalance in the type of career in every group: Thai cultural tourism group (experts: 24 and students: 13), Thai inclusive design group (experts: 19 and students: 3), Thai digital storytelling group (experts: 29 and students: 9) and International group (experts: 18 and students: 9). Although, the online survey was sent to both experts and
Researchers should collect data from online surveys using only one target group at a time. Thus, the researcher can monitor the number of participants that match the expected rate or not.

287
students at the same rate, the ratio was too different. Mobile phone format preference So many participants stated that they prefer to watch the framework and fill out the online survey on a mobile phone.
Further research should consider designing a mobile phone format as most people prefer to use a mobile phone to do everything. This could increase the rate of response online.
8.6 Further work
1. Comparative studies in other regions in Thailand
Due to limited samples set up in the capital city, Bangkok, the results of this
framework are of limited use to other countries. Moreover, the results are not
representative of all Thai people. Especially, in the case of Thailand, the country is
composed of five parts (north, north-east, centre, east and south). It is difficult to
apply the findings on barriers, drivers and behaviours whilst watching digital
storytelling to other areas that may have different cultural, socio-demographic or
economic contexts. Comparative studies should also be set up in the remaining four
areas of Thailand, to compare these results with other areas. This would help assess
universal validity and practicality of the results of this framework in other contexts.
2. Comparative studies between Thai cultural tourists and international tourists in Thailand
The framework was intentionally created to attract Thai tourists to visit cultural places
in Thailand only. Thus, further work should include new groups, especially
international tourists in Thailand to extend the use of this framework to international
visitors.
3. Including more target groups
In the evaluation stage, most participants stated that the positive aspect of this
framework is the ‘understanding diversity’, which received the highest mention
[n=41]. This is the strong point that classifies the target group of cultural tourists into
five groups, especially data about disabled people and older adults. However, they
commented that this framework should ‘include more target groups’ [n=12] (i.e. children, family or international tourists, etc.).

288
4. Detailing more results of the framework
In the evaluation, most participants recommended that the framework should be
improved by ‘presenting more details’ [n=20] and ‘improving graphics and style’
[n=13]. They needed details of each study for every group (i.e. all barriers and
drivers for all groups and full guidelines for the five groups) and needed a stylish
layout and interactive graphic design. While the focus of this PhD research has been
on devising the ‘content’ of the framework. Further studies could focus on devising
the ‘presentation’ of the framework and its content and apply this concept to design a
way to properly present the full range of formal information using an interactive system.
5. Setting up workshops with users to test this framework
From Chapter 7, the evaluation, participants recommended that the framework
‘needs testing and improvement’ [n=22]. They stated that the framework is rather
theoretical and not specifically practical. More support was needed to know how to
apply this framework in practice. Therefore, further studies should be conducted;
setting up workshops with real target users (digital storytelling, inclusive design and
cultural tourism experts), and adopting this framework in real-world scenarios and evaluate the findings.
6. Setting up workshops for local Thai people
One advantage of digital storytelling is the ability to create non-professional work
with low-budget equipment. Thus, everyone can create their own stories using this
framework. Further studies should set up workshops to train local people how to
create and share their stories of their local area using this framework. Consequently,
the research should identify areas and aspects to develop the framework to work in accordance with non-professional users’ needs.
8.7 Summary
This PhD research focused on two main problems of cultural tourism: lack of
diversity and lack of motivation. To address these issues, cultural tourism for Thai
people in Thailand was chosen as the context and the following research question

289
was proposed: How could inclusive design and digital storytelling principles be
applied to facilitate cultural tourism in Thailand? Four empirical studies were carried out in order to address the four objectives below:
1: To provide a better understanding of the current situation and relevant applications for three main areas: 1) cultural tourism, 2) inclusive design and 3) digital storytelling.
• Inclusive design and cultural tourism: this PhD research adopted the
principle of inclusive design as ‘understanding and designing for diversity’ by
identifying new potential cultural tourists and exploring their drivers and
barriers. • Digital storytelling and cultural tourism: there are no guidelines for digital
storytelling focusing on cultural tourism. Therefore, the aim of this study was
to create and propose a digital storytelling guideline to motivate five diverse
groups to engage in cultural tourism.
• Digital storytelling and inclusive design: there is an opportunity to apply
inclusive design to digital storytelling to create a system that supports and
engages diverse groups of users. Thus, this study aimed to understand the
behaviours of five diverse groups of users whilst engaging with digital
storytelling on digital devices.
2: To create an initial inclusive digital storytelling for cultural tourism framework
This objective was achieved through literature review and analysis in Chapter 2 to identify
relationships, gaps, problems, and opportunities between three main fields: 1.) lack of
diversity (inclusive design and cultural tourism); 2.) lack of motivation (digital storytelling and
cultural tourism); and 3.) lack of understanding of user behaviour whilst engaging with digital
storytelling (inclusive design and digital storytelling). To address these, an initial IDST for CT
framework was created and presented in Figure 8.1.
3: To develop and detail an initial inclusive digital storytelling for cultural tourism framework from three empirical studies
This objective was achieved in Chapters 4, 5 and 6. Three empirical studies were
planned and conducted, summarised in Table 8.6.

290
Table 8.6 Three empirical studies in this thesis
Study Topics Studies and methods Results 1. Barriers and drivers in cultural tourism
for five groups in Thailand
Inclusive design and cultural tourism (500 Questionnaires)
Results on barriers and drivers for five groups
2. Constructing the digital storytelling: guideline to increase motivation in cultural tourism for five groups in Thailand
Digital storytelling and cultural tourism (17 expert interviews)
The digital storytelling guidelines for five groups
3. Inclusive digital storytelling to understand audiences’ behaviour
Inclusive design and digital storytelling (50 observations)
Data for five groups in terms of reaching out and engaging with digital storytelling
4: To evaluate the usability and desirability of the inclusive digital storytelling for cultural tourism framework that embodies the findings from three empirical studies
The IDST for CT framework was evaluated in Chapter 7 using five factors including
reaction, learning, behaviour, results (Kirkpatrick, 1975) and desirability (McGinley, 2012).
• Total mean for ‘usability’ was 5.26 out of 7 (somewhat agree) and 5.11 out of
7 (somewhat agree) for ‘desirability’.
• Thai digital storytelling expert group received the highest mean in every
factor, especially in ‘results’ and ‘desirability’.
• Thai cultural tourism expert group received the lowest mean in ‘reaction’,
‘learning’ and ‘behaviour’.
• International expert group received the lowest mean in ‘results’ and
‘desirability’.
In conclusion, this PhD research has made three contributions to knowledge, outlined below:
1. Suggesting and establishing links between digital storytelling, inclusive design and
cultural tourism.
2. Devising and detailing a framework for inclusive digital storytelling to facilitate
cultural tourism

291
3 Providing the tourism industry and researchers with an understanding of the trends
of cultural tourism and preparing them to face new challenges by applying digital storytelling and inclusive design
Further work will focus on comparative studies in other regions in Thailand, including
International tourists, including more target groups, further detailing the results of the
framework, designing the ‘presentation’ of the framework, setting up workshops with
target users to evaluate the framework in real-world contexts and applications, and
setting up workshops for local Thai people.

292
References
Abad, M., Sorzabal, A. and Linaza, M., 2005. NOMENCLATOR-innovative multilingual environment for collaborative applications for tourists and cultural organizations. Information and Communication Technologies in Tourism 2005, pp.79-89.
Aceves-Gonzalez, C., 2014. The application and development of inclusive service design in the
context of a bus service (Doctoral dissertation, © Carlos Aceves Gonzalez). Administration on Aging. 2012. Available at:
http://www.aoa.gov/AoARoot/Aging_Statistics/future_growth/future_growth.aspx#age. (4 September 2013)
Ahmed, S., 2001. Understanding the use and reuse of experience in engineering design (Doctoral dissertation, University of Cambridge).
Alcantud Díaz, M., Ricart Vayá, A., and Gregori-Signes, C., 2014. 'Share your experience'. Digital
storytelling in English for tourism. Iberica, 2014, num. 10, p. 185-204.
Aldebert, B., Dang, R. and Longhi, C., 2011. Innovation in the tourism industry: The case of Tourism. Tourism Management. 32. 1204-1213.
Allan, M., 2013. Disability tourism: Why do disabled people engaging in tourism activities. European Journal of Social Sciences, 39(3), 480-486.
Alonso, E. C., 2015. Some Contributions to Smart Assistive Technologies (Doctoral dissertation, The University of Basque Country).
Altinay, Z., Saner, T., Bahçelerli, N. M., and Altinay, F., 2016. The Role of Social Media Tools:
Accessible Tourism for Disabled Citizens. Journal of Educational Technology and Society, 19(1), 89-99.
American Psychological Association, American Educational Research Association, and National Council on Measurement in Education., 1954. Technical recommendations for psychological tests and diagnostic techniques (Vol. 51, No. 2). American Psychological Association.
Amthor, G. R., 1992. Multimedia in Education: An Introduction. International Business Magazines.
Archer, B., 1995. The nature of research. Co-Design Journal, 2(11), 6-13. Arellano, L., 2003. Broadinghorizonts.Travel Agent, 311(10), 21–22.
ATLAS, 2009. ATLAS Cultural Tourism Research Project. Available from: http://www.tram-research.com/atlas/presentation.htm (1 June 2014)
Awaritefe, O., 2004. Motivation and other considerations in tourist destination choice: a case study of Nigeria. Tourism Geographies, 6(3), 303-330.
Barnard, Y., Bradley, M. D., Hodgson, F., and Lloyd, A. D., 2013. Learning to use new technologies by older adults: Perceived difficulties, experimentation behaviour and usability. Computers in Human Behavior, 29(4), 1715-1724.
Barros, A.C., Leitão, R. and Ribeiro, J., 2014. Design and evaluation of a mobile user interface for older adults: navigation, interaction and visual design recommendations. Procedia Computer Science, 27, pp.369-378.
Bennett, T., 1994, The Reluctant Museum Visitor: A Study of Non-Goers to History Museums and Art
Galleries, Australia Council for the Arts, Sydney.

293
Bianchini, F., 1990, October. Cultural policy and urban development: the experience of West European cities. In Paper delivered at the conference: Cultural Policy and Urban Regeneration: The West European Experience, Liverpool (pp. 30-31).
Bianchini, F., 1993. Culture, conflict and cities: issues and prospects for the 1990s.Cultural Policy and
Urban Regeneration: The West European Experience, 199-213.
Bizjak, B., Knežević, M. and Cvetrežnik, S., 2011. Attitude change towards guests with disabilities: Reflections from tourism students. Annals of Tourism Research, 38(3), pp.842-857.
Blanche, M. T., Blanche, M. J. T., Durrheim, K., and Painter, D. (Eds.)., 2006. Research in practice:
Applied methods for the social sciences. Juta and Company Ltd. Blessing, L. T., and Chakrabarti, A., 2009. DRM, a design research methodology. Springer Science
and Business Media. Blazey, M. A., 1987. The differences between participants and non-participants in a senior travel
program. Journal of travel research, 26(1), 7-12.
Bolan, P., Boy, S., and Bell, J., 2011. “We've seen it in the movies, let's see if it's true” Authenticity and displacement in film-induced tourism. Worldwide Hospitality and Tourism Themes, 3(2), 102-116.
Bolter, J. D. and Richard, G., 2001. Remediation: Understanding New Media. Cambridge, MA: MIT Press
Bond, N., and Falk, J., 2013. Tourism and identity-related motivations: why am I here (and not there)?. International Journal of Tourism Research, 15(5), 430-442.
Bopp, M. M., 2008. Storytelling and motivation in serious games. Part of the Final Consolidated
Research Report of the Enhanced Learning Experience and Knowledge Transfer–Project ELEKTRA.
Boukas, N., 2008. Cultural Tourism, Young People and Destination Perception: A Case Study of Delphi, Greece.
Bouranta, N., Chitiris, L. and Paravantis, J., 2009. The relationship between internal and external service quality. International Journal of Contemporary Hospitality Management, 21(3), pp.275-293.
Bowe, F., 2000. Universal design in education: Teaching nontraditional students. Greenwood Publishing Group.
Bowman, D. A., Hodges, L. F., Allison, D., and Wineman, J., 1999. The educational value of an
information-rich virtual environment. Presence. 8(3). 317–331.
Boyce, M. E., 1996. Organisational story and storytelling: a critical review. Journal of Organisational Change. 9(5). 5-26.
Boyd, S.W. and Timothy, D.J., 2001. Developing partnerships: tools for interpretation and management of World Heritage Sites. Tourism Recreation Research, 26(1), pp.47-53.
British Standards Institute, 2005. British Standard 7000-6: Design management systems “Guide to
managing inclusive design. British Standards Institute, London, UK. [Online]. Available from: www.bsi-global.com [Accessed 10 June 2015]
Brooks, A. C., 2003. Public opinion and the role of government arts funding in Spain. Journal of Comparative Policy Analysis: Research and Practice, 5(1), 29-38.
Bryman, A., and Teevan, J. J., 2005. Social research methods Canadian edition Oxford University Press.

294
Buhalis, D. and Licata, M. C., 2002. The future eTourism intermediaries. Tourism Management. 23(3). 207-220.
Buhalis, D. and Zoge, M., 2007. The strategic impact of the Internet on the tourism industry. Information and communication technologies in tourism 2007, pp.481-492.
Bull, G. and Kajder, S., 2005. Digital storytelling in the language arts classroom. Learning & Leading
with Technology, 32(4), pp.46-49. Buarapa, T., 2006. The development of a sustainable ecological and cultural tourism market in Khon
Kaen Province [in Thai]. Maha Sarakham: Research Institute of Northeastern Art and Culture.
Burmark, L., 2004. Visual presentations that prompt, flash and transform. Media and Methods. 40(6). 4–5.
Burns, A. C., and Bush, R. F., 2013. Marketing research. Pearson Higher Ed.
Burnett, J.J. and Baker, H.B., 2001. Assessing the travel-related behaviors of the mobility-disabled consumer. Journal of Travel Research, 40(1), pp.4-11.
Busby, G., and Klug, J., 2001. Movie-induced tourism: The challenge of measurement and other
issues. Journal of Vacation Marketing, 7(4), 316–332.
CABE, 2006. The Principles of Inclusive Design. [Online]. Available from: http://webarchive.nationalarchives.gov.uk/20110118095356/http:/www.cabe.org.uk/files/the-principles-of-inclusive-design.pdf [Accessed 10 June 2015]
Casper, B., 2003. Universal design can help all students. Pacesetter, 26(3), p.9. Cavlek, N., 2002. Tour operators and sustainable development–A contribution to the environment.
Journal of Transnational Management Development, 7(4), pp.45-54. Cetron, M., 2001. The world of today and tomorrow: the global view. Tourism and Hospitality in the
21st Century, pp.18-28. Chadwick, J. C., 1998. A survey of characteristics and patterns of behavior in visitors to a museum
web site.
Chadwick-Dias, A., McNulty, M., and Tullis, T., 2003, November. Web usability and age: how design changes can improve performance. In ACM SIGCAPH Computers and the Physically Handicapped (No. 73-74, pp. 30-37). ACM.
Chaisorn, J., 1993. Study of the conditions of tourist attractions in order to develop tourism in Mae Hong Son Province [in Thai]. Unpublished doctoral thesis, Srinakharinwirot University, Thailand
Chantachon, S. 2006. A Comparative study of the development model in education and religion management process between Thailand and Lao PDR [in Thai]. Kalasin: Prasan Printing.
Chamberlain, P. and Yoxall, A., 2012. ‘Of Mice and Men’: The Role of Interactive Exhibitions as Research Tools for Inclusive Design. The Design Journal, 15(1), pp.57-78.
Chan, M. Y., Haber, S., Drew, L. M., and Park, D. C., 2016. Training older adults to use tablet
computers: does it enhance cognitive function?. The Gerontologist, 56(3), 475-484.
Chantachan, S., 2011. A Comparative study of the development model in education and religion management process between Thailand and Lao. J. Soc. Sci, 7, 209-212.
Chen, H. C., Kao, Y. F., and Kuo, C. L., 2014, August. A Multimedia Storytelling in a Rural Village:
The Show Taiwan e-Tourism Service Using Tablet Technologies. In Advanced Applied Informatics (IIAIAAI), 2014 IIAI 3rd International Conference on (pp. 525-526). IEEE.

295
Chen, S.C. and Shoemaker, S., 2014. Age and cohort effects: The American senior tourism market. Annals of Tourism Research, 48, pp.58-75.
Chung, S.K., 2007. Art education technology: Digital storytelling. Chou, M. C., 2013. Does tourism development promote economic growth in transition countries? A
panel data analysis. Economic Modelling, 33, 226-232. CHESS - Cultural Heritage Experiences through Socio-personal interactions and Storytelling. 2011.
Available from www.chessexperience.eu (1 September 2016)
Christodoulakis, S., Foukarakis, M., Tsinaraki, C., Kanellidi, E., and Ragia, L., 2013, December. Contextual Geospatial Picture Understanding, Management and Visualization. In Proceedings of International Conference on Advances in Mobile Computing and Multimedia (p. 156). ACM.
Christodoulakis, S., 2014. Trends in Digital Cultural Heritage Management and Applications. Digital Presentation and Preservation of Cultural and Scientific Heritage, (IV), 17-25.
Clarkson, P.J. and Coleman, R., 2015. History of Inclusive Design in the UK. Applied ergonomics, 46, pp.235-247.
Clarkson, P.J., Coleman, R., Hosking, I. and Waller, S. (eds.). 2007. Inclusive Design Toolkit.
University of Cambridge, Cambridge, UK. [Online]. Available from: www.inclusivedesigntoolkit.com [Accessed 10 June 2015]
Clausen, J., Zygmunt, E., Clark, P., Mucherah, W., and Tancock, S., 2014, March. Understanding Community and Cultural Contexts: Teacher Education Candidate Development through Digital Storytelling. In Proceedings of Society for Information Technology and Teacher Education (SITE) International Conference (pp. 515-519).
Coleman, R., Pullinger, D.J. (Eds.), 1993. Applied Ergonomics Special Issue e Designing for Our Future Selves, vol. 24(1). Butterworth-Heinemann, Oxford, UK
Coleman, R., 2001. Designing for our future selves. Universal Design Handbook. McGraw Hill, pp.4-1. Connell, J., 2005. What’s the story in Balamory? The impacts of a children’s TV programme on small
tourism enterprises on the isle of Mull, Scotland. Journal of Sustainable Tourism, 13(3), 228–255.
Craik, J., 1995. Are there cultural limits to tourism?. Journal of sustainable tourism, 3(2), pp.87-98. Craeger, E., 2007. Some Tourist Destinations Improve Accessibility for Disabled. Arizona Republic,
December, 2. Crawford, D. W., and Godbey, G., 1987. Reconceptualizing barriers to family leisure. Leisure
sciences, 9(2), 119-127.
Crompton, J. L., 1979. Motivations for pleasure vacation. Annals of tourism research, 6(4), 408-424.
Cross, N., 1999. Design research: A disciplined conversation. Design issues, 15(2), 5-10. Cross, N., 2007. Designerly Ways of Knowing. Board of International Research in Design. Basel:
Birkhiuser. Crotty, M., 1998. The foundations of social research: Meaning and perspective in the research
process. Sage. Crouch, G.I., 1994. The study of international tourism demand: a review of findings. Journal of Travel
research, 33(1), pp.12-23.

296
Croy, W. G., 2010. Planning for film tourism: Active des- tination image management. Tourism and Hospitality Planning and Development, 7(1), 21–30.
Cultraro, M., Gabellone, F., and Scardozzi, G., 2009, May. The virtual musealization of archaeological sites: between documentation and communication. In Proceedings of the 3rd ISPRS International Workshop 3D-ARCH (pp. 25-28).
Cunsolo Willox, A., Harper, S. L., and Edge, V. L., 2013. Storytelling in a digital age: digital storytelling
as an emerging narrative method for preserving and promoting indigenous oral wisdom. Qualitative Research, 13(2), 127-147.
Czaja, S. J., Charness, N., Fisk, A. D., Hertzog, C., Nair, S. N., Rogers, W. A., and Sharit, J., 2006. Factors predicting the use of technology: findings from the Center for Research and Education on Aging and Technology Enhancement (CREATE). Psychology and aging, 21(2), 333.
D’Hudson, G. and Saling, L.L., 2010. Worry and rumination in older adults: differentiating the processes. Aging & mental health, 14(5), pp.524-534.
Danowski, J. A., and Sacks, W., 1980. Computer communication and the elderly. Experimental aging
research, 6(2), 125-135.
Darcy, S., and Daruwalla, P. S., 1999. The trouble with travel: people with disabilities and tourism. Social Alternatives, 18(1), 41.
Darcy, S. and Dickson, T.J., 2009. A whole-of-life approach to tourism: The case for accessible tourism experiences. Journal of Hospitality and Tourism Management, 16(1), pp.32-44.
Das, B. and Acharjee, S., 2013. Problems and prospects of cultural tourism: A case study of Assam,
India. International Journal of Physical and Social Sciences, 3(4), p.455. Davies, A., and Prentice, R., 1995. Conceptualizing the latent visitor to heritage attractions. Tourism
Management, 16(7), 491-500.
de Barros, A.C., Leitão, R. and Ribeiro, J., 2014. Design and evaluation of a mobile user interface for older adults: navigation, interaction and visual design recommendations. Procedia Computer Science, 27, pp.369-378.
Design Council, Royal College of Arts, 2013. Available from: http://www.designcouncil.info (18 July
2014)
Design for All Foundation, 2003. Design for All Foundation. Available from: www.designforall.org (1 October 2014).
Dickinson, A., Newell, A. F., Smith, M. J., and Hill, R. L., 2005. Introducing the Internet to the over-60s: Developing an email system for older novice computer users. Interacting with Computers, 17(6), 621-642.
Disabled World (TM), 2012.World Facts and Statistics on Disabilities and Disability Issues. Available at: http://www.disabled-world.com/disability/statistics/#ixzz2HJt698Oj (15 June 2014).
Dixon, N. M., 2000. Common knowledge: How companies thrive by sharing what they know. Harvard Business Press.
Dong, H., Keates, S., and Clarkson, P. J., 2004. Inclusive design in industry: barriers, drivers and the business case. In User-Centered Interaction Paradigms for Universal Access in the Information Society (pp. 305-319). Springer Berlin Heidelberg.
Dong, H., Bobjer, O., McBride, P., and Clarkson, P. J., 2006. Inclusive product design: Industrial case studies from the UK and Sweden. Contemporary Ergonomics, 2006, 338-342.
Downton, P., 2003. Design Research. Melburne: RMIT University Press.

297
Duffy, A. H., and O’Donnell, F. J., 1998. A model of product development performance. In Designers (pp. 269-283). Springer, London.
Dwyer, L. and Darcy, S., 2008. Chapter 4–Economic contribution of disability to tourism in Australia. Technical report, 90040, pp.15-21.
Eisma, R., Dickinson, A., Goodman, J., Mival, O., Syme, A., and Tiwari, L., 2003, March. Mutual
inspiration in the development of new technology for older people. In Proceedings of Include (Vol. 7, pp. 252-259).
Ehn, P., 1988. Work-oriented design of computer artifacts (Doctoral dissertation, Arbetslivscentrum). Elton, E. and Nicolle, C.A., 2010. The importance of context in inclusive design. ESCAP, 2000.Barrier-free tourism for people with disabilities in the ESCAP region. Bali – Indonesia,
s.n.
European Commission. The 2012 ageing report: Underlying assumptions and projection methodologies, Joint Report prepared by the European Commission’s Directorate-General for Economic and Financial Affairs and the Economic Policy Committee; 2011.
Executive, S., 2001. For Scotland’s children: Better integrated children’s services. The Stationery Office, Edinburgh. Executive, S., 2001, March. British Council, Scotland Europa, and BTA (2001) Culture and tourism–
Are we talking the same language. Report of the cultural tourism seminar held on.
Fallman, D., 2008. The interaction design research triangle of design practice, design studies, and design exploration. Design Issues, 24(3), 4-18.
Fiore, A.M., Kim, J. and Lee, H.H., 2005. Effect of image interactivity technology on consumer
responses toward the online retailer. Journal of Interactive Marketing, 19(3), pp.38-53. Floch, J., and Jiang, S., 2015, September. One place, many stories digital storytelling for cultural
heritage discovery in the landscape. In 2015 Digital Heritage (Vol. 2, pp. 503-510). IEEE.
Fluker, M.R. and Turner, L.W., 2000. Needs, motivations, and expectations of a commercial whitewater rafting experience. Journal of Travel Research, 38(4), pp.380-389.
Fodness, D., 1994. Measuring tourist motivation. Annals of tourism research, 21(3), 555-581.
Fodness, D., 2016. The problematic nature of sustainable tourism: some implications for planners and managers. Current Issues in Tourism, 1-13.
Fox, J. E., Mockovak, W., Fisher, S. K., and Rho, C., 2004. Usability issues associated with
converting establishment surveys to web-based data collection. STATISTICAL POLICY, 63. Frankel, L., 2009. Communicating design research knowledge: A role for ethnographic writing.
International Association of Societies of Design Research: Design/Rigor and Relevance. IASDR, 3507-3516.
Frayling, C., 1993. Research in Art and Design. Royal College of Art Research Papers. London:
Royal College of Art.
Friedman, K., 2003. Theory construction in design research: criteria: approaches, and methods. Design studies, 24(6), 507-522.
Frye, A., 2013. Bridging the Gap between Theory and Practice. Trends in Universal Design, p.58.

298
Fuglerud, K. S., and Sloan, D., 2013, July. The link between inclusive design and innovation: some key elements. In International Conference on Human-Computer Interaction (pp. 41-50). Springer Berlin Heidelberg.
Fuglerud, K. S., Halbach, T., and Tjøstheim, I., 2015. Cost-benefit analysis of universal design. Literature review and suggestions for future work. Oslo: Norsk Regnesentral.
Garcia, A., Vansteenwegen, P., Arbelaitz, O., Souffriau, W., and Linaza, M. T. 2013. Integrating public transportation in personalised electronic tourist guides. Computers and Operations Research, 40(3), 758-774.
Geissler, G. L., Rucks, C. T., and Edison, S. W. 2006. Understanding the role of service convenience in art museum marketing: An exploratory study. Journal of Hospitality and Leisure Marketing, 14(4), 69-87.
Gedenryd, H., 1998. How designers work-making sense of authentic cognitive activities (Vol. 75). Cognitive Science.
George, W., 2005. Commodifying local culture for rural community tourism development: Theorizing
the commodification process. USA: Mount Saint Vincent University. Gerkovich, P., 2005. Generation X and Work/Life Values. The Network News: A Work-Family News
Publication, 7(2). Gill, J., and Perera, S. 2003, April. Accessible universal design of interactive digital television. In
Proceedings of the 1st European conference on interactive television: from viewers to actors (pp. 83-89).
Gjorgievski, Mijalce, and Sinolicka Melles Trpkova. 2012. Movie induced tourism: A new tourism phenomenon. UTMS Journal of Economics 3 (1): 97–104.
Göbel, S., de Carvalho Rodrigues, A., Mehm, F., and Steinmetz, R., 2009. Narrative game-based learning objects for story-based digital educational games. narrative, 14, 16.
Goddard, N., and Nicolle, C., 2012. What is good design in the eyes of older users?. In Designing inclusive systems (pp. 175-183). Springer London.
Goldman, K. H., Schaller, D. T., and Adventures, E. W., 2004. Exploring motivational factors and visitor satisfaction in on-line museum visits. In In D. Bearman and J. Trant (Eds.), Museums and the Web 2004.
Goodall, B., 1988. How tourists choose their holidays: An analytical framework. Marketing in the tourism industry: The promotion of destination regions, 1, pp.1-17.
Greene, H., Koh, K., Bonnici, J., and Chase, J., 2015. The Value of Storytelling in the Marketing
Curriculum. Journal of the Academy of Business Education, 16, 111.
Guttentag, D. A., 2010. Virtual reality: Applications and implications for tourism. Tourism Management, 31, 637–651.
Halewood, C., and Hannam, K., 2001. Viking heritage tourism: authenticity and commodification. Annals of tourism research, 28(3), 565-580.
Hall, M.C. and Williams, A. eds., 2008. Tourism and innovation. Routledge.
Hays, S., Page, S. J., and Buhalis, D., 2013. Social media as a destination marketing tool: its use by national tourism organisations. Current issues in Tourism, 16(3), 211-239.
Harris Interactive Market Research. 2006. Research among adults with disabilities: travel and
hospitality. Chicago: Open Doors Organization. Hein, H. S., 2014. The museum in transition: A philosophical perspective. Smithsonian Institution.

299
Henderson, K. A., Stalnaker, D., and Taylor, G., 1988. The relationship between barriers to recreation and gender-role personality traits for women. Journal of leisure research.
Herbert, D.T., Prentice, R.C. and Thomas, C.J., 1989. Heritage sites: strategies for marketing and development. Avebury.
Herrero, L. C., Sanz, J. Á., Devesa, M., Bedate, A., and Del Barrio, M. J., 2006. The Economic Impact of Cultural Events A Case-Study of Salamanca 2002, European Capital of Culture. European urban and regional studies, 13(1), 41-57.
Hill, J., 2004. UK film policy, cultural capital and social exclusion. Cultural Trends, 13(2), 29-39.
Hiranyahat, R., 2001. Method of development to increase the potential of cultural villages for tourism: A case study of Ban Nong Kao, Ta Muang District, Kanjanaburi Province [in Thai]. Unpublished doctoral thesis, Srinakharinwirot University, Thailand.
Hjalager, A.M., 2002. Repairing innovation defectiveness in tourism. Tourism management, 23(5), pp.465-474.
Holcomb, B., 1999. Marketing Cities for Tourism. The tourist city, 54.
Howard, V. A., 2001. Funding the arts: an investment in global citizenship?. Journal of Aesthetic Education, 35(4), 83-95.
Hung, C. M., Hwang, G. J., and Huang, I., 2012. A Project-based Digital Storytelling Approach for Improving Students' Learning Motivation, Problem-Solving Competence and Learning Achievement. Educational Technology and Society, 15(4), 368-379.
Hill, R., Betts, L. R., and Gardner, S. E., 2015. Older adults’ experiences and perceptions of digital technology:(Dis) empowerment, wellbeing, and inclusion. Computers in Human Behavior, 48, 415-423.
Holzinger, A., Geier, M., and Germanakos, P., 2012. On the Development of Smart Adaptive User Interfaces for Mobile e-Business Applications-Towards Enhancing User Experience-Some Lessons Learned. In DCNET/ICE-B/OPTICS (pp. 205-214).
Hsu, C. H., Cai, L. A., and Wong, K. K., 2007. A model of senior tourism motivations—Anecdotes from Beijing and Shanghai. Tourism Management, 28(5), 1262-1273.
Huang, L., and Tsai, H. T., 2003. The study of senior traveler behavior in Taiwan. Tourism Management, 24(5), 561-574.
Hudson, S., and Ritchie, J. R., 2006. Promoting destinations via film tourism: An empirical identification of support- ing marketing initiatives. Journal of Travel Research, 44(4), 387–395.
Huh, C. and Singh, A.J., 2007. Families travelling with a disabled member: Analysing the potential of an emerging niche market segment. Tourism and Hospitality Research, 7(3-4), pp.212-229.
ICOMOS Charter on Cultural Tourism, 1976. Available from
http://www.icomos.org/tourism/tourism_charter.html (1 June 2014)
ICOMOS Charter for Cultural Tourism, 1997. Available from: http://www.icomos.org/tourism/ (1 June 2014)
Inclusive Design Reseach Centre, OCAD University, 2013. Available from: http://idrc.ocad.ca/index.php/about-the-idrc/49-resources/online-resources/articles-and-papers/443-whatisinclusivedesign (18 July 2014)
Inclusive Design Toolkit, University of Cambridge, 2013. Available from: www.inclusivedesigntoolkit.com (20 July 2014)
Iwashita, C., 2008. Roles of films and television dramas in international tourism: The case of

300
Japanese tourists to the UK. Journal of Travel and Tourism Marketing, 24(2), 139–151.
Jakes, D. S. and Brennan, J., 2005. Capturing stories, capturing lives: An introduction to digital storytelling. Available from http://www.jakesonline.org/dstory_ice.pdf. (10 Febuary 2015).
Jang, S. S., and Wu, C. M. E., 2006. Seniors’ travel motivation and the influential factors: An examination of Taiwanese seniors. Tourism management, 27(2), 306-316.
Jönsson, C., and Devonish, D., 2008. Does nationality, gender, and age affect travel motivation? A case of visitors to the Caribbean island of Barbados. Journal of Travel and Tourism Marketing, 25(3-4), 398-408.
Jones, J. G., 2002, March. Enhancing instructor and learner interactions using created realities technologies. Austin, TX: Created Realities Group.
Kaelber, L., 2007. A Memorial as Virtual Traumascape: Darkest Tourism in 3D and Cyber-Space to the Gas Chambers of Auschwitz. Ertr, e Review of Tourism Research, 5(2), 24-33.
Kale, S., R. McIntyre and K. Weir., 1997. Marketing Overseas Tour Packages to the Youth Segment: An Empirical Analysis. Journal of Travel Research, Vol. 25, No. 4, pp 20-24.
Kang, N. E., and Yoon, W. C., 2008. Age-and experience-related user behavior differences in the use of complicated electronic devices. International Journal of Human-Computer Studies, 66(6), 425-437.
Kantawateera, K., Naipinit, A., Sakolnakorn, T. P. N., and Kroeksakul, P., 2014. The satisfaction of tourists and policy guidelines for tourism development in Khon Kaen, Thailand. Asian Social Science, 10(6), 53.
Kapodini-Dimitradi, E., 1999. Developing Cultural Tourism in Greece. In M. Robinson and P. Boniface
(Eds.) Tourism and Cultural Conflicts (pp.113-127), Wallingford: CABI.
Kasemsarn, K. and Nickpour, F., 2016. A conceptual framework for inclusive digital storytelling to increase diversity and motivation for cultural tourism in Thailand. Studies in health technology and informatics, 229, pp.407-415.
Kavoura, A., and Katsoni, V., 2013. From e-business to c-commerce: collaboration and network
creation for an e-marketing tourism strategy. Tourismos, 8(3), 113-128. Kay, P. L., Wong, E., and Polonsky, M. J., 2009. Marketing cultural attractions: understanding non-
attendance and visitation barriers. Marketing Intelligence and Planning, 27(6), 833-854.
Keil, J., Pujol, L., Roussou, M., Engelke, T., Schmitt, M., Bockholt, U., and Eleftheratou, S., 2013, October. A digital look at physical museum exhibits: Designing personalized stories with handheld Augmented Reality in museums. In Digital Heritage International Congress (DigitalHeritage), 2013 (Vol. 2, pp. 685-688). IEEE.
Kennedy, D. W., Austin, D. R., and Smith, R. W., 1991. Special recreation: opportunities for persons with disabilities. Saunders College Publishing.
Keogh, B., 1990. Public participation in community tourism planning. Annals of Tourism Research, 17(3), 449-465.
Kim, J. H., 2007. Exploring motivation and tourist typology: The case of Korean golf tourists travelling
in the Asia Pacific (pp. 1-318). Canberra, ACT: University of Canberra.
Kim, K., Uysal, M., and Sirgy, M. J., 2013. How does tourism in a community impact the quality of life of community residents?. Tourism Management, 36, 527-540.
Kim, J. H., and Ritchie, J. B., 2014. Cross-cultural validation of a memorable tourism experience scale (MTES). Journal of Travel Research, 53(3), 323-335.

301
Kim, H., Cheng, C. K., and O’Leary, J. T., 2007. Understanding participation patterns and trends in tourism cultural attractions. Tourism management, 28(5), 1366-1371.
Kirchberg, V., 1998. Entrance fees as a subjective barrier to visiting museums. Journal of Cultural Economics, 22(1), 1-13.
Kirkpatrick, D L., 1998. Evaluating Training Programs: The Four Levels (2nd edition).
Kjeldskov, J., and Graham, C., 2003. A review of mobile HCI research methods. Human-computer interaction with mobile devices and services, 317-335.
Klaus, P. and Maklan, S., 2012. EXQ: a multiple-item scale for assessing service experience. Journal
of Service Management, 23(1), pp.5-33. Klironomos, I., Antona, M., Basdekis, I. and Stephanidis, C., 2005. EDeAN secretariat for 2005 White
Paper: Promoting Design For All and e-Accessibility in Europe Universal Access in the Information Society. International Journal, 5(1).
Kobayashi, M., 2012. A digital storytelling project in a multicultural education class for pre-service
teachers. Journal of Education for Teaching, 38(2), 215-219.
Kotler, P., Bowen, J., Makens, J.C., Moreno, R.R. and Paz, M.D.R., 2003. Marketing para turismo. McGraw-Hill.
Kozak, M., 2002. Comparative analysis of tourist motivations by nationality and destinations. Tourism
management, 23(3), 221-232.
Krauss, I., 2011. Manifestations of Universal Design in Germany, Universal Design Handbook. McGrawHill. New York.
Kravchyna, V. and Hastings, S., 2002. Informational value of museum web sites. Available from. (1 January 2015).
Krippendorf, J., 1987. The holidaymakers: Understanding the impact of leisure and travel. London: Heinemann-Butterworth.
Kurniawan, S., 2008. Older people and mobile phones: A multi-method investigation. International Journal of Human-Computer Studies, 66(12), 889-901.
Kuusisto, S., 2006. eavesdropping: a Memoir of Blindness and Listening. WW Norton & Company.
Langdon, P., Persad, U., and Clarkson, P. J., 2010. Developing a model of cognitive interaction for analytical inclusive design evaluation. Interacting with Computers, 22(6), 510-529.
Lambert, J., 2013. Digital storytelling: Capturing lives, creating community. Berkeley, CA, Digital Diner.
Laomee, B. (2009). Conservation and restoration of pulpits through the participation of Phu Thai people in Isan [in Thai]. Unpublished doctoral thesis, Mahasarakham University, Thailand.
Lazar, J., Feng, J. H., and Hochheiser, H., 2017. Research methods in human-computer interaction. Morgan Kaufmann.
Laslett, P., 1991. A fresh map of life: The emergence of the third age. Harvard University Press. Law, E. L. C., Roto, V., Hassenzahl, M., Vermeeren, A. P., and Kort, J., 2009, April. Understanding,
scoping and defining user experience: a survey approach. In Proceedings of the SIGCHI Conference on Human Factors in Computing Systems (pp. 719-728). ACM.
Lee, J., Graefe, A.R. and Burns, R.C., 2007. Examining the antecedents of destination loyalty in a forest setting. Leisure Sciences, 29(5), pp.463-481.
302
Lee, T. H., 2013. Influence analysis of community resident support for sustainable tourism development. Tourism Management, 34, 37-46.
Lepisto, L.R., 1985. A life-span perspective of consumer behavior. ACR North American Advances. Lewis, J.R., 1993. Multipoint scales: Mean and median differences and observed significance levels.
International Journal of Human-Computer Interaction, 5(4), pp.383-392.
Lida, Y., 2005. Beyond the ‘feminization of masculinity’: transforming patriarchy with the ‘feminine’in contemporary Japanese youth culture. Inter-Asia Cultural Studies, 6(1), pp.56-74.
LLC, Mandala Research., 2013. The Cultural and Heritage Traveller 2013 Edition. Tourism Travel and
Research Association: Advancing Tourism Research Globally 10.
Lockton, D., 2013. Design with intent: a design pattern toolkit for environmental and social behaviour change (Doctoral dissertation, Brunel University School of Engineering and Design PhD Theses).
Longhi, C., 2009. Internet and organisation of the industry in Tourism: a focus on the distribution of
travel and tourism services. International journal of leisure and tourism marketing, 1(2), pp.131-151.
Lord, G. D., 1999, September. The power of cultural tourism. In a Keynote Presentation presented at
the Wisconsin Heritage Tourism Conference. LaGrow, S., Wiener, W., and LaDuke, R., 1990. Independent travel for developmentally disabled
persons: A comprehensive model of instruction. Research in developmental disabilities, 11(3), 289-301.
Lambert, J., 2013. Digital storytelling: Capturing lives, creating community. Routledge. Langdon, P., Clarkson, P. J., and Robinson, P. (Eds.)., 2008. Designing inclusive futures. Springer
Science and Business Media. Law, E. L. C., Roto, V., Hassenzahl, M., Vermeeren, A. P., and Kort, J., 2009, April. Understanding,
scoping and defining user experience: a survey approach. In Proceedings of the SIGCHI Conference on Human Factors in Computing Systems (pp. 719-728). ACM.
Lepp, A. and Gibson, H., 2003. Tourist roles, perceived risk and international tourism. Annals of
tourism research, 30(3), pp.606-624. Lewis, G. B., and Brooks, A. C., 2005. A question of morality: Artists' values and public funding for the
arts. Public Administration Review, 65(1), 8-17. Lord, G. D., 1999. The power of cultural tourism. Wisconsin Heritage Tourism Conference.
Lund, A. M., 2001. Measuring usability with the use questionnaire12. Usability interface, 8(2), 3-6.
Mace, R. L., 1998. The Evolution of Universal Design,” keynote speech presented at Designing for the 21st Century: An International Conference on Universal Design, June 19, 1998, Hempstead, N.Y.
Madden, C., 2001. Using ‘economic’impact studies in arts and cultural advocacy: A cautionary note. Media International Australia Incorporating Culture and Policy, 98(1), 161-178.
MANLEY, D., 1986. New design for old: An exhibition of new products designed to help older people stay independent at home... held at the boilerhouse, Victoria and Albert museum, from 29th May to 3rd July, 1986.

303
Marsh, T., Sim, J. J., and Chia, D., 2014. Entertainment and Language Learning: Voice Activated Digital Game and Interactive Storytelling Trials in Singapore Schools. ICEC, 217-219.
Martin, B.S, Bridges, W.C and Valliere, W, 2004. Are Cultural Heritage Visitors Really Different from Other Visitors?. Tourism Analysis, 9(1-1), 129-134.
Marty, P.F., 2007. Museum websites and museum visitors: Before and after the museum visit. Museum Management and Curatorship. 22 (4). 337-60.
Mayo, E.J. and Jarvis, L.P., 1981. The psychology of leisure travel. Effective marketing and selling of travel services. CBI Publishing Company, Inc..
McGinley, C. G., 2012. Supporting people-centred design through information and empathy (Doctoral
dissertation, Brunel University School of Engineering and Design PhD Theses). Mcguire, J.M., Scott, S.S. and Shaw, S.F., 2006. Universal design and its applications in educational
environments. Remedial and special education, 27(3), pp.166-175. McKee, R., 2003. Storytelling that moves people: A conversation with screenwriting coach, Robert
McKee. Harvard Business Review. 80. 51–55.
McKercher, B., 2002. Towards a classification of cultural tourists. International journal of tourism research, 4(1), 29-38.
McLellan, H., 2006. Digital storytelling in higher education. Journal of Computing in Higher Education.
19 (1). 65-79.
Medilk, S.) ('Dictionary of Travel, Tourism and Hospitality Terms', 1996Routledge; 3 edition,
Meekaew, N., and Srisontisuk, S., 2012. Chiangkhan: cultural commodification for tourism and its impact on local community. In International Conference on Knowledge, Culture and Society, Jeju Island, South Korea.
Meyer-Hentschel, H. and Meyer-Hentschel, G., 2004. Seniorenmarketing. Generationsgerechte Entwicklung und Vermarktung von Produkten und Dienstleistungen. Göttingen: BusinessVillage.
Michael, D. R., and Chen, S. L., 2005. Serious games: Games that educate, train, and inform. Muska
and Lipman/Premier-Trade.
Michael, M., and Chen, S., 2006. Serious games: Games that educate, train and inform. Boston, MA: Thomson Course Technology.
Michopoulou, E., Darcy, S., Ambrose, I. and Buhalis, D., 2015. Accessible tourism futures: the world we dream to live in and the opportunities we hope to have. Journal of Tourism Futures, 1(3), pp.179-188.
Mieczkowski, Z., 1995. Environmental issues of tourism and recreation. University Press of America.
Migliorino, P., and Cultural Perspectives. 1998. The World is Your Audience: Case Studies in Audience Development and Cultural Diversity, Australia Council for the Arts, Sydney, Australia.
Migliorini, P., 1998. The World is Your Audience: Case Studies in Audience Development and Cultural Diversity. Redfern, Sydney: Australia Council.
Mikropoulos, T. A., 2006. Presence: a unique characteristic in educational virtual environments. Virtual Reality. 10. 197–206.
Miller, C. H., 2004. Digital Storytelling: A Creator's Guide to Interactive Entertainment. Amsterdam and Boston: Focal Press.

304
Miller, C. H., 2012. Digital Storytelling: A Creator's Guide to Interactive Entertainment. Amsterdam and Boston: Focal Press.
Milner, L. M., JAGO, L. K., and DEERY, M., 2004. Profiling the special event nonattendee: An initial investigation. Event Management, 8(3), 141-150.
Mohammad, B. A. M. A. H., and Som, A. P. M., 2010. An analysis of push and pull travel motivations of foreign tourists to Jordan. International Journal of Business and Management, 5(12), 41.
Morris, J. M., 1992, March. The effects of an introductory computer course on the attitudes of older adults towards computers. In ACM SIGCSE Bulletin (Vol. 24, No. 1, pp. 72-75). ACM.
Moscardo, G., 2001. Cultural and heritage tourism: the great debates. Tourism in the twenty-first century: Reflections on experience, 3-17.
Mowforth, M., and Munt, I., 2015. Tourism and sustainability: Development, globalisation and new
tourism in the third world. Routledge. Muller, D. A., Eklund, J., and Sharma, M. D., 2006. The future of multimedia learning: Essential issues
for research. Available from http://www.aare.edu.au/05pap/mul05178.pdf. (20 January 2015).
Myerscough, J., 1988. The economic importance of the arts in Britain. Policy Studies Institute.
National Heritage Board – NHB., 2005. More than 170,000 youths reached by the national heritage board, Newsletter. Available from: http://www.nhb.gov.sg/NHBPortal/. (10 April 2015)
Nasar, J.L. and Evans-Cowley, J., 2007. Universal design and visitability: From accessibility to zoning.
Nasing, P. S., Rodhetbhai, C., and Keeratiburana, Y., 2014. A Model for the Management of Cultural
Tourism at Temples in Bangkok, Thailand. Asian Culture and History, 6(2), 242.
National Statistical Office., 2015. Population and Society. Available from: http://web.nso.go.th/en/stat_theme_socpop.htm (10 April 2015)
Nesteruk, J., 2014. Digital Storytelling Bringing Humanistic Inquiry to Management Studies. Journal of
Management Education, 1052562914545335.
Neulinger, J., 1974. “THE PSYCHOLOGY OF LEISURE” RESEARCH APPROACHES TO THE STUDY OF LEISURE. Springfield, I, 11, 295-306.
Newell, A.F. and Gregor, P., 2000, November. “User sensitive inclusive design”—in search of a new paradigm. In Proceedings on the 2000 conference on Universal Usability (pp. 39-44). ACM.
Nickpour, F., 2012. Information behaviour in design (Doctoral dissertation, Brunel University School of
Engineering and Design PhD Theses).
Nonaka, I., Konno, N., 2008. Narrative approach for storategies. Hitotbashi Business Review. 2008 AUT. 110–125.
O’Connell, T. and Goldberg, L. 2011. UNIVERSAL DESIGN IN MEDIA, Universal Design Handbook. McGrawHill. New York.
O'Leary, J.T., Morrison, A.M. and Alzua, A., 1998. Cultural and heritage tourism: Identifying niches for international travellers. Journal of tourism studies, 9(2), p.2.
O'Neill, M. and Knight, J., 2000. Disability tourism dollars in Western Australia hotels. Hospitality
Review, 18(2), p.7. OECD. 2009. Annual Report 2009 ORGANISATION FOR ECONOMIC CO-OPERATION AND
DEVELOPMENT. Available from www.oecd.org. (2 Janaury 2015).
Ohler, J., 2006. The world of digital storytelling. Educational Leadership. 63 (4), 44–7.

305
Ohler, J. B., 2013. Digital storytelling in the classroom: New media pathways to literacy, learning, and creativity. Corwin Press
Opaschowski, H.W., 2001. Das gekaufte Paradies–Tourismus im 21. Jahrhundert. Hamburg. Open Mind Research Group, 2006. Cultural Participation: Overview of Research Findings. Open Mind
Research Group, Melbourne.
Oppermann, M., 2000. Tourism destination loyalty. Journal of travel research, 39(1), pp.78-84. Orso, V., Spagnolli, A., Gamberini, L., Ibañez, F., and Fabregat, M. E., 2015, September. Involving
older adults in designing interactive technology: the case of SeniorCHANNEL. In Proceedings of the 11th biannual conference on Italian SIGCHI Chapter (pp. 102-109). ACM.
Ozturk, Y., Yayli, A., and Yesiltas, M., 2008. Is the Turkish tourism industry ready for a disabled
customer's market?: The views of hotel and travel agency managers. Tourism management, 29(2), 382-389.
Pagán, R., 2012. Time allocation in tourism for people with disabilities. Annals of Tourism Research,
39(3), pp.1514-1537. Paquet, E. and Viktor, H. L., 2005. Long-term preservation of 3-D cultural heritage data related to
architectural sites. In: ISPRS 3D Virtual Reconstruction and Visualization of Complex Architectures, Mestre-Venice, Italy, 22–24 August 2005.
Pakpinpet, S., 2008. Method for development of cultural tourism among Pao Yao people (Iewmien): A case study of Ban Huai Chompoo, Mueang District, Chiang Rai Province [in Thai]. Bangkok: Rangsit University.
Paul, N., and Fiebich, C., 2005. The elements of digital storytelling. Internet document available at http://www. inms. umn. edu/elements.
Pathak, K. P., 2014. Paradigm Shift in Tourists Behavior and Its Impact on Tourism Area Life Cycle: A Study on Sundarbans. DU Journal of Marketing, 15, 187-206.
Pausch R., Snoddy J., Taylor R., Watson S., Haseltine E., 1996. Disney's Aladdin: First Steps Towards Story-telling in Virtual Reality. . In Proceedings of the 23rd annual conference on Computer graphics and interactive techniques. ACM. 193-203
Payne, A., Cole, K., Simon, K., Goodmaster, C., and Limp, F. Designing the Next Generation Virtual Museum: Making 3D Artifacts Available for Viewing and Download.
Pearce, P.L., Morrison, A. and Rutledge, J., 1998. Tourism: Bridges across continents. McGraw-Hill. Peischl, B., Ziefle, M., and Holzinger, A., 2012. A Mobile Information System for Improved Navigation
in Public Transport (pp. 217-221). DCNET/ICE-B/OPTICS.
Phillips, J. J., and Phillips, P. P., 2016. Handbook of training evaluation and measurement methods. Routledge.
Pontis, S., 2010. Types and approaches of (Design) research. Sheilapontis. wordpress. com. Porter, B., 2005. The art of digital storytelling. Revista Discovery Education. www. unitedstreaming.
com.
Pozzebon, A., and Calamai, S., 2015, September. Smart devices for Intangible Cultural Heritage fruition. In Digital Heritage, 2015 (Vol. 1, pp. 333-336). IEEE.
Prebensen, N.K., Woo, E., Chen, J.S. and Uysal, M., 2012. Experience quality in the different phases of a tourist vacation: A case of northern Norway. Tourism Analysis, 17(5), pp.617-627.

306
Preiser, W.F., 2010. Toward Universal Design Performance Assessments. Universal Design Handbook, 2E, p.38.
Preiser, W.F. and Ostroff, E., 2001. Universal design handbook. McGraw Hill Professional. Prentice, R., Davies, A., and Beeho, A., 1997. Seeking generic motivations for visiting and not visiting
museums and like cultural attractions. Museum management and curatorship, 16(1), 45-70.
Prusak, L., 2001. Why storytelling at this particular time?. In: Museums and the Web 2005, Proceedings, Archives and Museum Informatics. Vancouver, British Columbia, Canada, 13-16 April 2011.
Pujol, L., Roussou, M., Poulou, S., Balet, O., Vayanou, M., and Ioannidis, Y., 2012, March. Personalizing interactive digital storytelling in archaeological museums: the CHESS project. In 40th annual conference of computer applications and quantitative methods in archaeology. Amsterdam University Press.
Pullin, G., 2009. Design meets disability. MIT press. Qiongli, W., 2006. Commercialization of digital storytelling: An integrated approach for cultural
tourism, the Beijing Olympics and wireless VAS. International Journal of Cultural Studies. 9. 383–394.
Raggam, K. and Almer, A., 2005. Acceptance of geo-multimedia applications in Austrian tourism organisations. Information and Communication Technologies in Tourism 2005, pp.46-56.
Rains, S., 2007. Inclusive tourism; A new strategic alliance for the disability rights movement. The
Rolling Rains Report, ICAT, pp.22-24. Rains, S., 2009. Inclusive tourism: Participant/observer notes on the global paradigm shift toward
solutions. Neurology in the Third Millennium: From Disability to Social Reinsertion, Milan, Italy, April, 17.
Rand, D., Zeilig, G., and Kizony, R., 2015. Rehab-let: touchscreen tablet for self-training impaired
dexterity post stroke: study protocol for a pilot randomized controlled trial. Trials, 16(1), 277.
Ray, N.M. and Ryder, M.E., 2003. “Ebilities” tourism: an exploratory discussion of the travel needs and motivations of the mobility-disabled. Tourism Management, 24(1), pp.57-72.
Reisinger, Y. and F. Mavondo., 2002. Determinants of Youth Travel Markets' Perceptions of Tourism
Destinations, Tourism Analysis, Vol. 7, No. 1, pp 55-66. Resnick, M., 2008. Sowing the Seeds for a More Creative Society. Learning and Leading with
Technology, 35(4), 18-22.
Riley, R.W. and Van Doren, C.S., 1992, “Movies as tourism promotion – a ‘pull’ factor in a ‘push’ location”, Tourism Management, Vol. 3 3 September, pp. 267-74.
Rentschler, R., 2006. Mix It Up project report: building new audiences. Centre for Leisure Management Research, Deakin University, Melbourne.
Ricci, F., Rokach, L., and Shapira, B., 2011. Introduction to recommender systems handbook (pp. 1-35). Springer US.
Richards, G. (Ed.)., 2007. Cultural Tourism: Global and local perspectives. Routledge.
Richards, V., Pritchard, A. and Morgan, N., 2010. (Re) Envisioning tourism and visual impairment. Annals of Tourism Research, 37(4), pp.1097-1116.
Rizvic, S., Sadzak, A., Hulusic, V., Karahasanovic, A., 2012. Interactive Digital Storytelling in the
Sarajevo Survival Tools Virtual Environment. In: Proceedings of the 28th Spring Conference on Computer Graphics. ACM. 109-116

307
Rizvic, S., Sadzak, A., Hulusic, V., and Karahasanovic, A., 2013, March. Interactive digital storytelling in the sarajevo survival tools virtual environment. In Proceedings of the 28th Spring Conference on Computer Graphics (pp. 109-116). ACM.
Robin, B. R., 2008. Digital storytelling: A powerful technology tool for the 21st century classroom. Theory Into Practice. 47. 220-228.
Robson, C., and McCartan, K., 2016. Real world research. John Wiley and Sons. Romsa, G., and Blenman, M., 1989. Vacation patterns of the elderly German. Annals of Tourism
Research, 16(2), 178-188. Rogers, W. A., Fisk, A. D., McLaughlin, A. C., and Pak, R., 2005. Touch a screen or turn a knob:
Choosing the best device for the job. Human Factors, 47(2), 271-288.
Roque, N. A., and Boot, W. R., 2016. A New Tool for Assessing Mobile Device Proficiency in Older Adults The Mobile Device Proficiency Questionnaire. Journal of Applied Gerontology, 0733464816642582.
Rose, C., and Graesser, C. C., 1981. Adult Participation in Lifelong Learning Activities in California.
Rose, D.H. and Meyer, A., 2002. Teaching every student in the digital age: Universal design for learning. Association for Supervision and Curriculum Development, 1703 N. Beauregard St., Alexandria, VA 22311-1714.
Roussuo, M., 2004. Learning by doing and learning through play: an exploration of interactivity in virtual environments for children. Computers in Entertainment. 2 (1). 10-10.
Rovinelli, R. J., and Hambleton, R. K., 1976. On the use of content specialists in the assessment of criterion-referenced test item validity.
Russell, C., Campbell, A., and Hughes, I., 2008. Research: Ageing, social capital and the Internet: Findings from an exploratory study of Australian ‘silver surfers’. Australasian Journal on Ageing, 27(2), 78-82.
Russo, A. and Watkins, J., 2005. Digital cultural communication: Enabling new media and cocreation in southeast asia. International Journal of Education and Development using Information and Communication Technology. 1(4). 2005.
Rust, C., Mottram, J., and Till, J., 2007. Review of practice-led research in art, design and architecture.
Ryan, P., 2008. The Storyteller in Context: Storyteller Identity and Storytelling Experience.
Storytelling, Self, Society. 4(2). 64-87.
Saldaña, J., 2015. The coding manual for qualitative researchers. Sage.
Salpeter, J., 2005. Telling Tales with Technology: Digital Storytelling Is a New Twist on the Ancient Art of the Oral Narrative. Technology and Learning, 25(7), 18.
Samdahl, D. M., and Jekubovich, N. J., 1997. A critique of leisure constraints: Comparative analyses and understandings. Journal of leisure research, 29(4), 430.
Samuel, A., and Lewis, W., 2001. Curiosity-oriented research in engineering [core](design). WDK Publications, 37-44.
Sarıca, H. Ç., and Usluel, Y. K., 2016. The effect of digital storytelling on visual memory and writing
skills. Computers and Education, 94, 298-309.
Sarvas, R., and Frohlich, D. M., 2011. From snapshots to social media-the changing picture of domestic photography. Springer Science and Business Media.
Schafer, L., 2008. Investigations on digital storytelling: The development of a reference model. VDM Publishing.

308
Shaw-Lawrence, P., 1999. Enabling the disabled. Travel Weekly, 59(91), p.8. Schon, D. A., 1983. The reflective practitioner. How professionals think in action. Temple Smith,
London
Schouten, F. F., 1995. Heritage as historical reality. Heritage, tourism and society, 21-31. Sedgley, D., Pritchard, A. and Morgan, N., 2011. Tourism and ageing: A transformative research
agenda. Annals of Tourism Research, 38(2), pp.422-436.
Shaw, G., and Coles, T., 2004. Disability, holiday making and the tourism industry in the UK: a preliminary survey. Tourism Management, 25(3), 397-403.
Shi, L., 2010. Understanding leisure travel motivations of frequent travelers with mobility impairments.
Show Taiwan Android application, 2013. Available from http://www.androidapps.biz/app/show.taiwan (15 August 2016)
Silberberg, T., 1995. Cultural tourism and business opportunities for museums and heritage sites. Tourism management, 16(5), 361-365.
Smeral, E., 2003. A structural view of tourism growth. Tourism Economics, 9(1), pp.77-93. Song, K. S. and Lee, W. Y., 2002. A virtual reality application for geometry classes. Journal of
Computer Assisted Learning. 18. 149–156.
Spicer, S., and Miller, C., 2014. An exploration of digital storytelling creation and media production skill sets in first year college students. International Journal of Cyber Behavior, Psychology and Learning (IJCBPL), 4(1), 46-58.
Standard, B., 2005. 7000-6: Design management systems. Guide to managing inclusive design. British Standards Institute, London, UK.
Stebbins, R.A., 1996. Cultural tourism as serious leisure. Annals of tourism research, 23(4), pp.948-950.
Stedr application, 2016. Available from http://stedr.blogspot.co.uk (1 September 2016)
Steinfeld, E. and Shea, S.M., 2001. Fair housing: Toward universal design in multifamily housing. Universal design handbook, pp.35-1.
Stoddard, J., Davé, D., Evans, M., and Clopton, S. W., 2006. Economic impact of the arts in a small
US county. Tourism Economics, 12(1), 101-121.
Stern, N., 2006. What is the economics of climate change?. WORLD ECONOMICS-HENLEY ON THAMES-, 7(2), p.1.
Steuer, J., 1992. Defining virtual reality: Dimensions determining telepresence. Journal of
communication, 42(4), pp.73-93. Subrahmanian, E., Reich, Y., Konda, S. L., Dutoit, A., Cunningham, D., Patrick, R., and Westerberg,
A. W., 1997, September. The n-dim approach to creating design support systems. In Proc. of ASME Design Technical Conf.
Sumi, K., 2010. Learning Story Marketing through Practical Experience of Story Creation System. In:
Third Joint Conference on Interactive Digital Storytelling, ICIDS 2010, Edinburgh, UK, 1-3 November 2010.
Sundstedt, V., Chalmers, A., and Martinez, P., 2004. High fidelity reconstruction of the ancient Egyptian temple of Kalabsha. In: Proceedings of the 3rd International Conference on

309
Computer Graphics, Virtual Reality, visualisation and Interaction in Africa. New York: ACM Press.107-113.
Suni, J., and Komppula, R., 2012. SF-Filmvillage as a Movie Tourism Destination—A Case Study of Movie Tourist Push Motivations. Journal of Travel and Tourism Marketing, 29(5), 460-471.
Swanson, S. R., and Davis, J. C., 2006. Arts patronage: a social identity perspective. Journal of Marketing Theory and Practice, 14(2), 125-138.
Swain, M.B., 1995. A comparison of state and private artisan production for tourism in Yunnan. Tourism in China: geographic, political, and economic perspectives., pp.223-233.
Swap, W., Leonard, D., Shields, M., and Abrams, L., 2001. Using mentoring and storytelling to transfer knowledge in the workplace. Journal of Management Information Systems. 18(1). 95-114.
Tang, J. C., 1991. Findings from observational studies of collaborative work. International Journal of Man-machine studies, 34(2), 143-160.
Tauke, B., and D. Schoell.2010. The LIFEhouse Project, RERC on Universal Design. University at
Buffalo. N.Y.
The Centre for Digital Storytelling, 2013. Available from: www.storycenter.org (20 July 2014)
The gas chambers of Auschwitz, 2007. Available from http://panorama.auschwitz.org/tour1,2904,en.html (20 February 2015)
The Ohio State University, 2010. What is digital storytelling. Available from:
http://digitalstory.osu.edu/storytelling.html (1 June 2014).
The Sarajevo Survival Tools virtual environment, 2009. Available from http://h.etf.unsa.ba/srp/project.htm (20 February 2015)
The University of Houston, 2013. Available from: www.digitalstorytelling.coe.uh (20 July 2014)
The Virtual Museum of Iraq, 2009. Available from http://www.virtualmuseumiraq.cnr.it/homeENG.htm ( 10 February 2015)
The Virtual Smithsonian tour, 2002. Panoramic Virtual Tour. Available from http://www.mnh.si.edu/panoramas (20 February 2015)
Thomas, W. A. and Carey, S., 2005. Actual/Virtual Visits: What are the Links? In: International Conference on Museums and the Web 2005, Vancouver, British Columbia, Canada.
Tian, S., Crompton, J. L., and Witt, P. A., 1996. Integrating constraints and benefits to identify responsive target markets for museum attractions. Journal of Travel Research, 35(2), 34-45.
Timothy, D. J., 1997. Tourism and the personal heritage experience. Annals of Tourism Research, 24(3), 751-754.
Tsai, H. Y. S., Shillair, R., Cotten, S. R., Winstead, V., and Yost, E., 2015. Getting grandma online:
Are tablets the answer for increasing digital inclusion for Older Adults in the US?. Educational gerontology, 41(10), 695-709.
Tenh, H. K., Shiratuddin, N., and Harun, H., 2012. Core elements of digital storytelling from experts’ perspective.
Todman, J., and Drysdale, E., 2004. Effects of qualitative differences in initial and subsequent computer experience on computer anxiety. Computers in Human Behavior, 20(5), 581-590.
Tolva, J. and Martin, J., 2004. Making the transition from documentation to experience: The eternal egypt project. In: ICHIM 04 - Digital Culture and Heritage / Patrimoine and Culture Numrique In International Cultural Heritage Informatics Meeting Proceedings. 1–25.
Tooke, N., and Baker, M., 1996. Seeing is believing: The effect of film on visitor numbers to screened locations. Tourism Management, 17(2), 87–94.

310
Tsephe, N. P., and Obono, S. E., 2013, January. A theoretical framework for rural tourism motivation factors. In Proceedings of World Academy of Science, Engineering and Technology (No. 73, p. 1001). World Academy of Science, Engineering and Technology (WASET).
Uncles, M.D., Dowling, G.R. and Hammond, K., 2003. Customer loyalty and customer loyalty
programs. Journal of consumer marketing, 20(4), pp.294-316. UNESCO, 2003. Baltic Cultural Tourism Policy Paper. [Online]. Available
from:http://portal.unesco.org/culture/en/files/23640/11033006043bct_short1.pdf/bct_short1.pdf [Accessed 19 April, 2015]
UNWTO, 2008. International Recommendations for Tourism Statistics Draft Compilation Guide Madrid, March 2011 Statistics and Tourism Satellite Account Programme. [Online]. Available from: http://unstats.un.org/unsd/tradeserv/egts/CG/IRTS%20compilation%20guide%207%20march%202011%20-%20final.pdf. [Accessed 21 April 2015].
Upright, C. B., 2004. Social capital and cultural participation: spousal influences on attendance at arts events. Poetics, 32(2), 129-143.
U.S. Department of Education, Institute of Education Sciences. 2003, December. Identifying and implementing educational practices supported by rigorous evidence: A user friendly guide. Washington, DC.
Valentine, G., Holloway, S., and Bingham, N., 2002. The digital generation?: Children, ICT and the everyday nature of social exclusion. Antipode, 34(2), 296-315.
Vayanou, M., Karvounis, M., Katifori, A., Kyriakidi, M., Roussou, M., and Ioannidis, Y. E., 2014. The CHESS Project: Adaptive Personalized Storytelling Experiences in Museums. In UMAP Workshops.
Veal, A. J., 2006. Research methods for leisure and tourism: A practical guide. Pearson Education.
Yamane T., 1967. Elementary sampling theory. Englewood Cliffs, NJ, USA: Prentice-Hall Inc.
Yau, M. K. S., McKercher, B., and Packer, T. L., 2004. Traveling with a disability: More than an access issue. Annals of Tourism Research, 31(4), 946-960.
Yin, R. K., 2009. Case study research: Design and Methods. SAGE publications. Thousand oaks. You, X., O'leary, J., Morrison, A., and Hong, G. S., 2000. A cross-cultural comparison of travel push
and pull factors: United Kingdom vs. Japan. International Journal of Hospitality and Tourism Administration, 1(2), 1-26.
Waller, S., Bradley, M., Hosking, I. and Clarkson, P.J., 2015. Making the case for inclusive design. Applied ergonomics, 46, pp.297-303.
Walsh, C.J., 2004, December. Rio de Janeiro declaration on sustainable social development,
disability & ageing. In Designing for the 21st Century III-an international conference on universal design.
Wang, Y., and Bramwell, B., 2012. Heritage protection and tourism development priorities in
Hangzhou, China: A political economy and governance perspective. Tourism Management, 33(4), 988-998.
Wasson, C., 2000. Ethnography in the field of design. Human organization, 59(4), 377-388. Webster, C., and Ivanov, S., 2014. Transforming competitiveness into economic benefits: Does
tourism stimulate economic growth in more competitive destinations?. Tourism Management, 40, 137-140.

311
Wales, P., 2012. Telling tales in and out of school: youth performativities with digital storytelling. Research in Drama Education: The Journal of Applied Theatre and Performance, 17(4), pp.535-552.
Wells, W. and Burnett, J., S. Moriarty (2000). Advertising-Principles and practice. Westcott, J., 2004. Improving information on accessible tourism for disabled people. Office for Official
Publications of the European Communities. Wexler, L., Eglinton, K., and Gubrium, A., 2014. Using digital stories to understand the lives of Alaska
Native young people. Youth and Society, 46(4), 478-504.
Willmott, M. and Graham, S., 2001. The world of today and tomorrow: the European picture. Tourism and Hospitality in the 21st Century, pp.29-38.
Williams, K.Y. and O'Reilly III, C.A., 1998. DEMOGRAPHY AND. Research in organizational
behavior, 20, pp.77-140. Wither, J., Allen, R., Samanta, V., Hemanus, J., Tsai, Y. T., Azuma, R., and Korah, T., 2010, October.
The westwood experience: connecting story to locations via mixed reality. In 2010 IEEE International Symposium on Mixed and Augmented Reality-Arts, Media, and Humanities (pp. 39-46). IEEE.
Worden, A., Walker, N., Bharat, K., and Hudson, S., 1997, March. Making computers easier for older adults to use: area cursors and sticky icons. In Proceedings of the ACM SIGCHI Conference on Human factors in computing systems (pp. 266-271). ACM.
World Tourism Organization UNWTO., 2011. Understanding Tourism: Basic Gloss. Available fromhttp://media.unwto.org/en/content/understanding-tourism-basic-glossary (3 February
Wu, Y. C. J., Chang, C. L., and Hsieh, Y. J., 2014. Enhancing Learning Experience of the Disabled: An Accessible Tourism Platform. J. UCS, 20(15), 2080-2095.
Xia, M., 1999. From camaraderie to the cash nexus: Economic reforms, social stratification and their political consequences in China. Journal of Contemporary China, 8(21), pp.345-358.
Yang, Y. T. C., and Wu, W. C. I., 2012. Digital storytelling for enhancing student academic
achievement, critical thinking, and learning motivation: A year-long experimental study. Computers and Education, 59(2), 339-352.
Yang, Y. T. C., and Chang, C. H., 2013. Empowering students through digital game authorship: Enhancing concentration, critical thinking, and academic achievement. Computers and Education, 68, 334-344.
Yuan, S. and McDonald, C., 1990. Motivational determinates of international pleasure time. Journal of Travel Research, 29(1), pp.42-44.
Yuksel, A., Yuksel, F. and Bilim, Y., 2010. Destination attachment: Effects on customer satisfaction
and cognitive, affective and conative loyalty. Tourism management, 31(2), pp.274-284. Zimmerman, J., Forlizzi, J., and Evenson, S., 2007, April. Research through design as a method for
interaction design research in HCI. In Proceedings of the SIGCHI conference on Human factors in computing systems (pp. 493-502). ACM.

312
Appendix A1: Research ethics
Barriers and Drivers in Cultural Tourism for Five Groups in Thailand – mentioned in Chapter 4

313
Appendix A2: Research ethics
Constructing the Digital Storytelling: Guideline to Increase Motivation in Cultural Tourism for Five Groups in Thailand – mentioned in Chapter 5

314
Appendix A3: Research ethics
Inclusive digital storytelling to understand audiences’ behaviour – mentioned in Chapter 6

315
Appendix A4: Research ethics
Evaluation of an Inclusive Digital Storytelling for Cultural Tourism (IDST for CT) Framework – mentioned in Chapter 7

316
Appendix B1: Questionnaire – mentioned in Chapter 4
PARTICIPANT INFORMATION SHEET
Barriers and Drivers in Cultural Tourism for
Five Groups in Thailand You are being invited to take part in a research event. Ask us if there is anything that is not clear or if you would like more information. Take time to decide whether or not you wish to take part. What is the purpose of this project? The aim of this questionnaire is to investigate what are their barriers and drivers in cultural tourism for five different groups in Thailand. Do I have to take part? It is up to you to decide whether or not to take part. If you do decide to take part you will be given this information sheet to keep. If you decide to take part you are still free to withdraw at any time without giving a reason. What will happen to me if I take part? You will be invited to complete a questionnaire. We will ask questions about your why you travel and do not travel in cultural tourism in Thailand. What are the possible benefits of taking part? The results of this study will be used as a part of my PhD research to create an inclusive digital storytelling framework to increase motivation and diversity in cultural tourism, and help future studies in the area of digital storytelling, inclusive design and cultural tourism. Will my taking part in this project be kept confidential? All information that is collected from you during this research will be kept strictly confidential. What will happen to the results of the research project? The research findings will be communicated to designers and researchers wanting to gain insights into engaging the public with Inclusive Design and issues related to that. Event researcher: Kittichai Kasemsarn If you have any queries about this research please contact – Kittichai Kasemsarn Inclusive Design Research Group, Human Centred Design Institute Brunel University, Uxbridge, UB8 3PH; Tel: 074 72657643; E-mail [email protected]

317
Research Participation and Image Consent Form
Barriers and Drivers in Cultural Tourism for
Five Groups in Thailand I …………………………………………………………………………………..have read the
information on the research project which is to be conducted by Mr. Kittichai Kasemsarn and
all queries have been answered to my satisfaction.
I agree to participate voluntarily in this event and give my consent freely. I understand that the event will be conducted in accordance with the Information Sheet, a copy of which I have retained.
I understand that I can withdraw from the project at any time, without penalty, and do not have to give a reason for withdrawing.
I consent to:
• Participate in a recorded research event • I understand that all information gathered will be stored securely and my opinions will be
accurately transcribed.
Print name……………………………………………………………..
Signature………………………………………………………………….
Date ………………………………………………………………………
This project will be conducted in compliance with the Research Ethics Code of Brunel University

318
• The target audiences of this survey are: 1.) Youth; 2.) Non cultural tourist; 3.) Older adult and 4.)
People with disabilities and 5.) Cultural tourists.
• The aim of this questionnaire is to investigate what are their barriers and drivers in cultural tourism.
• This survey should only take 5-10 minutes. All answers are confidential and complete anonymity is
assured. Please check or mark the appropriate box for each question or write an answer in blanks
provided.
Cultural tourism means
“Travelling with cultural motivations or purposes (e.g. museums, heritage places, monuments, temples, cultural events, festivals)”.
Mass tourism means
“The destinations with a massive of tourists on holiday (e.g. sunbathing, visiting a theme park, hiking, beach)”.
“Barriers and Drivers in Cultural Tourism for Five Groups in Thailand”
Kittichai Kasemsarn; PhD student, Brunel University, London

319
Part 1: Demographic profile
1. Gender Male Female
2. Age 15-17 18-22 23-25 26-34 35-45 46-59 60-65 66-75 76-85 85+
3. Education Primary/ Secondary High school Diploma/ Certificate Undergraduate Post-graduate or above Others
4. Marital status Single Married Others (please specify)…………
5. Type of Disability* (only for people with disabilities)
Locomotion Reaching and streching Dexterity Seeing Hearing Communication I Intellectual functioning
6. Monthly income (Thai bath) Below 5,000 bath 5,000 – 10,000 bath 10,001 – 20,000 bath 20,001 – 30,000 bath 30,001 – 50,000 bath Above 50,000 bath
7. How many days did you spend for ‘cultural tourism’ (e.g. museums, heritage places, temples, cultural events, festivals) in Thailand in the last year?
Never 1-3 days/ year 4-6 days/ year 7-9 days/ year Above 9 days/ year
8. How many days did you spend for ‘mass tourism’ (e.g. sunbathing, visiting a theme park, hiking, travelling to other cities) in Thailand in the last year?
Below 5days/ years 5-9 days/ year 10-14 days/ year 15-20 days/ year Above 20 days/ year

320
Part 2 Barriers in cultural tourism Cultural tourism means “movements of persons for cultural motivations such as study tours, performing arts and cultural tours,
travel to festivals and other cultural events, visits to sites and monuments”
What do you dislike about cultural tourism?
…………………………………………………………………………………………………...
What stops you from doing cultural tourism related activity?
……………………………………………………………………………………………………
Please tell us up to three reasons why you may ‘NOT’ do cultural tourism in Thailand? (e.g. historical places, museums, temples, etc.)
1…………………………………………………………………………………………………. 2…………………………………………………………………………………………………. 3………………………………………………………………………………………………….
Please read each of the statement below and select on the scale provided.
Please tell us why you may ‘NOT’ do cultural tourism in Thailand? (e.g. historical places, museums, temples, etc.)
Strongly Disagree 1
2
3
4
5
6
Strongly agree 7
Uncomfortable experience, not entertaining
Not relevant or of interest; have different interests
Old and unfashionable No time to attend Inconvenience of opening times and activity schedules
No past engagement Poor past experience No information where to go Physical well-being Medical problems No concession pricing Overall costs and supplementary costs
Fear to travel alone Fear of hassles Embarrassing aspects of visible disabilities
Interactions of individuals and social environments

321
No self-confidence Poor quality offerings Only for education and information Security concerns Physically difficult to get to Difficult public transport to access Architectural barriers (e.g. cramped seating areas and unwieldy doors at hotels)
Accessible accommodation on airplanes, at hotels and at restaurants
Service of staff
Part 3 Drivers in cultural tourism
What do you like about cultural tourism?
…………………………………………………………………………………………………...
What encourages you from doing cultural tourism related activity?
……………………………………………………………………………………………………
Please tell us up to three reasons why you may ‘DO’ cultural tourism in Thailand? (e.g. historical places, museums, temples, etc.)
1…………………………………………………………………………………………………. 2…………………………………………………………………………………………………. 3………………………………………………………………………………………………….
Please read each of the statement below and select on the scale provided
Please tell us why you may ‘Do’ cultural tourism in Thailand? (e.g. historical places, museums, temples,
etc.)
Strongly Disagree 1
2
3
4
5
6
Strongly agree 7
New experience and different lifestyle Meeting new and different people Personal reward Visiting a place that I have not visited before
Getting away from home or mundane environment
Seeking adventure Increasing knowledge about foreign destination, people and things
Education/ learning Just relaxing Spending time with family/ friends Visiting historical/cultural sites

322
Interesting/ unique culture or environment
Prestige, pride and patriotism Nostalgia Recommendation from friends/acquaintances
Pre-trip information Attractive and contemporary presentation
Advertising from media Engaging online communities Location/accessibility/distance or nearness
Convenience of transportation Low cost/expenses (cheap food/accommodation/other facilities)
Outstanding scenery Online museums, applications or websites
Animation, VDO presentation, short movie
Video game about cultural stories

323
Appendix B2: Interview questions – mentioned in Chapter 5
PARTICIPANT INFORMATION SHEET
“Guidelines of digital storytelling to increase motivation in cultural tourism for five groups
in Thailand”
You are being invited to take part in a research event. Ask us if there is anything that is not clear or if you would like more information.
Take time to decide whether or not you wish to take part.
What is the purpose of this project?
The aim of this questionnaire is to propose a digital storytelling guideline to motivate five groups for cultural tourism.
Do I have to take part?
It is up to you to decide whether or not to take part. If you do decide to take part you will be given this information sheet to keep and be
asked to sign a consent form indicating your willingness to be involved. If you decide to take part you are still free to withdraw at any time
without giving a reason.
What will happen to me if I take part?
You will be invited to share your experiences and comments. In section A, we will interview about how to use each digital storytelling
element to motivate five different groups to be interested in cultural tourism. In section B, we will ask you to evaluate how important of each
digital storytelling element in a questionnaire.
What are the possible benefits of taking part?
The results of this study will be used as a part of my PhD research to create an inclusive digital storytelling framework to increase
motivation and diversity in cultural tourism, and help future studies in the area of digital storytelling, inclusive design and cultural tourism.
Will my taking part in this project be kept confidential?
All information that is collected from you during this research will be kept strictly confidential.
What will happen to the results of the research project?
The research findings will be communicated to designers and researchers wanting to gain insights into engaging the public with Inclusive
Design and issues related to that.
Event researcher: Kittichai Kasemsarn. If you have any queries about this research please contact – Kittichai Kasemsarn: Inclusive
Design Research Group, Human Centred Design Institute , Brunel University, Uxbridge, UB8 3PH; Tel: 074 72657643; E-mail

324
Research Participation and Image Consent Form
“Guidelines of digital storytelling to increase motivation in cultural tourism for five groups
in Thailand”
I …………………………………………………………………………………..have read the
information on the research project which is to be conducted by Mr. Kittichai Kasemsarn and
all queries have been answered to my satisfaction.
I agree to participate voluntarily in this event and give my consent freely. I understand that the event will be conducted in accordance with the Information Sheet, a copy of which I have retained.
I understand that I can withdraw from the project at any time, without penalty, and do not have to give a reason for withdrawing.
I consent to:
• Participate in a recorded research event • The audio or photographing of my contribution to the research • The use of this audio and any still images in which I can clearly be identified by the
Inclusive Design Research Group at Brunel University for purposes of research and publication and the sharing of this interview.
I understand that all information gathered will be stored securely and my opinions will be accurately transcribed.
Print name……………………………………………………………..
Signature………………………………………………………………….
Date ………………………………………………………………………
This project will be conducted in compliance with the Research Ethics Code of Brunel University

325
Section A: Demographic profile
Section B: Interview The aim of this section is to illustrate how to use digital storytelling elements to increase motivation in cultural tourism for five different groups. This section should take approximately 45 minutes, and will focus on suggesting each core element of digital storytelling to motivate cultural tourism for five groups.
Throughout this interview, please remember that you can choose to withdraw from this study at any time without having to give any reason.
Keywords Definition Digital storytelling A short medium which uses personal digital
technology to combine a number of media into a coherent narrative (Ohler, 2013)
Cultural tourism “Movements of persons for essentially cultural motivations such as study tours, performing arts and cultural tours, travel to festivals and other cultural events, visits to sites and monuments” (The World Tourism Organization - UNWTO, 2008).
Demographic profile
1. Name
2. Gender
3. Age
4. Highest Education and where
5. Occupation
6. Academic position (for a lecturer)
7. How long have you work in the area of digital storytelling (years)
Guidelines of digital storytelling to increase motivation in cultural tourism for five groups in Thailand Kittichai Kasemsarn; PhD student, Brunel University, London

326
Section B: Interviews The aim of this section is to illustrate how to use digital storytelling elements to increase motivation in cultural tourism for five different groups.
Q1 What ‘The storyteller’s point of view’ (the 1st or 3rd point of view) will you use in digital storytelling to increase motivation in cultural tourism for five different groups and why?
Q2 What style of ‘A key question’ (The main concept or a question that will be answered by the end. For example, what is the origin of Thai people?) will you use in digital storytelling to increase motivation in cultural tourism for five different groups and why?
Q3 What ‘purposes’ (such as to initially understand the meaning of cultural tourism, to be impressed or to lead them going out…) will you set up in digital storytelling to increase motivation in cultural tourism for five different groups?
Q4 What style of ‘Emotional Content’ (high-low, stable-swing emotions or mood -tone feelings) will you use in digital storytelling to increase motivation in cultural tourism for five different groups?
Q5 What style of ‘Story structure’ (basic – one or no climax or many climaxes) will you use in digital storytelling to increase motivation in cultural tourism for five different groups?
Q6 What ‘Economy’ (the level of amount of information – high, moderate, low) will you use in digital storytelling to increase motivation in cultural tourism for five different groups and why?
Q7 What style of ‘The rhythm of the story’ (slow, moderate or fast rhythm) will you use in digital storytelling to increase motivation in cultural tourism for five different groups and why?
Q8 Is it necessary to use ‘The storyteller’s voice’ and what style of voice will you use in digital storytelling to increase motivation in cultural tourism for five different groups?
Q9 What style of ‘Soundtrack’ will you use in digital storytelling to increase motivation in cultural tourism for five different groups?
Q10 What ‘Media’ will you use in digital storytelling to increase motivation in cultural tourism for five different groups and why?
Q11 What ‘Background’ (The real, surreal, fantasy world or locations) will you set up in digital storytelling to increase motivation in cultural tourism for five different groups and why?
Q12 Is there anything else you want to tell me about or comments you want to make?
Q13 Is there anything you wish I would have asked you or spoken about that didn’t come up during this interview?

327
Appendix B3: Observation Schedule – mentioned in Chapter 6
PARTICIPANT INFORMATION SHEET
“Inclusive digital storytelling to understand audiences’ behaviour”
You are being invited to take part in a research event. Ask us if there is anything that is not clear or if you would like more information. Take time to decide whether or not you wish to take part.
What is the purpose of this project?
The aim of this observation is to understand diverse audiences in terms of reaching (accessibility and understanding) and engaging with (usefulness, usability, desire) digital storytelling on digital mobile devices.
Do I have to take part?
It is up to you to decide whether or not to take part. If you do decide to take part you will be given this information sheet to keep and be asked to sign a consent form indicating your willingness to be involved. If you decide to take part you are still free to withdraw at any time without giving a reason.
What will happen to me if I take part?
You will be invited to share your experiences and comments about; 1.) reaching (accessibility and understanding) – how you use mobile devices to access DST and barriers and drivers in each stage; 2.) engaging (usefulness, usability, desire) - how you understand, prefer and are motivated from DST
What are the possible benefits of taking part?
The results of this study will be used as a part of my PhD research to create an inclusive digital storytelling framework to increase motivation and diversity in cultural tourism, and help future studies in the area of digital storytelling, inclusive design and cultural tourism.
Will my taking part in this project be kept confidential?
All information that is collected from you during this research will be kept strictly confidential.
What will happen to the results of the research project?
The research findings will be communicated to designers and researchers wanting to gain insights into engaging the public with Inclusive Design and issues related to that.
Event researcher: Kittichai Kasemsarn. If you have any queries about this research please contact –Kittichai Kasemsarn: Inclusive Design Research Group, Human Centred Design Institute , Brunel University, Uxbridge, UB8 3PH; Tel: 074 72657643; E-mail [email protected]

328
Research Participation and Image Consent Form
Inclusive digital storytelling to understand audiences’ behaviour
I …………………………………………………………………………………..have read the
information on the research project which is to be conducted by Mr. Kittichai Kasemsarn and
all queries have been answered to my satisfaction.
I agree to participate voluntarily in this event and give my consent freely. I understand that the event will be conducted in accordance with the Information Sheet, a copy of which I have retained.
I understand that I can withdraw from the project at any time, without penalty, and do not have to give a reason for withdrawing.
I consent to:
• Participate in a recorded research event • The audio/video taping or photographing of my contribution to the research • The use of this footage and any still images in which I can clearly be identified by the
Inclusive Design Research Group at Brunel University for purposes of research and publication and the sharing of this footage.
I understand that all information gathered will be stored securely and my opinions will be accurately transcribed.
Print name……………………………………………………………..
Signature………………………………………………………………….
Date ………………………………………………………………………
This project will be conducted in compliance with the Research Ethics Code of Brunel University

329
Observation Schedule: Inclusive digital storytelling to understand audiences’ behaviour
Part 1: Demographic profile
Name Gender Age Education Monthly income Type of disability How many days did you spend for ‘cultural tourism’ last year
How many days did you spend for ‘mass tourism’ last year
Part 2: Observation
Observation ScheduleNo. Activities Checklists Results 1. Unlocking a
mobile device
- Give an iPad mini 1 to the participants - Ask them to unlock the screen to access the home page
Accessibility Understanding Usefulness Usability Desirability
2. Opening the ‘YouTube’ application
- Ask the users to find the Youtube icon on the first page of IPad - Click the icon to open the Youtube application
Accessibility Understanding Usefulness Usability Desirability
3. Accessing the ‘Search’ icon
- Ask them to find the ‘Search’ icon to search for videos on Youtube - Click the ‘Search’ icon to open the search panel
Accessibility Understanding Usefulness Usability Desirability
4. Typing the - Ask them to type Accessibility

330
movie title the movie tile ‘I hate Thailand’ on the search panel
Understanding Usefulness Usability Desirability
5. Clicking on the ‘Play’ icon and watching the movie
- Ask them to click on the ‘Play’ icon and watch the video - Ask them to comment on every issue when watching (understand or not; like or dislike, etc.)
Accessibility Understanding Usefulness Usability Desirability
6. Closing the movie window
- Ask them to find the ‘Close’ icon - Click the ‘Close’ icon to turn off the video window
Accessibility Understanding Usefulness Usability Desirability
7. Accessing the ‘Search’ icon
- Ask them to find the ‘Search’ icon in Youtube again (round 2) - Click the ‘Search’ icon to open the search panel
Accessibility Understanding Usefulness Usability Desirability
8. Typing the animation title
- Ask them to type the animation tile ‘Jinxy Jenkins, Lucky Lou’ on the search panel
Accessibility Understanding Usefulness Usability Desirability
9. Clicking on the ‘Play’ icon and watching the animation
- Ask them to click on the ‘Play’ icon and watch the animation - Ask them to comment on every issue when watching (understand or not; like or dislike, etc.)
Accessibility Understanding Usefulness Usability Desirability
10. Closing the animation window
- Ask them to find the ‘Close’ icon - Click the ‘Close’ icon to turn off the
Accessibility Understanding Usefulness Usability Desirability

331
video window 11. Closing the
application - Ask them to find the ‘Close’ icon - Click the ‘Close’ icon to turn off the Youtube application
Accessibility Understanding Usefulness Usability Desirability

332
Appendix B4: Online questionnaire – mentioned in Chapter 7

333

334

335

336

337

338

339
Appendix C1: Applications of cultural tourism – mentioned in Chapter 2
● Urbanisation: The population of cities (megalopolises), currently at more
than 10 million people, is estimated to increase to approximately 30 million (United
Nations, 2005). Therefore, managing large cities will be a problem in the future. As a
result, travellers will tend to favour holidaying away from crowds, and to travel
globally. Moreover, congestion in both industrialised and developing countries will
lead to a tendency to escape and/or to indulge in tourism (UNWTO, 2002).
● Changing social structures: Changing social structures will increase
because of generation Y, the largest and most diverse demographic (Gerkovich,
2005). Moreover, the concept of the family holiday will remain, but there will be
growth in tourism for retired persons and for single people.
● Health: In the future, people will become increasingly concerned about their
health and well-being. Moreover, greater value will be given to de-stressing and self-
medicating (Pollock and Williams, 2000). Therefore, this trend will give rise to a
demand for a combination of health and travel. In addition, developed countries will
experience a blurring of working life and retirement (Cetron, 2001).
● Changing work patterns: People now tend to work flexibly, and will not
sacrifice their personal life for their careers. Significantly, the distinction between
work and leisure may blur. In summary, changing work patterns will lead to more
flexibility of travel plans (Gerkovich, 2005).
● Gender: Society tends to be more feminised, since the traditional inequality
between men and women has become less pronounced. Hence, women will have
increasing influence on all types of decisions (Iida, 2005).
In summary, the future trends of cultural tourism are linked to many areas, including
innovation and technology, and economic, political, environmental, demographic,
and social aspects. However, this study focuses on the innovation, technology, and
demographic aspects only.

340
Appendix C2: Applications of inclusive design in economy, industry and media – mentioned in Chapter 2 1. Business
Clarkson et al. (2003) state that inclusive design is accepted as a positive issue of
business strategy and design practice in the United Kingdom. For example, British
Telecommunications (BT) has made a strong commitment to inclusive design and
commissioned the Design Toolkit, a web-based tool for designers to create better
products with user satisfaction and commercial success. However, the business
case for inclusive design raises the problem that it is targeted at a minority group,
because it serves only older and disabled people. Clarkson and Coleman (2013)
recommend that we could integrate some temporary effects such as injury and
pregnancy to strengthen business opportunities. As a result, focusing on this market
through the inclusive design of mainstream products and services could lead to
brand and market advantage. In addition, inclusive design could be used as
innovation for accessibility and usability. Consequently, it could drive companies to
develop interfaces, accessible ICT, and people-friendly environment products and
services. Inclusive design products, services, and environments can benefit all
groups of people and increase business for companies (Clarkson and Coleman, 2013).
2. Economics
Clarkson and Coleman (2013) state that the economic case for inclusive design can
be presented based on two main factors. Firstly, the Potential Support Ratio (PSR),
the number of people aged 15 to 64 who could support one person over 65, has
been declining rapidly, especially in the developed world, because care costs as a
proportion of GDP have been escalating. Secondly, inclusive design in the workplace
can offer the possibility for older adults and people with disabilities to continue
working in gainful employment and extend independent living. This can then lower
care costs and help to stimulate the economy.
Krauss (2011) notes that Germany is facing an increasingly ageing and
simultaneously declining population. In fact, the proportion of those aged over 60
was only 5% in 1900, but today this number has risen to 25% and will reach
approximately 40% by 2050. Hence, because of the increasing proportion of older

341
adults in industrial societies, Krauss (2011) recommends that knowing the needs of older consumers is becoming more important.
Frye (2013) also supports that a strong economic case can support inclusive design;
for example, the demographic trends are one of the compelling factors. In the
countries of the European Union, expenditure on older adults was around 23.1% of
GDP in 2007 and importantly is expected to continue to rise. Moreover, the strong
relationship between age and disability is a key factor, as approximately two thirds of
disabled people are over retirement age. Therefore, solutions that reach everyone’s
needs, based on inclusive design, will provide the most cost-effective solution to the above issues.
3. Social impact
Frye (2013) outlines several social problems related to inclusive design, including
evidence of decline for those older adults who cannot go out alone even within their
own neighbourhood. The reduction in the quality of care, such as medical attention,
and the reduction in nutrition, such as fewer food choices, are also reported. Another
increasingly significant factor is loneliness, due to rapidly changing social patterns.
Many older adults are now living alone; for example, in the UK, this includes more
than 3.7 million people aged over 65. Clarkson and Coleman (2013) also present
strong social cases for inclusive design: (1) the desirability of social cohesion and
inclusivity, and (2) the accessibility of public buildings, spaces, and services that can
support social inclusion.
Clarkson et al. (2003) discuss the fact that there are governments trying to establish
universal design as an important component of the overall planning of the design
process. This concept is reflected in the work of the Norwegian government
beginning in 1997 (Bringa, 2001) who aimed to create a strategy supporting
accessibility as a component of planning for all levels. The state of Queensland in
north eastern Australia also has an integrated model of housing development and
promotes the concept of sustainability. In addition, it has presented ‘the triple bottom-
line concept’ of sustainability, composed of environmental, social, and economic
sustainability. In the United Kingdom, universal design processes were initiated by
the government-supported Commission for Architecture and the Built Environment
(CABE) in 1999. Clarkson et al. (2003) explain that CABE is the government adviser

342
for improving the quality of people’s lives through design in areas such as architecture, urban design, and public space.
Additionally, studies and tests, such as those carried out by the London-based
Research Institute for Consumer Affairs, reveal that products that are researched
and developed with the needs of older adults in mind actually have cross-
generational appeal. This is because the designs are more user-friendly, and as a
result, they can be appreciated by all target groups. However, older adult products
should not look as if they have been produced for ‘old people’, as this can diminish
their appeal (Meyer-Hentschel and Meyer-Hentschel, 2004).
4. Politics
Nowadays, politicians understand and recognise the concepts of inclusive design,
universal design, and design for all as worthy of promotion (Krauss, 2011).
Moreover, they generally support the increase in the social participation of older
adults and people with disabilities. Significantly, companies that consistently adapt
these concepts to develop their products and services could have competitive
advantages.
Krauss (2011) states that several politicians such as the German Federal Minister of
Family Affairs, Senior Citizens, Women, and Youth, and the German Federal
Minister of Economics and Technology, recognise design concepts such as inclusive
design as being important. Significantly, they encourage the advancement of these
design concepts through long-term promotional measures. For example, the Federal
Ministry of Family Affairs, Senior Citizens, Women, and Youth and the Federal
Ministry of Economics and Technology jointly launched “Age: An Economic Factor”
(Wirtschaftsfaktor Alter) in 2008. This project tried to increase older adults’ quality of life, strengthen economic growth, and create jobs.
As Federal Minister Ursula von der Leyen stated, “if we promote products and
services today, which people of all ages use and like, Germany with its rapidly
ageing society has the great opportunity of setting standards and becoming a world
market leader for generation-friendly products, before foreign competitors fill these gaps in the marketplace” (Krauss, 2011).

343
Frye (2013) states that the political issue is the strongest factor in the argument for
inclusive design. This also relates to the urbanisation of the world’s population as a
significant key driver. Since 2008, around half of the world’s population has been
living in urban areas, and that number continues to grow. Moreover, there is
pressure to create ‘liveable’ cities that allow older adults to stay in their own homes.
Frye (2013) explains that there is a related link between the ‘sustainability’ or green
issue and the idea of universal design, as cities continue to become more densely
populated.
5. Education
The report of the President’s Commission on Excellence in Special Education (U.S.
Department of Education, 2002) states that teachers and parents should work
together to provide successful teaching for students with additional needs, proposing
“that all measures used to assess accountability and educational progress be
developed according to principles of universal design” (U.S. Department of
Education, 2002, p. 27). Parents also support universal design as “an increasingly popular approach” for all students (Casper, 2003).
Tauke (2010) also discusses a course named “Beth Tauke’s award-winning Diversity
and Design course” at the University at Buffalo. This course has taught more than
200 students each semester since 2002, and introduced them to eight issues of
diversity: ethnicity, race, class, gender, age, physical ability/disability, mental
ability/disability, and religion. It also provides several classes of design such as
product, media, architectural, and urban design. The course “focuses on the relationship of design to the changing nature of . . . society” (Tauke, 2010).
In relation to written resources, Frank Bowe’s (1999) book Universal Design in
Education: Teaching Non-traditional Students is the first textbook on the principles of
universal design in studying. Prior to this, David Rose set up the Centre for Applied
Special Technology (CAST) in 1984 to develop and apply technologies for disabled
students to access a print-based curriculum. The textbook Universal Design for
Learning (UDL) is a further resource that includes guidelines for UDL in three main
parts: representation, expression, and engagement. In addition, Universal Design for
Instruction (UDI) focuses on college instruction for diverse learners to incorporate inclusive strategies in their teaching (McGuire and Scott, 2006).

344
Appendix C3: Trends in digital storytelling for cultural tourism – mentioned in Chapter 2 Trends in digital storytelling for cultural tourism
v From 2000 to 2010 1. Creating visitor experience
The Sarajevo Under Siege project can recreate via virtual experience the experience
of Sarajevo under siege in 1992–1996 and tell the story using digital storytelling.
Hence, online users can learn about and experience life in Sarajevo during that time.
It presents the creativity and tenacity of Sarajevo’s citizens, who could survive and
defend their city in terrible conditions, such as lack of water, food, electricity and
heating, under a constant threat of danger (Rizvic et al.,2012).
According to the book ‘The Museum in Transition’, museums should transform ‘on
view’ exhibitions into ‘visitor’s experience’ (Hilde, 2000). This idea relates to the
Eternal Egypt project. Tolva and Martin (2004) also state that the goal of museums
must develop from ‘assembling collectibles’ to fostering visitor experience. For this
reason, the Eternal Egypt project adopts digital storytelling, in order to link visitor
experiences and formal information together (Tolva and Martin, 2004). Tolva and
Martin (2004) state that virtual experiences of cultural heritage also benefit from a
storytelling approach as they can be well presented by advanced technologies such
as 3D animation, graphics, movies and high-resolution images.
2. 3D technology One powerful benefit of online museums is the ability to link virtual 3D objects,
stories and information and make the collection searchable. In the future, there might
be new technology that allows users to search for the relevant information from
audio, text, pictures and 3D images (Jones, 2002). Hence, this is a new challenge for
online museums. In the Virtual Museum of Iraq, the use of storytelling with
technology, such as three-dimensional presentations, undoubtedly increases users
interest more than a simple image does (Cultraro et al., 2009). This is because
exhibitions that can be explored interactively are more striking than one-way
communication (Cultraro et al., 2009).
The virtual Smithsonian tour is a good example of the potential for presenting a wide

345
collection of materials to people that may never have the chance to visit the actual
museums (Jones, 2002). It is also a good example of the use of graphic motifs, such
as maps, direction signs and control panels that place the visitor within a context
during their information navigation. Using state-of-the art technology with storytelling,
especially on three-dimensional images, can lead online users to have a new
museum experience (Jones, 2002).
3. Accessibility The gas chambers of Auschwitz (Kaelber, 2007) are hard to reach and physically
inaccessible. Virtual Auschwitz tours using digital storytelling offer this solution to
create the dark tourism experience. By using multimedia and storytelling, online
tourists can experience environments such as the detention camp, killing fields,
death rows and gas chambers (Kaelber, 2007). This suggests that digital storytelling
can enhance a story, present information and create mood and tone behind
physically inaccessible places.
In terms of universal communication, Tolva and Martin (2004) write that one of the
primary goals of the Eternal Egypt project is to provide worldwide access to Egypt’s
cultural heritage. There are five languages offered – English, Italian, Spain, French,
and Arabic. This can be presented as a good example of using digital storytelling as
a universal form of communication.
However, many studies have considered the question, raised by the emergence of
the online museum, ‘‘if visitors can access our digital collections using the Internet,
will they still come to the museum in person?’’ (Marty, 2007, p. 339). In theory, Marty
(2007) suggests that the virtual or online museum should encourage potential
museum visitors to visit the real place, not just plan to do so. Kravchyna and
Hastings (2002) insist that 57 per cent of online users visit museum websites both
before and after visiting the real places. Additionally, 70 per cent of visitors search
for online information before physically going to museums, and 57 per cent of them
state that information on a website can increase motivation to visit in person
(Thomas and Carey, 2005). Moreover, a number of studies support the view that
online museums can increase museum attendance. Online users confirm that the
primary reason for visiting museum websites is to acquire information about the

346
actual museum prior to visiting it (Goldman and Schaller 2004; Chadwick and
Boverie, 1999).
4. Less is more information From the Eternal Egypt project, Tolva and Martin (2004) suggest that an overload of
information and data in online museums can affect a visitor’s subjective experience.
The main challenge is how to simplify complex cultural exhibitions so that they are
not only engaging but also understandable for a variety of online visitors. In the
Virtual Museum of Iraq, the most difficult process for the online museum is the
method of simplifying its contents (Cultraro et al., 2009). In digital storytelling, the
‘less is more’ approach is recommended; but the information presented should not
be too superficial. However, offering too much information can make it feel
redundant to visitors, potentially making them bored. Digital storytelling techniques
can solve this issue by creating shorter and more entertaining content that can speak
to a large variety of diverse of online users.
5. High-speed bandwidth Internet requirements Jones (2002) points out that many of the latest web-enhanced presentations are
geared toward users and institutions that can access newer and higher bandwidth
internet connections. Jones (2002) also suggests that the virtual Smithsonian tour is
a good example of this issue, as it requires at high-speed connections to support
virtual three-dimensional presentations. As such, a majority of citizens in the United
States, particularly users in isolated rural areas, have problems accessing it.
However, as networking technology improves, this problem will affect fewer users.
This issue affects the Eternal Egypt project also. Because of the rich multimedia and
multilingual features of the project, such as zoomable images, up-to-date CCTV and
animations, the application requires an up-to-date web browser and two web
browser plug-ins, Macromedia Flash Player and Quicktime, to be installed. Hence,
not everyone can access the presentations, and it takes a lot of time to update a
browser and install plug-ins in order to meet the minimum browser requirements.
v From 2010 to 2016
1. User experience (UX)

347
Many current applications apply user experience (UX) to design, evaluate and
develop projects (Wither et al., 2010; Pujol et al., 2012; Floch and Jiang, 2015). For
example, in case of CHESS, the project starts by studying the user’s profile,
demographics, interests, cognitive or conceptual change, perception of value and
inspiration. Finally, it creates a specific user model that links between social media
and augmented reality (AR). Pujol et al. (2012) also recommend that the UX process should be tested with real users in real locations with real experiences.
However, Law et al. (2009) suggest that user experience is very subjective and
dynamic over time. There are a number of factors, such as users, trends, society,
period of time and countries. This means there is no specific formula or guideline for
all digital storytelling applications. UX designers should be aware of this issue and test their works personally.
2. Personalisation and sharing on social media Previous interactive storytelling in museums tried to focus on the content on a device
as one content for all users. Nowadays, most cultural heritage museums adopt
personalisation methods. This allows users to give feedback, rate or answer
questions about their interests, and they will then be presented with specific
information matching their interests. The aim of the personalisation is to provide a
smooth experience for each user visiting the museum (Pujol et al., 2012).
For instance, the CHESS project tries to enhance museum visiting in two ways.
Firstly, it focuses on the personalisation of visitors’ information. Secondly, it presents
users with an experience of discovery and wonder. CHESS also emphasises an
experience-oriented and user-centred approach focusing on the user’s needs. In
addition, Show Taiwan also creates user-created contents to tell stories and share
ideas and knowledge between teachers and students. This study concludes that this
process can lead users to explore cultural stories in much greater depth (Chen, Kao and Kuo, 2014).
Floch and Jiang (2015), in the Stedr project, support users’ different interests and
there are many stories and much information online. Most users would like to obtain,
search, filter and personalise the information easily. So, in order to personalise the
application, it is very important to consider their demographic information, needs and history.

348
Moreover, social media is very important; users would like to share the information or
experience with online friends. Moreover, they often wish to follow what interests
them. This is the benefit of sharing on social media (Floch and Jiang, 2015).
Therefore, current cultural media try to support users to customise, personalise and
share their interests on social media rather than just presenting one type of information for all visitors.
3. Mobile device technology Nowadays, the technology in a mobile device’s sensor has greatly developed.
Sensors can provide information such as a compass, the direction of movement of a
device and its GPS location. This technology has been adapted into cultural
applications (Christodoulakis, 2014). For example, we can use a map or a diagram
presenting the surrounding locations and identify the social context (who is near you)
to increase a good experience in cultural tourism (Christodoulakis et al., 2013;
Christodoulakis, 2014). All these applications presented previously – CHESS, Stedr,
Show Taiwan, The Westwood Experience – also adopt the technology in a mobile
device’s sensor to locate users and show maps.
Moreover, beyond 3D technology, 4D visualisation has been presented to integrate a
time factor into the visualisation. For instance, many heritage sites have been
destroyed for hundreds of years, but using 4D can enable users to see the real
building in the real location again to provide a better understanding of cultural
heritage (Tarantilis et al., 2011). The Westwood Experience is a good example of
this. It uses mixed reality (MR) to link the past and the current location. The story is
presented by the mayor of Westwood taking a tour of Westwood in 1949 (Wither et
al., 2010).
Very high technology in mobile devices can combine traditional media and real
location in a way that was previously impossible. For example, augmented reality
(AR) can present stories at the real sites through the camera and screen of a mobile
device. Moreover, mixed reality effects combining video, audio and images in the
real places can virtually present stories of a historical or fictional world linked
between the application and the real world. These technologies can enhance
storytelling at the real cultural locations by bridging the gap between past and
present worlds in a more interesting way than traditional media (Wither et al., 2010).

349
Chen, Kao and Kuo (2014) agree that Show Taiwan adapts this technology to
enhance the location-based guide process by mixing multimedia triggered by users’
movement in the real locations. In addition, The Westwood Experience applies
mixed reality; CHESS and Stedr adopt augmented reality to tell a linear story in the
real location-based experience (Wither et al., 2010; Pujol et al., 2012; Floch and Jiang, 2015)
However, some studies recommend that AR or any technology that needs
presenting on a mobile screen is only suitable for short descriptions, not for longer
stories. Moreover, AR needs users to be at the real time location and will not work
before or after the visit (Keil et al., 2013; Floch and Jiang, 2015). This could lead to
limitations in the use of this technology due to limited time and space issues. In fact,
users should be able to access the website or application when and where they like
(Floch and Jiang, 2015).
4. Keep it simple In the past, just a simple picture with narrative voices or texts or audio with sounds
could be considered to be a form of digital storytelling (Sarvas and Frohlich, 2011).
However, current technology, especially on mobile devices, such as advanced and
complicated method mixing froms, audio, text, video and interactive have changed
more rapidly than content or stories (Floch and Jiang, 2015). Therefore, some
projects only emphasise the latest technology. In addition, the cost of interactive
technology is very expensive. It is better to focus on creating good stories and
content that can be reused on many technology platforms. So focusing on users’
needs and the process of creating contents are very significant to develop guidelines
for creating good content and stories (Floch and Jiang, 2015).
Recommendations from many studies also support telling a very simple story at the
cultural sites rather than focusing on complicated and hi-tech methods (i.e. games,
events or puzzle hunts). Users only need a simple, easy to understand,
uncomplicated story structure (Wither et al., 2010; Pujol et al., 2012; Floch and
Jiang, 2015).