Surfacing, sharing and valuing tacit knowledge in open learning
Upload
independentCategory
view
1download
0
Sustainability 2013, 5, 4961-4987; doi:10.3390/su5124961
sustainability ISSN 2071-1050
www.mdpi.com/journal/sustainability
Communication
A Framework for Implementing and Valuing Biodiversity
Offsets in Colombia: A Landscape Scale Perspective
Shirley Saenz 1,†
, Tomas Walschburger 1,†
, Juan Carlos González 2,†
, Jorge León 1,†
,
Bruce McKenney 3, †
and Joseph Kiesecker 4,†,
*
1 The Nature Conservancy, Calle 67 # 7-84 Piso 3, Bogota 110231, Colombia;
E-Mails: [email protected] (S.S.); [email protected] (T.W.);
[email protected] (J.L.) 2 The Nature Conservancy, Calle Los Naranjos N44-491 Y Azucenas (Sector Monteserrin),
Quito 17-21-1107, Ecuador; E-Mail: [email protected] 3 The Nature Conservancy, 490 Westfield Road, Charlottesville, VA 22901, USA;
E-Mail: [email protected] 4 The Nature Conservancy, 117 East Mountain Avenue, Fort Collins, CO 80524, USA
† These authors contributed equally to this work.
* Author to whom correspondence should be addressed; E-Mail: [email protected];
Tel.: +1-970-484-9898; Fax: +1-970-498-0225.
Received: 5 October 2013; in revised form: 4 November 2013 / Accepted: 6 November 2013 /
Published: 26 November 2013
Abstract: Biodiversity offsets provide a mechanism for maintaining or enhancing
environmental values in situations where development is sought, despite negative
environmental impacts. They seek to ensure that unavoidable deleterious environmental
impacts of development are balanced by environmental gains. When onsite impacts
warrant the use of offsets there is often little attention paid to make sure that the location of
offset sites provides the greatest conservation benefit, ensuring they are consistent with
landscape level conservation goals. In most offset frameworks it is difficult for developers
to proactively know the offset requirements they will need to implement. Here we propose
a framework to address these needs. We propose a series of rules for selecting offset sites
that meet the conservation needs of potentially impacted biological targets. We then
discuss an accounting approach that seeks to support offset ratio determinations based on a
structured and transparent approach. To demonstrate the approach, we present a framework
developed in partnership with the Colombian Ministry of Environment and Sustainable
Development to reform existing mitigation regulatory processes.
OPEN ACCESS

Sustainability 2013, 5 4962
Keywords: biodiversity offsets; compensatory mitigation; landscape scale mitigation;
mitigation hierarchy; sustainable development goals
1. Introduction
Biodiversity offsets are one important tool for maintaining or enhancing environmental values
in situations where development is sought despite negative environmental impacts [1–3]. Offsets are
intended as an option for addressing environmental impacts of development after efforts have been
undertaken to minimize impacts on-site through application of the other steps of the mitigation
hierarchy: avoid, minimize, and restore [4]. They seek to ensure that inevitable negative environmental
impacts of development are balanced by environmental gains. Offset policies for environmental
purposes have gained attention in recent years [3,5,6]. Although the use of offset activity remains
relatively limited, offsets are increasingly employed to achieve environmental benefits, including pollution
control, mitigation of wetland losses, and protection of endangered species [1,3]. Offset activity is
most active for wetlands in the United States (USA), where methods and programs have been under
development for the past two decades. Wetland offsets in the USA have increased dramatically,
from 6000 ha/year in the early 1990s, increasing to an average of over 16,000 ha/year since 1995 [7].
Countries including the United States, Australia, Brazil, Colombia, South Africa, Netherlands, Sweden
and the United Kingdom have established or are developing offset policies to protect both species and
ecosystems. The cumulative influence of advancing these regulatory and voluntary policies is large
and growing [8,9], but interest in offsets is not restricted to governments. Multinational corporations
such as Rio Tinto [10] aim to have a ―net positive impact on biodiversity‖ as part of their biodiversity
strategy, and offsets will play an important role in meeting this objective.
Offsets offer potential benefits for industry, government and conservation groups alike [1–3].
Benefits for industry include a higher likelihood that permission would be granted from regulators for
new operations, greater societal support for development projects, and the opportunity to more
effectively manage environmental risks. Offsets provide governmental regulators with the opportunity
to encourage companies to make significant contributions to conservation, particularly in situations
where legislation does not require mandatory offsets. Conservation organizations can use biodiversity
offsets to move beyond piecemeal mitigation, securing larger scale, more effective conservation
projects. Offsets can also be a mechanism to ensure that regional conservation goals are integrated into
governmental and business planning. When offsets are utilized, the objective is to ensure that offsets
are ecologically equivalent to impacts, are consistent with goals of landscape conservation planning
and will persist at least as long as onsite impacts, resulting in net neutral or positive ecological
outcomes [2,3]. The aim is to identify offsets that will deliver the greatest contribution toward
ecological gains and provide ―additionality‖, an offset’s new contribution to conservation, additional to
existing values. Offsets that restore degraded ecosystems provide a new contribution to conservation
over time as the offset reaches maturity. Offsets that preserve habitat also deliver conservation value
when taking into account real-world conditions and threats, those offsets protect against an expected

Sustainability 2013, 5 4963
background rate of loss. For example, protecting an important habitat that was experiencing
conversion delivers a new contribution to conservation by preventing loss.
While offsets have great potential as a conservation tool, their establishment requires overcoming a
number of conceptual and methodological hurdles [3–11]. When onsite impacts warrant the use of
offsets there is often little attention paid to make certain that the selection of offset sites provides the
greatest conservation benefit, ensuring they are consistent with landscape level conservation goals [12].
In most offset frameworks it is difficult for developers to proactively know the offset requirements
they will need to implement. Current accounting approaches are generally too detailed to be applied
proactively making it difficult to identify situation where offset requirements would be relatively high
and might incentivize developers to avoid impacts instead. They are either too inflexible to address the
ecological context for impacts and offsets, or too open to subjective judgment.
2. Colombia: A Case Study in Offset Design
Colombia is one of the world’s ―megadiverse‖ countries, hosting close to 14% of the planet’s
biodiversity [13–15]. Colombia possesses a rich complexity of ecological, climatic, biological and
ecosystem components. The country has ~41,000 vascular plants, ~479 mammal species, ~1801 bird
species, ~763 amphibian species and ~506 reptile species [16]. Colombia also ranks as one of the
world’s richest countries in aquatic resources, which is partly explained by the fact that the country’s
large watersheds feed into the four massive sub-continental basins of the Amazon, the Orinoquía, the
Magdalena and the Cauca. The largest source of biological diversity is found in the Andean ecosystem,
characterized by a significant variety of endemic species, followed by the Amazon rainforest and the
sub-humid ecosystem in the Choćo bio-geographical area. This varied richness presents Colombia with
a unique opportunity for the implementation of sustainable development initiatives. However,
a considerable part of these natural ecosystems have been transformed for agriculture and cattle
ranching, primarily in the Andean and Caribbean regions. It has been estimated that almost 95% of the
country’s dry forests have been reduced from their original cover.
Like many Latin American countries Colombia’s economy is expected to grow with a rapid pace of
development driven by: agriculture, mining, energy, infrastructure, and housing [17]. Conservation of
the biological diversity in the country is in question, in part, because the Colombian government has
authorized exploration and development in ~24 million hectares of the ~79 million hectares still
remaining in natural land cover [18]. The increase in development forecasted for Colombia though
may yet be compatible with biodiversity if proper consideration is given to mitigation to ensure that
offsets compensate for impacts which may cause habitat loss and fragmentation [18,19].
Past mitigation decisions in Colombia reflect the subjective nature in which offsets have been used.
For example, when offsets have been utilized they only required that offsets provide security for a 3-year
period [18], clearly inadequate to compensate for most development impacts. Little attention too has
been paid to ensure that the offset sites are selected with the intention of accounting for the ecological
equivalency of the impact sites or that offset actions would provide value equal to that lost as a result
of development. For example impacts from mining in low elevation dry forest systems have directed
offset funding towards the planting of fruit trees in high elevation forest headwaters [18]. In addition
the location of offset sites is often not informed by the landscape or watershed priorities [18]. Using a

Sustainability 2013, 5 4964
conservation portfolio that was developed through landscape level planning could identify areas where
development impacts could be compensated for through the use of offsets [12,20,21].
Recognizing the need to improve its existing regulatory framework for mitigation, the Colombian
government asked The Nature Conservancy in 2008 to help develop an approach to guide better
decision making around siting and mitigation of future development [18]. While the Colombian
Ministry of Environment and Sustainable Development (MADS) sought to improve the current
mitigation framework there were constraints to the changes that could be made. For example the
current regulatory process caps the maximum offset to impact ratio at 10 to 1 and any changes we
recommended were limited by this cap. Here, we propose a framework to address the current
deficiencies in offset design and accounting. Our proposed framework for offset site selection includes
using a series of rules developed for selecting offset sites that meet the conservation needs of
potentially impacted biological targets (i.e., size, condition, landscape context). We then discuss an
accounting approach that seeks to support ratio determinations based on a structured and transparent
approach. We focus on five landscapes where development is projected to increase over coming years.
This includes the expansion of coal mining in the Cesar River Valley, gold mining in Sur de Bolivar,
highway development in Macarena, oil and gas development in Casanare and expansion of a sea port
in Bahia Tribuga (Figure 1 and Table 1). Finally, we provide an example from the Cesar River Valley
to illustrate the implementation of this framework.
Table 1. Pilot project site descriptions.
Pilot
Project
Total
Area (ha)
Conservation
Portfolio
Area (ha)
Number
of
Portfolio
Sites
Future
Potential
Development
(ha)
Area within
Conservation
Portfolio
Overlapping with
Future Potential
Development (ha)
Area of Ecological
Systems Impacted
by Future
Potential
Development (ha)
Cold Mining
in Cesar 1,278,600 490,327 24 72,369 3,817 2,518
Gold Mining
in Sur de
Bolivar
1,662,421 959,625 9 701,382 315,497 64,200
Port in Bahia
Tribuga
Choco
343,878 166,007 17 1,639 1,300 11
Macarena
Road in
Meta
809,993 325,107 24 349 103 109
Oil and Gas
in Casanare 1,871,326 715,108 18 687,367 186,758 242,192

Sustainability 2013, 5 4965
Figure 1. Location of development by design pilot projects within Colombia.
3. Selecting Suitable Offset Sites
Our objective with this framework is to ensure that the use of offsets is ecologically equivalent to
impacts and will persist at least as long as onsite impacts. To ensure offset selection results in conservation
outcomes consistent with landscape-level conservation goals we seek to use landscape-level planning
to guide to offset site selection in our 5 pilot landscapes (Figure 1) [21]. We utilized existing landscape
conservation assessments that were available for all of the five pilot project areas and used biological

Sustainability 2013, 5 4966
target lists generated from these analyses as the focus of our offset analyses [22–28]. Landscape-level
conservation planning is the process of locating, configuring and maintaining areas that are managed
to maintain the viability of biodiversity and other natural features [29,30]. A conservation portfolio,
the end product of conservation planning efforts, is a select set of areas that represents the full
distribution and diversity of these systems [31]. The results of landscape-level conservation plans can
be used to guide the application of the mitigation hierarchy [20,32]. Where plans have already been
completed, proposed developments can be mapped and assessed relative to the conservation portfolio.
After appropriate decisions are made regarding which impacts should be avoided or minimized [21],
the portfolio can be used to guide the selection of offset sites. Impacts would be quantified based on
impacts to biological targets identified in the landscape level plan and areas most similar to the impact
site could be selected as offset sites [20].
The landscape conservation plans that we adapted selected a set of focal targets using the
―coarse-filter/fine-filter‖ approach consistent with The Nature Conservancy’s Ecoregional Planning
approach [33]. Coarse filter generally refers to ―ecosystems‖; in a more practical sense, it refers to
mapped units of vegetation. The basic idea is that conserving a sample of each distinct vegetation type,
in sufficient abundance and distribution, is an efficient way to conserve the majority of biological
phenomena in the target area [33]. Fine filter generally refers to individual species, with specific habitat
requirements or environmental relationships that are not adequately captured by the coarse filters [33].
For our offset case studies, we adapted the list of biodiversity features using the coarse filter, fine
filter criteria [22–26]. These biological features were defined using a combination of point survey data,
vegetation cover estimations and predictive model estimations to represent the spatial distribution of
selected targets. For all projects we utilized the national landcover data set with maps produced at the
1:500,000 scale [34]. At the pilot landscape level this was refined to capture the location and
delineation of each ecosystem unit with a remotely sensed exercise focused on each of the five pilot
areas [22–28]. For identification of ecosystems within each pilot landscape, we relied on a 1:100,000
scale land cover map generate with imagery from remote sensing sensors ASTER, and ETM + Landsat,
taken between 2000 and 2008. The maps were obtained through the Landsat and TerraLook collections
held in the USGS archive by using USGS Global Visualization Viewer -GLOVIS-, and remote sensing
sensor Cbers2, obtained from Instituto Nacional de Pesquisas Espaciais (INPE) archive [22–26].
The remotely sensed data along with the national landcover map were used to generate a preliminary
map of ecosystems units [22–26]. Where available, we also utilized ecoregional assessments conducted
by Galindo et al. [27,28].
To select fine filter species targets we started with base species maps produced by NatureServe [35].
We also reviewed ecoregional assessments that were available for all of the five project areas and used
species lists generated from these analyses [22–26]. Where existing species models were not available
we settled on a simple approach of using deductive models by identifying the habitat preferences for
each species creating binary models of suitable habitat through a series of GIS overlays based on: slope,
aspect, topographic roughness, elevation (DEM), and vegetation type. The resulting species distribution
models were subsequently validated by local experts [21]. Details on targets used in each case study
can be found in Appendix 1.
In order to assess the relative value of patches of ecological systems impacted by development
relative to potential offset sites we calculated several landscape level metrics: the patch size of the

Sustainability 2013, 5 4967
ecological system, the amount of surrounding habitat remaining in natural vegetation cover, species
richness of patches, and potential for future disturbance. These metrics were calculated for every patch
of every ecological system found within the portfolio of conservation sites [21–26]. To select potential
offset sites for impacts associated with development in our pilot landscapes, we developed the MaFE
(mapping alternatives for equivalents) tool in Model Builder in ArcGIS 9.0, which identified patches
of the same type of ecological system and compared them as a function of the landscape level metrics
mentioned above [36]. With this tool, offsets would be directed to patches of the same ecological
system but only to sites with patches of equal or greater landscape level metric scores.
This would ensure that offsets are directed to areas consistent with landscape-level conservation goals,
since they would be restricted to areas within the conservation portfolio and would be directed to areas
of the highest quality based on the landscape level metrics.
We choose to utilize available species data to supplement the selection of ecological systems.
Once species models were compiled we summarized the species richness of these select target species
across the pilot landscapes [35]. To facilitate the relative comparison of the species richness of
different areas we placed the areas into categories based on Natural Jenks [37]. Natural Jenks break
provides a method in which the loss of information is minimized [37]. Areas with the highest species
richness were given priority since this would maximize the conservation benefit for a majority of the
species. Details on the species richness categories used in each case study can be found in Appendix 1.
4. Identifying Offset Replacement Ratios
Offset benefits are often estimated using mitigation replacement ratios which establish the number
of credit units that must be debited from an offset to compensate or replace one unit of loss at the
project site. Replacement ratios are often determined by predefined ratios, such as those based on the
type of conservation action (e.g., 1:1 ratio for restoration, 5:1 for preservation) or are subjective
determinations formed at the discretion of regulatory authorities after multiple considerations such as
proposed conservation actions and risk factors are accounted for [3]. Rarely do these consider
landscape-level features that would ensure values delivered by offset action are consistent with broader
conservation goals. Since most focus on site-level features related to the characteristics of the impact
and/or offset site it is difficult to proactively calculate these metrics and it has been difficult for
developers to build information about potential mitigation requirements into decisions on the
feasibility of investing in a development site. Here, we outline an approach that utilizes readily
available landscape-level data to proactively calculate a replacement ratio that will ensure offsets are
consistent with landscape-level conservation goals. We based the ratio determination on an assessment
of the amount of the ecological system currently within protected areas, the national-level and
local-level rarity of the ecological system, the percentage of the ecological system that remains relative
to its historic distribution and the rate of loss for the ecological system calculated over the previous
6 years. These estimates were based on the average of each patch of each ecological system within the
entire country. Scores for all ecological systems were compiled and categorized based on natural
breaks to one of five categories for each metric and each individual metric score was combined to
create a final replacement ratio (Tables 2 and 3).
Sustainability 2013, 5 4968
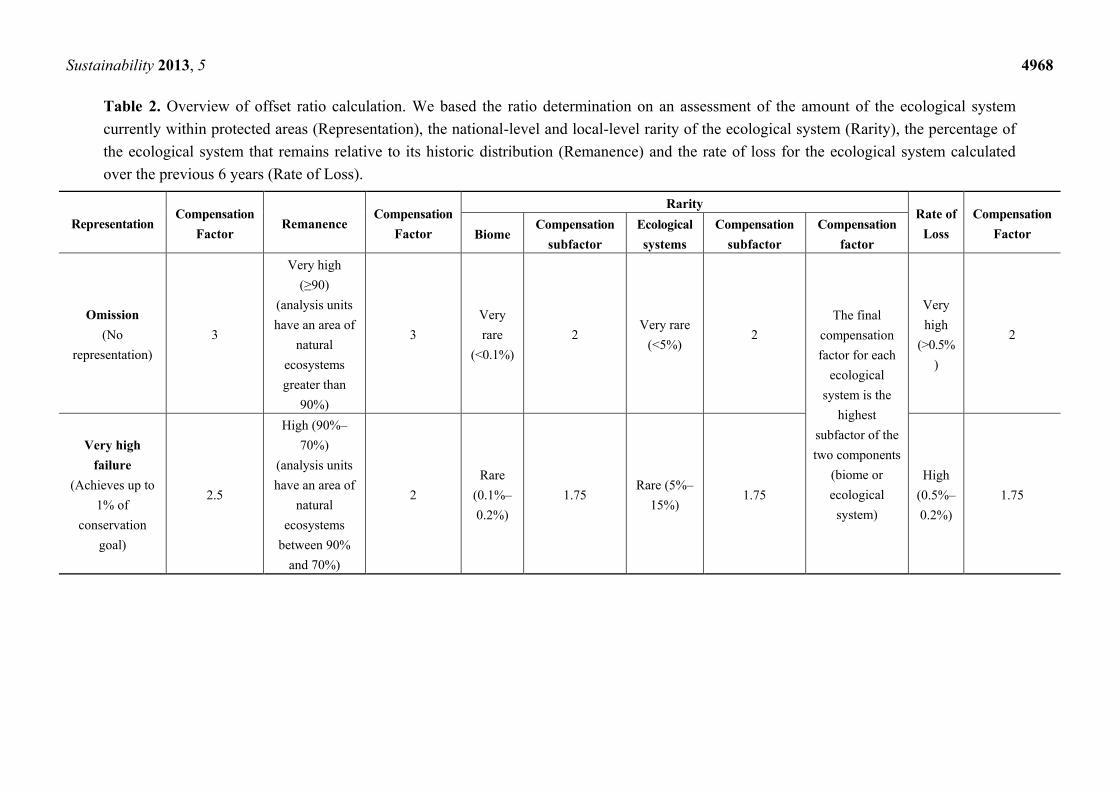
Table 2. Overview of offset ratio calculation. We based the ratio determination on an assessment of the amount of the ecological system
currently within protected areas (Representation), the national-level and local-level rarity of the ecological system (Rarity), the percentage of
the ecological system that remains relative to its historic distribution (Remanence) and the rate of loss for the ecological system calculated
over the previous 6 years (Rate of Loss).
Representation Compensation
Factor Remanence
Compensation
Factor
Rarity Rate of
Loss
Compensation
Factor Biome Compensation
subfactor
Ecological
systems
Compensation
subfactor
Compensation
factor
Omission
(No
representation)
3
Very high
(≥90)
(analysis units
have an area of
natural
ecosystems
greater than
90%)
3
Very
rare
(<0.1%)
2 Very rare
(<5%) 2
The final
compensation
factor for each
ecological
system is the
highest
subfactor of the
two components
(biome or
ecological
system)
Very
high
(>0.5%
)
2
Very high
failure
(Achieves up to
1% of
conservation
goal)
2.5
High (90%–
70%)
(analysis units
have an area of
natural
ecosystems
between 90%
and 70%)
2
Rare
(0.1%–
0.2%)
1.75 Rare (5%–
15%) 1.75
High
(0.5%–
0.2%)
1.75

Sustainability 2013, 5 4969
Table 2. Cont.
Representation Compensation
Factor Remanence
Compensation
Factor
Rarity Rate of
Loss
Compensation
Factor Biome Compensation
subfactor
Ecological
systems
Compensation
subfactor
Compensation
factor
High failure
(Achieves up to
10% of the
conservation
goal)
2
Mean
(70%–50%)
(analysis units
have an area of
natural
ecosystems
between 70%
and 50%)
1
Mean
(0.2%–
0.5%)
1.5 Mean
(15%–30%) 1.5
The final
compensation
factor for each
ecological
system is the
highest
subfactor of
the two
components
(biome or
ecological
system)
Mean
(0.2%–
0.1%)
1.5
Failure
(Achieves up to
50% of the
conservation
goal)
1.5
Low (50%–
30%)
(analysis units
have an area of
natural
ecosystems
between 50%
and 30%)
2
Common
(0.5%–
1%)
1.25 Common
(30%–75%) 1.25
Low
(0.1%–
0.05%)
1.25
Low failure
(Achieves up to
99.9% of the
conservation
goal)
1.25
Very Low
(<30%)
analysis units
have an area of
natural
ecosystems
below 30%
3
Very
common
(>1%)
1
Very
common
(>75%)
1
Very
low
(<0.05
%)
1
No gap
(conservation
goal achieved)
1
- - - - - - - -

Sustainability 2013, 5 4970
Table 3. Example of offset ratio calculation for representative ecological system. Example from the Cesar River Region Coal Mining Pilot for
the riparian forest Ecological System of the Caribe Helobiome and Shrub grassland in hills Ecological System of the Peinobiome Caribe.
Biogeographical Ecosystem
Districts Ecological Systems Representation Rarity Rate of Loss Remanence
Compensation
Factor
PeriCaribeño Ariguani_Cesar
Magdalena and Caribe
Helobiomes
Natural forest of the
Mangdalena and Caribe
Helobiome (Riparian
forest of the Caribe
helobiome)
2.5 1.75 1.5 2 7.75
PeriCaribeño Ariguani_Cesar
Magdalena and Caribe
Helobiomes
Shrub grassland of the
Magdalena and Caribe
Helobiome (Shrub
grassland in hills of the
peinobiome Caribe)
2.5 2 1.5 2 8
Sustainability 2013, 5 4971
The extent to which each ecological system is currently captured within the protected areas network
is based on an analysis conducted by the Colombian National System of Protected Areas [38]. Impacts
to ecological systems with lower coverage within protected areas would be expected to receive a
higher offset ratio for an impact relative to an ecological system with a greater coverage within
protected areas (Table 2). The measure of rarity was based on a national assessment of how rare an
ecological system is relative to the area of the entire country. In addition, we calculated a local level of
rarity based on the proportion of each ecological system within its biome. Both assessments were
based on the biome and nested ecological system classification defined by the Colombian Institute of
Hydrology and Environment Studies (IDEAM) [34]. These metrics were combined to ensure that
ecological systems with higher rarity scores have a higher ratio of required offsets for impacts (Table 2).
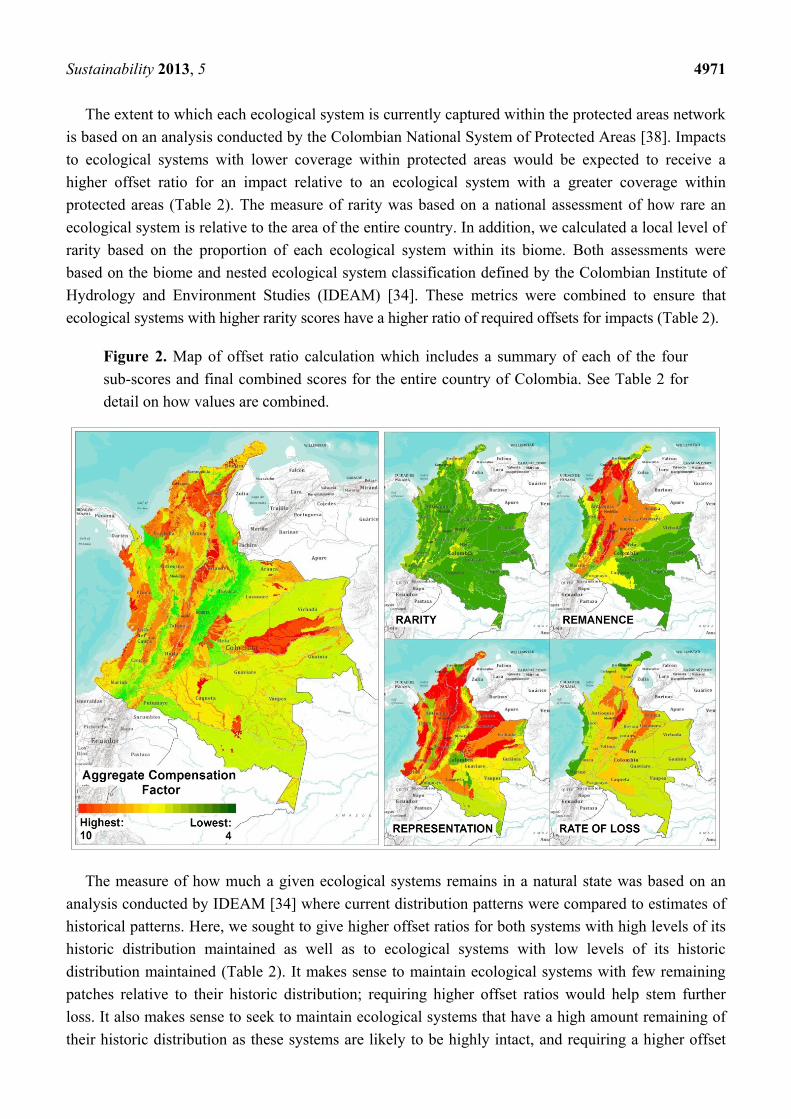
Figure 2. Map of offset ratio calculation which includes a summary of each of the four
sub-scores and final combined scores for the entire country of Colombia. See Table 2 for
detail on how values are combined.
The measure of how much a given ecological systems remains in a natural state was based on an
analysis conducted by IDEAM [34] where current distribution patterns were compared to estimates of
historical patterns. Here, we sought to give higher offset ratios for both systems with high levels of its
historic distribution maintained as well as to ecological systems with low levels of its historic
distribution maintained (Table 2). It makes sense to maintain ecological systems with few remaining
patches relative to their historic distribution; requiring higher offset ratios would help stem further
loss. It also makes sense to seek to maintain ecological systems that have a high amount remaining of
their historic distribution as these systems are likely to be highly intact, and requiring a higher offset
Sustainability 2013, 5 4972
ratio would encourage continued preservation of these systems. The estimation of how much loss each
ecological systems has experienced over the last 6 years was based on analysis by the International
Center for Tropical Agriculture (CIAT) and The Nature Conservancy that used remotely sensed data
examined to indicate land use change over that period [39]. Ecological systems that experience a
higher rate of loss over the last 6 years would be expected to receive a higher offset replacement ratio
then those with lower rates (Table 2). These four metrics were combined into a final score indicating
the required replacement ratio (Table 2 and Figure 2).
5. Applying the Framework in the Cesar Valley Region
The Cesar Valley Region (CVR) comprises ~1.2 million hectares, located in the basin of the
Rio Cesar, in the Caribbean region of Colombia. The Nature Conservancy, along with key federal land
management and wildlife regulatory agencies, Universities, and other conservation organizations,
conducted an ecoregional plan for the CVR [26]. The portfolio of sites chosen during the ecoregional
assessment consisted of 24 priority conservation areas covering a total area of 490,327 hectares,
representing about 27% of the total area of the study site (Figure 3 and Table 4). The portfolio was
dominated by conservation targets associated with the biome Helobioma Caribbean (Cesar). Of the
24 conservation areas selected about 10 consist of floodplain forests dominated by gallery forests,
representing approximately 44% of the total portfolio. The area is also home to a number of threatened
species such as the Blue-billed Curassow (Crax alberti), West Indian manatee (Trichechus manatus
manatus), Cotton-top tamarin (Saguinus oedipus), Rio Magdalena River Turtle (Podocnemis lewyana)
and Bocachico (Prochilodus magdalenae).
The CVR is also home to some of Colombia’s richest coal deposits (Figure 3 and Table 4) [40]
including some that intersect areas selected in the ecoregional assessment (Figure 3 and Table 4).
According to the Mining and Energy Planning Unit (UPME) resources and geological reserves of coal
for this area are estimated at 1933 million tons, the highest in Colombia [40]. The open pit coal
production in the CVR between 1994 and 2005 rose from 8% to 46% of national production and is
projected to continue increasing [40]. The coal potential in the area is considerable with 26.4% of the
area currently under concession by title and another 23.6% currently under application license [41].
Conservation of the biological diversity in this ecoregion is in question, in part because the Colombian
government has authorized exploration and development over such a large area. Developing the coal
resource will increase social and environmental risks as open pit mining activities increase, because it
is common to find high levels of contamination from the release of waste during the extraction and
transport of coal and the loss of endemic fauna and flora and degradation in the surrounding
ecosystems due to fragmentation [42,43].
Here we use the portfolio of sites selected in the plan (Figure 3 and Table 4) [26] to demonstrate
how the application of the framework outlined above will apply the mitigation hierarchy to balance
conservation objectives with impacts associated with future coal development. Since only 27% of the
ecoregion was selected as part of the conservation portfolio, conflicts could potentially be resolved by
simply re-designing the portfolio to meet target occurrence goals in areas having lower coal development
potential (Figure 2c and Table 1). In the CVR the intersection between the conservation portfolio and
the short term scenario of current mining concessions is minimal with a total of 3817 hectares

Sustainability 2013, 5 4973
representing 5% of the portfolio (Figure 3 and Table 4). Given the significant amount of habitat that
has already been converted to other uses, all concession areas overlapping with the conservation
portfolio would be expected to have impacts avoided [21].
However, the portfolio does not represent the only biologically valuable areas in the CVR. In fact
there are 2518 hectares outside of the conservation portfolio where ecological systems remain in the
natural state that are also currently in areas that coal mining concessions have been granted (Figure 3
and Table 4). In these sites, development could proceed to managing residual impacts through the use
of on-site restoration and offsets. Requiring that impacts offset any residual impact would ensure that
mitigation is consistent with landscape level conservation goals. To ensure that offsets provide benefits
to biodiversity equivalent to that impacted as a result of development we quantified the size,
composition and current condition of each patch of habitat found in the 2518 hectares described above.
These variables were then used as inputs in the MaFE tool [36] to select areas that match for the
composition of biodiversity within the conservation portfolio that have higher condition, higher species
diversity and are located in larger patches of habitat (Figure 3 and Table 4). Applying the replacement
ratio framework discussed above and outlined in Table 2 would require 12,890 hectares of offset for
the 2,518 hectares of areas impacted outside of the conservation portfolio (Figure 3 and Table 4).
Figure 3. Landscape-level recommendations for the application of the mitigation hierarchy
in the Ceasr Valley pilot area. Portfolio of conservation sites selected by the ecoregional
assessment in purple. Development potential outlined in red showing overlap between
potential development and conservation priorities. Natural areas not within the
conservation portfolio but requiring offsite mitigation shown in green. Bottom middle and
right panel show required compensation ratio for impacts to natural systems and areas best
suited to offset these impacts.

Sustainability 2013, 5 4974
Table 4. Application of mitigation framework for coal mining in the Cesar Valley Region.
Area (ha)
Study area 1,278,600
Portfolio area 490,327
Size of the future mining scenario 72,369
Portfolio or avoid area in the future mining scenario 3,817
Ecosystems that could be impacted by future mining
scenario outside portfolio 2,518
Compensation factor Between 7–9 for natural ecosystems
and 4 for secondary vegetation
Compensation area 12,891
6. Discussion
Our results are intended to facilitate ecologically appropriate siting of development, while ensuring
that key ecological features impacted as a result of development are preserved or restored. The increase
in mining, energy and infrastructure development forecasted for Colombia may be compatible with
biodiversity, if development activities are properly sited [21]. This presents a challenge for conservation
however, because the area projected to be impacted by habitat loss and fragmentation is large.
Many such impacts can be mitigated or eliminated with appropriate planning for development [20,44].
For example, many of the tilled agricultural areas within the country represent low-quality habitats
incapable of supporting populations of imperiled species and no longer support natural plant or animal
communities. New development would likely have substantially less potential to impact biodiversity if
sited in these areas [32]. Our approach also describes how impacts from development to ecologically
important areas in Colombia could be offset. But in order for a project to apply the mitigation
hierarchy there are areas that must first be avoided by development. Our criteria for avoidance are
based on the best available science regarding known high priority conservation targets in these
landscapes [21]. Our analysis follows best practices for conservation planning [29], by considering
multiple conservation targets designed to preserve both whole landscapes and particularly sensitive
areas. More importantly, our analysis offers a transparent proactive assessment of mitigation
requirements that will be easy to use by both regulators and industry. Our approach also proactively
estimates the amount of offset that would be required for impacts of a particular project to achieve the
necessary mitigation of habitats. These offsets must seek to provide high returns on investment, such
as conservation easements and restoration practices that can be implemented by land managers with
conservation payments from developers. Regulators that implement this framework must call for
offsets to represent new or additional contributions to conservation [3]. For example, for offset to
deliver additionality they must either protect areas at risk of future conversion or restore degraded
areas to improve conditions for biodiversity. While our framework guides offset sites towards high
quality areas within the conservation portfolio there is still ample opportunity to protect against future
conversion or restore areas that are degraded and in turn deliver additionality.
As this framework is implemented a more sophisticated approach to quantifying additionality may
need to be developed to ensure comparable value of offsets and impacts. We recommend that the
Colombian government improve their existing offset accounting approach so in addition to the
Sustainability 2013, 5 4975
landscape level metrics conservation projects are valued based on their additionality [3]. When offsets
restore degraded ecosystems, they provide a new contribution to conservation over time as the offset
reaches maturity. Success of restoration projects can vary greatly depending on the ecosystem,
restoration techniques, and other factors. In some cases, restoration approaches are known to be
effective, but in other situations there may be great uncertainty due to a lack of experience [45,46].
Where restoration experience is comprehensive, this probability could be estimated with some
accuracy, and where experience is more limited, a high-medium-low probability ranking process might
be used. Incorporating probability of success into offset accounting would ensure a more realistic
appraisal of how offsets, contribute to ecological gains. Restoration offsets may take many years
before conservation benefits mature. This time lag represents a loss for biodiversity and should be
accounted for in estimates of ecological gains [47]. We propose that the Colombian government
account for this loss by estimating the time to maturity of a restoration action and apply a discount
rate, a commonly used method for estimating the present value of future values. Offsets that preserve
habitat also deliver conservation value when, taking into account real-world conditions and threats,
those offsets protect against an expected background rate of loss. For example, protecting a 1000-hectare
forest area that was experiencing an average deforestation rate of 1 percent per year delivers a new
contribution to conservation of 10 hectares per year (1 percent of 1000 hectares). Such rates of loss can
be estimated using standard threat assessments [12,20,32,48].
A landscape level perspective on mitigation can offer a variety of improvements for conservation
over typically site by site mitigation. Landscape-level plans provide an opportunity to design offsets
that address residual adverse impacts arising from more than one development project [20].
Aggregated offsets might be advantageous when an area is subjected to cumulative impacts from
several individual developments, particularly those in the same sector, at roughly the same time. In this
situation, impacts on biodiversity are likely to be of a similar type, and aggregating offsets may
provide better mitigation at lower cost, with a higher probability of success given the concentration of
the management skills needed to deliver the offset and synergies in project management. Such assessments
can also reduce costly delays due to protracted environmental review. A landscape approach to
compensatory mitigation planning can lead to a better ecological outcome. If mitigation needs from
multiple projects are pooled, then larger, less fragmented parcels can be acquired, contributing to both
ecological integrity and fiscal savings. There is evidence that small, isolated fragments of habitat tend
to have lower overall biodiversity than larger patches [49]. A focus on aggregated offsets from
multiple project impacts has potential to improve the ecological gains offset deliver.
By pooling funds and facilitating their strategic and geographic application of offsets, conservation
outcomes are maximized, while mitigation costs for developers are reduced. Estimates of the amount
of mitigation described here could be proactively incorporated into the business costs of individual
projects. Given that the overall investment for a commercial development (e.g., mining, oil and gas
and infrastructure) is commonly hundreds of millions of dollars we estimate that the cost of mitigation
is less than a few percent of development costs (Saenz and Walschburger unpublished data).
More importantly, developers can use the results of this analysis to proactively reduce the need for
mitigation by siting projects in areas that would not warrant mitigation. This could substantially reduce
the cost of mitigation across projects. For example, we recognize that the amount of offset required
per ha for some impacts will be high (ratios of 10:1). They provide an opportunity for developers to
Sustainability 2013, 5 4976
proactively avoid these areas whenever possible. In addition, areas with the highest impact to offset
ratios (9/10 to 1) comprise a small percentage of the land area in Colombia (3.2%). Consequently,
impacts to these areas may be avoided through appropriate micro-siting of a projects footprint in
otherwise suitable project areas.
Our goal with these analyses was to illustrate a way in which gaps in the existing siting and
mitigation regulatory framework for Colombia could be improved using available data and tools.
The pilot sites selected to illustrate these concepts were chosen jointly by The Nature Conservancy and
the Colombian Ministry of Environment and Sustainable Development (MADS) because they are
expected to experience significant increases in development pressure. Prior to this analysis, offsets
were required only for forested areas, often directed to areas dissimilar to impacted areas [18].
For example, in some cases, forest clearing resulted in the planting of fruit trees as a way to
compensate for impacts [18]. As a result of this work, MADS adopted a resolution and a methodology
to incorporate the principles of biodiversity offsets outlined in our analyses into its licensing process
for terrestrial projects [50,51] (Colombia, 2012–Resolución 1517 de 2012) [52]. For the first time,
mitigation decisions will be made in accordance with an explicit science-based framework. It will also
push MADS to place impacts of development into a landscape perspective, highlighting the cumulative
impacts of development revealing the potential losses and the need for mitigation, including avoidance
but also compensation of impacts. There will also be a structured decision-making framework to
determine when projects could proceed or should be avoided [21]. Now the guidelines can proactively
identify proposed development that are incompatible with conservation goals and seek to avoid those
impacts [19,51,53]. In addition to decisions about avoidance and minimization, the framework will
support MADS in determining ecologically equivalent offset opportunities, locations where these
offsets can best contribute to landscape conservation goals, and the amount of compensatory
mitigation needed to address impacts. This change in the licensing process should drive both a
significant increase in, and more effective use of, funding for biodiversity conservation across
Colombia [21,53].
Our approach illustrates that it is possible to proactively implement a science-based system that
supports and guides development to avoid, minimize, and offset ecological impacts. The approach
outlined here, updated with new information as it becomes available, could be used to guide projects
that follow this protocol. Given the coarse scale nature of the species data utilized in our analysis and
our decision to use species data to supplement the selection of ecological system offset sites there is a
very real chance that at risk, rare and underrepresented species could be disfavored by this offset
methodology [50]. As this framework is implemented and development plans in the pilot landscapes
are refined, it is likely that biodiversity assessments will also be refined. These refinements may make
it possible to design development activities that minimizes impacts to rare and/or sensitive species or
design offsets that better captures their requirements. The final choice of any offset site must be
supported by field surveys and would need consensus from local communities and the regional
environmental authority. Implementation by MADS may help to improve the licensing process by
facilitating the completion of individual projects sited to avoid sensitive areas as well as protecting
areas of critical biodiversity and ecosystem services within Colombia. The effectiveness of a formal
offset program demands a responsible administrative entity with firm requirements for adequate
oversight, performance accountability, and process transparency and fairness. Achieving these

Sustainability 2013, 5 4977
objectives requires several administrative functions, including: (1) communication and maintenance of
standards and protocols; (2) application of standards to individual projects to analyze impacts and
determine needs for mitigation; (3) coordination and oversight of mitigation planning to target
mitigation funding toward projects with high conservation return on investment; and (4) oversight of
mitigation funds to ensure appropriate fiduciary management and impartial allocation. An independent
third-party entity that oversees these functions will be essential.
7. Conclusions
Balancing growing development demands with biodiversity conservation necessitates a shift from
the business as usual process. By first avoiding or minimizing impacts to occurrences of biological
targets with high irreplaceability and/or vulnerability, then ensuring that impacts are restored onsite
using the best available technology, and finally offsetting any remaining residual impacts, we can
provide a framework truly consistent with sustainable development. By blending a landscape vision
with the mitigation hierarchy, we move away from the traditional project-by-project approach.
A landscape vision is essential because it ensures that the biologically and ecologically important
features remain the core conservation targets throughout the process. Without this blueprint we could
lose sight of overarching conservation vision, have difficulty establishing priorities and tracking
progress. By adopting the framework outlined here we balance development with conservation and
provide the structure to fund conservation commensurate with impacts from development.
Acknowledgments
We thank, Frank Pearl, Adriana Soto, Xiomara Sanclemente, Aurelio Ramos, Jose Yunis, Julio
Carcamo, Juan Sebastian Lozano, Diana Zapata, Claudia Mora, Paula Rojas, Carmen S. Montenegro,
Mafe Patiño of Environment, Economic Analysis Group of the Ministry of Environment, Kei Sochi,
and Collin O’Neil, for providing technical assistance, and the people from Choice Butchers of Fort
Collins Colorado and Café Havana of Cartagena for helpful discussions. Funding was provided by the
Colombian Ministry of Environment, Robertson Foundation, The Nature Conservancy, World Wildlife
Fund and Conservation International.
Conflicts of Interest
The authors declare no conflict of interest.

Sustainability 2013, 5 4978
Appendix
Appendix 1. Details on the ecological systems and species that were the focus of
mitigation activities in each pilot project. The number of species is included by taxa along
with species richness categories that are represented as a range of the number of species
included in each category. Species richness values were binned into categories based on the
Jenks natural breaks classification method [38].
Case
study area
Total
area (ha) Ecological systems
Species (species richness
categories)
Coal
Mining in
Cesar
1,285,592
Riparian lake Mammals (17): Callicebus
torquatus, Leopardus tigrinus
pardinoides, Lontra longicaudis,
Myrmecophaga tridactyla Arteta,
Panthera onca centralis, Saguinus
oedipus, Tremarctos ornatus,
Trichechus manatus , Ateles
hybridus hybridus, Tapirus
terrestris terrestris, Puma concolor
concolor, Mazama americana,
Bradypus variegatus, Alouatta
seniculus, Cabassous centralis,
Leopardus pardalis, Leopardus
wiedii. Birds (23): Pauxi pauxi,
Anthocephala floriceps floriceps,
Ara militaris, Basileuterus
conspicillatus, Campylopterus
phainopeplus, Capito hypoleucus,
Chauna chavaria, Clytoctantes
alixii, Crax alberti, Dendroica
cerulea, Metallura iracunda,
Odontophorus atrifrons,
Ognorhynchus icterotis, Oroaetus
isidori, Gypopsitta pyrilia,
Schizoeaca perijana, Vultur
gryphus, Vermivora chrysoptera,
Pyrrhura pantchenko, Ortalis
garrula, Chlorostilbon gibsoni,
Picumnus cinnamomeus,
Synallaxis candei. Reptiles (3):
Crocodylus acutus, Geochelone
carbonaria, Podocnemis lewyana.
Amphibians (3): Centrolene
tayrona, Eleutherodactylus
cuentasi, Cryptobatrachus
boulengeri. fishes (10): Abramites
eques, Ageneiosus pardalis,
Aquatic vegetation
Swamp forest
Riparian forest and shrubland
Grassland riparian forest
Shrub grassland (en lomerio ondulo)
Shrub grassland (en lomerio quebrado)
Shrub grassland in foothills
Dry savanna
Semi dense dry forest in lomerio
Semi dense dry forest in mountain
Riparian dry forest
Semi dense sub-andean mountain forest
Dense sub-andean mountain forest
Riparian sub-andean mountain forest
Dense Andean mountain forest
Riparian andean mountain forest
Mountain grasslands (paramos)

Sustainability 2013, 5 4979
Appendix 1. Cont.
Case
study area
Total
area (ha) Ecological systems
Species (species richness
categories)
Coal
Mining in
Cesar
1,285,592 Mountain grasslands (paramos)
Brycon moorei, Curimata mivartii,
Ichthyoelephas longirostris,
Plagioscion magdalenae,
Prochilodus magdalenae,
Pseudouplatystoma magdaleniatum,
Salminus affinis, Sorubim
cuspicaudus. Plants (25): Acrocomia
aculeata, Astrocaryum malybo,
Aspidosperma polyneuron,
Brosimum alicastrum, Bulnesia
arbórea, Cedrela odorata, Elaeis
oleífera, Guaiacum officinale,
Podocarpus oleifolius,
Aspidosperma megalocarpon,
Cedrela fissilis, Haematoxylum
brasiletto, Pradosia colombiana,
Parinari pachyphylla, Swietenia
macrophylla, Sabal mauritiiformis,
Espeletia periajaensis,
Libanothamnus divisoriensis, Puya
grantii, Hypericum baccharoides,
Pentacalia perijaensis, Aragoa
romeroi, Belencita nemorosa,
Chaetolepis perijaensis
(1–4, 5–8, 9–12, 13–16, 17–27)
Gold
Mining in
Sur de
Bolivar
1,668.565
Riparian lake (bogs) Mammals (12): Ateles hybridus
brunneus, Saguinus leucopus,
Tapirus terrestris, Tremarctos
ornatus. Birds (10): Ara
militaris,Capito hypoleucus
carrikeri, Cercomacra parkeri,
Chauna chavaria, Clytoctantes alixi,
Crax alberti, Habia gutturalis,
Melanerpes pulcher Phylloscartes
lanyoni, Pionopsitta pyrilia.
Reptiles (2):Geochelone carbonaria,
Podocnemis lewyana. Fishes (11):
Abramites eques, Ageneiosus
caucanus, Cochilodon hondae,
Curimata mivartii, Salminus affinis,
Sorubim lima. Plants (24):
Aniba perutilis
Flood plain forest
Alluvial valley forest
Wetlands
swamp vegetation
Alluvial plain savannas
Forest in structural and erosional
mountain
Mountain forest in warm weather
fluiogravitational
Mountain forest in moist warm
fluiogravitational weather
Mountain forest in temperate wet
fluiogravitational
Mountain forest in temperate
fluiogravitational very wet
Mountain forest in a temperate climate
fluiogravitational

Sustainability 2013, 5 4980
Appendix 1. Cont.
Case
study area
Total
area (ha) Ecological systems
Species (species richness
categories)
Gold
Mining in
Sur de
Bolivar
1,668.565
Acuatic vegetation in mountain Cariniana pryryformis, Caryocar
amydaliferum, Cedrela odorata
Guaiacum officinale, Isidodendron
tripterocarpum
Juglans neotropica, Pachira
quinata, Prioria copaifera
Quercus humboldtii, Swietenia
macrophylla, Clatrotropis brunnea
Peltogyne paniculata, Dipterix
oleifera, Catostema digitata,
Gustavia romeroi, Lecythis
tuyrana, Lecythis mesophylla,
Licania platypus
Caryocar glabrum, Vascivaea
podocarpa, Astrocaryum malibo
Elais oleifera, Brosimum
alicastrum. (1–4, 5–9, 11–14,
14–20, 20–26)
Savannas vegetation
In fluviogravitational hills forest
Forest in structural and erosional hills
Aquatic vegetation
Forest in Lomerio in mountain forest
Dry forest in hills
dry forest in mountain
Foothill forest in dry forest wetland
biome
Aquatic vegetation in dry forest
Savanna in dry forest biome
Port in
Bahia
Tribuga
Choco
343,265
Estuarine Forest
Species (18): Bird communities of
the tropical rainforest and
mangroves, Community
amphibians, Panthera onca, Puma
concolor, Community mammalian
prey, terrestrial turtle, Community
psittácidos sharks, megaptera,
deep-water shrimp, shallow-water
shrimp, dolphins tursinus, hake,
turtle nesting beaches, groupers
and grouper, other bony fish,
Breeding birds. (Not Applicable)
forest in Monocline Crestones dissected
forest in Monocline and Composite
Spine Anticline
Halobiome forest
Riparian forest
estuarine forest in grasslands
forests on slopes and hills
forest in erosional mountains
forest in branched mountains
forest in mountains and hills branches
forest in aluvio-coluvial foothills
forest in beach
Littoral beaches
Wetlands
soft bottoms
coral formations
mangroves
beaches
secondary vegetation
rocky Coastlines
freshwater systems
Riscales

Sustainability 2013, 5 4981
Appendix 1. Cont.
Case
study area
Total
area (ha) Ecological systems
Species (species richness
categories)
Macarena
Road in
Meta
811,457
Humid tropical rainforest in hills and
hillsides Mammals (15sp.): Aotus
griseimembra, Aotus lemurinus,
Ateles belzebuth belzebuth,
Callicebus cupreus ornatus,
Cuniculus taczanowskii, Dynomis
branickii, Lagothrix lagothricha
lugens, Leopardus tigrinus
pardinoides, Leopardus wiedii,
Marmosops fuscatus,
Myrmecophaga tridactyla,
Panthera onca, Priodontes
maximus, Pteronura brasiliensis,
Tapirus pinchaque, Tapirus
terrestris, Tremarctos ornatus.
Birds (24 sp.): Aburria aburri,
Aburria pipile (Pipile pilpile),
Anhima cornuta, Ara macao,
Ara severus, Cissopis leverianus,
Crax alector, Dendroica cerúlea,
Gallinula melanops, Grallaria
alleni, Gypopsitta pyrila
(Syn. Pionopsitta pyrilia), Harpia
harpyja, Hypopyrrhus
pyrohypogaster, Mitu tomentosa,
Morphnus guianensis, Patagioenas
fasciata (Syn. Columba fasciata),
Rupicola peruvianus, Sporophila
plúmbea, Touit stictopterus,
Vermivora chrysoptera, Wilsonia
Canadensis. Reptiles (5 sp.):
Crocodilus intermedius,
Geochelone carbonaria,
Geochelone denticulata,
Podocnemis expansa, Podocnemis
unifilis. Amphibians (10 sp.):
Atelopus guitarraensis,
Bolitoglossa altamazonica,
Ceratophrys cornuta, Cochranella
adiazeta, Dendrophryniscus
minutus, Gastrotheca nicefori,
Hemiphractus johnsoni,
Phyllomedusa tarsius,
Humid Tropical rainforest in erosional
mountains
Humid Tropical rainforest on alluvial
fans and terraces
Humid tropical rainforest in
fluvio-erosional mountains
Pluvial tropical rainforest in
fluvio-erosional mountains
Humid tropical Rainforests in alluvial
terraces
Humid to pluvial tropical rainforest on
hills and low hillsides
Pluvial tropical rainforest in
fluvio-erosional mountains
Pluvial tropical rainforest in
intra-mountain alluvial valleys
Humid tropical in non-dissected alluvial
fans
Humid tropical rainforest on alluvial
plains of meandric rivers
Xerophitic vegetation and shrubland on
sandstone
Xerophitic vegetation and shrubland on
fluvio-erosional mountain
Xerophitic vegetation and shrubland on
non-dissected alluvial fans
Subandean pluvial forests in structural
hillsides
Subandean humid forests in hills and
mountains of the Sierra de la Macarena
Subandean Humid Forests in structural
hillsides
Sub-andean Humid Forests in fluvio-
erosional mountains
Andean humid and pluvial forests in
fluvio erosional mountains
Highland humid grasslands (páramos)
in glacial mountains
Humid forests and subparamos
(grasslands) in glacial mountains

Sustainability 2013, 5 4982
Appendix 1. Cont.
Case
study area
Total
area (ha) Ecological systems Species (species richness categories)
Macarena
Road in
Meta
811,457 Humid forests and subparamos
(grasslands) in glacial mountains
Pristimantis, savage, Rahebo
glaberrimus. Fishes
(10 sp.): Apteronotus macrostomus,
Brycon amazonicus, Curimata mivartii,
Ichthyoelephas longirostris, Prochilodus
magdalenae, Pseudoplatystoma
fasciatum, Salminus affinis, Salminus
hilarii, Sorubim cuspicaudus,
Trychomycterus migrans. Plants (33 sp.):
Alzatea verticillata, Aniba perutilis,
Aspidosperma polyneuron, Attalea
insignis, Axonopus morronei, Bactris
gasipaes var. Chichagui, Billia rosea,
Cattleya trianae, Cedrela odorata,
Ceroxylon alpinum, Ceroxylon
vogelianum, Eschweilera cabrerana,
Espeletia cabrerensis, Heliconia
marginata, Hyptis melissoides, Iriartea
deltoidea, Juglans neotropica, Minquartia
guianensis, Myrocarpus venezuelensis,
Pachira quinata, Passiflora arbórea,
Passiflora tolimana, Pitcairnia arenícola,
Pitcairnia tolimensis, Podocarpus
oleifolius, Pterocarpus officinalis,
Quercus humboldtii, Schizolobium
parahybum, Scutellaria parrae, Syagrus
sancona, Terminalia amazonia.
(1–4, 5–10, 11–15, 15–20, 21–32)
Oil and
Gas in
Casanare
1,892,780
High Dense Rainforest in
structural-erosional hills
Birds (23 sp.): Anas cyanoptera, Anas
discors, Anhima cornuta, Anthus
lutescens, Ara severa, Aratinga
acuticauda, Basileuterus cinereicollis,
Cacicus uropygialis, Cercibis oxycerca,
Ciconia maguari, Cissopis leverianus,
Cranioleuca vulpina, Crax alector, Mitu
tormentosum, Myrmotherula cherriei,
Neochen jubata, Phacellodomus
rufifrons, Pionopsitta pyrilia, Polystictus
pectoralis, Sporophila plumbea,
Vermivora chrysoptera, Seiurus
noveboracensis, Sayornis nigricans,
Jabiru mycteria Reptiles (5): Crocodilus
intermedius, Podocnemis unifilis,
High Dense Rainforest in
structural—erosional mountain
High Dense Rainforest in
fluvio-gravitational mountain
High Dense Rainforest in antique
tectonized foothill
High Dense Rainforest in alluvial
valleys
Medium dense Rainforest in
dilluvial-alluvial foothill
Medium dense Rainforest in
antique foothill
Sustainability 2013, 5 4983
Appendix 1. Cont.
Case
study area
Total
area (ha) Ecological systems Species (species richness categories)
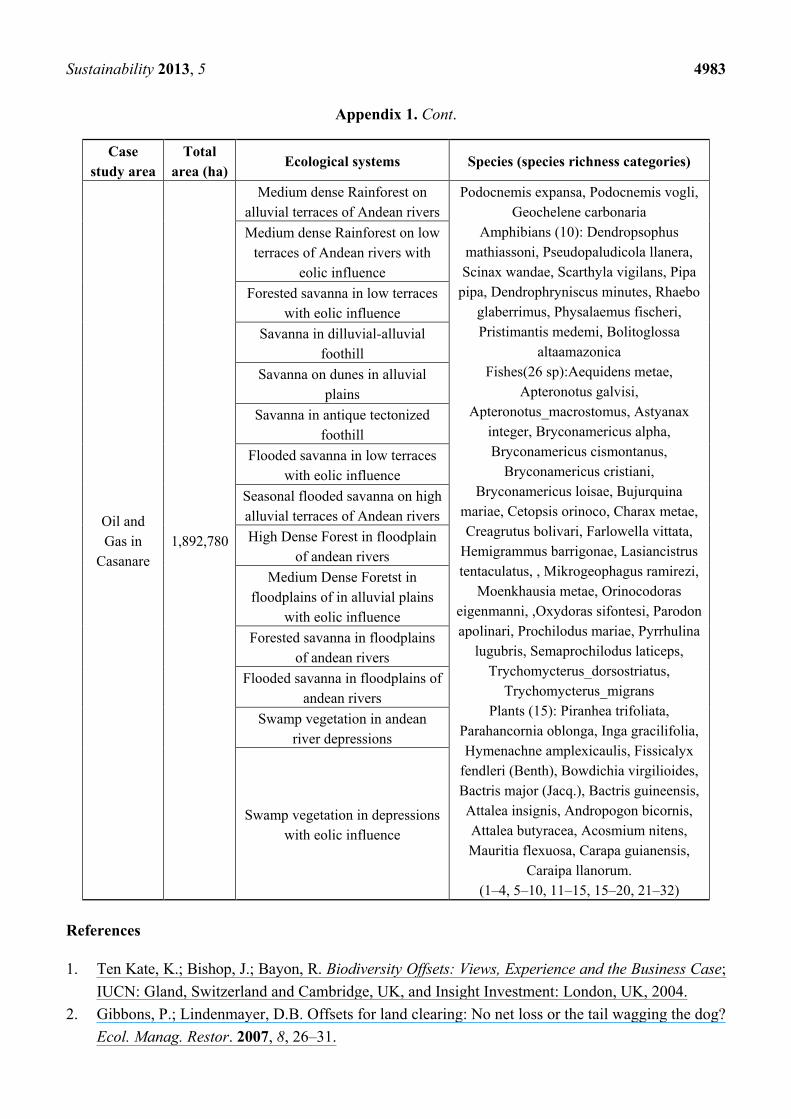
Oil and
Gas in
Casanare
1,892,780
Medium dense Rainforest on
alluvial terraces of Andean rivers
Podocnemis expansa, Podocnemis vogli,
Geochelene carbonaria
Amphibians (10): Dendropsophus
mathiassoni, Pseudopaludicola llanera,
Scinax wandae, Scarthyla vigilans, Pipa
pipa, Dendrophryniscus minutes, Rhaebo
glaberrimus, Physalaemus fischeri,
Pristimantis medemi, Bolitoglossa
altaamazonica
Fishes(26 sp):Aequidens metae,
Apteronotus galvisi,
Apteronotus_macrostomus, Astyanax
integer, Bryconamericus alpha,
Bryconamericus cismontanus,
Bryconamericus cristiani,
Bryconamericus loisae, Bujurquina
mariae, Cetopsis orinoco, Charax metae,
Creagrutus bolivari, Farlowella vittata,
Hemigrammus barrigonae, Lasiancistrus
tentaculatus, , Mikrogeophagus ramirezi,
Moenkhausia metae, Orinocodoras
eigenmanni, ,Oxydoras sifontesi, Parodon
apolinari, Prochilodus mariae, Pyrrhulina
lugubris, Semaprochilodus laticeps,
Trychomycterus_dorsostriatus,
Trychomycterus_migrans
Plants (15): Piranhea trifoliata,
Parahancornia oblonga, Inga gracilifolia,
Hymenachne amplexicaulis, Fissicalyx
fendleri (Benth), Bowdichia virgilioides,
Bactris major (Jacq.), Bactris guineensis,
Attalea insignis, Andropogon bicornis,
Attalea butyracea, Acosmium nitens,
Mauritia flexuosa, Carapa guianensis,
Caraipa llanorum.
(1–4, 5–10, 11–15, 15–20, 21–32)
Medium dense Rainforest on low
terraces of Andean rivers with
eolic influence
Forested savanna in low terraces
with eolic influence
Savanna in dilluvial-alluvial
foothill
Savanna on dunes in alluvial
plains
Savanna in antique tectonized
foothill
Flooded savanna in low terraces
with eolic influence
Seasonal flooded savanna on high
alluvial terraces of Andean rivers
High Dense Forest in floodplain
of andean rivers
Medium Dense Foretst in
floodplains of in alluvial plains
with eolic influence
Forested savanna in floodplains
of andean rivers
Flooded savanna in floodplains of
andean rivers
Swamp vegetation in andean
river depressions
Swamp vegetation in depressions
with eolic influence
References
1. Ten Kate, K.; Bishop, J.; Bayon, R. Biodiversity Offsets: Views, Experience and the Business Case;
IUCN: Gland, Switzerland and Cambridge, UK, and Insight Investment: London, UK, 2004.
2. Gibbons, P.; Lindenmayer, D.B. Offsets for land clearing: No net loss or the tail wagging the dog?
Ecol. Manag. Restor. 2007, 8, 26–31.

Sustainability 2013, 5 4984
3. McKenney, B.A.; Kiesecker, J.M. Policy development for biodiversity offsets: Review of offset
frameworks. Environ. Manag. 2010, 45, 165–176.
4. Council on Environmental Quality. Protection of the Environment, National Environment Policy
Act. 40 CFR 1500-1517, 2000.
5. Government of New South Wales. Native Vegetation Act 2003. No. 103, 2003.
6. Environmental Defense. Mitigation Banking as an Endangered Species Conservation Tool;
Environmental Defense: Toronto, ON, USA, 1999.
7. Environmental Law Institute. Banks and Fees: The Status of Off-Site Wetland Mitigation in the
United States; Environmental Law Institute: Washington, DC, USA, 2002.
8. Madsen, B.; Carroll, N.; Moore-Brands, K. State of Biodiversity Markets Report: Offset and
Compensation Programs Worldwide. Available online: http://www.ecosystemmarketplace.com/
documents/acrobat/sbdmr.pdf (accessed on 5 October 2013).
9. International Finance Corporation. Performance Standard 6 Biodiversity Conservation and
Sustainable Management of Living Natural Resources. Available online: http://www.ifc.org/ifcext/
policyreview.nsf/AttachmentsByTitle/Updated_PS6_August1-2011/$FILE/Updated_PS6_August1-
2011.pdf (accessed on 5 October 2013).
10. Rio Tinto. Rio Tinto’s biodiversity strategy. Available online: http://www.riotinto.com/documents/
ReportsPublications/RTBidoversitystrategyfinal.pdf (accessed on 5 October 2013).
11. Environmental Law Institute. Mitigation of Impacts to Fish and Wildlife Habitat: Estimating
Costs and Identifying Opportunities; Environmental Law Institute: Washington, DC, USA, 2007.
12. Kiesecker, J.M.; Copeland, H.C.; Pocewicz, A.; Nibbelink, N.; McKenney, B.; Dahlke, J.;
Holloran, M.; Stroud, D. A framework for implementing biodiversity offsets: Selecting sites and
determining scale. Bioscience 2009, 59, 77–84.
13. Stotz, D.F.; Fitzpatrick, J.W.; Parker, T.E.; Moskowitz, D.K. Neotropical Birds, Ecology and
Conservation; University of Chicago Press: Chicago, IL, USA, 1996.
14. Erwin, T.L.; Pimienta, M.C.; Murillo, O.E.; Aschero, V. Mapping patterns of beta diversity for
beetles across the western Amazon Basin: A preliminary case for improving conservation
strategies. Proc. Calif. Acad. Sci. 2004, 56, 72–85.
15. Ceballos, G.; Ehrlich, P.R. Global mammal distributions, biodiversity hotspots, and conservation.
Proc. Natl. Acad. Sci. USA 2006, 103, 19374–19379.
16. IAvH (Instituto Alexander von Humboldt). Available online: http://www.humboldt.org.co/
iavh/component/k2/item/129-colombia-en-el-mundo (accessed on 5 October 2013).
17. Departamento Nacional de Planeación (DNP). Plan Nacional de Desarrollo 2010–2014
(in Spanish); DNP: Bogota, Colombia, 2011.
18. Ministerio de Ambiente, Vivienda y Desarrollo Territorial (MAVDT). Convenio de Asociación
No.09 de 2008 (in Spanish); The Nature Conservancy, World Wildlife Fund y Conservación
Internacional: Bogota, Colombia, 2008.
19. Ministerio de Ambiente. Vivienda y Desarrollo Territorial. Metodología general para la presentación
de estudios ambientales (in Spanish); Zapata, P., Zamira Lozano, D.M., Londoño, L.A., Eds.;
Ministerio de Ambiente, Vivienda y Desarrollo Territorial: Bogota, Colombia, 2010; pp. 1–97.
20. Kiesecker, J.M.; Copeland, H.C.; Pocewicz, A.; McKenney, B. Development by design: Blending
landscape-level planning with the mitigation hierarchy. Front. Ecol. Environ. 2010, 8, 261–266.

Sustainability 2013, 5 4985
21. Saenz, S.; Walschburger, T.; León, J.; Gonzalez, J.; McKenney, B.; Kiesecker, J.M. Development
by design in Colombia: Making mitigation decisions consistent with conservation outcomes.
PLoS One 2013, in press.
22. León, J.; Saenz, S.; Walschburger, T.; Porras, M. Portafolio de Áreas Importantes para la
Conservación de la Biodiversidad del Sur de Bolívar. Producto V. Convenio de Asociación
No.123 de 2008 (in Spanish); Ministerio de Ambiente, Vivienda y Desarrollo Territorial,
The Nature Conservancy y World Wildlife Fund: Bogota, Colombia, 2010; pp. 1–33.
23. León, J.; Cardenas, J.J.; Walschburger, T.; Porras, M.; Saenz, S. Portafolio de Áreas Importantes
para la Conservación de la Biodiversidad de Bahía Tribugá. Producto V. Convenio de Asociación
No.123 de 2008 (in Spanish); Ministerio de Ambiente, Vivienda y Desarrollo Territorial,
The Nature Conservancy y World Wildlife Fund: Bogota, Colombia, 2010; pp. 1–32.
24. Romero, M.; Rodríguez, N.; Cárdenas, K. Portafolio de Áreas Importantes para la Conservación
de la Biodiversidad del Norte del Casanare. Producto V. Convenio de Asociación No.123 de 2008
(in Spanish); Ministerio de Ambiente, Vivienda y Desarrollo Territorial, The Nature Conservancy
y World Wildlife Fund: Bogota, Colombia, 2008; pp. 1–59.
25. Rodríguez, N.; Romero, M.; Cárdenas, K.; Castellanos, L. Portafolio de Áreas Importantes para
la Conservación de la Biodiversidad del Meta—Huila. Producto V. Convenio de Asociación
No.123 de 2008 (in Spanish); Ministerio de Ambiente, Vivienda y Desarrollo Territorial,
The Nature Conservancy y World Wildlife Fund: Bogota, Colombia, 2008; pp. 1–59.
26. Cabrera, E.; Rodriguez, J.; Otero, J.; Pedraza, C.; Ruiz, F. Portafolio de áreas prioritarias de
conservación en la zona central del Cesar. Producto 16. Instituto de Investigación de Recursos
Biológicos Alexander von Humboldt. Convenio de Asociación No.09 de 2008 (in Spanish);
Ministerio de Ambiente, Vivienda yDesarrollo Territorial, The Nature Conservancy, World
Wildlife Fund y Conservación internacional: Bogota, Colombia, 2009; pp. 1–55.
27. Galindo, G.; Pedraza, C.; Betancourt, F.; Moreno, R.; Cabrera, E. Planeación ambiental del sector
hidrocarburos para la conservación de la biodiversidad en los llanos de Colombia. Convenio de
cooperación 05–050 (in Spanish); Instituto de Investigación de Recursos Biológicos Alexander
von Humboldt: Bogota, Colombia, 2007.
28. Galindo, G.; Cabrera, E.; Otero, J.; Bernal, N.R.; Palacios, S. Planificación ecoregional para la
conservación de la biodiversidad en los Andes y en el Piedemonte amazónicos colombianos
(in Spanish); Instituto de Investigación de Recursos Biológicos Alexander von Humboldt,
Agencia Nacional de Hidrocarburos, The Nature Conservancy e Instituto de Meteorología y
Estudios Ambientales: Bogota, Colombia, 2009; pp. 1–24.
29. Margules, C.R.; Pressey, R.L. Systematic conservation planning. Nature 2000, 405, 243–253.
30. Pressey, R.L.; Bottrill, M.C. Opportunism, threats, and the evolution of systematic conservation
planning. Conservation. Biology 2008, 22, 1340–1345.
31. Noss, R.F.; Carroll, C.; Vance-Borland, K.; Wuerthner, G. A multicriteria assessment of the
irreplaceability and vulnerability of sites in the greater Yellowstone ecosystem. Biol. Conserv.
2002, 16, 895–908.
32. Kiesecker, J.M.; Evans, J.S.; Fargione, J.; Doherty, K.; Foresman, K.R.; Kunz, T.H.; Naugle, D.;
Nibbelink, N.P.; Niemuth, N.D. Win-win for wind and wildlife: A vision to facilitate sustainable
development. PLoS One 2011, 6, e17566.

Sustainability 2013, 5 4986
33. Groves, C.R. Drafting a Conservation Blueprint: A Practioner’s Guide to Planning for
Biodiversity; Island Press: Washington, DC, USA, 2003; pp. 1–457.
34. Ecosistemas continentales, costeros y marinos de Colombia (in Spanish). Available online:
http://www.invemar.org.co/noticias.jsp?id=3458&idcat=104 (accessed on 5 October 2013).
35. NatureServe. InfoNatura: Birds, mammals, and amphibians of Latin America. Available online:
http://www.natureserve.org/infonatura (accessed on 5 October 2013).
36. León, J.; Lozano, J.; Saenz, S. Mapeo de Formulas Equivalentes—Mapping Alternatives for
Equivalents ―M.a.F.E v.1.0‖ (in Spanish); The Nature Conservancy: Bogota, Colombia, 2010.
37. Osaragi, T. Classification Methods for Spatial Data Representation; Centre for Advanced Spatial
Analysis (UCL): London, UK, 2002.
38. Corzo, G. Áreas prioritarias para la conservación de la biodiversidad continental en Colombia
(in Spanish). Available online: https://www.siac.gov.co/documentos/DOC_Portal/DOC_Siac/
310510_Areas_prioritarias_conservacion.pdf (accessed on 5 October 2013).
39. Reymondin, L.; Jarvis, A.; Perez-Uribe, A.; Touval, J.; Argote, K.; Rebetez, J.; Guevara, E.;
Mulligan, M.A. Methodology for near real-time monitoring of habitat change at continental scales
using MODIS-NDVI and TRMM. Remote Sens. Environ. 2013, submitted for publication.
40. Unidad de Planeación Minero energética. Plan Nacional de Desarrollo Minero 2007–2010:
gestión pública para propiciar la actividad minera (in Spanish); Editorial Scripto Ltda: Bogota,
Colombia, 2007.
41. Gobernación del Cesar. Gestión de la Secretaria de Minas (in Spanish); Cifras de la Minería:
Valledupar, Colombia, 2008.
42. Perdomo, J.; Jaramillo, A.; Mendieta, J.C. Estimación de la senda óptima de extracción para un
recurso natural no renovable: caso de estudio para la actividad carbonífera a cielo abierto en el
centro del departamento del Cesar, Colombia. Documentos CEDE (in Spanish); Universidad de
los Andes Facultad de Economía: Bogota, Colombia, 2010.
43. Yushi, M.; Hong, S.; Fuqiang, Y. The True Cost of Coal; Greenpeace Energy Foundation (San
Francisco) and the World Wildlife Fund: Amsterdam, The Netherlands, 2007.
44. Kiesecker, J.M.; Copeland, H.C.; McKenny, B.; Pocewicz, A.; Doherty, K. Energy by Design:
Making Mitigation Work for Conservation and Development. In Energy Development and
Wildlife Conservation in Western North America; Naugle, D.E., Ed.; Island Press: Washington,
DC, USA, 2011; pp. 159–182.
45. Gardner, T.A.; von Hase, A.; Brownlie, S.; Ekstrom, J.M.M.; Pilgrim, J.D.; Savy, C.E.;
Stephens, R.T.T.; Treweek, J.; Ussher, G.T.; Ward, G.; et al. Biodiversity offsets and the
challenge of achieving no net loss. Biol. Conserv. 2013, doi:10.1111/cobi.12118.
46. Quétier, F.; Lavorel, S. Assessing ecological equivalence in biodiversity offset schemes:
Key issues and solutions. Biol. Conserv. 2011, 144, 2991–2999.
47. Thur, S.M. Refining the use of habitat equivalency analysis. Environ. Manag. 2007, 40, 161–170.
48. Evans, J.; Kiesecker, J.M. Shale gas, wind and water: Assessing the potential cumulative impacts
of energy development on ecosystem services within the Marcellus play. PLoS One 2013, in press.
49. Doncaster, C.P.; Micol, T.; Jensen, S.P. Determining minimum habitat requirements in theory and
practice. Oikos 1996, 75, 335–339.

Sustainability 2013, 5 4987
50. Regnery, B.; Kerbiriou, C.; Julliard, R.; Vandevelde, J.; le Viol, I.; Burylo, M.; Couvet, D. Sustain
common species and ecosystem functions through biodiversity offsets: Response to Pilgrim et al.
Conserv. Lett. 2013, 6, 385–386.
51. Ministerio de Ambiente y Desarrollo Sostenible. Manual para la asignación de compensaciones
por pérdida de biodiversidad (in Spanish). Available online: http://www.minambiente.gov.co/
documentos/normativa/resolucion/180912_manual_compensaciones.pdf (accessed on 5 October 2013).
52. Ministerio de Ambiente y Desarrollo Sostenible. Resolución 1517 de 2012 (in Spanish). Available
online http://www.minambiente.gov.co/documentos/normativa/resolucion/res_1517_310812.pdf
(accessed on 5 October 2013).
53. Saenz, S.; Walschburger, T.; León, J.; González, J. Manual para la asignación de
compensaciones por pérdida de biodiversidad (in Spanish); Convenio de Asociación No. 09 de
2008; Ministerio de Ambiente y Desarrollo Sostenible, The Nature Conservancy, World Wildlife
Fund, Conservación Internacional: Bogotá, Colombia, 2010.
© 2013 by the authors; licensee MDPI, Basel, Switzerland. This article is an open access article
distributed under the terms and conditions of the Creative Commons Attribution license
(http://creativecommons.org/licenses/by/3.0/).
Copyright © 2022 FDOKUMEN