A FEM-Based Optimization Method for Driving Frequency of ...
13
materials Article A FEM-Based Optimization Method for Driving Frequency of Contactless Magnetoelastic Torque Sensors in Steel Shafts Anna Ostaszewska-Li ˙ zewska 1, * , Michal Nowicki 1 , Roman Szewczyk 2 and Mika Malinen 3 Citation: Ostaszewska-Li ˙ zewska, A.; Nowicki, M.; Szewczyk, R.; Malinen, M. A FEM-Based Optimization Method for Driving Frequency of Contactless Magnetoelastic Torque Sensors in Steel Shafts. Materials 2021, 14, 4996. https://doi.org/10.3390/ ma14174996 Academic Editor: Roberto Citarella Received: 21 July 2021 Accepted: 30 August 2021 Published: 1 September 2021 Publisher’s Note: MDPI stays neutral with regard to jurisdictional claims in published maps and institutional affil- iations. Copyright: © 2021 by the authors. Licensee MDPI, Basel, Switzerland. This article is an open access article distributed under the terms and conditions of the Creative Commons Attribution (CC BY) license (https:// creativecommons.org/licenses/by/ 4.0/). 1 Faculty of Mechatronics, Institute of Metrology and Biomedical Engineering, Warsaw University of Technology, sw. A. Boboli 8, 02-525 Warsaw, Poland; [email protected] 2 Lukasiewicz Research Network—Industrial Research Institute for Automation and Measurements PIAP, 02-486 Warsaw, Poland; [email protected] 3 CSC–IT Center for Science, P.O. Box 405, FI-02101 Espoo, Finland; mika.malinen@csc.fi * Correspondence: [email protected]; Tel.: +48-790-016-546 Abstract: This paper presents a novel finite element method (FEM) of optimization for driving frequency in magneto-mechanical systems using contactless magnetoelastic torque sensors. The optimization technique is based on the generalization of the axial and shear stress dependence of the magnetic permeability tensor. This generalization creates a new possibility for the determination of the torque dependence of a permeability tensor based on measurements of the axial stress on the magnetization curve. Such a possibility of quantitative description of torque dependence of a magnetic permeability tensor has never before been presented. Results from the FEM-based modeling method were validated against a real magnetoelastic torque sensor. The sensitivity characteristics of the model and the real sensor show a maximum using a driving current of similar frequency. Consequently, the proposed method demonstrates the novel possibility of optimizing magnetoelastic sensors for automotive and industrial applications. Keywords: contactless torque sensors; magnetic permeability tensor; torque sensor; FEM optimization 1. Introduction Measuring the torque in mechanical shafts made of steel is a common challenge found in various industrial applications. Some examples of these applications include marine propulsion systems [1,2], turbine generators [3–5], robotics [6–10], and automo- tive [11–14] and electromobility applications [15–17]. Due to the rotation of a mechanical shaft under normal working conditions, powering a typical strain-gauge based torque sensor while collecting data is very challenging [3]. For this reason, the most promising solution from an application point of view after comparing the different types of shaft torque sensors [1,18–25] is contactless sensors. Soft magnetic materials the most commonly used as cores of contactless torque sensors utilizing magnetoelastic effects [26–29] are constructional steels [30–32]. However, research on the magnetoelastic effect caused by torque and possibilities of sensor optimization are significantly limited. Although the magnetoelastic effect caused by axial stresses is well de- scribed in the literature [33,34], information on the influence of shearing stresses generated by torque on magnetic characteristics of constructional steels is not readily available. This paper addresses the gap in the state of the art by presenting the modeling results of the torque dependence of magnetic characteristics on drive shafts made of constructional steel. Following on from the previous work on the generalization of the axial and shear stress dependence of magnetic permeability tensors carried out in [35], this paper presents a novel approach to quantitative description of the torque dependences of magnetization process. Due to tensor description of magnetic permeability, the proposed approach enables considering the shear stress induced anisotropy of constructional steel magnetic permeability. Moreover, in the proposed model, the shear stress-induced anisotropy can be Materials 2021, 14, 4996. https://doi.org/10.3390/ma14174996 https://www.mdpi.com/journal/materials
-
Upload
khangminh22 -
Category
Documents
-
view
4 -
download
0
Transcript of A FEM-Based Optimization Method for Driving Frequency of ...

materials
Article
A FEM-Based Optimization Method for Driving Frequency ofContactless Magnetoelastic Torque Sensors in Steel Shafts
Anna Ostaszewska-Lizewska 1,* , Michał Nowicki 1 , Roman Szewczyk 2 and Mika Malinen 3
Citation: Ostaszewska-Lizewska, A.;
Nowicki, M.; Szewczyk, R.; Malinen,
M. A FEM-Based Optimization
Method for Driving Frequency of
Contactless Magnetoelastic Torque
Sensors in Steel Shafts. Materials 2021,
14, 4996. https://doi.org/10.3390/
ma14174996
Academic Editor: Roberto Citarella
Received: 21 July 2021
Accepted: 30 August 2021
Published: 1 September 2021
Publisher’s Note: MDPI stays neutral
with regard to jurisdictional claims in
published maps and institutional affil-
iations.
Copyright: © 2021 by the authors.
Licensee MDPI, Basel, Switzerland.
This article is an open access article
distributed under the terms and
conditions of the Creative Commons
Attribution (CC BY) license (https://
creativecommons.org/licenses/by/
4.0/).
1 Faculty of Mechatronics, Institute of Metrology and Biomedical Engineering,Warsaw University of Technology, sw. A. Boboli 8, 02-525 Warsaw, Poland; [email protected]
2 Łukasiewicz Research Network—Industrial Research Institute for Automation and Measurements PIAP,02-486 Warsaw, Poland; [email protected]
3 CSC–IT Center for Science, P.O. Box 405, FI-02101 Espoo, Finland; [email protected]* Correspondence: [email protected]; Tel.: +48-790-016-546
Abstract: This paper presents a novel finite element method (FEM) of optimization for drivingfrequency in magneto-mechanical systems using contactless magnetoelastic torque sensors. Theoptimization technique is based on the generalization of the axial and shear stress dependence of themagnetic permeability tensor. This generalization creates a new possibility for the determinationof the torque dependence of a permeability tensor based on measurements of the axial stress onthe magnetization curve. Such a possibility of quantitative description of torque dependence of amagnetic permeability tensor has never before been presented. Results from the FEM-based modelingmethod were validated against a real magnetoelastic torque sensor. The sensitivity characteristicsof the model and the real sensor show a maximum using a driving current of similar frequency.Consequently, the proposed method demonstrates the novel possibility of optimizing magnetoelasticsensors for automotive and industrial applications.
Keywords: contactless torque sensors; magnetic permeability tensor; torque sensor; FEM optimization
1. Introduction
Measuring the torque in mechanical shafts made of steel is a common challengefound in various industrial applications. Some examples of these applications includemarine propulsion systems [1,2], turbine generators [3–5], robotics [6–10], and automo-tive [11–14] and electromobility applications [15–17]. Due to the rotation of a mechanicalshaft under normal working conditions, powering a typical strain-gauge based torquesensor while collecting data is very challenging [3]. For this reason, the most promisingsolution from an application point of view after comparing the different types of shafttorque sensors [1,18–25] is contactless sensors.
Soft magnetic materials the most commonly used as cores of contactless torque sensorsutilizing magnetoelastic effects [26–29] are constructional steels [30–32]. However, researchon the magnetoelastic effect caused by torque and possibilities of sensor optimization aresignificantly limited. Although the magnetoelastic effect caused by axial stresses is well de-scribed in the literature [33,34], information on the influence of shearing stresses generatedby torque on magnetic characteristics of constructional steels is not readily available.
This paper addresses the gap in the state of the art by presenting the modeling resultsof the torque dependence of magnetic characteristics on drive shafts made of constructionalsteel. Following on from the previous work on the generalization of the axial and shearstress dependence of magnetic permeability tensors carried out in [35], this paper presentsa novel approach to quantitative description of the torque dependences of magnetizationprocess. Due to tensor description of magnetic permeability, the proposed approachenables considering the shear stress induced anisotropy of constructional steel magneticpermeability. Moreover, in the proposed model, the shear stress-induced anisotropy can be
Materials 2021, 14, 4996. https://doi.org/10.3390/ma14174996 https://www.mdpi.com/journal/materials

Materials 2021, 14, 4996 2 of 13
determined on the base of measurements of axial stress dependence of the magnetizationcurve [36]. This feature was not presented before in the literature. It should be highlightedthat the possibility of determination of shear stress dependence of magnetic permeabilitytensor on the base of axial stress permeability dependence measurements is very usefulfrom the practical point of view.
As a result, the proposed model may be efficiently applied for FEM-based modelingsolutions. On the base of experimentally determined axial stress permeability dependences,the proposed model provides insight for understanding of magnetization processes underthe influence of torque, as well as enables further contactless magnetoelastic torque sensorsdevelopment. This development creates the possibility of optimizing magneto-mechanicalsystems using contactless magnetoelastic sensors in the area of modern industrial applications.
2. Finite Element Model for Development of Contactless Torque Sensors UtilizingFerromagnetic Construction Steels
The description of the stress tensor σ dependence of relative magnetic permeability µrtensor is the foundation of partial differential equation-based models of the magnetoelasticeffect. Knowledge on the shear stress dependence of permeability is limited to specificsystems and materials [37]. Moreover, axial and shear stress may occur in magneto-mechanical systems simultaneously, which makes its description more complex.
It should be highlighted that, in the presence of stress induced anisotropy of magneticpermeability in materials, flux density B is not parallel to magnetizing field H. This phe-nomenon was neglected before [38]. In addition, due to sophisticated mechanical stressdistribution as well as due to the simultaneous presence of axial and shear stress, onlyfinite elements modelling (FEM) methods enable the comprehensive analysis of the stressdependence of the magnetization process in real systems.
Experimental results widely presented in the literature are mostly focused on theaxial stress dependence of isotropic magnetic materials such as construction steels [38,39].The axial stress dependence of relative permeability was previously estimated as a lineardependence given as follows [40]:
µr(σ) = 769 + 4.22 σ (1)
where σ and µr represent the axial stress (expressed in MPa) and relative permeability,respectively. However, it should be highlighted that a good agreement of Equation (1) withdetermination coefficient R2 exceeding the value 0.94 was observed only for limited valuesof axial mechanical stresses σ.
For the generalization of stress tensor dependence of relative magnetic permeabilityµr tensor, the principal stress concept was applied [35]. Considering the Mohr’s circleconcept [41,42], each stress tensor can be reduced to the vector of axial stresses (principalstresses tensor σP) that is rotated to the new coordinate system by the rotation matrixR [36,43]:
σ =
σxx τxy τxzτxy σyy τyzτxz τyz σzz
= R×
σPx 0 00 σPy 00 0 σPz
× R−1 (2)
Theoretical and experimental analyses presented in previous work indicate that effec-tive axial stresses σeff caused by the perpendicular stress σ⊥ can be calculated according tothe following dependence [42]:
σe f f = −ν× σ⊥ (3)
where ν is Poisson’s ratio. The Poisson’s ratio of constructional steels is typically equalto 0.3.
Considering Equation (3), the efficient axial stresses influencing the relative magneticpermeability µ tensor can be estimated as:
σe f f Px = σPx − νσPy − νσPz (4)

Materials 2021, 14, 4996 3 of 13
σe f f Py = σPy − νσPx − νσPz (5)
σe f f Pz = σPy − νσPx − νσPy (6)
Consequently, the relative magnetic permeability µr tensor can be calculated usingthe following equation:
µr = R×
µr
(σe f f Px
)0 0
0 µr
(σe f f Py
)0
0 0 µr
(σe f f Pz
)× R−1 (7)
For the plain torque, only shear stress occurs in the stress tensor. In this case, Equa-tion (2) can therefore be written as: 0 0 τxz
0 0 τyzτxz τyz 0
= R×
σPx 0 00 σPy 00 0 0
× R−1 (8)
Equation (7) is thus reduced to:
µr = R×
µr(σPx − νσPy
)0 0
0 µr(σPy − νσPx
)0
0 0 µr(−νσPx − νσPy
)× R−1 (9)
Plain torque is rarely observed in real systems. For this reason, it is highly recom-mended to implement the Finite Element Modeling (FEM) systems where the stress tensordependence of the relative magnetic permeability tensor is based on Equation (7).
3. Implementation of Proposed Model in Open-Source FEM-Oriented Software
The proposed model is implemented using an open-source software with GNU li-censes (Version 3, Free Software Foundation, Boston, MA, USA) which can be adaptedeasily by small companies without access to expensive licenses. Other commercial softwaresuch as ANSYS or COMSOL can be employed to implement the proposed optimizationmethod of stress sensors. In this investigation, the following software were used under theLINUX MINT [44] operating system—Octave 5.2.0 [45] (open-source MATLAB alternative),NETGEN [46], Elmer FEM [47] and ParaView [48]—to establish a modeling environment.
A schematic block diagram of the software interoperation is presented in Figure 1.ElmerGrid and ElmerSolver are modules of Elmer FEM software (Version 9.0, CSC—ITCenter for Science, Espoo, Finland) which can be used independently. The geometry modelis described in the NETGEN batch .geo file. The mesh is then computed using the Delaunaymethod and processed in ELMERGrid from a .gmsh file into Elmer mesh files. It should bestated that information exchange among modules is carried out using text files. These toolsare beneficial for simplifying the troubleshooting and validation stages of this process.
The tetrahedral mesh of a magneto-mechanical system is presented in Figure 2. Thismesh consists of a modelled shaft (1), a driving coil (2), and a sensing coil (3). The dimen-sions of the bounding box of the shaft with driving and sensing coils are x = y = 7.5 mmand z = 64 mm. The whole model was modelled in a sphere of radius r = 1 m. The mesh wasbuilt from 1,454,671 volume elements, 93,468 surface elements, and 140,202 edge elementsin total. The sphere was assigned the properties of air at room temperature, and the copperand shaft coils were assigned the properties of structural steel. The relative magneticpermeability tensor µr was calculated by using the procedure written in the FORTRANprogramming language. The current density in the magnetizing coil and the torque loadapplied to the shaft were implemented within a .sif file in the MATC language as a sourceand boundary conditions for the model.

Materials 2021, 14, 4996 4 of 13Materials 2021, 14, x FOR PEER REVIEW 4 of 14
Figure 1. A schematic block diagram of information flow during the modeling process.
The tetrahedral mesh of a magneto‐mechanical system is presented in Figure 2. This
mesh consists of a modelled shaft (1), a driving coil (2), and a sensing coil (3). The di‐
mensions of the bounding box of the shaft with driving and sensing coils are x = y = 7.5
mm and z = 64 mm. The whole model was modelled in a sphere of radius r = 1 m. The
mesh was built from 1,454,671 volume elements, 93,468 surface elements, and 140,202
edge elements in total. The sphere was assigned the properties of air at room tempera‐
ture, and the copper and shaft coils were assigned the properties of structural steel. The
relative magnetic permeability tensor 𝜇 was calculated by using the procedure written
in the FORTRAN programming language. The current density in the magnetizing coil
and the torque load applied to the shaft were implemented within a .sif file in the MATC
language as a source and boundary conditions for the model.
The output signal on the real sensor is the voltage measured across a precise 1 kΩ
resistor that is connected to the sensing coil. In the FEM modeling, the voltage was cal‐
culated from the base value of the current in the sensing coil while the resistance was
modelled by measuring the resistance of a whole coil. This approach ensures the actual
voltage drop across the resistor can be measured accurately.
Shaft geometry
NETGEN
ElmerSolver
Octave
ParaView
ElmerGrid
.geo file
.gmsh file
.dat file
.sif file
meshing
FEM modeling
.vtu filevisualization
Elmer mesh file
Figure 1. A schematic block diagram of information flow during the modeling process.
Materials 2021, 14, x FOR PEER REVIEW 5 of 14
Figure 2. The tetrahedral mesh of the modelled system; 1—shaft, 2—magnetizing coil, 3—sensing
coil.
The calculations were automated using scripts in Octave which generated batch .sif
files and were run using the ElmerSolver. A total of 18 simulations were carried out for
nine values of supply current with AC frequencies: 50 Hz, 250 Hz, 500 Hz, 1 kHz, 1.5
kHz, 2 kHz, 3 kHz, 4 kHz, and 5 kHz. The current amplitude used was 0.5 A for two
values of torque load: 1.3 Nm and 0 Nm (no load), respectively. The results were then
visualized using the ParaView software.
Figure 3 shows the vectors of magnetic field strength 𝐻 before (Figure 3a) and after (Figure 3b) applying torque when the driving coil current frequency is equal to 5 kHz, the
amplitude is 0.5 A, and the number of turns of the driving coil is 150. It is clearly seen that
the direction of the vectors which were previously parallel to the axis of the shaft have
now become helically skewed. The same phenomenon can be observed for magnetic flux
density vectors 𝐵 as shown in Figure 4 where the driving current frequency, amplitude,
and number of turns of the driving coil are set to 5 kHz, 0.5 A, and 200 respectively.
(a)
Figure 2. The tetrahedral mesh of the modelled system; 1—shaft, 2—magnetizing coil, 3—sensing coil.
The output signal on the real sensor is the voltage measured across a precise 1 kΩresistor that is connected to the sensing coil. In the FEM modeling, the voltage wascalculated from the base value of the current in the sensing coil while the resistance wasmodelled by measuring the resistance of a whole coil. This approach ensures the actualvoltage drop across the resistor can be measured accurately.
The calculations were automated using scripts in Octave which generated batch .siffiles and were run using the ElmerSolver. A total of 18 simulations were carried out fornine values of supply current with AC frequencies: 50 Hz, 250 Hz, 500 Hz, 1 kHz, 1.5 kHz,2 kHz, 3 kHz, 4 kHz, and 5 kHz. The current amplitude used was 0.5 A for two values oftorque load: 1.3 Nm and 0 Nm (no load), respectively. The results were then visualizedusing the ParaView software.
Figure 3 shows the vectors of magnetic field strength H before (Figure 3a) and after(Figure 3b) applying torque when the driving coil current frequency is equal to 5 kHz, the

Materials 2021, 14, 4996 5 of 13
amplitude is 0.5 A, and the number of turns of the driving coil is 150. It is clearly seen thatthe direction of the vectors which were previously parallel to the axis of the shaft havenow become helically skewed. The same phenomenon can be observed for magnetic fluxdensity vectors B as shown in Figure 4 where the driving current frequency, amplitude,and number of turns of the driving coil are set to 5 kHz, 0.5 A, and 200 respectively.
Materials 2021, 14, x FOR PEER REVIEW 5 of 14
Figure 2. The tetrahedral mesh of the modelled system; 1—shaft, 2—magnetizing coil, 3—sensing
coil.
The calculations were automated using scripts in Octave which generated batch .sif
files and were run using the ElmerSolver. A total of 18 simulations were carried out for
nine values of supply current with AC frequencies: 50 Hz, 250 Hz, 500 Hz, 1 kHz, 1.5
kHz, 2 kHz, 3 kHz, 4 kHz, and 5 kHz. The current amplitude used was 0.5 A for two
values of torque load: 1.3 Nm and 0 Nm (no load), respectively. The results were then
visualized using the ParaView software.
Figure 3 shows the vectors of magnetic field strength 𝐻 before (Figure 3a) and after (Figure 3b) applying torque when the driving coil current frequency is equal to 5 kHz, the
amplitude is 0.5 A, and the number of turns of the driving coil is 150. It is clearly seen that
the direction of the vectors which were previously parallel to the axis of the shaft have
now become helically skewed. The same phenomenon can be observed for magnetic flux
density vectors 𝐵 as shown in Figure 4 where the driving current frequency, amplitude,
and number of turns of the driving coil are set to 5 kHz, 0.5 A, and 200 respectively.
(a)
Materials 2021, 14, x FOR PEER REVIEW 6 of 14
(b)
Figure 3. Magnetic field strength inside the shaft (first cross‐section along the shaft axis and the
second perpendicularly to the shaft axis, through the center of the length of the shaft and the coils)
for different values of torque M: (a) M = 0 Nm, (b) torque M = 1.3 Nm; 1—shaft (transparent),
2—magnetizing coil, 3—sensing coil.
(a)
(b)
Figure 4. Magnetic flux density inside the shaft for different values of torque M: (a) M = 0 Nm, (b)
torque M = 1.3 Nm; 1—shaft (transparent), 2—magnetizing coil, 3—sensing coil.
Figure 3. Magnetic field strength inside the shaft (first cross-section along the shaft axis and thesecond perpendicularly to the shaft axis, through the center of the length of the shaft and the coils)for different values of torque M: (a) M = 0 Nm, (b) torque M = 1.3 Nm; 1—shaft (transparent),2—magnetizing coil, 3—sensing coil.
The skewness of the magnetic field strength and flux density is connected with thedirection of the easy axes of the stress induced anisotropy tensor µr. These easy axes are ob-served by the rotation matrix R which was available during the Elmer Solver modeling. Itshould be highlighted that the observed results of the magnetic field strength and flux den-sity modeling agree with previously presented experimental results in references [29,49].
Figure 5a,b show a cross-section view of the eddy current densities j before and afterapplying torque of 1.3 Nm. Similar to the modeling conditions presented in Figures 3 and 4,the driving current frequency, amplitude, and number of turns of the driving coil are 5 kHz,0.5 A, and 150, respectively.
Before applying any torque, the current density vectors are tangent to the circledefining the circumference of the shaft and are contained in a plane perpendicular to theshaft axis. After applying a torque of 1.3 Nm, the eddy currents density vectors appearingon the shaft’s surface have a greater value and are tangent to the thread line. Looking atthe whole volume excluding the surface, there are smaller vectors with a direction that is

Materials 2021, 14, 4996 6 of 13
parallel to the shaft axis running in the opposite way. This shows how the current circulateson the surface and returns to the center of the shaft.
Materials 2021, 14, x FOR PEER REVIEW 6 of 14
(b)
Figure 3. Magnetic field strength inside the shaft (first cross‐section along the shaft axis and the
second perpendicularly to the shaft axis, through the center of the length of the shaft and the coils)
for different values of torque M: (a) M = 0 Nm, (b) torque M = 1.3 Nm; 1—shaft (transparent),
2—magnetizing coil, 3—sensing coil.
(a)
(b)
Figure 4. Magnetic flux density inside the shaft for different values of torque M: (a) M = 0 Nm, (b)
torque M = 1.3 Nm; 1—shaft (transparent), 2—magnetizing coil, 3—sensing coil. Figure 4. Magnetic flux density inside the shaft for different values of torque M: (a) M = 0 Nm,(b) torque M = 1.3 Nm; 1—shaft (transparent), 2—magnetizing coil, 3—sensing coil.
It should be highlighted that eddy current flow in the parallel direction of the shaftsubjected to torque has never been observed before. In spite of the fact that the amplitudeof such parallel eddy currents is relatively small, this phenomenon may be practicallyutilized in the area of non-destructive testing of conductive shafts subjected to torque andshear stresses. Material discontinuities inside of a shaft may influence parallel eddy currentdistribution, which may be observed utilizing an eddy current tomography [50]. In such acase, the model presented in Section 2 creates the possibility of quantitative descriptionof eddy current distribution and efficient estimation of a size and character of possiblediscontinuities in the core of a driving shaft subjected to torque.
The cause of all the results presented in Figures 3–5 is the influence of the complexstress distribution introduced by the torsion on the magnetic permeability µr tensor, whichchanges the anisotropy direction of the material [36]. For further validation, the sourcecode for modeling the magnetoelastic torque sensors is available at Supplementary Mate-rials: https://github.com/ostaszewska/ElmerFEM_Shaft_torque under the open-sourceMIT license.

Materials 2021, 14, 4996 7 of 13
Materials 2021, 14, x FOR PEER REVIEW 7 of 14
The skewness of the magnetic field strength and flux density is connected with the
direction of the easy axes of the stress induced anisotropy tensor 𝜇 . These easy axes are
observed by the rotation matrix 𝑅 which was available during the Elmer Solver model‐
ing. It should be highlighted that the observed results of the magnetic field strength and
flux density modeling agree with previously presented experimental results in references
[29,49].
Figure 5a,b show a cross‐section view of the eddy current densities 𝑗 before and after applying torque of 1.3 Nm. Similar to the modeling conditions presented in Figures
3 and 4, the driving current frequency, amplitude, and number of turns of the driving coil
are 5 kHz, 0.5 A, and 150, respectively.
(a)
(b)
Figure 5. A cross‐section view of the eddy current vectors along the shaft’s axis for different values
of torque M: (a) M = 0 Nm, (b) torque M = 1.3 Nm; 1—shaft (transparent), 2—magnetizing coil,
3—sensing coil.
Before applying any torque, the current density vectors are tangent to the circle de‐
fining the circumference of the shaft and are contained in a plane perpendicular to the
shaft axis. After applying a torque of 1.3 Nm, the eddy currents density vectors appear‐
ing on the shaft’s surface have a greater value and are tangent to the thread line. Looking
at the whole volume excluding the surface, there are smaller vectors with a direction that
is parallel to the shaft axis running in the opposite way. This shows how the current cir‐
culates on the surface and returns to the center of the shaft.
It should be highlighted that eddy current flow in the parallel direction of the shaft
subjected to torque has never been observed before. In spite of the fact that the amplitude
of such parallel eddy currents is relatively small, this phenomenon may be practically
Figure 5. A cross-section view of the eddy current vectors along the shaft’s axis for different valuesof torque M: (a) M = 0 Nm, (b) torque M = 1.3 Nm; 1—shaft (transparent), 2—magnetizing coil,3—sensing coil.
4. Experimental Validation of Proposed Model
The experimental validation of the proposed model was performed on a 7250R driveshaft (Traxxas, McKinney, TX, USA) which is made of constructional steel. This typeof shaft is generally used for electric vehicle models on a 1:16 scale. The geometry anddimensions of the shaft are shown in Figure 6a. For the purpose of this experiment, twocoils were wound on the shaft: the magnetizing coil (where the length of the entire shaftis 150 turns) and a sensing coil of 50 turns. The coil arrangement diagram is presented inFigure 6b where numbers ‘1’, ‘2’, and ‘3’ denote the shaft, magnetizing coil, and sensingcoil, respectively, and the given dimensions are in millimeters. One end of the shaft wasanchored, and torque was applied to the other end by hanging weights on a lever arm.
All measurements were done with the measurement system setup which is presentedin the schematic block diagram shown in Figure 7. The experimental setup consists ofthe following:
- SDG1050 signal generator (Siglent, Helmond, The Netherlands);- P334 current amplifier (Meratronic, Warsaw, Poland);- Precise resistor 1 kΩ (INCO, Warsaw, Poland);- Voltmeter W7-37 (Petersburg, Russia);- Fluxmeter LakeShore 480 (Lake Shore Cryotronics, Inc., Westerville, OH, USA);- AC voltmeter W7-38 (Leningrad, USSR);- Oscilloscope Ultron 539 (Munchen, Germany);- Oscilloscope Tektronix MDO4024C (Beaverton, OR, USA);- PC computer (X-KOM, Warsaw, Poland).

Materials 2021, 14, 4996 8 of 13
Materials 2021, 14, x FOR PEER REVIEW 8 of 14
utilized in the area of non‐destructive testing of conductive shafts subjected to torque and
shear stresses. Material discontinuities inside of a shaft may influence parallel eddy cur‐
rent distribution, which may be observed utilizing an eddy current tomography [50]. In
such a case, the model presented in Section 2 creates the possibility of quantitative de‐
scription of eddy current distribution and efficient estimation of a size and character of
possible discontinuities in the core of a driving shaft subjected to torque.
The cause of all the results presented in Figures 3–5 is the influence of the complex
stress distribution introduced by the torsion on the magnetic permeability 𝜇 tensor, which changes the anisotropy direction of the material [36]. For further validation, the
source code for modeling the magnetoelastic torque sensors is available at Supplemen‐
tary Materials: https://github.com/ostaszewska/ElmerFEM_Shaft_torque under the
open‐source MIT license.
4. Experimental Validation of Proposed Model
The experimental validation of the proposed model was performed on a 7250R drive
shaft (Traxxas, McKinney, TX, USA) which is made of constructional steel. This type of
shaft is generally used for electric vehicle models on a 1:16 scale. The geometry and di‐
mensions of the shaft are shown in Figure 6a. For the purpose of this experiment, two
coils were wound on the shaft: the magnetizing coil (where the length of the entire shaft
is 150 turns) and a sensing coil of 50 turns. The coil arrangement diagram is presented in
Figure 6b where numbers ‘1’, ‘2’, and ‘3’ denote the shaft, magnetizing coil, and sensing
coil, respectively, and the given dimensions are in millimeters. One end of the shaft was
anchored, and torque was applied to the other end by hanging weights on a lever arm.
Figure 6. Geometry of the tested shaft: (a) shaft dimensions, (b) coil arrangement diagram; 1: shaft,
2: driving coil, 3: sensing coil. All dimensions are given in mm.
All measurements were done with the measurement system setup which is pre‐
sented in the schematic block diagram shown in Figure 7. The experimental setup con‐
sists of the following:
‐ SDG1050 signal generator (Siglent, Helmond, The Netherlands);
‐ P334 current amplifier (Meratronic, Warsaw, Poland);
‐ Precise resistor 1 kΩ (INCO, Warsaw, Poland);
‐ Voltmeter W7‐37 (Petersburg, Russia);
‐ Fluxmeter LakeShore 480 (Lake Shore Cryotronics, Inc., Westerville, OH, USA);
‐ AC voltmeter W7‐38 (Leningrad, USSR);
‐ Oscilloscope Ultron 539 (Munchen, Germany);
Figure 6. Geometry of the tested shaft: (a) shaft dimensions, (b) coil arrangement diagram; 1: shaft,2: driving coil, 3: sensing coil. All dimensions are given in mm.
A dedicated software was installed on the PC computer to control the signal generatorand collect data simultaneously in the LabView environment (National Instruments, Austin,TX, USA).
The experiment was carried out using 33 frequency values ranging from 50 Hz upto 5 kHz that were increased gradually in an adaptive pattern. The amplitude of drivingcurrent was constant and set to 0.5 APeak. For each frequency change, the voltage inducedon the sensing coil was measured for the shaft without torque (UdetM0(f )) and when thetorque value was equal to 1.3 Nm (UdetM1.3(f )). Two values of torque M were selectedto linearize the torque dependence of the output signal and to simplify the model forphenomenon explanation. The sensitivity value S(f ) for each frequency was calculatedaccording to the following equation:
S( f ) =∆Udet( f )
∆Udet_range(10)
where:∆Udet( f ) = UdetM0( f )−UdetM1.3( f ), (11)
and∆Udet_range = ∆Udet_max − ∆Udet_min (12)
In Equation (12), ∆Udet_max is the maximum computed value of ∆Udet( f ) and ∆Udet_minis the minimum value.
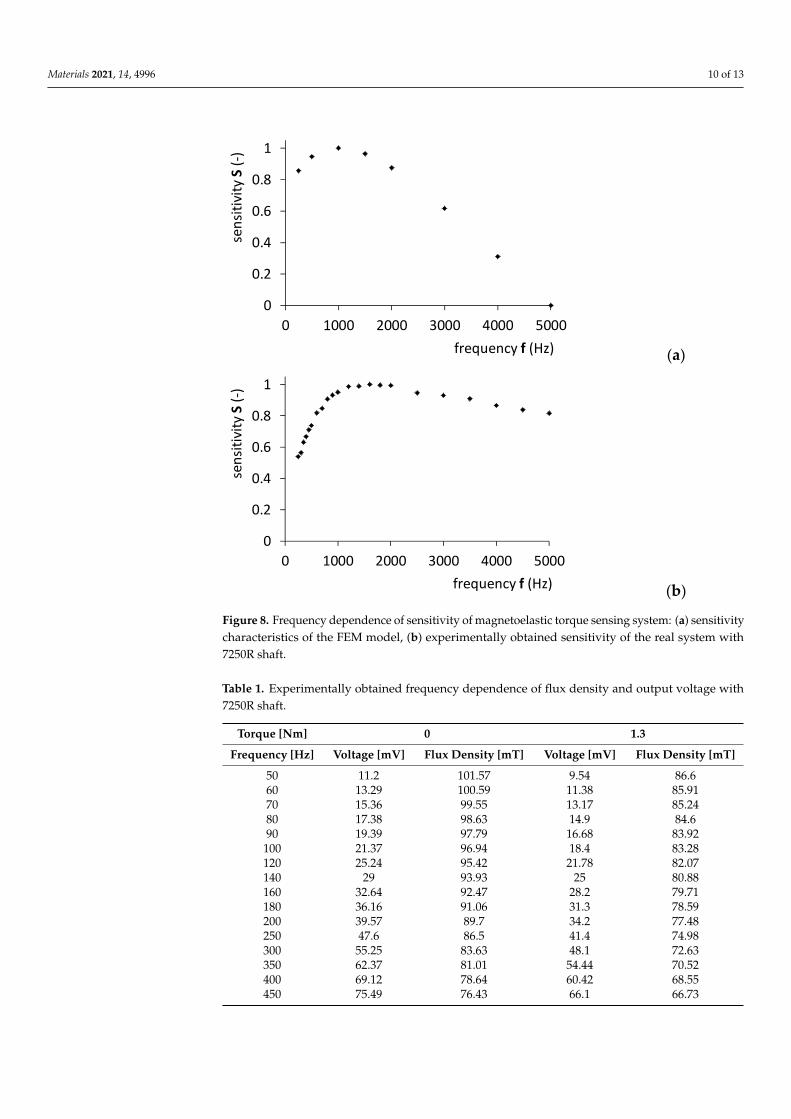
Figure 8 presents the experimental results obtained for the sensitivity value S(f ) incomparison to the FEM modeling, while Table 1 provides detailed experimental results.
The output voltage and flux density characteristics were similar, which is due to lowmagnetizing fields used, and thus the steel shaft was working in the initial part of themagnetization curve. For practical engineering applications, the output voltage sensitivitycharacteristic is further discussed.
It should be highlighted that stress dependence of magnetic properties of materials(such as magnetic permeability tensor) is nonlinear for a wide range of axial or shearstresses. This nonlinearity is the main reason for differences between the results of ex-periments and modeling presented in Figure 8. Moreover, the decrease in magnetoelasticsensitivity for higher frequencies is connected with the strong influence of eddy currentskin effect in conductive bulk elements made of constructional steel. This phenomenon is

Materials 2021, 14, 4996 9 of 13
especially visible in the case of real shafts. For driving frequencies exceeding 5 kHz, thesensitivity of the sensor radically degrades due to the roughness of a surface of materialand non-uniform distribution of surface stresses.
Materials 2021, 14, x FOR PEER REVIEW 9 of 14
‐ Oscilloscope Tektronix MDO4024C (Beaverton, OR, USA);
‐ PC computer (X‐KOM, Warsaw, Poland).
A dedicated software was installed on the PC computer to control the signal gener‐
ator and collect data simultaneously in the LabView environment (National Instruments,
Austin, TX, USA).
(a)
(b)
Figure 7. The measurement setup for testing the magnetoelastic torque sensing system: (a) sche‐
matic diagram, (b) photograph of the system.
The experiment was carried out using 33 frequency values ranging from 50 Hz up to
5 kHz that were increased gradually in an adaptive pattern. The amplitude of driving
current was constant and set to 0.5 APeak. For each frequency change, the voltage induced
on the sensing coil was measured for the shaft without torque (UdetM0(f)) and when the
torque value was equal to 1.3 Nm (UdetM1.3(f)). Two values of torque M were selected to
linearize the torque dependence of the output signal and to simplify the model for phe‐
Figure 7. The measurement setup for testing the magnetoelastic torque sensing system: (a) schematicdiagram, (b) photograph of the system.
On the other hand, in both scenarios, the maximum sensitivity is observed to beapproximately 1.2 kHz. As a result, in determining the optimal sensor driving frequency,important similarities can be observed between the obtained experimental results and theproposed FEM-based modeling results.
Materials 2021, 14, 4996 10 of 13
Materials 2021, 14, x FOR PEER REVIEW 11 of 14
3000 245.7 37.6 217 33.14
3500 268 35.15 236.5 30.94
4000 289 33.18 254.6 29.176
4500 309.3 31.55 272.2 27.72
5000 328.7 30.18 289 26.49
(a)
(b)
Figure 8. Frequency dependence of sensitivity of magnetoelastic torque sensing system: (a) sensi‐
tivity characteristics of the FEM model, (b) experimentally obtained sensitivity of the real system
with 7250R shaft.
It should be highlighted that stress dependence of magnetic properties of materials
(such as magnetic permeability tensor) is nonlinear for a wide range of axial or shear
stresses. This nonlinearity is the main reason for differences between the results of ex‐
periments and modeling presented in Figure 8. Moreover, the decrease in magnetoelastic
sensitivity for higher frequencies is connected with the strong influence of eddy current
skin effect in conductive bulk elements made of constructional steel. This phenomenon is
especially visible in the case of real shafts. For driving frequencies exceeding 5 kHz, the
sensitivity of the sensor radically degrades due to the roughness of a surface of material
and non‐uniform distribution of surface stresses.
On the other hand, in both scenarios, the maximum sensitivity is observed to be
approximately 1.2 kHz. As a result, in determining the optimal sensor driving frequency,
important similarities can be observed between the obtained experimental results and the
proposed FEM‐based modeling results.
0
0.2
0.4
0.6
0.8
1
0 1000 2000 3000 4000 5000
frequency f (Hz)
sensitivity S(‐)
0
0.2
0.4
0.6
0.8
1
0 1000 2000 3000 4000 5000
frequency f (Hz)
sensitivity S(‐)
Figure 8. Frequency dependence of sensitivity of magnetoelastic torque sensing system: (a) sensitivitycharacteristics of the FEM model, (b) experimentally obtained sensitivity of the real system with7250R shaft.
Table 1. Experimentally obtained frequency dependence of flux density and output voltage with7250R shaft.
Torque [Nm] 0 1.3
Frequency [Hz] Voltage [mV] Flux Density [mT] Voltage [mV] Flux Density [mT]
50 11.2 101.57 9.54 86.660 13.29 100.59 11.38 85.9170 15.36 99.55 13.17 85.2480 17.38 98.63 14.9 84.690 19.39 97.79 16.68 83.92100 21.37 96.94 18.4 83.28120 25.24 95.42 21.78 82.07140 29 93.93 25 80.88160 32.64 92.47 28.2 79.71180 36.16 91.06 31.3 78.59200 39.57 89.7 34.2 77.48250 47.6 86.5 41.4 74.98300 55.25 83.63 48.1 72.63350 62.37 81.01 54.44 70.52400 69.12 78.64 60.42 68.55450 75.49 76.43 66.1 66.73

Materials 2021, 14, 4996 11 of 13
Table 1. Cont.
Torque [Nm] 0 1.3
Frequency [Hz] Voltage [mV] Flux Density [mT] Voltage [mV] Flux Density [mT]
500 81.57 74.37 71.5 65.04600 92.8 70.69 81.6 61.98700 103.26 67.45 90.9 59.26800 112.8 64.57 99.54 56.82900 121.7 61.99 107.5 54.62
1000 130.1 59.66 115 52.641200 145.5 55.64 128.8 49.161400 159.5 52.28 141.2 46.221600 172.3 49.44 152.6 43.721800 184.3 47.02 163.2 41.572000 195.6 44.92 173.2 39.72500 221.9 40.74 196.1 35.963000 245.7 37.6 217 33.143500 268 35.15 236.5 30.944000 289 33.18 254.6 29.1764500 309.3 31.55 272.2 27.725000 328.7 30.18 289 26.49
5. Conclusions
The presented results in this paper have confirmed the possibility of modeling thetorque dependence of magnetization processes in steel shafts. Considering previouslypresented work on the generalization of stress dependence of a magnetic permeabilitytensor, the proposed generalization represents the dynamic magnetization process that isconnected to the eddy currents in a magnetized shaft. From modeling, it is achievable toobserve the helical anisotropy in the shaft that is subjected to torque and the axial eddycurrents in this shaft. It should be highlighted that research on the axial component ineddy current distribution in magnetoelastic shafts that are subjected to torque has not beenpresented previously in the literature.
The FEM-based modeling results have confirmed the prospect of determining theoptimal driving frequency for magnetoelastic torque sensors with a core made of construc-tion steel. The modeling and experimental test results both showed an optimal frequencyof approximately 1.2 kHz. It is noted, however, that the optimal driving frequency ofmagnetoelastic sensors may be strongly dependent on its geometry and the type of steelused for the shaft. Therefore, modeling should be carried out specifically for any givenmaterial using the specific geometry of the magnetoelastic sensing shaft.
In future works, better modelling accuracy could be achieved with the use of anexperimentally obtained model of the Anhysteretic Magnetization curve for given material,due to the recent achievements in this area [51].
Supplementary Materials: The following are available online at https://github.com/ostaszewska/ElmerFEM_Shaft_torque.
Author Contributions: Conceptualization, A.O.-L. and R.S.; methodology, A.O.-L. and M.N.; soft-ware, A.O.-L., M.M. and R.S.; validation, A.O.-L., and M.N.; investigation, A.O.-L.; data curation,A.O.-L. and M.N.; writing—original draft preparation, A.O.-L.; writing—review and editing, A.O.-L.,M.M., M.N. and R.S.; visualization, A.O.-L.; supervision, A.O.-L.; project administration, A.O.-L.; funding acquisition, A.O.-L. All authors have read and agreed to the published version ofthe manuscript.
Funding: This research was supported by the small grant of the Scientific Council of MechanicalEngineering, Warsaw University of Technology, grant number 504/04498/1142/43.090008.
Institutional Review Board Statement: Not applicable.
Informed Consent Statement: Not applicable.

Materials 2021, 14, 4996 12 of 13
Data Availability Statement: Not applicable.
Conflicts of Interest: The authors declare no conflict of interest.
References1. Džapo, H.; Stare, Z.; Bobanac, N. Digital Measuring System for Monitoring Motor Shaft Parameters on Ships. IEEE Trans. Instrum.
Meas. 2009, 58, 3702–3712. [CrossRef]2. Bonisławski, M.; Hołub, M.; Borkowski, T.; Kowalak, P. A Novel Telemetry System for Real Time, Ship Main Propulsion Power
Measurement. Sensors 2019, 19, 4771. [CrossRef]3. Hammons, T.J.; Chanal, L. Measurement of torque in steam turbine-generator shafts following severe disturbances on the
electrical supply system-analysis and implementation. IEEE Trans. Energy Convers. 1991, 6, 193–203. [CrossRef]4. Zhang, H.; Wenske, J.; Reuter, A.; Neshati, M. Proposals for a practical calibration method for mechanical torque measurement on
the wind turbine drive train under test on a test bench. Wind Energy 2020, 23, 1048–1062. [CrossRef]5. Zhang, H.; De Luna, R.O.; Pilas, M.; Wenske, J. A study of mechanical torque measurement on the wind turbine drive train-ways
and feasibilities. Wind Energy 2018, 21, 1406–1422. [CrossRef]6. Khan, H.; D’Imperio, M.; Cannella, F.; Caldwell, D.G.; Cuschieri, A.; Semini, C. Towards Scalable Strain Gauge-Based Joint Torque
Sensors. Sensors 2017, 17, 1905. [CrossRef] [PubMed]7. Joubair, A.; Zhao, L.F.; Bigras, P.; Bonev, I.A. Use of a Force-Torque Sensor for Self-Calibration of a 6-DOF Medical Robot. Sensors
2016, 16, 798. [CrossRef]8. Tang, T.; Lin, H.-C.; Zhao, Y.; Chen, W.; Tomizuka, M. Autonomous alignment of peg and hole by force/torque measurement for
robotic assembly. In Proceedings of the 2016 IEEE International Conference on Automation Science and Engineering (CASE), FortWorth, TX, USA, 21–25 August 2016.
9. O’Neill, J.J.; Stephens, T.K.; Kowalewski, T.M. Evaluation of Torque Measurement Surrogates as Applied to Grip Torque and JawAngle Estimation of Robotic Surgical Tools. IEEE Robot. Autom. Lett. 2018, 3, 3027–3034. [CrossRef]
10. Jung, B.-J.; Kim, B.; Koo, J.C.; Choi, H.R.; Moon, H. Joint Torque Sensor Embedded in Harmonic Drive Using Order TrackingMethod for Robotic Application. IEEE/ASME Trans. Mechatron. 2017, 22, 1594–1599. [CrossRef]
11. Fleming, W. Automotive torque measurement: A summary of seven different methods. In Proceedings of the 32nd IEEE VehicularTechnology Conference, San Diego, CA, USA, 23–26 March 1982; pp. 71–78.
12. Gao, B.; Chen, H.; Ma, Y.; Sanada, K. Design of nonlinear shaft torque observer for trucks with Automated Manual Transmission.Mechatronics 2011, 21, 1034–1042. [CrossRef]
13. Kim, W.; Kang, C.M.; Son, Y.-S.; Chung, C.C. Nonlinear Steering Wheel Angle Control Using Self-Aligning Torque with Torqueand Angle Sensors for Electrical Power Steering of Lateral Control System in Autonomous Vehicles. Sensors 2018, 18, 4384.[CrossRef]
14. Bitar, S.; Probst, J.S.; Garshelis, I.J. Development of a Magnetoelastic Torque Sensor for Formula 1 and CHAMP Car RacingApplications. SAE Tech. Pap. Ser. 2000, 1, 85. [CrossRef]
15. Stahl, K.; Höhn, B.-R.; Otto, H.-P.; Bäumler, R.; Hasl, C. Electro Mechanically Actuated Torque Sensing Multi-Disc. Clutch for AutomaticTransmissions–Electro Mechanic Powershift Clutch; Springer: Berlin, Germany, 2013; pp. 85–104.
16. Zhao, Z.; Chen, H.; Yang, Y. Fuzzy Determination of Target Shifting Time and Torque Control of Shifting Phase for Dry DualClutch Transmission. Math. Probl. Eng. 2014, 2014, 347490. [CrossRef]
17. Zhao, Z.-G.; Chen, H.-J.; Yang, Y.-Y.; He, L. Torque coordinating robust control of shifting process for dry dual clutch transmissionequipped in a hybrid car. Veh. Syst. Dyn. 2015, 53, 1269–1295. [CrossRef]
18. Petreus, D.; Farca, C.; Dobra, P.; Moga, D. Torque measurement system design. In Proceedings of the 2008 IEEE InternationalConference on Automation, Quality and Testing, Robotics, Pasadena, CA, USA, 19–23 May 2008; pp. 174–177.
19. Jin, H.; Lu, W.-Y. Strain Measurement of Microsamples Using Laser Interferometry. In Proceedings of the ASME 2006 InternationalMechanical Engineering Congress and Exposition, Chicago, IL, USA, 5–10 November 2006; pp. 563–567.
20. Zupan, M.; Hemker, K.J. Application of fourier analysis to the laser based interferometric strain/displacement gage. Exp. Mech.2002, 42, 214–220. [CrossRef]
21. Zi, X.; Geng, S.; Zhao, S.; Shu, F. Measurement of short shaft power based on a digital speckle correlation method. Meas. Sci.Technol. 2015, 26, 045001. [CrossRef]
22. Zi, X.; Geng, S.; Zhao, S.; Wang, Y.; Qin, W. Research on Principle of Saft Dynamic Torque Measurement Based on DigitalIndustrial Photogrammetry Technology. Chin. J. Lasers 2015, 42, 208002. [CrossRef]
23. Kruger, L.; Swart, P.L.; Chtcherbakov, A.A.; van Wyk, A.J. Non-contact torsion sensor using fibre Bragg gratings. Meas. Sci.Technol. 2004, 15, 1448–1452. [CrossRef]
24. Wang, Y.; Liang, L.; Yuan, Y.; Xu, G.; Liu, F. A Two Fiber Bragg Gratings Sensing System to Monitor the Torque of Rotating Shaft.Sensors 2016, 16, 138. [CrossRef]
25. Silva, D.; Mendes, J.C.; Pereira, A.B.; Gégot, F.; Alves, L.N. Measuring Torque and Temperature in a Rotating Shaft UsingCommercial SAW Sensors. Sensors 2017, 17, 1547. [CrossRef] [PubMed]
26. Bienkowski, A.; Szewczyk, R.; Salach, J. Industrial Application of Magnetoelastic Force and Torque Sensors. Acta Phys. Pol. A2010, 118, 1008–1009. [CrossRef]

Materials 2021, 14, 4996 13 of 13
27. Bienkowski, A.; Szewczyk, R. The possibility of utilizing the high permeability magnetic materials in construction of magnetoe-lastic stress and force sensors. Sens. Actuators A Phys. 2004, 113, 270–276. [CrossRef]
28. Dahle, O. The pressductor and the torductor—Two heavy-duty transducers based on magnetic stress sensitivity. IEEE Trans.Commun. Electron. 1964, 83, 752–758. [CrossRef]
29. Salach, J.; Bienkowski, A.; Szewczyk, R. The ring-shaped magnetoelastic torque sensors utilizing soft amorphous magneticmaterials. J. Magn. Magn. Mater. 2007, 316, e607–e609. [CrossRef]
30. Jackiewicz, D. Stress assessment in steel truss structures on the basis of magnetoelastic effects. Adv. Mechatron. Solut. 2016, 393,467–472.
31. Jackiewicz, D.; Kachniarz, M.; Bienkowski, A.; Szewczyk, R. Possibilities of Application of the Magnetoelastic Effect for StressAssessment in Construction Elements Made of Steel Considering Rayleigh Region. Adv. Intell. Syst. Comput. 2017, 543, 689–697.[CrossRef]
32. Jackiewicz, D.; Nowicki, M.; Szewczyk, R.; Bienkowski, A.; Kachniarz, M.; Salach, J.; Kaminski, M. Application of MagnetoelasticEffects for Stress Assesment and Risk Mitigation in Constructions. J. Eng. Stud. Res. 2015, 21, 65–70. [CrossRef]
33. Bienkowski, A. Magnetoelastic Villari effect in Mn–Zn ferrites. J. Magn. Magn. Mater. 2000, 215–216, 231–233. [CrossRef]34. Dapino, M.; Smith, R.; Flatau, A. Structural magnetic strain model for magnetostrictive transducers. IEEE Trans. Magn. 2000, 36,
545–556. [CrossRef]35. Ostaszewska-Lizewska, A.; Szewczyk, R.; Råback, P.; Malinen, M. Modelling the Characteristics of Ring-Shaped Magnetoelastic
Force Sensor in Mohri’s Configuration. Sensors 2020, 20, 266. [CrossRef] [PubMed]36. Szewczyk, R. Generalization of the Model of Magnetoelastic Effect: 3D Mechanical Stress Dependence of Magnetic Permeability
Tensor in Soft Magnetic Materials. Materials 2020, 13, 4070. [CrossRef]37. Aydin, U.; Rasilo, P.; Martin, F.; Belahcen, A.; Daniel, L.; Haavisto, A.; Arkkio, A. Effect of multi-axial stress on iron losses of
electrical steel sheets. J. Magn. Magn. Mater. 2019, 469, 19–27. [CrossRef]38. Sablik, M. Modeling stress dependence of magnetic properties for NDE of steels. Nondestruct. Test. Eval. 1989, 5, 49–65. [CrossRef]39. Kaido, C.; Hirose, N.; Iwasa, S.; Hayashi, T.; Waki, Y. Stress Dependence of Magnetic Properties in Non-oriented Electrical Steel
Sheets. J. Magn. Soc. Jpn. 2010, 34, 140–145. [CrossRef]40. Timoshenko, S.; Goodier, J.N. Theory of Elasticity; McGraw-Hill: New York, NY, USA, 1970.41. Mohri, K. Review on recent advances in the field of amorphous-metal sensors and transducers. IEEE Trans. Magn. 1984, 20,
942–947. [CrossRef]42. Kwun, H. Investigation of the dependence of Barkhausen noise on stress and the angle between the stress and magnetization
directions. J. Magn. Magn. Mater. 1985, 49, 235–240. [CrossRef]43. Stuelpnagel, J. On the Parametrization of the Three-Dimensional Rotation Group. SIAM Rev. 1964, 6, 422–430. [CrossRef]44. Available online: https://linuxmint.com/ (accessed on 8 April 2020).45. GNU Octave (Version 5.2.0). Available online: https://octave.org/doc/v5.2.0/ (accessed on 25 April 2020).46. Netgen/NGSolve. Available online: https://ngsolve.org/ (accessed on 23 November 2020).47. Elmer. Available online: https://www.csc.fi/web/elmer (accessed on 1 November 2020).48. Paraview. Available online: https://www.paraview.org/ (accessed on 1 November 2020).49. Salach, J.; Bienskowski, A.; Szewczyk, R. Magnetoelastic, ring-shaped torque sensors with the uniform stress distribution. J.
Autom. Mob. Robot. Intell. Syst. 2013, 1, 66–68.50. Nowak, P.; Nowicki, M.; Jus, A.; Szewczyk, R. Utilization of Eddy Current Tomography in Automotive Industry. Acta Phys. Pol. A
2017, 131, 1168–1170. [CrossRef]51. Silveyra, J.M.; Garrido, J.M.C. On the modelling of the anhysteretic magnetization of homogeneous soft magnetic materials. J.
Magn. Magn. Mater. 2021, in press.