A dynamic perspective on the molecular recognition of chitooligosaccharide ligands by hevein domains
11
A dynamic perspective on the molecular recognition of chitooligosaccharide ligands by hevein domains Giorgio Colombo, a, * Massimiliano Meli, a Javier Can ˜ ada, b Juan Luis Asensio b and Jesus Jimenez-Barbero b, * a Istituto di Chimica del Riconoscimento Molecolare, CNR via Mario Bianco, 9, 20131 Milano, Italy b Centro de Investigaciones Biologicas, CSIC, Ramiro de Maeztu 9, 28040 Madrid, Spain Received 13 October 2004; accepted 24 January 2005 Dedicated to Professor David A. Brant Abstract—The complexes between hevein and different chitin oligomers, from the di- to the penta-saccharide, are studied through all atom molecular-dynamics simulations. The results for the smaller oligosaccharide complexes show that the carbohydrate is able to move on the surface of the relatively flat binding-pocket of hevein, therefore occupying different binding subpockets. The pentasac- charide spans all possible intermolecular interactions with the receptor in a simultaneous manner. Statistical analysis methods were also applied in order to define the principal overall motions in the complexes. The oligosaccharide binding can be considered to be defined by a subtle balance between enthalpic and entropic effects, providing the possibility of the existence of multiple binding con- formations. This structural and dynamical view parallels the results based on NOE NMR data for the three disaccharide, trisaccha- ride, and pentasaccharide complexes. Ó 2005 Published by Elsevier Ltd. Keywords: Hevein; Lectins; Protein–carbohydrate interactions; Chitooligosaccharides; Molecular dynamics 1. Introduction The clarification of the physicochemical determinants underlying carbohydrate–protein molecular recognition is critical for our understanding of a series of fundamen- tal processes such as cell–cell adhesion, cell growth, inflammatory reactions, fertilization, and bacterial infection. The study of carbohydrate–protein binding is thus a topic of major interest because of its potential in pharmaceutical and clinical applications. 1–3 A great deal of information has been obtained re- cently through a variety of studies ranging from X-ray crystallography to NMR spectroscopy, from calorime- try to surface plasmon resonance, and so on. 4 From the experimental point of view, X-ray crystallography has provided a wealth of information on the three- dimensional structures of protein–carbohydrate com- plexes. 5 In many cases, however, oligosaccharides, either in the free form in solution or when present as glycocon- jugates or complexed to protein receptors such as anti- bodies, lectins, and enzymes have proved to be difficult to crystallize. In a parallel way, NMR experiments have been frequently used both in the area of oligosaccharide conformational analysis and for studying oligosaccha- ride–protein interactions. 6,7 The complexity of the bio- logical problems involved in protein–carbohydrate interactions underlines the need for simplified systems, in which the role of single monomers or chemical groups in the process can be pinpointed at atomic resolution. In order to do this, theoretical investigations on model sys- tems of biological relevance constitute a suitable choice. In this context, we have undertaken the investigation of the binding features of carbohydrate oligomers of dif- ferent lengths as probes to a small-sized lectin (namely, 0008-6215/$ - see front matter Ó 2005 Published by Elsevier Ltd. doi:10.1016/j.carres.2005.01.044 * Corresponding authors. Tel.: +39 02 28500031; fax: +39 02 28500036 (G.C.); tel.: +34 918373112/4370; fax: +34 915360432 (J.J-B.); e-mail addresses: [email protected]; [email protected] Carbohydrate RESEARCH Carbohydrate Research 340 (2005) 1039–1049
-
Upload
independent -
Category
Documents
-
view
0 -
download
0
Transcript of A dynamic perspective on the molecular recognition of chitooligosaccharide ligands by hevein domains
CarbohydrateRESEARCH
Carbohydrate Research 340 (2005) 1039–1049
A dynamic perspective on the molecular recognition ofchitooligosaccharide ligands by hevein domains
Giorgio Colombo,a,* Massimiliano Meli,a Javier Canada,b Juan Luis Asensiob andJesus Jimenez-Barberob,*
aIstituto di Chimica del Riconoscimento Molecolare, CNR via Mario Bianco, 9, 20131 Milano, ItalybCentro de Investigaciones Biologicas, CSIC, Ramiro de Maeztu 9, 28040 Madrid, Spain
Received 13 October 2004; accepted 24 January 2005
Dedicated to Professor David A. Brant
Abstract—The complexes between hevein and different chitin oligomers, from the di- to the penta-saccharide, are studied through all
atom molecular-dynamics simulations. The results for the smaller oligosaccharide complexes show that the carbohydrate is able to
move on the surface of the relatively flat binding-pocket of hevein, therefore occupying different binding subpockets. The pentasac-
charide spans all possible intermolecular interactions with the receptor in a simultaneous manner. Statistical analysis methods were
also applied in order to define the principal overall motions in the complexes. The oligosaccharide binding can be considered to be
defined by a subtle balance between enthalpic and entropic effects, providing the possibility of the existence of multiple binding con-
formations. This structural and dynamical view parallels the results based on NOE NMR data for the three disaccharide, trisaccha-
ride, and pentasaccharide complexes.� 2005 Published by Elsevier Ltd.
Keywords: Hevein; Lectins; Protein–carbohydrate interactions; Chitooligosaccharides; Molecular dynamics
1. Introduction
The clarification of the physicochemical determinants
underlying carbohydrate–protein molecular recognition
is critical for our understanding of a series of fundamen-tal processes such as cell–cell adhesion, cell growth,
inflammatory reactions, fertilization, and bacterial
infection. The study of carbohydrate–protein binding
is thus a topic of major interest because of its potential
in pharmaceutical and clinical applications.1–3
A great deal of information has been obtained re-
cently through a variety of studies ranging from X-ray
crystallography to NMR spectroscopy, from calorime-try to surface plasmon resonance, and so on.4 From
the experimental point of view, X-ray crystallography
0008-6215/$ - see front matter � 2005 Published by Elsevier Ltd.
doi:10.1016/j.carres.2005.01.044
* Corresponding authors. Tel.: +39 02 28500031; fax: +39 02 28500036
(G.C.); tel.: +34 918373112/4370; fax: +34 915360432 (J.J-B.); e-mail
addresses: [email protected]; [email protected]
has provided a wealth of information on the three-
dimensional structures of protein–carbohydrate com-
plexes.5 In many cases, however, oligosaccharides, either
in the free form in solution or when present as glycocon-
jugates or complexed to protein receptors such as anti-bodies, lectins, and enzymes have proved to be difficult
to crystallize. In a parallel way, NMR experiments have
been frequently used both in the area of oligosaccharide
conformational analysis and for studying oligosaccha-
ride–protein interactions.6,7 The complexity of the bio-
logical problems involved in protein–carbohydrate
interactions underlines the need for simplified systems,
in which the role of single monomers or chemical groupsin the process can be pinpointed at atomic resolution. In
order to do this, theoretical investigations on model sys-
tems of biological relevance constitute a suitable choice.
In this context, we have undertaken the investigation
of the binding features of carbohydrate oligomers of dif-
ferent lengths as probes to a small-sized lectin (namely,
1040 G. Colombo et al. / Carbohydrate Research 340 (2005) 1039–1049
hevein), by combining long time-scale all-atom molecu-
lar dynamics (MD) simulations with previously ob-tained NMR data.8
Hevein is a small single-chain protein of 43 amino
acids, especially rich in glycine and cysteine residues,
whose biological function is the recognition of chitin oli-
gosaccharides. Hevein is present in laticifers of the rub-
ber tree: from the biological viewpoint, it is the major
allergen of latex and, in addition, it has been proposed
to be involved in the mechanisms of plant defenseagainst insect and fungal attacks. Its 3D structure in
solution has been extensively studied by X-ray crystal-
lography and by NMR methods.9,10 Its binding to chitin
oligosaccharides has been studied by NMR spectro-
scopy. Since the exoskeleton of insects and fungi is
formed of chitin, the first step in the protection provided
by hevein could be the molecular recognition of chitin
by this small protein domain.6
Experimental investigations have proposed the exis-
tence of an exposed binding site for hevein, comprised
of three subsites for N-acetylglucosamine (GlcNAc)-
containing oligosaccharides: a subsite dubbed +1, de-
fined by the aromatic rings of W23 and Y30, subsite
+2 defined by residue W21. A third subsite, represented
by L16, C24, and S26 was identified based on MD sim-
ulations of NMR-selected structures in a previous paperby our group. MD simulations allowed identification of
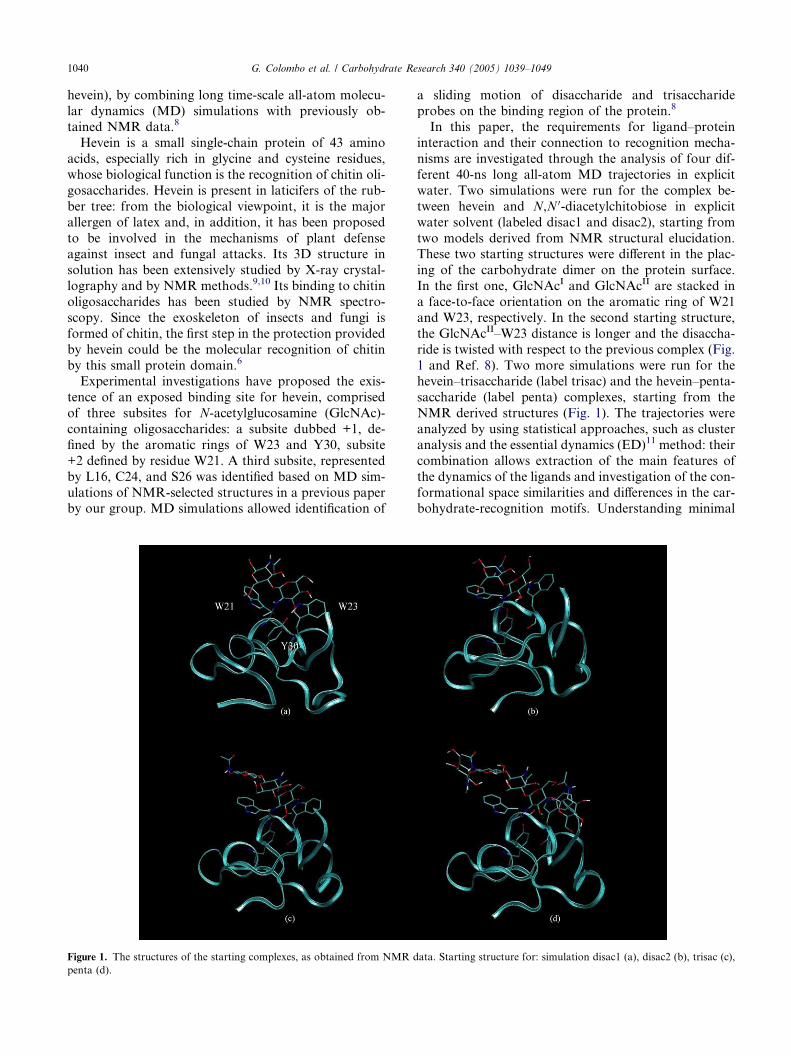
Figure 1. The structures of the starting complexes, as obtained from NMR d
penta (d).
a sliding motion of disaccharide and trisaccharide
probes on the binding region of the protein.8
In this paper, the requirements for ligand–protein
interaction and their connection to recognition mecha-
nisms are investigated through the analysis of four dif-
ferent 40-ns long all-atom MD trajectories in explicit
water. Two simulations were run for the complex be-
tween hevein and N,N 0-diacetylchitobiose in explicit
water solvent (labeled disac1 and disac2), starting from
two models derived from NMR structural elucidation.These two starting structures were different in the plac-
ing of the carbohydrate dimer on the protein surface.
In the first one, GlcNAcI and GlcNAcII are stacked in
a face-to-face orientation on the aromatic ring of W21
and W23, respectively. In the second starting structure,
the GlcNAcII–W23 distance is longer and the disaccha-
ride is twisted with respect to the previous complex (Fig.
1 and Ref. 8). Two more simulations were run for thehevein–trisaccharide (label trisac) and the hevein–penta-
saccharide (label penta) complexes, starting from the
NMR derived structures (Fig. 1). The trajectories were
analyzed by using statistical approaches, such as cluster
analysis and the essential dynamics (ED)11 method: their
combination allows extraction of the main features of
the dynamics of the ligands and investigation of the con-
formational space similarities and differences in the car-bohydrate-recognition motifs. Understanding minimal
ata. Starting structure for: simulation disac1 (a), disac2 (b), trisac (c),
G. Colombo et al. / Carbohydrate Research 340 (2005) 1039–1049 1041
binding requirements is in fact fundamental for the fu-
ture design of new molecules with improved recognitionabilities.
2. Results and discussion
The structure of the receptor protein remained in all
cases close to the native conformation, the average
RMSD varying between 0.2 and 0.31 nm from theNMR structures (Table 1). The three-dimensional fold
of the protein remains globally unchanged, despite the
ordering and appearance of b-sheet geometries between20 and 30 ns in simulations disac2, trisac, and penta, as
shown by the DSSP algorithm (see also previous pa-
per).8 In this paper, however, attention is focused on
Table 1. Structural summary of the simulations
RMS protein
(nm)
Num. of clusters Ratio
(main/second)
Disac1 0.22 174 3.1
Disac2 0.20 236 1.77
Trisac 0.28 9 1.03
Penta 0.3 92 5.8
The first column reports the average protein backbone RMSD from
the NMR starting structure. The second column represents the total
number of clusters visited in each simulation by the complexes. The
third column reports the ratio between the number of structures in the
first main structure cluster and the second main structure cluster.
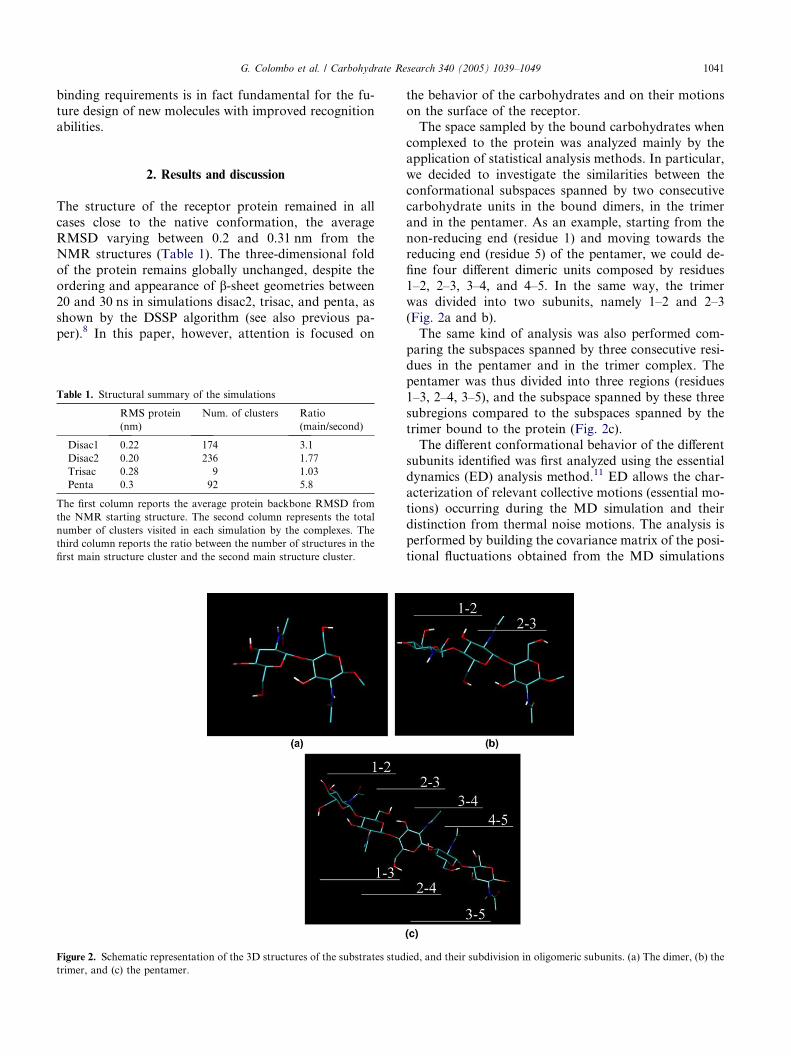
Figure 2. Schematic representation of the 3D structures of the substrates stud
trimer, and (c) the pentamer.
the behavior of the carbohydrates and on their motions
on the surface of the receptor.The space sampled by the bound carbohydrates when
complexed to the protein was analyzed mainly by the
application of statistical analysis methods. In particular,
we decided to investigate the similarities between the
conformational subspaces spanned by two consecutive
carbohydrate units in the bound dimers, in the trimer
and in the pentamer. As an example, starting from the
non-reducing end (residue 1) and moving towards thereducing end (residue 5) of the pentamer, we could de-
fine four different dimeric units composed by residues
1–2, 2–3, 3–4, and 4–5. In the same way, the trimer
was divided into two subunits, namely 1–2 and 2–3
(Fig. 2a and b).
The same kind of analysis was also performed com-
paring the subspaces spanned by three consecutive resi-
dues in the pentamer and in the trimer complex. Thepentamer was thus divided into three regions (residues
1–3, 2–4, 3–5), and the subspace spanned by these three
subregions compared to the subspaces spanned by the
trimer bound to the protein (Fig. 2c).
The different conformational behavior of the different
subunits identified was first analyzed using the essential
dynamics (ED) analysis method.11 ED allows the char-
acterization of relevant collective motions (essential mo-tions) occurring during the MD simulation and their
distinction from thermal noise motions. The analysis is
performed by building the covariance matrix of the posi-
tional fluctuations obtained from the MD simulations
ied, and their subdivision in oligomeric subunits. (a) The dimer, (b) the
1042 G. Colombo et al. / Carbohydrate Research 340 (2005) 1039–1049
for each of the afore-defined subunits. The covariance
matrix was built using the C atoms defining the pyra-nose rings of each of the subunits first described (Fig.
2). Upon diagonalization of this matrix, a set of eigen-
values and eigenvectors is generated, which define a
new set of generalized coordinates. The eigenvectors
correspond to directions in a 3N dimensional space
(where N is the number of atoms) along which collective
motions of atoms occur, and yield important insights
into the global conformational behavior of the system.The eigenvalues represent the total mean-square fluctu-
ation of the system along the corresponding eigenvector.
ED analysis, in this case, was used to gain information
about collective motions of the carbohydrate subunits
as a function of the different oligosaccharide chain-
lengths and of the interactions with the receptor protein.
To quantify the similarity of the subspaces spanned,
we calculated the subspace overlap (SO) as described inMaterial and Methods. This number accounts for the
(dis)similarity of the essential motions. We have there-
fore calculated this parameter between the trajectories
of the different subunits of the carbohydrates already de-
fined. The results reported in Table 2 show that the sub-
spaces defined for the different subunits partially overlap
in some cases, while they might be highly dissimilar.
The trajectories of each of the subunits in the com-plexes were also projected onto the plane defined by
the first two eigenvectors associated to first two
eigenvalues.
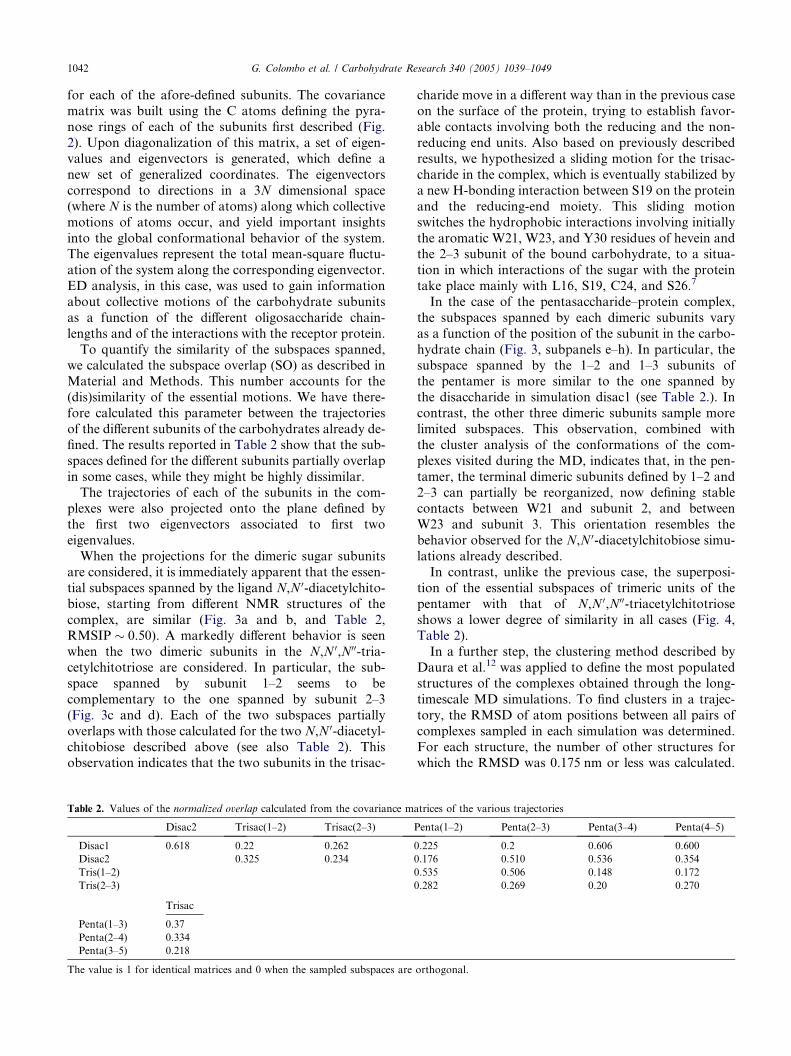
When the projections for the dimeric sugar subunits
are considered, it is immediately apparent that the essen-
tial subspaces spanned by the ligand N,N 0-diacetylchito-
biose, starting from different NMR structures of the
complex, are similar (Fig. 3a and b, and Table 2,RMSIP � 0.50). A markedly different behavior is seen
when the two dimeric subunits in the N,N 0,N00-tria-
cetylchitotriose are considered. In particular, the sub-
space spanned by subunit 1–2 seems to be
complementary to the one spanned by subunit 2–3
(Fig. 3c and d). Each of the two subspaces partially
overlaps with those calculated for the two N,N 0-diacetyl-
chitobiose described above (see also Table 2). Thisobservation indicates that the two subunits in the trisac-
Table 2. Values of the normalized overlap calculated from the covariance m
Disac2 Trisac(1–2) Trisac(2–3)
Disac1 0.618 0.22 0.262
Disac2 0.325 0.234
Tris(1–2)
Tris(2–3)
Trisac
Penta(1–3) 0.37
Penta(2–4) 0.334
Penta(3–5) 0.218
The value is 1 for identical matrices and 0 when the sampled subspaces are
charide move in a different way than in the previous case
on the surface of the protein, trying to establish favor-able contacts involving both the reducing and the non-
reducing end units. Also based on previously described
results, we hypothesized a sliding motion for the trisac-
charide in the complex, which is eventually stabilized by
a new H-bonding interaction between S19 on the protein
and the reducing-end moiety. This sliding motion
switches the hydrophobic interactions involving initially
the aromatic W21, W23, and Y30 residues of hevein andthe 2–3 subunit of the bound carbohydrate, to a situa-
tion in which interactions of the sugar with the protein
take place mainly with L16, S19, C24, and S26.7
In the case of the pentasaccharide–protein complex,
the subspaces spanned by each dimeric subunits vary
as a function of the position of the subunit in the carbo-
hydrate chain (Fig. 3, subpanels e–h). In particular, the
subspace spanned by the 1–2 and 1–3 subunits ofthe pentamer is more similar to the one spanned by
the disaccharide in simulation disac1 (see Table 2.). In
contrast, the other three dimeric subunits sample more
limited subspaces. This observation, combined with
the cluster analysis of the conformations of the com-
plexes visited during the MD, indicates that, in the pen-
tamer, the terminal dimeric subunits defined by 1–2 and
2–3 can partially be reorganized, now defining stablecontacts between W21 and subunit 2, and between
W23 and subunit 3. This orientation resembles the
behavior observed for the N,N 0-diacetylchitobiose simu-
lations already described.
In contrast, unlike the previous case, the superposi-
tion of the essential subspaces of trimeric units of the
pentamer with that of N,N 0,N00-triacetylchitotriose
shows a lower degree of similarity in all cases (Fig. 4,Table 2).
In a further step, the clustering method described by
Daura et al.12 was applied to define the most populated
structures of the complexes obtained through the long-
timescale MD simulations. To find clusters in a trajec-
tory, the RMSD of atom positions between all pairs of
complexes sampled in each simulation was determined.
For each structure, the number of other structures forwhich the RMSD was 0.175 nm or less was calculated.
atrices of the various trajectories
Penta(1–2) Penta(2–3) Penta(3–4) Penta(4–5)
0.225 0.2 0.606 0.600
0.176 0.510 0.536 0.354
0.535 0.506 0.148 0.172
0.282 0.269 0.20 0.270
orthogonal.
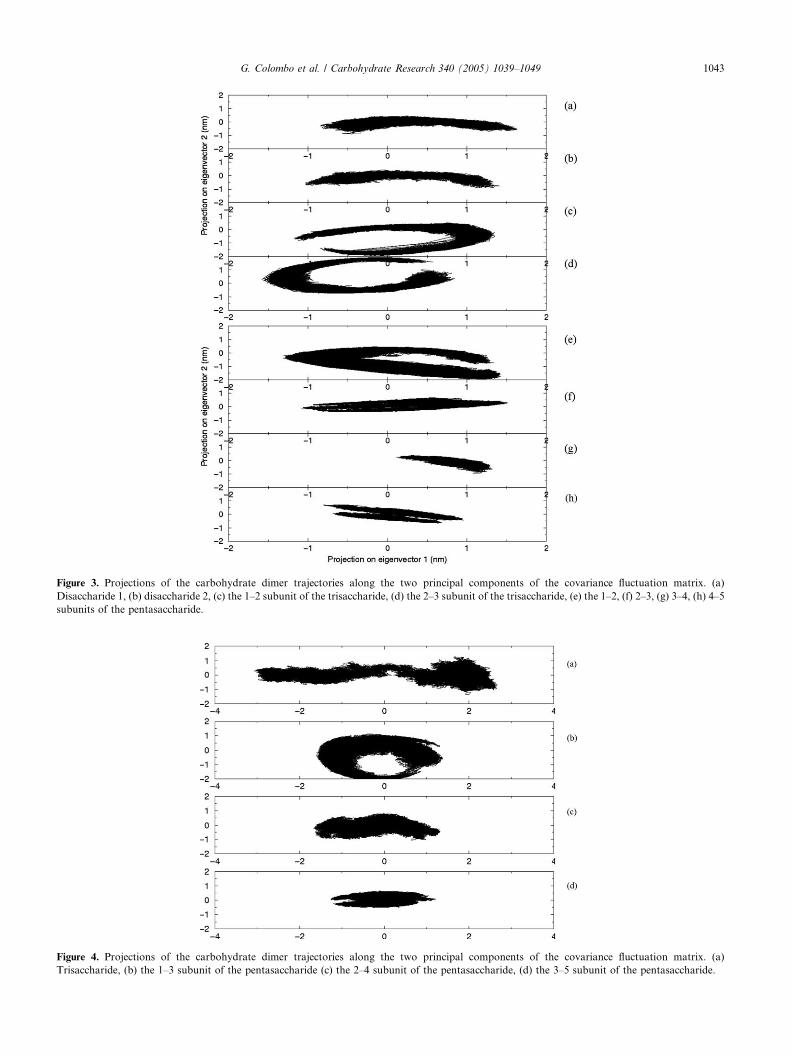
Figure 3. Projections of the carbohydrate dimer trajectories along the two principal components of the covariance fluctuation matrix. (a)
Disaccharide 1, (b) disaccharide 2, (c) the 1–2 subunit of the trisaccharide, (d) the 2–3 subunit of the trisaccharide, (e) the 1–2, (f) 2–3, (g) 3–4, (h) 4–5
subunits of the pentasaccharide.
Figure 4. Projections of the carbohydrate dimer trajectories along the two principal components of the covariance fluctuation matrix. (a)
Trisaccharide, (b) the 1–3 subunit of the pentasaccharide (c) the 2–4 subunit of the pentasaccharide, (d) the 3–5 subunit of the pentasaccharide.
G. Colombo et al. / Carbohydrate Research 340 (2005) 1039–1049 1043
1044 G. Colombo et al. / Carbohydrate Research 340 (2005) 1039–1049
The structure with the highest number of neighbors was
then taken as the center of the cluster, and was takenalong with its neighbors to define the first cluster. Then,
the structures belonging to this first cluster were re-
moved from the structural ensemble, and the process
was repeated with those remaining structures. The pro-
cess was repeated until the pool of structures was empty.
The results are summarized in Table 1.
In principle, this method should be useful to statisti-
cally characterize the distinct conformational families,or ensemble of complexes, which are sampled during
the simulations. Indeed, different numbers of clusters
were found for the different simulations.
In the case of N,N 0-diacetylchitobiose, the total num-
ber of clusters turned out to be dependent on the start-
ing conformations. As discussed previously, this
difference indicates that the complexes, in the two differ-
ent conditions, are exploring distinct conformational re-gions, although the width of the essential subspaces is
comparable. These observations suggest that the disac-
charide is mainly moving on the surface of the protein
around the region determined by W21, W23, and Y30,
partially establishing different interactions as a function
of the starting structure. Indeed, the N,N 0-diacetylchito-
biose–hevein complexes displayed multiple transitions
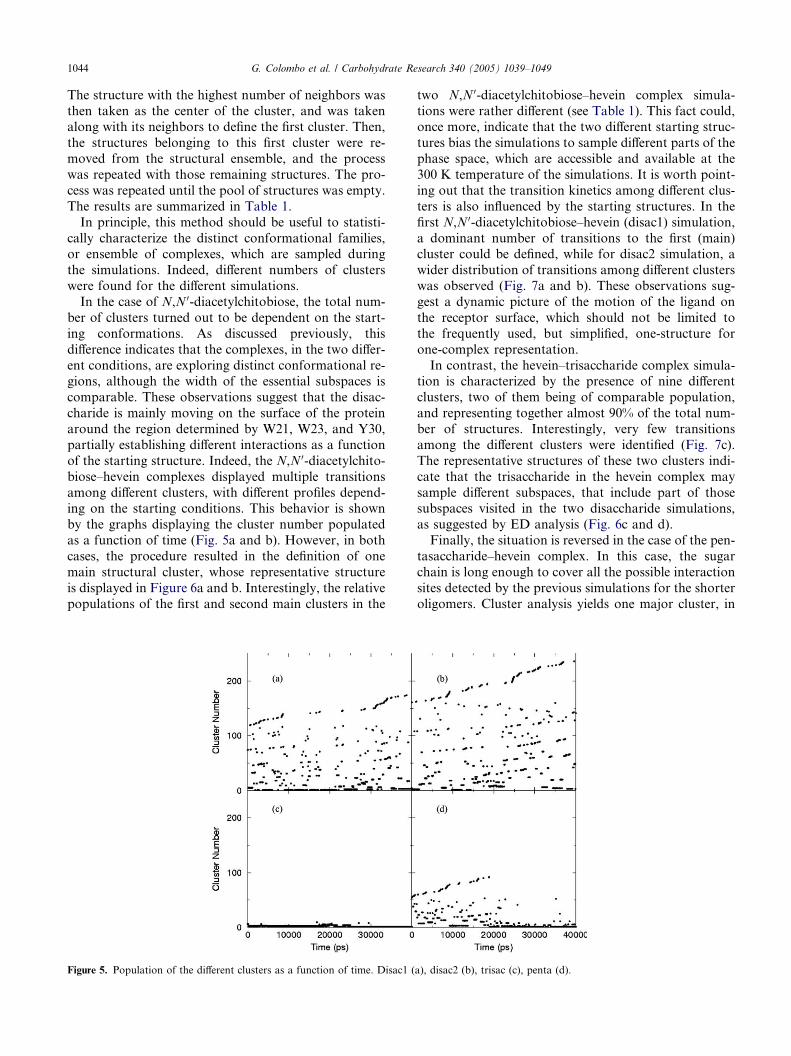
among different clusters, with different profiles depend-ing on the starting conditions. This behavior is shown
by the graphs displaying the cluster number populated
as a function of time (Fig. 5a and b). However, in both
cases, the procedure resulted in the definition of one
main structural cluster, whose representative structure
is displayed in Figure 6a and b. Interestingly, the relative
populations of the first and second main clusters in the
Figure 5. Population of the different clusters as a function of time. Disac1 (
two N,N 0-diacetylchitobiose–hevein complex simula-
tions were rather different (see Table 1). This fact could,once more, indicate that the two different starting struc-
tures bias the simulations to sample different parts of the
phase space, which are accessible and available at the
300 K temperature of the simulations. It is worth point-
ing out that the transition kinetics among different clus-
ters is also influenced by the starting structures. In the
first N,N 0-diacetylchitobiose–hevein (disac1) simulation,
a dominant number of transitions to the first (main)cluster could be defined, while for disac2 simulation, a
wider distribution of transitions among different clusters
was observed (Fig. 7a and b). These observations sug-
gest a dynamic picture of the motion of the ligand on
the receptor surface, which should not be limited to
the frequently used, but simplified, one-structure for
one-complex representation.
In contrast, the hevein–trisaccharide complex simula-tion is characterized by the presence of nine different
clusters, two of them being of comparable population,
and representing together almost 90% of the total num-
ber of structures. Interestingly, very few transitions
among the different clusters were identified (Fig. 7c).
The representative structures of these two clusters indi-
cate that the trisaccharide in the hevein complex may
sample different subspaces, that include part of thosesubspaces visited in the two disaccharide simulations,
as suggested by ED analysis (Fig. 6c and d).
Finally, the situation is reversed in the case of the pen-
tasaccharide–hevein complex. In this case, the sugar
chain is long enough to cover all the possible interaction
sites detected by the previous simulations for the shorter
oligomers. Cluster analysis yields one major cluster, in
a), disac2 (b), trisac (c), penta (d).
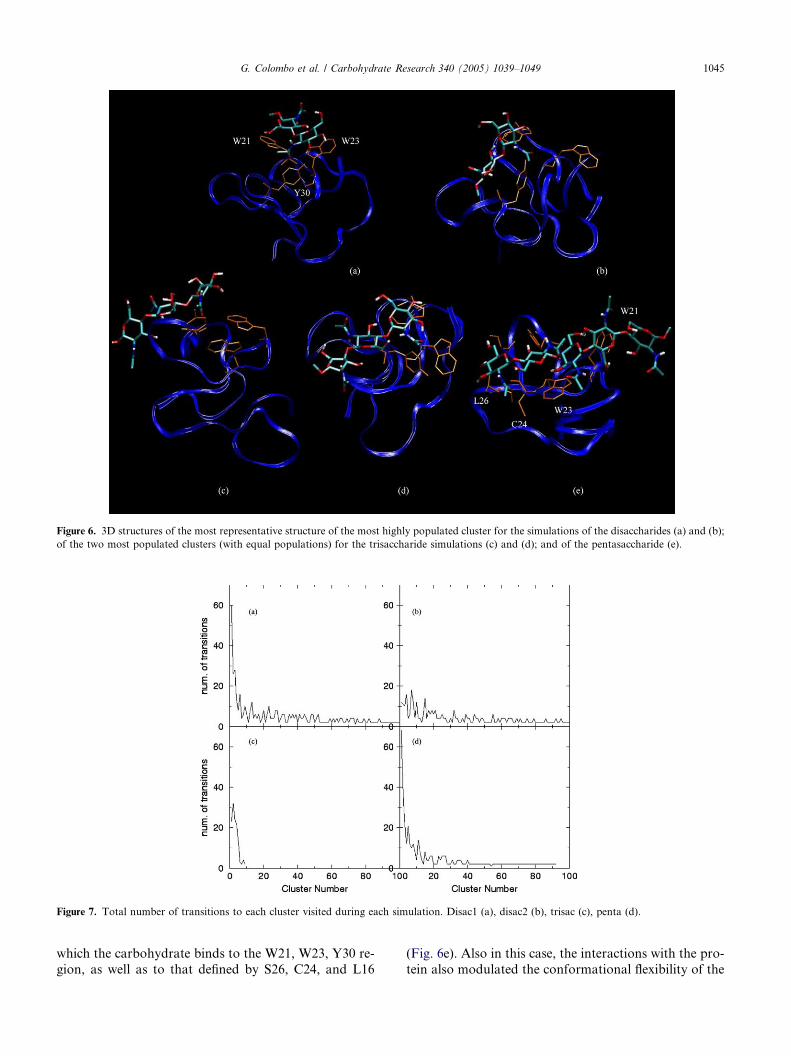
Figure 6. 3D structures of the most representative structure of the most highly populated cluster for the simulations of the disaccharides (a) and (b);
of the two most populated clusters (with equal populations) for the trisaccharide simulations (c) and (d); and of the pentasaccharide (e).
Figure 7. Total number of transitions to each cluster visited during each simulation. Disac1 (a), disac2 (b), trisac (c), penta (d).
G. Colombo et al. / Carbohydrate Research 340 (2005) 1039–1049 1045
which the carbohydrate binds to the W21, W23, Y30 re-
gion, as well as to that defined by S26, C24, and L16
(Fig. 6e). Also in this case, the interactions with the pro-
tein also modulated the conformational flexibility of the
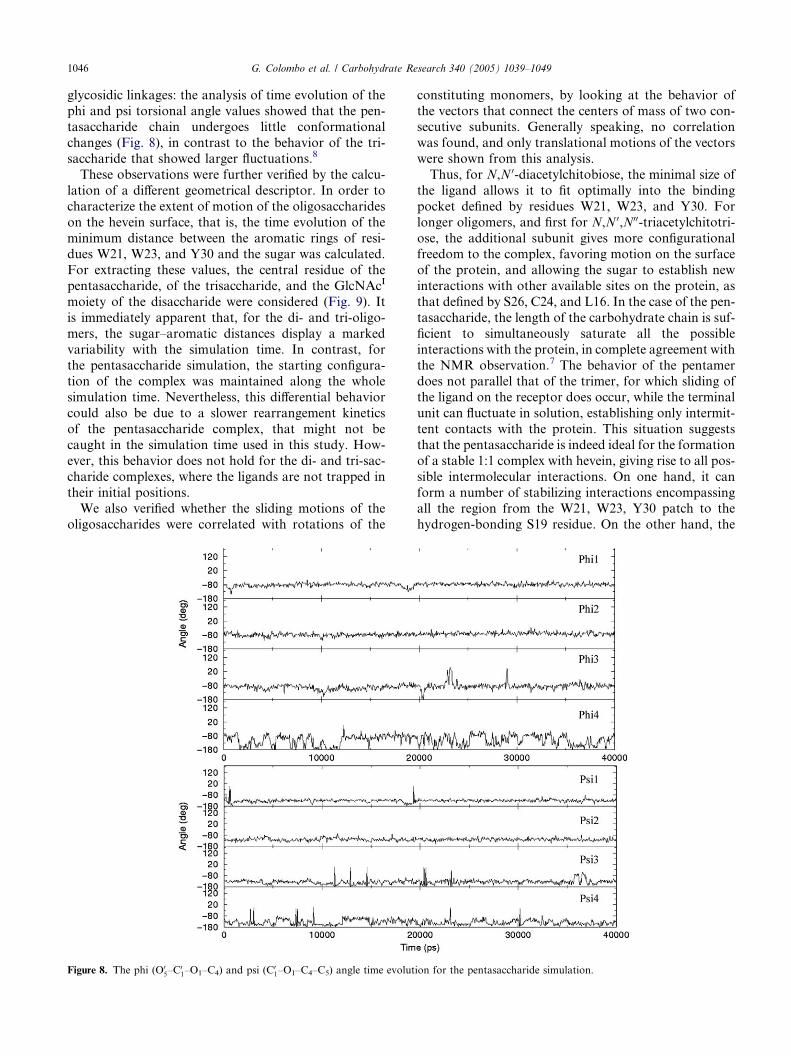
1046 G. Colombo et al. / Carbohydrate Research 340 (2005) 1039–1049
glycosidic linkages: the analysis of time evolution of the
phi and psi torsional angle values showed that the pen-tasaccharide chain undergoes little conformational
changes (Fig. 8), in contrast to the behavior of the tri-
saccharide that showed larger fluctuations.8
These observations were further verified by the calcu-
lation of a different geometrical descriptor. In order to
characterize the extent of motion of the oligosaccharides
on the hevein surface, that is, the time evolution of the
minimum distance between the aromatic rings of resi-dues W21, W23, and Y30 and the sugar was calculated.
For extracting these values, the central residue of the
pentasaccharide, of the trisaccharide, and the GlcNAcI
moiety of the disaccharide were considered (Fig. 9). It
is immediately apparent that, for the di- and tri-oligo-
mers, the sugar–aromatic distances display a marked
variability with the simulation time. In contrast, for
the pentasaccharide simulation, the starting configura-tion of the complex was maintained along the whole
simulation time. Nevertheless, this differential behavior
could also be due to a slower rearrangement kinetics
of the pentasaccharide complex, that might not be
caught in the simulation time used in this study. How-
ever, this behavior does not hold for the di- and tri-sac-
charide complexes, where the ligands are not trapped in
their initial positions.We also verified whether the sliding motions of the
oligosaccharides were correlated with rotations of the
Figure 8. The phi (O05–C
01–O1–C4) and psi (C
01–O1–C4–C5) angle time evolut
constituting monomers, by looking at the behavior of
the vectors that connect the centers of mass of two con-secutive subunits. Generally speaking, no correlation
was found, and only translational motions of the vectors
were shown from this analysis.
Thus, for N,N 0-diacetylchitobiose, the minimal size of
the ligand allows it to fit optimally into the binding
pocket defined by residues W21, W23, and Y30. For
longer oligomers, and first for N,N 0,N00-triacetylchitotri-
ose, the additional subunit gives more configurationalfreedom to the complex, favoring motion on the surface
of the protein, and allowing the sugar to establish new
interactions with other available sites on the protein, as
that defined by S26, C24, and L16. In the case of the pen-
tasaccharide, the length of the carbohydrate chain is suf-
ficient to simultaneously saturate all the possible
interactions with the protein, in complete agreement with
the NMR observation.7 The behavior of the pentamerdoes not parallel that of the trimer, for which sliding of
the ligand on the receptor does occur, while the terminal
unit can fluctuate in solution, establishing only intermit-
tent contacts with the protein. This situation suggests
that the pentasaccharide is indeed ideal for the formation
of a stable 1:1 complex with hevein, giving rise to all pos-
sible intermolecular interactions. On one hand, it can
form a number of stabilizing interactions encompassingall the region from the W21, W23, Y30 patch to the
hydrogen-bonding S19 residue. On the other hand, the
ion for the pentasaccharide simulation.
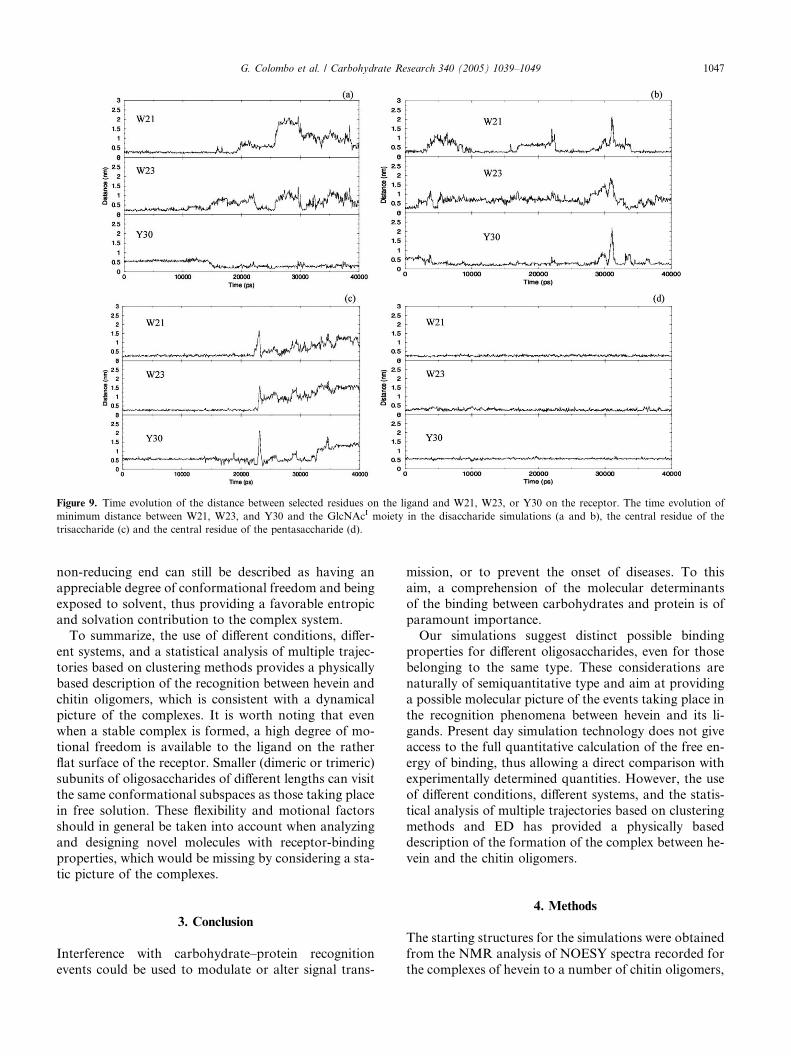
Figure 9. Time evolution of the distance between selected residues on the ligand and W21, W23, or Y30 on the receptor. The time evolution of
minimum distance between W21, W23, and Y30 and the GlcNAcI moiety in the disaccharide simulations (a and b), the central residue of the
trisaccharide (c) and the central residue of the pentasaccharide (d).
G. Colombo et al. / Carbohydrate Research 340 (2005) 1039–1049 1047
non-reducing end can still be described as having an
appreciable degree of conformational freedom and being
exposed to solvent, thus providing a favorable entropicand solvation contribution to the complex system.
To summarize, the use of different conditions, differ-
ent systems, and a statistical analysis of multiple trajec-
tories based on clustering methods provides a physically
based description of the recognition between hevein and
chitin oligomers, which is consistent with a dynamical
picture of the complexes. It is worth noting that even
when a stable complex is formed, a high degree of mo-tional freedom is available to the ligand on the rather
flat surface of the receptor. Smaller (dimeric or trimeric)
subunits of oligosaccharides of different lengths can visit
the same conformational subspaces as those taking place
in free solution. These flexibility and motional factors
should in general be taken into account when analyzing
and designing novel molecules with receptor-binding
properties, which would be missing by considering a sta-tic picture of the complexes.
3. Conclusion
Interference with carbohydrate–protein recognition
events could be used to modulate or alter signal trans-
mission, or to prevent the onset of diseases. To this
aim, a comprehension of the molecular determinants
of the binding between carbohydrates and protein is ofparamount importance.
Our simulations suggest distinct possible binding
properties for different oligosaccharides, even for those
belonging to the same type. These considerations are
naturally of semiquantitative type and aim at providing
a possible molecular picture of the events taking place in
the recognition phenomena between hevein and its li-
gands. Present day simulation technology does not giveaccess to the full quantitative calculation of the free en-
ergy of binding, thus allowing a direct comparison with
experimentally determined quantities. However, the use
of different conditions, different systems, and the statis-
tical analysis of multiple trajectories based on clustering
methods and ED has provided a physically based
description of the formation of the complex between he-
vein and the chitin oligomers.
4. Methods
The starting structures for the simulations were obtained
from the NMR analysis of NOESY spectra recorded for
the complexes of hevein to a number of chitin oligomers,
1048 G. Colombo et al. / Carbohydrate Research 340 (2005) 1039–1049
as described.6 The coordinates are available from the
authors upon request. The hevein domain was proton-ated to give a zwitterionic form (with N-terminal
NH3+ and C-terminal COO� groups). The oligosaccha-
rides were built using the building blocks obtained from
Vasudevan and Balaji.13 Four complexes were built
according to the NMR structures: two hevein–disaccha-
ride complexes (the two simulations are labeled disac1
and disac2), one hevein–trisaccharide complex (label tri-
sac) and one hevein–pentasaccharide complex (labelpenta).
The complexes were solvated with water in a periodic
truncated octahedron, large enough to contain the pep-
tide and 0.9 nm of solvent on all sides. All solvent mol-
ecules within 0.15 nm of any peptide atom were
removed. The total charge on the complexes was +2.
No counter-ions were added, as water is the highly
dielectric and the inclusion of no counter-ions was con-sidered a better approximation to the low salt experi-
mental conditions. The resulting system was composed
of the complex and 3016 water molecules in the case
of the disaccharide simulations, of the complex plus
2967 water molecules in the case of the trisaccharide
simulation, and of the complex and 3216 water mole-
cules for the pentasaccharide simulation.
The system was subsequently energy-minimized withthe steepest descent method for 1000 steps. In all simu-
lations, the temperature was maintained close to the in-
tended value of 300 K by weak coupling to an external
temperature bath18 with a coupling constant of 0.1 ps.
The protein, sugars, and the rest of the system were cou-
pled separately to the temperature bath. The GRO-
MOS96 force field14,15 was used. The simple point
charge (SPG)16 water model was used. The LINCS algo-rithm17 was used to constrain all bond lengths. For the
water molecules, the SETTLE algorithm18 was used. A
dielectric permittivity, e = 1, and a time step of 2 fs wereused. A twin-range cutoff was used for the calculation of
the non-bonded interactions. The short-range cut-off ra-
dius was set to 0.8 nm and the long-range cut-off radius
to 1.4 nm for both coulombic and Lennard–Jones inter-
actions. The cut-off values are the same as those used forthe GROMOS96 force field parameterization. Interac-
tions within the short-range cutoff were updated every
time step whereas interactions within the long-range cut-
off were updated every 5 time steps together with the
pair list. All atoms were given an initial velocity ob-
tained from a Maxwellian distribution at the desired ini-
tial temperature. The density of the system was adjusted
by performing the first equilibration runs at NPT condi-tion by weak coupling to a bath of constant pressure
(Po = 1 bar, coupling time sp = 0.5 ps).19 All the simula-
tions, starting from the appropriate NMR structure,
were equilibrated by 50 ps of MD runs with position re-
straints on the peptide to allow relaxation of the solvent
molecules. These first equilibration runs were followed
by other 50 ps runs without position restraints on the
peptide. The production runs using NVT conditions,after equilibration, were 40 ns long for all of the four
complexes.
All the MD runs and the analysis of the trajectories
were performed using the GROMACS software pack-
age.20 Cluster analysis was performed according to
Daura et al.21
The subspace overlap (SO) was calculated with the -v,
-eig, -v2, and -eig2 options of the g_anaeig of GRO-MACS. This way, a single number for the overlap be-
tween the covariance matrices can be generated. The
formulas are:
difference ¼ sqrtðtrððsqrtðM1Þ � sqrtðM2ÞÞ\2ÞÞ
normalized overlap ¼ 1� difference=sqrtðtrðM1Þþ trðM2ÞÞ
where M1 and M2 are the two covariance matrices and
tr is the trace of a matrix.The numbers are proportional to the overlap of the
square root of the fluctuations. The normalized overlap
is the most useful number, it is 1 for identical matrices
and 0 when the sampled subspaces are orthogonal.
References
1. Lemieux, R. U. Chem. Soc. Rev. 1989, 18, 347–374.2. Lasky, L. Science 1992, 258, 964–969.3. Dwek, R. A. Chem. Rev. 1996, 96, 683–720.4. Wormald, M. R.; Petrescu, A. J.; Pao, Y.-L.; Glithero, A.;Elliott, T.; Dwek, R. A. Chem. Rew. 2002, 102, 371–386.
5. Lescar, J.; Loris, R.; Mitchell, E.; Gautier, C.; Cox, V.;Wyns, L.; Perez, S.; Breton, C.; Imberty, A. J. Biol. Chem.2001, 277, 6608–6614.
6. Asensio, J. L.; Siebert, H. C.; von Der Lieth, C.; Laynez,J.; Bruix, M.; Soedjanaamadja, U. M.; Beintema, J. J.;Canada, F. J.; Gabius, H.; Jimenez-Barbero, J. Proteins2000, 40, 218–236.
7. Asensio, J. L.; Canada, F.; Siebert, H. C.; Laynez, J.;Poveda, A.; Beintema, J.; Gabius, H. J.; Jimenez-Barbero,J. Chem. Biol. 2000, 7, 529–543.
8. Colombo, G.; Meli, M.; Canada, J.; Asensio, J. L.;Jimenez-Barbero, J. Carbohydr. Res. 2004, 339, 985–994.
9. Asensio, J. L.; Canada, F. J.; Bruix, M.; Rodriguez-Romero, A.; Jimenez-Barbero, J. Eur. J. Biochem. 1995,230, 621–633.
10. Asensio, J. L.; Canada, F. J.; Bruix, M.; Rodriguez-Romero, A.; Jimenez-Barbero, J. Glycobiology 1998, 8,569–577.
11. Amadei, A.; Linssen, A. B. M.; Berendsen, H. J. C.Proteins: Struct., Funct., Gen. 1993, 17, 412–425.
12. Daura, X.; Gademann, K.; Jaun, B.; Seebach, D.; vanGunsteren, W. F.; Mark, A. E. Angew. Chem. Int., Ed.1999, 38, 236–240.
13. Vasudevan, S. V.; Balaji, P. V. J. Phys. Chem. B 2001, 105,7033–7041.
14. Scott, W. R. P.; Hunenberger, P. H.; Tironi, I. G.; Mark,A. E.; Billeter, S. R.; Fennen, J.; Torda, A. E.; Huber, T.;
G. Colombo et al. / Carbohydrate Research 340 (2005) 1039–1049 1049
Kruger, P.; van Gunsteren, W. F. J. Phys. Chem. A 1999,103, 3596–3607.
15. van Gunsteren, W. F.; Daura, X.; Mark, A. E. Encyclo-pedia Comput. Chem. 1998, 2, 1211–1216.
16. Berendsen, H. J. C.; Grigera, J. R.; Straatsma, T. P. J.Phys. Chem. 1987, 91, 6269–6271.
17. Hess, B.; Bekker, H.; Fraaije, J. G. E. M.; Berendsen, H. J.C. J. Comp. Chem. 1997, 18, 1463–1472.
18. Miyamoto, S.; Kollman, P. A. J. Comp. Chem. 1992, 13,952–962.
19. Berendsen, H. J. C.; Postma, J. P. M.; van Gunsteren, W.F.; Nola, A. D.; Haak, J. R. J. Chem. Phys. 1984, 81,3684.
20. van der Spoel, D.; van Drunen, R.; Berendsen, H. J. C. InGRoningen MAchine for Chemical Simulations; van derSpoel, D.; van Drunen, R.; Berendsen, H. J. C., Eds.;Department of Biophysical Chemistry, BIOSON ResearchInstitute: Nijenborgh 4 NL-9717 AG Groningen, 1994.
21. Daura, X.; van Gunsteren, W. F.; Mark, A. E. Proteins1999, 34, 269–280.