A Distributed Sensor Network for the Control of a Bioclimatic House in Spain
18
Sensors 2009, 9, 8197-8214; doi:10.3390/s91008197 OPEN ACCESS sensors ISSN 1424-8220 www.mdpi.com/journal/sensors Article A Distributed Sensor Network for the Control of a Bioclimatic House in Spain ´ Alvaro Guti´ errez 1,? , Javier Jim´ enez-Leube 1 and Luis Magdalena 2 1 ETSI Telecomunicaci´ on, Universidad Polit´ ecnica de Madrid, Avd. Complutense 30, 28040 Madrid, Spain; E-Mail: [email protected] 2 European Centre for Soft Computing, C. Gonzalo Guti´ errez Quir ´ os S/N, 33600 Asturias, Spain; E-Mail: [email protected] ? Author to whom correspondence should be addressed; E-Mail: [email protected]; Tel.: +34 91-549-57-00 Ext. 2318. Received: 11 June 2009; in revised form: 5 October 2009 / Accepted: 12 October 2009 / Published: 19 October 2009 Abstract: The XXI century home should be a digital habitat, a connected residence, but at the same time it should be involved in sustainability and the environment. The location of new technologies at home, and its acceptance by the user, requires, among other actions, a significant diffusion and activity to be undertaken. This work proposes the development of a Smart House network designed for its integration into a sustainable and bioclimatic solar house. The paper focuses on a specific aspect of the house design, the control system bus, developed for the management of the different parameters, variables, sensors and actuators which coexist at home. Finally, the system has been installed in a laboratory bioclimatic house. Environmental variable experiments based on the control of passive elements, such as phase shift gels, are presented. Experimental results show that the system is able to benefit from the bioclimatic elements in the house by taking into account the user preferences. Keywords: smart house; energy control; bioclimatic house
-
Upload
independent -
Category
Documents
-
view
0 -
download
0
Transcript of A Distributed Sensor Network for the Control of a Bioclimatic House in Spain
Sensors 2009, 9, 8197-8214; doi:10.3390/s91008197
OPEN ACCESS
sensorsISSN 1424-8220
www.mdpi.com/journal/sensors
Article
A Distributed Sensor Network for the Control of a BioclimaticHouse in SpainAlvaro Gutierrez 1,?, Javier Jimenez-Leube 1 and Luis Magdalena 2
1 ETSI Telecomunicacion, Universidad Politecnica de Madrid, Avd. Complutense 30, 28040 Madrid,Spain; E-Mail: [email protected]
2 European Centre for Soft Computing, C. Gonzalo Gutierrez Quiros S/N, 33600 Asturias, Spain;E-Mail: [email protected]
? Author to whom correspondence should be addressed; E-Mail: [email protected];Tel.: +34 91-549-57-00 Ext. 2318.
Received: 11 June 2009; in revised form: 5 October 2009 / Accepted: 12 October 2009 /Published: 19 October 2009
Abstract: The XXI century home should be a digital habitat, a connected residence, but atthe same time it should be involved in sustainability and the environment. The location ofnew technologies at home, and its acceptance by the user, requires, among other actions, asignificant diffusion and activity to be undertaken. This work proposes the development ofa Smart House network designed for its integration into a sustainable and bioclimatic solarhouse. The paper focuses on a specific aspect of the house design, the control system bus,developed for the management of the different parameters, variables, sensors and actuatorswhich coexist at home. Finally, the system has been installed in a laboratory bioclimatichouse. Environmental variable experiments based on the control of passive elements, such asphase shift gels, are presented. Experimental results show that the system is able to benefitfrom the bioclimatic elements in the house by taking into account the user preferences.
Keywords: smart house; energy control; bioclimatic house
Sensors 2009, 9 8198
1. Introduction
1.1. Motivation
For a long time, architecture has been based on logic, and therefore substantiated in climatecriteria [1]. Traditional solutions make use of locally available resources which offer thermal inertiato the buildings thanks to the mass of cladding and partitions [2]. The use of thick ceramic, stoneor soil walls give rise to magnificent results characterized by a thermal stability and a decrease energydependence. However, this solution limits the energy accumulation capacity, because the materials couldnever go below the minimum temperature at night or above the maximum temperature during the day [3].Furthermore, the heating or cooling of solids concentrates their energy only in the outer layers. Anotherdrawback is that the energy load and unload takes place at a variable temperature. Hence they will neverwork at constant comfort conditions. Moreover, current construction methods have a tendency towardsthe lightness of the materials to cheap the structure and obtain a larger living area, which increase thelooses on thermal inertia systems.
On the other hand, the bioclimatic architecture [1, 3–5] represents the use of materials andconstructive elements under sustainability criteria. It represents the optimum-energy generation conceptby means of the active or passive accumulation [6], distribution of renewable energies [7] and theintegration of ecological building elements [8]. The bioclimatic architecture comes back to the commonsense criteria, making use of technological elements, which give rise to results similar to the traditionalones, without loosing the benefits of the current constructive methods. Typical accumulation systemsare substituted by others based on the heat exploitation stored in Phase Change Materials (PCMs) [9].PCMs obtain energy from the outside and store it in form of energy represented as their liquid or solidstate. As is known, the PCMs always obtain/release heat at the same temperature (e.g. 0 ◦C for thewater). Therefore, by making use of chemical components to tune the changing temperature, newbuilding designs may include PCMs to make use of their thermal capabilities. However, in real domesticimplementations, the use of control systems becomes necessary to manage the air flows which allow thePCMs to change phase.
Because of new advances in home automation [10–12], there is an important field which is createdwhen connecting bioclimatic and automation principles. At present, the smart house systems or domoticsface a social change. Until very recently, domotics was described as a facility technical management. Itwas exclusively for the control of single devices in the residential or industrial sector, basically referringto isolated appliances, sensors or actuators. The new advances in technology, particularly in terms ofinformation and communication technologies, has brought about a change in the approach in which theterm domotics moves towards new concepts of digital habitat or connected environment [13]. Moreover,it evolves to concepts such as ubiquitous computing or ambient intelligence [14–16], which puts mankindin an environment which adapts to the needs and preferences of the user, at the same time it satisfiesexternal conditions. Furthermore, it would be desirable that the low cost and energetic consumptionsensor, actuator and control devices introduced by the user, were able to create a network which takesindividual and collective decisions.
If we focus on specific details, the two more important elements are those related with the PersonalArea Networks (PAN) and the control of sensors and actuators. Moreover, these elements must be

Sensors 2009, 9 8199
integrated into the bioclimatic architecture and the renewable energy concept. Therefore, the XXIcentury home should be a digital habitat; a connected residence, but at the same time it should be involvedin sustainability and the environment. The location of new technologies in the house, and its acceptanceby the user, requires, among other actions, a significant diffusion and activity to be undertaken.
Following these lines of research, we pursue the implementation of a distributed sensor networkfor the control of bioclimatic and sustainable houses. In this work, we create and adapt a distributednetwork based on an industrial bus which confers the possibility of sensing environment variables andactuating different non-standard elements for the conditioning of the home. The present work focuses onspecific aspects of the house design and the control system bus developed for the different parameters,variables, sensors and actuators systems that coexist within. The paper is organized as follows: The restof Section 1 describes the house and offers a brief overview of bioclimatic and non-standard elementsin it. In Section 2 the control bus and the nodes in the network are described. Section 3 sets out theuser interface. This interface manages the orders given by the user to the house and monitors the statusof the system thanks to its graphical interface. Experimental results are presented in Section 4. Finally,Section 5 concludes the paper and suggests future developments.
1.2. The Bioclimatic House
Nowadays, different research projects in Spain focus on the convergence of construction, bioclimaticand domotics systems [17]. However, for significant results, these studies should be carried out inenvironments with similar conditions to those in standard houses. Therefore, the system presented inthis work has been installed in a solar bioclimatic house previously used for the Solar Decathlon 2005competition [18], organized by the Department of Energy of the United States of America. In thisworkshop, universities compete to design, build, and operate the most effective and energy-efficientsolar-powered house. The project of the Universidad Politecnica de Madrid raised these aspects (i.e.,technology, sustainability and diffusion) in a proposal for the creation of a prototype of a potentialhouse for the XXI century. The aspects related with the technology and diffusion are reflected in thelater application of the first prototype, which after having been in the Solar Decathlon, become a reallaboratory and technology demonstrator in Spain.
The house (see Figure 1) integrates sustainability elements based on the use of renewable energies,self-sufficiency energetic methods and recycled construction materials. The self-sufficiency is based onthe correct use of the energy from a suitable control system, and the use of a bioclimatic design whichreduces the energy needs for the achievement of adequate comfort levels inside the house.
The house has been designed to allow the air to circulate passively and create a comfortableenvironment without the need for complex elements. As previously mentioned, the classic storingprocedures, used by the bioclimatic architecture, are those which accumulate heat or cold in the structureof the building. However, because of the dimensional limitations of the house, we have not used heavyelements in its construction. Hence, we have decided to use energy storage systems in the form of latenttemperature; that is, to promote the phase change of a chemical substance storing the heat or cold in it.
Sensors 2009, 9 8200
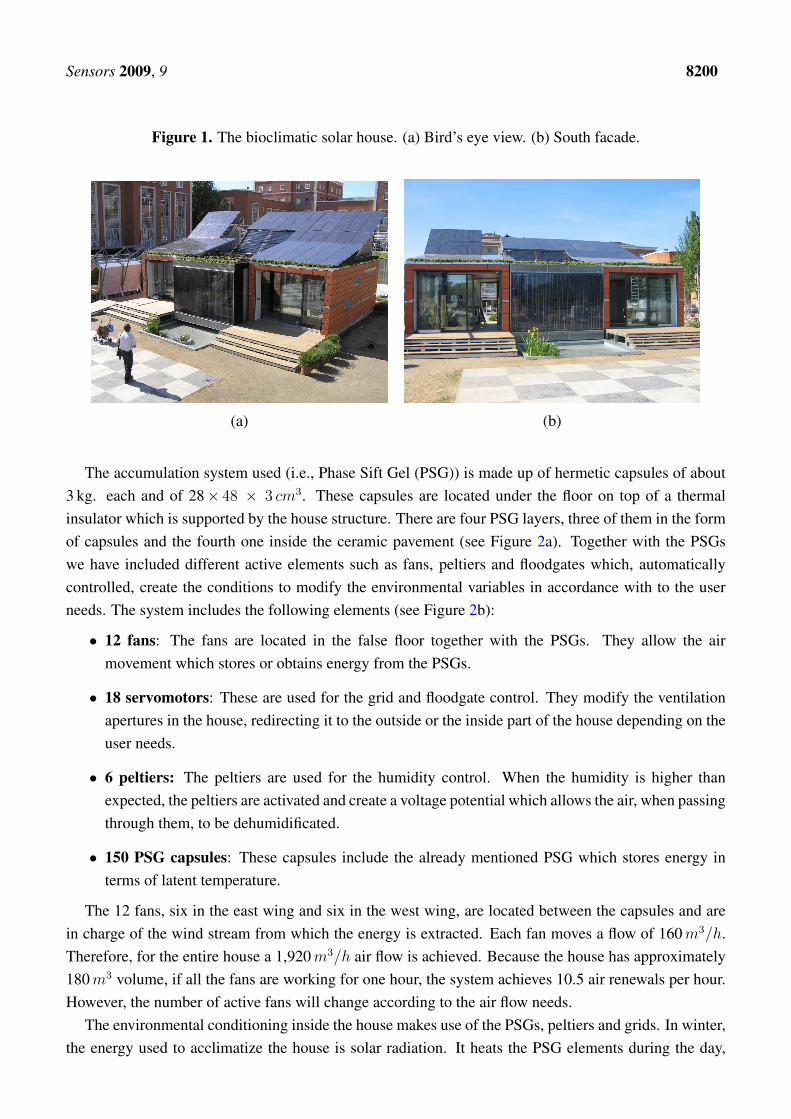
Figure 1. The bioclimatic solar house. (a) Bird’s eye view. (b) South facade.
(a) (b)
The accumulation system used (i.e., Phase Sift Gel (PSG)) is made up of hermetic capsules of about3 kg. each and of 28× 48 × 3 cm3. These capsules are located under the floor on top of a thermalinsulator which is supported by the house structure. There are four PSG layers, three of them in the formof capsules and the fourth one inside the ceramic pavement (see Figure 2a). Together with the PSGswe have included different active elements such as fans, peltiers and floodgates which, automaticallycontrolled, create the conditions to modify the environmental variables in accordance with to the userneeds. The system includes the following elements (see Figure 2b):
• 12 fans: The fans are located in the false floor together with the PSGs. They allow the airmovement which stores or obtains energy from the PSGs.
• 18 servomotors: These are used for the grid and floodgate control. They modify the ventilationapertures in the house, redirecting it to the outside or the inside part of the house depending on theuser needs.
• 6 peltiers: The peltiers are used for the humidity control. When the humidity is higher thanexpected, the peltiers are activated and create a voltage potential which allows the air, when passingthrough them, to be dehumidificated.
• 150 PSG capsules: These capsules include the already mentioned PSG which stores energy interms of latent temperature.
The 12 fans, six in the east wing and six in the west wing, are located between the capsules and arein charge of the wind stream from which the energy is extracted. Each fan moves a flow of 160 m3/h.Therefore, for the entire house a 1,920 m3/h air flow is achieved. Because the house has approximately180 m3 volume, if all the fans are working for one hour, the system achieves 10.5 air renewals per hour.However, the number of active fans will change according to the air flow needs.
The environmental conditioning inside the house makes use of the PSGs, peltiers and grids. In winter,the energy used to acclimatize the house is solar radiation. It heats the PSG elements during the day,

Sensors 2009, 9 8201
while they regulate the heat use during the night. On the other hand, in summer, the freshness during thenight must be stored in the PSGs, and must be used to cool the house during the day. In any situation,the system must be able to share the energy stored to acclimatize the house for the whole day.
Figure 2. The false floor elements in the house.
(a) (b)
Figure 3. Temperature control in a summer (a) night and (b) day.
(a) (b)
An important element of the system are the grid and floodgates. These elements are located in theceiling and false floor of the north and south facades to modify the air flows from the indoors to theoutdoors. For its correct working, the grids and floodgates must be positioned according to the needsof the house. For example, on a summer night (see Figure 3a), the north grids must be opened. Hence,the PSGs will obtain the freshness of the night while the rest of the house is aerated by opening thegreenhouse and the north ceiling grids. When the day comes, the grids and greenhouse are closedoutdoors (see Figure 3b). Therefore, the house must recirculate the temperature stored during the night,keeping the house fresh.
Furthermore, the humidity control is associated with the air streams generated by the existing fans.This air flow, when passing across the false floor, enters the dehumidification system (i.e., peltiers). The
Sensors 2009, 9 8202
different peltiers are activated depending on the humidity and user needs.
2. The Control Bus
For the automatic working of all the elements presented in the previous section we have designed andimplemented a distributed network which is able to measure all the environmental variables and activatesthe different fans, peltiers or servomotors. The sensor network intends for scalability. Therefore, anymeasurement variable could be inserted into the system by adding it to the network nodes. Flexibility isanother key component of the network, where any node can be “hot-plugged” into it without the need tostop or modify the architecture.
The network has been developed based on the RS-485 bus [19]. This robust and industrially tested busallows a fast reaction response to changes and future control implementations in the house. We decidednot to use a specific commercial smart house system (i.e., EIB/KNX [20], lonworks [21] or X10 [22]) infavor of the industrial RS-485 bus for the following criteria:
• The house, in which the system is going to be installed, is not a typical house where commercialdevices can be integrated. On the contrary, it is a laboratory where, from the very beginning,non-conventional devices are present: fans situated in the false floor, dehumidification systems,PSGs and laboratory instrumentation. This is because the house is nowadays used as a researchenvironment where different technologies in the fields of energy, construction and domotics arestudied. We hope in the short term we are able to transpose all these advances into commercialhouses.
• The house itself is a very dynamic environment where different novel technologies coexists. Thecontrol of non-standard technologies implies the need for a fast reaction when they are tested. Byusing commercial technologies we are restricted to devices which exist in the market and some ofthem are not able to control specific elements in the house.
• Finally, we wanted to create a new device based on an already tested technology which makes thesystem robust and scalable, and which offers new control capabilities in the field of sustainability,bioclimatic and self-sufficiency.
The system designed holds up to 32 nodes without the need for a repeater, and a 1.5 km distanceof transmission at 115,000 bauds. The implementation is based on a four-wire transmission, aphysical-decentralized architecture and a logical-centralized architecture. The system has been designedby focusing on scalability and robustness. Following these principles, all the nodes (i.e., NOD485) areidentical devices which allow different sensors and actuators to be connected. An embedded computerasks the nodes about the data measured and provides the information to the user. The network itselftakes into account the user and house needs and triggers the different actuators according to predefinedrequirements. Although the system is based on a decentralized topology, the central computer stores allthe data and control parameters that are accessible by the user from a web application (see Section 3).This communication allows the user to check the status of the house and to take the control of it, in casethe algorithm does not fit his needs.
Sensors 2009, 9 8203
2.1. The Node
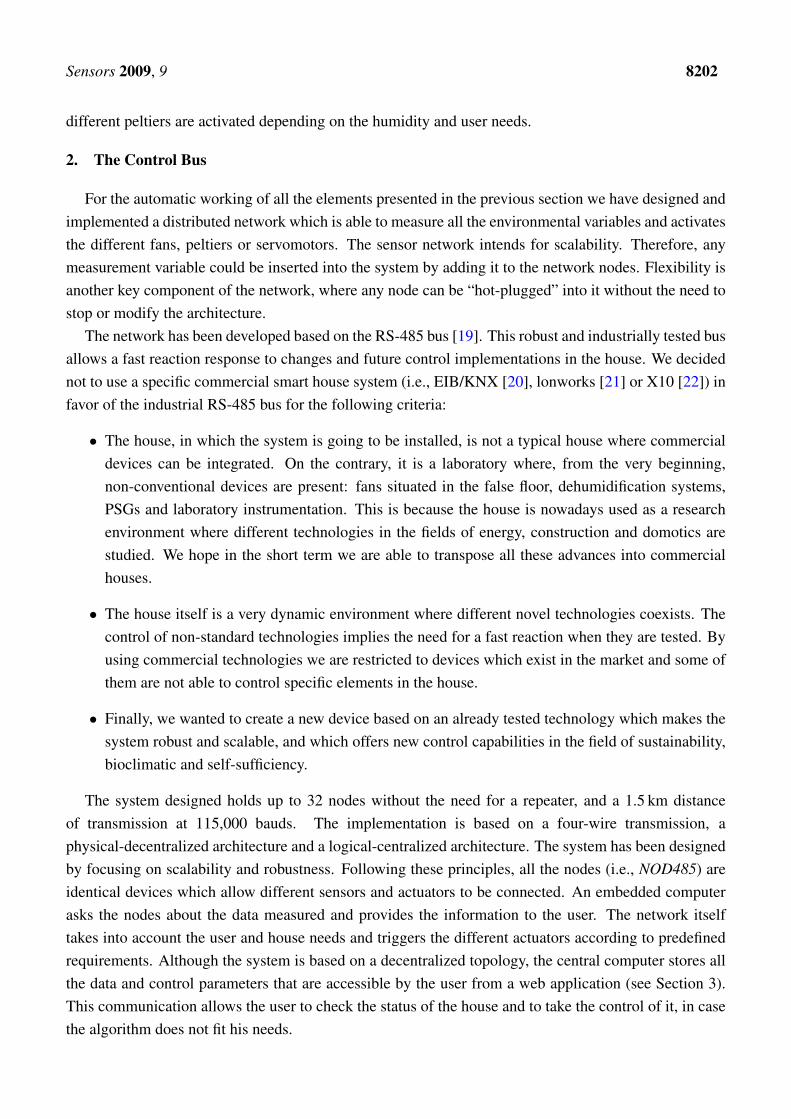
The NOD485 (see Figure 4a) is an autonomous system controlled by its own microcontroller. Thecontroller is in charge of communicating with the central computer, acquiring the information fromthe sensors attached and activating its different actuators. The board is equipped with two digitalinput/output lines, three analog inputs, one relay/triac output, an I2C bus and an RS-485 Full-Duplexbus (see Figure 4b).
Figure 4. (a) The NOD485. (b) The functional architecture of the NOD485.
(a) (b)
The NOD485 incorporates an isolated switched power supply. It allows a power input of 6–35 V andan efficiency of 85%–95% on the power conversion. It includes a safety power consumption systemwhich disconnects the node if consumption exceeds 1.25 A. Once the safety system is engaged, the nodeshort-circuits the RS-485 bus lines so as not to interfere with the other nodes in the network.
The actual implementation of the node includes three physical variables to detect (i.e. temperature,humidity and light) and two actuators (i.e., a relay and a triac) (see Figure 5). The evolution of thesolar bioclimatic house and the need for different functionalities will push on future sensor and actuatordesigns.
A monolithic sensor with on-chip signal conditioning has been chosen as the temperature sensor. Itcan be operated over the temperature range of 50 ◦C to +150 ◦C, making it ideal for its use in differentlocations. The signal conditioning eliminates the need for any trimming, buffering or linearizationcircuitry, greatly simplifying the system design and reducing the overall system cost. The output voltageis proportional to the temperature. The output swings from 0.25 V at 50 ◦C to +4.75 V at +150 ◦C usinga single +5.0 V supply. Therefore, a simple linearization makes the device useful for our application:
Sensors 2009, 9 8204
Vout = (Vcc/Vcal) (1.375 + ∆V Ta) (1)
where Vout is the voltage read at the analog to digital converter, Vcc is the sensor power supply, Vcal is the5 V calibrated power supply, ∆V is the linearization steps of 22.5 mV/◦C and Ta is the temperature.
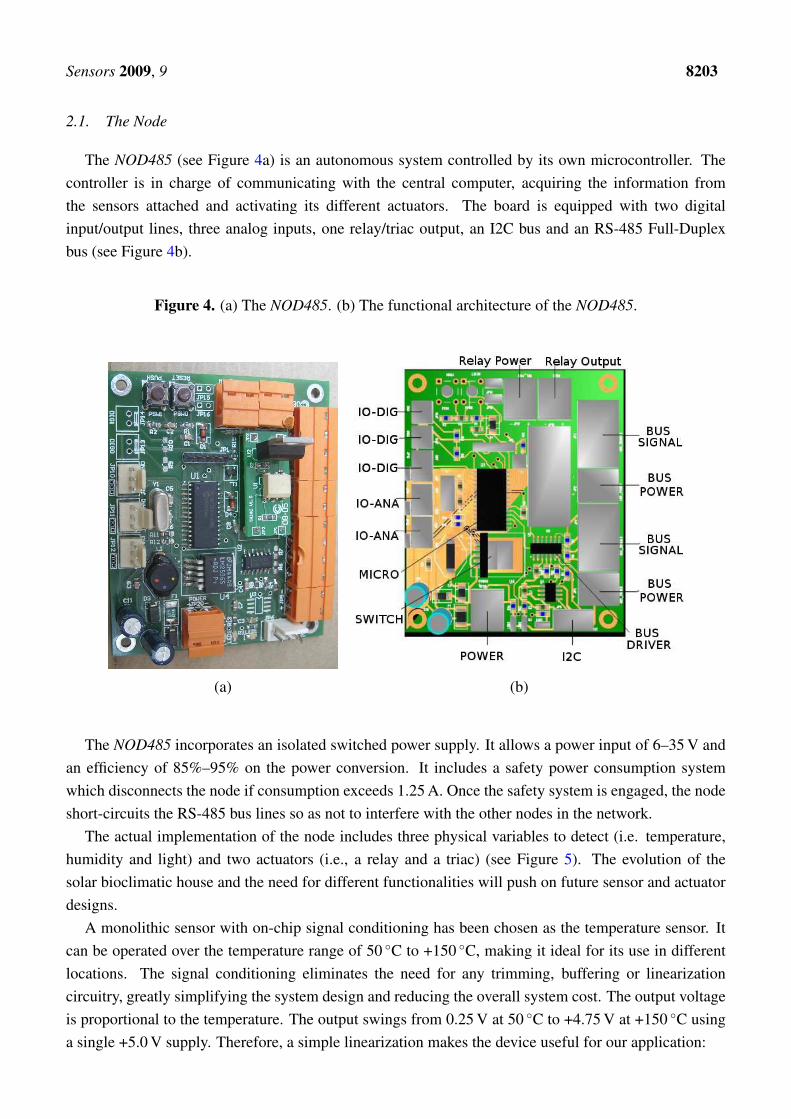
Figure 5. Sensor and actuator boards designed for its used on the NOD485.
HUMIDITYSENSOR
RELAYACTUATOR
LIGHT SENSOR TRIAC ACTUATOR
SENSORTEMPERATURE
The humidity sensor used has a linear voltage output designed to face an analog to digital converter.The sensor is a laser trimmed thermoset polymer capacitive sensing element with on-chip integratedsignal conditioning. The sensing element’s multilayer construction provides resistance to applicationproblems such as humidity, dust, dirt, oil, and common environmental chemicals. The sensor hasa reduced current draw of 200 mA which makes it suitable for our application. Its relative humiditymeasurement is interpreted as follows:
Vout = Vcc (0.0062 RHmeasure + 0.16) (2)
where Vout is the voltage read at the analog to digital converter, Vcc is the sensor power supply andRHmeasure is the relative humidity measurement.
However, the sensor is temperature dependent and a measurement correction must be includeddepending on the actual temperature:
RHreal = RHmeasure/(1.0546− 0.00216 Ta) (3)
where Ta is in Celsius.The light sensor used is a digital-output sensor with an I2C interface. It combines two photodiodes
and a companding analog-to-digital converter on a single CMOS integrated circuit to provide lightmeasurements over an effective 12-bit dynamic range with a response similar to that of the human eye.One of the photodiodes (channel 0) is sensitive to visible and infrared light, while the second photodiode(channel 1) is sensitive primarily to infrared light. An integrating ADC converts the photodiode currentsto digital outputs. When a reading is achieved, the channel 1 output is subtracted from that of channel 0,

Sensors 2009, 9 8205
compensating the effect of the IR light on the channel 0 photodiode. The result of this operation is thevalue obtained at the sensor output.
Both actuators, a relay and a triac, can be inserted into the NOD485 using the same docking slot (seeFigure 4b). The relay chosen is a miniaturized relay with an 8 A nominal current and 15 A peak current.It is able to control d.c. and a.c. motors of 230 V up to 3,000 W. However, when an a.c. motor is attachedto the NOD485, there is a great possibility of coils linking between the relay and the motor. Therefore,we have design a specific extension board including a triac for the a.c. motor control. The triac selectedis used both for an ON/OFF function or for phase control operation. It has been chosen because of itssnubberless version. The snubberless network offers the suppression of an RC network and it is suitablefor applications such as phase control and static switching on inductive or resistive loads.
2.2. Communication Protocol
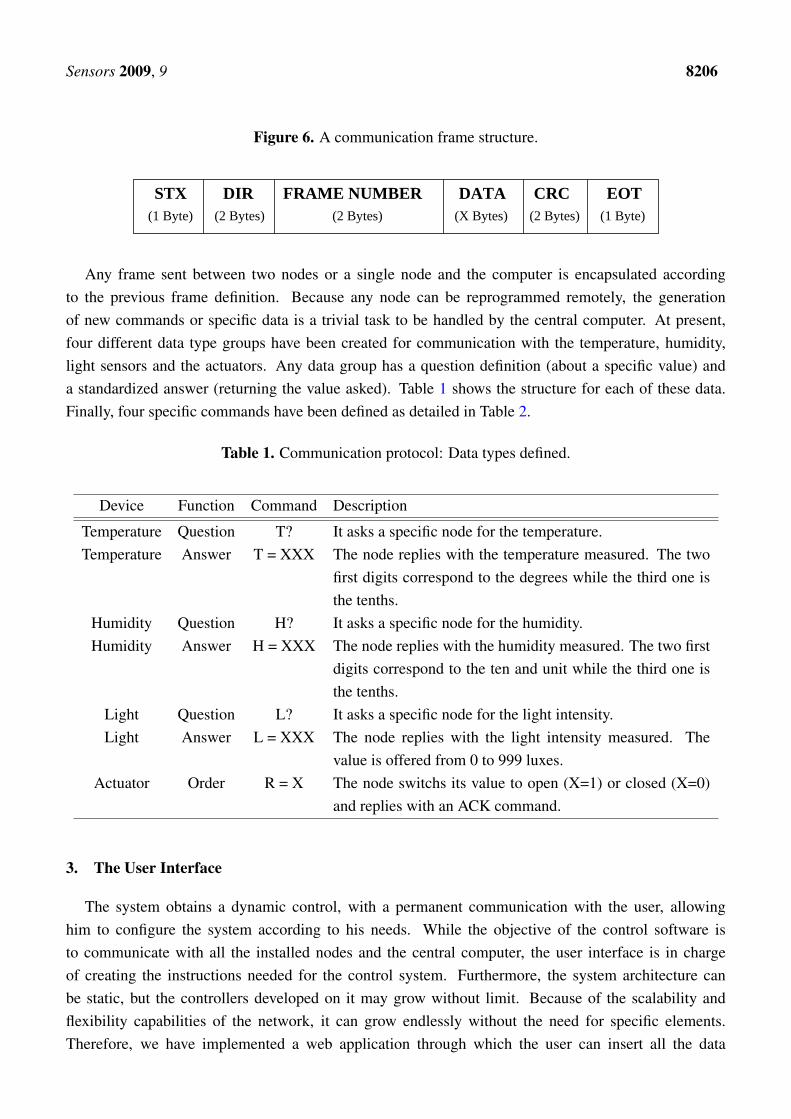
The communication protocol is based on an ASCII implementation where control characters andvalue codifications coexist in a same frame. The frame design allows the definition of two non-printablecharacters at the beginning and end of the the frame, and an oversized error control system for futureapplications. The frame is defined as a variable structure represented in Figure 6 and described asfollows:
• STX (0x02): It is the Start of Frame. This character establishes the starting point of a data frame.
• DIR: It is made up of 2 bytes which indicate the hexadecimal value of the node address in ASCIIcode. It is also used as the reception node address when the frame is sent by the computer. Forexample, if a frame is sent by the node ”1D”, the field will include the 0x31 and 0x42 bytes whichcorrespond to the ”1” and ”D” ASCII characters.
• Frame Number: 2 bytes which indicate hexadecimal value of the frame number. All the framesare numbered from 0x00 to 0xFF. When the frame number reaches its limit it is reset to the 0x00value.
• Data: The amount of data sent in each frame is variable. It includes both special commands anddata.
• CRC-16: 2 bytes used for the error detection transmission. The CRC generated corresponds tothe whole frame not including the EOT and STX characters.
• EOT (0x04): It is the End of Frame character. This character establishes the end point of the dataframe and indicates that the transmission has finished.
Sensors 2009, 9 8206
Figure 6. A communication frame structure.
(2 Bytes)
FRAME NUMBER(2 Bytes)
DIR(2 Bytes)
STX(1 Byte) (X Bytes)
DATA CRC EOT(1 Byte)
Any frame sent between two nodes or a single node and the computer is encapsulated accordingto the previous frame definition. Because any node can be reprogrammed remotely, the generationof new commands or specific data is a trivial task to be handled by the central computer. At present,four different data type groups have been created for communication with the temperature, humidity,light sensors and the actuators. Any data group has a question definition (about a specific value) anda standardized answer (returning the value asked). Table 1 shows the structure for each of these data.Finally, four specific commands have been defined as detailed in Table 2.
Table 1. Communication protocol: Data types defined.
Device Function Command Description
Temperature Question T? It asks a specific node for the temperature.Temperature Answer T = XXX The node replies with the temperature measured. The two
first digits correspond to the degrees while the third one isthe tenths.
Humidity Question H? It asks a specific node for the humidity.Humidity Answer H = XXX The node replies with the humidity measured. The two first
digits correspond to the ten and unit while the third one isthe tenths.
Light Question L? It asks a specific node for the light intensity.Light Answer L = XXX The node replies with the light intensity measured. The
value is offered from 0 to 999 luxes.Actuator Order R = X The node switchs its value to open (X=1) or closed (X=0)
and replies with an ACK command.
3. The User Interface
The system obtains a dynamic control, with a permanent communication with the user, allowinghim to configure the system according to his needs. While the objective of the control software isto communicate with all the installed nodes and the central computer, the user interface is in chargeof creating the instructions needed for the control system. Furthermore, the system architecture canbe static, but the controllers developed on it may grow without limit. Because of the scalability andflexibility capabilities of the network, it can grow endlessly without the need for specific elements.Therefore, we have implemented a web application through which the user can insert all the data
Sensors 2009, 9 8207
Table 2. Communication protocol: commands defined.
Command Value Description
ACK 0x06 It is sent when a frame has been received and decoded correctly.NACK 0x15 It is sent when a frame has not been decoded correctly.RESET 0x08 It forces the node to be reset. After this command, the node
sends an ACK and resets itself. For the next 2 seconds the nodeenters a programing mode which allows the central computer toreprogram the device.
ALIFE 0x0C This command is sent to a specific node to check if it is in workingmode. If the board is correctly working, it answers with an ACKcommand.
needed for the system definition. The user interface allows the user to install, program and modifythe nodes available in the network. Moreover, it offers different visualization interfaces for the correctunderstanding of the user.
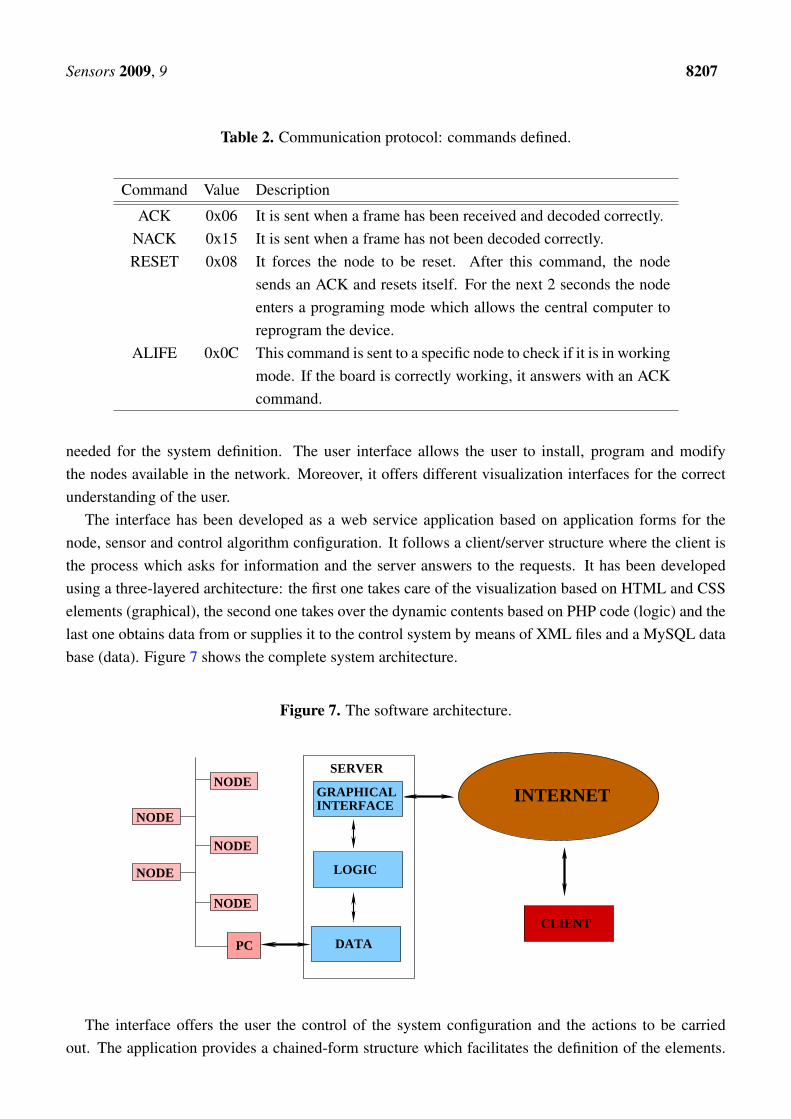
The interface has been developed as a web service application based on application forms for thenode, sensor and control algorithm configuration. It follows a client/server structure where the client isthe process which asks for information and the server answers to the requests. It has been developedusing a three-layered architecture: the first one takes care of the visualization based on HTML and CSSelements (graphical), the second one takes over the dynamic contents based on PHP code (logic) and thelast one obtains data from or supplies it to the control system by means of XML files and a MySQL database (data). Figure 7 shows the complete system architecture.
Figure 7. The software architecture.
NODE
NODE
NODE
NODE
NODE
PC
GRAPHICALINTERFACE
SERVER
LOGIC
DATA
INTERNET
CLIENT
The interface offers the user the control of the system configuration and the actions to be carriedout. The application provides a chained-form structure which facilitates the definition of the elements.
Sensors 2009, 9 8208
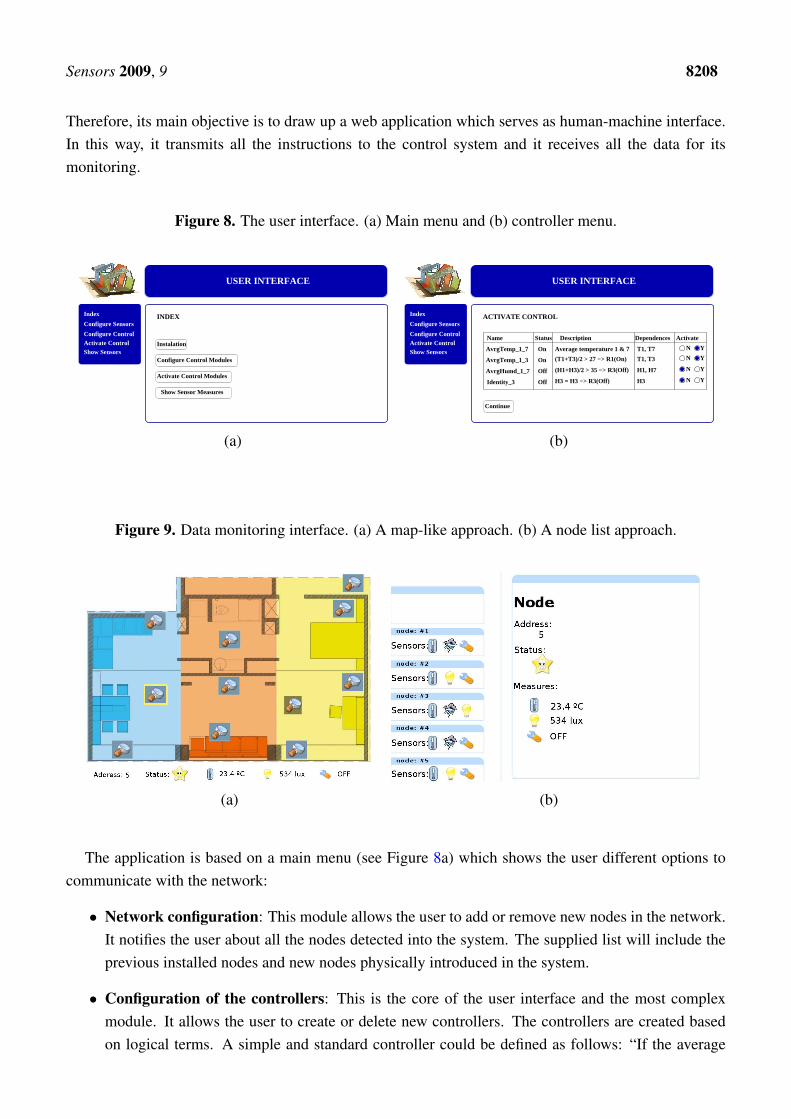
Therefore, its main objective is to draw up a web application which serves as human-machine interface.In this way, it transmits all the instructions to the control system and it receives all the data for itsmonitoring.
Figure 8. The user interface. (a) Main menu and (b) controller menu.
USER INTERFACE
Show Sensor Measures
Activate Control Modules
Configure Control Modules
Index
Configure Sensors
Configure ControlActivate ControlShow Sensors
Instalation
INDEX
USER INTERFACE
Index
Configure Sensors
Configure ControlActivate ControlShow Sensors
ACTIVATE CONTROL
Name ActivateDescriptionStatus
On
On
Off
AvrgTemp_1_7
AvrgTemp_1_3
AvrgHumd_1_7
Identity_3 Off
Average temperature 1 & 7
(H1+H3)/2 > 35 −> R3(Off)
(T1+T3)/2 > 27 −> R1(On)
H3 = H3 −> R3(Off)
Dependences
T1, T7
H1, H7
H3
T1, T3
Y
Y
YN
N
N
N
Continue
Y
(a) (b)
Figure 9. Data monitoring interface. (a) A map-like approach. (b) A node list approach.
(a) (b)
The application is based on a main menu (see Figure 8a) which shows the user different options tocommunicate with the network:
• Network configuration: This module allows the user to add or remove new nodes in the network.It notifies the user about all the nodes detected into the system. The supplied list will include theprevious installed nodes and new nodes physically introduced in the system.
• Configuration of the controllers: This is the core of the user interface and the most complexmodule. It allows the user to create or delete new controllers. The controllers are created basedon logical terms. A simple and standard controller could be defined as follows: “If the average

Sensors 2009, 9 8209
temperature measured by node 1 and node 3 is higher than 30◦C and the temperature measuredby node 5 is increasing then activate the air conditioner 2” which should be introduced into thesystem as “if((average(T1(t), T3(t) > 30) & (T5(t) > T5(t− 1)) thenR2(ON)”.
• Activation of the controllers: Different controllers created by different users can be available inthe data base. However, not all the users will be interested in having all the controllers runningat the same time. Hence, the interface allows the user to activate or deactivate the controllersaccording to his preferences (see Figure 8b).
• Data monitoring: The last module allows the user to visualize all the elements installed in thehouse. The information is plotted in two different configurations: i) A map-like approach (seeFigure 9a) and ii) a node list approach (see Figure 9b).
4. Experimental Results
4.1. The Network in the House
We have installed 22 nodes in the house according to the actual needs (see Figure 10). Four nodes(two on the north terrace and two on the south terrace) are located outdoors monitoring temperature,humidity and light conditions. Four nodes (one in the living room, one in the restroom, one on theeast side and one on the west side) monitoring indoor temperature, humidity and light. Eight nodes arelocated on the north and south side of the house monitoring temperature and humidity in the ceiling andfalse floor and managing the grid automation with a relay actuator. Two nodes are located on the eastand west false floor monitoring temperature and controlling six fans each for the air circulation thanksto the triac actuator. At the same location two more nodes monitor humidity and manage the activationof the peltiers with a relay actuator.
With all these nodes installed, we run two experiments. Both experiments try to control and optimizethe temperature and humidity values, however the first experiment is considered a failed experimentbecause of the outdoor climate conditions as explained in Section 4.2. A second experiment shows thesystem working successfully, where the controllers try to counteract the outdoor conditions. Note thatthe experiments presented do not try to carry out an exhaustive study of environmental parameters. Onthe other hand, they are presented to show that the system architecture is working and that differentcontrollers could be created and inserted into the system thanks to the user interface described inSection 3.
4.2. A Failed Experiment
The first experiment corresponds to the bioclimatic monitoring and control of the house from 10 amMay 10th, 2009 to 5 pm May 12th, 2009. The main objective was to maintain the indoor temperaturebetween 23 ◦C and 25 ◦C and the humidity at 30% managed by two simple controllers. The resultsobtained have not been as satisfactory as expected because of the climate conditions during the studiedperiod and the week before. However, the measurements have allowed the control system to be validated.
As shown in Figure 11a, none of the different areas of the house have reached the conditions planned.The grids and floodgates remained closed and the fans stopped during the whole experiment to keep

Sensors 2009, 9 8210
Figure 10. Actual location of nodes and their sensors in the house.
North
Temperature SensorHumidity Sensor
Light Sensor
Relay
Triac
Kitchen
Dinning Room
Restroom
Living Room
RoomBed
Office
Ceiling Node
Living area Node
False Floor Node
the house as isolated as possible from the outdoor conditions. However, different conclusions can beextracted from the figure:
• The PSG temperature is more stable than the outdoor temperature. This is because of their thermalinertia.
• The cold (in our example) comes from outdoors and modifies the indoor conditions. We canobserve a phase shift in the indoor temperature with respect to that of the outdoors. Moreover, theindoor temperature offers a more reduced amplitude because of the PSGs.
• For a successful climatization, the use of passive thermal conditioning is not enough when theoutdoor conditions are not appropriate. An active element, such as a heat pump or air conditioning,is needed to help the energy storage on the PSGs. This is because, after a long period without thepossibility of acquiring external energy, the system cannot reach the required values.
If we look at the humidity measurements (see Figure 11b), we observe that the humidity has neitherreached the intended value of 30%. However, a non-planned failure of the system made us realizeabout the correct working of the system. The problem was that a water pipe broke at noon onMay 12th. This flood created an increase in the indoor humidity (see Figure 12b) contrary to thedownward trend observed on the previous day (see Figure 12a). In a standard working, the system startswith a stored indoor humidity and gets reduced according to the influence of the outdoor humidity andthe PSG saturation. On the other hand, when the failure occurred, the fans were fully activated togetherwith the peltiers which tried to reduce the excess in humidity as observed in Figure 12b. Therefore, thehumidity in the false floor (where the PSGs are located) gets increased.

Sensors 2009, 9 8211
Figure 11. (a) Temperature and (b) humidity measurements for the first experiment period.
(a) (b)
Figure 12. Humidity measurements (a) for a normal working day and (b) when the waterpipe broke down.
(a) (b)
4.3. A Successful Experiment
Because the first experiment climate conditions were not too satisfactory for testing the system, weran a second experiment to demonstrate its correct working. For this experiment we sampled a workingperiod from 10 a.m. May 21th, 2009 to 5 p.m. May 23th, 2009.
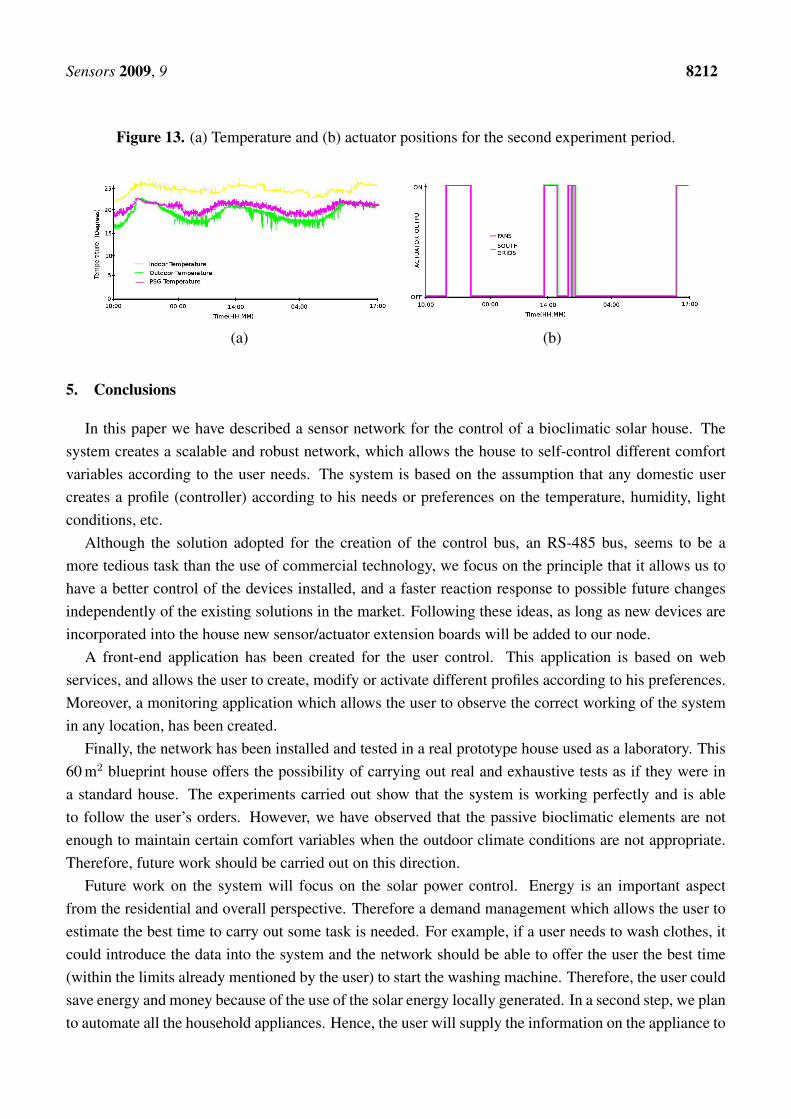
Figure 13a, shows the indoor, outdoor and PSG temperature measurements for the completeexperiment. The experiment is recorded after some sunny days, which explains that the indoortemperature starts around the optimal values. We observe, that as the day finishes, the outdoortemperature starts to decrease. This phenomenon influences the indoor and PSG temperature. Thanksto the thermal inertia of the PSGs, the system is able to keep the indoor temperature within an optimalinterval in detriment to the PSG temperature.
Figure 13b shows the fans and south grids actuators. We observe that when the temperature is above25 ◦C the south grids are opened and the fans activated. This situation makes the air circulate from thefalse floor (where the PSGs have a lower temperature) to cool the house. Once the optimal temperature(from 23 ◦C to 25 ◦C) has been reached, the fans are automatically stopped and the grids are closed.Hence, the house is closed to the outdoor and false floor thermal influences.
Sensors 2009, 9 8212
Figure 13. (a) Temperature and (b) actuator positions for the second experiment period.
(a) (b)
5. Conclusions
In this paper we have described a sensor network for the control of a bioclimatic solar house. Thesystem creates a scalable and robust network, which allows the house to self-control different comfortvariables according to the user needs. The system is based on the assumption that any domestic usercreates a profile (controller) according to his needs or preferences on the temperature, humidity, lightconditions, etc.
Although the solution adopted for the creation of the control bus, an RS-485 bus, seems to be amore tedious task than the use of commercial technology, we focus on the principle that it allows us tohave a better control of the devices installed, and a faster reaction response to possible future changesindependently of the existing solutions in the market. Following these ideas, as long as new devices areincorporated into the house new sensor/actuator extension boards will be added to our node.
A front-end application has been created for the user control. This application is based on webservices, and allows the user to create, modify or activate different profiles according to his preferences.Moreover, a monitoring application which allows the user to observe the correct working of the systemin any location, has been created.
Finally, the network has been installed and tested in a real prototype house used as a laboratory. This60 m2 blueprint house offers the possibility of carrying out real and exhaustive tests as if they were ina standard house. The experiments carried out show that the system is working perfectly and is ableto follow the user’s orders. However, we have observed that the passive bioclimatic elements are notenough to maintain certain comfort variables when the outdoor climate conditions are not appropriate.Therefore, future work should be carried out on this direction.
Future work on the system will focus on the solar power control. Energy is an important aspectfrom the residential and overall perspective. Therefore a demand management which allows the user toestimate the best time to carry out some task is needed. For example, if a user needs to wash clothes, itcould introduce the data into the system and the network should be able to offer the user the best time(within the limits already mentioned by the user) to start the washing machine. Therefore, the user couldsave energy and money because of the use of the solar energy locally generated. In a second step, we planto automate all the household appliances. Hence, the user will supply the information on the appliance to

Sensors 2009, 9 8213
use and the time interval, and the house should be able to allocate this information according toenergy criteria.
Acknowledgements
The authors acknowledge support from RBZ Robot Design S.L. Company. This work was supportedby the Ministerio de Educacion y Ciencia of Spain, within the Plan Nacional de I+D+I 2007-2010.(Gestion de la Demanda Electrica Domestica con Energıa Solar Fotovoltaica project, ENE2007-66135)and partly supported by the N4C - Networking for Challenged Communications Citizens: InnovativeAlliances and Test beds project, funded by the Seventh Framework Program (FP7-ICT-223994-N4C) ofthe European Commission. The information provided is the sole responsibility of the authors and doesnot reflect the European Commission’s opinion. The European Commission is not responsible for anyuse that might be made of data appearing in this publication.
References and Notes
1. Olgyay, V.; Olgyay, A. Application of Climatic Data to House Design; House and Home FinanceAgency: Washington, DC, USA, 1954.
2. Rapoport, A. Buildings and Society: Essays on the Social Development of the Built Environment;Routledge and Kegan Paul Ltd.: London, UK.
3. Olgyay, V. Design With Climate: Bioclimatic Approach to Architectural Regionalism; PrincetonUniversity Press: Princeton, NJ, USA, 1963.
4. Olgyay, V. Bioclimatic Approach to Architecture; Technical Report for National Research Council,Washington, DC, USA, 1953.
5. Jones, D.L. Architecture and the Environment: Bioclimatic Building Design; Laurence King:London, UK, 1998.
6. Henze, G.P.; Felsmann, C.; Knabe, G. Evaluation of Optimal Control for Active and PassiveBuilding Thermal Storage. Int. J. Therm. Sci. 2004, 43, 173–183.
7. Hui, S.C. Low Energy Building Design in High Density Urban Cities. Renewable Energy 2001,24, 627–640.
8. Thompson, G.F., Steiner, R.S., Eds.; Ecological Design and Planning; Wiley & Sons: London,UK, 1997.
9. Zalba, B.; Marın, J.M.; Cabeza, L.F.; Mehling, H. Review on Thermal Energy Storage with PhaseChange: Materials, Heat Transfer Analysis and Applications. App. Therm. Eng. 2002, 23, 251–283.
10. Inoue, M.; Uemura, K.; Minagawa, Y.; Esaki, M.; Honda, Y. A Home Automation System. IEEETrans. Consum. Electron. 1985, 31, 516–527.
11. Stauffer, H.B. Smart Enabling System for Home Automation. IEEE Trans. Consum. Electron.1991, 37, 29–35.
12. Nugent, C.D.; Finlay, D.D.; Fiorini, P.; Tsumaki, Y.; Prassler, E. Editorial Home Automation as aMeans of Independent Living. IEEE Trans. Automat. Sci. and Eng. 2008, 5, 1–9.
Sensors 2009, 9 8214
13. Anderson, B.; McWilliam, A.; Lacohee, H.; Clucas, E.; Gershuny, J. Family Life in the DigitalHome: Domestic Telecommunications at the End of the 20th Century. J. BT Technol. 2007,25, 301–312.
14. Weiser, M. Hot Topics-Ubiquitous Computing. Computer 1993, 26, 71–72.15. Aarts, E. Ambient Intelligence: A Multimedia Perspective. IEEE Multim. 2004, 11, 12–19.16. Weber, W., Rabaey, J.R., Aarts, E., Eds.; Ambient Intelligence; Springer-Verlag: Berlin,
Germany, 2005.17. Caamano-Martın, E.; Masa, D.; Gutierrez, A.; Monasterio-Huelin, F.; Jimenez-Leube, J.; Castillo,
M.; Porro, J. Optimizing PV Use Through Active Demand Side Management. In Proceedings ofthe 24th European Photovoltaic Solar Energy Conference, Munich, Germany, 2009, in press.
18. Caamano-Martın, E.; Egido, M.A.; Neila, J.; Bedoya, C.; Santos, A.G.; Jimenez, F.J.; Magdalena,L. Spanish Participation in the “Solar Decathlon 2005” Competition: New Proposals forZero-Energy Houses. In Proceedings of the 20th European Photovoltaic Solar Energy Conference,Munich, Germany, 2005; pp. 2587–2590.
19. ISO/IEC 8482. International Organization for Standarization: Geneva, Switzerland, 1993.20. Crijns, H. KNX System Architecture; Konnex Association: Brussels, Belgium, 2004.21. Dietmar, L., Dietmar, D., Schweinzer, H.J., Eds.; Open Control Networks: LonWorks/EIA 709
Technology; Springer-Verlag: Berlin, Germany, 2001.22. Gerhart, J. Home Automation & Wiring. McGraw Hill: Columbus, OH, USA, 1999.
c© 2009 by the authors; licensee Molecular Diversity Preservation International, Basel, Switzerland.This article is an open-access article distributed under the terms and conditions of the Creative CommonsAttribution license (http://creativecommons.org/licenses/by/3.0/).