
A detailed analysis of two seismic sequences in Abruzzo, Central Apennines, Italy
22
Journal of Seismology 4: 1–21, 2000. © 2000 Kluwer Academic Publishers. Printed in the Netherlands. 1 A detailed analysis of two seismic sequences in Abruzzo, Central Apennines, Italy G. De Luca 1,2 , R. Scarpa 2 , L. Filippi 1 , A. Gorini 1 , S. Marcucci 1 , P. Marsan 1 , G. Milana 1 & E. Zambonelli 2 1 Servizio Sismico Nazionale, Dipart. Servizi Tecnici Naz., Via Curtatone 3, 00185 Roma, Italy; 2 Dipartimento di Fisica, Universit` a dell’Aquila, Via Vetoio, 67010 – Coppito (L’Aquila), Italy Received 11 May 1998; accepted in revised form 4 January 1999 Key words: Apennines, focal mechanisms, seismicity, source parameters Abstract A three-component digital seismic network has been installed along central Apennines since the end of 1991. Two seismic sequences having main shocks of magnitudes 3.9 and 3.7 were recorded in August 1992 and June 1994, respectively. A detailed analysis of these sequences, including multiplet relocation, fault-plane solutions and source parameter estimation, is performed in the present paper. A correlation analysis allowed us to recognize a number of correlated events in the two sequences which were used for relative locations using a master event technique. This analysis allowed to obtain a better alignment of epicentral data along two almost orthogonal directions, following an Apenninic and an anti-Apenninic trend. For the two sequences, fault-plane solutions were evaluated by using a first arrival technique, resulting in mechanisms with predominantly normal faulting for the 1992 and 1994 swarms. S-wave polarization analysis allowed to check the stability of the previous solutions and to reduce their range of uncertainty. The same technique was also applied to derive the composite fault-plane solutions from the aftershocks, resulting in solutions which are in good agreement with those derived from the main shocks of both sequences. Source parameters were then derived from the three-component records of 28 well-recorded events with seismic moment in the range 8.5 × 10 10 –1.0 × 10 14 Nm. Stress drops ranged in the interval 0.3–52.3 bar and source radii were of the order of 100 m. Their scaling relations are in good agreement with other results derived from the analysis of other Italian earthquakes that occurred in regions of predominantly normal faulting tectonics (Apennines and Calabrian arc). Introduction The mountain chain of Abruzzo, central Apennines, Italy (Figure 1), is a seismic region characterized by normal faulting earthquakes reaching maximum in- tensity values up to XI MCS corresponding to M s close to seven (the largest and most destructive known events occurred in 1349, 1461, 1703 and 1915). The seismic activity of Abruzzo region is quite similar to that of most central-southern Apennines, with pre- dominant normal faulting earthquakes linked to a fault system striking mainly into the direction of the moun- tain chain. The largest earthquakes have a complex fault geometry (Bernard and Zollo, 1989a; De Natale et al., 1988; Westaway and Smith, 1989) and recur- rence periods also of thousands years (Pantosti and Valensise, 1990, 1993; Blumetti, 1995). The most well documented earthquake occurred on November 23, 1980 (M s = 6.9), indicating a complex fracture pro- cess linked to a predominant normal faulting solution (Bernard and Zollo, 1989a; Pantosti and Valensise, 1990, 1993; Westaway, 1992). Other well studied sequences occurred in Umbria in 1979, 1984 and 1997 (Deschamps et al., 1984; Haessler et al., 1988; Amato et al., 1998) and Abruzzo in 1984 (Westaway et al., 1989), following main shocks having mag- nitudes in the range 5.0–6.0. Also these moderate size earthquakes have shown the presence of predominant normal faulting mechanisms and complex aftershocks
-
Upload
independent -
Category
Documents
-
view
1 -
download
0
Transcript of A detailed analysis of two seismic sequences in Abruzzo, Central Apennines, Italy

Journal of Seismology4: 1–21, 2000.© 2000Kluwer Academic Publishers. Printed in the Netherlands.
1
A detailed analysis of two seismic sequences in Abruzzo, CentralApennines, Italy
G. De Luca1,2, R. Scarpa2, L. Filippi1, A. Gorini1, S. Marcucci1, P. Marsan1, G. Milana1 & E.Zambonelli21Servizio Sismico Nazionale, Dipart. Servizi Tecnici Naz., Via Curtatone 3, 00185 Roma, Italy;2Dipartimento diFisica, Universita dell’Aquila, Via Vetoio, 67010 – Coppito (L’Aquila), Italy
Received 11 May 1998; accepted in revised form 4 January 1999
Key words:Apennines, focal mechanisms, seismicity, source parameters
Abstract
A three-component digital seismic network has been installed along central Apennines since the end of 1991.Two seismic sequences having main shocks of magnitudes 3.9 and 3.7 were recorded in August 1992 and June1994, respectively. A detailed analysis of these sequences, including multiplet relocation, fault-plane solutions andsource parameter estimation, is performed in the present paper. A correlation analysis allowed us to recognize anumber of correlated events in the two sequences which were used for relative locations using amaster eventtechnique. This analysis allowed to obtain a better alignment of epicentral data along two almost orthogonaldirections, following an Apenninic and an anti-Apenninic trend. For the two sequences, fault-plane solutions wereevaluated by using a first arrival technique, resulting in mechanisms with predominantly normal faulting for the1992 and 1994 swarms. S-wave polarization analysis allowed to check the stability of the previous solutions and toreduce their range of uncertainty. The same technique was also applied to derive the composite fault-plane solutionsfrom the aftershocks, resulting in solutions which are in good agreement with those derived from the main shocksof both sequences. Source parameters were then derived from the three-component records of 28 well-recordedevents with seismic moment in the range 8.5× 10¹⁰–1.0× 10¹⁴ Nm. Stress drops ranged in the interval 0.3–52.3bar and source radii were of the order of 100 m. Their scaling relations are in good agreement with other resultsderived from the analysis of other Italian earthquakes that occurred in regions of predominantly normal faultingtectonics (Apennines and Calabrian arc).
Introduction
The mountain chain of Abruzzo, central Apennines,Italy (Figure 1), is a seismic region characterized bynormal faulting earthquakes reaching maximum in-tensity values up to XI MCS corresponding to Msclose to seven (the largest and most destructive knownevents occurred in 1349, 1461, 1703 and 1915). Theseismic activity of Abruzzo region is quite similar tothat of most central-southern Apennines, with pre-dominant normal faulting earthquakes linked to a faultsystem striking mainly into the direction of the moun-tain chain. The largest earthquakes have a complexfault geometry (Bernard and Zollo, 1989a; De Nataleet al., 1988; Westaway and Smith, 1989) and recur-
rence periods also of thousands years (Pantosti andValensise, 1990, 1993; Blumetti, 1995). The most welldocumented earthquake occurred on November 23,1980 (Ms = 6.9), indicating a complex fracture pro-cess linked to a predominant normal faulting solution(Bernard and Zollo, 1989a; Pantosti and Valensise,1990, 1993; Westaway, 1992). Other well studiedsequences occurred in Umbria in 1979, 1984 and1997 (Deschamps et al., 1984; Haessler et al., 1988;Amato et al., 1998) and Abruzzo in 1984 (Westawayet al., 1989), following main shocks having mag-nitudes in the range 5.0–6.0. Also these moderate sizeearthquakes have shown the presence of predominantnormal faulting mechanisms and complex aftershocks

2
Figure 1. Simplified geological and structural map of central Italy.

3
Fig
ure
2.
Serv
izio
Sis
mic
oN
azi
onale(S
SN)
mon
itorin
gne
twor
ks.
Dig
italt
hree
-com
pone
ntse
ism
icne
twor
kat
left,
GP
Sbe
nchm
ark
netw
ork
atto
prig
htan
dL’
Aqu
ilast
rong
mot
ion
arra
yat
botto
mrig
ht.
4
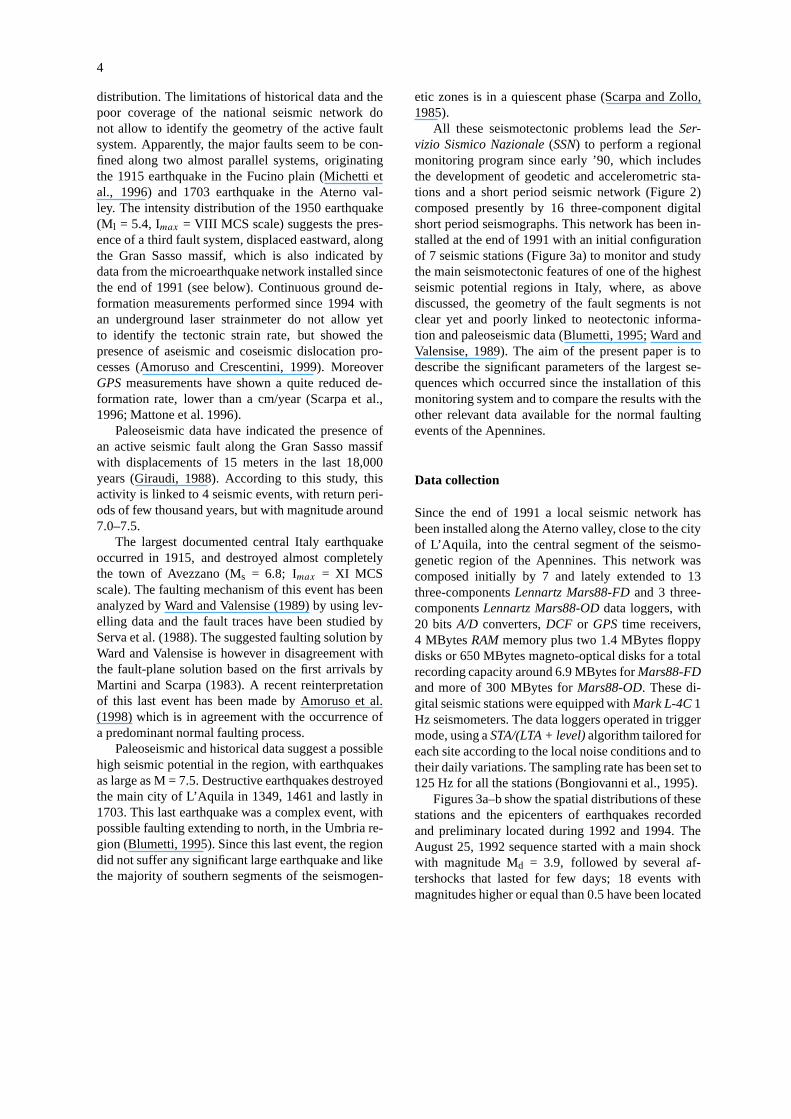
distribution. The limitations of historical data and thepoor coverage of the national seismic network donot allow to identify the geometry of the active faultsystem. Apparently, the major faults seem to be con-fined along two almost parallel systems, originatingthe 1915 earthquake in the Fucino plain (Michetti etal., 1996) and 1703 earthquake in the Aterno val-ley. The intensity distribution of the 1950 earthquake(Ml = 5.4, Imax = VIII MCS scale) suggests the pres-ence of a third fault system, displaced eastward, alongthe Gran Sasso massif, which is also indicated bydata from the microearthquake network installed sincethe end of 1991 (see below). Continuous ground de-formation measurements performed since 1994 withan underground laser strainmeter do not allow yetto identify the tectonic strain rate, but showed thepresence of aseismic and coseismic dislocation pro-cesses (Amoruso and Crescentini, 1999). MoreoverGPSmeasurements have shown a quite reduced de-formation rate, lower than a cm/year (Scarpa et al.,1996; Mattone et al. 1996).
Paleoseismic data have indicated the presence ofan active seismic fault along the Gran Sasso massifwith displacements of 15 meters in the last 18,000years (Giraudi, 1988). According to this study, thisactivity is linked to 4 seismic events, with return peri-ods of few thousand years, but with magnitude around7.0–7.5.
The largest documented central Italy earthquakeoccurred in 1915, and destroyed almost completelythe town of Avezzano (Ms = 6.8; Imax = XI MCSscale). The faulting mechanism of this event has beenanalyzed by Ward and Valensise (1989) by using lev-elling data and the fault traces have been studied byServa et al. (1988). The suggested faulting solution byWard and Valensise is however in disagreement withthe fault-plane solution based on the first arrivals byMartini and Scarpa (1983). A recent reinterpretationof this last event has been made by Amoruso et al.(1998) which is in agreement with the occurrence ofa predominant normal faulting process.
Paleoseismic and historical data suggest a possiblehigh seismic potential in the region, with earthquakesas large as M = 7.5. Destructive earthquakes destroyedthe main city of L’Aquila in 1349, 1461 and lastly in1703. This last earthquake was a complex event, withpossible faulting extending to north, in the Umbria re-gion (Blumetti, 1995). Since this last event, the regiondid not suffer any significant large earthquake and likethe majority of southern segments of the seismogen-
etic zones is in a quiescent phase (Scarpa and Zollo,1985).
All these seismotectonic problems lead theSer-vizio Sismico Nazionale(SSN) to perform a regionalmonitoring program since early ’90, which includesthe development of geodetic and accelerometric sta-tions and a short period seismic network (Figure 2)composed presently by 16 three-component digitalshort period seismographs. This network has been in-stalled at the end of 1991 with an initial configurationof 7 seismic stations (Figure 3a) to monitor and studythe main seismotectonic features of one of the highestseismic potential regions in Italy, where, as abovediscussed, the geometry of the fault segments is notclear yet and poorly linked to neotectonic informa-tion and paleoseismic data (Blumetti, 1995; Ward andValensise, 1989). The aim of the present paper is todescribe the significant parameters of the largest se-quences which occurred since the installation of thismonitoring system and to compare the results with theother relevant data available for the normal faultingevents of the Apennines.
Data collection
Since the end of 1991 a local seismic network hasbeen installed along the Aterno valley, close to the cityof L’Aquila, into the central segment of the seismo-genetic region of the Apennines. This network wascomposed initially by 7 and lately extended to 13three-componentsLennartz Mars88-FDand 3 three-componentsLennartz Mars88-ODdata loggers, with20 bits A/D converters,DCF or GPStime receivers,4 MBytesRAMmemory plus two 1.4 MBytes floppydisks or 650 MBytes magneto-optical disks for a totalrecording capacity around 6.9 MBytes forMars88-FDand more of 300 MBytes forMars88-OD. These di-gital seismic stations were equipped withMark L-4C1Hz seismometers. The data loggers operated in triggermode, using aSTA/(LTA + level)algorithm tailored foreach site according to the local noise conditions and totheir daily variations. The sampling rate has been set to125 Hz for all the stations (Bongiovanni et al., 1995).
Figures 3a–b show the spatial distributions of thesestations and the epicenters of earthquakes recordedand preliminary located during 1992 and 1994. TheAugust 25, 1992 sequence started with a main shockwith magnitude Md = 3.9, followed by several af-tershocks that lasted for few days; 18 events withmagnitudes higher or equal than 0.5 have been located

5
Fig
ure
3.
(a)
1992
and
(b)
1994
eart
hqua
kedi
strib
utio
nsan
dge
omet
ryev
olut
ion
ofth
ece
ntra
lApe
nnin
esse
ism
icne
twor
k.O
pen
circ
les
corr
espo
ndto
eart
hqua
keep
icen
ters
,cl
osed
tria
ngle
sto
seis
mic
stat
ions
,clo
sed
squa
res
toth
epr
inci
palt
owns
and
the
clos
edst
aris
the
peak
ofG
ran
Sas
so(2
912
m).
Lin
esre
pres
entt
here
gion
albo
unda
ries
.

6
Table 1. Hypocentral parameters and magnitudes (Md and Ml ) of the August 1992 and June 1994 seismic sequences in central Apennines(Abruzzo region). In the first column the progressive numbers are reported as in Figures 8a–b and Table 3. The hypocentral parameters arecomputed with theHYPO71code (Lee and Valdes, 1985) and using1-D velocity model (see Table 2) from Nicolich (1981). The missingmagnitudes are due to clipped signals (for Ml ) or to the presence of close aftershock events (for Md). The depth and the errors on thehorizontal axis and on depth (ERH and ERZ columns) are reported in km.
N◦ Date Origin Time UT Latitude North Longitude East Depth Phases GAP(◦) RMS (sec) ERH ERZ Md Ml
03 920825 02:25 47.90 42 26.77 13 22.45 12.3 21 149 0.31 1.0 1.4 3.9
05 920825 02:31 54.76 42 25.78 13 23.65 08.2 08 282 0.21 2.4 2.2 0.8 0.8
06 920825 02:45 11.91 42 25.90 13 23.83 08.7 08 282 0.05 0.7 0.6 0.7 0.7
07 920825 02:46 16.28 42 25.79 13 23.65 08.6 08 282 0.11 1.3 1.1 0.5 0.5
08 920825 02:48 48.37 42 27.09 13 23.65 10.9 16 157 0.27 1.5 1.6 1.6 1.5
09 920825 02:49 27.91 42 25.32 13 24.11 08.9 08 276 0.06 0.8 0.6 1.1 1.1
10 920825 05:02 49.94 42 24.69 13 24.57 08.6 10 267 0.15 1.1 0.9 1.3 1.3
14 920825 08:09 20.92 42 26.61 13 23.12 11.1 19 151 0.25 1.3 1.3 1.1 1.2
17 920826 12:14 06.76 42 24.12 13 23.65 07.7 06 263 0.22 3.3 2.0 0.8 0.9
18 920826 12:23 08.67 42 25.60 13 24.13 07.9 16 279 0.21 1.1 1.1 1.4 1.3
19 920826 14:53 08.77 42 24.86 13 24.56 09.1 08 269 0.05 0.4 0.3 1.0 1.1
21 920826 18:56 16.13 42 25.10 13 24.33 09.3 10 273 0.08 0.7 0.6 0.9 1.1
22 920826 23:31 04.52 42 26.58 13 23.03 10.9 24 150 0.25 0.9 0.6 2.3
23 920826 23:31 33.04 42 24.32 13 24.45 08.8 08 262 0.11 0.9 0.8 1.7 1.7
24 920827 03:54 12.97 42 25.34 13 24.13 08.7 06 276 0.01 0.2 0.1 0.7 0.6
27 920827 10:06 36.64 42 24.62 13 23.65 09.3 10 287 0.26 2.2 1.7 1.1 1.3
28 920827 10:07 32.07 42 22.91 13 24.46 07.0 10 218 0.11 0.7 0.7 1.4 1.5
29 920827 12:52 24.26 42 25.18 13 23.95 08.8 08 275 0.06 0.7 0.5 1.3 1.5
01 940602 16:41 23.90 42 26.60 13 15.96 13.2 28 080 0.26 0.9 1.6 2.9
02 940602 16:41 40.24 42 26.21 13 14.95 10.9 27 126 0.40 1.5 1.0 3.7
03 940602 16:45 23.51 42 28.91 13 17.29 11.8 17 140 0.26 1.4 0.7 2.0 1.9
04 940602 16:59 55.77 42 29.30 13 18.45 03.8 11 147 0.11 0.5 0.4 1.1 1.2
05 940602 17:00 34.57 42 28.54 13 15.64 10.7 13 132 0.18 1.3 0.8 1.2 1.2
06 940602 17:38 13.95 42 26.70 13 15.91 13.8 26 080 0.21 0.8 1.3
07 940602 17:38 57.83 42 27.66 13 16.66 11.7 20 131 0.29 1.1 0.7 3.2
08 940602 17:44 56.60 42 27.09 13 16.51 14.9 27 079 0.16 0.6 0.9 2.5 2.6
09 940602 18:07 44.04 42 26.72 13 19.13 11.3 05 328 0.06 0.9 0.7 1.5 1.6
10 940602 18:15 18.91 42 29.56 13 19.47 08.0 14 153 0.43 2.7 5.3 0.9
11 940602 18:15 26.48 42 29.03 13 18.05 10.2 15 144 0.18 1.2 1.0 2.1 2.0
12 940602 18:33 50.63 42 27.07 13 17.75 17.3 17 121 0.13 0.9 0.8 1.7 1.6
13 940602 19:31 21.61 42 27.50 13 18.76 15.8 13 223 0.09 0.7 0.7 2.0 1.9
(see Table 1). The June 2, 1994 sequence started witha foreshock having magnitude Ml = 2.9 followed in afew seconds by an event with Md = 3.7 and by severalaftershocks that lasted for less than one day; 13 eventswith magnitudes higher or equal than 0.9 have beenlocated (see Table 1).
Due to the low detection threshold and to the highamplification of the signals, the waveforms of thetwo main shocks and events n. 6 and 7 of the 1994swarm (see Table 1) were clipped and their magnitudeswere estimated only by the signal duration from a
drum recorder located in theDipartimento di Fisicaof L’Aquila University.
The local magnitudes Ml of the aftershocks wereevaluated by a conversion of the not clipped horizontalwaveforms recorded by the three-component stationsinto equivalentWood-Andersonseismograms.
The Md has been computed with regression ana-lysis by using Ml values from local earthquakes; theobtained relationship is Md = 2.7 log(t)–2.7 wheret istime expressed in seconds (Bongiovanni et al., 1995).The estimated values of Md and Ml are shown in the

7
Figure 4. Final configuration of seismic stations which haveprovided data for the August 1992 and June 1994 sequences.
last two columns of Table 1 and are well correlatedwith regional events detected by theING network.
The quality of the preliminary locations was notsatisfying due to the low number of stations and tothe fact that both sequences lie just outside the seismicnetwork. Therefore, in order to improve their reliabil-ity, we collected all the waveforms coming from theseismic stations operating in a circular area havingabout 120 km radius around the epicentral areas. Do-ing so we were able to read arrival times from stationsbelonging to the national seismic network, maintainedby the Istituto Nazionale di Geofisica(ING), to Um-bria regional seismic network (RE.SI.L.) maintainedby theRegione Umbriaand to Campotosto dam localnetwork maintained by the Electricity Board (ENEL).The total configuration of stations used for relocatingthe sequences is plotted in Figure 4. These last dataare derived from short period vertical sensors linkedto short dynamic range acquisition systems. As a con-sequence the phase and polarity picking procedureswere sometimes quite complicated. Despite of that wewere able to improve the quality of locations due to amore appropriate geometry of the seismic network.
The arrival time data set was analyzed with theHYPO71program (Lee and Valdes, 1985). The res-
Table 2. 1-D velocity model used to loc-ate the events of 1992 and 1994 swarms(Nicolich R., 1981).
Depth (km) P-wave velocity (km/s)
0–4 4.0
4–12 5.5
12–20 6.5
20–30 7.0
half space 8.1
ults of this analysis are shown in Figures 5a–c. Thevelocity model used for locating events results from aseismic refraction profile carried out along theLatina-Pescara(central Italy) alignment (Nicolich, 1981). Wechecked several1-D velocity models and the resultsdo not show relevant increase of quality of hypocen-ter solutions. An estimate of3-D velocity model ispresently under study using P- and S-phases from thepresent configuration of the seismic network of Ab-ruzzo (see Figure 2) which is formed by 16 digitalthree-components stations.
The VP /VS ratio was evaluated from Wadati dia-grams and a value of 1.80 has been estimated for thetwo sequences. Table 1 presents the magnitudes ofthe 1992 and 1994 events and their hypocentral para-meters. Table 2 shows the velocity model used andin Figures 6a–b the residual for P- and S-waves vs.epicentral distances are given for all stations.
A visual examination of records coming from vari-ous digital stations allowed us to recognize similarwaveforms between some of the events for the twosequences as showed in Figure 7. This observation,considering also the good quality of digital wave-forms, enabled a more detailed analysis of the data,presented in the next section.
Relative locations
Relative location techniques using P- and S-phaseshave been widely applied in order to improve thequality of hypocentral locations when dealing withcorrelated waveforms (Frankel, 1982; Poupinet et al.,1985; Augliera et al., 1995). In our data set it isparticulary important to improve the quality of depthestimates: in fact Table 1 shows that for the 1992events withGAP > 180◦ have a depth about 3 kmsystematically shallower. The relative location method

8
Figure 5. (a) Epicentral distribution of the best-located August 1992 and June 1994 events. (b) North-South cross-section. (c) East-Westcross-section. The error bars are those reported from the output ofHYPO71code.
is based on the hypothesis that earthquakes character-ized by highly correlated waveforms are generated inthe same source area and with the same source mech-anism. In this case the event location is expressed interms of the increment of the time-space coordinateswith respect to a so calledmaster eventwhose pos-ition is considered well determined (Console and DiGiovambattista, 1987). The main shock or a well re-corded aftershock are generally considered asmasterevent.
In order to apply the relative location techniques toour data we checked the correlation level between sig-nals evaluating the maximum of the cross-correlationfunction for every pair of them in a time window
starting few hours before the main shocks and lastingseveral days later.
Waveforms were band-pass filtered with a two-poles Butterworth filter in the 1–10 Hz range. Thecorrelation was evaluated by using a 3 second win-dow starting fromP onset for theSan Giulianostation(SANG), located about 7 km from the epicentral areaof 1992 events and about 13 km from the epicentralarea of 1994 events. The choice of this station wasmotivated by the high number of events recorded andfrom the usually goodsignal-to-noiseratio due to thequite low background noise level at the site.
The correlation matrices for 1992 and 1994 events,obtained forSANGstation, are shown in Figures 8a-b.Each figure is a map of similarity and the values of cor-

9
Figure 6. (a) Distribution of P-residualsvs.epicentral distance for the 1992 and 1994 swarms. (b) Same for S-residuals vs. epicentral distancefor the 1992 and 1994 swarms. The error bars are indicative of the weight used in the location procedure (we put± 0.05 s for weight 0,± 0.1 sfor weight 1,± 0.2 s for weight 2,± 0.4 s for weight 3 and± 0.8 s for weight 4).

10
Figure 7. Sketch of similar waveforms relative to some selectedevents of August 1992 (left) and June 1994 (right) sequences atSan Giulianostation (SANG) for vertical components. The signalsare filtered in the 1–6 Hz frequency band. For August 1992 eventsP- and S-waves are plotted while for June 1994 traces, to have thesame time scale, only P-waves are shown. The numbers in top-leftposition refer to event listed in Table 1. The y-axis scales are thesame for each sequence.
relation coefficient indicate a possible link between theevents of the sequence. The not correlated events couldbe considered out of the sequence, while the apparentlack of similarity of the main shock of the 1992 swarmis probably due to the different order of magnitude(about 2) which corresponds to different corner fre-quency and consequently to a lower frequency contentas compared to the remaining aftershocks. This lasthypothesis has been checked by cross-correlating sig-nals in the 1–6 Hz frequency band, corresponding tothe frequency content of the main shocks waveforms.In such a way a significant increase of the correla-tion level between the main shocks and the remainingevents of the sequences has been obtained.
The correlation analysis allowed us to recognize anumber of 26 correlated events for the two sequences;these events were selected for a relative location byusing asmaster eventsthe main shock for the 1992sequence and the foreshock for the 1994 swarm.
The results of the relative location analysis areshown in Figures 9a–c, where a better alignment ofepicentral data can be seen, except for a couple ofevents characterized however by a relatively lowernumber of arrival times. The hypocenter locations ap-pear to be more clustered than the initial locationsreported in Figures 5a–c, but confirm an alignmentoriented NNW-SSE for the 1992 sequence and a trendNE-SW for the 1994 sequence.
Fault plane solutions
Fault plane solutions of the two sequences wereevaluated by using standard first arrival techniques(Brillinger et al., 1980; Reasenberg and Oppenheimer,1985), obtaining quite stable solutions due to the highnumber of polarity data and azimuthal distribution atshort epicentral distance (i.e., within 100 km). Theresults shown in Figures 10a-e and 11a–f suggestmechanisms with predominant normal faulting for the1992 and 1994 events.
The quantity and quality of three-component di-gital waveforms recorded at short epicentral distanceallowed us to apply also S-wave polarization ana-lysis to better constrain the fault plane solutions. Thislast technique is based on a Bayesian approach thatevaluates the joint probability distribution obtained bymultiplying the probability distribution derived fromP-wave polarities and S-wave polarization. This ap-proach (Bernard and Zollo, 1989b; De Natale et al.,1991) has been already applied with success in es-timating fault-plane solutions in several italian regions(De Natale et al., 1995; Basili et al., 1996; Iannacconeet al., 1994). The polarization data were obtained fromparticle motion analysis performed on the horizontalcomponents of first S-wave pulses for stations close tothe epicentral area that presented a quasi-vertical in-cidence angle (De Natale et al., 1991). This techniquehas been applied to derive the fault-plane solutions ofthe 1992 and 1994 main shocks (see Figures 12a–b).A significant change has been obtained for the 1992solution by using the digital seismograms as comparedto that derived from the use of the first arrivals (seeFigure 10a which shows an inverse mechanism withrespect to the Figure 12a showing a normal solution).
The data are not corrected for the presence ofshear-wave anisotropy because the maximum timedelay is of about 0.06 to 0.09 sec between the arrivalsof the two S phases up to distances of 20 degrees in

11
Figure 8. Correlation matrices for the August 1992 (a) and June 1994 sequences (b). Only correlation coefficients≥ 0.5 are shown. Thenumbers in X and Y axis refer to event listed in Table 1. For clearness in the figures the correlation coefficients are multiplied by a factor of 10.

12
Figure 9. (a) Relative locations for the 1992 and 1994 swarms. In this figure it is possible to note the apenninic (1992) and anti-apenninic(1994) alignments of the two sequences. (b) North-South cross-section. (c) East-West cross-section.
the Apenninic direction (Iannaccone and Deschamps,1989).
The solutions of the main event of the 1994 se-quence are similar in spite of the two different methodsused to derive the mechanisms and the result indicatesmain normal faulting (see Figures 11b and 12b). Thesolutions represented in Figure 12b is however in pooraccordance with the S-wave polarizations; this can beexplaned by the higher number of P-polarity readingswhich influence the solution and these readings have asmall signal-to-noiseratio due to the presence of theforeshock.
These solutions are compatible with those of theaftershocks illustrated in Figures 11a–f which are con-sistent to main normal faulting motion, but showsdifferent strike angles. This may reflect a complexfault distribution which is also suggested from the
spatial pattern of the relocated events (see Figure 9a)which seems to follow an anti-apenninic direction.
For the aftershocks characterized by highly cor-related waveforms we evaluated a composite focalmechanism by applying the above described proced-ure. This was performed to check the hypothesis thatcorrelated waveforms are generated by similar sourcemechanisms. In particular we used 10 events (57 P-wave polarities and 36 S-wave polarizations) withaverage correlation coefficient≥ 0.68 for 1992 se-quence and 8 events (80 P-wave polarities and 28S-wave polarizations) with average correlation coef-ficient≥ 0.6 for 1994 sequence. The obtained resultsgive a predominant normal faulting process for both1992 and 1994 swarms.

13
Figure 10. Fault plane solutions, obtained from P-wave polarities for the best recorded five events of 1992 sequence; (a) event n. 3 (main shock– see Table 1) computed with 20 P-phases; strike of 320◦, dip of 75◦ and slip of 60◦; (b) event n. 8 computed with 10 P-phases; strike of 180◦,dip of 35◦ and slip of –80◦; (c) event n. 14 computed with 10 P-phases; strike of 165◦, dip of 45◦ and slip of –80◦; (d) event n. 18 computedwith 8 P-phases; strike of 185◦, dip of 40◦ and slip of –110◦; (e) event n. 22 computed with 16 P-phases; strike of 20◦, dip of 55◦ and slip of–80◦.
Figure 13 shows the main focal mechanisms andthe composite fault-plane solutions of the two se-quences with respect to the final relative locations.
Source parameter analysis
The source parameter analysis of microearthquakesis fundamental to infer information about the ruptureprocess and the energy release. In addition their es-timates are useful for determining scaling laws andevaluate the possible departures from self-similarityin the low magnitude range. The departure from self-similarity law for low magnitude events is a topic stillunder debate and is generally related to the saturationof observed corner frequencies due to the presence offmax in the displacement spectra (Abercrombie, 1995;Anderson and Hough, 1984; Boore and Atkinson,1992).
Source parameters were obtained starting from thehorizontal components of digital signals. The velocitytime-histories were corrected from the instrumental re-sponse and then integrated in order to transform themin ground displacement. Signals were then rotated intoSV-SHcomponents by using the horizontal directionderived from the hypocentral locations. Displacementspectra were then evaluated for theSHcomponent byusing a 4 sec window starting slightly before the S-wave onset. The spectra were smoothed using a 0.5Hz wide triangular filter to reduce rapid fluctuations inspectral amplitudes.
Starting from the smoothed spectra we estimatedsource parameters through a simultaneous inversionbased on the model proposed by Boatwright (1978)and described by the relationship:
logD(f ) =log�0− 0.43πf t
Q− 1
2log
[1+
(ffc
)2γ]
(1)

14
Figure 11. Fault plane solutions, obtained from P-wave polarities for the best recorded six events of 1994 sequence; (a) event n. 1 (foreshock –see Table 1) computed with 24 P-phases; strike of 325◦, dip of 85◦ and slip of –130◦ ; (b) event n. 2 (main shock) computed with 12 P-phases;strike of 345◦, dip of 25◦ and slip of –60◦; (c) event n. 6 computed with 26 P-phases; strike of 70◦, dip of 45◦ and slip of –40◦; (d) event n. 8computed with 21 P-phases; strike of 60◦, dip of 55◦ and slip of –70◦; (e) event n. 12 computed with 12 P-phases; strike of 75◦, dip of 55◦ andslip of –40◦; (f) event n. 13 computed with 14 P-phases; strike of 205◦, dip of 55◦ and slip of –30◦. Due to the presence of foreshock the mainevent of 1994 sequence has only 12 clear P-wave polarities and the solution is not stable.
whereD(f) is the displacement spectrum,�0 is theamplitude level of the low frequency portion of thespectrum,fc is the corner frequency,γ is related to thehigh frequency decay,Q is the average quality factor,andt is the travel time.
The relationship (1) evaluated for several valuesof frequency produces an overdetermined system ofequations with four unknown parameters. This systemcan be solved by linearizing the problem (Capuano etal., 1992) through a first order Taylor series expansionaround a trial set of values for the unknown parametersleading to a matrix system expressed by:
Aδx = δb (2)
whereδx represents the corrections to the trial valuesof parameters andδb is a vector containing the resid-uals. The inversion is performed by using a dampedleast squares approach (Menke, 1984).
A detailed analysis of site response and attenuationof body and coda waves has been recently performedfor the Abruzzo region by De Luca et al. (1998)and in the same region Del Pezzo and Zollo (1984)and Del Pezzo and Scarcella (1986) have previouslyestimatedQ values and their frequency dependence.Consequently in our application we decided do notinvert for theQ values. This last parameter has beenestimated as:
Q = 80f 0.4 (3)
The use of a constrainedQ value previously evalu-ated avoids the numerical instabilities in the inver-sion procedure due to the tradeoff betweenQ andγparameters.
The waveforms used for such analysis werechoosen from stations having a goodsignal-to-noiseratio and this drastically reduced the number of events

15
Figure 12. Fault plane solutions, obtained from P-wave polarities and S-wave polarizations for the 1992 main shock (a) and for the 1994 mainshock (b). Closed and open circles represent compression and dilatation of P-waves; segments are direction of polarization of observed S-waves.In the label the station name and the angle (degree) of S-wave polarization are indicated. For 1992 main shock we have strike of 30◦, dip of55◦ and slip of –65◦; for 1994 main shock we have strike of 0◦, dip of 25◦ and slip of –45◦.
for the analysis. The inversion was performed in the0.7–30 Hz frequency range in order to take properlyinto account the response of sensors and the presenceof antialiasing numerical filters in the data loggers. Allspectrum was corrected for the sensor response (thedamping parameter is 0.67 for all sensors used fromAbruzzo seismic network).
In total we estimated source parameters for 17events of the 1992 sequence and 11 events for the 1994sequence. Seismic moments were evaluated accordingto the relation:
M0 = 4πρ�0V3R
FPϕ(4)
whereV is the shear wave velocity (3.1 km/sec),ρ isthe density (2.6 g/cm3), R is the hypocentral distance,F is the free surface amplification effect for transversemotion (F is taken as 2) andPϕ is the radiation pattern;this last parameter was taken to be 0.64, in agreementwith the value used by Boore and Boatwright (1984)for the averageSH radiation coefficient. Source radiiwere computed according the Brune (1970) model:
rB = 0.372fcV (5)
where fc is the corner frequency. Stress drops wereevaluated by using the following equation:
1σ = 716M0
r3B
(6)
The average source parameters estimates of theiruncertainties are reported in Table 3. Some examplesof SHwaves spectra, with the fit derived from (1) areshown in Figure 14.
Theγ values obtained from the inversions for the1992 and 1994 swarms are in the 1.7–3.9 and 1.5–3.9range respectively (each value ofγ has about less of15% of error); the average values are 2.9± 0.7 for1992 and 2.7± 0.7 for 1994 events.
Discussion
The detailed analysis of two seismic sequences, oc-curred along the central Apennines seismic zone, al-lowed to infer some relevant features of the geometry

16
Figure 13. Epicentral relative locations of the 1992 and 1994 swarms merged with fault-plane solutions of Figure 12 for main shocks, withFigure 11a for 1994 foreshock and with composite fault-plane solutions for the two sequences (1992: strike of 30◦, dip of 50◦ and slip of –65◦;1994: strike of 200◦, dip of 40◦ and slip of –50◦).
of source regions and their kynematic and dynamicfeatures.
Firstly the sequences appear to be spatiallyclustered within two source regions having dimensionsabout 30 km2 and 50 km2 for the 1992 and for the1994 swarms, down to a depth of 15 km which hasbeen found as the bottom of the seismogenic layerin other apenninic regions (Deschamps et al., 1984;Haessler et al., 1988). Moreover their geometries fol-low variable strikes, confirming what already observedin other regions for sequences of small magnitudeearthquakes, which are located between major faultingsegments of the Apenninic fault system (Alessio et al.,1996). Speculations of the geometry of this fault sys-tem, based on earthquake intensity and paleoseismicinformation suggest the presence of two major fault-ing alignments, which are the source regions of largestearthquakes reaching magnitudes up to 7 (Westawayand Smith, 1989; Blumetti, 1995; Michetti et al.,1996).
Concerning the fault-plane solutions quite stablefocal mechanisms have been derived by using jointprobabilistic inversion of polarities of first arrivals andpolarization angles. Two nodal planes fit quite wellthe geometries derived from the aftershocks alignmentwith the exception of the 1994 swarm which may becaused by a series of normal faults displaced along anNE-SW direction.
These solutions confirm the general trend of thefault-plane-solutions of apenninic earthquakes dis-cussed by Gasparini et al. (1985) with predominantnormal faulting motion associated to the largest earth-quakes, with T axes normal to the strike of the moun-tain axes and strike slip component which is relevantfor swarms and in general for sequences of smallmagnitude earthquakes. A complexity arises from theanalysis of the 1994 sequence which is characterizedby an anti-apenninic alignment.
The source parameters of 28 earthquakes of thesesequences have been derived by using an inversion

17
Table 3. Magnitude (Ml ) and average source parameters of the August 1992 and June 1994 seismic sequences in central Apennines (Abruzzoregion) calculated for events recorded at sites listed in the last column (see Figure 2 for geographic view). In the first column the sameprogressive numbers of Table 1 is reported. The last column reports the stations used to estimate source parameters. The errors are espressedas±1σ . (∗) This value is Md.
N◦ Time Event UT Ml M0 1M0 fc 1fc rB 1rB 1σ 1(1σ ) Station Coincidences
(Nm) (Nm) (Hz) (Hz) (m) (m) (bar) (bar)
5 92082502:31 0.8 .13E+12 .43E+11 10.8 2.8 107 28 0.5 0.2 FILE LUCO SANG
6 92082502:45 0.7 .20E+12 .11E+12 11.3 2.1 101 19 0.8 0.1 FILE LUCO SANG
7 92082502:46 0.5 .85E+11 .21E+11 12.7 0.6 88 4 0.6 0.2 FILE LUCO SANG
8 92082502:48 1.5 .21E+13 .87E+12 11.9 2.8 98 26 12.7 11.8 BARI FILE LUCO SANG
9 92082502:49 1.1 .38E+12 .21E+12 8.1 3.1 156 71 0.7 0.8 FILE LUCO SANG
10 92082505:02 1.3 .15E+13 .38E+12 12.4 0.5 90 4 9.3 3.2 BARI FILE LUCO SANG
14 92082508:09 1.2 .12E+13 .41E+12 10.2 0.7 110 8 3.9 1.2 BARI FILE LUCO SANG
17 92082612:14 0.9 .22E+12 .11E+12 10.8 3.5 113 45 0.9 0.8 FILE LUCO SANG
18 92082612:23 1.3 .15E+13 .58E+12 9.3 1.5 123 20 3.7 1.8 BARI CMPF FILE LUCO SANG
19 92082614:53 1.1 .51E+12 .17E+12 12.9 2.0 88 13 3.8 2.7 BARI FILE LUCO SANG
21 92082618:56 1.1 .25E+12 .94E+11 12.2 2.0 94 17 1.5 1.0 BARI FILE LUCO SANG
22 92082623:31 2.3 .56E+13 .23E+13 9.2 0.8 122 11 13.6 5.2 CMPF BARI FILE FONT LUCO SANG
23 92082623:31 1.7 .37E+12 .16E+12 11.3 3.1 105 31 1.8 1.7 FILE LUCO SANG
24 92082703:54 0.6 .14E+12 .56E+11 11.7 2.9 100 30 0.7 0.5 FILE LUCO SANG
27 92082710:06 1.3 .60E+12 .29E+12 5.8 0.9 194 29 0.4 0.3 BARI FILE OCRE SANG
28 92082710:07 1.5 .94E+12 .58E+12 4.4 0.7 259 40 0.3 0.2 BARI FILE OCRE SANG
29 92082712:52 1.5 .27E+12 .13E+12 11.4 2.1 100 17 1.5 1.4 FILE LUCO SANG
1 94060216:41 2.9 .80E+14 .92E+14 5.7 1.8 213 73 52.3 58.5 AIEL BARI CMPF FILE SANG TAGL
3 94060216:45 1.9 .29E+13 .46E+12 6.9 1.6 168 35 3.2 2.1 BARI FILE SANG
4 94060216:59 1.2 .79E+12 .30E+12 8.4 3.3 145 57 1.5 1.1 SANG FILE
5 94060217:00 1.2 .56E+12 10.5 107 2.0 SANG
7 94060217:38 3.2∗ .10E+15 .77E+14 5.1 0.7 220 30 37.6 16.3 AIEL BARI CMPF FILE TAGL
8 94060217:44 2.6 .30E+14 .13E+14 6.1 1.5 189 43 19.7 5.6 AIEL BARI CMPF FILE SANG TAGL
9 94060218:07 1.6 .14E+13 .49E+12 7.3 1.5 157 33 1.6 0.4 FILE SANG
10 94060218:15 0.9 .29E+12 .89E+11 10.5 2.5 110 24 1.4 1.3 FILE SANG
11 94060218:15 2.0 .30E+13 .31E+12 8.7 1.6 131 26 6.5 2.9 BARI FILE SANG
12 94060218:33 1.6 .21E+13 .55E+12 9.0 1.2 126 16 4.6 0.7 BARI FILE SANG
13 94060219:31 1.9 .31E+13 .12E+13 6.4 2.0 187 57 2.4 1.2 BARI FILE SANG
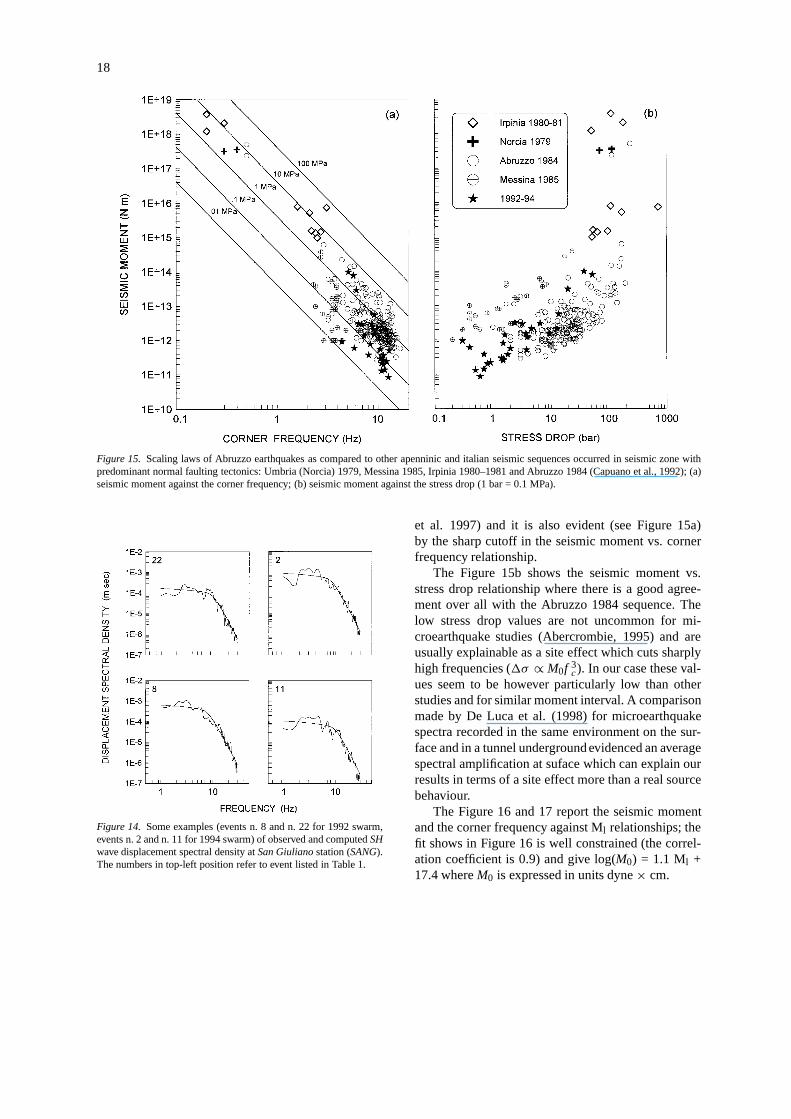
procedure for estimating the spectral parameters. Themain result from study indicates that the local siteresponse does not change significantly between thestations of the network and consequently the estima-tion of source parameters is not strongly influenced bythe site effects (see De Luca et al., 1998). Moreoverthe scaling relation for these source parameters (seis-mic moment vs. stress drop) follows, also for smallevents the main features found for earthquakes in theApennines, such as generally low stress drop values.This result is of great relevance for estimating theseismic risk in the region. Figures 15a–b comparesthe results obtained for the sequences analyzed withother studies performed along the Apennines, by using
similar inversion procedures (Capuano et al., 1992). Alimit however in the present study is that the deviationof similarity can be a consequence offmax which isclose to 15 Hz. As compared to spectra of microearth-quakes observed undergroundby De Luca et al. (1998)an average amplification and spectral distorsion is infact observed for the stations located on the surface,in the frequency band 1–8 Hz. This last observation,should allow to correct spectra for the local site condi-tions to take properly into account local amplificationeffects in the limestones and other outcrops where theregional monitoring seismic station are located. There-fore, this observation is confirmed by a larger quantityof underground data (De Luca et al. 1998; Amoruso
18
Figure 15. Scaling laws of Abruzzo earthquakes as compared to other apenninic and italian seismic sequences occurred in seismic zone withpredominant normal faulting tectonics: Umbria (Norcia) 1979, Messina 1985, Irpinia 1980–1981 and Abruzzo 1984 (Capuano et al., 1992); (a)seismic moment against the corner frequency; (b) seismic moment against the stress drop (1 bar = 0.1 MPa).
Figure 14. Some examples (events n. 8 and n. 22 for 1992 swarm,events n. 2 and n. 11 for 1994 swarm) of observed and computedSHwave displacement spectral density atSan Giulianostation (SANG).The numbers in top-left position refer to event listed in Table 1.
et al. 1997) and it is also evident (see Figure 15a)by the sharp cutoff in the seismic moment vs. cornerfrequency relationship.
The Figure 15b shows the seismic moment vs.stress drop relationship where there is a good agree-ment over all with the Abruzzo 1984 sequence. Thelow stress drop values are not uncommon for mi-croearthquake studies (Abercrombie, 1995) and areusually explainable as a site effect which cuts sharplyhigh frequencies (1σ ∝ M0f 3
c). In our case these val-ues seem to be however particularly low than otherstudies and for similar moment interval. A comparisonmade by De Luca et al. (1998) for microearthquakespectra recorded in the same environment on the sur-face and in a tunnel undergroundevidenced an averagespectral amplification at suface which can explain ourresults in terms of a site effect more than a real sourcebehaviour.
The Figure 16 and 17 report the seismic momentand the corner frequency against Ml relationships; thefit shows in Figure 16 is well constrained (the correl-ation coefficient is 0.9) and give log(M0) = 1.1 Ml +17.4 whereM0 is expressed in units dyne× cm.

19
Figure 16. Seismic moment vs. Ml relationship for the 1992 and 1994 sequences. The error bar values are listed in Table 3.
Figure 17. Corner frequency vs. Ml relationship for the 1992 and1994 sequences. The error bar values are listed in Table 3.
Conclusions
The main results found in this paper consist in a de-tailed description of two sequences of small magnitude
earthquakes occurring along the central segment of theApenninic chain. The geometry of the seismogeneticzone is not yet well defined due to its complexity andto the inadequate coverage of the national network,maintained byING, which is characterized by stationspacing of several tens of km. A relatively dense di-gital three-component short period seismic network,installed since the end of 1991 provides an adequatetool for defining the source geometry and the dynam-ics of microearthquakes in the region. Like most ofmoderate size earthquakes, a detailed study of thesesequences can allow to map stress field and sourcegeometry of events limiting the main asperities of theregion. A similar but less well constrained study car-ried out by Alessio et al., 1996 along another quiescentsegment, in the southern Apennines, shows that thesequence of moderate size events (Ml around 4) seemto be located at the limits of major fault segments.
Acknowledgements
We thank Alberto Cirella for the contribution given inthe maintenance of seismic equipment, Pino De Nata-le for the support in the polarization data analysis,the responsibles ofI.N.G. (Alberto Basili), E.N.E.L.(Raniero Berardi),RE.SI.L. (Martino Siciliano) for

20
making available waveform data from their networks,Luca Crescentini and Antonella Amoruso for the helpto the realization of Figures 10, 11 and 12, and Sal-vatore Barba for the support in the polarity analysis. Afinal thank goes to Annamaria Blumetti and RobertoBagnaia for the exhaustive discussions on the struc-tural and neotectonic settlement of the investigatedarea (see Figure 1).
References
Abercrombie, R.E., 1995, Earthquakes source scaling relationshipsfrom -1 to 5ML using seismograms recorded at 2.5-km depth,J.Geophys. Res.100, 24015–24036.
Alessio, G., Gorini, A., Iannaccone, G. and Vilardo, G., 1996, Lowenergy sequences in areas with high seismic potential: Benevento(southern Apennines), april 1990. In V. Schenk (ed),EarthquakeHazard and Risk. 3–16, Kluwer Academic Publishers.
Amato, A., Azzara, R., Chiarabba, C., Cimini, G.B., Cocco, M.,Di Bona, M., Margheriti, L., Mazza, S., Mele, F., Selvaggi, G.,Basili, A., Boschi, E., Courboulex, F., Deshamps, A., Gaffet,S., Bittarelli, G., Chiaraluce, L., Piccinini, D. and Ripepe, M.,1998, The 1997 Umbria-Marche, Italy, earthquake sequence: afirst look at the main shocks and aftershocks,Geophys. Res. Lett.25, 2861–2864.
Amoruso, A. and Crescentini, L., 1999, Coseismic and aseismicstrain offsets recorded by the Gran Sasso strainmeter,Phys.Chem. Earth24, 101–104.
Amoruso, A., Crescentini, L., De Luca, G., Scarpa, R., Abril,M. and Cirella, A., 1997, Underground earth strain and seis-mic rediation measurements with a laser interferometer and adense small-aperture seismic array,Annali GeofisicaVol. XL (5),995–1005.
Amoruso, A., Crescentini, L. and Scarpa, R., 1998, Inversion ofsource parameters from near- and far-field observations: an ap-plication to the 1915 Fucino earthquake, Central Apennines,Italy, J. Geophys. Res.103(29), 989–999.
Anderson, J.N. and Hough, S.E., 1984, A model for the shape of theFourier amplitude spectrum of acceleration at high frequencies,Bull. Seism. Soc. Am.74, 1969–1993.
Augliera, P., Cattaneo, M. and Eva, C., 1995, Seismic multipletsanalysis and its implication in seismotectonics,Tectonophysics248, 219–234.
Basili, A., Cantore, L., Cocco, M., Frepoli, A., Margheriti, L.,Nostro, C. and Selvaggi, G. 1996, The June 12, 1995 microe-arthquake sequence in the city of Rome,Annali GeofisicaVol.XXXIX (6), 1167–1175.
Bernard, P. and Zollo, A., 1989a, The Irpinia 1980 earthquake: de-tailed analysis of a complex normal faulting,J. Geophys. Res.94, 1631–1648.
Bernard, P. and Zollo, A., 1989b, Inversion of near-source polariza-tion for parameters of double couple point sources,Bull. Seism.Soc. Am.79, 1779–1809.
Blumetti, A.M., 1995, Neotectonic investigations and evidence ofpaleoseismicity in the epicentral area of the January–February1703 central Italy. In L. Serva and B.D. Slemmons (eds), A. E.G. Special Publ. 6Perspectives in paleoseismology, 83–100.
Boatwright, J., 1978, Detailed spectral analysis of two small NewYork state earthquakes,Bull. Seism. Soc. Am.68, 1117–1131.
Bongiovanni, G., Gorelli, V., Gorini, A., Marcucci, S., Marsan, P.and Milana, G., 1995, Valutazione di parametri sismici in alcunearee dell’Appennino Centrale,Rapporto TecnicoSSN/RT/95/5.
Boore, D.M. and Boatwright, J., 1984, Average body-wave radiationcoefficient,Bull. Seism. Soc. Am.74, 1615–1621.
Boore, D.M. and Atkinson, G.M., 1992, Source spectra for the 1988Saguenay, Quebec earthquakes,Bull. Seism. Soc. Am.82, 683–719.
Brillinger, D.R., Udias, A. and Bolt, B., 1980, A probability modelfor regional focal mechanism solutions,Bull. Seism. Soc. Am.70,149–170.
Brune, J.N., 1970, Tectonic stress and the stress spectra of seismicshear waves from earthquakes,J. Geophys. Res.75, 4997–5009.
Capuano, P., Gasparini, P., Peronaci, M. and Scarpa, R., 1992,Strong ground motion and source parameters for earthquakes inthe Apennines, Italy,Earthquake Spectra8, 529–554.
Cocco, M. and Rovelli, A., 1989, Evidence for the variation of stressdrop between normal and thrust faulting earthquakes in Italy,J.Geophys. Res.94, 9399–9416.
Console, R. and Di Giovanbattista, R., 1987, Local earthquakerelative location by digital records,Phys. Earth Plan. Int.47,43–49.
De Luca, G., Del Pezzo, E., Di Luccio, F., Margheriti, L., Milana,G. and Scarpa, R., 1998, Site response study in Abruzzo (centralItaly): underground array versus surface stations,J. Seismol.2,223–236.
Del Pezzo, E. and Zollo, A., 1984, Attenuation of coda waves andturbidity coefficient in central Italy,Bull. Seism. Soc. Am.74,2655–2659.
Del Pezzo, E. and Scarcella, G., 1986, Three-component codaQ inthe Abruzzi-Molise region, central Apennines,Ann. Geophys.4,589–592.
De Natale, G., Pingue, F. and Scarpa, R., 1988, Seismic andground deformation monitoring in the seismogenetic region ofthe Southern Apennines, Italy,Tectonophysics6, 422–434.
De Natale, G., Ferraro, A. and Virieux, J., 1991, A probabilitymethod for earthquake focal mechanism,Geophys. Res. Lett.18,613–616.
De Natale, G., Ferraro, A., Virieux, J. and Zollo, A., 1995, Accur-ate faulting mechanisms of a 1984 earthquake swarm at CampiFlegrei caldera (Italy) during an unrest episode: implications forvolcanological research,J. Geophys. Res.100(24), 167–185.
Deschamps, A., Iannaccone, G. and Scarpa, R., 1984, The Umbrianearthquake (Italy) of 19 September 1979,Ann. Geophys.2, 29–36.
Frankel, A., 1982, Precursor to a magnitude 4.8 earthquake in theVirgin Islands: spatial clustering of small earthquakes, anomal-ous focal mechanisms and earthquake doublets,Bull. Seism. Soc.Am.72, 1277–1294.
Gasparini, C., Iannaccone, G. and Scarpa, R., 1985, Fault-planesolutions and seismicity of the Italian peninsula,Tectonophysics117, 59–78.
Giraudi, C., 1988, Segnalazioni di scarpate di faglia postglacialinel massiccio del Gran Sasso (Abruzzo): implicazioni tettoniche,rapporti tra tettonica recente e morfologia, paleosismicità,Mem.Soc. Geol. It.41, 627–635.
Haessler, H., Gaulon, R., Rivera, L., Console R., Frogneux, M.,Gasparini, C., Martel, L., Patau, G., Siciliano, M. and Cisternas,A., 1988, The Perugia (Italy) earthquake of 29, April, 1984: amicroearthquake survey,Bull. Seism. Soc. Am.78, 1948–1964.
Iannaccone, G. and Deschamps, A., 1989, Evidence of shear-waveanisotropy in the upper crust of Central Italy,Bull. Seism. Soc.Am.79, 1905–1912.
21
Iannaccone, G., Zollo, A., De Matteis, R. and Deschamps, A.,1994, Rupture characterization of a low magnitude earthquake ofCentral Apennines (Italy),Phys. Earth Plan. Int.82, 157–165.
Lee, W.H.K. and Valdes, C.M., 1985,HYPO71PC: a personal com-puter version of the HYPO71 earthquake location program,U. S.Geol. Survey Open File Rep., 85–749.
Martini, M. and Scarpa, R., 1983, Earthquakes in Italy in the lastcentury. Proc. Int. School of PhysicsEnrico Fermi, LXXXVCourse onEarthquakes: Observation, theory and interpretation.North-Holland, Amsterdam, 519–527.
Mattone, M., Bonci, L., Capone, G., Blumetti, A.M. and Marsan,P., 1996, Attività geodetiche nell’Abruzzo centrale,RapportoTecnicoSSN/RT/96/13.
Menke, 1984, Geophysical data analysis: discrete inverse theory.Academic Press, Inc., New York.
Michetti, A., Brunamonte, F., Serva, L. and Vittori, E., 1996, Trenchinvestigations of te Fucino earthquake fault scarps (Abruzzo,central Italy): Geological evidence of large historical events,J.Geophys. Res.101, 5921–5936.
Nicolich, R., 1981, Il profilo Latina-Pescara e le registrazioni me-diante OBS nel Mar Tirreno,Atti del 1◦ Convegno AnnualeG.N.G.T.S. (CNR)II , 621–637.
Pantosti, D. and Valensise, G., 1990, Faulting mechanism andcomplexity of the 23 November, 1980, Campania-Lucania earth-quake inferred from surface observations,J. Geophys. Res.95,15319–15341.
Pantosti, D. and Valensise, G., 1993, Source geometry and longterm behaviour of the 1980, Irpinia earthquake, based on fieldgeologic observations,Annali Geofisica, Vol. XXXVI (1), 41–49.
Poupinet, G., Frechet, J., Ellsworth, W.L., Fremont, M.J. andGlageaud, F., 1985, Doublet analysis: improved accuracy forearthquake prediction studies,Earth. Predict. Res.3, 147–159.
Reasenberg, P. and Oppenheimer, D., 1985,FPFIT, FPPLOTandFPPAGE: Fortran computer programs for calculating and dis-playing earthquake fault plane solutions,U. S. Geol. Survey OpenFile Rep., 85–739.
Scarpa, R. and Zollo, A., 1985, Seismotectonics and seismic qui-escence in southern Apennines, Italy,Earthq. Predict. Res.1,81–93.
Scarpa, R., Cirella, A. and De Luca, G., 1996, Borehole and un-derground geophysical experiments in central Apennines, Italy.Proc. Workshop on Monitoring and research for mitigating seis-mic and volcanic risk, Rejkjavik, EUR 16696 EN, Brussels,87–98.
Serva, L., Blumetti, A.M. and Michetti, A.M., 1988, Gli effetti sulterreno del terremoto del Fucino (13.01.1915), tentativo di inter-pretazione della evoluzione tettonica recente di alcune strutture,Mem. Soc. Geol. It.35, 893–907.
Ward, S.N. and Valensise, G., 1989, Fault parameters and slip dis-tribution of the 1915, Avezzano, Italy earthquake derived fromgeodetic observations,Bull. Seism. Soc. Am.79, 690–710.
Westaway, R., 1992, Revised hypocentre and fault rupture geometryfor the 1980 November 23 Campania-Basilicata earthquake insouthern Italy,Geophys. J. Int.109, 376–390.
Westaway, R. and Smith, R.B., 1989, Strong ground motion innormal-faulting earthquakes,Geophys. J.96, 529–559.
Westaway, R., Gawthorpe, M. and Tozzi, M., 1989, Seismologicalobservations of 1984 Lazio-Abruzzo earthquakes: implicationsfor the active tectonics of Italy,Geophys. J.98, 489–514.