A Decision Support Tool for Buying Farm Tractors, Based on ...
26
Citation: Ruiz-Garcia, L.; Sanchez-Guerrero, P. A Decision Support Tool for Buying Farm Tractors, Based on Predictive Analytics. Agriculture 2022, 12, 331. https://doi.org/10.3390/ agriculture12030331 Academic Editor: Giuseppe Timpanaro Received: 13 February 2022 Accepted: 18 February 2022 Published: 25 February 2022 Publisher’s Note: MDPI stays neutral with regard to jurisdictional claims in published maps and institutional affil- iations. Copyright: © 2022 by the authors. Licensee MDPI, Basel, Switzerland. This article is an open access article distributed under the terms and conditions of the Creative Commons Attribution (CC BY) license (https:// creativecommons.org/licenses/by/ 4.0/). agriculture Article A Decision Support Tool for Buying Farm Tractors, Based on Predictive Analytics Luis Ruiz-Garcia * and Patricia Sanchez-Guerrero Departamento de Ingeniería Agroforestal, ETSIAAB, Universidad Politécnica de Madrid, Av. Puerta de Hierro, 2, 28040 Madrid, Spain; [email protected] * Correspondence: [email protected]; Tel.: +34-910-67-09-83 Abstract: Data science can help farmers when making a decision about tractor purchase. Buying a tractor represents a big investment for farmers, and price is one of their main concerns. This study presents the development of a web-based decision support tool (DST) that calculate the price of new and second-hand tractors, for the purpose of providing the decision-maker some information that will lead him to the final decision. The tool makes use of different algorithms based on predictive analytics methodologies. The dataset has information about 227 different observations of new tractors and 1003 of second-hand tractors, from different European countries. During the study, the prices of new and used tractor were modeled, testing parametric and non-parametric regression models with different segmentations and predictor variables. Non parametric models includes regression trees, support vector machines, ensembles of regression trees, Gaussian process, and neural networks. In both cases, for predicting the prices of new and second-hand tractors, adjusted R 2 higher than 0.99 were achieved. The models developed were implemented in the DST which is fully operative, available in Internet, and free to use. Keywords: farm tractors; data science; data economy; decision support tool 1. Introduction Tractors are the most important equipment for most of the farmers. Tractors are essential for farming as they provide machine power for performing farm applications. Tractors are capable of performing the most important operations in farming, like plowing, planting, cultivating, fertilizing, and harvesting crops [1,2]. The top ten countries in tractor sales in Europe are: France, Germany, Italy, United Kingdom, Spain, Poland, Portugal, Austria, Belgium, Sweden (see Table 1)[3]. For example, in the case of Spain, the total investment in new machinery purchased by farmers in Spain in 2020 exceeds 1331 million euros, being tractors the most sold machines [4]. Table 1. Sales volumes of new tractors over the last three years. Top ten countries in Europe [3]. Country 2018 2019 2020 France 33,534 39,998 37,238 Germany 27,670 28,979 32,052 Italy 18,443 18,579 17,944 United Kingdom 12,013 12,040 10,380 Spain 11,266 12,029 10,044 Poland 9064 8714 9937 Portugal 5788 6497 6470 Austria 3950 4379 4632 Belgium 2985 2948 2849 Sweden 3006 2827 2776 Agriculture 2022, 12, 331. https://doi.org/10.3390/agriculture12030331 https://www.mdpi.com/journal/agriculture
-
Upload
khangminh22 -
Category
Documents
-
view
1 -
download
0
Transcript of A Decision Support Tool for Buying Farm Tractors, Based on ...

�����������������
Citation: Ruiz-Garcia, L.;
Sanchez-Guerrero, P. A Decision
Support Tool for Buying Farm
Tractors, Based on Predictive
Analytics. Agriculture 2022, 12, 331.
https://doi.org/10.3390/
agriculture12030331
Academic Editor: Giuseppe
Timpanaro
Received: 13 February 2022
Accepted: 18 February 2022
Published: 25 February 2022
Publisher’s Note: MDPI stays neutral
with regard to jurisdictional claims in
published maps and institutional affil-
iations.
Copyright: © 2022 by the authors.
Licensee MDPI, Basel, Switzerland.
This article is an open access article
distributed under the terms and
conditions of the Creative Commons
Attribution (CC BY) license (https://
creativecommons.org/licenses/by/
4.0/).
agriculture
Article
A Decision Support Tool for Buying Farm Tractors, Based onPredictive AnalyticsLuis Ruiz-Garcia * and Patricia Sanchez-Guerrero
Departamento de Ingeniería Agroforestal, ETSIAAB, Universidad Politécnica de Madrid, Av. Puerta de Hierro, 2,28040 Madrid, Spain; [email protected]* Correspondence: [email protected]; Tel.: +34-910-67-09-83
Abstract: Data science can help farmers when making a decision about tractor purchase. Buying atractor represents a big investment for farmers, and price is one of their main concerns. This studypresents the development of a web-based decision support tool (DST) that calculate the price of newand second-hand tractors, for the purpose of providing the decision-maker some information thatwill lead him to the final decision. The tool makes use of different algorithms based on predictiveanalytics methodologies. The dataset has information about 227 different observations of new tractorsand 1003 of second-hand tractors, from different European countries. During the study, the pricesof new and used tractor were modeled, testing parametric and non-parametric regression modelswith different segmentations and predictor variables. Non parametric models includes regressiontrees, support vector machines, ensembles of regression trees, Gaussian process, and neural networks.In both cases, for predicting the prices of new and second-hand tractors, adjusted R2 higher than0.99 were achieved. The models developed were implemented in the DST which is fully operative,available in Internet, and free to use.
Keywords: farm tractors; data science; data economy; decision support tool
1. Introduction
Tractors are the most important equipment for most of the farmers. Tractors areessential for farming as they provide machine power for performing farm applications.Tractors are capable of performing the most important operations in farming, like plowing,planting, cultivating, fertilizing, and harvesting crops [1,2].
The top ten countries in tractor sales in Europe are: France, Germany, Italy, UnitedKingdom, Spain, Poland, Portugal, Austria, Belgium, Sweden (see Table 1) [3]. For example,in the case of Spain, the total investment in new machinery purchased by farmers in Spainin 2020 exceeds 1331 million euros, being tractors the most sold machines [4].
Table 1. Sales volumes of new tractors over the last three years. Top ten countries in Europe [3].
Country 2018 2019 2020
France 33,534 39,998 37,238Germany 27,670 28,979 32,052
Italy 18,443 18,579 17,944United Kingdom 12,013 12,040 10,380
Spain 11,266 12,029 10,044Poland 9064 8714 9937
Portugal 5788 6497 6470Austria 3950 4379 4632Belgium 2985 2948 2849Sweden 3006 2827 2776
Agriculture 2022, 12, 331. https://doi.org/10.3390/agriculture12030331 https://www.mdpi.com/journal/agriculture

Agriculture 2022, 12, 331 2 of 26
Buying a tractor represents a big investment for farmers. The most important factorfor a farmer when buying a tractor is the brand, followed by power, price, and features (seeFigure 1) [5].
Agriculture 2022, 11, x FOR PEER REVIEW 2 of 27
Table 1. Sales volumes of new tractors over the last three years. Top ten countries in Europe [3].
Country 2018 2019 2020 France 33,534 39,998 37,238
Germany 27,670 28,979 32,052 Italy 18,443 18,579 17,944
United Kingdom 12,013 12,040 10,380 Spain 11,266 12,029 10,044
Poland 9064 8714 9937 Portugal 5788 6497 6470 Austria 3950 4379 4632 Belgium 2985 2948 2849 Sweden 3006 2827 2776
Figure 1. Most important factors for farmers when buying a tractor [5].
1.1. Data Science Data Science is an interdisciplinary field that involves scientific methods, processes,
and systems to extract knowledge or a better understanding of data in its different forms, whether structured or unstructured. It includes some data analytics fields such as statis-tics, data mining, machine learning, and predictive analytics [6,7].
The use of data science methods and tools creates new opportunities for organiza-tions to use data to produce new market-changing products and better public services in the data economy [6,7].
1.2. Data Economy Data Economy can be defined as the set of initiatives, activities, and/or projects whose
business model is based on the exploration and exploitation of existing database struc-tures (traditional and from new sources) to identify opportunities for the generation of products and services.
Data are new resource considered by many as “the new oil” [8], which reflect its rel-evance and increasing dependence on this resource. They have also been defined as an infrastructure resource [9], as they can be used by an unlimited number of agents for an
0.0% 5.0% 10.0% 15.0% 20.0% 25.0% 30.0% 35.0% 40.0% 45.0% 50.0%
Brand
Price
Power
Features
46.7%
19.6%
22.4%
11.2%
¿What is the most important for a farmer when buying a tractor ?
Figure 1. Most important factors for farmers when buying a tractor [5].
However, in the case of purchasing a new tractor, most tractor brands do not publishprices. The farmer must go to the store to get a price estimate.
In the case of second-hand tractors, there is a very wide and varied offer. There arethousands of tractors on offer with different characteristics, operating hours, and age (yearof manufacture). Thus, it is a difficult challenge for the farmer to summarize and analyzeall this information.
This paper attempts to solve these problems by developing a web-based DST thatcalculates the price of new and second-hand tractors.
Data science can help farmers when making a decision about tractor purchase. Predic-tive analytics can be used for estimating the price of the tractors, new and used ones. Thiscan be used for a public or private farm consulting service.
1.1. Data Science
Data Science is an interdisciplinary field that involves scientific methods, processes,and systems to extract knowledge or a better understanding of data in its different forms,whether structured or unstructured. It includes some data analytics fields such as statistics,data mining, machine learning, and predictive analytics [6,7].
The use of data science methods and tools creates new opportunities for organizationsto use data to produce new market-changing products and better public services in thedata economy [6,7].
1.2. Data Economy
Data Economy can be defined as the set of initiatives, activities, and/or projects whosebusiness model is based on the exploration and exploitation of existing database structures(traditional and from new sources) to identify opportunities for the generation of productsand services.
Data are new resource considered by many as “the new oil” [8], which reflect itsrelevance and increasing dependence on this resource. They have also been defined as
Agriculture 2022, 12, 331 3 of 26
an infrastructure resource [9], as they can be used by an unlimited number of agents foran infinite number of applications to produce goods and services, considered the basicequipment and structure necessary for a country, a region, or an organization to functionproperly [10].
However, a piece of data by itself does not provide value. To obtain information fromthe data and, therefore, utility from them, it is necessary to process them.
1.3. Decision Support Tools
According to Shim et al., 2002, a DST is a computational system with the purposeof helping decision-makers by analyzing information and identifying solutions. Theirgoal is to link strictly computational attributes of a management information system tothe judgement ability of the decision-maker [11]. Based on that, decision support toolscontribute to:
(i) The analysis of the decision environment by identifying actors, risks, constraints,consequences, etc.; and
(ii) The structure of the decision-making procedure by setting goals and developing waysto achieve them.
A DST consists of three fundamental characteristics: a database that can store andmanage internal and external information, algorithms necessary for the analysis, and aninterface for communication with the user [12].
Stakeholders and farmers may encounter difficulties in making proper decisions aboutagricultural management in topics where there is a huge amount of information available(e.g., environmental, crop-related, and economic data) [13]. It is challenging for themto transfer these data into practical knowledge. Thus, DST can assist them in makingevidence-based and precise decisions.
DST have been developed in agriculture for disease prevention [14,15], optimizingcrop rotation [16], assessing the climate regulation potential of agricultural soils [17],visualizing E. coli risk on agricultural land [18], field-specific nutrient management [19],and many other applications [20]. There are studies about the development of decisionsupport tools in other fields like medicine [21–24], supply chain management [25], cementindustry [26], sewage sludge treatment [27], marine spatial planning [28], or ecosystemservices quantification and valuation [29].
Rose et al., 2016, found the following eight core factors that influence the uptake anduse of DST by farmers: performance expectancy, easy to use, peer recommendation, trust,cost, habit, relevance to user and farmer-adviser compatibility [20].
1.4. Tractor Cost Studies
Regarding tractor cost and prices, there are studies about tractor repair and main-tenance costs [30–32], depreciation patterns for farm tractors [33–37] and farm tractorreplacement modelling [38,39].
Al-Suhaibani and Wahby 2017 studied the work order for 40 tractors, investigatingthe relationship between tractor age and power on repair and maintenance costs, findingthat repair cost ratio and maintenance cost ratio were directly related to tractor workinglife (age) and tractor power [30]. Asfarnia et al., 2014 studied the effect of failure rate onrepair and maintenance costs of just four agricultural tractor models [31]. Lorencowicz andUziak, 2015 studied the repair cost of tractors and agricultural machines in family farms inPoland. They found that specific circumstances of Polish agriculture, with small sizes ofthe farms and old tractors and agricultural machines, highly affect the repair costs [32].
Dumler et al., 2003 compared six depreciations methods to simulate the value of farmtractors in USA. The methods compared were those of the American Society of Agriculturaland Biological Engineers (ASABE), Cross and Perry [36,40], North American EquipmentDealers Association (NAEDA), the Kansas Management, Analysis and Research (KMAR)plus two US income tax methods. They found that no method is consistently the mostaccurate, and thus farm managers must devote significant time and thought to choosing a

Agriculture 2022, 12, 331 4 of 26
depreciation method for their farm business [33]. This study is outdated because some ofthe models applied have changed.
Fenollosa and Guadalajara Olmeda, 2007 and 2010, used a dataset of new and second-hand tractor characteristics and prices with data from Spain and Italy. They studied theremaining value for financial and tax planning purposes [34,41].
Hansen and Lee, 1991 analyzed second-hand farm tractor prices to estimate farmtractor depreciation, for tax implications in Canada and USA. Their results indicated thatdepreciation of farm tractors would be approximated by an 8.3% annual rate [35].
Wilson, 2010, used 1223 observations of second-hand tractor prices in the UK, for esti-mating tractor depreciation with linear regression models. The preferred model explained87% of the variation in total depreciation [37].
Gaworski and Józwiak, 2012, studied the financial advantages of purchasing newtractors in comparison with extending the life of old ones. The investigation was done in afamily farm in Poland [38].
Poozesh et al., 2012 determined the economically optimum life of a single model oftractor in a certain location of Iran. Listed price of tractor, annual depreciation, and internalrate of return and repair and maintenance cost were used to determine their economiclife [39].
Thus, there are studies on the cost of new and used tractors, that analyze their variables,regarding depreciation, for valuation of machinery on market value balance sheets andtax implications. None of them was applied to the development of DSTs. All of them useonly parametric modeling with datasets from only one or two countries and very limitednumber of brands.
The main objective in the present study was to develop a DST for the decision-makingprocedure of buying farm tractors, for predicting tractor prices. The study includes the useof parametric and non-parametric models.
2. Materials and Methods
In this study there is a combination of open data from the public sector (Ministryof Agriculture, Fisheries and Food of Spain–MAPA), data from corporative websites oftractor brands, and data from classified ads websites (Agriaffaires, Tractorhouse, Mascus,Truck1.eu and E-farm.com).
The dataset includes observations from Spain, Portugal, Germany, France, Italy, Bel-gium, Poland, and United Kingdom.
Regarding the new tractors, we searched data about 27 different brands, including themost important brands in the European market (see Table 2) [3]. They were the following:John Deere, Case IH, New Holland, Steyr, Massey Ferguson, Same, Lamborghini, Deutz-fahr, Valtra, Landini, Claas, Kubota, Antonio Carraro, Pasquali, Mc Cormick, Valpadana,Ferrari, Goldoni, Arbos, Kioti, Iseki, BCS, Agria, Zetor, Belarus, Yanmar, Ursus.
We searched information on 27 brands, but we got data from 15 of these brands. Thisis because for some of the brands there was no open information on the price of newtractors. We got observations about 227 models of new tractors. For each model, the dataincludes brand, power, and price. The data about brand, model, category, and power werecross-checked with the official ministry database.
In the case of second-hand tractors, data were collected for all the brands listed intractor advertisements on the consulted websites. To avoid errors in the informationcollected on these sites, the data about brand, model, category, and power were alsocross-checked with the official database from the Ministry.
We obtained data on 1003 observations of second-hand/used tractors. Each obser-vation includes brand, model, category, power, operating hours, and/or age (year ofmanufacture) of each tractor. Sometimes, the number of operating hours or the age wasmissed. The data about brand, model, category, and power were also cross-checked, withthe official ministry database.
Agriculture 2022, 12, 331 5 of 26
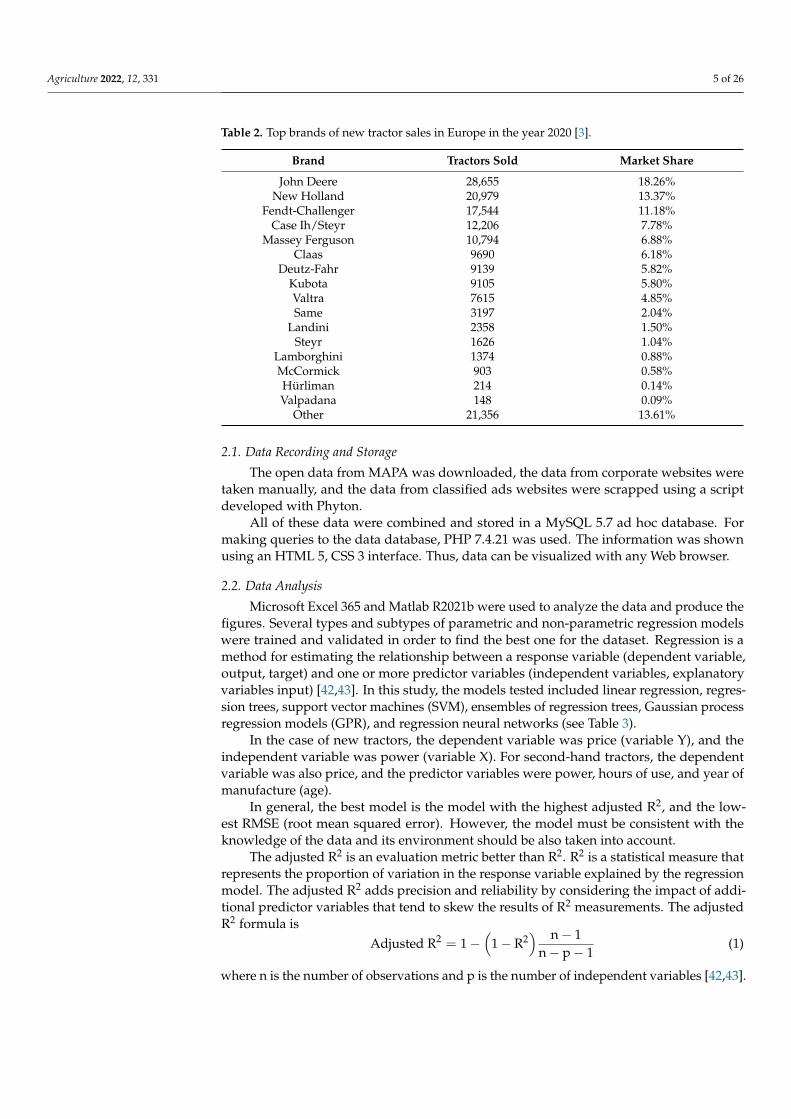
Table 2. Top brands of new tractor sales in Europe in the year 2020 [3].
Brand Tractors Sold Market Share
John Deere 28,655 18.26%New Holland 20,979 13.37%
Fendt-Challenger 17,544 11.18%Case Ih/Steyr 12,206 7.78%
Massey Ferguson 10,794 6.88%Claas 9690 6.18%
Deutz-Fahr 9139 5.82%Kubota 9105 5.80%Valtra 7615 4.85%Same 3197 2.04%
Landini 2358 1.50%Steyr 1626 1.04%
Lamborghini 1374 0.88%McCormick 903 0.58%Hürliman 214 0.14%Valpadana 148 0.09%
Other 21,356 13.61%
2.1. Data Recording and Storage
The open data from MAPA was downloaded, the data from corporate websites weretaken manually, and the data from classified ads websites were scrapped using a scriptdeveloped with Phyton.
All of these data were combined and stored in a MySQL 5.7 ad hoc database. Formaking queries to the data database, PHP 7.4.21 was used. The information was shownusing an HTML 5, CSS 3 interface. Thus, data can be visualized with any Web browser.
2.2. Data Analysis
Microsoft Excel 365 and Matlab R2021b were used to analyze the data and produce thefigures. Several types and subtypes of parametric and non-parametric regression modelswere trained and validated in order to find the best one for the dataset. Regression is amethod for estimating the relationship between a response variable (dependent variable,output, target) and one or more predictor variables (independent variables, explanatoryvariables input) [42,43]. In this study, the models tested included linear regression, regres-sion trees, support vector machines (SVM), ensembles of regression trees, Gaussian processregression models (GPR), and regression neural networks (see Table 3).
In the case of new tractors, the dependent variable was price (variable Y), and theindependent variable was power (variable X). For second-hand tractors, the dependentvariable was also price, and the predictor variables were power, hours of use, and year ofmanufacture (age).
In general, the best model is the model with the highest adjusted R2, and the low-est RMSE (root mean squared error). However, the model must be consistent with theknowledge of the data and its environment should be also taken into account.
The adjusted R2 is an evaluation metric better than R2. R2 is a statistical measure thatrepresents the proportion of variation in the response variable explained by the regressionmodel. The adjusted R2 adds precision and reliability by considering the impact of addi-tional predictor variables that tend to skew the results of R2 measurements. The adjustedR2 formula is
Adjusted R2 = 1−(
1− R2) n− 1
n− p− 1(1)
where n is the number of observations and p is the number of independent variables [42,43].
Agriculture 2022, 12, 331 6 of 26
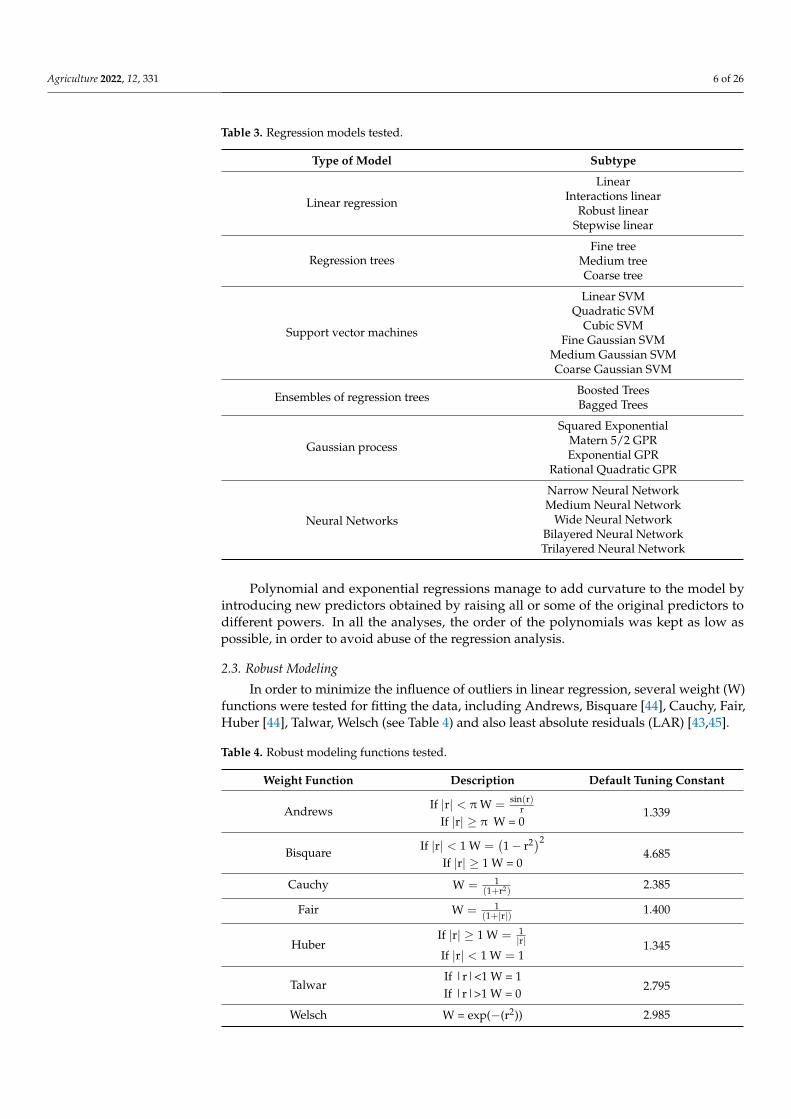
Table 3. Regression models tested.
Type of Model Subtype
Linear regression
LinearInteractions linear
Robust linearStepwise linear
Regression treesFine tree
Medium treeCoarse tree
Support vector machines
Linear SVMQuadratic SVM
Cubic SVMFine Gaussian SVM
Medium Gaussian SVMCoarse Gaussian SVM
Ensembles of regression trees Boosted TreesBagged Trees
Gaussian process
Squared ExponentialMatern 5/2 GPRExponential GPR
Rational Quadratic GPR
Neural Networks
Narrow Neural NetworkMedium Neural Network
Wide Neural NetworkBilayered Neural NetworkTrilayered Neural Network
Polynomial and exponential regressions manage to add curvature to the model byintroducing new predictors obtained by raising all or some of the original predictors todifferent powers. In all the analyses, the order of the polynomials was kept as low aspossible, in order to avoid abuse of the regression analysis.
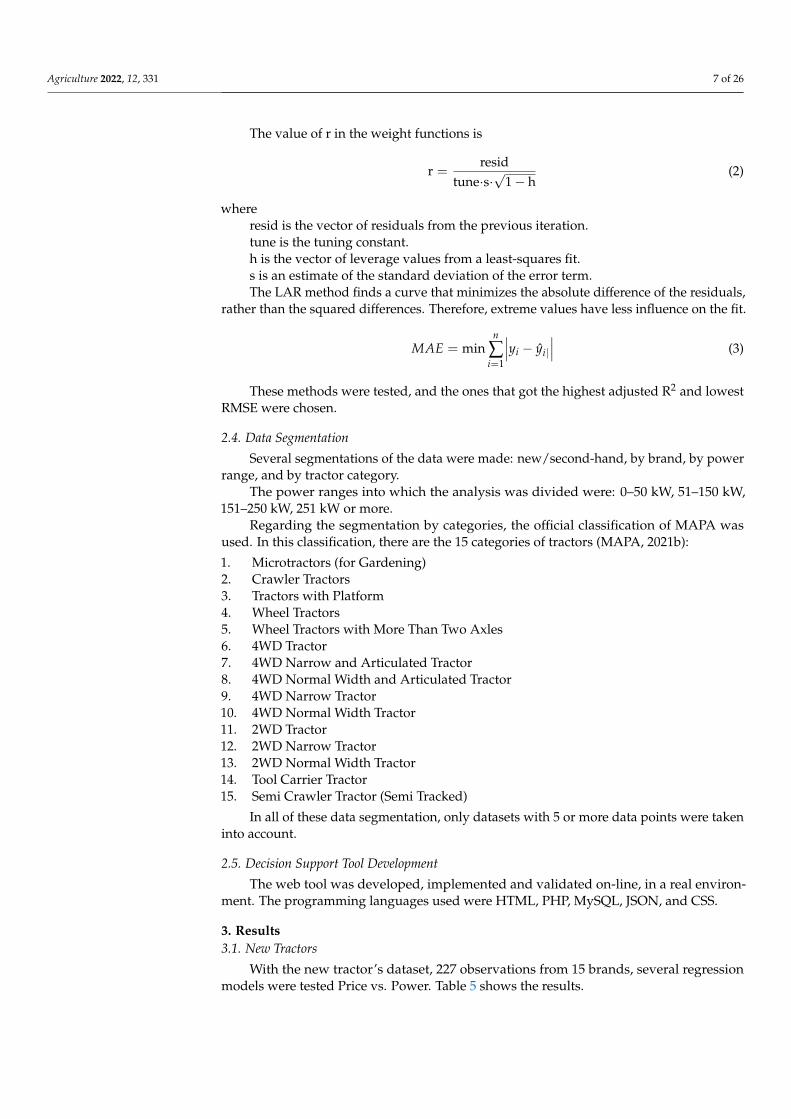
2.3. Robust Modeling
In order to minimize the influence of outliers in linear regression, several weight (W)functions were tested for fitting the data, including Andrews, Bisquare [44], Cauchy, Fair,Huber [44], Talwar, Welsch (see Table 4) and also least absolute residuals (LAR) [43,45].
Table 4. Robust modeling functions tested.
Weight Function Description Default Tuning Constant
Andrews If |r| < π W =sin(r)
rIf |r| ≥ π W = 0
1.339
Bisquare If |r| < 1 W =(1− r2)2
If |r| ≥ 1 W = 04.685
Cauchy W = 1(1+r2)
2.385
Fair W = 1(1+|r|) 1.400
HuberIf |r| ≥ 1 W = 1
|r|If |r| < 1 W = 1
1.345
TalwarIf |r|<1 W = 1If |r|>1 W = 0
2.795
Welsch W = exp(−(r2)) 2.985
Agriculture 2022, 12, 331 7 of 26
The value of r in the weight functions is
r =resid
tune·s·√
1− h(2)
whereresid is the vector of residuals from the previous iteration.tune is the tuning constant.h is the vector of leverage values from a least-squares fit.s is an estimate of the standard deviation of the error term.The LAR method finds a curve that minimizes the absolute difference of the residuals,
rather than the squared differences. Therefore, extreme values have less influence on the fit.
MAE = minn
∑i=1
∣∣∣yi − yi|
∣∣∣ (3)
These methods were tested, and the ones that got the highest adjusted R2 and lowestRMSE were chosen.
2.4. Data Segmentation
Several segmentations of the data were made: new/second-hand, by brand, by powerrange, and by tractor category.
The power ranges into which the analysis was divided were: 0–50 kW, 51–150 kW,151–250 kW, 251 kW or more.
Regarding the segmentation by categories, the official classification of MAPA wasused. In this classification, there are the 15 categories of tractors (MAPA, 2021b):
1. Microtractors (for Gardening)2. Crawler Tractors3. Tractors with Platform4. Wheel Tractors5. Wheel Tractors with More Than Two Axles6. 4WD Tractor7. 4WD Narrow and Articulated Tractor8. 4WD Normal Width and Articulated Tractor9. 4WD Narrow Tractor10. 4WD Normal Width Tractor11. 2WD Tractor12. 2WD Narrow Tractor13. 2WD Normal Width Tractor14. Tool Carrier Tractor15. Semi Crawler Tractor (Semi Tracked)
In all of these data segmentation, only datasets with 5 or more data points were takeninto account.
2.5. Decision Support Tool Development
The web tool was developed, implemented and validated on-line, in a real environ-ment. The programming languages used were HTML, PHP, MySQL, JSON, and CSS.
3. Results3.1. New Tractors
With the new tractor’s dataset, 227 observations from 15 brands, several regressionmodels were tested Price vs. Power. Table 5 shows the results.

Agriculture 2022, 12, 331 8 of 26
Table 5. Results from regression models testing with the whole new tractors dataset.
Type of Model Subtype Adjusted R2
Linear regression
Linear 0.8872Interactions linear 0.8996
Robust linear 0.9981Stepwise linear 0.8946
Regression treesFine tree 0.8895
Medium tree 0.8493Coarse tree 0.7087
Support vector machines
Linear SVM 0.8996Quadratic SVM 0.8895
Cubic SVM 0.8841Fine Gaussian SVM 0.8795
Medium Gaussian SVM 0.9096Coarse Gaussian SVM 0.8996
Ensembles of regression trees Boosted Trees 0.8895Bagged Trees 0.8906
Gaussian process
Squared Exponential 0.9026Matern 5/2 GPR 0.9076Exponential GPR 0.8996
Rational Quadratic GPR 0.9086
Neural Networks
Narrow Neural Network 0.9072Medium Neural Network 0.9091
Wide Neural Network 0.8966Bilayered Neural Network 0.9082Trilayered Neural Network 0.9096
Best results were found with robust linear regression (see Table 5 and Figure 2). Thebest fit was in a polynomial model of degree 1 using LAR robust adjustment. With thismodel, the adjusted R2 was 0.9981 (see Figure 2). Thus, it is possible to predict the price ofa new tractor, knowing its power, regardless of its brand (see Figure 3).
For the new tractor dataset, more sophisticated regression models like regressiontrees, SVM, ensembles of regression trees, Gaussian process, and Neural Networks, do notprovide better results than robust linear regression (see Table 5).
3.1.1. Segmentation by Brand
Of the 24 brands for which data were available, 8 of them had more than 5 data andregressions were performed (see Figures 4–11 and Table 6).
The adjusted value of R2 reflects the precision of the calculation of the predictedvariable (price). Therefore, the better the equation, the closer its value is to 1. Almost all thebrands have adjusted R2 over 0.94, with the exception of Iseki, whose R2 is 0.8524 and theadditional segmentation done in Claas.
3.1.2. Segmentation by Power
In new tractors, when segmenting by power range, the results were worse than thosewith the whole dataset and the segmentation by brand (see Figures 12–15 and Table 7).With this segmentation by power, all adjusted R2 were under 0.8.

Agriculture 2022, 12, 331 9 of 26
Agriculture 2022, 11, x FOR PEER REVIEW 9 of 27
Best results were found with robust linear regression (see Table 5 and Figure 2). The best fit was in a polynomial model of degree 1 using LAR robust adjustment. With this model, the adjusted R2 was 0.9981 (see Figure 2). Thus, it is possible to predict the price of a new tractor, knowing its power, regardless of its brand (see Figure 3).
For the new tractor dataset, more sophisticated regression models like regression trees, SVM, ensembles of regression trees, Gaussian process, and Neural Networks, do not provide better results than robust linear regression (see Table 5).
Figure 2. Linear regression using the whole new tractor dataset. Figure 2. Linear regression using the whole new tractor dataset.
Agriculture 2022, 11, x FOR PEER REVIEW 10 of 27
Figure 3. Price vs. power for new tractors.
3.1.1. Segmentation by Brand Of the 24 brands for which data were available, 8 of them had more than 5 data and
regressions were performed (see Figures 4–11 and Table 6).
Figure 4. Price vs. power for Case IH new tractors.
0
50000
100000
150000
200000
250000
300000
350000
400000
450000
500000
0 100 200 300 400 500
Price
(€)
Power (kW)
New tractor prices colored by brand
Antonio Carraro
Arbos
Case Ih
Claas
Deutz-fahr
Fendt
Ferrari
Iseki
John Deere
Kioti
Landini
Massey Ferguson
Mc Cormick
New Holland
Valpadana
Figure 3. Price vs. power for new tractors.

Agriculture 2022, 12, 331 10 of 26
Agriculture 2022, 11, x FOR PEER REVIEW 10 of 27
Figure 3. Price vs. power for new tractors.
3.1.1. Segmentation by Brand Of the 24 brands for which data were available, 8 of them had more than 5 data and
regressions were performed (see Figures 4–11 and Table 6).
Figure 4. Price vs. power for Case IH new tractors.
0
50000
100000
150000
200000
250000
300000
350000
400000
450000
500000
0 100 200 300 400 500
Price
(€)
Power (kW)
New tractor prices colored by brand
Antonio Carraro
Arbos
Case Ih
Claas
Deutz-fahr
Fendt
Ferrari
Iseki
John Deere
Kioti
Landini
Massey Ferguson
Mc Cormick
New Holland
Valpadana
Figure 4. Price vs. power for Case IH new tractors.
Agriculture 2022, 11, x FOR PEER REVIEW 11 of 27
Figure 5. Price vs. power for Claas new tractors.
Figure 6. Price vs. power for Fendt new tractors.
Figure 7. Price vs. power for Iseki new tractors.
Figure 5. Price vs. power for Claas new tractors.
Agriculture 2022, 11, x FOR PEER REVIEW 11 of 27
Figure 5. Price vs. power for Claas new tractors.
Figure 6. Price vs. power for Fendt new tractors.
Figure 7. Price vs. power for Iseki new tractors.
Figure 6. Price vs. power for Fendt new tractors.

Agriculture 2022, 12, 331 11 of 26
Agriculture 2022, 11, x FOR PEER REVIEW 11 of 27
Figure 5. Price vs. power for Claas new tractors.
Figure 6. Price vs. power for Fendt new tractors.
Figure 7. Price vs. power for Iseki new tractors. Figure 7. Price vs. power for Iseki new tractors.
Agriculture 2022, 11, x FOR PEER REVIEW 12 of 27
Figure 8. Price vs. power for John Deere new tractors.
Figure 9. Price vs. power for Massey Ferguson new tractors.
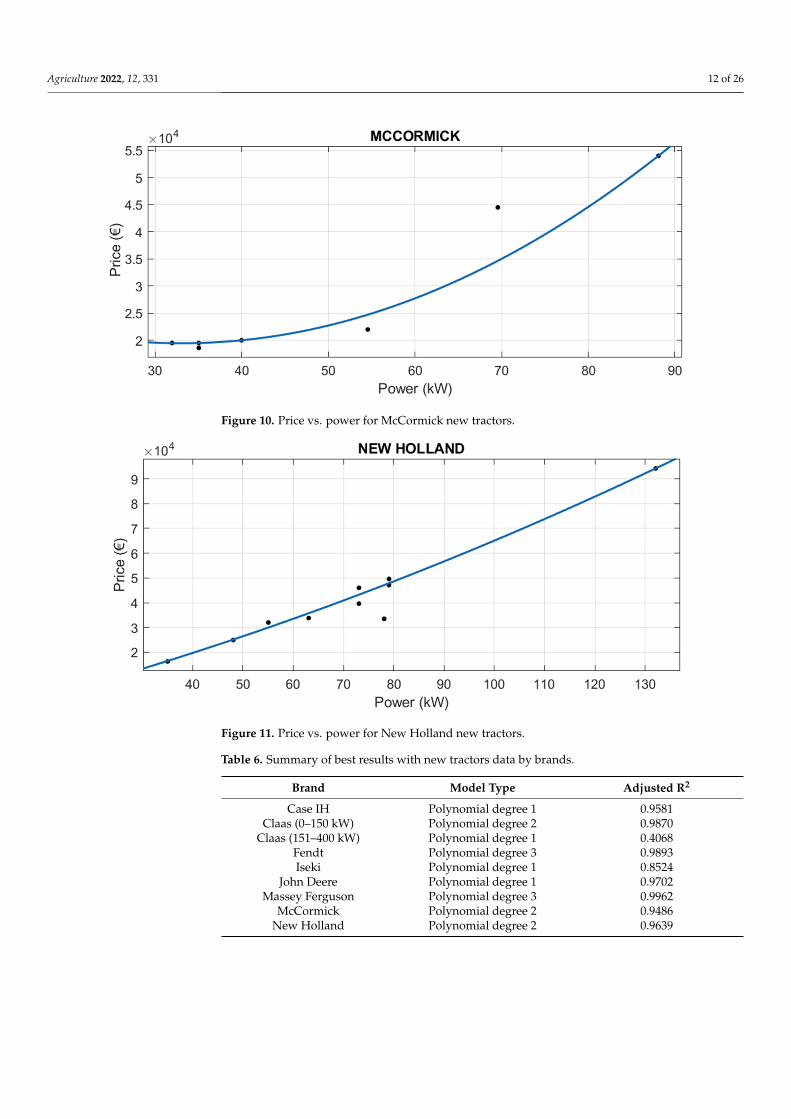
Figure 10. Price vs. power for McCormick new tractors.
Figure 8. Price vs. power for John Deere new tractors.
Agriculture 2022, 11, x FOR PEER REVIEW 12 of 27
Figure 8. Price vs. power for John Deere new tractors.
Figure 9. Price vs. power for Massey Ferguson new tractors.
Figure 10. Price vs. power for McCormick new tractors.
Figure 9. Price vs. power for Massey Ferguson new tractors.
Agriculture 2022, 12, 331 12 of 26
Agriculture 2022, 11, x FOR PEER REVIEW 12 of 27
Figure 8. Price vs. power for John Deere new tractors.
Figure 9. Price vs. power for Massey Ferguson new tractors.
Figure 10. Price vs. power for McCormick new tractors. Figure 10. Price vs. power for McCormick new tractors.
Agriculture 2022, 11, x FOR PEER REVIEW 13 of 27
Figure 11. Price vs. power for New Holland new tractors.
Table 6. Summary of best results with new tractors data by brands.
Brand Model Type Adjusted R2 Case IH Polynomial degree 1 0.9581
Claas (0–150 kW) Polynomial degree 2 0.9870 Claas (151–400 kW) Polynomial degree 1 0.4068
Fendt Polynomial degree 3 0.9893 Iseki Polynomial degree 1 0.8524
John Deere Polynomial degree 1 0.9702 Massey Ferguson Polynomial degree 3 0.9962
McCormick Polynomial degree 2 0.9486 New Holland Polynomial degree 2 0.9639
The adjusted value of R2 reflects the precision of the calculation of the predicted var-iable (price). Therefore, the better the equation, the closer its value is to 1. Almost all the brands have adjusted R2 over 0.94, with the exception of Iseki, whose R2 is 0.8524 and the additional segmentation done in Claas. 3.1.2. Segmentation by Power
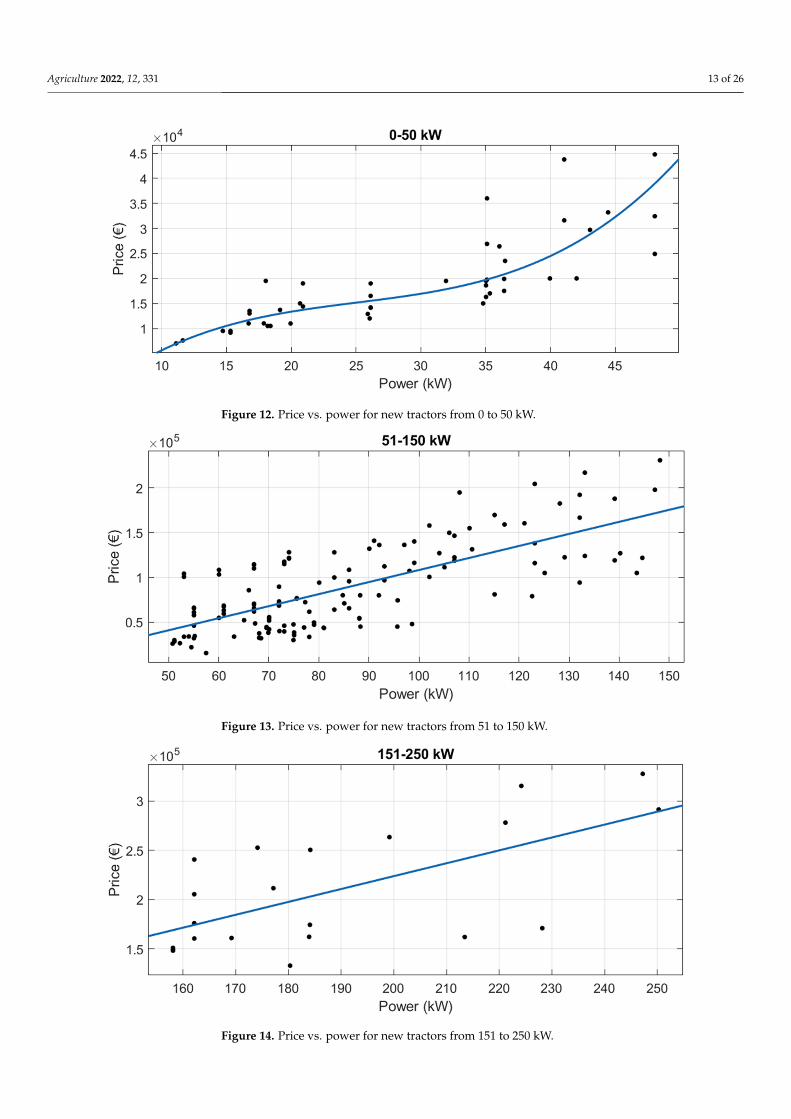
In new tractors, when segmenting by power range, the results were worse than those with the whole dataset and the segmentation by brand (see Figures 12–15 and Table 7). With this segmentation by power, all adjusted R2 were under 0.8.
Figure 11. Price vs. power for New Holland new tractors.
Table 6. Summary of best results with new tractors data by brands.
Brand Model Type Adjusted R2
Case IH Polynomial degree 1 0.9581Claas (0–150 kW) Polynomial degree 2 0.9870
Claas (151–400 kW) Polynomial degree 1 0.4068Fendt Polynomial degree 3 0.9893Iseki Polynomial degree 1 0.8524
John Deere Polynomial degree 1 0.9702Massey Ferguson Polynomial degree 3 0.9962
McCormick Polynomial degree 2 0.9486New Holland Polynomial degree 2 0.9639
Agriculture 2022, 12, 331 13 of 26Agriculture 2022, 11, x FOR PEER REVIEW 14 of 27
Figure 12. Price vs. power for new tractors from 0 to 50 kW.
Figure 13. Price vs. power for new tractors from 51 to 150 kW.
Figure 12. Price vs. power for new tractors from 0 to 50 kW.
Agriculture 2022, 11, x FOR PEER REVIEW 14 of 27
Figure 12. Price vs. power for new tractors from 0 to 50 kW.
Figure 13. Price vs. power for new tractors from 51 to 150 kW.
Figure 13. Price vs. power for new tractors from 51 to 150 kW.
Agriculture 2022, 11, x FOR PEER REVIEW 14 of 27
Figure 12. Price vs. power for new tractors from 0 to 50 kW.
Figure 13. Price vs. power for new tractors from 51 to 150 kW.
Figure 14. Price vs. power for new tractors from 151 to 250 kW.

Agriculture 2022, 12, 331 14 of 26
Agriculture 2022, 11, x FOR PEER REVIEW 15 of 27
Figure 14. Price vs. power for new tractors from 151 to 250 kW.
Figure 15. Price vs. power for new tractors with more than 251 kW.
Table 7. Summary of results of segmentation by power for new tractors.
Power (kW) Model Type Adjusted R2
0–50 Polynomial degree 3 0.7814 51–150 Polynomial degree 2 0.5334 151–250 Polynomial degree 1 0.3938
More than 251 Polynomial degree 2 0.6076
3.1.3. Segmentation by Category Although there are 15 tractor categories in the official list, some of them are in disuse,
and in others there are few models. Therefore, new tractor data were obtained for the following eight categories: 1. 4WD Normal Width Tractors 2. 4WD Narrow Tractors 3. Crawler Tractors 4. 2WD Normal Width Tractors 5. 2WD Narrow Tractors 6. 4WD Tractors 7. Semi Crawler Tractors (Semi Tracked) 8. 4WD Narrow and Articulated Tractors
Of these 8, for “Crawler Tractors”, “Semi Crawler Tractor (Semi Tracked)” and “4WD Narrow and Articulated Tractor”, very little new tractor data were available, so regression was not performed in these three cases.
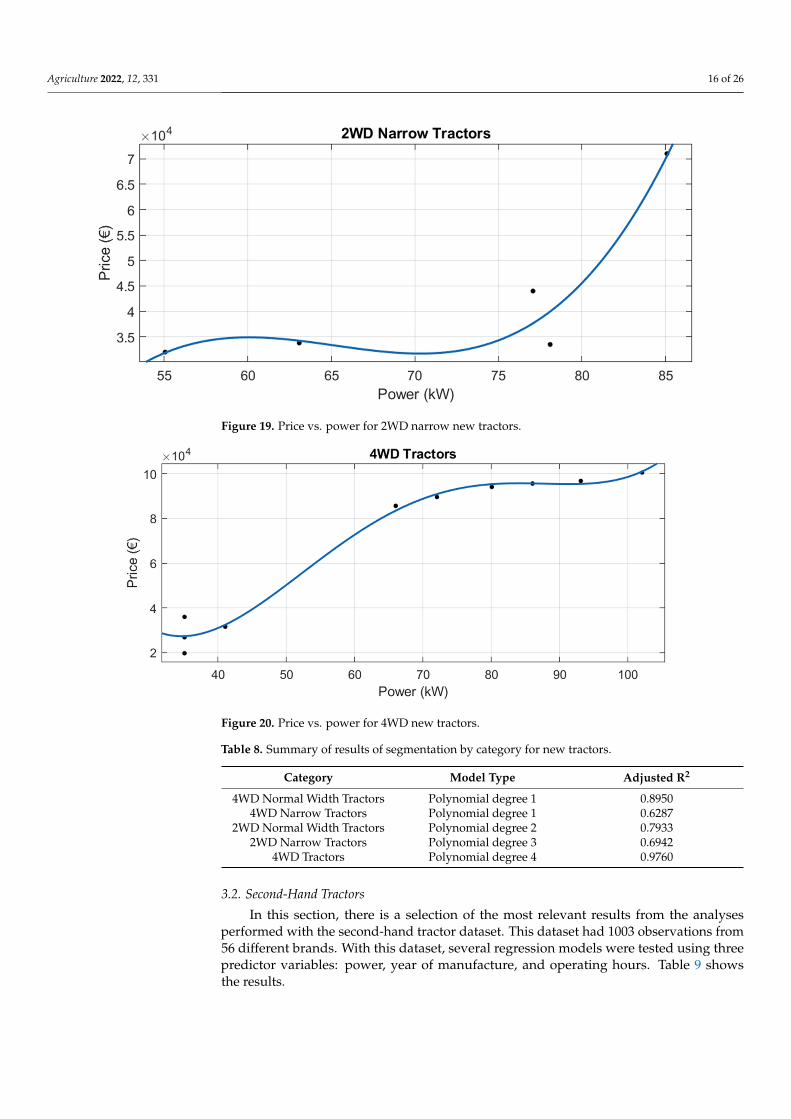
For the other six official categories, robust linear regressions were performed (see Figures 16–20 and Table 8). Adjusted R2 ranges from 0.6287 to 0.9760. The lowest adjusted R2 was for “4WD Narrow Tractors” (adjusted R2 = 0.6287). The highest adjusted R2 was for the category “4WD Tractors” (adjusted R2 = 0.9760).
Figure 15. Price vs. power for new tractors with more than 251 kW.
Table 7. Summary of results of segmentation by power for new tractors.
Power (kW) Model Type Adjusted R2
0–50 Polynomial degree 3 0.781451–150 Polynomial degree 2 0.5334151–250 Polynomial degree 1 0.3938
More than 251 Polynomial degree 2 0.6076
3.1.3. Segmentation by Category
Although there are 15 tractor categories in the official list, some of them are in disuse,and in others there are few models. Therefore, new tractor data were obtained for thefollowing eight categories:
1. 4WD Normal Width Tractors2. 4WD Narrow Tractors3. Crawler Tractors4. 2WD Normal Width Tractors5. 2WD Narrow Tractors6. 4WD Tractors7. Semi Crawler Tractors (Semi Tracked)8. 4WD Narrow and Articulated Tractors
Of these 8, for “Crawler Tractors”, “Semi Crawler Tractor (Semi Tracked)” and “4WDNarrow and Articulated Tractor”, very little new tractor data were available, so regressionwas not performed in these three cases.
For the other six official categories, robust linear regressions were performed (seeFigures 16–20 and Table 8). Adjusted R2 ranges from 0.6287 to 0.9760. The lowest adjustedR2 was for “4WD Narrow Tractors” (adjusted R2 = 0.6287). The highest adjusted R2 was forthe category “4WD Tractors” (adjusted R2 = 0.9760).

Agriculture 2022, 12, 331 15 of 26Agriculture 2022, 11, x FOR PEER REVIEW 16 of 27
Figure 16. Price vs. power for 4WD normal width new tractors.
Figure 17. Price vs. power for 4WD narrow new tractors.
Figure 16. Price vs. power for 4WD normal width new tractors.
Agriculture 2022, 11, x FOR PEER REVIEW 16 of 27
Figure 16. Price vs. power for 4WD normal width new tractors.
Figure 17. Price vs. power for 4WD narrow new tractors.
Figure 17. Price vs. power for 4WD narrow new tractors.
Agriculture 2022, 11, x FOR PEER REVIEW 16 of 27
Figure 16. Price vs. power for 4WD normal width new tractors.
Figure 17. Price vs. power for 4WD narrow new tractors.
Figure 18. Price vs. power for 2WD normal width new tractors.
Agriculture 2022, 12, 331 16 of 26
Agriculture 2022, 11, x FOR PEER REVIEW 17 of 27
Figure 18. Price vs. power for 2WD normal width new tractors.
Figure 19. Price vs. power for 2WD narrow new tractors.
Figure 20. Price vs. power for 4WD new tractors.
Table 8. Summary of results of segmentation by category for new tractors.
Category Model Type Adjusted R2
4WD Normal Width Tractors Polynomial degree 1 0.8950 4WD Narrow Tractors Polynomial degree 1 0.6287
2WD Normal Width Tractors Polynomial degree 2 0.7933 2WD Narrow Tractors Polynomial degree 3 0.6942
4WD Tractors Polynomial degree 4 0.9760
3.2. Second-Hand Tractors In this section, there is a selection of the most relevant results from the analyses per-
formed with the second-hand tractor dataset. This dataset had 1003 observations from 56 different brands. With this dataset, several regression models were tested using three pre-dictor variables: power, year of manufacture, and operating hours. Table 9 shows the re-sults.
Figure 19. Price vs. power for 2WD narrow new tractors.
Agriculture 2022, 11, x FOR PEER REVIEW 17 of 27
Figure 18. Price vs. power for 2WD normal width new tractors.
Figure 19. Price vs. power for 2WD narrow new tractors.
Figure 20. Price vs. power for 4WD new tractors.
Table 8. Summary of results of segmentation by category for new tractors.
Category Model Type Adjusted R2
4WD Normal Width Tractors Polynomial degree 1 0.8950 4WD Narrow Tractors Polynomial degree 1 0.6287
2WD Normal Width Tractors Polynomial degree 2 0.7933 2WD Narrow Tractors Polynomial degree 3 0.6942
4WD Tractors Polynomial degree 4 0.9760
3.2. Second-Hand Tractors In this section, there is a selection of the most relevant results from the analyses per-
formed with the second-hand tractor dataset. This dataset had 1003 observations from 56 different brands. With this dataset, several regression models were tested using three pre-dictor variables: power, year of manufacture, and operating hours. Table 9 shows the re-sults.
Figure 20. Price vs. power for 4WD new tractors.
Table 8. Summary of results of segmentation by category for new tractors.
Category Model Type Adjusted R2
4WD Normal Width Tractors Polynomial degree 1 0.89504WD Narrow Tractors Polynomial degree 1 0.6287
2WD Normal Width Tractors Polynomial degree 2 0.79332WD Narrow Tractors Polynomial degree 3 0.6942
4WD Tractors Polynomial degree 4 0.9760
3.2. Second-Hand Tractors
In this section, there is a selection of the most relevant results from the analysesperformed with the second-hand tractor dataset. This dataset had 1003 observations from56 different brands. With this dataset, several regression models were tested using threepredictor variables: power, year of manufacture, and operating hours. Table 9 showsthe results.
Agriculture 2022, 12, 331 17 of 26
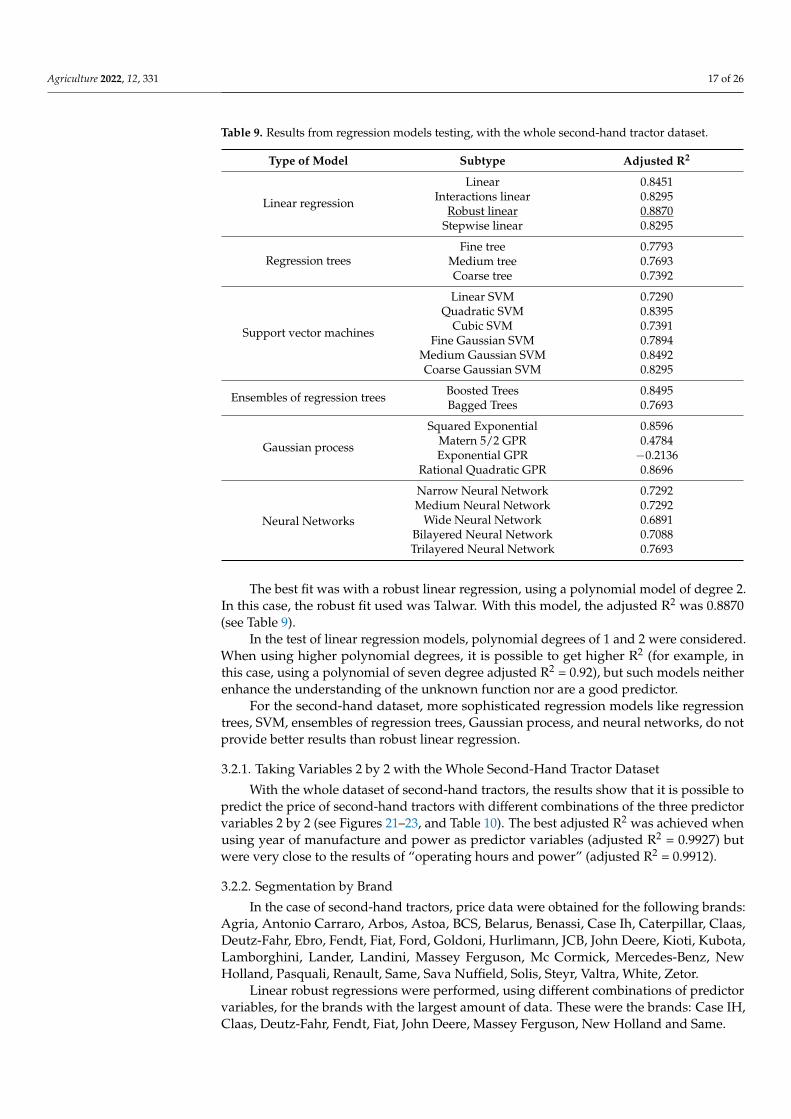
Table 9. Results from regression models testing, with the whole second-hand tractor dataset.
Type of Model Subtype Adjusted R2
Linear regression
Linear 0.8451Interactions linear 0.8295
Robust linear 0.8870Stepwise linear 0.8295
Regression treesFine tree 0.7793
Medium tree 0.7693Coarse tree 0.7392
Support vector machines
Linear SVM 0.7290Quadratic SVM 0.8395
Cubic SVM 0.7391Fine Gaussian SVM 0.7894
Medium Gaussian SVM 0.8492Coarse Gaussian SVM 0.8295
Ensembles of regression trees Boosted Trees 0.8495Bagged Trees 0.7693
Gaussian process
Squared Exponential 0.8596Matern 5/2 GPR 0.4784Exponential GPR −0.2136
Rational Quadratic GPR 0.8696
Neural Networks
Narrow Neural Network 0.7292Medium Neural Network 0.7292
Wide Neural Network 0.6891Bilayered Neural Network 0.7088Trilayered Neural Network 0.7693
The best fit was with a robust linear regression, using a polynomial model of degree 2.In this case, the robust fit used was Talwar. With this model, the adjusted R2 was 0.8870(see Table 9).
In the test of linear regression models, polynomial degrees of 1 and 2 were considered.When using higher polynomial degrees, it is possible to get higher R2 (for example, inthis case, using a polynomial of seven degree adjusted R2 = 0.92), but such models neitherenhance the understanding of the unknown function nor are a good predictor.
For the second-hand dataset, more sophisticated regression models like regressiontrees, SVM, ensembles of regression trees, Gaussian process, and neural networks, do notprovide better results than robust linear regression.
3.2.1. Taking Variables 2 by 2 with the Whole Second-Hand Tractor Dataset
With the whole dataset of second-hand tractors, the results show that it is possible topredict the price of second-hand tractors with different combinations of the three predictorvariables 2 by 2 (see Figures 21–23, and Table 10). The best adjusted R2 was achieved whenusing year of manufacture and power as predictor variables (adjusted R2 = 0.9927) butwere very close to the results of “operating hours and power” (adjusted R2 = 0.9912).
3.2.2. Segmentation by Brand
In the case of second-hand tractors, price data were obtained for the following brands:Agria, Antonio Carraro, Arbos, Astoa, BCS, Belarus, Benassi, Case Ih, Caterpillar, Claas,Deutz-Fahr, Ebro, Fendt, Fiat, Ford, Goldoni, Hurlimann, JCB, John Deere, Kioti, Kubota,Lamborghini, Lander, Landini, Massey Ferguson, Mc Cormick, Mercedes-Benz, NewHolland, Pasquali, Renault, Same, Sava Nuffield, Solis, Steyr, Valtra, White, Zetor.
Linear robust regressions were performed, using different combinations of predictorvariables, for the brands with the largest amount of data. These were the brands: Case IH,Claas, Deutz-Fahr, Fendt, Fiat, John Deere, Massey Ferguson, New Holland and Same.

Agriculture 2022, 12, 331 18 of 26Agriculture 2022, 11, x FOR PEER REVIEW 19 of 27
Figure 21. Price vs. power and operating hours for second-hand tractors.
Figure 22. Price vs. power and year of manufacture for second-hand tractors.
Figure 23. Price vs. operating hours and year of manufacture for second-hand tractors.
Table 10. Summary of results with the whole dataset of second-hand tractors, taking variables 2 by 2.
Dependent Variable Independent Variables Model Type Adjusted R2 Price Operating hours, power Polynomial model degree 1 0.9912 Price Year of manufacture, power Polynomial model degree 2 0.9927 Price Year of manufacture, operating hours Polynomial model degree 1 0.9893
3.2.2. Segmentation by Brand
Figure 21. Price vs. power and operating hours for second-hand tractors.
Agriculture 2022, 11, x FOR PEER REVIEW 19 of 27
Figure 21. Price vs. power and operating hours for second-hand tractors.
Figure 22. Price vs. power and year of manufacture for second-hand tractors.
Figure 23. Price vs. operating hours and year of manufacture for second-hand tractors.
Table 10. Summary of results with the whole dataset of second-hand tractors, taking variables 2 by 2.
Dependent Variable Independent Variables Model Type Adjusted R2 Price Operating hours, power Polynomial model degree 1 0.9912 Price Year of manufacture, power Polynomial model degree 2 0.9927 Price Year of manufacture, operating hours Polynomial model degree 1 0.9893
3.2.2. Segmentation by Brand
Figure 22. Price vs. power and year of manufacture for second-hand tractors.
Agriculture 2022, 11, x FOR PEER REVIEW 19 of 27
Figure 21. Price vs. power and operating hours for second-hand tractors.
Figure 22. Price vs. power and year of manufacture for second-hand tractors.
Figure 23. Price vs. operating hours and year of manufacture for second-hand tractors.
Table 10. Summary of results with the whole dataset of second-hand tractors, taking variables 2 by 2.
Dependent Variable Independent Variables Model Type Adjusted R2 Price Operating hours, power Polynomial model degree 1 0.9912 Price Year of manufacture, power Polynomial model degree 2 0.9927 Price Year of manufacture, operating hours Polynomial model degree 1 0.9893
3.2.2. Segmentation by Brand
Figure 23. Price vs. operating hours and year of manufacture for second-hand tractors.
Table 10. Summary of results with the whole dataset of second-hand tractors, taking variables 2 by 2.
Dependent Variable Independent Variables Model Type Adjusted R2
Price Operating hours, power Polynomial model degree 1 0.9912Price Year of manufacture, power Polynomial model degree 2 0.9927Price Year of manufacture, operating hours Polynomial model degree 1 0.9893
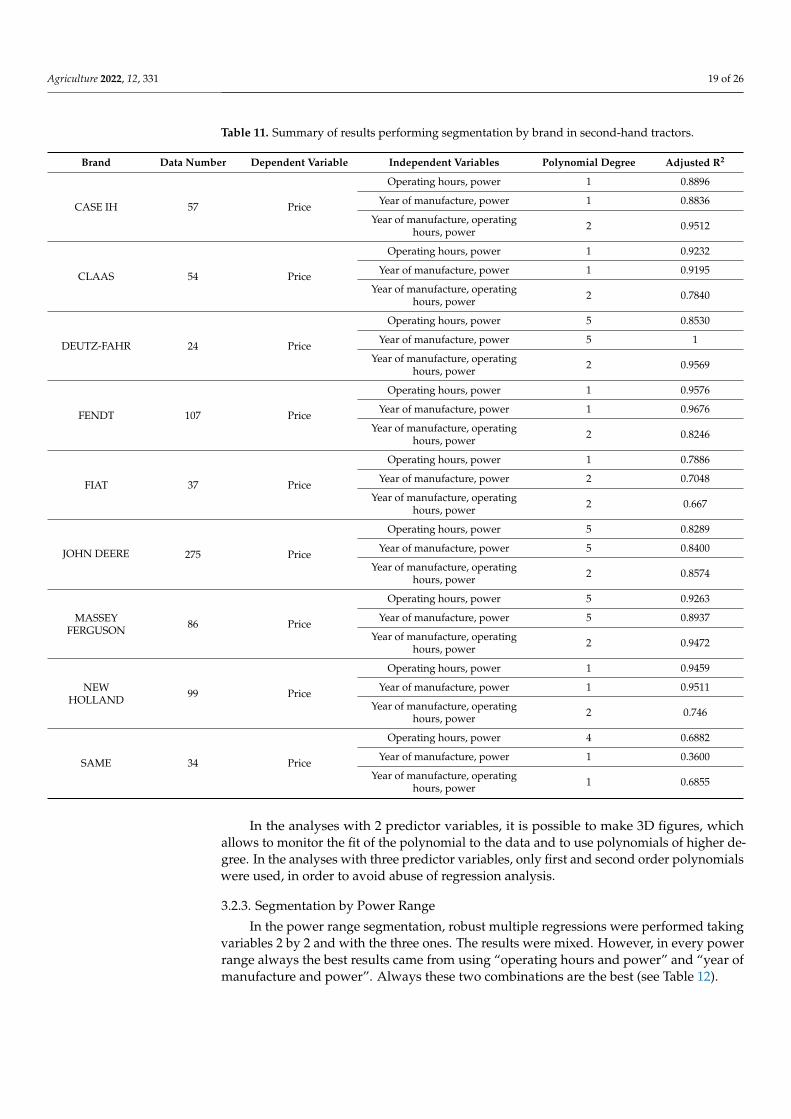
Doing a segmentation by brand, it is possible to get good and more specific adjust-ments, in most cases (see Table 11).
Agriculture 2022, 12, 331 19 of 26
Table 11. Summary of results performing segmentation by brand in second-hand tractors.
Brand Data Number Dependent Variable Independent Variables Polynomial Degree Adjusted R2
CASE IH 57 Price
Operating hours, power 1 0.8896
Year of manufacture, power 1 0.8836
Year of manufacture, operatinghours, power 2 0.9512
CLAAS 54 Price
Operating hours, power 1 0.9232
Year of manufacture, power 1 0.9195
Year of manufacture, operatinghours, power 2 0.7840
DEUTZ-FAHR 24 Price
Operating hours, power 5 0.8530
Year of manufacture, power 5 1
Year of manufacture, operatinghours, power 2 0.9569
FENDT 107 Price
Operating hours, power 1 0.9576
Year of manufacture, power 1 0.9676
Year of manufacture, operatinghours, power 2 0.8246
FIAT 37 Price
Operating hours, power 1 0.7886
Year of manufacture, power 2 0.7048
Year of manufacture, operatinghours, power 2 0.667
JOHN DEERE 275 Price
Operating hours, power 5 0.8289
Year of manufacture, power 5 0.8400
Year of manufacture, operatinghours, power 2 0.8574
MASSEYFERGUSON 86 Price
Operating hours, power 5 0.9263
Year of manufacture, power 5 0.8937
Year of manufacture, operatinghours, power 2 0.9472
NEWHOLLAND 99 Price
Operating hours, power 1 0.9459
Year of manufacture, power 1 0.9511
Year of manufacture, operatinghours, power 2 0.746
SAME 34 Price
Operating hours, power 4 0.6882
Year of manufacture, power 1 0.3600
Year of manufacture, operatinghours, power 1 0.6855
In the analyses with 2 predictor variables, it is possible to make 3D figures, whichallows to monitor the fit of the polynomial to the data and to use polynomials of higher de-gree. In the analyses with three predictor variables, only first and second order polynomialswere used, in order to avoid abuse of regression analysis.
3.2.3. Segmentation by Power Range
In the power range segmentation, robust multiple regressions were performed takingvariables 2 by 2 and with the three ones. The results were mixed. However, in every powerrange always the best results came from using “operating hours and power” and “year ofmanufacture and power”. Always these two combinations are the best (see Table 12).

Agriculture 2022, 12, 331 20 of 26
Table 12. Summary of results for segmentation by power range in second-hand tractors.
Power (kW) Data Number Dependent Variable Independent Variables Polynomial Degree Adjusted R2
0–50 193 Price
Operating hours, power 1 0.8917
Year of manufacture, power 1 0.9397
Operating hours, year of manufacture 1 0.8813
Year of manufacture, operatinghours, power 1 0.3520
51–150 626 Price
Operating hours, power 1 0.9897
Year of manufacture, power 1 0.9907
Operating hours, year of manufacture 1 0.4298
Year of manufacture, operatinghours, power 1 0.8577
151–250 162 Price
Operating hours, power 1 0.9694
Year of manufacture, power 1 0.9794
Operating hours, year of manufacture 1 0.9742
Year of manufacture, operatinghours, power 1 0.6400
More than 250 22 Price
Operating hours, power 1 0.8947
Year of manufacture, power 1 0.8442
Operating hours, year of manufacture 1 0.7297
Year of manufacture, operatinghours, power 2 0.7665
On the other hand, when using “Operating hours and year of manufacture” and “Yearof manufacture, operating hours and power” the results are worse.
3.2.4. Segmentation by Category
Of the official categories into which MAPA classifies, enough data numbers were onlyavailable for the following categories:
• Crawler Tractors• 4WD Narrow and Articulated Tractor• 4WD Narrow Tractor• 4WD Normal Width Tractor• 2WD Narrow Tractor• 2WD Normal Width Tractor
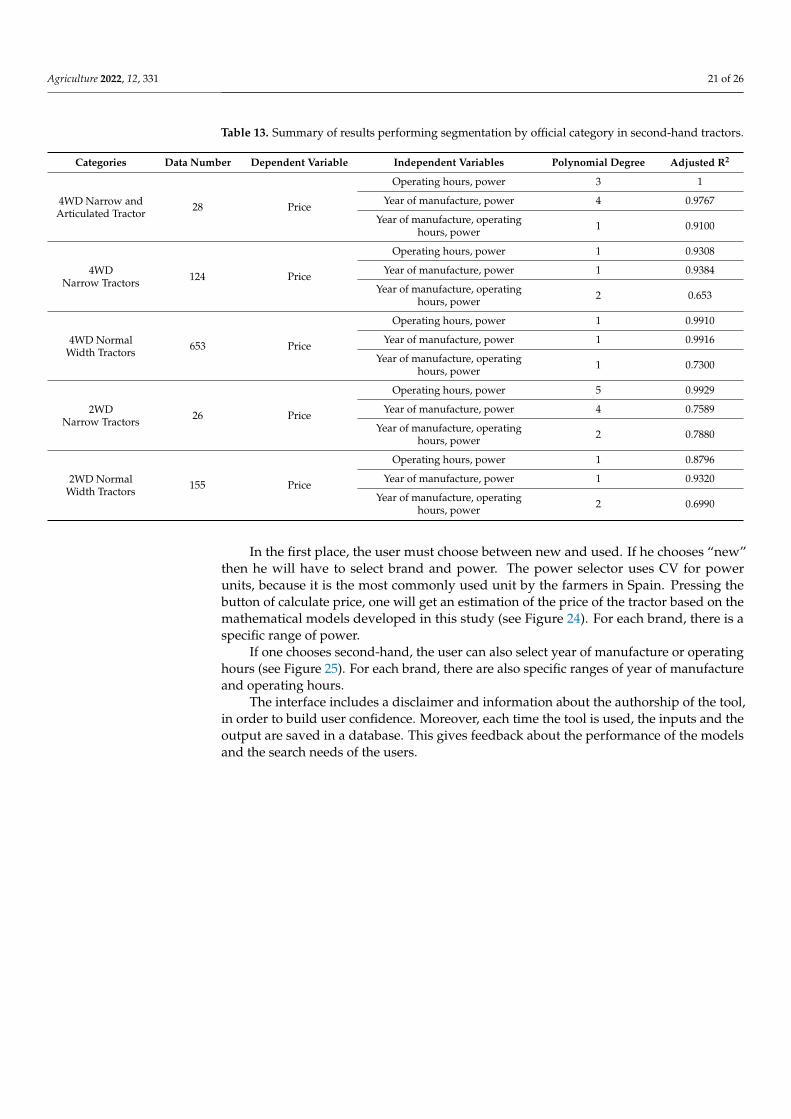
In these analysis, the adjusted R2 were very good, most of them greater than 0.9. Thehighest adjusted R2 were obtained always when 2 predictor variables were used. Thelowest adjusted R2 were obtained when 3 predictor variables were used (see Table 13).
3.3. Decision Support Tool
The decision support tool is available and fully operative at: https://www.tractoresymaquinas.com/calculadora-precios-tractores/ (see Figures 24 and 25). It is an open andfree tool, very easy to use. It is done in a web environment, but it can be also implementedin a smartphone APP for Android or IOS. It is in Spanish because it is implemented in aSpanish site dedicated to tractors and other farm machinery. The number of fields andoptions were reduced to a minimum, with the idea of making the tool as simple as possible.
Agriculture 2022, 12, 331 21 of 26
Table 13. Summary of results performing segmentation by official category in second-hand tractors.
Categories Data Number Dependent Variable Independent Variables Polynomial Degree Adjusted R2
4WD Narrow andArticulated Tractor
28 Price
Operating hours, power 3 1
Year of manufacture, power 4 0.9767
Year of manufacture, operatinghours, power 1 0.9100
4WDNarrow Tractors 124 Price
Operating hours, power 1 0.9308
Year of manufacture, power 1 0.9384
Year of manufacture, operatinghours, power 2 0.653
4WD NormalWidth Tractors
653 Price
Operating hours, power 1 0.9910
Year of manufacture, power 1 0.9916
Year of manufacture, operatinghours, power 1 0.7300
2WDNarrow Tractors 26 Price
Operating hours, power 5 0.9929
Year of manufacture, power 4 0.7589
Year of manufacture, operatinghours, power 2 0.7880
2WD NormalWidth Tractors
155 Price
Operating hours, power 1 0.8796
Year of manufacture, power 1 0.9320
Year of manufacture, operatinghours, power 2 0.6990
In the first place, the user must choose between new and used. If he chooses “new”then he will have to select brand and power. The power selector uses CV for powerunits, because it is the most commonly used unit by the farmers in Spain. Pressing thebutton of calculate price, one will get an estimation of the price of the tractor based on themathematical models developed in this study (see Figure 24). For each brand, there is aspecific range of power.
If one chooses second-hand, the user can also select year of manufacture or operatinghours (see Figure 25). For each brand, there are also specific ranges of year of manufactureand operating hours.
The interface includes a disclaimer and information about the authorship of the tool,in order to build user confidence. Moreover, each time the tool is used, the inputs and theoutput are saved in a database. This gives feedback about the performance of the modelsand the search needs of the users.

Agriculture 2022, 12, 331 22 of 26
Agriculture 2022, 11, x FOR PEER REVIEW 22 of 27
Table 13. Summary of results performing segmentation by official category in second-hand tractors.
Categories Data Number
Dependent Variable Independent Variables Polynomial
Degree Adjusted R2
4WD Narrow and Articu-lated Tractor
28 Price Operating hours, power 3 1
Year of manufacture, power 4 0.9767 Year of manufacture, operating hours, power 1 0.9100
4WD Narrow Tractors 124 Price Operating hours, power 1 0.9308
Year of manufacture, power 1 0.9384 Year of manufacture, operating hours, power 2 0.653
4WD Normal Width Trac-tors
653 Price Operating hours, power 1 0.9910
Year of manufacture, power 1 0.9916 Year of manufacture, operating hours, power 1 0.7300
2wd Narrow Tractors 26 Price Operating hours, power 5 0.9929
Year of manufacture, power 4 0.7589 Year of manufacture, operating hours, power 2 0.7880
2WD Normal Width Trac-tors
155 Price Operating hours, power 1 0.8796
Year of manufacture, power 1 0.9320 Year of manufacture, operating hours, power 2 0.6990
3.3. Decision Support Tool The decision support tool is available and fully operative at: https://www.tractore-
symaquinas.com/calculadora-precios-tractores/ (see Figures 24 and 25). It is an open and free tool, very easy to use. It is done in a web environment, but it can be also implemented in a smartphone APP for Android or IOS. It is in Spanish because it is implemented in a Spanish site dedicated to tractors and other farm machinery. The number of fields and options were reduced to a minimum, with the idea of making the tool as simple as possi-ble.
Figure 24. Screenshot of the decision support tool. New tractors. Figure 24. Screenshot of the decision support tool. New tractors.
Agriculture 2022, 11, x FOR PEER REVIEW 23 of 27
Figure 25. Screenshot of the decision support tool. Second-hand tractors.
In the first place, the user must choose between new and used. If he chooses “new” then he will have to select brand and power. The power selector uses CV for power units, because it is the most commonly used unit by the farmers in Spain. Pressing the button of calculate price, one will get an estimation of the price of the tractor based on the mathe-matical models developed in this study (see Figure 24). For each brand, there is a specific range of power.
If one chooses second-hand, the user can also select year of manufacture or operating hours (see Figure 25). For each brand, there are also specific ranges of year of manufacture and operating hours.
The interface includes a disclaimer and information about the authorship of the tool, in order to build user confidence. Moreover, each time the tool is used, the inputs and the output are saved in a database. This gives feedback about the performance of the models and the search needs of the users.
4. Discussion Farm tractors have many different characteristics (brand, dimensions, power, dis-
placement, gearbox, transmission, steering, hydraulics, roll over protection systems, etc.,). However, with just a few of these variables, we can predict their price.
Regarding new tractors, this study is in line with the study of tractors in Italy and Spain, in which it is said that the price of new tractors can be modeled using only power as predictor variable. In that study the variance explained was 89% in Spain and 73% in Italy, and in this study, it is 99.81% using a robust LAR adjustment [34,41].
Segmentations by brand, with the data of new tractors, have also given good results and more specific predictions than the analysis of the whole dataset of new tractors. This has not been the case with the segmentations by category and by power range, where the results have been worse than that with the whole new tractor dataset.
Figure 25. Screenshot of the decision support tool. Second-hand tractors.

Agriculture 2022, 12, 331 23 of 26
4. Discussion
Farm tractors have many different characteristics (brand, dimensions, power, dis-placement, gearbox, transmission, steering, hydraulics, roll over protection systems, etc.).However, with just a few of these variables, we can predict their price.
Regarding new tractors, this study is in line with the study of tractors in Italy andSpain, in which it is said that the price of new tractors can be modeled using only power aspredictor variable. In that study the variance explained was 89% in Spain and 73% in Italy,and in this study, it is 99.81% using a robust LAR adjustment [34,41].
Segmentations by brand, with the data of new tractors, have also given good resultsand more specific predictions than the analysis of the whole dataset of new tractors. Thishas not been the case with the segmentations by category and by power range, where theresults have been worse than that with the whole new tractor dataset.
In the case of predicting used tractor prices, the results showed that it is possible topredict the price of second-hand tractors, with very good precision, doing robust linearregressions with only three predictor variables (power, year of manufacture and operat-ing hours) or taking 2 by 2. The use of short number of variables, reduces the risk ofoverfitting [42,45].
Predictive analytics with the whole dataset of the used tractors, using these threepredictor variables, achieved 88.70% of explained variance, which is similar to the resultfrom another study done with a dataset from UK [37]. Using only power and age, the resultis 99.27% of explained variance, which is higher than the 73.4% achieved in a previousstudy [34].
In second-hand tractors, doing segmentations by brand, power range, and categoryit is also possible to achieve better results, with adjusted R2 > 0.9 in most cases, usingvariables 2 by 2.
Regarding the type of parametric models, in the present study, all the models obtainedfor estimating the market value of tractor were polynomic. However, previous studiesfound better results with logarithmic-linear types [33,41,46,47] or cubic [37].
In previous studies, some variables like brand or traction, were considered binaryvariables, with the aim to do one model for new and another one for second-hand trac-tors [34,37,41]. Doing segmentations by brand, horsepower or type, like in this study, allowsthe development of more precise mathematical models that provide better predictions. Thisnew approach improves the performance of the DST.
Regarding non-parametric models, for new and second-hand tractors datasets, the non-parametric regression models tested (regression trees, support vector machines, ensemblesof regression trees, Gaussian process, and Neural Networks) do not provide better resultsthan robust linear regressions. Those more complex models were not tested by previousstudies [30–35,37–39,41,48], but there is no additional benefit to be gained by choosing them.
The DST developed in the present study has the three fundamental characteristicsthat any DST should have: a database that can store and manage internal and externalinformation, algorithms necessary for the analysis, and an interface for communicationwith the user [12].
The present DST fulfills the eight core factors that influence the uptake and use ofDST by farmers, established by Rose et al., 2016. These factors are performance expectancy,easy to use, peer recommendation, trust, cost, habit, relevance to user and farmer-advisercompatibility [20].
Regarding performance, this DST works efficiently, provides up-to-date information,give accurate predictions or information, and enable better decision-making. DST is veryeasy to use because it provides information in a quick, user-friendly way, works in anybrowser, has a clear and simple design with only few options for the inputs and one clearoutput. The peer recommendation is not extensive because it is a DST that has just beenlaunched. But if the DST performs well, the peer recommendation will come.
Regarding trust, farmers and advisers are keen to use tools from trusted sources. Forthis reason, there is a text in the bottom of the DST saying that it is a neutral decision support
Agriculture 2022, 12, 331 24 of 26
tool based on algorithm done by a public university, not a farm machinery manufacturer,dealer, or distributor. Thus, it is something that farmers can trust. This DST is also free touse. Users do not have to pay and can use the DST for an unlimited number of times.
In the case of habit, younger farmers are used to using computers and smartphones.They will seamlessly start to use a decision support tool delivered in the form of softwareor apps. Following this approach, the present DST can be used in any smartphone, tablet,or computer. It works in a www secured environment.
Regarding the relevance to user, this DST is sufficiently flexible to serve the needs ofan individual but it is also generic. It gives specific results for the most popular brands, butalso has general models that can be applied to any brand.
In this DST the farmer-adviser compatibility is guaranteed, because it is accessible forboth and is compatible with any browser or Internet device.
5. Conclusions
With the parametric models developed in this study, a calculator for estimating newand used tractor prices was developed, implemented, test, and validated. This calculatoris currently used as a decision support tool for buying and selling tractors. This tool canlead users through clear steps and suggest optimal decision paths in the process of buyingfarm tractors.
This tool saves time and money to farmers and machine dealers. In the case of newtractors, the farmer does not need to visit several stores to get a price information. Hejust can use the tool and get many different price estimations in a short time. For themachine dealers, it is a very easy way to compare tractor prices of different brands. Inthe case of second-hand tractors, the tool summarizes and condenses the information ofthousands of tractors models with different characteristics, operating hours, and age (yearof manufacture).
Moreover, the DST has other benefits. To the buyer, the farmer, it allows to detectfraudulent offers, suspicious for being too cheap or too expensive. The seller or tractorowner can estimate the remaining value of his tractor or the selling price in the market.The seller does not need to be an expert appraiser to know how much to sell his usedtractors for.
Author Contributions: Data curation, L.R.-G. and P.S.-G.; formal analysis, L.R.-G. and P.S.-G.; inves-tigation, L.R.-G.; methodology, L.R.-G.; software, L.R.-G.; supervision, L.R.-G.; visualization, P.S.-G.;writing—original draft, L.R.-G. and P.S.-G.; writing—review and editing, L.R.-G. All authors haveread and agreed to the published version of the manuscript.
Funding: This research received no external funding.
Institutional Review Board Statement: Not applicable.
Informed Consent Statement: Not applicable.
Data Availability Statement: If necessary, we can provide raw data.
Acknowledgments: The authors would like to thank the website “Tractores y Máquinas” (https://www.tractoresymaquinas.com/) for providing the IT infrastructure for this study.
Conflicts of Interest: The authors declare no conflict of interest.
References1. Goering, C.E.; Stone, M.L.; Smith, D.W.; Turnquist, P.K. Development of Off-Road Vehicles; ASAE: St. Joseph, MI, USA, 2003;
ISBN 1-892769-26-3.2. Renius, K.T. Fundamentals of Tractor Design, 1st ed.; Springer: Cham, Switzerland, 2020; ISBN 978-3-030-32804-7.3. Abolsamia. Loures, Portugal. 2021. Available online: https://issuu.com/abolsamia/docs/abolsamia_125/14 (accessed on
10 February 2022).4. MAPA. Spanish Ministry of Agriculture, Fisheries and Food. Statistics. Inscripción de Maquinaria Agrícola Año 2020. 2021.
Available online: https://www.mapa.gob.es/es/agricultura/estadisticas/ (accessed on 10 February 2022).

Agriculture 2022, 12, 331 25 of 26
5. Ruiz-Garcia, L. ¿Cuál es el Factor Más Importante al Comprar un Tractor? Available online: https://www.tractoresymaquinas.com/que-es-mas-importante-al-comprar-un-tractor/ (accessed on 30 September 2021).
6. Kotu, V.; Deshpande, B. Data Science: Concepts and Practice; Morgan Kaufmann: Burlington, MA, USA, 2018; ISBN 0128147628.7. Qamar, U.; Raza, M.S. Data Science Concepts and Techniques with Applications; Springer: Berlin/Heidelberg, Germany, 2020;
ISBN 9811561338.8. Van’t Spijker, A. The New Oil: Using Innovative Business Models to Turn Data into Profit; Technics Publications: Basking Ridge, NJ,
USA, 2014; ISBN 1634620569.9. Hill, L.; Levy, F.; Kundra, V.; Laki, B.; Smith, J. Data-Driven Innovation for Growth and Well-Being; OECD Publishing: Paris,
France, 2015.10. Pham, X.; Stack, M. How data analytics is transforming agriculture. Bus. Horiz. 2018, 61, 125–133. [CrossRef]11. Shim, J.P.; Warkentin, M.; Courtney, J.F.; Power, D.J.; Sharda, R.; Carlsson, C. Past, present, and future of decision support
technology. Decis. Support Syst. 2002, 33, 111–126. [CrossRef]12. Hazır, Ö. A review of analytical models, approaches and decision support tools in project monitoring and control. Int. J. Proj.
Manag. 2015, 33, 808–815. [CrossRef]13. Taechatanasat, P.; Armstrong, L. Decision support system data for farmer decision making. In Proceedings of the 9th Conference
of the Asian Federation for Information Technology in Agriculture “ICT’s for future Economic and Sustainable AgriculturalSystems”, Perth, Australia, 29 September–2 October 2014.
14. Foughali, K.; Fathallah, K.; Frihida, A. Using Cloud IOT for disease prevention in precision agriculture. Procedia Comput. Sci.2018, 130, 575–582. [CrossRef]
15. Rupnik, R.; Kukar, M.; Vracar, P.; Košir, D.; Pevec, D.; Bosnic, Z. AgroDSS: A decision support system for agriculture and farming.Comput. Electron. Agric. 2019, 161, 260–271. [CrossRef]
16. Pahmeyer, C.; Kuhn, T.; Britz, W. ‘Fruchtfolge’: A crop rotation decision support system for optimizing cropping choices with bigdata and spatially explicit modeling. Comput. Electron. Agric. 2021, 181, 105948. [CrossRef]
17. Van de Broek, M.; Henriksen, C.B.; Ghaley, B.B.; Lugato, E.; Kuzmanovski, V.; Trajanov, A.; Debeljak, M.; Sandén, T.; Spiegel, H.;Decock, C.; et al. Assessing the Climate Regulation Potential of Agricultural Soils Using a Decision Support Tool Adapted toStakeholders’ Needs and Possibilities. Front. Environ. Sci. 2019, 7, 131. [CrossRef]
18. Oliver, D.M.; Bartie, P.J.; Heathwaite, A.L.; Pschetz, L.; Quilliam, R.S. Design of a decision support tool for visualising E. coli riskon agricultural land using a stakeholder-driven approach. Land Use Policy 2017, 66, 227–234. [CrossRef]
19. Sharma, S.; Rout, K.K.; Khanda, C.M.; Tripathi, R.; Shahid, M.; Nayak, A.; Satpathy, S.; Banik, N.C.; Iftikar, W.; Parida, N.; et al.Field-specific nutrient management using Rice Crop Manager decision support tool in Odisha, India. Field Crop. Res. 2019,241, 107578. [CrossRef]
20. Rose, D.C.; Sutherland, W.J.; Parker, C.; Lobley, M.; Winter, M.; Morris, C.; Twining, S.; Ffoulkes, C.; Amano, T.; Dicks, L.V.Decision support tools for agriculture: Towards effective design and delivery. Agric. Syst. 2016, 149, 165–174. [CrossRef]
21. Ridgway, J.P.; Robicsek, A.; Shah, N.; Smith, B.A.; Singh, K.; Semel, J.; Acree, M.E.; Grant, J.; Ravichandran, U.; Peterson, L.R. ARandomized Controlled Trial of an Electronic Clinical Decision Support Tool for Inpatient Antimicrobial Stewardship. Clin. Infect.Dis. 2021, 72, e265–e271. [CrossRef] [PubMed]
22. Burk-Rafel, J.; Reinstein, I.; Feng, J.; Kim, M.B.; Miller, L.H.; Cocks, P.M.; Marin, M.; Aphinyanaphongs, Y. Development andValidation of a Machine Learning-Based Decision Support Tool for Residency Applicant Screening and Review. Acad. Med. 2021,96, S54–S61. [CrossRef] [PubMed]
23. Eudaley, S.T.; Mihm, A.E.; Higdon, R.; Jeter, J.; Chamberlin, S.M. Development and implementation of a clinical decision supporttool for treatment of uncomplicated urinary tract infections in a family medicine resident clinic. J. Am. Pharm. Assoc. 2019, 59,579–585. [CrossRef]
24. Tan, A.; Durbin, M.; Chung, F.R.; Rubin, A.L.; Cuthel, A.M.; McQuilkin, J.A.; Modrek, A.S.; Jamin, C.; Gavin, N.; Mann, D.; et al.Design and implementation of a clinical decision support tool for primary palliative Care for Emergency Medicine (PRIM-ER).BMC Med. Inform. Decis. Mak. 2020, 20, 13. [CrossRef] [PubMed]
25. Taticchi, P.; Garengo, P.; Nudurupati, S.S.; Tonelli, F.; Pasqualino, R. A review of decision-support tools and performancemeasurement and sustainable supply chain management. Int. J. Prod. Res. 2015, 53, 6473–6494. [CrossRef]
26. Mokhtar, A.; Nasooti, M. A decision support tool for cement industry to select energy efficiency measures. Energy Strategy Rev.2020, 28, 100458. [CrossRef]
27. Turunen, V.; Sorvari, J.; Mikola, A. A decision support tool for selecting the optimal sewage sludge treatment. Chemosphere 2018,193, 521–529. [CrossRef]
28. Pınarbası, K.; Galparsoro, I.; Borja, Á.; Stelzenmüller, V.; Ehler, C.N.; Gimpel, A. Decision support tools in marine spatial planning:Present applications, gaps and future perspectives. Mar. Policy 2017, 83, 83–91. [CrossRef]
29. Bagstad, K.J.; Semmens, D.J.; Waage, S.; Winthrop, R. A comparative assessment of decision-support tools for ecosystem servicesquantification and valuation. Ecosyst. Serv. 2013, 5, 27–39. [CrossRef]
30. Al-Suhaibani, S.A.; Wahby, M.F. Farm tractors breakdown classification. J. Saudi Soc. Agric. Sci. 2017, 16, 294–298. [CrossRef]31. Asfarnia, F.; Asoodar, M.A.; Abdeshahi, A. The effect of failure rate on repair and maintenance costs of four agricultural tractor
models. Int. J. Agric. Biosyst. Sci. Eng. 2014, 8, 181–185.

Agriculture 2022, 12, 331 26 of 26
32. Lorencowicz, E.; Uziak, J. Repair Cost of Tractors and Agricultural Machines in Family Farms. Agric. Agric. Sci. Procedia 2015, 7,152–157. [CrossRef]
33. Dumler, T.J.; Burton Jr, R.O.; Kastens, T.L. Predicting farm tractor values through alternative depreciation methods. Rev. Agric.Econ. 2003, 25, 506–522. [CrossRef]
34. Fenollosa, M.; Guadalajara-Olmeda, M.N. An empirical depreciation model for agricultural tractors in Spain. Spanish J. Agric. Res.2007, 5, 130–141. [CrossRef]
35. Hansen, L.; Lee, H. Estimating farm tractor depreciation: Tax implications. Can. J. Agric. Econ. 1991, 39, 463–479. [CrossRef]36. Perry, G.M.; Bayaner, A.; Nixon, C.J. The effect of usage and size on tractor depreciation. Am. J. Agric. Econ. 1990, 72, 317–325.
[CrossRef]37. Wilson, P. Estimating tractor depreciation: The impact of choice of functional form. J. Farm Manag. 2010, 13, 799–818.38. Gaworski, M.; Józwiak, J. Analysis of tractor replacement effectiveness in the fruit farm. Ann. Warsaw Life Sci. Agric. 2012, 59,
99–106.39. Poozesh, M.; Mohtasebi, S.S.; Ahmadi, H.; Asakereh, A. Determination of appropriate time for farm tractors replacement based
on economic analysis. Elixir Control Eng. 2012, 47, 8684–8688.40. Cross, T.L.; Perry, G.M. Remaining Value Functions for Farm Equipment. Appl. Eng. Agric. 1996, 12, 547–553. [CrossRef]41. Guadalajara-Olmeda, N.; Fenollosa-Ribera, M.L. Modelos de valoración de maquinaria agrícola en el sur de Europa. Un análisis
de la depreciación real. Agrociencia 2010, 44, 381–391.42. Delen, D. Predictive Analytics: Data Mining, Machine Learning and Data Science for Practitioners; FT Press: Upper Saddle River, NJ,
USA, 2020; ISBN 0135946522.43. McCarthy, R.V.; McCarthy, M.M.; Ceccucci, W.; Halawi, L.; McCarthy, R.V.; McCarthy, M.M.; Ceccucci, W.; Halawi, L. Applying
Predictive Analytics; Springer: Berlin/Heidelberg, Germany, 2019; ISBN 978-3-030-14038-0.44. Fox, J.; Weisberg, S. Robust regression. In An R and S-Plus Companion to Applied Regression; SAGE: Newcastle upon Tyne, UK, 2002;
p. 91.45. Maronna, R.A.; Martin, R.D.; Yohai, V.J.; Salibián-Barrera, M. Robust Statistics: Theory and Methods (with R); John Wiley & Sons:
Hoboken, NJ, USA, 2019; ISBN 1119214688.46. Cross, T.L.; Perry, G.M. Depreciation patterns for agricultural machinery. Am. J. Agric. Econ. 1995, 77, 194–204. [CrossRef]47. Unterschultz, J.; Mumey, G. Reducing investment risk in tractors and combines with improved terminal asset value forecasts.
Can. J. Agric. Econ. 1996, 44, 295–309. [CrossRef]48. Dumler, T.J.; Burton, R.O., Jr.; Kastens, T.L. Use of alternative depreciation methods to estimate farm tractor values. In Proceedings
of the Annual Meeting of the American Agricultural Economics Association, Tampa, FL, USA, 30 July–2 August 2000.