A CROSS CULTURAL STUDY OF CONSUMER-BASED ...
434
WWW.BROOKES.AC.UK/GO/RADAR RADAR Research Archive and Digital Asset Repository A cross cultural study of consumer-based global brand equity in the restaurant industry Sung-Ho Han (2012) https://radar.brookes.ac.uk/radar/items/e5c59c0f-3f62-497f-b839-8fbad0549358/1/ Note if anything has been removed from thesis: Copyright © and Moral Rights for this thesis are retained by the author and/or other copyright owners. A copy can be downloaded for personal non-commercial research or study, without prior permission or charge. This thesis cannot be reproduced or quoted extensively from without first obtaining permission in writing from the copyright holder(s). The content must not be changed in any way or sold commercially in any format or medium without the formal permission of the copyright holders. When referring to this work, the full bibliographic details must be given as follows: Han, S-H, A cross cultural study of consumer-nased global brand equity in the restaurant industry, PhD, Oxford Brookes University
-
Upload
khangminh22 -
Category
Documents
-
view
5 -
download
0
Transcript of A CROSS CULTURAL STUDY OF CONSUMER-BASED ...

WWW.BROOKES.AC.UK/GO/RADAR
RADAR
Research Archive and Digital Asset Repository
A cross cultural study of consumer-based global brand equity in the restaurant industry
Sung-Ho Han (2012)
https://radar.brookes.ac.uk/radar/items/e5c59c0f-3f62-497f-b839-8fbad0549358/1/
Note if anything has been removed from thesis:
Copyright © and Moral Rights for this thesis are retained by the author and/or other copyright owners. A copy can be downloaded for personal non-commercial research or study, without prior permission or charge. This thesis cannot be reproduced or quoted extensively from without first obtaining permission in writing from the copyright holder(s). The content must not be changed in any way or sold commercially in any format or medium without the formal permission of the copyright holders.
When referring to this work, the full bibliographic details must be given as follows:
Han, S-H, A cross cultural study of consumer-nased global brand equity in the restaurant industry, PhD, Oxford Brookes University

i
A CROSS CULTURAL STUDY OF CONSUMER-BASED GLOBAL BRAND EQUITY
IN THE RESTAURANT INDUSTRY
SUNG HO HAN
A Thesis Submitted in Partial Fulfilment of the Requirements of the Award of Doctor of Philosophy
Faculty of Business Oxford Brookes University
September 2012

ii
ABSTRACT
Consumers in contemporary society are increasingly exposed to global restaurant
brands. As a result, global brand equity of restaurants has emerged as an essential
subject of study. Although building brand equity ensures economic benefits, only a
limited number of empirical studies are available in the context of the restaurant
industry. More importantly, despite differences in the concepts and measurements of
global and local brand equity, a great deal of research seems to have used the two
interchangeably. In order to distinguish between the two, this study proposes a
research model that compares consumers‘ value judgments across two cultures, and
that includes cultural values as an independent variable. The mediating variable,
Consumer-Based Global Brand Equity is examined from consumer-based and global
perspectives. Brand loyalty, which is an outcome of Consumer-Based Global Brand
Equity within the restaurant industry, is treated as a dependent variable. Additionally,
the research model proposes brand reputation as a dependent variable that plays an
important role in determining Consumer-Based Global Brand Equity.
The specific objectives of the present research are as follows. First, to conduct a
critical review of the literature on the antecedents and consequences of Consumer-
Based Global Brand Equity. Second, to develop a theoretical model to conceptualise
the relationship between antecedents and consequences of Consumer-Based Global
Brand Equity for restaurant brands across two cultures: British and South Korean.
Third, to assess the validity and reliability of the measurement scales for assessing
Consumer-Based Global Brand Equity, cultural values and brand loyalty across two
cultures. Finally, to examine the mediating role of Consumer-Based Global Brand
Equity between cultural values and brand loyalty in the restaurant industry.
To test this model, data is collected from consumers belonging to two different
cultures: British and South Korean. This study employs a mixture of quantitative and
qualitative research methods to capture the breadth and depth of the complex
mindsets of consumers. A survey is conducted with British and South Korean native
respondents and the data is analysed using SPSS.

iii
Prior to the survey interviews are used as a qualitative tool to obtain insight into
consumers‘ views regarding global restaurant brands.
Through the survey and analyses, several important findings of this research are
found. Firstly, validity and reliability of cultural values – Collectivism, Masculinity,
Uncertainty Avoidance, Power Distance, Long-Term Orientation and Materialism –
are confirmed. Secondly, the Consumer-Based Global Brand Equity scale is also
found to be valid and reliable: Brand Trust, Perceived Quality, Self-Congruence,
Brand Awareness, Brand Association, and Brand Identification. Compared to
previous research, the inclusion of cultural values and the other brand equity
dimensions in this study enables a more thorough investigation of the concept of
global brand equity. Moreover, the improved dimensions help in accurately measuring
the consumers‘ perceptions of a global brand. The results of this study partially
confirm the relationships between the dimensions of cultural values and Consumer-
Based Global Brand Equity. Furthermore, the results show that Consumer-Based
Global Brand Equity partially has a positive effect on brand reputation and brand
loyalty.
These results not only contribute to the development of a new research model on
Consumer-Based Global Brand Equity but also have practical and managerial
implications for the restaurant managers. The study also makes a significant
contribution to the measurement of Consumer-Based Global Brand Equity in the
restaurant industry and explores the relationship between the antecedents (cultural
values) and the consequences (brand reputation and brand loyalty) of Consumer-
Based Global Brand Equity. The comparison of cross-cultural data offers insights into
efficient strategies that can be used to enforce brand reputation and secure brand
loyalty in the global restaurant industry. Future studies can build on this model
through application to different cultural populations.

iv
A tremendous amount of knowledge and a wealth of
experience I gained throughout this research and invaluable experiences in a new environment will lead to higher
confidence in myself and every aspect of my life.
This thesis is dedicated to my dearest parents, wife, daughter and son. Their patience, support, understanding and love led to a successful completion of this study. Their precious love has
been my infinite motivation and source of energy.

v
ACKNOWLEDGEMENTS
The successful completion of my PhD thesis should be ascribed to the valuble
guidance and constant support provided by many people to whom I would like to
demonstrate my greatest appreciation and gratitude.
The greatest respectfulness and appreciation must be granted to my supervisors;
Professor Yuksel Ekinci gave me valuable guidance and comments whenever I
needed to make decisions throughout my PhD research. In particular, his erudite and
broad knowledge about hospitality marketing and research methodology is highly
appreciated. Dr. David Bowen provided me with a better understanding of consumer
behaviour in hospitality, and valuable encouragement and advice whenever I felt
difficulties in my research and adapting to a new, different culture and environment.
Furthermore, their sincere supervisions have helped me to achieve the remarkable
level of a mixture of quantitative and qualitative research methods and the across
cultural study with progressive and enthusiastic attitude.
Special thanks and appreciation should be paid to my dearest parents for their greatest
love, concerning and encouragement, and for trusting my ability to achieve my dream.
I wish to sincerely acknowledge the appreciation to Emeritus Professor Sang Mu Kim
who has provided me with valuable advice and encouragement. He helped me to
maintain an optimistic mindset which has always led to great confidence and positive
approach to my life.
I would like to express an honourable mention and my special gratitude to my dearest
family, my wife Mi Kyeong, son Sooyeon and daughter Hyun Jee for their precious
love and tremendous emotional support.

vi
LIST OF CONTENTS
Abstract………. ............................................................................................... ii Dedication……. .............................................................................................. iv Acknowledgement ............................................................................................ v List of Cotents… ............................................................................................. vi List of Tables….. ........................................................................................... xiv List of Figures... ........................................................................................... xvii
CHATPER 1 INTRODUCTION
1.1 Research Background ................................................................................. 2 1.2 Objectives of the Research ..............................................................................3
1.3 Structure of the Research .................................................................................4
CHAPTER 2 CONSUMER-BASED GLOBAL BRAND EQUITY
2.1 Introduction ................................................................................................ 8
2.2 Product versus Brand ................................................................................. 9
2.3 Definitions of a Brand .............................................................................. 11
2.4 Why is a Brand Necessary?...................................................................... 13
2.5 Definitions of Consumer-Based Brand Equity ........................................ 15
2.6 Academic Models of Brand Equity .......................................................... 18
2.6.1 Aaker‘s Brand Equity Model .................................................... 19
2.6.2 The Brand Power Model ........................................................... 22
2.6.3 Service Branding Model ........................................................... 25
2.7 Measurements of Brand Equity ................................................................ 28
2.7.1 Measurements of Consumer-Based Brand Equity .................... 29
2.7.1.1 Measurements of Consumer-Based Brand
Equity in the Hospitality Industry .................... 39
2.7.2 A Financial Approach to Brand Equity Measurements ............. 40
2.7.3 An Integrated Approach to Brand Equity Measurements ...... ...43
2.8 Importance of Global Brand Equity ......................................................... 45

vii
2.9 Components of Consumer-Based Global Brand Equity .......................... 48
2.9.1 Brand Trust ................................................................................ 49
2.9.1.1 Conceptualisation of Brand Trust ...................... 50
2.9.1.2 Measurements of Brand Trust ............................ 53
2.9.2 Brand Affect .............................................................................. 54
2.9.2.1 Conceptualisation of the Brand Affect ............... 55
2.9.2.2 Measurements of Brand Affect .......................... 56
2.9.3 Perceived Quality ...................................................................... 58
2.9.3.1 Perceived Service Quality .................................. 58
2.9.3.2 Conceptualisation of Perceived Quality ............. 59
2.9.3.3 Measurements of Service Quality. ..................... 65
2.9.4 Self-Congruence ........................................................................ 67
2.9.4.1 Self-Concept....................................................... 68
2.9.4.2 Conceptualisation of Self-Congruence .............. 68
2.9.4.3 Measurements of Self-Congruence ..................... 72
2.9.5 Brand Awareness ....................................................................... 76
2.9.5.1 Conceptualisation of Brand Awareness ................ 76
2.9.5.2 Measurements of Brand Awareness ..................... 77
2.9.6 Brand Association ..................................................................... 78
2.9.6.1 Conceptualisation of Brand Association .............. 79
2.9.6.2 Measurements of Brand Association ................... 81
2.9.7 Brand Identification .................................................................. 82
2.9.7.1 Social Identity Theory .......................................... 83
2.9.7.2 The Concept of Brand Identification ................... 84
2.9.7.3 Measurements of Brand Identification ................. 85
2.10 Summary.................................................................................................88
CHAPTER 3 ANTECEDENTS AND CONSEQUENCES OF
CONSUMER-BASED GLOBAL BRAND EQUITY
3.1 Introduction .............................................................................................. 90
3.2 Cultural Values as Antecedents of Global Brand Equity ......................... 90

viii
3.2.1 Definitions of Culture ............................................................... 91
3.2.1.1 The Concept of Cultural Values ......................... 93
3.2.1.2 National Culture versus Organisational Culture 95
3.2.2 Measurements of Cultural Values ............................................. 98
3.2.2.1 Hofstede‘s Model of Cultural Values ................. 98
3.2.2.2 Materialism as a cultural value ........................ 102
3.2.2.3 Measurements of Cultural Values .................... 102
3.3 Brand Reputation as a Consequence of Consumer-Based Global
Brand Equity ......................................................................................... 109
3.3.1 Brand Reputation .................................................................... 109
3.3.1.1 Definitions of Brand Reputation ...................... 110
3.3.1.2 Distinction between Reputation and Image ..... 112
3.3.1.3 The Role of Brand Reputation ......................... 114
3.3.1.4 Measurements of Brand Reputation ................. 115
3.4 Brand Loyalty as a Consequence of Consumer-Based Global
Brand Equity .......................................................................................... 119
3.4.1 Brand Loyalty ....................................................................... 119
3.4.2 Why is Brand Loyalty Important? ........................................ 120
3.4.3 Definitions of Brand Loyalty ................................................ 122
3.4.3.1 Behavioural Brand Loyalty .............................. 122
3.4.3.2 Attitudinal Brand Loyalty ................................ 124
3.4.3.3 Composite Brand Loyalty ................................ 125
3.4.4 Measurements of Brand Loyalty ........................................... 127
3.4.4.1 Measurements of Behavioural Brand Loyalty . 127
3.4.4.2 Measurements of Attitudinal Brand Loyalty .... 130
3.4.4.3 Measurements of Composite Brand Loyalty .... 134
3.5 Summary…... ............................................................................................. 137

ix
CHAPTER 4 THE RESEARCH MODEL
4.1 Introduction ................................................................................................ 140
4.2 Developing the Research Model ............................................................ 140
4.2.1 Findings of the Interviews: Qualitative Study ...................... 141
4.3 The Research Model .............................................................................. 145
4.4 Definitions of Variables ......................................................................... 147
4.4.1 Dimensions of Cultural Values ............................................. 147
4.4.2 Dimensions of Consumer-Based Global Brand Equity ........ 151
4.4.3 Dependent Variables:
Brand Reputation and Brand Loyalty ................................... 155
4.5 Hypothesis Development ....................................................................... 156
4.5.1 Effect of Cultural Values on Consumer-Based
Global Brand Equity .............................................................. 156
4.5.2 Effect of Consumer-Based Global Brand Equity on
Brand Reputation and Brand Loyalty .................................... 159
4.6 Summary… ................................................................................................. 164
CHAPTER 5 METHODOLOGY
5.1 Introduction ............................................................................................ 166
5.2 Research Philosophy .............................................................................. 166
5.2.1 Multiple Research Methods ................................................ 170
5.3 Sampling….. .......................................................................................... 172
5.3.1 Sampling methods ............................................................... 174
5.3.2 Method of Data Collection .................................................. 179
5.3.2.1 Fieldwork ......................................................... 179
5.4 Validity and Reliability of the Scale ...................................................... 181

x
5.5 Questionnaire Design ............................................................................. 183
5.5.1 Measurement of Variables .................................................. 187
5.5.1.1 Independent Variable: Cultural Values ............. 194
5.5.1.2 Consumer-Based Global Brand Equity ............ 195
5.5.1.3 Dependent Variables:
Brand Reputation and Brand Loyalty .............. 197
5.6 The Pilot Study ....................................................................................... 198
5.7 Data Analysis ......................................................................................... 198
5.7.1 Profiles of Participants ........................................................ 200
5.7.2 Factor Analysis ................................................................... 200
5.7.3 Reliability Analysis ............................................................. 202
5.7.4 Regression Analysis ............................................................ 202
5.7.5 t-Test ................................................................................... 203
5.7.6 ANOVA with a Post-hoc Test ............................................ 204
5.8 Summary…................................................................................................. 204
CHAPTER 6 FINDINGS
6.1 Introduction ............................................................................................ 207
6.2 Profiles of the Respondents .................................................................... 207
6.2.1 Profiles of the Whole Sample ............................................. 208
6.2.2 Profiles of the British Sample ............................................. 210
6.2.3 Profiles of the South Korean Sample .................................. 213
6.3 Validity and Reliability of Measures ..................................................... 216
6.3.1 Validity and Reliability of the Cultural Values Scale ......... 217
6.3.1.1 The Whole Sample ........................................... 217
6.3.1.2 Cross-Cultural Validity and Reliability of
the Cultural Values Scale ................................ 224
xi
6.3.1.2.1 The British Sample.......................... 224
6.3.1.2.2 The South Korean Sample .............. 227
6.3.1.3 Adjustments of the Measures ........................... 230
6.3.2 Validity and Reliability of the Consumer-Based Global
Brand Equity Scale ............................................................ 231
6.3.2.1 The Whole Sample ........................................... 231
6.3.2.2 Validity and Reliability of the Consumer-Based
Global Brand Equity Scale in Cross-Cultures . 237
6.3.2.2.1 The British Sample.......................... 237
6.3.2.2.2 The South Korean Sample .............. 241
6.3.2.3 Adjustments of the Measures ........................... 245
6.3.3 Reliability of the Brand Reputation Scale .......................... 246
6.3.3.1 The Whole Sample ........................................... 246
6.3.3.2 The British Sample ........................................... 246
6.3.3.3 The South Korean Sample ............................... 247
6.3.4 Reliability of the Brand Loyalty Scale ................................ 248
6.3.4.1 The Whole Sample ........................................... 248
6.3.4.2 The British Sample ........................................... 248
6.3.4.3 The South Korean Sample ............................... 249
6.4 Hypothesis Testing: Results of the Multiple Regression Analysis of the
Whole Sample .................................................................... 250
6.4.1 Effects of Cultural Values on Consumer-Based Global
Brand Equity ....................................................................... 251
6.4.2 Effect of Consumer-Based Global Brand Equity on
Brand Reputation ................................................................. 259
6.4.3 Effect of Consumer-Based Global Brand Equity on
Brand Loyalty ...................................................................... 262

xii
6.5 Testing of the Resaerch Model in the British and South Korean
Samples…… ........................................................................................ 264
6.5.1 Effects of Cultural Values on Consumer-Based Global
Brand Equity........................................................................ 265
6.5.2 Effect of Consumer-Based Global Brand Equity on
Brand Reputation ................................................................. 283
6.5.3 Effect of Consumer-Based Global Brand Equity on
Brand Loyalty ...................................................................... 286
6.6 Evalutation of Consumer-Based Global Brand Equity across
Demographics of the Whole Sample ................................. 289
6.6.1 Evaluation of Consumer-Based Global Brand Equity
by Demographic Characeristics of the Responents ........... 289 6.6.1.1 Evaluation of Consumer-Based Global
Brand Equity by Gender .................................. 289
6.6.1.2 Evaluation of Consumer-Based Global
Brand Equity by Marriage ................................ 290
6.6.1.3 Evaluation of Consumer-Based Global
Brand Equity by Age Group ............................. 291
6.6.1.4 Evaluation of Consumer-Based Global
Brand Equity by Income Group ....................... 294
6.7 Summary… ................................................................................................. 297
CHAPTER 7 DISCUSSION AND CONCLUSION
7.1 Introduction ........................................................................................... 300
7.2 Objectives of the Research ..................................................................... 300
7.3 Discussion of the Research Findings ..................................................... 301
7.3.1 The Cultural Value Scale .................................................... 301
7.3.2 The Consumer-Based Global Brand Equity Scale .............. 303

xiii
7.3.3 Antecedents and Consequences of Consumer-Based Global
Brand Equity in the British and South Korean samples .... 304
7.3.3.1Effects of Cultural Values on Consumer-Based
Global Brand Equity ........................................ 309
7.3.3.2 Effects of Consumer-Based Global Brand
Equity on Brand Reputation ............................. 311
7.3.3.3 Effects of Consumer-Based Global Brand
Equity on Brand Loyalty .................................. 312
7.4 Contributions of the Research ................................................................ 313
7.5 Practical and Managerial Implications ................................................... 315
7.6 Limitations and Future Research ........................................................... 323
Appendixes
Appendix A: Interview Questions ................................................................ 326
Appendix B: The Samples of Interview Transcript ..................................... 329
Appendix C: Initial Questionnaire ............................................................... 339
Appendix D: Revised Questionnaire ............................................................ 347
References…… ........................................................................................... 367

xiv
LIST OF TABLES
CHAPTER 2 ........................................................................................................
Table 2.1: Functions that Brands Fulfil ............................................................ 13
Table 2.2: Measurements of Consumer-Based Brand Equity .......................... 30
Table 2.3: Measurement of Financial Brand Equity ........................................ 42
Table 2.4: Integrated Approaches for Brand Equity Measurements ................ 44
Table 2.5: The SERVQUAL Dimensions ........................................................ 65
Table 2.6: Recent Studies Investigating the Relationship between Self-Image
Congruity and Consumer Behaviour ................................................................ 74
CHAPTER 3 ........................................................................................................
Table 3.1: Hofstede‘s Cultural Dimensions ..................................................... 99
Table 3.2: Measurements of Cultural Values ................................................. 103
Table 3.3: Distinction between Reputation and Image .................................. 112
Table 3.4: Measurements of Brand Reputation .............................................. 117
Table 3.5: Measurements of Behavioural Brand Loyalty .............................. 129
Table 3.6: Measurements of Attitudinal Brand Loyalty ................................. 132
Table 3.7: Measurements of Composite Brand Loyalty ................................. 135
CHAPTER 5 Table 5.1: Assumptions of the Main Paradigms ............................................ 168
Table 5.2 Probability and Non-probability Sampling Designs ........................ 177
Table 5.3 Measurement of Variables ................................................................. 188

xv
CHAPTER 6 ........................................................................................................
Table 6.1: Results of Factor Analysis for the Cultural Values Scale
(British & South Korean) ............................................................................... 218
Table 6.2: Reliability of the Cultural Values Scale
(British & South Korean) ............................................................................... 222
Table 6.3: Results of Factor and Reliability Analyses for the Cultural Values
Scale (British) ................................................................................................. 225 225
Table 6.4: Results of Factor and Reliability Analyses for the Cultural Values
Scale (South Korean) ...................................................................................... 228
Table 6.5: Results of Factor Analysis for the Consumer-Based Global
Brand Equity Scale (British & South Korean) ............................................... 232
Table 6.6: Reliability of the Consumer-Based Global Brand Equity Scale
(British & South Korean) ............................................................................... 236
Table 6.7: Result of Factor and Reliability Analyses for the Consumer-Based
Global Brand Equity Scale (British) ............................................................... 238
Table 6.8: Result of Factor and Reliability Analyses for the Consumer-Based
Global Brand Equity Scale (South Korean) ................................................... 242
Table 6.9: Reliability of the Brand Reputation Scale
(British & South Korean) ............................................................................... 246
Table 6.10: Reliability of the Brand Reputation Scale (British) .................... 247
Table 6.11: Reliability of the Brand Reputation Scale (South Korean) ......... 247
Table 6.12: Reliability of the Brand Loyalty Scale
(British & South Korean) ............................................................................... 248
Table 6.13: Reliability of the Brand Loyalty Scale (British) ......................... 249
Table 6.14: Reliability of the Brand Loyalty Scale (South Korean) .............. 249

xvi
Table 6.15: Effect of Cultural Values on Brand Trust and Perceived
Quality…. ....................................................................................................... 252
Table 6.16: Effect of Cultural Values on Self Congruence and Brand
Awareness ....................................................................................................... 255
Table 6.17: Effect of Cultural Values on Brand Association and Brand
Identification ................................................................................................... 258
Table 6.18: Effect of Consumer-Based Global Brand Equity on Brand
Reputation ....................................................................................................... 261
Table 6.19: Effect of Consumer-Based Global Brand Equity on Brand
Loyalty ............................................................................................................ 263
Table 6.20: Effect of Cultural Values on Brand Trust ................................... 266
Table 6.21: Effect of Cultural Values on Perceived Quality .......................... 269
Table 6.22: Effect of Cultural Values on Self Congruence ............................ 272
Table 6.23: Effect of Cultural Values on Brand Awareness .......................... 275
Table 6.24: Effect of Cultural Values on Brand Association ......................... 278
Table 6.25: Effect of Cultural Values on Brand Identification ...................... 281
Table 6.26: Effect of Consumer-Based Global Brand Equity on Brand
Reputation ....................................................................................................... 284
Table 6.27: Effect of Consumer-Based Global Brand Equity on Brand
Loyalty ............................................................................................................ 287
Table 6.28: Analysis of CBGBE by Gender: t-Test ....................................... 290
Table 6.29: Analysis of CBGBE by Marital Status: t-Test ............................ 291
Table 6.30: Analysis of CBGBE by Age: ANOVA with Post-hoc Test ........ 292
Table 6.31: Analysis of CBGBE by Income: ANOVA with Post-hoc Test ... 295

xvii
LIST OF FIGURES
CHAPTER 1
Figure 1.1 Structure of the Thesis ...................................................................... 5
CHAPTER 2
Figure 2.1 Product and Brand ........................................................................... 10
Figure 2.2 Brand Equity ................................................................................... 20
Figure 2.3 Brand Power Model ........................................................................ 23
Figure 2.4 Service Branding Model ................................................................. 26
Figure 2.5 Service Quality Model .................................................................... 61
Figure 2.6 Hierarchy of Priorities: The Management of Interactive Service
Quality .............................................................................................................. 63
Figure 2.7 Different Forms or Types of Self-Congruity and Attitude Change
or Persuasion .................................................................................................... 70
Figure 2.8 Brand Association Model................................................................ 80
CHAPTER 3
Figure 3.1 Components of Culture ................................................................... 94
Figure 3.2 The Balance of Values and Practices for Various Levels of
Culture…. ......................................................................................................... 97
CHAPTER 4
Figure 4.1 Research Model ............................................................................. 146
CHAPTER 5
Figure 5.1 Research Choice ............................................................................ 171

xviii
Figure 5.2 Sampling Process .......................................................................... 173
Figure 5.3 Classification of Sampling ............................................................ 175
Figure 5.4 Process of Questionnaire Design .................................................. 185
Figure 5.5 Data Analysis Procedure ............................................................... 199
CHAPTER 6
Figure 6.1 Gender Distribution of the Respondents in the Whole Sample .... 208
Figure 6.2 Age Group Distribution of the Respondents in the Whole
Sample ............................................................................................................ 208
Figure 6.3 Distribution of Annual Personal Income of Respondents in the
Whole Sample........ ........................................................................................ 209
Figure 6.4 Main Purpose for Restaurant Visit in the Whole Sample ............. 210
Figure 6.5 Gender Distribution of British Respondents ................................. 211
Figure 6.6 Age Group Distribution of British Respondents ........................... 211
Figure 6.7 Distribution of Annual Personal Income of British Respondents . 212
Figure 6.8 Main Purpose for Restaurant Visit in the British sample .............. 213
Figure 6.9 Gender Distribution of South Korean Respondents ...................... 214
Figure 6.10 Age Group Distribution of South Korean Respondents ............. 214
Figure 6.11 Distribution of Annual Personal Income of South Korean
Respondents .................................................................................................... 215
Figure 6.12: Main Purpose for Restaurant Visit in the South Korean sample 216
CHAPTER 7
Figure 7.1 Summary of Final Research Model (British) ................................ 305
Figure 7.2 Summary of Final Research Model (South Korean) ..................... 306

CHAPTER 1

-2-
CHAPTER 1
INTRODUCTION 1.1 Research Background In modern society, mass media, internet growth and cross-border tourism have led
people to take a keen interest in other cultures and understand them in depth (Holt,
Quelch and Taylor, 2004). Moreover these factors have contributed towards
understating of cultural homogeneity (Levitt, 1983). In this kind of environment,
people in different nations have held common symbols and global brands are one of
the important symbols (Holt et al., 2004).
Brand globalisation is beneficial for the competitiveness of brands (Kapferer, 2008).
This is because the perceived globalism influences brand preferences, and is viewed
as an indicator of quality and increased status (Holt, Quelch and Taylor, 2003).
In global marketing, branding strategy can play an important role in acquiring
sustainable advantages (Wang, Wei, and Yu, 2008). Branding adds value to an
elementary service or product (Knox and Bickerton, 2003) and enables a producer to
offer products with a unique or superior quality (Motameni and Shahrokhi, 1998).
Thus, the branding promotes brand preference and loyalty (Knox and Bickerton,
2003).
Although marketing researchers have shown a recent interest in branding, the
majority of the studies have focused on tangible goods, rather than on service-
oriented brands (Turley and Moore, 1995). However, some researchers argue that the
intangible attributes of a service make it hard for consumers to assess service quality,
which makes branding more vital for services than for products (Krishnan and
Hartline, 2001). Service-oriented brands need tangible clues that help consumers view
them as less of a risky purchase (Onkvisit and Shaw, 1989). Here, branding can play
an important role in allowing companies to build trust with consumers (Berry, 2000).
This is one of the reasons that branding has become a key driver of the restaurant
industry worldwide.

-3-
One of the most important goals of marketing and brand investment is to build brand
equity (Keller, 1998). Strong brands help marketers achieve distinct competitive
advantages (Keller, 1993). They are also an important asset in marketing, which
reflect the company‘s standing (Simões and Dibb, 2001). They are especially
important in service companies because they can efficiently reduce consumers‘
perceptions of risk when selecting a service (Berry, 2000).
Marketing managers want to extend their market to cover many regions to capitalise
on the brand equity that has been already acquired (Wang et al., 2008). However,
brand extension is often challenging because marketers may not be familiar with the
culture and consumer preferences in different regions. Hence, understanding local
culture is an essential factor of global marketing.
Culture has emerged as a key determinant of the success of global marketing
(Kapferer, 2008). In fact global marketing now revolves around cultural values and
the behaviour of local consumers (Yoo, 2009). Creating global brands and gaining
brand equity across cultures are important for a robust marketing strategy in today‘s
competitive business environment (Yoo and Donthu, 2002). Given this background,
the purpose of this study is to contribute to a better understanding of global brand
equity in the restaurant industry.
1.2 Objectives of the Research The aim of the research is to develop and test a consumer-based global brand equity
model for the restaurant industry. The objectives of the study are as follows:
1) To conduct a critical review of the literature on antecedents and
consequences of Consumer-Based Global Brand Equity.
2) To develop a theoretical model to conceptualize the relationship between
antecedents and consequences of Consumer-Based Global Brand Equity for
restaurant brands across two cultures: British and South Korean.
3) To assess the validity and reliability of the measurement scales for assessing

-4-
Consumer-Based Global Brand Equity, cultural values and brand loyalty
across two cultures.
4) To examine the mediating role of Consumer-Based Global Brand Equity
between cultural values and brand loyalty in the restaurant industry.
1.3 Structure of the Research This thesis consists of seven chapters. Figure 1.1 illustrates structure of the research.

-5-
Figure 1.1 Structure of the Thesis
Chapter 1
Introduction
Chapter 4
The Research Model
r
The Research Framework
Chapter 5
Methodology
Chapter 6
Findings
Chapter 7
Discussion and Conclusion
Chapter 2
Literature Review 1: Consumer-Based Global Brand
Equity
Chapter 3
Literature Review 2: Antecedents and Consequences of
Consumer-Based Global Brand Equity
-6-
Chapter 2 presents a literature review of the concept of brand equity. This includes a
comparison between brands and products, definitions of brands and consumer-based
brand equity, the necessity of a brand, the importance of global brand equity and
measurements as well as components of Consumer-Based Global Brand Equity
(CBGBE).
Chapter 3 reviews existing literature for the antecedents and consequences of
CBGBE in the context of the restaurant industry. The present study focuses on cross-
cultural perspectives and proposes that cultural values can be useful as antecedents of
CBGBE. This chapter also examines brand loyalty and brand reputation as
consequences of CBGBE. These represent efficient ways for understanding
consumption psychology in a cross-cultural study.
Chapter 4 presents the results of interviews conducted to identify missing variables.
A research model, based on the outcomes of these interviews, is formulated, which
includes the missing variables and explains the relationships between the variables.
This chapter also defines the variables and presents the research propositions used for
the empirical study.
Chapter 5 deals with the research methodology, including the research philosophy,
the sampling process, the validity and the reliability of the scale, the questionnaire
design for the quantitative study, the measurement of the variables and the methods of
data analysis.
Chapter 6 discusses the findings of the study.
Chapter 7 provides overall discussion, contributions, limitations and suggestions for
future research.

-7-
CHAPTER 2

-8-
CHAPTER 2
CONSUMER-BASED GLOBAL BRAND EQUITY
2.1 Introduction Creating and maintaining brand is essential in today‘s competitive marketing
environment, and brand equity is the outcome of efficient investment in branding
activities (Seetharaman et al., 2001). Brand equity has recently emerged as one of the
key factors of marketing (Buil, de Chernatony and Martinez, 2008) because of its
necessity and value. In particular, the evaluation of brand equity presents an efficient
way to assess management performance, which is responsible for the growing interest
in the concept shown by managers, accountants and researchers (Richards, Foster and
Morgan, 1998).
This chapter consists of eight sections that review the literature on the concept of
brand equity. The first section (2.2) reviews concepts related to brands and products.
The second section (2.3) offers insights into the definitions of the brand from three
different perspectives. The third section (2.4) explains the necessity of a brand. This
enhances our in-depth understanding of brands. The fourth section (2.5) presents the
definitions of consumer-based brand equity, which is a key focus of the study. This
section offers a better understanding of the brand equity concept by inspecting,
categorising and reviewing previous research on this topic. The fifth section (2.6)
provides knowledge about the academic models of brand equity. These models offer
further evidence for conceptualisation of the research model. The sixth section (2.7)
focuses on the measurements of brand equity. This is important not only to develop
new measurement for this study but also to conduct relevant empirical research. The
seventh section (2.8) shows why Consumer-Based Brand Equity (CBGBE) is
important for this study by shedding light on its academic and practical considerations.
The final section (2.9) examines the components of CBGBE in detail.

-9-
2.2 Product versus Brand
Before defining a brand, it is very important to differentiate between a brand and a
product. Although the terms ‗brand‘ and ‗product‘ have different meanings, in
practice they are often used interchangeably. However, it is necessary to distinguish
between product and brand.
Aaker (1996:73) defines brand and product by comparing their attributes:
―A product includes characteristics such as scope, attributes, quality/value and uses, while a brand includes not only these product characteristics but also brand users, country of origin, organisational associations, brand personality, symbols, brand-customer relationships, emotional benefits and self-expressive benefits.‖
Orth, Mcdaniel, Shellhammer and Loptcharat (2004) supported Aaker‘s (1996)
definition by stating that the difference between a brand and a product is that a
product provides a practical benefit while a brand enforces the intangible value of a
product through a name, symbol, and so on. In other words, a product is part of a
brand that has an intangible value, which is beyond the functional value of the
product (Orth et al., 2004). Stephen King from WPP Group, London, differentiates a
brand from a product (Seetharaman, Nadzir and Gunalan, 2001) in the following
words: a product, something which is manufactured in a factory, can be copied by
competitors and can become outdated quickly; whereas a brand, bought by a
consumer, is unique and unlike products, it is timeless if the brand is successful.
Seetharman et al. (2001) highlight the significance of brand personality and
association to distinguish between a brand and a product: a product is merely the
general term, whereas a brand has personality and certain associations that represent a
meaning to a person, which has been shaped by that person‘s experience. Figure 2.1
shows the relationship between product and brand.

-10-
Figure 2.1 Product and Brand
Source: Kapferer (2008:41)
Kapferer (2008) suggests that one of the key functions of brands is to reassure
customers about the benefits they desire to gain through purchasing the product. As
shown in Figure 2.1, Kapferer (2008) defines a ‗halo effect‘ in the relationship
between a product and a brand. The ‗halo effect‘ is ―a major source of value created
by the brand: the fact that knowing the name of the brand influences consumer‘s
perception of the product advantages beyond what the visible cues had themselves
indicated‖ (Kapferer, 2008:41). Moreover, Kapferer highlights that intangible
associations stemming from a brand‘s values, philosophy, vision, and so on, are
attached to the brand, and these associations, in turn, lead to emotional ties that go
beyond product satisfaction.
Overall, the relationship between a brand and a product lends more clarity to the two
concepts. A product provides functional benefits like visible characteristics, whereas a
brand has intangible values such as brand personality, symbols, emotional benefits
and product attributes (Aaker, 1996a). These observations make a theoretical
contribution to a better understanding of the nature of a brand.
In order to have a better understanding of the brand, the next section reviews some
key definitions of the term ‗brand‘.
Branded product
Brand‘s intangible values and imagery Product‘s visible and
differentiating characteristics Halo effect
Brand aspiration Product satisfaction Expectations

-11-
2.3 Definitions of a Brand
A brand can be defined from three perspectives: the consumer‘s perspective, the
owner‘s perspective (Wood, 2000) and the comprehensive perspective. Hence, the
present research reviews the concept from different perspectives.
The producer-based definition, when combined with the purpose of the product,
recognises a brand as a tool for sales in terms of marketing. Anderson and Bennett
(1988:18) defines brand as ―a name, term, design, symbol or any other feature that
identifies one seller‘s goods or services as distinct from those of other sellers.‖ In this
definition the key words are ‗any other features‘, which indicate intangible elements
such as image (Wood, 2000). Wood adds that it is the intangible elements of a brand
that enable differentiation, which is the basic purpose of a brand.
Clearly, a brand is the consequence of organisational strategic behaviour such as
market segmentation and product differentiation (Kapferer, 2008). This view is
supported by stating that every strategic activity of a firm has a potential effect on the
brand, and it should be co-ordinated to produce a brand that is line with the
stakeholders‘ desires (Miller and Muir, 2004). In this approach, producers regard the
brand as a differentiating device, an image in the consumers‘ minds, a relationship
adding value, an identity system, a personality, an evolving entity and an asset (de
Chernatony and Riley, 1997).
The second definition of a brand considers the views of the consumers. A brand is
able to generate trust for its products and services and also allows the consumers to
create an asset of products or services in their minds by adding to the perceived value
(Kapferer, 2008). From the consumer‘s point of view, a brand is the accumulation of
the consumers‘ past experiences (Kapferer, 2004). In other words, consumers
recognise a brand and obtain some information about it by experiencing the product
or service (Keller, 1998).
Oliver (1980) argues that a brand is closely linked to expectation and satisfaction of
the consumers. In line with this view, Ambler and Styles (1996:10) define a brand as

-12-
―the promise of the bundles of attributes that someone buys and that provides
satisfaction. These attributes that make up a brand may be real or illusory, rational or
emotional, tangible or invisible.‖ This view is based on the notion that the attributes a
brand derives from all of the components of the marketing mix are liable to
interpretation by the customers (Wood, 2000). In this approach, a brand is central to
the consumers‘ emotions, experiences and satisfaction. Hence, consumers consider a
brand as a visual identifier, a shorthand device, a guarantee of consistent quality and
an expression of the self (de Chernatony and Riley, 1997).
The comprehensive perspective considers both the producer‘s and the consumer‗s
perspectives. The majority of brand definitions focus on the brand‘s benefits for either
the seller or the customer. However, an integrated definition not only helps a brand‘s
owner emphasise a brand‘s purpose but also considers how this is accomplished
through consumer satisfaction and benefits (Wood, 2000). According to Wood (2000)
the purpose of a brand is attaining competitive advantages for companies through
differentiation, and the features that make the brand different from others lead a
consumer to willingly pay a premium because of its benefits and satisfaction.
A brand signals the origins of a product to the consumer, and protects the producer
and the consumer from competitors who try to offer similar products in the market
(Aaker, 1991). The comprehensive perspective serves as a general definition that
considers both the producers‘ and the consumers‘ needs.
In summary, all the perspectives can play an important role in clarifying the meaning
and the identity of the brand itself. However, one of the drawbacks of the producer-
based definitions is that they are too product-oriented (Wood, 2000) and focus on
sellers‘ profits, disregarding the consumers‘ needs. The present study considers the
consumer‘s definition of a brand. This is more closely related to brand equity, which
is the focal point of this study. Brands are important to consumers because consumers
are the main targets of marketing strategies; and they play a decisive role in
purchasing a product. The following section sheds light on the need for a brand: why
is a brand necessary?

-13-
2.4 Why is a Brand Necessary?
One of the key benefits of a brand is that it can serve as a valuable symbol of many
benefits to both consumers and manufacturers (Keller, 1998). A brand is a useful tool
to explain how consumers decide to purchase a product or service before
experiencing it (Aaker, 1996a). A brand serves a variety of functions not only for
producers in marketing but also for consumers, by aiding their purchasing decisions
(Keller, 1998). The functions of a brand are listed in Table 2.1.
Table 2.1: Functions that Brands Fulfil
Source: Keller (1998:7)
As shown in Table 2.1, brands fulfil important functions in a complex marketplace.
Kapferer (2008:22) states that by providing the following functions a brand can serve
as a catalyst for consumer purchase: ―identification, practicality, guarantee,
optimisation, badge, continuity, hedonistic, and ethical.‖ Thus, although a brand is
intangible, it can play a positive role in uncovering the hidden qualities of the goods
(Kapferer, 2008). Hence, when consumers purchase goods, brands help them by
preventing social and psychological losses (DelVecchio, 2000). With regard to
invisible attributes, Kapferer (2008) suggests that one of the key functions of brands
CONSUMERS
Identification of source of product
Assignment of responsibility to product maker
Risk reducer
Search cost reducer
Promise, bond or pact with maker of product
Symbolic device
Signal of quality
MANUFACTURERS
Means of identification to simplify handling or tracing
Means of legally protecting unique features
Signal of quality level to satisfied customers
Means of endowing products with unique associations
Source of competitive advantage
Source of financial returns

-14-
is to reassure consumers about the benefits that can be gained through purchasing the
product. Further, brands offer other symbolic benefits to the consumer (Grace and
O‘Cass, 2002). That is, they are representative of status and prestige. Purchasing
brands allows consumers to obtain a psychological prestige and status from owning
high valued items (Cravens and Piercy, 2006).
For manufacturers, a brand functions as a sign for trade, a recognition signal and a
guarantee of the product quality, thus enabling a manufacturer to understand his or
her own brand (Kapferer, 2008). A brand is regarded as intellectual property (Keller,
2008). Thus, they offer legal protection to the manufacturers against imitation (Aaker,
1991). In addition, a brand endows products with unique associations (Keller, 1998).
Through this unique association, which ranges from product attributes to more
emotional, image-oriented value, brands develop differentiation (Davis, 2002). A
strong brand with competitive differentiation profits from a great degree of loyalty
that leads to more stable future sales. (Kapferer, 2008).
Another perspective that justifies the need for a brand pertains to the internal
functions that it fulfils for an organisation. According to Davis (2002), a strong brand
motivates employees within the company and enables them to take pride in their work.
It also boosts employee satisfaction. Employees who have pride in their organisation
naturally contribute to the company‘s value, success and achievement of goals (Aaker,
1996).
Thus, a brand has a variety of uses for both consumers and manufacturers. It helps a
consumer make a more effective buying decision by signalling certain product
characteristics (Keller, 1998). At the same time, it enables manufacturers to build a
competitive advantage and earn sustainable profits (Keller, 1998). Further, a brand
not only provides functional value but also offers symbolic meaning (Kapferer, 2008).
The signalling function of a brand is reflective of brand equity (Erdem and Swait,
1997). An evidence of brand equity is when consumers are aware of the brand and
perceive its quality (Seetharaman et al., 2001). The next section reviews definitions of
brand equity from the consumer perspective.

-15-
2.5 Definitions of Consumer-Based Brand Equity
Brand equity has become one of the most popular topics among brand managers
(Aaker, 1991) as studies have shown that brand equity can positively influence a
company‘s long-term and sustainable benefits (Pappu and Quester, 2006). However,
despite growing interest in the topic, there has been no consensus on the concept of
brand equity.
The term ‗brand equity‘ is the outcome of an effort to define the relationship between
consumers and the brand in marketing literature (Wood, 2000). Brand equity can be
described as the value added to a product or service by a brand name (Farquhar, 1998).
Aaker (1991:15) defines brand equity as ―a set of brand assets and liabilities linked to
a brand, its name and symbol, that add to or subtract from the value provided by a
product or service to a firm and/or to that firm‘s customer.‖ Although a number of
different definitions of brand equity have been proposed, it is widely accepted that
brand equity refers to the ‗added value‘ endowed to goods as a result of past
investment in the brand (Keller, 1998).
The concept of brand equity has been studied from various points of view (Farquhar,
1989; Aaker 1991). Capon et al. (2001) categorise equity into ‗customer brand equity‘
and ‗organizational brand equity‘. Kim and Kim (2005) used three classifications:
‗consumer-based perspective‘, ‗financial perspective‘ and ‗comprehensive
perspective‘, which incorporates the concepts of consumer-based brand equity and
firm-based brand equity.
From a financial perspective, brand equity indicates the differences in consumers‘
responses to marketing activities (Taylor, Hunter and Lindberg, 2007). Feldwick
(1996) explains brand equity as the whole value of a brand as a separable asset. The
value of a brand refers to the guarantee of future cash flows (Wood, 2000). Simon and
Sullivan (1993:29) define brand equity as ―the incremental cash flows which accrue
to branded products over and above the cash flows which would result from the sale
of unbranded products.‖ Simon and Sullivan suggest that brand equity can be
estimated by estimating the company‘s future cash flows. This contrasts with the

-16-
more standard assessment method based on stock prices (Myers, 2003). A financial
perspective is useful for brand acquisition, franchising or royalty calculations;
however, since the 1990s, the definition of brand equity has shifted its focus to the
‗non-financial‘ version (Chen, 2007).
In marketing, brand equity research has largely focused on consumer-based
perspectives, rather than firm-based. The consumer-based approach analyses why
brand equity is necessary for consumers. It is based on cognitive psychology centred
on the consumer‘s memory (Aaker, 1991; Keller, 1993). According this approach, a
brand stands for a consumer‘s perceptions and feelings about advantages that the
branded product or service offers (Kotler, Armstrong, Wong and Saunders (2008).
Brand equity measures the strength of the consumers‘ attachment to a brand. Hence it
is defined as ‗consumers‘ favouritism towards the focal brand in terms of their
preference, purchase intention and choice among brands in a product category that
offers the same level of product benefits (Yasin, Noor and Mohamad, 2007:39).
Therefore, building brand equity in the minds of the consumers is strongly associated
with their assessment, feelings, perceptions and experiences. Moreover, marketing
activities connected with consumption can efficiently serve to build such equity.
Keller (1993:2) defines consumer-based brand equity as ―the differential effect of
brand knowledge on consumer response to the marketing of the brand.‖ That is,
consumer-based brand equity operates when the consumer recognises the brand as a
result of the marketing activities, which promote favourable or strong brand
associations that are retained in the minds of the consumer. This definition is
supported by stating that brand equity is the difference in consumer responses
towards an unbranded product and a focal brand that have the same product attributes
and receive the same level of marketing stimulation (Yoo and Donthu, 2001). They
add that the difference in the minds of the consumer can be attributed to the brand
name, which substantiates the effects of brand-related marketing in the long run.
Erdem and Swait (1997) emphasise that consumer-based brand equity is regarded as
the value of a brand sign offered to consumers, which is based on the credibility
gained through the interactions between companies and consumers. Thus, consumers

-17-
can reduce uncertainties when choosing a brand through a credible signal that assures
them that the company will deliver the promised benefits (Bailey and Ball, 2006).
In addition to these consumer-based definitions of brand equity, it is essential to gain
an understanding of the brand to ensure that the marketing programme will lead
consumers to favour that brand (Keller, 1993). That is, the marketing mix, which
strengthens the meaning of brand and is combined with brand, encourages the brand
to adapt to the desires of the targeted market (Wood, 2000). Brand equity and the
response from consumers are important aspects to be assessed by managers (Lassar,
Mittal and Sharma, 1995). This is why managers should participate in the creation of
a brand that will serve to enhance brand strength or brand loyalty (Wood, 2000).
The comprehensive perspective of brand equity incorporates both the consumer-based
and the company-based definitions. This approach considers the insufficiencies in
analysing brand equity from just two perspectives (Kim and Kim, 2005). Motameni
and Shahrokhi (1998) suggest that the value of brand equity can be estimated by
combining the marketing and financial approach.
The definition of brand equity also depends on the context (Bailey and Ball, 2006).
For instance, one such context is the restaurant industry. A number of empirical
studies have focused on the consumer-based brand equity of services (Kim and Kim,
2005). Muller (1998) proposes three key factors that influence brand equity in the
restaurant industry: quality of service and products, establishing a symbolic and
enduring image and execution of service delivery. Muller adds that restaurants can
charge a premium and enhance brand loyalty by combining these three elements.
Branding plays an important role in service companies because a strong brand enables
consumers to better visualise the benefits and earns their trust (Berry, 2000). In the
restaurant industry, brand equity can reduce consumer‘s risk at the time of choosing a
restaurant.
The above discussion highlights that brand equity refers to intangible values
associated with a product or service (Francois and MacLachlan, 1995). Both the
consumer-based perspective and the finance-based perspective serve as the main
theoretical and practical foundations of the concept of brand equity. However, it is
-18-
necessary to clarify the differences between a consumer-based definition, a financial
definition and a comprehensive definition. A consumer-based definition is based on
the effects of the brand on the individual consumer (Keller, 1993). A financial
definition is based on the incremental cash flows (Kim and Kim, 2005). A
comprehensive definition combines the above perspectives of brand equity. While a
number of researchers have defined consumer-based brand equity, very few have
examined brand equity from either financial or comprehensive perspectives.
In conclusion, the present research adopts Kim and Kim‘s (2005) consumer-based
definition of brand equity, which can be applied in the restaurant industry. There are
obvious differences between the brand equities of services and products, mainly
because of the intangible and heterogeneous attributes of services. A consumer-based
definition of brand equity is appropriate for this study for the following reasons.
Service companies have adopted a consumer-based approach to brand equity. Using a
similar approach in this study will facilitate a comparison between the results of the
present study and those reported in literature. Further, the data needed to examine
brand equity from a financial perspective are confidential, and therefore inaccessible
(Taylor, Hunter and Lindberg, 2007). The consumer-based definitions of brand equity
contend that (1) the value of a brand must be assessed by consumers (Atilgan, Aksoy,
and Akinci, 2005), and that (2) equity is the result of consumers‘ awareness of the
brand and their ability to associate it with some favourable, strong and unique
feelings (Keller, 1993). Both these aspects of brand equity are relevant to the
restaurant industry. Service in restaurants is an intangible attribute, which is evaluated
by consumers‘ perceptions and value judgements.
This discussion gives rise to an interesting question: what comprises brand equity? In
the next section, academic models of brand equity examine the various components
of brand equity.
2.6 Academic Models of Brand Equity
Since the 1980s, brand equity has emerged as one of the most important intangible

-19-
assets for companies (Leon, Rao, Keller, Luo, McAlister and Srivastava, 2006). Over
the years, many different academic models of brand equity have been proposed by
many researchers. An academic model captures the knowledge structure of brand
equity and allows researchers to explore the ways in which consumers perceive and
assess brands. An academic model for consumer-based brand equity proposes a
number of fundamental premises (Leon et al., 2006:126):
―The power of a brand lies in the minds of consumers and what they have experienced, learned and felt about the brand over time; Brand equity can be thought of as the ‗added value‘ endowed to products in the thoughts, words and actions of consumers; There are many different ways that this added value can be created for a brand; and there are also many different ways the value of a brand can be manifested or exploited to benefit the firm.‖
Several notable models are explained in the following sections.
2.6.1 Aaker’s Brand Equity Model
Aaker (1991) proposes one of the most commonly and widely accepted models. In
this model, brand equity is composed of five components: brand awareness, brand
association, perceived quality, brand loyalty and other proprietary brand assets. These
components offer various benefits and value to the company. Figure 2.2 shows the
key components of brand equity.

-20-
Figure 2.2: Brand Equity
Source: Aaker (1991:270)
Anchor to which other Associations can be Attached Familiarity – Liking Signal of Substance/Commitment Brand to be Considered
Provides Values to Consumer by Enhancing Consumer‘s: Interpretation/
Processing of Information
Confidence in the
Purchase Decision Use Satisfaction
Other Proprietary
Brand Assets
Brand Associations
Provides Value to Firm by Enhancing: Efficiency and
Effectiveness of Marketing Programmes
Brand Loyalty Prices/Margins Brand extension Trade Leverage Competitive
Advantage
Reason-to-buy Differentiate/Position Price Channel Member Interest Extensions
BRAND EQUITY
Brand Loyalty
Brand Awareness
Perceived Quality
Reduced Marketing Costs Trade Leverage Attracting New Consumers Create Awareness Reassurance Time to Respond to Competitive Threats
Competitive Advantage
Help Process/ Retrieve Information Differentiate/ Position Reason-to-buy Create Positive Attitude/Feelings Extensions

-21-
Association is an important element of brand equity. Aaker (1996) suggests that brand
association not only helps consumers retrieve information but also aids brand
differentiation and brand extension. Furthermore, it influences the consumer‘s
purchase decision and elicits positive feelings. Individual experiences and
communication, such as advertising and word-of-mouth, lead consumers to adopt a
keen interest in purchasing a brand. Strong brand associations motivate consumers to
increase their purchasing of brands.
Awareness is a factor of brand equity that affects consumers‘ perceptions and attitudes
(Aaker, 1996). Aaker adds that brand awareness may operate at two different levels.
At the recognition level, it can offer the brand a sense of familiarity and a sign of
commitment. At the recall level, it has an effect on the choice of brands that attract
the interest of the consumers. Creating and maintaining awareness is crucial because
consumers always consider brands that have high awareness when they decide to buy
a product (Hoyer and Brown, 1990).
Perceived quality contributes to value creation by providing reasons to purchase,
differentiating between brands or supporting a higher price strategy (Aaker, 1996).
Perceived quality can be defined as the ―perceived ability of a product to provide
satisfaction ‗relative‘ to the available alternatives‖ (Monroe and Krishnan, 1985:212).
Individuals choose important attributes as comparison criteria for a product or service,
and quality is an important subjective measure (Baldauf, Cravens and Binder, 2003).
Brand loyalty creates value by reducing marketing costs as drawing new consumers is
much more costly than maintaining existing ones (Aaker, 1996). Loyal consumers
constantly favour a brand and refrain from switching to other brands (Grover and
Srinivasan, 1992). Therefore, brand loyalty is linked to an increase in sales and profits
generated by the brands (Aaker, 1996).
The components of brand equity offer value to consumers by increasing the
consumers‘ interpretation/processing of information, and also confidence in the
buying decision and satisfaction.

-22-
As a consequence, Aaker‘s model has served as the basis for much study of
consumer-based brand equity. It also combines both perceptional and behavioural
dimensions, which can be used to predict marketplace behaviour (Myers, 2003).
However, some researchers regard brand loyalty as a consequence of brand equity
(e.g. Na, Marshall and Keller, 1999; Kayaman and Arasli, 2007). Aaker‘s model, too,
which is based on the consumer perspective, needs to be adjusted for use in the
restaurant industry.
2.6.2 The Brand Power Model Keller‘s (1993) approach to brand equity is also based on the consumer-based
perspective. He proposes two stages of equity—awareness level and image level—
that lead to a brand assessment. Figure 2.3 displays the brand power knowledge
relevant to consumer-based brand equity.


-24-
As shown in Figure 2.3, the brand power model shows that brand power can be
generated by a variety of components. It is clear that brand power is created in a
complex structure and interactions between components are necessary to produce a
new power. According to Figure 2.3, brand equity is based on two principal
dimensions, namely brand awareness and brand image.
Awareness is associated with the strength of the brand node in the consumer‘s
memory, simply measured by recognition and recall (Na et al., 1999). Brand image is
―perceptions about a brand as reflected by the brand associations held in consumer
memory‖ (Keller, 1993:3). Brand image involves the measurement of consumer‘s
perceptions of the value and benefits, which leads to the forming of a particular image
in the consumer‘s mind (Na et al., 1999). Thus, the antecedents of brand image range
in levels of abstraction from attribute data to perceptions of benefits (Na et al., 1999)
and values, and these three levels should interact (Zeithaml, 1988). The creative
process of image power begins with ‗intrinsic‘ (e.g. corporate level, category level
and brand-specific level) and ‗extrinsic‘ sources (e.g. price, level of advertising and
warranty) (Na et al., 1999).
Na et al. (1999) propose that image is a chunk of information that is developed by
consumers and this chunk is composed of multiple aspects of the brand. Therefore, a
multi-attribute approach is necessary to evaluate brand equity. In addition, they add
that during product evaluation, extrinsic cues and intrinsic cues are interrelated in the
consumer‘s mind.
Thus, Na et al. (1999) share a different view from Aaker (1991). The brand power
model offers refreshing new insights into brand equity through a well-organised
process, and the three levels of attributes of this model are useful in determining the
antecedents of brand equity.
In summary, even though Aaker‘s (1991) and Keller‘s (1993) concepts of brand
equity are different, their definitions of brand equity are rooted in the consumer-based
perspective and they consist of similar dimensions for measuring consumer-based
brand equity (Kayaman and Arasli, 2007). Their measures are a common measure of
consumer-based brand equity. Hence, many scholars have employed Aaker‘s and

-25-
Keller‘s (1993) measurements. However, before employing a model in research, it is
necessary to consider the model‘s generalisability across different markets (Yoo and
Donthu, 2002). Given the recent trend for the creation of global brands, cross-cultural
validation of the brand equity model is important to ensure success in the global
market. Moreover, in order to formulate a global brand equity model, other
components along with those proposed by Aaker and Keller need to be considered.
2.6.3 Service Branding Model
To date, a number of brand equity models have been proposed by researchers but
most models are centred on the brands of products (Turley and Moore, 1995).
Although some researchers have developed models that can be applied to branding of
both services and products, a model solely dedicated to service branding needs to be
developed to account for the differences between products and services (Berry, 2000).
Figure 2.4 shows a branding model in the service industry.

- 26 -
Figure 2.4: Service Branding Model
Primary Impact
Secondary Impact
Source: Berry (2000:130)
Company‘s Presented Brand
External Brand Communications
Customer Experience with Company
Brand Awareness
Brand Meaning
BRAND
EQUITY

- 27 -
Figure 2.4 shows that the components of a service brand include the following:
presented brand, external brand communication, consumer experience, brand
awareness, brand meaning, brand equity and also the relationships between these
components.
Berry (2000) asserts that brand equity consists of two types of components: brand
awareness and brand meaning. Berry argues that the primary source of brand
awareness is the company‘s presented brand, which refers to the firm‘s controlled
communication, including service facilities, advertising, network of service providers,
the firm‘s name and logo. The secondary source of brand awareness is the external
brand communication, which is uncontrolled information consumers receive about the
service of the company, e.g. through word-of-mouth communications and public
relations.
Brand meaning refers to the consumer‘s predominant perceptions about the brand,
which promptly surface to the consumer‘s mind at the mention of the brand (Berry,
2000). In addition, Berry asserts that even though the company‘s presented brand and
external brand communication have an influence on brand meaning, brand meaning is
primarily affected by the consumer‘s experience with the company because
experience-based beliefs are stronger in the service industry. Clearly, service quality
is an important factor affecting the consumer‘s experiences (Alexandris, Dimitriadis
and Markata, 2002; Alexandris, Zahariadis, Tsorbatzoudis and Grouios, 2004).
Moreover, external brand communications have an influence on expected service
(Gronroos, 1984).
In the restaurant industry, the physical environment and the behaviour of the staff in
delivering services are crucial, because these, too, play an important role in satisfying
consumer desires (Ekinci, Dawes and Massey, 2008). Hence, the evaluation of brand
equity in the restaurant industry depends heavily on the quality of service experienced
by the consumer. Berry‘s model analyses how the antecedents of brand equity play a
role within the service industry. Moreover, the model is valuable in understanding the
complex structure between brand equity and its antecedents. Brand meaning based on
consumers‘ experience is shown to be the primary impact of brand equity. Thus, to
build a strong brand in the restaurant industry, it is essential to focus more on the

- 28 -
consumers‘ actual experience with the service than on the presented brand and the
external brand. This is why, in the current research, the perceived quality of service
brand as based on actual experience has been included as an important factor.
The following section reviews the measurements of brand equity as described in
earlier research models.
2.7 Measurements of Brand Equity To develop marketing strategies that align with consumers‘ values, the measurement
of brand equity should accurately evaluate consumers‘ perceptions of the brands.
Aaker (1996) argues that these measurements should be modified and improved, as
brand equity varies across brands, product categories and markets. He adds that
developing credible and sensitive measures for brand equity is very important.
Moreover, given that a large number of brands today are manufactured in one country
but sold in others, the measurement of brand equity should reflect the variations
across countries in an international context (Shocker, Srivastava and Ruekert, 1994).
A variety of perspectives can be used to measure brand equity, which is a
multidimensional concept. From, a consumer perspective, brand equity is reflected in
measures that determine the intangible value of brands in the minds of consumers.
Secondly, although only a limited amount of research has adopted a financial
perspective, financial measures such as cost, profit, sales and margins can be used to
evaluate brand equity (Aaker, 1996). Finally, under the comprehensive approach
brand equity is assessed as the value of brand as perceived by the consumers and the
firm.
The following section discusses the measurements of brand equity from a consumer-
based perspective, from a financial angle and via an integrated approach.

- 29 -
2.7.1 Measurements of Consumer-Based Brand Equity Experts argue that measurement of consumer-based brand equity is the most efficient
method to assess brand asset and the performance of brands. This is relevant not only
to consumers who purchase a brand but also to managers and marketers who evaluate
the performance of brands and formulate powerful strategies. Consumer-based brand
equity includes two multi-dimensional concepts: brand strength and brand value
(Srivastava and Shocker, 1991). Brand strength is derived from perceptions and
behaviours of consumers, while brand value is the financial outcome of the
management‘s ability to leverage brand strength by offering future profits (Kim and
Kim, 2005). Table 2.2 summarises previous research on the measurements of
consumer-based brand equity.

-30-
Table 2.2 Measurements of Consumer-Based Brand Equity
Researcher Dimensions of
Brand Equity
Applied
Area
Measurement
Scale
Analysis
Methods Key Findings
Aaker
(1991)
Brand awareness
Brand loyalty
Perceived quality
Brand associations
Brand awareness, perceived quality and brand association
can all strengthen brand loyalty by increasing consumer
satisfaction and providing reasons to purchase the goods.
Keller
(1993)
Brand knowledge:
Brand awareness
Brand image
Brand knowledge can be conceptualised in accordance with
an associative network memory model in the light of brand
awareness and brand image.
Lassar et al.
(1995)
Performance
Social Image
Value
Trustworthiness
Attachment
Television
monitors
Watches
7-point
scale
Exploratory
factor analysis
Confirmatory
factor analysis
Correlation
A scale of 17 items has been developed to measure
consumer-based brand equity. This scale can help firms
evaluate their marketing strategies and programmes, as well
as the marketing mix elements of a brand.

-31-
Researcher Dimensions of Brand
Equity
Applied
Area Measurement
Scale
Analysis
Methods
Key Findings
Prasad and
Dev (2000)
Brand performance
Brand awareness Hotels
5-point
scale
The authors have developed a hotel brand equity
index, which can be used by marketers to evaluate
a brand‘s power.
Yoo and
Donthu
(2001)
Brand loyalty
Perceived quality
Brand awareness/
associations
Camera
films
Athlethic
shoes
Television
sets
5-point
likert
scale
Confirmatory
factor analysis
( LISREL8 maximum
l likelihood
method
This new measure is reliable and valid as well as
parsimonious. However, the generalisability of the
measure is limited because it has been applied to
only in a few cultures and to a few product
categories.
Baldauf et
al. (2003)
Brand Awareness
Perceived quality
Brand loyalty
Tile
5-point
and
7-point
Likert
scale
Exploratory
fator analysis
R Reliability Analysis
Confirmatory
factor analysis
R Regression Analysis
Brand awareness, perceived quality and brand
loyalty are important determinants of brand
profitability, brand market performance, consumer
value and purchase intentions.

-32-
Researcher Dimensions of
Brand Equity
Applied Area Measurement
Scale
Analysis
Methods Key Findings
Bamert and
Wehrli
(2005)
Service quality
Athlethic shoes
Financial services
Telecommunication
services,
Internet trader
7-point
likert-type
scale
Exploratory
factor analysis
Cronbach‘s
reliability
In the consumer goods markets, consumer service can
be regarded as a marketing activity that affects the
dimensions of brand equity.
Pappu,
Quester and
Cooksey
(2005)
Brand
awareness
Brand
association
Perceived
quality
Brand loyalty
Cars Televisions
Dichotomous
scale
11 likert-type
scale
Exploratory
factor analysis
Confirmatory
factor analysis
Maximum
likelihood
estimation
method
Studies have demonstrated that in the light of product
category-country associations, differences appear in
the minds of consumers.

-33-
Researcher Dimensions of
Brand Equity Applied Area Measurement
Scale
Analysis
Methods Key Findings
Kim and Kim
(2005)
Brand awareness
Brand loyalty
Perceived quality
Brand image
Hotel
Restaurant
7-point likert
scale
Factor analysis
with principal
components
(varimax
rotations)
Stepwise
regression analysis
The results of this research have shown that three
dimensions other than brand awareness play a key
role in determining brand equity. In luxury hotels and
restaurant chains, there exists a positive relationship
between the dimensions of consumer brand equity
and a company‘s performance.
Chen (2007)
Loyalty,
Perceived quality
Brand association
Brand awareness
Other proprietary
brand asset
Consumer
electrics
Ballpoint pen
7-point
semantic
differential
scales
t-test
ANOVA
MANOVA
The source channel has a significant effect on brand
equity. Of the five brand equity dimensions,
perceived quality is the most common concern
among consumers. More importantly, the effect of
the source channel on consumer evaluations of brand
equity is stronger than product involvement.

-34-
Researcher Dimensions of
Brand Equity Applied Area Measurement
Scale
Analysis
Methods Key Findings
Yasin et al.
(2007)
Prerceived quality
Brand loyalty
Brand awareness
Brand association
Television
Refrigerator
Air-
conditioners
Exploratory
factor analysis
Regression
analysis
Factor analysis of brand equity dimensions has
identified three components: brand distinctiveness,
brand loyalty and brand awareness/associations. As
a result of the study, the brand‘s country-of–origin
image positively affects brand equity.
Kayaman and
Arasli
(2007)
Brand loyalty
Perceived quality
Brand image
Brand awareness
Hotel
Industry
5-point likert
scale
Cronbach‘s alpha
Correlation
Confirmatory
factor analysis
Path Analysis
Brand awareness is not a significant factor of
consumer-based brand equity in the research model
for hotels.

-35-
Researcher Dimensions of
Brand Equity
Applied
Area Measurement
Scale
Analysis
Methods Key Findings
Wang et al.
(2008)
Corporation ability
association
Brand awareness
Quality perception
Brand resonance
Brand extensibility
Price flexibility
Repulchase intentions
Shampoo
Computers
Super-
markets
Qualitative
(Content analysis)
Quantitative
(confirmatory
factor alysis,
correlations,
reliability,
path analysis)
Brand awareness and corporation ability
association both affect perception of quality.
Quality perception has a positive influence on
brand extensibility, brand resonance and price
flexibility.

-36-
Researcher Dimensions of
Brand Equity Applied Area Measurement
Scale
Analysis
Methods Key Findings
Buil et al.
(2008)
Brand awareness
Perceived quality
Brand loyalty
Brand association
(Perceived value,
brand personality,
organisational
association)
Soft drink
Sportswear
Consumer-
electronics
Cars
7-point
likert
scale
Exploratory
factor analysis
Confirmatory
factor analysis
Across two cultures, the scale of brand equity has
been shown to be invariant and having similar
dimensionality.
Nam, Ekinci
and Whyatt
(2011)
Physical quality
Staff behaviour
Ideal
self-congruence
Brand
identification
Lifestyle-
congruence
Hotel
Restaurant
7-point
likert
scale
Confirmatory
factor analysis
Structural
equations
modelling
The impacts of staff behaviour, ideal self-congruence
and brand identification on brand loyalty are partially
mediated by consumer satisfaction; On the other
hand, consumer satisfaction fully mediates the
impacts of physical quality and lifestyle congruence
on brand loyalty.

-37-
Based on Table 2.2, previous research on the measurement of consumer-based
brand equity is discussed as follows.
Aaker‘s (1991, 1996) theory offers insights into the creative aspects of a brand.
In the context of brand equity, his work on the conceptualisation of consumers‘
perceptions, attitudes and behaviours has positively contributed to other research
studies. According to Aaker (1996:103-104) ―brand equity measures should (1)
reflect the construct being measured, (2) reflect constructs that truly drive the
market, (3) be sensitive to detect changes of brand equity, and (4) be applicable
across brands, product categories and markets.‖ Aaker (1991, 1996) proposes
brand awareness, perceived quality, brand associations and brand loyalty as
dimensions of brand equity. Many researchers have applied these dimensions to
their studies. Aaker‘s (1991) approach is highly useful for measurement of brand
equity in different areas; however, to accurately estimate it, the measures should
be adjusted according to the market, competitors and product categories.
Although Aaker (1991) and Keller (1993) conceptualise brand equity in different
ways, they define brand equity from the perspective of consumer memory–based
brand associations (Pappu et al., 2005). Keller (1993) argues that brand equity
comprises two components: brand awareness and brand image. Keller explains
that brand awareness consists of brand recognition and brand recall whereas
brand image is related to associations maintained in the consumer‘s memory.
The views put forward by Aaker (1991) and Keller (1993) have been supported
by Yoo and Donthu (2001). Yoo and Donthu developed a multidimensional scale
for measuring consumer-based brand equity and evaluated its psychometric
properties. Their measure was based on Aaker‘s and Keller‘s brand equity
dimensions and it covers three dimensions: brand loyalty, perceived quality and
brand awareness/associations. Brand association and brand awareness are
combined into one. Yoo and Donthu (2001) discuss several important
implications of their scale: firstly, the measures are valid and reliable. Secondly,
they can be used to investigate how consumer-based brand equity is influenced
by factors such as marketing activity, purchase behaviour and brand knowledge.
Thirdly, the measures can be employed to examine the consequences of brand

-38-
equity, and finally, they can aid research on brand extensions. Thus, marketers or
managers can understand the success or failure of a brand by using the measures
developed by Yoo and Donthu (2001) to evaluate brand performance.
Pappu et al. (2005) remark that current available measurement scales contained
some limitations such as the lack of a clear difference between the dimensions
of brand awareness and brand association and the use of student samples. The
result of their research supports Aaker‘s (1991) and Keller‘s (1993)
conceptualisation of brand equity. In addition, it indicates that brand awareness
and brand association are two distinct dimensions of brand equity. This contrasts
with the findings of Yoo and Donthu (2001). They included brand personality in
the scale to measure consumer-based brand equity and sampled actual
consumers instead of students (Pappu et al., 2005).
Baldauf et al. (2003) confirm Aaker‘s views by examining whether the
dimensions of brand equity—brand awareness, brand loyalty and perceived
quality—are significant determinants of a company‘s performance and
consumers‘ values. Their concept of brand equity is based on a part of Aaker‘s
original model.
Buil et al. (2008) use the four brand equity dimensions of Aaker (1991) to
investigate the cross-nation applicability of this measurement. Brand recall,
familiarity and recognition are used for measuring brand awareness and brand
loyalty is used for measuring attitudinal loyalty. Moreover, the brand
associations include brand personality, perceived value and organisational
associations.
Lassar et al. (1995) develop an instrument for measuring consumer-based brand
equity, which is different from Aaker‘s (1991). Their consumer-based brand
equity scale is based on five dimensions of consumer-based brand equity:
performance, value, social image, trustworthiness and commitment.
The above discussion indicates that operationalisations of consumer-based brand
equity can be usually categorised into two groups (Yoo and Donthu, 2001):

-39-
cognitive brand equity (brand awareness, brand association, perceived quality)
and behavioural brand equity (brand loyalty, willingness to pay a high price)
(Kim and Kim, 2005). However, Lassar et al. (1995) assert that consumer-based
brand equity is central to only consumer perception, excluding behavioural
dimensions, and this differs from Aaker‘s inclusive definition (Kim and Kim,
2005). A consumer‘s consumption psychology including satisfaction and its
antecedents for a service has a strong relationship with brand loyalty (Chitty,
Ward and Chua, 2007). The measures of consumer-based brand equity need to
be tailored to the objective of the research for an accurate evaluation.
In the following section, the measurements of consumer-based brand equity will
be explained in the context of the hospitality (restaurant) industry.
2.7.1.1 Measurements of Consumer-Based Brand Equity in
the Hospitality Industry Marketing research models are used to access the core of consumers‘ mindsets
for studying consumer behaviour related to service management (Bowen, 2008).
As Table 2.2 shows, Prasad and Dev (2000) developed a consumer-centric index
of hotel brand equity based on their estimation of brand awareness and
performance. They view brand equity as a measure rooted in a range of
consumer-satisfaction criteria. In addition, brand performance is measured by
overall consumer satisfaction with product or service, brand preference and
price-value perception; whereas brand awareness is measured by brand recall.
Kayaman and Arasli (2007) examine the relationship between the individual
elements of consumer-based brand equity and the applicability of the suggested
scale in measuring consumer-based brand equity for the hotel industry.
Interestingly, they report that brand awareness is not explained significantly as a
consumer-based brand equity dimension for hotels, which is similar to the
results found by Kim and Kim (2005). However, the majority of studies
demonstrate that brand awareness is an important dimension for consumer-based

-40-
brand equity (e.g. Prasad and Dev, 2000; Baldauf et al., 2003; Pappu et al.,
2005; Wang et al., 2008).
Kim and Kim (2005) claim that brand equity of chain restaurants consists of
four dimensions: brand image, brand loyalty, perceived quality and brand
awareness. They add that brand image and brand loyalty feature prominently in
the brand equity of restaurant chains, whereas perceived quality, brand loyalty
and brand image are rated highly in the hotel sector.
Nam, Ekinci and Whyatt (2011) explore brand equity of hotels and restaurants in
the UK, using a British sample. They explore the five dimensions of physical
quality, staff behaviour, ideal self-congruence, lifestyle-congruence and brand
identification. In their model, service quality is composed of physical quality
and staff behaviour, and lifestyle-congruence has been generated as a dimension.
This review of literature indicates that service quality is an important dimension
of brand equity in the hospitality industry. Consumers normally rely on their
experience when purchasing a service because of its intangible characteristics.
Service quality plays a key role in shaping the consumer‘s experience.
Perceived quality offers value to consumers by differentiating the brand from
competing brands and by giving consumers a reason to purchase (Kayaman and
Arasli, 2007). It is well known that service brands have characteristics (e.g.
intangibility and perishability) that are different from those of tangible products.
Hence, while evaluating brand equity of a service brand, it is necessary to
develop measures that can account for the attributes of a service. More
specifically, the present research deals with global brand equity in the restaurant
industry. Therefore, robust measures are necessary to enable the evaluation of
the global brand equity of restaurant brands (see 2.8 and 2.9).
2.7.2 A Financial Approach to Brand Equity Measurements
A financial approach to brand equity is ―based on incremental cash flows earned

-41-
as a result of owning a brand—the brand‘s contribution to the business (Kim and
Kim, 2005:551).‖ In this perspective, a company‘s brand equity is estimated
through the financial market value-based technique (Simon and Sullivan, 1993).
Financial measures are needed to reassure investors of the value of their long-
term investments (Barwise, 1993). The investors can evaluate the quality of the
firm‘s performance through the financial model, which provides a standard set
of financial measures(Krambia-Kapardis and Thomas, 2006). Krambia-Kapardis
and Thomas (2006:6) propose the following financial measures: ―the efficiency
of production, the value of stocks and work in progress, and the return on
investments made.‖ Common financial measures centre on stock price or brand
replacement (Bamert and Wehrli, 2005). Previous research with regard to the
measurement of financial brand equity is summarised in Table 2.3.

-42-
Table 2.3 Measurement of Financial Brand Equity
Researcher Dimensions of
Brand Equity Applied Area
Analysis
Methods Key Findings
Simon and
Sullivan (1993)
Manufacturing
industries
Tobin‘s Q
Brand equity = intangible asset – (nonbrand factors +
anticompetitive industry structure)
Companies with high brand equity have significant brand
names. These companies have high macro estimation of brand
equity, while micro measurement of changes in brand equity is
affected by marketing decisions and market events.
Source: Adapted from Kim and Kim (2005: 553)

-43-
Simon and Sullivan (1993) empirically analyse methodologies used to assess a
company‘s brand equity. They use ‗Tobin‘s Q‘ as the technique for extracting the
value of brand equity from the financial market value of the company. The
authors suggest that this technique is useful for two purposes: firstly, the macro
approach evaluates brand equity at the company level and provides an objective
value of the brand of the company; and secondly, the micro approach assesses
changes in brand equity at the level of individual brands and analyses how major
marketing decisions affect brand equity.
In contrast with consumer-based brand equity, which focuses on the perceptions
of consumers, financial-based brand equity is rooted in ‗cash flows‘ (Kim and
Kim, 2005). Accordingly, as financial measures, researchers collect ‗financial
market accounting and store-level scanner data without contacting consumers‘
(Yoo and Donthu, 2001:2).
2.7.3 An Integrated Approach to Brand Equity Measurements
The integration of brand equity measurements refers to the use of a combination
of marketing and financial perspectives. Table 2.4 summarises previous findings
in relation to an integrated approach for measuring brand equity.

-44-
Table 2.4 Integrated Approaches for Brand Equity Measurements
Researcher Dimensions of
Brand Equity Applied Area Analysis Methods Key Findings
Motameni
and Shahrokhi
(1998)
Brand strength
(customer base potency,
competitive potency,
global potency)
Brand net earnings
Traditional net present
value (NPV) methods
The proposed global brand equity valuation model assesses
the value of a brand by incorporating the marketing and
finance perspectives. It reveals that the sources of value hold
important practical implications for marketers.
Farquhar
(1989)
Brand equity represents the ‗added value‘ that a brand
attaches to a product from the firm‘s perspective, trade‘s
perspective, and consumer‘s perspective..

-45-
Although many marketers describe brand equity in behavioural terms, it is important
to know what consumer mental state causes what behaviour change (Ambler, 1997).
Hence Motameni and Shahrokhi (1998) and Farquhar (1989) propose a
comprehensive model to estimate the brand equity.
This approach intended to compensate the insufficiencies of both the consumer-based
and the financial perspectives. However, for most research objectives, either of these
perspectives is usually appropriate. The consumer-based perspective is more widely
used because consumer-based equity causes incremental financial profit to the
company (Lassar, 1995) and helps managers and marketers to understand how their
marketing programs and activities improve their brand‘s value in the consumers‘
memory (Keller, 1993).
The following section discusses the importance of global brand equity.
2.8 Importance of Global Brand Equity The twenty-first century marketplace is characterised by rapid globalisation (Lee,
Knight and Kim,2008). Accordingly, consumers can purchase the same brands
throughout the world (Hassan, Craft and Kortam, 2003). Brand equity previously
acquired for the regional extension of markets is intended to be used by marketing
managers (Wang et al., 2008). Global brands have several advantages because of their
status and prestige, moreover, widespread coverage of market can reduce advertising
costs (Motameni and Shahrokhi, 1998). An increase in the number of global brands
has ushered in the importance of global brand equity and has highlighted the need for
developing a model of global brand equity (Wang et al., 2008).
Global brand equity is important for several reasons. To begin with, it positively
influences management performance (Aaker, 1996). Strong brands can provide their
companies with distinct growth advantages (e.g. resist competitive action, attract new
consumers) and enhance their profitability (e.g., brand loyalty, lower advertising
ratios, premium pricing) (Keller, 1998).

-46-
The strong relationship between brand equity and management performance of a
company has been well documented (Aaker, 1996). This idea is also supported by the
notion that evaluating brand equity is necessary for assessing brand performance (Yoo
and Donthu, 2001). Amber (1997) highlights the importance of global brand equity by
stating that although applications of the marketing strategy may not produce
immediate improvement in brand performance, it will increase the image of global
brand equity, which will result in future profits.
Srivastava and Shocker (1995) believe that global brand equity should be evaluated in
terms of both brand strength and brand value. Brand strength is linked to brand
association, whereas brand value refers to the gains that accumulate when brand is
strengthened (Lassar et al., 1995). The author adds that global brand value is the
result of a brand name being strongly related to its financial performance in the global
context. The value of global brand equity is associated with the complicated mindsets
of consumers, which includes value judgements and attitudes towards purchasing.
Global brand equity captures the incremental value added to goods by a brand name
(Srivastava and Shoker, 1991). Brand equity is derived from the consumers‘ greater
trust in the brand, prompted by the brand‘s strength and associations, when compared
against its competitors (Lassar et al., 1995). This trust leads consumers to pay a
premium for purchasing the brand (Lassar et al., 1995). In addition, a precise
comprehension of brand equity can enhance a company‘s marketplace advantage and
competitiveness (Erdem and Swait ,1997) as well as its financial performance (Lassar
et al., 1995).
Secondly, global brand equity can reveal the degree of efficiency in the marketing
programs (Aaker, 1991). A good understanding of brand equity can help in improving
the outcomes of marketing activities (Keller, 1993). Marketing activities will be more
effective if consumers are familiar with the brand (Aaker, 1991). Marketers will be
able to improve the effectiveness of brand strategies by ensuring high recall of their
brands in the minds of consumers (Keller, 1993).
Third, strong brands offer their companies with an opportunity for successful
extensions (Lassar et al., 1995). In other words, brand equity may be an important
factor in extending the brand through line extensions or co-branding (Washburn, Till

-47-
and Priluck, 2000). A global brand has high prestige, and thus the ability to compete
against other brands in new and different markets (Kapferer, 2008). Further, the
awareness and identity of a global brand can reduce the costs and risks of placing a
new product in a new market (Aaker, 1996b).
Lastly, global brand equity can help consumers interpret products and brands and
obtain information on them (Aaker, 1991). Moreover, it can also influence the
consumer‘s confidence about purchasing a product (Aaker, 1991). The credibility of a
brand gained by global brand equity can raise consumers‘ expectations about the
brand‘s quality due to a perception of reduced risk (Erdem and Swait, 1997).
Consumers who have confidence in a firm will purchase its products or services
continuously. Brand equity increases attitude strength towards a brand, which is an
important determinant of brand purchase.
In summary, a substantial amount of recent research deals with the intangible values
of brand. Researchers are highly interested in investigating the complex mindsets of
consumers, particularly in relation to global brand equity. The concept of global brand
equity is linked to a consumer‘s interpretation of information, consumer satisfaction
(Aaker, 1996a) and greater confidence (Lassar et al., 1995). It also increases a firm‘s
financial performance (Aaker, 1996a).
Global brand equity can serve as an effective way to evaluate marketing activities that
target global markets (Prasad and Dev, 2000). Through considering cultural diversity,
the strategy of building global brand equity is good to overpower competitors. That is,
glocalisation can be an effective strategy when it comes to dealing with both
worldwide considerations and specific cultures of each country (Maynard, 2003).
Further, a marketing programme, which includes advertising, can help to strengthen
the brand‘s association in the minds of global consumers (Keller, 1993). In particular,
advertising can enhance brand familiarity, which leads the growth of global brand
equity. Thus global brand equity can enhance brand loyalty and aid the purchasing
intention of consumers. It also plays a key role in a brand‘s profitability performance.
The above sections discussed the definitions of consumer-based brand equity,
academic models of brand equity, measurements of brand equity and importance of

-48-
global brand equity. The following section reviews the components of global brand
equity.
2.9 Components of Consumer-Based Global Brand Equity A considerable amount of research has been directed towards identifying the
components of consumer-based brand equity and to establish a common basis for
further study. Many researchers have explored the components of brand equity: brand
loyalty, brand awareness, perceived quality, brand association and other proprietary
brand assets (Aaker, 1991; Yoo and Donthu, 2001; Baldauf et al., 2003; Pappu et al.,
2005; Chen, 2007; Yasin et al., 2007; Buil et al., 2008) (see Table 2.2). To examine
the brand equity of luxury hotels and chain restaurants, Kim and Kim (2005) use
brand loyalty, brand awareness, perceived quality and brand image. The same
components are used by Kayaman and Arasli (2007) in their model for hotels. Nam et
al. (2011) identify physical quality, staff behaviour, ideal self-congruence, brand
identification, and lifestyle-congruence as the components of the hospitality brand
equity.
These factors represent the dimensions of brand equity across industries. Three of
these dimensions-brand awareness, brand associations and perceived quality-have
been widely accepted and studied as the major components by many researchers
Aaker (1991, 1996) indentifies both perceptual and behaviour dimensions. More
specifically, Aaker views brand loyalty as a behavioural dimension; and brand
awareness, brand association and perceived quality as cognitive dimensions.
However, Lassar et al. (1995) view brand loyalty as a consequence of brand equity.
They consider only perceptual dimensions as brand equity, thus excluding behaviour
dimensions, such as brand loyalty. Keller (1998) argues that the habit of purchasing a
specific brand cannot be equated with brand loyalty. Hence, Keller also states that
brand loyalty should not be used as a component of brand equity. In keeping with the
argument of Lassar et al. (1995) and Keller (1998), the present study employs brand
loyalty as one of the consequences of brand equity.

-49-
To be successful, a brand should satisfy both the consumers‘ functional needs and
symbolic needs (Kapferer, 1997). Self-congruence and brand identification are linked
to symbolic consumption of the restaurant brands (e.g. Johnson, Herrmann and Huber,
2006; Kim, Han and Park, 2001). Self-congruence also plays a role in the evaluation
of global brands because culture influences consumer behaviour (Focht, Maloles III,
Swobida, Marschett and Sinha, 2008). Moreover brand identification leads to brand
loyalty because consumers choose a brand that allows them to belong to a certain
group (Kuenzel and Halliday 2010). Thus, both self-congruence and brand
identification play an important role in success of restaurant brands.
Inculcating brand trust is one of the most important characteristics of a global brand.
For instance, with regard to the restaurant industry, brand trust can lead consumers to
believe that almost all aspects of a particular restaurant chain will be identical,
irrespective of the country in which that restaurant is located. As a result, they are
likely to have no hesitation in dining there.
Brand affect is also a significant dimension in the service industry. In the restaurant
industry, in particular, to engender brand loyalty, it is important for consumers to
forge strong emotional bonds with the staff or with the restaurant (Chaudhuri and
Holbrook, 2001).
This study considers brand trust, brand affect, self-congruence, brand awareness,
brand associations, perceived quality and brand identification as components of
consumer based global brand equity (CBGBE), while brand loyalty is viewed as a
consequence of CBGBE. These dimensions serve as an effective tool to evaluate
CBGBE.
The next sections offer insights into the conceptualisation and measurements of these
seven components of CBGBE.
2.9.1 Brand Trust
In recent years, the concept of brand trust has attracted considerable attention in the

-50-
field of marketing research. This is because trust not only increases consumption
behaviour (Kenning, 2008) but also enhances the benefits of brand extension (Reast,
2005). In fact, brand trust can be an efficient way of building and maintaining brand
equity as a relational asset (Delgado-Ballester and Munuera-Alemán, 2005). This is
because trust is vital to maintaining a strong relationship between a brand and its
consumers (Delgado-Ballester and Munuera-Alemán, 2001).
2.9.1.1 Conceptualisation of Brand Trust
Through the way a company‘s product is developed, manufactured, put on the market,
advertised and serviced, a trustworthy brand guarantees and assures value to
consumers (Delgado-Ballester and Munuera-Alemán, 2005). They point out that
brands provide satisfaction to consumers and thus encourage loyalty. This is why
researchers and practitioners in the field of marketing have paid attention to the
concept of trust (Schtmann, 2007).
Trust has been discussed in various research disciplines, including sociology,
psychology, economics and marketing. Luhmann (1979) proposes a sociological
theory of trust. The author states that the three modes that induce anticipation about
the future, based on culture and personal experiences, are familiarity, confidence and
trust. Familiarity is a prerequisite for trust (Elliott and Yannopoulou, 2007). Luhmann
(1979) supports this by insisting that trust stems from the familiarity, and it needs a
reliable background. Kania (2001) states that higher trust is created once the
consumer is familiar with a brand or firm. Purchase based on familiarity occurs when
consumers believe that the perceived risk of their purchase is low. However,
confidence, which is a mix of cognition and emotion stemming from experience, is
necessary at higher levels of perceived risk; and when the perceived risk levels are
high, trust is required for buying (Elliott and Yannopoulou, 2007).
In the field of psychology, trust is believed to result from previous experience and
interactions (Rempel, Holmes and Zanna, 1985). They add that it typically passes

-51-
through the following stages: predictability, dependability, trust and faith. These
stages indicate a hierarchy in terms of emotional attachment which arrives at trust
when people get emotionally involved with another person; trust indicates a greater
degree of emotional involvement (Elliott and Yannopoulou, 2007).
Some researchers from the field of marketing have studied strategies to reduce risks
by selecting reputable brands (Ring, Schriber and Horton, 1980). They explain that
consumers tend to choose a strong brand, because strong brands provide consumers
the safety to better understand a company‘s offerings. Trust in a brand helps in
reducing the risk and uncertainty associated with it (Chaudhuri and Holbrook, 2001).
Trust minimises consumers‘ uncertainty regarding the behaviour of the company
(Arrow, 1973). In addition, brand trust is regarded as expectation when the consumer
believes that the brand will be consistent, capable, responsible and honest (Delgado-
Ballester and Munuera-Alemán, 2005).
Brand trust evolves with the perception of a brand-consumer relationship (Sheth and
Parvatiyar, 1995). Hiscock (2001) asserts that creating a strong consumer-based brand
is the goal of marketing, and brand trust is the key element of this bond. Morgan and
Hunt (1994) study relationship marketing and identify that trust is important to
relational exchange and a crucial variable in marketing relationships. Moorman,
Deshpandé and Zaltman (1993:82) highlight the importance of confidence in
developing long-term relationships by defining trust as ―a willingness to rely on an
exchange partner in whom one has confidence.‖ They explain that behavioural
intention is an essential aspect of trust. This definition parallels that of Chaudhuri and
Holbrook (2001:2): ―trust is defined as the willingness of the average consumer to
rely on the ability of the brand to perform its stated function.‖ Morgan and Hunt
(1994) suggest that real confidence is an indicator of the behavioural intention to
depend on something. Therefore, trust is related to behavioural intention (Moorman,
Deshpandé and Zaltman, 1993) and buying behaviour (Kenning, 2008). That is, trust
has a positive effect on consumer loyalty (Kenning, 2008). The constant process of
maintaining a valuable relationship that is based on trust generates brand loyalty.
Accordingly, trust is the fundamental factor for loyalty (Berry, 1993).

-52-
In the context of service industries, including hospitality, Berry and Parasuraman
(1991) find that trust is essential for forming relationships between the consumer and
the firm; in the case of a service, managing trust is important for effective and
successful service marketing. The authors highlight that one of the characteristics of a
service is intangibility, which suggests that consumers need to trust a brand before
they purchase the service to avoid a risk. The consumption experience is an essential
source of trust as it produces assessments and associations that are not only more self-
relevant but also held with greater confidence (Dwyer, Schurr and Oh, 1987).
The rise of globalisation has led a great number of companies to take a keen interest
in brand extension (Kapferer, 2008). The role that brand trust has is significant in the
achievement of a brand extension, because the relationship that consumers have built
with the parent brand provides them with affection and credibility in a new brand
(Reast, 2005). Moreover, given that global brands have a strong reputation, the
majority of the consumers are likely to evaluate local brands as inferior to global
brands and less reliable (Wang et al., 2008). Global companies focus on enhancing
brand trust, through their marketing programmes, to maintain the economic and
competitive benefits gained by their relationships with the consumers (Delgado-
Ballester, 2004).
Consequently, although various conceptualisations of brand trust have resulted in a
confusing range of definitions, according to most perspectives, ‗expectation‘ and
‗risk‘ are prominent factors of trust (Delgado-Ballester and Munuera-Alemán, 2005).
Brand trust can, therefore, be defined as ―the confident expectations of the brand‘s
reliability and intentions in situations entailing risk to the consumer‖ (Delgado-
Ballester, 2004: 574) Brand trust is an essential component of CBGBE. In the
restaurant industry, building and maintaining trust can enable restaurants to extend
their brands into different countries and cultures. Brand trust is also essential in
building a good relationship between the consumer and the firm in a long-term, and is
also a driver of loyalty (Delgado-Ballester and Munuera-Alemán, 2005). This is on
the basis of the belief that the product or service offered by the brand matches
consumer expectations, which are based on the consumers‘ previous experiences with
the brand (Sichtmann, 2007). Thus, investing in building brand trust offers distinct
benefits for practitioners.

-53-
2.9.1.2 Measurements of Brand Trust
Trust is the consumer‘s feeling that the brand will meet his/her consumption
expectations, which is based on two general dimensions: brand reliability and brand
intentions (Delgado-Ballester and Munuera-Alemán, 2001). In marketing research,
these two dimensions of trust have been widely discussed (e.g. Morgan and Hunt,
1994; Doney and Cannon, 1997; Delgado-Ballester and Munuera-Alemán, 2001,
2005). Brand reliability has a competence-based or a technical trait, which includes
the willingness and the ability to deliver against promises and meet consumer
requirements (Delgado-Ballester and Munuera-Alemán, 2005). This dimension allows
consumers to predict whether the brand will satisfy their needs and shapes their
attitude towards the brand (Delgado-Ballester and Munuera-Alemán, 2004).
Therefore, reliability is the starting point of trust.
The second dimension of trust is brand intentions, which refers to the belief that the
brand will hold consumers‘ welfare and interests, when unexpected problems with the
use of the brand emerge (Delgado-Ballester and Munuera-Alemán, 2004). Brand
intention includes attributes such as benevolence, honesty (Larzelere and Huston,
1980), dependability and fairness (Rempel et al., 1985).
Reast (2003) proposed a model of brand trust that consists of two components:
cognitive and conative. According to this model, conative and cognitive components
are based on ‗credibility‘ and ‗performance satisfaction‘ respectively. Credibility is a
significant factor for brand extension (Keller and Aaker, 1992), as it is a reflection of
the brand‘s honesty in advertising, in other kinds of brand communication and in
personal interaction (Reast, 2005). Credibility consists of two aspects: trustworthiness
and expertise (Power et al., 2008). According to Reast (2005:9), ―performance
satisfaction reflects the extent to which quality is consistent and meets expectations
and the extent to which the brand is dependable or can be relied on‖. Kenning (2008)
classified trust into two groups: general and specific trust. Marketing influences
specific trust which is vital to establishing a long-term, lasting relationship between a
firm and its consumers. Specific trust is composed of a cognitive and an affective
element (Morrow, Hansen and Pearson, 2004), and affective trust, in particular, is the

-54-
result of emotional and affective experiences of an individual (Kramer, 1999). On the
other hand, conscious experiences of the consumers with a specific brand result in
cognitive trust (Kenning, 2008). Kenning adds that cognitive trust may be employed
as a tool for evaluating trustworthiness.
Power et al. (2008) discuss three dimensions of trust in their study on the
attractiveness and connectedness of ruthless brands: competence, honesty and
empathy. Butler (1991) proposes ten different dimensions of trust: integrity,
consistency, promise-fulfilment, receptivity, loyalty, fairness, competence, discretion,
openness and availability. Of these, Verbeke et al. (2006) focus on competence,
openness and availability, as evidenced in the ethical treatment of suppliers.
As discussed above, brand trust is multi-dimensional concept, and researchers have
employed different variables to measure it. Typically, in marketing literature, the
concept of trust is linked to confidence, credibility (reliability) and intentions
(Delgado-Ballester and Munuera-Alemán, 2001). In the field of psychology, brand
trust is viewed a concept consisting of cognitive, conative (Reast, 2003) and affective
elements (Morrow et al., 2004).
The next section reviews the influence of brand affect on the restaurant industry.
2.9.2 Brand Affect
Emotional feelings such as love, hate, pity and anger seem to provide the energy that
stimulates and sustains a particular attitude towards a brand (Wright, 2006). It is clear
that the emotional effects of the brand lead consumers to recall the brand and boost
brand loyalty (Dick and Basu, 1994; Chaudhuri and Holbrook, 2001; Matzler et al.,
2006). Thus, these effects play an important role in brand equity.

-55-
2.9.2.1 Conceptualisation of the Brand Affect
Nowadays, consumption is governed by consumer‘s feelings and emotions, in
addition to the functional aspect of product (Zohra, 2011). Hence, much attention has
been directed towards the affective factors in marketing (Burk and Edell, 1989;
Erevelles, 1998; Gobé, 2001; Keller 1998).
Brand affect is a consumer‘s overall favourable or unfavourable evaluation of a
specific brand (Keller, 1993). Chaudhuri and Holbrook (2001:.82) define brand affect
as ―a brand‘s potential to elicit a positive emotional response in the average consumer
as a result of its use.‖ Evoking consumer emotions is a major factor for developing a
long-term relationship between a consumer and a brand (Zohra, 2011). Matzler et al.
(2006) refer to affect as feelings and emotions induced by stimulations. Consumers‘
emotions are related to stimuli (Wright, 2006). Wright adds that if the stimuli
reinforce factors that evoke positive feelings, consumers are encouraged to purchase
certain brands, which, in turn, promotes brand loyalty (Wright, 2006).
Behaviour decision theorists investigate affective reactions that influence the
decision-making process (Garbarino and Edell, 1997). Consumer satisfaction and
purchase intention are directly influenced by positive emotions, which are also known
as positive affects (Oliver et al., 1997). A brand or a company that successfully forms
a positive emotional relationship with the consumer gains a competitive advantage
(Nowak, Thach and Olsen, 2006). Thus, for pleasing consumers and securing their
preferences, outstanding consumer service is vital. Yu and Dean (2001) propose that
the affective element of consumer satisfaction is a better component for predicting
consumer loyalty and positive word-of-mouth than cognitive elements (e.g. price and
quality).
Evanschitzky, Iyer, Plassmann, Niesing and Meffert (2006) propose that affective
commitment is an important precursor of loyalty in service relationships. Affective
commitment, which is the emotion that a consumer attaches to a brand (Allen and
Meyer, 1990), has a positive effect on both attitudinal loyalty and behaviour loyalty
(Evanschitzky et al., 2006). Therefore, strong attitudinal commitment and purchase
loyalty reflect the brand‘s success in making the consumers feel ‗happy,‘

-56-
‗affectionate‘ or ‗joyful‘ (Chaudhuri and Holbrook, 2001).
In the service industry, in particular, building positive emotion is very important.
Brands with high consumer affect lead to attitudinal and purchase loyalty (Chaudhuri
and Holbrook, 2001). The authors add that consumers who have strongly built
emotional connections with a restaurant or with its staff will not only revisit the
restaurant but also be willing to pay a premium price.
Consequently, brand affect is considered as an antecedent to brand purchasing
(Chaudhuri and Holbrook, 2001). To achieve a positive brand evaluation from
consumers, it is important that the brand experience is enjoyable (Matzler et al., 2006).
In the restaurant industry, high quality service is the key to please consumers (Nowak
et al., 2006). The stimulation of positive emotion will attract consumers and connect
them closely to the brand (Zohra, 2011). When brand loyalty is based on emotional
bonds, it not only becomes stronger, but also acts as a source of competitive
advantage (Gómez, Arranz and Gillán, 2006).
The following section reviews the measurements of brand affect based on concept of
brand affect.
2.9.2.2 Measurements of Brand Affect
Many researchers have developed measures of brand affect. Westbrook (1987)
proposes two affect constructs—positive and negative—that indicate consumer
satisfaction with a product. Later, Westbrook and Oliver (1991) conducted a
dimensional analysis and identified three affective dimensions of satisfaction
judgments: hostility (a constellation of negative affect), pleasant surprise (positive
affect and surprise) and interest. Oliver (1993) discusses a negative affect dimension
that has three subcomponents: externally attributed affects (anger, disgust and
contempt), internally attributed affects (guilt and shame) and situation-specific affects
(fear and sadness). Mano and Oliver (1993) describe two dimensions of brand affect:
a positive-negative affect and arousal.

-57-
Richins (1997) develops the consumption emotion set (CES), which highlights the
following consumer emotions: worry, anger, fear, loneliness, joy, peacefulness,
optimism, romantic love, guilt, sadness, envy, shame, discontent, optimism, surprise,
pride and contentment. Later, Nowak et al. (2006) adopt two CESs - joy and
excitement - and uses them to investigate the attitudes of wine buyers. In the study,
‗joy‘ refers to happiness, pleased feelings and joyfulness, while ‗excitement‘ refers to
thrill and enthusiasm (Nowak et al., 2006). They find that through positive emotions,
wineries can raise brand loyalty and consumer patronage.
Hanzacc (2011) investigates the impact of consumption emotions on satisfaction and
word-of-mouth and develop a model based on Russell‘s model of pleasure arousal.
Russell (1980) measures emotions using 12 items that represent pleasure and arousal
dimensions. Pleasure is measured by six items: satisfied-dissatisfied, pleased/annoyed,
contented/melancholic, hopeful/despairing, relaxed/bored and happy/unhappy.
Arousal is measured by another six items: excited/calm, stimulated/relaxed,
frenzied/sluggish, jittery/dull, wide awake/sleepy and aroused/unaroused.
More recently, Zohra (2011) has proposed three emotional dimensions: affection,
passion and connection. Affection represents warm feelings such as love and
friendship; passion represents positive and intense feelings such as attraction and the
bond between the consumer and the brand; and connection refers to being linked and
attached to a brand.
In summary, the conceptual models of emotions have been used more often in service
sectors that are centred mainly on positive and negative affect (Edwardson, 1998).
Many researchers have adopted happiness, pleasure, joy, hope, excitement, optimism,
love as positive emotions; and unhappiness, anger, fear, sadness as negative emotions.
Additionally, arousal and interest have been explored as other dimensions of affect.
The present study considers only those dimensions of affect that are relevant to the
restaurant services (see 4.4.2).
The following section examines the essential component of perceived quality.
-58-
2.9.3 Perceived Quality
Perceived quality is the main determinant of brand equity (Aaker, 1996b). It refers to
the consumer‘s judgement of a brand‘s superiority or excellence (Netemeyer,
Krishnan, Pullig, Guangping, Yagci, Dean, Ricks and Wirth, 2004). This influences
the purchase of a product or service (Aaker, 1991). Perceived quality is also valuable
because it provides consumers with a reason to purchase and differentiates the brand
from its competitors (Pappu et al., 2005).
Perceived quality is an attitude towards the brand (Aaker, 1996; Keller, 1993) that is
linked to consumer satisfaction (Pappu and Quester, 2006). It is ―the consumer‘s
subjective evaluation of the product rather than the actual quality of the product‖
(Zeithaml, 1988:3). This is because the standards for comparison of goods and
services are selected by the individuals (Baldauf et al., 2003). A great number of
companies constantly try to meet their consumers‘ evolving preferences and demands
for quality, to ensure consumer satisfaction (Atilgan et al., 2005).
2.9.3.1 Perceived Service Quality
Perceived quality of services is different from that of products because products and
services have different attributes. The first difference is intangibility of services, i.e.
they cannot be seen, tasted or touched but only experienced. Unlike products, the
attributes of services cannot be tested before they are used by consumers. Service
quality can only be assessed later on the basis of results. Secondly, the inseparability
of production and consumption is another unique feature of a service (Bamert and
Wehrli, 2005). Thirdly, the essence and quality of a service can vary according to the
producer, consumer and the situation (i.e. heterogeneity), which makes it difficult to
standardise. Finally, perishability is another important characteristic of a service,
which indicates that a service cannot be stored or saved (Bamert and Wehrli, 2005).
These characteristics of services suggest that services are produced, distributed and
consumed in the interaction between the service provider and the consumer
(Svensson, 2004).

-59-
Perceived service quality has been defined as a global judgment of service excellence
(Holbrook and Kim 1985). The evaluation of service quality is based on the
perceptions of consumers. Thus, service quality is considered as a cognitive
assessment of the service performance (Oliver, 1997). However, Edvardsson (2005)
asserts that service quality should be understood from both cognitive and emotional
perspectives, which are based on service experience. Service experience tends to stay
in the minds of the consumers for long time and has a strong influence on consumer‘s
quality perception and emotion (Edvardsson, 2005).
Service quality plays a vital role in determining consumer‘s assessments of value
(Imrie, Cadogan and McNaughton 2002) and has a positive effect on financial profit
(Zeithaml, 2000). It also has a positive relationship with consumer loyalty, repeat
purchases and price competitiveness (Gale and Buzzel, 1989). Service performance
has a direct relationship with service quality (Chenet, Tynan and Money, 1999).
2.9.3.2 Conceptualisation of Perceived Quality A number of models have been proposed to conceptualise the construct of service
quality (e.g. Garvin, 1987; Parasuraman, Zeithaml, and Berry 1988; Frost and Kumar,
2000; Svensson, 2004). Broadly, the dominant perspectives in the conceptualisation
of perceived quality are disconfirmation and performance-only approaches (Martinez
Caro and Martinez Garcia, 2007). The disconfirmation approach has been used by
Parasuraman et al. (1988) to develop the SERVQUAL model (Nam et al., 2011).
Parasuraman et al. (1985:42) summarised existing knowledge on service quality in
the following words:
• Service quality is more difficult for the consumer to evaluate than goods quality.
• Service quality perceptions result from a comparison of consumer expectations with actual service performance.
• Quality evaluations are not made solely on the outcome of a service; they also involve evaluations of the process of service delivery.

-60-
On the basis of this information, Parasuraman et al., (1988:17) define perceived
quality as ―the degree of discrepancy between consumers‘ normative expectations for
the service and their perceptions of the service performance.‖ Zeithaml, Parasuraman,
and Berry (1990) suggest key factors that influence consumer‘s expectations: word-
of-mouth communication, personal needs, past experience and external
communications. Zeithaml et al. also developed SERVQUAL components that form
the criteria for evaluating service quality. This model views service quality as a
function of the different gaps or scores between consumer expectations and
perceptions (Parasuraman, Zeithaml, and Berry, 1985). Figure 2.5 shows the service
quality model.

-61-
Figure 2.5 Service Quality Model
Source: Parasuraman et al. (1985:44)
Word-of-Mouth Communication
Personal Needs
Past Experience
Expected Service
Perceived Service
Service Delivery (including pre-and
post-contacts)
External Communications to
Consumers
Translation of Perceptions into Service Quality
Specs
Management Perceptions
of Consumer Expectations
GAP 4
GAP 2
GAP 3
GAP 5
GAP 1
Consumer
Marketer

-62-
Figure 2.5 shows important insights about the concept of service quality and factors
affecting it (Parasuraman et al., 1985). In the figure, the gaps are shown in the
marketer side. According to Parasuraman et al. (1985), the causes of the five quality
gaps are inconsistencies in the quality management process. Gaps 1 to 4 pertain to the
shortfalls in the service provider‘s business, and these gaps also influence the
consumers‘ perceptions of poor quality of service (Zeithaml et al., 1990). Gap 5
illustrates the potential incongruity between the consumer‘s expected and perceived
service (Parasuraman et al., 1985). This model reveals that consumers evaluate their
experience of service quality on the basis of the gap between the expected and
perceived service (Parasuraman, Zeithaml and Berry., 1990).
Since 1988, many researchers have used the SERVQUAL model in their research.
However, this model is not suitable for capturing the service provider‘s perspective
(Svensson, 2004). Other models have been developed to emphasise the interaction
between the service receiver and the service provider (e.g. Grönroos, 1984; Svensson,
2003).
Grönroos (1984) developed the Nordic model using the disconfirmation approach.
The author (1984:37) states that ―the perceived quality of a given service will be the
outcome of an evaluation process, where the consumer compares his expectations
with the service he perceives he has received .i.e. he puts the perceived service
against the expected service.‖ According to Grönroos (1984), once the service is
provided to the consumer, the consumer-producer interactions influence the perceived
service.
In line with Grönroos‘ view (1984), Svensson (2003) states that the service quality in
a service encounter is the interactive process between the service provider and the
service receiver. Svensson proposes that the interactive service quality relies on the
gap between the service provider‘s perception and the service receiver‘s perception.
Svensson‘s (2003) see-saw model of interactive service quality suggests that a
balance between the service provider‘s perspective and the service receiver‘s
perspective leads a congruent interactive service quality, which is a satisfactory
situation. Svensson (2003) also proposes that time and context influence the

-63-
interactive service quality. Figure 2.6 shows the management of interactive service
quality in terms of a hierarchy of priorities.
Figure 2.6 Hierarchy of priorities: the management of interactive service quality
Source: Svensson (2004: 285)
According to Svensson (2004), hierarchy involves four stages of priority influenced
by the congruence or incongruence between the provider‘s and receiver‘s perspectives
of interactive service quality. The author characterises hierarchy as follows (2004:
285-286):
Context
3rd Priority
(Negative) Service Provider
Service Provider (Positive)
Service Receiver (Negative)
Service Receiver (Positive)
1st Priority
4th Priority 2nd Priority
Time

-64-
―The first priority level occurs when the service provider‘s perspective is positive and the service receiver‘s perspective is negative. The second priority level occurs when the service provider‘s and the service receiver‘s perspectives are equally negative. The third priority level occurs when the service provider‘s and the service receiver‘s perspectives are equally positive. In this third situation, there is a positive congruence of the interactive service quality in the service encounter. The fourth priority level occurs in a service encounter when the service provider‘s perspective is negative and the service receiver‘s perspective is positive.‖
In summary, perceived quality is closely based on the consumers‘ value judgements in
deciding to purchase a brand; as a result, brand performance can be greatly affected.
The perceived quality of services is different from that of products because of the
unique attributes of a service—intangibility, inseparability, heterogeneity and
perishability. Grönroos (1984) and Parasuraman et al. (1985) develop service quality
models that are based on the disconfirmation approach. This approach compares
consumers‘ expectations of service quality with their perceptions of the service
quality actually received (Martinez Caro and Martinez Garcia, 2007). Most studies on
service quality based on the SERVQUAL model have dealt with only the service
receiver‘s perspective. However Grönroos (1984) and Svensson (2004) propose a
model for interactive service quality, which considers the service provider‘s
perspective and the service receiver‘s perspective simultaneously.
Edvardsson (2005) argues that understanding the drivers of positive and negative
consumer emotions clarify consumer‘s perceived service quality. That is, in the
restaurant industry, the interpretation of quality aspects such as
‗helpfulness‘, ‘politeness‘ and ‗friendliness‘ can differ greatly among the guests, as
these are subjectively estimated (Mei, Dean and White, 1999). For this reason, a
service is difficult to standardise, and its assessment depends on the quality of
personal service.
A consumer‘s satisfaction with a service is based on his or her experience with the
service provider. The food-service experience can influence a consumer‘s overall
satisfaction with the restaurant experience (Law, Hui and Zhao, 2004). Hence,
improving the service quality for consumer satisfaction is one of the most important

-65-
marketing strategies in the restaurant industry. The restaurant‘s facilities and
cleanliness, the staff‘s behaviour, and food quality are some of the important elements
that determine consumer satisfaction and loyalty.
2.9.3.3 Measurements of Service Quality
To develop robust marketing strategies, managers of service firms need a reliable and
valid scale (Kang, James and Alexandris, 2002). In the past, scholars have developed
many multi-dimensional models of service quality. Grönroos (1984) considers
technical quality, functional quality and firm‘s image as the dimensions in his model,
whereas Lehtinen and Lehtinen (1991) include interaction quality and output quality
among their dimensions. However the majority of the studies to date have used the
SERVQUAL method, developed by Parasuraman et al. (1985, 1988), for measuring
service quality.
Parasuraman et al. (1988) propose that service quality is a concept that involves five
dimensions: reliability, assurance, tangibles, empathy and responsiveness.They define
these dimensions as follows:
Table 2.5 The SERVQUAL Dimensions
Source: Parasuraman et al. (1988: 23)
Dimensions Definitions
Tangibles Physical facilities, equipment, and appearance of personnel
Reliability Ability to perform the promised service dependably and accurately
Responsivness Willingness to help consumers and provide prompt services
Assurance Knowledge and courtesy of employees and their ability to inspire trust and confidence
Empathy Caring, individualized attention the firm provides its consumers

-66-
Reliability is shown as the most significant dimension while empathy, a compound of
understanding and access, is the least significant across a seemingly broad range of
services (Chowdhary and Prakash, 2007). Parasuraman et al. (1988) add that empathy
and responsiveness are more important for labour-intensive industries, including the
hospitality industry, whereas tangibles and reliability affect capital-intensive services.
Even though the SERVQUAL scale has been widely used in service quality research,
it has certain limitations. Most of these pertain to the difficulties in conceptualising
expectations, the limited number of items in each dimension and the negatively
phrased items, low reliability and validity caused by the gaps model (Carman, 1990;
Buttle, 1995; Armstrong, Allinson and Hayes, 1997).
In addition, some researchers argue that a performance-only approach is a better
approach to measuring service quality than considering the expectation scale together
(Cronin and Taylor, 1992; Babakus and Boller, 1992; Martinez Caro and Martinez
Garcia, 2007). Cronin and Taylor (1992), in particular, identified the problems of the
disconfirmation paradigm in measuring service quality and, in response, developed
the SERVPERF model. Subsequently, many researchers have acknowledged the
superiority of performance-only measures (Brady et al., 2005).
Dabholkar, Thorpe and Rentz (1996) also points out the limitations in applying the
SERVQUAL scale within a retail environment. To overcome this, they developed the
DTR scale that measures service quality within the retail environment. The DTR scale
is composed of five dimensions: physical aspects, reliability, personal interaction,
problem solving and policy (Dabholkar et al., 1996). Personal interaction itself has
two sub-dimensions: confidence inspired by service personnel and courteousness
/helpfulness of staff.
Although a number of studies have focused on service quality within the hospitality
industry, scholars have not yet arrived at a consensus for measuring it. The
SERVQUAL scale continues to be used widely, despite its drawbacks. Mei et al.
(1999) modified the SERVQUAL scale slightly to the hospitality service sector and
introduced three dimensions of service quality: employees, tangibles and reliability.

-67-
They find that employee behaviour is the best predictor of overall service quality. The
Nordic European model of service quality, as opposed to the Parasuraman et al North
American model, is found to be more valid in the hospitality industry (e.g. Brady and
Cronin, 2001; Ekinci, 2001; Madanoglu, 2004). In the Nordic European model, two
dimensions of service quality are identified as technical quality and functional
quality: technical quality refers to what the consumer receives as the outcome of the
service performance whereas functional quality refers to how the consumer receives
the service (Grönroos, 1984). Grönroos highlights that perceived service is the result
of the consumer‘s view of technical quality and functional quality.
In conclusion, despite the SERVQUAL instrument‘s deficiencies (Kang et al., 2002),
researchers have used it as a useful tool to measure service quality (Buttle, 1996).
However, the two-dimensional Nordic model is more valid when applied to restaurant
service. Moreover, the present study adopts a performance-only approach to service
quality, which considers perceived performance rather than consumer expectation.
2.9.4 Self-Congruence In consumer behaviour research, it has been shown that consumers choose and
purchase products or brands based on the symbolic meaning attached to these
products or brands, as well as their functional attributes (Wright, 2006). Thus,
consumers often purchase products and services as a way to expressing their own self
(Sirgy, 1986). Moreover, when consumers find a product or a brand that are matched
with themselves they will show a favourable attitude towards such products or brands
(Sirgy and Su, 2000). The authors point out that this process of matching is referred to
as ―self-congruence.‖
In particular, self-congruence is highly relevant to culture because consumers‘
product consumption depends on their lifestyles and cultures (Quester, Karunaratna
and Goh 2000). Consumer behaviour researchers have recognised that culture exerts a
considerable influence over consumer motivations and product choices (Tse, Wong
and Tan, 1988). Thus, self-congruence plays an important role in evaluating a global
brand.

-68-
As noted by Kressmann, Sirgy, Herrmann, Huber, Huber and Lee (2006), in the
consumer behaviour literature, the following are employed interchangeably: self-
image congruence, self-congruence, self-congruity and image congruence.
2.9.4.1 Self-Concept
Self-concept refers to the thoughts and beliefs that individuals hold about their own
characteristic traits (Wright, 2006). It is based not only on what other people think of
the person, but also on how one thinks of oneself in terms of personality, abilities,
appearance, characteristics and limitations (Graeff, 1996). Self-concept has to be
learned; it is not innate (Onkvisit and Shaw, 1987).
A number of researchers have used self-concept to explain consumer behaviour
(Quester et al., 2000) because specific behaviour patterns of a person are frequently
determined by the image that he/she has about himself/herself (Onkvisit and Shaw,
1987). Self-concept, which is stored in the memory, can be activated when a person
makes a purchasing decision (Graeff, 1996).
The majority of people behave in a way that strengthens or retains their self-concept.
Thus, the self-concept has been used as a method of explaining product symbolism
(Kwak and Kang, 2009). Product symbolism is based on the idea that consumers are
drawn towards a product whose symbolic image is most similar to their self-concept
(Kwak and Kang, 2009). Onkvisit and Shaw (1987) suggest that self-concept serves
to both protect and enhance a person‘s ego. In a competitive marketing environment,
the extent of congruency between consumers‘ self-concept and a brand‘s image has a
significant influence on consumers‘ responses to the brand (Graeff, 1996).
2.9.4.2 Conceptualisation of Self-Congruence
As with people, products and services too have different personality types (Sirgy,
1985). Sirgy suggests that the personalities of products and services can be described
in terms of a set of characteristics, such as excited, honest, sophisticated and
traditional.

-69-
Gardner and Levy (1955) and Levy (1959) were the first to study the relationship
between an individual‘s self-image and a product‘s image (Landon, 1974). Consumers
tend to prefer products and brands with images that match their own self-concept
(Sirgy, 1980). These brands give the consumers an opportunity to express themselves
(Graeff, 1996). Graeff adds that consumers have a positive attitude and positive
buying intentions towards brands that are consistent with their self-image (Graeff,
1996). According to the image congruence model, consumers assess these brand
images from the standpoint of their symbolic meanings (Onkvisit and Shaw, 1987).
The authors state, additionally, that when these images are regarded as very
believable and desirable, they offer an incentive for the consumer to attain them.
Johar and Sirgy (1991) define self-congruence as the match between the product-user
image (the product‘s value-expressive attributes) and the consumer‘s self-concept.
They (1991: 24) suggest four different types of self-image:
―an actual self-image (an image an individual has of him of herself), an ideal self-image (an image one aspires to have), a social self-image (beliefs about how one is viewed by others) and an ideal social self-image (the imagined image one aspires others to have of him or herself.‖
Figure 2.7 represents the types of self-congruence and how they operate to persuade
the consumer.

-70-
Figure 2.7: Different Forms or Types of Self-Congruity and Attitude Change or Persuasion
Source: Johar and Sirgy (1991:25)
As shown in Figure 2.7, the congruence between the product-user image (product‘s
value-expressive attributes) and the actual self-image, ideal self-image, social self-
image and ideal social self-image of a consumer enhances the probability of
Satisfaction of need for
self-consistency
Actual self-congruence
Product user
image
Actual self-
image
Product user
image
Ideal self- image
Product user
image
Social self-
image
Product user
image
Ideal social self -image
Ideal self- congruence
Social self- congruence
Ideal social self-
congruence
Satisfaction of need for
self-esteem
Positive attitude
or persuasion
Satisfaction of need for social
consistency
Satisfaction of need for social
approval

-71-
consumer having a positive attitude towards a product or brand and being persuaded
to buy that product or brand (Johar and Sirgy, 1991). As the congruence between the
self-images and the product-user image increases, the need for self-consistency, self-
esteem, social consistency and social approval also increases; thus there is an increase
in the consumer‘s positive attitude towards the product (Johar and Sirgy, 1991).
Self-concept is motivated by the desire for self-consistency and self-esteem (Sirgy,
1982). Self-consistency determines people‘s actual self (Kressmann, 2006), whereas
self-esteem is boosted by realising the ideal self-image (Sirgy and Su, 2000).
According to Katz (1960), when the message of a brand or good is well matched with
the motives of the person, the attitude towards a product changes (Johar and Sirgy,
1991). An attitude towards a brand or a product offering the value expressive function
allows the consumer to demonstrate positive value and self-concept (Johar and Sirgy,
1991).
Consumer behaviour research has indicated that self-congruity has an impact on
consumer satisfaction (Jamel and Goode, 2001), purchase intentions (Landon, 1974;
Ibrahim and Najjar, 2008) and loyalty (Sirgy and Samli, 1985; Kressman et al., 2006).
Consequently, positive attitudes and behaviour towards brands or products are
facilitated by congruence between the self-concept and the image of the product
(Sirgy, 1980, 1985). Thus, a symbolic image of a product or brand as it is perceived in
the market place is very important for consumer decisions.
For example, in the restaurant industry, self-congruence is one of the main factors that
influence a restaurant visit. Restaurants are a place not only for dining but also for
social meetings and business. Hence, the image of a restaurant (such as interior
design, music, menu and staff dress) must match the self-concept of its target
consumers. Most people aim to feel comfortable in a restaurant that coincides with
their self-concepts. Therefore, managers of restaurants need to consider the self-
concept of their consumers and develop a brand personality that fits this self-concept,
taking into account customer‘s self-congruence (Kressmann et al., 2006; Kwak and
Kang, 2009). Moreover, managers of global brands should understand the cultural
backgrounds of their consumers to ensure that their marketing strategies match the
consumer‘s self-concept.

-72-
2.9.4.3 Measurements of Self-Congruence
The traditional method (Q-sort, semantic differential) for measuring self-image
congruence is the discrepancy index, which measures self-congruity based on the
mathematical discrepancy between the product-user image and the consumer self-
concept (Sirgy and Su, 2000). Although the traditional method of measuring self-
image congruence is prevalent, Sirgy, Grewal, Mangleburg, Park, Chon, Claiborne,
Johar and Berkman (1997) have identified the following problems with this
traditional method: the use of discrepancy score, which can result in inflated
reliability scores, spurious correlations with other variables and restricted variance;
the use of predetermined images, which can lead respondents to indicate congruence
or incongruence of irrelevant images with products (Back, 2005). Hence, Sirgy et al.
(1997) suggest a new approach to measure self-image congruence that is rooted in the
direct score formula (Ibrahim and Najjar, 2008). This approach does not measure
product image and self-image separately to capture self-congruity, and does not ask
respondents to indicate their perception of congruity with predetermined images
(Sirgy et al., 1997). This approach is more predictive of various consumer behaviours
and attitudes than the traditional methods (Sirgy and Su, 2000).
Most of the existing self-image research has been measured and analysed by
psychologists who focus on the perception differences between of the actual self and
the ideal self, which are the two dimensions of the self-concept (Quester et al., 2000).
Some researchers have suggested that self-concept has two components, whereas
other researchers, including Sirgy (1982), argue that it consists of more than two
dimensions. Sirgy (1979; 1980) proposes four self-congruity measures related to
consumer behaviour: an actual self-image, an ideal self-image, a social self-image
and an ideal social self-image (see 2.9.4.2).
Likewise Sirgy, Onkvisit and Shawn (1987: 17) put forward the following dimensions
of self-concept: real self (actual or objective self) - the way a person actually is, self-
image (subjective self) - the way a person sees himself, ideal self (self-actualisation) -
the way he would like to be, looking-glass self (social self) - the way he thinks others
regard him.‖ These dimensions can exist at the same time and overlap partially but
are not mutually exclusive. Therefore, a person‘s actual self can differ from his/her

-73-
self-image, ideal self-image and looking-glass self (Onkvisit and Shawn, 1987).
Bosnjak and Rudolph (2008) investigate whether undesired self-image congruence
affects consumer behaviour. They use the three facets—actual congruity, ideal social
congruity and undesired congruity—in their research. The ‗undesired self‘, a concept
introduced by Ogilvie (1987: 380), is characterised as ―a least-desired identity,
comprising the sum of negatively valenced traits, memories of dreaded experiences,
embarrassing situations, fearsome events and unwanted emotions the individual is
consistently motivated to avoid.‖ Undesired self-image congruence influences
consumption attitudes but does not directly affect buying intentions (Bosnjak and
Rudolph, 2008). Table 2.6 summarises recent researches on the relationship between
self-image congruity and consumer behavioural intentions with regard to factors such
as brand preferences and purchase intentions.

-74-
Table 2.6 Recent Studies Investigating the Relationship between Self-Image Congruity and Consumer Behaviour
Author Type of Self-Concept Products
Findings
Amstrong (2001) Actual self Ideal self
Activities
A difference in the self-image, product image and level of image and level of image congruity experienced, does exist between females and males.
Jamal and Goode (2001) Actual self Brand products
Self-image congruity is a very strong predictor of the consumer‘s brand preferences and a good predictor of consumer satisfaction. Consumers with higher levels of self-image congruity were more likely to prefer a brand and to enjoy higher levels of satisfaction with the brand as compared to those with lower levels of self-image congruity.
Ekinci and Riley (2003) Actual self Ideal self Services Actual and ideal self-congruity have a variable influence on purchase
intention, attitudes, satisfaction and service quality.
Azevedo and Farhangmehr (2005)
Actual self Ideal self Brand products A significant positive correlation exists between self-concept and brand
personality.
Kleijnen,Ruyter and Andreassen (2005)
Actual self Ideal self Services
Consumers with low image congruity are influenced more by their surroundings than consumers with high image congruity, and image congruity has a significant impact on consumer attitudes and the adoption decision.
Source: Ibrahim and Najjar (2008:211–212)

-75-
As shown in Table 2.6, research has focused largely on the main dimensions namely,
actual and ideal self-concepts. These two types of self are the most commonly studied
(Ekinci et al., 2008). It appears that they are the most effective predictors of consumer
purchasing intentions (Quester et al., 2000).
Ross (1971) asserts that consumers prefer a brand that is similar to the actual self-
concept rather than the ideal self-concept. However, Sirgy (1980) argues that ideal
self-congruence has more influence on product preferences than actual self-
congruence. Quester et al (2000) attribute this finding to the nature of the product (e.g.
a functional product or a symbol-related product) and notes that the degree of the
inclusion of actual and ideal self-image varies.
Desire has been used as a standard of comparison to appraise consumer satisfaction
(Woodruff, Clemons, Schumann, Gardial and Burns, 1991). Desire congruence can be
defined as the subjective evaluation made by comparing what the consumers desire
with what they receive from the performance of the company‘s products and services
(Ekinci, Dawes and Massey (2008). Ekinci et al. (2008) use desire congruence, actual
self-congruence and ideal self-congruence as an antecedent of consumer satisfaction
in their research and found that ideal self-congruence and desire congruence have a
positive effect on consumer satisfaction in the context of hospitality services. Ekinci
et al. report that self-congruence matches the complex mind-set of consumers and
influences a wide range of value judgements and behaviours when making a purchase.
Overall, a variety of methods have been used in consumer behaviour studies to
measure the extent of congruence between self-image and product image (Sirgy and
Danes, 1982). An accurate evaluation of self-image congruence can predict
consumers‘ buying intention and product preference. The reliability and validity of
measures used in research are very important (Sirgy and Danes, 1982). Marketing
strategies based on an accurate evaluation can serve to increase consumer‘s
satisfaction. Consistent with previous research, the present research adopts actual
self-congruence and ideal self-congruence as dimensions of self-congruence relevant
to the restaurant industry. These dimensions have been widely employed in earlier
research (e.g. Amstrong, 2001; Ekinci and Riley, 2003; Azevedo and Farhangmehr,
2005; Kleijnen et al., 2005).

-76-
2.9.5 Brand Awareness
Creating brand awareness is the first step to build brand equity (Gil, Andrés and
Salinas, 2007). Brand awareness is related to the strength of the brand in the minds of
consumers; it is also enables consumers to recognise the brand, recall the brand and
thus enhance brand equity (Keller, 1993; Aaker, 1996).
2.9.5.1 Conceptualisation of Brand Awareness
Brand awareness is ―the ability of a potential buyer to recognise or recall that a brand
is a member of a certain product category and to draw a link between the product
class and the brand‖ (Aaker, 1991: 61). Brand awareness is the first dimension that
reflects brand knowledge (Keller, 1993). Brand awareness is linked to brand name; it
denotes the probability that a particular brand name comes to the consumer‘s mind
(Keller, 1993). Name-related facts and feelings associated with the brand can be filled
in the consumer‘s mind like a file folder which consumers can easily access (Aaker,
1991). In memory theory, brand awareness is vital to build the ‗bundle‘ of
associations attached to the brand in memory (Stokes, 1985). Aaker (1991) proposes
that these associations are anchored with the brand name.
In addition, brand awareness can have an effect on perceptions and attitudes to the
brand and can lead to brand choice and loyalty (Aaker, 1996). This is because brand
awareness is an efficient means of providing familiarity and signaling substance and
commitment (Aaker, 1992).
Brand awareness plays a significant role in helping consumers to decide which brand
to purchase (Macdonald and Sharp, 2003): First, as noted by Howard and Sheth
(1969), brand awareness plays an important role in determining the consideration set.
Forming a set of brands that the consumer considers is an essential step (Macdonald
and Sharp, 2003) because most consumers choose a brand from within this
consideration set (Aaker, 1991). Second, brand awareness also has an effect on
decisions about brands in the consideration set (Keller, 1993). Consumers tend to

-77-
purchase familiar brands which affect their satisfaction and behaviour intention (Tam,
2008). Consumers normally try to reduce the costs of decision making in terms of
time spent, and the cognitive effort such as selecting a familiar brand (Macdonald and
Sharp, 2003). Finally, brand awareness impacts consumer‘s buying decisions by
influencing the formation of brand association (Keller, 1993).
Consequently, brand awareness is an important goal of marketing efforts. Brand
image or brand attitude cannot be formed in the absence of brand awareness
(Macdonald and Sharp, 2003). Some researchers highlight, in particular, the
importance of brand awareness in the service context (e.g. Krishnan and Hartline,
2001; Prasad and Dev, 2000; Kayaman and Arasli, 2007). Consumers have difficulty
in evaluating services because of their unique characteristics. Thus, a brand name can
serve to reduce the risks of buying and consuming of service brand (Bhradwaj,
Varadarajan and Fahy, 1993).
2.9.5.2 Measurements of Brand Awareness
There are different levels in the domain of brand awareness, including recognition,
recall, top-of-mind, brand dominance, brand knowledge and brand opinion (Aaker,
1996b). Keller (1993) suggests that brand awareness can be classified into two
categories: brand recall and brand recognition.
Recognition, referring to the familiarity obtained from the past exposure such as
advertising, promotions and word-of mouth, is the lowest level of awareness (Aaker,
1991, 1996). However, recognition alone is not sufficient to produce a positive
consumer‘s reaction, hence it is called aided recall (Pitta and Katsanis, 1995).
If a consumer can recall a brand name without aid, the consumer can be said to have a
high level of awareness (Pitta and Katsanis, 1995). Brand recall refers to ―the
consumers‘ ability to retrieve the brand from memory when given the product
category, using the needs fulfilled by the category or some other types of probe as a
cue‖ (Keller, 1993: 3).

-78-
‗Top-of-mind‘ refers to a situation when a brand is named first in the process of recall
and has an advantageous position in a consumer‘s mind compared to other brands
(Aaker, 1991). ‗Brand dominance‘, the last level of awareness, refers to a situation
when only a single brand is recalled (Aaker, 1996a, 1996b). A dominant brand is
strongly competitive with other brands because consumers will not consider any other
brands in buying situations (Aaker, 1991). ‗Brand knowledge‘ indicates knowledge of
what the brand stands for and brand opinion indicates consumer opinion about the
brand (Aaker, 1996b).
In summary, brand awareness measures the accessibility of the brand in a consumer‘s
memory (Keller, 1993). The majority of researchers who study brand awareness adopt
top-of-mind, brand recall and brand recognition as dimensions of awareness (e.g.
Francois and MacLachian, 1995; Yoo and Donthu, 2001; Kim and Kim, 2005).
2.9.6 Brand Association
Brand associations are closely linked to marketing programmes and other factors that
affect consumer judgments when selecting a brand (Keller, 1998). To fully
comprehend how consumers evaluate brands or products, the nature of the association
must be understood (Supphellen, 2000). Brand associations contribute to both
awareness of the brand and the brand‘s image (Ross, James and Vargas, 2006). They
may be regarded as one of the most important factors in creating a brand image
because the brand‘s image is reflected by the brand associations (Keller, 1993). Brand
image through advertising, logos and symbols determines a product‘s position, and
successful positioning reinforces a strong brand image (Pitta and Katsanis, 1995).
In particular, brand associations allow consumers to differentiate a specific brand
from a huge number of competing brands, as well as allow a brand to enter new
markets more effectively (Dean, 2004). In addition, brand associations represent the
basis not only of purchase decisions but also of consumer loyalty (Ross et al., 2006).
The associations help engender positive consumer emotions (Aaker, 1991). Therefore,
a positive brand association can lead to a strong brand (Park, Millberg and Lawson,
1991) and ensure economic success of that brand (O‘Cass and Frost, 2002).

-79-
2.9.6.1 Conceptualisation of Brand Association
The basis of brand equity is the consumer‘s memory. Thus, the majority of cognitive
psychology studies involving associative models have focused on how memory is
structured (Pitta and Katsanis, 1995). Aaker‘s (1991) conceptualisation and Keller‘s
framework (1993) are based on cognitive psychology and focus on the cognitive
processes underlying the interaction between consumers and companies (Erdem and
Swait, 1997). Aaker (1991) asserts that the fundamental value of a brand name is to
give rise to associations. That is to say, brand equity is associated with a familiar
brand name, which can make consumers remember the products (Aaker, 1991). Aaker
(1991:109) defines brand associations as ―anything linked in memory to a brand.‖
Similarly, Keller (1993:3) defines brand associations as ―the other informational
nodes linked to the brand node in memory and contain the meaning of the brand for
consumers.‖ Krishnan (1996) notes that brand associations can be employed as a
general term to indicate a link between any two nodes, which give rise to an
association in the minds of the consumer. Pitta and Katsanis (1995: 52) state that
―Nodes are stored information connected by links of varying strengths.‖ The
informational nodes contain specific details of a product, such as price, logos and
brand advertising, in addition to word-of-mouth and the consumer‘s past experience
(John, Loken, Kim and Monga, 2006). John et al. suggest that all of these pieces of
information might be associated in the memory of the consumer.
Different types of brand associations may be present in a consumer‘s memory (Keller,
1993). Chen (2001) proposes two types of associations: product associations and
organisational associations. In a previous study, Keller (1993) focuses on product
associations, whereas Aaker (1996b) addresses organisational associations. Marketers
should develop different branding strategies based on the various types of brand
associations (Chen, 2001). Figure 2.8 shows a classification system for brand
associations.

-80-
Figure 2.8 Brand Association Model
Source: Chen (2001: 443)
As shown in Figure 2.8, product associations are linked with the product‘s physical
composition, functional associations (e.g. functional benefits, product‘s attributes)
and non-functional attributes (e.g. emotional associations, symbolic associations)
(Chen, 2001). Chen adds that organisational associations are divided into corporate
ability associations, which relate to the company‘s ability to produce and deliver the
product, and corporate social responsibility associations, which indicate the
company‘s status and activities in terms of its social duties. Aaker (1991:114) lists
eleven types of associations: ―product attributes, intangibles, customer benefits,
relative price, use/application, user/ customer, celebrity/person, lifestyle/personality,
product class, competitors and country/geography.‖ The elements of Keller‘s (1993)
model are similar to those of Aaker. Keller (1993) identifies three types of brand
associations: (1) attributes that characterise a service or product and are divided into
product-related and non-product-related properties, such as price, user/usage imagery
and brand personality; (2) benefits indicate the value that consumers attach to a
service or product (i.e. functional benefits, experiential benefits and symbolic
Brand Associations
Product Associations
Functional Attribute Associations
Non-functional Attribute Associations
Organizational Associations
Corporate Ability Associations
Corporate Social Responsibility Associations

-81-
benefits); and (3) attitudes resulting from the consumers‘ evaluation of the brand
(Wilkie, 1986).
Brand associations are important to both consumers and marketers because they
create value for a company and its consumers: helping consumers process and access
information, providing a basis for differentiation and extension of a brand, creating
positive attitude and feeling towards a specific brand and providing a special reason
to buy the brand (Aaker, 1991).
In summary, brand associations are thoughts held in consumer‘s memory related to a
special brand. Brand associations are a main component of brand image (Simms and
Trott, 2006), which is made up of the different types of brand associations (Keller,
1993). Brand association can enhance brand image and brand loyalty; therefore,
marketers in restaurants try to develop marketing strategies related to brand
association. In particular, non-product-related associations like the name and logo of
restaurant are vital factors in global brands of the restaurants, because these non-
product-related associations enable consumers to recall and recognise all impressive
things related with brand, such as high quality of food, interior, service and so on.
2.9.6.2 Measurements of Brand Association
A number of researchers have developed scales to measure brand associations (Low
and Lamb, 2000). Keller (1993) proposes three dimensions of brand associations:
favourability, strength and uniqueness. Favourability depends on the extent of
favourable brand evaluations by consumers; strength refers to how information is
encoded and stored in the consumer‘s memory; and uniqueness not only act as an
incentive for brand purchase but also enhances the competitive advantage of the
brand (Keller, 1993).
Chen (1996) develops a consumer-based brand equity scale that reflects brand
associations. The author proposes five variables: perceived quality, functional features,
symbolic associations, emotional associations and innovation.

-82-
Low and Lamb (2000) empirically test a conceptualisation of brand associations.
They propose brand image, brand attitudes and perceived quality as dimensions of
brand associations. They justify the dimensions by explaining that (1) they are most
frequently used to measure consumer‘s perceptions of brands, (2) they have reliable
measures and (3) they have been frequently discussed in previous conceptual studies
(Aaker, 1991; 1996; Keller, 1993; 1998).
Alexandris, Douka, Papadopoulos and Kaltsatou (2008) measure brand associations
related to a fitness club. They use 25 items to measure eight of 16 types of brand
associations developed by Gladden and Funk (2002): popularity, nostalgia, vicarious
achievement, escape, logo attractiveness, management, community pride and affect.
Results of their study indicate that brand associations have a strong effect on
consumer loyalty and that nostalgia, escape, logo attractiveness, pride and affect
contribute significantly to the prediction of loyalty.
The logo, in particular, can help build consumer-based brand equity. A familiar and
distinctive logo can help improve consumers‘ knowledge of the brand and help them
distinguish it from competitive brands (Keller, 1993). Thus, the logo enables
consumers to generate associations by transmitting meanings and supporting
marketing programmes (Keller, 1998).
2.9.7 Brand Identification
The concept of identification has mainly been studied in the social psychology field
and recently has been applied to the research area of marketing. Consumers tend to
express themselves through the use of particular brands (Kim, Han and Park, 2001)
and prefer the brands that can improve self-esteem. In other words, consumers can
enhance their self-image with the images of the brands they choose (RÍo, Vázquez
and Iglesias, 2001). Applying the concept of identification to the relationship between
the brand and consumers offers valuable insights on social identity theory (Kuenzel
and Halliday, 2008).

-83-
2.9.7.1 Social Identity Theory
Social identity theory was developed to comprehend how individuals understand
themselves and others in the social context (Korte, 2007). Within social identity
theory, Taifel (1978: 63) defines social identity as ―... that part of an individual‘s self-
concept which derives from his (or her) knowledge of his (or her) membership of a
social group (or groups) together with the value and emotional significance attached
to that membership.‖ Social identity includes two processes, namely self-
categorisation and social comparison (Hogg and Abrams, 1988).
Individuals tend to categorise themselves as members of various social classifications
such as gender or ethnicity, or membership of organisations (Bhattacharya and Sen,
2003). Therefore, self-categorisation leads people to organise their social context by
formulating meaningful categories of individuals (Solnet, 2006). Individual attitude
and behaviour are based on the categories to which a person belongs (Solnet, 2006).
Individuals desire to have positive self-evaluation through social comparison in-group
and out-group (Amiot, Terry and Callan, 2007). As individuals perceive that in-group
is better than out-group, an individual‘s social identity is enhanced (Amiot and
Bourhis, 2005). Therefore, the individual preserves a positive social identity when the
difference between the in-group and the out-group is maintained (Cameron and
Lalonde, 2001).
Social identification occurs when a person identifies with a specific group (Kuenzel
and Halliday, 2008) and perceives himself/herself in terms of the particular human
group (Ashforth and Mael, 1989). This can be either the group that one is associated
with or the group that one wishes to be in (Bhattacharya, Rao and Glynn, 1995).
Membership of a group provides individual self-esteem and self-concept (Cameron
and Lalonde, 2001). People aim to raise their self-esteem by choosing groups that
possess distinctiveness and prestige (Carlson, Donavan and Cumiskey, 2008).
Social identification theory has mostly been applied to explain organisational
identification (Kim, Han and Park, 2001). Organisational identification is a more
specific type of social identification in which the person believes him/herself to be a
member of a specific organisation (Bhattacharya et al., 1995). Organisational

-84-
identification is the cognitive connection that is made when organisational identity
and a person‘s self contains the same attributes (Dutton, Dukerich and Harquail 1994).
Some researchers have extended the concept of identification beyond the employee to
the consumer (Bhattacharya and Sen, 2003; Sen and Bhattacharya, 2001).
2.9.7.2 The Concept of Brand Identification
Akerlof and Kranton (2000) apply the concept of identity to the field of economics.
They propose that identity can explain various phenomena that current economics is
unable to elucidate. According to Aaker (1996a), brand identity is a unique set of
brand associations that enables the brand to establish a relationship with the consumer
by forming a value proposition comprising emotional, functional or self-expressive
benefits.
Social identity affects a group member‘s intention to participate in collective
activities, and social identity with one‘s brand community influences the consumer‘s
brand identification (Bagozzi and Dholakia, 2006). Hughes and Ahearne (2010:84)
conceptualise brand identification as ―the degree to which people define themselves
by the equal attributes that they believe defines a brand.‖
Bhattacharya and Sen (2003) suggest that identification with a group can occur
without strong ties or interaction with a group. Scotte and Lane (2000) support this
view by arguing that even if individuals are not formal members of the group, they
can seek out identification. This argument is based on the concept that identification
is a psychological perception whereby an individual thinks of himself/herself as being
associated with a special group (Kuenzel and Halliday, 2008).
Brand identification is characterised by a powerful emotional connection with the
brand, and it is possible for individuals to experience optimistic and positive feelings
in the form of strengthened self-esteem when they identify themselves with a specific
brand (Donavan, Janda and Suh, 2005). Hence, companies spend a considerable
amount of money on advertising and other marketing activities to construct a

-85-
psychological link between consumers and a brand (Hughes and Ahearne, 2010).
Identification leads individuals to be psychologically connected to the specific
corporation (Bhattacharya et al., 2003) and consumers who identify with the
corporation have positive purchasing intentions (Wu and Tasi, 2007). Consumers who
identify in this way generate positive word-of-mouth endorsement or
recommendation (Wu and Tasi, 2007) and increased loyalty to the specific
organisation (Adler and Adler, 1987).
However, the definition of brand identification differs from that of brand loyalty (Raj,
1985). While brand loyalty stems from positive experience with the use of a brand,
brand identification is bound with the goals of a particular organisation (Bhattacharya
et al., 1995). Bhattacharya et al. add that all those consumers who identify with the
goal of the organisation are likely to be loyal to its brand, but all consumers who have
brand loyalty are not necessarily identified with the organisation.
Brand is a symbolic source building social identity (Elliott and Wattanasuwan, 1998).
That is, brand has a social identification function, which allows the consumer to
belong to or to dissociate him-/herself from the groups of individuals that constitute
his/her social environment (Rio, Vazquez and Iglesias, 2001). Thus, people express to
others who they are through the brand which they purchase and use (Graeff, 1996).
This is achieved through the process of identification with the brand, with which the
consumer is satisfied. Service brands like restaurant brands have not only their
functional value but also their symbolic value. Some researchers have proposed the
importance of symbolic consumption in building meaningful relationships between
consumers and brands (e.g. Graeff, 1996; Ekinci et al., 2008). Therefore, the majority
of people tend to choose the prestigious and distinctive restaurant that can enhance
their self-esteem.
2.9.7.3 Measurements of Brand Identification
Many scales for measurement of social or group identification have been developed,
and the scales comprise items that measure distinct aspects of identification (Bergami

-86-
and Bagozzi, 2000). Brown, Condor, Mathews, Wade and Williams (1986) developed
an instrument to study intergroup relations in a paper factory and chose awareness of
group membership, evaluation and affect as three facets of identity.
Other researchers have since supported Brown et al.‘s means of measuring brand
identification. Bhattacharya et al. (1995) suggest that identification as a member in an
organisation is associated with the characteristics of organisation and product,
affiliation and activity; that the characteristics of organisation and product are related
to members‘ perceptions of the organisation; that affiliation refers to the
characteristics of a person‘s membership (e.g. length of membership, visibility of
membership); and that activity is associated with individual‘s identity (Bhattacharya
et al.,1995). These factors are closely connected with awareness, affect and evaluation,
which form part of the process of psychological change. In line with these researchers,
Ellemers, Kortekaas and Ouwerkerk (1999: 372) put forward three components of
social identity: ―a cognitive component (awareness of one‘s membership in a social
groupㅡself-categorisation), an evaluative component (a positive and negative value
connotation attached to this group membershipㅡgroup self-esteem), and an
emotional component (a sense of emotional involvement with the groupㅡaffective
commitment).‖
Other researchers have incorporated these approaches as well. Bergami and Bagozzi
(2000) suggest organisational identification, affective commitment and organisation-
based self-esteem as components of social identity. They view that organisational
identification happens through cognitive processes of categorisation. They developed
two measures - a visual item and a verbal item - to measure self-categorisation. A
visual item expresses how one‘s own identities overlap with organisation identity, and
a verbal item indicates how self-image overlaps with organisation image. (Brown,
Condor, Mathews, Wade and Williams,1986).
An emotional component is also important as a component of social identity
(Ellemers et al., 1999). Allen and Meyer (1990:1) define affective commitment as
―emotional attachment to, identification with, and involvement in, the organisation.‖
Ellemers et al. (1999) refer to affective commitment as the desire of a member of an

-87-
organisation to remain as an organisation member. Shaver, Schwartz, Kirson and Cary
(1987) suggest ‗joy‘ and ‗love‘ as two emotional categories for affective commitment.
Bergami and Bagozzi (2000) also propose organisation-based self-esteem as an
evaluative component of social identity. Pierce, Garner, Gummings and Dunham
(1989) define organisation-based self-esteem as the extent to which organisational
members consider their needs can be met and satisfied by taking part in roles within
the organisation‘s context.
In contrast, Wu and Tasi (2007) propose three components (identity membership,
identity similarity and identity loyalty) of identification in their study to investigate
how companies control their consumers‘ identification. They add that identity
membership relates to consumers‘ feelings of membership to the company they
purchased from, that identity similarity is the consumers‘ awareness of resemblance
to the company that they have chosen and that identity loyalty is consumers‘ loyalty
to the company.
Balmer and Liao (2007) have a different perspective that regards categories of
corporate brand identification as a hierarchy, divided into legalisation, realisation and
actualisation. The authors explain that legalisation refers to an institutional concern
such as financial, legal matters and so forth; realisation refers to an institutional
concern like the symbolic and promotional management of the brand; and
actualisation refers to an emotional relationship with the corporate brand.
In conclusion, according to Mael and Ashforth (1992), organization identification can
be defined as a perceptual/cognitive construct in which people see themselves as
psychologically entwined with the fate of the group. They propose a six-item
organisation identification scale. Many researchers have adopted the scale from Mael
and Ashforth‘s (1992) study to measure brand identification (e.g. Bhattacharya et al.,
1995; Kim et al., 2001; Donavan, Janda and Suh,2005 ; Kuenzel and Halliday,
2008; Stokburger-Sauer, 2011). The present research uses Kuenzel and Halliday‘s,
(2008) scale and Mael and Ashforth‘s (1992) scale.

-88-
2.10 Summary
This chapter reviews the concept of brand equity, which has been studied by a
significant number of researchers. Before studying brand equity, it is essential to
consider the attributes of a brand and a product. This review has demonstrated that
there are clear differences between the brand and the product. Invisible values and
images are important for the brand and visible and tangible features are valuable for
the product (Kapferer, 2008). Kapferer (2008) emphasises that a ‗halo effect‘
stemming from a brand can affect consumers‘ perception of the product. A
considerable amount of the research on brands has used consumer-based, financial-
based and integrated perspectives. It is worth noting that brand equity is the value
added by a product or service (Aaker, 1991a). The present research deals with
consumer-based brand equity. It hypothesises that the study of the consumer‘s
psychology regarding consumption is useful for developing marketing strategies. The
academic models of Aaker (1991), Na et al. (1999) and Berry (2000) offer insights
into the value and meaning of a brand from a consumer-based perspective.
In today‘s world, many restaurant brands have been globalised. Adopting a global
perspective is necessary for accounting purposes, marketing productivity (Keller,
1993) and brand extension strategies in international markets (Dacin and Smith,
1994). Consumer-based global brand equity (CBGBE) is composed of many
dimensions, namely brand trust, brand affect, perceived quality, self-congruence,
brand identification, brand awareness and brand association.
Following various empirical analyses, the relative importance of these dimensions is
identified, and their contribution to CBGBE is clarified.

-89-
CHAPTER 3

-90-
CHAPTER 3
ANTECEDENTS AND CONSEQUENCES OF CONSUMER-BASED GLOBAL BRAND EQUITY
3.1 Introduction
Understanding the antecedents and consequences of Consumer-Based Global Brand
Equity (CBGBE) is necessary for developing the research model. This chapter
reviews both the antecedents and the consequences of CBGBE and explores the topic
in three parts. The first part discusses cultural values as antecedents of CBGBE, while
the second and third parts deal with brand reputation and brand loyalty as
consequences of CBGBE.
3.2. Cultural Values as Antecedents of Global Brand
Equity
Nowadays, managers are increasingly dealing with globalised brands and companies
that operate in markets across the world (Pagell, Katz and Shue, 2005). While
managing a global business, it is important to take into account not only the economic
and physical environments of each market (population, geography, climate, etc) but
also its cultural settings (values, religion, communication, social structure, etc)
(Miroshnik, 2002). Many researchers studying the concept of ‗global marketing
strategy‘ have focused on the different competitive strategies adopted by companies
in different nations, with regard to branding and the concept of national culture
(Porter, 1990; Rugman, 1990). Brands also function as cultural markers (Holt, 1998).
Therefore, the brand meaning and brand associations stemming from a brand name
may vary according to the cultural context (Sherry, 1983).

-91-
Regarded as one of the most abstract frameworks that influence human behaviour,
culture has been described in numerous ways. Culture can be considered in terms of
what parts and components it consists of (Baligh, 1994). In addition, culture has a
significant effect on every aspect of human behaviour and it can be subtle or distinct,
direct or oblique, permanent or temporary (Craig and Douglas, 2006). In marketing,
cultural dimensions play a significant role in shaping the brand imagery; they help the
marketer communicate more effectively with the consumers (Banerjee, 2008).
Cultural values are shared in common by the consumers of a particular culture, and,
through brand equity, they affect brand attitude. As brand images are emotionally
involved in the local culture, consumers who belong to different cultures differently
perceive the global brands (Jung and Sung, 2008).
Different cultural elements, such as language, tradition etc. between nations have
become the key issue in the hospitality industry (Bowie and Buttle, 2004). Thus, they
add that these cultural differences can be overcome by global marketing strategies
through effective marketing communication channels.
Rapid globalisation has highlighted the fact that it is significant to have a higher level
of understanding of culture (Craig and Douglas, 2006). Therefore, the following
sections explore definitions of culture, cultural values, national culture versus
organisational culture, Hofstede‘s model of cultural values, materialism as a cultural
value, and measurement of cultural values.
3.2.1 Definitions of Culture
Culture is the foundation of a society and has a significant effect on people‘s
behaviours (Banerjee, 2008). Each country has a distinct set of features (Pagell et al.,
2005), which gives rise to cultural differences between countries. When managers
understand that cultures vary, they also understand differences between global and
domestic brand management (Miroshnik, 2002). However, culture is a complex
concept that it is difficult to define in words (Groeschl and Doherty, 2000).

-92-
The complexity of culture is reflected in its many definitions (Craig and Douglas,
2006). Furthermore, Hofstede (1983:77) asserts that ―there is no commonly accepted
language to describe a complex thing such as a culture…In the case of culture such a
scientific language does not exist.‖
Anthropology has created several definitions of culture, of which the most widely
accepted is perhaps the definition given by Tylor (1881 as cited in Craig and Douglas,
2006:323), who regards culture as ―that complex whole which includes knowledge,
belief, morals, law, custom and any other capabilities and habits acquired by man as a
member of society‖. This classical definition highlights the term man-made as the
basis of culture; that is, culture comes from human activity. In addition, this definition
views culture as having a shared meaning (Kashima, 2000). In psychology, culture is
viewed as the characteristic way a cultural group perceives the man-made
environment (Triandis, 1972). According to this view, culture determines the ways in
which individuals recognise and interpret phenomena, and majority of the consumer
researchers have accepted this view of culture (Craig and Douglas, 2006). While
some researchers view culture as a process of meaning-making, Kashima (2000:21)
proposes that ―culture is a process of production and reproduction of meanings in
particular actors‘ concrete actions in particular contexts in time and space.‖ In
sociology, Namenwirth and Weber (1987:8) define culture as ―a system of ideas that
provide a design for living.‖
The definition of culture can be better understood through the roles of culture. Culture
plays vital roles as follows in our society (Dresser and Carns, 1969):
• Communication with others using a language.
• Prediction of how others in our society are likely to respond to our actions.
• Providing standards for judgement of right or wrong, beautiful and ugly, reasonable
and unreasonable etc.
• Necessary knowledge and skill.
• Identification of us with other people who also have similar background.
In the 1990s, new terms contributed by the complex structure of economics, society,
and science were added to the classical definitions. Many researchers were interested

-93-
in understanding culture in more specific terms. Parts of culture have frequently been
referred to and analysed, for example, social and economic systems, family, religion,
education, language, communication and technology (Ferraro, 1990; Hall and Hall,
1987). Recently, a different view of culture has been proposed, which views it as a
multi-layered construct existing at different levels—global, national, organisational
and group—that encompass an individual (Leung, Bhagat, Buchan, Erez and Gibson,
2005).
In summary, the concept of culture is complex, but culture refers to a way of life that
includes the values, beliefs and behaviours shared by the people within a nation,
group or organisation. In addition, the attitude, beliefs and behaviour of people are
based on their values. In the following subsection, the concept of cultural values is
discussed in more detail.
3.2.1.1 The Concept of Cultural Values
Culture can be categorised into two components: abstract and material (Blackwell,
Miniard and Enrgel, 2007). Blackwell et al. suggest that abstract components refer to
values, ideas, attitudes, symbols and rituals. However, the material component refers
to visible cultural objects that are typical in the society. This view of the components
of culture was supported by Banerjee (2008) who mentioned that culture comprises a
set of values, ideas, artefacts, and other meaningful symbols that assist individuals, as
members of society, in communicating, interpreting and evaluating. Sojka and
Tansuhai (1995) suggest three components of culture: (1) abstract—values and belief
systems; (2) material—artefacts, symbols and rites; and (3) the communication bonds
that unite and preserve a cultural system. Communication transmits intangible
culture—values and beliefs—from one person to another or from one generation to
another (Craig and Douglas, 2006). Moreover, according to Craig and Douglas
(2006), the communication process is essentially dynamic and is constantly evolving.
Moreover, artefacts, from religious icons to shoes or clothing, can also be expressions
of intangible beliefs or values as they indicate that a member belongs to a specific
culture. Figure 3.1 illustrates the components of culture.

-94-
Figure.3.1 Components of culture
Source: Craig and Douglas (2006: 324)
Values and belief systems are intangible elements of culture. Cultural values are
considered fundamental characteristics of a culture as well as a guide for peoples‘
behaviours (Craig and Douglas, 2006). Cultural values are also basic determinants of
how people perceive themselves and others as well how people treat one another
(Banerjee, 2008). In addition, our attitudes and beliefs in relation to success, work,
wealth, competition and other components of our environment are defined by our
values (Banerjee, 2008).
While there exist other intangibles that impact people‘s behaviours and consumption
patterns (e.g. norms, ideals, cultural myths), research has typically focused on
identifying the values emphasised by society (Craig and Douglas, 2006). Hawkins,
Best and Coney (2006) propose that the principal operational system of culture begins
by marking stated borders for individual behaviour; these borders are termed as
norms in a particular social context. Values and norms are considered differently in
the social sciences. Basic values are gleaned from our environment during our early
youth and are programmed in people‘s mind (Hofstede, Neuijen, Daval Ohayv and
Sander, 1990). Hofstede (1984:19) explain that values differ in intensity and
direction: ―If we hold a value, this means that the issue involved has relevance for us
(intensity) and that we identify certain outcomes as good and others as bad
LANGUAGE AND COMMUNICATION
SYSTEMS
MATERIAL CULTURE
AND ARTIFACTS
VALUES AND BELIEF
SYSTEMS CULTURE

-95-
(direction).‖ Trompenaars (1993) reports that a norm is the perception of how we
should behave, whereas a value indicates how we want to behave.
The history of events that a group has experienced together gives rise to commonly
shared beliefs or feelings, which become the basis of their values (Mathews, Ueno,
Kekäle, Repka, Pereira and Silva, 2000). These shared beliefs or feelings are essential
and fundamental for the culture of any group. As a result, culture can exist in any
group consisting of members who have experienced a common history of events that
are learnt and shared concurrently (Banerjee, 2008). This process can be viewed as
the formation of cultural values at different levels.
In summary, values are the most fundamental elements of a culture that influence the
attitudes and behaviour of people. In the market place, cultural values greatly
influence the consumer‘s perception of a product and brand. They are linked to the
consumer‘s decision-making and consumption patterns.
In the following section, national culture and organisational culture are compared and
explained.
3.2.1.2 National Culture versus Organisational Culture
National culture is a collective national characteristic shared by the people of a
particular country (Hofstede, 1991). The three main characteristics of national culture
are as follows: (1) it forms a social group‘s values and behaviours; (2) it is shared
among group members; and (3) it is passed from older members to younger members
of the social group (Adler, 1991).
Hofstede and Hofstede (2005:18) state that:
―Nations that have existed for some time have strong tendencies towards integration: one dominant national language, mass media, a national education system, a national army, a national political system, national representation in sports events with a strong symbolic and emotional appeal, and a national market for certain skills, products and services.‖

-96-
Whereas national culture has been recognised as a construct founded on a variety of
elements within a nation, organisational culture can be defined as (Schein, 2004:17):
―a pattern of shared basic assumptions that was learned by a group as it solved its problems of external adaptation and internal integration, that has worked well enough to be considered valid and, therefore, to be taught to new members as the correct way to perceive, think, and feel in relation to those problems.‖
Hofstede and Hofstede (2005) add that an organisation‘s culture is embedded in the
minds of its members and is reflected in organisation‘s interactions with others,
including consumers, suppliers, labour organisations and the press. Organisational
culture has three components: (1) underlying assumptions, which are the taken-for-
granted and unconscious thoughts that are the basis of values and acts; (2) espoused
beliefs and values; (3) visible artefacts (Schein, 2004). Terawatanavong and Quazi
(2006) observe that an organisation‘s culture is based on the shared values that are
reflected in the behaviour of the employers and employees.
Organisational cultures differ from national cultures in many respects (Hofstede and
Hofstede, 2005). These differences result from the different mixtures of values and
practices of national and organisational cultures (Hofstede and Hofstede, 2005). That
is, the balance of values and practices is the basis of the differences between national
and organisational cultures because levels of culture can be classified differently
according to this balance (Hofstede and Hofstede, 2005).
―Practice‖ can be labelled ―conventions,‖ ―customs,‖ ―habits,‖ ―mores,‖ ―traditions,‖
or ―usages‖ (Hofstede et al., 1990:311). Hofstede and Hofstede (2005) suggest that
the idea of practices comprises three components: (1) symbols such as language,
which carry a particular meaning; (2) heroes as individuals who gain respect in the
culture and are models for behaviour; and (3) rituals, such as how to greet others and
a range of social and religious ceremonies.
Value systems can be examined not only at the individual level but also at the group
or organisational level within society (Craig and Douglas, 2006). As shown in Figure
3.2, culture has several levels: a gender level, which is more basic than nationality; a
social class level with some likelihood of mobility (ascent or descent); an

-97-
occupational level; an industry level; and an organisational level. An occupational
level is placed halfway between nation and organisation.
Figure 3.2 The Balance of Values and Practices for Various Levels of Culture
Source: Hofstede and Hofstede (2005: 285)
Figure 3.2 shows considerable differences in values between national cultures
whereas, within organisational cultures, considerable differences can be seen in
practice for people who hold the same values (Hofstede et al., 1990). The authors add
that this difference can be attributed to the different places where socialisation occurs
for value and practices. Values are acquired from family or the neighbourhood, while
practice is learnt at the work place (Hofstede et al., 1990).
In summary, the differences between national and organisational cultures can be
analysed in terms of how the balance of values and practices at cultural levels mingle.
Hofstede (1994) proposes that the membership of a nation is permanent while the
membership of an organisation is usually partial. In addition, national culture
influences differences in values, beliefs and orientations of organisations across
different countries (Trompenaars, 1994; Black and Mendenhall, 1989; Hofstede and
Hofstede, 2005).
Family
School
Work
Practices
LEVEL
Gender National
Organizational Corporate
Occupational
Industry
Social class Values

-98-
The present study focuses on national culture, and adopts Hofstede and Hofstede‘s
definition (2005) of ‗national culture‘. Hofstede and Hofstede (2005:284) define
national culture as ―part of the mental software we acquired during the first ten years
of our lives, in the family, in the living environment, and at school, and they contain
most of our basic values.‖ Thus, the values, behaviours, and attitudes of a particular
culture are formed by the collective ‗mental software‘ (Morden, 1999). That is,
national culture may be constituted by the components of a society within a nation.
3.2.2 Measurements of Cultural Values Because values are the steady elements of culture, the measurement of cultural values
is important in a cross-cultural study. Hofstede‘s dimension is one of the most widely
accepted cultural values by management and marketing researchers. The following
section describes Hofstede‘s model of cultural values in greater detail.
3.2.2.1 Hofstede’s Model of Cultural Values Hofstede developed a dimensional model of cultural values to show differences
between national cultures (Hofstede, 1980). He collected data from IBM employees
in 66 different countries between the years 1967 and 1973. His analysis of the data
revealed cultural differences among countries. He established the following cultural
value dimensions: collectivism/individualism, masculinity/femininity, power distance
and uncertainty avoidance. Long/short-term orientation was later added as a fifth
dimension (Hofstede, 1991). Hofstede‘s cultural value dimensions have been used to
illustrate differences between cultural groups (Kanousi, 2005). The attractive
attributes of Hofstede‘s dimensions are that sample size and codification of country
characteristics are assigned a numerical score (Furrer, Liu and Sudharshan, 2000).
Therefore, these cultural dimensions are often cited in studies of culture (Focht,
Maloles III, Swobida, Marschett and Sinha, 2008). Table 3.1 shows Hofstede‘s
cultural value dimensions.

-99-
Table 3.1 Hofstede’s Cultural Dimensions
Dimension Low High
Individualism
ㆍSocial networks are the primary source of information. ㆍCollective interests prevail over individual interests. ㆍOpinions are predetermined by group membership.
ㆍMedia is the primary source of information. ㆍEveryone has the right to privacy. ㆍConsumption patterns show self-supporting lifestyles.
Masculinity
ㆍThe roles of women and men are similar. ㆍResolution of conflicts by compromise and negotiation. ㆍThe roles of men and women are not similar.
Power Distance ㆍInequalities among people should be minimised. ㆍInequalities among people are expected and desired.
Uncertainty Avoidance
ㆍLow stress and anxiety. ㆍThere is fast acceptance of new products and
technologies, such as e-mail and the Internet.
ㆍThe uncertainty inherent to life is a continuous threat that must be fought.
ㆍPeople feel less happy.
Long-Term orientation
ㆍEfforts should produce quick results. ㆍRespect for tradition. ㆍFew savings, little money for investment.
ㆍPerseverance or sustained efforts towards slow results. ㆍRespect for circumstances. ㆍLarge savings, funds available for investment.
Source: Hofstede and Hofstede (2005: 39-238)

-100-
Hui and Triandis (1986) view collectivism as ‗concern‘, which bonds and links with
other. Thus, high concern is typical of collectivism. Collectivists regard themselves as
members of groups and highlight ‗we‘ over ‗I‘ (Yoo and Donthu, 2002). Therefore,
collectivists value the group‘s opinion and harmony with in-group members. In a
collectivistic society, the behaviour of a consumer is likely to depend on others, that is,
people are more likely to want social approval (Jung and Sung, 2008). In contrast,
individualists emphasise self-concept, free-will, and personal achievement (Yoo and
Donthu, 2002). Therefore, in an individualistic culture, people are less likely to be
pressured to buy brands that are not self-expressive (Foscht et al., 2008).
The masculinity dimension refers to the dominant sex role patterns (Hofstede, 1980),
and different countries have different gender roles (Pagell et al., 2005). In masculine
cultures, it is common to stress power, ambition, competition, and success; in contrast,
countries that have higher degrees of femininity emphasise teamwork, sacrifice, and
helpfulness (Hofstede, 1980).
Inequalities exist in areas such as wealth, prestige, and law. Power distance measures
how a particular society copes with inequalities (Hofstede, 1994). Even though both
high and low power distance societies have hierarchical power relationships, these
relationships can be accepted differently (Pagell et al., 2005). In high power distance
societies, people look for guidance and direction from their superiors, and less
powerful people can endure the fact that other members are more powerful (Jung and
Su, 2008). In a low power distance culture, a partner is prone to be involved more
willingly in decision-making processes (Kale and McIntyre, 1991).
Although uncertainty is universal, it is not equally stressful for all people or societies
(Hofstede, Jonker and Verwaart, 2008). Uncertainty avoidance measures the degree to
which countries or people regard certainty as important (Pagell et al., 2005). Cultures
that practice intensive rituals and beliefs in order to deal with unpredictability are
termed uncertainty avoiding (Hofstede et al., 2008). People with strong uncertainty
avoidance believe that standards and norms are important for predicting the actions of
others (Vitell, Nwachukwu and Barnes, 1993). For example, people in strong
uncertainty avoidance countries tend to prefer restaurants with suitable standards,
whereby they can avoid uncertainty when choosing a place to eat.

-101-
Long-term orientation is the degree to which a society presents a future-oriented
viewpoint (Hofstede, 1980). On Hofstede‘s (2005) long-term orientation index, a high
score indicates persistence, thrift, and having a sense of shame, whereas a low score
indicates reciprocation of greeting, personal steadiness, and stability.
Overall, Hofstede‘s cultural framework combines many important cultural concepts
(Chandy and Williams, 1994). Therefore, the cultural dimensions developed by
Hofstede and Hofstede (2005) have been adopted in a substantial amount of research.
By using Hofstede‘s cultural measure, researchers can find meaningful relationships
between a culture and the perceptions of its people as well as important demographic,
economic, and political indicators of society (Kale and Barnes, 1992).
Although many researchers have used Hofstede‘s framework, the dimensions in this
framework may be criticised for several reasons: First, the employees of IBM who
were participants in the survey were mostly male; hence more differences were likely
to exist between men and women than with regard to nationality (Horton, Rose and
Blodgett, 2001). Second, the data obtained from the survey were collected more than
20 years ago (Fernandez, Carlson, Stepina and Nicholson, 1997).
Importantly, although there are criticisms of Hofstede‘s measure, the measure can
explain many culture differences, and such a measure can be useful in order to
estimate cultural differences regarding service quality (Donthu and Yoo, 1998).
Moreover, Hofstede‘s framework has offered a foundation for research on cross-
cultural marketing (Blodgett et al., 2008). Merritt (2000) has reconfirmed the
construct validity of Hofstede‘s dimensions in his research. Many recent studies
continue to cite Hofstede‘s original dimensions of national culture in decision-making
research (Pagell et al., 2005).
Therefore, the present research adopts Hofstede‘s cultural dimensions in order to
examine the influence of culture on differences in perception of CBGBE between
British and South Korean consumers.

-102-
3.2.2.2 Materialism as a cultural value
In addition to Hofstede‘s cultural dimensions, materialism has been adopted as a
cultural dimension in the present research because materialism is a useful variable for
comparing cultures (Richins and Dawson, 1992).
In modern society, the dominance of consumption is a worldwide trend. Products play
a vital role in culture, and possessions are essential to people‘s lives and identities
(Richins and Dawson, 1992). The attitudes and values focusing on possession can be
thought of as materialism (Browne and Kaldenberg, 1997). Hence, materialists
believe possession is the greatest source of satisfaction.
Materialism is described as ―a mind–set…an interest in getting and spending‖
(Rassuli and Hollander, 1986:10). Richins and Dawson (1992) propose three themes
that have appeared consistently in materialism research: first, materialists emphasise
possessions and acquisition; second, materialists believe that possessions and their
acquisition are essential for happiness; and finally, materialists use possessions and
acquisition to judge success.
Materialism is a value (Richins and Dawson, 1992), something that guides attitudes,
actions, and judgements and allows people to compare specific objects and situations
(Rokeach, 1973). When defining materialism as a value, we see that materialism
reflects the fact that the source of happiness is possession (Belk, 1984), and
possessions and their acquisition are more important than other activities and matters.
Consequently, many researchers who have explored materialism at a cultural level
have adopted materialism as a value concept.
3.2.2.3. Measurements of Cultural Values
Many scholars have recently attempted to concretise the concept of culture,
comparing countries by means of measurements (Mooij and Hofstede, 2002). Table
3.2 represents the measurements of cultures used in marketing with relation to brand.

-103-
Table 3.2 Measurements of Cultural Values
Researcher Dimensions of Cultural Values Applied Area Measurement
Scale Analysis Methods Key Findings
Richins and
Dawson (1992)
Materialism
5-point likert-type scale
Exploratory factor analysis Reliability (coefficient alpha, test-retest reliability)
Confirmatory factor analysis Descriptive statistics
Materialism can be regarded as a value and considered to be a set of centrally held beliefs about the importance of possessions.
Furrer,Liu
and Sudharshan
(2000)
Power distance Individualism/ Collectivism Masculinity/ femininity Long-term orientation
Retail banking services
7-point likert-type scale
Correlation Cluster analysis
Perceived quality of service varies according to cultural groups. The authors show that Hofstede‘s dimensions of cultural values are related to the importance of the SERVQUAL scale dimensions.
You and Donthu (2002)
Collectivism Uncertainty avoidance Masculinity Power distance Confucian dynamism
Under graduate students
5-point likert-type scale
Descriptive statistics
Confirmatory factor analysis
Cronbach‘s Alpha
Students‘ level of marketing ethics is in relation to formal and informal education and cultural values.

-104-
Researcher Dimensions of Cultural Values Applied Area Measurement
Scale Analysis Methods Key Findings
Stedham and Yamamura
(2004)
Power distance Individualism/ Collectivism Masculinity/ femininity
t-Test Mean comparisons Pearson correlations
Gender differences are revealed in power distance in Japan and in individualism/collectivism in Japan and theUSA. Gender differences in masculinity/femininity are not found in either country.
Tai (2004)
Power distance Individualism Masculinity/ feminity Uncertainty avoidance Long-term orientation Realism/idealism, Materialism
Advertising between
USA and Hong Kong
6-point interval scale
Multiple regression Chi-square test Simple correlation
Transformational advertising is positively associated with collectivism and long-term orientation, whereas informational advertising is positively related to realism. However, the other four variables are not significantly connected with the advertising message strategy used.
Kanousi (2005)
Power distance Individualism/ Collectivism Masculinity/ femininity Long-term orientation
7-point likert type scale
Descriptives and reliability Multiple regression
Individualism, masculinity and long-term orientation dimensions influence the expectation of service recovery.

-105-
Researcher Dimensions of Cultural Values Applied Area Measurement
Scale Analysis Methods Key Findings
Sangkhawasi and
Johri (2007)
Materialism (luxury, display, money-oriented, material-oriented, leading concern, value regard)
Perceived status of car product (Mercedes Benz)
5-point likert type scale Correlation
The results of the research indicated that the correlations between materialism and perceived status of MB were significant and positive. Therefore, status products can satisfy a materialist‘s mind and thus increase the sense of materialism.
Foscht et al. (2008)
Individualism Collectivism Power distance Masculinity/ femininity Performance- orientation
Energy Drink Brand (Red Bull)
7-point likert-type scale
Discriminant analysis
This study shows that a same brand can be recognised differently in different cultures; thus, it is necessary to highlight the common characteristicof the goods.
Jung, Su, Baeza and
Hong (2008)
Power distance Individualism Masculinity Uncertainty avoidance Long-term orientation
Consumer electronics Construction Plant equipment Engineering Consulting service industries
5-point likert-type scale
Mean and standard deviation scores Factor analysis Regression analysis
The total quality management practices are affected by power distance, long-term orientation and individualism.

-106-
Researcher Dimensions of Cultural Values Applied Area Measurement
Scale Analysis Methods Key Findings
Yoo (2009) Collectivism-individualism
Shoe brands (Puma, Reebok, Adidas, Nike)
5-point scale ANOVA MANOVA
Collectivistic orientations had an impact on brand equity and loyalty toward brand.
Gong (2009)
Low-context cultures High-context cultures Monochronic cultures Polychronic cultures Uncertainty avoidance
B2C e-commerce
t-Test, Non-parametric correlation analysis
High-context cultures, polychromic cultures and uncertianty avoidance are helpful for B2C e-commerce adoption and diffusion.

-107-
As indicated in Table 3.2, many management and marketing scholars have used Hofstede‘s
study in their research (Sodergaard, 1994). Furrer et al. (2000), You and Donthu (2002) and
Kanousi (2005) employ five of Hofstede‘s cultural dimensions, namely,
individualism/collectivism, power distance, masculinity/femininity, uncertainty avoidance,
and long-term orientation for their research in the service context. In particular, You and
Donthu (2002) investigate college students‘ marketing ethics. They employ 26-item scale
developed to measure Hofstede‘s cultural dimension. Stedham and Yamamura (2004) use
Hofstede‘s (1980) model of cultural values to investigate gender differences on the basis of
culture. They conclude that gender differences in masculinity/femininity are not found in
Japan and the USA. Thus, the researchers point out that Hofstede‘s framework may need to
be revised in order to explain gender-based differences in culture.
Foscht et al. (2008) propose the performance orientation dimension as a cultural value
dimension. Performance orientation concerns people‘s success and material things; thus, in
countries with high performance orientation, people work to live, and success is the only
factor considered, whereas in countries with low performance orientation, people live to
work (Foscht et al., 2008). In fact, performance orientation is also known as achievement
orientation or masculinity (Hofstede and Pedersen, 1999). However, Foscht et al. view the
performance orientation dimension as different from the masculinity dimension.
Ger and Belk (1996) found, in their empirical study, that perception of materialism is
different across nationalities. Thus some researchers propose materialism as a cultural
dimension (e.g. Tai, 2004; Sangkhawasi and Johri, 2007). In Tai‘s research, materialism is
the idea that being affluent and rich is the emphasis in life (Hong, Muderrisoglu and
Zinkham, 1987). Sangkhawasi and Johri (2007) emphasise that status brand strategies
encourage materialism at an acceptable level. In addition, the characteristics of the brand,
such as symbolic meaning, emotional appeal, and quality have a strong impact on
materialists because consumers may associate these brand characteristics with self-
congruence or brand association.
Many researchers have mentioned a variety of materialism measures, but none of these
measures have commonly accepted standards (Richins and Dawson, 1992). However, the
measures of Richins and Dawson (1992) are often founded in the literature (Xu, 2008;

-108-
Browne and Kaldenberg, 1997; Ferle and Chan, 2008), and Richins and Dawson‘s study
states that in order to determine the appropriate measurement approach for materialism, it is
necessary to investigate the nature of the construct itself. On the basis of the
conceptualisation of materialism, Richins and Dawson developed three dimensions, namely,
success, centrality, and happiness, and included 18 items. However, the authors recommend
using 15 items instead of 18. Similarly, Gu and Hong (2009) employ acquisition centrality,
novelty seeking, and susceptibility to social influence as dimensions of materialism.
Hall (1976) proposes low/high context, monochromic/polychromic cultural classifications.
Context is defined as the way individuals and their society seek information and knowledge
(Gong, 2009). People in high context cultures obtain information from personal information
networks. In contrast, people in low context cultures obtain information from reports,
databases, and the Internet (Morden, 1999). Hall (1976) mentions that high context cultures
emphasise collective goals and needs and make ‗us-them‘ categories; whereas low context
cultures emphasise individual goals and needs and accept individuals‘ uniqueness. High
context cultures and low context cultures correspond with a collectivist society and an
individual society, respectively (Hofstede, 2001). Hall (1976) also distinguishes between
monochromic cultures and polychromic cultures on the basis of a culture‘s attitude towards
time. Monochromic cultures are associated with low context cultures, and polychromic
cultures are related to high context cultures (Kotable and Helsen, 2001).
In conclusion, a greater variety of cultures have formed in today‘s world than ever before
due to the social diversification arising from industrialised and materialism-oriented
societies. In particular, service in the restaurant industry has unique and distinctive traits.
Therefore, it is worth researching culture in terms of service and developing cultural
dimensions with regard to the restaurant industry in the context of globalisation.
For cultural research, Tai (2004) highlights the consideration of valid culture models.
Notably, using proper dimensions for analysis is necessary because culture varies according
to nationality and additional factors. Although Hofstede‘s (2005) cultural dimensions have
some limitations, they have been widely adopted by many scholars. In addition, it is
accepted that materialism has become a cultural value that is significant enough to be
central to today‘s society. Thus, You and Donthu‘s (2002) and Jung et al.‘s (2008) scales,

-109-
based on Hofstede‘s (2005) dimensions, and Richins and Dawson‘s (1992) materialism
scales can be adopted for the present research.
In the following section, the consequences of brand equity in the restaurant industry will be
analysed.
3.3 Brand Reputation as a Consequence of Consumer–Based Global
Brand Equity
This part of the chapter examines brand reputation, which is one of the outcomes of brand
equity. The first section defines brand reputation, on the basis of previous research. The
second section clarifies the differences between brand reputation and brand image by
comparing the two concepts. Brand reputation as perceived by the consumer and the
company is discussed in the third section. Finally, the fourth section explains how brand
reputation can be measured for an empirical study.
3.3.1 Brand Reputation
Both scholars and practitioners agree that the importance of brand reputation has increased
in recent years (Veloutsou and Moutinho, 2009), and a number of research studies have
been conducted in this field (e.g. Abimbola and Vallaster, 2007; Andreassen, 1994; Fan,
2010). Reputation is a valuable intangible asset for a company (Carvana, 1997) because it
plays an important role in consumer purchase decisions (Omar et al., 2009). This is
particularly true in the service sector given the intangible character of a service and the
difficulty in evaluating its quality without experience (Herbig and Milewicz, 1995). A good
brand reputation helps customers reduce their risk in choosing a service (Fombrun and
Rindova, 1998).
In general, the terms ‗brand reputation‘ and ‗corporate (company) reputation‘ are used
interchangeably because ―the name of the company is often the brand name‖ (Berry,
lefkowith and Clark, 1988:28). Berry argues that ―the company becomes the primary brand

-110-
rather than the product.‖ In line with this argument, the present study also uses the term
‗brand reputation‘ to refer to corporate (company) reputation.
3.3.1.1 Definitions of Brand Reputation
Every brand name carries a symbolic meaning that helps the consumer make a purchasing
decision (Milewicz and Herbig 1994). A brand name is often the package for a company‘s
reputation: high performance level of one product is commonly transferred to another
product through the brand name (Moorthy, 1985). Thus, brand reputation is defined as the
perception of the quality in relation to the brand name (Aaker and Keller, 1990).
Despite the growing research in this field, the concept of brand reputation is still ambiguous
because of the conflicting, and overlapping definitions (Chun, 2005). Although reputation
has been studied within various disciplines such as sociology, psychology, economics,
business strategy and marketing, fragmented research efforts and the lack of a
multidisciplinary approach have led to difficulties in defining brand reputation (Smaiziene
and Jucevicius, 2009).
In the field of sociology, researchers focus on the collective nature of reputation (Einwiller,
2001). This perspective highlights the social facet of reputation that is evident as a result of
a social network in which information about a brand is transmitted to others via various
media or by word-of-mouth (Granovetter, 1985). This view is supported by the belief that
reputation is the shared perception of the public and is constructed or destroyed by them
(Einwiller, 2001).
In psychology, reputation is a method for evaluating risk that consumers use while
interacting with a firm (Dalton and Croft, 2003). That is to say, reputation allows consumers
to anticipate the future behaviour of the firm, and therefore plays an important role in the
purchase decision (Smaiziene and Jucevicius, 2009). In economics, reputation is viewed as
an indicator of a firm‘s possible action and behaviour towards consumers in the market
(Fomburn and van Riel, 1997). Within the discipline of business strategy, reputation is a

-111-
distinguishing intangible asset that is difficult to copy (Mahon, 2002) and hence has an
impact on company competitiveness (Grant, 1998).
In the field of marketing, researchers view reputation not only as a power that attracts
consumers and prompts them to develop loyalty, but also as a factor that impacts the
selling–buying process (Smaiziene and Jucevicius, 2009). Marketing researchers also
believe that reputation is related to attitudes and beliefs (Andreassen, 1994). ―Attitudes are
feelings and beliefs that people develop about objects, events, people and issues over a
lifetime through learning and experientially interacting with people and the environment‖
(Wright, 2006:256). Wright (2006) argues that as feelings become stronger, a belief can
become an attitude and attitudes involve longevity and generalisation. Interestingly, this
view of attitudes is consistent with the concept of reputation. Schwaiger (2004) describes
reputation as being concerned with attitudes and defines affect (emotion) and cognition
(beliefs) as components that conceptualise reputation. Consumers form beliefs about a
brand on the basis of the knowledge and information obtained from their direct or indirect
experiences and their feelings towards brand that shapes their attitude (Wright, 2006).
Therefore, ―a brand‘s reputation refers to the attitude of consumers that the brand is good
and reliable‖ (Afzal et al., 2010:45).
Varying perspectives on brand reputation have made it difficult to arrive at a consensus with
regard to the definition. However, in an attempt to find an integrative definition, researchers
have identified four elements that are common to most definitions (Omar, Williams and
Lingelbach, 2009): (1) company‘s fame - good or bad (Brown, 1995); (2) past actions
(Weigelt and Camerer, 1988); (3) net effective or emotional reactions (Fombrun, 1996); and
(4) information cues (Fombrun and Shanley, 1990).
In addition, there are some keywords that can be found in the definitions of reputation
(Smaiziene and Jucevicius, 2009): socio-cognitive nature, collectivity, esteem, reliability
and trustworthiness, and evaluation formed over a period of time. On the basis of the above
keywords and elements, researchers have proposed comprehensive definitions of reputation.
According to Herbig and Milewicz (1995:5), ―reputation is an aggregate composite of all
previous transactions over the life of the entity, a historical notion, and requires consistency
of an entity‘s actions over prolonged times.‖ Gotsi and Wilson (2001:25) define reputation

-112-
as ―a stakeholder‘s overall evaluation of a company over time.‖ This evaluation depends on
the stakeholder‘s direct experiences with the company (Gotsi and Wilson, 2001).
In summary, brand reputation has multiple definitions, which reflect the different
perspectives on the concept. Nonetheless, some scholars have offered comprehensive
definitions, and the most widely used among those is Fombrun‘s definition (1996:72): ―a
perception representation of a company‘s past actions and future prospects that describes
the firm‘s overall appeal to all of its key constituents when compared with other leading
rivals.‖ The definition of brand reputation becomes much clearer through a comparison with
brand image.
3.3.1.2 Distinction between Reputation and Image
It is essential to differentiate between brand reputation and brand image. Sometimes
reputation and image are used interchangeably (Dowling, 1994), which can cause confusion
(Markwick and Fill, 1977). However, the two constructs have distinct features. Table 3.3
summarizes differences between reputation and image.
Table 3.3 Distinction between Reputation and Image
Reputation Image
Duration of Establishment Long-term duration Short-term duration
Change Stable and enduring Changes frequently
Emanating from inside or outside the firm Inside and outside Inside
Represents Evaluations aggregated Individual‘s impression
Relation Related to self-esteem and favourability towards the company Related to the brand
Targets Consumers, investors, employees,
partners, business communities, and so on.
Consumers
Source: Adapted from Jackson (2004); Cornelissen (2004); Walker (2010); Weiss, Anderson and Maclnniss (1999)

-113-
As shown in Table 3.3, one of the important differences between reputation and image is
time (Walker, 2010). Many researchers suggest that brand image can be created in a short
time, whereas reputation takes much more time to construct (Gray and Balmer, 1998;
Jackson, 2004; Cornelissen, 2004). Therefore, reputation is enduring and stable but image
may change often (Walker, 2010). This is because reputation is based on experience.
Consumers can form an image of a brand without having experienced it (Chun, 2005),
whereas reputation can only be built through direct or indirect experiences (Selnes, 1993;
Andreassen, 1994; Gotsi and Wilson, 2000).
Consumers decide their behaviour on the basis of attitudes, which can be associated with
their beliefs about the attributes and benefits of the brand (Keller, 1993). An attitude or
belief toward a brand relies on previous experience (Andreassen, 1994). Consumers cannot
obtain information on certain products or services without experiencing them (Caruana,
1997). Typically, consumers who do not have any, or enough, experience depend on the
brand‘s reputation to form their attitudes and beliefs towards the brand (Andreassen, 1994).
Another major difference between the two terms is that one is associated with an aggregated
evaluation while the other with individual impression. Einwiller (2001) argues that in
contrast to the brand image, which exists in the memory of each individual, reputation
represents the social/collective evaluation of the firm. This view is supported by
Cornelissen (2004), who states that image is a sudden impression emerging out of an
individual‘s mind in response to a signal from the firm, but reputation is many evaluations
aggregated over a long period of time.
Moreover, according to Jackson (2004), the targets of reputation and image are different:
whereas image has only the consumer as a target, reputation targets consumers, investors,
business partners, employees, and others. As they have different targets, companies adopt
different marketing decisions and actions to create and manage their reputation and image
(Smaiziene and Jucevicius, 2009). In other definitions of reputation, researchers focus on
keywords such as esteem and favourability (Weiss et al., 1999; Sage, 2002).
As explained above, reputation and image are different concepts. Brand image reflects
associations linked to a brand, logo, symbol, name or trademark of a company (Fillis, 2003).

-114-
On the other hand, reputation is a collective estimation of the trustworthiness and integrity
of a company based on its past actions (Fombrun and van Riel, 1997). As can be seen by
comparing brand reputation and brand image, in terms of long-term benefit for the company,
brand reputation has a stronger impact than brand image. The following section discusses
the role of brand reputation in greater detail.
3.3.1.3 The Role of Brand Reputation
Reputation has been accepted as one of the main factors driving the management
performance of a company (Key, 1995). It is necessary to examine the role of reputation
from the perspective of both the consumers and the company.
Many researchers suggest that for consumers, reputation is a signal of trust (Šmaižienė,
2008). Reputation is seen as credibility, trustworthiness and honesty, acquired from a
consumer‘s past experience with a product or service (Afzal et al., 2010). Thus, reputation
becomes a tool for attracting and maintaining consumers (Šmaižienė, 2008). Moreover,
consumers tend to believe that products or services with a good reputation have better
quality (Dowling, 1994). They anticipate that the more positive the reputation, the better the
brand‘s ability to meet their expectations (Veloutsou and Moutinho, 2008). Therefore,
consumers are willing to pay a premium price for a brand with reputation (Preece, Fleisher
and Toccacelli, 1995; Fombrun and Van Riel, 1997)
In addition, reputation has been studied particularly in the area of global marketing; and
reputation may be evaluated in terms of the outcomes of the firm‘s promise and its
fulfilment of that promise (Flavián and Guinalíu, 2007). In business strategy literature, the
role of reputation as a tool assessing risk is emphasized (Šmaižienė, 2008). Reputation acts
as a substitute for guarantor (Ferris, Blass, Douglas, Kolodinsky and Treadway, 2003).
Reputation acts as safeguard against deficient information, thus positive reputation that
expresses a low level of risk stimulates buying decisions (Šmaižienė, 2008). Consumers
depend on reputation for evaluating the firm‘s trustworthiness and estimating their risk level
as well as decision to buy in the absence of comprehensive information about a company
(Šmaižienė, 2008). Saxton (1998) explains that brand reputation brings about expectations

-115-
about the crucial attributes of a company and the company‘s future behaviour. Therefore,
brand reputation has an impact on the consumers‘ perceptions of a company‘s ability to
convey satisfaction to its consumers (Fombrun and Van Riel, 1997).
In contrast, from a company‘s point of view, the chief of company considers reputation as a
significant intangible asset that provides a company with a continuous positioning benefit
(Hall, 1992). It enables stakeholders to anticipate the company‘s future outcomes (Weigelt
and Comerer, 1988, cited in Chernatony, 1999), and helps consumers choose between many
seemingly similar brands (Dowling, 1994). More importantly, reputation is related to a
company‘s brand extension (Keller, 2003). Consumers who are already familiar with other
brands or products of a company are likely to accept new products easily. In addition,
reputation influences the company‘s power to draw better investors (Milgrom and Roberts,
1986) as well as acting as a bar against imitation (Fombrun, Garderg and Sever, 2000)
In conclusion, a good reputation is beneficial to both the consumer and the company. The
reputation of a product or service influences the consumers‘ purchasing decision process
(Cretu and Brodie, 2007). In other words, it encourages purchase by simplifying the
decision regulation (Andreassen, 1994). Moreover, it ensures higher consumer retention
(Preece et al., 1995) and increases repurchases. For a company, its brand reputation
contributes to its financial results (Šmaižienė, 2008). For example, in the restaurant industry,
brand reputation is very important. This is mainly because the services of a restaurant, such
as food quality (e.g. Dutta, Venkatesh and Parsa, 2007; Kivela, Inbakaran and Reece, 1999;
Soriano, 2002), staff behaviour and physical quality (Ekinci, 2001) are intangible and
cannot be evaluated exactly before experiencing (Nguyen and Leblanc, 2001). Therefore,
when choosing a restaurant, consumers tend to depend on the service provider‘s reputation.
3.3.1.4 Measurements of Brand Reputation
Researchers have tried to identify measures of reputation that capture the true nature of the
reputation (Chetthamrongchai, 2010). It has been assessed using two indicators reflecting
the company‘s overall reputation (Shapiro, 1983, Zeithaml, 1988). The first item evaluates
the absolute level of reputation (positive-negative) and the second item evaluates the

-116-
relative reputation, estimated in relation to the company‘s competitors.
According to Caruana (1997), reputation can be seen to have two components: an overall
impression component and an object-specific component. The researcher explains that the
overall impression component exists at a corporate level or when the corporate name is used
as a brand. Similarly, Sullivan (1998) proposes that overall impression is common to all
products that share the same brand name and refers to those quality features that are not
specific to individual products; whereas the product-specific component indicates attributes
that can be recognized as belonging to one product or another.
Fomburn, Gardberg, and Sever, (2000) devised the RQ (reputation quotient) model to
measure brand reputation. In the RQ model, reputation is defined as the collective
perceptions of diverse stakeholders about a firm‘s performance, Moreover because company
performance is a multi-dimensional construct, reputation is also expected to be multi-
dimensional (Fomburn et al, 2000). The authors developed a scale of reputation through a
five-step process: define construct, design scale, pilot test, administer scale & analysis items,
and validation & norming. They proposed that reputation is composed of two factors:
emotional appeal (the first factor) and rational appeal (the other five factors: product and
service; vision and leadership; workplace environment; social and environmental
responsibility; and financial performance).
Commonly, the RQ model is compared with the Corporate Character Scale (CCS) proposed
by Davies, Chun, Da Silva and Roper, (2003). As CCS was validated among consumers and
employees, a comparison between the two perspectives and the identification of any gaps
between them is possible (Chetthamrongchai, 2010). Davies et al. (2003) emphasise that
CCS relies on the personification metaphor of ‗company as person‘ to measure corporate
reputation. The five main dimensions under CCS are agreeableness, competence, enterprise,
chic, and ruthlessness, which reflect people‘s descriptions of a company brand (Davies et al.
2003). Veloutsou and Moutinho (2008) used two other constructs to measure the long-term
brand reputation in their study: brand reputation and sustainable image. Table 3.4 shows
some of the strategies for measuring corporate reputation.

-117-
Table 3.4 Measurements of Brand Reputation
Researcher Dimensions of Brand Reputation
Applied
Area
Measurement Scale
Analysis Methods Key Findings
Selnes (1993)
Absolute level of reputation Relative reputation
Life insurance Telephone company Business college Salmon feed supplier
Maximum likelihood LISREL VII
Result of research shows that brand reputation has a strong effect on loyalty, and satisfaction only has an effect on loyalty as customers can assess product quality through their direct experience. Moreover, as perceived quality and brand reputation are correlated and affect loyalty, they are the drivers of satisfaction and loyalty.
Andreassen (1994)
Public sector (public services)
6-point likert scale
Factor analysis Regression analysis
Reputation is correlated with satisfaction and loyalty. Improving consumers‘ perception about service quality, special management of customer voice and government‘s reputation have an impact on consumer satisfaction and loyalty.
Caruana (1997) Beverage firm
5-point likert scale
Exploratory factor analysis Cronbach‘s alpha
Through the four focus groups and the survey, a 14-item scale is determined.

-118-
Researcher Dimensions of Brand Reputation
Applied
Area
Measurement Scale
Analysis Methods Key Findings
Fomburn et al. (2000)
Emotional appeal Products and service Vision and leadership Workplace environment Social and environmental responsibility Financial performance
Publicly traded firms
Factor analysis Cronbach‘s alpha
The Reputation QuotientSM is developed, which is a valid and reliable measure for evlauating the company‘s reputation.
Cretu and Brodie (2007)
Hair salons 10-point likert scale
Cronbach‘s alpha Confirmatory factor analysis Structural equation modeling using LISREL
The brand image specifically affects the consumers‘ perceptions of product and service quality whereas the company‘s reputation widely influences perceptions of customer value and customer loyalty.
Veloutsou and
Moutinho (2009)
Long- term brand reputation
(brand reputation, sustainable image)
A mix of undergraduate and part-time MBA students in Scotland
5-point likert Type scale
Descriptive statistics Cronbach‘s alpha Stepwise linear regression analysis
Brand tribalism is more useful than brand epu reputation when building up consumer-brand rela relationships.

-119-
The present research uses two constructs to measure the long-term brand reputation
developed by Veloutsou and Moutinho (2008). In order to assess the relationship between
objects accurately, scale development needs to be based on the characteristic traits of the
object, since the scale may yield the different results. Traditionally, the main measure of
reputation has revolved around financial aspects; however, many researchers including
Fombrun et al. (2000) and Davies et al. (2003) have favoured the use of an ‗emotional
appeal‘ factor (Chetthamrongchai, 2010).
3.4 Brand Loyalty as a Consequence of Consumer-Based
Global Brand Equity
This part deals with brand loyalty, which is one of the consequences of brand equity. The
first section presents a comprehensive overview of brand loyalty. The second section
provides insights into the importance of brand loyalty; that is, it investigates the
characteristic traits. The third section reviews three definitions of brand loyalty that need
further exploration, not only in order to understand them in-depth, but also to adopt one of
them for the current study. The fourth section examines in detail which measurements of
brand loyalty correspond with which given concepts.
3.4.1 Brand Loyalty
Nowadays, managers are concerned with gaining an enhanced understanding of the
relationship between brand equity and brand loyalty (Taylor et al., 2004). Loyalty is one of
the consequences of brand equity (Ross, 2006) and the most widely accepted and generally
applicable outcome (Alexandris et al., 2008).
If a brand satisfies its consumer, he or she will show loyalty by repurchasing (Selnes, 1993).
Aaker (1991) and Keller (1993) argue that loyalty is related to a variety of factors; one of

-120-
the major factors is the experience of use. In particular, service products tend to depend on a
prior purchase or experience (Paswan Spears and Ganesh, 2007).
When designed brands fit a consumer‘s personality or self-image, or when the consumer
pursues satisfaction through the unique benefits that are provided by the brand, brand
loyalty grows (Quester and Lim, 2003). Quester and Lim emphasise that personal
attachment occurs towards the brand in both cases.
Since loyal consumers are assets of brand equity, the company can reduce the marketing
cost by doing business with the loyal customers. Keeping customers loyal is advantageous
for the company. A company can improve customer loyalty through differentiated brand
marketing strategies such as brand extension and market penetration (Rundle-Thiele and
Bennett, 2001).
In light of the above, practitioners and academics regard brand loyalty as an important
strategy for a company‘s survival (Gounaris and Stathakopoulos, 2004). In the restaurant
industry, for example, the ultimate marketer‘s goal in brand-relationship development is to
lead a customer to loyalty towards the brand in the competitive environment of the
restaurant industry. Developing a brand with strong brand equity that comes from great
confidence is a major prerequisite for drawing brand-loyal consumers (Lassar et al., 1995).
In line with this, in the present research brand loyalty is considered as an important
consequence of brand equity. The following section presents the importance of brand
loyalty.
3.4.2 Why is Brand Loyalty Important?
In today‘s competitive marketing environment, most companies understand that obtaining
and retaining brand loyalty from consumers is critical for the survival of a company. Hence,
most companies develop marketing strategies to attract loyal consumers. The advantages of
brand loyalty are as follows:
● Continued profit: The benefits of brand loyalty are long-term and cumulative; thus, when

-121-
a consumer maintains loyalty for a long time, the company can realise a profit from that
single consumer (Reichheld, 1996).
● Reduced marketing costs: Companies invest money in marketing to attract new
consumers, but these costs are eliminated or minimised for loyal consumers (Reichheld,
1996).
.
● Reduced uncertainty: New consumers tend to delay their buying decisions when the
purchase is uncertain. However, if existing consumers have loyalty to a brand, it can reduce
the uncertainty that new consumers feel (Aaker,1991).
● Provides a competitive advantage: Brand loyalty assists consumers to resist the strategies
of competitive brands (Dick and Basu, 1994). Brand loyalty provides companies with some
protection from competition; hence, companies can obtain a sustainable competitive
advantage (Gounaris and Stathakopolous, 2004). Moreover, a company can retain a price
differentiation over a competing company because of its product‘s ability to meet the
consumer‘s needs (Reichheld, 1996).
● Increased price premiums: When a brand has a unique value that cannot be found in
other brands, brand loyal consumers are willing to pay more for the brand, and a simple
discount is less likely to attract loyal consumers (Reichheld, 1996).
● Increase per-customer revenue growth: Consumer expenditure tends to increase over
time. For example, consumers who repeatedly purchase the same company‘s product
become more familiar with the company‘s full product line, and they will be likely to try
other product lines in the same company (Reichheld, 1996).
● Decreased operating costs: It costs less to serve loyal consumers who are familiar with a
company‘s products and services because such consumers depend less on the company‘s
employees for information and help (Reichheld, 1996).
● Leads to positive word of mouth: Loyal consumers make positive word-of-mouth and
recommend the brand to others (Dick and Basu, 1994).

-122-
As a result of loyalty, firms can secure premium prices, continuous profit and a greater
market share. In the case of the restaurant industry, restaurants try to obtain and maintain
brand loyalty from consumers, as it is easier to serve loyal consumers than non-loyal ones
(Tepeci, 1999). In the following section, the definition of brand loyalty will be discussed
from three perspectives through a review of previous literature.
3.4.3 Definitions of Brand Loyalty
In marketing literature, many researchers agree that brand loyalty is a complex construct.
Hence, the definition of brand loyalty is not sufficiently comprehensive or consistent
(Javalgi and Moberg, 1997).
Two approaches to the construct of brand loyalty are the behavioural approach and the
attitudinal approach. ―Behaviour approach is concerned with a consistent purchase
behaviour of a specific brand over time and attitudinal approach relies on a favourable
attitude towards a brand‖ (Quester and Lim, 2003:26). In addition, Jacoby and Chestnut
(1978) propose the integration of the behavioural notion and the attitudinal notion to define
brand loyalty.
In brief, brand loyalty is a multi-dimensional concept that can be sorted into behavioural,
attitudinal and composite categories. The following subsections address these three
approaches in more detail.
3.4.3.1 Behavioural Brand Loyalty
From a behaviour perspective, consumers who demonstrate brand loyalty purchase the same
brand systematically (Odin, Odin and Valette-Florence, 2001). The factor that defines
behaviour brand loyalty is the consumer‘s purchase behavior (Dekimpe, Steenkamp,
Mellens and Abeele, 1997). Therefore, the repeat purchase of a special brand demonstrates

-123-
brand loyalty in terms of a behavioural approach (Quester and Lim, 2003).
Newman and Werbel (1973:404) found that ―purchase of the same brand twice in
succession typically has been used as evidence of loyalty.‖ Similarly, McConnell (1968:14)
proposes that ―Brand loyalty exists when a consumer selects the same brand for at least four
successive trials.‖
Some researchers propose behaviour loyalty as the proportion of purchases devoted to a
specific brand (e.g., Cunningham, 1956; Blattberg and Sen, 1974). Hence, behavioural
loyalty is indicated by the percentage or share of purchase (Bennett and Rundle-Thiele,
2004). Cunningham (1956:118) mentions, ―single-brand loyalty is the proportion of total
purchases represented by the largest single brand used.‖ With regard to the proportion of
purchases, Bennett and Rundle-Thiele (2004) defines behavioural loyalty as the proportion
of total expenses of one consumer that are dedicated to one specific brand retailer.
According to Bennett and Rundle-Thiele (2004), the greatest value of behavioural brand
loyalty is that the loyal consumer rarely purchases services or products from other retailers.
Furthermore, some researchers focus on the frequency of purchase (e.g., Ehrenberg, 2000;
Kuehn, 1962; Sheth, 1968). Kuehn (1962:12) defines brand loyalty as ―a function of the
frequency and regularity of brand that has been selected in the past.‖ Sheth (1968: 398)
supports this argument by mentioning that ―brand loyalty is a function of a brand‘s relative
frequency of purchase in time-independent situations and it is a function of relative
frequency and purchase pattern for a brand in time dependent situations.‖
The probability of future purchase behaviour is a consideration in some research. Repeat
purchase probability can be estimated on the basis of a series of previous purchases
(Oppermann, 2000). Frank (1962) finds that the more often the same brand is purchased
within a purchase sequence, and the more recent the special brand purchase, the more likely
it is that the consumer will repurchase that brand (Oppermann, 2000).
In summary, the behaviour approach focuses on the consistent purchase of a particular
brand over time (Bandyopadhyay and Martell, 2007). Therefore, researchers who study
brand loyalty from a behavioural perspective observe purchasing patterns, the proportion of

-124-
overall purchases, purchase probability and frequency of purchase. However, it has been
pointed out that the behavioural approach cannot explain psychological attachment to brand.
Bandyopadhyay and Martell (2007) note that recent studies have approached brand loyalty
beyond behaviour measures by turning to situational factors (such as stock-out and non-
availability), intrinsic factors (such as individual fortitude) or socio-cultural factors (such as
social bonding) to account for the difference between repeat purchases and brand loyalty.
For example, Dick and Basu (1994) highlight the need to include attitudinal influences in
the loyalty concept. The next subsection explains attitudinal brand loyalty in more detail.
3.4.3.2 Attitudinal Brand Loyalty
From the attitudinal standpoint, behavioural definitions are not enough to explain how and
why consumers develop and modify brand loyalty in their minds (Dick and Basu, 1994). In
addition, it is difficult to differentiate between repeat purchases and brand loyalty (Jacoby
and Kyner, 1973). Therefore, some researchers have explored brand loyalty from a
psychological perspective. They have argued that mental factors are important for building
brand loyalty (Bennett and Rundle-Thiele, 2002). That is, when positive feelings and affects
are added to a brand, loyalty can be shown as an attitude. Attitudinal researchers have been
interested in how the function of attitudinal loyalty operates in the complex mindset of
consumers. Therefore, in the attitudinal approach, based on consumer brand preferences or
intention to purchase, brand loyalty is an attempt on the consumer‘s part to go beyond
behaviour and express their loyalty in light of psychological commitment or statement of
preference (Yoon and Uysal, 2005). Commitment provides an essential basis for
distinguishing brand loyalty from other forms of repeat purchasing behaviour (Reynolds,
Darden and Martin, 1974). That is, ―true brand loyalty implies commitment‖ (Quester and
Lim, 2003: 27).
Based on these views, Reynolds et al., (1974) define brand loyalty as a tendency for a
person to uphold similar attitudes in situations that are similar to those he/she has faced
before. They also emphasise that a favourable attitude to a brand had to be maintained over
several years.

-125-
Overall, attitudinal loyalty is a psychological attachment or commitment that a consumer
has towards a particular brand. Importantly, the present research adopts attitudinal loyalty as
a consequence of brand equity. Brand loyalty in the restaurant industry, for instance, can be
better understood through the concept of attitudinal loyalty. In the restaurant industry,
consumers prefer brand, which provides delight as a positive emotional state. Delight with
service is positively associated with brand loyalty and results in repurchase intentions and
willingness to recommend a brand (Paswan, Spears and Ganesh, 2007). A richer
comprehension of brand loyalty with respect to its attitudinal construction would be useful
for marketers, not only for choosing and developing their target markets, but also for
developing loyalty-building and consumer-retention strategies (Quester and Lim, 2003).
3.4.3.3 Composite Brand Loyalty
Another category of brand loyalty is composite brand loyalty. Many scholars have assessed
brand loyalty as including both behavioural and attitudinal components (Jacoby and Kyner,
1973; Oliver, 1999; Chaudhari and Holbrook, 2001). Researchers have also suggested that
the behavioural dimension alone cannot completely catch the reasons behind a purchase and
thus the attitudinal dimension is also related (Baloglu, 2002). Chaudhari and Holbrook
(2001), and also Oliver (1999), affirm the superiority of the two-dimensional approach to
brand loyalty.
In terms of a complex multi-dimensional concept of brand loyalty, many researchers have
tendered definitions. Newman (1966) was the first to attempt an approach that equates
behavior patterns with preferences to infer loyalty (Day, 1969). Day (1969) points out that it
is difficult to distinguish between ‗true‘ loyalty and ‗spurious‘ loyalty related to consistent
buying of one brand. In addition, spurious consumers lack attachment to a brand, and they
readily move from one brand to another. Therefore, Day (1969) emphasises that to be truly
loyal, both buying a brand and having a positive attitude toward it are necessary.
Jacoby and Kyner (1973: 2) support this notion by stating that.brand loyalty should have six
collectively sufficient conditions. A ccordingly their definition of brand loyalty is as
follows:

-126-
―(1) the biased (i.e. non-random), (2) behavioural response (i.e. purchase), (3) expressed over time, (4) by some decision-making unit, (5) with respect to one or more alternative brands out of a set of such brands, and (6) is a function of psychological (decision-making, evaluative) processes.‖
Jacoby and Kyner (1973) view brand loyalty as a behavioural response and as a function of
psychological processes. Likewise, Dick and Basu (1994) suggest that it is necessary to
broaden the range of the concept of brand loyalty to include attitudinal affects. Dick and
Basu (1994:99) emphasise the cognitive, affective and conative components of attitude that
are likely to have an impact on a consumer‘s relative attitude/repeat-patronage relationship:
―Customer Loyalty is viewed as the strength of the relationship between an individual‘s relative attitude and repeat patronage. The relationship is seen as mediated by social norms and situational factors. Cognitive, affective and conative antecedents of relative attitude are identified as contributing to loyalty, along with motivational, perceptual and behavioural consequences.‖
Social scientists propose that people‘s attitudes should be divided into three classes -
cognition, affect, and conation (or behavioural intention) (Bagozzi, 1978; Breckler, 1984).
This view is supported by Oliver (1997), who likewise asserts that attitudinal brand loyalty
should be assessed in three phases: cognitive, affect and conation. Oliver (1999: 35-36) also
introduced a four-stage loyalty model, as follows:
• Cognitive loyalty: In the first loyalty phase, the brand attribute information available to the consumer indicates that a brand is preferable to its alternatives.
• Affective loyalty: At the second phase of loyalty development, a liking
or attitude toward the brand has developed on the basis of cumulatively satisfying usage occasions.
• Conative loyalty: The next phase of loyalty development is the conative
(behavioural intention) stage, as influenced by repeated episodes of positive affect toward the brand. Conation implies a brand-specific commitment to repurchase.
• Action loyalty: In the action control sequence, the motivated intention
in the previous loyalty state is transformed into a readiness to act. The action control paradigm proposes that this is accompanied by an additional desire to overcome obstacles that might prevent the act.

-127-
Consequently, many marketing researchers point out that repeat purchase without a
favourable attitude toward the brand does not reflect ‗true‘ brand loyalty. This is because
‗true‘ brand loyalty requires an attitudinal approach based on psychological commitment.
However, this approach shows limitations in which weighting or quantified scores may not
be applicable to both the behavioural and attitudinal factors, and they may require differing
measurements (Yoon and Uysal, 2005). In the following section, measurements of brand
loyalty are discussed in detail.
3.4.4 Measurements of Brand Loyalty
In spite of the numerous brand loyalty measurements proposed in marketing research, there
is no consensus on how to measure brand loyalty (Bennett and Rundle-Thiele, 2002).
However, brand loyalty generally has been measured according to either behaviour
measurements, attitudinal measurements or composite measurements.
3.4.4.1 Measurements of Behavioural Brand Loyalty
From the behavioural perspective, loyalty is seen as effective consumer behaviour towards a
specific product and brand. In measuring loyalty, behaviour can be more easily observed
and evaluated than attitudes; moreover, behaviour data can be collected at less cost than
attitudinal data, especially in extended longitudinal studies of brand loyalty (Dekimpe et al.,
1997).
Behavioural loyalty to brand can usually be measured by purchase behaviour (Newman and
Werbel, 1973). Jacoby and Chestnut (1978) classified the behaviour approach into five
types: brand purchase sequence, brand purchase proportion, brand purchase probability,
synthesis measures and miscellaneous measures. Brown (1952 as cited in Oppermann,
2000: 79) suggests four brand purchase sequences; namely, undivided loyalty (purchase
sequence: AAAAAA), divided loyalty (ABABAB), unstable loyalty (AAABBB), and
irregular sequences (ABBACDB). A number of researchers have used the proportion of

-128-
purchases of a particular brand compared to all purchases as a behavioural measure (e.g.,
Cunningham, 1956; Bennett and Rundle-Thiele, 2004). It has been suggested that consumer
purchase shares ranging from 100% to about 50% are indicative of brand loyal behaviour
(Oppermann, 2000). The higher the percentage is, the stronger the consumer‘s loyalty to a
specific brand. The probability of purchase is represented by a count of repeat purchase
probabilities on the basis of a series of previous purchases (Oppermann, 2000).
In addition, East, Gendall, Hammond and Lomax (2005) propose brand retention, duration
of time, repeat purchase, share-of-category expenditure and portfolio size as measures of
behavioural loyalty. Moreover, other researchers measure behavioural loyalty according to
the amount of brand switching (Javalgi and Moberg, 1997) or frequency of purchases (e.g.,
Ehrenberg, 2000). With regard to measurements of behavioural brand loyalty, several
previous studies are summarised in Table 3.5.

-129-
Table 3.5 Measurements of Behavioural Brand Loyalty
Researcher Dimensions of Brand Loyalty
Applied Area
Measurement Scale
Analysis Methods Key Findings
Oppermann (2000)
Proportion of purchase Purchase probability
Tourism destination
Loyalty Scale; nonpurchaser, unsteady, loyal, very loyal
Frequency
Destinations will be able to determine the composition of its customers in relation to their loyalty toward tourism destination.
Martenson (2007) Groceries 4 graded scale
Maximum-likelihood (ML) methods
A brand‘ image is important for consumers‘ satisfaction. Moreover, when the atmosphere of store is neat and the store is aware of its customers‘ needs, customers can be satisfied.
Romaniuk and Nenycz-Thiel
(2011)
Buying frequency Share of category requirements.
Hot beverages
Chi-squared tests One-way ANOVA Correlations Linear regression
A higher purchase frequency and a higher share of category requirements create more brand associations. Moreover, share of category requirements have a greater impact on brand association than purchase frequency.

-130-
As can be seen from Table 3.5, Oppermann (2000) investigates the application and
usefulness of tourist destination loyalty from a behavioural perspective. Destination loyalty
was measured using only the behaviour dimension because it is easier and faster to collect
data on customers‘ previous purchase history without including attitudinal instruments
(Oppermann, 2000). For research, he selected a household sample from telephone books,
using a systematic random approach. The application of two measurements (proportion of
purchase, purchase probability) indicates their validity for a tourism destination choice over
a longer time period (Oppermann, 2000).
Martenson (2007) measures store loyalty by how much the respondent bought in the store.
This study investigates three important facets (the store as a brand, manufacturer brands,
store brands), and ‗store as a brand‘ was more important than the other facets (Martenson,
2007).
Romaniuk and Nenycz-Thiel (2011) study the relationship between past brand loyal
behaviour and consumers‘ current brand associations. The brand purchasing data was
collected from a chain‘s loyalty card over a one-year period and brand associations were
collected through a consumer online survey (Romaniuk and Nenycz-Thiel, 2011).
Overall, behavioural measurement is based on actual purchase behaviour or on reported
purchase behaviour (e.g., Romaniuk and Nenycz-Thiel‗s research, 2011). Therefore, it is
easy for a company to implement behavioural approaches because some of the data - the
purchase, or even purchase history - are already available to them (Oppermann, 2000).
However, the behavioural approach (e.g., repeat purchases, frequency of purchases)
measures brand loyalty without considering the cognitive aspects of brand (Ha, 1998).
Hence, it cannot directly indicate whether the consumer feels an attachment to the brand.
Some researchers assert that psychological processes must be included to confirm true
loyalty.
3.4.4.2 Measurements of Attitudinal Brand Loyalty
The premise of the attitudinal approach of brand loyalty is that ―brand loyalty is more than

-131-
just repeat purchase behaviour‖ (Quester and Lim, 2003:27). Attitudinal measures employ
data that reflects emotional and psychological attachment to brand (Bowen and Chen, 2001).
Therefore, attitudinal measures provide an understanding of the factors causing brand
loyalty (Oppermann, 2000).
One of the earliest measurements used for the attitudinal approach was Guest‘s (1942)
‗brand preference‘; however, later the author (1955) asserted that favourable attitudes ought
to be maintained for several years (Oppermann, 1999). Similarly, Gounaris and
Stathakopoulos (2004) propose that preferences are important components of attitudinal
loyalty.
Attitudinal brand loyalty is composed of brand attitudes. Hence, Dick and Basu (1994)
propose the cognitive, affective, and conative components of attitude. In particular, Jacoby
and Kyner (1973) suggested that all three components of attitude should be incorporated.
As can be seen from Table 3.6, Quester and Lim (2003) and Yuksel, Yuksel and Bilim
(2010) adopt the cognitive, affective, and conative dimensions of attitudinal approaches of
brand loyalty for their studies. In particular, Yuksel et al. (2010) employ three for measuring
affective loyalty, which reflect the extent to which a customer ‗likes‘ the destination and its
services; and two items are used in order to measure conative loyalty toward the destination
that is studied (i.e., commitment and purchase intentions).
Other measures of attitudinal loyalty are: commitment (e.g., Beatty and Kahle, 1988;
Gounaris and Stathakopoulos, 2004), intention to repurchase (e.g., Zeithaml, Berry and
Parasuraman, 1996; Oliver, 1999; Lee and Cunningham, 2001; Harris and Ezeh, 2008), re-
patronage intentions (e.g. Oliver, 1999), and word-of-mouth (e.g. Zeithaml et al., 1996;
Evanschitzky and Wunderlich, 2006), willingness to recommend (Paswan, Spears and
Ganesh, 2007).
Table 3.6 summarizes previous studies regarding measurements of attitudinal brand loyalty.

-132-
Table 3.6 Measurements of Attitudinal Brand Loyalty
Researcher Dimensions of Brand Loyalty
Applied Area
Measurement Scale Analysis Methods Key Findings
Quester and Lim (2003)
Cognitive Affective Conative
Sports shoes Trainers Ball-point pens
7 point likert scale
Principal component analysis
Validity and reliability test
The relationship between product involvement and brand loyalty includes different aspects of product involvement for each of the products concerned.
Bennett and Rundle-Thiele
(2004) Advertising
service Structural equation modeling
Satisfaction and attitudinal loyalty have different constructs; although the relationship exists between them, high levels of attitudinal loyalty are not always generated by high levels of satisfaction.
Paswan, Spears and Ganesh
(2007) Recommendation International
Students market
9-point semantic differential scale.
Principal component
factor analysis Coefficient alpha
ANOVA MANOVA
Multiple regressions analysis
Consumers who purchase their preferred service brand are likely to be more satisfied with the attributes of the obtained brand and show a higher level of brand loyalty.

-133-
Researcher Dimensions of Brand Loyalty
Applied Area
Measurement Scale Analysis Methods Key Findings
Harris and Ezeh
(2008)
Loyalty intention
Restaurant patrons
7-point likert Scale
Principal component factor analysis Correlation analysis Multiple regression analysis
A model is developed to assess the effects of nine servicescape variables on customers‘ loyalty intentions. A great deal of significant associations with loyalty intentions are revealed through analysis of survey responses.
Yuksel et al. (2010)
Cognitive Affective Conative
Tourism destination
5-point likert Scale
Structural equation modeling (SEM) in AMOS 5
Positive emotional and cognitive connection with a place could affect the individual‘s assessment of a tourism destination and his/her loyalty to the place.

-134-
In summary, a number of different attitudinal brand loyalty measures have been proposed:
brand preference, brand commitment, intention to purchase and three phases of attitudinal
loyalty: cognitive, affective and conative. Rundle-Thiele and Bennett (2001) point out that
brand loyalty measurement should be chosen according to the type of market that is being
measured. In service markets, ―collecting behavioural loyalty statistics can be difficult and
long time periods are needed to examine brand-switching patterns (Rundle-Thiele and
Bennett, 2001:31).‖ In addition, while behavioural measurements mostly rely on
longitudinal data, attitudinal measurement studies have focused on cross-sectional data
(Oppermann, 1999). In the restaurant industry, service experiences result in cognitive and
emotional responses (Edvardsson, 2005) so attitudinal measurements are applied because
they are based on the consumer‘s emotional and psychological attachment to a restaurant
brand. In addition, Oliver (1997) asserts that in order to be truly brand loyal, consumers
should express a four-stage loyalty package: cognitive, affective, conative and action loyalty.
Importantly, since the restaurant industry has invisible and variable characteristics (e.g.,
staff behaviour, food quality and taste, and so on), the emotional and psychological process
of forming true brand loyalty is important. Therefore, the present research adopts an
attitudinal approach for brand loyalty measurement in the restaurant industry.
3.4.4.3 Measurements of Composite Brand Loyalty
Several researchers have argued the necessity of using both attitudinal and behavioural
brand loyalty measurements. These studies have regarded brand loyalty as both a result of
repeat purchase behaviour and an outcome of cognitive attitudes towards a particular brand
(Back and Park, 2003). They have pointed out, therefore, that using behavior measures or
attitudinal/cognitive measures alone is not sufficient for evaluating brand loyalty. Moreover,
Newman and Werbel (1973) point out that an evaluation based on two different measures
seems to produce better results than considering repurchase alone. Table 3.7 summarises
previous related research on measurements of composite brand loyalty.

-135-
Table 3.7 Measurements of Composite Brand Loyalty
Researcher Dimensions of Brand Loyalty
Applied Area
Measurement Scale Analysis Methods Key Findings
Newman and Werbel (1973)
Brand purchase Brand deliberation
6 types of major appliances
Multiple classification analysis (MCA)
The findings showed positive relationships between brand loyalty and satisfaction with the appliance, and age of household head and the presence of children in the home.
Back and Parks (2003)
Cognitive Affective Conative Behavioural brand loyalty
Lodging industry
7-point likert scale
Reliability analysis Confirmatory factor analysis Structure equation model
The results of this research showed that attitudinal loyalty has a significant mediating effect on the relationship between the consumer satisfaction and behaviour brand loyalty.
Chitty, Ward
and Chua (2007)
Psychological perspective: (brand attitudes) Behavioural perspective: (habitual behaviour)
Youth hostel
7-point likert scale
Descriptive statistics Confirmatory factor analysis (AMOS) Structural equation modelling
Brand image is an antecedent of satisfaction with a hostel, whereas perceived value shows the extent of loyalty towards the ‗brand.‘

-136-
Researcher Dimensions of Brand Loyalty
Applied Area
Measurement Scale
Analysis Methods Key Findings
Russell-Bennett, McColl-
Kennedy and Coote (2007)
Attitudinal loyalty: (repurchase intentions, commitment) Behaviour loyalty: (actual purchase)
Small business
Confirmatory factor analysis Path estimate SMCs (square multiple correlations)
Attitudinal loyalty is an important antecedent of behaviour loyalty, and attitudinal loyalty and the antecedents that were studied (i.e., purchase satisfaction and category involvement) have significant relationships.
Matzler, Grabner-
Kräuter and Bidmon (2008)
Attitudinal loyalty (commitment and willingness to pay a higher price), Purchase loyalty (purchase probability)
Mobile phone
5-point scale
Partial least squares
Consumer risk aversion is significantly connected to attitudinal loyalty and repurchase loyalty. The relationship between consumer risk aversion and brand loyalty is mediated by brand affect and brand trust.
Ha, Janda and Park (2009)
Attitudinal loyalty Behavioural loyalty
Retail superstore
5-point likert scale
Confirmatory factor analysis, Structure equation analysis
The research model clearly illustrates the process of brand loyalty formation and the model proves the mediating role of satisfaction in the process of brand loyalty formation.

-137-
Overall, a composite approach to brand loyalty can be inspected from ‗psychological‘
and ‗behaviour‘ perspectives (Chaudhuri, 1999). In several areas, researchers have
applied composite measurements as a valuable tool for understanding brand loyalty
(Bowen and Chen, 2001). However, Day (1969:30) points out the problem with this
approach: ―loyalty index combines a one-time estimate of brand attitude with an
interval estimate of purchase probability, thus there is a possibility that the attitude
component of the brand loyalty score may not be accurate during some of the time
period required to estimate the purchase probability.‖ Therefore, composite loyalty
measurements are not very practical (Oppermann, 2000).
3.5 Summary
This chapter examines the antecedents and consequences of Consumer-Based Global
Brand Equity (CBGBE). There has been a considerable interest in brand equity.
However in this era of globalisation, the antecedents and consequences of CBGBE
for the restaurant industry are not well understood. To explore these variables for the
restaurant industry, the first part of this chapter deals with cultural values as an
antecedent of CBGBE. The literature review on cultural values includes definitions,
concepts, national culture versus organizational culture and measurements. Notably,
the majority of previous studies have followed Hofstede‘s dimensions, which consist
of collectivism/individualism, masculinity/femininity, power-distance, uncertainty
avoidance, and long/short-term orientation. The present study also adopts Hofstede‘s
dimensions, which are widely accepted by many researchers (e.g. Furrer et al., 2000;
Stedham and Yamamura, 2004; Tai, 2004; Yoo, 2009; Gong, 2009) because they
reveal clear differences between cultural groups (Kanousi, 2005). In addition to
Hofstede‘s dimensions, materialism is adopted as a new dimension in this study. This
is because materialism has a significant impact on the consumer‘s consumption
behaviour (e.g., Xu, 2007; Delaney, Burke and Gudergan, 2005; Yoo and Lee, 2009).
The second part of the chapter discusses brand reputation and brand loyalty as
consequences of CBGBE. Brand reputation consists of definitions, the distinction
between reputation and image, role and measurements. Brand reputation is the

-138-
attitude of consumers (Andreassen, 1994; Schwaiger, 2004; Afzal et al., 2010), which
is based on the evaluation stemming from consumers‘ direct experiences (Gotsi and
Wilson, 2001). Brand loyalty is composed of definitions and measurements of
attitudinal brand loyalty, behavioural brand loyalty, and composite brand loyalty.
Importantly, brand loyalty measurement needs to be tailored to the market type. Since
the service market is unstable and high involved, attitudinal measures of brand loyalty
are more appropriate for the evaluation of the consumer‘s perception regarding a
service (Rundle-Thiele and Bennett, 2001). This should be based on the unique
characteristics of the service including intangibility and heterogeneity.

-139-
CHAPTER 4

-140-
CHAPTER 4
THE RESEARCH MODEL
4.1 Introduction The previous chapters are useful in order to establish a better understanding of
theoretical constructs. This chapter offers insights into the research model and
research hypotheses. It is worth noting that developing an adequate research model is
essential for achieving the research objectives. A mixture of quantitative and
qualitative research methods can be used for developing measures and, hence,
obtaining clear outcomes of a study (Saunders, Lewis and Thornhill, 2007).
The proposed research model is based on both the literature review and fieldwork
interviews. This chapter refers to the qualitative semi-structured interviews that were
used to assess the validity of the research model; and the literature review that was
used to help define the key variables and the research hypotheses.
4.2 Developing the Research Model Interviews provide a better understanding in the early stage of research (Saunders, et
al., 2007). The purpose of semi-structured interviews in this study was mainly to
identify missing variables for the research model. To achieve this goal, a qualitative
study undertaking interviews with five British and five South Korean consumers who
have a high degree of experience of global restaurant brands was carried out in April
2010. The British consumers were: 1) a 24-year-old female teacher; 2) a 47-year-old
female librarian; 3) a 55-year-old male teacher; 4) a 31-year-old male student; 5) a
25-year-old male student. The Korean consumers were: 1) a 29-year-old male student;
2) a 45-year-old man working in a travel agency; 3) a 52-year-old housewife; 4) a 42-
year old female lecturer; 5) a 37-year-old male engineer.

-141-
Each interview began with questions regarding the participants‘ visit experiences at a
restaurant (e.g. ‗Please select one of your favourite restaurant brands from the above
list‘; ‗Please identify your favourite restaurant brand‘; ‗How many times have you
eaten in this restaurant in the last 12 months?‘). The following questions were intended
to help the interviewees recall their thoughts and feelings related to the experience of a
restaurant (e.g. ‗How do you feel about eating in this restaurant?‘). Some questions
needed to identify participants‘ value judgements of consumption from a cultural
perspective (e.g. ‗When deciding your choice, how much do you consider your
personal situation or is this an impulsive decision?‘; ‗Who in your family group,
friends or work colleagues decides which restaurant to eat in?‘; ‗If you visit another
city or nation would you want to eat in the same brand of restaurant or in another one?
Why?‘ ‗If there are none of your favourite brand restaurant in another city or nation,
how can you get information about other restaurants, e.g. newspaper, magazine,
internet, opinion-seeking and deciding by yourself etc.?‘).
Importantly, some of the interview questions intended to identify missing variables
(e.g. ‗What factors are important in this decision?‘; ‗If you would like to change your
favourite restaurant brand, what would be the reason for changing it?‘; ‗Are there
other factors that influence this decision that we have not spoken about yet?‘). This
was followed by questions asking respondents about their attitudinal loyalty toward
the restaurant industry (e.g. Why do you like to eat in this restaurant?). The interview
questions can be found in Appendix A.
4.2.1 Findings of the Interviews: Qualitative Study
The interview data collected was transcribed and analyzed. The first procedure of
analysis was categorisation. Saunders et al., (2007) add that the identification of
categories is guided by the purpose of research. Although the same data is used,
another researcher who has different objectives may formulate different categories
(Dey, 1993).

-142-
The words interviewees used in the process of the interviews were formulated into
four categories which were largely based on the previous literature review: good
reputation (e.g. Milewicz and Herbig, 1994), state of brand, (e.g. Fombrun and
Shanley, 1990; Cretu and Brodie, 2007), positive Word-of-Mouth (WOM) (e.g.
Milewicz and Herbig, 1994), tradition of the brand (e.g. Chun, 2005).
British respondents 1, 2 and 4; and South Korean respondent 4 explained that the
brand reputation is in relation to good WOM as follows:
―I wouldn‘t want to go and eat in a restaurant that people
don‘t like‖ (British 1).
―If I heard that somewhere is really nice, or if someone said there is a
fantastic restaurant, I would be very interested in going‖ (British 2).
―The opinions of others have influence on my decision of which
restaurant‖ (British 4).
―If I heard from my friends that there is a very famous and reputable
restaurant, I would want to go to the restaurant‖ (South Korean 4).
Interviewees (British 1, 2, 4 and South Korean 4) have confidence in the restaurants
that people say are ―really nice,‖ or that people have liked for a long time or that
people recommend.
Notably, the majority of both British and South Korean respondents mentioned good
reputation as a factor that influence buying decision (British 1 and South Korean 1, 4).
―The decision point is reputation‖ (British 1).
―I would usually likely to be associated with a brand having a high
reputation‖ (South Korean 1).
―I think the reputation of the brand is the most important point when
choosing the restaurant brand‖ (South Korean 4).
With regard to a state of brand, British 5 mentioned:

-143-
―A state of brand namely, brand reputation is an essential factor for me
to decide purchasing brand‖ (British 5).
South Korean 1 mentioned tradition as the reason to devote to a brand:
―Tradition of the brand is the reason to satisfy me‖ (South Korean 1).
Importantly, the results of the study suggest that brand reputation can be added as part
of the decision to purchase in a restaurant for both British and South Korean
respondents. Namely, brand reputation was found to be a missing variable.
The analysis of data shows the relationship between brand reputation and brand
equity. British respondent 5 emphasized that brand reputation has a relationship with
perceived quality of restaurant brands:
―Interestingly, brand reputation includes good value in terms of
reasonable quality and quantity of food. Thus, most young guys
tend to prefer to use these global restaurant brands in which they
can choose without distrusting it.‖
In relation to brand identification, South Korean respondent 1 said that the brand with
the highest reputation allows people to express themselves to others through
purchasing the brand: ―Young respondents seemed to prefer global brands to local
brands because they would regard themselves as the same state the brand has.‖
Moreover, South Korean respondent 3 also explained that people like to belong to a
high level position by choosing the brand with a high reputation. For instance:
―In case someone asks me about what kind of food I enjoy, I prefer
to answer ‗I enjoy having steak at a family restaurant‘ not just
saying ‗steak.‘ This is based on the fact that the price of food in
this family restaurant is not cheap.‖
With regard to self-congruence, South Korean respondent 1 mentioned the following:
―I would usually like to express myself to my friends through using the brand.‖

-144-
Maintaining brand trust is essential for global brands, because the majority of global
consumers are likely to purchase without hesitation. South Korean respondents 2, 3
and 4 also suggested what brand reputation is in relation to trust:
―I trust the brand with a reputation absolutely won‘t disappoint me
because the reputation comes from building sincere relationships
between the brand and consumers.‖ (South Korean 4)
―Brand reputation regarding honesty and trust can play a role in
preventing damage to the brand image. It seems that the global
restaurants try to continuously sustain their own brand
reputation.‖ (South Korean 3)
―Customers do not want to visit a restaurant if they see in the news
that it has been criticized for having a severe problem of food
hygiene.‖ (South Korean 2)
Awareness and image - perceptions about a brand reflected by the brand associations
(Keller, 1998) - are associated with brand reputation. A brand with familiarity and
good image creates and attempts to maintain good brand reputation. British (5) and
South Korean (1, 2, 3, 4, and 5) interviewees mentioned familiarity formed by a large
number of restaurant chains, or advertisements. In addition, distinctive mottos, logos
and symbols were mentioned as important for brand association (South Korean 2 and
5). British 3, 4 emphasised fair-trade and ethical business for good brand image.
It is worth noting that brand reputation relates to how consumers rely on brand in
their selection in today‘s world. This is supported by South Korean respondent 2:
―Even though some brands actually are not good as much as brand
reputation, the brands with reputation can capture consumers‘
mind.‖

-145-
As a consequence, brand reputation can be an important consequence of CBGBE as a
new variable for the present research. Importantly, this is based on the fact that firstly,
the dependent variable is of primary interest to the researcher whose goal is to
understand and measure it (Sekaran, 2003); secondly, in the cross cultural study of
Britain and South Korean, it is important to use a variable, brand reputation, that is
common between the nations to make the research more appropriate; finally, brand
reputation can be a strong competitive tool for geographic extension of a global brand.
Two selected samples from the ten transcripts used for analysis are shown in
Appendix B. In the next section, the research model is presented based on the
outcomes of the interviews and the literature reviews.
4.3 The Research Model The purpose of the present study is to develop a Consumer-Based Global Brand
Equity (CBGBE) in the restaurant industry and compare consumer perceptions of
CBGBE across two cultures.
The proposed research model consists of the associative links between cultural values,
CBGBE, brand reputation and brand loyalty. The association between variables can
play an essential role in explaining the effective relationship between those variables.
Figure 4.1 displays the proposed research model which illustrates how to best
understand the antecedents and consequences of CBGBE.


- 147 -
As shown in Figure 4.1, CBGBE is a multidimensional construct which consists of
brand trust, brand affect, perceived quality, self-congruence, brand awareness, brand
association and brand identification.
Cultural values have an effect on CBGBE, which, in turn, affect brand reputation and
brand loyalty, respectively. A significant amount of previous research shows the
relationship among variables of the research model as discussed in the next section.
4.4 Definitions of Variables
When variables are measured in research, it is important to define them suitably in
order to measure them more accurately and better understand a research model.
Hence, the next subsection explains the definition of independent variables and
dependent variables of CBGBE.
4.4.1 Dimensions of Cultural Values
Cultural values consist of six dimensions: collectivism/individualism,
masculinity/femininity, power distance, uncertainty avoidance, long/short-term
orientation (Hofstede and Hofstede, 2005), and materialism (Richins and Dawson,
1992).
Collectivism/Individualism
Hui and Triandis (1986:244-245) define collectivism as ―the subordination of
individual goals to the goals of a collective, and a sense of harmony, interdependence,
and concern for others‖ and define individualism as ―the subordination of collective
goals to the goals of individual goals, and a sense of independence and lack of
concern for others.‖ Triandis, Betancourt, Iwao, Leung, Salazar, Stetiade, Sinha,
Touzard, and Zaleski, (1993) summarize simply that collectivism regards the goals of
collectives as the most important consideration, whereas individualism regards the

-148-
goals of individuals as the prime concern. Compared to individualistic society,
members of collectivistic societies are prone to be more sensitive to group
membership in social meetings (Lin and Miller, 2003).
Hofstede and Hofstede (2005:74-75) differentiate between the collectivist and the
individualist and state that ―the vast majority of people in our world live in societies
in which the interest of the group prevails over the interest of the individual… a
minority of people in our world live in societies in which the interests of the
individual prevail over the interests of the group.‖ In a high individualistic society,
everyone is expected to take care of themselves and their family (Hofstede and
Hofstede, 2005).
The present research adopts collectivism/individualism based on the views of Triandis,
et al. (1993) and Hofstede and Hofstede (2005): the focus of collectivism involves a
situation in which group interests, sacrifices and goals are the priority; whereas,
individualism involves a focus on the interest and goals of an individual.
Masculinity/Femininity
Different cultures have differences in gender roles (Pagell, Katz and Sheu, 2005).
Miroshinik (2002) proposes that masculine societies emphasize materialism and
assertiveness while, feminine societies are central to concern for others, relationships
among people and the general quality of life.
Interestingly, with regard to the perspectives of workers, it is worth noting there are
differences between femininity and masculinity. In countries that femininity indices
are higher, life satisfaction of workers take priority over job success, but in countries
where masculinity indices are higher, job success takes precedence over life
satisfaction of workers (Pagell et al., 2005). Therefore, the current research considers
masculinity as assertiveness and success, while, femininity is related to the general
quality and satisfaction of life (Miroshinik‘s, 2002; Pagell et al., 2005).

-149-
Power Distance
Even though every country has hierarchy, both high and low power distance societies
can be understood differently (Pagellet al., 2005). The authors explain that high
power distance societies tend to be less ‗legitimate‘ and use more compulsive power,
whereas, low power distance societies utilize legitimate power. In high power
distance societies, organizations tend to be focused on a few people having power,
and individuals at the top are different from the ones at the bottom in authority, salary
and privileges; while in low power distance societies the power of organization is
distributed (Li and Harrison, 2008). The authors add that this is because decision-
making is carried out by consultation and encouragement is given to the independent
actions of less powerful members of an organization (Li and Harrison, 2008).
As used in this research, power distance is incorporated as inequality among people,
thus, power distance measures the extent that less powerful members of organizations
accept inequitable distribution of power (Li and Harrison, 2008).
Uncertainty Avoidance
Uncertainty avoidance can be measured by the degree that members feel threatened
when faced with ambiguous or unknown situations (Miroshnik, 2002). Societies with
strong uncertainty avoidance respond more favorably to information offered to reduce
perceived uncertainty (Tai, 2004). These societies are characterized by less
aggressiveness, intolerance to change and individuals who seek security (Jung, Su,
Baeza, and Hong, 2008). In the cultural environment, members tend to be less
innovative (Gong, 2009). Conversely, weak uncertainty avoidance societies are more
aggressive, more tolerant to change and more likely to take risks (Jung, et al., 2008).
Therefore, it is clear that in uncertainty avoidance societies, members want to avoid
unclear, unpredictable situations. As used in this research, building formal rules,
offering greater career stability can be efficient means to beat off such uncertainty
(Tai 2004).

-150-
Long/Short-Term Orientation
Long/short-term orientation is to do with the relative importance of the past-and-
present versus future (Hofstede, 1997). Long term orientation related to the future is
represented by values such as perseverance and thrift, while short term orientation
regarding past and present is represented by values such as respect for tradition and
fulfilling social obligations (Hofstede, 1995). Moreover, long term versus short term
orientation can be regarded as dynamic versus static and Eastern versus Western
(Donthu and Yoo, 1998).
Hofstede (1995, 1997) highlights that long/short-term orientation is the value of life
in terms of the past-and-present versus future, a view which is utilised in the present
research.
Materialism
Materialism means ―having more than others‖ and ―associating more value than
others‖ (Sangkhawasi and Johri, 2007: 276). Materialism is involved with a sense of
insecurity and, hence, people who have a materialistic perspective excessively use
their possessions as a means of happiness (Sangkhawasi and Johri, 2007).
In materialistic societies, consumers are attached to possessions (Belk, 1984), and
being rich and prosperous is encouraged (Hong, Muderrisoglu, and Zinkham, 1987).
Therefore, materialists tend to centralize more on earning and spending money and
suffer from a life-work imbalance imperiling their personal safety (Sangkhawasi and
Johri, 2007). In high materialism societies, consumers believe that acquisition is a
good indicator of success and happiness (Xu, 2008).
The current research is based on the view of Sangkhawasi and Johri (2007) and so
regards materialism as a component of cultural values arising from the pleasure and
happiness of possessions.

-151-
4.4.2 Dimensions of Consumer-Based Global Brand Equity
Brand Trust
Trust can be understood as perceived credibility (Ganesan, 1994). Trust reduces the
uncertainty in an environment of high perceived risk so that consumers can rely on
the trusted brand (Chaudhuri and Holbrook, 2001). Chaudhuri and Holbrook
emphasize that belief in relation to reliability, safety, and honesty are all important
facets of trust.
Importantly, this is incorporated by noting that brand reliability links with the
performance of a brand and, therefore, brand reliability is more in relation to the
product‘s functional capabilities and physical attributes (Delgado-Ballester, 2004).
Moreover, brand intentions are reflected in Delgado-Ballester‘s definition, which
describes beliefs regarding the brand which are beyond physical functioning. Brand
intentions are more to do with, for example, facets of brand personality, namely
responsibility, honesty, and sincerity (Aaker, 1997), or intimacy (Blackston, 1992).
Cleary, brand trust arises out of these two different perspectives.
Hence, the present study follows Delgado-Ballester (2004) and views brand trust as
reliability of the brand‘s functional capabilities and physical attributes which serve to
reduce uncertainty; and intentions which reflect an emotional security on the part of
the individuals – as applied to the global restaurant industry.
Brand Affect
Chaudhuri and Holbrook (2001) suggest that the close relationship between a brand
and its consumers tends to show the level of positive affect caused by that brand.
They add that strong and positive affect will be related to high levels of brand
commitment.

-152-
In the current study, Chaudhuri and Holbrook‘s (2001) view is adopted: brand affect
is a strong emotional tie with a restaurant or their staff, such as feeling good,
happiness, and pleasure.
Perceived Quality
The physical evidence of service quality associated with the appearance and condition
of the physical environment and facilities has been strongly maintained in many
empirical studies (e.g. Parasuraman, Zeithaml, and Berry, 1988). Moreover, the
behaviour of service employees, in the light of their competence, helpfulness, and
responsiveness, has been an essential element of service quality evaluation (Brady
and Cronin, 2001; Ekinci, 2001; Mittal and Lasser, 1996). The present research uses
the service quality scale proposed by Ekinci, Dawes, and Massey (2008) based on
Nordic model, which considers both the physical quality of a restaurant and the staff
behaviour. Physical quality is determined by the interiors, facilities and environment
within the restaurant, while staff behaviour is determined by the competence,
helpfulness and friendliness of the restaurant‘s employees (Ekinci et al., 2008).
It is worth noting that service quality must be evaluated from a wider perspective in
order to account for the expectations of consumers. Therefore, physical quality and
service quality of employees as well as food quality needs to be evaluated for overall
service quality. A suitable description of quality that can be used for measuring the
effectiveness of food quality is necessary (Spiegel, Luning, Ziggers, and Jongen,
2004). Rogers (2005) points out that food provision is essential for the hospitality
industry. Food quality is regarded as one component of service quality (Hoare and
Butcher, 2008) and can be defined as the degree of tastiness and freshness of foods in
a restaurant.
Self-Congruence
Self-concept can be defined as the attitude an individual holds about the self, this

-153-
attitude being composed of belief, knowledge, evaluations and tendencies to respond
(Ross, 1971).
Self-image congruence refers to the degree of coincidence between self-image (actual
self-image, ideal self-image) and brand image (Sirgy and Danes, 1982). Ekinci et al.
(2008) have a keen interest in actual and ideal self-concept for two reasons: firstly,
these two types of self are the most commonly studied constructs; secondly, the other
self-concepts (e.g. social self) are strongly related to actual and ideal self-concepts.
The current study adopts Ekinci et al.‘s (2008) view that self-congruence relates to the
degree to which brand image matches up with a consumer‘s actual self-image, and
ideal self-image.
Brand Awareness
Brand awareness relates to the strength of the brand or traces in a person‘s memory,
as reflected by the consumer‘s ability to identify the brand under different conditions
(Taylor, Hunter, and, Lindberg, 2007). Rossiter and Percy (1987) state that brand
awareness is essential for the communications process between brand and consumer
and it precedes all other steps in the process.
More specifically, there are many levels of awareness, including recognition, recall,
top-of-mind, brand dominance, brand knowledge and brand opinion (Aaker, 1996b).
Keller (1993) suggests that brand awareness consists of both brand recognition and
brand recall. According to Keller, brand recognition occurs when consumers exactly
distinguish the brand as having been seen or heard previously. The same author adds
that brand recall occurs when consumers exactly generate the brand from memory.
In this study, Keller‘s (1993) view is adopted suggesting that brand awareness is the
identification of a brand in a certain product category or the recall of a brand from
consumer‘s memory.

-154-
Brand Association
Brand associations are an important component of brand image (Simms and Trott,
2006) that link to brand name in consumer‘s memory (Río, Vazquez, and Iglesias,
2001). According to how much information is summarized in brand association,
Keller (1993) classifies brand associations into three groups: attributes, benefits and
attitudes. Moreover, Keller points out that Consumer-Based Global Brand Equity
(CBGBE) occurs when the consumer is aware of the brand and holds some
favourable, strong, and unique brand associations in their memory.
In the restaurant industry, brand associations can be generated by building favourable,
strong, and unique brand image through the restaurants brand name, symbol, or logo,
and through the particular features of a restaurant brand, based on Keller‘s (1993)
view and used in this research.
Brand Identification
Social identification is a perception of belongingness in which a person becomes a
member of a social category. Organizational identification is where an individual
defines him or herself as a member of a particular organization (Mael and Ashforth,
1992). Consumers develop their social identity by associating themselves with brands
that reinforce their self-identities (Bhattacharya and Sen, 2003). As identification is a
driver of behavior, consumer behavior can be understood and predicted through social
identity theory (Kuenzel and Halliday, 2008). The present study adopts the view of
Bhattacharya and Sen, (2003): consumers who want to identify with a particular
group express themselves by selecting a particular brand.

-155-
4.4.3 Dependent Variables: Brand Reputation and Brand Loyalty
Brand Reputation
Brand reputation is an accumulated assessment toward the company based on past
performance (Camara, 2007). Rindova and Fombrun (1999) define reputation as the
aggregate attitude created from what outside observers estimate to be important
characteristics of a company. In the service industry in particular, as intangible
attributes of service are difficult to evaluate, reputation has an influence on the
consumer‘s choice of brand (Andreassen and Lindestad, 1997). Reputation may be
favorable to a company by giving consumers a signal about the quality of goods or
service (Fombrun and Shanley, 1990). Therefore, brands with good reputation are
likely to attract more consumers, and if a company fails to carry out its marketing
signals, a brand will lose its positive reputation, which can have disadvantages for the
company (Veloutsou and Moutinho, 2009).
This study follows Veloutsou and Moutinho‘s (2009) view which regards brand
reputation as an attitude of consumers, with an evaluative reaction based on long term
and sustainable image.
Brand Loyalty
Brand loyalty is investigated from two perspectives: behavioural loyalty and
attitudinal loyalty. Behavioural loyalty is defined as repeat purchasing of a consumer
towards the brand (Bandyopadhyay and Martell, 2007; Russell-Bennett, et al., 2007).
Attitudinal loyalty refers to a psychological attachment or commitment to a specific
brand including intention to repurchase the brand (Quester and Lim, 2003; Baloglu,
2002).
In the context of service, repurchase intentions and willingness to recommend a brand
have been investigated from an attitudinal perspective (Parasuraman, Zeithaml, and

-156-
Berry, 1994; Oliver and Westbrook, 1993). This is because service causes emotional
responses which lead consumers to continue a relationship with a particular brand
(Harris and Ezeh, 2008).
The present research measures brand loyalty with attitudinal construct and follows
Parasuraman et al. (1994), and Oliver and Westbrook‘s (1993) view that repurchase
intentions and willingness to recommend are an essential part of an attitudinal
variable in the restaurant industry.
4.5 Hypothesis Development
A hypothesis is necessary to understand the relationship among variables. A
hypothesis has practical value in designing research and adds clarity to what
researchers expect to find out through the study (Zikmund, Babin, Carr and Griffin,
2010). The hypotheses are proposed in the following subsection.
4.5.1. Effect of Cultural Values on Consumer-Based Global Brand
Equity
Trust is an important component in the development of positive and long-term
relationships between consumers and companies (Matzler, Grabner-Kräuter, and
Bidmon, 2008). Trust is associated with uncertainty avoidance among culture values.
Therefore, many researchers agree that trust is related to an uncertain and risky
environment (Mayer, Davis, and Schoorman, 1995; Moorman, Zaltman, and Desh-
pandé, 1992). Erdem, Swait, and Valenzuela (2006) investigate cross-culture
differences of brands, and find that credible brands provide more value in high-
uncertainty-avoidance countries because they have a lower perceived risk. Trust
reduces the risk that consumers feel in uncertain environments, and so consumers
depend on the trusted brand; that is, a global brand can efficiently serve to repel
uncertainty (Chaudhuri and Holbrook, 2001).

-157-
Affective responses to brands are important for brand management (Fischer, 2006).
Interestingly, when selecting a restaurant, consumers tend to consider their
preferences. They can have a favorable or unfavorable evaluation about the brand
(Keller, 1993). In terms of the relationship between affect and risk reduction, Matzler
et al. (2008) demonstrates that uncertainty avoidance is positively related to brand
affect. Hence, the present study proposes that:
H1a. Cultural values have an effect on brand trust.
H1b. Cultural values have an effect on brand affect.
A great deal of researchers has studied the relationship between culture and perceived
quality. Donthu and Yoo (1998) investigate the effect of culture on consumer‘s service
quality expectations, and suggest that high power culture consumers and long-term-
oriented consumers have lower service quality expectations, while high uncertainty
avoidance consumers and individualistic consumers have higher service quality
expectations. Jung and Sung (2008) explore culture differences in CBGBE. The
results indicate that when making purchase decisions, perceived quality is more
important in a high-uncertainty-avoidance society than a low-uncertainty-avoidance
society (Jung and Sung, 2008).
Matilla(1999) mentions the cultural differences of individualism/collectivism and
power distance. Matilla presumes that powerful consumers in luxury hotels use power
over service staff. Powerful consumers consider that they deserve good service from
service providers (Tsoukatos and Rand, 2007).
Similarly Donthu and Yoo (1998) and Furrer et al. (2000) propose that the
SERVQUAL dimensions are correlated with Hofstede‘s cultural dimensions. Furrer et
al. (2000) suggest that collectivists are more tolerant of poor service than
individualistic consumers. In cultures with a high degree of masculinity, consumers
expect male service staff to be more professional, more assuring and more reliable
(Furrer et al., 2000). Furrer et al. point out that in frequent service situations,
consumer‘s feelings of uncertainty have to be reduced by a guarantee to solve the
problems, and suggest the positive relationships between uncertainty avoidance and
assurance, responsiveness, empathy, and reliability. In service encounters, Furrer et al.

-158-
(2000) demonstrate the positive relationships between long-term orientation and
reliability, responsiveness. Consequently, this previous research offers evidence that
cultural values have a strong effect on perceived quality. Accordingly, this study
hypothesizes:
H1c. Cultural values have an effect on perceived quality of food.
H1d. Cultural values have an effect on perceived quality of physical environment.
H1e. Cultural values have an effect on perceived quality of staff behaviour.
Aaker (1991) explains that recognition indicates familiarity acquired from past
exposures and consumers recognize that a brand is good through familiarity elements.
Well-known brands stand for security or trust. In online business, a well-known brand
increases the risk reducing effect (Ernst and Young, 1996). That is, the familiar brand
to consumers decreases uncertainty. Importantly, the cultural dimension of uncertainty
avoidance concerns response to unstructured and ambiguous contexts (Li, and
Harrison, 2008). Li and Harrison add that higher uncertainty avoidance implies a
greater discomfort with uncertain and ambiguous situations and consequently, a
greater need to reduce the uncertainty by seeking out more information.
In addition, previous research has shown the strong relationship between brand
association and brand image (Aaker, 1991; Keller, 1998). Roth (1995) researches the
relationship between culture and the performance of global brand image and
demonstrates that, in highly individualistic cultures, brand images that highlight
functional, experiential needs, or novelty are more effective than social images that
stress group membership. Moreover, in countries with high power distance,
consumers who are more interested in prestige, wealth, and class differences
emphasize that social, symbolic, and sensory needs are more suitable. In low power
distance countries, functional brand image is most appropriate. Therefore, cultural
values including collectivism and individualism and uncertainty avoidance are related
to brand awareness and brand association. Based on these findings, this study
suggests that:
H1f. Cultural values have an effect on brand awareness.
H1g. Cultural values have an effect on brand association.

-159-
Culture is an environmental characteristic that affects consumer behaviour (Roth,
1995). Thus, individual consuming tendencies operate within a cultural framework
(Narin, Griffin, and Wicks, 2008). Those with an independent self tend to self-express
by demonstrating their points of difference, whereas those with an interdependent self
have a tendency to self-express by demonstrating points of similarity (Singelis, 1994).
Singelis proposes that national culture based on individual values will have influence
on self-congruence. Cultural orientation has an effect on consumer‘s self-concept and
self-congruity with brand being much stronger in individualists than in collectivists
(Phau and Lau, 2001).
In the light of brand identification, brands can add meaning to the consumer‘s life and
status because they have symbolic meaning (Caprara, Barbaranelli, C. and Guido, G.,
2001). The brand identification function allows the consumer to be integrated or
separated (del Rio et al., 2001). Thus, brand identification seems to be associated with
collectivism or individualism. In a collectivist society, people tend to depend on
others in consumption patterns while, in an individualistic society, people‘s
consumption patterns indicate a self-supporting lifestyle (Hofstede and Hofstede,
2005) Collectivists who want to display conformity will use brand personality as a
way in which to express their similarities to members of their reference group (Phau
and Lau, 2001). Thus, the current study posits that:
H1h. Cultural values have an effect on self-congruence.
H1i. Cultural values have an effect on brand identification.
4.5.2. Effect of Consumer-Based Global Brand Equity on Brand
Reputation and Brand Loyalty
Trust is a feeling of safety on the basis of belief (Delgado-Ballester and Munuera-
Alemán, 2001). That is, trust plays a role in reducing risk in the consumer buying
process (Afzalet al., 2010). Similarly, reputation has the ability to reduce uncertainty
(Einwiller, 2001) and it indicates ―trustworthiness, honesty and integrity‖ (Afzal et al.,

-160-
2010:45). Reputation is associated with credibility (Milewicz and Herbig, 1994)
which is ‗perceived trustworthiness‘ (Keller and Aaker, 1992). Keller and Aaker
support this by reporting that trust is a part of ‗brand credibility‘. It can be seen from
previous research that brand reputation is closely associated with brand trust (Afzal et
al., 2010; Einwiller, 2001; Cheema, 2008). Omar et al. (2009) propose trust and
communications as determinants of brand reputation. Tractinsky, Jarvenpaa, Vitale,
and Saarinen (1999) find that brand trust impacts on reputation. With regard to these
arguments, this study hypothesizes:
H2a. Brand trust has a positive effect on brand reputation.
H2b. Brand affect has a positive effect on brand reputation.
Zeithaml (1988) and Shapiro (1983) suggest that the perceived quality of a product or
service is related to the reputation. That is, the quality of products or services
becomes an indicator of a good or bad reputation (Yoon, Guffey, and Kijewski, 1993).
Consumers tend to believe that the goods manufactured by a firm today have a similar
quality as compared with goods manufactured in the past, since credibility is added to
the brand (Milewicz, J. and Herbig, 1994). Having a good reputation ensures that
firms which have high quality will grow because of worth-of-mouth from other
consumers (Rogerson, 1983). The ambiguity of product quality may affect building a
brand reputation, but if consumers have the opportunity to evaluate the quality of
product or service, they are more able to judge the quality which can affect brand
reputation (Selnes, 1993). Based on these arguments, this study hypothesizes:
H2c. Perceived quality of food has a positive effect on brand reputation.
H2d. Perceived quality of physical environment has a positive effect on brand
reputation.
H2e. Perceived quality of staff behaviour has a positive effect on brand reputation.
Brand awareness and brand associations are components of Global Brand Equity
(Aaker, 1991) and brand reputation is strongly related to Global Brand Equity (Lai,
Chiu, Yang, and Pai, 2010). Brand reputation is an issue of attitudes and beliefs with
regard to brand awareness and image (Malz, 1991). Investment in particular brand
awareness can lead to sustainable competitive advantage and long-term value

-161-
(Macdonald and Sharp, 2003). Moreover, Fortune/Yanckelovich Partners propose
awareness as one of the components of reputation (Gains-Ross, 1997); whereas,
Davis and Miles (1998) regard identity, desired identity and image (referred to as
association) as elements of reputation. Consumers who have loyalty to the brand
think of association with a company which has a high-reputation (Roberts and
Dowling, 2002). Therefore, brand awareness and brand associations have an impact
on brand reputation. Thus, this study suggests:
H2f. Brand awareness has a positive effect on brand reputation.
H2g. Brand association has a positive effect on brand reputation.
Consumers express themselves with specific brands that reflect self-identities
(Bhattacharya and Sen, 2003). Hence, a brand that is well known among consumers
or has a good reputation can be used as a tool to increase their pride (Ahearne,
Bhattacharya, Thomas, 2005). This is a reason why reputable brands indicate
company success (Bhattacharya, Rao, Glynn, 1995). As consumers perceive that a
brand has a good reputation, they demonstrate higher identification with the brand
(Hughes and Ahearne, 2010). Therefore, Hughes and Ahearne highlight that managers
who try to raise their brands‘ reputation gain benefits from stronger brand
identification. Hence, this study suggests:
H2h. Self-congruence has a positive effect on brand reputation.
H2i. Brand identification has a positive effect on brand reputation.
When the features of products or services are characterized by experience and
credible qualities, trust is a more important component and so brand loyalty is
considered as a vital consequence of brand trust (Chaudhuri and Holbrook, 2001).
Accordingly, Chaudhuri and Holbrook (2001) demonstrate that both brand emotion
and brand credibility have a strong impact on attitudinal loyalty.
Emotional feelings such as ―happy‖ or ―joyful‖ lead consumers to extract loyalty
(Chaudhuri and Holbrook, 2001). Similarly, Dick and Basu (1994) suggest that
positive conditions and emotional mood increase brand loyalty. Clearly, in the light of

-162-
forming brand relationships, brand affect is regarded as a fundamental antecedent of
brand loyalty (Matzler, Bidmon, Grabner-Kräuter, 2006). Hence, the next hypothesis
is:
H3a. Brand trust has a positive effect on brand loyalty.
H3b. Brand affect has a positive effect on brand loyalty.
Service quality has influence on service loyalty via consumer satisfaction (Caruana
and Malta, 2002); and service quality and food quality are two important elements
that determine consumer satisfaction (Qin and Prybutok, 2009). In addition, when
purchasing food, consumers take more interest in food safety and quality (Rijswijk,
and Frewer, 2008). Ekinci et al. (2008) suggest physical quality and staff behaviour as
two dimensions of perceived quality. The physical evidence of service quality is
associated with the appearance and condition of the physical environment and
facilities (Parasuraman et al., 1988); and the behaviour of service employees is related
to their competence, helpfulness, and responsiveness (Ekinci, 2001). Chen, Ekinci,
Riley, Yoon, Tjelflaat, (2001) demonstrate that physical environment and employee‘s
service quality have a positive impact on lodging an image which affects consumers‘
decision-making behaviour. Moreover, Harris and Ezeh (2008) find that physical
environment and service staff qualities are associated with greater intentions of
consumers to be loyal. As a result, these researchers offer evidence that perceived
quality has a strong effect on brand loyalty. Based on these arguments, this study
hypothesizes:
H3c. Perceived quality of food has a positive effect on brand loyalty.
H3d. Perceived quality of physical environment has a positive effect on brand loyalty.
H3e. Perceived quality of staff behaviour has a positive effect on brand loyalty.
Awareness has an influence on the actual choice made by consumers, since
consumers are likely to purchase well-known brands (Anselmsson, Johansson, and
Persson, 2007). The consumer‘s awareness of the product is the beginning of loyalty
towards a product (Aaker, 1991). The more consumers are aware of the product, the
greater the possibility that they will buy it (Kayaman and Arasli, 2007). Brand
awareness plays an important role when a customer makes a decision. In particular,

-163-
brand recognition may have influence on the degree that product decisions are made
in the store (Keller, 1993). Thus, higher brand awareness along with associations in
the consumer‘s mind causes the consumer to determine their preference for the brand
(Gil, Andrés, and Salinas, 2007).
Keller (1998) highlights that brand association can influence consumer‘s buying
decisions. Alexandris et al. (2008) demonstrate the relationships among brand
associations, loyalty and service quality. They highlight that the findings of regression
analysis reveal that five of the eight brand associations (escape, nostalgia, pride, logo,
and effect) have a significant influence on the prediction of loyalty. Thus, the current
study hypothesizes that:
H3f. Brand awareness has a positive effect on brand loyalty.
H3g. Brand association has a positive effect on brand loyalty.
A great deal of research has revealed that consumers purchase brands which can be
matched with their self-concept (Kressmann et al., 2006) and the process of this
matching is called self-congruity (Sirgy, 1986). Sirgy (1985), Sirgy and Samli (1985)
and Sirgy et al. (2007) demonstrate that self-congruity affects brand loyalty. Similarly,
Kressmann et al., (2006) indicate that self-congruity plays a significant role in brand
loyalty. Marketing managers and researchers take a keen interest in brand
identification because this may lead to important positive behavioural outcomes such
as brand loyalty (Kuenzel and Halliday, 2010). Kim et al. (2001) indicate that brand
identification has an impact on brand loyalty. Thus, the present study suggests:
H3h. Self-congruence has a positive effect on brand loyalty.
H3i. Brand identification has a positive effect on brand loyalty.

-164-
4.6 Summary
The major objective of the present study is to examine the difference of perception
across two cultures on the basis of the antecedents and consequences of Consumer-
Based Global Brand Equity in the restaurant industry. In order to achieve this
objective, this chapter establishes a research model based on the results of a review of
previous literature and interviews. The essential variables of the research model
consist of cultural values, CBGBE, brand reputation and attitudinal brand loyalty.

-165-
CHAPTER 5

-166-
CHAPTER 5
METHODOLOGY
5.1 Introduction This chapter deals with methodological issues in terms of how the empirical study
was conducted on the data analysed. The first section (5.2) presents objectives of the
research, which are related to research methods and techniques. The second section
(5.3) addresses the research philosophy, which consists of positivism and
interpretivism. These philosophical modes of thought have several philosophical
assumptions. Moreover, this section also addresses various types of research methods,
including mixed-method research, which has the advantages and disadvantages of
both quantitative and qualitative methods. The third section (5.4) presents the
sampling. In this section, the types of sampling methods are explained. The methods
are reviewed to consider their advantages and disadvantages in terms of the present
research. The fourth section (5.5) addresses the validity and reliability of the scales.
The fifth section (5.6) focuses on the questionnaire design. This section presents
items in the questionnaire, which are drawn from previous research. The sixth section
(5.7) shows the pilot test. The last section (5.8) is composed of the types and contents
of the data analysis for this research.
5.2 Research Philosophy A research philosophy contains important assumptions regarding the way a researcher
views the social world (Saunders et al., 2007). Although there are some researchers
who conduct sound research without considering philosophical thought, it is useful to
have some knowledge of research philosophies because it serves to clarify the
research design and promotes the choice of an appropriate method (Blumberg,
Cooper and Schindler, 2005). The two main research paradigms that are used as

-167-
philosophical frameworks are positivism and interpretivism.
Positivism begins with the idea that the social world can be described by facts.
Positivism has its origin in the natural sciences and depends on the assumption that
social reality is objective (Ticehurst and Veal, 2000). In addition, it uses a deductive
process to understand social phenomena and is related with quantitative methods of
analysis (Collis and Hussey, 2009).
However, some researchers are concerned with attempts to translate natural science
approaches into the social sciences (Ticehurst and Veal, 2000). Thus interpretivism
began with criticisms of positivism. Interpretivists believe that social reality is
subjective because it is formed by our perceptions (Collis and Hussey, 2009). While
positivism centres on measuring social phenomena, interpretivism centres on
exploring social phenomena (Collis and Hussey, 2009). In addition, interpretivism
employs the process of induction and does not derive findings from the statistical
analysis of quantitative data (Blumberg et al., 2005). Table 5.1 illustrates the
philosophical assumptions that underpin positivism and interpretivism.

-168-
Table 5.1: Assumptions of the Main Paradigms
Philosophical assumption
Positivism
Interpretivism
Ontological assumption (the nature of reality)
Reality is objective and singular, separate from the researcher.
Reality is subjective and multiple, as seen by the participants.
Epistemological assumption
(what constitutes valid knowledge)
Researcher is independent of that being researched.
Researcher interacts with that being researched.
Axiological assumption (the role of values)
Research is value-free and unbiased.
Researcher acknowledges that research is value-laden and biases are present.
Rhetorical assumption (the language of
research)
Researcher writes in a formal style and uses the passive voice, accepted quantitative words, and set definitions.
Researcher writes in an informal style and uses the personal voice, accepted qualitative terms, and limited definitions.
Methodological assumption
(the process of research)
Process is deductive. Study of cause and effect with a static design. Research is context free. Generalizations lead to prediction, explanation, and understanding. Results are accurate and reliable through validity and reliability.
Process is inductive. Study of mutual simultaneous shaping of factors with an emerging design. Research is context-bound. Patterns and/or theories are developed for understanding. Findings are accurate and reliable through verification.
Source: Collis and Hussey, (2009:58) adapted from Creswell (1994:5 and 1998:75)
As shown in Table 5.1, there are various philosophical assumptions that underpin the
two main paradigms: ontological, epistemological, axiological, and methodological
(Creswell, 1994, 1998).
The methodological assumption is associated with the process of the research (Collis
and Hussey, 2009). It is argued that there is a high possibility that the positivist
researcher uses a highly structured methodology (Gill and Johnson, 2002) and the

-169-
researcher comes to a reasoned conclusion by the logical generalization of a known
fact via the process of deduction (Sekaran, 2003). The researcher focuses on facts that
are objective, formulates hypotheses, uses large samples and uses analytical tools in
order to look for a relationship between variables (Collis and Hussey, 2009). In
contrast, interpretivism requires the examination of a small sample, possibly over a
period of time, and the employment of a number of research methods in order to gain
different insights into the phenomena (Collis and Hussey, 2009). Induction is a
process in which the researcher observes certain phenomena and comes to a
conclusion on that basis (Sekaran, 2003). In terms of the epistemological assumption,
this is related to what can be accepted by researchers as valid knowledge and involves
an investigation of the relationship between researcher and that which is researched
(Collis and Hussey, 2009). In terms of axiological assumptions, positivists believe
that they are detached from what they are researching. In contrast, interpretivists
believe that researchers have values that help determine what are acknowledged as
facts (Collis and Hussey, 2009).
In summary, ―positivism can be referred to as scientific, experimental, empiricist,
quantitative or deductive, whereas interpretivism can be referred to as hermeneutic,
qualitative, phenomenological, interpretive, reflective, inductive, ethnographic or
action research‖ (Ticehurst and Veal, 2000:20). Some researchers propose that
combining positivism and interpretivism is necessary for a ‗perfect‘ research
(Blumberg et al., 2005), because broader insights can be gained from mixed research
methods (Easterby-Smith, Thorpe and Lowe, 1991)
The present research focuses on using a structured methodology based on positivism
by formulating hypotheses and analyzing the relationships between variables. In
addition, the qualitative method is also used to further develop the research model.
Hence, this research adopts both positivism and interpretivism in order to elicit in-
depth findings and reduce the biases of the various approaches. Following this section,
the reasons why this study has adopted both research philosophies will be described.

-170-
5.2.1 Multiple Research Methods Positivists believe that research is both a neutral and technical process and that
researchers show or discover knowledge by finding the answers to their questions
scientifically (Lee, 1992). Therefore, Lee adds that empirical surveys using a
significant number of participants are appropriate for obtaining a view of reality
through a concrete structure and multivariate statistical analysis.
In contrast to this approach, qualitative methods do not need to use mathematical and
statistical programs to transform the data that are collected. Instead, the data are
processed through systematization, categorization, and interpretation (O‘Connor,
2007). O‘Connor emphasizes that the qualitative method has a great deal of
advantages. For example, it is useful in examining personal changes over times
(Ticehurst and Veal, 2000:20). However, qualitative research methods have important
limitations. In particular, qualitative analysis heavily depends on the interpretation of
the researcher.
In choosing research methods, researchers either use mono method or multiple
methods. As shown in Figure 5.1, multiple methods have four different possibilities:
multi-method quantitative study, multi-method qualitative study, mixed-method
research, mixed-model research (Saunders et al., 2007). Mixed method research
employs data collection techniques and analysis based on both quantitative and
qualitative methods at the same time or one after the other (Saunders et al., 2007).
Figure 5.1 displays the types of research methods.

-171-
Figure 5.1 Research Choice
Source: Saunders et al. (2007:146)
There are two major advantages of employing multiple methods in the same research
(Saunders et al., 2007: 146-147):
―Above all, different methods can be used for different purposes in a study; researcher may wish to employ, for example, interviews at an exploratory stage in order to get a feel for the key issues before using a questionnaire to collect descriptive or explanatory data. Secondly, the advantage of using mixed methods is that it enables triangulation to take place; for instance, semi-structured group interviews may be a valuable way of triangulating data collected by other means, such as a questionnaire.‖
Consequently, the present research adopts mixed methods, which is a sub-division of
multiple methods. As each method is useful for showing findings related to certain
research questions, employing only one method would be limited in terms of
comprehensively answering all the questions (Parmelee, Perkins and Sayre, 2007).
The analytic results of the qualitative method can be basically affected by the
researcher‘s own ideas, biases, ways of thinking, and so on; thus, the structural
framework of the researcher generates a bias regarding the object of inquiry
Research Choices
Mono Method Multiple Methods
Multi-Method Quantitative
studies
Multi-Method Qualitative
Studies
Multi-Methods
Mixed-Method Research
Mixed-Model Research
Mixed-Methods

-172-
(O‘Connor, 2007). Therefore, employing multiple methods can play a role as a bridge
between the deductive and inductive methods of analysis (Gilbert, 2006).
5.3 Sampling
Sampling is an efficient way of selecting a sufficient sample from the entire
population (Sekaran, 2003). It would be practically impossible to carry out a census
to investigate the characteristics of the entire population (Zikmund, 2000). In
conducting surveys, obtaining an appropriate sample is essential (Graziano and
Raulin, 1997) because it enables the sample to precisely represent the population
(Zikmund, 2000).
Both advantages and disadvantages can be generated in the process of sampling from
the entire population. It saves financial resources, human resources and time, but the
researcher must predict the population‘s characteristics, which has the possibility of
error (Kumar, 1996). The process of sampling can follow many different procedures
(Thiétart et al., 2001) and can also involve the process of using a small number of
elements in the whole population in making conclusions (Zikmund, 2000). Figure 5.2
shows the stages of the sampling process.

-173-
Figure 5.2 Sampling Process
Source: Collis and Hussey (1997: 210)
As shown in Figure 5.2, defining the target population is the first process. Then, the
population is operationalized in order to have clear criteria to determine the elements
so that the outcomes will be generalized through statistical inference (Thiétart et al.,
2001). The second process of sampling is obtaining a sampling framework. When
doing this, bias can be generated in a sampling strategy, which is associated with the
choices made in the design of the study itself and also the characteristics of the
process of collecting the data (Easterby-Smith et al., 1991). The third stage of the
sampling process is to determine an acceptable minimum sample size.
The larger the sample, the better it will reflect the whole population and the easier it
will be to generalize the results of the analysis (Collis and Hussey, 1997). However,
large samples give rise to problems of practicality, particularly in the light of how
much cost and scheduling are required (Thiétart et al., 2001). The minimum sample
size which will enable results to be generalised to the whole population is in
Define the target population
Obtain or construct a sampling frame
Determine the minimum sample size
Choose a sampling method
Decide how to convert sample estimates to population parameters

-174-
proportion to the scale which represents the whole population (Collis and Hussey,
1997). Ticehurst and Veal (2000:164) propose that ―there are three criteria for the
sample size: the required level of precision in the results, the level of detail in the
proposed analysis, and the available budget.‖ The next stage is to select a sampling
method, which is often limited due to economic or feasibility reasons (Thiétart et al.,
2001). The final stage is to determine how to convert sample estimates to population
parameters.
5.3.1 Sampling methods
The main sampling designs can be categorized into probability and non-probability
sampling methods (Sekaran, 2003). In these two categories, there are a variety of
sampling designs.


-176-
As shown in Figure 5.3, probability sampling plans are composed of unlimited or
simple random sampling and the restricted or complicated probability sampling plans,
including cluster sampling, systematic sampling, and stratified random sampling
(Sekaran, 2003).
Kumber (1999) proposes that there are two useful advantages of random/probability
samples: Firstly, the inferences drawn from such samples can be generalized to the
entire population, and secondly, some statistical analyses can be applied only to data
collected by random sampling. Probability sampling provides us with confidence
because the sample adequately stands for the population that researchers wish to
examine (Graziano and Raulin, 1997).
Simple random sampling is the most basic selection method (Thiétart et al., 2001). In
simple random sampling, each sample in the total population must have the same
probability of being chosen as each element in the population, that is, the selection of
an element in the sample should not be affected by other factors, such as personal
preference (Kumar, 1996). However, such sampling would consume more time and
money in order to conduct a survey; moreover, updated listings of the population may
not always be available. Hence, other probability sampling methods are often selected
instead because of such disadvantages (Sekaran, 2003).
Non-probability sampling offers a range of alternative techniques to choose samples
based on the researcher‘s subjective judgment. More specifically, in the exploratory
stages of research projects, such as a pilot survey, non-probability sampling may be
the most useful (Saunders et al., 2007). Non-probability sampling is employed when
the number of individuals in a population is neither known nor able to be identified
individually (Kumar, 1996). This type of sampling consists of convenience sampling,
judgment sampling, snowball sampling, and quota sampling (Saunders et al., 2007).
Table 5.2 illustrates the advantages and disadvantages of probability and non-
probability sampling designs.

-177-
Table 5.2 Probability and Non-probability Sampling Designs
Sampling Design Description Advantages Disadvantages
Probability Sampling
1. Simple random sampling All elements in the population are considered and each element has an equal chance of being chosen as the subject.
High generalizability of findings. Not as efficient as stratified sampling.
Systematic sampling
A systematic selection process selects the first element randomly from the sampling frame, then selects the following elements at constant intervals.
Easy to use if population frame is available. Systematic biases are possible.
2. Stratified random sampling (Str.R.S.)
Proportionate Str.R.S.
Disproportionate Str. R.S.
Population is first divided into meaningful segments; thereafter subjects are drawn in proportion to their original numbers in the population. Based on criteria other than their original population numbers.
Most efficient among all probability designs. All groups are adequately sampled and comparisons among groups are possible.
Stratification must be meaningful. More time-consuming than simple random sampling or systematic sampling.
Cluster sampling
Groups that have heterogeneous members are first identified; then some are chosen at random; all the members in each of the randomly chosen groups are studied.
In geographic clusters, costs of data collection are low.
The least reliable and efficient among all probability sampling designs since subsets of clusters are more homogeneous than heterogeneous.

-178-
Source: Sekaran (2003:280), Kumar (1999:162) and Thietart et al. (2001:150)
Sampling Design Description Advantages Disadvantages Non-probability
Sampling
Convenience sampling
The most easily accessible members are chosen as subjects.
Quick, convenient, less expensive. Not generalizable at all.
Judgment sampling Subjects selected on the basis of their expertise in the subject investigated.
Sometimes, the only meaningful way to investigate.
Generalizability is questionable; not generalizable to entire population.
Quota sampling
Subjects are conveniently chosen from targeted groups according to some predetermined number or quota.
Very useful where minority participation in a study is critical. Not easily generalizable.
Snowball sampling
Snowball sampling is the process of selecting a sample using networks.
This sampling technique is useful if you know little about the group. This method of selecting a sample is useful for studying communication patterns, decision making or diffusion of knowledge within a group.
The choice of the entire sample rests upon the choice of individuals at the first stage. It is difficult to use this technique when the sample becomes fairly large.

-179-
As shown in Table 5.2, each of these two major designs are classified into the
different types of sampling that can be chosen according to the degree of
generalization desired, the requirements of time and other resources, and the purpose
of study (Sekaran, 2003).
The present research adopts convenience sampling. This is because there is not any
specific information with regard to the population, such as a sampling frame, the total
number of subjects, or other information (Kumar, 1996). Convenience sampling is the
process of acquiring the samples available, that is, of using the most convenient
method (Zikmund, 2000). Although this method has some disadvantages, Zikmund
mentions that researchers generally employ convenience sampling to collect a great
deal of completed questionnaires, which is advantageous in terms of economic
efficiency. It is possible to gather a great deal of data within a relatively limited
timeframe and with low costs (Hair, Black, Babin, Anderson and Tatham, 2006a).
5.3.2 Method of Data Collection This research methodology is based on a combination of qualitative and quantitative
methods. The qualitative method is based on interpretivism, which aims to identify
any missing variables in order to support the research model. It is considered essential
to carry out a pilot study before conducting the survey and field work in order to find
possible problems in advance.
5.3.2.1 Fieldwork
Interview
Prior to the survey, face-to-face interviews were conducted with ten participants who,
as five British and five Korean consumers, have a high degree of experience of
global brands in the restaurant industry. The purpose of these interviews was to
investigate face validity of the suggested research model, the relationships among the
variables as well as identify any missing variable from the research model. Initially,

-180-
participants were accessed through personal contacts and recruited through snowball
sampling. The interviews were carried out at convenient locations, such as coffee
shops, restaurants, parks, as per participants‘ preferences. The interviews were
carried out in April 2010. Before starting the interviews, a participation information
sheet and consent form were provided for/completed by the participants. The
interview guidelines, questionnaire, participation information sheet, and consent form
for the interviews were provided in English and in Korean. The interviews, which
subsequently transcribed, coded, and evaluated.
The interviews provided a deeper understanding of motivations of human behaviours
and attitudes; and also, offered a feeling for the key concepts before the survey. Thus,
the relationship among the variables of the suggested research model was confirmed.
Moreover, the interview analysis revealed that brand reputation is the consequence of
Consumer-Based Global Brand Equity (CBGBE).
The Survey
The survey was conducted between June of 2010 and September of 2010.
Information on the research was provided to participants and they were assured of
confidentiality through the use of the participation information sheet. The main
reason for selecting two cultures was to investigate the value judgments of consumers
in relation to global brand equity through a cross-cultural study.
The quantitative data was collected by person-to-person surveys. Two research
assistants in each country who had field experience regarding hospitality or marketing
helped to collect data. Convenience sampling was employed in two cities in the UK
(London and Oxford) and South Korea (Seoul and Daegu) in which consumers had
easy contact with global restaurant brands. Various locations were chosen without any
strict limits on place and time and examples of sub-locations included parks, coffee
shops and shopping malls. A total of 668 surveys were collected. Of these, 35 were
excluded because they did not fully complete the questionnaire or missed out many
items. Hence, total data for 633 native speakers (313 in the UK and 320 in South
Korea) were used for statistical analysis. Responses consisted of a 7-point Likert-type

-181-
scale ranging from strongly agree to strongly disagree. The revised questionnaires can
be seen in Appendix D.
5.4 Validity and Reliability of the Scale
Reliability
Reliability is defined as ―the extent to which research findings would be the same if
the research were to be repeated at a later stage or with a different sample of subjects‖
(Veal, 1997:35). In other words, the reliability of a measure is highly associated with
its ‗stability‘ and ‗consistency‘ across time and place, as well as across the various
items in the instrument (Sekaran, 2003). Sekaran adds that ‗stability‘ of measurement
refers to the ability of a measure to maintain stability over time, and can be tested
through test-retest method, parallel-forms reliability. With regard to the test-retest
method, the questions are asked of the same sample, but on at least two independent
occasions. Responses obtained on the two occasions are correlated, and the
correlation coefficient of the data from the two occasions is calculated (Collis and
Hussey, 2009). Parallel-form reliability can be proven when answers to two
comparable sets of measures, which tap the identical construct, show an intense
correlation (Sekaran, 2003).
On the other hand, consistency refers to the structural homogeneity of the items in the
measure (Tull and Hawkins, 1993). The items should work together as a set and be
able to independently measure the same concept. Thus, the same overall meaning is
attached to each item by respondents (Sekaran, 2003). Sekaran added that this can be
revealed by examining whether the items in the measuring instrument are strongly
related. Consistency can be assessed through tests of inter-item consistency reliability
(the Cronbach‘s coefficient alpha is used for inter-item consistency reliability) and
split-half reliability. For the split-halves reliability method, the questionnaires are
divided into two equal halves, which are correlated in the light of the scores for each
half (Welman, 2006). The correlation coefficient of the two halves is computed, and
this coefficient shows the reliability of the test.

-182-
In testing reliability, there are several techniques to measure the reliability of the
measures (Newman, 2000). Cronbach‘s alpha is the most widely used method of
assessing inter-item consistency reliability (Hair, Black, Babin, Anderson and Tatham,
2006). ―Every item is correlated with every other item across the sample and the
average inter-item correlation is taken as the index of reliability‖ (Collis and Hussey,
2009:206). Cronbach‘s alpha is a reliability coefficient and indicates how well the
items measuring a concept in a dimension are correlated to one another (Sekaran,
2003). Sekaran (2003:307) suggests that ―the closer Cronbach‘s alpha is to 1, the
higher the internal consistency reliability.‖
For the present research, Cronbach‘s alpha coefficient is used to measure the internal
consistency reliability. Cronbach‘s alpha coefficients for the scales of the brand equity,
cultural values, brand loyalty, and brand reputation are considered to support the
reliability. These will be mentioned in section 5.8.4
Validity
Validity is defined as the degree to which ―the information collected by the researcher
truly reflects the phenomenon being studied‖ (Veal, 1997:35).That is, measurement
validity expresses how well the conceptual and operational definitions of the
indicators fit with each other (Newman, 2000). Imperfect research procedures,
insufficient samples, and inaccurate measurements can decrease validity (Collis and
Hussey, 2009). There are three methods of measuring validity: content validity,
criterion-related validity, and construct validity (Sekaran, 2003).
Content validity, known as face validity, is the representativeness or sampling
adequacy of the content of the measurement instrument (McDaniel and Gates, 2006).
That is, content validity evaluates whether or not the items adequately represent a
performance domain or construct of specific interest (Crocker and Algina, 1986).
Criterion-related validity is established when the measure differentiates individuals on
a criterion it is expected to predict (Sekaran, 2003:206). It is the ability of a

-183-
measuring instrument to predict a variable designated as a criterion (McDaniel and
Gates, 2006). Thus it is regarded as ‗predictive validity‘ (Sekaran, 2003).
Construct validity is defined as ―how well the results obtained from the use of the
measure fit the theories around which the test is designed‖ (Sekaran, 2003: 207).
Clearly stated definitions and hypotheses that are logically built on well-validated
constructs should be used so that the researcher can reduce threats to construct
validity (Graziano and Raulin, 2004). It is classified into convergent and discriminant
validity. Convergent validity is established when two different instruments measuring
the same concept are highly correlated, whereas discriminant validity is established
when two variables are predicted to be uncorrelated (Sekaran, 2003).
Several methods are offered to establish validity of the research model for the present
research: (1) content validity of the instrument is provided by employing various
methods including the concepts from the review of the literature, a pre-test, and the
judgment by supervisors, as suggested by Sekaran (2003), (2) multiple regression
analysis using the whole sample is used to establish predictive validity or convergent
and discriminant validity, (3) factor analysis is used to establish construct validity.
These will be mentioned in section 5.8.3
5.5 Questionnaire Design
A questionnaire is a written set of questions for the respondents (Kumar, 1999).
Questionnaires are the most useful method to collect data, particularly when a survey
is conducted on a great many subjects in different geographical regions (Sekaran,
2003). Sekaran adds that the survey using questionnaires is a popular method of
obtaining data because researchers are able to easily obtain information and coding
questionnaire responses are easy. That is, such research is economical, which can save
time and human and financial resources, and it also provides greater anonymity
(Kumar, 1999). However, the survey has disadvantages, which include the fact that
the application of a study is limited to populations that can read and write (Kumar,
1999). Furthermore, if the response rate to the questionnaires is very low, the findings

-184-
may not be accepted in terms of the sampling. In order to increase the response rate of
the questionnaire for the present research, respondents were offered some assistance,
wary of the need not to introduce bias, when they had some difficulty comprehending
some questions.
In order to find out what people think or feel and explain the researcher‘s questions
regarding the research, designing questionnaires appropriately is important (Collis
and Hussey, 2009). When formulating a questionnaire, the researcher should examine
as much previous research on the topic or relating topics as possible (Ticehurst and
Veal, 2000). The concepts and variables involved and the relationships between the
variables being investigated, in the form of theories, hypotheses, and research models,
should be evident and should lead to the development of a questionnaire design
through a well-organized process (Welman, Kruger and Mitchell, 2005).
Before designing the questionnaire, the researcher needs to identify the variables that
researchers are able to explain via their research questions (Collis and Hussey, 2009).
Collis and Hussey add that before deciding what questions are appropriate,
researchers must obtain a great deal of knowledge regarding their subject in order to
enable them to develop a conceptual framework and further establish the hypotheses
that should be tested. Moreover, in formulating questionnaires, it is essential to
carefully consider why the research is being done (Ticehurst and Veal, 2000).
Question design refers to the forms of questions, their wording, and the order in
which they are posed (Collis and Hussey, 2009). The processes concerning designing
a questionnaire are summarized in Figure 5.4.
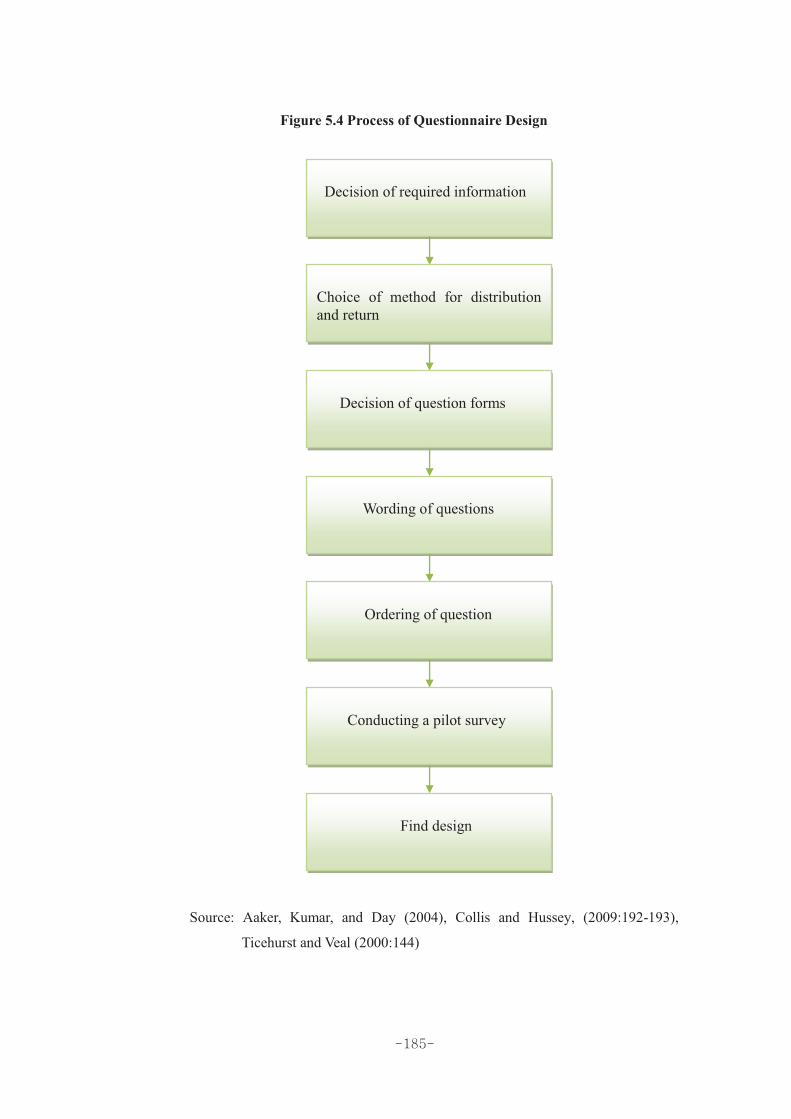

-186-
The questionnaire design process should begin by making a list of information
required to explain the research problems. In order to obtain information for the
questionnaire design, previous studies were reviewed and interviews were conducted.
On the basis of the prior studies, the items of cultural values, Consumer-Based Global
Brand Equity, brand reputation and brand loyalty were developed (see Table 5.3).
There are numerous questionnaire distribution methods, which have different
advantages and disadvantages, and cost can be an important factor (Collis and Hussey,
2009). Collis and Hussey highlight that appropriate management and decision-making
regarding sampling size and location can be the best method for a particular study.
Two types of questions, such as open-ended and closed-ended, are necessary for
formulating the questionnaire (Kumar, 1999). In a closed-ended question, the possible
responses are displayed on the questionnaire, and the respondents tick the categories
that appropriately describe their answers (Kumar, 1999). In the present research, most
of the questions employed the closed-ended question type, in order to increase the
response rate as well as to obtain more precise responses. This is because in an open-
ended question, possible answers are not given (Kumar, 1999), and the respondents
tend to avoid those kinds of questions which require more time for writing the
answers. Moreover, the length of the questionnaire, with the emphasis on closed-
ended questions, is considered to achieve a higher response rate. The questionnaire
was designed to be completed in no longer than 15 minutes.
Since answers to the later items may be affected by earlier items, considering the
appropriateness of the order of the questions is necessary. Normally, questions in a
questionnaire begin with straight-forward questions. Particularly sensitive questions
are then left until later (Ticehurst and Veal, 2000). Therefore, the questionnaire for
this research consists of three parts:
i) The first part is central to the questions relating to the degree to which
respondents are interested in visiting and experiencing global brands in the
restaurant industry.
ii) The second part focuses on how the respondents perceive the cultural values

-187-
in their nations and Consumer-Based Global Brand Equity in the restaurant
industry. Moreover, this part involves questions measuring brand reputation
and brand loyalty.
iii) The final part consists of the respondents‘ socio-demographics.
Kumar (1999) suggests that both the format and wording of questions plays an
important role in a research instrument because the type and quality of information
acquired is affected by them. The wording of each question by native speakers will
need to be sincerely considered in order to ensure that the respondents‘ answers are
valid (Sanders et al., 2007). With regard to the wording of questions for a
questionnaire, there are many principles that the researcher should consider, namely
avoiding jargon, simplifying sentences wherever possible, avoiding ambiguity of
expression, avoiding leading questions, and asking only one question at a time
(Ticehurst and Veal, 2000). Conducting a pilot test is the efficient way to check the
wording of those questions that may be ambiguous before fieldwork, (Thiétart et al.,
2001). In this research, wording of questions was assessed through the pilot study and
the wording of each question was reviewed by native speakers from Britain and South
Korea, respectively.
5.5.1 Measurement of Variables
The measurement for all the variables in the present study has been employed in
previous research. Table 5.3 shows the measurement of variables, including variable
names, questions, sources, and scales.

-188-
Table 5.3 Measurement of Variables
Variables Questions Source Scale
Cultural Values (27)
Collectivism (6)
Individuals should sacrifice self-interest for the group that they belong to.
Individuals should stick with the group even through difficulties. Group welfare is more important than individual rewards. Group success is more important than individual success.
Individuals should pursue their goals after considering the welfare of the group.
Group loyalty should be encouraged even if individual goals suffer.
Hofstede (1980,1991);
Yoo and Donthu (2002)
7-point
Likert-type
Masculinity (4)
It is more important for men to have a professional career than it is for women.
Men usually solve problems with logical analysis; women usually solve problems with intuition.
Solving difficult problems usually requires an active forcible approach, which is typical of men.
There are some jobs that a man can always do better than a woman.
Uncertainty
Avoidance (5)
It is important to have instructions spelled out in detail so that I always
know what I‘m expected to do. It is important to closely follow instructions and procedures. Rules/regulations are important because they inform me of what is expected of me.
Standardized work procedures are helpful. Instructions for operations are important.

-189-
Variables Questions Source Scale
Cultural Values
Power Distance (5)
People in higher positions should make most decisions without consulting people in lower positions. People in higher positions should not ask the opinions of people in lower positions too frequently.
People in higher positions should avoid social interaction with people in lower positions.
People in higher positions should not delegate important tasks to people in lower positions.
People in lower positions should not disagree with decisions made by people in higher positions.
Long-Term Orientation (2)
I am working and saving for the future. I am planning and preparing for the future.
Hofstede (1984, 2001); Jung et
al. (2008)
7-point Likert-type
Materialism (5)
I have all the things I really need to enjoy life. My life would be better if I owned certain things I don‘t have. I wouldn‘t be any happier if I owned nicer things. (-) I‘d be happier if I could afford to buy more things. It sometimes bothers me quite a bit that I can‘t afford to buy all the things I‘d like.
Richins and
Dawson (1992)

-190-
Variables Questions Source Scale
Consumer- Based Global Brand Equity
(31)
Brand Trust (4)
This brand meets my expectations of restaurant service. I can rely on this brand to solve the service dissatisfaction.
This brand guarantees satisfaction. I have confidence in this brand.
Delgado-Ballester (2004)
7-point Likert-type
Brand Affect (3)
I feel good when I dine in this restaurant brand. This restaurant brand makes me happy. This restaurant brand gives me pleasure.
Chaudhuri and Holbrook (2001)
Perceived Quality (10)
Food Quality
(3)
This restaurant brand provides tasty foods. This restaurant brand prepares food and drinks according
to hygiene standards. This restaurant brand offers fresh foods.
Kivela et al., (1999)
Dutta et al.(2007)
Soriano (2002)
Physical Environment
(3)
The décor of this restaurant brand is beautifully co-
ordinated with great attention to detail. This restaurant brand offers a tidy environment.
This restaurant brand provides comfortable seats and tables.
Ekinci (2001)

-191-
Variables Questions Source Scale
Consumer- Based Global Brand Equity
Staff Behaviour
(4)
The staff of this restaurant brand is helpful and friendly.
The staff of this restaurant brand seems to anticipate what I want.
The staff of this restaurant brand listens to me. The staff of this restaurant brand is talented and displays a natural expertise.
Ekinci (2001)
7-point Likert-type
Self-Congruence
(4)
Actual Self- Congruence
(2)
The customers who dine in this restaurant reflect the type
of person I am. The customers who dine in this restaurant are very much
like me.
Sirgy and Su (2000)
Ideal Self-
Congruence (2)
The customers who dine in this restaurant reflect the type
of person I would like to be. The customers who dine in this restaurant are very much
like the person I admire.
Sirgy and Su (2000)
Brand Awareness (4)
I am aware of this brand. I can recognize this brand among other restaurant brands.
When I think of a restaurant brand, this is one of the brands that come to mind. I am familiar with this restaurant brand.
Yoo et al., (2000)
Netemeyer et al., (2004)

-192-
Variables Questions Source Scale
Consumer- Based Global Brand Equity
Brand
Association (3)
This brand has an attractive logo. I like the logo of the brand. I like the colours of building or interior.
Gladden and Funk (2002); Alexandris et
al. (2008)
7-point Likert-type
Brand
Identification (3)
I feel good when I see a positive report in the media about this brand.
I am interested in what others think about this brand. When someone praises this brand, it feels like a personal compliment.
Kuenzel and Halliday (2008)
Mael and Ashforth
(1992)

-193-
Variables
Questions Source
Scale
Brand Reputation (5)
This brand is trustworthy. This brand is reputable. This brand makes honest claims. This brand has a long lasting reputation. In the past, today and in the future, the value behind this brand will not change.
Veloutsou and Moutinho (2009)
7-point
Likert-type
Brand Loyalty (4)
I say positive things about this restaurant brand to other people. I will recommend this restaurant brand to anyone who seeks my advice.
I would not switch to another restaurant brand, even if I had a problem with the services of this restaurant brand.
I will revisit this restaurant brand next time.
Zeithaml et al. (1996); Horppu et al. (2008)
Tayor, et al., (2004)
Chaudhuri and Holbrook (2001)
7-point
Likert-type

-194-
5.5.1.1 Independent Variable: Cultural Values
Collectivism
Collectivism, the first component of cultural values, uses six items adopted from Yoo
and Donthu (2002). Their dimensions are adopted from Hofstede (1980, 1991). As
shown in Table 5.3, the six items were measured on a 7-point Likert-type scale
ranging from 1 = strongly disagree to 7 = strongly agree.
Masculinity
Masculinity, the second dimension of cultural values, uses four items adopted from
Yoo and Donthu (2002) based on Hofstede‘s (1980, 1991) cultural value dimensions.
Table 5.3 shows that the present research uses four items that are scored on a 7-point
Likert-type scale ranging from 1 = strongly disagree to 7 = strongly agree.
Uncertainty Avoidance
The third component of cultural measurements is uncertainty avoidance, which uses
five items adopted from Yoo and Donthu (2002) based on Hofstede‘s (1980, 1991)
cultural value dimensions. As shown in Table 5.3, responses to the five items were
measured on a 7-point Likert-type scale from 1 = strongly disagree to 7 = strongly
agree.
Power Distance
The fourth component of cultural measurements is power distance, which uses five
items adopted from Yoo and Donthu (2002) based on Hofstede‘s cultural value
dimensions (1980,1991). Table 5.3 shows that power distance was measured using
five items with a 7-point Likert-type scale from 1 = strongly disagree to 7 = strongly
agree.

-195-
Long-Term Orientation
Long-term orientation, the fifth component of cultural measurements, uses two items
adopted from Jung et al. (2008) based on Hofstede‘s (1980, 2001) dimension. As
shown in Table 5.3, the current research employs two items that are scored on a 7-
point Likert-type scale ranging from 1 = strongly disagree to 7 = strongly agree.
Materialism
The sixth component of cultural measurements is materialism, which uses five items
adopted from Richins and Dawson (1992). As shown in Table 5.3, the five items are
scored with a 7-point Likert-type scale that ranges from 1 = strongly disagree to 7 =
strongly agree.
5.5.1.2 Consumer-Based Global Brand Equity
Brand Trust
The items related to brand trust are adopted from Delgado-Ballester (2004). As Table
5.3 shows, for the measurement of variables, this research employs four items for
brand trust that are scored on a 7-point Likert-type scale ranging from 1 = strongly
disagree to 7 = strongly agree.
Brand Affect
The second component of brand measurements is brand affect, which uses three items
adopted from Chaudhuri and Holbrook (2001). As shown in Table 5.3, three items for
brand affect are measured on a 7-point Likert-type scale ranging from 1 = strongly
disagree to 7 = strongly agree.

-196-
Perceived Quality
Ekinci (2001) proposes that service quality has only two dimensions, physical quality
and staff behaviour, both of which use a five-point Likert scale. In addition, overall
service quality uses a seven-point, single-item scale, which was anchored by the
terms ―1 = strongly disagree and 7 = strongly agree‖ Ekinci et al. (2008).
Physical quality and staff behaviour, the components of perceived quality
measurement, use three and four items, respectively, which are adopted from Ekinci
(2001). Food quality, a component of perceived quality, employs three items adopted
from Kivela et al., (1999), Dutta et al., (2007), and Soriano (2002). As shown in Table
5.3, the current research uses entirely ten items for perceived quality within a 7-point
Likert-type scale ranging from 1 = strongly disagree to 7 = strongly agree.
Self-Congruence
The items of self-congruence, the fourth component of brand measurements, are
adopted from Sirgy and Su (2000). As Table 5.3 shows regarding the measurement of
the variables, this research consists of two components, actual self-congruence (two
items) and ideal self-congruence (two items), with a 7-point Likert-type scale ranging
from 1 = strongly disagree to 7 = strongly agree. Thus, there are four items in total.
Brand Awareness
The fifth component of brand measurements is brand awareness, which employs four
items adopted from Yoo et al., (2000) and Netemeyer et al., (2004). As shown in
Table 5.3, the authors above created four items for brand awareness, with a 7-point
Likert-type scale ranging from 1=strongly disagree to 7=strongly agree. This four
item scale shows the characteristic traits of brand awareness and the degree to which
these allow us to know the complex mindset of consumers regarding the range of
awareness.

-197-
Brand Association
The sixth component of brand measurement is brand association, which is adopted
from Alexandris et al. (2008) based on Gladden and Funk (2002). As shown in Table
5.3, this research uses three items for brand association, which are scored on a 7-point
Likert-type scale ranging from 1 = strongly disagree to 7 = strongly agree.
Brand Identification
The last component of brand measurements is brand identification, which is adopted
from Kuenzel and Halliday‘s (2008) item and Mael and Ashforth‘s (1992) items. As
shown in Table 5.3, the current research employs three items for brand identification,
with a 7-point Likert-type scale ranging from 1 = strongly disagree to 7 = strongly
agree.
5.5.1.3 Dependent Variables: Brand Reputation and Brand
Loyalty
Brand Reputation
The component of brand reputation measurements consists of five items, which is
adopted from Veloutsou and Moutinho (2009). As shown in Table 5.3, the five items
are employed with a 7-point Likert-type scale ranging from 1 = strongly disagree to 7
= strongly agree.
Brand Loyalty
The component of purchase intention measurement is conative and adopted from
Chaudhuri and Holbrook (2001), Tayor et al. (2004) and Horppu et al. (2008) adapted
from Zeithaml et al. (1996). As can clearly be seen from the Table 5.3, the current
research employs four items that are scored on a 7-point Likert-type scale ranging
from 1 = strongly disagree to 7 = strongly agree.

-198-
5.6 The Pilot Study
A pilot test was conducted to ensure that wording, explanations, and questions were
clear and arranged in a proper format (Crouch and Louviere, 2004). It was conducted
with participants who were familiar with global restaurants. For the survey,
participants were accessed through personal contacts.
The pilot study was conducted three times in May of 2010 using the initial
questionnaire (see Appendix C). 30 questionnaires were distributed for the first pilot
study in Oxford. The result of the first pilot study revealed that some questions on
cultural values were obscure and difficult for participants to understand. Thus, the
scale of cultural values used by Furrer et al. (2000) as presented in the initial
questionnaire were exchanged with the research scales of Yoo and Donthu (2002) in
order to provide a better understanding for the participants. The second pilot study
was conducted to check respondents‘ levels of understanding of the questions after
changing the scale of cultural values. 30 questionnaires were distributed and most
respondents understood the questions with greater ease. Before the main survey, a
third pilot study was carried with the Korean version of the questionnaires.
Questionnaires were distributed to 10 Korean native speakers for a check on wording.
In particular, questionnaire of the Korean version was checked by two specialists
(translators) among them to see if the translation was exact. Minor modifications
were made in wording. The revised questionnaires appear in Appendix D.
5.7 Data Analysis
Data analysis starts with editing data and coding from the questionnaire. The present
research deals with quantitative analysis ranging from basic descriptive analysis, t-
test, and ANOVA with post-hoc test (Duncan‘s multiple range test) to more complex
factor and reliability analyses, and multiple regression analysis performed by
employing the SPSS software program. The result of this analysis appears in sections
6.2, 6.3, 6.4, 6.5 and 6.6. Figure 5.5 displays the data analysis procedure, ranging
from editing data to more a complex multiple range test.


-200-
5.7.1 Profiles of Participants
Profiles of participants consist of their socio-demographics, such as gender, age,
nationality, occupation and annual income (see 6.2). In the current research, this
information is useful to better understand their characteristics, and it is essential
information. Moreover, it is needed in order to compare between groups using t-test
and ANOVA with post-hoc test, which may offer more useful findings (see 6.6).
Tabulation is the orderly arrangement of data in the form of a table or other summary
format, and it is useful in revealing percentages and cumulative percentages as well as
frequency distributions (Zikmund, 2000). Furthermore, a histogram, pie chart, and bar
diagram are diagrams that have columns or sections that display the frequencies of
the wider range of numerical scores or values of a quantity (Welman, et al., 2005).
In the present research, the frequency test is employed to describe the demographic
details such as gender distribution, age group distribution, distribution of annual
personal income, and main purpose for restaurant visit. Moreover, pie and bar charts
are used to display data. This is helpful in displaying basic characteristics (see 6.2).
5.7.2 Factor Analysis
Factor analysis is used to reduce the number of factors, and to summarize the
information contained in a number of original variables into a smaller set of factors
(Hair et al., 2006). The most commonly employed technique is Varimax rotation,
which enables the number of variables to be reduced (Pallant, 2007). This rotation is
used to simplify the structure of the factors, which is strongly loaded with a given
factor (Thiétart et al., 2001). Thiétart et al emphasize that such a structure generally
improves the interpretation of the factors and that Varimax rotation seems to be the
most efficient method that offers the best results. This is because the rotation displays
the pattern of loadings in a way that helps the researcher to interpret the data more
easily (Pallant, 2007). Interpretation of factors is an essential part of factor analysis
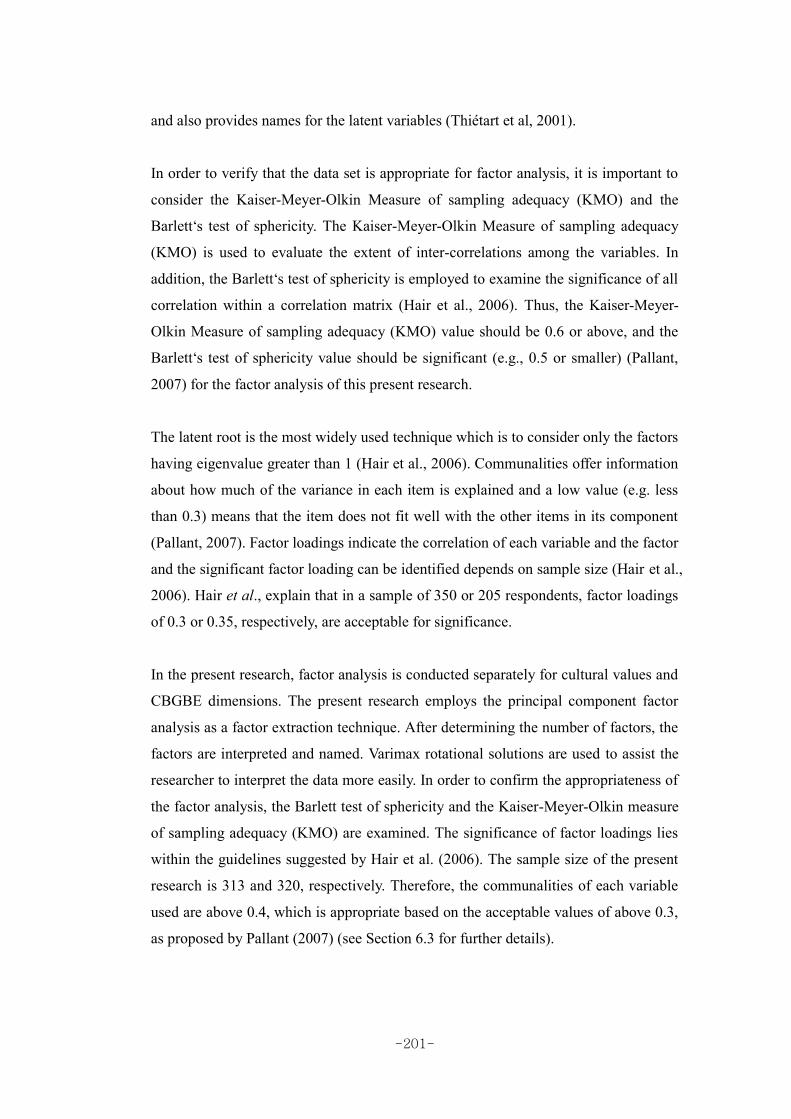
-201-
and also provides names for the latent variables (Thiétart et al, 2001).
In order to verify that the data set is appropriate for factor analysis, it is important to
consider the Kaiser-Meyer-Olkin Measure of sampling adequacy (KMO) and the
Barlett‘s test of sphericity. The Kaiser-Meyer-Olkin Measure of sampling adequacy
(KMO) is used to evaluate the extent of inter-correlations among the variables. In
addition, the Barlett‘s test of sphericity is employed to examine the significance of all
correlation within a correlation matrix (Hair et al., 2006). Thus, the Kaiser-Meyer-
Olkin Measure of sampling adequacy (KMO) value should be 0.6 or above, and the
Barlett‘s test of sphericity value should be significant (e.g., 0.5 or smaller) (Pallant,
2007) for the factor analysis of this present research.
The latent root is the most widely used technique which is to consider only the factors
having eigenvalue greater than 1 (Hair et al., 2006). Communalities offer information
about how much of the variance in each item is explained and a low value (e.g. less
than 0.3) means that the item does not fit well with the other items in its component
(Pallant, 2007). Factor loadings indicate the correlation of each variable and the factor
and the significant factor loading can be identified depends on sample size (Hair et al.,
2006). Hair et al., explain that in a sample of 350 or 205 respondents, factor loadings
of 0.3 or 0.35, respectively, are acceptable for significance.
In the present research, factor analysis is conducted separately for cultural values and
CBGBE dimensions. The present research employs the principal component factor
analysis as a factor extraction technique. After determining the number of factors, the
factors are interpreted and named. Varimax rotational solutions are used to assist the
researcher to interpret the data more easily. In order to confirm the appropriateness of
the factor analysis, the Barlett test of sphericity and the Kaiser-Meyer-Olkin measure
of sampling adequacy (KMO) are examined. The significance of factor loadings lies
within the guidelines suggested by Hair et al. (2006). The sample size of the present
research is 313 and 320, respectively. Therefore, the communalities of each variable
used are above 0.4, which is appropriate based on the acceptable values of above 0.3,
as proposed by Pallant (2007) (see Section 6.3 for further details).

-202-
5.7.3 Reliability Analysis
The question of reliability is connected with all operational processes of quantitative or
qualitative research, that is to say data collection, coding, and all other procedures
involved in preparing and analyzing data (Thiétart et al., 2001). Reliability exists in
relation to both the findings of the research and the credibility of the findings (Welman et
al., 2005). It is important that researchers precisely formulate their research design to a
high degree of reliability (Thiétart et al., 2001).
In quantitative research, the reliability of the research instrument seems to be related
to research reliability (Thiétart et al., 2001). Cronbach‘s (1951) coefficient alpha is
employed to estimate the degree of the internal consistency of a measurement (e.g.
cultural value dimensions, CBGBE dimensions, brand reputation and brand loyalty)
(Welman et al., 2005), that is, how well all the items in a measurement are positively
correlated with one another (Sekaran, 2003).
Peterson (1994) highlighs the fact that the level of Cronbach‘s alpha should be
between 0.60 and 0.95, depending on the type of research. Hair et al. (2006)
maintains that a 0.6 level can be employed as an acceptable level in exploratory
research. Therefore, according to the characteristic of the current study, it needs to
employ 0.6 level as an acceptable level (see Section 6.3 for further details.).
5.7.4 Regression Analysis
Multiple regression analysis is performed to examine the effect of the independent
variables on the dependent variable in the present research. When more than one
independent variable is regressed together against the criterion variable, this is called
multiple regression analysis (Sekaran, 2003). Multiple regression analysis is
simultaneously able to investigate the effect of two or more independent variables on
a dependent variable that is a single interval scaled (Zikmund, 2000).
Zikmund (2000) points out that in a regression model it is important to understand
how independent variables affect the dependent variable. For the statistical
significance of the model, R-square (R²), F ratio and the beta (β) value should be

-203-
checked. The square of multiple r, R-square, or R² is the amount of variance
explained in the dependent variable by the predictor variables. In addition, F ratio
offers a measure of the statistical significance of the model. When the p-value is no
more than .05 (.01, .001, etc.), the F ratio is regarded as significant (Brace et al.,
2000), and the variable is making a contribution to the prediction of the dependent
variable (Pallant, 2007).
Moreover, a researcher examines the standardized coefficients in order to compare the
different variables. ‗Standardised‘ means that these values, for every different variable,
have been converted to an equal scale (Pallant, 2007). Hair et al. (2006) explain that
the strength of the relationship between dependent and independent variables in the
regression variate is represented by the beta coefficients. The beta (β) value can be
used to compare which independent variable has the most influence on the dependent
variable.
Prior to proceeding, multicollinearity should be checked (Hair et al., 2006). The value
of multicollinearity can be checked via the tolerance and VIF, which are above 0.1
and less than 10, respectively (Pallant, 2007). The analysis is performed to find the
relationship among variables in the British and South Korean samples. Further details
are contained in Section 6.4 and 6.5.
5.7.5 t-Test
The t-test is used to compare the different impact of two groups on the dependent
variable (Pallant, 2007).
In the current research, a t-test is performed to identify the mean differences between
independent variables (e.g. gender, marriage) and the dependent variable (e.g.
Consumer-Based Global Brand Equity). In the interpretation of the results of a test,
the significant differences between two groups are accepted when the p-value is less
than 0.05 (see 6.6.1.1, 6.6.1.2, 6.6.1.3 and 6.6.1.4 for further details).

-204-
5.7.6 ANOVA with Post-hoc Test
ANOVA is the appropriate method of comparing the means of more than two groups
(Zikmund, 2000). ANOVA is performed to examine the significant mean differences
among more than two groups of the independent variables to the dependent variables
(Sekaran, 2003).
The results of ANOVA are interpreted through the F statistic value and p-value. F
ratio indicates the variance between the different groups, divided by the variance
within the groups, in addition, a large F ratio represents that there is more variability
between the groups than there is within each group (Pallant, 2007). The p-value must
be less than 0.05 in order for the F-ratio to be regarded as significant (Brace, Kemp,
and Snelgar, 2006).
The post-hoc test can be performed, as appropriate, to detect where exactly the mean
differences lie (Sekaran, 2003). More specifically, through the post hoc test,
deeper insight is provided into the mean differences of groups. Several post-hoc tests
are different in the light of their nature and strictness, such as Tukey‘s Honesty
Significant Different test (HSD), Dunnett‘s C test, Scheffe‘s test, Duncan‘s multiple
range test, and so on.
The present research uses an one way analysis of variance (one way ANOVA), which
is performed to compare the mean differences between groups (e.g. age, income) and
with the variable (e.g. Consumer-Based Global Brand Equity). After receiving a
statistically significant difference of the ANOVA, Duncan‘s multiple range test is
conducted as a post-hoc test (see Section 6.6.1.3 and 6.6.1.4 for further details).
5.8 Summary
This chapter centres on selecting appropriate research methods and techniques. The
research goes through several research process stages (i.e. research design, sampling
method, the appropriate data collection method, development of questionnaires
design, data analysis).

-205-
The target population for the present research consists of native English and Korean
speakers who are familiar with the global brands of the restaurants. An operational
procedure including convenience sampling, questionnaire development process and
measurement of variables is conducted. Moreover, a pre-test is conducted before the
main survey, and reliability and validity are considered. Data was analysed through
the SPSS soft program.
The first part of the analysis involved profiling the socio-demographics of
respondents and purpose of their visit for global restaurant brands by using
descriptive analysis. The research hypotheses are tested by using various statistical
techniques, both in the entire sample and in each of the British and Korean samples.
Descriptive analysis shows the fundamental characteristics of the data. Factor
analysis is used to develop and evaluate scales (Pallant, 2007) and identify factors
both in the entire sample and each of the British and South Korean samples.
Cronbach‘s Alpha is one of the most commonly uses indicators of internal
consistency (Sekaran, 2003). This research examined the perceptual differences of
Consumer-Based Global Brand Equity (CBGBE) between groups by using t-test, and
ANOVA with a post-hoc test (Duncan‘s multiple range test). Multiple regression
analysis is employed to test the research model.

-206-
CHAPTER 6

-207-
CHAPTER 6
FINDINGS
6.1 Introduction The purpose of this chapter is to present the findings of the study. The analysis of the
data is aided by the Statistical Package for the Social Sciences (SPSS) which allowed
descriptive analysis, factor analysis, reliability analysis, t-test, ANOVA with post-hoc
test and regression analysis to be conducted on the whole sample, and also both the
British and South Korean samples. This chapter consists of four sections. The first
part shows the profiles of the participants, through the use of descriptive analysis, as
regards socio-demographics and main purpose of visit to global brand restaurants.
The second part displays the reliability and validity of the cultural values, Consumer-
Based Global Brand Equity (CBGBE), brand reputation and brand loyalty scales. The
third section illustrates that the research model and hypotheses are tested by
examining the relationship between the research variables using multiple regression.
The fourth section shows the perceptional differences among the respondents
analyzed by t-test and ANOVA.
6.2 Profiles of the Respondents The profiles of the respondents include gender, age group, income and main purpose
of visit. With regard to the representativeness of samples, it is worth noting that it
would be impossible to observe the whole population of the subjects that the
researcher is interested in (Graziano and Raulin, 1997). In the present research, the
sampling is focused on consumers who just experienced the global restaurant.
However, it is not only difficult to count the numbers of consumers who have
experienced the brand, according to their ages, incomes and gender, but there is also
no need to investigate them. Thus, proportion of the respondents in the samples may
be different from the whole population. Although samples can not perfectly represent
of the population (Graziano and Raulin, 1997), the study of the samples can show a
more reliable result by using the appropriate sample size (Sekaran, 2003).

-208-
6.2.1 Profiles of the Whole Sample
Gender: Figure 6.1 displays the distribution of gender.
Figure 6.1: Gender Distribution of the Respondents in the Whole sample
45.4%
54.6%
Male
Female
There are 313 British respondents and 320 South Korean respondents, and so the total
number of respondents is 633. The male‘s proportion of the sample accounts for
45.4% and female is made up of 54.6%.
Age of Respondents: The distribution of sample by age appears in Figure 6.2 Figure 6.2: Age Group Distribution of the Respondents in the Whole sample
29.6% 27.9%25.4%
11.4%
3.6% 2.1%
0
5
10
15
20
25
30
35
16-25 26-35 36-45 46-55 56-65 Over 65


-211-
Figure 6.5: Gender Distribution of British Respondents
51.0%
49.0% Male
Female
The percentage of the males and females are 49.0% and 51.0% respectively. Thus the
distribution of the British respondents‘ gender is fairly balanced.
Age of Respondents: Figure 6.6 indicates age group of Respondents
Figure 6.6: Age Group Distribution of British Respondents
31.4%
19.6%
25.3%
17.3%
4.8%1.6%
0
5
10
15
20
25
30
35
40
16-25 26-35 36-45 46-55 56-65 over 65

-212-
The biggest age group is between16-25 (31.4%). The percentage of 36-45 years old is
25.3% which is higher than 26-35 (19.6%) and 46-55 (17.3%). In contrast, the age
groups 56-65, and over 65 take up a lower proportion.
Income of Respondents: Annual personal income of respondents appears in
Figure 6.7.
Figure 6.7: Distribution of Annual Personal Income of British Respondents
14.7%
21.1%
16.1% 18.6%
10.2%
7.4%
11.9%
0
5
10
15
20
25
No Inco
me
Less th
an £
15,00
0
£15
,000 t
o£24
,999
£25
,000 t
o £34
,999
£35
,000 t
o £44
,999
£45
,000 t
o £54
,999
Over £
55,00
0
Figure 6.7 indicates annual personal income before tax. Less than 15,000 GBP is the
greatest proportion (21.1%) among the categories; 18.6% are between 25,000-34,999
GBP; 16.1% are between 15,000-24,999 GBP; 14.7% are no income; 11.9% are over
55,000 GBP and 7.4% are between 45,000-54,999 GBP.
Main Purpose of Restaurant Visit: Figure 6.8 displays British respondents‘ main purpose for restaurant visit.


-215-
small number of respondents. The 46-55 age group stands at 5.6%. The respondents
of the lowest group are between 56-65, and over 65 (2.5% in each).
Income of Respondents: Figure 6.11 presents respondents‘ annual personal income.
Figure 6.11: Distribution of Annual Personal Income of South Korean Respondents
28.4%
18.8%
31.3%
10.2%
3.2% 4.5% 3.5%
0
5
10
15
20
25
30
35
No Inco
me
Less th
an £
15,00
0
£15
,000 t
o£24
,999
£25
,000 t
o £34
,999
£35
,000 t
o £44
,999
£45
,000 t
o £54
,999
Over £
55,00
0
The highest proportion (31.3%) has between 15,000-24,999 GBP as the annual
personal income before tax. The larger percentage of no income and less than 15,000
GBP are 28.4% and 18.8% respectively. In contrast to this, the lowest proportions lie
in the groups with 35,000-44,999 GBP.
Main Purpose of Restaurant Visit: Figure 6.12 accounts for the main purpose of restaurant visit in South Korea.


-217-
In the chapter on methodology, there are considerable details about reliability and
validity (see 5.7.3 and 5.7.4). In addition, the results of both the reliability test
(Cronbach‘s alpha test) and the factor analyses are described in 6.3.1 below.
6.3.1 Validity and Reliability of the Cultural Values Scale The validity and reliability is determined through the results of the reliability test and
factor analysis using SPSS, which is performed on the whole sample as well as the
British and South Korean samples separately. Data collected from the two samples are
analyzed using principal component extraction with a Varimax rotation. This is done
in order to categorize items for data summarization and also to identify the
framework of a set of research variables (Hair et al., 2006).
6.3.1.1 The Whole Sample The KMO (Kaiser-Meyer-Oklin) value is 0.844 which exceeds the recommended
value of 0.6 (Pallant, 2007). Barlett‘s Test of Sphericity is shown to be statistically
significant (p=0.000) (see 5.7.3 for details about the KMO and Barlett‘s Test of
Sphericity). This supports the notion of factorability of the correlation matrix. The
data fulfils the fundamental requirements of factor analysis. Cultural values scale is
subjected to factor analysis with a Varimax rotation performed using SPSS. The final
result of the factor analysis suggests a six factor solution. The results of the factor
analysis are presented in Table 6.1.

-218-
Table 6.1: Results of Factor Analysis for the Cultural Values Scale
Scales Factor Loadings
Factor 1 Factor 2 Factor 3 Factor 4 Factor 5 Factor 6 Communalities
Collectivism
Group success is more important than individual success. 0.83 0.72
Group welfare is more important than individual rewards. 0.83 0.71
Individuals should pursue their goals after considering the welfare of the group. 0.76 0.61
Individuals should stick with the group even through difficulties. 0.76 0.64
Group loyalty should be encouraged even if individual goals suffer. 0.75 0.61
Individuals should sacrifice self-interest for the group that they belong to. 0.68 0.50
Uncertainty Avoidance
Rules/regulations are important because they inform me of what is expected of me. 0.87 0.79
Standardized work procedures are helpful. 0.83 0.74
It is important to closely follow instructions and procedures. 0.83 0.74
Instructions for operations are important. 0.81 0.71
It is important to have instructions spelled out in detail so that I always know what I‘m expected to do.
0.65 0.56

-219-
Scales Factor Loadings
Factor 1 Factor 2 Factor 3 Factor 4 Factor 5 Factor 6 Communalities
Power Distance
People in lower positions should not disagree with decisions made by people in higher positions.
0.82 0.70
People in higher positions should not delegate important tasks to people in lower positions.
0.82 0.72
People in higher positions should avoid social interaction with people in lower positions.
0.80 0.71
People in higher positions should not ask the opinions of people in lower positions too frequently.
0.77 0.64
Masculinity
Men usually solve problems with logical analysis; women usually solve problems with intuition.
0.78 0.66
Solving difficult problems usually requires an active forcible approach, which is typical of men.
0.78 0.70
It is more important for men to have a professional career than it is for women. 0.74 0.65
There are some jobs that a man can always do better than a woman. 0.64 0.55
Materialism
I‘d be happier if I could afford to buy more things. 0.86 0.76
It sometimes bothers me quite a bit that I can‘t afford to buy all the things I‘d like. 0.82 0.70
My life would be better if I owned certain things I don‘t have. 0.73 0.63

-220-
Scales Factor Loadings
Factor 1 Factor 2 Factor 3 Factor 4 Factor 5 Factor 6 Communalities
Long-Term Orientation
I am working and saving for the future. 0.90 0.84
I am planning and preparing for the future. 0.90 0.85
Eigenvalue 3.75 3.58 2.80 2.52 2.13 1.75
% of Variance 15.63% 14.93% 11.70% 10.53% 8.89% 7.29% Total: 68.99%
Extraction Method: Principal Component Analysis Rotation Method: Varimax Rotation Item loading less than 0.40 omitted

-221-
As can be seen from Table 6.1, the factor analysis produces a six factor solution. The
eigenvalues are greater than 1.0 supporting the factor solution for the cultural values
scale. The factor loadings in all of the 24 items are over 0.4. (see 5.7.3 for the details
about the eigenvalues and the factor loadings). The six factors account for 68.99% of
the total variance. Collectivism contributes 15.63%, Uncertainty Avoidance
contributes 14.93%, Power Distance contributes 11.70%, Masculinity contributes
10.53% and Materialism contributes 8.89%, and Long-Term Orientation contributes
7.29% of the total variance explained. The outcome of the factor analysis supports
construct validity of the scale.
Following the successful factor analysis results, Cronbach‘s alpha is used to examine
the internal consistency reliability of the scale. The results of the reliability analysis
are shown in Table 6.2.

-222-
Table 6.2: Reliability of the Cultural values Scale
Dimensions Items Item to total Correlation
Cronbach’s Alpha
Collectivism
Group success is more important than individual success. 0.75
0.87
Group welfare is more important than individual rewards. 0.74 Individuals should pursue their goals after considering the welfare of the group. 0.65
Individuals should stick with the group even through difficulties. 0.69 Group loyalty should be encouraged even if individual goals suffer. 0.65 Individuals should sacrifice self-interest for the group that they belong to. 0.58
Uncertainty Avoidance
Rules/regulations are important because they inform me of what is expected of me. 0.80
0.88
Standardized work procedures are helpful. 0.75 It is important to closely follow instructions and procedures. 0.77 Instructions for operations are important. 0.71 It is important to have instructions spelled out in detail so that I always know what I‘m expected to do. 0.57
Power Distance
People in lower positions should not disagree with decisions made by people in higher positions. 0.68
0.84
People in higher positions should not delegate important tasks to people in lower positions. 0.71
People in higher positions should avoid social interaction with people in lower positions. 0.70
People in higher positions should not ask the opinions of people in lower positions too frequently. 0.62
Masculinity
Men usually solve problems with logical analysis; women usually solve problems with intuition. 0.61
0.79 Solving difficult problems usually requires an active forcible approach, which is typical of men. 0.68
It is more important for men to have a professional career than it is for women. 0.62 There are some jobs that a man can always do better than a woman. 0.52

-223-
Dimensions
Items Item to total
Correlation Cronbach’s
Alpha
Materialism
I‘d be happier if I could afford to buy more things. 0.69 0.78
It sometimes bothers me quite a bit that I can‘t afford to buy all the things I‘d like. 0.60
My life would be better if I owned certain things I don‘t have. 0.57
Long-Term Orientation I am working and saving for the future. 0.71
0.82 I am planning and preparing for the future. 0.71
Extraction Method: Principal Component Analysis Rotation Method: Varimax Rotation Item loading less than 0.40 omitted
-224-
As shown in Table 6.2, Cronbach‘s alpha coefficients of the Collectivism, Uncertainty
Avoidance, Power Distance, Masculinity, Materialism and Long-Term Orientation
dimensions show good internal consistency with alpha values of 0.87, 0.88, 0.84, 0.79,
0.78, 0.82, respectively, all of which exceed the minimum reliability standard of 0.60
(Murphy and Davidshofer, 1988; Robinson et al., 1991; Peterson, 1994) for an
exploratory study (Hair et al., 2006).
6.3.1.2 Cross-Cultural Validity and Reliability of the Cultural
Values Scale The cultural value scale is subjected to factor analysis with the Varimax rotation
applied using SPSS. This is in order to ―identify the extent to which questions seem to
be capturing the same dimensions and the degree to which they could be reduced to a
smaller set of factor attributes‖ (Kozac, 2002:224). For the cross cultural study it is
necessary to confirm and also compare the validity and reliability of the cultural
values scale between the British and South Korean samples.
6.3.1.2.1. The British Sample
The KMO (Kaiser-Meyer-Oklin) value at 0.807 which exceeds the minimum value of
0.6 (Pallant, 2007) and the Barlett‘s Test of Sphericity indicates statistical significance
(p=0.000), supporting the factorability of the correlation matrix. Thus, the scale meets
the standard requirements for the factor analysis. The final result of the factor analysis
suggests a six factor solution. Table 6.3 displays the results of the factor and
reliability analyses.

-225-
Table 6.3: Results of Factor and Reliability Analyses for the Cultural values Scale (British)
Scales Factor Loadings
Factor 1 Factor 2 Factor 3 Factor 4 Factor 5 Factor 6 Communalities
Collectivism ( = 0.87 )
Group success is more important than individual success. 0.86 0.76 Group welfare is more important than individual rewards. 0.85 0.73
Individuals should stick with the group even through difficulties. 0.78 0.65
Group loyalty should be encouraged even if individual goals suffer. 0.73 0.59
Individuals should pursue their goals after considering the welfare of the group. 0.71 0.52
Individuals should sacrifice self-interest for the group that they belong to. 0.70 0.50
Uncertainty Avoidance ( = 0.85 ) Rules/regulations are important because they inform me of what is expected of me. 0.88 0.79
Standardized work procedures are helpful. 0.84 0.73
It is important to closely follow instructions and procedures. 0.81 0.70
Instructions for operations are important. 0.80 0.68 It is important to have instructions spelled out in detail so that I always know what I‘m expected to do. 0.54 0.44
Power Distance ( = 0.83 ) People in higher positions should not delegate important tasks to people in lower positions. 0.83 0.74
People in higher positions should not ask the opinions of people in lower positions too frequently. 0.82 0.70
People in lower positions should not disagree with decisions made by people in higher positions. 0.77 0.65
People in higher positions should avoid social interaction with people in lower positions. 0.76 0.67

-226-
Scales
Factor Loadings
Factor 1 Factor 2 Factor 3 Factor 4 Factor 5 Factor 6 Communalities
Masculinity ( = 0.79 )
Men usually solve problems with logical analysis; women usually solve problems with intuition.
0.81 0.70
It is more important for men to have a professional career than it is for women. 0.80 0.69 Solving difficult problems usually requires an active forcible approach, which is typical of men.
0.78 0.71
There are some jobs that a man can always do better than a woman. 0.63 0.49
Materialism ( = 0.83 )
I‘d be happier if I could afford to buy more things. 0.88 0.81
It sometimes bothers me quite a bit that I can‘t afford to buy all the things I‘d like. 0.84 0.74
My life would be better if I owned certain things I don‘t have. 0.81 0.69
Long-Term Orientation ( = 0.84 )
I am working and saving for the future. 0.92 0.87
I am planning and preparing for the future. 0.91 0.86
Eigenvalue 3.75 3.26 2.77 2.64 2.28 1.81
% of Variance 15.62% 13.60% 11.55% 11.00% 9.51% 7.57% Total: 68.87% Extraction Method: Principal Component Analysis Rotation Method: Varimax Rotation Item loading less than 0.40 omitted

-227-
According to Table 6.3, a six factor solution is supported by the result of the factor
analysis of the 24 items for the cultural values. The six factors have eigenvalues
greater than 1.0 and factor loadings over 0.4. The results of the factor analysis suggest
a six factor solution accounting for 68.87 % of the total variance, with 15.62%
(Collectivism), 13.60% (Uncertainty Avoidance), 11.55% (Power Distance), 11.00%
(Masculinity), 9.51% (Materialism) and 7.57% (Long-Term Orientation) portions of
the variance. Therefore, these findings taken from the factor analysis provide
evidence for construct validity of the scale.
Following the factor analysis results, Cronbach‘s alpha test is employed to examine
the internal consistency reliability of the scale. The reliability of each factor is also
tested to compute Cronbach‘s alpha. The alpha coefficients for the six factors range
between 0.79 and 0.87. This fulfills the minimum reliability standard of 0.60.
6.3.1.2.2. The South Korean Sample
The KMO (Kaiser-Meyer-Oklin) value is 0.840 which fulfills the recommended value
of over 0.6 (Pallant, 2007) and the Barlett‘s Test of Sphericity is also found to be
statistically significant (p=0.000). This shows that sufficient intercorrelations exist in
the data matrix, thus factor analysis is appropriate. This means the scale items meet
the fundamental requirements for the factor analysis. A six factor solution is proposed
from the result of the factor analysis. The results of the factor and reliability analyses
are displayed in Table 6.4.

-228-
Table 6.4: Results of Factor and Reliability Analyses for the Cultural Values Scale (South Korean)
Scales Factor Loadings
Factor 1 Factor 2 Factor 3 Factor 4 Factor 5 Factor 6 Communalities
Uncertainty Avoidance ( = 0.90 )
It is important to closely follow instructions and procedures. 0.85 0.76
Rules/regulations are important because they inform me of what is expected of me. 0.83 0.75
Instructions for operations are important. 0.83 0.75 It is important to have instructions spelled out in detail so that I always know what I‘m expected to do. 0.80 0.66
Standardized work procedures are helpful. 0.80 0.72
Collectivism ( = 0.88 )
Group welfare is more important than individual rewards. 0.83 0.72
Group success is more important than individual success. 0.80 0.68
Individuals should pursue their goals after considering the welfare of the group. 0.80 0.69
Group loyalty should be encouraged even if individual goals suffer. 0.74 0.65
Individuals should stick with the group even through difficulties. 0.73 0.66
Individuals should sacrifice self-interest for the group that they belong to. 0.67 0.53
Power Distance ( = 0.84 ) People in lower positions should not disagree with decisions made by people in higher positions. 0.84 0.75
People in higher positions should avoid social interaction with people in lower positions. 0.82 0.74
People in higher positions should not delegate important tasks to people in lower positions. 0.80 0.69 People in higher positions should not ask the opinions of people in lower positions too frequently. 0.73 0.57

-229-
Scales Factor Loadings
Factor 1 Factor 2 Factor 3 Factor 4 Factor 5 Factor 6 Communalities
Masculinity ( = 0.71 ) Men usually solve problems with logical analysis; women usually solve problems with intuition. 0.78 0.65
Solving difficult problems usually requires an active forcible approach, which is typical of man. 0.77 0.64
It is more important for men to have a professional career than it is for women. 0.61 0.53
There are some jobs that a man can always do better than a woman. 0.55 0.47
Long-Term Orientation ( = 0.81 )
I am working and saving for the future. 0.89 0.82
I am planning and preparing for the future. 0.86 0.81
Materialism ( = 0.61 )
I‘d be happier if I could afford to buy more things. 0.85 0.75
It sometimes bothers me quite a bit that I can‘t afford to buy all the things I‘d like. 0.79 0.64
My life would be better if I owned certain things I don‘t have. 0.45 0.50
Eigenvalue 4.00 3.80 2.87 2.11 1.77 1.66
% of Variance 16.69% 15.86% 11.96% 8.80% 7.41% 6.94% Total: 67.68% Extraction Method: Principal Component Analysis Rotation Method: Varimax Rotation Item loading less than 0.40 omitted

-230-
As presented in the table 6.4, the outcome of the factor analysis of the 24 items for
the cultural values produces six factors. The six factors with eigenvalues greater than
1 represent 67.68% of the total variance, with 16.69% (Uncertainty Avoidance),
15.86% (Collectivism), 11.96% (Power Distance), 8.80% (Masculinity), 7.41%
(Long-Term Orientation) and 6.94% (Materialism). All factor loading scores are
greater than 0.4. Therefore, the outcome of the factor analysis confirms the construct
validity of the scale.
Cronbach‘s alpha is computed to test the reliability of the six factors. The results
show that the alpha coefficients for all six factors range between 0.61 and 0.90, which
meet the minimum value of 0.60 as a standard level of reliability (Murphy and
Davidshofer, 1988; Robinson et al., 1991; Peterson, 1994) for an exploratory study
(Hair et al., 2006).
6.3.1.3 Adjustments of the Measures Factor analysis with the Varimax Rotation is applied to the 27 items of cultural values.
Out of the 27 items, three items in the whole sample and each of the British and the
South Korean sample are excluded from further analysis. One of the items is not
loaded on the same factor in the British and South Korean samples. In addition, factor
loadings of two items are low, that is, the factor loadings of the items are below 0.4.
It is necessary to maintain the equivalence of the construct of the British and South
Korean. In terms of methodology, when conducting cross cultural study, functional
equivalence is necessary (Buil et al., 2008). Buil et al. add that equivalent construct
need to be expressed in similar ways when applying across cultures.
The six factors are termed: collectivism, masculinity, uncertainty avoidance, power
distance, long-term orientation, and materialism respectively.

-231-
6.3.2 Validity and Reliability of the Consumer-Based Global
Brand Equity Scale
In order to examine dimensionality of the Consumer-Based Global Brand Equity
(CBGBE) Scale, principal component analysis with the Varimax rotation is performed.
In addition, reliability of the scale is assessed by Cronbach‘s alpha. Both analyses are
conducted on the whole sample and on both the British and South Korean samples
separately.
6.3.2.1. The Whole Sample The KMO (Kaiser-Meyer-Oklin) value is 0.931 which is the standard level - above
0.6 (Pallant, 2007) and the Barlett‘s Test of Sphericity is statistically significant at
p=0.000. This is used to determine the propriety of applying factor analysis with
Varimax rotation. This supports the notion of factorability of the correlation matrix
and the scale fulfils the fundamental requirements of factor analysis. The factor
analysis determined the six factor solution which is displayed in Table 6.5 and the
results of the reliability analysis are shown in Table 6.6.

-232-
Table 6.5: Results of Factor Analysis for the Consumer-Based Global Brand Equity Scale
Scales Factor Loadings
Factor 1 Factor 2 Factor 3 Factor 4 Factor 5 Factor 6 Communalities Brand Trust
This restaurant brand makes me happy. 0.80 0.81
I feel good when I dine in this restaurant brand. 0.79 0.79
This restaurant brand gives me pleasure. 0.79 0.77
This restaurant brand provides tasty foods. 0.75 0.68
I have confidence in this brand. 0.74 0.72
This brand guarantees satisfaction. 0.72 0.72
This brand meets my expectations of restaurant service. 0.64 0.65
I can rely on this brand to solve the service dissatisfaction. 0.55 0.60
Perceived Quality
The staff of this restaurant brand is helpful and friendly. 0.77 0.73
This restaurant brand offers a tidy environment. 0.72 0.65
The staff of this restaurant brand is talented and displays a natural expertise. 0.72 0.71
The staff of this restaurant brand listens to me. 0.72 0.67
The staff of this restaurant brand seems to anticipate what I want. 0.70 0.60
This restaurant brand provides comfortable seats and tables. 0.68 0.58
The décor of this restaurant brand is beautifully co-ordinated with great attention to detail. 0.59 0.62

-233-
Scales Factor Loadings
Factor 1 Factor 2 Factor 3 Factor 4 Factor 5 Factor 6 Communalities Self-Congruence
The customers who dine in this restaurant are very much like me. 0.84 0.82
The customers who dine in this restaurant reflect the type of person I am. 0.80 0.81 The customers who dine in this restaurant reflect the type of person I would like to be.
0.78 0.80
The customers who dine in this restaurant are very much like the person I admire. 0.66 0.73
Brand Awareness
I am familiar with this restaurant brand. 0.89 0.82
I can recognize this brand among other restaurant brands. 0.85 0.77
I am aware of this brand. 0.84 0.73
When I think of a restaurant brand, this is one of the brands that come to mind. 0.50 0.48
Brand Association
I like the logo of the brand. 0.85 0.86
This brand has an attractive logo. 0.82 0.83
I like the colours of building or interior. 0.74 0.77

-234-
Scales
Factor Loadings
Factor 1 Factor 2 Factor 3 Factor 4 Factor 5 Factor 6 Communalities
Brand Identification
I am interested in what others think about this brand. 0.79 0.74
When someone praises this brand, it feels like a personal compliment. 0.76 0.76
I I feel good when I see a positive report in the media about this brand. 0.57 0.67
Eigenvalue 5.22 4.86 3.11 2.82 2.65 2.35
% of Variance 18.00% 16.76% 10.74% 9.73% 9.14% 8.13% Total:72.52%
Extraction Method: Principal Component Analysis Rotation Method: Varimax Rotation Item loading less than 0.40 omitted

-235-
As shown in Table 6.5, the six factors solution including 29 items with eigenvalues
greater than 1.0 and factor loadings of over 0.4 in all of the 31 items are retained. The
six extracted factors account for a total of 72.52% of the variance, with Brand Trust
explaining 18.00% of the variance, Perceived Quality explaining 16.76% of the
variance, Self-Congruence explaining 10.74 % of the variance, Brand Awareness
explaining 9.73% of the variance, Brand Association explaining 9.14% of the
variance, and Brand Identification explaining 8.13 % of the variance. The results of
the factor analysis confirm construct validity of the scale.
Reliability of the Consumer-Based Global Brand Equity scale (CBGBE) was tested
using Cronbach‘s alpha statistic as seen in Table 6.6.

-236-
Table 6.6: Reliability of the Consumer-Based Global Brand Equity Scale
Dimensions Items Item to total Correlation
Cronbach’s Alpha
Brand Trust
This restaurant brand makes me happy. 0.80
0.93
I feel good when I dine in this restaurant brand. 0.83 This restaurant brand gives me pleasure. 0.77 This restaurant brand provides tasty foods. 0.73 I have confidence in this brand. 0.79 This brand guarantees satisfaction. 0.79 This brand meets my expectations of restaurant service. 0.71 I can rely on this brand to solve the service dissatisfaction. 0.65
Perceived Quality
The staff of this restaurant brand is helpful and friendly. 0.76
0.90
This restaurant brand offers a tidy environment. 0.72 The staff of this restaurant brand is talented and displays a natural expertise. 0.75 The staff of this restaurant brand listens to me. 0.73 The staff of this restaurant brand seems to anticipate what I want. 0.68 This restaurant brand provides comfortable seats and tables. 0.66 The décor of this restaurant brand is beautifully co-ordinated with great attention to detail. 0.66
Self-Congruence
The customers who dine in this restaurant are very much like me. 0.79
0.89 The customers who dine in this restaurant reflect the type of person I am. 0.75 The customers who dine in this restaurant reflect the type of person I would like to be. 0.81 The customers who dine in this restaurant are very much like the person I admire. 0.70
Brand Awareness
I am familiar with this restaurant brand. 0.76
0.81 I can recognize this brand among other restaurant brands. 0.72 I am aware of this brand. 0.64 When I think of a restaurant brand, this is one of the brands that come to mind. 0.42
Brand Association I like the logo of the brand. 0.84
0.87 I like the colours of building or interior. 0.67 This brand has an attractive logo. 0.77
Brand Identification I am interested in what others think about this brand. 0.68
0.80 I feel good when I see a positive report in the media about this brand. 0.62 I When someone praises this brand, it feels like a personal compliment. 0.67

-237-
As shown in Table 6.6, Cronbach‘s alpha coefficient of Brand Trust, Perceived
Quality, Self-Congruence, Brand Awareness, Brand Association, and Brand
Identification dimensions are 0.93, 0.90, 0.89, 0.81, 0.87 and 0.80, respectively. All of
which exceed the acceptable level of 0.60. Thus, the internal consistency is acceptable
for a newly developed scale. ―The Corrected item-total correlated values shown in the
Item-Total Statistics table give an indication of the degree to which each item
correlates with the total score‖ (Pallant, 2007:98). Coefficients of the Brand Trust
dimension range from 0.65 to 0.83; the Perceived Quality dimension range from 0.66
to 0.76; the Self-Congruence dimension range from 0.70 to 0.81; the Brand
Awareness dimension range from 0.42 to 0.76; the Brand Association dimension
range from 0.67 to 0.84 and the Brand Identification dimension range from 0.62 to
0.68.
Consequently, in the whole sample, the CBGBE Scale with six dimensions is retained.
The results of the factor analysis and Cronbach‘s alpha provide evidence for validity
and reliability of the scale.
6.3.2.2 Validity and Reliability of the Consumer-Based Global
Brand Equity Scale in Cross-Cultures
6.3.2.2.1 The British Sample It is necessary to determine the propriety of applying factor analysis through the
examination of the KMO (Kaiser-Meyer-Oklin) measure of sample adequacy and
Barlett‘s Test of Sphericity. The result of KMO (Kaiser-Meyer-Oklin) value shows a
level of 0. 914 which is the standard - above 0.6 (Pallant, 2007) and the Barlett‘s Test
of Sphericity are statistically significant (p=0.000), supporting the factorability of the
correlation matrix. Thus, the scale meets the acceptable requirements for the factor
analysis.
The principal component analysis with the Varimax rotation determines six factors.
Table 6.7 displays the results of the factor analysis and Cronbach‘s alpha test.

-238-
Table 6.7: Result of Factor and Reliability Analyses for the Consumer-Based Global Brand Equity Scale (British)
Scales
Factor Loadings
Factor 1 Factor 2 Factor 3 Factor 4 Factor 5 Factor 6 Communalities
Brand Trust ( = 0.93 )
This restaurant brand makes me happy. 0.81 0.81
This restaurant brand gives me pleasure. 0.80 0.80
I feel good when I dine in this restaurant brand. 0.78 0.79 I have confidence in this brand. 0.78 0.77 This brand guarantees satisfaction. 0.76 0.76
This restaurant brand provides tasty foods. 0.76 0.69
This brand meets my expectations of restaurant service. 0.66 0.63
I can rely on this brand to solve the service dissatisfaction. 0.63 0.64
Perceived Quality ( = 0.90 )
The staff of this restaurant brand is helpful and friendly. 0.74 0.74
This restaurant brand offers a tidy environment. 0.74 0.66
The staff of this restaurant brand is talented and displays a natural expertise. 0.71 0.73
This restaurant brand provides comfortable seats and tables. 0.69 0.64
The staff of this restaurant brand seems to anticipate what I want. 0.67 0.60
The staff of this restaurant brand listens to me. 0.60 0.66
The décor of this restaurant brand is beautifully co-ordinated with great attention to detail. 0.57 0.65

-239-
Scales Factor Loadings
Factor 1 Factor 2 Factor 3 Factor 4 Factor 5 Factor 6 Communalities
Self-Congruence ( = 0.92 )
The customers who dine in this restaurant reflect the type of person I would like to be. 0.87 0.88
The customers who dine in this restaurant are very much like me. 0.83 0.84
The customers who dine in this restaurant are very much like the person I admire. 0.80 0.81
The customers who dine in this restaurant reflect the type of person I am. 0.80 0.81
Brand Awareness ( = 0.74 )
I am familiar with this restaurant brand. 0.87 0.78
I can recognize this brand among other restaurant brands. 0.82 0.72
I am aware of this brand. 0.82 0.71
When I think of a restaurant brand, this is one of the brands that come to mind. 0.40 0.34
Brand Association ( = 0.89 )
I like the logo of the brand. 0.85 0.86
This brand has an attractive logo. 0.80 0.82
I like the colours of building or interior. 0.75 0.80
Brand Identification ( = 0.77 )
I am interested in what others think about this brand. 0.79 0.72
When someone praises this brand, it feels like a personal compliment. 0.77 0.76
I I feel good when I see a positive report in the media about this brand. 0.60 0.67

-240-
Scales Factor Loadings
Factor 1 Factor 2 Factor 3 Factor 4 Factor 5 Factor 6 Communalities
Eigenvalue 5.59 4.52 3.54 2.76 2.63 2.17
% of Variance 19.30% 15.59% 12.21% 9.52% 9.09% 7.50% Total:73.24% Extraction Method: Principal Component Analysis Rotation Method: Varimax Rotation Item loading less than 0.40 omitted

-241-
As shown in table 6.7, all factors including 29 items are maintained for further
analysis. This is based on eigenvalues greater than 1.0 and factor loadings of over 0.4
in all of the 31 items. The six extracted factors explain 73.24% of the total variance,
with 19.30%, 15.59%, 12.21%, 9.52%, 9.09% and 7.50% portions of the variance,
respectively. Therefore, it is evident that construct validity of the scale can be
identified from these outcomes coming from the factor analysis.
Following the factor analysis results, the internal consistency of the items forming six
factors solution is estimated using the reliability analysis. The reliability alpha
coefficients of Brand Trust, Perceived Quality, Self-Congruence, Brand Association,
Brand Awareness, Brand identification were 0.93, 0.90, 0.92, 0.89, 0.74 and 0.77,
respectively.
6.3.2.2.2 The South Korean Sample
The result of KMO (Kaiser-Meyer-Oklin) value shows a level of 0. 919 which is
acceptable - above 0.6 (Pallant, 2007) and the Barlett‘s Test of Sphericity is
considered significant (p=0.000). This result suggests that sufficient intercorrelations
exist in the data matrix. Thus the data is suitable for factor analysis. The principal
component analysis with the Varimax rotation determines six factors solution. The
results of the factor and reliability analyses are presented in Table 6.8.

-242-
Table 6.8: Result of Factor and Reliability Analyses for the Consumer-Based Global Brand Equity Scale (South Korean)
Scales Factor Loadings
Factor 1 Factor 2 Factor 3 Factor 4 Factor 5 Factor 6 Communalities
Brand Trust ( = 0.91)
This restaurant brand makes me happy. 0.81 0.82
I feel good when I dine in this restaurant brand. 0.80 0.79
This restaurant brand gives me pleasure. 0.78 0.78
This restaurant brand provides tasty foods. 0.70 0.65
I have confidence in this brand. 0.68 0.67
This brand guarantees satisfaction. 0.62 0.68
This brand meets my expectations of restaurant service. 0.55 0.68
Perceived Quality ( = 0.90 )
The staff of this restaurant brand listens to me. 0.80 0.71
The staff of this restaurant brand is helpful and friendly. 0.78 0.72
The staff of this restaurant brand is talented and displays a natural expertise. 0.71 0.69
This restaurant brand offers a tidy environment. 0.71 0.65
The staff of this restaurant brand seems to anticipate what I want. 0.70 0.61
This restaurant brand provides comfortable seats and tables. 0.64 0.56
The décor of this restaurant brand is beautifully co-ordinated with great attention to detail. 0.62 0.60
I can rely on this brand to solve the service dissatisfaction. 0.55 0.64

-243-
Scales Factor Loadings
Factor 1 Factor 2 Factor 3 Factor 4 Factor 5 Factor 6 Communalities
Self-Congruence ( = 0.78 )
The customers who dine in this restaurant are very much like me. 0.83 0.80
The customers who dine in this restaurant reflect the type of person I am. 0.77 0.77
The customers who dine in this restaurant reflect the type of person I would like to be. 0.55 0.67
Brand Awareness ( = 0.87 )
I am familiar with this restaurant brand. 0.82 0.81
I am aware of this brand. 0.80 0.69
I can recognize this brand among other restaurant brands. 0.78 0.76
When I think of a restaurant brand, this is one of the brands that come to mind. 0.78 0.72
Brand Association ( = 0.85 )
I like the logo of the brand. 0.83 0.86
This brand has an attractive logo. 0.81 0.81
I like the colours of building or interior. 0.70 0.72
I feel good when I see a positive report in the media about this brand. 0.52 0.69
Brand Identification ( = 0.82 )
When someone praises this brand, it feels like a personal compliment. 0.81 0.75
I am interested in what others think about this brand. 0.74 0.67
The customers who dine in this restaurant are very much like the person I admire. 0.70 0.73

-244-
Extraction Method: Principal Component Analysis Rotation Method: Varimax Rotation Item loading less than 0.40 omitted
Scales Factor Loadings
Factor 1 Factor 2 Factor 3 Factor 4 Factor 5 Factor 6 Communalities
Eigenvalue 5.03 4. 56 3.21 3.12 2.59 2.29
% of Variance 17.36% 15.75% 11.08% 10.76% 8.93% 7.92% Total:71.82%

-245-
As shown in Table 6.8, all factors including 29 items are maintained for further
analysis. This is based on eigen values greater than 1.0 and factor loadings of over 0.4
in all of the 31 items. The six extracted factors explain 71.82% of the total variance,
with 17.36% (Perceived Quality), 15.75% (Brand Trust), 11.08% (Brand Awareness),
10.76% (Brand Identification), 8.93% (Brand Association) and 7.92% (Self-
Congruence). Therefore, it is clear that construct validity of the scale can be identified
from these results of the factor analysis.
The reliability test for testing the internal consistency of the items in six factors was
employed after the factor analysis. The Cronbach‘s alpha coefficients for all six
factors range from 0.78 to 0.91.
The six factors are labeled Brand Trust, Perceived Quality, Self-Congruence, Brand
Awareness, Brand Association and Brand Identification, respectively.
6.3.2.3 Adjustments of the Measures For the British and South Korean samples, factor analysis with a Varimax Rotation
method was applied to the 31 items of CBGBE scale. All the items of Brand Affect
dimension and an item of the Perceived Quality loaded on the dimension of Brand
Trust. In addition, out of the 31 items, two items of the dimension of Perceived
Quality in the whole sample and each of the British and the South Korean sample are
excluded in further analysis. This is because the two items are not loaded on the same
factor in the British and South Korean samples.
It is necessary for both the UK and South Korea questionnaires to have the equivalent
construct. Importantly, in the light of methodology, an establishment of functional
equivalence is necessary for the cross cultural study, (Buil et al., 2008).

-246-
6.3.3 Reliability of the Brand Reputation Scale To assess the reliability of the brand reputation scale, Cronbch‘s alpha test is
performed on the whole sample and each of the British and South Korean samples.
6.3.3.1 The Whole Sample To examine the reliability of the brand reputation scale, Cronbach‘s alpha coefficients
examine the measure in the whole sample. Table 6.9 presents the results of this test.
Table 6.9: Reliability of the Brand Reputation Scale
Brand Reputation Scale Item to Total Correlation
Cronbach’s Alpha
This brand is trustworthy. 0.75
0.87
This brand is reputable. 0.78
This brand makes honest claims. 0.71
This brand has a long lasting reputation. 0.66
In the past, today and in the future, the value behind this brand will not change. 0.61
In the whole sample, the Cronbach‘s alpha coefficient of the brand reputation scale is
0.87, which fulfills the acceptable internal consistency threshold of 0.70 for a mature
scale. Item to total correlation coefficients for the scale are between 0.61 and 0.78.
Therefore, the brand reputation scale confirms its reliability in the whole sample.
6.3.3.2 The British Sample
The reliability test for the British sample measures the internal consistency of a scale
and examines the reliability of the brand reputation scale. Table 6.10 displays the
results of this test.

-247-
Table 6.10: Reliability of the Brand Reputation Scale (British)
Brand Reputation Scale Item to Total Correlation
Cronbach’s Alpha
This brand is trustworthy. 0.75
0.87
This brand is reputable. 0.80
This brand makes honest claims. 0.73
This brand has a long lasting reputation. 0.63
I In the past, today and in the future, the value behind this brand will not change. 0.56
The Cronbach‘s alpha coefficients of brand reputation scale are 0.87 and coefficients
of brand reputation scale range from 0.56 to 0.80. Thus, the Cronbach‘s alpha
coefficients support the reliability of the scale in the British sample.
6.3.3.3 The South Korean Sample
In the South Korean sample, Cronbach‘s alpha coefficients examine the measurement
to examine the reliability of the brand reputation scale. The results of the reliability
analysis are shown in Table 6.11.
Table 6.11: Reliability of the Brand Reputation Scale (South Korean)
Brand Reputation Scale Item to Total Correlation
Cronbach’s Alpha
This brand is trustworthy. 0.72
0.87
This brand is reputable. 0.76
This brand makes honest claims. 0.69
This brand has a long lasting reputation. 0.68
I In the past, today and in the future, the value behind this brand will not change. 0.66
The coefficients of the brand reputation scale indicate 0.87 and the scale range from
0.66 to 0.76. Hence, the Cronbach‘s alpha coefficients confirm the reliability of the
scale in the South Korean sample.

-248-
6.3.4 Reliability of the Brand Loyalty Scale In order to assess the reliability of the scale, Cronbach‘s alpha evaluates the internal
consistency of the scale in the whole sample and each of the British and South
Korean sample.
6.3.4.1 The Whole Sample To examine the reliability of the brand loyalty scale, Cronbach‘s alpha coefficients
examine the measurement in the whole sample. Table 6.12 displays the results of this
test.
Table 6.12: Reliability of the Brand Loyalty Scale
Brand Loyalty Scale Item to Total Correlation
Cronbach’s Alpha
I say positive things about this restaurant brand to other people. 0.80
0.85
I will recommend this restaurant brand to anyone who seeks my advice. 0.82
I would not switch to another restaurant brand, even if I had a problem with the services of this restaurant brand. 0.52
I will revisit this restaurant brand next time. 0.66
Coefficient of the brand loyalty scale indicates 0.85, which value fulfills acceptable
internal consistency threshold – 0.7. Item to total correlation coefficients for the scale
are between 0.52 and 0.82. Therefore, the brand loyalty scale confirms its reliability.
6.3.4.2 The British Sample The reliability test for the British sample measures the internal consistency of a scale
and examines the reliability of the brand loyalty scale. Table 6.13 shows the results of
this test.

-249-
Table 6.13: Reliability of the Brand Loyalty Scale (British)
The Cronbach‘s alpha coefficients of the brand loyalty scale are 0.87 and coefficients
of the brand loyalty scale range from 0.58 to 0.84. Thus, the Cronbach‘s alpha
coefficients for the British sample confirm the reliability of the scale.
6.3.4.3 The South Korean Sample In the South Korean sample, Cronbach‘s alpha coefficients assess the measurement to
examine the reliability of the brand loyalty scale. Table 6.14 presents the results of
this test.
Table 6.14: Reliability of the Brand Loyalty Scale (South Korean)
Brand Loyalty Scale Item to Total Correlation
Cronbach’s Alpha
I say positive things about this restaurant brand to other people. 0.70
0.79
I will recommend this restaurant brand to anyone who seeks my advice. 0.79
I would not switch to another restaurant brand, even if I had a problem with the services of this restaurant brand. 0.41
I will revisit this restaurant brand next time. 0.61
The coefficients of the brand loyalty scale are 0.79 and the scale range from 0.41 to
0.79. Hence, the Cronbach‘s alpha coefficients for the South Korean sample support
the reliability of the scale.
Brand Loyalty Scale Item to Total Correlation
Cronbach’s Alpha
I say positive things about this restaurant brand to other people. 0.84
0.87
I will recommend this restaurant brand to anyone who seeks my advice. 0.82
I would not switch to another restaurant brand, even if I had a problem with the services of this restaurant brand. 0.58
I will revisit this restaurant brand next time. 0.68

-250-
6.4 Hypothesis Testing: Results of the Regression Analysis of the Whole Sample
In the third stage of data analysis, multiple regression analysis is used to test the
research hypotheses and the research model.
The independent variables are six Cultural Value dimensions: Collectivism,
Masculinity, Uncertainty Avoidance, Power Distance, Long-Term Orientation and
Materialism. The mediating variables are six Consumer-Based Global Brand Equity
(CBGBE) dimensions: Brand Trust, Perceived Quality, Self-Congruence, Brand
Awareness, Brand Association, Brand Identification. The dependent variables are
brand reputation and brand loyalty.
It should be noted that it is necessary to perform the multiple regression analysis
using the whole sample. The increased size of whole sample may generate enough
statistical power to detect a significant effect for the dependent variables (Dash,
Bruning and Acharya, 2009). The reason why the analysis is necessary is to confirm
predictive validity of the research model.
Prior to proceeding to the analysis, multicollinearity should be checked as follows.
Multicollinearity can be assessed by a Tolerance Value and a Variance Inflation Factor
(VIF). Tolerance value should be greater than .10 and VIF should be less than 10 in
order to confirm that the regression result is not influenced by multicollinearity
(Pallant, 2007).
For this research, the results of the multicollinearity analysis suggest that both the
Tolerance Value and VIF (Variance Inflation Factor) fulfill the standard. That is, there
was no multicollinearity effect in any of the regression model (see Table 6.15, 6.16,
6.17, 6.18, 6.19).

-251-
6.4.1 Effects of Cultural Values on Consumer-Based Global Brand
Equity
In order to test the research hypotheses, multiple regression analysis using the enter
method was conducted. Six represent the independent variables. The Cultural Value
dimensions are: Collectivism, Masculinity, Uncertainty Avoidance, Power Distance,
Long-Term Orientation, and Materialism. The six CBGBE dimensions are: Brand
Trust, Perceived Quality, Self-Congruence, Brand Awareness, Brand Association, and
Brand Identification. One of the aims of the present research is to examine; how do
Cultural Values have an effect on CBGBE? The first set of research hypotheses
between cultural values and two dimensions of CBGBE (Brand Trust and Perceived
Quality) is described:
H1a: Collectivism of cultural values has an effect on Brand Trust of CBGBE.
H1b: Masculinity of cultural values has an effect on Brand Trust of CBGBE.
H1c: Uncertainty Avoidance of cultural values has an effect on Brand Trust of
CBGBE.
H1d: Power Distance of cultural values has an effect on Brand Trust of CBGBE.
H1e: Long-Term Orientation of cultural values has an effect on Brand Trust of
CBGBE.
H1f: Materialism of cultural values has an effect on Brand Trust of CBGBE.
H2a: Collectivism of cultural values has an effect on Perceived Quality of CBGBE.
H2b: Masculinity of cultural values has an effect on Perceived Quality of CBGBE.
H2c: Uncertainty Avoidance of cultural values has an effect on Perceived Quality of
CBGBE.
H2d: Power Distance of cultural values has an effect on Perceived Quality of
CBGBE.
H2e: Long-Term Orientation of cultural values has an effect on Perceived Quality
of CBGBE.
H2f: Materialism of cultural values has an effect on Perceived Quality of CBGBE.
Table 6.15 summarizes the multiple regression analysis between cultural values and
the two CBGBE variables: Brand Trust and Perceived Quality.

-252-
Table 6.15: Effect of Cultural Values on Brand Trust and Perceived Quality
* p<0.05 ** p<0.01 *** p<0.001
Variable Brand Trust Perceived Quality
Beta t-value p-value Tolerance VIF Hypothesis Supported Beta t-value p-value Tolerance VIF Hypothesis
Supported
Collectivism 0.09 2.26 0.024* 0.90 1.10 H1a = YES 0.13 3.31 0.001** 0.90 1.10 H2a = YES
Masculinity 0.10 2.20 0.028* 0.69 1.44 H1b = YES 0.04 1.04 0.294 0.69 1.44 H2b = NO
Uncertainty Avoidance 0.19 4.49 0.000*** 0.76 1.31 H1c = YES 0.11 2.58 0.010* 0.76 1.30 H2c =YES
Power Distance 0.02 0.53 0.593 0.81 1.23 H1d = NO 0.09 2.17 0.030* 0.80 1.23 H2d =YES
Long-Term Orientation 0.06 1.68 0.093 0.93 1.07 H1e = NO 0.20 5.18 0.000*** 0.93 1.06 H2e =YES
Materialism 0.16 3.88 0.000*** 0.85 1.17 H1f = YES 0.02 0.48 0.631 0.84 1.17 H2f = NO
R2 0.16 0.13
F 18.439 14.762
p 0.000 0.000

-253-
As shown in Table 6.15, the effect of cultural values was first tested on the Brand
Trust of CBGBE and the multiple regression model is statistically significant
(F=18.439, p=0.000). The R2 of the regression model shows that the model explains
16% of the total variance which means that the six cultural values successfully
explain Brand Trust. The dimensions of Collectivism (β=0.09) and Masculinity
(β=0.10) have a significant effect on Brand Trust (p<0.05). Uncertainty Avoidance
(β=0.19) and Materialism (β=0.16) dimensions have a significant effect on Brand
Trust (p<0.001). However, the dimensions of Power Distance and Long-Term
Orientation have no significant effect on Brand Trust. Therefore, the research
supports the hypotheses of H1a, H1b, H1c and H1f but does not support H1d and H1e.
The effects of cultural values on Perceived Quality dimension of CBGBE are
assessed with results showing a statistical significance (p=0.000, F=14.762) and 13%
of the total variance. The dimensions of Collectivism (β=0.13) and Long-Term
Orientation (β=0.20) are statistically significant at p<0.01 and p<0.001, respectively
and the dimensions of Uncertainty Avoidance (β=0.11) and Power Distance (β=0.09)
are also significant at p<0.05. However, the dimensions of Masculinity and
Materialism are found be statistically insignificant. Hence, the present research
accepts the hypotheses of H2a, H2c, H2d and H2e, but rejects H2b and H2f.
The second set of research hypotheses illustrates the relationship that cultural values
have with the Self-Congruence dimension of CBGBE, and with the Brand Awareness
dimension of CBGBE.
H3a: Collectivism of cultural values has an effect on Self-Congruence of CBGBE.
H3b: Masculinity of cultural values has an effect on Self-Congruence of CBGBE.
H3c: Uncertainty Avoidance of cultural values has an effect on Self-Congruence of
CBGBE.
H3d: Power Distance of cultural values has an effect on Self-Congruence of CBGBE.
H3e: Long-Term Orientation of cultural values has an effect on Self-Congruence of
CBGBE.
H3f: Materialism of cultural values has an effect on Self-Congruence of CBGBE.
H4a: Collectivism of cultural values has an effect on Brand Awareness of CBGBE.

-254-
H4b: Masculinity of cultural values has an effect on Brand Awareness of CBGBE.
H4c: Uncertainty Avoidance of cultural values has an effect on Brand Awareness of
CBGBE.
H4d: Power Distance of cultural values has an effect on Brand Awareness of CBGBE.
H4e: Long-Term Orientation of cultural values has an effect on Brand Awareness of
CBGBE.
H4f: Materialism of cultural values has an effect on Brand Awareness of CBGBE.
Table 6.16 displays the results of the multiple regression analysis between cultural
values and both the Self-Congruence dimension of CBGBE and the Brand Awareness
dimension of CBGBE.

-255-
Table 6.16: Effect of Cultural Values on Self-Congruence and Brand Awareness
* p<0.05 ** p<0.01 *** p<0.001
Variable Self-Congruence Brand Awareness
Beta t-value p-value Tolerance VIF Hypothesis Supported Beta t-value p-value Tolerance VIF Hypothesis
Supported
Collectivism 0.07 1.97 0.049* 0.90 1.10 H3a= YES 0.21 5.19 0.000*** 0.90 1.10 H4a= YES
Masculinity 0.16 3.66 0.000*** 0.69 1.43 H3b= YES - 0.06 -1.43 0.151 0.69 1.43 H4b= NO
Uncertainty Avoidance 0.09 2.09 0.036* 0.77 1.29 H3c= YES 0.15 3.41 0.001** 0.75 1.31 H4c= YES
Power Distance 0.09 2.26 0.024* 0.81 1.22 H3d= YES - 0.07 -1.59 0.111 0.80 1.24 H4d= NO
Long-Term Orientation 0.10 2.78 0.006** 0.93 1.06 H3e= YES 0.06 1.59 0.112 0.93 1.06 H4e= NO
Materialism 0.13 3.18 0.002** 0.84 1.18 H3f= YES 0.06 1.41 0.157 0.84 1.18 H4f= NO
R2 0.15 0.09
F 18.196 10.163
p 0.000 0.000

-256-
As seen in Table 6.16, the consequences of the regression analysis for the relationship
between the cultural values and Self-Congruence dimension of CBGBE are presented.
This is statistically significant (p=0.000, F=18.196) and the R2 value shows that the
cultural values explain 15% of the total variance in the dimension. Clearly, all of the
six Cultural Value dimensions make a significant contribution to explaining the effect
of the Self-Congruence dimension of CBGBE. The Self-Congruence dimension is
influenced by the dimensions of Collectivism (β=0.07), Uncertainty Avoidance
(β=0.09) and Power Distance (β=0.09) at p<0.05 level, by Long-Term Orientation
(β=0.10) and Materialism (β=0.13) at p<0.01 level and by Masculinity (β=0.16) at
p<0.001 level. Thus, all hypotheses of H3a, H3b, H3c, H3d, H3e and H3f are
confirmed by this research.
The fourth set of results from the regression analysis show a statistical significant
relationship at the 0.000 level (F=10.163). The overall estimate of the model
accounts for 9% of the variance in Brand Awareness. Collectivism and Uncertainty
Avoidance dimensions show a beta coefficient of 0.21 and 0.15 at p<0.001 and
p<0.01 level, respectively. The other dimensions of Masculinity, Power Distance,
Long-Term Orientation and Materialism are found to be insignificant. Hence, results
from the analysis accept only the hypotheses of H4a and H4c, but reject H4b, H4d,
H4e and H4f.
The third set of research hypotheses displays the relationship that cultural values have
with the Brand Association dimension of CBGBE, and with the Brand Identification
dimension of CBGBE.
H5a: Collectivism of cultural values has an effect on Brand Association of CBGBE.
H5b: Masculinity of cultural values has an effect on Brand Association of CBGBE.
H5c: Uncertainty Avoidance of cultural values has an effect on Brand Association of
CBGBE.
H5d: Power Distance of cultural values has an effect on Brand Association of
CBGBE.
H5e: Long-Term Orientation of cultural values has an effect on Brand Association of
CBGBE.
-257-
H5f: Materialism of cultural values has an effect on Brand Association of CBGBE.
H6a: Collectivism of cultural values has an effect on Brand Identification of CBGBE.
H6b: Masculinity of cultural values has an effect on Brand Identification of CBGBE.
H6c: Uncertainty Avoidance of cultural values has an effect on Brand Identification
of CBGBE.
H6d: Power Distance of cultural values has an effect on Brand Identification of
CBGBE.
H6e: Long-Term Orientation of cultural values has an effect on Brand Identification
of CBGBE.
H6f: Materialism of cultural values has an effect on Brand Identification of CBGBE.
The results of the multiple regression analysis between cultural values and both
Brand Association dimension of CBGBE and Brand Identification dimension of
CBGBE appear in Table 6.17.

-258-
Table 6.17: Effect of Cultural Values on Brand Association and Brand Identification
* p<0.05 ** p<0.01 *** p<0.001
Variable Brand Association Brand Identification
Beta t-value p-value Tolerance VIF Hypothesis Supported Beta t-value p-value Tolerance VIF Hypothesis
Supported
Collectivism 0.12 2.98 0.003** 0.90 1.10 H5a=YES 0.10 2.57 0.010* 0.90 1.10 H6a=YES
Masculinity 0.06 1.43 0.152 0.69 1.44 H5b=NO 0.15 3.44 0.001** 0.69 1.44 H6b=YES
Uncertainty Avoidance 0.07 1.67 0.094 0.76 1.30 H5c=NO 0.10 2.33 0.020* 0.76 1.30 H6c=YES
Power Distance 0.01 0.42 0.672 0.80 1.24 H5d=NO 0.15 3.59 0.000*** 0.80 1.23 H6d=YES
Long-Term Orientation 0.11 2.72 0.007** 0.93 1.06 H5e=YES 0.10 2.73 0.006** 0.93 1.06 H6e= YES
Materialism 0.12 2.80 0.005** 0.84 1.18 H5f=YES 0.05 1.24 0.212 0.84 1.18 H6f= NO
R2 0.09 0.15
F 9.771 18.304
p 0.000 0.000

-259-
As presented in Table 6.17, the results of the multiple regression analysis explains 9%
of the total variance and indicates that Cultural Value dimensions are statistically
significant (p=0.000, F=9.771) in predicting the Brand Association of CBGBE.
Collectivism, Long-Term Orientation and Materialism have a standardized coefficient
of 0.12, 0.11 and 0.12, respectively and have a statistically significant effect on the
Brand Association at the level of 0.01. However, three other dimensions of
Masculinity, Uncertainty Avoidance and Power Distance are not statistically
significant. Therefore, the results from the analysis confirm the hypotheses of H5a,
H5e and H5f, but do not confirm H5b, H5c and H5d.
The regression analysis shows the relationship between the cultural values and the
Brand Identification dimension of CBGBE to be statistically significant (p=0.000,
F=18.304) and the R2 value explains 15% of the total variance. With the exception of
only the Materialism dimension, the dimensions of Collectivism (β=0.10), and
Uncertainty Avoidance (β=0.10) show a significant level of 0.05. In addition, the
dimensions of Masculinity, (β=0.15) and Long-Term Orientation (β=0.10) at p<0.01
level make a statistically significant contribution to explaining Brand Identification.
Power Distance (β=0.15) indicates a strong significant contribution too at the
probability level of 0.001. Hence, results from the analysis accept the hypotheses of
H6a, H6b, H6c, H6d and H6e excluding H6f.
6.4.2 Effect of Consumer-Based Global Brand Equity on Brand
Reputation
The six dimensions of CBGBE are: Brand Trust, Perceived Quality, Self-Congruence,
Brand Awareness, Brand Association and Brand Identification. One of the aims of the
present research is to test the hypotheses whether CBGBE affects brand reputation.
The fourth set of formulated research hypotheses is as follows:
H7a: Brand Trust of CBGBE has a positive effect on brand reputation.
H7b: Perceived Quality of CBGBE has a positive effect on brand reputation.
H7c: Self-Congruence of CBGBE has a positive effect on brand reputation.

-260-
H7d: Brand Awareness of CBGBE has a positive effect on brand reputation.
H7e: Brand Association of CBGBE has a positive effect on brand reputation.
H7f: Brand Identification of CBGBE has a positive effect on brand reputation.
The results of the regression model between the six dimensions of CBGBE and brand
reputation appear in Table 6.18.

-261-
Table 6.18: Effect of Consumer-Based Global Brand Equity on Brand Reputation
* p<0.05 ** p<0.01 *** p<0.001
Variable Brand Reputation
Beta t-value p-value Tolerance VIF Hypothesis Supported
Brand Trust 0.41 10.53 0.000*** 0.47 2.08 H7a= YES
Perceived Quality 0.06 1.62 0.106 0.46 2.17 H7b= NO Self-Congruence 0.08 2.33 0.020* 0.60 1.66 H7c= YES
Brand Awareness 0.25 8.21 0.000*** 0.78 1.27 H7d= YES
Brand Association 0.11 3.21 0.001** 0.59 1.66 H7e= YES
Brand Identification 0.11 3.06 0.002** 0.55 1.79 H7f= YES
R2 0.59 F 132.963 p 0.000

-262-
As shown in Table 6.18, the results of the regression model are statistically significant
at the 0.000 level (F=132.963). The R2 value explains 59% of the total variance in
brand reputation dimension. Brand Trust (β=0.41) and Brand Awareness (β=0.25)
indicate statistically a strong significant level of 0.001. Brand Association (β=0.11)
and Brand Identification (β=0.11) are statistically significant at the level of 0.01. Self-
Congruence (β=0.08) is also statistically significant (p<0.05). Of all the dimensions,
Brand Trust has the greatest standardized coefficient (β=0.41) and therefore, the most
important dimension in explaining Brand Reputation. The dimension of Perceived
Quality is the only dimension for which the analysis is found to be insignificant.
Hence, the research hypotheses of H7a, H7c, H7d, H7e, and H7f are accepted.
6.4.3 Effect of Consumer-Based Global Brand Equity on Brand
Loyalty
The previous dimension analysis produced six dimensions of CBGBE which are
named as: Brand Trust, Perceived Quality, Self-Congruence, Brand Awareness, Brand
Association and Brand Identification. One of the aims of the present research is to
examine the hypotheses that CBGBE affects brand loyalty. The fifth set of hypotheses
is as follows:
H8a: Brand Trust of CBGBE has a positive effect on brand loyalty.
H8b: Perceived Quality of CBGBE has a positive effect on brand loyalty.
H8c: Self-Congruence of CBGBE has a positive effect on brand loyalty.
H8d: Brand Awareness of CBGBE has a positive effect on brand loyalty.
H8e: Brand Association of CBGBE has a positive effect on brand loyalty.
H8f: Brand Identification of CBGBE has a positive effect on brand loyalty.
Table 6.19 shows that the results of the regressions model between six dimensions of
CBGBE and brand loyalty.

-263-
Table 6.19: Effect of Consumer-Based Global Brand Equity on Brand Loyalty
* p<0.05 ** p<0.01 *** p<0.001
Variable Brand Loyalty
Beta t-value p-value Tolerance VIF Hypothesis Supported
Brand Trust 0.47 12.83 0.000*** 0.47 2.09 H8a= YES
Perceived Quality 0.03 0.97 0.329 0.46 2.16 H8b= NO
Self-Congruence 0.07 2.22 0.027* 0.60 1.66 H8c= YES
Brand Awareness 0.05 1.95 0.051 0.78 1.27 H8d= NO
Brand Association 0.05 1.65 0.098 0.60 1.66 H8e= NO
Brand Identification 0.30 8.98 0.000*** 0.55 1.79 H8f= YES
R2 0.63
F 163.933
p 0.000

-264-
As seen in Table 6.19, the regression analysis model between CBGBE and brand
loyalty is statistically significant (p=0.000, F=163.933). 63% of the variation of brand
loyalty is explained by six dimensions of CBGBE. Three dimensions make a
significant contribution to an explanation of brand loyalty with values of 0.47 for
Brand Trust (p<0.001), 0.30 for Brand Identification (p<0.001) and 0.07 for Self-
Congruence (p<0.05). Analysis indicates the dimensions of Perceived Quality, Brand
Awareness and Brand Association are statistically insignificant. The two dimensions
of Brand Trust (β=0.47) and Brand Identification (β=0.30), which comprise the
largest standardized coefficients, show the importance of explaining brand loyalty. In
terms of confirming hypotheses, H8a, H8c and H8f are supported, but H8b, H8d and
H8e are not supported.
6.5 Testing of the Research Model in the British and South Korean Samples
The research model is tested by multiple regression analysis in the British and South
Korean samples. The independent variables are composed of six cultural value
dimensions: Collectivism, Masculinity, Uncertainty Avoidance, Power Distance,
Long-Term Orientation and Materialism. The mediating variables consist of
Consumer-Based Global Brand Equity (CBGBE) dimensions: Brand Trust, Perceived
Quality, Self-Congruence, Brand Awareness, Brand Association, Brand Identification.
The dependent variables are brand reputation and brand loyalty.
Before proceeding to the analysis, multicollinearity should be considered.
Multicollinearity can be evaluated by a Tolerance Value and a Variance Inflation
Factor (VIF). Tolerance value should be above .10 and VIF should be lower than 10
in order to confirm that the regression result is not affected by multicollienarity
(Pallant, 2007). For the present research, the results of the multicollinearity analysis
propose that both the Tolerance Value and VIF (Variance Inflation Factor) meet the
standard. That is to say, there was no multicollinearity effect in any of the regression
model (see Table 6.20, 6.21, 6.22, 6.23, 6.24, 6.25, 6.26, 6.27).

-265-
6.5.1 Effects of Cultural Values on Consumer-Based Global
Brand Equity Multiple regression analysis using the enter method was performed to test the
research hypotheses. The cultural values dimensions consist of Collectivism,
Masculinity, Uncertainty Avoidance, Power Distance, Long-Term Orientation, and
Materialism. The CBGBE dimensions were composed of Brand Trust, Perceived
Quality, Self-Congruence, Brand Awareness, Brand Association, and Brand
Identification. One of the aims of the present research is to examine the effect of
cultural values on Brand Trust of CBGBE. To achieve this goal, the following
hypotheses are produced:
H1a: Collectivism of cultural values has an effect on Brand Trust of CBGBE.
H1b: Masculinity of cultural values has an effect on Brand Trust of CBGBE.
H1c: Uncertainty Avoidance of cultural values has an effect on Brand Trust of
CBGBE.
H1d: Power Distance of cultural values has an effect on Brand Trust of CBGBE.
H1e: Long-Term Orientation of cultural values has an effect on Brand Trust of
CBGBE.
H1f: Materialism of cultural values has an effect on Brand Trust of CBGBE.
Table 6.20 presents the results of the multiple regression analysis between the cultural
values dimensions and the Brand Trust dimension of CBGBE in the British and South
Korean samples.

-266-
Table 6.20: Effect of Cultural Values on Brand Trust
* p<0.05 ** p<0.01 *** p<0.001
Variable Brand Trust (British) Brand Trust (South Korean)
Beta t-value p-value Tolerance VIF Hypothesis Supported Beta t-value p-value Tolerance VIF Hypothesis
Supported Collectivism
0.05
0.86
0.386
0.92
1.08
H1a = NO
0.11
1.85
0.064
0.75
1.33
H1a = NO
Masculinity 0.02 0.40 0.684 0.75 1.32 H1b = NO 0.16 2.60 0.010*
0.72 1.38 H1b = YES
Uncertainty Avoidance 0.22 3.66 0.000***
0.86 1.15 H1c = YES 0.17 2.67 0.008**
0.70 1.42 H1c = YES
Power Distance - 0.00 - 0.03 0.969 0.79 1.25 H1d = NO 0.02 0.44 0.655 0.80 1.24 H1d = NO
Long-Term Orientation 0.06 1.10 0.270 0.94 1.06 H1e = NO 0.04 0.78 0.435 0.89 1.11 H1e = NO
Materialism 0.20 3.37 0.001**
0.89 1.11 H1f= YES 0.05 0.89 0.371 0.87 1.14 H1f = NO
R2 0.12 0.14
F 6.714 8.181
p 0.000 0.000

-267-
As seen in Table 6.20, The multiple regression model for the British sample is
statistically significant for estimating the effect of the cultural values on Brand Trust
(F=6.714, p=0.000). The R-square of the regression model explains 12% of the total
variance in Brand Trust. The dimension of Uncertainty Avoidance has the largest beta
coefficients of 0.22 at the level of 0.001. Materialism (β=0.20) indicates a statistical
significance at the level of 0.01. However, the other dimensions such as Collectivism,
Masculinity, Power Distance and the Long-Term Orientation are not statistically
significant. Hence, these findings accept H1c and H1f but reject H1a, H1b, H1d and
H1e.
The regression model for the South Korean sample is also statistically significant in
estimating Brand Trust (F=8.181, p=0.000). The R-square of the regression model
explains 14% of the total variance in Brand Trust. Uncertainty Avoidance (β=0.17,
p<0.01)) and Masculinity (β=0.16, p<0.05) are statistically significant in explaining
Brand Trust. However, Collectivism, Power Distance, Long-Term Orientation and
Materialism do not have a statistically significant influence on Brand Trust. Hence,
these findings accept H1b, and H1c, but reject H1a, H1d, H1e and H1f.
In comparing the results of the analysis between the British and South Korean
samples, the differences of the dimensions of Masculinity for the South Korean
sample and Materialism for the British sample have a statistically significant
influence on Brand Trust, thus these findings partially accept H1b and H1f.
Uncertainty Avoidance dimension for both of the samples has a statistically
significant influence on Brand Trust. Clearly, the effect of this dimension on Brand
Trust is stronger in the UK sample (β= 0.22) than the South Korean (β= 0.17) sample.
However, the dimensions of Collectivism, Power Distance and Long-Term
Orientation for both samples have no statistically significant influence on Brand Trust.
Therefore, these findings accept H1c but reject H1a, H1d and H1e.
The second set of hypotheses is proposed to test the relationship between cultural
values and perceived quality:
H2a: Collectivism of cultural values has an effect on Perceived Quality of CBGBE.
H2b: Masculinity of cultural values has an effect on Perceived Quality of CBGBE.

-268-
H2c: Uncertainty Avoidance of cultural values has an effect on Perceived Quality of
CBGBE.
H2d: Power Distance of cultural values has an effect on Perceived Quality of
CBGBE.
H2e: Long-Term Orientation of cultural values has an effect on Perceived Quality
of CBGBE.
H2f: Materialism of cultural values has an effect on Perceived Quality of CBGBE.
Table 6.21 displays the results of the multiple regression analysis between the cultural
values dimensions and the Perceived Quality dimension of CBGBE in the British and
South Korean samples.

-269-
Table 6.21: Effect of Cultural Values on Perceived Quality
* p<0.05 ** p<0.01 *** p<0.001
Variable Perceived Quality (British) Perceived Quality (South Korean)
Beta t-value p-value Tolerance VIF Hypothesis Supported Beta t-value p-value Tolerance VIF Hypothesis
Supported Collectivism
0.15
2.60
0.010*
0.92
1.08
H2a = YES
0.10
1.73
0.084
0.75
1.33
H2a = NO
Masculinity - 0.02 - 0.42 0.670 0.75 1.32 H2b =NO 0.08 1.35 0.176 0.72 1.38 H2b = NO
Uncertainty Avoidance 0.12 2.10 0.036* 0.86 1.15 H2c =YES 0.13 2.07 0.039*
0.70 1.42 H2c = YES
Power Distance 0.13 2.13 0.033*
0.79 1.25 H2d =YES 0.07 1.35 0.176 0.80 1.24 H2d = NO
Long-Term Orientation 0.11 1.91 0.057 0.94 1.06 H2e =NO 0.26 4.84 0.000***
0.89 1.11 H2e = YES
Materialism 0.05 0.94 0.343 0.89 1.11 H2f =NO - 0.07 - 1.29 0.196 0.87 1.14 H2f = NO
R2 0.10 0.15
F 5.491 9.607
p 0.000 0.000

-270-
As presented in Table 6.21, the results of the second regression analysis for the
British sample is statistically significant at p=0.000 level (F=5.491) and 10% of the
total variance is explained for Perceived Quality. This is estimated by the three
dimensions of the cultural values at p<0.05, including Collectivism (β=0.15),
Uncertainty Avoidance (β=0.12) and Power Distance (β=0.13). The other dimensions
(Masculinity, Long-Term Orientation and materialism) have no statistically
significant effect on Perceived Quality. Thus, results confirm H2a, H2c and H2d but
reject H2b, H2e and H2f.
The second regression analysis in the South Korean sample presents the relationship
between the cultural values dimensions and Perceived Quality of CBGBE. This is
statistically significant (p=0.000, F=9.607) and the R-square value indicates that the
cultural values explain 15% of the total variance of Perceived Quality. The
dimensions of Uncertainty Avoidance (β=0.13, p<0.05) and Long-Term Orientation
(β=0.26, p<0.001) have a statistically significant influence on Perceived Quality.
However, the Perceived Quality is not significantly influenced by Collectivism,
Masculinity, Power Distance and Materialism. Thus, the hypotheses of H2c and H2e
are confirmed but H2a, H2b, H2d and H2f are not confirmed in the South Korean
Sample.
To sum up, the results of the study suggest that the dimensions of Uncertainty
Avoidance have a significant influence on Perceived Quality in the two samples thus,
support H2a and H2c. Collectivism, Power Distance and Longt-Term Orientation
dimensions have a statistically significant effect on Perceived Quality, which partially
support H2a, H2d and H2e. However, the hypotheses of H2b and H2f are not
supported. More specifically, out of all these dimensions, the effect of Long-Term
Orientation for the South Korean sample has the largest beta coefficient of 0.26 at
p<0.001. The effect of Uncertainty Avoidance on Perceived quality is strong in the
British and South Korean samples (β= 0.12 and 0.13, respectively).
The third set of research hypotheses between the dimensions of cultural values and
the Self-Congruence is as follows:

-271-
H3a: Collectivism of cultural values has an effect on Self-Congruence of CBGBE.
H3b: Masculinity of cultural values has an effect on Self-Congruence of CBGBE.
H3c: Uncertainty Avoidance of cultural values has an effect on Self-Congruence of
CBGBE.
H3d: Power Distance of cultural values has an effect on Self-Congruence of CBGBE.
H3e: Long-Term Orientation of cultural values has an effect on Self-Congruence of
CBGBE.
H3f: Materialism of cultural values has an effect on Self-Congruence of CBGBE.
Table 6.22 displays the results of the multiple regression analysis between the
cultural values dimensions and the Self-Congruence dimension of CBGBE in the
British and South Korean samples.

-272-
Table 6.22: Effect of Cultural Values on Self-Congruence
* p<0.05 ** p<0.01 *** p<0.001
Variable Self-Congruence (British) Self-Congruence (South Korean)
Beta t-value p-value Tolerance VIF Hypothesis Supported Beta t-value p-value Tolerance VIF Hypothesis
Supported Collectivism
0.16
2.86
0.004**
0.92
1.08
H3a = YES
0.05
0.89
0.369
0.75
1.33
H3a = NO
Masculinity 0.13 2.08 0.038*
0.75 1.32 H3b= YES 0.06 0.97 0.329 0.72 1.38 H3b = NO
Uncertainty Avoidance 0.01 0.30 0.759 0.86 1.15 H3c = NO 0.21 3.36 0.001** 0.70 1.42 H3c = YES
Power Distance - - 0.04 - 0.63 0.527 0.79 1.25 H3d = NO 0.19 3.19 0.002**
0.80 1.24 H3d = YES
Long-Term Orientation 0.12 2.08 0.038*
0.94 1.06 H3e = YES 0.06 1.19 0.232 0.89 1.11 H3e = NO
Materialism 0.07 1.23 0.220 0.89 1.11 H3f = NO 0.02 0.50 0.617 0.87 1.14 H3f = NO
R2 0.08 0.13
F 4.384 7.585
p 0.000 0.000

-273-
As shown in Table 6.22, the regression model estimates the relationship between the
cultural values dimensions and Self-Congruence of CBGBE in the British sample.
This is statistically significant (p=0.000, F=4.384) and the R-square value explains
8% of the total variance of Self-Congruence. The dimensions of Collectivism,
Masculinity and Long-Term Orientation have the beta coefficients of 0.16, 0.13 and
0.12, respectively. The dimensions of Collectivism (p<0.01) and Masculinity and
Long-Term Orientation (p<0.05) are significant in estimating the Self-Congruence
dimension of CBGBE. However, the dimensions of Uncertainty Avoidance, Power
Distance and Materialism dimensions provide no significant contribution to explain
Self-Congruence of CBGBE. Hence, results accept H3a, H3b and H3e, but reject H3c,
H3d and H3f.
The results of regression analysis of the South Korean sample show the relationship
between the cultural values dimensions and the Self-Congruence dimension of
CBGBE. This is statistically significant (p=0.000, F=7.585) and the R-square value
explains 13% of the total variance of Self-Congruence. The dimensions of
Uncertainty Avoidance (β=0.21) and Power Distance (β=0.19) are significant in
explaining Self-Congruence dimension (p<0.01). Collectivism, Masculinity, Long-
Term Orientation and Materialism are found to be statistically insignificant. Hence,
results accept H3c and H3d, but reject H3a, H3b, H3e and H3f.
In summary, excluding the Materialism dimension, the dimensions of Collectivism,
Masculinity and Long-Term Orientation for the British sample, and Uncertainty
Avoidance and Power Distance for the South Korean sample have a significant
influence on Self-Congruence. The research hypotheses of H3a, H3b, H3c, H3d and
H3e are partially accepted, but H3f is rejected. The Uncertainty Avoidance dimension
for the South Korean sample is the most effective dimension in explaining Self-
Congruence dimension in both of the samples (β= 0.21, p<0.01).
The fourth set of research hypotheses between cultural values and the Brand
Awareness dimension of CBGBE is described below:
H4a: Collectivism of cultural values has an effect on Brand Awareness of CBGBE.
H4b: Masculinity of cultural values has an effect on Brand Awareness of CBGBE.

-274-
H4c: Uncertainty Avoidance of cultural values has an effect on Brand Awareness of
CBGBE.
H4d: Power Distance of cultural values has an effect on Brand Awareness of CBGBE.
H4e: Long-Term Orientation of cultural values has an effect on Brand Awareness of
CBGBE.
H4f: Materialism of cultural values has an effect on Brand Awareness of CBGBE.
.
The results of the multiple regression analysis between cultural values and Brand
Awareness of CBGBE appear in Table 6.23

-275-
Table 6.23: Effect of Cultural Values on Brand Awareness
* p<0.05 ** p<0.01 *** p<0.001
Variable Brand Awareness (British) Brand Awareness ( South Korean)
Beta t-value p-value Tolerance VIF Hypothesis Supported Beta t-value p-value Tolerance VIF Hypothesis
Supported Collectivism
0.15
2.61
0.009**
0.92
1.08
H4a = YES
0.09
1.64
0.100
0.75
1.33
H4a = NO
Masculinity - 0.01 - - 0.23 0.812 0.75 1.32 H4b = NO 0.13 2.14 0.032* 0.72 1.38 H4b = YES
Uncertainty Avoidance 0.25 4.20 0.000*** 0.86 1.15 H4c = YES 0.19 3.17 0.002**
0.70 1.42 H4c = YES
Power Distance - 0.10 - 1.65 0.100
0.79 1.25 H4d = NO 0.00 0.06 0.951 0.80 1.24 H4d = NO
Long-Term Orientation 0.04 0.82 0.408 0.94 1.06 H4e = NO 0.05 0.93 0.352 0.89 1.11 H4e = NO
Materialism 0.12 2.11 0.036* 0.89 1.11 H4f = YES 0.14 2.63 0.009**
0.87 1.14 H4f = YES
R2 0.12 0.17
F 6.754 10.479
p 0.000 0.000

-276-
As seen in Table 6.23, the results of multiple regression analysis of the British sample
show the effects of the cultural values dimensions on Brand Awareness of CBGBE.
This indicates a significance statistically (p=0.000, F=6.754) and explains 12% of the
total variance of Brand Awareness. The Brand Awareness dimension is successfully
estimated by Collectivism (β=0.15, p<0.01), Uncertainty Avoidance (β=0.25,
p<0.001) and Materialism (β=0.12, p<0.05). However, Masculinity, Power Distance
and Long-Term Orientation are found to be statistically insignificant. Thus, these
findings support H4a, H4c and H4f but do not support H4b, H4d and H4e.
The overall estimate of the South Korean sample indicates that the regression model
is statistically significant (p=0.000, F=10.479). The model explains 17% of the total
variance of Brand Awareness which can be explained by cultural values dimensions.
The dimensions of Uncertainty Avoidance (β=0.19) and Materialism (β=0.14) are
statistically significant in estimating the Brand Awareness (p<0.01). Masculinity
dimension (β=0.13) are also statistically significant in explaining Brand Awareness
(p<0.05). In contrast, the three other dimensions of Collectivism, Power Distance and
Long-Term Orientation are also insignificant in estimating the Brand Awareness
dimension. Thus, the research results support H4b, H4c and H4f, but do not support
H4a, H4d and H4e.
Therefore, the dimension of Uncertainty Avoidance for both British (p<0.001) and
South Korean (p<0.01) samples has a significant effect on Brand Awareness.
Uncertainty Avoidance for the British (β= 0.25) and South Korean (β= 0.19) samples
are more important in explaining Brand Awareness than other dimensions. The
dimension of Materialism for the British (β= 0.12, p<0.05) and South Korean (β=
0.14, p<0.01) samples has a significant influence on Brand Awareness. Other
dimensions of Collectivism in the British sample and Masculinity in the South Korean
sample have a statistically significant impact on Brand Awareness. Thus, the research
hypotheses are supported by H4c and H4f, and partly supported by H4a and H4b, but
not supported by H4d and H4e.
The fifth set of research hypotheses between cultural values and Brand Association of
CBGBE dimensions is described below:

-277-
H5a: Collectivism of cultural values has an effect on Brand Association of CBGBE.
H5b: Masculinity of cultural values has an effect on Brand Association of CBGBE.
H5c: Uncertainty Avoidance of cultural values has an effect on Brand Association of
CBGBE.
H5d: Power Distance of cultural values has an effect on Brand Association of
CBGBE.
H5e: Long-Term Orientation of cultural values has an effect on Brand Association of
CBGBE.
H5f: Materialism of cultural values has an effect on Brand Association of CBGBE.
Table 6.24 presents the results of the multiple regression analysis for the relationship
between the cultural values and Brand Association of CBGBE.

-278-
Table 6.24: Effect of Cultural Values on Brand Association
* p<0.05 ** p<0.01 *** p<0.001
Variable Brand Association (British) Brand Association ( South Korean)
Beta t-value p-value Tolerance VIF Hypothesis Supported Beta t-value p-value Tolerance VIF Hypothesis
Supported Collectivism
0.18
3.24
0.001**
0.92
1.08
H5a = YES
0.04
0.76
0.445
0.75
1.33
H5a = NO
Masculinity - 0.01 - 0.28 0.774 0.75 1.32 H5b = NO 0.22 3.52 0.000***
0.72 1.38 H5b = YES
Uncertainty Avoidance 0.19 3.23 0.001**
0.86 1.15 H5c = YES 0.00 0.11 0.906 0.70 1.42 H5c = NO
Power Distance - 0.05 - 0.81 0.416 0.79 1.25 H5d= NO 0.02 0.45 0.647 0.80 1.24 H5d = NO Long-Term Orientation 0.04 0.87 0.384 0.94 1.06 H5e = NO 0.18 3.26 0.001**
0.89 1.11 H5e= YES
Materialism 0.17 3.02 0.003**
0.89 1.11 H5f = YES - 0.02 - 0.41 0.681 0.87 1.14 H5f = NO
R2 0.12 0.11
F 6.950 6.569
p 0.000 0.000
-279-
As presented in Table 6.24, the cultural values for the British sample explains 12% of
the total variance in Brand Association, (p=0.000, F=6.950). The dimensions of
Collectivism (β=0.18), Uncertainty Avoidance (β=0.19) and Materialism (β=0.17)
show a statistically significant influence on the Brand Association dimension at
p<0.01 level. In contrast, three other dimensions of Masculinity, Power Distance and
Long-Term Orientation have no significant effect on Brand Association of CBGBE.
Thus, this research results accept H5a, H5c, and H5f but reject H5b, H5d and H5e.
The results of the fifth multiple regression analysis of the South Korean sample
display the effects of cultural values on Brand Association of CBGBE. This is
statistically significant (p=0.000, F=6.569) and accounts for 11% of the total variance
of Brand Association. The dimensions of Masculinity and Long-Term Orientation
show the beta coefficients of 0.22 and 0.18, respectively. Therefore, these dimensions
make a statistically significant contribution in explaining the Brand Association at
p<0.001 and p<0.01 levels. However, Collectivism, Uncertainty Avoidance, Power
Distance and Materialism dimensions are insignificant in estimating the Brand
Association dimension. Thus, this results of the study support H5b and H5e, but reject
H5a, H5c, H5d and H5f.
To summarise, the dimensions of Collectivism, Uncertainty Avoidance and
Materialism have a significant influence on Brand Association in the British sample
(p<0.01). In the South Korean sample, the dimensions of Masculinity, Long-Term
Orientation also has a statistically significant impact on the Brand Association
dimension at p<0.001 and p<0.01, respectively. The results of the research partially
confirm H5a, H5b, H5c, H5e and H5f but reject H5d.
The sixth set of research hypotheses between Cultural Value dimensions and Brand
Identification of CBGBE dimensions is described below:
Research Hypotheses:
H6a: Collectivism of cultural values has an effect on Brand Identification of CBGBE.
H6b: Masculinity of cultural values has an effect on Brand Identification of CBGBE.

-280-
H6c: Uncertainty Avoidance of cultural values has an effect on Brand Identification
of CBGBE.
H6d: Power Distance of cultural values has an effect on Brand Identification of
CBGBE.
H6e: Long-Term Orientation of cultural values has an effect on Brand Identification
of CBGBE.
H6f: Materialism of cultural values has an effect on Brand Identification of CBGBE.
Table 6.25 presents the results of the multiple regression analysis for the relationship
between the cultural values dimensions and Brand Identification of CBGBE in the
British and South Korean samples.

-281-
Table 6.25: Effect of Cultural Values on Brand Identification
* p<0.05 ** p<0.01 *** p<0.001
Variable
Brand Identification (British) Brand Identification ( South Korean)
Beta t-value p-value Tolerance VIF Hypothesis Supported Beta t-value p-value Tolerance VIF Hypothesis
Supported
Collectivism 0.10 1.88 0.060 0.92 1.08 H6a = NO 0.09 1.49 0.137 0.75 1.33 H6a = NO
Masculinity 0.12 2.03 0.043* 0.75 1.32 H6b = YES 0.09 1.49 0.136 0.72 1.38 H6b = NO
Uncertainty Avoidance 0.15 2.62 0.009** 0.86 1.15 H6c= YES 0.07 1.15 0.250 0.70 1.42 H6c = NO
Power Distance 0.08 1.41 0.158 0.79 1.25 H6d = NO 0.25 4.39 0.000*** 0.80 1.24 H6d = YES
Long-Term Orientation 0.05 0.91 0.361 0.94 1.06 H6e = NO 0.12 2.29 0.022* 0.89 1.11 H6e = YES
Materialism 0.09 1.64 0.102 0.89 1.11 H6f = NO - 0.08 -1.41 0.158 0.87 1.14 H6f = NO
R2 0.13 0.14
F 7.221 8.650
p 0.000 0.000

-282-
As presented in Table 6.25, the results of the multiple regression analysis between the
Cultural Value dimensions and Brand Identification is statistically significant in the
British Sample (p=0.000, F=7.221) and the R-square value indicates that the cultural
values explain 13% of the total variance of Brand Identification. Masculinity (β=0.12,
p<0.05) and Uncertainty Avoidance (β=0.15, p<0.01) make a significant contribution
in estimating the Brand Identification dimension. However Collectivism, Power
Distance, Long-Term Orientation and Materialism are not statistically significant
predictors. Hence, the hypotheses of H6b and H6c are confirmed but H6a, H6d, H6e
and H6f are rejected.
The results of regression analysis of the South Korean sample are statistically
significant at the 0.000 probability level (F=8.650) and account for 14% of the total
variance in Brand Identification. The dimensions of Power Distance (β=0.25,
p<0.001) and Long-Term Orientation (β=0.12, p<0.05) have a significant effect on the
Brand Identification dimension. The other dimensions of Collectivism, Masculinity,
Uncertainty Avoidance, and Materialism make an insignificant contribution in the
Brand Identification dimension. Hence, these findings confirm H6d and H6e, but
reject H6a, H6b, H6c and H6f.
To sum up, the dimensions of Masculinity and Uncertainty Avoidance for the British
sample and Power Distance and Long-Term Orientation for the South Korean sample
have a statistically significant influence on the Brand Identification dimension.
However, the dimensions of Collectivism and Materialism have no statistical impact
on the Brand Identification. Hence, these findings partly confirm H6b, H6c, H6d, and
H6e, but rejects H6a and H5f. The Power Distance dimension (β= 0.25) for the South
Korean sample has the most importance of explaining the Brand Identification
dimension in both of the samples.
-283-
6.5.2 Effect of Consumer-Based Global Brand Equity on Brand
Reputation
One of the aims of this research is to examine the hypothesis that CBGBE affects
brand reputation. The research hypotheses are described:
H7a: Brand Trust of CBGBE has a positive effect on brand reputation.
H7b: Perceived Quality of CBGBE has a positive effect on brand reputation
H7c: Self-Congruence of CBGBE has a positive effect on brand reputation.
H7d: Brand Awareness of CBGBE has a positive effect on brand reputation.
H7e: Brand Association of CBGBE has a positive effect on brand reputation.
H7f: Brand Identification of CBGBE has a positive effect on brand reputation.
The results of the regression model between the six dimensions of CBGBE and brand
reputation for the British and South Korean samples appear in Table 6.26.

-284-
Table 6.26: Effect of Consumer-Based Global Brand Equity on Brand Reputation
* p<0.05 ** p<0.01 *** p<0.001
Variable Brand Reputation (British) Brand Reputation ( South Korean)
Beta t-value p-value Tolerance VIF Hypothesis Supported Beta t-value p-value Tolerance VIF Hypothesis
Supported
Brand Trust 0.37 6.24 0.000*** 0.46 2.16 H7a= YES 0.43 8.78 0.000*** 0.46 2.17 H7a= YES
Perceived Quality 0.09 1.40 0.163 0.41 2.43 H7b= NO 0.07 1.61 0.107 0.48 2.07 H7b= NO
Self-Congruence 0.00 - 0.01 0.990 0.63 1.56 H7c= NO 0.09 2.14 0.033* 0.62 1.59 H7c= YES
Brand Awareness 0.24 5.33 0.000*** 0.81 1.23 H7d= YES 0.27 6.31 0.000*** 0.60 1.64 H7d= YES
Brand Association 0.16 3.04 0.003** 0.61 1.63 H7e= YES 0.09 2.15 0.032* 0.54 1.83 H7e= YES
Brand Identification 0.11 2.06 0.040* 0.58 1.70 H7f= YES 0.05 1.17 0.243 0.56 1.78 H7f= NO
R2 0.53 0.66
F 53.424 96.596
P 0.000 0.000

-285-
Table 6.26 shows the regression model for the relationship between CBGBE and
brand reputation in the British sample. This is statistically significant at the 0.000
probability level (F=53.424). 53% of the total variation of brand reputation is
explained by the six CBGBE dimensions. The dimensions of Brand Trust (p<0.001),
Brand Awareness (p<0.001), Brand Association (p<0.01), and Brand Identification
(p<0.05) make a statistically significant contribution to explaining Brand Reputation.
The standardized coefficients are 0.37 for Brand Trust, 0.24 for Brand Awareness,
0.16 for Brand Association and 0.11 for Brand Identification. Clearly, among these
dimensions, Brand Trust has the largest beta coefficient of 0.37 and, therefore, shows
the most important contribution for explaining Brand Reputation. However, the
dimensions of Perceived Quality and Self-Congruence are insignificant. Hence, the
research hypotheses of H7a, H7d, H7e and H7f are supported, but H7b and H7c are
rejected.
The regression analysis model for the relationship between CBGBE and brand
reputation reveals a statistically significant relationship for the South Korean sample
(p=0.000, F=96.596). The R-square value of 66% of the variance in the brand
reputation dimension accounts for the results. With the exceptions of the Perceived
Quality and Brand Identification dimensions, the Brand Trust (β=0.43) and Brand
Awareness (β=0.27) dimensions are significant in explaining brand reputation
(p<0.001). The dimensions of Self-Congruence (β=0.09) and Brand Association
(β=0.09) also are significant in estimating brand reputation (p<0.05). Importantly,
among these dimensions, Brand Trust has the largest standardized coefficient (β) of
0.43, which means that it is the most effective dimension in explaining Brand
Reputation. Hence, the research hypotheses of H7a, H7c, H7d and H7e are supported,
but H7b and H7f are not supported.
In summary, in both samples the dimensions of Brand Trust, Brand Awareness and
Brand Association have a statistically significant effect on Brand Reputation. Thus the
research results support H7a, H7d and H7e. Brand Trust for both of the samples is the
most important dimension in explaining the brand reputation dimension (β= 0.37 and
0.43), which shows a strong significance at p<0.001. The dimensions of Brand
Identification for the UK sample and Self-Congruence for the South Korea sample are

-286-
significant, thus these dimensions are partly supported. However, Perceived Quality
for both samples is not a significant dimension for explanation and so this is rejected.
6.5.3 Effect of Consumer-Based Global Brand Equity on Brand
Loyalty
One of the aims of this research is to examine the final hypothesis that CBGBE
affects brand loyalty. The hypotheses are described:
H8a: Brand Trust of CBGBE has a positive effect on brand loyalty.
H8b: Perceived Quality of CBGBE has a positive effect on brand loyalty.
H8c: Self-Congruence of CBGBE has a positive effect on brand loyalty.
H8d: Brand Awareness of CBGBE has a positive effect on brand loyalty.
H8e: Brand Association of CBGBE has a positive effect on brand loyalty
H8f: Brand Identification of CBGBE has a positive effect on brand loyalty.
The results of the regression analysis between the six dimensions of CBGBE and
brand loyalty appear in Table 6.27.

-287-
Table 6.27 Effect of Consumer-Based Global Brand Equity on Brand Loyalty
* p<0.05 ** p<0.01 *** p<0.001
Variable Brand Loyalty (British) Brand Loyalty ( South Korean)
Beta t-value p-value Tolerance VIF Hypothesis Supported Beta t-value p-value Tolerance VIF Hypothesis
Supported Brand Trust
0.42
8.19
0.000***
0.46
2.16
H8a= YES
0.49
9.07
0.000***
0.46
2.17
H8a= YES
Perceived Quality 0.14 2.61 0.010*
0.41 2.43 H8b= YES - 0.03 - 0.65 0.515 0.48 2.07 H8b= NO
Self-Congruence - 0.02 - 0.44 0.656 0.63 1.56 H8c= NO 0.04 0.95 0.342 0.62 1.59 H8c= NO
Brand Awareness 0.03 0.86 0.388 0.81 1.23 H8d= NO 0.14 2.96 0.003** 0.60 1.64 H8d= YES
Brand Association 0.07 1.62 0.105 0.61 1.63 H8e= NO 0.08 1.61 0.107 0.54 1.83 H8e= NO
Brand Identification 0.33 7.26 0.000*** 0.58 1.70 H8f= YES 0.25 5.12 0.000*** 0.56 1.78 H8f= YES
R2 0.66 0.59
F 89.054 71.493
P 0.000 0.000

-288-
As shown in Table 6.27, the regression analysis model successfully estimates the
relationship between CBGBE and brand loyalty in the British sample. (p=0.000,
F=89.054). The R-square shows that 66% of the variance is explained by the
regression model. Brand Trust (β=0.42) and Brand Identification (β=0.33) have a
significant influence on brand loyalty (p<0.001). Perceived Quality (β=0.14) also has
a statistically significant influence on brand loyalty (p<0.05) in the British Sample. Of
all these dimensions, Brand Trust and Brand Identification have the largest
standardized coefficient (β=0.42, β=0.33). These are the most important dimensions
in explaining brand loyalty. However, the other dimensions do not a have significant
effect on brand loyalty. Hence, the research hypotheses of H7a, H7b and H7f are
accepted but H7c, H7d and H7e are rejected.
The regression model for the South Korean sample estimates the relationship between
CBGBE and brand loyalty (F=71.493, p=0.000). 59% of the total variation in brand
loyalty is explained by the six Global Brand Equity dimensions. The two dimensions
of Brand Trust (β=0.49), and Brand Identification (β=0.25) have a statistically
significant impact on brand loyalty at the 0.001 level. Brand Awareness (β=0.14) also
has a statistically significant influence on brand loyalty (p<0.01) in the South Korean
Sample. Clearly, Brand Trust indicates the largest standardized coefficient (β=0.49)
which is statistically significant for explaining brand loyalty. However, the
dimensions of Perceived Quality, Self-Congruence and Brand Association do not
have a significant impact on brand loyalty. Hence, the research hypotheses of H7a,
H7d and H7f are accepted, but H7b, H7c and H7e are rejected.
Overall, the dimensions of Brand Trust and Brand Identification are statistically
significant at the p<0.001 level in both of the samples, thus these findings fully
support H8a and H8f. Importantly, Brand Trust in both of the samples is the most
important dimension (β= 0.42 in the British and β= 0.49 in South Korean sample) in
explaining brand loyalty. The dimensions of Perceived Quality in the UK (p<0.05)
and Brand awareness in Korea (p<0.01) are also significant in explaining brand
loyalty, thus these findings partially accept H8b and H8d. However, the dimensions
of Self-Congruence and Brand Association are insignificant, thus are rejected.

-289-
6.6 Evaluation of Consumer-Based Global Brand Equity
across Demographics of the Whole Sample
Independent samples t-test is employed to compare the mean scores of two different
groups of samples or conditions. One-way ANOVA is used to compare the mean
score of three or more groups (Pallant, 2007). In the present research, independent
samples t-test identifies differences between gender and marriage status of the
respondents in terms of their evaluation of Consumer-Based Global Brand Equity
(CBGBE). One-way ANOVA identifies if CBGBE differs across different age and
personal income groups. In order to identify the perceptional differences of groups in
detail, Duncan‘s multiple range test is performed as a post-hoc test.
6.6.1 Evaluation of Consumer-Based Global Brand Equity by
Demographic Characteristics of the Respondents
In the present research, a t-test identifies differences between two groups in light of
gender and marriage, and an ANOVA with post-hoc test identifies differences among
six age groups and seven income groups.
6.6.1.1 Evaluation of Consumer-Based Global Brand Equity by Gender
A t-test was performed to compare if CBGBE differs between males and females.
Table 6.28 displays the results of the t-test.

-290-
Table 6.28: Analysis of CBGBE by Gender: t-Test
Variable Gender N Mean S.D. t-value p-value
Brand Trust Male 275 4.65 1.16
- 0.20 0.835 Female 325 4.67 1.18
Perceived
Quality
Male 283 4.25 1.15 - 0.35 0.720
Female 339 4.29 1.22
Self-
Congruence
Male 283 3.19 1.39 - 1.66 0.096
Female 339 3.37 1.30
Brand
Awareness
Male 276 5.42 1.11 2.51 0.011*
Female 339 5.17 1.27
Brand
Association
Male 282 4.49 1.31 - 0.43 0.667
Female 343 4.53 1.32
Brand
Identification
Male 286 3.28 1.34 - 2.22 0.026*
Female 341 3.52 1.31
* p<0.05
Table 6.28 illustrates the t-test results according to gender. The mean scores of males
are different at a statistically significantly level from females for the dimensions of
Brand Awareness and Brand Identification at p<0.05 level. With regard to Brand
Awareness, this result of the test indicates that males (5.42) are more aware of the
global brands than females (5.17).
6.6.1.2 Evaluation of Consumer-Based Global Brand Equity by Marriage
Another t-test was conducted in order to identify if evaluation of CBGBE is different
between the married and unmarried groups. Table 6.29 shows the result of the t-test.

-291-
Table 6.29: Analysis of CBGBE by Marital Status: t-Test
Variable
Marital
Status
N
Mean
S.D.
t-value
p-value
Brand Trust
Married 286 4.59 1.24 -1.42 0.155 Single 312 4.73 1.09
Perceived Quality
Married 298 4.40 1.15 2.40 0.016* Single 321 4.17 1.19
Self- Congruence
Married 298 3.30 1.33 0.23 0.811 Single 321 3.28 1.36
Brand Awareness
Married 293 5.25 1.22 - 0.49 0.619 Single 319 5.30 1.19
Brand Association
Married 301 4.51 1.30 - 0.13 0.891 Single 321 4.53 1.32
Brand Identification
Married 302 3.43 1.39 0.36 0.713 Single 322 3.39 1.27
* p<0.05
As shown in Table 6.29, only the Perceived Quality shows statistically significant
differences between married and single groups at p<0.05 level. The married group‘s
perception of service quality (4.40) is much higher than the single group (4.17).
6.6.1.3 Evaluation of Consumer-Based Global Brand Equity by Age Group
An ANOVA was performed to assess if CBGBE scores differs across the age groups.
Table 6.30 illustrates the results of the ANOVA with post-hoc test.

-292-
Table 6.30: Analysis of CBGBE by Age: ANOVA with the Post-hoc Test
Variable
Age
N
Mean
S.D.
F
p-value
Post-hoc test ****
Brand Trust
(a)16-25 (b) 26-35 (c) 36-45 (d) 46-55 (e) 56-65 (f) Over 65
182 165 150 69 22 13
4.70 4.64 4.71 4.28 4.77 5.58
1.13 1.11 1.17 1.31 1.22 1.12
3.22
0.007**
a,b,c,d,e < f
Perceived Quality
(a) 16-25 185 3.95 1.19
8.42
0.000***
(b) 26-35 174 4.35 1.10 (c) 36-45 156 4.46 1.15 a,d < b,c,e < f (d) 46-55 71 4.07 1.27 (e) 56-65 22 4.78 1.13 (f) Over 65 13 5.59 0.88
Self- Congruence
(a) 16-25 186 3.07 1.38
5.86
0.000***
(b) 26-35 173 3.54 1.20 (c) 36-45 158 3.33 1.33 d < a,b,c,e < f (d) 46-55 69 2.78 1.35 (e) 56-65 22 3.68 1.31 (f) Over 65 13 4.15 1.63
Brand Awareness
(a) 16-25 182 5.30 1.24
0.33
0.893
(b) 26-35 175 5.24 1.17 (c) 36-45 155 5.23 1.21 No difference (d) 46-55 68 5.41 1.13 (e) 56-65 21 5.38 1.33 (f) Over 65 13 5.48 1.40

-293-
Variable Age N Mean S.D. F p-value Post-hoc test ****
Brand Association
(a) 16-25 185 4.58 1.32
2.92
0.013*
(b) 26-35 173 4.52 1.35 (c) 36-45 159 4.52 1.27 a,b,c,d,e < f (d) 46-55 71 4.08 1.28 (e) 56-65 23 4.59 1.41 (f) Over 65 13 5.43 1.05
(a) 16-25 186 3.40 1.23
2.57
0.025*
d < a,b,c,e, < f Brand Identification
(b) 26-35 174 3.40 1.27 (c) 36-45 159 3.42 1.42 (d) 46-55 72 3.10 1.39 (e) 56-65 23 3.81 1.32 (f) Over 65 13 4.38 1.66
* p<0.05 ** p<0.01 *** p<0.001 ****The Duncan‘s multiple range test as the post hoc test indicates low, middle and high scores, respectively

-294-
As can be seen from Table 6.30, ANOVA with the post-hoc test (Duncan‘s multiple
range test) was used to examine the perceptional differences of CBGBE by categories
of age group at the 0.05, 0.01 and 0.001 level. The ANOVA with the Duncan‘s
multiple range test displays a statistical significance for the five dimensions of
CBGBE, except Brand Awareness.
More specifically, the Duncan multiple range test confirms significant difference
between the age group of ―Over 65‖ and the other age groups of ―16-25,‖ ―26-35,‖
―36-45,‖ ―46-55‖ with regard to Brand trust (p<0.01) and Brand Association (p<0.05).
In terms of Self-Congruence (p<0.001) and Brand Identification (p<0.05), these six
groups can be categorized into three (―46-55‖ age group; ―16-25,‖ ―26-35,‖ ―36-45,‖
and ―56-65‖ age groups; ―over 65‖ age group). Each category shows the different
perception of Self-Congruence and Brand identification: the ―Over 65‖ age group
represents the highest mean score, while ―46-55‖ age group has the lowest mean
score. The rest of them are between the two categories. With regard to perceived
quality (p<0.001), there is a significant difference among three categories: ―16-25‖
and ―46-55‖ age groups; ―26-35,‖ ―36-45‖ and ―56-65‖ age groups; ―Over 65‖ age
group. The age group of ―Over 65‖ has the highest perception of Perceived Quality
(Mean=5.59).
To sum up, the age group of ―Over 65‖ has the highest mean score in all variables.
Moreover, the age groups of 26-35,‖ ―36-45‖ and ―56-65‖ seem to have similar
perception of all variables. The ―16-25‖ age group perceives Self-Congruence and
Brand Identification higher than the other four variables.
6.6.1.4 Evaluation of Consumer-Based Global Brand Equity by Income Group
The second ANOVA test examines whether dimensions of CBGBE is significantly
different among the groups who have different personal income. Table 6.31 illustrates
the result of ANOVA according to the income.

-295-
Table 6.31: Analysis of CBGBE by Income: ANOVA with the Post-hoc Test
Variable
Income
N
Mean
S.D.
F
p-value
Post-hoc test ****
Brand Trust
(a) No Income 125 4.84 1.16
3.52
0.002**
g < a,b,c,d,e,f
(b) Less than £ 10,000 113 4.56 1.14 (c) £10,000 to 19,999 134 4.85 1.06 (d) £20,000 to 29,999 79 4.54 1.10 (e) £ 30,000 to 39,999 38 4.48 1.41 (f) £ 40,000 to 49,999 33 4.67 1.08 (g) Over £ 50,000 44 4.05 1.37
Perceived Quality
(a) No Income 129 4.17 1.21
3.00
0.007**
b,g < c,f
(b) Less than £ 10,000 118 4.01 1.21 (c) £10,000 to 19,999 143 4.50 1.13 (d) £20,000 to 29,999 84 4.37 0.96 (e) £ 30,000 to 39,999 34 4.15 1.31 (f) £ 40,000 to 49,999 35 4.51 1.04 (g) Over £ 50,000 45 3.94 1.35
Self-Congruence
(a) No Income 130 3.35 1.37
3.68
0.001**
g < a,b,d,e,f < c
(b) Less than £ 10,000 116 3.24 1.42 (c) £10,000 to 19,999 143 3.60 1.15 (d) £20,000 to 29,999 83 3.19 1.31 (e) £ 30,000 to 39,999 38 2.93 1.28 (f) £ 40,000 to 49,999 34 3.26 1.23 (g) Over £ 50,000 44 2.66 1.36
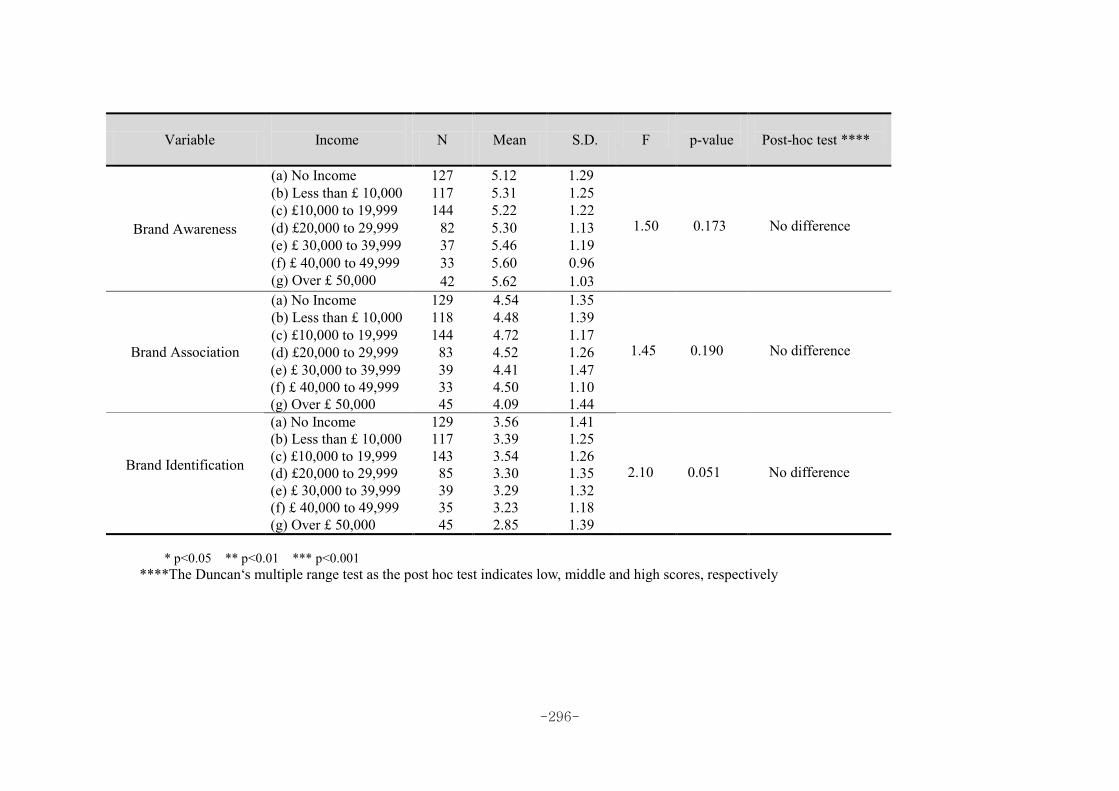
-296-
Variable
Income
N
Mean
S.D.
F
p-value
Post-hoc test ****
Brand Awareness
(a) No Income 127 5.12 1.29
1.50
0.173
No difference
(b) Less than £ 10,000 117 5.31 1.25 (c) £10,000 to 19,999 144 5.22 1.22 (d) £20,000 to 29,999 82 5.30 1.13 (e) £ 30,000 to 39,999 37 5.46 1.19 (f) £ 40,000 to 49,999 33 5.60 0.96 (g) Over £ 50,000 42 5.62 1.03
Brand Association
(a) No Income 129 4.54 1.35 1.45
0.190
No difference
(b) Less than £ 10,000 118 4.48 1.39 (c) £10,000 to 19,999 144 4.72 1.17 (d) £20,000 to 29,999 83 4.52 1.26 (e) £ 30,000 to 39,999 39 4.41 1.47
(f) £ 40,000 to 49,999 33 4.50 1.10 (g) Over £ 50,000 45 4.09 1.44
Brand Identification
(a) No Income 129 3.56 1.41 2.10
0.051
No difference
(b) Less than £ 10,000 117 3.39 1.25 (c) £10,000 to 19,999 143 3.54 1.26 (d) £20,000 to 29,999 85 3.30 1.35 (e) £ 30,000 to 39,999 39 3.29 1.32 (f) £ 40,000 to 49,999 35 3.23 1.18 (g) Over £ 50,000 45 2.85 1.39
* p<0.05 ** p<0.01 *** p<0.001
****The Duncan‘s multiple range test as the post hoc test indicates low, middle and high scores, respectively

-297-
Table 6.31 demonstrates the perceptional differences of CBGBE by categories of
annual personal income. This shows a statistical significance at the 0.01 levels for
Brand Trust, Perceived Quality, and Self-Congruence.
The Post-hoc test confirms that the mean score for the income group ―Over £50,000‖
differs significantly from the other six groups with regard to the dimensions of Brand
Trust. With regard to Perceived Quality of CBGBE, the test shows a significant
difference between the two categories: the income groups of ―Less than 10,000‖ and
―Over £50,000‖ which have a low perception of the Perceived Quality and the income
groups of ―£ 10,000 to £ 19,999‖ and ―£ 40,000 to £ 49,999‖ with a high perception
of it. In the case of Self-Congruence, the Duncan multiple range test indicates that
these seven income groups can be categorized into three: ―Over £ 50,000‖; ―No
Income,‖ ―Less than £ 10,000,‖ ―£20,000 to 29,999,‖ ―£ 30,000 to 39,999,‖ ―£ 40,000
to 49,999‖; ―£10,000 to 19,999.‖ There is significant difference of the perception
between annual personal incomes of “£10,000 to £ 19,999‖ and ―Over £50,000‖ for
the dimensions of Self-Congruence. The ―£10,000 to £ 19,999‖ is found to be higher
compared to ―Over £50,000.‖ The ―Over £50,000‖ has the least level of the Self-
Congruence with a mean score of 2.66.
To sum up, significant differences appear among income groups with regard to brand
trust, perceived quality and self-congruence. In particular, the income group of ―Over
£ 50,000‖ seems to have a low perception of Brand Trust, Perceived Quality and Self-
Congruence.
6.7 Summary
This chapter presents the findings of analyses including frequency analysis, t-test,
ANOVA with the post-hoc test, factor analysis and multiple regression analysis.
First of all, the profiles of respondents including gender, age, income, and the main
purpose of visit are illustrated.

-298-
Second, assessment of the validity and reliability of the scales is performed. The
findings confirm the six dimensions of cultural values: Collectivism, Masculinity,
Uncertainty Avoidance, Power Distance, Long-Term Orientation and Materialism.
The findings also confirm six dimensions of CBGBE: Brand Trust, Perceived Quality,
Self-Congruence, Brand Awareness, Brand Association, Brand Identification. The
analysis shows that both the cultural values scale with six dimensions and 24-items,
and the CBGBE scale with six dimensions and 29-items are valid and reliable.
Moreover, Cronbach‘s alpha test supports the reliability of the brand reputation scale
with 5 items and brand loyalty scale with 4 items.
Third, multiple regression analysis using the enter method for the whole samples,
before conducting the analysis of each of the British and South Korean samples,
confirms predictive validity.
Fourth, multiple regression analysis of the British and South Korean samples tests the
research hypotheses and the research model. The results of the regression analysis
identify the relationship between the antecedents and consequences of CBGBE for
restaurant brands in the British and South Korean samples.
Finally, the t-test identifies differences between two groups in relation to gender and
marriage; and ANOVA with the post-hoc test (Duncan‘s multiple range test) identifies
differences among six age groups and seven income groups.

-299-
CHAPTER 7

-300-
CHAPTER 7
DISCUSSION AND CONCLUSION
7.1 Introduction This chapter presents the discussion and the conclusions of the study in four parts.
The first part describes the objectives of the research. The second part discusses the
research findings and presents the conclusions drawn from them. The third part
summarises the contributions of the research: theoretical, practical and managerial.
The final section discusses the limitations of the research and offers relevant
suggestions for future research.
7.2 Objectives of the Research
In the present day, brand equity has become one of the essential tools of marketing.
However, the majority of prior research on brand equity has focussed on product
brands instead of service brands. In particular, a limited amount of empirical research
has been conducted on brand equity in the context of the restaurant industry.
Moreover, the increased levels of globalisation and consumerism warrant a
development of a Consumer-Based Global Brand Equity (CBGBE) model and the
examination of its antecedents and consequences. Accordingly, the objectives of the
research are:
1) To conduct a critical review of the literature on antecedents and
consequences of Consumer-Based Global Brand Equity.
2) To develop a theoretical model to conceptualize the relationship between
antecedents and consequences of Consumer-Based Global Brand Equity
for restaurant brands across two cultures: British and South Korean.
3) To assess the validity and reliability of the measurement scales for assessing
Consumer-Based Global Brand Equity, cultural values and brand loyalty
across two cultures.
-301-
4) To examine the mediating role of Consumer-Based Global Brand Equity
between cultural values and brand loyalty in the restaurant industry.
7.3 Discussion of the Research Findings
Several important findings have been identified from the research in the British and
South Korean samples:
Firstly, the cultural value scale consisting of six dimensions are valid and reliable.
Collectivism, Masculinity, Uncertainty Avoidance, Power Distance, Long-Term
Orientation and Materialism are the dimensions of cultural values for the present
research.
Secondly, the Consumer-Based Global Brand Equity (CBGBE) scale is found to be
valid and reliable: The six dimensions of CBGBE are Brand Trust, Perceived Quality,
Self-Congruence, Brand Awareness, Brand Association, and Brand Identification.
Thirdly, the findings of the study suggest that almost half of the cultural value
dimensions have a statistically significant effect on CBGBE.
Finally, this research shows that almost half of the CBGBE dimensions have a
positive effect on brand reputation and brand loyalty.
7.3.1 The Cultural Value Scale
Many researchers have explored the dimensions of cultural value through cross-
cultural studies. (e.g. Phatak, 1986; Stedham & Yamamura, 2004; Foscht and Maloles
III, Swoboda, Morschett, Sinha, 2008). Materialism dimension is also supported by
Tai, (2004) and Richins (2004). Hofstede‘s (1991; 2005) cultural value dimensions
has been used the most widely for cross cultural study. However, Hofstede‘s cultural
values scale was originally employed to measure work related values. Moreover some

-302-
researchers have criticised Hofstede‘s method of constructing the scale (Furrer et al,
2000). For instance, although in testing of the validity of the scale factor analysis is
used Blodgett, Bakir, and Rose (2008) argue that most of the items are lacking face
validity. Thus in order to improve reliability and validity of the scale, the present
research adopts the work of Yoo and Donthu (2002) based on Hofstede (1984, 2001)
to include Collectivism, Masculinity, Uncertainty Avoidance, and Power Distance;
and also adopts Jung et al. (2008) based on Hofstede (1984, 2001) and the dimension
Long-Term Orientation. In addition, this research employs the materialism scale,
which is adopted from Richins and Dawson (1992). Accordingly, the present research
adopts six dimensions with 24-items as the components of cultural values:
Collectivism (6items), Masculinity (4 items), Uncertainty Avoidance (5 items), Power
Distance (4 items), Long-Term Orientation (2 items) and Materialism (3 items).
Factor analysis with a Varimax Rotation is conducted on a 27-item cultural values
scale. Of the original 27 items, three items are deleted to improve validity of the scale.
This is because one item loaded across other dimensions, and factor loadings of two
items were low.
In the whole sample, the reliabilities are 0.87, 0.79, 0.88, 0.84, 0.82 and 0.78,
respectively. The cumulative percentage of total variance accounts for 68.99% for six
dimensions that have eigenvalues greater than 1. The reliability of the scales ranges
from 0.87, 0.79, 0.85, 0.83, 0.84 and 0.83, respectively in the British sample and 0.88,
0.71, 0.90, 0.84, 0.81 and 0.61, respectively in the South Korean sample. All six
dimensions in the British and South Korean samples have eigenvalues greater than 1,
and the cumulative percentage of variance accounts nearly 68.87 % and 67.68%
respectively.
The results of the factor analysis and reliability confirm six valid dimensions of
cultural values: Collectivism, Masculinity, Uncertainty Avoidance, Power Distance,
Long-Term Orientation and Materialism. In terms of criterion-related validity, all six
dimensions make significant contributions to explaining the external measure
CBGBE. The results of the analyses show support for criterion-related validity of the
cultural values scale in both samples.

-303-
7.3.2 The Consumer- Based Global Brand Equity Scale
This research adopts six dimensions with 29 items as the components of Consumer-
Based Global Brand Equity (CBGBE): Brand Trust (8 items), Perceived Quality (7
items), Self-Congruence (4 items), Brand Awareness (4 items), Brand Association (3
items) and Brand identification (3 items).
Factor analysis with the Varimax Rotation method was performed on a 31-item
CBGBE scale. All the Brand Affect items and an item from Perceived Quality loaded
on a single factor, namely Brand Trust. In addition, of the 31 items, two Perceived
Quality items were deleted to improve validity of the scale. This is because the two
items in the South Korean sample were loaded on Brand Trust.
The Cronbach‘s alpha coefficients of all the factors are considered to be at an
acceptable level of reliability (0.80 to 0.93) in the whole sample. All six dimensions
in the whole samples have eigenvalues greater than 1, and the cumulative percentage
of variance amounts to 72.52%. The results of the analyses show support for
criterion-related validity of the brand equity scale. The present research yields six
dimensions for the Global Brand Equity scale in the British and South Korean
samples with composite reliabilities of 0.93, 0.90, 0.92, 0.74, 0.89, and 0.77; and 0.91,
0.90, 0.78, 0.87, 0.85, and 0.82, respectively. All six dimensions in the British and
South Korean samples have eigenvalues greater than 1, and the cumulative
percentage of variance amounts to 73.24% and 71.82, respectively.
Consequently, the results of the factor analysis and reliability confirm six valid
dimensions of CBGBE for the survey: Brand Trust, Perceived Quality, Self-
Congruence, Brand Awareness, Brand Association, and Brand Identification. From
the standpoint of criterion-related validity, all six dimensions make a significant
contribution to explaining all two external measures: brand reputation and Brand
Loyalty. The results of the analyses show support for criterion-related validity of
CBGBE scale in both samples.

-304-
7.3.3 Antecedents and Consequences of Consumer-Based Global
Brand Equity in the British and South Korean samples
Prior to proceeding to the analysis, multicollinearity should be checked. The
multicollinearity can be assessed by a Tolerance Value and a Variance Inflation Factor
(VIF). Both the Tolerance Value and VIF (Variance Inflation Factor) fulfill the
standard. That is, there was no multicollinearity effect in any of the regression model
(see Tables 6.20, 6.21, 6.22, 6.23, 6.24, 6.25, 6.26, 6.27).
Significant results are achieved through the analysis. Some of the findings are in line
with previous research and some are new. Figure 7.1 and 7.2 summarise the
relationship between cultural values and CBGBE as well as the relationship between
CBGBE and brand reputation and brand loyalty, as determined from the analysis of
British and South Korean samples.

-305-
Figure 7.1: Summary of Final Research Model (British)
H (β=0.16)
H (β=0.14)
H (β=0.11)
H (β=0.33)
H (β=0.16)
H (β=0.37)
H (β=0.42)
Collectivism
Masculinity
Uncertainty Avoidance
Power Distance
Long-Term Orientation
Materialism
Brand Trust (R2=0.12)
Perceived Quality (R2=0.10)
Self-Congruence (R2=0.08)
Brand Awareness (R2=0.12)
Brand Association (R2=0.12)
Brand Identification (R2=0.13)
Brand Reputation
(R2=0.53)
Brand Loyalty (R2=0.66)
Statistically Significant Statistically Insignificant
H (β=0.12)
H (β=0.12)
H (β=0.20)
H (β=0.15)
H (β=0.17)
H (β=0.13)
H (β=0.18)
H (β=0.19)
H (β=0.12)
H (β=0.12)
H (β=0.25)
H (β=0.15)
H (β=0.15)
H (β=0.22)
H( β=0.13)
H (β=0.24)

-306-
Figure 7.2: Summary of Final Research Model (South Korean)
H (β=0.14)
H (β=0.43)
H (β=0.27)
H (β=0.09) H (β=0.49)
H (β=0.25)
Brand Loyalty (R2=0.59)
Collectivism
Masculinity
Uncertainty Avoidance
Power Distance
Long-Term Orientation
Materialism
Brand Trust (R2=0.14)
Perceived Quality (R2=0.15)
Self-Congruence (R2=0.13)
Brand Awareness (R2=0.17)
Brand Association (R2=0.11)
Brand Identification (R2=0.14)
Brand Reputation (R2=0.66)
H (β=0.21)
H (β=0.13)
H (β=0.19)
H (β=0.26)
H (β=0.13)
H (β=0.19)
H (β=0.16)
H (β=0.17)
H (β=0.22)
H (β=0.18) H (β=0.14)
H (β=0.25) H (β=0.12)
Statistically Significant Statistically Insignificant
H (β=0.09)

-307-
As shown in Figure 7.1 and 7.2, the dimensions of Masculinity (β=0.16, p<0.05) in
the South Korean sample and Materialism (β=0.20, p<0.01) in the British sample
show a statistically significant impact on Brand Trust, hence these findings partially
confirm H1b and H1f. The Uncertainty Avoidance dimension in the British (β=0.22,
p<0.001) and South Korean (β=0.17, p<0.01) samples has a significant effect on
Brand Trust. Therefore, these findings confirm H1c, but do not confirm H1a, H1d
and H1e.
The Uncertainty Avoidance dimension has an effect on Perceived Quality in both the
British (β=0.12) and South Korean (β=0.13) samples at p<0.05 level, hence, accepts
H2c. The dimensions of Collectivism (β=0.15) and Power Distance (β=0.13) in the
British sample (p<0.05) and Long-Term Orientation (β=0.26, p<0.001) in the South
Korean sample have a statistically significant influence on the Perceived Quality
dimension, which partly support H2a, H2d and H2e. However, the hypotheses of
H2b and H2f are not accepted. Clearly, among all these dimensions, the effect of
Long-Term Orientation on the Perceived Quality dimension for the South Korean
sample shows the largest beta coefficient and the strongest statistical significance
compared to other dimensions.
The five dimensions of Collectivism (β=0.16, p<0.01), Masculinity (β=0.13, p<0.05)
and Long-Term Orientation (β=0.12, p<0.05) in the British sample, and Uncertainty
Avoidance (β=0.21) and Power Distance (β=0.19) in the South Korean sample, do
significantly affect Self-Congruence at p<0.01 level, with the exception of the
Materialism dimension for both samples. The research hypotheses are partially
accepted by H3a, H3b, H3c, H3d and H3e, but are rejected by H3f. Notably, the
Uncertainty Avoidance dimension in the South Korean sample has the most
importance for explaining the Self-Congruence dimension in both of the samples.
The dimensions of Uncertainty Avoidance in both the British (β= 0.25, p<0.001) and
South Korean (β=0.19, P<0.01) samples, and Materialism in both the British (β= 0.12,
p<0.05) and South Korean (β= 0.14, p<0.01) samples have significant impact on
Brand Awareness. Collectivism (β=0.15, p<0.01) in the British sample and
Masculinity (β=0.13, p<0.05) in the South Korean sample have a significant effect on
Brand Awareness. Therefore, these findings confirm the research hypotheses H4c and

-308-
H4f, and partly confirm H4a and H4b, but not confirm H4d and H4e.
The Collectivism (β=0.18), Uncertainty Avoidance (β=0.19) and Materialism
(β=0.17) dimensions have a statistically significant effect on the Brand Association
dimension for the British sample (p<0.01). For the South Korean sample, the
dimensions of Masculinity (β=0.22, p<0.001) and Long-Term Orientation (β=0.18,
p<0.01) also have a significant effect on the Brand Association dimension. The
research hypotheses partly confirm H5a, H5b, H5c, H5e and H5f, with the exception
of the insignificant H5d.
Masculinity (β=0.12, p<0.05) and Uncertainty Avoidance (β=0.15, p<0.01)
dimensions in the British sample and Power Distance (β= 0.25, p<0.001) and Long-
Term Orientation (β=0.12, p<0.05) in the South Korean sample have a statistically
significant influence the Brand Identification dimension. Thus, the research results
partly accept H6b, H6c, H6d, and H6e, but reject H6a and H6f. The Power Distance
dimension has the most importance for explaining the Brand Identification dimension
in the South Korean sample.
The dimensions of Brand Trust (β=0.37, p<0.001), Brand Awareness (β=0.24,
p<0.001) and Brand Association (β=0.16, p<0.01) in the British sample, and Brand
Trust (β=0.43, p<0.001), Brand Awareness (β=0.27, p<0.001) and Brand Association
(β=0.09, p<0.05) in South Korean sample have a significant and positive impact on
brand reputation. Hence, these findings accept H7a, H7d and H7e. Clearly, Brand
Trust for both of the samples has the most importance for explaining the brand
reputation dimension and shows the strongest significance. The dimensions of Brand
Identification (β=0.11, p<0.05) in the British sample and Self-Congruence (β=0.09,
p<0.05) in the South Korean sample are statistically significant in explaining brand
reputation, thus H7f and H7c are partly accepted. It should be noted that Perceived
Quality for both samples is an insignificant dimension in explaining brand reputation,
thus H7b is not accepted.
,
Brand Trust in the British (β=0.42) and in South Korean samples (β=0.49) and Brand
Identification dimensions in the British (β=0.33) and in South Korea (β=0.25) show
statistically significant influence on brand loyalty, which indicates the strongest

-309-
significance at p<0.001 level. Hence, the research results accept H8a and H8f.
Importantly, Brand Trust for both samples has the most importance in explaining
brand loyalty and indicates greater values than others. The dimensions of Perceived
Quality (β=0.14, p<0.05) in the British and Brand Awareness (β=0.14, p<0.01) in the
South Korean samples show a statistically significance in explaining brand loyalty,
thus the research results partially accept H8b and H8d. However, Self-Congruence
and Brand Association dimensions are not significant, hence are rejected.
7.3.3.1 Effects of Cultural Values on Consumer-Based Global
Brand Equity
The current research has adopted the concept of ‗national culture‘ suggested by
Hofstede and Hofstede (2005) who viewed it as mental programming, shared among
people who live or lived within the same country.
Erdem et al. (2006) found that cultural values are correlated with CBGBE. For
example, in high uncertainty avoidance countries, credibility of brands reduces the
perceived risk and information cost. Furrer et al. (2000) argue that there is a strong
relationship between SERVQUAL dimensions and Hofstede‘s cultural dimensions by
using the Cultural Service Quality Index which can be used to divide international
service markets and allocate resources across segments. Phau and Lau, (2001) find
that cultural orientation can significantly explain self-congruity that is stronger in
individual rather than in collective societies.
The results of multiple regression analysis show that many dimensions of cultural
values make significant contributions to explaining the dimensions of CBGBE for the
British and South Korean samples. In the British sample, the Brand Identification of
CBGBE dimensions indicate the greatest R-square value of 0.13; and the Self-
Congruence dimension indicates the lowest R-square value of 0.08. However, the
Brand Awareness dimension of the South Korean sample indicates the greatest R-
square of 0.17; and the Brand Association dimension shows the lowest R-square value
of 0.11.

-310-
It is interesting to note here that uncertainty avoidance seems to be an important
factor when choosing a global brand in both South Korea and the UK. In both
countries, Uncertainty Avoidance has an effect on Brand Trust, Perceived Quality and
Brand Awareness. In particular, the effect of Uncertainty Avoidance on Brand
Awareness in the British sample has the largest beta coefficient of 0.25. This result is
different from Hofstede‘s finding (1980, 1991) which suggested that the British have
a low score on Uncertainty Avoidance. The uncertainty score of the South Korean
sample supports Hofstede‘s (1980, 1991) finding which states that uncertainty is high
among the South Korean population. Thus, consumers in the UK and South Korea
attempt to avoid uncertainty by choosing a brand that they trust and have experience
in using.
Moreover, Collectivism, Uncertainty Avoidance, Power Distance in the British
sample, and Uncertainty Avoidance and Long-Term Orientation in the South Korean
sample have a strong effect on Perceived Quality. This research confirms the findings
of the study by Donthu and Yoo (1998), which state that Collectivism, Uncertainty
Avoidance, Power Distance, and Long-Term Orientation are related to Perceived
Quality.
On the other hand, this study shows perceptional differences in CBGBE between two
different cultural groups. In the British and South Korean samples, the relationship
between cultural values and Self-Congruence, Brand Association, and Brand
Identification are different. In the British sample, Masculinity has an effect on both
Self-Congruence and Brand Identification, while in the South Korean one, these
dimensions are significantly influenced by power distance. This indicates that
consumers in South Korea tend to express their status or aspire to belong to a high
position group by selecting particular brands. The dimension of Materialism has a
significant impact on Brand Awareness in the British and South Korean samples, and
on Brand Trust and Brand Associations in the British sample. Brand name conveys
the quality and function of a particular brand. Materialists in both countries seem to
select familiar brands that are consumed in public.

-311-
7.3.3.2 Effects of Consumer-Based Global Brand Equity on Brand
Reputation
One of the consequences of CBGBE is brand reputation which is an attitudinal
variable. Acquiring a good reputation ensures that the consumers of a brand will not
switch to a new brand in the long term and that new consumers will be attracted
towards the brand because of positive word-of-mouth (Rogerson, 1983).
Empirical evidence indicates a relationship between CBGBE and brand reputation.
For example, past studies show that perceived quality influences brand reputation
(Zeithaml 1988; Shapiro,1983; Selnes,1993; Milewicz and Herbig,1994). In addition,
it can be seen from previous research that brand reputation is closely associated with
Brand Trust (Tractinsky, Jarvenpaa, Vitale and Saarinen, 1999). In terms of reducing
risk in the buying process, Brand Trust has shown to significantly affect brand
reputation (e.g., Afzal et al., 2000; Einwiller, 2001; Delgado-Ballester and Munuera-
Alemán, 2001). Brand Trust can significantly explain the brand reputation from the
view point of credibility (Keller and Aaker, 1992; Milewicz and Herbig, 1994; Herbig
and Milewicz, 1995). The Brand Identification dimension is related to brand
reputation. This is based on the fact that, firstly, consumers are interested in the brand
that reflects their own self-identity (Bhattacharya and Sen, 2003). Secondly,
consumers are proud of a brand which has a good reputation. Lastly, reputable brands
imply a company‘s success (Bhattacharya, Rao and Glynn, 1995).
The relationship between brand equity and brand reputation is statistically significant
(p=0.000, F=53.424) and the R-square value indicates that six dimensions of Global
Brand Equity explain 53% of the total variance of brand reputation for the British
sample. The dimensions of Brand Trust (β=0.37) and Brand Awareness (β=0.24)
show a strong significance at the p<0.001 level, Brand Association (β=0.16) at the
p<0.01 level and Brand Identification (β=0.11) at the p<0.05 level have a statistically
significant effect on the brand reputation dimension.
The results of regression analysis of the South Korean sample are statistically
significant at the 0.000 level (F=96.596) and accounts for 66% of the total variance in

-312-
the brand reputation. For the South Korean sample, Brand Trust (β=0.43) and Brand
Awareness (β=0.27) dimensions have a significant influence on brand reputation
(p<0.001). The dimensions of Self-congruence (β=0.09) and Brand Association
(β=0.09) also have a significant effect on brand reputation (p<0.05).
Importantly, Brand Trust is the most important dimension in explaining the brand
reputation dimension in both the British and South Korean samples.
7.3.3.3 Effects of Consumer-Based Global Brand Equity on
Brand Loyalty This research has adopted the concept of ‗Brand Equity‘ proposed by Kim and Kim
(2005), who viewed strong Brand Equity as an important component in the restaurant
industry. Empirical evidence has suggested that CBGBE is an important antecedent of
brand loyalty (e.g., Aaker, 1991; Bitner, 1992; Keller, 1993; Dick and Basu, 1994;
Chaudhuri and Holbrook, 2001; O‘Cass and Frost, 2002; Matzler et al., 2006;
Rijswijk and Frewer, 2008; Qin and Prybutok, 2009; Parasuraman et al., 1988; Brady
and Cronin, 2001; Ekinci, 2001; Mittal and Lasser, 1996; Kayaman and Arasli, 2007;
Ekinci et al., 2008; Alexandris et al., 2008). These studies have offered an insight into
the existence of the theoretical relationship between CBGBE and brand loyalty.
The regression analysis model estimates the relationship between CBGBE and brand
loyalty. This is statistically significant in the British (p=0.000, F=89.054) and South
Korean samples (p=0.000, F=71.493). The relationship among the Global Brand
Equity dimensions, Brand Trust and Brand Identification in the British (β=0.42 and
β=0.33) and South Korean (β=0.49 and β=0.25) samples, does significantly explain
the effect upon brand loyalty (p<0.001). Perceived Quality (β=0.14) also indicates a
statistical impact on brand loyalty (p<0.05) in the British sample; and Brand
awareness (β=0.14) in the South Korean sample shows a statistical effect on brand
loyalty (p<0.01). This research confirms the findings of the studies by Gil et al.
(2007), in which Perceived Quality and Brand Awareness related to brand loyalty.

-313-
However, this result is not in line with Gil et al., (2007); Kayaman and Arasli, (2007)
who commented the positive relationship between Brand Awareness and brand loyalty.
7.4 Contributions of the Research
The present research focuses on the cross-cultural study of CBGBE in the restaurant
industry. The outcomes of a variety of the analyses offer theoretical and practical
implications for managers/marketers in the restaurant industry.
The present research makes theoretical and practical contributions with regard to
CBGBE in the restaurant industry. It aims to provide a more in-depth knowledge and
understanding of CBGBE regarding its antecedents and consequences. In addition, it
leads to a better understanding of cultural values and CBGBE.
Firstly, the present research makes a theoretical contribution by examining the
mediating role of CBGBE between cultural values, and brand reputation and brand
loyalty across two cultures in the restaurant industry. Since there is limited research
available using both cultural values and CBGBE, an examination of the mediating
role of CBGBE between cultural values, and brand reputation and brand loyalty in
two cultures permits new insights into understanding of CBGBE in the restaurant
industry.
The findings reveal that almost a half of the dimensions of cultural value play a
significant role in explaining the dimensions of CBGBE. It is important to establish
the relationship between these variables and also to compare the results in the British
and South Korean sample. Furthermore, almost a half of the CBGBE dimensions
show a positive relationship with brand reputation and brand loyalty. Brand Trust
which is one of the dimensions of CBGBE is found to be the most important predictor
of brand reputation and brand loyalty in the British and South Korean samples.
Secondly, given the globalisation of brands, it has become necessary to have a valid
and reliable instrument that measures cultural values. This study has presented and

-314-
empirically tested a model that can be used for the above purpose. Thus, the present
research examines reliability and validity of the cultural values scale through
empirical study. It is necessary for previous scales to be adjusted in terms of how the
scales should operationalize concepts (Sekaran, 2003) and measure consumer‘s
perception of CBGBE. The present research examines cultural values through the 24-
item scale. The results of the analysis show the existence of six dimensions of cultural
values. Importantly, it is worth noting that one particular dimension – Materialism -
has been included in cultural values due to its importance in modern society. It can be
seen from the findings that cultural values are a valuable antecedent of CBGBE.
Further to this, the additional Materialism dimension is meaningful as an adjusted
dimension in measuring the relationship with CBGBE. Thus, the employment of the
modified cultural value dimensions will be effective in comparison of global brands
in today‘s world.
Thirdly, it is worth validating dimensions of CBGBE across two cultures (The UK
and South Korea). Only a limited number of studies on CBGBE have been conducted
in the context of restaurant brands. This empirical study of the global restaurant
industry focuses on an examination of CBGBE. The findings of the current study
using the British and South Korean samples suggest that the six factors of CBGBE
are valid and also reliable. Importantly, in this study the three dimensions - Brand
Trust, Brand Identification and Self-Congruence - have been added to the three
widely accepted dimensions of brand equity: Brand Awareness, Brand Association,
and Perceived Quality.
These revised dimensions of CBGBE, which have been generated through empirical
study, are useful in achieving a better understanding of CBGBE for future research.
More specifically, the scale for measurement of CBGBE used in this study clarifies
how CBGBE dimensions of a global restaurant brand are related to the attitude of
British and South Korean consumers. Such a scale, which can be applied across
countries, allows managers to design and develop efficient global brand strategies
(Buil et al., 2008).
Finally, it should be noted that the present research has found a new attitudinal
variable in the restaurant industry by using in-depth interviews based on mixed

-315-
research methods. The in-depth interviews contribute to providing a more profound
insight into establishing the research model and also ―getting a picture of the
important issues‖ (Saunders et al., 2007; 147). In previous studies, CBGBE has been
found to affect brand reputation, thus brand reputation is regarded as a consequence
of CBGBE in this research. Importantly, the results show that CBGBE has a strong
effect on brand reputation.
It can be seen from the results that brand reputation is influenced by CBGBE. In both
samples, the dimensions of Brand Trust, Brand Awareness and Brand Association
have a statistically significant influence on Brand Reputation. The dimensions of
Brand Identification for the UK sample and Self-Congruence for the South Korea
sample have a statistically significant relationship with Brand Reputation.
7.5 Practical and Managerial Implications
Managers should be able to better understand applications of CBGBE to global
restaurant brands by gaining a practical knowledge of cultural values. This research
will help to further develop management strategies through the analysis of the
relationship between cultural values and CBGBE in the restaurant industry. In
practical terms, the measurement instrument introduced by this study can be used to
assess CBGBE by the restaurant managers.
Firstly, the present research suggests that cultural values consist of six dimensions:
Collectivism, Masculinity, Uncertainty Avoidance, Power Distance, Long-Term
Orientation and Materialism which significantly explains CBGBE. For the British
sample, the Collectivism dimension of cultural values was associated with Perceived
Quality, Self-Congruence, Brand Awareness and Brand Association; Masculinity was
associated with Self-Congruence and Brand Identification; Uncertainty Avoidance
was associated with Brand Trust, Perceived Quality, Brand Awareness, Brand
Association and Brand Identification; Power Distance was associated with Perceived
Quality; Long-Term Orientation was associated with Self-Congruence; Materialism

-316-
was associated with Brand Trust,Brand Awareness and Brand Association. In the
South Korean sample, the Masculinity dimension of cultural values was associated
with Brand Trust, Brand Awareness and Brand Association; Uncertainty Avoidance
was associated with Brand Trust, Perceived Quality, Self-Congruence and Brand
Awareness; Power Distance was associated with Self-Congruence and Brand
Identification; Long-Term Orientation was associated with Perceived Quality, Brand
Association, and Brand Identification; and Materialism was associated with Brand
Awareness. Managers in the restaurant industry can develop branding and
promotional strategies more effectively based on the findings of the analysis. That is,
it will be possible for them to design the plans for marketing strategy and tactics more
effectively by understanding different dimensions of cultural values related to
different dimensions of CBGBE. Marketers managing global brand usually offer
standardized products. They also adapt global brands to the needs of consumers in
different cultures (Cateora and Graham, 2005).
Since Uncertainty Avoidance plays an important role in determining CBGBE, it is
necessary to focus on the application of Uncertainty Avoidance to the restaurant
industry in both the British and South Korean samples. This can be seen from the
results of the analysis using the measures of Yoo and Donthu (2002) indicating that it
is important to have rules/regulations, instructions and procedures which are spelled
out in detail. For the CBGBE, Uncertainty Avoidance can be achieved through
standardization. Standardization refers to ―a common approach to business
throughout the world‖ (Ang and Massingham, 2007:6). In restaurants with a global
brand, standardization is accomplished by a production strategy which stipulates the
rules/regulations, instructions and procedures. This impacts on Uncertainty Avoidance
and subsequently, leads many consumers to visit the global brand. That is, consumers
can experience the same quality of foods and environment anywhere without
hesitation. Many of the consumers who visit global restaurant brands believe that they
offer higher quality products and prestige (Kotabe and Helsen, 2011).Therefore, for
strong uncertainty avoidance cultures, managers of the global brand restaurants need
to create a positive perception of the brand through a good reputation (Lee and Carter,
2012).
Consumers may have different values and perspectives with regard to consumption

-317-
trends, according to the character and values of the society to which consumers
belong - Collectivism or Masculinity. Consumers in a collectivistic society attach a
considerable importance to gaining social approval (Jung and Sung, 2008), especially
by purchasing products that have a high reputation such as global brands. Accordingly,
managers of global brand restaurants should make their consumers feel proud by
improving their restaurants‘ image through marketing strategy and tactics. Consumer
behaviour related to Collectivism is connected to the buying decision process. In an
individualistic culture, consumers tend to consider about their own goals. In
contrast, consumers who belong to a collectivist culture consider their extended
family as well as their immediate family (Lee and Carter, 2012). The result of the
present research shows that Collectivism has an effect on consumer‘s Self-
Congruence (see Table 6.22). Therefore, in individualistic cultures such as the UK,
managers should more customize goods and services for consumers. By contrast,
marketers who seek to attract consumers with collective cultural backgrounds need to
develop a marketing strategy that emphasises how families, friends and colleagues are
an integral part of a person‘s life (Magnini, 2010).
Research finding shows that Masculinity has influence on trust. In a society with high
score masculinity, it would be more effective for the restaurants‘ managers to employ
male staff rather than female staff. This is because consumers in high masculinity
society tend to expect that male staff are more professional and reliable (Tsoukatos
and Rand, 2007).
Cultural values including Power Distance and Long-Term Orientation can have an
effect on personal consumption of each consumer. In terms of social hierarchy
structure, marketers should encourage senior consumers or the leader of a community
to purchase the brand. This is because people who belong to a high position in the
hierarchy of the society generally have power to make decisions regarding the
adoption of the brand. Moreover, as shown in Table 6.22 and 6.25, Power Distance
has an effect on Self-Congruence and Brand Identification. Since the choice of a
restaurant sometimes reflects a person‘s status, people want to visit well-known
restaurant brands that reflect their high position within the social structure. In
particular, Power Distance has influence on Perceived Quality. In high power
distance societies, tangible cues are important when consumers evaluate service
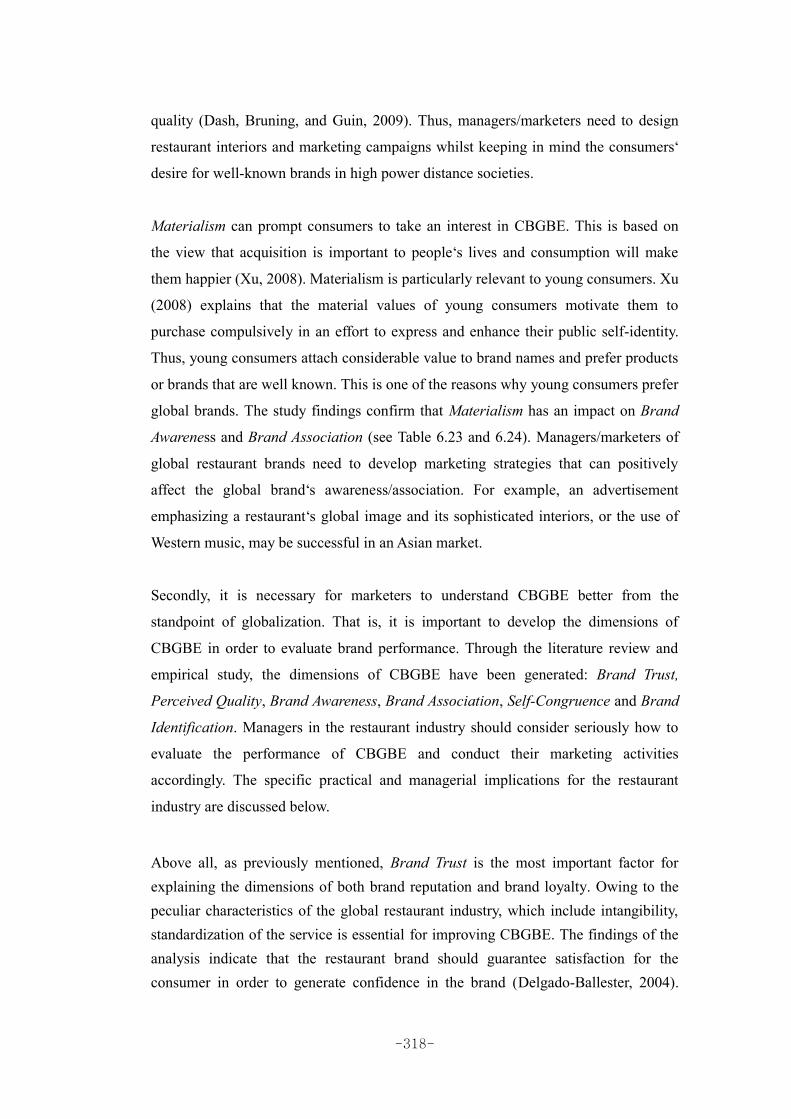
-318-
quality (Dash, Bruning, and Guin, 2009). Thus, managers/marketers need to design
restaurant interiors and marketing campaigns whilst keeping in mind the consumers‘
desire for well-known brands in high power distance societies.
Materialism can prompt consumers to take an interest in CBGBE. This is based on
the view that acquisition is important to people‘s lives and consumption will make
them happier (Xu, 2008). Materialism is particularly relevant to young consumers. Xu
(2008) explains that the material values of young consumers motivate them to
purchase compulsively in an effort to express and enhance their public self-identity.
Thus, young consumers attach considerable value to brand names and prefer products
or brands that are well known. This is one of the reasons why young consumers prefer
global brands. The study findings confirm that Materialism has an impact on Brand
Awareness and Brand Association (see Table 6.23 and 6.24). Managers/marketers of
global restaurant brands need to develop marketing strategies that can positively
affect the global brand‘s awareness/association. For example, an advertisement
emphasizing a restaurant‘s global image and its sophisticated interiors, or the use of
Western music, may be successful in an Asian market.
Secondly, it is necessary for marketers to understand CBGBE better from the
standpoint of globalization. That is, it is important to develop the dimensions of
CBGBE in order to evaluate brand performance. Through the literature review and
empirical study, the dimensions of CBGBE have been generated: Brand Trust,
Perceived Quality, Brand Awareness, Brand Association, Self-Congruence and Brand
Identification. Managers in the restaurant industry should consider seriously how to
evaluate the performance of CBGBE and conduct their marketing activities
accordingly. The specific practical and managerial implications for the restaurant
industry are discussed below.
Above all, as previously mentioned, Brand Trust is the most important factor for explaining the dimensions of both brand reputation and brand loyalty. Owing to the peculiar characteristics of the global restaurant industry, which include intangibility, standardization of the service is essential for improving CBGBE. The findings of the analysis indicate that the restaurant brand should guarantee satisfaction for the consumer in order to generate confidence in the brand (Delgado-Ballester, 2004).

-319-
Hence, for the CBGBE, trust is a higher priority above any other factor in the restaurant industry. Managers in the restaurant industry should try to develop marketing strategies for consumers who want to enjoy standard service and provision anywhere across the world. More specifically, managers should focus on upgrading trust in the brand and the standardization of all services and products by checking them and training staff regularly. Such an approach can be an efficient way of elevating trust in a global brand. More importantly, the findings of the interviews show that consumers tend to be very sensitive about food hygiene (see 4.2.1). Hence, managers should always inspect the level of food hygiene in order to increase consumers‘ trust.
Perceived Quality has a significant effect on brand loyalty in the British sample.
Perceived Quality is an important component of CBGBE in the restaurant industry
since environment and intangible service such as staff behavior, mood, and interior
décor are the main products of the restaurant. Good manners and staff uniform as well
as the physical environment are good examples of what may be considered as
Perceived Quality. It is the most important factor for consumers in choosing or
recommending the restaurant brand to other acquaintances in the UK. In addition, as a
result of the analysis using the measures of Ekinci et al (2001; 2008), the restaurant
staff should be helpful and friendly and also able to anticipate what consumers want;
the décor should be beautifully co-ordinated; and also, comfortable seats and tables
should be provided for the consumer. In a complex society, it is widely regarded that
restaurants are not only for having a good meal but also for taking a break and
relieving stress within a good and comfortable atmosphere. Hence, managers working
in the restaurant industry in the UK should strive to improve or maintain the
Perceived Quality with respect to staff conduct and environment, since these are the
most important assets for the CBGBE. The assessment of Perceived Quality can be a
good way of comparing an existing restaurant to other units of the same brand. in
terms of standardizaion. Most consumers define quality in terms of their needs
(Cateora and Graham, 2005). Global restaurant brands should customize foods, the
interior of the store, staff behavior and uniform to the local consumers' taste to
manage cultural diversity (Clarke and Chen, 2007). Importantly, the maintenance of
balance between standardization and customization is essential to manage brand
equity.

-320-
The Self-Congruence dimension is significant to brand reputation only in the South
Korean sample. As a result of the analysis using the actual and ideal self-congruence
measures of Sirgy and Su (2000) and Ekinci et al. (2008), there is a close relationship
between an individual and others who dine in the same restaurant in South Korea.
That is, an individual diner probably shares the same status, character and taste as the
other diners in the restaurant. More specifically, the interior of the restaurant can be
designed to suit the consumers‘ ideal personality, to reinforce emotional connections
between the restaurant and its consumers (Ekinci et al; 2008). Customizing the
restaurant menu as well as standardizing the service can generate emotional
connections between the restaurant and its consumers. There are a significant number
of people who are concerned about food and service quality when encountering other
cultures. For this reason, combining the strategies of standardization and
customization is the most effective way to satisfy global and local consumers.
It is worth noting that religion, preference, and social issue of health across cultures
need to be taken into account when planning the menu. In addition, managers of
global restaurant brands have to take into account symbols, morals and rules of
different cultures (Jeannet and Hennessey, 2004). To meet the emotional and
symbolic needs of the consumers, it is necessary for managers to identify through
surveys their preferences and the type of ambience that should be created.
Subsequently, managers should modify the interior of restaurants in order to satisfy
the consumers‘ symbolic and emotional needs by using favourable colours and design
for the restaurant. In addition, the staff behaviour in the restaurant, including manner
and conversation, is related to the consumers‘ symbolic requirements (Ekinci et al;
2008). Importantly, managers should focus not only on Perceived Quality as
mentioned earlier, but also the idealised personality of their consumers, as part of the
dimension of Self-Congruence.
Brand Awareness is an underlying dimension of CBGBE, and contributes
significantly to brand reputation in both the British and South Korean samples and to
brand loyalty in the South Korean sample. Brand Awareness is related to familiarity
with the brand (Yoo et al., 2000; Netemeyer et al., 2004; Buil et al., 2008). In the
perceptual process, it is essential to inform consumers about the brand as a

-321-
fundamental tool in promoting familiarity in order to score an advantage over the
competition (Aaker, 1996). In addition, it can be seen from the results of the analysis
that establishing and also maintaining a reputable image is essential to encourage the
consumers to have a positive attitude toward the brand and to generate additional
business through word of mouth. Long-running advertising campaigns can be one of
the most effective ways to market a brand. Therefore, those involved in marketing
should have a strong interest in all promotional strategies including advertising, word
of mouth, public relations, and so forth despite the levels of investment involved. In
modern society, public exposure to advertising through the mass media is ubiquitous
and continues to increase. In particular, managers of global brands need to know that
what is acceptable in advertisements varies depending on cultural values. That is,
advertisements which convey individual pleasures and extreme hedonism would not
be acceptable in collective societies (Lee and Carter, 2012).In addition, it is important
for the brand to show consumers that it takes a keen interest in social and
environmental issues. For example, according to the findings of the interviews in the
UK, there are consumers who are interested in fair trade coffee and ethical business.
They prefer to visit restaurants offering fair trade coffee (see 4.2.1). Thus, marketers
should focus on developing a favourable image for the brand by using fair trade foods,
recycling campaigns or charities. In terms of a positioning strategy, these strategies
will be useful for positioning the brands in the minds of consumers.
Brand Association is related to brand reputation in both the British and South Korean
samples. In terms of Brand Association, the importance of the logo has been pointed
out by Gladden and Funk (2002) and also Alexandris et al. (2008). Clearly, from the
results of the analysis, Brand Association has a significant effect on brand reputation
but not on brand loyalty. That is, Brand Association is not related directly to brand
loyalty. Managers should create a unique association to establish each brand in the
minds of consumers in order to build a competitive advantage and increase CBGBE
(Chen, 2001). To increase this association, employing unique marketing strategies can
be the most effective means of increasing this association, for example (once again)
through the use of a unique logo, interior, staff uniforms, advertising and specific
menus. In actual fact, the majority of global restaurants have been successfully
developed using creative and memorable designs which lead consumers to take an
interest in evaluation in advance of visiting the restaurants. Along with these

-322-
strategies, ―integrated brand communications and creative repetition through various
types of media are key to success in brand communications‖ (Ghodeswar, 2008:10).
The dimension of Brand Identification plays a key role in brand loyalty for both
samples, and has a significant effect on brand reputation in the British sample. This
can be seen from the results of the analysis obtained employing the scales of Mael
and Ashforth (1992); and Kuenzel and Halliday (2008). Their studies indicate that
consumers are satisfied with the brand when the brand acquires a good reputation
from others and the media. That is, when the consumers hear someone praising their
brand, they almost view it as a personal compliment. A good image can have an
impact on the brand reputation (Smidts, Pruyn and Van Riel, 2001). In addition,
consumers may tend to experience a sense of belonging to a specific society through
experiencing the global brand. For example, the majority of the consumers of global
fast food restaurants are young people, who like to feel they are sharing in western
culture by enjoying fast foods. Consumers have a variety of interests according to
their different characteristics. Whilst the taste of the music is becoming standardised
among young people, the music which senior citizens listen to can be different (Doole
and Lowe, 2008). This is due to the difference of their values. Marketers should
employ segmentation strategies for senior citizens, families, teenagers, children, and
others. Marketers should be aware of consumers‘ characteristic traits, culture and
society since they tend to place importance on belonging to a specific group. Hence,
the global restaurant should become the place where there are prized things such as
music, mood, particular foods, comfortable tables and chairs as part of the overall
ambience. Managers should provide their consumers with specific spaces and
services in order to grant them a sense of belonging which is the sense that they are of
an equivalent value or quality to the brand they use. That is, managers need to use
both the customization and standardisation strategies to offer a sense of belonging.
In conclusion, it is useful to note that it should be a priority for managers/marketers to
assess the effect of cultural values on a CBGBE across cultures, since this may be
essential for retaining brand loyalty for the brand and further cultivate new markets
around the world. The diversity of culture causes differences in consumer behaviour.
In particular, food consumption is influenced by cultural variation which can affect
the marketing strategy of the restaurant (Jeannet and Hennessey, 2004). Balancing

-323-
standardization and customization of global service brand is one of the major issues.
Global restaurant brands try to maintain their standard image and, at the same time,
offer services that are congruent with the local consumers‘ expectations. For example,
food hygiene, logo, symbol, interior and service quality of global restaurants are
uniform worldwide. However, some of the food menus need to vary across cultures.
Moreover, advertising and signboards of global restaurant brands need to be written
in the native language (Witkowski, Ma, Beach, and Zheng, 2003). The
managers/marketers of such brands must understand consumers through prevailing
cultural values, norms, beliefs, lifestyles in the countries. In the process that is
underway for the globalization of many brands, it is necessary not only to have global
thoughts and standardization, but also to pursue suitable marketing strategies for the
local cultures, in order for the global brand to be successful in the local place.
7.6 Limitations and Future Research
Although the present research makes valuable contributions to cross cultural study,
some limitations remain, and should be considered in future research:
First of all, guidelines for the interviews and survey were formulated in English and
in Korean and applied in two countries. Before conducting the survey, the
questionnaire of Korean version was checked by two professional interpreters and
eight respondents. Subsequently, this was reviewed based on the comments of the
interpreters and participants. In addition, the results of the interviews with South
Korean respondents which were recorded in a cassette tape were translated into
English and reviewed to see whether there were any improper interpretations or not.
However, a minor gap in the interpretation in the interview guide and questionnaire
may have occurred even though these were carefully checked by the professional
interpreters
Secondly, for the interviews and the survey, sampling is constrained to participants
from four cities (two cities in the UK and two cities in South Korea), respectively.
This may limit generalizability of the study‘s findings to the two populations.

-324-
The third limitation is the use of non-probability sampling (convenience sampling).
Despite best efforts, the respondents may not be a representative sample of the total
population of restaurant consumers (Graziano and Raulin, 1997). Hence, future
research needs to consider employing probability samplings in order to elevate
external validity of the analyses and findings regarding generalizability (Sekaran,
2003).
In addition, this research relies on a limited number of global restaurants for the
object of research, because it is necessary for a cross-cultural study that the object in
the UK and South Korea is kept the same. Owing to the difficulty in finding the same
global restaurant brand in both countries, mainly fast food restaurants have been
chosen, for the most part, in this research.
The present study provides an insight into the relationships among cultural values,
Consumer-Based Global Brand Equity, brand reputation and brand loyalty within a
global perspective and also the study field of the restaurant industry. Future research
needs to further build up this research model through additional cross-cultural study.
The present study has examined the relationships of variables according to the British
and South Korean samples. Further studies on these relationships in other national
cultures would provide us with additional understanding of a culture and its influence.
For example, it would be interesting to research the relationships in countries at
various stages of economic development as well as between countries which have
different traditions and social systems. In addition, culture is not immutable. Changes
in culture affect global brands, thus international marketing managers need to
examine the cultural changes, and the relationships of culture and CBGBE in their
market continuously. Therefore, longitudinal research on the relationships would
make a contribution to the restaurant industry in global market place.

-325-
APPENDIXES

-326-
APPENDIX A
INTERVIEW QUESTIONS

-327-
Interview Questions (for Customers of Restaurant)
Burger King, Costa Coffee, KFC, McDonald‘s, Pizza Hut, TGI Friday‘s, Domino‘s Pizza , Starbucks, Subway
1. Please select one of your favourite restaurant brands from the above list. (or identify your favourite restaurant brand).
And, how many times have you eaten in this restaurant in the last 12 months?
2. Why do you like to eat in this restaurant? 3. How do you feel eating in this restaurant?
4. When deciding your choice, how much do you consider your personal
situation or is this an impulsive decision?
5. If you would like to change your favourite restaurant brand, what would be the reason for changing it?
6. If you visit another city or nation, would you want to eat in the same
brand of restaurant or in another one? Why?
7. If there are none of your favourite brand restaurant in another city or nation, how can you get information about other restaurants, e.g. newspaper, magazine, internet, opinion-seeking, deciding by yourself etc. ?
8. Who in your group of the family, friends or work colleagues decides
which restaurant to eat in? What factors are important in this decision?
9. Are there other factors that influence this decision that we have not spoken about yet?

-328-
인터뷰 질문 (레스토랑 고객을 대상으로)
Burger King (버그킹), Costa Coffee (코스타 커피), KFC (케이에프씨),
McDonald‘s (맥도날드), Pizza Hut (피자헛), TGI Friday‘s (티지아이 프라이데
이), Domino‘s Pizza (도미노 피자), Starbucks (스타벅스), Subway (섭웨이)
1. 위의 보기 중에서 당신이 좋아하는 레스토랑 브랜드를 하나만 선택
하십시오. (또는 당신이 좋아하는 식당 브랜드를 확인해 주십시오).
그리고, 지난 12개월 동안 당신이 선택한 레스토랑 브랜드를 몇 번 방
문하셨습니까?
2. 당신은 왜 이 레스토랑에서 식사하는 것을 좋아하십니까?
3. 이 레스토랑에서 식사할 때 당신의 느낌은 어떠했습니까?
4. 당신은 레스토랑을 결정할때 당신의 개인적인 상황을 어느 정도 고려하
십니까? 또는 충동적으로 구매를 결정하십니까?
5. 만일 당신이 좋아하는 레스토랑을 다른 브랜드로 바꾼다면 그 이유는
무엇입니까?
6. 만일 당신이 다른 국가 또는 지역을 방문한다면 그 전의 같은 브랜드의
레스토랑에서 식사를 하시겠습니까 또는 다른 브랜드의 레스토랑에서
식사를 하시겠습니까? 왜 그렇습니까?
7. 만일 다른 국가 또는 지역에 예전에 당신이 선호하였던 같은 브랜드의
레스토랑이 없다면 당신은 다른 레스토랑에 관한 정보를 신문, 잡지, 인
터넷, 질문, 자신의 결정 중에서 어떠한 방법을 사용하시겠습니까?
8. 당신의 가족, 친구들, 또는 동료 중에서 누가 레스토랑을 결정하십니까?
어떤 요인들이 이 결정에 중요한 영향을 미칩니까?
9. 지금까지 위에서 우리가 언급하지 않은 레스토랑 결정에 영향을 미칠만
한 다른 요인들이 있습니까?

-329-
APPENDIX B
THE SAMPLES OF INTERVIEW TRANSCRIPT:
THE SAMPLES OF THE BRITISH & SOUTH KOREAN

-330-
Transcript of Interview British 1
Gender: Female Age: 24 years old Occupation: Teacher * The following is a list of global restaurant brands.
Burger King, Costa Coffee, KFC, McDonald‘s, Pizza Hut, TGI Friday‘s, Domino‘s Pizza, Starbucks and Subway
1. Please select one of your favourite restaurant brands from the above list. (or identify your favourite restaurant brand). Brand X. They are definitely my favourite, I think. And, how many times have you eaten in this restaurant in the last 12 months? Probably, four times.
2. Why do you like to eat in this restaurant?
I think probably for the menu. I like the food they serve, so there are lots of different things you can eat there, and it‘s a fun restaurant.
What is fun?
It is quirky. I find most of the Brand X have their waiters wearing different uniforms. It‘s more fun than some restaurants.
Anything else?
It has got a good atmosphere, I like the food, and I like the American style of the restaurant. So you get food that you can eat leisurely … . It reminds me of an

-331-
American diner, which I like. I think it‘s good. I like the way it‘s designed. It‘s a bit more relaxed. It‘s not so much like a restaurant feel, you know, very proper and fancy. It‘s really nice, relaxed and casual. What do you mean by ‘relaxed’? It‘s Comfortable and not too expensive.
3. How do you feel eating in this restaurant? I feel relaxed when I eat there, and I enjoy the experience.
What do you mean by ‘enjoy the experience’?
I like the food and the staff. I enjoy the design of the restaurant and I like eating there.
4. When deciding your choice, how much do you consider your personal situation or is this an impulsive decision?
I think it is more like an impulsive decision. I think, I normally, sometimes, I
don‘t go very often. 4 times a year, so if I feel like it, in the weekend, I might be
‗ah!‘ I suppose it‘s both, really. I have to take into account, where they are - the
nearest one to us is quite far away, so distance as well. So personal and impulsive,
really. Sometimes I think, ‗Ah, I‘ll just go there‘, but then it‘s quite far away to go
to the nearest one…so…. .
5. If you would like to change your favorite restaurant brand, what would
be the reason for changing it?
Sometimes I find when I do go there, that you have to wait for a long time for the food, and it takes a long time, and not only that, but they also don‘t have enough seats. They have that system when they give you a beeper; you have to then wait a long time to get a seat. Maybe they can make the restaurant bigger, or… . I don‘t know, sometimes that is annoying.

-332-
How about the quality of the food?
Quality of food could be better. It‘s nice food because you don‘t pay too much for it, but the quality of the food could be better. I like the service; it is good there. I don‘t think the price is bad, actually. I don‘t find it too expensive, so…what you get is… well, it depends. If you spend too much, then you might go to Brand Y. But I think it‘s nice to go to Brand X.
How about the location of the restaurant?
More and more branches I think. They need to have more restaurants because they don‘t have enough. The nearest one is in Coventry. There are not many around. I would go more than four times in a year, if there were more in the area.
6. If you visit another city or nation, would you want to eat in the same brand of restaurant or in another one? Why?
I like it not just because it is in England, but… it depends, really. When I go to Dubai on a holiday, there are a lot of choices of restaurants there. So I might be less inclined to go and have a dinner there because they have more restaurants to choose from. Do you see what I mean…like… here, there are not many great restaurants. If I want to go to Brand X, which is an American diner, here aren‘t many others around. Whereas in Dubai, they have a huge range of different similar style of restaurants you can go to. Here, I like Brand X, because that is the best of the American diners in England, but in Dubai, there are lots of different things that are better than Brand X. So in Dubai, I might go eat in a different one, instead of going to Brand X.
7. If there are none of your favorite brand restaurant in another city or nation, how can you get information about other restaurants, e.g. newspaper, magazine, internet, opinion-seeking, deciding by yourself etc.?
Normally, by opinion seeking or a magazine, actually. You know through word-of-mouth, through other people telling me, or I mainly go on holiday to places

-333-
like Dubai, so I think I normally look in their magazines and see which ones look good. Or the Internet.
What is the important point you would consider when choosing a restaurant from magazines?
Price, reputation and menu. I don‘t like it when they don‘t have much choice on the menu because I am very fussy with my food so I love to have a lot of choice.
8. Who in your group of the family, friends or work colleagues decides which
restaurant to eat in? What factors are important in this decision?
My Dad, because he pays money. He probably decides where. And he has eaten in more restaurants than I have. He is older and he knows more restaurants that are nicer, and he uses the Internet to find out about the restaurants and he‘ll say ‗no‘ or ‗good‘.
Does your father like Brand X?
Yes, he does. There are more Brand X in Dubai… .
Many elderly people don’t usually like global brands; they prefer local brands more… ?
He prefers global brands. He travels a lot so he goes to different countries where he works. I think he prefers restaurants that have… . He prefers global brands.
When you go to restaurants with your friends, who usually chooses the restaurant?
We decide as a group. We decide together. So when I am with my friends, there is
normally a group decision. The decision point is reputation and things like that.

-334-
When you are with your colleagues, who decides the restaurant?
One person decided it. She just made a decision for everybody. Everybody had a
different opinion but one person just decided the restaurant. Even though she was
not very old, or in a high position, she just made a decision because she was quite
confident. She didn‘t really care whether other people blame her or not.
Did she choose a local brand or global brand?
Maybe, global brand. I am not sure.
Do you know why she prefers global brand more?
If you have a global brand, it is obviously successful in different countries. So you can trust it more because you know that other people eat there, and you know that it is safe to eat so you know that it is fine. Whereas in independent restaurants, you don‘t know so much. It is less likely to have a website, or less likely to have a good chef.
9. Are there other factors that influence this decision that we have not spoken about yet?
Price and reputation of the restaurant. Menu, obviously. I don‘t like it when they don‘t have much choice on the menu.
Why do you think about the restaurant? Why is the reputation of the restaurant important for you?
Because I wouldn‘t want to go and eat in a restaurant that people don‘t like. Not just one person, everyone has different opinions. But if a lot of people said ‗Brand X restaurant does not have nice food and I don‘t like the price‘, then I wouldn‘t want to go and do it because I think that I wouldn‘t want to go and waste money.

-335-
Why is the reputation important and useful for you to choose this restaurant?
I don‘t want to go somewhere, if someone said it‘s horrible. I will go somewhere, if it‘s good. Because they like it, so I might like it. I think that it is more important to listen to what others are saying, especially people who you know. Share opinions together.
Is there another factor that influences this decision that we have not spoken about yet?
Money, other people would go there is important. Brand X is probably a young place so young dress-code is important. Locations, obviously, reputation of the restaurant, and facilities of the restaurant are also important.
Some people told me that they are interested in the look of the restaurant, like restaurants that have colorful design. I don‘t like when it is too bright. Do you think the atmosphere of Brand X is good?
Yes, I like the music in there, and the staff gets up and sings sometimes. That‘s nice rather than all be very quiet.
Do you think Brand X appearance is distinctive?
I like the music in there. Staff sings in there. I like that rather than being quiet… .

-336-
Transcript of Interview South Korean 3 Gender: Female Age: 52 years old Occupation: Housewife
* The following is a list of global restaurant brands.
Burger King, Costa Coffee, KFC, McDonald‘s, Pizza Hut, TGI Friday‘s, Domino‘s
Pizza, Starbucks and Subway
1. Please select one of your favourite restaurant brands from the above list?
(or identify your favourite restaurant brand). It is a ―Brand Z‖.
And, how many times have you eaten in this restaurant in the last 12 months? About five or six times.
2. Why do you like to eat in this restaurant? I am familiar with this brand because there is a large number of its chain anywhere. In addition, a variety of menu and taking out are attractive for me.
3. How do you feel eating in this restaurant ?
During staying this restaurant, I feel comfortable. More specifically, even though I keep waiting or talking with my friends without ordering a food, I do not feel uncomfortable at all.
4. When deciding your choice, how much do you consider your personal situation
or is this an impulsive decision?
Price is not important but personal situation is very important for me. For instance, when I needed to decide a brand, I consider sincerely whether I can carry out food and this restaurant is convenient for anyone like my family, friends etc., or not.

-337-
5. If you would like to change your favourite restaurant brand, what would be the reason for changing it? Changing my favourite menu to another one may lead me to try different brands. More specifically, most menus have too much fat, so when I get older, I would change to wellbeing.
Is there another reason to change the brand, for example similar conditions such as providing similar quality of food, physical environment, price and so on?
The global restaurant brands would have a trust stemming from responsibility through which I can trust the brand would sort out any problems – customers‘ dissatisfaction, hygiene, etc. In this perspective, we do not need to distrust such global brands when choosing it in another city or nation.
6. If you visit another city or nation, would you want to eat in the same brand of restaurant or in another one? Why? I would like to visit the same restaurant in which has familiar menus.
7. If there are none of your favourite brand restaurant in another city or nation, how can you get information about other restaurants, e.g. newspaper, magazine, internet, opinion-seeking, deciding by yourself etc. ?
A book and magazine for travellers would be helpful for me to find the restaurant in which I can see a special food. And, I can also efficiently gain useful information through travel guide to find the one.
8. Who in your group of the family, friends or work colleagues decides which restaurant to eat in. What factors are important in this decision?
I usually discuss with my family to decide choice for the brand. And when visiting
with staffs in my husband‘s clinic or my friends, I also follow their decisions to
choose the brand. The staffs are young so they prefer the family restaurant like Brand X.

-338-
Why the young staffs would like to visit the family restaurant?
The young staffs enjoy having a variety of menu, much quantity and saving a bonus point in the family restaurant. Interestingly, they seem to be happier to visit the brand than local one. It is due to the brand reputation through which they would like to belong to the high level of position. For instance, in case someone ask me about what
kind of food I enjoy having, I prefer to answer ―I enjoy having steak of Brand X‖ not just saying ―steak‖. This is based on the fact that the price of food in the family restaurant is not cheap.
9. Are there other factors that influence this decision that we have not spoken about yet?
I think everyone who has a keen interest in this global brand has been monitoring the brand. That is, brand reputation regarding a joint ownership, honesty and trust can play role in preventing causing the damage of brand image. It seems that the global restaurant tries to sustain continuously its own brand reputation.
What do you think of standardization of the global brand?
Standardization of the brand is efficiently able to prevent providing low quality of service. For this reason, I would like to maintain using same brand that I have employed. Therefore, these factors mentioned above lead me to make a decision for brand loyalty.

-339-
APPENDIX C
INITIAL QUESTIONNAIRE

-340-
Dear Participant I am a PhD student at Oxford Brookes University. The aim of this research is to investigate British consumers‘ perception of global brand in the restaurant industry. Your opinions are very valuable to the success of this study. All information provided will be kept strictly confidential and be used for academic purposes only. It will take no longer than fifteen minutes of your valuable time to complete this survey. If you have any questions regarding this study, please do not hesitate to ask for clarification. When you have finished, please return the questionnaire to the data collectors. Thank you for your time and participation to this survey. Best Regards, Sung Ho Han PhD researcher Business school Oxford Brookes University
Wheatley Campus, Wheatley, Oxford, OX33 1HX, UK
Email: [email protected]

-341-
SECTION A: A GLOBAL RESTAURANT BRAND YOU ARE FAMILIAR WITH
Directions: The following is a list of global restaurant brands which operates more than one country. Please choose one restaurant brand with which you are familiar with and then respond the questions. Please note that there are no right or wrong answers.
A List of Global Restaurant Brands:
Q1. Please print the restaurant brand which you have selected _______________
Q2. How long have you known this restaurant brand?
Q3. Have you eaten in this restaurant in the last 12 months?
□Yes □No (Please go to section B)
Q4. Approximately, how many times have you visited this restaurant brand in the
last 12 months? _________________
Q5. What was the main purpose of your visit?
□ Business □ Leisure □ Business and Leisure □ Routine
□ Celebrating Event (Graduation, Birthday, etc.) □ Other ______________
Q6. How would you describe overall satisfaction with your last experience with this
restaurant ?
Completely
Dissatisfied
1□ 2□ 3□ 4□ 5□ 6□ 7□ Completely
Satisfied
□ Less than 1 month □ 1 to 7 months
□ 6 to 12 months □ 1 to 3 years
□ Over 3 years
Burger King, Costa Coffee, KFC, McDonald‘s, Pizza Hut, TGI Friday‘s, Domino‘s Pizza, Starbucks, Subway

-342-
SECTION B: OVERALL IMAGE OF THE GLOBAL RESTAURANT BRAND THAT YOU SELECTED IN SECTION A
Q7. Directions: The following statements are about the brand image of the global restaurant brand that you selected in section A. Please rate the extent to which agree or disagree with the statements. Rating 7 means you are ―strongly agree‖ and 1 means ―strongly disagree‖.
Statement
`
This brand meets my expectations of restaurant service.
1 2 3 4 5 6 7
I can rely on this brand to solve the service dissatisfaction.
1 2 3 4 5 6 7
This brand guarantees satisfaction with quality of food.
1 2 3 4 5 6 7
I have confidence in this brand. 1 2 3 4 5 6 7
I feel good when I use this brand. 1 2 3 4 5 6 7
This brand makes me happy. 1 2 3 4 5 6 7
This brand gives me a pleasure. 1 2 3 4 5 6 7
This brand provides tasty foods. 1 2 3 4 5 6 7
This brand prepares food and drinks according to hygiene standards.
1 2 3 4 5 6 7
This brand offers fresh foods. 1 2 3 4 5 6 7
The décor is beautifully co-ordinated with great attention to detail.
1 2 3 4 5 6 7
This brand is tidy. 1 2 3 4 5 6 7
This brand provides comfortable seats and tables.
1 2 3 4 5 6 7
The staffs of this brand are helpful and friendly.
1 2 3 4 5 6 7
The staffs of this brand seem to anticipate what I wanted.
1 2 3 4 5 6 7
The staffs of this brand listen to me. 1 2 3 4 5 6 7
Strongly
Disagree
Neutral
Strongly
Agree

-343-
Statement
The staffs of this brand are talented and displayed a natural expertise.
1 2 3 4 5 6 7
The customers who dine in this brand reflect the type of person I am.
1 2 3 4 5 6 7
The customers who dine in this brand are very much like me.
1 2 3 4 5 6 7
The customers who dine in this brand reflect the type of person I would like to be.
1 2 3 4 5 6 7
The customers who dine in this brand are very much like the person I admire.
1 2 3 4 5 6 7
I am aware of this brand. 1 2 3 4 5 6 7
When I think of a restaurant, this brand is one of the brands that come to mind.
1 2 3 4 5 6 7
I am familiar with this brand. 1 2 3 4 5 6 7
I can recognize this brand among other brands.
1 2 3 4 5 6 7
This brand is a leader in the restaurant industry.
1 2 3 4 5 6 7
This brand is very popular 1 2 3 4 5 6 7
This brand is widely recognized 1 2 3 4 5 6 7
I have good memories for the service in the restaurant.
1 2 3 4 5 6 7
My family and friends have fond memories for the service in the restaurant.
1 2 3 4 5 6 7
I enjoy reflecting on everyday problems. 1 2 3 4 5 6 7
This brand has an attractive logo. 1 2 3 4 5 6 7
I recall the logo of this brand. 1 2 3 4 5 6 7
I recall the colours of the building and inside.
1 2 3 4 5 6 7
Strongly
Disagree
Neutral
Strongly
Agree

-344-
Q8.Directions: The following statements are about cultural values. Please rate the extent to which you agree or disagree with the statement using the 7 point scale. Rating 7 means you are ―strongly agree‖ and 1 means ―strongly disagree‖.
Statement
Individuals should sacrifice self-interest for the sake of the group to which the individual belong.
1 2 3 4 5 6 7
Individuals should pursue their goals after considering the welfare of the group.
1 2 3 4 5 6 7
Group success is more important than individual success.
1 2 3 4 5 6 7
I like to work in a competitive environment 1 2 3 4 5 6 7
I pursue winning, success and achievement 1 2 3 4 5 6 7
Consumption patterns show self-supporting lifestyle.
1 2 3 4 5 6 7
I avoid risk rather than take risk.
1 2 3 4 5 6 7
I like to accept innovative and creative idea
1 2 3 4 5 6 7
I hesitate using new products and technologies.
1 2 3 4 5 6 7
I think social status is important in showing power.
1 2 3 4 5 6 7
I like to buy products which can identify my social status.
1 2 3 4 5 6 7
I like well-known brands. 1 2 3 4 5 6 7
It bothers me when my friends have things that I cannot afford.
1 2 3 4 5 6 7
I choose my job on the basis of the salary. 1 2 3 4 5 6 7
I prefer a rational to an emotional analysis in decision making.
1 2 3 4 5 6 7
Strongly
Disagree
Neutral
Strongly
Agree

-345-
Statement
I tend to use reason rather than intuition in my life in decision making.
1 2 3 4 5 6 7
I am working and saving for the future. 1 2 3 4 5 6 7
I am planning and preparing for the future.
1 2 3 4 5 6 7
Q9.Directions: The following are statements regarding the brand loyalty in the global
restaurant brand that you selected in section A. Please rate the extent to which you agree
or disagree with the statement using the 7 point scale. Rating 7 means you are ―strongly
agree‖ and 1 means ―strongly disagree‖.
Statement
I say positive things about this brand to other people.
1 2 3 4 5 6 7
I will recommend this brand to anyone who seeks my advice.
1 2 3 4 5 6 7
I would not switch to another brand, even if I had a problem with the services of this brand.
1 2 3 4 5 6 7
I will revisit this brand next time. 1 2 3 4 5 6 7
Strongly
Disagree
Neutral
Strongly
Agree
Strongly
Disagree
Neutral
Strongly
Agree

-346-
Directions: Please tick (√) the box where appropriate.
Q10. Gender: □ Female □ Male
Q11. Age Group: □ 16-23 □ 31-40 □ 51-60
□ 24-30 □ 41-50 □ Over 61
Q12. Nationality: __________________
Q13. The highest level of education you attained: □ GCSE □ A-Level □ GNVQ/NVQ
Q14. Current Employment Status: □ Full-time Employee □ Part-time Employee □ Self-employee □ Unemployed
Q15. Your current occupation: □ Manager and Senior Officials □ Professional Occupation □ Associate Professional and
Technical Occupations □ Administrative and Secretarial
Occupation □ Elementary Occupations
Q16. Average annual pre-tax personal income:
□ Less than £ 10,000 □ £ 10,000 to £ 19,999 □ £ 20,000 to £ 29,999
Thank you for your help
□ Undergraduate Degree □ Postgraduate Degree □ Other: _______________
□ Retired □ Housework □ Student □ Other: _______________
□ Skilled Trades Occupations □ Personal Service Occupations □ Sales and Customer Service Occupations □ Process, Plant and Machine Operatives □ Other: _______________
□ £ 30,000 to £ 39,999 □ £ 40,000 to £ 49,999 □ Over £50,000

-347-
APPENDIX D
REVISED QUESTIONNAIRE

-348-
Dear Participant I am a PhD student at Oxford Brookes University. The aim of this research is to investigate British consumers‘ perception of global brand in the restaurant industry. This survey will take no longer than fifteen minutes of your valuable time and your opinion is very valuable to the success of this study. Please be assured that all information provided will be kept strictly confidential and used for academic purposes only. If you have any questions regarding this study, please do not hesitate to ask for clarification. When you have finished, please return the questionnaire to the data collectors. Thank you for your time and participation in this survey. Best Regards, Sung Ho Han PhD researcher Business school Oxford Brookes University
Wheatley Campus, Wheatley, Oxford, OX33 1HX, UK Email: [email protected]
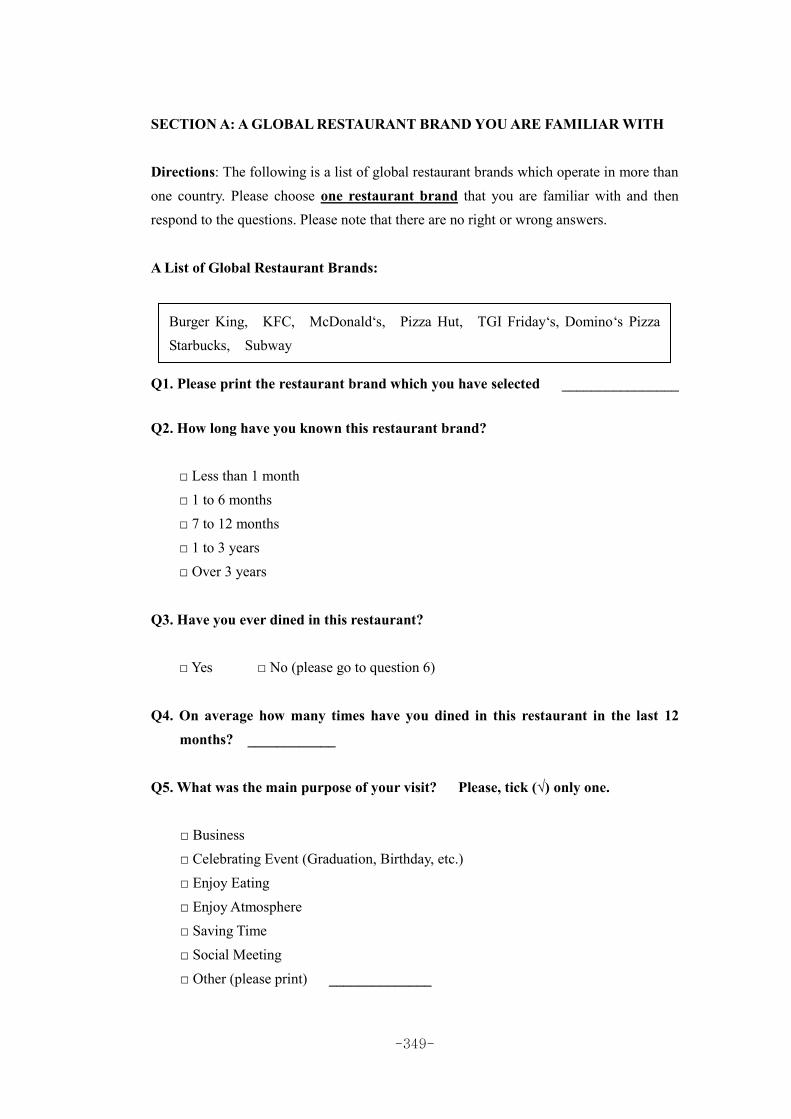
-349-
SECTION A: A GLOBAL RESTAURANT BRAND YOU ARE FAMILIAR WITH Directions: The following is a list of global restaurant brands which operate in more than one country. Please choose one restaurant brand that you are familiar with and then respond to the questions. Please note that there are no right or wrong answers.
A List of Global Restaurant Brands: Q1. Please print the restaurant brand which you have selected ________________ Q2. How long have you known this restaurant brand?
□ Less than 1 month □ 1 to 6 months □ 7 to 12 months □ 1 to 3 years □ Over 3 years
Q3. Have you ever dined in this restaurant?
□ Yes □ No (please go to question 6)
Q4. On average how many times have you dined in this restaurant in the last 12 months? ____________
Q5. What was the main purpose of your visit? Please, tick (√) only one.
□ Business □ Celebrating Event (Graduation, Birthday, etc.) □ Enjoy Eating □ Enjoy Atmosphere □ Saving Time □ Social Meeting □ Other (please print) ______________
Burger King, KFC, McDonald‘s, Pizza Hut, TGI Friday‘s, Domino‘s Pizza Starbucks, Subway

-350-
Q6. What type of promotion reminds you of this restaurant most? Please tick (√) one only.
□ Internet □ Magazine □ Newspaper □ Radio □ Signboard
□ Word of Mouth □ Television □ Leaflet
Q7. Which of the following is a strong point of this brand? Please, tick (√) only one only.
□ Accessibility (Location and Many branches) □ Children facility □ Cleanliness □ Competence of Staff □ Convenience (Saving time) □ Hygiene □ Quality of Food □ Reasonable Price □ Special Promotion (Coupon, Point Card, etc.) □ Standardized menu and physical environment □ Wide Space inside

-351-
SECTION B: OVERALL IMAGE OF THE SELECTED RESTAURANT BRAND IN SECTION A Q8. Directions: The following statements are about the restaurant brand that you have selected in section A. Please rate the extent to which you agree or disagree with the statements. Rating 7 means you ―strongly agree‖ and 1 means ―strongly disagree‖.
Statement
a. This brand meets my expectations of restaurant service.
1 2 3 4 5 6 7
b. I can rely on this brand to solve the service dissatisfaction.
1 2 3 4 5 6 7
c. This brand guarantees satisfaction. 1 2 3 4 5 6 7
d. I have confidence in this brand. 1 2 3 4 5 6 7
e. I feel good when I dine in this restaurant brand.
1 2 3 4 5 6 7
f. This restaurant brand makes me happy. 1 2 3 4 5 6 7
g. This restaurant brand gives me pleasure. 1 2 3 4 5 6 7
h. This restaurant brand provides tasty foods.
1 2 3 4 5 6 7
i. This restaurant brand prepares food and drinks according to hygiene standards.
1 2 3 4 5 6 7
j. This restaurant brand offers fresh foods. 1 2 3 4 5 6 7
k. The décor of this restaurant brand is beautifully co-ordinated with great attention to detail.
1 2 3 4 5 6 7
l. This restaurant brand offers a tidy environment.
1 2 3 4 5 6 7
m. This restaurant brand provides comfortable seats and tables.
1 2 3 4 5 6 7
n. The staff of this restaurant brand is helpful and friendly.
1 2 3 4 5 6 7
o. The staff of this restaurant brand seems to anticipate what I want.
1 2 3 4 5 6 7
Strongly
Disagree
Neutral
Strongly
Agree

-352-
Statement
p. The staff of this restaurant brand listens to me.
1 2 3 4 5 6 7
q. The staff of this restaurant brand is talented and displays a natural expertise.
1 2 3 4 5 6 7
r. The customers who dine in this restaurant reflect the type of person I am.
1 2 3 4 5 6 7
s. The customers who dine in this restaurant are very much like me.
1 2 3 4 5 6 7
t. The customers who dine in this restaurant reflect the type of person I would like to be.
1 2 3 4 5 6 7
u. The customers who dine in this restaurant are very much like the person I admire.
1 2 3 4 5 6 7
v. I am aware of this brand. 1 2 3 4 5 6 7
w. When I think of a restaurant brand, this is one of the brands that come to mind.
1 2 3 4 5 6 7
x. I am familiar with this restaurant brand. 1 2 3 4 5 6 7
y. I can recognize this brand among other restaurant brands.
1 2 3 4 5 6 7
z. This brand has an attractive logo. 1 2 3 4 5 6 7
a2. I like the logo of the brand. 1 2 3 4 5 6 7
b2. I like the colours of building or interior. 1 2 3 4 5 6 7
c2. I feel good when I see a positive report in the media about this brand.
1 2 3 4 5 6 7
d2. I am interested in what others think about this brand
1 2 3 4 5 6 7
e2. When someone praises this brand, it feels like a personal compliment
1 2 3 4 5 6 7
Strongly
Disagree
Neutral
Strongly
Agree

-353-
Q9. Directions: The following are statements regarding the restaurant brand that you
selected in section A. Please rate the extent to which you agree or disagree with the
statement using the 7 point scale. Rating 7 means you ―strongly agree‖ and 1 means
―strongly disagree‖.
Statement
a. This brand is trustworthy. 1 2 3 4 5 6 7
b. This brand is reputable. 1 2 3 4 5 6 7
c. This brand makes honest claims. 1 2 3 4 5 6 7
d. This brand has a long lasting reputation 1 2 3 4 5 6 7
e. In the past, today and in the future, the value behind this brand will not change.
1 2 3 4 5 6 7
Q10. Directions: The following are statements regarding the restaurant brand that you
selected in section A. Please rate the extent to which you agree or disagree with the
statement using the 7 point scale. Rating 7 means you are ―strongly agree‖ and 1 means
―strongly disagree‖.
Statement
a. I say positive things about this restaurant brand to other people.
1 2 3 4 5 6 7
b. I will recommend this restaurant brand to anyone who seeks my advice.
1 2 3 4 5 6 7
c. I would not switch to another restaurant brand, even if I had a problem with the services of this restaurant brand.
1 2 3 4 5 6 7
d. I will revisit this restaurant brand next time.
1 2 3 4 5 6 7
Strongly
Disagree
Neutral
Strongly
Agree
Strongly
Disagree
Neutral
Strongly
Agree

-354-
11. Directions: The following is about way of life and characteristic in a particular society. Please rate the extent to which you agree or disagree with the statement using the 7 point scale. Rating 7 means you are ―strongly agree‖ and 1 means ―strongly disagree‖.
Statement
a. Individuals should sacrifice self-interest for the group that they belong to.
1 2 3 4 5 6 7
b. Individuals should stick with the group even through difficulties.
1 2 3 4 5 6 7
c. Group welfare is more important than individual rewards.
1 2 3 4 5 6 7
d. Group success is more important than individual success.
1 2 3 4 5 6 7
e. Individuals should pursue their goals after considering the welfare of the group.
1 2 3 4 5 6 7
f. Group loyalty should be encouraged even if individual goals suffer.
1 2 3 4 5 6 7
g. It is more important for men to have a professional career than it is for women.
1 2 3 4 5 6 7
h. Men usually solve problems with logical analysis; women usually solve problems with intuition.
1 2 3 4 5 6 7
i. Solving difficult problems usually requires an active forcible approach, which is typical of men.
1 2 3 4 5 6 7
j. There are some jobs that a man can always do better than a woman.
1 2 3 4 5 6 7
k. It is important to have instructions spelled out in detail so that I always know what I‘m expected to do.
1
2
3
4
5
6
7
l. It is important to closely follow instructions and procedures.
1 2 3 4 5 6 7
m. Rules/regulations are important because they inform me of what is expected of me.
1 2 3 4 5 6 7
Strongly
Disagree
Neutral
Strongly
Agree

-355-
Statement
n. Standardized work procedures are helpful.
1 2 3 4 5 6 7
o. Instructions for operations are important. 1 2 3 4 5 6 7
p. People in higher positions should make most decisions without consulting people in lower positions.
1 2 3 4 5 6 7
q. People in higher positions should not ask the opinions of people in lower positions too frequently.
1 2 3 4 5 6 7
r. People in higher positions should avoid social interaction with people in lower positions.
1 2 3 4 5 6 7
s. People in higher positions should not delegate important tasks to people in lower positions.
1 2 3 4 5 6 7
t. People in lower positions should not disagree with decisions made by people in higher positions.
1 2 3 4 5 6 7
u. I am working and saving for the future. 1 2 3 4 5 6 7
v. I am planning and preparing for the future.
1 2 3 4 5 6 7
w. I have all the things I really need to enjoy life.
1 2 3 4 5 6 7
x. My life would be better if I owned certain things I don‘t have.
1 2 3 4 5 6 7
y. I wouldn‘t be any happier if I owned nicer things.
1 2 3 4 5 6 7
z. I‘d be happier if I could afford to buy more things.
1 2 3 4 5 6 7
a2. It sometimes bothers me quite a bit that I can‘t afford to buy all the things I‘d like.
1 2 3 4 5 6 7
Strongly
Disagree
Neutral
Strongly
Agree

-356-
SECTION C: ABOUT YOU: Please tick (√) the box where appropriate. Q12. Gender: □ Male □ Female Q13. Age Group: □ 16-25 □ 36-45 □ 56-65 □ 26-35 □ 46-55 □ Over 65 Q14. Are you? □ Married □ Single Q15. Nationality: __________________
Q16. The highest level of education you attained: □ No Formal Educational Qualification □ Undergraduate Degree
□ GCSE □ Postgraduate Degree
□ A-Level □ Other: _______________ □ GNVQ/NVQ
Q17. Your current occupation: □ Administrative and Secretarial Occupation □ Associate Professional and
Technical Occupation □ Elementary Occupation □ Manager and Senior Official □ Personal Service Occupation □ Process, Plant and Machine Operatives
Q18. Annual personal income before tax:
Thank you for your help.
□ No Income □ £ 35,000 to £ 44,999 □ Less than £ 15,000 □ £ 45,000 to £ 54,999 □ £ 15,000 to £ 24,999 □ Over £55,000
□ £ 25,000 to £ 34,999
□ Professional Occupation □ Retired □ Sales and Customer Service Occupation □ Skilled Trades Occupations □ Student □ Other: _______________

-357-
설문참여자 여러분
저는 영국 옥스포드 브룩스 대학교의 박사과정 학생입니다.
본 연구의 목적은 레스토랑 산업에서 글로벌 브랜드에 관한 한국 소비자들의
인식을 조사하는 것입니다.
이 설문지를 완성하기 위해서는 15분 이상이 걸리지 않을 것이며, 귀하의 의
견은 성공적인 연구를 위하여 매우 소중하게 반영될 것입니다. 제공된 모든
개인 정보는 엄격하게 비밀이 유지될 것이며, 오로지 연구 목적으로서만 사용
될 것입니다.
만약 이 연구와 관련하여 어떠한 질문이 있으시면, 주저하지 마시고 질문하여
주시기 바랍니다. 설문지 작성을 마친 후에는 설문 조사자에게 설문지를 제출
해주십시오.
이 조사를 위해 시간을 내어 참가해 주셔서 감사합니다.
한성호 (Sung Ho Han)
박사과정 (PhD Researcher)
경영대학 (Business School)
옥스포드 브룩스 대학교 (Oxford Brookes University)
Wheatley Campus, Wheatley, Oxford, OX33 1HX, UK
Email: [email protected]

-358-
SECTION A: 귀하와 친숙한 글로벌 레스토랑 브랜드
아래 보기는 한 국가 이상에서 운영되고 있는 글로벌 레스토랑 브랜드의 리스트
입니다. 귀하께서 친숙한 하나의 레스토랑 브랜드를 선택하신 다음, 아래의 질문들
에 답하여 주십시오. 맞거나 틀린 답을 쓰는 것이 아니라는 것에 유의하십시오. 글로벌 레스토랑 브랜드:
Q1. 위의 보기 중 귀하께서 친숙한 레스토랑 브랜드를 답하여 주십시오
______________
Q2. 귀하께서는 이 브랜드를 알게 된 지 얼마나 되셨습니까?
□ 1개월 미만
□ 1개월이상 6개월 이하
□ 7개월이상 12개월 미만
□ 1년에서 3년 사이
□ 3년 이상
Q3. 이 레스토랑에서 식사를 한 적이 있습니까?
□ 예 □ 아니오 (6번 문제부터 답하여 주십시오.)
Q4. 평균적으로, 지난 12개월 동안 이 레스토랑에서 몇 번 식사를 하셨습니까? __
Burger King (버거킹), KFC (케이에프씨), McDonald‘s (맥도날드), Pizza Hut (피자헛),
TGI Friday‘s (티지아이 프라이데이), Domino‘s Pizza (도미노 피자), Starbucks (스타벅
스), Subway (섭웨이)

-359-
Q5. 이 레스토랑을 방문하는 주된 목적은 무엇입니까? 한 가지 답에만 표시(√) 해
주십시오.
□ 사업
□ 축하 이벤트 (졸업식, 생일 등)
□ 식사
□ 분위기를 즐기기 위함
□ 시간절약
□ 교제
□ 기타 (기재하여 주십시오.) ______________
Q6. 어떤 유형의 판매촉진이 귀하로 하여금 가장 이 레스토랑을 생각나게
합니까? 한가지 답에만 표시(√) 해 주십시오.
□ 인터넷 □ 잡지 □ 신문 □ 라디오 □ 광고 간판 □ 구전
□ 텔레비전 □ 전단지
Q7. 다음 중 이 브랜드의 강점은 무엇입니까? 한 가지 답에만 표시(√) 해
주십시오.
□ 접근성 (위치와 많은 지점)
□ 어린이를 위한 시설
□ 청결함
□ 직원의 능력
□ 편리성(시간 절약)
□ 위생
□ 음식의 품질
□ 적절한 가격
□ 특별한 판매촉진(쿠폰, 포인트 카드 등)
□ 규격화된 메뉴와 시설
□ 넓은 내부공간

-360-
Section B: Section A에서 선택한 글로벌 레스토랑 브랜드에 관한 전체적인 이미지
Q8. 다음의 질문들은 Section A에서 귀하께서 선택한 레스토랑 브랜드에 관한 것입니
다. 다음의 질문에 어느 정도 동의하는지 또는 동의하지 않는지를 답하여 주십시오. 7
은 ―매우 동의함‖을 의미하며, 1은 ―매우 동의하지 않음‖을 의미합니다.
질문
a. 이 브랜드는 레스토랑 서비스에 대한
나의 기대를 만족시킨다.
1 2 3 4 5 6 7
b. 나는 이 브랜드가 서비스 불만족 문
제를 해결해 줄 수 있다고 믿는다.
1 2 3 4 5 6 7
c. 이 브랜드는 만족을 보장한다.
1 2 3 4 5 6 7
d. 나는 이 브랜드에 신뢰를 가진다. 1 2 3 4 5 6 7
e. 나는 이 레스토랑에서 식사를 할 때
기분이 좋다.
1 2 3 4 5 6 7
f. 이 레스토랑 브랜드는 나를 행복하게
만든다.
1 2 3 4 5 6 7
g. 이 레스토랑 브랜드는 나에게 기쁨을
준다.
1 2 3 4 5 6 7
h. 이 레스토랑은 맛있는 음식을 제공한
다.
1 2 3 4 5 6 7
i. 이 레스토랑 브랜드는 위생기준에 맞
게 음식과 음료수를 준비한다.
1 2 3 4 5 6 7
j. 이 레스토랑은 신선한 음식을 제공한
다.
1 2 3 4 5 6 7
k. 이 브랜드의 장식은 세세한 데까지
주의를 끌만큼 아름답게 꾸며져 있
다.
1 2 3 4 5 6 7
l. 이 레스토랑은 청결하고 깔끔한 환경
을 제공한다.
1 2 3 4 5 6 7
m. 이 레스토랑은 편안한 의자와 테이블
을 제공한다.
1 2 3 4 5 6 7
매우동의
하지않음
보통
매우
동의함

-361-
질문
n. 이 브랜드의 직원들은 친절하며 도움
을 준다.
1 2 3 4 5 6 7
o. 이 레스토랑의 직원들은 내가 무엇을
원하는지 잘 알고 있는 것처럼 보인
다.
1 2 3 4 5 6 7
p. 직원들은 나의 말에 귀를 기울인다.
1 2 3 4 5 6 7
q. 이 브랜드의 직원들은 능력이 있으며
타고난 전문성을 보여준다.
1 2 3 4 5 6 7
r. 이 브랜드에서 식사를 하는 고객들은
현재의 나와 같은 타입(유형)이라는
것을 보여준다.
1 2 3 4 5 6 7
s. 이 브랜드에서 식사를 하는 고객들은
나와 매우 유사하다.
1 2 3 4 5 6 7
t. 이 브랜드에서 식사를 하는 고객들은
내가 되고 싶은 유형의 이미지를 보여
준다.
1 2 3 4 5 6 7
u. 이 브랜드에서 식사를 하는 고객들은
내가 존경하는 사람과 매우 유사하다.
1 2 3 4 5 6 7
v. 나는 이 브랜드를 잘 알고 있다. 1 2 3 4 5 6 7
w. 내가 레스토랑에 대해 생각할 때 이
브랜드는 머리에 떠오르는 브랜드들
중의 하나다.
1 2 3 4 5 6 7
x. 나는 이 레스토랑 브랜드와 친숙하다. 1 2 3 4 5 6 7
y. 나는 다른 레스토랑 브랜드들 사이에
서 이 브랜드를 인식할 수 있다.
1 2 3 4 5 6 7
z. 이 브랜드는 매력적인 로고를 가지고
있다.
1 2 3 4 5 6 7
a2. 나는 이 브랜드의 로고를 좋아한다. 1 2 3 4 5 6 7
b2. 나는 이 브랜드의 건물색깔이나 내
부장식을 좋아한다.
1 2 3 4 5 6 7
매우동의
하지않음
보통
매우
동의함

-362-
Q9. 다음의 질문들은 Section A에서 귀하께서 선택한 레스토랑 브랜드에 관한 것입니
다. 다음의 질문에 어느 정도 동의하는지 또는 동의하지 않는지를 답하여 주십시오. 7
은 ―매우 동의함‖을 의미하며, 1은 ―매우 동의하지 않음‖을 의미합니다.
질문
a. 이 브랜드는 신뢰할만한 가치가
있다.
1 2 3 4 5 6 7
b. 이 브랜드는 평판이 좋다.
1 2 3 4 5 6 7
c. 이 브랜드는 정직함만을 말한다. 1 2 3 4 5 6 7
d. 이 브랜드는 오랫동안 지속적으로 명
성을 가지고 있다.
1 2 3 4 5 6 7
e. 과거, 현재 그리고 미래에도 이 브랜
드의 가치는 변하지 않을 것이다.
1 2 3 4 5 6 7
질문
c2. 나는 이 브랜드에 관한 대중매체의
긍정적인 보도를 볼 때 기분이 좋다.
1 2 3 4 5 6 7
d2. 나는 이 브랜드에 대한 다른 사람들
의 의견에 관심이 있다.
1 2 3 4 5 6 7
e2. 다른 누군가가 이 브랜드를 칭찬할
때 마치 내가 칭찬을 받는 것처럼
느껴진다.
1 2 3 4 5 6 7
매우동의
하지않음
보통
매우
동의함
매우동의
하지않음
보통
매우
동의함

-363-
Q10. 다음의 질문들은 Section A에서 귀하께서 선택한 레스토랑 브랜드에 관한 것입니
다. 다음의 질문에 어느 정도 동의하는지 또는 동의하지 않는지를 답하여 주십시오. 7
은 ―매우 동의함‖을 의미하며, 1은 ―매우 동의하지 않음‖을 의미합니다.
질문
a. 나는 다른 사람들에게 이 브랜드에
대하여 긍정적으로 말한다.
1 2 3 4 5 6 7
b. 나에게 조언을 구하는 어떤 사람에게
이 브랜드를 추천할 것이다..
1 2 3 4 5 6 7
c. 비록 이 브랜드의 서비스에 문제가
생기더라도 나는 다른 브랜드로 바
꾸지 않을 것이다.
1 2 3 4 5 6 7
d. 나는 다음에도 이 브랜드를 방문할
것이다.
1 2 3 4 5 6 7
Q11. 아래 질문은 특정사회 안에서의 생활방식과 특징에 관한 것 입니다. 다음의 질
문에 어느 정도 동의하는지 또는 동의하지 않는지를 답하여 주십시오. 7은 ―매우 동의
함‖을 의미하며, 1은 ―매우 동의하지 않음‖을 의미합니다.
질 문
a. 개인은 그들이 속한 집단을 위해 자
신의 이익을 희생해야만 한다.
1 2 3 4 5 6 7
b. 개인들은 각자의 어려움을 감수하더
라도 단체(그룹)에 충실하여야 한다
1 2 3 4 5 6 7
c. 집단에 대한 복지는 개인에 대한 보
상보다 더 중요하다.
1 2 3 4 5 6 7
d. 집단의 성공은 개인의 성공보다 더
중요하다.
1 2 3 4 5 6 7
매우동의
하지않음
보통
매우
동의함
매우동의
하지않음
보통
매우
동의함

-364-
질문
e. 개인은 집단의 번영을 고려한 후에
자신의 목표를 추구해야 한다.
1 2 3 4 5 6 7
f. 집단에 대한 충성은 비록 개인의 목표
와는 어긋나더라도 장려 되어져야만
한다.
1 2 3 4 5 6 7
g. 남성들이 전문적인 경력을 가지는 것
은 여성들이 전문적인 경력을 가지는
것보다 더 중요하다.
1 2 3 4 5 6 7
h. 남성들은 대개 논리적인 분석으로 문
제를 해결하지만, 여성들은 대개 직
관적으로 문제를 해결한다.
1 2 3 4 5 6 7
i. 어려운 문제를 해결하기 위해서는 언
제나 적극적이고, 강압적 접근법이 요
구되는데, 이것은 남성들의 전형적 방
법이다.
1 2 3 4 5 6 7
j. 남성이 여성 보다 항상 더 잘하는 일
부 직업들이 있다.
1 2 3 4 5 6 7
k. 내가 무엇을 해야 하는지 잘 인식할
수 있도록 자세히 설명되어 있는 안내
서를 가지는 것은 중요하다.
1 2 3 4 5 6 7
l. 사용 설명서와 절차를 충실히 따르는
것이 중요하다.
1 2 3 4 5 6 7
m. 규칙/규율은 내가 무엇을 해야 하는
지를 알려주기 때문에 매우 중요하
다.
1 2 3 4 5 6 7
n. 표준화된 작업 절차들은 도움이 된다. 1 2 3 4 5 6 7
o. 사용설명서는 중요하다. 1 2 3 4 5 6 7
p. 보다 높은 지위에 있는 사람들은 보
다 낮은 지위의 사람들과 의논하지
않고 대부분의 결정을 한다.
1 2 3 4 5 6 7
매우동의
하지않음
보통
매우
동의함

-365-
질 문
q. 보다 높은 지위에 있는 사람들은 보
다 낮은 지위의 사람들에게 의견을
너무 자주 물어서는 안된다.
1 2 3 4 5 6 7
r. 보다 높은 지위에 있는 사람들은 보
다 낮은 지위의 사람들과 교제를 피
해야만 한다.
1 2 3 4 5 6 7
s. 보다 높은 지위의 사람들은 보다 낮
은 지위의 사람들에게 중요한 임무
를 위임해서는 안된다.
1 2 3 4 5 6 7
t. 보다 낮은 지위에 있는 사람들은 보
다 높은 지위에 있는 사람들이 만든
결정에 다른 의견을 제기해서는 안
된다.
1 2 3 4 5 6 7
u. 나는 미래를 위해 일하고 저축한다.
1 2 3 4 5 6 7
v. 나는 미래를 계획하고 준비한다. 1 2 3 4 5 6 7
w. 나는 인생을 즐기기 위해 필요한 모
든 것을 가지고 있다.
1 2 3 4 5 6 7
x. 만일 내가 가지지 못한 어떤 것을 가
진다면 나의 인생은 더 좋을 것이다.
1 2 3 4 5 6 7
y. 만일 더 좋은 것들을 가지더라도 나
는 더 행복하지 않을 것이다.
1 2 3 4 5 6 7
z. 만일 더 많은 것을 구매 할 수 있다
면 나는 더 행복할 것이다.
1 2 3 4 5 6 7
a2. 내가 좋아하는 모든 것을 구매 할
수 없는 것은 때때로 나를 조금 짜
증나게 한다.
1 2 3 4 5 6 7
매우동의
하지않음
보통
매우
동의함

-366-
SECTION C: 당신을 가장 적절하게 설명하는 답에 표시(√) 해 주십시오.
Q12. 성별: □ 남성 □ 여성
Q13. 연령
Q14. 결혼여부: □ 기혼 □ 미혼
Q15. 국적: __________________ Q16. 귀하의 최종 학력: □ 정규교육기관 미이수 □ 대졸 □ 중졸 □ 대학원졸 □ 고졸 □ 기타 ( ) □ 전문대졸 Q17. 귀하의 현재 직업: □ 행정직 및 비서직 □ 전문직(의사, 변호사, 약사 등) □ 준 전문직 및 기술직 □ 은퇴 □ 단순직 □ 판매직 또는 서비스직 □ 관리직 또는 고위 공무원 □ 숙련직 □ 프리랜서 □ 학생 □ 기능직(직역: 공정, 공장 및 기계직)
□ 기타 _______________
Q18. 납세 이전의 평균 연 수입: □ 무수입 □ 3000만원 미만 □ 3000만원 이상 5000만원 미만 □ 5000만원 이상 7000만원 미만
설문에 답하여 주셔서 대단히 감사합니다
□ 만16-25 □ 만36-45 □ 만56-65 □ 만26-35 □ 만46-55 □ 만66세 이상
□ 7000만원 이상 9000만원 미만 □ 9000만원 이상 1억원 미만 □ 1억원 이상

-367-
REFERENCES

-368-
Aaker, D.A. (1991) Managing Brand Equity: Capitalizing on the Value of a Brand Name. New York: The Free Press. Aaker, D.A. (1992) The Value of Brand Equity, Journal of Business Strategy, 13(4), 27-31. Aaker, D.A. (1996a) Building Strong Brand, New York: The Free Press. Aaker, D.A. (1996b) Measuring Brand Equity Across Products and Markets, California Management Review, 38(3), 102-120. Aaker, D.A. and Keller, K.L. (1990) Consumer Evaluations of Brand Extensions, Journal of Marketing, 54 (January), 27-41. Aaker, D.A., Kumar, V. and Day, G.S. (2004) Marketing Research, New York: John Wiley & Sons. Aaker, J.L. (1997) Dimensions of Brand Personality, Journal of Marketing Research, 347-356. Abimbola, T. and Vallaster, C. (2007) Brand, Organizational Identity and Reputation in SMEs: An Overview, Qualitative Market Research: An International Journal, 10(4), 341-348. Adler, P. and Adler, P.A. (1987) Role Conflict and Identity Salience: College Athletics and the Academic Role, Social Science Journal, 24(4), 443-455. Afzal, H., Khan, M.A., Rehman, K., Ali, I. and Wajahat, S. (2010) Consumer Trust in the Brand: Can it Be Built through Brand Reputation, Brand Competence and Brand Predictability, International Business Research, 3(1), 43-49. Ahearne, M., Bhattacharya, C.B. and Gruen, T. (2005) Antecedents and Consequences of Customer-Company Identification: Expanding the Role of Relationship Marketing, Journal of Applied Psychology, 90 (3), 574-585. Akerlof, G.A. and Kranton R.E. (2000) Economics and identity, Quarterly Journal of Economics, 115(3), 715-753.

-369-
Alexandris, K., Dimitriadis, N. and Markata, D. (2002) Can Perceptions of Service Quality Predict Behavioral Intentions? An Exploratory Study in the Hotel Sector in Greece, Managing Service Quality, 12(4), 224-231. Alexandris, K., Douka, S., Papadopoulos, P. and Kaltsatou, A (2008) Testing the Role of Service Quality on the Development of Brand Associations and Brand Loyalty, Managing Service Quality, 18(3), 239-254. Alexandris, K., Zahariadis, P., Tsorbatzoudis, C. and Grouios, G. (2004) An Empirical Investigation into the Role of the Outcome Dimension in Measuring Perceived Service Quality in Health Club Context, International Journal of Sport Management, 5(3), 281-294. Allen, N.J. and Meyer, J.P. (1990) The Measurement and Antecedents of Affective, Continuance and Normative Commitment to the Organization, Journal of Occupational Psychology, 63(1), 1-18. Ambler, T. (1997) How Much of Brand Equity Is Explained By Trust? Management Decision, 35(4), 283-292. Ambler, T. and Styles, C. (1996) Brand Development versus New Product Development: Towards a Process Model of Extension Decisions, Marketing Intelligence and Planning, 14(7), 10-19. Amiot, C.E. and Bourhis, R.Y. (2005) Ideological Beliefs as Determinants of Discrimination in Positive and Negative Outcome Distributions, European Journal of Social Psychology, 35, 581-598. Amstrong, K.L. (2001) Self and Product Image Congruency among Male and Female Minor League Ice Hokey Spectators: Implication for Women‘s Consumption of Professional Men‘s Sports, Women in Sport & Physical Activity Journal, 10(2), 1-28. Anderson, P.F. and Bennett, P.D. (1988) Dictionary of Marketing Terms, Chicago: The American Marketing Association
-370-
Andreassen, T.W. (1994) Satisfaction, Loyalty and Reputation as Indicators of Customer Orientation in the Public Sector, International Journal of Public Sector Management,7(2), 16-34. Andreassen, W. and Lindestad, B. (1997) Consumer Loyalty and Complex Service: The Impact of Corporate Image on Quality, Consumer Satisfaction and Loyalty for Consumers with Varying Degrees of Service Expertise, International Journal of Service Industry Management, 8(4), 7-23. Ang, Z. and Massingham, P. (2007) National Culture and the Standardization Verse Adaption of Knowledge Management, Journal of Knowledge Management, 11(2), 5-21 Anselmsson, J., Johansson, U. and Persson, N. (2007) Understanding Price Premium for Grocery Products: A Conceptual Model of Customer-Based Brand Equity, Journal of Product & Brand Management, 16(6), 401-414. Armstrong, S., Allinson, C.W. and Hayes, J. (1997) The Implications of Cognitive Style for the Management of Student-Supervisor Relationships, Educational Psychology, 17(1-2), 209-217. Arrow, K.J. (1973) Information and Economic Behaviour, Stockholm: Federation of Swedish Industries. Ashforrth, B.E. and Mael, F. (1989) Social Identity Theory and the Organization, Academy of Management Review, 14(1), 20-39. Atilgan, E., Aksoy, S. and Akinci, S. (2005) Determinants of the Brand Equity: A Verification Approach in the Beverage Industry in Turkey, Marketing Intelligence and Planning, 23(3), 237-248. Azevedo, A. and Farhangmehr, M. (2005) Clothing Branding Strategies: Influence of Brand Personality of Advertising Response, Journal of Textile and Apparel Technology and Management, 4(3), 1-13.

-371-
Back, K.J. (2005) The Effect of Image Congruence on Customers‘ Brand Loyalty in the Upper Middle-Class Hotel Industry, Journal of Hospitality and Tourism Research, 29(4), 448-467. Back, K.J. and Parks, S.C. (2003) A Brand Loyalty Model Involving Cognitive, Affective, and Conative Brand Loyalty and Customer Satisfaction, Journal of Hospitality & Tourism Research, 27(4), 419-435. Bagozzi, R.B. and Dholakia, U.M. (2006) Antecedents and purchase consequences of customer participation in small group brand communities, International Journal of Research in Marketing, 23, 45-61. Bagozzi, R.P. (1978) The Construct Validity of the Affective, Behavioral, and Cognitive Components of Attitude by Analysis of Covariance Structures, Multivariate Behavioural Research, 13, 9-31. Bailey, R. and Ball, S. (2006) An Exploration of the Meanings of Hotel Brand Equity, The Service Industries Journal, 26(1), 15-38. Baldauf, A., Cravens, K.S. and Binder, G. (2003) Performance Consequences of Brand Equity Management: Evidence from Organizations in the Value Chain, Journal of Product & Brand Management, 12(4), 220-236. Baligh, H.H. (1994) Components of Culture: Nature, Interconnections, and Relevance to the Decisions on the Organization Structure, Management Science, 40(1), 14-27. Balmer, J.M.T. and Liao, M.N. (2007) Student Corporate Brand Identification: An Exploratory Case Study, Corporate Communications, An International Journal, 12(4), 356-375. Baloglu, S. (2002) Dimensions of Customer Loyalty: Separating Friends from Well Wishers, Cornell Hotel & Restaurant Administration Quarterly, 43, 47-59. Bamert, T. and Wehrli, H.P. (2005) Service Quality as an Important Dimensions of Brand Equity in Swiss Services Industries, Managing Service Quality, 15(2), 132-141.

-372-
Bandyopadhyay, S. and Martell, M. (2007) Does Attitudinal Loyalty Influence Behavioral Loyalty? Journal of Retailing and Services, 14, 35-44. Banerjee, S. (2008) Dimensions of Indian Culture, Core Cultural Values and Marketing Implications: An analysis, Cross Cultural Management: An International Journal, 15(4), 376. Barwise, P. (1993) Brand Equity Snark or Boojum? International Journal of Research in Marketing, 10, 93-104. Beatty, S.E. and Kahle, L.R. (1988) Alternative Hierarchies of the Attitude-Behaviour Relationship: The Impact of Brand Commitment and Habit, Journal of Academic Marketing Science, 16(2), 1-10. Belk, R.W. (1984) Three Scales to Measure Constructs Related to Materialism: Reliability, Validity, and Relationships to Measures of Happiness, Advances in Consumer Research, 11(1), 291-297. Bennett, R. and Rundle-Thiele, S. (2002) Measuring Attitudinal Brand Loyalty, Journal of Brand Management, 9(3), 193-209. Bennett, R. and Rundle-Thiele, S. (2004) Customer Satisfaction Should Not Be the Only Goal, Journal of Services Marketing, 18(7), 514-523. Bergami, M and Bagozzi, R.P. (2000) Self-Categorization, Affective Commitment and Group Self-Esteem as Distinct Aspects of Social Identity in the Organization, British Journal of Social Psychology, 39, 555-577. Berry, L.L. (1993) Relationship Marketing, in Berry, L.L., Shostack, G.L. and Dupah, G. (eds.), Emerging Perspectives on Services Marketing, Chicago: AMA. Berry, L.L. (2000) Cultivating Service Brand Equity, Journal of the Academy of Marketing Science, 28(1), 128-137. Berry, L.L., lefkowith, E.F. and Clark, T. (1988) In Services, What‘s in a name? Harvard Business Review, 28-30.

-373-
Berry, L.L and Parasuraman, A. (1991) Marketing Services. New York: The Free Press. Bhattacharya, C.B. and Rao, H. and Glynn, M.A. (1995) Understanding the Bond of Identification: An Investigation of Its Correlates among Art Museum Members, Journal of Marketing, 59, 46-57. Bhattacharya, C.B. and Sen, S. (2003) Consumer-Company Identification: A Framework for Understanding Consumers‘ Relationships with Companies, Journal of Marketing, 67, April, 76-88. Bhradwaj, S.G., Varadarajan, R.P. and Fahy, J. (1993) Sustainable Competitive Advantage in Service Industries: A Conceptual Model and Research Propositions, Journal of Marketing, 57, 83-99. Bitner, M.J. (1992) Servicescapes: The Impact of Physical Surrounding on Consumers and Employees, Journal of Marketing, 56, 72-93. Black, J.S. and Mendenhall, M. (1989) A Practical But Theory-based Framework for Selecting Cross-Cultural Training Methods, Human Resource Management, 28(4), 511-539. Blackston, M. (1992) A Brand with an Attitude: A Suitable Case for the Treatment, Journal of the Market Research Society, 34(3), 231-241. Blackwell, R.J. Miniard, P.W. and Enrgel, J.F. (2007) Consumer Behavior, (9th ed.), London: Thomson Press. Blattberg, R.C. and Sen, S.K. (1974) Market Segmentation Using Models of Multidimensional Purchasing Behavior, Journal of Marketing, 38(4), 20-28. Blodgett, J.G., Bakir, A. and Rose, G.M. (2008) A Test of the Validity of Hofstede‘s Cultural Framework, Journal of Consumer Marketing, 25(6), 339-349. Blumberg, B., Cooper, D.R. and Schindler, P.S. (2005) Business Research Methods. London: McGraw-Hill Education.

-374-
Bosnjak, M. and Rudolph, N. (2008) Undesired Self-image Congruence in a Low-Involvement Product Context, European Journal of Marketing, 42(5/6), 702-712. Bowen, D. (2008) Consumer Thoughts, Actions, and Feelings from within the Service Experience, The Service Industries Journal, 28(10). Bowen, J.T. and Chen, S.L. (2001) relationship between Customer Loyalty and Customer Satisfaction, International Journal of Contemporary Hospitality Management, 13(5), 213-217. Bowie, D. and Buttle, F. (2004) Hospitality Marketing: Principles and Practice, (1st ed.), Oxford: Elsevier Ltd. Brace, N., Kemp, R. and Snelgar, R. (2006) SPSS for Psychologist: A Guide to Data Analysis Using SPSS for Windows, London: Palgrave. Brady, M.K., Bourdeau, B.L. and Heskel, J. (2005), The Importance of Brand Cues in Intangible Service Industries: An Application to Investment Services, Journal of Services Marketing, 19(6), 401-410. Brady, M. K. and Cronin Jr, J.J. (2001) Some New Thoughts on Conceptualizing Perceived Service Quality: A Hierarchical Approach, Journal of Marketing, 65(3), 34-49. Breckler, S. (1984) Empirical Validation of Affect, Behavior, and Cognition as Distinct Components of Attitude, Journal of Personality & Social Psychology, 47, 1191-1205. Brown, A. (1995) Organizational Culture, Pitman Publishing, London. Brown, G.H. (1952) Coffee Buyers Loyal to Brands, Yet Two-Thirds Buy Four or More Brands in a Year, Advertising Age, 55-56. Brown, R., Condor, S., Mathews, A., Wade, G. and Williams, J. (1986) Explaining Intergroup Differentiation in an Industrial Organization, Journal of Occupational Psychology, 59, 273-286.

-375-
Browne, B.A. and Kaldenberg, D.O. (1997) Conceptualizing Self-Monitoring: Links to Materialism and Product Involvement, Journal of Consumer Marketing, 14(1), 31-44. Buil, I., Chernatony, L. de and Martinez, E. (2008) A Cross-National Validation of the Consumer-Based Equity Scale, Journal of Product and Brand Management, 17(6), 384-392. Butler, J.K. (1991) Toward Understanding and Measuring Conditions of Trust: Evolution of a Conditions of Trust Inventory, Journal of Management, 17(3), 643-663. Buttle, F.A. (1995) What Future SERVQUAL, Proceedings of the 24th European Marketing Academy Conference, 211-230. Camara, N.D. (2007) Brand and Reputation: Equals or Opposites? Henley Manager Update, 18(3), 11-18. Cameron, J.E. and Lalonde, R.N. (2001) Social identification and gender-related ideology in women and men, British Journal of Social Psychological Society, 40, 59-77. Caminiti, S. (1992) The Payoff from a Good Reputation, Fortune, 125(3), 49-53. Capon, N., Berthon, J.P., Hulbert, J. and Pitt, L. (2001) Brand Custodianship: A New Primer for Senior Managers, European Management, 19(3), 215-227. Caprara, G.V., Barbaranelli, C. and Guido, G. (2001) Brand Personality: How To Make the Metaphor Fit? Journal of Economic Psychology, 22, 377-395. Carlson, B.D., Donavan, D.T. and Cumiskey, K.J. (2009) Consumer-Brand Relationships in Sport: Brand Personality and Identification, International Journal of Retail & Distribution Management, 37(4), 370-384. Carman, J.M. (1990) Consumer Perceptions of Service Quality: An Assessment of the SERVQUAL Dimensions, Journal of Retailing, 66(1), 33-55.

-376-
Caruana, A. (1997) Corporate Reputations: Concept and Measurement, The Journal of Product and Brand Management, 6(2), 109-118. Caruana, A. and Malta, M. (2002) Service Loyalty: The Effects of Service Quality and the Mediating Role of Customer Satisfaction, European Journal of Marketing, 36(7/8), 811-828. Cateora, P.R. and Graham, J.L. (2005) International Marketing (11th ed.), New York: The McGraw-Hill Companies, Inc. Chandy, P.R. and Williams, T.G.E. (1994) The Impact of Journals and Authors on International Business Research: A Citation Analysis of JIBS articles, Journal of International Business Studies, 25(4), 715-728. Chaudhuri, A. (1999) Does Brand Loyalty Mediate Brand Equity Outcomes?, Journal of Marketing Theory and Practice, Spring, 136-146. Chaudhuri, A. and Holbrook, M.B. (2001) The Chain of Effects from Brand Trust and Brand Affect to Brand Performance: The Role of Brand Loyalty, Journal of Marketing, 65(2), 81-93. Cheema, A. (2008) Surcharges and Seller Reputation, Journal of Consumer Research, 35, June, 167-177. Chen, A.C.H. (1996) The Measurement and Building of Customer-Based Brand Equity, PhD Dissertation, National Chenchi University in Taiwan. Chen, A.C.H. (2001) Using Free Association to Examine the Relationship between the Characteristics of Brand Associations and Brand Equity, Journal of Product & Brand Management, 10(7), 439-451. Chen, H.L. (2007) Grey Marketing and Its Impacts on Brand Equity, Journal of Product and Brand Management, 16(4), 247-256.

-377-
Chen, J.S., Ekinci, Y., Riley, M., Yoon, Y. and Tjelflaat, S. (2001) What Do Norwegians Think of US Lodging Services? International Journal of Contemporary Hospitality Management, 13(6), 280-284. Chenet, P., Tynan,C. and Money, A. (1999) Service Performance Gap: Re-Evaluation and Redevelopment, Journal of Business Research, 46, 133-147.
Chernatony, L.D. (1999) Brand Management through Narrowing the Gap Between Brand Identity and Brand Reputation, Journal of Marketing Management, 15, 157-179 Chetthamrongchai, P. (2010) Revalidating Two Measures of Reputation on Thailand, Corporate Reputation Review, 13(3), 209-219. Chitty, B., Ward, S., and Chua, C. (2007) An Application of the ECSE Model as a Predictor of Satisfaction and Loyalty for Backpacker Hostels, Marketing Intelligence & Planning, 25(6), 563-580. Chowdhary, N. and Prakash, M. (2007) Prioritizing Service Quality Dimensions, Managing Service Quality, 17(5), 493-509. Chun, R., (2005) Corporate reputation: Meaning and measurement, International Journal of Management Reviews, 7 (2), 91-109.
Churchill, G.A. (1979) Marketing Research: Methodological Foundations. Hinsdale, Illinois. Clarke, A. and Chen, W. (2007) International Hospitality Management, Oxford: Elsevier. Collis, J. and Hussey, R. (2009) Business Research: A Practical Guide for Undergraduate and Postgraduate Students (3rd ed.), New York: Palgrave McMillan. Cornelissen, J.P. (2004) Corporate Communications: Theory and Practice, London, GBR: Sage Publications, Ltd.

-378-
Cravens, D.W. and Piercy, N.F. (2006) Strategic Marketing, New York: Mc-Graw Hill. Craig, C.S., and Douglas, S.P. (2006) Beyond National Culture: Implications of Cultural Dynamics for Consumer Research, International Marketing Review, 23(3), 322-342. Creswell, J.W. (1994) Research Design: Qualitative and Quantitative Approaches, Thousand Oaks, California: Sage. Creswell, J.W. (1998) Qualitative Inquiry and Research Design: Choosing Among Five Approaches, Thousand Oaks, CA: Sage. Cretu, A.E., and Brodie, R.J. (2007) The Influence of Brand Image and Company Reputation Where Manufacturers Market to Small Firms: A Customer Value Perspective, Industrial Marketing Management 36, 230-240. Cronin, J.J. and Taylor, S.A. (1992) Measuring Service Quality: A Reexamination and Extension, Journal of Marketing, 56(3), 55-68. Crouch, G.I. and Louviere, J.J. (2004) The Determinants of Convention Site Selection: A Logistic Choice Model from Experimental Data, Journal of Travel Research, 1108-1130. Cunningham, R.M. (1956) Brand Loyalty- What, Where, How Much?, Harvard Business Review, 34(1), 116-128. Dabholkar, P.A., Thorpe, D.I. and Rentz, J.O. (1996) A Measure of Service Quality for Retail Stores: Scale Development and Validation, Journal of the Academy of Marketing Science, 24, 3-16. Dacin, P.A. and Smith, D.C. (1994) The Effect of Brand Portfolio Characteristics on Consumer Evaluations of Brand Extensions, Journal of Marketing Research, 31, 229-242. Dalton, J. and Croft, S. (2003) Managing Corporate Reputation: The New Currency. London: Thorogood.

-379-
Dash, S., Bruning, E. and Acharya, M. (2009) The Effect of Power Distance and Individualism on Service Quality Expectations in Banking, International Journal of Bank Marketing, 27(5), 336-358. Dash, S., Bruning, E. and Guin, K.K. (2009) A Cross-Cultural Comparison of Individualism‘s Moderating Effect on Bonding and Commitment in Banking Relationships, Marketing Intelligence & Planning, 27(1), 146-169. Davies, G. and Miles, L. (1998) Reputation management: Theory versus practice, Corporate Reputation Review, 2(1), 16-27. Davies, G., Chun, R., Da Silva, R.V. and Roper, S. (2003) Corporate Reputation and Competitiveness, UK: Routledge. Davis, S. (2002) Brand Asset Management: How Business Can Profit from the Power of Brand, Journal of Consumer Marketing, 19(4), 351-358. Day, G.S. (1969) A Two-Dimensional Concept of Brand Loyalty, Journal of Advertising Research, 9(3), 29-35. De Chernatony, L. and Dall‘Olmo Riley, F. (1997) Brand Consultants‘ Perspective on the Concept of ‗the Brand‘, Marketing and Research Today, 45-51. Dean, D.H. (2004) Evaluating Potential Brand Associations through Conjoint Analysis and Market Simulation, Journal of Product & Brand Management, 13(7), 506-513. Dekimpe, M.G., Steenkamp, J-B. E.M., Mellens, M. and Abeele, P.V. (1997) Decline and variability in brand loyalty, International Journal of Research in Marketing, 14(5), 405-420. Del Río, A.B., Vazquez, R. and Iglesias, V. (2001) The Effect of Brand Associations on Consumer Response, Journal of Consumer Marketing, 18(5), 410-425. Delaney, J., Burke, P.F. and Gudergan, S. (2005) National Culture, Materialism and Consumption Behaviour, ANZMAC 2005 Conference, Marketing in International and Cross-Cultural Environments, 21-27.

-380-
Delgado-Ballester, E. (2004) Applicability of a Brand Trust Scale across Product Categories: A Multigroup Invariance Analysis, European Journal of Marketing, 38(5/6), 573-596. Delgado-Ballester, E. and Munuera-Alemán, J.L. (2001) Brand Trust in the Context of Consumer Loyalty, European Journal of Marketing, 35(11/12), 1238-1258. Delgado-Ballester, E. and Munuera-Aleman, J.L. (2005) Does Brand Trust Matter to Brand Equity? Journal of Product and Brand Management, 14(3), 187-196. Delgado-Ballester, E., Munuera, J.L. and Yagüe, M.J. (2003) Development and Validation of a Brand Trust Scale, International Journal of Market Reserach, 45(1), 35-54. DelVecchio, D. (2000) Moving Beyond Fit: The Role of Brand Portfolio Characteristics in Consumer Evaluations of Brand Reliability, Journal of Product & Brand Management, 9(7). Dey, I. (1993) Qualitative Data Analysis, London: Routledge. Dick, A. and Basu, K. (1994) Customer Loyalty: Towards an Integrated Conceptual Framework, Journal of Academy of Marketing Science 22(2), 99-113. Donavan, D.T., Janda, S. and Suh, J. (2005) Environmental Influences in Corporate Brand Identification and Outcomes, Brand Management, 14(1/2), 125-136. Doney, P.M. and Cannon, J.P. (1997) An Examination of the Nature of Trust in Buyer-Seller Relationships, Journal of Marketing, 61(2), 35-51. Donthu, N. and Yoo, B. (1998) Cultural Influences on Service Quality Expectations, Journal of Service Research, 1, 178-85. Doole, I. and Lowe, R. (2008) International Marketing Strategy (5th edition), London: Cengage Learning EMEA.

-381-
Dowling, G.R. (1994) Corporate Reputations: Strategies for Developing the Corporate Brand. London:Kogan Page. Dresser, D. and Carns, D. (1969) Sociology the Study of Human Interactions, Yarmouth, ME: Intercultural Press. Dutta, K., Venkatesh, U. and Parsa, H.G. (2007) Service Failure and Recovery Strategies in the Restaurant Sector: An Indo-Us Comparative Study, International Journal of Contemporary Hospitality Management, 19(5), 351-363. Dutton, J.E., Dukerich, J.M. and Harquail, C.V. (1994) Organizational Image and Member Identification, Administrative Science Quarterly, 39(2), 239-263. Dwyer, F.R., Schurr, P.H. and Oh, S. (1987) Developing Buyer-Seller Relationship, Journal of Marketing, 51, 11-27. East, R., Gendall, P., Hammond, K., Lomax, W. (2005) Customer Loyalty: Singular, Additive or Interactive? Australasian Marketing Journal, 13(2), 10-26. Easterby-Smith, M., Thorpe, R. and Lowe, A. (1991) Management Research: An Introduction. London: Sage. Edvardsson, B. (2005) Service Quality: Beyond Cognitive Assessment, Managing Service Quality, 15(2), 127-131. Edwardson, M. (1998) Measuring Emotions in Service Encounters: An Exploratory Analysis, Australasian Journal of Market Research, 6(2), 34-48. Ehrenberg, A.S.C, (1988) Repeat-buying: facts, theory and applications, London: Griffin. Einwiller, S. (2001) The Significance of Reputation and Brand for Creating Trust in the Different Stages of a Relationship between an Online Vendor and its customers, Proceedings of the 8th Research Symposium on Emerging Electronic Markets, September,16, 1-17.

-382-
Ekinci, Y. (2001) The Validation of the Generic Service Quality Dimensions: An Alternative Approach, Journal of Retailing and Consumer Services, 8(6), 311-24. Ekinci, Y. and Riley, M. (2003) An Investigation of Self-Concept: Actual and Ideal Self-Congruence Compared in the Context of Service Evaluation, Journal of Retailing and Consumer Services, 10(4), 201-214. Ekinci, Y., Dawes, P.L. and Massey, G.R. (2008) An Extended Model of the Antecedents and Consequences of Consumer Satisfaction for Hospitality Services, European Journal of Marketing, 42(1/2), 35-68. Ellemers, N., Kortekaas, P. and Ouwerkerk, J.W. (1999) Self–Categorisation, Commitment to the Group and Self Esteem as Related but Distinct Aspects of Social Identity, European Journal of Social Psychology, 29, 371-389. Elliott, R. and Wattanasuwan, K. (1998) Brand as symbolic resources for the construction of identity, International Journal of Advertising, 17(2), 131-144. Elliott, R. and Yannopoulou, N. (2007) The nature of trust in brands: a psychosocial model, European Journal of Marketing, 41(9/10), 988-998. Erdem. T. and Swait. J. (1998) Brand Equity as a Signaling Phenomenon, Journal of Consumer Psychology, 7(2), 131-157. Erdem, T., Swait, J. and Valenzuela, A. (2006) Brands as Signals: A Cross-Country Validation Study, Journal of Marketing, 70, 34-49. Ernst, and Young, (1996) The Ernst & Young International Information Security Survey 1995, Information Management and Computer Security, 4(4), 26-33. Evanschitzky, H. and Wunderlich, M. (2006) An Examination of Moderator Effects in the Four-Stage Loyalty Model, Journal of Service Research, 8(4), 330-345. Evanschitzky, H., Iyer, G.R., Plassmann, H., Niesing, J. and Meffert, H. (2006) The Relative Strength of Affective Commitment in Securing Loyalty in Service Relationships, Journal of Business Research, 59, 1207-1213.

-383-
Fan, Y. (2005) Ethical Branding and Corporate Reputation, Corporate Communications: An International Journal, 10(4), 341-350. Farquhar, P.H. (1989) Managing Brand Equity, Marketing Research, 1, 24-33. Feldwick, P. (1996) Do We Really Need ―Brand Equity‖? The Journal of Brand Management, 4(1), 9-28. Ferle, C.L. and Chan, K. (2008) Determinants for Materialism among Adolescents in Singapore, Young Consumers, 9(3), 201-214. Fernandez, D., Carlson, D., Stepina, L. And Nicholson, J. (1997) Hofstede‘s Country Classification 25 Years Later, The Journal of Social Psychology, 137, 43-54. Ferraro, G.P. (1990) Cultural Dimension of International Business. Englewood Cliffs, New Jersey: Prentice-Hall. Ferris, G.R., Blass, R., Douglas, C., Kolodinsky, R.W., and Treadway, D.C. (2003). Personal Reputation in Organizations, in Organizational Behavior: The State of the Science, Greenberg, J. (ed.), (211-246). USA: Lawrence Erlbaum Associates, Incorporated. Fillis, I. (2003) Image, reputation and identity issues in the arts and crafts organization, Corporate Reputation Review, 6(3), 239-251. Fischer, R. (2006) Congruence and Functions of Personal and Cultural Values: Do My Values Reflect My Culture‘s Values?, Personality and Social Psychology Bulletin, 32(11), 1419-1431. Flavián, C. and Guinalíu, M. (2007) Development and Validation of Familiarity, Reputation and Loyalty Scales for Internet Relationships, ESIC Market (January·April), 157-188. Focht, T., Maloles III, C., Swobida, B., Marschett, D and Sinha, I. (2008) The Impact of Culture on Brand Perceptions: A Six-Nation Study, Journal of Product & Brand Management, 17(3), 131-142.

-384-
Fombrun, C.J. (1996) Reputation: Realising Value from the Corporate Image, Harvard Business School press, Boston, MA. Fombrun, C.J. and Rindova, V. (1998) Reputation Management in Global 1000 Firms: A Benchmarking Study, Corporate Reputation Review, 1(3), 205-212. Fombrun, C.J. and Shanley, M. (1990) What‘s in A Name? Reputation Building and Corporate Strategy, Academy of Management Journal, 33(2), 233-258. Fomburn, C.J. and van Riel, C.B.M. (1997) The Reputational Landscape, Corporate Reputation Review, 1(1 and 2), 1-9. Fomburn, C.J., Gardberg, N.A. and Sever, J.M. (2000) The Reputation Quotient: A Multiple Stakeholder Measures of Corporate Reputation, Journal of Brand Management, 7(4), 241-255. Foscht, T. and Maloles III, C., Swoboda, B., Morschett, D., Sinha, I. (2008) The Impact of Culture on Brand Perceptions: A Six-Nation Study, Journal of Product and Brand Management, 17(3), 131-142. Francois, P. and MacLachlan, D.L. (1995) Ecological Validation of Alternative Consumer-Based Strength Measures, International Journal of Research in Marketing, 12(4), 321-332. Frost, F.A. and Kumar, M. (2000) INTSERVQUAL-an Internal Adaptation of the GAP Model in Large Service Organization, Journal of Service Marketing, 14(5), 358-377. Furrer, O., Liu, B. and Sudharshan, D. (2000) The Relationship Between Culture and Service Quality Perceptions: Basis for Cross-Cultural Market Segmentation and Resource Allocation, Journal of Service Research, 2(4), 355-371. Gains-Ross, L. (1997) Leveraging Corporate Equity, Corporate Reputation Review, 1(1/2), 51-56. Gale, B.T. and Buzzel, R.D. (1989) Market Perceived Quality: Key Strategic Concept, Strategy & Leadership, 17(2), 6-48.

-385-
Ganesan, S. (1994) Determinants of Long-Term Orientation in Buyer-Seller Relationships, Journal of Marketing, 58, 1-19. Garbarion, E.C. and Edell, J.A. (1997) Cognitive Effort, Affect, and Choice, Journal of Consumer Research, 24. Gardner, B.B. and Levy, S.J. (1955) The Product and the Brand, Harvard Business Review, 33, 33-39. Garvin, G.A. (1987) Competing on the Eight Dimensions of Quality, Harvard Business Review, 65(6). Ger, G and Belk, R. (1996) Cross-Cultural Differences in Materialism, Journal of Economic Psychology, 17, 55-77. Ghodeswar, B.M. (2008) Building Brand Identity in Competitive Markets: A Conceptual Model, Journal of Product and Brand Management, 17(1), 4-12. Gil, R.B., Andrés, E.F. and Salinas, E.M. (2007) Family as a Source of Consumer-Based Brand Equity, Journal of Product and Brand Management, 16(3), 188-199. Gilbert, T. (2006) Mixed Methods and Mixed Methodologies, Journal of Research in Nursing, 11, 205-217. Gill, J. and Johnson, P. (2002) Methods for Managers, (3rd ed.), London: Sage. Gladden, J. and Funk, D. (2002) Developing an Understanding of Brand Associations in Team Sport: Empirical Evidence from Consumers of Professional Sports, Journal of Sport Management, 16(1), 54-81. Gómez, B.G., Arranz, A.G. and Gillán, J.G. (2006) The Role of Loyalty Programs in Behaviour and Affective Loyalty, Journal of Consumer Marketing, 23(7), 387-396. Gong, W. (2009) National Culture and Global Diffusion of Business-to-Consumer E-commerce, Cross Cultural Management: An International Journal, 16(1), 83-101.

-386-
Gotsi, M. and Wilson, A.M. (2001) Corporate Reputation: Seeking a Definition, Corporate Communications, 6(1), 24-30. Gounaris, S. and Stathakopolous, V. (2004) Antecedents and Consequences of Brand Loyalty: An Empirical Study, Journal of Brand Management, 11(4), 283-306. Grace, D. and O‘Cass, A. (2002) Brand Associations: Looking through the Eye of the Beholder, Qualitative Market Research: An International Journal, 5(2), 96-111. Graeff, T.R. (1996) Using Promotional Messages to Manage the Effects of Brand and Self-Image on Brand Evaluations, Journal of Consumer Marketing, 13(3), 4-18. Granovetter, M. (1985) Economic action and social structure: The problem of embeddedness, American Journal of Sociology 91, 481-510. Grant, R. (1998) Contemporary Strategy Analysis: concepts, techniques and applications (3 rd ed), USA: Blackwall Publishers Inc. Gray, E.R. and Balmer, J.M.T. (1998) Managing Corporate Image and Corporate Reputation, Long Range Planning, 31(5), 695-702. Graziano, A.M. and Raulin, M.L. (1997) Research Methods. (3rd ed.), New York: Longman. Groeschl, S. and Doherty, L. (2000) Conceptualising Culture, Cross Culture Management, An International Journal, 7(4), 12-17. Grönroos, C. (1984) A Service Quality Model and Its Marketing Implications, European Journal of Marketing, 18(4), 36-44. Grover, R. and Srinivasan, V. (1992) Evaluating the Multiple Effects of Retail Promotions on Brand–Loyal and Brand–Switching Segments, Journal of Marketing Research, 18, 76-89. Guest, L.P. (1942) Last vs Usual Purchase Questions, Journal of Applied Psychology, 26(2), 180-186.

-387-
Gu, F.F. and Hong, K. (2009) Materialism among Adolescents in China: A Historical Generation Perspective, Journal of Asia Business Studies, Spring, 56-64. Ha, C.L. (1998) The Theory of Reasoned Action Applied to Brand Loyalty, Journal of Product & Brand Management, 7(1), 51-61. Ha, H-Y., Janda, S. and Park, S.-K. (2009) Role of Satisfaction in an Integrative Model of Brand Loyalty: Evidence from China and South Korea, International Marketing Review, 26(2), 198-220.
Hair, J.F., Black, W.C., Babin, B.J., Anderson, R.E. and Tatham, R.L. (2006) Multivariate Data Analysis. (6th ed.), New Jersey: Prentice Hall. Hall, E.T. (1976) Beyond Culture, New York: Anchor Press. Hall, E.T. and Hall M.R. (1987) Hidden Differences: Doing Business with the Japanese. New York: Anchor Books/Doubleday. Hall, R. (1992) The Strategic Analysis of Intangible Resources, Strategic Management Journal, 13, 135-142. Hanzacc, K.H. (2011) Investigation of the Effect of Consumption Emotions on Satisfaction and Word of Mouth, Middle-East Journal of Science Research, 9(5), 566-571. Harris, L.C. and Ezeh, C.E. (2008) Servicescapes and Loyalty Intentions: An Empirical Investigation, European Journal of Marketing, 42(3/4), 390-422. Hassan, S.S., Craft, S. and Kortam, W. (2003) Understanding the New Bases for Global Market Segmentation, Journal of Consumer Marketing, 20(5), 446-462. Hawkins, D.J., Best, R.J. and Coney, A.K. (2006) Consumer Behavior: Building Marketing Strategy, (9th ed.), New Delhi: Tata McGraw Hill. Herbig, P. and Milewicz, J. (1995) The Relationship of Reputation and Credibility to Brand Success, Journal of Consumer Marketing, 12(4), 5-10.

-388-
Hiscock, J. (2001) Most Trusted Brands, Marketing, March, 1, 32-33. Hoare, R.J. and Butcher, K. (2008) Do Chinese Cultural Values Affect Customer Satisfaction/Loyalty? Internal Journal of Contemporary Hospitality Management, 20(2), 156-171. Hofstede, G. (1980) Culture’s Consequences: International Differences in Work-related Values, California: Sage Publications. Hofstede, G. (1983) The Cultural Relativity of Organizational Practices and Theories, Journal of International Business Studies, 14(2), 75-89. Hofstede, G. (1991) Cultures and Organizations: Software of the Mind. London: McGraw-Hill. Hofstede, G. (1994) Management Scientist are Human, Management Science, 40(1), 4-13. Hofstede, G. (2001), Culture’s Consequences, (2nd ed.), Thousand Oaks, CA: Sage. Hofstede, G and Hofstede, G. J. (2005) Cultures and Organizations: Software of the Mind. New York: McGraw-Hill. Hofstede, G.J. (1997) Wired International Teams: Experiments in Strategic Decision-Making by Multi-Culture Virtual Teams, Proceeding of the 5th European Conference on Information Systems, 321-336. Hofstede, G.J., Jonker, C.M. and Verwaart, T. (2008) Modelling Culture in Trade: Uncertainty Avoidance, SpringSim’08 proceedings of 2008 Spring Simulation Multiconference, 143-150. Hofstede, G., Neuijen, B, Daval Ohayv, D. and Sanders, G. (1990) Measuring Organizational Cultures: A Qualitative and Quantitative Study across Twenty Cases, Administrative Science Quarterly, 35, 286-316. Hofstede, G.J. and Pedersen, P. (1999) Synthetic Cultures: Intercultural Learning Through Simulation Games, Simulation & gaming, 30(4), 415-440.

-389-
Holbrook, M.B. and Kim, P.C. (1985) Quality and Value in the Consumption Experience: Phaedrus Rides Again, perceived quality, 31, 31-57. Holt, D.B. (1998) Does Cultural Capital Structure American Consumption? Journal of Consumer Research, 25, 1-25. Holt, D.B., Quelch, J.A. and Taylor, E.L. (2003) Managing the Transnational Brand: How Global Perceptions Drive Value, Globalization of Markets Colloquium, Harvard Business School Holt, D.B., Quelch, J.A. and Taylor, E.L. (2004) How Global Brands Compete, Harvard Business Review, 82(9), 68-75. Hong, J.W., Muderrisoglu, A. and Zinkham, G.M. (1987) Cultural Differences and Advertising Expression: A Comparative Content Analysis of Japanese and US Magazine Advertising, Journal of Advertising, 16(1), 55-62. Horton, L.M., Rose, G.M. and Blodgett, J. (2001) An Investigation of Cross-Cultural Values, http://www. Olemiss, edu/courses/mktg35/values, htm. Horppu, M., Kuivalainen, O., Tarkiainen, A. and Ellonen, H.-K. (2008) Online Satisfaction, Trust and Loyalty, and the Impact of the Offline Parent Brand, Journal of Product & Brand Management, 17(6), 403-413. Howard, J.A. and Sheth, J.N. (1969) The Theory of Buyer Behaviour, New York: Wiley. Hoyer, W.D. and Brown, S.P. (1990) Effects of Brand Awareness on Choice for a Common, Repeat Purchase Product, Journal of Consumer Research, 17, 141-148. Hughes, D.E. and Ahearne, M. (2010) Energizing the Reseller‘s Sales Force: The Power of Brand Identification, Journal of Marketing, 74, July, 81-96. Hui, C.H. and Triandis, H.C. (1986) ―Individualism-Collectivism: A study of Cross-Cultural Researchers, Journal of Cross-Cultural Psychology, 17, 225-248.

-390-
Ibrahim, H. and Najjar, F. (2008) Assessing the Effects of Self-Congruity, Attitudes and Customer Satisfaction on Customer Behavioural Intentions in Retail Environment, Marketing Intelligence & Planning, 26(2), 207-227. Imrie, B.C., Cadogan, J.W., and McNaughton, R. (2002) The Service Quality Construct on Global Stage, Managing Service Quality, 12(1), 10-18. Jackson, K. (2004) Building Reputational Capital Strategies for Integrity and Fair Play that Improve the Bottom Line, UK: Oxford University Press. Jacoby, J. and Chestnut, R.W. (1978) Brand Loyalty: Measurement and Management. New York: John Wiley & Sons. Jacoby, J. and Kyner, D.B. (1973) Brand Loyalty versus Repeat Purchasing, Journal of Marketing Research, 10, 1-9. Jamel, A. and Goode, M. (2001) A Study of the Primary Evaluative Criteria in the Precious Jewelry Market in the UK, Journal of Consumer Behaviour, 1, 140-155. Javalgi, R.G. and Moberg, C.R. (1997) Service Loyalty: Implications for Service Providers, Journal of Services Marketing, 11(3), 165-179. Jeannet, J.- P. and Hennessey, H. D. (2004) Global Marketing Strategies (6th edition), Boston: Houghton Mifflin Company. Johar, J.S. and Sirgy, M.J. (1991) Value-Expressive Versus Utilitarian Advertising Appeals: When And Why To Use Which Appeal, Journal of Advertising, 20(3), 23-33. John, D.R., Loken, B., Kim, K., and Monga, A.B. (2006) Brand Concept Maps; A Methodology for Identifying Brand Association Networks, Journal of Marketing Research, 43, 549-563. Johnson, M.D., Herrmann, A., and Huber, F. (2006) The Evolution of Loyalty Intentions. Journal of Marketing, 70(2), 122-132.

-391-
Jung, J. and Sung, E. (2008) Consumer-Based Brand Equity - Comparisons among Americans and South Koreans in the USA and South Koreans in Korea, Journal of Fashion Marketing and Management, 12(1), 24-35. Jung, J., Su, X., Baeza, M. and Hong, S. (2008) The Effect of Organizational Culture Stemming from National Culture towards Quality Management Development, The TQM Magazine, 20(6), 622-635. Kale, S.H. and Barnes, J.W. (1992) Understanding the Domain of Cross-Cultural Buyer-Seller Interactions, Journal of International Business Studies, 23(1), 101-132. Kale, S.H. and McIntyre, R.P. (1991) Distribution Channel Relationships in Diverse Cultures, International Marketing Review, 8(3), 31-45. Kang, G.-D., James, J. and Alexandris, K. (2002) Measurement of Internal Service Quality: Application of the SERVQUAL Battery to Internal Service Quality, Managing Service Quality 12(5), 278-291. Kania, D. (2001) Branding.com, Chicago, IL: NIC. Kanousi, A. (2005) An Empirical Investigation of the Role of Culture on Service Recovery Expectations, Managing Service Quality, 15(1), 57-69. Kapferer, J.N. (2004) Brand NEW World, Brand Equity. Mumbai: The Economic Times. Kapferer, J.N. (2008) The New Strategic Brand Management, London and Philadelphia: Kogan page. Kashima, Y. (2000) Conceptions of Culture and Person for Psychology, Journal of Cross-Cultural Psychology, 31(14), 14-31. Kayaman, R. and Arasli, H. (2007) Customer Based Brand Equity: Evidence from the Hotel Industry, Managing Service Quality, 17(1), 92-109. Keller, K.L. (1993) Conceptualizing, Measuring, and Managing Customer-Based Brand Equity, Journal of Marketing, 57(1), 1-22.

-392-
Keller, K.L. (1998) Strategic Brand Management: Building, Measuring, and Managing Brand Equity. New Jersey: Prentice Hall. Keller, K.L. and Aaker, D.A. (1992) The Effects of Sequential Introduction of Brand Extensions, Journal of Marketing Research, 29, 35-50. Kelly, P. (1991) Advertising Research and Decision Making, Proceeding of the Australasian Marketing Educators’ Conference, Adelaide: University of South Australia. Kenning, P. (2008) The Influence of General Trust and Specific Trust on Buying Behaviour, International Journal of Retail & Distribution Management, 36(6), 461-476. Key, J. (1995) Foundations of Corporate Success: How Business Strategies Add Value, Oxford University Press, Oxford. Kim, C.K., Han, D.C., and Park, S.B. (2001) The Effect of Brand Personality and Brand Identification on Brand Loyalty: Applying the Theory of Social Identification, Japanese Psychological Research, 43(4), 195-206. Kim, H.-b. and Km, W.G. (2005) The Relationship between Brand Equity and Firms‘ Performance in Luxury Hotels and Chain Restaurants, Tourism Management, 26(4), 549-560. Kivela, J., Inbakaran, R. and Reece, J. (1999) Consumer Research in the Restaurant Environment, Part1: A Conceptual Model of Dinning Satisfaction and Return Ptronage, International Journal of contemporary Hospitality management,11(5), 205-222. Kleijnen, M., de Ruyter, K. and Andreassen, T.W. (2005) Image Congruence and the Adoption of Service Innovations, Journal of Service Research, 7(4), 343-359. Knox, S. and Bickerton, D. (2003) The Six Conventions of Corporate Branding, European Journal of Marketing, 37(7/8), 998-1016.

-393-
Kotabe, M. and Helsen, K. (2001) Global Marketing Management (2nd ed.), New York: Wiley & Sons. Kotler, P., Armstrong, G., Wong, V. and Saunders, J. (2008) Principles of Marketing, Fifth European Edition. Harlow, Essex: Pearson Education. Kozac, M. (2002) Comparetive Analysis of Tourist Motivations by Nationality and Destinations, Tourism Management, 23, 224. Krambia-Kapardis, M. and Thomas, A. (2006) Hospitality Industry in Cyprus: The Significance of Intangibles, Journal of Contemporary Hospitality Management, 18(1), 6-24. Kramer, R.M. (1999) Trust and Distrust in Organizations: Emerging Perspectives, Enduring Questions, Annual Review of Psychology, 50(1), 569-597. Kressmann, F., Sirgy, M.J., Herrmann, A., Huber, F., Huber, S. and Lee, D.-J. (2006) Direct and Indirect Effects of Self-Image Congruence on Brand Loyalty, Journal of Business Research, 59, 955-964. Krishnan, B.C., Hartline, M.D. (2001) Brand Equity: Is It More Important in Services?, Journal of Services Marketing, 15(5), 328-342. Krishnan, H.S. (1996) Characteristics of Memory Associations: A Consumer-Based Brand Equity Perspective, International Journal of Research in Marketing, 13, 389-405. Kuehn, A.A.(1962) Consumer Brand Choice as a Learning Process, Journal of Advertising Research, 2(4), 10-17. Kuenzel, S. and Halliday, S.V. (2008) Investigating Antecedents and Consequences of Brand Identification, Journal of product & Product Management, 17(5), 293-304. Kuenzel, S. and Halliday, S.V. (2010) The Chain of Effects from Reputation and Brand Personality Congruence to Brand Loyalty: The Role of Brand Identification, Journal of Targeting, Measurement and Analysis for Marketing, 18(3/4), 167-176.

-394-
Kumar, R. (1996) Research Methodology: A Step-by-Step Guide for Beginners. London: SAGE publications Ltd. Kwak, D.H. and Kang, J.H. (2009) Symbolic Purchase in Sport: The Role of Self-Image Congruence and Perceived Quality, Management Decision, 47(1), 85-99. Lai, C.S., Chiu, C.J., Yang, C.F., and Pai, D.C. (2010) The Effect of Corporate Social Responsibility on Brand Performance: The Mediating Effect of Industrial Brand Equity and Corporate Reputation, Journal of Business Ethics, 95(3), 457-469. Landon, Jr, E.L. (1974) Self-Concept, Ideal Self-Concept and Consumer Purchase Intensions, Journal of Consumer Research, 1, 44-51. Larzelere, R. and Huston, T.L. (1980) The Dyadic Trust Scale: Toward Understanding Interpersonal Trust in Close Relationships, Journal of Marriage and the Family, August, 595-604. Lassar, W., Mittal, B. and Sharma, A. (1995) Measuring the Consumer Based Brand Equity, Journal of Consumer Marketing, 12(4), 4-19. Law, A.K.Y., Hui, Y.V. and Zhao, X. (2004) Modeling Repurchase Frequency and Customer Satisfaction for Fast Food Outlets, International Journal of Quality & Reliability Management, 21(5), 545-563. Lee, K. and Carter, S. (2012) Global Marketing Management, Oxford: Oxford University Press. Lee, M. and Cunningham, L.F. (2001) A Cost/Benefit Approach to Understanding Service Loyalty, Journal of Services Marketing, 15(2), 113-130. Lee, M.-Y., Knight, D. and Kim, Y.-K. (2008) Brand Analysis of a US Global Brand in Comparison with Domestic Brands in Mexio, Korea, and Japan, Journal of Product & Brand Management, 17(3), 163-174. Lehtinen, U. and Lehtinen, J.P. (1991) Two Approaches to Service Quality Dimensions, The Service Industries Journal, 11(3), 287-303.

-395-
Leon, R.P., Rao, V.R., Keller, K. ., Luo, A.M., McAlister, L. and Srivastava, R. (2006) Linking Brand Equity to Customer Equity, Journal of Service Research, 9(2), 125-127. Leung, K., Bhagat, R.S., Buchan, N.R., Erez, M. and Gibson, C. (2005) Culture and International Business: Recent Advances and Their Implications for Future Research, Journal of International Business Studies, 369(4), 357-378. Levitt, T. (1983) The Marketing Imagination, New York: The Free Press. Levy, S.J. (1959) Symbols for Sale, Harvard Business Review, 37, 117-24. Li, J. and Harrison, J.R. (2008) Corporate Governance and National Culture: A Multi-County Study, Corporate Governance, 8(5), 607-621. Lin, X. and Miller, S.J. (2003) Negotiation Approaches: Direct and Indirect Effect of National Culture, Internal Marketing Review, 20(3), 286-303. Low, G.S., and Lamb Jr. C.W. (2000) The Measurement and Dimensionality of Brand Associations, Journal of Product & Brand Management, 9(6), 350-368. Luhmann, N. (1979) Trust and Power, Chichester: John Wiley& Sons, Ltd. Macdonald and Sharp, (2003) Management Perceptions of the Importance of Brand Awareness as an Indication of Advertising Effectiveness, Marketing Bulletin, 14(2), 1-11. Madanoglu, M. (2004) Validating Restaurant Service Quality Dimensions, Journal of Foodservice Business Research, 7(4), 127-147. Mael, F. and Ashforth, B.E. (1992) Alumni and their Alma mater: A Partial Test of the Reformulates Model of Organizational Identification, Journal of Organizational Behaviour, 13(2), 103-123. Magnini, V.P. (2010) The Influence of Collectivism in Restaurant Selection: A Sentence Completion Experiment, International Journal of Hospitality Management, 29(1), 191-193.

-396-
Mahon, J.F. (2002) Corporate Reputation: A Research Agenda Using Strategy and Stakeholder Literature, Business and Society, 41(4), 415-445. Maloles III, C., Foscht, T., Swoboda, B., Morschett, D. and Sinha I. (2008) The Impact of Culture on Brand Perceptions: A Six Nation Study, Journal of Product & Brand Management, 17(3), 131-142. Maltz, E. (1991) Managing Brand Equity: A Conference Summary, Marketing Science Institute, Cambridge, MA. Report, 99-110. Markwick, N. and Fill, C. (1977) Towards a Frame-Work for Managing Corporate Identity, European Journal of Marketing, 31(5/6), 396-409. Martenson, R. (2007) Corporate brand Image, Satisfaction and Store Loyalty, International Journal of Retail & Distribution Management, 35(7), 544-555. Martinez Caro, L. and Martinez Garcia, J.A. (2007) Measuring Perceived Quality In Urgent Transport Service, Journal of Retailing and Consumer Services, 14(1), 60-72. Mathews, B.P., Ueno, A., Kekäle, T., Repka, M., Pereira, Z.L. and Silva, G. (2000) European Quality Management Practices: The Impact of National Culture, International Journal of Quality Management, 18(7), 692-707. Mattila, A.S. (1999) The Role of Culture in the Service Evaluation Processes, Journal of Service Research, 1(3), 250-261. Matzler, K., Grabner-Kräuter, S. and Bidmon, S. (2006) Individual Determinants of Brand Effect: the Role of the Personality Traits of Extraversion and Openness to Experience, Journal of Product & Brand Management, 15(7), 427-434. Mayer, R.C., Davis, J.H. and Schoorman, F.D. (1995) An Integrative Model of Organizational Trust, Academy of Management Review, 20(3), 709-734. Maynard, M.L. (2003) From Global to Glocal: How Gillette‘s SensorExcel Accommodates to Japan, Keio Communication Review, 25, 57-75.

-397-
McConnell, J.D. (1968) Development of Brand Loyalty: An Empirical Study, Journal of Marketing Research, 5(1), 13-19. McDaniel, C. and Gates, R. (2006) Marketing Research Essentials. New York: Wiley. Mei, A.W.O., Dean, A.M. and White, C.J. (1999) Analyzing Service Quality in the Hospitality Industry, Managing Service Quality, 9(2), 136-143. Merritt, A. (2000) Culture in the Cockpit: Do Hofstede‘s Dimensions Replicate? Journal of Cross-Cultural Psychology, 31(3), 283-301. Milewicz, J. and Herbig, P. (1994) Evaluating the Brand Extension Decision Using a Model of reputation building, Journal of Product & Brand Management, 3(1), 39-47. Milgrom, P. and Roberts, J. (1986) Price and Advertising Signals of Product Quality, International Library of Critical Writing in Economics, 136, 364-389. Miller, J. and Muir, D. (2004) Business of Brands, Chichester: John Wiley& Sons, Ltd. Miroshinik, V. (2002) Culture and International Management: A Review, Journal of Management, Journal of Management Development, 21(7), 521-544. Mittal, B. and Lasser, W.M. (1996) The Role of Personalization in Service Encounters, Journal of Retailing, 72(1), 95-109. Monroe, K.B. and Krishnan, R. (1985) The Effect of Price on Subjective Product Evaluations, in Perceived Quality, Jacoby, J. and Olson J. (eds.) Lexington, MA: Lexington Books. Mooij, M.D. and Hofstede, G. (2002) Convergence and Divergence in Consumer Behaviour: Implications for International Retailing, Journal of Retailing, 78(1), 61-69. Moorman, C., Desh-pandé, R. and Zaltman, G. (1993) Factors Affecting Trust in Market Research Relationships, Journal of Marketing, 57, 81-101.

-398-
Moorman, C., Zaltman, G. and Desh-pandé, R. (1992) Relationships between Providers and Users of Market Research: The Dynamics of Trust Within and between Organisations, Journal of Marketing Research, 29, 314-328. Moorthy, K.S. (1985) Using Game Theory to Model Competition, Journal of Marketing Research, 22 (August), 262-282. Morden, T. (1999) Models of National culture – A Management Review, Cross Culture Management, 6(1), 19-44. Morgan, R.M. and Hunt, S.D. (1994) The Commitment-Trust Theory of Relationship Marketing, Journal of Marketing, 58, 20-38. Morrow Jr, J.L., Hansen, M.H. and Pearson, A.W. (2004) The Cognitive and Affective Antecedents of General Trust within Cooperative Organizations, Journal of Managerial Issues, 16(1), 48-64. Motameni, R. and Shahrokhi, M. (1998) Brand Equity Valuation: A Global Perspective, Journal of Product & Brand Management, 7(4), 275-290. Murphy, K.R. and Davidshofer, C.O. (1988) Psychological Testing: Principles and Applications, New Jersey: Prentice Hall. Myers, C.A. (2003) Managing Brand Equity: A Look at the Impact of Attributes, Journal of Product & Brand Management, 12(1), 39-51. Na, W.B., Marshall, R. and Keller, K.L. (1999) Measuring Brand Power: Validating a Model for Optimizing Brand Equity, Journal of Product & Brand Management, 8(3), 170-184. Nam, J., Ekinci, Y. and Whyatt, G. (2011) Brand Equity, Brand Loyalty and Consumer Satisfaction, Annals of Tourism Research, 38(3), 1009-1030. Namenwirth, J.Z. and Weber, R.B. (1987) Dynamics of Culture, Boston: Allen and Unwin.

-399-
Narin, A., Griffin, C. and Wicks, P. G. (2008) Children‘s Use of Brand Symbolism: A Consumer Culture Theory Approach, European Journal of Marketing, 42(5/6), 627-640. Netemeyer, G., Krishnan, B., Pullig, C., Wang, G., Yagci, M., Dean, D., Ricks, J. and Wirth, F. (2004) Developing and Validating Measures of Facets of Customer-Based Brand Equity, Journal of Business Research, 209-224.
Newman, J. W. (1966) On Knowing the Consumer, New York: Wiley.
Newman, W.L. (2000) Social Research Methods, (4thed.) Needham Heights: A Pearson Education Company. Newman, J.W. and Werbel, R.A. (1973) Multivariate Analysis of Brand Loyalty for Major House hold Appliances, Journal of Marketing Research, 10, 404-9. Nguyen, N. and Leblanc, G. (2001) Corporate Image and Corporate Reputation in Customers‘ Retention Decisions in Services, Journal of Retailing and Consumer Services, 8(4), 227-236. Nowak, L., Thach, L. and Olsen, J.E. (2006) Wowing the Millennium: Creating Brand Equity in the Wine Industry, The Journal of Product an Brand Management, 15(5), 316-323. O‘Cass, A. and Frost, H. (2002) Status Brands: Examining the Effects of Non-Product-Related Brand Associations on Status and Conspicuous Consumption, Journal of Product & Brand Management, 11(2), 67-88. O‘Connor, P. (2007) Doing Boy/Girl‘ and Global/local Elements in 10-12 Year Olds‘ Drawings and Written Texts, Qualitative Research, 7(2), 229-247. Odin, Y., Odin, N. and Valette-Florence, P. (2001) Conceptual and Operational Aspects of Brand Loyalty: An Empirical Investigation, Journal of Business Research, 53(2), 75-84.

-400-
Ogilvie, D.M. (1987) The Undesired Self: A Neglected Variable in Personality Research, Journal of Personality and Social Psychology, 52(2), 379-385. Oliver, R.L. (1980) A Cognitive Model of the Antecedents and Consequences of Satisfaction Decisions, Journal of Marketing Research, 17(4), 460-469. Oliver, R.L. (1993) Cognitive, Affective, and Attribute Based of the Satisfaction Response, Journal of Consumer Research, 20. Oliver, R.L. (1997) Satisfaction: A Behavioral Perspective on the Consumer. New York: Irwin/McGraw-Hill, Oliver, R.L. (1999) Whence consumer loyalty? Journal of Marketing, 63(5), 33-44. Oliver, R.L. and Westbrook, R.A. (1993) Profiles of Consumer Emotions and Satisfaction in Ownership and Usage, Journal of Consumer Satisfaction, Dissatisfaction and Complaining Behaviour, 6, 12-27. Oliver, T.A. (1997) Satisfaction: A Behaviour Perspective on the Consumer. Boston, Massachusetts: Irwin McGraw-Hill. Omar, M., Williams Jr, R.L. and Lingelbach, D. (2009) Global Brand Market-Entry Strategy to Manage Corporate Reputation, Journal of Product & Brand Management, 18(3), 177-187. Onkvisit, S. and Shaw, J.J. (1989) Service Marketing Image, Branding, and Competition, Business Horizons, 32(1), 13-18. Oppermann, M. (1999) Predicting Destination Choice-A Discussion of Destination Loyalty, Journal of Vacation Marketing, 5(1), 51-65 Oppermann, M. (2000) Tourism Destination Loyalty, Journal of Travel Research, 39, 78-84. Orth, U.R., Mcdaniel, M., Shellhammer, T. and Loptcharat, K. (2004) Promoting Brand Benefits: The Role of Consumer Psychographics and Lifestyle, Journal of Consumer Marketing, 21(2), 97-108.

-401-
Pagell, M., Katz, J.P. and Shue, C. (2005) The Importance of National Culture in Operations Management Research, International Journal of Operations & Production Management, 25(4), 371-394.
Pallant, J. (2007) SPSS Survival Manual: A Step by Step Guide to Data Analysis Using SPSS for Windows. Maidenhead: McGraw-Hill. Pappu, R. and Quester, P. (2006) Does Customer Satisfaction Lead to Improved Brand Equity? An Empirical Examination of Two Categories of Retail Brands, Journal of Product & Brand Management, 15(1), 4-14. Pappu, R., Quester, P.G. and Cooksey, R.W. (2005) Consumer-Based Brand Equity: Improving the Measurement-Empirical Evidence, Journal of Product and Brand Management, 14(3), 143-154. Parasuraman, A., Zeithaml, V.A. and Berry, L.L. (1985) A Conceptual Model of Service Quality and Its Implications for Future Research, Journal of Marketing, 49(4), 41-50. Parasuraman, A., Zeithaml, V.A. and Berry, L.L. (1988) SERVQUAL: A Multiple-Item Scale for Measuring Consumer Perceptions of Service Quality, Journal of Retiling, 64 (1), 12-40. Parasuraman, A., Zeithaml, V.A. and Berry, L.L. (1990) Delivering Quality Service: Balancing Customer perceptions and Expectations, New York: Free Press. Parasuraman, A., Zeithaml, V.A. and Berry, L.L (1994) Alternative Scale for Measuring Service Quality: A Comparative Assessment Based on Psychometric and Diagnostic Criteria, Journal of Retailing, 70(3), 201-230. Park, C.W., Millberg, S. and Lawson, R. (1991) Evaluation of Brand Extension: The Role of Product Level Similarity and Brand Concept Consistency, Journal of Consumer Research, 18, 185-193. Parmelee, J.H., Perkins, S.C., Sayre, J.J. (2007) What About People Our Age? Applying Qualitative and Quantitative Methods to Uncover How Political Ads Alienate College Students, Journal of Mixed Methods Research, 1(2), 183-199.
-402-
Paswan, A., Spears, N., and Ganesh, G. (2007) The Effects of Obtaining One‘s Preferred Service Brand on Consumer Satisfaction and Brand Loyalty, Journal of Services Marketing, 21(2), 75-87. Peterson, R.A. (1994) A Meta-Analysis of Cronbach‘s Coefficient Alpha, Journal of Consumer Research, 21 (2), 381-391. Phatak, A.V. (1986) International Dimensions of Management, Boston, MA: PWS-Kent. Phau, I. and Lau, K.C. (2001) Brand Personality and Consumer Self-Expression: Single or Dual Carriageway? Brand Management, 8(6), 428-444. Pierce, J.L., Garner, D.G., Cummings, L.L. and Dunham, R.B. (1989) Organization-Based Self-esteem: Construct Definition, Measurement, and Validation, Academy of Management Journal, 32, 622-648. Pitta, D.A. and Katsanis, L.P. (1995) Understanding Brand Equity for Successful Brand Extension, Journal of Consumer Marketing, 12(4), 51-64. Porter, M. (1990), The Competitive Advantage of Nations, New York: Free Press. Power, J., Whelan, S. and Davies, G. (2008) The Attractiveness and Connectedness of Ruthless Brands: The Role of Trust, European Journal of Marketing, 42(5/6), 586-602. Prasad, K. and Dev, C.S. (2000), Managing Hotel Brand Equity: A Customer-centric Framework for Assessing Performance, Cornell Hotel and Restaurant Administration Quarterly, 22-31. Preece, S., Fleisher, C., Toccacelli, J. (1995) Building A Reputation Along the Value Chain at Levi Strauss, Long Range Planning, 28(6), 88-98. Qin, H. and Prybutok, V.R. (2009) Service Quality, Customer Satisfaction, and Behavioural Intentions in Fast-Food Restaurants, International Journal of Quality and Service Sciences, 1(1), 78-95.

-403-
Quester, P. and Lim, A.L. (2003) Product Involvement/Brand Loyalty: Is There A Link? Journal of Product & Brand Management, 12(1), 22-38. Quester, P.G., Karunaratna, A., and Goh, L.K. (2000) Self-Congruity and Product Evaluation: A Cross-Cultural Study, Journal of Consumer Marketing, 17(6), 525-537. Raj, S.P. (1985) Striking a Balance Between Brand Popularity and Brand Loyalty, Journal of Marketing, 49 (winter), 53-59. Rassuli, K.M. and Hollander, S. (1986) Desire-Induced, Innate, Insatiable? Journal of Macro-Marketing, 6 (Fall), 4-24. Reast, J.D. (2003) The Role of Brand Trust within Related and Unrelated Brand Extension Activities: A Consumer Perspective, PhD thesis, Leeds University Business School, Leeds University, Leeds, January. Reast, J.D. (2005) Brand Trust and Brand Extension Acceptance: The Relationship, Journal of Product & Brand Management, 14(1), 4-13. Reichheld, F.F. (1996), The Loyalty Effect, Boston, MA: Harvard Business School Press
Rempel, J., Holmes, J. and Zanna, M. (1985) Trust in Close Relationships, Journal of Personality and Social Psychology, 49(1), 95-112. Reynolds, F.D., Darden, W.R. and Martin, W.S. (1974) Developing an Image of the Store-Loyal Customer: A Life Style Analysis to Probe a Neglected Market, Journal of Retailing, 50(4), 73-84. Richard, I., Foster, D. and Morgan, R. (1998) Brand Knowledge Management: Growing Brand Equity, Journal of Knowledge Management, 2(1), 47-54. Richins, M.L. (1997) Measuring Emotions in the Consumption Experience, Journal of Consumer Research, 24(2), 127-146.

-404-
Richins, M.L. and Dawson, S. (1992) A Consumer Values Orientation for Materialism and Its Measurement: Scale Development and Validation, Journal of Consumer Research, 19, 303-316. Rijswijk, W.V. and Frewer, L.J. (2008) Consumer Perceptions of Food Quality and Safety and Their Relation to Traceability, British Food Journal, 110(10), 1034-1046. Rindova, V.P., and Fombrun, C.J. (1999) Constructing Competitive Advantage: The Role of Firm-Constituent Interactions, Strategic Management Journal, 20, 691-710. Ring, A., Schriber, M. and Horton, R.L. (1980) Some Effects of Perceived Risk on Consumer Information Processing, Journal of Academy of Marketing Science, 8(3), 255-263. Rio, A., Vazquez, R. and Iglesias, V. (2001) The Role of the Brand Name in Obtaining Differential Advantages, Journal of Product and Brand Management, 10(7),452-465. Roberts, P.W. and Dowling, G.R. (2002) Corporate Reputation and Sustained Superior Financial Performance, Strategic Management Journal, 23(12), 1077-1093. Robinson, J.P., Shaver, P.R. and Wrightsman, L.S. (1991) Criteria for Scale Selection and Evaluation, in Measures of Personality and Social Psychological Attitudes, Robinson, J.P., Shaver, P.R. and Wrightsman, L.S. (eds.), San Diego: Academic Press. Rogers, S. (2005) Selecting a Food Service System: A Review, International Journal of Contemporary Hospitality Management, 17(2), 147-156. Rogerson, W.P. (1983) Reputation and Product Quality, The Bell Journal of Economics, 14, Autumn, 508-516. Rokeach, M. (1973) The Nature of Human Values, New York, NY: The Free Press. Romaniuk, J. and Nenycz-Thiel, M. (2011) Behaviour Brand Loyalty and Consumer Brand Associations, Journal of Business Research, 1-6. Ross, I. (1971) Self-Concept and Brand Preference, Journal of Business, 44, 38-50.

-405-
Ross, S. (2006) A Conceptual Framework for Understanding Spectator-Based Brand Equity, Journal of Sport Management, 20(1), 22-38. Ross, S., James, J. and Vargas, P. (2006) Development of A Scale to Measure Team Brand Associations in Professional Sport, Journal of Sport Management, 20(2), 260-279. Rossiter, J.R. and Percy, L. (1987) Advertising and Promotion Management, New York: McGraw-Hill. Roth, M.S. (1995) The Effect of Culture and Socioeconomics on the Performance of Global Brand Image Strategies, Journal of Marketing Research, 32, 163-175. Rugman, A. (1990) Research in Global Strategic Management, Greenwich, CT:JAI Press. Rundle-Thiele, S. and Bennett, R. (2001) A Brand for All Seasons? A Discussion of Brand Loyalty Approaches and Their Applicability for Different Markets, Journal of Product & Brand Management, 10(1), 25-37. Russell-Bennett, R., McColl-Kennedy, J.R. and Coote, L.V. (2007) Involvement, Satisfaction, and Brand Loyalty in a Small Business Services Setting, Journal of Business Research, 60(12), 1253-1260. Russell, J.A. (1980) A Circumplex Model of Affect, Journal of Personality and Social Psychology, 39(6), 1161-1178. Sage, P.D. (2002) Customer Support and Player Reputation: It’s All about Trust, in Thor Alexander (ed.), Massively Multiplayer Game Development (90-99), USA: Charles River Media. Sangkhawasi, T. and Johri, L.M. (2007) Impact of Status Brand Strategy on Materialism in Thailand, Journal of Consumer Marketing, 24/5, 275-282. Saunders, M., Lewis, P. and Thornhill, A. (2007) Research Method for Business Students, UK: FT Prentice Hall.

-406-
Saxton, M.K. (1998) Where Do Corporate Reputation Come from? Corporate Reputation Review, 1(4), 393-399. Schein, E.H. (2004) Organizational Culture and Leadership, (3rd ed.), San Francisco, CA: Jossey-Bass.
Scotte, S.G. and Lane, V.R. (2000) A Stakeholder Approach to Organizational Identity, Academy of Management Review, 25(1), 43-62. Sichtmann, C. (2007) An Analysis of Antecedents and Consequences of Trust in a Corporate Brand, European Journal of Marketing, 41(9/10), 999-1015. Schwaiger, M. (2004) Components and Parameters of Corporate Reputation – An Empirical Study, Schmalenbach Business Review, 56, 46-71. Seetharaman, A., Nadzir, Z.A.B.M., and Gunalan, S. (2001) A Conceptual Study on Brand Valuation, Journal of Product and Brand Management, 10(4), 243-256. Sekaran, U. (2003) Research Methods for Business: A Skill Building Approach. New York: John Wiley & Sons, Inc. Selnes, F. (1993) An Examination of the Effect of Product Performance on Brand Reputation, Satisfaction and Loyalty, European Journal of Marketing, 24(9), 19-35. Sen, S. and Bhattacharya, C.B. (2001) Does doing good always lead to doing better? Consumer reaction to corporate social responsibility, Journal of Marketing Research, 38(2), 225-244. Shapiro, C. (1983) Premiums for High Quality Products as Returns to Reputations, Quarterly Journal of Economics, 98(4), 659-680. Shaver, P., Schwartz, J., Kirson, D. and Cary, O. (1987) Emotional Knowledge: Further Exploration of a Prototype Approach, Journal of Personality and Social Psychology, 52(6), 1061-1086. Sherry, J.F. (1983) Gift Giving in Anthropological Perspective, Journal of Consumer Research, 10(2), 157-168.

-407-
Sherry, J.F. (1998) Managing the Servicecape, Lincolnwood, IL: NTC Business Books. Sheth, J.N. (1968) A Factor Analytic Model of Brand Loyalty, Journal of Marketing Research, 5, 398. Sheth, J.N. and Parvatiyar, A. (1995) Relationship Marketing in Consumer Markets: Antecedents and Consequences, Journal of the Academy of Marketing Science, 23(4), 255-271. Shocker, A.D., Srivastava, R.K. and Ruekert, R.W. (1994) Challenges and Opportunities Facing Brand Management: An Introduction to the Special Issue, Journal of Marketing Research, 31, 149-158. Sichtmann, C. (2007) An Analysis of Antecedents and Consequences of Trust in a Corporate Brand, European Journal of Marketing, 41(9/10), 999-1015. Simms, C.D. and Trott, P. (2006) The Perceptions of the BMW Mini Brand: The Importance of Historical Associations and the Development of a Model, Journal of Product & Brand Management, 15(4), 228-238. Simões, D. and Dibb, S. (2001) Rethinking the Brand Concept: New Brand Orientation, Corporate Communications, 6(4), 217-24. Simon C.J., and Sullivan, M.W. (1993) The Measurement and Determinants of Brand Equity: A Financial Approach. Marketing Science, 12(1), 28-52. Singelis, T.M. (1994) Bridging the Gap between Culture and Communication, in Journeys into Cross-Cultural Psychology, Bouvy, A.M., Van de Vijer, F.J.R., Boski, P. and Schmitz, P. (eds.), (278-293), Lisse: Swets & Zeitlinger. Sirgy, M.J. (1980) The Self-Concept in Relation to Product Preference and Purchase Intention, Developments in Marketing Science, 3, 350-354. Sirgy, M.J. (1982) Self-Concept in Consumer Behavior: A Critical Review, Journal of Consumer Research, 9(3), 287-300.

-408-
Sirgy, M.J. (1985) Using Self-Congruity and Ideal Congruity to Predict Purchase Motivation, Journal of Business Research, 13, 195-206. Sirgy, M.J. (1986) Self-Congruity: Toward a Theory of Personality and Cybernetics, New York: Praeger. Sirgy, M.J. (2007) The Science of Community Quality-of–Life Research: A Certification Manual, Blacksburg, VA: International Society for Quality-of-Life Studies. Sirgy, M.J. and Danes, J.E. (1982) Self-Image/Product-Image Congruence Models: Testing Selected Models, Advances in Consumer Research, 9, 556-561. Sirgy, M.J., Grewal, D., Mangleburg, T.F., Park, J., Chon, K., Claiborne, C.B., Johar, J.S. and Berkman, H. (1997) Assessing the Predictive Validity of Two Methods of Measuring Self-Image Congruence, Journal of Academy of Marketing Science, 25(3), 229-241. Sirgy, M.J. and Samli, A.C. (1985) A Path Analytic Model of Store Loyalty Involving Self-Concept, Store Image, Geographic Loyalty, and Socioeconomic Status, Journal of the Academy of Marketing Science Summer, 13(3), 265-291. Sirgy, M.J. and Su, C. (2000) Destination Image, Self-Congruity, and Travel Behaviour: Toward an Integrative Model, Journal of Travel Research, 38(4), 340-352. SK, J.-L. (1992) Quantitative verse Qualitative Research Methods-Two Approaches to Organisation Studies, Asia Pacific Journal of Management, 9(1), 87-94. Šmaižienė, I. (2008) Revealing the Value of Corporate Reputation for Increasing Competitiveness, Economics and Management, 13, 718-723. Smaiziene, I. and Jucevicius, R. (2009) Corporate Reputation: Multidisciplinary Richness and Search for a Relevant Definition, Inzinerine Ekonomika-Engineering Economics (2), 91-99.

-409-
Smidts, A., Pruyn, A.T.H and Van Riel, C.B.M (2001) The Impact of Employee Communication and Perceived External Prestige on Organizational Identification, Academy of Management Journal, 44(5), 1051-1062. Sojka, J. Z. and Tansuhai, P. (1995) Cross-Culture Research: a Twenty-Year Review, Advances in Consumer Research, 22, 461-474. Solnet, D. (2006) Introducing employee social identification to customer satisfaction research: A hotel industry research, Managing Service Quality, 16(6), 575-594. Soriano, D.R. (2002) Customers‘ Expectations Factors in Restaurants: The Situation in Spain, International Journal of Quality & Reliability Management, 19(8/9), 1055-1067. Spiegel, M.V.D., Luning, P.A., Ziggers, G.W. and Jongen, W.M.F. (2004) Evaluation of Performance Measurement Instruments on Their Use for Food Quality System, Critical Review in Food Science and Nutrition, 44, 501-512. Srivastava, R.K. and Shocker, A.D. (1991) Brand equity: A perspective on its meaning and measurement. Working Paper Series, Cambridge, MA: Marketing Science Institute, Report Number 91-124. Stedham, Y.E. and Yamamura, J.H. (2004) Measuring National Culture: Does Gender Matter? Women in Management Review, 19(5), 233-243. Stokburger-Sauer, N.E. (2011) The Relevance of Visitor‘s Nation Brand Embeddedness and Personality Congruence for Nation Brand Identification, Visit Intentions and Advocacy, Tourism Management, 32(6), 1282-1289. Stokes, R.C. (1985) The Effect of Price, Package Design and Brand Familiarity on Perceived Quality, In Perceived Quality, Jacoby, J. & Olson, J.C. Lexington: Lexington Books. Supphellen, M. (2000) Understanding Core Brand Equity: Guidelines for In-Depth Elicitation of Brand Associations, International Journal of Marketing Research, 3(3), 319-338.

-410-
Sullivan, M.W. (1998) How Brand Names Affect the Demand for Twin Automobiles, Journal of Marketing Research, 35(May), 154-165. Svensson, G. (2003) A Generic Conceptual Framework of Interactive Service Quality, Managing Service Quality, 13(4), 267-275. Svensson, G. (2004) Interactive Service Quality in Service Encounters: Empirical Illustration and Models, Managing Service Quality, 14(4), 278-287. Tai, H.C.S. (2004) The Relationship of Cultural Values and Message Strategies in Service Advertising, Marketing Intelligence & Planning, 22(4), 438-454. Taifel, H. (1978) Social Categorization, Social Identity and Social Comparison, in Differentiation between Social Groups: Studies in the Social Psychology of Intergroup Relations, Tajfel, H. (ed.), London: Academic Press. Taylor, S.A., Hunter, G.L. and Lindberg, D.L. (2007) Understanding (Customer-Based) Brand Equity in Financial Services, Journal of Service Marketing, 21(4), 241-252. Tayor, S.A., Celuch, K. and Goodwin, S. (2004) The Importance of Brand Equity to Customer Loyalty, Journal of Product and Brand Management, 13(4), 217-227. Tepeci, M. (1999) Increasing Brand Loyalty in the hospitality industry, International Journal of Contemporary Hospitality Management, 11(5), 223-229. Terawatanavong, C. and Quazi, A. (2006) Conceptualizing the link between national cultural dimensions and B2B relationships, Asia Pacific Journal of Marketing and Logistics, 18(3), 173-183. Thietart, R.A., Girod-Séville, M., Perret, V., Allard-Poesi, F., Maréchal, C., Charreire, S., Durieux, F., Baumard, P., Ibert, J., Grenier, C., Josserand, E., Royer, I., Zarlowski, P., Angot, J., Milano, P., Donada, C., Xuereb, J.M., Drucker-Godard, C., Ehlinger, S., Mbengue, A., Vandangeon-Derumez, I., Donada, C., Angot, J., Forgues, B., Allard-Poesi, F. (2001) Doing Management Research: A Comprehensive Guide, London: Sage.

-411-
Ticehurst, G.W. and Veal, A.J. (2000) Business Research Methods, Australia: Longman. Tractinsky, N., Jarvenpaa, S.L., Vitale, M. and Saarinen, L. (1999) Consumer Trust in an Internet Store: a Cross-Cultural Validation, Journal of Computer-Mediated Communication, 5(2). 1-5. Triandis, H.C., Betancourt, H., Iwao, S., Leung, K., Salazar, J.M., Stetiade, B., Sinha, J.B.P., Touzard, H. and Zaleski, Z. (1993) An Etic-emic Analysis of Individualism and Collectivism, Journal of Cross-Cultural Psychology, 24, 366-383. Trompenaars, F. (1993) Riding the Waves of culture, London: Nicholas Brealey Publishing Ltd. Tse, D.K., Wong, J.K., and Tan, C.T. (1988) Towards Some Standardized Cross-Cultural Consumption Values, Advances in Consumer Research, 15, 387-395. Tsoukatos, E. and Rand, G.K. (2007) Cultural Influences on Service Quality and Customer Satisfaction: Evidence from Greek Insurance, Managing Service Quality, 17(4), 467-485. Tull, D.S. and Hawkins, D.I. (1993) Marketing Research: Measurement and Method (6th ed.), New York: Macrnillian. Turley, L.W. and Moore, P.A. (1995) Brand name strategies in the service sector, Journal of Consumer Marketing, 12(4), 42-50. Veal, A.J. (1997) Research Methods for Leisure and Tourism: A Practical Guide (2nd ed.), London: Pitman Institute of Leisure and Amenity Management. Veloutsou, C. and Moutinho, L. (2009) Brand Relationships through Brand Reputation and Brand Tribalism, Journal of Business Research, 62, 314-322. Verbeke, W., Bagozzi, R.P., and Farris, P. (2006) The Role of Key Account Programs, Trust, and Brand Strength on Resource Allocation in the Channel of Distribution, European Journal of Marketing, 40(5/6), 502-532.

-412-
Vitell, S.J., Nwachukwu, S.L. and Barnes, J.H. (1993) The Effects of Culture on Ethical Decision-Making: An Application of Hofstede‘s Typology, Journal of Business Ethics, 12(10), 753-760. Walker, K. (2010) A Systematic Review of the Corporate Reputation Literature: Definition, Measurement, and Theory, Corporate Reputation Review, 12(4), 357-387. Wang, H., Wei, Y. and Yu, C. (2008) Global Brand Equity Model: Combining Customer-Based with Product-Market Outcome Approaches, Journal of Product and Brand Management, 17(5), 305-316. Washburn, J.H., Till, B.D., and Priluck, R. (2000) Co-Branding: Brand Equity and Trial Effects, Journal of Consumer Marketing, 17(7), 591-604. Weigelt, K. and Camarer C. (1988) Reputation and Corporate Strategy: A Review of Recent Theory and Applications, Strategic Management Journal, 9,443-454. Weiss, A.M., Anderson, E., and Maclnniss, D.J. (1999) Reputation Management as a Motivation for Sales Structure Decisions, Journal of Marketing, 63(4), 74-89. Welman, C. (2006) Research Methodology (3rd ed.), Oxford: Oxford University Press. Welman, C., Kruger, F. and Mitchell, B. (2005) Research Methodology, Oxford: Oxford University Press. Westbrook, R.A. (1987) Product/Consumption-Based Affective Responses and Postpurchase Processes, Journal of Marketing Research, 24, 258-270. Westbrook, R.A. and Oliver, R.L. (1991) The Dimensionality of Consumption Emotion Patterns and Consumer Satisfaction, Journal of Consumer Research, 18, 84-91. Witkowski, T.H., Ma, Y. and Zheng, D. (2003), Cross-Cultural Influence on Brand Identity Impressions: KFC in China and the United States, Asia Pacific Journal of Marketing and Logistics, 15(1/2), 74-88.

-413-
Wood, L. (2000) Brands and Brand Equity: Definition and Management, Management Decision, 38(9), 662-669. Woodruff, R.B., Clemons, S.D., Schumann, D.W., Gardial, S.F. and Burns, M.J. (1991) The Standard Issue in CS/D Research: A Historical Perspective, Journal of Consumer Satisfaction, Dissatisfaction and Complaining Behavior, 4, 103-109. Wright, R. (2006) Consumer Behviour, Thomson; London. Wu, W-Y and Tasi, C-H (2007) The empirical study of CRM: Consumer-company identification and purchase intention in direct selling industry, International Journal of Commerce and Management, 17(3), 194-210. Xu, Y. (2008) The Influence of Public Self-Consciousness and Materialism on Young Consumers‘ Compulsive Buying, Young Consumers, 9(1), 37-48. Yasin, N.M., Noor, M. N. and Mohamad, O. (2007) Does Image of Country-of-Origin Matter to Brand Equity? Journal of Product and Brand Management, 16(1), 38-48. Yoo, B. (2009) Cross-National Invariance of the Effect of Personal Collectivistic Orientation on Brand Loyalty and Equity: The United States versus South Korean consumers, Asia Pacific Journal of Marketing and Logistic, 21(1), 41-57. Yoo, B., and Donthu, N. (2001) Developing and Validating a Multidimensional Consumer-Based Brand Equity Scale, Journal of Business Research, 52(1), 1-14 Yoo, B. and Donthu, N. (2002) Testing Cross-Cultural Invariance of the Brand Equity Creation Process, The Journal of Product and Brand Management, 11(6/7), 380-399. Yoo, B., Donthu, N., and Lee, S. (2000) An Examination of Selected Marketing Mix Elements and Brand Equity, Journal of the Academy of Marketing Science, 28(2), 195-211. Yoo, B. and Lee, S.H. (2009) Buy Genuine Luxury Fashion Products or Counterfeits? Advances in Consumer Research, 36, 280-286.

-414-
Yoon, E., Guffey, H. and Kijewski, V. (1993) The Effects of Information and Company Reputation on Intentions to Buy a Business Service, Journal of Business Research, 27, 215-228. Yoon, Y. and Uysal, M. (2005) An Examination of the Effects of Motivation and Satisfaction on Destination Loyalty: A Structural Model, Tourism Management, 26(1), 45-56. Yuksel, A., Yuksel, F. and Bilim, Y. (2010) Destination Attachment: Effects on Customer Satisfaction and Cognitive, Affective and Conative Loyalty, Tourism Management, 31, 274-284. Yu, Y.T. and Dean, A. (2001) The Contribution of Emotional Satisfaction to Consumer Loyalty, International Journal of Service Industry Management, 12(3/4), 234-250. Zeithaml, V.A. (1988) Consumer Perceptions of Price, Quality, and Value: A Means-End Model and Synthesis of the Evidence, Journal of Marketing, 52(July), 2-22. Zeithaml, V.A. (2000) Service Quality, Profitability, and the Economic Worth of Customers: What We Know and What We Need to Learn, Journal of the Academy of Marketing Science, 28(1), 67-85. Zeithaml, V.A., Berry, L.L. and Parasuraman, A. (1993) The Nature and Determinants of Customer Expectations of Service, Journal of the Academy of Marketing Science, 21(1), 1-12. Zeithaml, V.A., Berry, L.L. and Parasuraman, A. (1996) The Behavioral Consequences of Service Quality, Journal of Marketing, 60(2), 31-46. Zeithaml, V.A., Parasuraman, A. and Berry, L.L. (1990) Delivering Quality Service, New York: A division of Macmillan, Inc. Zikmund, W.G. (2000) Business Research Methods (6th ed.), U.S.A: Harcourt. Zikmund, W.G., Babin, B.J., Carr, J.C. and Griffin, M. (2010) Business Research Methods (8th ed.), Canada: South-Western.

-415-
Zohra, G. (2011) The Role of the Emotion Felt towards A Brand in the Development of the Behavior of Loyalty: An Application in the Sector of Mobile Phones in Tunisia, African Journal of Marketing Management, 3(8), 168-177.


![Psychologia międzykulturowa [Cross-cultural psychology]](https://static.fdokumen.com/doc/165x107/631e5a483dc6529d5d07ecb7/psychologia-miedzykulturowa-cross-cultural-psychology-1675713982.jpg)