A CROSS-CULTURAL COMPARISON AND MODELING OF
337
A CROSS-CULTURAL COMPARISON AND MODELING OF INFORMATION AND COMMUNICATION TECHNOLOGIES ASPECTS AFFECTING MATHEMATICAL AND PROBLEM SOLVING LITERACY AND PERCEPTIONS OF POLICY MAKERS A THESIS SUBMITTED TO THE GRADUATE SCHOOL OF NATURAL AND APPLIED SCIENCES OF MIDDLE EAST TECHNICAL UNIVERSITY BY YUNİS ŞAHİNKAYASI IN PARTIAL FULLFILLMENT OF THE REQUIREMENTS FOR THE DEGREE OF DOCTOR OF PHILOSOPHY IN COMPUTER EDUCATION AND INSTRUCTIONAL TECHNOLOGY JUNE 2008
-
Upload
khangminh22 -
Category
Documents
-
view
1 -
download
0
Transcript of A CROSS-CULTURAL COMPARISON AND MODELING OF

A CROSS-CULTURAL COMPARISON AND MODELING OF
INFORMATION AND COMMUNICATION TECHNOLOGIES ASPECTS AFFECTING MATHEMATICAL AND PROBLEM SOLVING LITERACY
AND PERCEPTIONS OF POLICY MAKERS
A THESIS SUBMITTED TO THE GRADUATE SCHOOL OF NATURAL AND APPLIED SCIENCES
OF MIDDLE EAST TECHNICAL UNIVERSITY
BY
YUNİS ŞAHİNKAYASI
IN PARTIAL FULLFILLMENT OF THE REQUIREMENTS FOR
THE DEGREE OF DOCTOR OF PHILOSOPHY IN
COMPUTER EDUCATION AND INSTRUCTIONAL TECHNOLOGY
JUNE 2008
Approval of the thesis:
A CROSS-CULTURAL COMPARISON AND MODELING OF INFORMATION AND COMMUNICATION TECHNOLOGIES ASPECTS AFFECTING MATHEMATICAL AND PROBLEM SOLVING LITERACY
AND PERCEPTIONS OF POLICY MAKERS
submitted by YUNİS ŞAHİNKAYASI in partial fulfillment of the requirements for the degree of Doctor of Philosophy in Computer Education and Instructional Technology Department, Middle East Technical University by, Prof. Dr. Canan Özgen _____________________ Dean, Graduate School of Natural and Applied Sciences Prof. Dr. M. Yaşar Özden _____________________ Head of Department, Computer Education and Instructional Technology Assoc. Prof. Dr. Soner Yıldırım _____________________ Supervisor, Computer Education and Instructional Technology Dept., METU Examining Committee Members: Assoc. Prof. Dr. Zahide Yıldırım _____________________ Computer Education and Instructional Technology Dept., METU Assoc. Prof. Dr. Soner Yıldırım _____________________ Computer Education and Instructional Technology Dept., METU Assist. Prof. Dr. Yasemin Gülbahar _____________________ Computer Education and Instructional Technology Dept., Başkent University Assoc. Prof. Dr. Kürşat Çağıltay _____________________ Computer Education and Instructional Technology Dept., METU Assist. Prof. Dr. Yeşim Çapa Aydın _____________________ Educational Sciences Dept., METU
Date: 20.06.2008

iii
I hereby declare that all information in this document has been obtained and presented in accordance with academic rules and ethical conduct. I also declare that, as required by these rules and conduct, I have fully cited and referenced all material and results that are not original to this work.
Name, Last name: Yunis Şahinkayası
Signature :
iv
ABSTRACT
A CROSS-CULTURAL COMPARISON AND MODELING OF INFORMATION AND COMMUNICATION TECHNOLOGIES ASPECTS AFFECTING MATHEMATICAL AND PROBLEM SOLVING LITERACY
AND PERCEPTIONS OF POLICY MAKERS
Şahinkayası, Yunis
Ph.D., Department of Computer Education and Instructional Technology
Supervisor: Assoc. Prof. Dr. Soner Yıldırım
June 2008, 316 pages
The purpose of this study was to compare Turkey and the European Union (EU)
regarding aspects (use, self-confidence and attitude) of students’ information and
communication technologies (ICT), the relationships between ICT aspects and mathematical
and problem solving literacy performances, and to understand education policy makers’
perceptions on ICT in Turkey. A multimethod (quantitative and qualitative) research design
was used in this study. Country groups –an EU member group, a new EU member group and
Turkey- were formed on the basis of the status of a country in the EU, and that of having
ICT data in the Programme for International Student Assessment (PISA) 2003.
This study has three focuses. The first focus of the present study was to examine
similarities and differences in ICT use, self-confidence in ICT and attitudes toward
computers in students from Turkey and the EU. The sample of this focus was those students
from the EU member group (N=56,610), the new EU member group (N=24,834) and Turkey
(N=3,231) who participated in the PISA 2003. Multivariate analysis of covariance -
controlling students’ economic, social and cultural status (ESCS) and attitudes toward
computers- and univariate analysis of covariance -controlling ESCS- were conducted to see
whether students’ ICT aspects differ across country groups. The first focus of the present
study indicated that Turkish students have lower self-confidence in using computer and the
Internet and they use the Internet less frequently than students in the EU. Contrary to this,
the findings of this focus revealed that Turkish students have relatively more positive

v
attitudes toward computers and they use program/software more frequently than do students
in the EU.
The second focus of the present study was to model the relationships among ICT
factors and mathematical and problem solving literacy performances of Turkish and the EU
students. The sample of this focus was those students from the EU member group
(N=57,787), the new EU member group (N=25,359) and Turkey (N=3,590) who participated
in the PISA 2003. The proposed path analytic models were separately tested for each country
group. The second focus revealed that students’ socioeconomic and cultural status and self-
confidence in routine computer tasks have positive and medium level relationships with their
mathematical and problem solving literacy performances, for all country groups.
Furthermore, students’ self-confidence in Internet tasks had a positive and low level
relationship with these performances for all country groups. On the other hand, it was found
that students’ frequency of computer and Internet use and their self-confidence in high-level
computer tasks have generally negative and small relationships with these literacy
performances in all country groups.
The third focus aimed to investigate education policy makers’ perceptions of the ICT
policy making and implementation process in Turkey, and their evaluations of the findings
of the quantitative phase of this study. The participants of this focus consisted of seven
education policy makers from the Ministry of National Education and universities in Turkey.
The data, collected with interviews, were content-analyzed by coding data, identifying, and
relating the categories and sub-categories, that is, open, axial and selective coding were
conducted respectively. In the third focus of the present study, participants specified the
primary issues of ICT policy making and the implementing process in Turkey and made
suggestions on these issues. Participants frequently related the findings of the quantitative
phase of this study to the economic, social and cultural status of students.
Keywords: Information and Communication Technologies (ICT) Use, Self-confidence in
ICT, Attitudes toward Computers, Mathematical Literacy Performance, ICT Perceptions of
Education Policy Makers.
vi
ÖZ
BİLGİ VE İLETİŞİM TEKNOLOJİLERİ DEĞİŞKENLERİNİN VE MATEMATİK İLE PROBLEM ÇÖZME OKURYAZARLIĞI MODELLEMESİNİN
KÜLTÜRLER ARASI KARŞILAŞTIRMASI VE YETKİLİLERİN ALGILARI
Şahinkayası, Yunis
Doktora, Bilgisayar ve Öğretim Teknolojileri Eğitimi Bölümü
Tez Yöneticisi: Doç. Dr. Soner Yıldırım
Haziran 2008, 316 sayfa
Bu çalışmanın amacı, Türkiye ile Avrupa Birliği’ndeki (AB) öğrencilerin bilgi ve
iletişim teknolojileri (BİT) boyutlarını (kullanım, özgüven ve tutum), bu boyutların
matematik ve problem çözme okuryazarlık performansıyla ilişkilerini karşılaştırmak, ve
eğitim politikası yetkililerinin BİT algılarını anlamaktır. Bu çalışmada çoklu (nicel ve nitel)
araştırma yöntemi kullanılmıştır. Ülke grupları, -AB üyeleri, yeni AB üyeleri ve Türkiye-
Uluslararası Öğrenci Değerlendirme Programı (PISA) 2003 BİT verisi olan ülkenin AB’deki
statüsüne göre oluşturulmuştur.
Bu çalışmanın üç odağı vardır. Araştırmanın birinci odağı, Türk ve AB
öğrencilerinin BİT kullanımı, BİT özgüveni ve bilgisayara ilişkin tutumlarındaki
benzerlikleri ve farklılıkları incelemektir. Birinci odağın örneklemi, PISA 2003’e katılan AB
üyelerinden 56,610, yeni AB üyelerinden 24,834 ve Türkiye’den 3,231 öğrencidir. Ülke
gruplarındaki öğrencilerin BİT boyutlarında farklılaşmalarına çok yönlü kovaryans analizleri
-öğrencilerin sosyoekonomik ve kültürel durumları -SEKD- ile bilgisayara ilişkin tutumları
kontrol edilerek- ve kovaryans analizi -SEKD kontrol edilerek- ile bakılmıştır. Araştırmanın
birinci odağı, AB’deki öğrencilere göre Türk öğrencilerin bilgisayar ve Internet kullanımında
kendilerine daha az güvendiklerini ve daha az sıklıkta Internet kullandıklarını göstermiştir.
Buna karşın bu odağın bulguları, Türk öğrencilerin AB öğrencilerine göre, nispeten
bilgisayara ilişkin daha olumlu tutuma sahip olduklarını ve daha sık program/yazılım
kullandıklarını açığa çıkarmıştır.
vii
Araştırmanın ikinci odağı, Türk ve AB öğrencilerinin BİT boyutları ile matematik ve
problem çözme okuryazarlık performansları arasındaki ilişkilerin modellemesidir. İkinci
odağın örneklemi, PISA 2003’e katılan AB üyelerinden 57,787, yeni AB üyelerinden 25,359
ve Türkiye’den 3,590 öğrencidir. Öne sürülen path analizi modelleri her bir ülke grubu için
ayrı ayrı test edilmiştir. Çalışmanın ikinci odağı, bütün ülke gruplarında öğrencilerin
sosyoekonomik ve kültürel durumu ve rutin bilgisayar kullanım özgüveni ile matematik ve
problem çözme okuryazarlık performansları arasında orta düzeyde, İnternet kullanım
özgüveni ile bu performanslar arasında düşük düzeyde olumlu ilişki olduğunu ortaya
çıkarmıştır. Öte yandan, bütün ülke gruplarında öğrencilerin bilgisayar ve İnternet kullanım
sıklığı ve ileri düzey bilgisayar kullanım özgüveni ile bu performansları arasında genellikle
düşük düzeyde olumsuz ilişki bulunmuştur.
Araştırmanın üçüncü odağı, eğitim politikasında yetkililerin, bu çalışmanın nicel
bulgularını değerlendirmelerini ve Türkiye’de BİT politikası oluşturma ve uygulama süreci
ile ilgili algılarını araştırmayı amaçlamıştır. Türkiye’deki üniversitelerden ve Milli Eğitim
Bakanlığından eğitim politikasında yetkili yedi kişi bu odağın örneklemini oluşturmaktadır.
Görüşmelerle toplanan veriler üzerinde, veriyi kodlama, kategorileri ve alt kategorileri
tanımlama ve ilişkilendirme yoluyla içerik analizi yapılmıştır. Bu çalışmanın üçüncü
odağında, katılımcılar Türkiye’de BİT politikası oluşturma ve uygulama sürecindeki başlıca
sıkıntıları belirtmişler ve bu sıkıntılara yönelik çözüm önerilerilerinde bulunmuşlardır.
Katılımcılar, araştırmanın nicel kısmının sonuçlarını genellikle, öğrencilerin sosyoekonomik
ve kültürel durumlarıyla ilişkilendirmişlerdir.
Anahtar Kelimeler: Bilgi ve İletişim Teknolojileri (BİT) Kullanımı, BİT Kullanım Özgüveni,
Bilgisayara İlişkin Tutum, Matematik Okuryazarlık Performansı, Eğitim Politikası
Yapanların BİT Algıları.

viii
To my darling supportive wife, Hamide
and my lovely son, Hamdi Emre

ix
ACKNOWLEDGEMENTS
I wish to express my deepest gratitude to my supervisor, Assoc. Prof. Dr. Soner
Yıldırım, for his guidance and criticism. I have learned many things from him throughout my
graduate studies. He provided me with strong encouragement and support for my academic
works. Thank you indeed.
I would like to thanks Assoc. Prof. Dr. Kürşat Çağıltay for his sincere help and all
kind of supports especially in the qualitative phase of this study, a challenging and
demanding job for me. Also, I would like to thank Assist. Prof. Dr. Yeşim Çapa Aydın for
her guidance and detailed feedback especially in statistical analyses of the quantitative phase.
I express my sincere appreciation to the examination committee members, Assist. Prof. Dr.
Yasemin Gülbahar and Assoc. Prof. Dr. Zahide Yıldırım for their valuable comments and
suggestions.
I would like to express my special appreciation and thanks to Assist. Prof. Dr. Ali
Rıza Terzi who led me to enter academic world. Without his encouragement, advice and
directions, most probably I would have continued in my career as a teacher. My special
thanks go to Assist. Prof. Dr. Margaret J-M Sönmez for helping me in proof reading. Also, I
am grateful to Gülhal Çakar, secretary of Graduate School of Natural and Applied Sciences
at METU for her help in informing and guiding me through bureaucratic processes in
graduate schools.
I would like to acknowledge Prof. Dr. M. Yaşar Özden, Dr. Hasan Karaaslan, Dr.
Ömer Delialioğlu and Miraç Banu Gündoğan for their advice, encouragement, and support.
In addition, thanks to research assistants at the CEIT department for providing me with
valuable insights, suggestions and comments.
I also thank to my close relatives and friends, Bülent and Güldane Şahinkayası for
their morale support and encouragement. I offer my biggest thanks to my most favorite
people, my mother, Hatice Bahçıvan, my sisters, Hilal and Nihal Şahinkayası, and relatives-
in-law, Zeliha, Hasan Hüseyin, and Ayşe Yıldırım for the understanding, patience and
support they provided during this study.
Finally, I would like to express my endless gratitude to my wife for her academic
support and patience and to my thoughtful son -just 3 year-old- for his big patience during
this study.

x
TABLE OF CONTENTS
ABSTRACT............................................................................................................................ iv
ÖZ ........................................................................................................................................... vi
ACKNOWLEDGEMENTS.................................................................................................... ix
TABLE OF CONTENTS......................................................................................................... x
LIST OF TABLES................................................................................................................ xiv
LIST OF FIGURES ............................................................................................................. xvii
LIST OF ABBREVIATIONS............................................................................................... xix
CHAPTERS1
1. INTRODUCTION ...........................................................................................................1
1.1 Organisation for Economic Co-Operation and Development.................................. 3
1.2 Programme for International Student Assessment................................................... 4
1.3 Purpose of the Study................................................................................................ 5
1.4 Significance of the Study......................................................................................... 7
1.5 Research Questions.................................................................................................. 8 1.5.1 Quantitative Research Questions.....................................................................8 1.5.2 Qualitative Research Questions.......................................................................9
1.6 Definition of Important Terms................................................................................. 9
2. LITERATURE REVIEW ..............................................................................................11
2.1 ICT-in-Education Policies and Implementations in Turkey .................................. 11 2.1.1 ICT-in-Education Initiatives and Projects .....................................................12
2.1.1.1 Basic Education Project - Phase I...................................................... 14 2.1.1.2 Basic Education Project - Phase II .................................................... 17 2.1.1.3 MONE ADSL Connection Project .................................................... 17 2.1.1.4 Campaign for Supporting Computer Aided Education ..................... 18 2.1.1.5 Education for the Future (in Co-operation with Intel Company) ...... 18 2.1.1.6 E-learning - Education Portal ............................................................ 18
2.1.2 ICT in Primary and Secondary School Curriculum.......................................20
2.2 Studies about the Integration of ICT into Education in Turkey............................. 26 2.2.1 ICT Use, Competency and the Feelings of Students in Turkey.....................37 2.2.2 Comparison of Turkey and the EU in Integration of ICT into K-12 Schools39
2.3 ICT Integration Issues from Other Countries ........................................................ 41
2.4 ICT and Attainment ............................................................................................... 44 2.4.1 International Studies Comparing Student Achievement across Turkey and
the EU ...........................................................................................................44 2.4.2 Meta-analysis Studies ....................................................................................45 2.4.3 ICT and Attainment: International Studies on TIMSS and PISA..................47

xi
2.4.4 Studies on PISA 2003 Dataset.......................................................................50 2.4.4.1 Relationship between Mathematical and Problem Solving Literacy. 53
2.5 Socioeconomic Status of Students and Achievement............................................ 53
2.6 Relationships between ICT use, Self-confidence in ICT and Attitudes toward ICT.............................................................................................................................. 54
2.7 ICT-in-Education Policies and Implementations in the EU .................................. 56 2.7.1 Basic Demographic Data of the Country Groups ..........................................56 2.7.2 Trends in Integration of ICT into Schools in the European Countries ..........61 2.7.3 ICT-in-Education Policies in European Countries ........................................62 2.7.4 Overall Computer Access..............................................................................64
2.7.4.1 Computer and Internet Access at School........................................... 66 2.7.4.2 Computer and Internet Access at Home............................................ 68
2.7.5 ICT in Primary and Secondary School Curriculum in the EU ......................70 2.7.5.1 Primary Education............................................................................. 71 2.7.5.2 General Lower Secondary Education................................................ 72 2.7.5.3 General Upper Secondary Education ................................................ 74
2.7.6 Teachers Specialized in ICT..........................................................................76 2.7.7 In-service Training and Teachers’ Use of ICT ..............................................77 2.7.8 ICT in School of Teacher Education .............................................................78 2.7.9 Shared Responsibility for the Purchase and Maintenance of Hardware........79 2.7.10 Expenditure on Human Resources ..............................................................81
2.8 ICT in Education in the EU ................................................................................... 81
2.9 The Challenges, Roles and Promises of ICT in Education in the EU.................... 85
2.10 ICT-in-Education in the EU................................................................................. 88 2.10.1 ICT-in-Education in the EU Member Group...............................................88
2.10.1.1 Austria ............................................................................................. 88 2.10.1.2 Belgium ........................................................................................... 90 2.10.1.3 Denmark .......................................................................................... 92 2.10.1.4 Finland............................................................................................. 94 2.10.1.5 Germany .......................................................................................... 96 2.10.1.6 Greece.............................................................................................. 98 2.10.1.7 Ireland............................................................................................ 100 2.10.1.8 Italy................................................................................................ 102 2.10.1.9 Portugal ......................................................................................... 105 2.10.1.10 Sweden ........................................................................................ 106 2.10.1.11 The United Kingdom................................................................... 107
2.10.2 ICT-in-Education in the New EU Member Group ....................................110 2.10.2.1 The Czech Republic ...................................................................... 110 2.10.2.2 Hungary......................................................................................... 112 2.10.2.3 Latvia............................................................................................. 114 2.10.2.4 Poland............................................................................................ 116 2.10.2.5 The Slovak Republic ..................................................................... 117
2.11 Summary of the Literature Review.................................................................... 119 2.11.1 ICT-in-Education Policies and Implementations in Turkey ......................119 2.11.2 Issues and Suggestions about Integration of ICT into Education in Turkey
....................................................................................................................121 2.11.3 ICT and Attainment ...................................................................................122 2.11.4 Comparison of Turkey and the EU in ICT Integration into K-12 Schools
....................................................................................................................123

xii
3. METHODOLOGY ......................................................................................................126
3.1 Design of the Study ............................................................................................. 126
3.2 Methodology for the Quantitative Phase of the Study......................................... 127 3.2.1 Population, Sampling, and Sample..............................................................127 3.2.2 Data Collection Instruments ........................................................................130
3.2.2.1 Mathematical Literacy Assessment................................................. 133 3.2.2.2 Problem-Solving Literacy Assessment............................................ 134 3.2.2.3 Student Questionnaire ..................................................................... 135
3.2.2.3.1 The Index of Highest Parental Occupation Status ............ 137 3.2.2.3.2 The Index of Highest Level of Parental Education in Number
of Years of Education ........................................................ 138 3.2.2.3.3 The Index of Home Possessions ....................................... 138
3.2.2.4 Information and Communication Technologies Questionnaire....... 140 3.2.2.4.1 The Meaning of ICT Indexes ............................................ 140
3.2.3 Data Collection Procedure...........................................................................141 3.2.4 Data Sources and Preliminary Statistical Procedures for Data Analyses ....142 3.2.5 Statistical Data Analyses in the study..........................................................145
3.2.5.1 Descriptive Statistics for MANCOVA and ANCOVA ................... 145 3.2.5.2 One-way MANCOVA..................................................................... 147 3.2.5.3 Univariate ANCOVA...................................................................... 150 3.2.5.4 Descriptive Statistics for Path Analytic Models.............................. 151 3.2.5.5 Path Analytic Models ...................................................................... 153
3.2.6 Validity and Reliability ...............................................................................158 3.2.6.1 Content-Related Validity................................................................. 158 3.2.6.2 Construct-Related Validity.............................................................. 160 3.2.6.3 Reliability ........................................................................................ 160
3.2.7 Limitations...................................................................................................161 3.2.8 Missing Data Analysis.................................................................................162 3.2.9 Effect Size ...................................................................................................163
3.3 Methodology for the Qualitative Phase of the Study........................................... 164 3.3.1 Participants ..................................................................................................164 3.3.2 Data Collection Instrument..........................................................................165 3.3.3 Data Collection Procedure...........................................................................167 3.3.4 Data Analysis Procedure .............................................................................168 3.3.5 Validity and Reliability ...............................................................................170 3.3.6 Limitations...................................................................................................171
3.4 Summary of the Methodology ............................................................................. 171 3.4.1 Summary of the Quantitative Methodology ................................................172 3.4.2 Summary of the Qualitative Methodology ..................................................173
4. RESULTS ....................................................................................................................175
4.1 Results for Quantitative Phase of the Present Study............................................ 175 4.1.1 Results of One-Way MANCOVA...............................................................175
4.1.1.1 Answer to Research Question 1 ...................................................... 177 4.1.1.2 Answer to Research Question 2 ...................................................... 179
4.1.2 Results of Univariate ANCOVA .................................................................181 4.1.2.1 Answer to Research Question 3 ...................................................... 181
4.1.3 Path Analytic Models ..................................................................................182 4.1.3.1 Mathematical Literacy Performance Models .................................. 183 4.1.3.2 Problem Solving Literacy Performance Models ............................. 191
4.2 Results for Qualitative Phase of the Present Study.............................................. 200

xiii
4.2.1 Issues in ICT Policy and Implementations in Turkey .................................200 4.2.2 Suggestions for ICT Policy and Implementations in Turkey ......................205 4.2.3 Perceptual Evaluation of ICT Aspects.........................................................210
4.2.3.1 Attitudes toward Computers............................................................ 210 4.2.3.2 Type of ICT Use.............................................................................. 212 4.2.3.3 Self-Confidence in ICT Use ............................................................ 212
4.2.4 Perceiving both the EU Groups regarding ICT ...........................................216 4.2.5 Relationships between PRGUSE, HIGHCONF and ESCS with MATHLIT
and PROBSOL............................................................................................217
4.3 Summary of the Results....................................................................................... 219 4.3.1 Summary of Quantitative Phase ..................................................................219
4.3.1.1 Summary of MANCOVA and ANCOVA....................................... 219 4.3.1.2 Summary of Path Analytic Models ................................................. 223
4.3.2 Summary of Qualitative Phase ....................................................................226
5. DISCUSSION, CONCLUSIONS AND IMPLICATIONS .........................................231
5.1 Comparison of Turkey and the EU Concerning ICT Aspects ............................. 231 5.1.1 Type of ICT Use..........................................................................................231 5.1.2 Self-confidence in ICT Tasks ......................................................................234 5.1.3 Attitudes toward Computers........................................................................239
5.2 Relationships between ICT Aspects and Student Performance........................... 240 5.2.1 Mathematical Literacy Performance Modeling ...........................................240 5.2.2 Problem Solving Literacy Performance Modeling ......................................246
5.3 Issues in and Suggestions for ICT-in-education Policy Making and Implementations in Turkey................................................................................. 246
5.4 Implications and Suggestions for Further Research and Practice........................ 254
REFERENCES .................................................................................................................... 260
APPENDICES A. THE DESCRIPTIVE STATISTICS OF EACH ICT AND ESCS INDEX FOR
COUNTRY GROUPS ...........................................................................................269 B. PISA 2003 ICT QUESTIONNAIRE .....................................................................275 C. INTERVIEWER SCHEDULE – INTERVIEWER ...............................................281 D. INTERVIEW SCHEDULE – BEFORE AND DURING INTERVIEW...............284 E. THE PERMISSION DOCUMENT........................................................................302 F. QUALITATIVE CODING SYSTEM....................................................................303 G. MATHEMATICAL AND PROBLEM SOLVING LITERACY MODELS WITH
T-VALUES FOR COUNTRY GROUPS..............................................................307 H. THE SIMPLIS SYNTAXES FOR THE MATHEMATICAL LITERACY
MODELS FOR COUNTRY GROUPS .................................................................311 I. THE SIMPLIS SYNTAXES FOR THE PROBLEM SOLVING LITERACY
MODELS FOR COUNTRY GROUPS .................................................................313
CURRICULUM VITAE...................................................................................................... 315
xiv
LIST OF TABLES
TABLES Table 2.1 Analysis of Computer Courses’ Curriculum Content until 2003 in Turkey ......... 23 Table 2.2 Key Demographic Indicators and their Definitions ............................................... 58 Table 2.3 Key Demographic Indicators of Country Groups and their Members ................... 59 Table 2.4 Approaches to ICT Defined in the Primary Education Curriculum (ISCED 1),
2000/01 ................................................................................................................. 71 Table 2.5 Approaches to ICT Defined in the General Lower Secondary Education
Curriculum (ISCED 2), 2000/01 .......................................................................... 72 Table 2.6 Annual Number of Hours Recommended for Teaching ICT as a Subject in Its Own
Right in General Lower Secondary Education (ISCED 2), 2000/01.................... 73 Table 2.7 Objectives Defined in the Curriculum for Teaching or Use of ICT in General
Lower Secondary Education (ISCED 2), 2000/01 ............................................... 73 Table 2.8 Objectives Defined in the Curriculum of Lower Secondary (ISCED 2) for the
Teaching or Use of ICT, 2002/2003..................................................................... 74 Table 2.9 Approaches to ICT Defined in the Curriculum of General Upper Secondary
Education (ISCED 2), 2000/01............................................................................. 75 Table 2.10 Objectives Defined in the Curriculum of General Upper Secondary Education
(ISCED 2) for the Teaching or Use of ICT, 2000/01 ........................................... 76 Table 2.11 Specialist ICT Teachers in Primary and Secondary Education (ISCED 1, 2 and 3),
2000/01 ................................................................................................................. 77 Table 2.12 Inclusion of ICT in Preservice Teacher Training Programs for Primary Education
.............................................................................................................................. 78 Table 2.13 Inclusion of ICT in Preservice Teacher Training Programs for Lower Secondary
Education.............................................................................................................. 79 Table 2.14 Inclusion of ICT in Preservice Teacher Training Programs for Upper Secondary
Education.............................................................................................................. 80 Table 2.15 Responsibility for the Purchase and Maintenance of Hardware for Primary and
Secondary Education (ISCED 1, 2, 3) in Projects Under Way in 2000/01 .......... 80 Table 3.1 Country Groups, Members and Countries with ICT Data in PISA 2003 Dataset for
This Study........................................................................................................... 129 Table 3.2 Target and Accessible Populations and Samples for PISA 2003......................... 129 Table 3.3 Sample Sizes with respect to Research Questions and Country Groups ............. 130 Table 3.4 Distribution of Literacy Domains’ Items by Quantity, Allocated Time, and Booklet
Numbers in Pisa 2003......................................................................................... 132 Table 3.5 PISA 2003 Rotated Test Design to Form Booklets ............................................. 133 Table 3.6 Distribution of Mathematical Literacy Categories with Item Formats in PISA 2003
............................................................................................................................ 134 Table 3.7 Distribution of Problem Solving Approaches with Item Formats in PISA 2003. 135 Table 3.8 The ISCED Classification in PISA 2003 ............................................................. 137

xv
Table 3.9 The Index of Economic, Social, and Cultural Status of Students, its Questionnaire Questions, Formats of Questionnaire Questions, Containing Indexes, and Its Items in PISA 2003 ...................................................................................................... 139
Table 3.10 ICT Aspects, Questionnaire Questions, Formats of Questionnaire Questions, ICT Indexes, and Its Items in PISA 2003 .................................................................. 143
Table 3.11 Research Questions, Variables and Statistical Data Analyses of Quantitative Phase................................................................................................................... 146
Table 3.12 Sample Sizes and Basic Descriptive Statistics for Variables............................. 147 Table 3.13 Levene's Test of Equality of Error Variances for MANCOVA......................... 148 Table 3.14 The Multivariate Tests for MANCOVA............................................................ 149 Table 3.15 The Results of the Test of Homogeneity of Slopes for ANCOVA.................... 151 Table 3.16 Sample Size and Basic Descriptive Statistics for Path Analytic Models........... 151 Table 3.17 Correlation Matrix of the Predictor Variables in Mathematical and Problem
Solving Literacy Performance Models for Country Groups............................... 153 Table 3.18 Basic Shapes and Explanations in Path Analysis............................................... 155 Table 3.19 The Alpha Reliability Coefficients of the ICT Indexes and ESCS Index in
Country Groups .................................................................................................. 161 Table 3.20 The Percentages of Missing Values of ICT Indexes in Path Analytic Models .. 163 Table 3.21 Background Information of Interviewees .......................................................... 166 Table 4.1 The Results of One-Way MANCOVA and ANCOVA ....................................... 176 Table 4.2 Adjusted Mean Scores and Standard Errors of ICT Indexes for Country Groups,
Holding ESCS and ATTCOMP Constant .......................................................... 176 Table 4.3 Pairwise Comparison Results of ANCOVAs that are the Follow-up for
MANCOVA ....................................................................................................... 177 Table 4.4 The Results of One-Way ANCOVA.................................................................... 181 Table 4.5 Adjusted Mean Scores and Standard Errors of Attitudes toward Computers,
Controlling for Economic, Social and Cultural Status of Students .................... 182 Table 4.6 Pairwise Comparison Results of a Univariate ANCOVA.................................... 182 Table 4.7 The Fit Index Values of the Mathematical Literacy Performance Model for
Country Groups .................................................................................................. 186 Table 4.8 Measurement Errors of Mathematical Literacy Performance Model for Country
Groups ................................................................................................................ 186 Table 4.9 β (Lowercase Beta) Path coefficients for Mathematical Literacy Performance
Models for Country Groups................................................................................ 187 Table 4.10 γ (Lowercase Gamma) Path coefficients for Mathematical Literacy Performance
Models for Country Groups................................................................................ 187 Table 4.11 Squared Multiple Correlations of Endogenous Variables for Mathematical
Literacy Performance Models for Country Groups ............................................ 188 Table 4.12 Direct Effects of Exogenous Variables on Endogenous Variables of Mathematical
Literacy Performance Models for Country Groups ............................................ 189 Table 4.13 Indirect Effects of Exogenous Variables on Endogenous Variables of
Mathematical Literacy Performance Models for Country Groups ..................... 189 Table 4.14 Total Effects of Exogenous Variables on Endogenous Variables of Mathematical
Literacy Performance Models for Country Groups ............................................ 190 Table 4.15 Regression Equations of Mathematical Literacy Performance Models for Country
Groups ................................................................................................................ 191
xvi
Table 4.16 The Fit Index Values of the Problem Solving Literacy Performance Model for Country Groups .................................................................................................. 195
Table 4.17 Measurement Coefficients of Problem Solving Literacy Performance Model for Country Groups .................................................................................................. 195
Table 4.18 β (Lowercase Beta) Path coefficients for Problem Solving Literacy Performance Models for Country Groups................................................................................ 196
Table 4.19 γ (Lowercase Gamma) Path coefficients for Problem Solving Literacy Performance Models for Country Groups .......................................................... 196
Table 4.20 Squared Multiple Correlations of Endogenous Variables for Problem Solving Literacy Performance Models for Country groups............................................. 197
Table 4.21 Direct Effects of Exogenous Variables on Endogenous Variables of Problem Solving Literacy Performance Models for Country Groups............................... 198
Table 4.22 Indirect Effects of Exogenous Variables on Endogenous Variables of Problem Solving Literacy Performance Models for Country Groups............................... 198
Table 4.23 Total Effects of Exogenous Variables on Endogenous Variables of Problem Solving Literacy Performance Models for Country Groups............................... 199
Table 4.24 Regression Equations of Problem Solving Literacy Performance Models for Country Groups .................................................................................................. 199
Table 4.25 Pairwise Comparison Results of ANCOVAs that are the follow-up of MANCOVA and of Univariate ANCOVA......................................................... 219
Table 4.26 The Negative-Positive Distribution of Country Groups’ Mean and Adjusted Mean Scores in ICT Indexes......................................................................................... 221
Table 4.27 The Ranked Country Groups in terms of Mean and Adjusted Mean Scores in ICT Indexes................................................................................................................ 223
Table 4.28 The Fit Index Values of Mathematical and Problem Solving Literacy Performance Models for All Country Groups .................................................... 224
Table 4.29 Squared Multiple Correlations of Endogenous Variables for Mathematical and Problem Solving Literacy Performance Models for All Country Groups .......... 224
Table 4.30 Standardized Path coefficients for Mathematical and Problem Solving Literacy Performance Models for All Country Groups ................................................... 226
Table 4.31 Summary of Qualitative Results ........................................................................ 229 Table A.1 Descriptive Statistics of Each ICT and ESCS Index for the EU Member Group269 Table A.2 Descriptive Statistics of Each ICT and ESCS Index for the New EU Member
Group.................................................................................................................. 271 Table A.3 Descriptive Statistics of Each ICT and ESCS Index for Turkey......................... 273 Table F.1 The Qualitative Coding System: Categories and Sub-categories ........................ 303

xvii
LIST OF FIGURES
FIGURES Figure 1.1 Hypothesized Path Analytic Mathematical and Problem Solving Literacy
Performance Models for Country Groups ............................................................ 6 Figure 2.1 Computer Competencies that should be gained at each grade in primary education
............................................................................................................................ 22 Figure 2.2 Reasons given by teachers for not using the internet with students, represented in
percentages. Secondary education (ISCED 2 and 3), 2001................................ 42 Figure 2.3 Schedules for ICT project implementation for (a) primary, (b) lower and (c) upper
secondary schools............................................................................................... 63 Figure 2.4 Percentages of 15-year-old students having access to computer at home and/or at
school and at other places on average in PISA 2000 and 2003.......................... 65 Figure 2.5 Percentages of students’ computer access at home and/or at school in country
groups in PISA 2003 .......................................................................................... 66 Figure 2.6 Number of students per computer and number of students per computer with
Internet connection at primary and secondary schools in the EU member group in 2001................................................................................................................ 67
Figure 2.7 Percentages of 15-year-old students who claim to have a computer available at home, in PISA 2000 and 2003............................................................................ 68
Figure 2.8 Percentages of 15-year-old students who claim to have an Internet connection at home, in PISA 2000 and 2003............................................................................ 69
Figure 2.9 Percentages of students having access to computer at home, by national quarters of the index of economic, social and cultural status (ESCS), PISA 2003.......... 70
Figure 3.1 SPSS syntax for testing the parallelism of regression planes ............................. 149 Figure 3.2 An Example of Coding System after Data Analysis .......................................... 170 Figure 4.1 Adjusted Mean Scores on Internet/Entertainment use for Country Groups ....... 178 Figure 4.2 Adjusted Mean Scores on Program/Software use for Country Groups .............. 178 Figure 4.3 Adjusted Mean Scores on Confidence in Routine Tasks for Country Groups ... 179 Figure 4.4 Adjusted Mean Scores on Confidence in Internet Tasks for Country Groups ... 180 Figure 4.5 Adjusted Mean Scores on Confidence in High Level Tasks for Country Groups
.......................................................................................................................... 180 Figure 4.6 Adjusted Mean Scores on Attitudes toward Computers for the Three Groups .. 182 Figure 4.7 Structural Model of Mathematical Literacy Performance for the EU Member
Group (Coefficients in Standardized Value) .................................................... 184 Figure 4.8 Structural Model of Mathematical Literacy Performance for the New EU Member
Group (Coefficients in Standardized Value) .................................................... 184 Figure 4.9 Structural Model of Mathematical Literacy Performance for Turkey (Coefficients
in Standardized Value) ..................................................................................... 185 Figure 4.10 Structural Model of Problem Solving Literacy Performance for the EU Member
Group (Coefficients in Standardized Value) .................................................... 193

xviii
Figure 4.11 Structural Model of Problem Solving Literacy Performance for the New EU Member Group (Coefficients in Standardized Value)...................................... 193
Figure 4.12 Structural Model of Problem Solving Literacy Performance for Turkey (Coefficients in Standardized Value) ............................................................... 194
Figure 4.13 Eta Squares of ANCOVA that are follow-ups to MANCOVA and of Univariate ANCOVA for ICT Indexes .............................................................................. 220
Figure 4.14 Mean and Adjusted Mean Scores in MANCOVA in ICT Indexes for Country Groups .............................................................................................................. 221
Figure 4.15 The Difference between Adjusted Mean Scores (in MANCOVA and a Univariate ANCOVA) and Mean Scores ......................................................... 222
Figure G.1 Structural Model of Mathematical Literacy for the EU Member Group (t-values).......................................................................................................................... 307
Figure G.2 Structural Model of Problem Solving Literacy for the EU Member Group (t-values) .............................................................................................................. 308
Figure G.3 Structural Model of Mathematical Literacy for the New EU Member Group (t-values) .............................................................................................................. 308
Figure G.4 Structural Model of Problem Solving Literacy for the New EU Member Group (t-values) .............................................................................................................. 309
Figure G.5 Structural Model of Mathematical Literacy for Turkey (t-values) .................... 309 Figure G.6 Structural Model of Problem Solving Literacy for Turkey (t-values) ............... 310

xix
LIST OF ABBREVIATIONS
AC: Academician ACER: Australian Council for Educational Research ADSL: Asymmetric Digital Subscriber Line AGFI: Adjusted Goodness of Fit Index ANCOVA: Analysis of Covariance AT: Austria ATTCOMP: Attitudes toward Computers BE: Belgium BE de: German Community of Belgium BE fr: French Community of Belgium BE nl: Dutch Community of Belgium BEP: Basic Education Project BILGEM: Bilgisayar Eğitimi ve Hizmetleri Genel Müdürlüğü (General Directorate of Computer Education and Services) CAE: Computer Assisted Education CAI: Computer Assisted Instruction CD-ROM: Compact Disk Read Only Memory CEIT: Computer Education and Instructional Technology CFA: Confirmatory Factor Analysis CITO: National Institute for Educational Measurement CLS: Computer Laboratory Schools CES: Computer Experimental Schools CZ: Czech Republic DE: Deutschland DK: Denmark EL: Greece ESCS: Economic, Social, and Cultural Status of Students ETS: Educational Testing Service EU: European Union FI: Finland GDP: Gross Domestic Product GFI: Goodness of Fit Index GNI: Gross National Income HIGHCONF: Self-confidence in High-Level Tasks HISEI: Index of Highest Parental Occupation Status HOMEPOS: Index of Home Possessions HU: Hungary ICT: Information and Communication Technologies IE: Ireland ILS: Integrated Learning Systems INTCONF: Self-confidence in Internet Tasks INTUSE: Internet/Entertainment Use IRT: Item Response Theory ISCED: International Standard Classification of Education ISCO: International Standard Classification of Occupations
xx
ISEI: International Socioeconomic Index of Occupational Status IST: Information Society Technologies Programme IT: Italy (only used in tables and figures) IT: Information Technology K-12: Kindergarten through the Twelfth Grade K-8: Kindergarten through the Eighth Grade LISREL: LInear Structural RELationship LV: Latvia M: Mean MA: Master of Arts MANCOVA: Multivariate Analysis of Covariance MATHLIT: Mathematical Literacy Performance of Students METU: Middle East Technical University MLO: Müfredat Laboratuar Okulları (Curriculum Laborotory Schools) MONE: Turkish Ministry of National Education NGOs: Non-Governmental Organizations NIER: National Institute for Educational Research NPMs: National Project Managers ODL: Open and Distance Learning OECD: Organisation for Economic Co-operation and Development OKS: Ortaöğretim Kurumları Öğrenci Seçme ve Yerleştirme Sınavı (Secondary Education Institutions Student Selection and Placement Examination) PARED: Index of Highest Level of Parental Education in Number of Years of Education PGB: PISA Governing Board PI: Policy Implementer PIRLS: Progress in International Reading Literacy Study PISA: Programme for International Student Assessment PL: Poland PM: Policy Maker PRGUSE: Program/Software Use PROBSOL: Problem Solving Literacy Performance of Students PT: Portugal PVs: Plausible Values RMSEA: Root Mean Square Error of Approximation ROUTCONF: Self-confidence in Routine Tasks SD: Standard Deviation SE: Sweden (only used in tables and figures) SE: Standard Error SEM: Structural Equation Modeling SES: Socioeconomic Status SK: Slovak Republic SMEG: Subject Matter Expert Group SPSS: Statistical Package for the Social Sciences S-RMR: Standardized Root Mean Square Residual TBŞ: Türkiye Bilişim Şurası (Turkish Informatics Council) TIMSS: Third International Mathematics and Science Study TR: Turkey TTKB: Talim ve Terbiye Kurulu Başkanlığı (Authority of the Turkish Education Board) UK: United Kingdom UK E: United Kingdom-England UK NI: United Kingdom-Northern Ireland UK SC: United Kingdom-Scotland UK W: United Kingdom-Wales

xxi
USA: United States of America VET: Vocational Education and Training School WLE: Weighted Likelihood Estimates WWW: World Wide Web YÖK: Yüksek Öğretim Kurulu (Higher Education Council)
1
CHAPTERS CHAPTER 1
1. INTRODUCTION
Countries have entered the new millennium with such interdependent challenges as
insufficient economic conditions, increasing population, huge information explosion, that
they lead respectively to low standards of living, inadequate quality in education, and the
need to access, process and share information. In order to cope with these challenges,
governments have recognized that using new approaches in their education systems plays a
key role in educating a large number of citizens, and in this way the other challenges can
also be overcome more effectively and efficiently. Information and communication
technologies (ICT) with their potential for innovation and change can be considered as a new
approach in education systems in order to respond to the changing needs.
Contrary to these challenges, there have been some rapid developments in scientific,
industrial, technological and educational areas especially in last three decades. Pelgrum and
Law (2003) describe the evolution of computers in education. When the products from these
developments, particularly technological ones such as microcomputers, have became
affordable for end users in the early 1980s, the concept of ‘computers in education’ was
included in the agenda of education policy makers. This situation was primarily supported by
the governments with the fear of loosing the technology race. Then, at the end of the 1980s,
the focus shifted from computing technology to storing and retrieving information, thereby
the concept of ‘information technology’ (IT) superseded the concept of ‘computers in
education’. Later on, in conjunction with the spread of e-mail to the general public, IT was
replaced by the new concept of ‘information and communication technologies’, in the early
1990s (Pelgrum & Law, 2003).
Initially, although the expectations about effectiveness and motivation in education
were very closely related to the introduction of microcomputers in education systems, a great
number of surveys revealed that ICT were used mainly as a supplement to the curriculum
and rarely as tools integrated in a traditional learning environment. This led many policy
makers to feel great disappointment, whereby the investments in hardware, professional
development and research programmes on ICT were diminished between the years 1992 and
2
1995. However, with the availability of the World Wide Web (WWW), the political focus
was once more, and quickly, shifted to ICT (Pelgrum & Law, 2003).
With ubiquitous impact of WWW, and the proliferation and utilization of ICT in
goods and services in public and private sectors have become pervasive in almost all areas of
life. ICT and its facilities have become increasingly common in peoples’ daily activities in
their professional, social and cultural lives, as well. Accordingly, people needed to adopt ICT
related developments and integrate ICT as a basic functional requirement into their personal
and professional lives. On this account, governments as policy makers need to develop
successful ICT policies for their national education systems, and to provide and monitor their
implementations in order to make their citizens acquire ICT literacy.
Experts from education, government, non-governmental organizations (NGOs),
labor, and the private sector, in the international ICT literacy panel convened by the
Educational Testing Service (ETS), defined ICT literacy as “using digital technology,
communications tools, and/or networks to access, manage, integrate, evaluate, and create
information in order to function in a knowledge society” (Kirsch et al., 2007, p.2).
Considering this definition and the growing importance, and ubiquity of the ICT concept in
almost all aspects of the life, the governments investing in their human capital aim to have
their citizens ICT literate in order to transform their society into a ‘knowledge society’.
Having ICT literacy requires citizens to gain ICT competency, such as knowing how to
collect, apply, interpret and represent, evaluate, and generate information. Therefore,
inevitably, governments should provide their citizens with ICT competency in compulsory
education.
In the research literature, there are many rationales why ICT should be included in
education. They can be categorized into three broad groups: (1) economic (or vocational,
professional) rationales, (2) social (or public, cultural, personal) rationales and (3)
educational (or pedagogical, cognitional) rationales. Firstly, the economic rationale forces
employees in many work areas to have ICT competency, which leads to a high quality in
employment and employability for the current and future economy. This rationale involves
employees in different workforce categories in almost all areas of employment having ICT
literacy to some degree. Furthermore, there is a global expectation and trend that nations
with ICT literate societies benefit economically from ICT use (OECD, 2001a; Markauskaite,
2006).
Secondly, as to the social rationale, since traditional life and emerging e-activities (e-
learning, e-communities, and e-commerce etc.) with ICT facilities have gradually established
coherent association, having ICT competency is considered an essential ‘life skill’, which is

3
both a ‘requirement’ and a ‘right’ in providing full participation in the knowledge society for
all citizens. In other words, the members of society with little or no ICT literacy can not
independently use any public or private services through ICT (OECD, 2001a; Markauskaite,
2006).
Thirdly, the pedagogical rationale concentrates on the role of ICT in enhancing the
breadth and richness of students’ learning. In this respect, governments have been
encouraging especially their youths both to be ICT literate and to enhance their learning with
ICT facilities within their formal education system, which prepares them for the future of
their society. In meeting the basic needs rationalized from economic, social and pedagogical
issues, involving ICT literacy in compulsory education seems to be the most reasonable
approach in delivering ICT literacy education from the point of view of both citizens and
governments. These three rationales are growing in cooperation and convergence and there is
an increasing positive interaction between them (OECD, 2001a; Markauskaite, 2006).
In education, there are several ICT use areas, namely, such instructional tasks as
preparation of lessons, teaching delivery, measurement and evaluation, and such managerial
tasks as databases for students and schools, communication and sharing information. Aşkar
and Olkun (2005) classified the major effects of ICT use on education into three areas: (1)
when learning to use ICT as instructional tools is considered, it is important in terms of
preparing students for life. In this context, ICT as a purpose is an integral part of the school
curriculum; (2) using ICT in teaching and learning activities has transformed ICT into an
essential tool; (3) ICT has been changing the role of teachers in education; acquisition of ICT
knowledge and skills by teachers is now a necessity.
This study aims to understand the relationships between aspects of ICT (ICT use,
self-confidence in ICT, attitudes toward computers), the economic, social, and cultural status
of students (ESCS), and mathematical and problem solving literacy performance across
country groups (an EU member group, a new EU member group and Turkey) through the
dataset of the Programme for International Student Assessment (PISA) 2003, conducted by
the Organisation for Economic Co-operation and Development (OECD).
1.1 Organisation for Economic Co-Operation and Development
The OECD was established in 1961, and located in Paris. The OECD is an
organization that it consists of 30 member countries, committed to democracy and the
market economy. The mission of the OECD covers: supporting economic growth; boosting
employment; raising the standards of living; maintaining financial stability; assisting other
countries’ economic development; and contributing to growth in world trade. It is based on

4
three administrative powers: Council (oversight and strategic direction); Committees
(discussion and implementation); and Secretariat (analysis and proposals). The Directorate
for Education, affiliated to the Secretariat of the OECD, helps the members reach high-
quality learning, contributing to personal development, sustainable economic growth and
social cohesion. Furthermore, it assists countries in designing, developing and implementing
effective educational policies so as to respond to challenges related to education systems.
Moreover, it concentrates on outcomes of education in terms of their evaluation and
improvement processes. These lead to improved quality of teaching and learning (OECD,
2006a, 2006b, n.d).
The OECD is one of the world's largest and most reliable sources of
comparable economic and social statistical data and their related publications. It researches
social changes and evolving patterns in trade, environment, agriculture, technology, fiscal
policy, and education. Accordingly, the OECD helps governments compare policy
experiences; seek answers to common problems; identify good practice; and coordinate
national and international policies; and thereby the governments can develop policies and/or
adopt strategic orientations through deciphering emerging issues and identifying policies that
work. Furthermore, it makes specifically regular peer reviews about the education systems of
members and non-members, and presents progress in education and training systems in an
annual compendium including statistics and indicators. For example, the Programme for
International Student Assessment (PISA) provides information on investigations into long-
range trends and innovations in achievement levels of 15-year-old students, every three
years, in education (OECD, 2006a, 2006b, n.d).
1.2 Programme for International Student Assessment
In 1997, the OECD launched a three-year cycled programme going under the name
of the Programme for International Student Assessment (PISA) in order to respond to
demands for regular, reliable and valid data on the knowledge and skills of students,
educational demographics and the performance of the education systems. The first study
(cycle) took place in 2000, the second one in 2003 and the third one in 2006. It will be
continued by the same token. Since the PISA surveys provide global and regular data, they
allow countries to monitor their progress, to compare their performance with the best
practices of the others, and to check whether educational goals are met or not. This leads to
improvements in their educational systems, through modeling on more successful ones, if
appropriate (Downes, 2005; PISA, n.d.).

5
Moreover, it is the only international education survey which focuses on 15-year-old
students, who are almost at end of compulsory education in schools. In this context, the
PISA seeks answers to the following questions, concerned by all stakeholders: Do schools
prepare young people for the challenges of adult life? (public policy issue); How do young
adults analyze, reason and communicate effectively when they examine, interpret and solve
real life problems rather than any discipline in school curricula? (literacy issue); and Do
young people know what, why and how to learn knowledge and skills? (lifelong learning
issue). It measures not only students’ performance in reading, mathematics, and science
literacy –not focusing on the curriculum– but also students’ motivations, beliefs about
themselves, and learning strategies. Therefore, it is considered unique among other
international studies. With its student and ICT questionnaire, the PISA also collects
contextual data on students’ demographics, socioeconomic status (SES), and computer
familiarity (PISA, n.d.).
1.3 Purpose of the Study
This study has a multimethod research design. It has quantitative and qualitative
phases, with separate main purposes. The main purpose of the quantitative phase is three-
fold: first to reanalyze the PISA 2003 dataset with respect to aspects of ICT controlling
ESCS and attitudes toward computers, across country groups; second to model the
relationships between mathematical literacy performance and affecting factors, such as
aspects of ICT and ESCS, by using the PISA 2003 dataset across country groups; and third
to model the relationships between problem solving literacy performance and those other
factors across country groups.
On the other hand, the main purpose of the qualitative phase is to investigate
exemplary education policy makers’ perceptions of the quantitative phase results of this
study and of issues and possible solutions in ICT policy making and implementations in
Turkey.
Along with reanalyzing ICT aspects in the PISA 2003 dataset in the quantitative
phase, the factors affecting mathematical and problem solving literacy performance of
students in PISA 2003 are tested with proposed path analytic models. The proposed models
are not only designed on the basis of the previously developed models (Erbaş, 2005; İş Güzel
& Berberoğlu, 2005), but also developed through considering the most meaningful
modification indexes during testing the models. First of all, the mathematical and problem
solving literacy performance of students, endogenous variables, are supposed to be directly
affected by ICT aspects (exogenous variables), but then the economic, social and cultural

6
ROUTCONF
PRGUSE
INTUSE
INTCONF
HIGHCONF
ESCS
ATTCOMP
MATHLIT / PROBSOL
status of students is also regarded as an important factor affecting the literacy performance of
students (Yang, 2003). Finally, although students’ attitudes toward computers can be
considered as an aspect of ICT strongly affecting the ICT literacy of students, it is also
considered as both a predictor and a criterion variable, moderating relationships between
other ICT aspects, the economic, social and cultural status of students and the literacy
performance of students. These models of mathematical and problem solving literacy
performance for country groups are given in Figure 1.1. These models are evaluated to
interpret similarities and differences in relation to the relationships between ICT aspects,
ESCS, mathematical and problem solving literacy performance across country groups.
Country groups are formed on the basis of the status of a country in the EU, (i.e., being an
EU member, a new EU member or a candidate state -only Turkey is considered- in this
study) and that of having ICT data in the PISA 2003 study. In this sense, the partial endeavor
of this study is to pursue answers to the following questions “Which path analytic models
explain the relationships between ICT aspects and mathematical and problem solving
literacy performance of students in PISA 2003 across country groups, considering ESCS?”
and “How well do the proposed models explain the variance in student performance of
mathematical and problem solving literacy performance in PISA 2003 across country
groups, considering ICT aspects and ESCS?”.
Figure 1.1 Hypothesized Path Analytic Mathematical and Problem Solving Literacy Performance Models for Country Groups

7
In the modeling part, students’ responses to assessment instruments, ICT and student
questionnaires in PISA 2003, are used to generate and test path analytic models. Since
related items in questionnaires have already been grouped by PISA experts to obtain
composite scores (called indexes) for ICT and ESCS, the path analytic models are
conceptually and theoretically generated and tested by using these indexes in the PISA 2003
dataset. Consequently, two path analytic models are proposed to give the best explanations
of the factors affecting mathematical and problem solving literacy performance across
country groups.
With the emergence and demands for ICT and its facilities, particularly educational
settings, the ICT related factors, -namely PRGUSE: Programs/software use, INTUSE:
Internet/entertainment use, ROUTCONF: Confidence in routine tasks, INTCONF:
Confidence in Internet tasks, HIGHCONF: Confidence in high-level tasks, ATTCOMP:
Attitudes toward computers-, and students’ background variable –ESCS: Economic, Social,
and Cultural Status of Students- are considered as factors influencing students’ mathematical
and problem solving literacy performance (MATHLIT and PROBSOL) in the two proposed
models (see Figure 1.1).
1.4 Significance of the Study
In this study, a multimethod (quantitative and qualitative) research design is used to
explore, compare, and understand the relationships between ICT aspects, mathematical and
problem solving literacy performance, and student background information across the EU
member group, the new EU member group and Turkey. Thus, this study puts forth some
information and suggestions about differences and similarities in terms of students’
perceived ICT use, self-confidence in ICT and attitudes toward computers, which may
reflect ICT policies and implementations across country groups. In the integration process of
Turkey into the EU, this valuable comparison is likely to point out the general status and
needs for changes in ICT policy, and its implementations for decision-making powers in the
Turkish education system. Correspondingly, in order to compare and understand the relative
strengths and weaknesses of students from Turkey and the EU in aspects of ICT, multivariate
analyses are conducted to investigate how well the students seem to be prepared to meet
today’s requirements for basic ICT knowledge and skills.
This study aims to help academicians, educational curriculum planners, and policy
makers amend their perceptions, beliefs, and perspectives, and this leads to suggestions for
initiate some changes in ICT policy in Turkish education, either in the short term or in the
long run. Since the findings of this study give information about perceived ICT aspects and
8
the relationships between ICT aspects and the mathematical and problem solving literacy
performance of international young adults along with their socioeconomic and cultural
status, this research provides national education policy makers with a powerful and helpful
tool to understand what ICT related factors will probably be effective in explaining students’
literacy performances in their contexts. More specifically, this study is important in
clarifying relationships between ICT aspects, student background information, and
mathematical and problem solving literacy performance at a macro level across different
cultural settings in PISA 2003, which sheds light on the question of how to utilize ICT in
gaining mathematical and problem solving literacy performance. Furthermore, the results of
this study may provide education policy makers and authorized educators with a general
guidance and insight -especially with path analytic models- in order to understand how ICT
aspects enhance -or impede- the mathematical and problem solving literacy performance of
students.
There is a gap, in the accessed literature, on researching the relationships between
ICT aspects and mathematical and problem solving literacy performance. In this sense, this
study is new and it is expected that it may contribute to the literature on this issue. It is
important to note that both working on a robust, reliable and valid dataset and the scope of
this research are likely to increase the significance of this study. In addition to these, it is
hope that this study will stimulate further studies to investigate and model ICT related
variables in cross-cultural settings.
1.5 Research Questions
More specifically, the following research questions have been investigated in the
present study.
1.5.1 Quantitative Research Questions
1. How does ICT use –Internet/Entertainment Use and Program/Software Use– differ
among students in PISA 2003 across the EU member group, the new EU member
group and Turkey (country groups) when the effects of students’ attitudes toward
computers and economic, social and cultural status are controlled?
2. How does the self-confidence in ICT –Confidence in Routine Tasks, Confidence in
Internet Tasks and Confidence in High Level Tasks– differ among students in PISA
2003 across country groups when the effects of students’ attitudes toward computers
and economic, social and cultural status are controlled?
9
3. How do attitudes toward computers differ among students in PISA 2003 across
country groups when the effect of students’ economic, social and cultural status is
controlled?
4. How well do ICT related factors and student family background explain variances of
the PISA 2003 students’ mathematical literacy performance across country groups?
5. How well do ICT related factors and student family background explain variances of
the PISA 2003 students’ problem solving literacy performance across country
groups?
1.5.2 Qualitative Research Questions
1. How do Turkish education policy makers evaluate the quantitative findings of this
study across Turkey and the EU?
2. According to Turkish education policy makers, what are the issues in developing and
implementing an ICT-in-education policy in Turkey?
3. What are the Turkish education policy makers’ suggestions for developing and
implementing an ICT-in-education policy in Turkey?
1.6 Definition of Important Terms
ICT in PISA: “The use of any equipment or software for processing or transmitting digital
information that performs diverse general functions whose options can be specified or
programmed by its user” (OECD, 2005a, p. 239).
Literacy in PISA: “The capacity of students to apply knowledge and skills and to analyze,
reason and communicate effectively as they pose, solve and interpret problems in a variety of
situations” (OECD, 2004b, p. 23).
ICT Literacy in PISA: “ICT literacy is the interest, attitude, and ability of individuals to
appropriately use digital technology and communication tools to access, manage, integrate,
and evaluate information, construct new knowledge, and communicate with others in order
to participate effectively in society” (Lennon, Kirsch, Davier, Wagner & Yamamoto, 2003,
p. 8).
ICT indexes (variables): ICT indexes are Internet/Entertainment Use (INTUSE),
Programs/Software Use (PRGUSE), Self-confidence in Routine Tasks (ROUTCONF), Self-
confidence in Internet Tasks (INTCONF), Self-confidence in High-Level Tasks
(HIGHCONF), and Attitudes toward Computers (ATTCOMP). Each ICT index is a
composite score derived from related observational data collected via an ICT Questionnaire.
These indexes are called scale indexes. The key objective in generating the scale indexes is
10
to make internationally valid comparisons (OECD, 2005b, p. 272). Detailed explanations
about the ICT indexes are given in the Chapter 3.
Economic, Social, and Cultural Status of Students (ESCS): The ESCS index for PISA
2003 was derived from three variables related to family background: highest level of parental
education (in number of years of education), highest parental occupation and number of
home possessions (OECD, 2005b, p. 316). Detailed explanations about the ESCS index are
given in Chapter 3.
Mathematical Literacy Performance (MATHLIT): “An individual’s capacity to identify
and understand the role that mathematics plays in the world, to make well-founded
judgments and to use and engage with mathematics in ways that meet the needs of that
individual’s life as a constructive, concerned and reflective citizen” (OECD, 2003a, p. 15,
2005b, p. 14). Detailed explanations of MATHLIT are given in Chapter 3.
Problem Solving Literacy Performance (PROBSOL): “An individual’s capacity to use
cognitive process to confront and resolve real, cross-disciplinary situations where the
solutions path is not immediately obvious and where the literacy domains or curricular areas
that might be applicable are not within a single domain of mathematics, science or reading”
(OECD, 2003a, p. 15, 2005b, p. 14). Detailed explanations of PROBSOL are given in
Chapter 3.
Basic Education School (K-8): Schools offering primary education and lower secondary
education.
Optional Computer Course: Provided that schools have IT room and computer teacher,
Optional Computer Course is offered to students. It is not included in compulsory or core
curriculum of K-12.

11
CHAPTER 2
2. LITERATURE REVIEW
Considering the research questions, a comprehensive literature review is conducted
and presented in this chapter. Firstly, ICT-in-education policies and implementations in
Turkey and studies about integration of ICT into education in Turkey and integration issues
from other countries are given. Then, studies on ICT and attainment are gathered under the
following titles: meta-analysis studies on ICT and attainment, international ICT and
attainment studies on TIMSS and PISA, and studies on the PISA 2003 dataset. Afterwards,
the SES of students and achievement is given. ICT-in-education policies and
implementations in the EU are then presented. ICT in education in the EU is also given.
Finally, information on some demographics, education systems and ICT policy and
implementations for each member in the EU groups is also presented.
2.1 ICT-in-Education Policies and Implementations in Turkey
Computers have had more priority than any other educational technology in the
Turkish education system (Akkoyunlu & Orhan, 2001). This is mainly due to the fact that
computer literacy is one of the most important abilities that students need in their future
social and professional life. Indeed, since 1984 the national policy of the Turkish Ministry of
National Education (MONE) on information technology (IT) had been stated as “to equip all
levels in the education system with technology to catch the information age, to be a
knowledgeable and technological society, to educate people who think nationally and
universally; and to increase competition of our people and society continuously” (MONE,
2002, para. 1).
In a 1999 policy paper, MONE “views IT as a tool that children, teachers and
administrators can use comfortably in their daily routines and as an integral part to and
supportive of the curriculum offered to the children” (MONE, 1999, p.4). More specifically,
MONE claims that technology should be an integral part of basic education due to the
following three rationales:
12
• Widespread use of technology in almost all professional areas in society in the 21st
century necessitates students acquiring computer skills.
• Since one of the tasks of a school is to prepare the individuals for the community,
integration of changing and developing technologies into education will both
improve the quality of education and support economic and social development.
• Technology as an effective tool leads to enhancing learning environment,
increasing students’ motivation, retention, and increasing problem solving and
critical thinking skills (MONE, 1999, p. 5).
It could be said that in the earlier ICT policy statement of MONE, the hardware issue
was more emphasized than software and curriculum integration issues like teacher training,
curriculum and technical and pedagogical support. Even though integration of ICT into the
whole basic education curriculum was stated in a 1999 policy paper, the curriculum was not
changed; thus, by 2003 the expected ICT integration had not come out in practice.
In order to integrate ICT into education, some initiatives and projects had been
conducted within the framework of National Education Development Project and Basic
Education Project phase I up to 2003. The following ones were been launched after that:
Basic Education Project phase II, MONE Project for Accessing Internet, Education for the
Future (in Co-operation with Intel Company), Learning Centres, Foreign Language Teaching
Through Distance Learning at International Standards, Vocational Training Through
Distance Learning at International Standards, and E-learning - Education Portal (UNESCO,
2004). Projects only directly related to ICT integration in primary and secondary education
schools are given below.
2.1.1 ICT-in-Education Initiatives and Projects
Use of information technologies in education began with establishing the Specialized
Commission on Computer Education at Secondary Schools in 1984 (MONE, 2003). In that
year, the Computer Aided Instruction Project was initiated and 1,100 microcomputers were
bought for secondary schools. In the 1985-86 school year, 1,111 computers were bought for
an additional 101 secondary schools (10+1 computers for each school). In-service training
was provided for two teachers from each of these schools (MONE, 2003). Additionally, with
a project started in the 1985-86 school year, 130 computers were sent to 13 vocational high
schools related to commerce and tourism. After in-service training of teachers, an optional
computer course was added to the curriculum of secondary schools in the 1987-1988 school
year (MONE, 2003). MONE decided and planned to equip 500 secondary and vocational
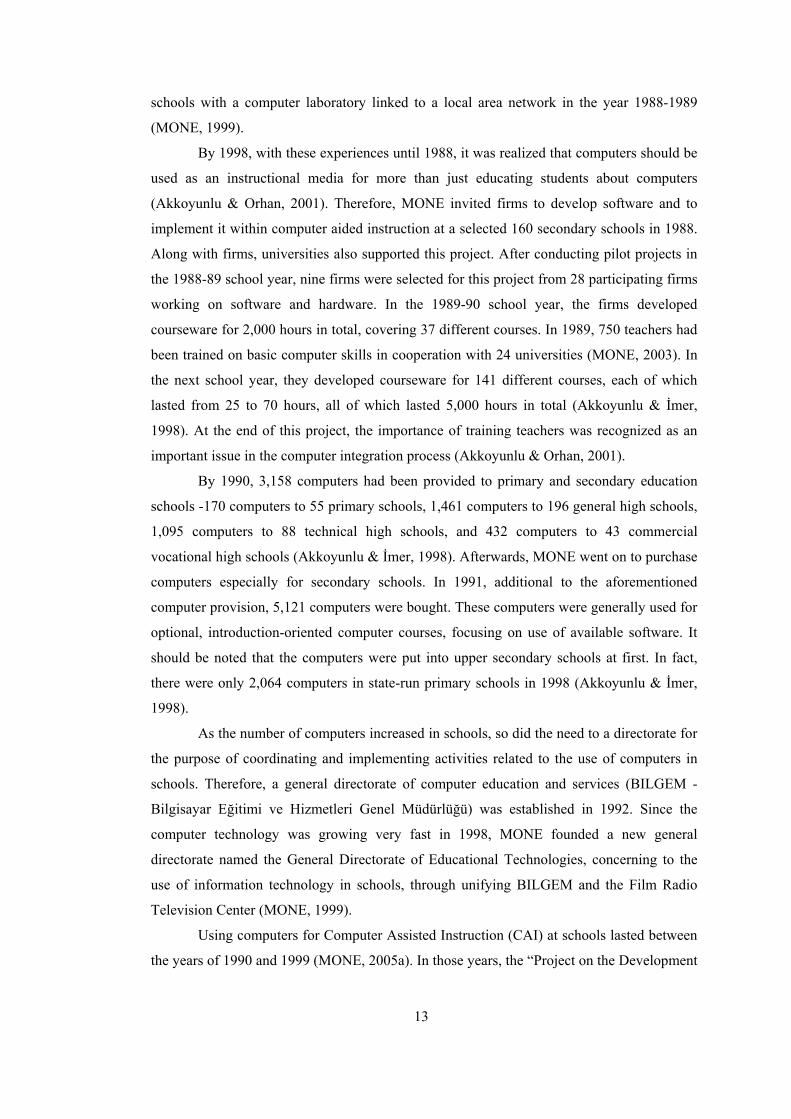
13
schools with a computer laboratory linked to a local area network in the year 1988-1989
(MONE, 1999).
By 1998, with these experiences until 1988, it was realized that computers should be
used as an instructional media for more than just educating students about computers
(Akkoyunlu & Orhan, 2001). Therefore, MONE invited firms to develop software and to
implement it within computer aided instruction at a selected 160 secondary schools in 1988.
Along with firms, universities also supported this project. After conducting pilot projects in
the 1988-89 school year, nine firms were selected for this project from 28 participating firms
working on software and hardware. In the 1989-90 school year, the firms developed
courseware for 2,000 hours in total, covering 37 different courses. In 1989, 750 teachers had
been trained on basic computer skills in cooperation with 24 universities (MONE, 2003). In
the next school year, they developed courseware for 141 different courses, each of which
lasted from 25 to 70 hours, all of which lasted 5,000 hours in total (Akkoyunlu & İmer,
1998). At the end of this project, the importance of training teachers was recognized as an
important issue in the computer integration process (Akkoyunlu & Orhan, 2001).
By 1990, 3,158 computers had been provided to primary and secondary education
schools -170 computers to 55 primary schools, 1,461 computers to 196 general high schools,
1,095 computers to 88 technical high schools, and 432 computers to 43 commercial
vocational high schools (Akkoyunlu & İmer, 1998). Afterwards, MONE went on to purchase
computers especially for secondary schools. In 1991, additional to the aforementioned
computer provision, 5,121 computers were bought. These computers were generally used for
optional, introduction-oriented computer courses, focusing on use of available software. It
should be noted that the computers were put into upper secondary schools at first. In fact,
there were only 2,064 computers in state-run primary schools in 1998 (Akkoyunlu & İmer,
1998).
As the number of computers increased in schools, so did the need to a directorate for
the purpose of coordinating and implementing activities related to the use of computers in
schools. Therefore, a general directorate of computer education and services (BILGEM -
Bilgisayar Eğitimi ve Hizmetleri Genel Müdürlüğü) was established in 1992. Since the
computer technology was growing very fast in 1998, MONE founded a new general
directorate named the General Directorate of Educational Technologies, concerning to the
use of information technology in schools, through unifying BILGEM and the Film Radio
Television Center (MONE, 1999).
Using computers for Computer Assisted Instruction (CAI) at schools lasted between
the years of 1990 and 1999 (MONE, 2005a). In those years, the “Project on the Development
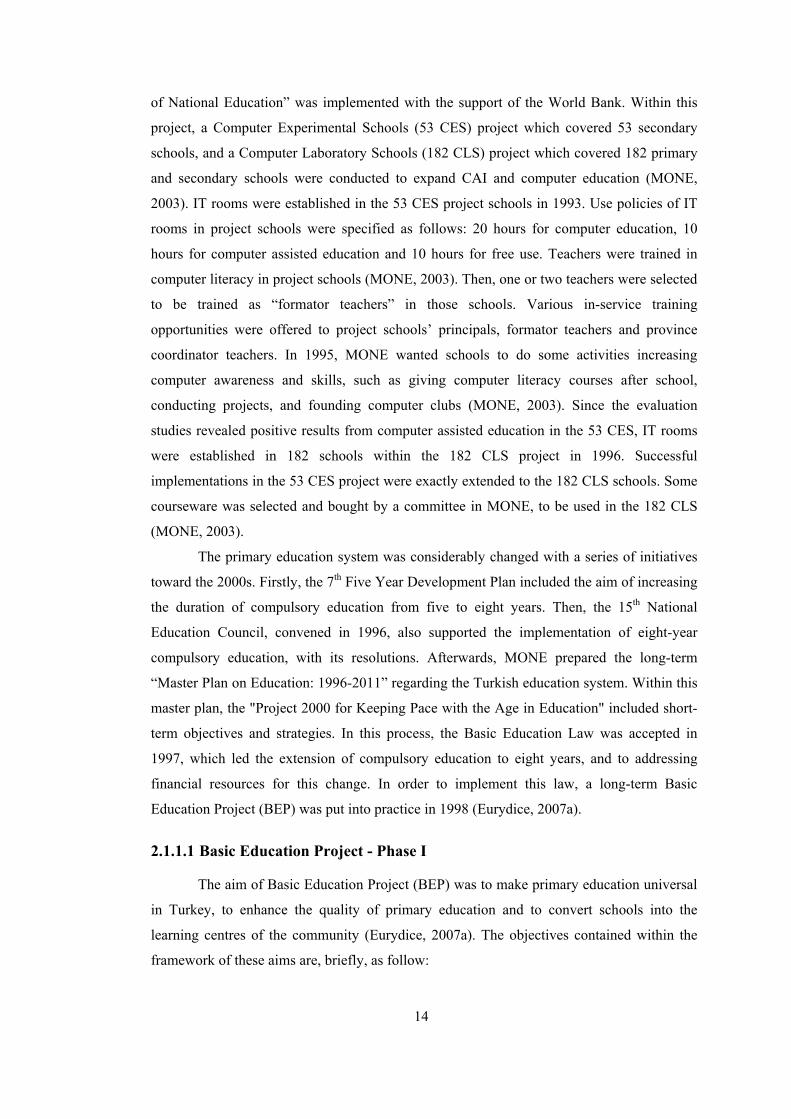
14
of National Education” was implemented with the support of the World Bank. Within this
project, a Computer Experimental Schools (53 CES) project which covered 53 secondary
schools, and a Computer Laboratory Schools (182 CLS) project which covered 182 primary
and secondary schools were conducted to expand CAI and computer education (MONE,
2003). IT rooms were established in the 53 CES project schools in 1993. Use policies of IT
rooms in project schools were specified as follows: 20 hours for computer education, 10
hours for computer assisted education and 10 hours for free use. Teachers were trained in
computer literacy in project schools (MONE, 2003). Then, one or two teachers were selected
to be trained as “formator teachers” in those schools. Various in-service training
opportunities were offered to project schools’ principals, formator teachers and province
coordinator teachers. In 1995, MONE wanted schools to do some activities increasing
computer awareness and skills, such as giving computer literacy courses after school,
conducting projects, and founding computer clubs (MONE, 2003). Since the evaluation
studies revealed positive results from computer assisted education in the 53 CES, IT rooms
were established in 182 schools within the 182 CLS project in 1996. Successful
implementations in the 53 CES project were exactly extended to the 182 CLS schools. Some
courseware was selected and bought by a committee in MONE, to be used in the 182 CLS
(MONE, 2003).
The primary education system was considerably changed with a series of initiatives
toward the 2000s. Firstly, the 7th Five Year Development Plan included the aim of increasing
the duration of compulsory education from five to eight years. Then, the 15th National
Education Council, convened in 1996, also supported the implementation of eight-year
compulsory education, with its resolutions. Afterwards, MONE prepared the long-term
“Master Plan on Education: 1996-2011” regarding the Turkish education system. Within this
master plan, the "Project 2000 for Keeping Pace with the Age in Education" included short-
term objectives and strategies. In this process, the Basic Education Law was accepted in
1997, which led the extension of compulsory education to eight years, and to addressing
financial resources for this change. In order to implement this law, a long-term Basic
Education Project (BEP) was put into practice in 1998 (Eurydice, 2007a).
2.1.1.1 Basic Education Project - Phase I
The aim of Basic Education Project (BEP) was to make primary education universal
in Turkey, to enhance the quality of primary education and to convert schools into the
learning centres of the community (Eurydice, 2007a). The objectives contained within the
framework of these aims are, briefly, as follow:

15
• Increase the rate of attendance to schools in eight-year primary education from 86% to 100%,
• Increase the rate of attendance in pre-school education from 7% to 16%, • Create additional capacity at schools (additional capacity for 3,5 million
pupils) • Reduce the numbers present in classrooms to 30, • Abolish dual education in time, • Teach at least one foreign language to each pupil, • Generalize usage of computer technologies in education (Establishing
computer labs in every primary education school) • Improve the conditions of all schools in rural areas (35,000 schools)
(Eurydice, 2007a, p. 98).
Expenditure for BEP was estimated at 11.3 billion dollars. The majority of this
money was met by Turkey’s own resources. Nevertheless, Turkey requested the World Bank
for loans for this project in 1997. The World Bank and MONE signed a contract for a 600
million dollar credit in 1998, half of which is for BEP I and the other for BEP II (Eurydice,
2007a). The first phase of BEP was implemented in 1998-2003.
In accordance with the given objectives aforementioned above, MONE aimed to
establish and equip learning centres named Information Technology Rooms (IT rooms) in all
primary schools and to utilize information technologies tools for productivity. MONE
reports that the following actions were taken to achieve IT related objectives in BEP I:
• The infrastructure for 3188 information technology (IT) classes in 2802 primary schools was completed and IT classes were opened;
• 56605 computers and other related pieces of equipment were distributed to 26244 village primary schools in rural areas;
• 1500 laptops were purchased and distributed to primary education inspectors;
• 130 laptops and 1 server were purchased for Board of Inspection/inspectors of MONE (MONE, 2005a, pp. 53-54).
Almost all of the IT rooms were equipped and in operation by the end of the 1999-
2000 school year (World Bank, 2001).
As for the training component of BEP I, along with in-service training in other
fields, basic and advanced training in computer hardware and educational software was
offered to supervisors, administrators, teacher trainees and teachers, in order to utilize IT
rooms in primary schools in the most efficient way (MONE, 2005a). The ICT related
training events announced by MONE were:
• In-service training provided for 3000 primary education inspectors in the areas of Educational Management, Computer Literacy, Active Learning and Teaching Strategies together with Material Usage, Active Learning and Special Teaching Methods;
• In-service training on computer literacy provided for 25000 teachers in the schools where IT classes were established by computer teacher trainers;
• 250 computer teacher trainers selected from schools with IT classes trained in 3 periods on various subject areas in order to make them gain the necessary qualifications for training computer teacher trainers in provinces;

16
• 15928 teachers in the schools where IT classrooms were built given basic (computer literacy) and advanced (Windows NT, Proxy, MS Office, Internet, Windows 98) education by the firms providing hardware and software (MONE, 2005a, pp. 54-55).
According to the Turkish Informatics Council (Türkiye Bilişim Şurası-TBŞ)
education report of 2002, in spite of large investments in hardware within BEP I, only 17%
of primary and secondary schools in Turkey had computers in 2002. The ratio of computer to
students was 1 to 81 among primary and secondary students, which was considerably lower
than the world average of 1 to 45 students. Furthermore, it is assumed that most of these
schools had no or limited Internet connections (TBŞ, 2002).
In 2005, based on the experiences of BEP I, MONE declared its objectives related to
ICT integration into the Turkish education system in the 2000s as:
• IT hardware and software will be provided for every school including primary education schools;
• Secure and fast Internet connection will be provided to all schools; • All students, teachers, directors, parents and school staff will be able to
access IT; • An IT class with 20+1 computers per 500 students, at least 2 computers with
Internet and intranet connection per teachers’ room and at least 1 computer will be provided with the same specs for guidance services, libraries and administration offices;
• Necessary software and in-service training courses will be provided in order to ensure that teachers, students, directors and the school staff are able to use IT and successfully take advantage of it during the educational processes;
• Current curriculum will be transformed into a student-centered one and students will be able to access information by using IT tools by themselves during their educational processes;
• Work will be undertaken in order to avoid the digital divide, and IT at schools will be at all citizens’ service;
• Technical support centres for schools will be established in order to provide the necessary technical support for the update and continuous maintenance of the IT hardware at schools (MONE 2005a, pp. 70-71).
It is understood from these policy objectives that MONE recognized the importance
of not only installing IT rooms, but also providing software, internet connections, hardware
for school staff, technical support, and in-service training for all staff, and of transforming
the curriculum into a student-centered curriculum. Parallel to these, the last curriculum
reform beginning in 2004 also involves integrating ICT into primary and secondary school
curricula. It is likely that ICT will be utilized in all subjects as teachers adopt and use the
new curriculum. The projects hereafter are designed, developed and implemented in the light
of these policy objectives.
ICT related major policies, initiatives, and projects underway in primary and
secondary education until the PISA 2003 data collection have been mentioned so far. It
should be noted that only Computer Experimental Schools, Computer Laboratory Schools

17
and BEP I projects were initiated and/or finished by 2003. Hence, the major initiatives and
projects stated below do not have any impact on the PISA 2003 data. They are described in
order to illustrate the context and trend of ICT integration into education settings after 2003
in Turkey.
2.1.1.2 Basic Education Project - Phase II
The World Bank’s Board approved the second loan of 300 million dollars to
continue to support the Government’s Basic Education Project in 2002, in the second phase
(BEP II). According to the official website of the World Bank, BEP II was conducted in
2002-2007. However, in reality the project was activated by the government in 2005 (World
Bank, n.d.). The general aims of BEP I were kept in the second phase, too. Additionally, pre-
primary education and special education were emphasized in the second phase (MONE,
2005a). In order to increase access to ICT in basic education schools within this phase of the
project, 4,002 IT rooms were to be established in 3,000 additional basic education schools
throughout Turkey. Installing an education portal was also among the aims of BEP II (World
Bank, 2002; MONE, 2005a).
2.1.1.3 MONE ADSL Connection Project
In December 2003, a protocol between the Ministry of Transport and MONE was
signed to provide high speed Internet connection to approximately 40,000 schools including
most of the primary schools and all secondary schools, for educational and administrative
purposes (World Bank, 2004). The main goal of this project was to improve the students’
skills in accessing, using, producing and sharing information through providing schools an
appropriate Internet bandwidth for using e-learning methods (UNESCO, 2004).
According to the protocol, high speed Internet connections would be provided to
these schools for a 3-year period of 2004 and 2006. The cost of the Internet connection
would be covered under MONE's budget (World Bank, 2004). The project consists of four
phases: in the first three phases Asymmetric Digital Subscriber Line (ADSL) Internet access
was completed for approximately 20,000 schools, and then it was planned that ADSL
Internet access for the rest of schools would be completed by 31 October 2005 (MONE,
2005a). With this project, an important step has been taken in the way of e-education
application at every level of education and training (UNESCO, 2004).

18
2.1.1.4 Campaign for Supporting Computer Aided Education
This project was launched by MONE and Turkish Informatics Industry Association
in 2005. The main goal of the project is to catch up with world informatics standards with a
new technology boom in the Turkish education system. The objective of the project is to
gain one million computers for primary and secondary education schools with donations
from the private sector and community (BEDK, 2008). Up to 2007, 294,000 computers have
been put into schools, IT rooms have been established in 19,000 schools, and Internet
connections (as ADSL) have been provided to 25,000 schools (Eurydice, 2007a).
2.1.1.5 Education for the Future (in Co-operation with Intel Company)
With this project, it was aimed to enable 50,000 teachers to acquire computer
literacy in three years through expert teacher trainers who would be trained with a specific
program by 2006. Computer teachers determined by MONE have 40 hours training about
teaching computer use. These teachers -as the main instructors- will undergo special
education about the curriculum and be responsible for the training of the expert teachers. The
expert teachers will train other teachers, determined by MONE. During this process, the aim
was to train 5,000-8,000 teachers in the first year, and the estimated number of trained
teachers would be 50,000 by the end of the third year. A protocol was signed with the Intel
Company (UNESCO, 2004).
2.1.1.6 E-learning - Education Portal
As aforementioned, one of the stated aims of BEP II was that MONE would install
an educational portal. The following services are to be offered with the education portal:
• Software which suits and supports the curriculum, • A rich, continuous, up-to-date and reliable educational content in Turkish
which meets the requirements of students, teachers, parents and directors, • Distance synchronized and desynchronised educational services, • Foreign Language teaching through distance learning at international
standards, • Vocational training through distance learning at international standards, • The training of teachers, students and administrators, • Mutual communication of the students, teachers, administrators and parents;
services such as providing e-mails, web pages and etc, • Necessary web page orientations through search engines and links, • Preparation of the continuous education environment so as to provide all
necessary educational information and allied services for individuals at all ages and the target audience remaining out of the formal education (UNESCO, 2004, p. 30-31).
Major projects related to ICT integration into primary and secondary schools have
been mentioned so far. In summary, ICT investments started at first in secondary schools in

19
1984. These investments continued, especially in upper secondary schools, in the years of
1984-1991. Attempts to develop instructional software for CAI in collaboration with MONE,
the private sector and universities were seen in 1988-1991. In the late 1980s and early 1990s,
a few in-service-training activities were also held on basic computer skills for teachers, with
the support of universities. In the 1990s, within the framework of a National Education
Development project, 53 CES and 182 CLS projects were started in selected secondary and
basic education (K-8 -Kindergarten through the Eighth Grade) schools, in 1993 and 1996
respectively. The main aim of these two projects was to investigate ways to integrate
computers into the Turkish education system.
The Education Master Plan 1996-2011 was formed on the basis of policy
recommendations from the Seventh 5th Year Development Plan and the 15th National
Education Council. Within this master plan, Project 2000 for Keeping Pace with the Age in
Education was launched as a short-term project. Afterwards, compulsory education was
expanded from five to eight years in 1997. The long-term plan BEP was initiated in 1998,
which was one of the largest education projects in the world in terms of its scope, affected
population, and budget. The main purpose of this project was to generalize basic education
throughout Turkey, to enhance the quality of basic education and to convert schools into
community learning centers. One of the objectives was directly related to ICT: generalizing
the use of computer technologies in education through establishing IT rooms in every basic
education school. The government had a loan of 300 million dollars from the World Bank
for the first phase of this project, that was implemented in 1998-2003, and an additional 300
million dollar for the second phase, in 2002-2007. Since the government in Turkey and
project leaders in the World Bank changed, the second phase of BEP actually started in
2005. In the second phase, the main aims and goals were kept. Additionally, pre-primary
school education and special education were also planned to be improved in this phase.
It could be concluded that hardware investments were more dominant in the ICT
integration process up to 2003. Those investments for basic education schools were actually
implemented in 1998-2000 within BEP I (3,188 IT rooms in 2,802 primary schools). Yet, the
Internet connections at schools were limited and slow until the end of 2003 (Akbaba-Altun,
2006). However, it appears that with MONE ADSL Connection Project signed at the end of
2003, schools started to access the Internet through broadband. E-learning - Education Portal
(one of the objectives of BEP II), Education for the Future (in Co-operation with Intel for
training teachers on ICT), and the Campaign for Supporting Computer Aided Education
Project are other major projects that are directly related to ICT integration into compulsory
education implemented after the PISA 2003 data collection.
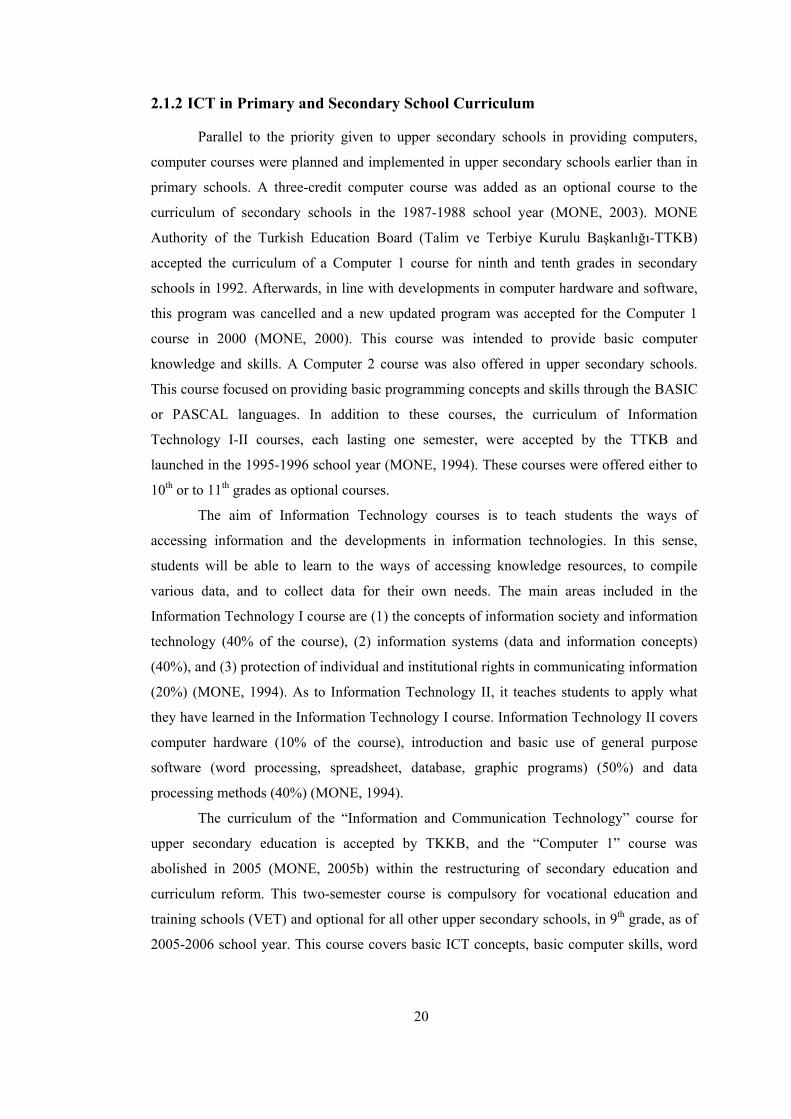
20
2.1.2 ICT in Primary and Secondary School Curriculum
Parallel to the priority given to upper secondary schools in providing computers,
computer courses were planned and implemented in upper secondary schools earlier than in
primary schools. A three-credit computer course was added as an optional course to the
curriculum of secondary schools in the 1987-1988 school year (MONE, 2003). MONE
Authority of the Turkish Education Board (Talim ve Terbiye Kurulu Başkanlığı-TTKB)
accepted the curriculum of a Computer 1 course for ninth and tenth grades in secondary
schools in 1992. Afterwards, in line with developments in computer hardware and software,
this program was cancelled and a new updated program was accepted for the Computer 1
course in 2000 (MONE, 2000). This course was intended to provide basic computer
knowledge and skills. A Computer 2 course was also offered in upper secondary schools.
This course focused on providing basic programming concepts and skills through the BASIC
or PASCAL languages. In addition to these courses, the curriculum of Information
Technology I-II courses, each lasting one semester, were accepted by the TTKB and
launched in the 1995-1996 school year (MONE, 1994). These courses were offered either to
10th or to 11th grades as optional courses.
The aim of Information Technology courses is to teach students the ways of
accessing information and the developments in information technologies. In this sense,
students will be able to learn to the ways of accessing knowledge resources, to compile
various data, and to collect data for their own needs. The main areas included in the
Information Technology I course are (1) the concepts of information society and information
technology (40% of the course), (2) information systems (data and information concepts)
(40%), and (3) protection of individual and institutional rights in communicating information
(20%) (MONE, 1994). As to Information Technology II, it teaches students to apply what
they have learned in the Information Technology I course. Information Technology II covers
computer hardware (10% of the course), introduction and basic use of general purpose
software (word processing, spreadsheet, database, graphic programs) (50%) and data
processing methods (40%) (MONE, 1994).
The curriculum of the “Information and Communication Technology” course for
upper secondary education is accepted by TKKB, and the “Computer 1” course was
abolished in 2005 (MONE, 2005b) within the restructuring of secondary education and
curriculum reform. This two-semester course is compulsory for vocational education and
training schools (VET) and optional for all other upper secondary schools, in 9th grade, as of
2005-2006 school year. This course covers basic ICT concepts, basic computer skills, word

21
processing, spreadsheet, database, and presentation program as well as Internet and
communication (MONE, 2005b).
As to basic education schools, the program of optional computer courses from 4th to
8th grades was accepted by MONE in August 1998 (MONE, 1998). It started to be
implemented in the 1998-1999 school year. This program had a spiral content organization,
that is, the content of one grade was included in the next grade with additional knowledge
and skills. This program was too repetitive in content organization across grades, so teachers
did not actually follow it (Kural Er & Güven, 2008).
In 1999, MONE declared that its main policy on ICT was to spread IT skills across
grades 1 through 8 in order to give students the necessary computer competencies for the 21st
century workforce. Thus, MONE aimed to integrate basic computer skills into the whole
primary education curriculum rather than introducing them in a separate computer course
(MONE, 1999). The World Bank also indicated that BEP aimed to integrate ICT into other
subjects in primary education, beginning from fourth grade, along with improving the
computer literacy of teachers and students (World Bank, 2002). Accordingly, in a 1999
policy paper, MONE defined computer competencies for each grade level, as seen in Figure
2.1 (MONE, 1999). Although computer competencies of the first three grades were also
defined, the curriculum of the optional computer course was accepted for students in the 4th
to 8th grades in 1998. This could be evaluated as a contradiction between policy and practice.
Indeed, the first three grades were permitted to take optional computer course as of the 2005-
2006 school year.
Afterwards, within the framework of the education reforms that started in 2004, a
new curriculum for all grades in basic education was designed and accepted by the TTKB in
2006. This new curriculum began to be implemented in 2006-2007 for the first three grades,
and in 2007-2008 for the 4th - 8th grades.
In order to understand to what extent the content of optional computer courses
covers the aspects of ICT focused on by PISA 2003, a curriculum analysis of each computer
course given in Turkey until 2003 was done and is presented in Table 2.1. First, the most
striking deficiency is a lack of Internet-related objectives and content. Second, programming
skills do not take place in the curricula, except for in that of Computer 2. Third, no
educational software or content/activity to enhance other subjects exists within the curricula.
Finally, creating a web page, multimedia presentation, and using antivirus software are not
included in the curricula at all. The curricula of those courses are largely focused on basic
computer skills, such as opening, deleting and copying a file, playing games and drawing
pictures with the mouse.
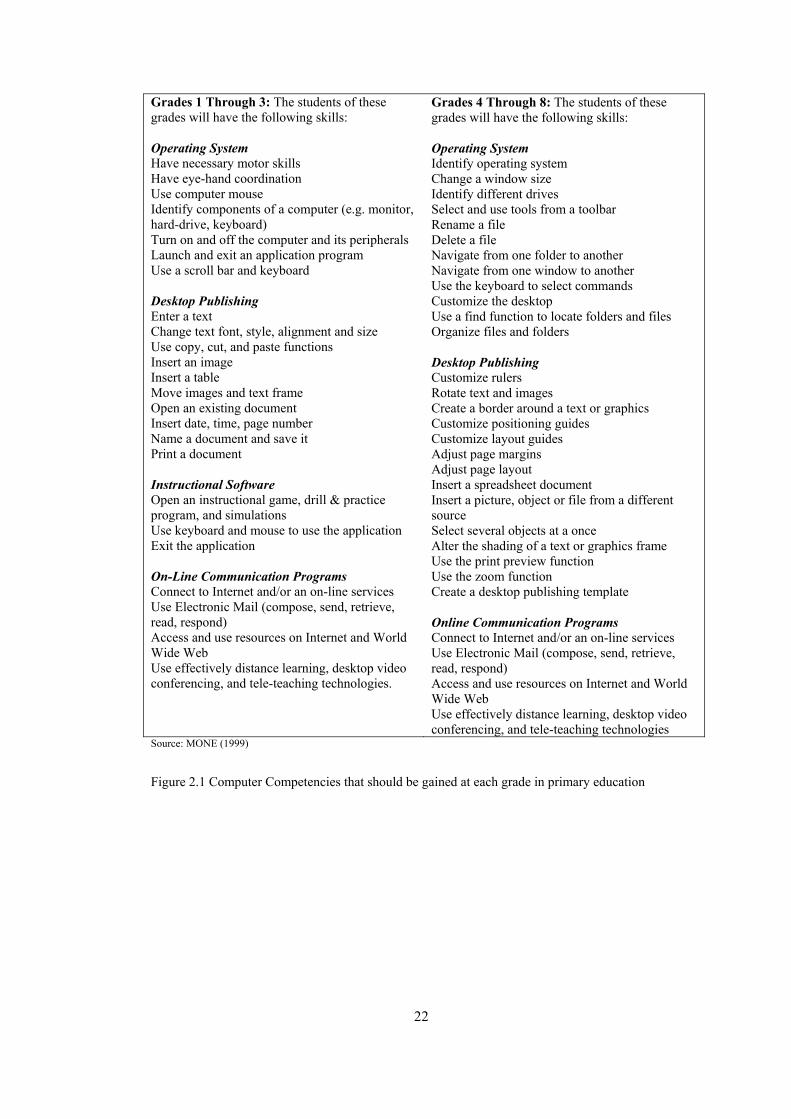
22
Grades 1 Through 3: The students of these grades will have the following skills: Operating System Have necessary motor skills Have eye-hand coordination Use computer mouse Identify components of a computer (e.g. monitor, hard-drive, keyboard) Turn on and off the computer and its peripherals Launch and exit an application program Use a scroll bar and keyboard Desktop Publishing Enter a text Change text font, style, alignment and size Use copy, cut, and paste functions Insert an image Insert a table Move images and text frame Open an existing document Insert date, time, page number Name a document and save it Print a document Instructional Software Open an instructional game, drill & practice program, and simulations Use keyboard and mouse to use the application Exit the application On-Line Communication Programs Connect to Internet and/or an on-line services Use Electronic Mail (compose, send, retrieve, read, respond) Access and use resources on Internet and World Wide Web Use effectively distance learning, desktop video conferencing, and tele-teaching technologies.
Grades 4 Through 8: The students of these grades will have the following skills: Operating System Identify operating system Change a window size Identify different drives Select and use tools from a toolbar Rename a file Delete a file Navigate from one folder to another Navigate from one window to another Use the keyboard to select commands Customize the desktop Use a find function to locate folders and files Organize files and folders Desktop Publishing Customize rulers Rotate text and images Create a border around a text or graphics Customize positioning guides Customize layout guides Adjust page margins Adjust page layout Insert a spreadsheet document Insert a picture, object or file from a different source Select several objects at a once Alter the shading of a text or graphics frame Use the print preview function Use the zoom function Create a desktop publishing template Online Communication Programs Connect to Internet and/or an on-line services Use Electronic Mail (compose, send, retrieve, read, respond) Access and use resources on Internet and World Wide Web Use effectively distance learning, desktop video conferencing, and tele-teaching technologies
Source: MONE (1999) Figure 2.1 Computer Competencies that should be gained at each grade in primary education
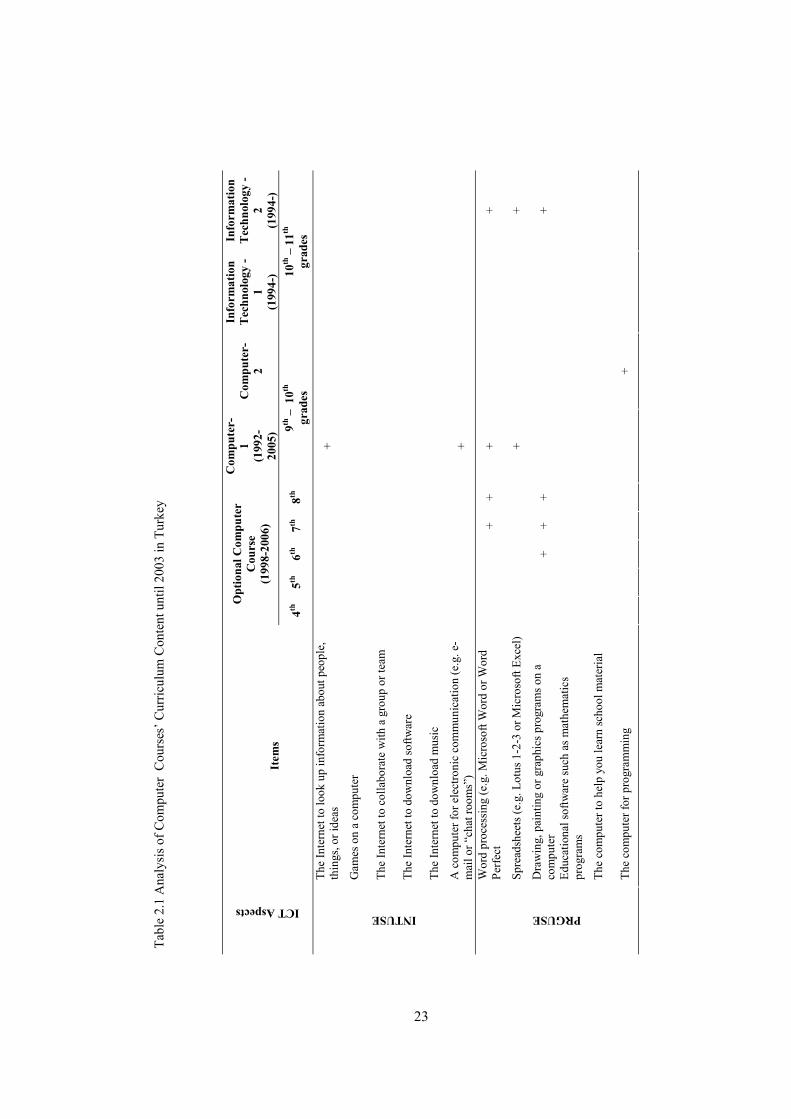
23
T
able
2.1
Ana
lysi
s of C
ompu
ter
Cou
rses
’ Cur
ricul
um C
onte
nt u
ntil
2003
in T
urke
y
Opt
iona
l Com
pute
r C
ours
e (1
998-
2006
)
Com
pute
r-1
(199
2-20
05)
Com
pute
r-2
Info
rmat
ion
Tec
hnol
ogy
-1
(199
4-)
Info
rmat
ion
Tec
hnol
ogy
-2
(199
4-)
ICT Aspects
Item
s
4th
5th
6th
7th
8th
9th –
10th
gr
ades
10
th –
11th
gr
ades
Th
e In
tern
et to
look
up
info
rmat
ion
abou
t peo
ple,
th
ings
, or i
deas
+
Gam
es o
n a
com
pute
r
The
Inte
rnet
to c
olla
bora
te w
ith a
gro
up o
r tea
m
The
Inte
rnet
to d
ownl
oad
softw
are
The
Inte
rnet
to d
ownl
oad
mus
ic
INTUSE
A c
ompu
ter f
or e
lect
roni
c co
mm
unic
atio
n (e
.g. e
-m
ail o
r “ch
at ro
oms”
)
+
Wor
d pr
oces
sing
(e.g
. Mic
roso
ft W
ord
or W
ord
Perfe
ct
+
+ +
+
Spre
adsh
eets
(e.g
. Lot
us 1
-2-3
or M
icro
soft
Exce
l)
+
+
Dra
win
g, p
aint
ing
or g
raph
ics p
rogr
ams o
n a
com
pute
r
+
+ +
+
Educ
atio
nal s
oftw
are
such
as m
athe
mat
ics
prog
ram
s
The
com
pute
r to
help
you
lear
n sc
hool
mat
eria
l
PRGUSE
The
com
pute
r for
pro
gram
min
g
+

24
Tab
le 2
.1 C
ontin
ued.
Opt
iona
l Com
pute
r C
ours
e (1
998-
2006
)
Com
pute
r-1
(199
2-20
05)
Com
pute
r -
2
Info
rmat
ion
Tec
hnol
ogy-
1 (1
994-
)
Info
rmat
ion
Tec
hnol
ogy-
2(1
994-
)
ICT Aspects
Item
s
4th
5th
6th
7th
8th
9th –
10th
gr
ades
10
th –
11th
gr
ades
St
art a
com
pute
r gam
e.
+ +
+ +
+
O
pen
a fil
e.
+
+ +
C
reat
e/ed
it a
docu
men
t.
+ +
+
Scro
ll a
docu
men
t up
and
dow
n a
scre
en.
+ +
+
C
opy
a fil
e fr
om a
flop
py d
isk
+
Sa
ve a
com
pute
r doc
umen
t or f
ile.
+ +
+ +
+ Pr
int a
com
pute
r doc
umen
t or f
ile.
+
+
+ D
elet
e a
com
pute
r doc
umen
t or f
ile.
+ +
+ +
M
oves
file
s for
m o
ne p
lace
to a
noth
er o
n a
com
pute
r.
+
Play
com
pute
r gam
es.
+ +
+ +
+
ROUTCONF
Dra
w p
ictu
res u
sing
a m
ouse
. +
+ +
+ +
+
Get
on
to th
e In
tern
et.
+
C
opy
or d
ownl
oad
files
from
the
Inte
rnet
.
Atta
ch a
file
to a
n em
ail m
essa
ge
D
ownl
oad
mus
ic fr
om th
e In
tern
et.
INTCONF
Writ
e an
d se
nd e
mai
ls.
+
U
se so
ftwar
e to
find
and
get
rid
of c
ompu
ter v
iruse
s.
Use
a d
atab
ase
to p
rodu
ce a
list
of a
ddre
sses
.
+ +
+
+
Cre
ate
a co
mpu
ter p
rogr
am (e
.g. i
n Lo
go, P
asca
l, B
asic
)
+
Use
a sp
read
shee
t to
plot
a g
raph
+ +
+
+
Cre
ate
a pr
esen
tatio
n (e
.g. u
sing
Mic
roso
ft Po
wer
Poin
t).
+ +
+ +
C
reat
e a
mul
ti-m
edia
pre
sent
atio
n
HIGHCONF
Con
stru
ct a
Web
pag
e.
25
At this point, it is worth mentioning both the place of ICT in the curriculum reform
initiated in 2004 and the relationship of curriculum reform with the PISA 2003 study. Within
the 2004 curriculum reform, TTKB studied curriculum change for primary and secondary
education with a holistic view in accordance with developments in Turkey and in the World
(TTKB, 2004). In the 8th Five Year Development Plan, MONE was advised to develop the
curriculum according the following points: (1) Continuity of Turkish Republic project
founded by Atatürk through development, (2) Changes and developments in the world-
especially in curriculum, (3) the EU norms, goals, and insight of education, and (4) assessing
the existing education properties, evaluating success and failures and raising consequences.
The findings of international studies such as PISA, the Third International Mathematics and
Science Study (TIMSS) and Progress in International Reading Literacy Study (PIRLS) are
considered in the fourth point (TTKB, 2004).
One of the basic components of new curricula is “to use informatics technology in an
efficient and productive way for a certain purpose” (TTKB, 2004, p. 14). TTKB also stresses
that the aim of the new programs is not to use ICT, but to utilize ICT effectively and
efficiently in order to reach a specific goal. Parallel to this aim, the new curricula include
systematic arrangements related to where ICT will be embedded in courses (TTKB, 2004, p.
14).
In summary, there was no formal computer education curriculum for basic education
until 1998. Computer education started from the 4th grade, in the curriculum accepted in
1998. This development could be attributed to ICT objectives in BEP I. Within the
curriculum reform of 2004, this curriculum was cancelled and a new curriculum for 1st – 8th
grades was accepted. The new curriculum is more student-centered than the previous one. As
of 2005, students in the first three grades were allowed to take optional computer courses.
When the integration of ICT into other subjects is considered, it could be said that the
curriculum reform that started in 2004 is the first apparent curricular evidence of integrating
ICT into whole primary and secondary school curricula. In fact, hardware and in-service
training are provided within BEP I, but only one optional computer course is added to the
basic education curriculum. Göktaş (2003) also stresses that there is little evidence any effort
to change the curriculum in basic education until 2003.
As to upper secondary education, optional courses, named Computer 1-2 and
Information Technology 1-2, were added to the curriculum, but they are still optional
courses. In 2005, the Computer 1 course was replaced with a new course, called Information
and Communication Technologies, for the 9th grade (MONE, 2005b). Note that offering
26
computer courses depends on the existence of IT rooms and computer teacher in primary and
secondary schools.
2.2 Studies about the Integration of ICT into Education in Turkey
There is an agreement in the literature that nations should find ways to transform
themselves into knowledge societies, in order to become competitive with others
(Akkoyunlu, 1992; Aydın & McIsaac, 2004). Aydın and McIsaac (2004) deduce that if ICT
is utilized in the best way, information technology can form the foundations for economic,
social and educational transformation; can increase production of knowledge; and can be
developed to meet local needs rather than using developed nations’ own solutions.
MONE continues to purchase computers for primary and secondary schools, to train
staff with in-service training through various projects, and to make attempts to increase
available instructional software. Meanwhile, researchers have conducted a variety of studies
to identify issues or problems in ICT integration, and have suggested strategies or possible
prescriptive solutions to those problems. These studies focused on challenges faced by such
different stakeholders as key policy makers, formator teachers, subject teachers, school
principals, and inspectors. The issues and problems of ICT integration into K-12 schools in
Turkey, and possible solutions recommended by the literature are presented in this section.
The need to integrate computers into Turkish primary schools as part of the
country’s transformation from an agricultural and industrialized society to a knowledge
society was stressed by Akkoyunlu in early 1990s (Akkoyunlu, 1992), even though there was
no significant ICT investment in primary schools at that time. In terms of the integration of
computers into primary school curricula, Akkoyunlu (1992) also underlines the importance
of very careful planning on many issues, such as selection of hardware and software
compatible to each other and to the curriculum, integrating computers into other learning
activities, and the training of teachers (p. 324).
Opinions of key policy makers were also a topic of research in ICT integration
studies. Özar (1996) conducted a qualitative study to identify the opinions of key policy
makers in MONE in terms of present and future uses of IT in Turkey. He interviewed fifteen
key policy makers in the headquarters of MONE. Özar (1996) reports that almost all of the
participants expressed that the Turkish education system as a whole was not ready for IT
integration, due to a classical understanding of curriculum, teaching methods and the content
of the courses in the educational system; teachers’ lack of IT skills; and a lack of educational
courseware. Issues that emerged from his study are a lack of good planning, a lack of
27
curriculum revision and change, and the need for cooperation between the private sector and
universities with MONE.
Özar (1996) inferred from his data three important mistakes in IT integration into
schools, and he saw that these had led to the failure of IT integration planning up to 1996.
The first is lack of well-planned IT implementation. The existing education system, in terms
of physical and human resources, was not really well considered and evaluated before IT was
introduced into the Turkish education system (10 out of 15 participants). Second, since the
1980s, the emphasis has been on hardware issues rather than on software (4 out of 15). This
led to inefficient use of IT in schools. Third, in many schools computers seem to have been
locked away (2 out of 15) due to teachers not understanding the fact that technology is
changing rapidly and therefore these technological products will be outdated soon. Özar
(1996) attributed these mistakes in IT policy to policy makers not understanding IT and to a
lack of well-planned activities. The biggest obstacle to IT integration is teachers’ lack of
appropriate knowledge and skills, according to participants (8 out of 15). Lack of
communication and cooperative work on ICT integration in MONE was another issue among
his findings. Based on these results, Özar addressed some common areas that need to be
considered in the integration of IT. These can be summarized as the needs for teacher
training (8 out of 15), improvement of physical conditions, management of finance,
preservation of national unity while giving autonomy to local authorities, and the necessity
for contributions from the private sector and the universities (Özar, 1996).
In order to increase the number of computer teachers, selected voluntary subject
teachers have been trained and given some special rights under the name of formator
teachers or computer coordinator teachers, since the mid 1980s. These formator teachers
were expected to train other teachers and students in computer literacy and to be agents of
change for utilizing computers in educational purposes in schools. Various studies were
conducted to investigate formator teachers’ use of computers and the problems they
encountered in schools (Akkoyunlu, 1995; Akbaba-Altun, 2006). For instance, in the months
of July and September, between the 1991 and 1993, there were in-service training sessions
for formator teachers. Along with this in-service training sessions, Akkoyunlu (1995) asked
the 160 formator teachers to answer an open-ended question asking which obstacles they
encounter when using computers in schools. Most of the respondents stated inadequate
hardware; insufficient and low-quality software; inadequate number of teachers trained in
computer skills, not having a computer laboratory in school; and the computer laboratory
being kept locked. In the other study conducted between March 2003 and July 2004,
Akbaba-Altun (2006) reported the problems of IT coordinators as insufficient in-service

28
training (rare training sessions, problematic training in terms of quality of trainers and
training not addressing the needs of adult learners), the ambiguity of their basic rights as
State employees (conflict in their roles as subject teacher and formator teacher, retrenching
of salary, supervision problems, lack of incentives for being formator teachers) and heavy
workload (planning IT room schedule, being responsible for IT rooms’ maintenance, helping
subject teachers use computers for their courses, preparing in-service training for teachers
and the public) (Akbaba-Altun, 2006).
There is no doubt that without teachers internalizing new technology as a tool in
their instructional activities, all ICT investment would be a waste of time and money.
Teachers’ computer competency levels, the purposes and extent of their computer use, and
the problems they face in ICT integration were described and analyzed by many studies.
Çağıltay, Çakıroğlu, Çağıltay and Çakıroğlu (2001) conducted a survey study to investigate
how teachers use computers in education and how they perceive the use of computers in
education in Turkey. In 1998 spring, a questionnaire with 95 items was distributed to 202
teachers from a randomly selected 27 schools in three cities in the middle and western part of
the country. The most frequently selected purposes for computer use are preparing
examination questions, calculating student grades and administrative tasks. From a given list
of problems which they may face in integrating computers in the curriculum, teachers
selected the following three problems: (1) lack of access to a computer, (2) their own
insufficient experience in computer use, and (3) inconvenience of curriculum structure for
integration of computers. Only 21% of the teachers in the sample had taken in-service
training in computer skills. Based on the results of this study, the authors identify the needs
of teachers is access to computers and in-service training on computer skills and on how to
use computers in the curriculum (Çağıltay et al., 2001).
In a similar study, Usluel and Aşkar (2002) aimed to identify the purposes of
teachers in using ICT. The study’s sample covers 638 teachers from 27 primary schools, and
data were collected with a questionnaire. Based on the findings, they reported that computers
in schools have become widely used for administrative purposes, such as preparation of
lesson plans and unit plans, organizing students’ scores and reports, and writing official
letters. Computer use in instructional activities is not observed more frequently than in
managerial tasks. The major computer uses reported in instructional activities were as a
presentation tool during lessons and for experiments. Thus, it could be inferred from the
results of Çağıltay et al. (2001) and Usluel and Aşkar (2002) that teachers were using
computers mostly for administrative tasks until the early 2000s.

29
Çağıltay et al. (2001) also asked teachers to identify what their schools needed in
order to integrate technology into the curricula. The teachers who worked in schools with IT
rooms gave priority to the following needs: (1) computer training for teachers, (2) opening
the IT rooms for general use, (3) technical support personnel trained in computers, (4) a
computer that teachers can use. The other teachers, who worked in schools without IT rooms
gave priority to the following needs: (1) computer training for teachers, (2) at least one
computer for each classroom, (3) technical support personnel trained in computers.
According to these results, the most urgent need for integration of computers into the
curriculum is increasing teachers’ knowledge about and experience with computers. This is
an important issue that also emerged in Özar’s study (1996). The second most common need
recommended for schools by the two groups of teachers is technical support personnel
trained in computers.
Aşkar, Usluel and Mumcu (2006) conducted a causal-comparative study to predict
ICT use in teaching preparation, teaching, and administrative tasks from teachers’
perceptions about the innovation characteristics of ICT. Innovation characteristics are
relative advantage, compatibility, complexity, trialability and observability, which hinder or
facilitate diffusion of innovation (Rogers, 1995). The sample was 416 secondary school
teachers in Ankara. The data was analyzed with logistic stepwise regression. The results of
the study show that complexity -i.e. ease of use- is a common by perceived innovation
characteristic of computers for teaching preparation, teaching delivery and managerial tasks
in schools. Observability of computer use was a perceived attribute in teaching delivery in
some specific tasks during lessons, whereas the relative advantage and compatibility of
computers are for teaching preparation tasks. Aşkar, Usluel and Mumcu (2006) state the
importance of employing new strategies to decrease the perceived complexity of ICT, for the
diffusion of ICT in schools. For this aim, besides nationwide solutions, they propose school-
based solutions as more realistic in the diffusion of computers for instructional purposes,
such as ongoing and immediate technical and educational support, and early familiarity with
ICT. Remember that Çağıltay et al. (2001) arrive at such a conclusion.
Aşkar, Usluel and Mumcu (2006) also suggest some strategies to exploit the
observability feature of ICT for the diffusion of ICT in teaching delivery, such as giving
teachers the opportunity to observe ICT integration done by their colleagues in the
classroom, and demonstrating use of instructional technology in in-service training.
Within the framework of the National Education Development Project implemented
in 1990-1999, the Higher Education Council (Yüksek Öğretim Kurulu-YÖK) made some
significant efforts to raise the quality of teachers. In order to respond to the changing needs

30
of the society and to increasing problems in the education system, teacher training programs
were restructured in 1998 to produce more teachers for basic education. Within this
restructuring, a program and departments of Computer Education and Instructional
Technology (CEIT) in schools of teacher education were opened, to meet the need of
computer teachers in primary education (YÖK, 1998). On the other hand, a compulsory
computer course was added to all teacher education programs (including classroom and
subject teacher programs) to improve teachers’ computer literacy. In addition, as an
extension of this computer course, an Instructional Technology and Material Development
course was added to new formation courses with the aim of raising teachers’ utilization of
advanced instructional technologies in the teaching and learning environment (YÖK, 1998).
It is noteworthy that there is a parallelism in TTKB’s acceptation of computer courses for 4th
– 8th grades and YÖK’s opening of CEIT programs, both being implementations within the
National Education Development Project. Of course, such synchronization among
institutions in policy implementation is needed for more successful results.
In his comparison of teacher training schools in terms of ICT inclusion across the
EU and Turkey, Göktaş (2003) comments that a pedagogical use of ICT is needed in both
preservice and in-service training of teachers, in addition to basic ICT skills for successful
integration of ICT into education (Göktaş, 2003). It appears that either the impact of the
restructuring of programs in faculties of education by YÖK in 1998 could not be felt, or
there are problems in the implementations of the programs. However, Göktaş (2006)
investigated the current status of ICT integration into preservice teacher education programs
in Turkey and arrived at a conclusion supporting the 1998 restructuring of teacher education
programs by YÖK.
Towards the completion of the first phase Basic Education Project (BEP I), some
studies were conducted to assess the ICT component of BEP I (e.g. Yıldırım, 2007; Akbaba-
Altun, 2006; MONE, 2005a; & Bhullar, 2005). Yıldırım (2007) examined teachers’ use of
ICT in Turkish basic education schools and investigated the barriers to effective technology
integration. The data on extent and type of ICT use and ICT competency perception were
obtained from 402 (97 female, 305 male) basic education teachers, through questionnaires.
Afterwards, as a follow-up study, 72 of these teachers responded to open-ended
questionnaire designed to investigate the barriers to technology integration. Results indicated
that teachers use computers most frequently for preparing handouts and tests, and, parallel to
this, feel most competent in word processing. Contrary to these, the least frequent use of
computers was with instructional software and, naturally, they felt least competent in the use
of instructional software. As to the barriers to effective technology integration, Yıldırım
31
(2007) infers that the most detrimental factors to successful technology integration in schools
were overcrowded classes, inadequate in-service training, lack of timely technical and
pedagogical support, inflexible school curricula, lack of incentives, lack of sound leadership,
lack of clearly stated goals and expectations from ICT, and lack of collaboration among
teachers. Based on these findings, Yıldırım (2007) stated that most teachers did not use ICT
to promote students’ attainment in areas across the curriculum, in basic education schools in
the 2002 conditions of Turkey. In order to be successful in educational reforms, he proposes
that the teachers should be empowered through appropriate preservice and in-service
training, led by a powerful leadership, provided with necessary incentives, and continually
provided with technical and pedagogical support. Otherwise, ICT investments will fail and
new issues will be added to the existing ones in the education system (Yıldırım, 2007).
In another study, Akbaba-Altun (2006) investigated issues in integrating computers
into the Turkish school system (which is highly centralized) from the perspective of formator
teachers, school principles and inspectors. Fifteen IT coordinators, and 17 school principals
in one city in the Western Black Sea Region were interviewed and 151 elementary school
inspectors from eight different cities responded to a survey. Data was analyzed with content
analysis. Infrastructure, personnel, curriculum, administration, and supervision were found
as ICT implementation issues. The infrastructure issue addresses physical settings -buildings
and classrooms, equipment- security, breakdowns, and maintenance; personnel issues were
related to formator teachers and other teachers; curricular issues were design, development
and implementation of curriculum, materials, assessment, and delivery of instruction;
administrative issues were responsibility and anxiety at school level and conflicting roles and
communication breakdowns at national level; and finally, the supervision issue was a lack of
standards in supervision of IT rooms and the limited or non-existent computer experience of
inspectors. Although formator teachers and inspectors mentioned all those issues, school
principles only mentioned on infrastructure and personnel as problems and issues with IT
rooms. More specifically, the following implications could be drawn from the findings of her
study:
• The more problems in the education system, the more challenges in integration of ICT
into that education system. Thus, a collaborative organizational approach should be
adopted and each unit in the headquarters of MONE should perform a collaborative
effort towards this aim.
• Hardware, software, especially in the native language, Internet access and computer
peripherals at schools are insufficient.
32
• There are design faults in the establishment of IT rooms in terms of cabling, ergonomics
and security.
• Teacher’s in-service training is insufficient and of a low quality. Given by badly-
qualified trainers, the training sessions do not address teachers’ needs and knowledge
levels and do not involve hands-on activities.
• The computer curriculum for grades 4-8 is nearly the same, the design is far too spiral.
• The software sent to schools is not appropriate to the level of students. Except for
English courses, other content teachers do not use multimedia or videotapes in their
courses. No needs analyses were conducted at schools before sending instructional
software to the schools. Schools cannot purchase software.
• Lack of leadership at schools in ICT integration. School principals do not support ICT
integration at schools (Akbaba-Altun, 2006).
Akbaba-Altun (2006) deduces that investment in human capital is as important as
investment in technology. Thus, she proposes well-planned and up-to-date training to be
conducted not only for teachers, but also for supervisors, school principals and formator
teachers for successful ICT integration. She underlines the necessity of developing and
implementing vision and mission to minimize problems and issues at school and at national
level (2006).
MONE and the World Bank reported their evaluation of BEP I. MONE conducted an
impact study of BEP I, analyzing the effect of IT rooms in 2004 (MONE, 2004). According
to MONE, the results show that IT rooms enable administrators, teachers and especially
students to have access to ICT. Furthermore, two-thirds of students are provided with
computer access and more than half of the students have computer access only in school.
When schools are considered, almost one-third of schools have their own web pages or they
have started to develop them. Another noteworthy finding was that all teachers perceive IT
rooms as laboratories established for computer lessons rather than as an environment that
they can use in their own lessons; thus, teachers who have taken in-service training on
computer literacy need to be well informed on the goals of IT rooms. This report also
pointed out inadequacies in educational software and technical support, a lack of any factor
encouraging or compelling teachers to use computers for educational purposes with the
exception of preparing annual course plans, the non-existence of computers in teacher’s
room at half of the schools, generally keeping IT rooms under lock and key, and the
limitedness of Internet opportunities (MONE, 2004). MONE proposes that establishing
ADSL connections to IT rooms is an important step toward solving the Internet problem. It
was seen that school administrators do not open IT rooms for the use of students and public

33
out of school hours because of security and management problems (MONE, 2004). This
drastic finding was also mentioned in several studies (Özar, 1996; Akkoyunlu, 1995), and
indicates that not much has changed about keeping IT rooms locked from the point of most
principals since 1984.
After completion of BEP I, the World Bank also reported some mistakes of MONE
and made a self-criticism related to the ICT components of the project (World Bank, 2004).
It criticizes MONE for not preventing administrative and purchase delays in educational
material provision, for not writing a policy on how to integrate ICT into the curriculum, and
for not completing ICT impact study before BEP I completion date. The World Bank wanted
the Government to prepare and update the IT policy paper and formulate a strategy “to
integrate IT into the curriculum and teacher training” (pp. 8-9). The IT policy paper and ICT
impact study were not completed before the project closing date. The World Bank also
pointed out that subject teachers were not trained in “how to integrate computers into their
lessons”. On the other hand, the World Bank made a self-criticism in the same report, for
placing extensive emphasis on solving problems related to procurement and financial issues
instead of focusing on outcomes, and for not to synchronizing training of formator teachers
and computer provision to schools. In addition, it note that it had not continuously sought
opportunities, or entry points, to engage in dialogue with the Government on other aspects of
education quality, such as review of the curriculum and content of teacher training (World
Bank, 2004). It is understood that the World Bank discerned that solely providing of
educational materials in terms of hardware and software will not lead to increased
educational quality without considering the other parts of the education system, such as
curriculum and teacher training at the end of BEP I.
The World Bank states that there is no evidence of improvement in the quality of
basic education or of improvement in computer literacy penetration through BEP I (World
Bank, 2004). Nevertheless, this organization admits that the potential uses of computers in
schools are many and implementation processes are long-term (World Bank, 2004). In this
sense, the World Bank claims that the ICT investments in BEP I could set the preconditions
to achieve more ambitious goals for the future, which include radical change of school
culture. Thus, the World Bank does not draw final conclusions about the efficiency of ICT
investments in BEP I, rather, they only report their formative evaluation (World Bank,
2004).
In order to propose suggestions for issues of ICT integration in Turkey raised in the
reports of MONE (2004) and the World Bank (2004), Bhullar (2005) conducted a document
analysis on ICT policies and implementations in 15 countries, from North and South
34
America, Europe and Asia. Based on the experiences of these countries, Bhullar proposes
ICT-in-education policies and strategies. At the end of her analysis, Bhullar concludes with
the following four policies and related strategies at a national level for Turkey:
Create a responsive educational system: The critical success factor for ICT
integration into schools in Europe, North America and Asia is the creation of an education
system responsive to the needs of a knowledge society.
Creating new knowledge and information should be emphasized, rather than rote
learning.
There should be a focus on more individual learning in the education system
(Differentiate approaches used in teaching and learning considering students’ different
aptitudes and learning habits).
More creative and self-directed education methods should be introduced (employ
real life problems and solutions)
In order to optimize the value of new technologies in schools, IT resources
should be given directly to the teachers and students so that they may find new ways of
using these technologies: While technology advances, an attitude shift in instruction
towards learning is necessary. Traditional teaching and learning do not fit with ICT
integration.
A holistic approach beyond the technological dimension is needed to effectively
integrate ICT into education policy: Successfully utilizing the potential of new
technologies (multimedia, and Internet etc.) in education depends far more on pedagogical
and organizational issues than on technologies themselves. The ICT-in-education policy
should consider other aspects, such as curriculum assessment, the professional development
of teachers, research and development, ICT resources and fund generation.
Accumulation of capital and workforce is not sufficient in competition between
countries: The capacity of the workforce to generate knowledge must be continuously
promoted. For this aim, an ICT-in-education policy should be implemented so as to
complement and support other development strategies, instead of being formulated in
isolation (Bhullar, 2005, pp. 112-113).
Bhullar (2005) explains the importance of arrangements in policy and the regulatory
environment, such as clearly defining the roles and responsibilities of all departments in the
ICT integration process, transforming education policy into action, educating students
regarding the use of Internet, and improving access and equity to narrow the digital divide.
As to policies at school management level for successful integration of ICT into
education, Bhullar (2005) proposes that optimization of the potential of ICT in education

35
necessitates a shift in the learning paradigm. ICT provides possibilities for changing both the
ways students learn and teachers teach (Bhullar, 2005); thus, curriculum, learning objectives,
teaching strategies and activities in the classroom should be changed in the light of a
paradigm shift in the concept of learning. For successful ICT integration, Bhullar (2005)
suggests three policies at school management level:
1. Creating ICT vision and strategy in schools
• Top-down strategies will not work
• Create a shared vision and decide strategies together with all stakeholders affected
from the outcome of ICT integration (teachers, students, parents and the
community)
2. Putting together an ICT integration plan
• To promote use of ICT in schools, MONE should set guidelines, rather than
imposing rules or regulations.
• To promote ICT use in schools, school managerial staff should initially adopt
strategies that make ICT a part of the daily routine of teachers.
• Schools should have a master ICT integration plan customized to their own school
culture and environment.
• An ICT integration plan should detail how teachers are expected to use technology
in lessons.
• Making such a plan is complex and time consuming, but worthwhile.
3. Giving schools some autonomy to select ICT resources that are most suitable to the
needs of students and teachers
• MONE should provide basic technological infrastructure
• MONE should let schools decide on the kind of ICT resources and tools that they
need, based on their own vision and analyses of students’ learning needs
• Better ICT integration in the curriculum is ensured only if the fact that every
school is different is recognized
• There is a need for strong and committed leadership of technology integration
(Bhullar, 2005, pp. 112-115).
The suggestions of Bhullar (2005) for successful technology integration at school
level could be summarized as follows: schools should create their own vision and strategy
based on a comprehensive needs analysis about teaching and learning at school, and should
make an ICT integration plan together with all stakeholders. Another important point is that
schools should have some autonomy to decide an ICT equipments based on their own needs.
36
Şahinkayası and Şahinkayası (2004) also emphasize a lack of regional or school
level instructional technology planning in Turkey. In their study, they attached importance to
the integration of ICT into schools within instructional technology planning. Based on
Anderson (1996, 1999) and Anderson and Perry (1994), they give the definition of an
instructional technology plan, comment on its indispensible components and provide
suggestions for developing and implementing a successful instructional technology plan.
They point out that a well-prepared instructional technology plan should be developed by all
stakeholders for the proper integration of ICT into school, and it should include student,
teacher and school characteristics and the components of the instructional technology plan
such as: vision and mission statements, needs analysis, implementation and working
schedule, professional development, maintenance and support, budget and financial
resources, standards, instructions, security, moral issues, and evaluation. Özar (1996)
indicates the need to develop a policy document to be used in schools, as well. This
document should address long and short-term goals, resource management, technical
support, staff development, and student entitlement etc. Furthermore, as he states, this policy
document should be revised regularly to keep up with recent developments. Aşkar (2004)
also states that for an efficient use of ICT facilities, schools should have a vision about the
use of ICT, a technology plan, a support mechanism for teachers, technology integration plan
for each subject, collaboration with computer teachers, and evaluation works (as cited in
Tuti, 2005).
Gülbahar (2007) presented the process of conducting the technology planning and
indicated the important components of technology planning by reporting the technology
planning process for a private school. In this private school, she collected data from 105
teachers, 25 administrative staff, and 379 students through questionnaires. Besides, she
conducted unstructured interviews with the administrative staff and teachers to validate the
questionnaire results. She descriptively analyzed the data to investigate the administrators’
and teaching staff’s perceived computer literacy, and issues related to ICT use. She also
investigated students’ perceptions about the current utilization of ICT in their school. In her
study, she illustrated how these obtained data could be used in technology planning. For a
successful technology integration in schools, Gülbahar (2007) suggests the technology plan
should especially guide the school staff in the following aspects: (1) maintenance and
continuous update of the technology plan, (2) hardware and software maintenance and
update, (3) equity of access to technological resources, (4) providing support services for
teachers and administrative staff, (5) reward systems that encourage teachers and
administrative staff to use technology, (6) integration of instructional technologies into the

37
curriculum, and (7) in-service training. Gülbahar (2007) concluded that teachers and
administrative staff felt themselves competent in using ICT available at school, but they
reported a lack of guidelines that would lead them to successful technology integration.
Students reported that ICT is not utilized sufficiently in their classes.
2.2.1 ICT Use, Competency and the Feelings of Students in Turkey
Yalçınalp and Yıldırım (2006) conducted a descriptive study on Turkey’s ICT data
in PISA 2003 to analyze ICT demographics, the perceived frequency of ICT use, perceived
ICT competency, and feelings about ICT. They also analyzed the differences between males
and females in these aspects, with t-test. Firstly, for ICT demographics, they report location
of computer access, how long the students have used computers, and from whom they
learned computers and Internet. Most of the students have access to computers from other
sources (73.4% of 3,458 students), while more than half of the students use computers
(53.6% of 3,488 students) at school and only 37.2% of students at home (N= 3,367). Two
thirds of the students had been using computers for three years or less. Almost one third of
the students reported that they learned to use the computer and Internet by themselves. Only
29.2% students stated that they learned to use computer at school. It is noteworthy that
around half of the students who have computer access at school reported that they learned to
use computers at school. As to Internet, only 9.7% of students stated that they learned to use
Internet at school. The lower proportion of students who had learned Internet at school than
those who learned computer at school could be due to the existence of IT rooms with lack of
or slow Internet access in the 2003 school conditions. Secondly, for frequency of computer
use and computer competency levels, Yalçınalp and Yıldırım (2006) report that 41.1% of
students used computers at school a few times each week. They claim that ICT was used
more actively with the employment of more computer teachers in schools in recent years.
Thirdly, the results indicate that students feel most confident in playing games (79.7%),
starting games (78%) and drawing pictures with the mouse (76.8%), while they feel least
confident in using antivirus programs (20%), designing web pages (27%) and programming
(28%). Finally, the majority of students had positive attitudes towards ICT (85.6% of them
saying they agreed or strongly agreed to four positively stated attitude items).
Tuti (2005) conducted a descriptive and correlational study to investigate the use of
ICT, according to the performance indicators in the use of ICT in education, students’
computer self-efficacy and students’ opinion of ICT at lower secondary schools. Her sample
was 1014 seventh grade students in 24 basic education schools (19 public, 1 private, 2 BEP,
and 1 MLO - Müfredat Laboratuar Okulları) in Çankaya region of Ankara. She administered

38
a survey consisting of an ICT questionnaire, computer self-efficacy measures and opinion of
ICT measures. The performance indicators were access to computers, use of computers, use
of Internet and use of ICT in education.
Her study also indicated that students’ self-efficacy towards computer is high (its
mean is 3.8 out of 5) and their opinions about the ICT use in education are positive.
However, when the school type is taken into consideration, students who have the lowest
self-confidence are from public schools, while students who have the highest self-confidence
are from the private school. She stated that the access and use of ICT varies according to
school type. That study also showed that computer self-efficacy of students who attend a
school with IT room and had taken computer courses is significantly higher than that of
students who attend a school without IT room. Tuti (2005) concluded that ICT facilities
available for students at school positively influence students’ computer self-efficacy.
According to the results, 56.6% of the students have computer access at home.
Students use computer at school mostly in IT rooms (46.4%). Very few students stated that
they use computers in such different places as, multimedia room (6.5%), library (6%),
science laboratory (5.6%), and the classroom (2.3%). However, 60.8% of students reported
that they do not use computer in the school. She detected a dramatic difference between
students of public school (other than BEP or MLO) and students of private schools in access
to ICT. Access to ICT is widespread for the private school students, while it is almost none
for the public school students. Furthermore, 22.8% of the students stated that they have never
used computer before and 67.8% of them stated that they have never used the Internet. From
computer users, 29% of them also reported that they never use computer for educational
purposes. Only 38% of students stated that they use computer for educational purposes once
a week. If teachers and families guide students about how to use computers and Internet,
then these tools can become useful and appropriate (Tuti, 2005).
She deduced that families have an important role in students’ using computers, since
most of the students reported that they had learned using computers from their family or by
themselves. ICT use out of school generally occurs at home and in Internet cafes. The results
also indicated that very few students use educational software (less than %2).
When she examined the use of ICT in lessons, she concluded that science is the
course in which ICT is mostly used. Thirty percent of the students stated that they use ICT in
science courses, while 22% in social science, 19% of them in Turkish Literature courses,
17% of students stated that they use ICT in mathematics courses, 14% in foreign language
courses and 7.5% in painting and 6.8% in music courses.
39
2.2.2 Comparison of Turkey and the EU in Integration of ICT into K-12 Schools
There are studies and documents comparing and contrasting education systems,
particularly ICT facilities and utilization in primary and secondary schools in Turkey and in
the EU (Göktaş, 2003; Uşun, 2004; Yıldırım, 2006).
Göktaş (2003) conducted a document analysis to identify similarities and differences
between the education systems of Turkey and 15 EU member states regarding integration of
ICT into primary education curricula and teacher education programs. In his thesis, Göktaş
(2003) outlines the relationship between Gross National Income (GNI) per capita,
population, and possession and utilization of ICT. As GNI per capita increases, the ICT
possession rate also increases. On the other hand, there is an inverse relationship between
size of population and ICT utilization. Countries with smaller populations have more ICT
possession and ICT utilization.
As to a comparison of the EU member states and Turkey in terms of ICT inclusion in
primary education, ICT at primary education has become an integral part of the compulsory
curriculum in many EU countries (Eurydice, 2001a). Furthermore, ICT is seen as a tool to be
used throughout the whole curriculum, which is reflection of the policies and initiatives in
most EU countries. In Turkey, on the other hand, primary school curricula include only an
optional computer course, and offering that course generally depends on school conditions or
students. Göktaş (2003) reports that at the time of his research there is little evidence of
conducting a serious revision of that curriculum to increase the use of ICT. On this basis, he
suggests that primary education curricula should include ICT as a must course whose
objectives are more applicable and relevant to daily life. Turkey has to take measures to meet
the EU standards for ICT integration into her education system (Göktaş, 2003). Note that the
curriculum reform in 2004 still includes ICT courses as optional, not must courses.
Uşun (2004) conducted a document analysis in order to review, compare and
contrast the applications of instructional technologies in Turkey and developed countries. He
focused on distance education, use of Internet, and Computer Assisted Education (CAE) as
methods and media in his study. First, although the number of computers is increasing at
schools, Turkey is still at the very early stages in CAE projects, applications and studies
compared to developed countries (Uşun, 2004). According to Uşun (2004), in spite of
initiatives taken by MONE to promote computer literacy and the use of CAE in schools,
from 1984 through 2002, unfortunately, computer education and CAE were still in the early
stages of development. As he points out, even the main components and aims of the first
project (CAE project) launched in 1984, couldn’t be realized. In the other projects, supported
by the World Bank in 1998, the 53 CES project in 1993 and BEP I, the main components

40
and aims had also not been realized. However, according to Uşun (2004) these projects
appear to be very important steps for the Turkish education system. He infers the major
problem areas of CAE in Turkey as effective planning and administration of CAE projects,
insufficient financial resources, lack of adequate software, hardware and teacher training for
CAE, and the lack of the projects and experimental studies on the computer education and
CAE (Uşun, 2004).
Second, despite some extensive initiatives and projects to integrate Internet into the
Turkish education system since 1990 (e.g. computer experimental schools and computer
laboratory schools), Uşun (2004) draws attention to the nonexistence of an infrastructure of
computer networks in primary and secondary education schools, due to the highly
bureaucratic and centralized nature of MONE. The educational uses of the Internet were still
in their infancy compared to developed countries (Uşun, 2004). After his comprehensive
literature review on instructional technology utilization, Uşun (2004) concluded, “Although
Turkey considers itself part of the European community, its educational problems place it
rather with its Asian neighbors” (p. 270).
Uşun (2004) accounts for the rapid development of the technology access rate at
schools in developed countries, as well. According to him, this could be due to the relative
advantaged position of developed countries in the following factors: locally achieving
technological advancements -no import cost, capable of producing products meeting local
needs, quick delivery, and support services-; support to schools by individuals besides the
government; existence of clearly specified policy documents supporting teachers in using
technology for teaching and learning; and available research funds for evaluation of media
effects, the results of which are a base for future planning (Uşun, 2004, p. 250-251).
Yıldırım (2006) compares and contrasts Turkey and the EU member states in terms
of the role of ICT in education. According to Yıldırım, the number of students in the
education system, economic indicators and budget allocation per student are the most
detrimental factors for the role of ICT in education. Serving a large population increases the
problems in the Turkish education system compared to the EU member states. Turkey’s
economic indicator of per capita was around $6,900 in 2005 while that of the EU member
states with similar populations are above $27,000. Similarly, although 3.8% of the budget
was allocated to education, educational expenses per student were below $700 in Turkey.
This amount is much lower than the EU member states that allocated around $5,000-7,000 to
education. Turkey allocates only 15% of the average budget allocation of the EU to
education per student. ICT investments are also met from this budget. Schools offering high
quality education are very few compared to schools offering low quality education.
41
According to Yıldırım (2006), the primary goal should be spreading the standards of those
schools offering high quality education to those offering low quality educations. ICT plays
an important role in sharing limited resources to spread quality. In this sense, Yıldırım
(2006) suggests that:
• In order to digitize and share high quality educational content, Turkey has to invest in ICT
• Successful teaching methods have to be shared with other teachers via ICT to increase quality of education.
Putting ICT into schools, maintenance of those ICT at schools and employing
teachers in such a profile that he/she leads other staff in using ICT at schools are crucial for
Turkey as a candidate for EU membership (Yıldırım, 2006).
2.3 ICT Integration Issues from Other Countries
Eurydice (2001a) concludes that non-use of the Internet by teachers in their classes is
largely attributable to difficulty in accessing the Internet in European countries. The teachers
lay down three major reasons. Firstly, problems of Internet access at schools because they
are not equipped with computers or have no Internet connection, or because classrooms
themselves do not provide for an Internet connection. Secondly, and much less frequent, are
reasons concerned with the lack of relevance of the Internet to their teaching, either because
teachers consider that there is no need to turn to the Web for one or more subjects on which
they work with their students, or because they believe that information available on the
Internet is difficult to use because it is in a foreign language. Finally, the least commonly
cited reasons are those related to lack of familiarity with the Internet on the part of students
or the inability of teachers to use it. The foregoing ranking of factors is the same in the
majority of the cases in the EU member group (see Figure 2.2).
Mumtaz (2000) conducted a review of literature about factors influencing teachers’
decisions to use of ICT in the classroom. The review indicates three interlocking factors that
affect teachers’ use of ICT: institution (school), resources, and the teacher. More
specifically, access to resources, quality of software and hardware, ease of use, incentives to
change, support and collegiality in their school, school and national policies, commitment to
professional learning and background in formal computer training are the factors affecting
teachers’ decisions (Mumtaz, 2000). Based on this review, Mumtaz (2000) underlines the
role of pedagogy and suggests that teachers’ beliefs about teaching and learning are central
to ICT integration.
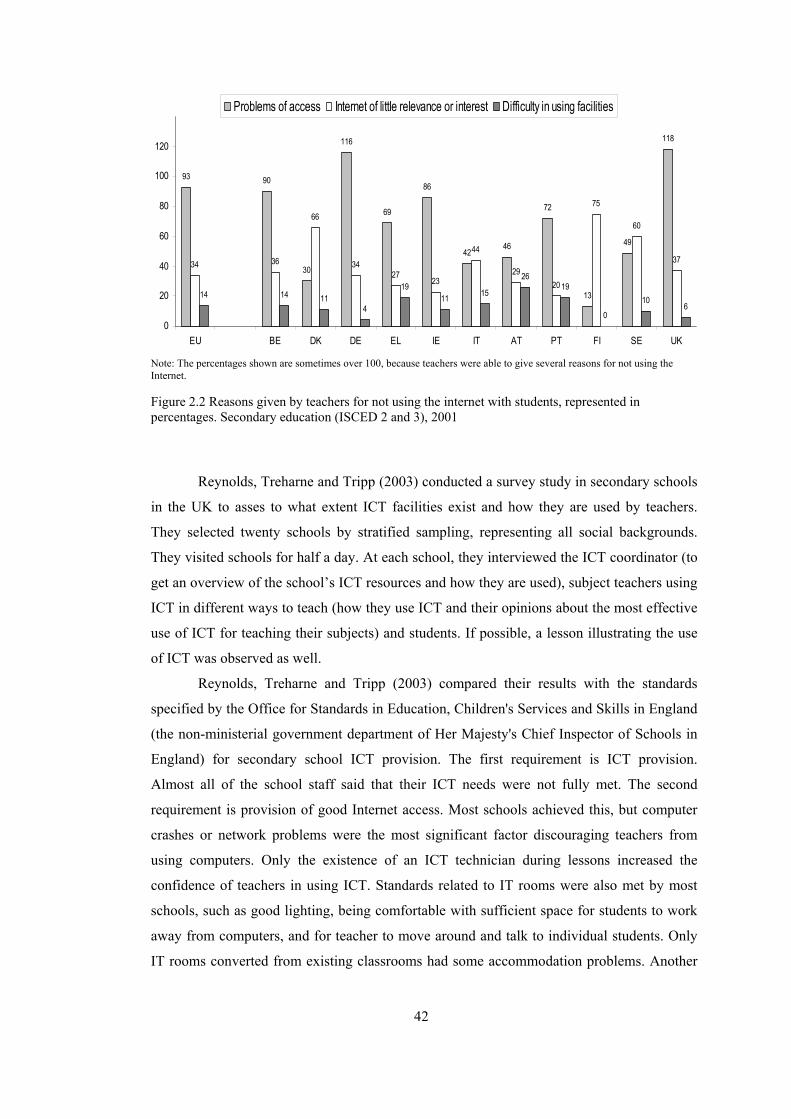
42
Problems of access Internet of little relevance or interest Difficulty in using facilities
93 90
30
116
69
86
4246
72
13
49
118
34 36
66
3427
23
44
2920
75
60
37
14 14 114
1911 15
2619
0
106
0
20
40
60
80
100
120
EU BE DK DE EL IE IT AT PT FI SE UK
Note: The percentages shown are sometimes over 100, because teachers were able to give several reasons for not using the Internet. Figure 2.2 Reasons given by teachers for not using the internet with students, represented in percentages. Secondary education (ISCED 2 and 3), 2001
Reynolds, Treharne and Tripp (2003) conducted a survey study in secondary schools
in the UK to asses to what extent ICT facilities exist and how they are used by teachers.
They selected twenty schools by stratified sampling, representing all social backgrounds.
They visited schools for half a day. At each school, they interviewed the ICT coordinator (to
get an overview of the school’s ICT resources and how they are used), subject teachers using
ICT in different ways to teach (how they use ICT and their opinions about the most effective
use of ICT for teaching their subjects) and students. If possible, a lesson illustrating the use
of ICT was observed as well.
Reynolds, Treharne and Tripp (2003) compared their results with the standards
specified by the Office for Standards in Education, Children's Services and Skills in England
(the non-ministerial government department of Her Majesty's Chief Inspector of Schools in
England) for secondary school ICT provision. The first requirement is ICT provision.
Almost all of the school staff said that their ICT needs were not fully met. The second
requirement is provision of good Internet access. Most schools achieved this, but computer
crashes or network problems were the most significant factor discouraging teachers from
using computers. Only the existence of an ICT technician during lessons increased the
confidence of teachers in using ICT. Standards related to IT rooms were also met by most
schools, such as good lighting, being comfortable with sufficient space for students to work
away from computers, and for teacher to move around and talk to individual students. Only
IT rooms converted from existing classrooms had some accommodation problems. Another

43
finding was a lack of comprehensive provision of digital projectors, and a need for further
training of teachers in using this equipment, a need for an efficient and equitable reservation
system for IT rooms, and a lack of increase in ICT facilities parallel to in-service training of
the staff on ICT.
Reynolds, Treharne and Tripp (2003) conclude that if a school has a strong whole-
school ICT policy, lead by an expert in ICT, its teachers are more confident in using ICT for
teaching because of feeling that the necessary support exists. The other essential factor for
ICT use in schools is that teachers need to believe that ICT will improve their teaching and
their students’ learning. According the results of their survey, 83% of teachers said that they
believed ICT in raising learning standards. The researchers argued, “Yet, we wonder, why is
it a belief instead of a reality after the investment of so much in terms of both money, time,
commitment and energy in ICT over the past twenty years?” (p. 166). Based on this issue,
they claim that acceptance of the human factor besides the financial, social and
organizational costs of using ICT is still lacking. At this point, that teachers’ beliefs about
teaching and learning play a crucial role in integrating ICT into schools is stressed by
Reynolds, Treharne and Tripp (2003), like Mumtaz (2000).
It is intriguing that teachers’ need for in-service training in using computers or
utilizing computers in their teaching is not an issue in the study of Reynolds, Treharne and
Tripp (2003). The reverse is the case in Turkey, where almost all studies on ICT integration
indicates urgent need for better professional development system for teachers on ICT literacy
and ICT integration.
Addo (2001) puts forth a number of factors as barriers to utilization of IT for
education and development in developing countries, especially in Africa. These are lack of
good, reliable and adequate infrastructural system including the supply of electricity, a
conducive computer environment and telecommunications; a non-literate population; lack of
finance (foreign exchange); multiplicity of languages (whether IT alone could enable sharing
of information); lack of national information technology policies; and rapid and
technological advances and changes (Addo, 2001). He concludes that developing countries
need to develop a strong commitment to research and take advancement of local knowledge
through its own research. Otherwise, as Addo claims, developing countries will always have
to rely on and follow the developed nations for knowledge and development.
44
2.4 ICT and Attainment
2.4.1 International Studies Comparing Student Achievement across Turkey and the EU
Berberoğlu (2005) examined various international and national student achievement
assessments to examine student performance levels across Turkey and the EU countries. He
analyzed the TIMMS 1999, PIRLS 2001, the 2000 National Assessment Program for lower
secondary schools and PISA 2003 data. The PISA mathematics scale uses six proficiency
levels to describe student performances, Level 1 is the lowest and Level 6 is the highest. The
mean score of Turkish students corresponded to level 2 (423), while students from most
OECD countries performed at level 3. Then, Turkish students can make direct inferences and
extract relevant information from a single source, use single representations, carry out
algorithmic calculations, and their reasoning skills are limited to direct procedures
(Berberoğlu, 2005). He (2005) points out that almost 28% of 15-year-old students in Turkey
performed at the bottom proficiency level (Level 1), and over 50% performed at level 1 or 0
on the PISA 2003 mathematics scale. The proportion of students in these two bottom
categories is larger than the average proportions of students in these categories in the OECD
and the EU countries. Ironically, 2.4% of Turkish students performed at sixth proficiency
level (Berberoğlu, 2005). He underlines that this proportion is larger than some EU member
states like Italy (1.5%), Portugal (0.8%), Greece (0.6%), Spain (1.4%), and Latvia (1.6%).
He (2005) concludes that Turkish students on average do not perform beyond certain basic
computational skills and demonstrate only a basic understanding of concepts in mathematics
and science, considering the results of both TIMSS and PIRLS in terms of student learning
achievement. As to reading skills, they generally can only retrieve explicitly stated
information from a text.
Berberoğlu (2005) also investigates how differences in region, gender, and school
type affect learning outcomes in Turkey. He detected striking differences in student
achievement between two groups of schools: (1) Schools having very low student
performance: general high schools, vocational high schools, Anatolian vocational high
schools and basic education schools, (2) Schools having high achievers: science lycées,
Anatolian high schools, and police colleges. He (2005) states that the differences between
types of schools in terms of student achievement are significant and have a large impact, but
still they are not as severe as the differences between regions. Further analyses indicated that
the difference between two groups of schools could be due to student-related characteristics,
such as mathematics self-concept and mathematics efficacy, anxiety about mathematics, and
climate in mathematic lessons (Berberoğlu, 2005). Based on these results, he (2005)

45
proposes that more emphasis should be placed on reducing the achievement gap between
different school types, particularly by providing more resources and spending greater effort
in raising students’ learning achievement in general secondary and vocational schools.
2.4.2 Meta-analysis Studies
There are many meta-analysis and literature review studies designed to measure the
overall effect of ICT use on student achievement. However, the literature on the effect of
ICT on achievement is still inconclusive and leading to merely tentative conclusions (Kulik,
2003). Yet, as a field, IT is newly developed with around 50-years of study in the field at
most. So, the field is still transforming, based on lessons learned from its past. In the field
professionals go on to study the interaction between learner characteristics, learning tasks
and media attributes for designing better learning environments.
Two recent studies, one from the USA and one from the EU are reported in this
section. Kulik (2003) conducted a meta-analysis on studies conducted in American
elementary and secondary schools published since 1990 and on reviews of studies published
before 1990. Effect size measures were used to summarize his findings. Kulik (2003)
contends that schools have become more successful in utilizing instructional technology in
teaching and learning in the 1990s compared to earlier years. He relates this improvement to
two reasons. First, computer technology has become more user-friendly, faster, and more
sophisticated than it was three decades ago. Second, students are more familiar with the use
of ICT and many teachers have comfortably been able to use instructional technology. Based
on his meta-analysis results, he comes up with tentative conclusions related to the use of
instructional technology to improve instruction in reading, writing, mathematics and natural
sciences. Related to mathematics, he claims that ICT often improves student achievement in
mathematics with a .40 median effect size in seven studies. He states that especially
Integrated Learning Systems (ILS) software has been producing positive results in
mathematics programs for decades. ILS comprises software programs that provide sequential
instruction for students over several grades, while keeping extensive records of student
progress. Most ILS programs use tutorial instruction as a basic teaching methodology, and
most of them provide instruction in the basic skill areas of reading and mathematics (Kulik,
2003).
The other review of literature about the impact of ICT on schools was conducted in
the European context by Balanskat, Blamire and Kefala (2006). In their study, the six studies
they reviewed are more quantitative based, and tried to establish a causal link between use of
ICT and students’ outcomes based on analyzing the statistical relationship between use of
46
ICT and students’ results in exams or tests. They conclude with the following statements,
based on those quantitative studies about learning outcomes:
1. ICT impacts positively on educational performance in primary schools, particular in English and less so on science and not in mathematics.
2. Use of ICT improves attainment levels of school children in English- as a home language- (above all), in Science and in Design and technology between ages 7 and 16, particularly in primary schools.
3. In the OECD countries there is a positive association between the length of time of ICT use and students’ performance in PISA mathematics tests.
4. Schools with higher levels of e-maturity demonstrate a more rapid increase in performance scores than those with lower levels.
5. Schools with good ICT resources achieve better results than those that are poorly equipped.
6. ICT investment impacts on educational standards most when there is fertile ground in schools for making efficient use of it.
7. Broadband access in classrooms results in significant improvements in pupils’ performance in national tests taken at age 16.
8. Introducing interactive whiteboards results in pupils’ performance in national tests in English (particularly for low-achieving pupils and for writing), mathematics and science, improving more than that of pupils in schools without interactive whiteboards (Balanskat, Blamire & Kefala, 2006, p. 3).
ICT is effective in improving achievement in English, Science, and Design and
Technology courses, but not in Mathematics for, particularly, primary schools. It is drawn as
a conclusion that students with rich ICT facilities at school are more successful than students
with poor ICT facilities at school. However, it is not enough to have ICT facilities at school,
productive and supportive arrangements are also required to use these facilities efficiently
(Balanskat, Blamire & Kefala, 2006).
In addition to quantitative studies, they also reviewed qualitative studies and made a
further four, more qualitative-based, statements about the impact of ICT on learning
outcomes. These are mainly based on opinions of teachers, students and parents:
1. Pupils, teachers and parents consider that ICT has a positive impact on pupils’ learning.
2. Pupils’ subject-related performance and basic skills (calculation, reading and writing) improve with ICT, according to teachers.
3. Teachers are becoming more and more convinced that the educational achievements of pupils improve through the use of ICT.
4. Academically strong students benefit more from ICT use, but ICT serves also weak students (Balanskat, Blamire & Kefala, 2006, pp. 3-4).

47
In summary, ICT is perceived as a contributor to achievement by students, teachers,
and parents. Teachers are getting convinced that student attainment improves through ICT
use. ICT is utilized wisely by high achieving students, but it can also be used to improve low
achieving students’ attainment level (Balanskat, Blamire & Kefala, 2006).
2.4.3 ICT and Attainment: International Studies on TIMSS and PISA
Some studies investigating the relationship between ICT and attainment (Pelgrum &
Plomp, 2002; Fusch & Woessmann, 2004; Sweet & Meates, 2004) reanalyze international
student assessment studies, such as TIMSS 95-99 and PISA 2000. These studies are
presented in this section.
Pelgrum and Plomp (2002) conducted a study on TIMSS 95 and TIMSS 99 data to
describe general trends in indicators related to ICT and mathematics education. Their major
finding was that ICT use in mathematics education was minimal, except for some countries,
and the finding remained the same between 1995 and 1999. They selected fourteen countries
from TIMSS-95 data which has at least 150 high ICT-using and low ICT-using students in
their mathematics lessons. When those two groups’ mathematics achievement scores are
compared within each country, it is found that students who used ICT frequently for
mathematics learning had much lower achievement score than students who hardly ever used
or did not use ICT for all countries. They relate this finding to the fact that focus on drill and
practice exercises for lower ability students is more common than other types of ICT use in
mathematics courses, which yields a sample selection-bias, as they admit. This means, high
ICT-using group and low ICT-using group are already different from each other in
achievement before the ICT intervention. They also compared home background indicators
of these groups. They conclude that these two groups did not seem to differ in home
background variables.
However, Kroesbergen and Van Luit (2003) made a meta analysis of 58 studies of
mathematics interventions for elementary students with special needs. Interventions in three
different domains were selected: preparatory mathematics, basic skills, and problem solving
strategies. They state that interventions involving the use of CAI and peer tutoring showed
smaller effects than interventions not including these supports. They conclude that the use of
CAI can be very helpful when students have to be motivated to practice with certain kinds of
problems. With the use of a computer, it is possible to let children practice and automate
math facts and also to provide direct feedback. Yet, the computer cannot remedy the basic
difficulties that children encounter. In general, the results of their study show that, traditional
interventions by teachers are the most effective among all types of interventions, including

48
CAI. Whereas the literature states that ICT intervention is used for remedial purposes with
low achieving students (Pelgrum & Plomp, 2002), the meta-analysis of Kroesbergen and
Van Luit (2003) on mathematical interventions for elementary students indicates that CAI
and peer tutoring are less effective than traditional teacher-centered interventions especially
for the basic difficulties that students encounter.
Pelgrum and Plomp (2002) also compared frequency of instructional approaches
used during mathematics lessons for high and low ICT using groups. In all countries, the
majority of students in high ICT using groups also were frequently involved in student-
centered approaches (project work, working in small groups, or working on mathematical
problems related to daily life). When they checked this relationship within each country,
there was a negative association between student-centered instructional practices and
mathematics scores in almost all countries. Overall, they deduce that there is tendency to use
ICT in student-centered approaches in teaching mathematics. They put forth a tentative
hypothesis to explain the large score difference between low ICT users and high ICT users in
mathematics education. This is caused by the fact that a student-centered pedagogical
approach -including more frequent use of ICT- places less emphasis on competencies, such
as those measured in TIMSS-95 mathematics test (Pelgrum & Plomp, 2002). It should be
noted that TIMSS program is highly curriculum-oriented, and that is applied to eighth
grades, in contrast to PISA which aims to measure basic skills used in daily life.
Fusch and Woessmann (2004) estimated the relationship between students’
educational achievement and the access to and use of computers at home and at school in
PISA 2000 student-level data. Their bivariate analyses indicate a positive correlation
between achievement and access to computers both at home and at school. However, the
relationship becomes negative for home computers and insignificant for school computers
when they control extensively for family background and school characteristics. Fusch and
Woessmann (2004) propose that merely having access to computer at home seems to distract
students from effective learning. Holding the other family-background characteristics
constant, students perform significantly worse if they have computers at home. This may
reflect to the fact that computers at home may actually distract students from learning,
because learning through computers may not be the most efficient way of learning, and
computers may be used for aims other than learning (Fusch & Woessmann, 2004). Yet, only
measures of computer use for education and communication at home indicate a positive
conditional relationship with student achievement. As to school computers, the conditional
relationship between student achievement and computer and Internet use at school has an
inverted U shape (Fusch & Woessmann, 2004). Exactly the same conditional relationship for

49
school computers is observed by Aşkar and Olkun (2005) on PISA 2003 data for Turkish
students, as well. This appears to be a clue of continuing a similar trend after three years.
Based on the general notion in the literature that ICT can be used as a tool to
improve low achievers’ learning skills and motivation to learn, Sweet and Meates (2004)
reanalyzed PISA 2000 data to investigate levels of literacy achievement and access to and
patterns of ICT use at school and at home across 31 countries. Students with a combined
reading literacy scale score at proficiency level as 1 or below defined by PISA, were
identified as low achievers. The results show that there is a general trend that low achievers
have significantly less ICT resources at home than higher achievers, especially than the
highest achievers, in terms of number of computers at home (in 25 out of 31 countries),
Internet access at home (in 22/31), and educational software at home (in 22/31). As Sweet
and Meates (2004) report, inequalities in access to and use of ICT seem to be much more at
home than at school. Thus, they point out the importance of the school as a source of access
to ICT for low achievers. More specifically, they emphasize the importance of schools and
school systems in addressing ways that low achievers can access and use ICT outside of the
classroom and outside of normal school hours. Although the contribution of ICT resources to
achievement is not yet a totally agreed claim; the role of schools in providing ICT access to
low achievers is approved by this finding.
Sweet and Meates (2004) state that low achievers’ perceived confidence and
competence in using ICT are higher than their reported attitudes toward computers in
English-speaking countries, yet the reverse is generally the case in the remaining countries.
Sweet and Meates relate this result to the fact that around the world the most common
operating systems and most of the software are in English. If this is a part of reason, they
say, it could reinforce calls to develop educational software in other languages (Sweet &
Meates, 2004), especially native languages.
Sweet and Meates (2004) also examined level and type of computer use across
lowest and highest achievers. The overall level of computer use by low achieving students,
in most of the PISA 2000 countries, is not significantly different from that of other students.
When the particular purpose of computer use is examined, there is a strong and significant
trend in 19 out of 23 countries that the lowest achievers in reading literacy report using
computers for programming more than high achievers do. There is also a common trend in
all countries for low achievers to report that they use computers for games more frequently
than high achievers do, despite not being statistically significant. Drawing for graphics and
using spreadsheet software are other computer use types by low achievers in the general
trend. On the other hand, Internet use and word processing are more common by high
50
achievers and less common by low achievers. Another noteworthy finding is that in four
Scandinavian countries (Denmark, Finland, Norway and Sweden) low achievers tend to
report more than high achievers that they use educational software. This trend is not
significant in other countries, although the pattern is in the same direction in most of them
(Sweet & Meates, 2004).
Based on their analyses, Sweet and Meates (2004) infer that in the case of low
achieving students, the scale of the digital divide varies widely across countries, and they
state that it need not be apparently related either to national welfare or to the ease and
cheapness of ICT access in those countries. Rather, they propose that the digital divide
especially depends on home conditions, in other words welfare in the home (Sweet &
Meates, 2004, p. 10).
İş Güzel and Berberoğlu (2005) conducted a structural equation modeling study on
PISA 2000 to investigate factors affecting mathematics and reading literacy performance.
They found that there is a positive relationship between school resources, such as computers,
calculators and libraries with math literacy performance at the medium level in Brazil, which
is a developing country whose conditions are similar to Turkey. However, the same
relationship is not significant in Norway and is weak, but negative in Japan. They attributed
this discrepancy in findings to the novelty effect on education (Mcmillian and Schumacher,
2001 as cited in İş Güzel & Berberoğlu, 2005), because the use of computers and calculators
is relatively new in the Brazilian education system compared to Norway and Japan.
Technological school resources positively affect student performance as long as they are
newly introduced into education system (İş Güzel & Berberoğlu, 2005). The authors suggest
that as students get used to these resources, the positive impact diminishes, even changes
direction to a negative one. They also concluded that the way educational technologies,
especially computers, are used in the system is more important than providing these
technologies.
2.4.4 Studies on PISA 2003 Dataset
Since PISA 2003 data was made available at the end of 2004, researchers throughout
the world have conducted descriptive and inferential analyses exploring or testing
relationships among the many variables included in this dataset. Studies focusing on ICT
variables, mathematics, problem solving or science literacy measures are given in this
section.
Despite an increasing rate of diffusion of technology in schools, the debate goes on
about the use of computers in schools, especially on the question of effectiveness of
51
technology on student attainment (Kulik, 2003; Reynolds, Treharne & Tripp, 2003). Aşkar
and Olkun (2005) and Erbaş (2005) conducted some studies on PISA 2003 data regarding
ICT variables and student achievement in Turkey. In the international arena, Wittwer &
Senkbeil (2008) conducted a study to estimate the relationship between ICT use and
mathematics achievement. These studies are given below.
Aşkar and Olkun (2005) conducted a descriptive study to have a snapshot of the use
of ICT in schools and its possible associations with mathematics and problem solving scores
in the PISA 2003 dataset. They compare mathematics and problem solving mean scores from
Turkey with two developed countries (Sweden and the USA), two developing countries
(Uruguay and Thailand) and the OECD total mean. Their comparison classifies students
according to place of ICT access (whether access at school, at home and other places or not)
and the level of ICT use, experience in computer use, frequency of computer use at school,
frequency of Internet use, playing computer games, and educational software use. First, the
proportion of students who have never used computers before is 13.76% in Turkey. This
ratio is much larger than the OECD total mean of, 1.7%. Second, the proportion of students
having access to ICT in schools in Turkey is 38.6%, which is considerably lower than the
OECD average of, 84.19%. Third, when the mathematics and problem solving scores of
students having access to ICT and not having access to ICT in schools are compared, while
there are differences in achievement scores in favor of students having ICT access at schools
in all other countries and in the OECD mean, the achievement rates of both groups are the
same in Turkey. Aşkar and Olkun relate this situation to the fact that IT rooms are used only
for computer courses, and not used in other courses in a regular manner (2005).
Fourth, students using computers at home have higher achievement scores than those
not using computers at home for all countries. Aşkar and Olkun (2005) attribute this finding
to a more underlying factor, the socioeconomic level of students, rather than using computers
-even for educational purposes. Fifth, as to the level of experience of students in using
computers, a positive relationship between experience in ICT use and achievement in
mathematics and problem solving is found. The more experience in using computers, the
more success in achievement scores, regardless of country. Sixth, as to frequency of using
computers in school, students who use computers in school at a medium level (between once
a week or once a month and less than once a month) are more successful in math and
problem solving compared to those using computers very frequently or those never use
computers in school. Seventh, considering frequency of Internet use to access information,
students using Internet between once a week and once a month have higher achievement
scores than others who uses Internet very frequently or rarely, except for in the USA and
52
Thailand, where the more frequently the Internet is used, the more success is attained in math
and problem solving achievements. Eighth, when the frequency of game playing is
considered, in almost all countries, students playing computer games at a medium frequency
have relatively higher achievement scores than those who play very frequently or than those
never playing computer games. Finally, for the frequency of educational software use,
generally students using educational software less than once a month have relatively higher
scores than those using educational software at other frequencies.
Based on these results, Aşkar and Olkun (2005) draw the following conclusions: (1)
access to computers at schools in Turkey is at a low level compared to the OECD countries,
(2) students having access to computers at schools have higher mathematics and problem
solving achievement than those not having computers in schools, (3) students having
computers at home have higher achievement scores than those not having computers at
home, (4) students using computers for a long time have higher achievement scores than
those using computers for a short time and (5) students using computers at school, using
Internet and educational software, and playing computer games at a medium frequency have
higher scores than the other students. It could be inferred that controlled, conscious and
purposive computer use in education is associated with success. In fact, more ICT use does
not mean better (OECD, 2006c)
Erbaş (2005) conducted a structural equation modeling study to explore the
relationships between science literacy performance and attitudes toward computers (two
dependent latent variables) with frequency of computer use, frequency of Internet use,
having basic computer skills, and having advanced computer skills (four independent latent
variables), on Turkish students’ data from the PISA 2003 dataset. According to the fitted
model, having basic computer skills and frequency of Internet use have positive and strong
relationships with science literacy performance (standardized path coefficients for 0.51 and
0.43 respectively). On the contrary, frequency of computer use, and having advanced
computer skills and attitudes toward computers have negative relationships with science
literacy performance (standardized path coefficients for -0.52, -0.22, and -0.08 respectively).
In addition, the model illustrates the positive relationship between Internet use, basic
computer skills and advanced computer skills with attitudes toward computers (standardized
path coefficients for 0.32, 0.23, and 0.18 respectively). It should be noted that there is no
meaningful relationship between computer use and attitudes toward computers.
Wittwer and Senkbeil (2008) detect a mistake in studies concluding that having a
computer at home and using it frequently are associated with better performance in schools.
Such studies have serious methodological faults due to not considering the multiple
53
determination of school performance. In this context, Wittwer and Senkbeil (2008)
reanalyzed the PISA 2003 Germany data to investigate the relationship between students’
home computer use and their performance in mathematics by controlling other factors that
have been found to affect students’ achievement. They also investigated possible differences
in students’ school performance depending on how students use the computer. Multiple
regression models were conducted to predict students’ mathematics and problem solving
performance from availability of home computer, by controlling ESCS, gender, immigration
background, cognitive abilities, reading in leisure time, reading newspapers, watching TV,
watching news on TV, and watching films on TV. Their results indicated that students’
access to a computer was not linked to their performance in mathematics. Moreover, the
result remains the same regardless of how often they used it at home. However, a positive
effect of computer use was detected in the case of those who used the computer in a self-
determined way that engaged them in problem-solving activities, for only a small portion of
students. Types of computer use at home play a very limited role in predicting their
academic achievement. Wittwer and Senkbeil (2008) infer that computers had no substantial
influence on academic achievement for the majority of students.
2.4.4.1 Relationship between Mathematical and Problem Solving Literacy
In PISA 2003, it is focused on mathematical (as a major domain), science, reading
and problem solving (as minor domains) literacy. As explained in Chapter 1, PISA wants to
assess 15-year-old students’ performance in analyzing, reasoning and communicating
effectively when they examine, interpret and solve real life problems rather than any
discipline in school curricula. Therefore, these literacy domains can be considered as basic
complementary components of academic literacy performance of students, particularly at the
end of compulsory education. Correlations between the ability estimates for individual
students in each of these domains in the PISA 2003 are estimated to have unbiased estimates
of the true correlation between the underlying latent variables. Correlation between
mathematical and problem solving literacy is .89 for both the OECD countries and for all
countries participated in the PISA 2003 (OECD, 2005b, p. 189). Thus, it can be said that
relationship between mathematical and problem solving literacy is very strong.
2.5 Socioeconomic Status of Students and Achievement
Based on a comprehensive literature review, Yang states that there is a positive and
medium relationship between SES and student academic achievement at an individual level
in the literature, 0.30 (Yang, 2003). When classroom or school is selected as the unit of

54
analysis, the relationship between these two variables rises from 0.60 to 0.80 (Yang, 2003).
Yang conducted a two-level structural equation modeling study to simultaneously examine,
both individual and school levels, dimensionality of SES and the pattern of relationships
between the SES dimensions and mathematics and science achievement, by using TIMSS 95
data. Data from 17 countries, most of which are European countries, in addition to Hong
Honk, Singapore, Canada and the USA, were selected. In total, 123,031 students from 3,148
schools are included in the analyses. The results confirmed that the ownership of a set of
households can be used as SES indicators at both individual and school levels. Two
dimensions were identified at student level for most of the countries: a general capital
dimension and a cultural capital dimension. At school level, only the general capital factor
accounts for SES differences for the majority of countries, while both the general and the
cultural capital dimension emerged in six out of 17 countries to determine SES at school
level. For the effect of SES on achievement, the cultural resource factor has a great impact
on mathematics and science achievement at both student and school levels (Yang, 2003).
The schools’ social background, as a reflection of community demographic features explains
over 35% of school differences in school mathematics and science achievement. Yang
(2003) concludes that these findings confirmed the previous studies on the pattern of
relationships between SES dimensions and achievement at the individual and school level.
2.6 Relationships between ICT use, Self-confidence in ICT and Attitudes toward ICT
Arthur and Olson (1991) made a correlational study to investigate relationships
between cognitive ability, computer experience and computer attitude. Subjects of their
study were 136 volunteer students (54 of them were female) at a large southwestern state
university in the USA. They administered a 20-item computer attitude scale (CATT) to
measure computer attitude, a 9-item computer experience scale to measure computer
experience, a cognitive ability scale that consists of 36 matrix or design problem arranged in
ascending order of difficulty (Advanced Progressive Matrices Set II (APM, Raven, Court, &
Raven, 1985 as cited in Arthur & Olson,1991) to measure cognitive ability, the numerical
section of the Wesman Personnel Classification Test (PCT- V, Wesman, 1965, as cited in
Arthur & Olson,1991) to measure mathematical aptitude. They tested two path analytic
models: (1) the cognitive ability → computer experience → computer attitude, (2) the
cognitive ability → computer attitude → computer experience. The first model fitted to the
data but the second did not. In the first model, the standard path coefficient for the path form
55
cognitive ability to computer experience was .28 (t=3.31), and that for the path from
computer use to computer attitude was .31 (t=3.81).
Based on the analyses, they concluded that low-cognitive ability persons report less
experience with computers since they may escape from computer interactions due to initial
negative encounters. They also concluded that their finding support the argument that
“computer experiences precedes computer attitudes” (p. 53). Indeed, initial computer
experiences may play a major role in the formation of computer attitudes (Arthur & Olson,
1991). Finally, they concluded that there is no significant relation between cognitive ability
and computer attitudes. Moreover, they did not obtain gender, age, college class, GPA, or
math aptitude differences in computer experience and attitude. Thus, they call for more
research to investigate and identify variables that are exogenous to computer attitudes. Thus,
the possible influences of ICT use and self-confidence in ICT on attitude toward computers
were investigated in the mathematic and problem-solving literacy models.
Contreras (2004) conducted two stepwise multiple regression analyses to predict
computer self-confidence by using demographic and personality variables and computer use
indicators. His sample was 208 students enrolled in online college-credit classes. He
measured computer self-confidence with one 10-choice question. Demographic variables
included age, annual income, geographic region, gender, and ethnicity. He measured
computer use with computer experience (in years, with one direct question) and by the
number of online classes taken within a term. He measured personality variables with the
Bicognitive Orientation to Life Scale (BOLS). The BOLS measures field independence
(ability of math and science), field sensitivity (ability of social science), and cognitive flex
(absolute difference between field independence and field sensitivity). After his analyses,
Contreras (2004) concluded that computer experience, annual income, the number of online
classes taken within a term, and cognitive flex are significant predictors of computer self-
confidence. Based on these results, Contreras (2004) suggests that the relationship between
computer self-confidence and academic performance should be the focus of future
investigations. “If no relationship between computer self-confidence and academic
performance exists, investigations of computer self confidence may be moot” (p. 178),
Contreras said. In this sense, the relation between self confidence in ICT tasks and
mathematical and problem-solving literacy performance were investigated in the path
analytic models.
Based on the literature on computer-related behavior, Kay and Knaack (2004)
inferred that more positive computer attitudes are generally associated with higher levels of
computer ability and use. Since the research looking at the effect of one’s ability in a specific
56
subject area and the successful use of computers is far less prevalent (Kay & Knaack, 2004),
the relationship between mathematical and problem-solving literacy and ICT aspects were
investigated in the path analytic models proposed in this study.
Kay and Knaack (2004) stated that older students (15–16 years old), viewed
computers as tools for accomplishing tasks and getting work done (e.g., word processing,
programming, use of the Internet, and email), whereas younger students (11–12 years old)
saw computers as a source of enjoyment (e.g., play games and use graphics software) (Kay
& Knaack, 2004). It is not clear whether differences observed in computer-related behavior
are a result of advances in cognitive and emotional maturity (age) or whether they are due to
the cultural biases that may emerge at certain grade levels (Kay & Knaack, 2004). For the
case in Turkey, Orhan and Akkoyunlu (2004) also reached a similar finding. They conducted
a study on basic education students’ Internet usage. In their study, they found that most of
the students use Internet frequently. They stated that as students’ age increases, frequency of
their Internet use also increases; but their computer use for playing computer game decreases
while use for accessing information and communication increase.
2.7 ICT-in-Education Policies and Implementations in the EU
Having examined many countries’ performance indicators for ICT use in education,
Tuti (2005) stated that countries basically select the followings as performance indicators:
hardware, ICT curriculum, student-computer ratio, Internet connections, software, and
digital divide between school degrees, national policies, teacher training and in-service
training, access to computers and Internet and technical support. Thus, fhis section presents
basic demographics, ICT-in-education policies and some indicators of their implementations
in the EU, such as students’ access to computers, integration of ICT into the curriculum, in-
service teacher training on ICT and teachers’ use of ICT in their teaching. These
demographics are given comparatively for country groups.
2.7.1 Basic Demographic Data of the Country Groups
As countries are being categorized into three groups in this study, a multiphase
strategy is taken as a base for state of belonging to the EU, status of the EU membership (the
EU member group, the new EU member group and candidate member) and having ICT data
in the PISA 2003 study. Total population, population growth, gross national income per
capita, an e-government readiness index, ICT expenditure, schools connected to the Internet,
Internet users, personal computers, and percentages of 15-year-old students frequently using
a computer are considered as key demographic indicators for each country. They are chosen

57
to represent some general facts, ICT-related developments and status. These demographic
indicators and their definitions are taken from World Bank (2008) and OECD (2006c), and
given in Table 2.2; data for these indicators for country groups, including members, can be
seen as a whole in Table 2.3.
When the average populations of the country groups are compared, Turkey had a
population of 67.4 million whereas the EU member group had 23.7 million and the new EU
member group had 13.4 million in 2000. The population growth of country groups in 2000
indicates that Turkey had a population growth of 1.7%, the EU member group was strongest
around 0.45%, and the new EU member group had a negative population growth, -0.36%.
The population growth of Turkey is larger than both EU groups, but in 2005 the population
growth Turkey regressed while that of the EU member group and the new EU member group
progressed.
National welfare is the basic underlying factor for the development of a country in
many respects. The World Bank (2008) reports that GNI per capita in 2000 was 23,173 for
the EU member group, 4,414 for the new EU member group and 2,980 for Turkey (in US
dollars). These numbers increased to 34,648, 8,634, and 4,750 for the EU member group, the
new EU member group and Turkey, respectively, in 2005. Where these numbers are
concerned, the EU member group has the highest prosperity, the new EU member group has
the second highest on average and Turkey has the smallest prosperity level.
An e-government readiness index indicates the level of countries’ provision of
specific products and services via ICT. This scale could be zero at the least and one at the
most, meaning that the higher the e-government index of a country, the more products and
services provided via ICT. In 2005, the EU member group had the highest e-government
readiness index, (0.77), the new EU member group had the second highest index, (0.66), and
Turkey had the lowest e-readiness index, (0.50) (World Bank, 2008).

58
Tab
le 2
.2 K
ey D
emog
raph
ic In
dica
tors
and
thei
r Def
initi
ons
Indi
cato
rs
Def
initi
ons
1. T
otal
Pop
ulat
ion
Tota
l pop
ulat
ion
is b
ased
on
the
de fa
cto
defin
ition
of p
opul
atio
n, w
hich
cou
nts
all r
esid
ents
rega
rdle
ss o
f leg
al s
tatu
s or
ci
tizen
ship
-exc
ept f
or re
fuge
es n
ot p
erm
anen
tly s
ettle
d in
the
coun
try o
f asy
lum
, who
are
gen
eral
ly c
onsi
dere
d pa
rt of
th
e po
pula
tion
of th
eir c
ount
ry o
f orig
in.
2. P
opul
atio
n gr
owth
A
nnua
l pop
ulat
ion
grow
th ra
te.
3. G
ross
Nat
iona
l Inc
ome
per C
apita
GN
I per
cap
ita (A
tlas
met
hod)
is th
e gr
oss
natio
nal i
ncom
e (G
NI)
con
verte
d to
US
dolla
rs u
sing
the
Wor
ld B
ank
Atla
s
met
hod
divi
ded
by th
e m
idye
ar p
opul
atio
n. G
ross
nat
iona
l inc
ome
is th
e su
m o
f val
ue a
dded
by
all r
esid
ent p
rodu
cers
plu
s
any
prod
uct t
axes
(les
s su
bsid
ies)
not
incl
uded
in th
e va
luat
ion
of o
utpu
t plu
s ne
t rec
eipt
s of
prim
ary
inco
me
(com
pens
atio
n
of e
mpl
oyee
s an
d pr
oper
ty in
com
e) fr
om a
broa
d. G
NI,
calc
ulat
ed in
nat
iona
l cur
renc
y, is
usu
ally
con
verte
d to
U.S
. dol
lars
at
off
icia
l exc
hang
e ra
tes
for c
ompa
rison
s ac
ross
eco
nom
ies.
To
smoo
th fl
uctu
atio
ns in
pric
es a
nd e
xcha
nge
rate
s, th
e
Atla
s m
etho
d is
use
d by
the
Wor
ld B
ank,
whi
ch a
vera
ges
the
exch
ange
rate
for a
giv
en y
ear a
nd th
e tw
o pr
eced
ing
year
s,
adju
sted
for d
iffer
ence
s in
rate
s of
infla
tion
betw
een
the
coun
try, a
nd th
e Eu
ro Z
one,
Jap
an, t
he U
nite
d K
ingd
om, a
nd
the
Uni
ted
Stat
es.
4. E
-gov
ernm
ent r
eadi
ness
inde
x E-
gove
rnm
ent r
eadi
ness
inde
x is
bas
ed o
n a
five-
stag
e m
odel
, asc
endi
ng in
nat
ure,
and
bui
ldin
g up
on th
e pr
evio
us le
vel o
f so
phis
ticat
ion
of a
gov
ernm
ent’s
onl
ine
pres
ence
. The
se s
tage
s ar
e Em
ergi
ng, E
nhan
ced,
Inte
ract
ive,
Tra
nsac
tiona
l, an
d
Net
wor
ked.
Cou
ntrie
s ar
e sc
ored
on
the
basi
s of
whe
ther
they
pro
vide
spe
cific
pro
duct
s an
d se
rvic
es.
5. I
CT
Expe
nditu
re
ICT
expe
nditu
re in
clud
e co
mpu
ter h
ardw
are
(com
pute
rs, s
tora
ge d
evic
es, p
rinte
rs, a
nd o
ther
per
iphe
rals
); co
mpu
ter s
oftw
are
(o
pera
ting
syst
ems,
pro
gram
min
g to
ols,
util
ities
, app
licat
ions
, and
inte
rnal
sof
twar
e de
velo
pmen
t); c
ompu
ter s
ervi
ces
(in
form
atio
n te
chno
logy
con
sulti
ng, c
ompu
ter a
nd n
etw
ork
syst
ems
inte
grat
ion,
Web
hos
ting,
dat
a pr
oces
sing
ser
vice
s,
and
othe
r ser
vice
s); a
nd c
omm
unic
atio
ns s
ervi
ces
(voi
ce a
nd d
ata
com
mun
icat
ions
ser
vice
s) a
nd w
ired
and
wire
less
co
mm
unic
atio
ns e
quip
men
t.
6. S
choo
ls c
onne
cted
to th
e In
tern
et
Scho
ols
conn
ecte
d to
the
Inte
rnet
are
the
shar
e of
prim
ary
and
seco
ndar
y sc
hool
s in
the
coun
try th
at h
ave
acce
ss to
the
Inte
rnet
.
7. I
nter
net u
sers
In
tern
et u
sers
are
peo
ple
with
acc
ess
to th
e w
orld
wid
e ne
twor
k.
8. P
erso
nal c
ompu
ters
Pe
rson
al c
ompu
ters
are
sel
f-co
ntai
ned
com
pute
rs d
esig
ned
to b
e us
ed b
y a
sing
le in
divi
dual
. 9.
Per
cent
age
of 1
5-ye
ar-o
ld
s
tude
nts
freq
uent
ly u
sing
a
com
pute
r*
Perc
enta
ge o
f 15-
year
-old
stu
dent
s fr
eque
ntly
usi
ng a
com
pute
r at h
ome
and
at s
choo
l (“
alm
ost e
very
day
” or
“a
few
tim
es e
ach
wee
k”),
in P
ISA
200
3 st
udy.
Not
e: T
he d
efin
ition
s la
bele
d 1-
8 ar
e ta
ken
from
Wor
ld B
ank
(200
8) a
nd 9
th d
efin
ition
is ta
ken
from
OEC
D (2
006c
).

59
Ta
ble
2.3
Key
Dem
ogra
phic
Indi
cato
rs o
f Cou
ntry
Gro
ups a
nd th
eir M
embe
rs
Total Population*
Population Growth*
Gross National Income per Capita*
E-governmentReadiness Index*
ICT Expenditure*
Schools connected to the Internet*
Internet Users*
Personal Computers*
Percentage of 15-year-old students frequently using a computer**
(mill
ion)
(a
nnua
l %)
(US$
) (s
cale
0-1
) (%
of G
DP)
(%
) (%
) (%
) (%
)
Cou
ntry
G
roup
s
2000
20
05
2000
20
05
2000
20
05
2005
20
00
2005
20
05
2000
20
05
2000
20
05
at
scho
ol
at
hom
e
AT
8.0
8.2
0.1
0,7
26,0
10
37,1
90
0.76
5.
9 5.
5 94
33
.7
48.6
36
.2
60.7
53
81
BE
10
.3
10.5
0.
3 0,
6 25
,360
36
,140
0.
74
6.0
5.8
93
29.3
45
.8
22.4
34
.8
27
84
DK
5.
3 5.
4 0.
3 0,
3 31
,850
48
,330
0.
91
6.1
6.0
100
39.2
52
.7
50.6
65
.6
68
84
FI
5.2
5.
2
0.2
0,
3
25,1
50
37,5
30
0.82
7.
4 6.
9 99
37
.2
53.4
39
.6
48.1
36
78
D
E 82
.2
82.5
0.
1
-0,1
25
,510
34
,870
0.
81
6.1
6.1
99
30.2
45
.5
33.6
54
.5
23
82
EL
10.9
11
.1
0.3
0,
4
11,5
30
19,8
40
0.59
4.
4 4.
1 59
9.
2 18
.0
6.9
8.9
45
57
IE
3.8
4.
2
1.3
2,
2
23,1
20
41,1
40
0.73
5.
6 4.
4 99
17
.8
27.6
35
.7
49.4
24
61
IT
56
.9
58.6
0.
0
0,7
20
,900
30
,250
0.
68
4.7
4.3
88
23.2
47
.8
18.1
36
.7
51
76
PT
10.2
10
.5
0.5
0,
5
11,5
90
17,1
90
0.61
4.
2 4.
4 92
16
.4
27.9
10
.3
13.3
34
78
SE
8.
9
9.0
0.
1
0,4
28
,870
40
,910
0.
90
7.4
7.4
99
45.6
76
.4
50.7
76
.3
48
89
EU
Mem
ber
Gro
up
UK
59
.7
60.2
1.
7
0,7
25
,010
37
,740
0.
88
8.1
7.3
99
26.4
47
.3
33.8
60
.0
- -
Ave
rage
23
.76
24.1
3 0.
45
0.61
23
,173
34
,648
0.
77
5.99
5.
65
92.8
2 28
.02
44.6
4 30
.72
46.2
1 40
.90
77.0
0 CZ
10
.3
10.2
-0
.1
0,3
5,
790
11
,220
0.
64
7.4
7.1
95
9.7
26.9
12
.2
24.0
41
70
H
U
10.2
10
.1
-0.3
-0
,2
4,60
0
10,0
70
0.65
7.
3 5.
8 85
7.
0 29
.7
8.5
14.6
80
67
LV
2.
4
2.3
-0
.8
-0,5
3,
240
6,77
0 0.
61
- -
97
6.3
44.8
14
.3
21.7
-
- PL
38
.5
38.2
-0
.5
-0,0
4,
570
7,
160
0.59
4.
1 4,
2 90
7.
3 26
.2
6.9
19.3
44
59
New
EU
M
embe
r G
roup
SK
5.
4
5.4
-0
.1
0,1
3,
870
7,
950
0.59
5.
9 5.
6 65
9.
4 46
.4
13.7
35
.8
42
65
Ave
rage
13
.36
13.2
4 -0
.36
-0.0
6 4,
414
8,63
4 0.
66
6.18
5.
68
86.4
7.
94
34.8
11
.12
23.0
8 51
.75
65.2
5
Turk
ey
TR
67.4
72
.1
1.7
1.
3
2,98
0
4,75
0 0.
50
7.9
7.9
40
3.7
22.2
3.
7 5.
2 46
48
No
te: S
ourc
es fo
r dat
a ar
e *
Wor
ld B
ank
(200
8) a
nd *
* O
ECD
(200
6c).

60
As to the ICT expenditure of countries, including computer hardware, software,
computer services and communication services, it was 6% of gross domestic product (GDP)
in the EU member group, 6.2% of GDP in the new EU member group and 7.9% of GDP in
Turkey in 2000. This number regressed in both EU groups while remained the same in
Turkey in 2005. Turkey shared a relatively larger budget for ICT hardware, software and
service.
The proportion of Internet users among citizens could be another important indicator
of a country’s level of ICT use. On average, 28% of citizens in the EU member group, 8% in
the new EU member group and 3.7% in Turkey were Internet users in 2000. From 2000 to
2005, the proportion of Internet users increased one and half times in the EU member group,
four times in the new EU member group, and more than five times in Turkey. That is, in
2005, after five years, this proportion is 45% for the EU member group, 35% in the new EU
member group and 22% in Turkey.
According to the World Bank report (2008), the rate of people owning personal
computers drastically changes across country groups, as well. On average, 31% of citizens in
the EU member group and 11% of citizens in the new EU member group had personal
computers in 2000. This proportion increased to 46% in the EU member group and 23.8% in
the new EU member group, on average, in 2005. As to Turkey, it was 3.7% in 2000 and
increased to 5.2% in 2005. The rapid increase in the computer possession rate in both EU
groups from 2000 to 2005 is not observed to the same extent in Turkey. Thus, after five
years, there are still considerable differences between country groups; the proportion in the
new EU member group is half of that of the EU member group, and it is considerably lower
in Turkey compared to both EU groups.
After the data illustrated in Table 2.3 is comparatively considered, it appears that the
EU member group has the best position and the new EU member group has the second best
position, whereas Turkey is at disadvantaged position in terms of national prosperity, e-
government readiness index, personal computer penetration and number of Internet users.
There are positive relationships among these indicators. However, this order is not the same
for average total population and ICT expenditure. Turkey is the most numerous group, the
EU member group is the second most numerous, whereas the new EU member group has the
smallest population on average. Turkey has allocated a slightly higher proportion of GDP for
ICT expenditure than both EU groups. This could be due to the relatively recent efforts made
to increase e-government services in Turkey, compared to those efforts in both EU groups.

61
2.7.2 Trends in Integration of ICT into Schools in the European Countries
In order to understand the panorama of ICT integration into the Kindergarten
through to Twelfth Grade (K-12) curriculum in European countries, it is better to begin with
a glance at general trends related to ICT integration in education systems in European
countries. These trends are reported by the European Commission Education and Culture
Department in two official documents published in 2001 and 2004. These documents
comparatively review ICT-in-education policies and ICT related demographics as indicators
of how ICT has been integrated into the school education systems of thirty European
countries. Note that Turkey is not included in these reports.
In the 2001 report, entitled Basic Indicators on the Incorporation of ICT into
European Education Systems: Facts and Figures, the following trends emerged throughout
the EU countries in general:
• Education policies increasingly involve using ICT, • Budgets are rarely managed only at central government level, • Programming does not often take place in the curricular aims of the primary,
lower and upper secondary levels of school education, • A majority of teachers utilize ICT in their teaching on a regular basis, and • An increasing number of countries in Europe involve ICT in the compulsory
curriculum of preservice teacher training, but schools of teacher education are often largely free to determine how it should be taught (Eurydice, 2001a, pp. VII-VIII).
From these trends in European countries, it is understood that the EU countries give
importance to gaining ICT literacy for their students and to integrate ICT into their school
education systems in 2001.
After three years, in a 2004 report, entitled Key Data on Information and
Communication Technology in Schools in Europe, the following trends were deduced for
European countries:
a. Computer facilities at school and home:
• In most countries, the average ratio varies between 5 and 20 students per computer
at schools which 15-year-old students attended.
• The percentage of young people having a home computer varies from 20% to over
90% throughout Europe, where most penetration is in Nordic countries and least
penetration is in East European ones.
• The level of Internet connection is always lower than the level of computerization
both at school and at home.
• There is a positive relationship between national prosperity and the development of
school and home computer facilities

62
• Two main stages in school computerization are detected: computer facilities for
staff at first, then for students.
• Students are provided with access to ICT facilities first outside the classroom,
mostly in the form of IT rooms, and then -as school computerization increases-
also within the classroom
b. Use of computer facilities at school and home
• ICT is an integral part of the compulsory curriculum in K-12 schools virtually
everywhere in Europe. This is supplemented by separate ICT courses in
secondary education.
• The frequency of using ICT in schools considerably increases from students aged
9-10 to students aged 15.
• No matter how much computerization there is at home, students aged 9-10 in
European countries are able to access home computers, and their parents let
them use it if a computer is available at home.
• At school, writing activity and information searches are typical purposes of ICT
use for students aged 9 or 10. At home, computer games are the main activity.
c. Training teachers for ICT
• Teachers in secondary education are often supported by ICT specialists. In many
countries, irrespective of whether the curriculum offers separate ICT courses or
ICT as a tool for teaching other subjects, teachers are assisted by ICT specialists.
This practice is especially widespread in secondary education.
• Preservice teacher programs include basic training in the educational use of ICT in
most countries.
• Official recommendations concerning training for teaching ICT are rarely detailed
(Eurydice, 2004, pp. 8-11)
The ICT-in-education policies and ICT demographics for both EU groups are
comparatively described below. Where related data for Turkey exist, it is included in the
comparisons, as well.
2.7.3 ICT-in-Education Policies in European Countries
Projects to introduce ICT into secondary education have been initiated in all
European countries (Eurydice, 2001a), mostly after 1995 as seen in Figure 2.3. With the
exception of a very few education systems (the German-speaking Community of Belgium
and Latvia), projects also exist at primary level. In most of the countries, these projects
generally have main aims, such as to provide ICT equipment and facilities to K-12 schools,
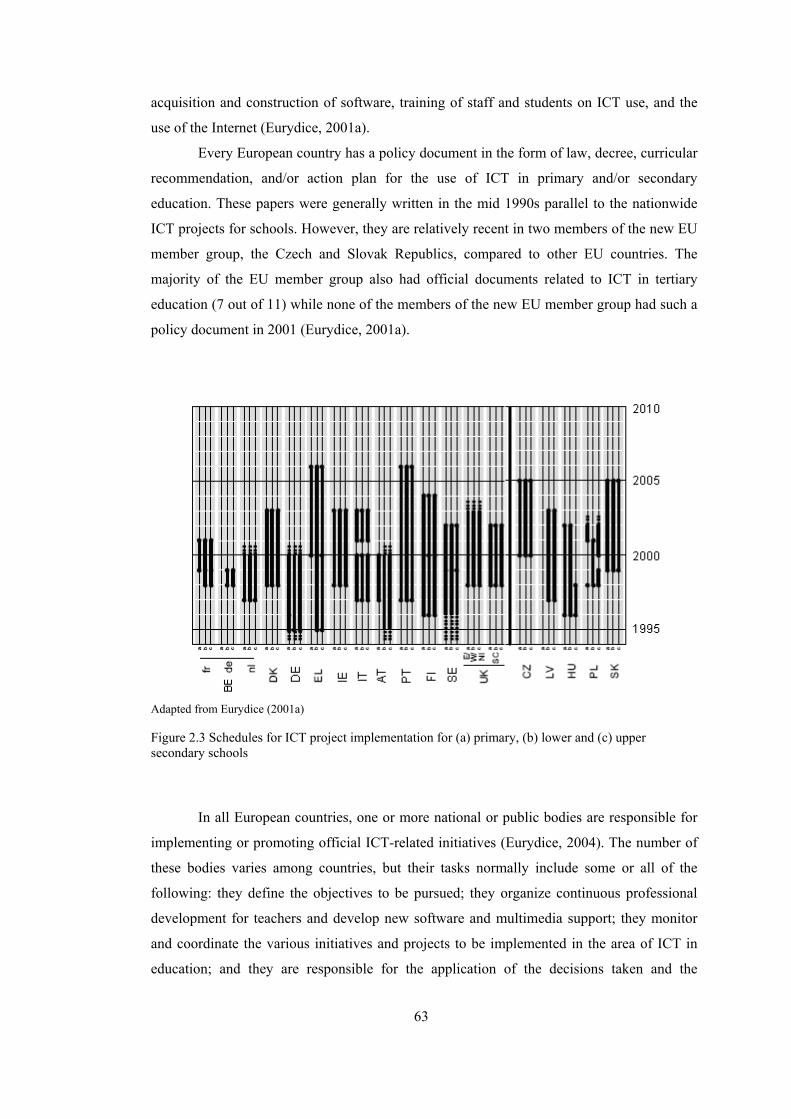
63
acquisition and construction of software, training of staff and students on ICT use, and the
use of the Internet (Eurydice, 2001a).
Every European country has a policy document in the form of law, decree, curricular
recommendation, and/or action plan for the use of ICT in primary and/or secondary
education. These papers were generally written in the mid 1990s parallel to the nationwide
ICT projects for schools. However, they are relatively recent in two members of the new EU
member group, the Czech and Slovak Republics, compared to other EU countries. The
majority of the EU member group also had official documents related to ICT in tertiary
education (7 out of 11) while none of the members of the new EU member group had such a
policy document in 2001 (Eurydice, 2001a).
Adapted from Eurydice (2001a) Figure 2.3 Schedules for ICT project implementation for (a) primary, (b) lower and (c) upper secondary schools
In all European countries, one or more national or public bodies are responsible for
implementing or promoting official ICT-related initiatives (Eurydice, 2004). The number of
these bodies varies among countries, but their tasks normally include some or all of the
following: they define the objectives to be pursued; they organize continuous professional
development for teachers and develop new software and multimedia support; they monitor
and coordinate the various initiatives and projects to be implemented in the area of ICT in
education; and they are responsible for the application of the decisions taken and the
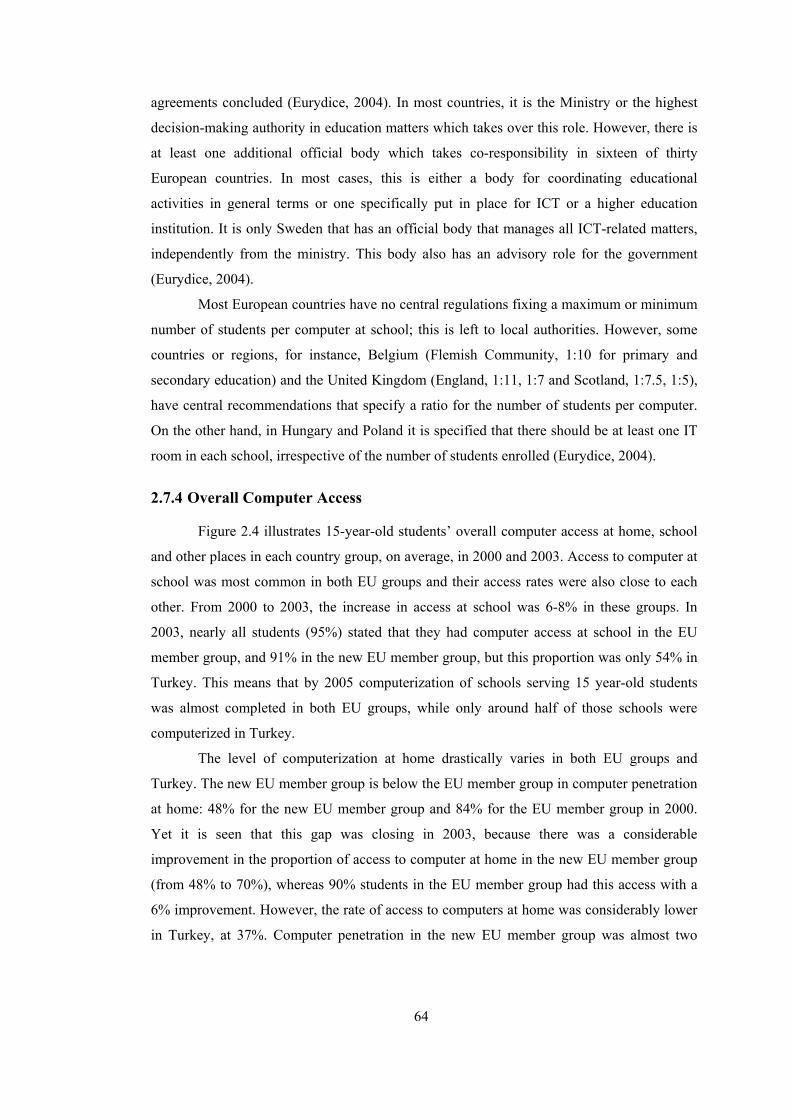
64
agreements concluded (Eurydice, 2004). In most countries, it is the Ministry or the highest
decision-making authority in education matters which takes over this role. However, there is
at least one additional official body which takes co-responsibility in sixteen of thirty
European countries. In most cases, this is either a body for coordinating educational
activities in general terms or one specifically put in place for ICT or a higher education
institution. It is only Sweden that has an official body that manages all ICT-related matters,
independently from the ministry. This body also has an advisory role for the government
(Eurydice, 2004).
Most European countries have no central regulations fixing a maximum or minimum
number of students per computer at school; this is left to local authorities. However, some
countries or regions, for instance, Belgium (Flemish Community, 1:10 for primary and
secondary education) and the United Kingdom (England, 1:11, 1:7 and Scotland, 1:7.5, 1:5),
have central recommendations that specify a ratio for the number of students per computer.
On the other hand, in Hungary and Poland it is specified that there should be at least one IT
room in each school, irrespective of the number of students enrolled (Eurydice, 2004).
2.7.4 Overall Computer Access
Figure 2.4 illustrates 15-year-old students’ overall computer access at home, school
and other places in each country group, on average, in 2000 and 2003. Access to computer at
school was most common in both EU groups and their access rates were also close to each
other. From 2000 to 2003, the increase in access at school was 6-8% in these groups. In
2003, nearly all students (95%) stated that they had computer access at school in the EU
member group, and 91% in the new EU member group, but this proportion was only 54% in
Turkey. This means that by 2005 computerization of schools serving 15 year-old students
was almost completed in both EU groups, while only around half of those schools were
computerized in Turkey.
The level of computerization at home drastically varies in both EU groups and
Turkey. The new EU member group is below the EU member group in computer penetration
at home: 48% for the new EU member group and 84% for the EU member group in 2000.
Yet it is seen that this gap was closing in 2003, because there was a considerable
improvement in the proportion of access to computer at home in the new EU member group
(from 48% to 70%), whereas 90% students in the EU member group had this access with a
6% improvement. However, the rate of access to computers at home was considerably lower
in Turkey, at 37%. Computer penetration in the new EU member group was almost two

65
times larger, and that in the EU member group was two and a half times larger, than in
Turkey in 2003.
When the 2003 results are compared, the second most common computer access is at
home in the EU member group while it is in other places in the new EU member group. In
contrast, the most common access to computers is in other places (73%) and the second most
common is at school in Turkey. Note that the rate of computer access at other places is
relatively similar in the country groups, even if this rate is lower in Turkey than in both EU
groups. In sum, students’ computer access rates in all three places in Turkey are lower than
both EU groups, with relatively closer access rates at other places.
9
OECD Average EU members New EU members Turkey
7887 84 85
928384 87 84
90 9582
48
85
69 70
9185
37
54
73
0102030405060708090
100
At home At school At other places At home At school At other places
PISA 2000 PISA 2003 Source: OECD (2006c), Note: PISA 2000 data presented in this figure is not available for Austria, Greece, Italy, Portugal, Poland, Slovak Republic, and Turkey. Figure 2.4 Percentages of 15-year-old students having access to computer at home and/or at school and at other places on average in PISA 2000 and 2003
As seen in Figure 2.5, while 85% of 15-year-old students in the EU member group
and 63% in the new EU member group had computer access both at home and at school, this
proportion was only 17% in Turkey in 2003. Furthermore nearly half of the students in
Turkey reported that they had computer access neither at home nor at school. This rate was
only 3% for the new EU member group and 1% for the EU member group.
Under these conditions, Turkish students are disadvantaged in terms of access to
computers, particularly at home and at school, when compared to both EU groups. In other
words, it could be inferred that both EU groups have higher rates of computer access at home
and at school, when compared to Turkey. On the contrary, similar proportions of students
have computer access at other places in both EU groups and Turkey (see Figure 2.4). In fact,
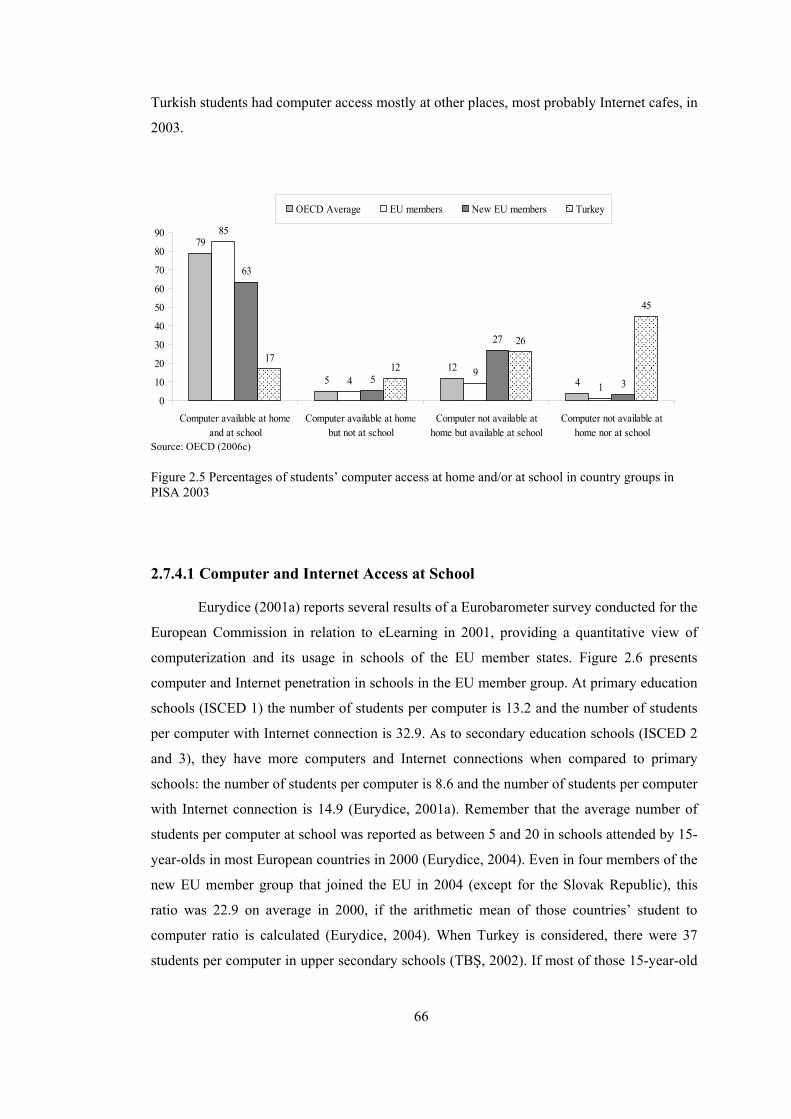
66
Turkish students had computer access mostly at other places, most probably Internet cafes, in
2003.
79
512
4
85
49
1
63
5
27
3
1712
26
45
0
10
20
30
40
50
60
70
80
90
Computer available at homeand at school
Computer available at homebut not at school
Computer not available athome but available at school
Computer not available athome nor at school
OECD Average EU members New EU members Turkey
Source: OECD (2006c)
Figure 2.5 Percentages of students’ computer access at home and/or at school in country groups in PISA 2003
2.7.4.1 Computer and Internet Access at School
Eurydice (2001a) reports several results of a Eurobarometer survey conducted for the
European Commission in relation to eLearning in 2001, providing a quantitative view of
computerization and its usage in schools of the EU member states. Figure 2.6 presents
computer and Internet penetration in schools in the EU member group. At primary education
schools (ISCED 1) the number of students per computer is 13.2 and the number of students
per computer with Internet connection is 32.9. As to secondary education schools (ISCED 2
and 3), they have more computers and Internet connections when compared to primary
schools: the number of students per computer is 8.6 and the number of students per computer
with Internet connection is 14.9 (Eurydice, 2001a). Remember that the average number of
students per computer at school was reported as between 5 and 20 in schools attended by 15-
year-olds in most European countries in 2000 (Eurydice, 2004). Even in four members of the
new EU member group that joined the EU in 2004 (except for the Slovak Republic), this
ratio was 22.9 on average in 2000, if the arithmetic mean of those countries’ student to
computer ratio is calculated (Eurydice, 2004). When Turkey is considered, there were 37
students per computer in upper secondary schools (TBŞ, 2002). If most of those 15-year-old

67
students are assumed to attend upper secondary schools in both EU groups, the ratio in
Turkish high schools is one and a half times larger than the new EU member group, and
considerably larger than the EU member group. Needless to say, this ratio is high in primary
and lower secondary schools in total: 81 students per computer (TBŞ, 2002). Remember that
in Turkey there were no comprehensive efforts to provide schools with fast Internet
connections up to end of 2003. The limited number of existing Internet connections were
slow (Akbaba-Altun, 2006). These comparisons indicate that both EU groups make more
ICT related investments in K-12 schools than Turkey does. Indeed, the EU member group
made earlier and heavier investments in ICT integration into the school system in terms of
money, time and effort than do the new EU member group and Turkey.
13,28,6
32,9
14,9
05
101520253035
Primary schools Secondary schools
Number of student per computerNumber of students per computer with Internet connection
Source: Eurydice (2001a) Figure 2.6 Number of students per computer and number of students per computer with Internet connection at primary and secondary schools in the EU member group in 2001.
In summary, the computer and Internet access in primary schools is more limited
than in secondary schools in the EU member group. This could be due to the fact that
including ICT as a separate subject is more common in secondary school curricula, besides
using it as a tool in other subjects. Eurydice (2004) also reports that students aged 9-10 do
not use computers at school as much as 15-year-old students. Parallel to facilities at schools
and the place of ICT in curricula, students’ use of ICT at school increases as grade level
increases. Nevertheless, students’ computer and Internet access rates in primary and
secondary schools in both EU groups are considerably higher than in Turkey.
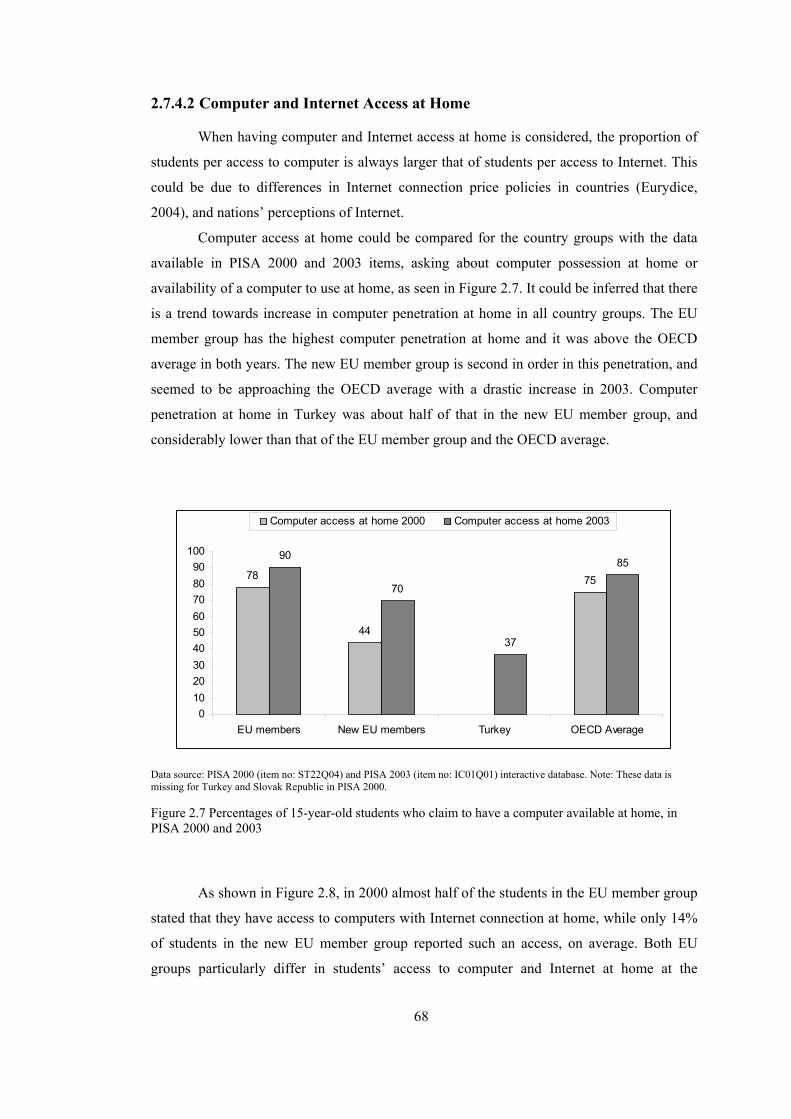
68
2.7.4.2 Computer and Internet Access at Home
When having computer and Internet access at home is considered, the proportion of
students per access to computer is always larger that of students per access to Internet. This
could be due to differences in Internet connection price policies in countries (Eurydice,
2004), and nations’ perceptions of Internet.
Computer access at home could be compared for the country groups with the data
available in PISA 2000 and 2003 items, asking about computer possession at home or
availability of a computer to use at home, as seen in Figure 2.7. It could be inferred that there
is a trend towards increase in computer penetration at home in all country groups. The EU
member group has the highest computer penetration at home and it was above the OECD
average in both years. The new EU member group is second in order in this penetration, and
seemed to be approaching the OECD average with a drastic increase in 2003. Computer
penetration at home in Turkey was about half of that in the new EU member group, and
considerably lower than that of the EU member group and the OECD average.
78
44
75
90
70
37
85
0102030405060708090
100
EU members New EU members Turkey OECD Average
Computer access at home 2000 Computer access at home 2003
Data source: PISA 2000 (item no: ST22Q04) and PISA 2003 (item no: IC01Q01) interactive database. Note: These data is missing for Turkey and Slovak Republic in PISA 2000. Figure 2.7 Percentages of 15-year-old students who claim to have a computer available at home, in PISA 2000 and 2003
As shown in Figure 2.8, in 2000 almost half of the students in the EU member group
stated that they have access to computers with Internet connection at home, while only 14%
of students in the new EU member group reported such an access, on average. Both EU
groups particularly differ in students’ access to computer and Internet at home at the

69
beginning of the 2000s. This proportion rose to almost 69% for the EU member group and to
29% for the new EU member group, on average, in 2003. Yet only 14% of students in
Turkey reported that they had Internet connection at home in 2003.
46
14
46
69
29
14
64
0102030405060708090
100
EU members New EU members Turkey OECD Average
Inernet connection at home 2000 Inernet connection at home 2003
Data source: PISA 2000 and PISA 2003 database. Note: These data is missing for Turkey and Slovak Republic in PISA 2000. Figure 2.8 Percentages of 15-year-old students who claim to have an Internet connection at home, in PISA 2000 and 2003
Based on the ICT demographics of county groups given up to now and the GNI per
capita of the county groups in Table 2.3, there is a positive relationship between GNI per
capita of a country and students’ access to home computers (Göktaş, 2003; Eurydice, 2004;
OECD 2006c). Furthermore, as rate of access to computers at home increases, rate of access
to computers at school also tends to increase (Eurydice, 2004). Germany, Greece, Portugal
are exceptions to this general trend. In these countries, computer penetration at home is high,
but computer facilities in schools are not that widespread (Eurydice, 2004). Therefore, the
higher the GNI per capita, the more the computer environment is developed, both at home
and at school.
The OECD report on the PISA 2003 ICT questionnaire results deduces that
socioeconomic background is a strong predictor of having access to a computer at home, and
the differences in access at school and other places tend to be much smaller than
socioeconomic differences at home (OECD, 2006c). In this report, the student population of
each country was divided into four equal-sized groups, according to a ranking of student
socioeconomic and cultural status. In most countries, students in the bottom quarter were
significantly less likely to have a computer available at home than those in the top quarter
(OECD, 2006c). According to this report, this socioeconomic and cultural driven digital
70
divide is most apparent in Turkey, Mexico, the Russian Federation and Thailand. In these
countries, the fewest students overall had home computer access compared to other
countries, and where 11% or fewer students in the bottom quarter by ESCS can access home
computers, compared to at least 70% in the top quarter. It should be noted that from the
countries included in the present study only Turkey is among those countries having the
considerable digital divide at home. Figure 2.9 shows proportion of access to home computer
by ESCS quarters for the country groups.
0
10
20
30
40
50
60
70
80
90
100
AT BE DE DK EL FI IE IT PT SE UK OECDavg.
CZ HU LV PL SK TR
Bottom quarter Second quarter Third quarter Top quarter
Source: OECD (2006c). Figure 2.9 Percentages of students having access to computer at home, by national quarters of the index of economic, social and cultural status (ESCS), PISA 2003
2.7.5 ICT in Primary and Secondary School Curriculum in the EU
In most EU countries’ official recommendations for ICT, the minimum curriculum
included objectives for primary, lower secondary and upper secondary education levels in
2000/2001 fell into the following categories:
• to develop programming skills, • to learn correct use of a word processor, a spreadsheet, etc., • to learn to search for information on a CD-ROM (Compact Disk Read Only
Memory), a network, etc., and • to communicate via a network (Eurydice, 2001a, p. 16).
According to a survey conducted in the 2002-2003 school year by Eurydice, K-12
schools’ compulsory curriculum in most EU countries also involve ICT related objectives
under an additional category, namely, “to use ICT to enhance subject knowledge” for
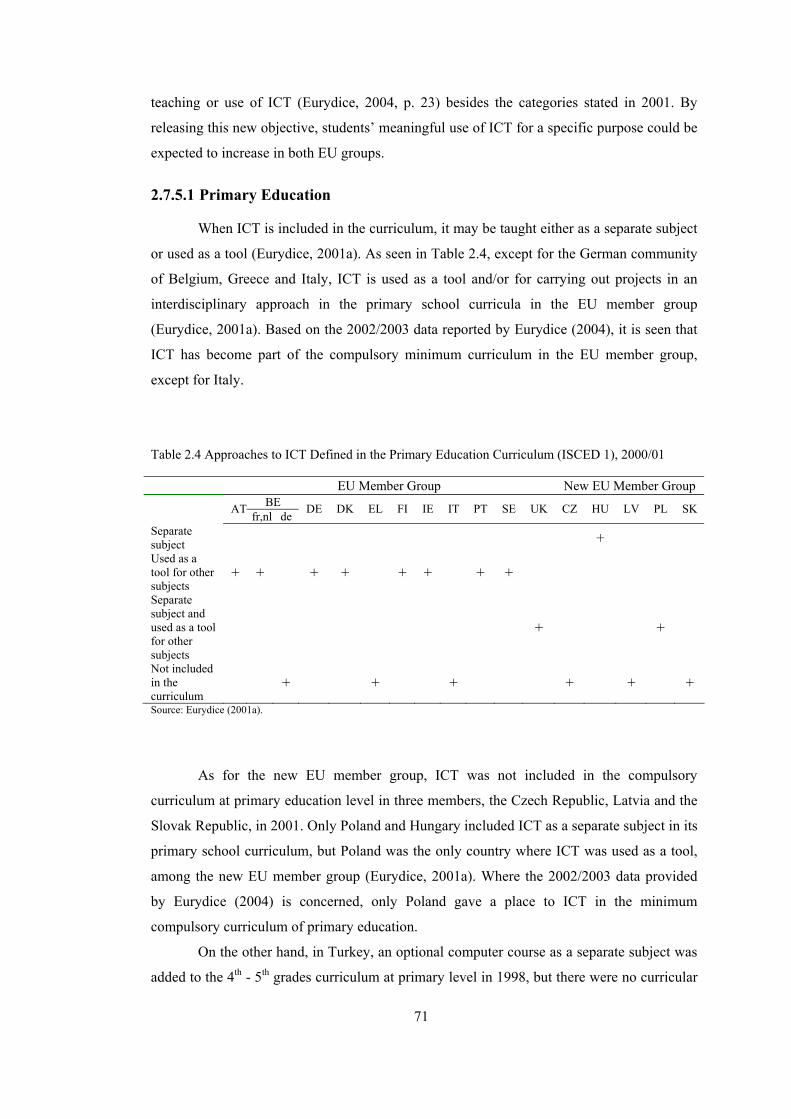
71
teaching or use of ICT (Eurydice, 2004, p. 23) besides the categories stated in 2001. By
releasing this new objective, students’ meaningful use of ICT for a specific purpose could be
expected to increase in both EU groups.
2.7.5.1 Primary Education
When ICT is included in the curriculum, it may be taught either as a separate subject
or used as a tool (Eurydice, 2001a). As seen in Table 2.4, except for the German community
of Belgium, Greece and Italy, ICT is used as a tool and/or for carrying out projects in an
interdisciplinary approach in the primary school curricula in the EU member group
(Eurydice, 2001a). Based on the 2002/2003 data reported by Eurydice (2004), it is seen that
ICT has become part of the compulsory minimum curriculum in the EU member group,
except for Italy.
Table 2.4 Approaches to ICT Defined in the Primary Education Curriculum (ISCED 1), 2000/01
EU Member Group New EU Member Group BE AT fr,nl de DE DK EL FI IE IT PT SE UK CZ HU LV PL SK
Separate subject + Used as a tool for other subjects
+ + + + + + + +
Separate subject and used as a tool for other subjects
+ +
Not included in the curriculum
+ + + + + +
Source: Eurydice (2001a).
As for the new EU member group, ICT was not included in the compulsory
curriculum at primary education level in three members, the Czech Republic, Latvia and the
Slovak Republic, in 2001. Only Poland and Hungary included ICT as a separate subject in its
primary school curriculum, but Poland was the only country where ICT was used as a tool,
among the new EU member group (Eurydice, 2001a). Where the 2002/2003 data provided
by Eurydice (2004) is concerned, only Poland gave a place to ICT in the minimum
compulsory curriculum of primary education.
On the other hand, in Turkey, an optional computer course as a separate subject was
added to the 4th - 5th grades curriculum at primary level in 1998, but there were no curricular

72
efforts to integrate ICT into other subjects (Göktaş, 2003). Such efforts were started in the
2004 curriculum reform.
For primary school curricula, programming skills were not covered by most of the
EU member group at primary education level, the exceptions being Germany, Greece, and
the United Kingdom (Eurydice, 2004). Nevertheless, this category is increasingly included in
lower and upper secondary curricula.
2.7.5.2 General Lower Secondary Education
All members in both EU groups included ICT in their lower secondary education
curricula, expect for Italy. Table 2.5 shows approaches to teaching ICT in the lower
secondary curricula in 2001, as reported by Eurydice (2001a). There were only a few
European countries in which the minimum curriculum did not include ICT as a subject in its
own right at this level (Eurydice, 2001a). These countries add up to almost half of the EU
member group who include ICT only as a tool for other subjects at this level of education.
Several other members in the EU member group included ICT both as a tool, as is the case in
primary education, and as a separate subject. ICT took place only as a separate subject in its
own right in Greece at lower secondary level. As for the new EU member group, ICT was
taught as a separate subject in all members, yet it was also used as a tool across the
curriculum only in two of them: Latvia and Poland. As for Turkey, ICT has been found as
separate optional course at lower secondary schools since 1998, depending on school
conditions and students’ preferences (Göktaş, 2003).
Table 2.5 Approaches to ICT Defined in the General Lower Secondary Education Curriculum (ISCED 2), 2000/01
EU Member Group New EU Member Group
BE AT nl fr de DE DK EL FI IE IT PT SE UK CZ HU LV PL SK
Separate subject + + + +
Used as a tool for other subjects
+ + + + + +
Separate subject and used as a tool for other subjects
+ + + + + + +
Not included in the curriculum
+
Source: Eurydice (2001a).
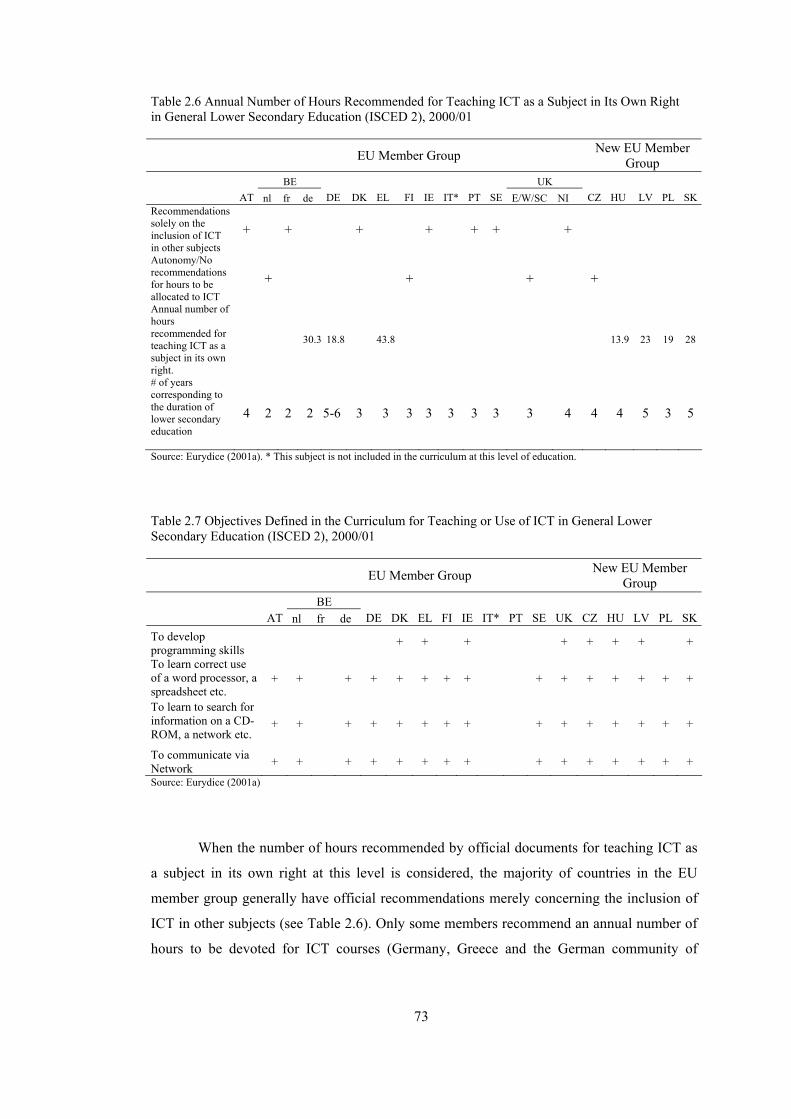
73
Table 2.6 Annual Number of Hours Recommended for Teaching ICT as a Subject in Its Own Right in General Lower Secondary Education (ISCED 2), 2000/01
EU Member Group New EU Member Group
BE UK AT nl fr de DE DK EL FI IE IT* PT SE E/W/SC NI CZ HU LV PL SKRecommendations solely on the inclusion of ICT in other subjects
+ + + + + + +
Autonomy/No recommendations for hours to be allocated to ICT
+ + + +
Annual number of hours recommended for teaching ICT as a subject in its own right.
30.3 18.8 43.8 13.9 23 19 28
# of years corresponding to the duration of lower secondary education
4 2 2 2 5-6 3 3 3 3 3 3 3 3 4 4 4 5 3 5
Source: Eurydice (2001a). * This subject is not included in the curriculum at this level of education. Table 2.7 Objectives Defined in the Curriculum for Teaching or Use of ICT in General Lower Secondary Education (ISCED 2), 2000/01
EU Member Group New EU Member
Group BE
AT nl fr de DE DK EL FI IE IT* PT SE UK CZ HU LV PL SKTo develop programming skills
+ + + + + + + +
To learn correct use of a word processor, a spreadsheet etc.
+ + + + + + + + + + + + + + +
To learn to search for information on a CD- ROM, a network etc.
+ + + + + + + + + + + + + + +
To communicate via Network + + + + + + + + + + + + + + +
Source: Eurydice (2001a)
When the number of hours recommended by official documents for teaching ICT as
a subject in its own right at this level is considered, the majority of countries in the EU
member group generally have official recommendations merely concerning the inclusion of
ICT in other subjects (see Table 2.6). Only some members recommend an annual number of
hours to be devoted for ICT courses (Germany, Greece and the German community of
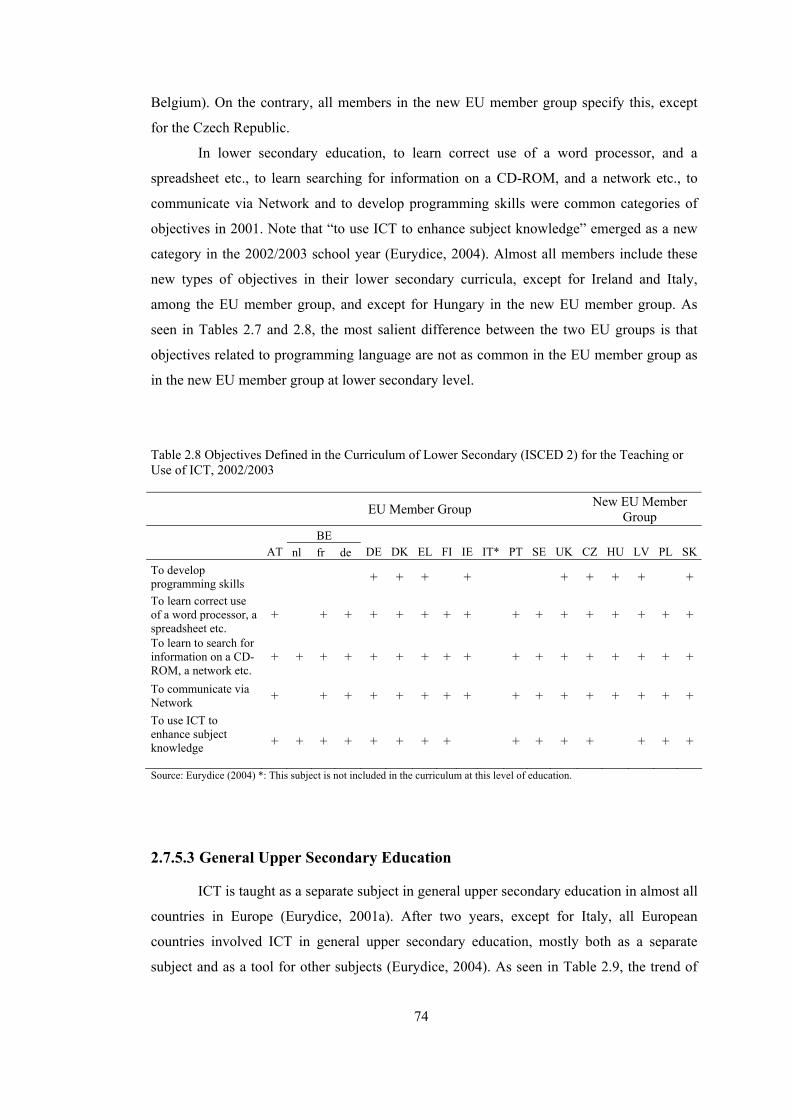
74
Belgium). On the contrary, all members in the new EU member group specify this, except
for the Czech Republic.
In lower secondary education, to learn correct use of a word processor, and a
spreadsheet etc., to learn searching for information on a CD-ROM, and a network etc., to
communicate via Network and to develop programming skills were common categories of
objectives in 2001. Note that “to use ICT to enhance subject knowledge” emerged as a new
category in the 2002/2003 school year (Eurydice, 2004). Almost all members include these
new types of objectives in their lower secondary curricula, except for Ireland and Italy,
among the EU member group, and except for Hungary in the new EU member group. As
seen in Tables 2.7 and 2.8, the most salient difference between the two EU groups is that
objectives related to programming language are not as common in the EU member group as
in the new EU member group at lower secondary level.
Table 2.8 Objectives Defined in the Curriculum of Lower Secondary (ISCED 2) for the Teaching or Use of ICT, 2002/2003
EU Member Group New EU Member
Group BE
AT nl fr de DE DK EL FI IE IT* PT SE UK CZ HU LV PL SKTo develop programming skills + + + + + + + + +
To learn correct use of a word processor, a spreadsheet etc.
+ + + + + + + + + + + + + + + +
To learn to search for information on a CD- ROM, a network etc.
+ + + + + + + + + + + + + + + + +
To communicate via Network + + + + + + + + + + + + + + + +
To use ICT to enhance subject knowledge
+ + + + + + + + + + + + + + +
Source: Eurydice (2004) *: This subject is not included in the curriculum at this level of education.
2.7.5.3 General Upper Secondary Education
ICT is taught as a separate subject in general upper secondary education in almost all
countries in Europe (Eurydice, 2001a). After two years, except for Italy, all European
countries involved ICT in general upper secondary education, mostly both as a separate
subject and as a tool for other subjects (Eurydice, 2004). As seen in Table 2.9, the trend of

75
using ICT as a tool in other subjects also exists in upper secondary schools in most of the EU
member group. As to the new EU member group, all of them include ICT as a separate
subject, but only two of them (Latvia and Poland) also include it as a tool for use in other
subjects.
Table 2.9 Approaches to ICT Defined in the Curriculum of General Upper Secondary Education (ISCED 2), 2000/01
EU Member Group New EU Member Group
BE UK AT nl fr de DE DK EL FI IE IT* PT SE E/SC NI/W CZ HU LV PL SKSeparate subject + + + + Used as a tool for other subjects
+ +
Separate subject and used as a tool for other subjects
+ + + + + + + + + + +
Not included in the curriculum
+ +
Source: Eurydice (2001a) *: This subject is not included in the curriculum at this level of education.
Teaching ICT as a separate subject is the most common approach in lower and upper
secondary curriculum, in the form of optional courses, in Turkey. Indeed, using ICT as a tool
in other subjects for a meaningful purpose not appear in the written curriculum until the
curriculum reform that was initiated in 2004 in Turkey, while the curriculum change for
upper secondary education is still in progress. Thus, using ICT as a tool in the teaching and
learning of other subjects is not yet actually initiated in upper secondary education in
Turkey.
If 2001 conditions, which have a grater impact on ICT aspects for the PISA 2003
students, are considered, what is different from lower secondary curriculum is that objectives
related to developing programming skills are more common in upper secondary ICT
objectives. Programming is included in the majority of countries in the EU member group,
and in all of the new EU member group countries, as seen in Table 2.10.
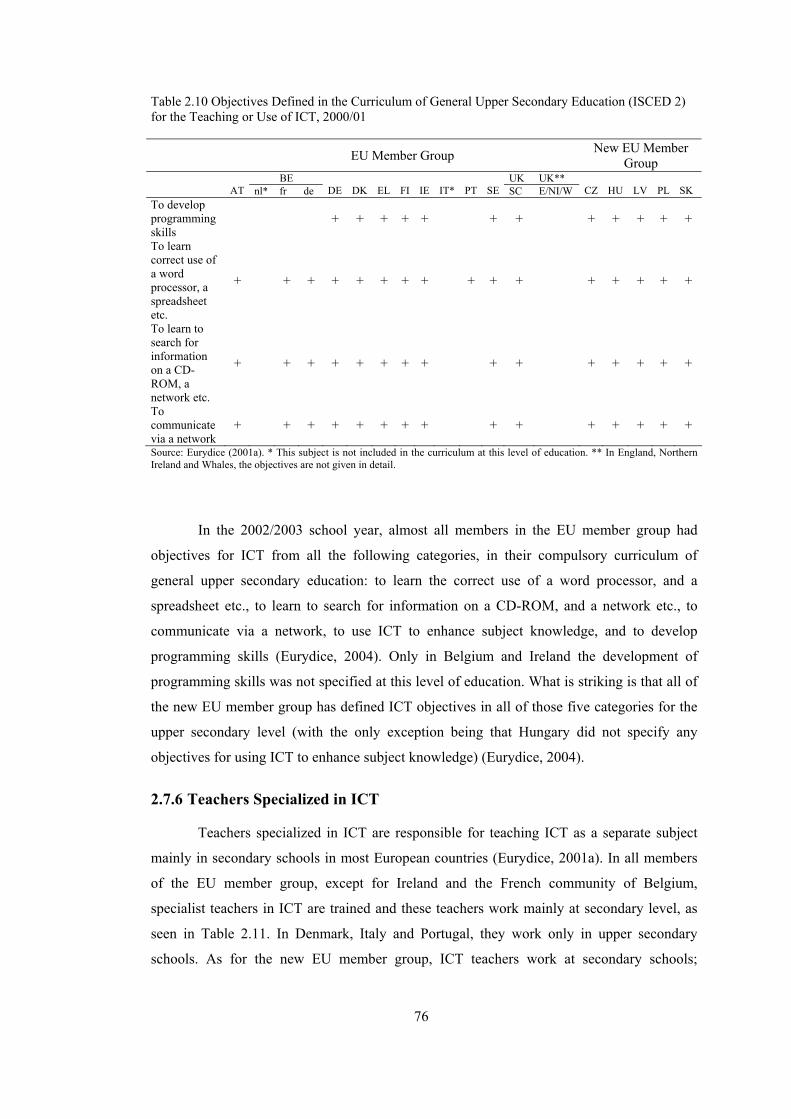
76
Table 2.10 Objectives Defined in the Curriculum of General Upper Secondary Education (ISCED 2) for the Teaching or Use of ICT, 2000/01
EU Member Group New EU Member Group
BE UK UK** AT nl* fr de DE DK EL FI IE IT* PT SE SC E/NI/W CZ HU LV PL SK To develop programming skills
+ + + + + + + + + + + +
To learn correct use of a word processor, a spreadsheet etc.
+ + + + + + + + + + + + + + + +
To learn to search for information on a CD-ROM, a network etc.
+ + + + + + + + + + + + + + +
To communicate via a network
+ + + + + + + + + + + + + + +
Source: Eurydice (2001a). * This subject is not included in the curriculum at this level of education. ** In England, Northern Ireland and Whales, the objectives are not given in detail.
In the 2002/2003 school year, almost all members in the EU member group had
objectives for ICT from all the following categories, in their compulsory curriculum of
general upper secondary education: to learn the correct use of a word processor, and a
spreadsheet etc., to learn to search for information on a CD-ROM, and a network etc., to
communicate via a network, to use ICT to enhance subject knowledge, and to develop
programming skills (Eurydice, 2004). Only in Belgium and Ireland the development of
programming skills was not specified at this level of education. What is striking is that all of
the new EU member group has defined ICT objectives in all of those five categories for the
upper secondary level (with the only exception being that Hungary did not specify any
objectives for using ICT to enhance subject knowledge) (Eurydice, 2004).
2.7.6 Teachers Specialized in ICT
Teachers specialized in ICT are responsible for teaching ICT as a separate subject
mainly in secondary schools in most European countries (Eurydice, 2001a). In all members
of the EU member group, except for Ireland and the French community of Belgium,
specialist teachers in ICT are trained and these teachers work mainly at secondary level, as
seen in Table 2.11. In Denmark, Italy and Portugal, they work only in upper secondary
schools. As for the new EU member group, ICT teachers work at secondary schools;

77
additionally, in Hungary and Poland, they also work in primary schools. In Turkey,
graduates of different programs in computer education work at three levels of education to
teach students ICT skills in optional courses.
Table 2.11 Specialist ICT Teachers in Primary and Secondary Education (ISCED 1, 2 and 3), 2000/01
EU Member Group New EU Member Group
BE AT nl fr de DE DK EL FI IE IT PT SE UK CZ HU LV PL SKPrimary and secondary education
+ +
Lower and upper secondary education
+ + + + + + + + + + +
Upper secondary education + + +
Neither primary nor secondary education
+ +
Source: Eurydice (2001a)
2.7.7 In-service Training and Teachers’ Use of ICT
Where in-service training of teachers on “the use of computers and/or the Internet in
their teaching” is concerned, the acquisition or upgrading of ICT skills is encouraged in the
majority of the EU countries. National programmes (generally lasting at least two years)
encourage this type of training for teachers at primary and secondary education levels
(Eurydice, 2004).
For the EU member group, 62% of primary teachers and 50% of secondary school
teachers had received official training in 2001 (Eurydice, 2001a). In line with ICT
investments and in-service training on the use of ICT as a tool in other subjects, 71% of
teachers used computers and 34% of teachers used the Internet in the classroom in primary
schools, in the EU member group. Indeed, primary school teachers used computers five
hours a week in the EU member group, on average (Eurydice, 2001a). As to lower and upper
secondary school teachers, 60% of them used computers and 42% of them used the Internet
in the classroom, in 2001 (Eurydice, 2001a). Among the objectives to be pursued in almost
all EU countries, curricula for lower and upper secondary education refer to searching for
information on a network or communicating via a network. Yet, on average, less than half of
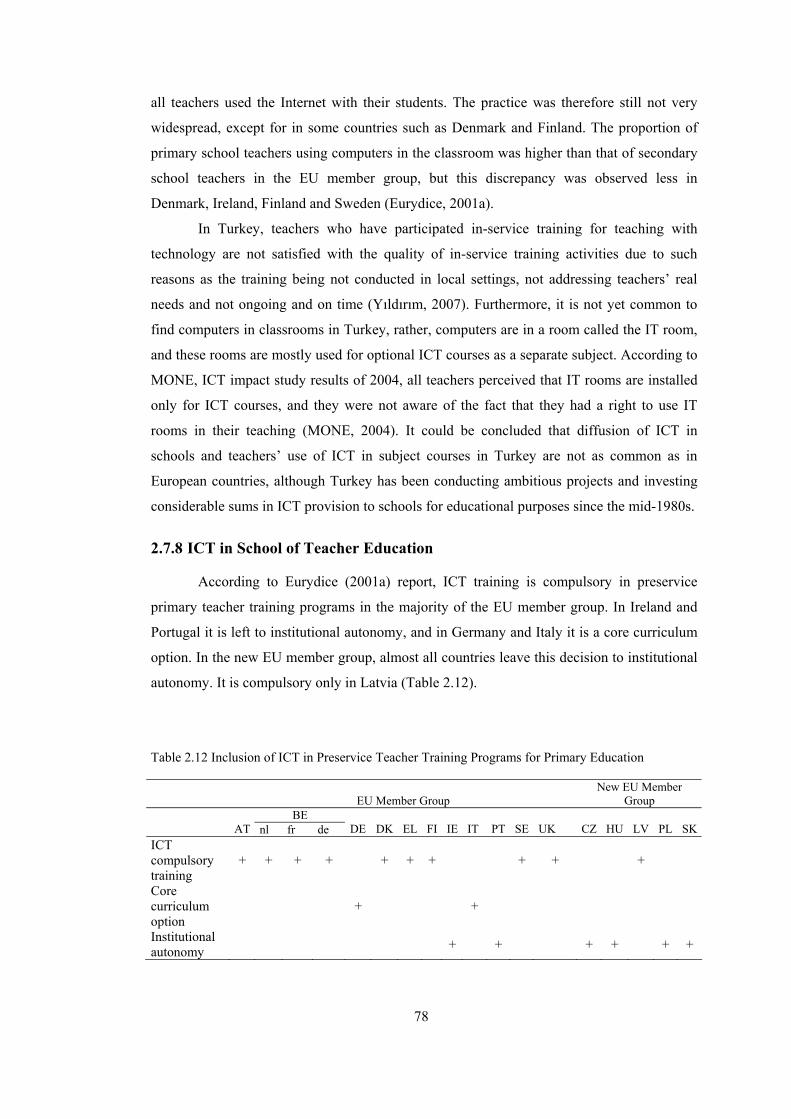
78
all teachers used the Internet with their students. The practice was therefore still not very
widespread, except for in some countries such as Denmark and Finland. The proportion of
primary school teachers using computers in the classroom was higher than that of secondary
school teachers in the EU member group, but this discrepancy was observed less in
Denmark, Ireland, Finland and Sweden (Eurydice, 2001a).
In Turkey, teachers who have participated in-service training for teaching with
technology are not satisfied with the quality of in-service training activities due to such
reasons as the training being not conducted in local settings, not addressing teachers’ real
needs and not ongoing and on time (Yıldırım, 2007). Furthermore, it is not yet common to
find computers in classrooms in Turkey, rather, computers are in a room called the IT room,
and these rooms are mostly used for optional ICT courses as a separate subject. According to
MONE, ICT impact study results of 2004, all teachers perceived that IT rooms are installed
only for ICT courses, and they were not aware of the fact that they had a right to use IT
rooms in their teaching (MONE, 2004). It could be concluded that diffusion of ICT in
schools and teachers’ use of ICT in subject courses in Turkey are not as common as in
European countries, although Turkey has been conducting ambitious projects and investing
considerable sums in ICT provision to schools for educational purposes since the mid-1980s.
2.7.8 ICT in School of Teacher Education
According to Eurydice (2001a) report, ICT training is compulsory in preservice
primary teacher training programs in the majority of the EU member group. In Ireland and
Portugal it is left to institutional autonomy, and in Germany and Italy it is a core curriculum
option. In the new EU member group, almost all countries leave this decision to institutional
autonomy. It is compulsory only in Latvia (Table 2.12).
Table 2.12 Inclusion of ICT in Preservice Teacher Training Programs for Primary Education
EU Member Group New EU Member
Group BE
AT nl fr de DE DK EL FI IE IT PT SE UK CZ HU LV PL SKICT compulsory training
+ + + + + + + + + +
Core curriculum option
+ +
Institutional autonomy + + + + + +
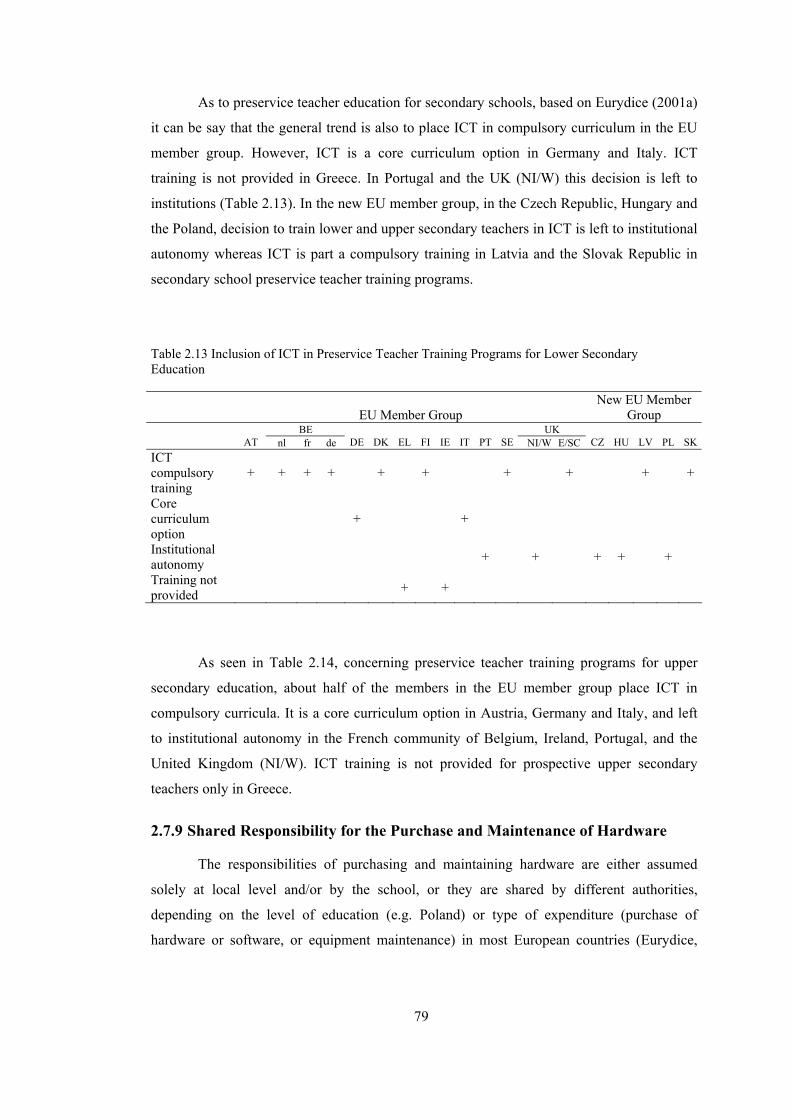
79
As to preservice teacher education for secondary schools, based on Eurydice (2001a)
it can be say that the general trend is also to place ICT in compulsory curriculum in the EU
member group. However, ICT is a core curriculum option in Germany and Italy. ICT
training is not provided in Greece. In Portugal and the UK (NI/W) this decision is left to
institutions (Table 2.13). In the new EU member group, in the Czech Republic, Hungary and
the Poland, decision to train lower and upper secondary teachers in ICT is left to institutional
autonomy whereas ICT is part a compulsory training in Latvia and the Slovak Republic in
secondary school preservice teacher training programs.
Table 2.13 Inclusion of ICT in Preservice Teacher Training Programs for Lower Secondary Education
EU Member Group New EU Member
Group BE UK
AT nl fr de DE DK EL FI IE IT PT SE NI/W E/SC CZ HU LV PL SKICT compulsory training
+ + + + + + + + + +
Core curriculum option
+ +
Institutional autonomy + + + + +
Training not provided + +
As seen in Table 2.14, concerning preservice teacher training programs for upper
secondary education, about half of the members in the EU member group place ICT in
compulsory curricula. It is a core curriculum option in Austria, Germany and Italy, and left
to institutional autonomy in the French community of Belgium, Ireland, Portugal, and the
United Kingdom (NI/W). ICT training is not provided for prospective upper secondary
teachers only in Greece.
2.7.9 Shared Responsibility for the Purchase and Maintenance of Hardware
The responsibilities of purchasing and maintaining hardware are either assumed
solely at local level and/or by the school, or they are shared by different authorities,
depending on the level of education (e.g. Poland) or type of expenditure (purchase of
hardware or software, or equipment maintenance) in most European countries (Eurydice,
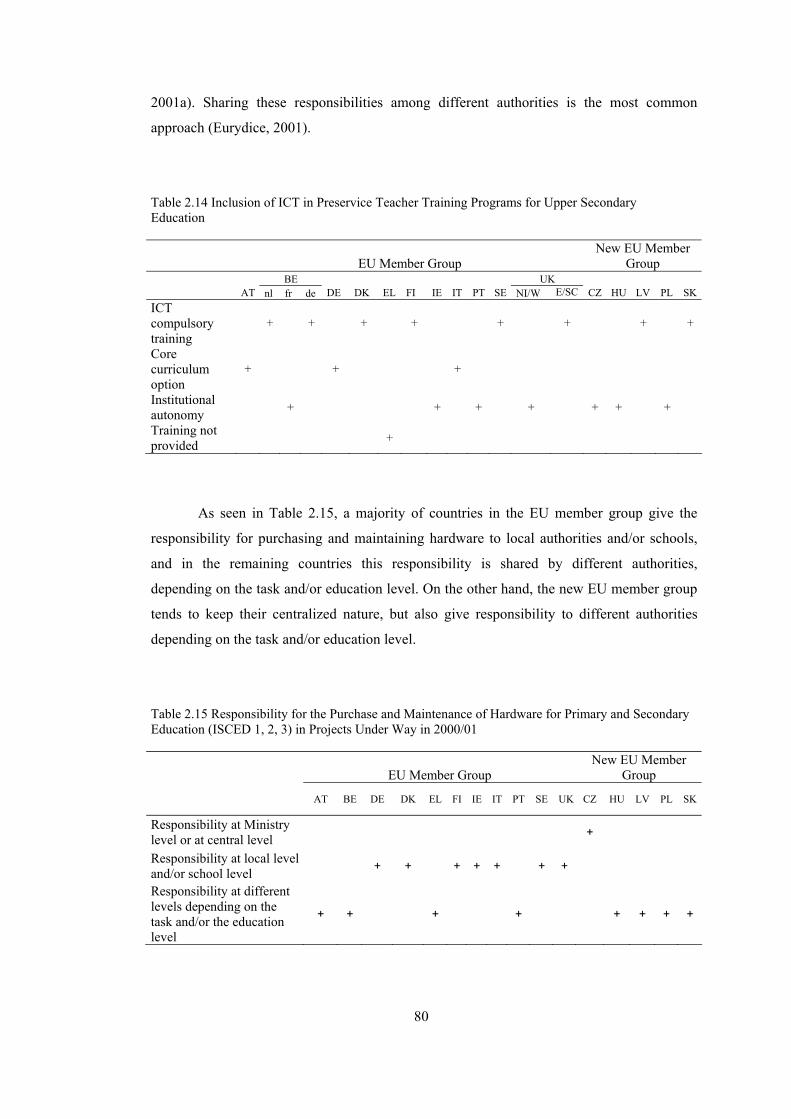
80
2001a). Sharing these responsibilities among different authorities is the most common
approach (Eurydice, 2001).
Table 2.14 Inclusion of ICT in Preservice Teacher Training Programs for Upper Secondary Education
EU Member Group New EU Member
Group BE UK
AT nl fr de DE DK EL FI IE IT PT SE NI/W E/SC CZ HU LV PL SKICT compulsory training
+ + + + + + + +
Core curriculum option
+ + +
Institutional autonomy + + + + + + +
Training not provided +
As seen in Table 2.15, a majority of countries in the EU member group give the
responsibility for purchasing and maintaining hardware to local authorities and/or schools,
and in the remaining countries this responsibility is shared by different authorities,
depending on the task and/or education level. On the other hand, the new EU member group
tends to keep their centralized nature, but also give responsibility to different authorities
depending on the task and/or education level.
Table 2.15 Responsibility for the Purchase and Maintenance of Hardware for Primary and Secondary Education (ISCED 1, 2, 3) in Projects Under Way in 2000/01
EU Member Group New EU Member
Group
AT BE DE DK EL FI IE IT PT SE UK CZ HU LV PL SK
Responsibility at Ministry level or at central level +
Responsibility at local level and/or school level + + + + + + +
Responsibility at different levels depending on the task and/or the education level
+ + + + + + + +
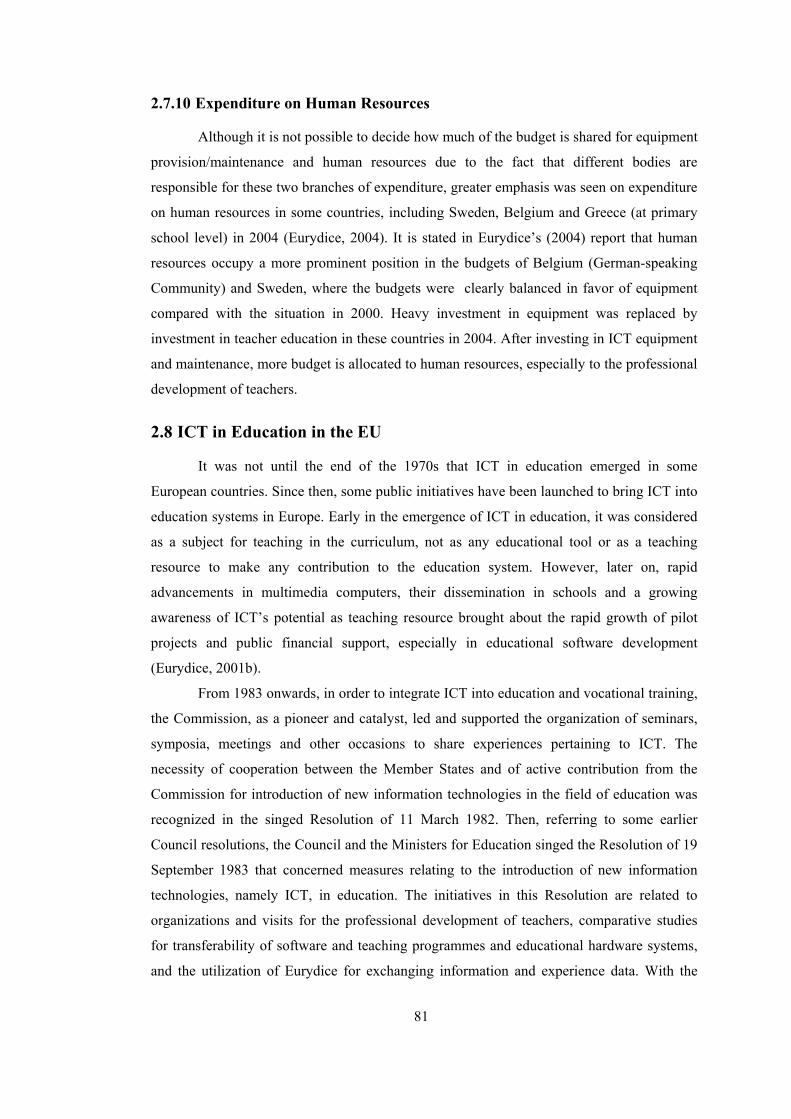
81
2.7.10 Expenditure on Human Resources
Although it is not possible to decide how much of the budget is shared for equipment
provision/maintenance and human resources due to the fact that different bodies are
responsible for these two branches of expenditure, greater emphasis was seen on expenditure
on human resources in some countries, including Sweden, Belgium and Greece (at primary
school level) in 2004 (Eurydice, 2004). It is stated in Eurydice’s (2004) report that human
resources occupy a more prominent position in the budgets of Belgium (German-speaking
Community) and Sweden, where the budgets were clearly balanced in favor of equipment
compared with the situation in 2000. Heavy investment in equipment was replaced by
investment in teacher education in these countries in 2004. After investing in ICT equipment
and maintenance, more budget is allocated to human resources, especially to the professional
development of teachers.
2.8 ICT in Education in the EU
It was not until the end of the 1970s that ICT in education emerged in some
European countries. Since then, some public initiatives have been launched to bring ICT into
education systems in Europe. Early in the emergence of ICT in education, it was considered
as a subject for teaching in the curriculum, not as any educational tool or as a teaching
resource to make any contribution to the education system. However, later on, rapid
advancements in multimedia computers, their dissemination in schools and a growing
awareness of ICT’s potential as teaching resource brought about the rapid growth of pilot
projects and public financial support, especially in educational software development
(Eurydice, 2001b).
From 1983 onwards, in order to integrate ICT into education and vocational training,
the Commission, as a pioneer and catalyst, led and supported the organization of seminars,
symposia, meetings and other occasions to share experiences pertaining to ICT. The
necessity of cooperation between the Member States and of active contribution from the
Commission for introduction of new information technologies in the field of education was
recognized in the singed Resolution of 11 March 1982. Then, referring to some earlier
Council resolutions, the Council and the Ministers for Education singed the Resolution of 19
September 1983 that concerned measures relating to the introduction of new information
technologies, namely ICT, in education. The initiatives in this Resolution are related to
organizations and visits for the professional development of teachers, comparative studies
for transferability of software and teaching programmes and educational hardware systems,
and the utilization of Eurydice for exchanging information and experience data. With the
82
singing of this resolution, these initiatives would be implemented and monitored to
supplement and support the actions and programmes of the member states until 1988.
Consequently, this process prepares young people to use information technology as a tool
and to judge its effects on daily life and to assess its social significance (Eurydice, 2001b;
Council, 1983).
Later on, the Community programme Comett was launched to provide cooperation
between universities and enterprise in the whole of Europe in 1986. Another programme,
Eurotecnet was also started to promote innovation in vocational training considering ongoing
technological change and its effects on competencies and employment. Similar to Comett
and Eurotecnet, Socrates 1-2, Leonardo da Vinci 1-2, Lifelong Learning, and their sub-
programmes, and others were launched in turn.
Open and Distance Learning (ODL) issues were introduced and discussed in the
conference held on 30-31 March 1992 in Portugal. The conclusions of this conference were
published as the Commission memorandum. The memorandum concludes that “open and
distance learning elements should be incorporated whenever justified into appropriate
Community education and training programmes. Moreover, the potential for developing
better arrangements of ODL offered by Community programmes in other fields should be
fully exploited” (Council, 1992a, p.1). After this memorandum, on 1 June 1992, the Council
and Ministers confirmed their interest in receiving proposals in this area. The Council and
the Ministers of Education considered action to support members and their cooperation in the
field of ODL. Since then, action in the field of ICT has been consolidated and regularly
expanded (Council, 1992b, p.1). The ODL action within Socrates 1 (1995-1999) helped ICT
to integrate into education systems in the EU. The second phase of Socrates incorporated
increased opportunities in the field of the ODL issues under the Minerva measure (Ertl,
2003).
In order to allow six European programmes -Socrates, Leonardo da Vinci, Targeted
Socio-Economic Research, Esprit, Telematics Applications, and Trans -European
Telecommunications Networks- to pool their efforts to increase development of the
educational and training technology and its applications all over the EU, an Educational
Software and Multimedia Task Force was established in 1995. The cooperation between
these programmes provided the opportunity to contribute the implementation of policies
made at the European level in the fields of education and training. For example, up to 1998
the Educational Software and Multimedia Task Force supported 46 educational multimedia
projects involving 400 firms and institutions, around half of which were schools (Eurydice,
2001b).

83
Learning in the Information Society, launched in 1996, is an action plan that focused
on making multimedia in general, and the Internet in particular, part of teaching practice.
The initiative of the action plan had three main objectives to: “(1) accelerate schools' entry
into the information society by giving them new means of access to the world, (2) encourage
widespread application of multimedia pedagogical practices and the forming of a critical
mass of users, products and educational multimedia services and (3) reinforce the European
dimension of education and training with the tools of the information society whilst
enhancing cultural and linguistic diversity” (Commission, 1996, p.7). In order to achieve
these objectives, the initiative involved the following four lines of action (Eurydice, 2001b,
p.17):
• Encouraging the establishment of electronic networks between schools throughout Europe;
• Boosting the development of educational multimedia resources; • Promoting teacher training in the use of ICT; and • Providing information on the potential of multimedia and audio-visual
educational tools and resources.
Along with ODL action within Socrates 1 (1995-1999), the Minerva action within
Socrates 2 (2000-2006) went on to develop ICT integration into education systems in the
EU. The Minerva action focused generally on promoting transnational cooperation projects
at the European level in the field of ODL, multimedia and the use of ICT in education. It had
the following three main objectives (Europa, 2006, p. 1):
• to promote understanding among teachers, learners, decision-makers and the public at large of the implications of ODL and ICT for education, as well as the critical and responsible use of ICT for educational purposes,
• to ensure that pedagogical considerations are given proper weight in the development of ICT and multimedia-based educational products and services, and
• to promote access to improved methods and educational resources as well as to results and best practices in this field.
The Minerva action supported the following ICT related activities: “action and/or
research aimed at highlighting the impact of ICT or open and distance education on the
organisation of processes and models for teaching and learning; and the development, at
European level, of information systems and services concerned with educational methods
and resources involving the use of ICT and open and distance education” (Eurydice, 2001b,
p. 18).
When looking back on the eLearning initiative, the originating point of it was based
on a strategic goal of the Lisbon process in 2000. The “eLearning Action Plan: Designing
tomorrow’s education” initiative was adopted by the European Commission on 24 May 2000
and accepted by the Ministers of Education in June 2000. Considering the conclusions of the
84
Lisbon process, the principles, objectives and action lines of the eLearning initiative were
started to improve the quality of learning, services, remote exchanges, and cooperation for
education and training at the European level by using new multimedia technologies and the
Internet. Although it had several actions, the ICT related one is “devising a decision-making
support tool in the form of an information base that contains qualitative and quantitative
indicators regarding the use of ICT for educational purposes” (Commission, 2001; Eurydice,
2001b, p.20).
The eSchola action is more obviously aimed at an educational venture that was to be
implemented as part of the eLearning initiative. eSchola focused largely on indicating the
information and communication potential of the new technologies, encouraging schools and
teachers to share best practices and learn from each other. In 2001, there was a campaign, to
increase awareness of using the Internet and ICT in schools, especially using eTeaching to
require teachers to integrate ICT in teaching activities (Eurydice, 2001b).
Initially, the Information Society Technologies Programme (IST) was replaced with
three sub-programmes in the Fourth Framework Programme, (1) the Advanced
Communications Technologies and Services, (2) Esprit, and (3) Telematics Applications.
Thereby the IST brought these activities together within a single programme. It indicated the
growing close interrelationship among information processes, communications and
multimedia technology. Then, the IST was also present at the Fifth Framework Programme
as a major research and development theme. The strategic goal of the IST was to enable
Europe to benefit from the advantages of the information society and to ensure that the needs
of individuals and enterprises were satisfied. Although IST is structured into four key
actions, the ICT-related action covers the following areas: “essential technologies and
infrastructures: mobile and personal means of communication, microelectronics, the
development of software and corresponding technology, systems and services, simulation
and visualization technologies, new interfaces, the development of peripherals and
subsystems and microsystems” (Eurydice, 2001b, p. 22).
The information network on education in Europe, Eurydice, has provided strategic
mechanisms or an institutional network for gathering, monitoring, processing and circulating
reliable and comparable information on education systems and policies all over Europe since
1980. In order to increase cooperation in answering and regulating needs of education
systems and policies at the European level, Eurydice is primarily committed to provide
policy makers and decision makers with an exchange of information and experiences in the
field of education. It prepares and publishes the following issues: “readily comparable and
regularly updated country descriptions on the organisation of education systems,

85
comparative studies on specific topics of Community interest, and indicators” (Eurydice,
2007b, p. 1).
With the growing use of the Internet and ICT, the national governments and the
Commission need to learn and measure the status of ICT and Internet use in educational
institutions in the member states. In this, Eurydice publications on ICT in education are
critically important, as they make available publications giving information about key data
on education, ICT at schools in Europe and basic indicators relating to ICT incorporation
into European education systems (Eurydice, 2001b). Furthermore, it has Eurybase, a highly
detailed database on education systems, and makes it available to its users. Additionally, it
cooperates closely with the other partners, Eurostat, Cedefop (the European Centre for the
Development of Vocational Training), ETF (European Training Foundation), the Council of
Europe, the OECD, and the United Nations Educational, Scientific and Cultural
Organization (UNESCO) (Eurydice, 2007b).
2.9 The Challenges, Roles and Promises of ICT in Education in the EU
In 2001, experts from most of the European countries published a report about five
challenges to the quality of education and sixteen indicators of the quality of school
education in Europe. The challenges are connected with knowledge, decentralization,
resources, social inclusion, and data and comparability, all of which would have potency to
change the face of Europe and impact on national education systems in Europe
(Commission, 2000).
Firstly, the information explosion has demanded a fundamental rethinking of
traditional conceptions of knowledge, its transmission and delivery by teachers, and its
acquisition by students. This leads to a question prioritization in curricula, the setting of
educational goals and objectives, the selection and using of teaching methods, and issues
related to measurement and assessment etc. In short, essential purposes of school education
need redefining to respond to the challenge of the knowledge society, for lifelong learning in
Europe. Secondly, the decentralization of education systems at school level, in terms of
autonomy, responsibility, accountability, and affordability is another challenge for the EU.
Providing same standards, controlling educational inputs and outputs, comparability, equity,
quality assurance, and inspection issues are placed in this challenge. Thirdly, money and
time-related investments in education are resource challenges to quality of education. This
challenge affects both the professional manpower and the students’ childhood experiences in
pre-school education and in compulsory schooling in terms of intelligence, personal
development and, subsequently, social and economic integration into society. Fourthly,

86
making education systems inclusive, to prepare young adults for life after school, is an other
challenge related to social inclusion. The structures, curricula and learning environments of
schools do not provide any incentive to go and attend on a regular basis, and they are often
considered uncongenial or irrelevant to young adults’ lives. Finally, benchmarking to make
comparisons of national, local, and regional effectiveness and performances at the level of
individual schools is the data and comparability challenge. Benchmarks can be used
diagnostically and formatively to inform policy and practice, but sometimes they are also
considered as a threat. Benchmarking involves creating or having standardized data
(Commission, 2000).
The widespread diffusion of ICT has forced people to acquire and master key digital
knowledge and competencies that are necessary for education and training, personal
development, active citizenship, social inclusion, employment, and self development for the
knowledge-based economy and society. Furthermore, ICT helps in providing for the
acquisition of new knowledge and competencies to remain competitive in the global world,
and in making society ready to grasp new opportunities in the future (Punie & Cabrera,
2006).
Since technological developments are faster than educational ones and educational
institutions require some stability and certainty to deliver instructions and to evaluate their
processes and/or outcomes, there is a difficulty in finding a balance between these elements
in order to catch technological advancements and to integrate them into educational
institutions. Although technological advancements, especially in ICT, provide many
facilities for learning, they concurrently offer many ambiguities on how to integrate them
into educational institutions. This also leads to some challenges that Europe faces in
adapting, managing, and implementing ICT in learning environments, which partly explains
why ICT-enabled learning has not carried out its promise so far. Nevertheless, ICT should be
integrated into learning environments. This integration needs to have more and better
investment, resources, research, availability of multi-stakeholders ready to get involved. It
needs innovation, time for a trial-and-error process, social and institutional changes, and
support from a positive policy (Punie & Cabrera, 2006).
Starting with the Lisbon process in 2000 and its strategic goal aforementioned,
authorities from the Europe needed a new vision of learning for a knowledge-based economy
and society; thereby they wanted both a radical transformation of European economy and
society, and a challenging programme for the modernization of social welfare and education
systems. Furthermore, in 2002, they declared that Europe should be the world leader in terms
of the quality of its education systems by 2010, which means a fundamental transformation

87
of education and training systems throughout Europe. This transformation can be considered
as a need for a demanding and urgent process of change for policymakers, educational
stakeholders, and practitioners in Europe (Europa, 2007).
This need for a fundamental transformation of education and training systems is met
by especially some actions of the Education and Training 2010 Programme, which is based
on three major goals to: “(1) improve the quality and effectiveness of the EU education and
training systems; (2) assure that they are accessible to all and; (3) open up education and
training to the wider world” (Europa, 2007). In order to realize the Lisbon strategic goal and
to meet the need, each country in its national context should drive forward in cooperation
with the others at the European level, working for common goals and sharing knowledge and
experiences with the help of an open-method of co-ordination. Consequently, it has been
working towards the ultimate goal that ICT-enabled lifelong learning in a knowledge-based
economy and society becomes true; this involves improving all aspects of education systems:
primarily integration of ICT, teacher training, basic skills, efficiency of investments,
mobility and citizenship education etc. In this sense, ICT has a key role to play in making
ICT-enabled lifelong learning a reality, and in meeting the need for a fundamental
transformation of education and training (Europa, 2007).
Correspondingly, when new developments, shifts and trends in technology and
education are considered by the Community, it is well aware of a new vision of ‘ICT and
learning’ that is likely to transform the way people work, learn, and interpret their lives to
envision, foresee and expect future learning needs, and requirements. The guiding principle
of ICT in this vision can be considered as a strategic catalyst or an enabler in providing
anyone with access to learning environments anywhere, anytime, and anyhow; but ICT alone
is not enough to lead the entire change or transformation process automatically; it should be
supported with, especially, necessary reforms in learning and education systems.
Furthermore, teaching and learning without ICT seem to be almost impossible to envisage in
future learning environments and even in current ones (Punie & Cabrera, 2006).
When ICT is integrated into education systems, it has some key roles to play, such as
being a lever for change and adaptation, a catalyst for innovation, an enabler for lifelong
learning, a support for employability, a bridge over the digital gap, and a platform for
European cooperation (Diaz, 2002). Furthermore, ICT has a responsive role to play in
meeting rapid technological changes and their effects on learning. In this connection,
meeting challenges in ICT-enabled learning makes learning more flexible and modularized,
multi-cultural and permanent in Europe. In addition to these, ICT has an inclusive role to
play in including handicapped people in the social learning environment, to provide learning

88
opportunities. It is very interesting that, to some extent, learning has an ICT paradox; this is
that ICT may be a challenge for learning, especially at initial stage of integration, and
adaptation, but then it may be an enabler. In connection with ICT, this situation is
completely changeable, depending on such issues as the basis of existence, purpose,
function, and use of ICT (Punie & Cabrera, 2006).
2.10 ICT-in-Education in the EU
ICT-related aims, strategies, action lines, initiatives, main programmes, projects,
public and private partnerships, and sharing responsibilities pertaining to the EU members
are explained separately below.
2.10.1 ICT-in-Education in the EU Member Group
2.10.1.1 Austria
Considering the integration of ICT facilities, curricula, and teacher training in the
education system of Austria, they vary; but they have reached a basic and more advanced
level in lower secondary education. Some schools offer optional or compulsory courses
related to ICT. The schools called computer science schools give particular importance to
this. Some of them have Internet access and homepages (Eurydice, 2001b).
Within vocational training schools, in 1998 there were experiments for more
extensive training to increase ICT familiarity. There are many various further training
projects in progress: “training of teachers for industrial certificates in ICT; online training
through the eFit academy; academy placements; training in information technologies; the
foundation of specialized schools in computer technology and communication and data
processing; and the obligation in future for all graduates in technical and vocational training
to have obtained a level II grade in computer science testifying to specialized knowledge in
this field etc.” (Eurydice, 2001b, p. 94).
At lower and upper secondary academic schools, computer science was introduced
as a compulsory subject in 1987. These schools were linked to their own network in 1995,
and then all schools under the responsibility of federal authorities were linked to the network
and the Internet in 1999. Later, education in ICT was included in the curricula of all levels of
school from primary upwards (in 2001). Furthermore, several ICT related projects (school
book and notebook) were being implemented (Eurydice, 2001b).
Integration of ICT in education and training was conducted to prioritize curriculum
development and lesson administration by the Federal Ministry for Education, Science and
Culture from the mid to end 1990s. However, since then the curriculum has been changed

89
and adapted to the need for ICT integration in all disciplines of the curriculum. With the
beginning of the ICT initiative “eFit-Austria” in 2000, increase in access to education, and
improvement in quality of the entire education system through sustainable use of modern
ICT was targeted. In 2003, thirteen training programmes related to ICT use were developed
and implemented for such areas as, particularly, unemployed people, the development of
new professional fields in university, and the further training of teachers. eFit-Austria
entered its next phase as eFit2-Austria in 2005, aiming to increase the sustainability of the
projects and to ensure the necessary technical infrastructure and pedagogical conditions
(Commission, 2005b; Empirica, 2006a).
The scope of eFit-Austria consists of eEducation, eTraining, eScience, eCulture,
eAdministration, ICT-infrastructure, and an eLearning portal. The focus of eEducation is to
integrate ICT into general and vocational training systems; that of eTraining is to follow the
strategy of developing and implementing modern learning and communication techniques
via ICT for lifelong learning; that of eScience is to use ICT in teaching, learning, and
research in science and higher education; that of eCulture is to explore, preserve, and access
the cultural and scientific heritage with ICT; that of eAdministration is to transform
education management to a more efficient and service-oriented form, through use of ICT;
that of ICT-infrastructure is to take technical precautions to enable completion of the tasks
defined before; and that of the eLearning portal is to provide central access to education,
science and culture-related information, and to offer ICT services for interested users (eFit
Austria, n.d.).
In Austria, the authorities focused generally on e-learning, learning on the network,
training future teachers, and effective, permanent, and systematic ICT implementations in
the field of education, science and culture. The main ICT strategy of the Ministry of
Education is to transform e-learning and the Internet into natural learning resources. They
therefore prioritized the following eight aims in their projects within this main strategy: “(1)
establishing e-Learning academies; (2) extending opportunities for training in ICT; (3)
developing on-line teaching content; (4) setting up ICT scientific centers; (5) enriching adult
education and training; (6) promoting the Austrian cultural heritage over the Internet; (7)
launching ‘e-Government’ in education; and (8) adapting the infrastructure” (Eurydice,
2001b, p. 93).
Public and private partnerships related to ICT are particularly found in vocational
schools. There is also cooperation in providing compulsory education schools with issues of
computers and secure Internet access in Vienna. In addition, there are many associations
90
between schools for vocational training and the private sector in the field of humanities
(Eurydice, 2001b, p.93).
2.10.1.2 Belgium
The Flemish, French and German Community had separate endeavors toward
sharing responsibilities for ICT related studies. In the Flemish Community, there were four
major initiatives in ICT. They had also sub-initiatives or programs as follow: (a) initiatives
concerned with infrastructure (a1- The PC/KD programme, a2- The I-line, a3- The Telenet
Pandora initiative, and a4- initiatives to promote video-conferencing); (b) initiatives to
familiarize students with ICT (b1- The educational software project for special education,
b2- The European Network of Innovative Schools, b3- The matrix programme); (c) teacher
training initiatives (c1- In-service teacher training and c2- Initial teacher training); and (d)
initiatives to promote international cooperation projects (d1- the OECD initiatives and d2-
the European Schoolnet). As understood from the initiatives of the Flemish Community, they
gave more importance to these endeavors than the other communities (Eurydice, 2001b).
The aims of these initiatives can be summarized as: a1- all schools would have one
computer for every 10 students (10-18 years of age) by 2002; a2- primary and secondary
schools would be provided with access to the Internet 24-hours-a day in the period 1998-
2000; a3- primary and secondary schools would be provided with tax-free access to the
Internet; a4- financial assistance would be offered by the department of education to schools
in videoconferencing facilities and associated training for primary and secondary schools;
b1- students enrolled in special education would be taught using educational software in pilot
schools; b2- all types of institutions, especially for teachers in compulsory education, would
be provided with a network that seeks to link up schools recognized for their experience in
the area of ICT; b3- primary schools would be supported by a matrix programme of
educational database software related to the Flemish language; c1- primary and secondary
school teachers would be familiarized with new technologies by encouraging exchanges of
expertise through computer networking; c2- primary and secondary school teachers would be
prepared for their new roles as teachers in the future information society; d1- endeavors
would be conducted by the 25 OECD member countries to provide “quality criteria for
educational software and multimedia; changes in the market for educational software and the
potential for partnerships in this area; and research and evaluation of the impact of ICT in
education”; and d2- schools in the EU countries would be networked to communicate, test
educational resources and services and invest in multilateral projects etc. (Eurydice, 2001b).

91
The German-speaking community had a deliberate policy on development of ICT in
1998. This policy focused on two main aims: “(1) action to develop ICT in schools and (2)
initiatives concerned with in-service training and with fully mobilizing the energies of civil
society” (Eurydice, 2001b, p. 40). French community had two general aims: “(1) the
incorporation of ICT into compulsory education, which is regarded as a factor in boosting
the economy, attaches priority to training young people in use of these new technologies, and
(2) this concern is coupled with determination to develop a policy for equal opportunities
ensuring that all students can secure access to ICT” (Eurydice, 2001b, p. 37). The general
aims of the Flemish Community were as follow: “the acquisition and development of
knowledge regarding ICT should constitute a new ‘lifelong learning’ process; and schools
should make arrangements among themselves for ‘lifelong learning’ to become a reality and
an opportunity open to everyone” (Eurydice, 2001b, p. 41).
The French community had initiatives under the following three major titles: (1)
primary and secondary levels: (1a) the scheme for multimedia equipment, (1b) connecting to
the Internet, and (1c) in-service teacher training; (2) tertiary level; and (3) ICT
media/multimedia education. The scheme for multimedia equipment (1a), aimed to provide
primary and secondary schools with such equipment for the period of 1998-2001.
Connecting to the Internet (1b), aimed to connect 1665 primary and secondary schools to the
Internet in 1998. In-service teacher training (1c) aimed to provide primary and secondary in-
service teachers with ICT teacher training, financed and subsidized by the French
community, including training in handling computer tools, their applications for teaching
purposes and the development of critical familiarity with ICT media, in 1999. Tertiary level
(2) aimed to integrate a new content into training about knowledge and teaching applications
of ICT and its media for primary and lower secondary school teachers, in 2000. ICT
media/multimedia education (3) refers to providing education in the ICT media for all
primary and secondary school staff. The French community aimed to establish priorities in
this area, incorporating media education into school curricula, initial and in-service training,
and encouraging necessary partnerships in delegating a team consisting of the Council for
Education in the Media and three officially recognized resource centres (Eurydice, 2001b).
The German Community focused on a joint action involving different levels of
authority. The French Community had been working together to provide schools with
multimedia equipment and ICT related studies. The French Community had also been
supervising the integration of ICT into educational teacher training activity. There was
nothing of note in public and private partnerships in the German and French Communities.
92
However, in the Flemish community, both governmental and sectoral level partnerships
about ICT were better than the others (Eurydice, 2001b).
Similar to the French community, In the German Community, there were mainly
three major initiatives about ICT, that are as follow: (1) connecting secondary schools in the
German-speaking Community to the Internet; (2) the “CyberMedia” initiative; and (3)
regular involvement in “Netd@ys” and opening of a “Learnbox” unit. The main aim of the
first initiative was to provide as many secondary schools as possible with an Internet
connection. The first initiative was completely realized by Belgacom and the German-
speaking community in the year 1998. The main purpose of the second initiative,
CyberMedia, was to provide primary and secondary schools with multimedia equipment and
facilities in 1999. Primary schools received 300 computers and 13 upper secondary schools
were provided with computer and multimedia equipment under the second initiative
(Eurydice, 2001b). The last initiative of the German community, Netd@ys and Learnbox,
aimed to create general public awareness about the potential of the new media and the
challenges emerging from ICT. In 2000, this initiative served schools throughout the
Community in such a way that “two teachers who assisted with the introduction of ICT in
primary and secondary schools opened an interactive educational Internet website, known as
Learnbox, which amongst other things includes databases providing for the exchange of
practical information among all schools throughout the Community” (Eurydice, 2001b, p.
41).
2.10.1.3 Denmark
In 1984, ICT was offered to students as optional subject under the name of
“computing”. ICT became an obligatory subject known as “electronic data processing” in
1990. The integration of ICT as an obligatory subject into the teaching of all subjects was the
major objective for primary schools in 1994. Parallel to this, “word processing”,
“technology” and “media” were also established as three new subjects for students. This
transformation process ensured that all students would have a similar level of computer
skills. Therefore, Danish ICT policy at the primary level perceived ICT as not a particular
subject or topic, but an integrated part of all subjects. Correspondingly, ICT skills can be
considered as a fourth basic skill along with reading, writing, and arithmetic (Pedersen,
2003).
In 1998, the Danish government set a primary goal in terms of ICT implementation
which was that the Danish education system would be among the best five in the World. The
Danish ICT policy, based on an information society, covers all kinds of people that should

93
not be divided into different ICT skill levels. The Danish government also emphasized
investment in ICT, which equally would serve to the following two main purposes: “(1) to
improve education by adding more quality and by making it more efficient, (2) to give
students the basic ICT qualifications that allow them to operate in present-day society and
the society of the future” (Pedersen, 2003, p. 185).
As a result of these concerns, the Danish Ministry of Education made an action plan
for 1998-2003. This action plan focused on the following five areas: (1) the implications of
ICT for students, (2) teachers and ICT, (3) areas of study and ICT, (4) fair and flexible
access to lifelong learning, (5) coordination between research into ICT and education. In
addition to the action plan, the following general aims were set: provide all schools with
reliable and inexpensive connections to the Internet and intranet through a sufficient number
of computers integrated into education, develop significant ICT-related content and online
courses to promote lifelong learning, develop teacher training program for in-service
teachers to certify their ICT knowledge and skills related to the ICT (Eurydice, 2001b).
After that, the Danish strategy related to ICT in education was based on a wide range
of innovative ICT projects. This led to some initiatives, including ICT at lower levels in
primary schools, connection of all basic schools into an ICT network, in-service teacher
training through distance education and teachers as ICT users etc. Some major initiatives are
the Danish ICT Center for Education and Research (UNI-C), Sektornet, and School-ICT:
The Educational ICT Driving License. The UNI-C is an ICT company and IT frontline
organization that provides services for education, research, and business and offers a
common platform for the exchange of knowledge within the Danish educational sector
respectively. It also connects schools to the Internet and develops educational materials,
particularly software and homepages. Sektornet was a kind of network that improved and
intensified communications between Danish educational institutions. The ultimate goal of
Sektornet was to connect all Danish educational institutions to the Internet in order to offer
net-based education in the future. School-ICT: The Educational ICT Driving License is the
basic ICT in-service training program for primary school teachers through distance
education. With this program, teachers would revise the content and raise the quality of their
teaching (Pedersen, 2003).
In addition to these, there are five cutting-edge projects: (1) Cutting-edge
municipalities, (2) The Janus project, (3) Electronic gymnasium, (4) Cutting-edge colleges of
education, and (5) Poseidon. Firstly, cutting-edge municipalities (1995) aimed to improve
public services by affecting a more efficient administration. Secondly, the Janus project
(1995-1997) aimed to instill the principles of goal-oriented ICT planning in schools. Thirdly,

94
Electronic gymnasium (1995-1998) offered schools experience with the latest computer
technology in education. Fourthly, Cutting-edge colleges of education (1995) aimed to
integrate ICT into colleges of education and understand how ICT influences the teaching of
subjects and assessment-related work of teachers. Finally, Poseidon (1997-1999) aimed to
test tools and procedures for the integration of ICT through ten pioneering institutions
(Pedersen, 2003).
After the action plan for 1998-2003, the Danish government initiated another action
plan for ICT in the field of primary and lower secondary education for the period of 2004-
2007. ICT integration into subjects where deemed appropriate, and the development of new
forms of online teaching materials, are launched and funded within this action plan. It is
expected that both low and high performance students take advantage of ICT integration in
the teaching process through access to ICT, and use it as a daily personal tool. This also
improves the regular cooperation between teachers and students at all grades (Empirica,
2006c).
2.10.1.4 Finland
In order to build a Finnish information society, a position paper outlining a Finnish
information society strategy was drawn up by the government in 1995. An initial national
strategy -the National Strategy on Education, Training and Research- was specified to
achieve the following two general aims: “(1) enabling everyone, in accordance with the
principle of equality of opportunity, to acquire the ICT knowledge and skills needed to study
and develop their intellectual ability; and (2) encouraging the development of a real
information society based on interactive knowledge” (Eurydice, 2001, p. 99). In order to
implement this strategy, the national Information Society Programme was conducted from
1996 to 1999. With this programme, school computer network activity and methods of in-
service education and training for trainers areas are covered (Eurydice, 2001b).
Along with the implementation of its initial strategy, in 1996, Towards a Culture-
oriented Information Society was set up and realized by the Ministry of Education as an
information strategy. The guiding principle of this strategy was to guarantee all citizens
equal access to cultural services in the new media, especially through producing Finnish
content. Furthermore, this strategy provided the Finnish people with new content and
information services to diminish alienation and enhance internationalization in Finnish
society (Kankaanranta & Linnakyla, 2003).
A consecutive strategy, the National strategy for 2000-2004, was based on appraisal
of the initial strategy. It was recognized in 1999 that the information society in Finland was
95
of a high standard, especially in terms of infrastructures, but there was inadequate and
inconsistent use of ICT in education, while resources were earmarked for development of
computer networks and its facilities. Therefore, four action lines were defined: “(1)
development of the knowledge and skills needed in the information society; (2) promotion of
computer networks as a means of learning; (3) accumulation of information digital capital;
and (4) the strengthening of infrastructure in the education and research sectors” (Eurydice,
2001b, p. 100).
The responsibility for these strategies, aims and action lines and related initiatives,
programmes, projects and measures was taken and shared by the Ministry of Education and
the National Board of Education at the central level, and by local authorities, schools, and
teaching staff at the local level. More specifically, the Ministry of Education determined and
monitored the strategy and aims of the information society in the fields of education, training
and research; the National Board of Education implemented and coordinated the programme
for basic education, general and vocational upper secondary education and adult education;
and local authorities were a key partner responsible for a major share of the financing of
primary and secondary education. However, it was not until 2001 that there was a private
and public partnership related to computer equipment manufacturing and content producing
(Eurydice, 2001b).
With the declaration of the national information strategy of Finland for education
and research in the period 2000-2004, the Ministry set out seven major initiatives, and their
aims and content: (1) citizenship skills in the Information Society; (2) training of teaching
staff; (3) information industry and digital communication professionals; (4) virtual
university; (5) virtual school; (6) research and development relating to learning
environments; and (7) content production (Eurydice, 2001b).
The aim of the first initiative was generally to encourage people to learn the skills
necessary for the Information Society. The aim of second initiative was two fold: (1) to
develop a strategy for the use of ICT in education and (2) to provide educational staff and
teachers with training about ICT. The third initiative aimed to overcome challenges in
information industry sectors through making these sectors more attractive, developing the
quality of education in these sectors and increasing their employment. The fourth and fifth
initiatives, virtual university and virtual school, basically aimed to develop and introduce
cooperative and interactive open learning environments and teaching methods (Kankaanranta
& Linnakyla, 2003). The sixth initiative’s aim was to meet needs emerging from the
adoption of an information strategy that requires developing top quality learning
environments related to virtual university and school projects. The final initiative aimed to
96
increase the development of a digital culture and to support industries producing an
educational digital content (Eurydice, 2001b).
In addition to these, the programme of the Information Society for Education,
Training and Research 2004-2006 aimed to give information society skills to citizens, to
provide ICT in educational institutions and to establish social innovation through ICT.
Through this programme, “all those completing studies [were] to be given the opportunity to
obtain the basic skills and knowledge required in an information society; […] at least 75% of
teachers [were] to have the skills to use ICT in teaching, and […] on-line instruction [was] to
be well-established” (Empirica, 2006d, p. 10).
2.10.1.5 Germany
With advent of worldwide advancements and general trends in multimedia,
telecommunications and the Internet since the mids-1990s, ICT has become an important
political issue in education in Germany. Therefore, a nationwide initiative was started by
German Telekom AG to connect schools to the Internet in 1995. This played a critical role in
recognizing the significance of multimedia and the Internet for teaching and learning in
schools. After this, several initiatives and funding programmes were launched to transform
the country an industrial society to a knowledge-based society. The “Forum Info 2000”
initiative was Germany’s first national activity to reach the Information Society, and was
started by the Federal Government in 1996 (Empirica, 2006e). In addition, ICT-related
measures have been taken to integrate ICT into schools and utilize its facilities for
educational purposes, to provide in-service teacher training, and develop learning software
etc. (Schulz-Zander, 2003).
Several meetings and panels have been conducted by experts and authorities in order
to respond to ICT-related challenges on the level of ICT/media-related competency. These
have produced some reports and then a declaration, New Media and Telecommunications in
Education, published in 1997. This declaration can be considered as a reference point for the
federal states in their endeavors to implement changes in the education system. By this
declaration, the Ministry confirmed that ICT as new media would be needed to facilitate
teaching and learning, to provide teaching aids, and to be a medium for distance learning.
Consequently, it has been concluded that the general aim is for ICT to be integrated into
general and vocational schools at both lower and upper secondary levels (Schulz-Zander,
2003). Furthermore, the ICT-related general aims are stated as to “include ICT in the initial
and in-service training of teachers; encourage partnerships between multimedia centres and
the teacher training institutes in the Länder” (Eurydice, 2001b, p. 49).

97
The shared responsibilities in administrative levels in Germany are as follow: state
responsibilities: the ministries of education and research in the Länder are responsible for the
in-service training of their teachers (who are civil servants); municipal responsibilities:
municipalities are generally responsible for the provision of ICT facilities in public-sector
schools. Federal government responsibilities: the federal authorities share responsibility with
the Länder in areas concerned with tax law, literary and artistic property rights, rights
relating to use of the Internet, distance education and the quality assurance of services and
educational software. The federal government is also responsible for financial assistance
(Eurydice, 2001b).
In Germany, there are ICT-related private-public partnerships, in both nationwide
and local level industry, to promote the use of ICT in education system. The most
outstanding partnerships can be given under two titles: (1) partnership with INTEL, an in-
service teacher training programme known as ‘Teaching for the Future’, provides 120,000
teachers with in-service training in the use of ICT both in the classroom and for distance
purposes; and (2) an other partnership with over 120 firms in the information technology
sector, which provides schools with computer-related infrastructure and a free consultancy
service (Eurydice, 2001b).
The initiatives can be grouped into the following four areas: (1) the “IT in education:
communication rather than isolation Action Programme”; (2) Innovation and Jobs in the
Information Society of the 21st Century; (3) joint actions involving the federal government
and the Länder; and (4) Initiatives of the States (Eurydice, 2001b).
Firstly, “IT in education: communication rather than isolation Action Programme”
has four components: (1a) the initiative of ‘Schools on Line’, between the federal
government and Deutsche Telekom, provided all schools with free Internet access (including
installation and monitoring) and 20,000 computers for primary and secondary schools in the
period of 1996-2001. However, this initiative is to continue for an unspecified period beyond
2001; (1b) the initiative of support for the development of educational software was
launched by the federal Ministry for Education and Research, to develop educational
software in the period of 2000-20004; (1c) the initiative of a Programme to modernize
vocational education institutions was set up between the Federal Institute for Vocational
Training and various social partners in order to modernize vocational education institutions.
It is centered on the provision of ICT facilities and implemented by the federal Ministry for
Education and Research; and (1d) the initiative of facilities for public libraries provides all
public libraries with Internet access, giving priority to those with inadequate equipment
(Eurydice, 2001b; Empirica, 2006e).

98
Secondly, Innovation and Jobs in the Information Society of the 21st Century (the
D21 Initiative) was adopted in 1999. The actions supported by the federal Ministry for
Education and Research are the following: development of the Lehrer-Online website with a
new priority called ‘Women teachers and pupils go online’; establishment of the DFN-
Verein network for higher education and research institutions; support for various types of
industrial pilot projects involving companies, institutions and teachers etc.; and promotion of
some Internet teaching projects for five years: the first is about the establishment of virtual
cooperation among Universities of Applied Sciences, the second concerns the development
of multimedia support for courses in chemistry, and the third is about technical and
organizational approaches to ‘telelearning’ in centres for continuing training (Eurydice,
2001b).
Thirdly, a joint action involving the federal government and the Länder has three
components: (1) ‘construction of institutions of higher education’, a joint action aimed to
support the programme for providing computer facilities, the establishment of
communications networks in higher education institutions, and the extension of opportunities
for training in computer science; (2) joint actions for distance education aimed at using
computer networks and multimedia content in education; and (3) the SEMIK pilot project
(systematic incorporation of media and ICT in teaching and learning processes), which was
launched in 1998 and aimed to ensure the continued introduction and use of ICT in all
schools at all levels (Eurydice, 2001b).
Finally, there were also some information society development programmes as
initiatives at a regional level supported by the States. They can be listed as: “Baden-
Württemberg media-perspectives for the development of the media in the state of Baden
Württemberg; Bayern Online- an information society programme of the Bavarian state
government; Brandenburg’s Information Strategy 2006 (BIS 2006); Bremen’s Regional
Information Society Strategy Development (BRISE); Initiative Information Society
Schleswig-Holstein; the Berlin way towards the Information Society; and Media NRW - an
initiative of the state of north Rhine-Westphalia” (Eurydice, 2001b; Chatrie & Wraight,
2000, p. 24).
2.10.1.6 Greece
In Greece, the Ministry for Education and Religious Affairs launched a plan called
the “Operational Programme for the Information Society” for the 2000-2006 period. This
plan extended a previous action (Odysseia, which consists of 19 programmes and aims to
include ICT in daily activities over 380 secondary schools), and complements its general
99
measures to provide schools with equipment and facilities, linking them in a network and
developing ICT in education. The plan has two general aims: (1) to offer a service and better
quality of living to citizens; and (2) to contribute to general economic and human resources
development. In addition to these aims, there are several ICT-related strategies: providing a
network of all primary, secondary and special needs schools and administrative units with
ICT facilities; completing the network on education (EduNet) in all schools by 2001; and
installing an intranet linking in all schools by 2006 (Eurydice, 2001b).
Responsibilities shared by authorities can be categorized under two titles: (1)
administrative duties and (2) products. Firstly, the Pedagogical Institute and the ministerial
departments (implementation and monitoring of programmes) are responsible for planning
education policies for primary and secondary education. Secondly, the hardware issue is
under responsibility of the Ministry and the Pedagogical Institute. Putting out to tender
contracts for the development of educational software is the responsibility of universities or
institutes working with high tech companies. The Pedagogical Institute is responsible for
supplying teaching equipment and materials and establishing their standards (Eurydice,
2001b).
The national initiatives of Greece have generally focused on supplementing
hardware, the development and assessment of educational software, and the training of
teachers and staff at all levels of the education system. In the area of primary education, the
“Island of Phaeakes Programme” was launched in 1998 as a main initiative, and conducted
by the Institute of Computer Technology, and the departments for the training of primary
school teachers at the Universities of Athens, Thessaly and Crete. This programme aimed to
provide teachers and trainee teachers with training and a database, and to provide every
twelve students with one computer by 2006. Giving trainees basic computer skills,
integrating ICT in the education process, and increasing familiarity with educational
software were also targets for the database. It also sought to provide 14 pilot public-sector
schools with computerized laboratories, having Internet access and new educational
software, which led students to acquire basic skills in the use of ICT (Eurydice, 2001b;
McCaffery, 2003).
In the area of secondary education, since 1997 modernization of the infrastructure
and services of a national network (under the Odysseia programme in the period of 1996-
2000) were provided 400 high schools with the IT rooms since 1997. New educational
software was produced for the teaching of all subjects in junior high schools, and the
Institute of Computer Technology localized international educational software in 1999. This
initiative, in the period of 2000-2006, tried to provide all schools with access to a network by

100
the end of 2001, and to link all schools by means of an intranet by 2006. Furthermore, it
wanted all 51 prefectures, 1,800 schools and 117 administrative units to be connected to each
other.
In addition to these, there has been a development of educational exchanges and the
twinning of primary and secondary schools in Greece and schools abroad. These include
such activities as communication on the Internet and the exchange of projects, leading to
exchange programmes and visits. Greece is one of the founding members of the eLearning
programme EUN-European Schoolnet, an organisation founded in 1997 aimed at the co-
operation and communication of all Ministries of Education of the EUN member states on
issues related to e-Learning and the use of ICT in education (Empirica, 2006f).
2.10.1.7 Ireland
In Ireland, the government committed itself to a programme aimed at providing
computer literacy throughout the school system for the new millennium. Although there
were several ICT related policies, goals and programmes, the most comprehensive action
programme, Schools IT 2000 –A Policy Framework for new Millennium, was launched in
1998 and extended from 2000 to 2003 in order to invest in ICT in primary and secondary
schools. In this context, several goals and related initiatives covered the establishment of ICT
infrastructure in schools, the development and upgrading of teacher ICT skills, giving
computer literacy to students in the information society, support facilities and the integration
of ICT into teaching and learning environments. With these initiatives, student/computer
ratios changed from 35:1 to 11:1 at primary level and from 16:1 to 9:1 at second level from
1998 to end of the 2001. Therefore, considerable progress in relation to teacher ICT skills
and use of ICT in classroom was made in Ireland (Eurydice, 2001b; Empirica, 2006g).
ICT related responsibilities were shared among the authorities as follow: the
Department of Education and Science is responsible for education policy on curricula and
ICT integration into the education system; the National Council for Curriculum and
Assessment is responsible for the curriculum implementation of ICT; the National Center for
Technology in Education provides advice and guidance to schools about ICT infrastructure
for schools; and a Computer Service Manager is responsible for purchasing software, and
hardware etc. The Department/School within a particular Institute proposes teaching courses,
course content and teaching methodology, which is approved internally by the Academic
Council of the Institute and externally by the National Council of Education Awards
(Eurydice, 2001b).
101
In Ireland, there is an ICT-related public-private partnership between the Irish
telecommunications company (EIRCOM) and the Department of Education and Science, in
order to provide each primary and secondary school with the following within the Schools IT
2000 policy framework: a telephone line providing Internet access; an Internet service; a
ready-to-use multimedia computer connected to the Internet; free Internet dial-up access for
five hours a week. Furthermore, EIRCOM also supplied 30 education centers with an ISDN
connection and a network of 10 multimedia computers for teacher training. Moreover, in
1999, in order to offer educational services and materials for a variety of groups -including
students, parents and teachers- and to put them in contact with each other, the other major
agreement on development, maintenance and operation of the Scoilnet (the Irish version of
the European network called as European Schoolnet) network between Intel Company and
the Department of Education and Science was signed for at least three years. Additionally,
many partnerships between the private and public sector were formed under the School
Integration Project within the Schools IT 2000 project to develop models of best practice for
ICT applications, pedagogies, and resources and schemes for ICT use in teaching and
learning (Eurydice, 2001b).
In addition to the comprehensive initiative, Schools IT 2000, there are also ICT
related major initiatives at primary and secondary level that can be categorized under the
following three titles: (1) development of technological infrastructure; (2) development of
the professional skills of teachers; and (3) development of an infrastructure for guidance and
support (Eurydice, 2001b).
Firstly, it was aimed to increase the number of multimedia computers in primary and
secondary schools in the period of 1998-2003. Measures for promotion and implementation
were taken to finance the establishment of class computer networks, and to examine the
national infrastructure for extending Internet access and expanding facilities. Secondly, in
order to develop the ICT-related professional skills of primary and secondary school teachers
in the period 1998-2003, ICT training was designed, developed and implemented. Finally,
efforts were made to create an infrastructure for guidance and support that provides
curricular innovations to enhance the use of ICT in classroom; to set up national network to
advise and support schools with ICT related plans; to establish a national framework to
support multimedia products and tools tailored to the Irish curriculum; and to distribute
appropriate curricular resources in schools (Eurydice, 2001b).
As Chatrie and Wraight (2000) note, in 1997 the Information Society Steering
Committee published a report entitled “Information Society Ireland: Strategy for Action”. In
this report, there were strategies and measures concerning how ICT would transform the

102
economy and society. How this transformation could be realized is given in the following
objectives, strategies, and specific actions:
• ensure a strong and independent regulatory office for the telecommunications sector;
• provide Irish businesses and households with low cost access to broadband services including through the offering of a cable franchise in 1997;
• develop a centre of excellence for the creation, provision and export of content for the Information Society and encourage similar regional centres;
• develop Dublin as a flagship Irish "virtual city" providing citizens and visitors with on line access to information and services using ICT;
• establish a National Learning Initiative linked to two flagship projects: "Cyber-Schools" to link schools and libraries to the Internet with ISDN and "Knowledge Resource Centres'1 to facilitate the provision of information and introduction of ICT;
• create a legal framework for the Information Society including the amendment of intellectual property rights legislation and introduction of legislation on areas inadequately covered such as electronic commerce (Chatrie & Wraight, 2000, p. 140).
2.10.1.8 Italy
In Italy, ICT as a subject is normally given in technical and vocational schools, that
kept up with technological innovations from the 1960s to 2003. Computer Science was
introduced to technical schools in 1967 and the National Plan for Computer Science
introduced the teaching of computer science in mathematics and physics courses in
secondary schools in the 1980s. However, the introduction of computers to nursery schools
(preschools) and primary and lower secondary schools was varied, because of a limitation of
finances and dependency on local resources. There were several initiatives for this issue, but
the official action, the decision to introduce ICT in all schools, was realized by the
government of Italy in the mid-1990s. This large-scaled program went under the name of the
Program for the Development of Educational Technologies in 1997-2000. It was launched by
the Ministry of Education to promote the use of ICT throughout the whole Italian school
system. After piloting related initiatives in 1996, the program was affected with public funds
in 1997 and completed in 2000 (Melchiori & Picco, 2003).
Along with the Program for the Development of Educational Technologies, there
were various experimental and pilot projects, coordinated plans for teacher training and
practices requiring use of ICT; but between 2001 and 2003 the Ministry of Education,
University and Research strengthened this program. With release of the Education Reform
Act as a core element, access to ICT would be improved through installing a computerized
network infrastructure with broadband cabling and satellite reception equipment in schools.
This led to support for teaching Computer Science as a core element in the primary school

103
curriculum and for providing teachers with continuous ICT training (Melchiori & Picco,
2003; Empirica, 2006h).
In this sense, the ICT-related main strategies were set to: provide schools with
appropriate infrastructure; connect all schools to the Internet; establish networks and support
services; encourage development and use of educational software and multimedia; integrate
ICT into curricula as a compulsory subject for the first two years of secondary school and in
other subject areas at all levels; explain how ICT can be effectively integrated into each
discipline; and provide teachers with ICT related training (Eurydice, 2001).
The Ministry of Education is generally responsible of financing ICT training and the
provision of computer equipment for schools. However, regional and provincial authorities
are also responsible for the establishment of service, advisory or resource centers for the
benefit of schools. The schools or research bodies are sometimes given responsibility for
resources to carry out pilot projects (Eurydice, 2001b).
The Programme for the Development of Teaching Technology aimed to train
teachers, supply schools with multimedia equipment, connect schools to the Internet and set
up networks and services for transmission. This programme supported teachers and students
in primary and secondary education for the period of 1997-2000, through the Ministry,
schools, and private partners, including RAI (Radiotelevisione Italiana), computer equipment
suppliers and Internet providers. There were some measures to promote and implement this
programme: establishing multimedia premises or facilities for teachers; delivering
multimedia literacy courses; introducing and using all kinds of ICT; providing multimedia
work stations for groups or individuals; installing a link to the Intranet; connecting
computers to the Internet free of charge; and developing network services for students and
teachers (Eurydice, 2001b).
There was an important initiative, Progetto SeT (Project SeT), for students and
teachers in primary and lower-upper secondary education, to support the implementation of
the Italian Action Plan for Information Society for the period of 1999-2002. In this sense,
Project SeT helped schools in providing the right resources to improve their ICT related
tools and facilities, and thereby to organize their scientific and technological teaching. It also
helped in creating services, support tools, actions and training opportunities for teachers, and
in promoting specific technological and scientific organizations to provide ICT-related
support for schools (Eurydice, 2001b; Melchiori & Picco, 2003).
Similar to Project SeT, in 2000, there was another initiative, The Tools and Facilities
for Scientific and Technological Education, to support the implementation of the Italian
Action Plan for Information Society. This initiative was associated with Project SeT and

104
aimed to provide equipment and resources for scientific and technological education.
Therefore, it can be said that this initiative supported the Project SeT and produced ICT-
related tools and services for scientific and technological education, especially projects
carried out by the network of schools in cooperation with public agencies interested in
education and science. There were also some measures to promote and implement this
initiative: calls for project proposals, project appraisal by a special expert committee, and
distribution of funding-related activities (Eurydice, 2001b; Melchiori & Picco, 2003).
There were various ICT related initiatives in Italy, but the noteworthy ones can be
summarized as: (1) The 100 Projects whose aims were the same as those of the Tools and
Facilities for Scientific and Technological Education, but which was launched earlier and
focused on more than just scientific subject areas; (2) Scientific Literacy: this aimed to
arrange training and counseling for teachers, training activities for students and the
production of multimedia equipment for teachers in primary and lower secondary schools;
(3) The Center for Teacher Training: this aimed to utilize ICT in education for teachers; (4)
Multimedia in the Classroom: this aimed to give teachers and students involved multimedia
laboratories or networks experience with innovative hardware materials and new
technologies; (5) Technological Observatory: this aimed to inform teachers on how to
monitor and make available ICT-derived products (network, services, software and good
practice); (6) Catalogue of Software for Teaching Purposes: this aimed to collect, classify
and make available multimedia products for all levels of education; and (7) PCs for Students:
this initiative aimed to encourage families with young students enrolled in the first year of
upper secondary school to buy a personal computer conforming to the required quality,
safety and service standards, by making available interest-free loans, repayable over a two-
year period. Partners of this initiative were the presidency of the Council of Ministers and
the Italian banking association (Eurydice, 2001b; Melchiori & Picco, 2003).
In addition to these initiatives, there were projects that involved ICT use in the areas
of teaching, teacher training, technological innovation and research. LES is an example of
these, that covered the entire school system. It aimed to establish a national school network
supported by education researchers who were to produce, test and validate innovative ICT
related educational practices and materials for use in schools. Another example is LABTEC
for teachers and students in the first two years of upper secondary school. It aimed to
enhance experimental methodologies and practical activities through use of ICT and
therefore it encouraged the production of multimedia and online materials, training of online
tutors, online seminars and tutoring in schools and planning, and implementing and updating
websites (Eurydice, 2001b; Melchiori & Picco, 2003).
105
2.10.1.9 Portugal
Portugal since the mid-1990s has focused on issues relating to the notion of the
information society. Considering these issues led the government to develop policies and
programs to transform Portuguese society to a knowledge or information society. In order to
fulfill this, the national education authorities have implemented policies and programs across
different sectors of Portuguese society (Henriques, Ribeiro, Amaro & Ferreira, 2003).
ICT-related initiatives in education and a national action plan that aimed to increase
the introduction and use of ICT throughout society are under the responsibility of the
Ministry of Education. Parallel to this, there is a funding programme, Prodep 3, for the
development of education in Portugal, which has three strategies: (1) installation of school
computer facilities and networks, (2) development of multimedia educational content, and
(3) teacher training. In 2001, the National Lifelong Learning Strategy was formulated to
develop a national system for training and developing competencies in the use of ICT.
Furthermore, the Network of ICT Competency Centres, as a part of the Nónio Secule 21st
Century Programme (ICT Programme for Schools), played a noteworthy role in the
provision of pedagogical support for the integrated use of ICT in education (Eurydice,
2001b; Empirica, 2006i).
In general, the Ministry of Education is responsible for the whole education system
and for integration of ICT into school curricula, and the Ministry of Science and Technology
is in charge of connecting schools and other institutions (e.g. libraries) to the Internet.
However, the regional authorities are responsible for providing ICT facilities in schools,
which is executed by local authorities for primary schools. Provision of ICT facilities for
schools is realized within the Internet Portugal na Escola programme, conducted by the
Ministry of Science and Technology, and is planned to complete by 2001. The Ministry
encourages schools to act autonomously in deciding how they use their resources (Eurydice,
2001b).
There were some ICT-related initiatives in Portugal as well. The ICT Programme for
Schools aimed to provide multimedia computers for compulsory and secondary schools, to
train teachers to fully use and develop the equipment, to provide incentives for the
development of educational software, and to promote information exchange and
international cooperation (Henriques, Ribeiro, Amaro & Ferreira, 2003). The Prodep III
initiative, funded by the European Social Fund and the European Regional Development
Fund, began in 2000. It aimed to provide schools with computers in such a way that there
should be one computer for 20 students in primary schools, and one computer for 10 students
in secondary schools. By 2006, there should be one computer for 10 students in all schools.

106
It also aimed to give all teachers basic ICT skills before 2006 and to develop multimedia
educational content (Eurydice, 2001b; McCaffery, 2003).
The Internet initiative started in August 2000 and aimed at all students having access
to a computer by 2003, all citizens having Internet access; all teachers having a computer in
their homes before 2004, and providing fixed-rate broadband width connections (cable TV,
ADSL, UMTS). Another initiative related to the Internet connection of schools was the
Internet na Escola. This initiative covered secondary school levels, universities and
polytechnic institutes, municipal libraries and, particularly, primary schools, all of which
should be connected by the end of 2001. It aimed to extend the Internet connections through
the Ministry of Science and Technology (Eurydice, 2001b).
2.10.1.10 Sweden
After a change of government, the second national commission on IT in 1995
developed guidelines for a national action plan and its implementation. Three areas were
prioritized: (1) the legal system, (2) education, and (3) the provision of information to
society at large. One year later, a third IT commission advised the government on the
necessary legal changes to be implemented as a result of rapid developments in ICT. On the
basis of the fourth IT commission findings and advice, many public initiatives were launched
between 1996-1999. There were also initiatives related to the cultural sector and public
administrations in Sweden (McCaffery, 2003).
Sweden has two general aims related to ICT: (1) to enable all citizens to take an
active part in public debate and professional life through access to ICT and acquisition of the
skills needed to use ICT; and (2) to encourage use of ICT as an interactive learning tool to
enable all citizens to upgrade and extend their skills, given that lifelong learning is becoming
essential to overcome the rapid changes affecting society. More specifically, it aims to
enhance the educational potential and development prospects of schools through use of ICT
(Eurydice, 2001b).
Along with the Ministry of Education and Science, the development of an e-
community and some of its education related activities are under the responsibility of the
Ministry of Industry. Most of the municipalities introduce strategies designed to broaden
access to ICT. Central and local level administrative divisions work together flexibly in
terms of responsibilities. Considering the needs and characteristics of school students, each
school prepares a working programme, including its objectives, measures and activities at
school level. Municipalities also provide schools with ICT related equipment and facilities
for school activities (Eurydice, 2001b).

107
In this sense, the national programme for ICT in schools (the Nationellt program för
IT i skolan, ItiS) was launched in 1999 to support the development of ICT in compulsory and
upper secondary education. In this way, the government hopes enable to students to acquire
the same degree of proficiency in ICT, which can prepare students in post-compulsory
education for lifelong learning. Furthermore, use of ICT as a learning tool at all levels of
education was strategically adopted to teach use of ICT in a meaningful way, so that students
in compulsory and upper secondary education should be familiar with ICT, select different
sources of information, process information, create and manage data and evaluate the data.
Moreover, one of the aims was to develop positive attitudes toward aspects of ICT for
students in upper secondary education. In addition, financial investment in the integration of
ICT into the education system, including teacher training and tertiary education, helps the
development of ICT related courses (Eurydice, 2001b).
The National Programme for ICT in Schools (ItiS) was designed mainly for
compulsory and upper secondary education, but pre-primary education and municipal adult
education is also covered. This initiative was specifically aimed to develop ICT knowledge
and skills on the part of teachers and school heads, to provide teachers with training with
their own computers, to increase Internet access for schools and supply teachers and students
with their own e-mail address, to support the development of educational multimedia tools
for disadvantage students through funding, to develop the Schoolnet network at national and
European levels aforementioned, and to reward teachers who make an outstanding
contribution to the use of ICT in education (Eurydice, 2001b).
ItiS involves offering a skill development programme to teachers working in a team
and with students. It was the largest and most comprehensive national investment
programme implemented by the Swedish government between the years 1999-2002. Within
this programme, the 70,000 teachers’ competency in using ICT as a tool to support the
students’ learning was raised over a four-year period. The programme had a state grant for
infrastructure improvements, including Internet connections and e-mail access for all
teachers and students (Empirica, 2006j).
2.10.1.11 The United Kingdom
After the Superhighway Initiative involving 25 projects and around 1,000 schools in
1995, was launched, it was decided to start the British Governments National Grid for
Learning (NGfL) initiative for 1998-2002. This generally aims to provide high quality
educational software to teachers and students through public/private partnerships. More
specifically, it aimed to have 1 computer for every 5 students in secondary school, for every
108
8 in primary schools and for at least 75% of 14 year-old students to have ability to use the
Internet for studies and ICT. In 1998, the government declared an ICT-related policy and
covered the following ICT-related key area as complementary general objectives for
England, Wales and Northern Ireland: transforming education - using ICT in education in
such a way that all can acquire the knowledge and skills needs for the information age
(McCaffery, 2003; Eurydice, 2001b).
In 1998, the government issued the NGfL initiative to take forward and adopt the
following ICT-related targets for ICT in 1998-2002: connect all educational institutions,
libraries and community centers to the Grid, train teachers to feel confident and be
competent in teaching using ICT within the curriculum, and train librarians similarly, ensure
general administrative communications between education bodies and the government and
its agencies stop using paper-based work and make Great Britain a centre for excellence in
the development of networked software content and a world leader in the export of learning
services (Eurydice, 2001b).
In Scotland, ICT related general policies, objectives, aims and strategies were also
set by the government. Complementary general objectives focused on the issues of:
developing of the information society, supporting teaching-learning processes and increasing
educational levels, and preparing learners for a society based on lifelong learning. More
specifically, it aimed to equip students with experience and skills in ICT appropriate to help
them work universally and to enable researchers to pursue their activities on a world-wide
basis. In addition to these, there were strategies related to ICT. Firstly, in-service teacher
training on using ICT in teaching started in 1999 and was forwarded to training institutes in
order to be completed in 2002, which was adopted by the Scottish Further Education
Funding Council. Secondly, provision of facilities and Internet connections to schools and
development of multimedia services and resources focused on connecting primary,
secondary, higher institutions and community centers to the Internet and on making students
and teachers use their own electronic addresses. Finally, training students in better ICT skills
as determined by the Higher Still Core Skills framework would be realized before the 2002
(Eurydice, 2001b).
Although several departments have authority and responsibility for devolving ICT-
related resources to schools, the British Educational Communications & Technology Agency
(BECTA) is responsible for supporting government and national agencies in the use and
development of ICT to raise standards in education. The New Opportunities Fund is
responsible for distributing grants for health, education and environment initiatives as
determined by the government. Local Education Authorities in England and Wales are in

109
charge of distributing additional funds to schools and supporting them with their own ICT
development plans. In Northern Ireland, the Education Technology Strategic Management
Group has overall responsibility for education technology strategy. Schools are in charge of
developing their own ICT plans and budgeting for their implementation. In Scotland,
Learning and Teaching Scotland is responsible for ICT courses and applications in education
and for supplying a wide range of innovative products and services. Local authorities and
schools in Scotland are responsible for purchasing and maintenance of software and
hardware (Eurydice, 2001b).
The aforementioned NGfL is a major initiative related to ICT in the UK. It can also
be defined as an educational portal or gateway and a programme for providing educational
institutions with appropriate infrastructure. Local authorities, BECTA, schools and private
sectors are common partners of this initiative for all learners, and lifelong learning services
at all levels of education. This initiative has three aims: (1) deliver high quality educational
software and services to teachers and students; (2) to remove barriers to learning in order to
ensure quality of access for all, and (3) to provide information and learning resources for
teachers to improve their ICT skills. In Scotland, this initiative is used to modernize schools
in terms of computer facilities, networks and connections to the Internet and use of ICT as a
resource for teaching and learning (Eurydice, 2001b; McCaffery, 2003).
In England, Wales, and Northern Ireland, New Opportunities Fund Training is an
initiative supporting the NGfL initiative. It aimed to train teachers and librarians to use ICT
effectively in meeting their teaching needs by 2003. This led newly qualified teachers to
reach the level of expertise for mandatory standards in ICT in England and Wales. This
initiative focused on teachers and school librarians at primary and secondary levels. In
Scotland, it also aimed to train all in-service teachers and school librarians to use ICT
effectively for the period of 1999-2002 (Eurydice, 2001b).
In 2000, BECTA and independent suppliers launched other initiatives, being the
Computers for Teachers, Fast-track programmes (in England and Wales) and Laptops for
head-teachers (in Wales) programmes to raise teachers’ confidence and competence in ICT
by enabling them to have personal access to a computer. In these programmes, teachers in
Computers for Teachers supported 50% of the purchase price of a laptop or desktop
computer and school head-teachers in Laptops for head-teachers were supplied with laptops
(Eurydice, 2001b).
City Learning Centers were launched as part of Excellence in Cities in England. It
was conducted by Local Education Authorities and schools for the 2001-2002 period to
improve the education of city children through using ICT to deliver extended educational
110
opportunities to schools, students and adults in determined areas of major cities. Through
this initiative, students and adults can improve their education technology knowledge and
skills; thereby the attainment levels of students are increased. Research and Development
was an initiative in Scotland. It aimed to develop new ICT-linked educational content and
services for the Internet for primary and secondary education (Eurydice, 2001b).
The ICT for Learning Strategy was another initiative in Wales. It was interested in
the provision for use, both within and outside school, to provide the foundation for the
development of lifelong learning across the Wales. It generally aimed to make ICT more
available to disadvantaged areas, improve ICT skills, and raise standards of attainment in
schools. Local Education Authorities and schools were partners of this initiative for all
learners, particularly for the socially disadvantaged (McCaffery, 2003; Eurydice, 2001b).
The education Technology Strategy in Northern Ireland was started by the
Department of Education Northern Ireland in 1997 to provide all schools with the necessary
infrastructure of equipment and online services to be in the information society. More
specifically, it aimed to provide teachers with training on competency in ICT use and its
facilities, to integrate ICT into both teaching and learning, to provide schools with
curriculum content, professional support and guidance on effective use of ICT in teaching
and learning, and in school administration and management (McCaffery, 2003; Eurydice,
2001b).
The new Labor government promised to modernize the country with new strategies
for the information age in 1997. Then, the Information Society Initiative Programme was
launched and ran until 2000. Within this initiative there many initiatives were conducted. In
the early 2000s, it was declared that all government services would be online and the Internet
would be provided to all who wanted it by 2005. Later on, the Digital Scotland Initiative, the
Wales Information Society Initiative and the Northern Ireland Information Age Initiative
were indicators of how devolved administrations were developing the information age
programmes at a regional level (McCaffery, 2003).
2.10.2 ICT-in-Education in the New EU Member Group
2.10.2.1 The Czech Republic
In 2000, the government approved the ICT-related national policy that aimed to
ensure that through integrating ICT into the education system, all pedagogical staff, students
and citizens would acquire a certain level of access to mastery of ICT. This helps in
developing a real information society. In order to realize this, the following strategic and
specific objectives were settled: to provide an ICT coordinator in each school to help

111
teachers and students in using ICT as resource for teaching and learning, to enable students,
teachers and librarians in basic and upper secondary education to demonstrate some mastery
in working with ICT, to enable upper secondary schools and libraries to become information
centers with ICT facilities for citizens considering lifelong learning before 2005, to train
75% of civil servants and teachers in upper secondary education to use ICT as a teaching
resource by 2006, and to enable all schools and libraries to have Internet connections in a
national information infrastructure (Empirica, 2006l; Eurydice, 2001b; Kramplova, 2003).
The process of implement of the national ICT policy depended on the following
timeline: the first step (2000-2001) included training teachers and librarians and providing
schools and other organizations with ICT equipment; the second step (2002) required
assessing a situation in terms of what had been done up to 2002 in implementing ICT policy,
and making an inventory of ICT equipment already present in educational institutions. In this
way, a roadmap can be drawn to update ICT policy operationally and to update its
implementation for the following years; the third step (2003) was to finish the process of
providing schools and libraries with ICT facilities and to ensure that teachers, librarians and
public servants could be ICT literate; a fourth step (2004) was also required to evaluate what
had been achieved in terms of implementing ICT policy since most of the students could
have been students of schools and be ICT literate; and the fifth step (2005) was to equip
nursery schools with ICT. By that year it was expected that the active population of the
Czech Republic would have reached a basic ICT literacy level (Kramplova, 2003).
The national ICT policy of the Czech Republic covered equipping schools with ICT
facilities, connecting schools to the Internet and using these facilities. For this, the following
time schedule was also set to implement ICT policy: every basic and upper secondary school
would be equipped with at least one multimedia computer connected to the Internet as of
2002; at least one computer with Internet would be accessible for all teachers in each school
by the end of 2003, every larger basic and upper secondary school would have one special
room with a minimum of 8 multimedia computers connected to the intranet, every teacher in
these schools would have individual access to the Internet, each of these schools would have
its own website designed and maintained by its students and students in upper secondary
schools would have their own individual e-mail addresses by 2004, and school
administration issues would be conducted electronically and ICT would be fully integrated
into the management process of every school in 2005 (Kramplova, 2003).
The Ministry of Education is basically responsible for funding training programmes,
purchasing and maintaining hardware and basic software for all levels of education, and
equipping ICT facilities. The regional and local authorities are also partly responsible for
112
these funding issues, especially for specialised software and for initiatives in school
management. Schools are in charge of their own educational content and the teaching
methods used. There is a public/private partnership in supplying schools with ICT equipment
and services (Eurydice, 2001b).
In order to realize these ICT related policies, the Ministry of Education and other
private organizations started a set of initiatives. For the period 2001/05, the following major
initiatives were started: Information Literacy was started by the Coordination Centre of the
Ministry of Education and the Czech Information Society to train teachers, documentary
research librarians, ICT coordinators and citizens for ICT use; Educational Software and
Information Sources was launched by the Coordination Centre of the Ministry of Education
and an expert council to integrate ICT into teaching and school activity and the
establishment of an educational gateway, pilot projects and on-line distance education were
taken and conducted as measures for the promotion and implementation of this initiative;
Infrastructure was also started to provide schools with ICT and teachers and students with
access the ICT-related services by the Coordination Centre of the Ministry of Education, the
general contractor and the general auditor (Eurydice, 2001b).
2.10.2.2 Hungary
In the early 1980s, there was a government programme requiring all secondary
schools to have computer in Hungary. Later on, the National Information Strategy developed
in 1995 attached an important role to the implementation of ICT in education. The Sulinet
(School-Net) programme was designed as a large-scale information technology development
programme by the Ministry of Education in 1996. As a result of this programme, all
secondary schools with dormitories and some 250 primary schools had full and free access to
the Internet for a 5 year period. Furthermore, these schools also had a computer room with 7
to 16 multimedia computers including necessary software. Moreover, every secondary
school with dormitories and 25% of primary schools had IT rooms (aggregately 4,000) with
access to the WWW. This programme was financed by central and local authorities (Aux-
Banfi & Körös-Mikis, 2003).
The School-Net programme also aimed to help local systems integrate into a wider
educational network, which facilitates access to educational services and documents, and
ICT-based teaching materials for various curriculum subjects. This required content
digitalization and management for teachers and students. Consequently, in 1997, Digital
Lessons (a basic multimedia package in the form of teaching materials on CD-ROM) and
Homework (promoting individual learning in the Hungarian language) were created through

113
offering tenders to develop the School-Net programme and better utilization school
laboratories. Digital Lessons and Homework related to subjects in the national core
curriculum were free to schools and available as CD-ROMs or on the Internet in 1998. They
provided digital reusable teaching materials that could be used for either individual learning
or cooperative learning in groups. In this sense, this was the first step to a digital paradigm
shift in education (Aux-Banfi & Körös-Mikis, 2003; Empirica, 2006m).
After 1998, with a new government, the trend shifted from developing infrastructure
in schools to effective application of ICT, developing network services and supporting in-
service teacher training programmes. The School-Net programme was continued, but its
name and focus were changed respectively as Iris-Sulinet and the elaboration of content
elements of services and further development of the public education information system.
More specifically, ICT development in public services (hospitals, community houses and
mobile education centers) also enables citizens, teachers and students to utilize them (Aux-
Banfi & Körös-Mikis, 2003).
Ninety-seven percent of primary and secondary schools, and pedagogical institutions
were integrated into the Iris-Sulinet network hierarchically. The Ministry of Education was
responsible for the monitoring working and utilization ratio of the network, and thereby
suggestions could be made for further developments. Maintaining and repairing this network
system was guaranteed to be free of charge for three years by the supplier company. With
this networking action, The Iris-Sulinet portal was created in 1999 to provide teachers and
students with a variety of educational services related to information on in-service training,
reference materials for teaching-learning activities, electronic references, and educational
reference databases (Aux-Banfi & Körös-Mikis, 2003).
With the coming of the new millennium, the hot topic in Hungary was the
information society as it was in the entire world. Therefore, the information society and its
requirements were put on the educational agenda. As part of this, some aims and strategies
on the ICT were determined by the Hungarian policy-makers and curriculum developers.
They have focused generally on the following issues: improving education at all levels,
improving ICT skills required for information society, supporting teachers with in-service
training, providing schools with ICT equipment (network, Internet and digital content),
providing opportunities through ICT to share international knowledge and experience and
national cultural and scientific capital, enabling students to realize the importance of ICT in
society, and having students regularly use ICT knowledge and skills (Aux-Banfi & Körös-
Mikis, 2003; Eurydice, 2001b).
114
The Ministry of Education is responsible for determining strategies, action
programmes and all funding issues related to the ICT-related initiatives, but local authorities
are responsible for providing schools with hardware, equipment and the materials allocated
to them. The Public Foundation for Schools Education also provides schools with ICT
facilities at a regional level. Educational software can generally be provided through the Iris-
Sulinet programme and its website, and schools can purchase their own chosen software. In-
service teacher training is financed by the government (80%), and the remaining part (20%)
is financed by schools, individual teachers chosen by schools or other sponsors. There was
no major partnership among public and private organization until 2001 (Eurydice, 2001b).
Similar to other countries, there were various ICT-related initiatives. The major ones
can be summarized as: Equipment, Methods and Educational Content aimed to improve
computer facilities and the quality of methods and educational content in single structure
primary schools and general secondary schools, training in ICT aimed to organize ICT
training courses within higher education institutions for teachers, prospective teachers and
students expecting to undertake more specialised training in ICT, a Research and
Development initiative that aimed to increase research and development, and thereby
circulation and exploitation of its results; Supporting Bodies aimed to ensure maintenance of
systems through establishment of a Systems Operator Service and ICT-based Pedagogy
Counseling Service; International Involvement that aimed to increase international
professional relations participation in the European Schoolnet network, and Development of
e-Learning Materials that aimed to improve the quality of open and distance learning courses
through using digital teaching materials for higher education, vocational training, adult
education, and in-company training (Eurydice, 2001b).
2.10.2.3 Latvia
As of 2001, the general aim of policy-makers in Latvia was to develop a sound high
quality education system, and thereby the cultural heritage and well-being of the country
would be supported. Within this general aim, it was the specific aim to train qualified
specialists in computer programming and ICT so as to develop a major economic sector to
increase exportation. In this sense, the main strategies aimed to computerize the education
system and train specialists in ICT-related fields through taking several measures. In the
computerization of the education system, students and teachers would be prepared to live
and work in the information society, the process of learning would be modernized to be more
effective, and all education institutions would be networked through the initiative of the
Latvian Education Informatization System (LIIS) started in 1997 (Eurydice, 2001b).
115
Responsibilities among the central, regional and local level authorities were shared
at a central level. The General Education Department of the Ministry of Education and
Science was in charge of specifying the guidelines for educational content and the
government was responsible for financing LIIS. The Ministry of Education and Science, the
University of Latvia, the local authorities and the schools were responsible for project
implementation and they were also supposed to determine the number of teachers who would
receive in-service teacher training administered by LIIS regional centers. The LIIS project
monitoring committee was responsible for evaluating the resources allocated for regions.
Additionally, the Ministry of Transport was responsible for the informatics national
programme and the Ministry for Economic Affairs administered eLatvia programme. There
were no major partnerships between public and private organizations until 2001 (Eurydice,
2001b).
In Latvia, there were ICT-related initiatives. The Latvian Education Informatization
System (LIIS) was one of the major initiatives. The LIIS project is one of the main priorities
of the Latvia Informatics programme for an information society. It aimed to integrate ICT
into teaching in such a way that computers would support, but not replace teachers; teachers
and students would be active participants, but not passive consumers, and computerization
would provide equal opportunities for the development of everyone. Furthermore, Latvia
also aimed to train all teachers (over 40,000), through LIIS, to use ICT in their teaching for
lifelong learning. Moreover, ICT was introduced into management and information services.
All these projects were started by the Ministry of Education and Science, the University of
Latvia, local authorities and schools, in 1997. In order to realize this initiative, the following
ICT-related measures were taken for promotion and implementation: development of
software for students and the introduction of ICT in the learning process (Eurydice, 2001b).
eLatvia was the major initiative that aimed to provide all citizens with secure access
to information and fundamental knowledge, and to help them utilize these in their daily lives
through the acquisition of basic knowledge skills related to ICT. In this way, eLatvia would
lead to improvement in the country’s effectiveness and competitiveness on the world market
(e-commerce) and in terms of social well-being (e-government) by 2004. The following
measures were taken to reach the determined aims: speeding up the computerization of
schools through supporting computer-assisted learning and teacher training, connecting all
schools to the Internet and exploiting resource this; transforming libraries into information
centers in all fields, and introducing the European Computer Driving License (Eurydice,
2001b).

116
2.10.2.4 Poland
In Poland, the education system at all levels and sectors was reformed at the end of
the 1990s. This reform tried to support modernization and development of the information
society. As such, it was intended to enable students to use new technologies for learning,
researching and problem solving. Furthermore, prospective and in-service teachers would be
trained to adopt ICT both as a subject to be taught and as a resource to be used in the
teaching of other subjects. Some main strategies were also settled: to introduce new common
and detailed curricula, prepare school textbooks with multimedia attachments, launch the
initiative of Interkl@sa to develop the information society in 1999, introduce ICT into
schools, and prepare a White Paper for the development of the information society in Poland
for the years 2001-2006 – ePolska (Eurydice, 2001b).
The Ministry of Education was responsible for specifying the common curriculum,
school textbooks and other teaching materials for financing software and for hardware. Local
authorities were also responsible for financing the purchase and maintenance of hardware
and software. Schools were in charge of preparing their detailed curricula, selecting their
teaching methods and covering Internet and other expenditure like paper and ink for
printouts etc. (Eurydice, 2001b).
There were partnerships among the private and public sectors. INTEL and Microsoft
included the project “Teach to the Future” for training 100 trainers and 400 teachers (each
would be responsible for training 20 teachers) to use ICT in various school subjects. CISCO
worked together with local authorities on the CISCO Networking Academy project for
training Internet and intranet specialists and technicians. The Ministry of Education and the
Polish telecommunications company (TP SA) reached an agreement to offer free Internet
access to all levels of education in schools for a determined period of time (Eurydice,
2001b).
In Poland, there were also major ICT-related initiatives. In 1998, an Internet
laboratory initiative aimed to provide 2,500 primary and lower secondary schools with IT
rooms including 10 computers with Internet access and general and educational software, at
local authority level. Furthermore, 7,000 teachers were trained in a 40 hours training
programme within this initiative. Furthermore, in 1999-2000, an initiative providing one
Internet laboratory in each gymnasium provided 3,300 lower secondary schools with IT
rooms that had the same specifications as the Internet laboratory initiative mentioned above.
Moreover, in the years ahead, this initiative was to be continued with appropriate facilities
for primary and upper secondary schools. The other initiative, the Interkl@sa, has been
conducted by parliamentary committees for education, and for science youth, the Ministry of

117
Education, local authorities, NGOs and private and media companies since 1999. It aimed to
increase ICT use at all school levels, to diminish the digital divide and to involve students
and teachers in the information society (Eurydice, 2001b).
2.10.2.5 The Slovak Republic
In the Slovak Republic, computer systems, programming and algorithm processing
as separate subjects were introduced and taught in selected upper secondary schools until
1986. Informatics and computer technology began to be taught as independent subjects in all
upper secondary schools within the national project on the “electronization” of schools in
1986. Within this project, selected schools were equipped with computers and informatics
was taught as a course. Its content covered the essentials of programming and algorithm
processing in Basic and Pascal. In this sense, mathematics teachers were trained in computer
skills and programming in Basic. Actually, the training of informatics teachers had already
started in 1984 and they graduated from the Faculty of Mathematics and Physics, Comenius
University in Bratislava, in 1989. The Slovak Republic developed its own computers which
replaced the ones in secondary schools in 1988. This process then directed the teaching of
ICT to application programs, such as word-processing and spreadsheets, and gave less
importance to programming (Blahova, 2003).
After 1989, the Slovak Republic opened its doors to the world market; thereby many
computers were imported from abroad. At that time, both the government and the Ministry
of Education did not have any idea of an official information technology program. Schools
had a limited budget to purchase computers. Therefore, computers and their peripherals were
received by schools as grants or from sponsors. Schools in the Slovak Republic were allowed
to use multi-license Comenius Logo for Windows free of charge in 1993. They frequently
used Comenius Logo until 2000. The Ministry of Education and Microsoft (which supplies
schools with the Microsoft Windows operating system and with Microsoft Office) reached
an agreement for Slovakian schools to obtain licenses in 2000. In 2002, the new object-
oriented programming language “Imagine” was developed and distributed to 500 schools in
the Slovak Republic within the project of “Infovek” (Blahova, 2003).
ICT was not integrated into the primary school curriculum, but a computer-based
unit was offered as part of technical education for the second stage of primary schools
(grades 5 to 9). Primary schools providing education by means of computers were gradually
increasing in terms of extended lessons or optional subjects, but these lessons included only
computer basics and playing games for common schools, or a programming at schools
oriented to mathematics and programming. Since ICT was not a compulsory subject and the

118
Ministry did not help schools financially, those primary schools that wanted to use ICT in
their teaching had difficulty in finding money to purchase computers and related equipment
(Blahova, 2003).
On the other hand, informatics as an independent subject was taught in high schools,
and other related subjects were also taught as optional subjects. All schools had one or two
IT rooms (mostly connected to local area networks) only for teaching informatics. From
1997 on, The objective of the secondary school curriculum focused not on only acquiring
skills for operating a personal computer and using word-processing and spreadsheet
applications, but also on teaching the essentials of the science of information processing,
strategies for gathering, manipulating and presenting information, working with ICT and
applying ICT and developing algorithmic thinking (Blahova, 2003, p. 520).
The basic aims were to enable students in primary (second stage) and secondary
schools to use computers and the Internet and appropriate software. In other words, ICT
knowledge and skills would be given to students in education. In this sense, the following
strategies were determined: projects would be financed and established by the Ministry of
Education, computer networks between higher education institutions and the universities
would be developed (SANET project), primary and secondary schools would be provided
with computer facilities and the Internet (Infovek project), primary and secondary school-
teachers would be provided with training (Infovek project), school projects would be
financed (Infovek project), and a national and international exchange of information and
experience would be provided (Infovek project) (Eurydice, 2001b).
The Ministry of Education and regional authorities were responsible for integrating
ICT into schools through pilot projects (e.g. Infovek). Some primary and all secondary
schools had autonomy to purchase hardware, software, and laboratory equipment with
appropriate maintenance. Public/private partnerships were developed by Infovek and EUNIS
(the civic association comprising higher education institutions and other members) – those
were known as SK projects. Telenor Slovakia and Nextra were the private donors and they
supported the Infovek project especially with equipment. Microsoft and CISCO were also
partners of the EUNIS-SK project (Eurydice, 2001b).
The Internet and Secondary Schools project helped schools in connecting to the
Internet for the period 1996-2000. Within this project, certain schools were selected and
provided with a server. The Internet fees for these schools were met, and teachers in these
schools were trained in using Internet applications for various subjects. The first website for
teachers was developed in 1996/99 and then a new program, a distance education initiative
using Internet, was launched in 1999 (Blahova, 2003).

119
Similar to other countries, there were various initiatives related to ICT. The Slovak
Academic Network (SANET) was among the major ones. SANET aimed to establish an
Internet computer network including primary and secondary schools, higher education
institutions and the universities. It also took part in a European project, the Gigabyte
European Academic NeTwork (GEANT) that was launched by the European Commission in
2000 to link up previously existing national education and research networks. SANET was
administered by the Minister of Education and the EU from 1991 to 2001 (Eurydice, 2001b).
The aforementioned project of Infovek aimed to integrate ICT into the teaching and
learning environment in primary and secondary schools through connecting them to the
Internet before the end of 2002, and to train their all teachers and students to master basic
computer skills before the end of 2003. It also intended to develop sound educational ICT-
related content and to enable teachers to integrate ICT in every subject. In 1998, it was
officially launched by a non-governmental and non-profit-making civic association, the
Ministry of Culture and private donors (Eurydice, 2001b; Blahova, 2003).
2.11 Summary of the Literature Review
2.11.1 ICT-in-Education Policies and Implementations in Turkey
ICT related initiatives and projects in education: ICT investments started in
secondary schools in 1984. These investments continued, especially in upper secondary
schools, in the years 1984-1991. Attempts to develop instructional software for CAI in
collaboration with MONE, the private sector and universities were seen in 1988-1991. In the
late 1980s and early 1990s, a few in-service training activities were also held on basic
computer skills for teachers, with the support of universities. In the 1990s, within the
framework of the National Education Development project, 53 CES and 182 CLS projects
were started in selected secondary and basic education schools (in 1993 and 1996,
respectively). The main aim of these two projects was to investigate ways to integrate
computers into the Turkish education system.
With the Education Master Plan 1996-2011 formed on the basis of policy
recommendations from the Seventh 5th Year Development Plan and the 15th National
Education Council, Project 2000 for Keeping Pace with the Age in Education was launched
as a short-term project. Afterwards, in 1997, compulsory education was expanded from five
to eight years. The long-term plan, as a strategy of the master plan, BEP was initiated in
1998. It was one of the largest education projects in the world in terms of its scope, the
affected population, and budget. The main purpose of this project was to generalize basic
education throughout Turkey, to enhance the quality of basic education and to convert

120
schools into community learning centers. One of BEP objectives was directly related to ICT:
generalizing the use of computer technologies in education through establishing IT rooms in
every basic education school. The government had a loan of 300 million dollars from the
World Bank for the first phase of this project that was implemented in 1998-2003, and an
additional 300 million dollar for the second phase in 2002-2007. Since the government in
Turkey and project leaders in the World Bank changed, the second phase of BEP actually
started in 2005. The main aims and objectives of BEP were kept for the second phase.
Additionally, it was planned to improve pre-primary school education and special education
in the second phase.
It could be concluded that hardware investments were more dominant in the ICT
integration process up to 2003. These investments for basic education schools were actually
made in 1998-2000 within BEP I (3,188 IT rooms in 2,802 primary schools). However, the
Internet connections at schools were limited and slow (Akbaba-Altun, 2006; TBŞ, 2002)
until December 2003. Nevertheless, with MONE ADSL Connection Project, schools started
to access the Internet with broadband. After the PISA 2003 data collection, the E-learning -
Education Portal, Education for the Future, and the Campaign for Supporting Computer
Aided Education Project were other major projects and initiatives concerning ICT integration
into primary and secondary education.
ICT in the Primary and Secondary School Curriculum: There was no formal
computer education curriculum for basic education until 1998. Computer education started
from the 4th grade, with the curriculum being accepted in 1998. This development could be
attributed to ICT objectives in BEP I. As of 2005, students in the first three grades were
allowed to take optional computer courses, as well. With the 2004 curriculum reform, this
curriculum was cancelled and a new curriculum for 1st - 8th grades was accepted in 2006. The
new curriculum is more student-centered compared to the previous one. When integration of
ICT into other subjects is considered, there is little evidence of an effort for curriculum
change in basic education (Göktaş, 2003). For this aim, hardware and in-service training
have been provided within BEP I, but only one optional computer course has been added to
the basic education curriculum. In fact, the curriculum reform that started in 2004 is the first
apparent curricular evidence of efforts to integrate ICT into all primary and secondary school
curricula. As to upper secondary education, optional courses named Computer 1-2 and
Information Technology 1-2 were added to the curriculum, but they are still optional.
Furthermore, computer courses could be offered in schools with IT rooms and computer
teachers.
121
2.11.2 Issues and Suggestions about Integration of ICT into Education in Turkey
The major issues concerning the ICT-in-education policy and implementations in
Turkey that have emerged in studies could be summarized as follow:
• The Turkish education system serves a considerably large number of students
(Yıldırım, 2006; Göktaş, 2003).
• Students are at a low readiness level for ICT integration (Reynolds, Treharne &
Tripp, 2003; Aydın & McIsaac, 2004).
• There is a lack of communication and cooperative work on ICT integration in
MONE (Özar, 1996).
• There is higher emphasis on hardware investments (Özar, 1996; Bhullar, 2005).
• There is inadequate and/or low quality in-service training on ICT integration into
the curriculum (Çağıltay et al., 2001; Akbaba-Altun, 2006; Aşkar, Usluel &
Mumcu, 2006; Yıldırım, 2007).
• There is a lack of appropriate supervision of IT rooms and ICT integration
(Akbaba-Altun, 2006).
• There is a lack of leadership in schools (Yıldırım, 2007; Akbaba-Altun, 2006).
• There are an inadequate number of computers, Internet connections are slow and
there are maintenance problems at schools (Yıldırım, 2006; Akbaba-Altun,
2006; TBŞ, 2002; Çağıltay et al., 2001; Akkoyunlu, 1995).
• The curriculum structure is inconvenient for integration of computers (Çağıltay et
al., 2001; Yıldırım, 2007; Göktaş, 2003; World Bank, 2004)
• There is a problem with poor software quality or inappropriate software for the
curriculum and local needs (Aydın & McIsaac, 2004; Akbaba-Altun, 2006;
Akkoyunlu, 1995).
Suggestions for remedy these issues and others in the literature regarding ICT-in-
education policy and implementations in Turkey can be listed as:
• Provide strong leadership (Yıldırım, 2007; Akbaba-Altun, 2006; Bhullar, 2005).
• Reform or revise the curriculum (Özar, 1996; Akkoyunlu, 1992).
• Find school based solutions to problems (Özar, 1996; Bhullar, 2005; Aşkar, Usluel
& Mumcu, 2006).
• Provide a more effective in-service training system (Yıldırım, 2007; Aşkar, Usluel
& Mumcu, 2006; Akbaba-Altun, 2006; Göktaş, 2003; Çağıltay et al., 2001;
Addo, 2001).

122
• There is a necessity for collaborative work between MONE the universities and the
private sector (Özar, 1996; Yıldırım, 2006).
• Needs analysis to identify local needs should be conducted before purchasing or
developing software (Özar, 1996; Aydın & McIsaac, 2004; Akbaba-Altun, 2006;
Addo, 2001).
• Avoid focusing largely on pedagogical and organizational issues rather than on
technological ones with a holistic approach in ICT-in-education policies and
implementations (Bhullar, 2005).
2.11.3 ICT and Attainment
The influence of access to computers at home and school on student achievement has
become a significant research realm as computerization increases in these places. The
literature indicates that there is a positive relationship between access to computers and
student achievement (OECD, 2006c; Fusch & Woessmann, 2004; Sweet & Meates, 2004).
However, when the family background characteristics of students are taken into
consideration, this relationship becomes negative (Fusch & Woessmann, 2004) or
insignificant (Wittwer & Senkbeil, 2008). Moreover, the results remain the same regardless
of how often students use computers at home (Wittwer & Senkbeil, 2008). This means,
holding family background characteristics constant, that students perform significantly worse
when they have computer access at home. Non-educational use of computers or ineffective
ways of using computers for learning may lead to home computers negatively affecting
student learning. In brief, students’ access to a computer may not be linked to their
performance in mathematics. Only some conditional positive relationships between
computer access at home and student achievement are detected, if computers are used for
education and communication purposes (Fusch & Woessmann, 2004) and for problem-
solving activities in a self-determined way (Wittwer & Senkbeil, 2008). Similarly, when
school characteristics are taken into consideration, the relationship between access to
computers at school and achievement becomes insignificant (Fusch & Woessmann, 2004).
Still, a conditional relationship exists at school: computer use is associated with student
achievement only at medium level frequency, not at the least or most frequencies (Fusch &
Woessmann, 2004; Aşkar & Olkun, 2005).
Inequality in access to ICT resources at home is larger than at school, between high
and low achievers regardless of the level of prosperity of a country (Sweet & Meates, 2004).
The same trend is also detected in the PISA 2003 data (OECD, 2006c). In this sense, schools
123
should have a mission to provide low achievers (who have less ICT resources at home) with
ICT resources (Sweet & Meates, 2004).
There are some patterns of computer use peculiar to low and high achievers (Sweet
& Meates, 2004). Low achievers tend to use computers more frequently for programming,
computer games, drawing for graphics and using spreadsheets in general. Contrary to this,
high achievers use Internet and word processing more frequently.
There are various studies on students’ attainment and ICT use in learning. These
studies yield contradictory results. Thus, the literature about the effects of ICT on
achievement is still inconclusive and leads to merely tentative conclusions (Kulik, 2003).
Kulik’s (2003) meta-analysis of seven studies concludes that ICT often considerably
enhances student achievement in mathematics. Indeed, schools have become more successful
in utilizing instructional technology in teaching and learning in the 1990s, compared to
earlier years, due to advancements in technology and the greater familiarization with
technology of both teachers and students (Kulik, 2003). On the other hand, Balanskat,
Blamire and Kefala (2006) contend that ICT does not improve the mathematics performance
of students aged 7-16, while it is effective on English, Science, and Design and Technology
courses. They emphasize the importance of the arrangements of ICT facilities at school as
productive and supportive for student learning. ICT is considered to be a contributor to
student achievement by students, teachers, and parents (Balanskat, Blamire & Kefala, 2006).
As to use of ICT in math courses, it was rare in 8th grade classes between the years of
1995-1999 (Pelgrum & Plomp, 2002). Moreover, students who reported more frequent
computer use in their math courses had lower math scores than students who did not report
any computer use in their math courses (Pelgrum & Plomp, 2002). According to Pelgrum
and Plomp, this result may stem from two reasons. First, the most common use of computers
in math courses is for drill and practice for lower ability students. Sweet and Meates (2004)
also stated that low achievers tend to use educational software more than high achievers do.
Second, students who use computers frequently in math courses engage in more student-
centered instruction compared to those who do not use computers in math courses. Most
probably, student-centered instruction does not focus on the competencies measured in
TIMSS (Pelgrum & Plomp, 2002). Thus, these students may become low achievers,
according to the results of these tests.
2.11.4 Comparison of Turkey and the EU in ICT Integration into K-12 Schools
Overall computer access at home, school and other places: Access to computers
at school is most common in both EU groups and their rates are also close to each other.

124
However, the second common form of access in the EU member group is at home, while it is
at other places in the new EU member group. Although there was a gap between the rates of
computer access at home between both EU groups in 2000, this gap was closing in 2003.
The country groups could be compared on the basis of PISA 2003 data for overall computer
access. On the contrary, the most common form of access is not at school, but at other places
(73%) for Turkish students. The second most common form of access in Turkey is school.
However, the rate of this access is 54% for Turkey, while it is 95% for the EU member
group and 91% for the new EU member group. Similarly, the rate of access to computers at
home is very low in Turkey, at 37%. This rate is almost two times larger in the new EU
member group (70%) and two and half times larger in the EU member group (90%).
Nevertheless, it should be noted that the rate of computer access in other places is relatively
similar in all country groups, but even this rate is lower in Turkey than in both EU groups.
Under these conditions, Turkish students are in a disadvantaged position in terms of access
to computers, particularly at home and at school.
Integration of ICT into Primary and Secondary Education in Turkey and the
EU: Developed countries have invested in technology for educational settings since the early
1980s. According to the Eurydice report on the integration of ICT into education, ICT
investments have been seen in K-12 schools in almost all EU countries, through nationwide
ICT projects beginning around the mid 1990s (Eurydice, 2001a).
Every European country has a policy document in the form of a law, decree,
curricular recommendation, and/or action plan for the use of ICT in primary and/or
secondary education. Parallel to these developments, it is seen that the number of students
per computer is between 5 and 20 in most European countries according to PISA 2000 data
(Eurydice, 2004). This ratio is 22.9 on average, even in the new EU member group. In 2001,
this number was 37 students per computer in upper secondary schools in Turkey (TBŞ,
2002). Computerization of schools in Turkey is relatively low when compared with the new
EU member group, and considerably lower than the EU member group. It is clear that the
EU member group makes more ICT related investments in K-12 schools than Turkey.
As to in-service training, percentages of primary and secondary school teachers who
had received official training in the use of computers and/or the Internet in their teaching are
62% and 50% respectively in the EU member group in 2001 (Eurydice, 2001b). On the other
hand, in Turkey teachers who have participated in-service training are not satisfied with the
quality of in-service training activities for teaching with technology, due to these activities
not being offered in local settings, not addressing real needs and not being ongoing and not
being on time (Yıldırım, 2007).

125
In the EU member group, in line with ICT investments and in-service training on
using ICT as a tool in other subjects, 71% of teachers use computers and 34% of them use
the Internet in the classroom in primary schools. Primary school teachers use computers five
hours a week on average. As to secondary school teachers, in 2001 60% of them used
computers and 42% of them used the Internet in the classroom in this country group
(Eurydice, 2001a). In contrast, in Turkey it is not common to put computers into classrooms
yet, rather, computers are in a room, called the IT room, and these rooms are mostly used for
optional ICT courses as a separate subject. Furthermore, according to the ICT impact study
conducted in 2004 by MONE, all teachers perceived IT rooms as installed only for ICT
courses, and they were not aware of their rights to use the IT rooms in their teaching
(MONE, 2004). In-service training for teachers at least until 2004 seems only to have aimed
at providing basic ICT skills, not at teaching how to utilize technology or IT rooms in
lessons. The pedagogy of teaching with ICT should be the main focus of in-service training
activities. Indeed, the role of pedagogy and teachers’ beliefs about teaching and learning are
central to ICT integration (Mumtaz, 2000).
ICT is generally used as a tool in primary school curricula in the EU member group
(Eurydice, 2001a). This trend also exists in secondary schools with the support of separate
ICT courses (Eurydice, 2004). According to the survey conducted in 2002-2003 school year
by Eurydice, K-12 schools’ compulsory curriculum in most EU countries involves ICT-
related objectives under an additional category, namely, to “use ICT to enhance subject
knowledge” for teaching or use of ICT (Eurydice, 2004, p. 23). With implementation of this
new objective, students’ meaningful use of ICT for a specific purpose could be expected to
increase in the EU countries. However, teaching ICT as a separate subject is the most
common approach in the K-12 curriculum in Turkey. Indeed, using ICT as a tool for a
meaningful purpose did not appear in the written curriculum until the curriculum reform
initiated in 2004. Thus, Turkey could be seen to be at the initial stages of using ICT as a tool
in the teaching and learning of other subjects.
In summary, the infrastructure and teachers’ use of ICT in subject courses in Turkey
are not as common as in European countries, although Turkey has been conducting
ambitious projects and investing considerable sums of money in ICT provision to schools for
educational purposes since the mid-1980s.
126
CHAPTER 3
3. METHODOLOGY
The present study has two phases. The first one is in the quantitative research
paradigm and the second one is in the qualitative research paradigm. The methodology of
each phase is given separately. After giving information about the design of the study, firstly,
the population, sampling, sample, instruments, data collection procedure, statistical data
analyses, validity and reliability, limitations, missing data analysis, and effect size pertaining
to the quantitative phase are presented. Secondly, the participants, data collection instrument,
data collection procedure, data analysis procedure, validity and reliability, and limitations
pertaining to the qualitative phase are also presented.
3.1 Design of the Study
This study has both quantitative and qualitative phases, with separate main purposes.
The main purpose of quantitative phase is three-fold: firstly it aims to reanalyze the PISA
2003 dataset with respect to ICT aspects controlling ESCS and attitudes toward computers,
across country groups; secondly it models the relationships between mathematical literacy
performance and affecting factors, such as ICT aspects and ESCS, by using the PISA 2003
dataset across country groups; thirdly it models the relationships between problem solving
literacy performance and those factors across country groups. On the other hand, the main
purpose of the qualitative phase is to investigate exemplary education policy makers’
perceptions of the quantitative phase results of this study and of issues and possible solutions
in ICT policy making and implementations in Turkey. More specifically, the research
questions of this study are as follow:
a) Quantitative Research Questions:
1. How does ICT use –Internet/Entertainment Use and Program/Software Use– differ
among students in PISA 2003 across the EU member group, the new EU member
group and Turkey (country groups), controlling for attitudes toward computers and
the economic, social and cultural status of students?
127
2. How does self-confidence in ICT –Confidence in Routine Tasks, Confidence in
Internet Tasks and Confidence in High Level Tasks– differ among students in PISA
2003 across country groups, controlling for attitudes toward computers and the
economic, social and cultural status of students?
3. How do attitudes toward computers differ among students in PISA 2003 across
country groups, controlling for the economic, social and cultural status of students?
4. How well do ICT-related factors and student family background explain variances of
PISA 2003 students’ mathematical literacy performance across country groups?
5. How well do ICT-related factors and student family background explain variances of
PISA 2003 students’ problem solving literacy performance across country groups?
b) Qualitative Research Questions:
1. How do Turkish education policy makers evaluate the quantitative findings of this
study across Turkey and the EU?
2. According to Turkish education policy makers, what are the issues in developing and
implementing an ICT-in-education policy in Turkey?
3. What are the Turkish education policy makers’ suggestions for developing and
implementing an ICT-in-education policy in Turkey?
Considering the quantitative and qualitative phases together, along with the
interrelated and complete structure and procedures, and the theoretical drives of this
research, according to Morse (2003), the overall design of such a study is referred to as a
multimethod research design. When the characteristics and principles of this research design
are taken into account, it is best fit in a quantitative -dominance- study followed by a
qualitative study with a deductive theoretical drive. The multimethod research design type of
this study is notated as: QUAN → qual. The separate focuses and the related research
questions of quantitative and qualitative phases of the study also require the multimethod
research design.
3.2 Methodology for the Quantitative Phase of the Study
3.2.1 Population, Sampling, and Sample
Since there are natural differences in national education systems with relation to
grade or structure of the educational institutions in the countries that participated in PISA
2003, the target population in each country is defined as all 15-year-old students in grade 7
or higher, enrolled in any type of educational program, except for students schooled at home
or abroad. The age of the students in PISA 2003 study ranges from 15 years and 3
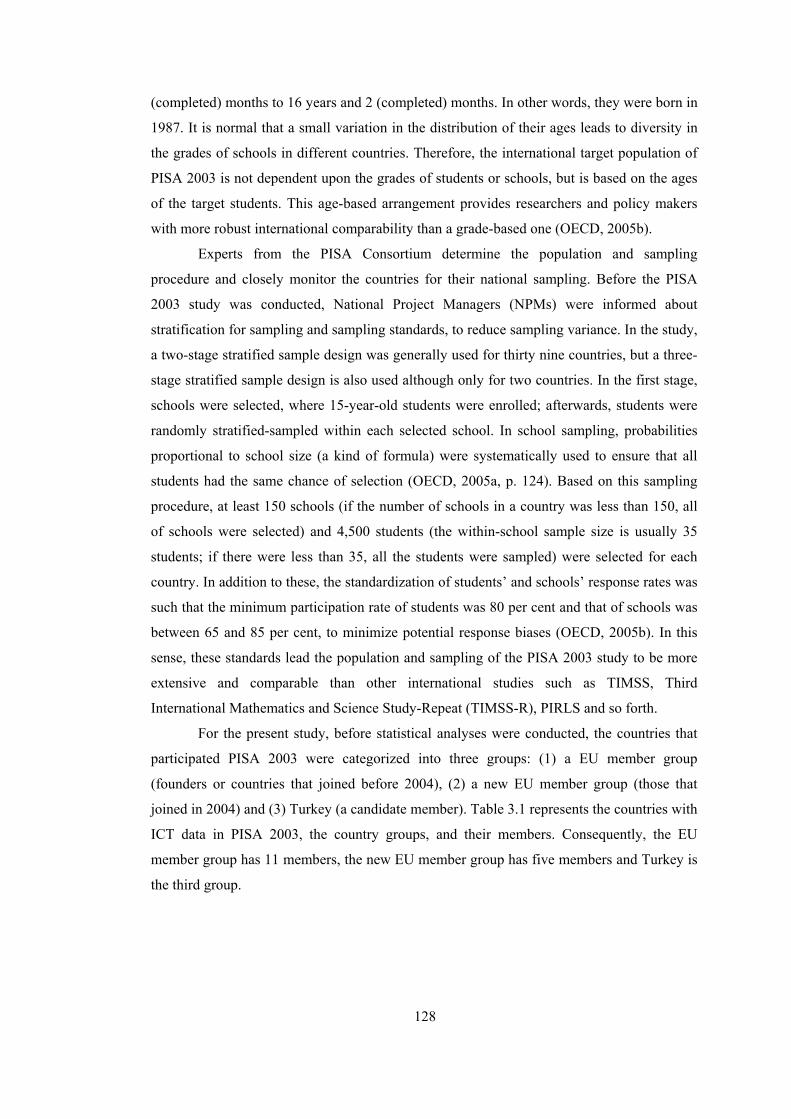
128
(completed) months to 16 years and 2 (completed) months. In other words, they were born in
1987. It is normal that a small variation in the distribution of their ages leads to diversity in
the grades of schools in different countries. Therefore, the international target population of
PISA 2003 is not dependent upon the grades of students or schools, but is based on the ages
of the target students. This age-based arrangement provides researchers and policy makers
with more robust international comparability than a grade-based one (OECD, 2005b).
Experts from the PISA Consortium determine the population and sampling
procedure and closely monitor the countries for their national sampling. Before the PISA
2003 study was conducted, National Project Managers (NPMs) were informed about
stratification for sampling and sampling standards, to reduce sampling variance. In the study,
a two-stage stratified sample design was generally used for thirty nine countries, but a three-
stage stratified sample design is also used although only for two countries. In the first stage,
schools were selected, where 15-year-old students were enrolled; afterwards, students were
randomly stratified-sampled within each selected school. In school sampling, probabilities
proportional to school size (a kind of formula) were systematically used to ensure that all
students had the same chance of selection (OECD, 2005a, p. 124). Based on this sampling
procedure, at least 150 schools (if the number of schools in a country was less than 150, all
of schools were selected) and 4,500 students (the within-school sample size is usually 35
students; if there were less than 35, all the students were sampled) were selected for each
country. In addition to these, the standardization of students’ and schools’ response rates was
such that the minimum participation rate of students was 80 per cent and that of schools was
between 65 and 85 per cent, to minimize potential response biases (OECD, 2005b). In this
sense, these standards lead the population and sampling of the PISA 2003 study to be more
extensive and comparable than other international studies such as TIMSS, Third
International Mathematics and Science Study-Repeat (TIMSS-R), PIRLS and so forth.
For the present study, before statistical analyses were conducted, the countries that
participated PISA 2003 were categorized into three groups: (1) a EU member group
(founders or countries that joined before 2004), (2) a new EU member group (those that
joined in 2004) and (3) Turkey (a candidate member). Table 3.1 represents the countries with
ICT data in PISA 2003, the country groups, and their members. Consequently, the EU
member group has 11 members, the new EU member group has five members and Turkey is
the third group.
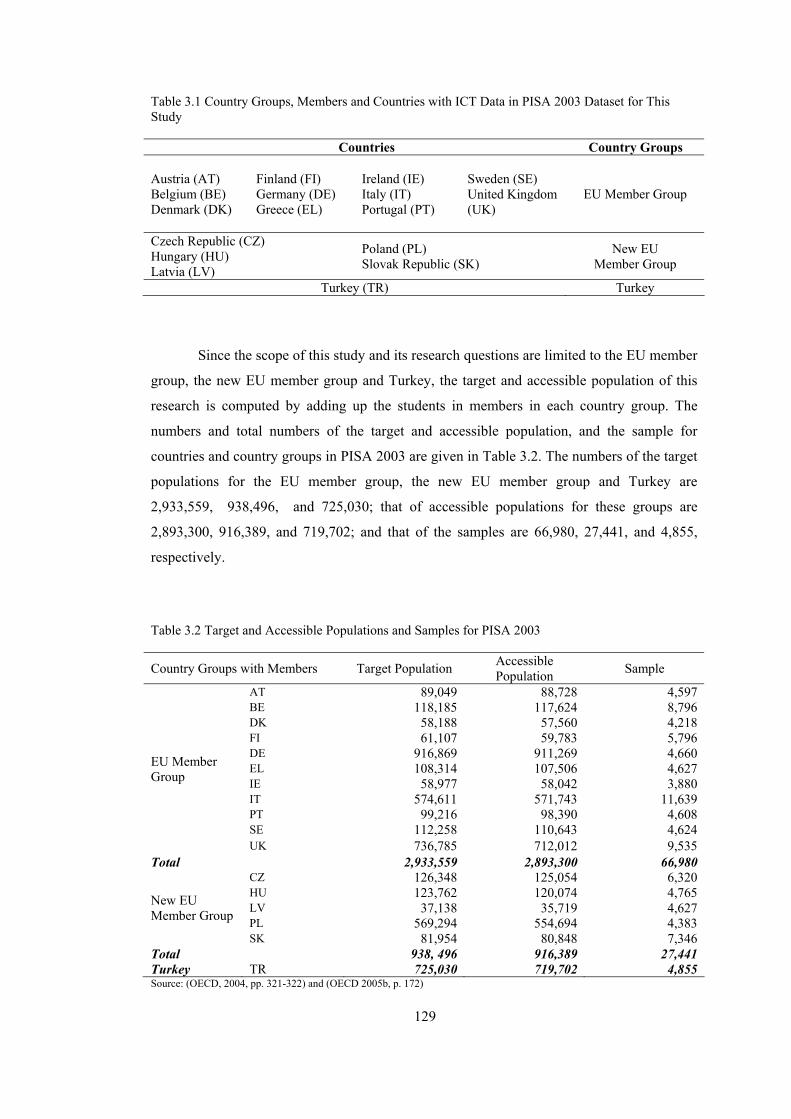
129
Table 3.1 Country Groups, Members and Countries with ICT Data in PISA 2003 Dataset for This Study
Countries Country Groups
Austria (AT) Belgium (BE) Denmark (DK)
Finland (FI) Germany (DE) Greece (EL)
Ireland (IE) Italy (IT) Portugal (PT)
Sweden (SE) United Kingdom (UK)
EU Member Group
Czech Republic (CZ) Hungary (HU) Latvia (LV)
Poland (PL) Slovak Republic (SK)
New EU Member Group
Turkey (TR) Turkey
Since the scope of this study and its research questions are limited to the EU member
group, the new EU member group and Turkey, the target and accessible population of this
research is computed by adding up the students in members in each country group. The
numbers and total numbers of the target and accessible population, and the sample for
countries and country groups in PISA 2003 are given in Table 3.2. The numbers of the target
populations for the EU member group, the new EU member group and Turkey are
2,933,559, 938,496, and 725,030; that of accessible populations for these groups are
2,893,300, 916,389, and 719,702; and that of the samples are 66,980, 27,441, and 4,855,
respectively. Table 3.2 Target and Accessible Populations and Samples for PISA 2003
Country Groups with Members Target Population Accessible Population Sample
AT 89,049 88,728 4,597 BE 118,185 117,624 8,796 DK 58,188 57,560 4,218 FI 61,107 59,783 5,796 DE 916,869 911,269 4,660 EL 108,314 107,506 4,627 IE 58,977 58,042 3,880 IT 574,611 571,743 11,639 PT 99,216 98,390 4,608 SE 112,258 110,643 4,624
EU Member Group
UK 736,785 712,012 9,535 Total 2,933,559 2,893,300 66,980
CZ 126,348 125,054 6,320 HU 123,762 120,074 4,765 LV 37,138 35,719 4,627 PL 569,294 554,694 4,383
New EU Member Group
SK 81,954 80,848 7,346 Total 938, 496 916,389 27,441 Turkey TR 725,030 719,702 4,855 Source: (OECD, 2004, pp. 321-322) and (OECD 2005b, p. 172)

130
As all the national target populations of the countries consists of 15-year-old
students in the PISA 2003 dataset, the sample of this study is also 15-year-old students, but
only those from the EU member group, the new EU member group and Turkey and those
who have used computers before. As seen in Table 3.3, the sample size for this study
changes, depending on statistical analyses.
Table 3.3 Sample Sizes with respect to Research Questions and Country Groups
Sample Size Research Questions Statistical Data Analyses EU
Members New EU Members Turkey
Research Questions – 1 and 2 One-way multivariate
MANCOVA
Research Question – 3 A-univariate ANCOVA 56,610 24,834 3,231
Research Questions – 4 and 5 Path Analytic Models within
SEM 57,787 25,359 3,590
The difference in sample sizes for multivariate variance analyses and path analytic
models exist because of a different deletion method used for missing data. Students with data
on all ICT indexes and ESCS index are taken for multivariate analysis of covariance
(MANCOVA) and analysis of covariance (ANCOVA) analyses (i.e. listwise deletion). On
the other hand, students with at least one non-missing ICT index are taken for path analytic
models within structural equation modeling (SEM) analysis (i.e. pairwise deletion).
3.2.2 Data Collection Instruments
The designing, developing and implementing of PISA 2003 assessment instruments
are interactive processes involving the cooperative responsibility of the OECD members, and
international PISA consortium. This consortium consists of the PISA Governing Board,
diverse expert committees, and international experts from noteworthy institutions such as the
Australian Council for Educational Research (ACER), the National Institute for Educational
Measurement (CITO) in the Netherlands, Westat and ETS in the United States, the National
Institute for Educational Research (NIER) in Japan, senior policy makers, and international
expert groups, as the subject matter expert group (SMEG). In particular in establishing
assessment instruments, SMEG works on the identification of the critical knowledge, skills
and competencies of 15-year-students, having to successfully join and contribute to modern
society. Considering and balancing the national, cultural, linguistic, and educational contexts
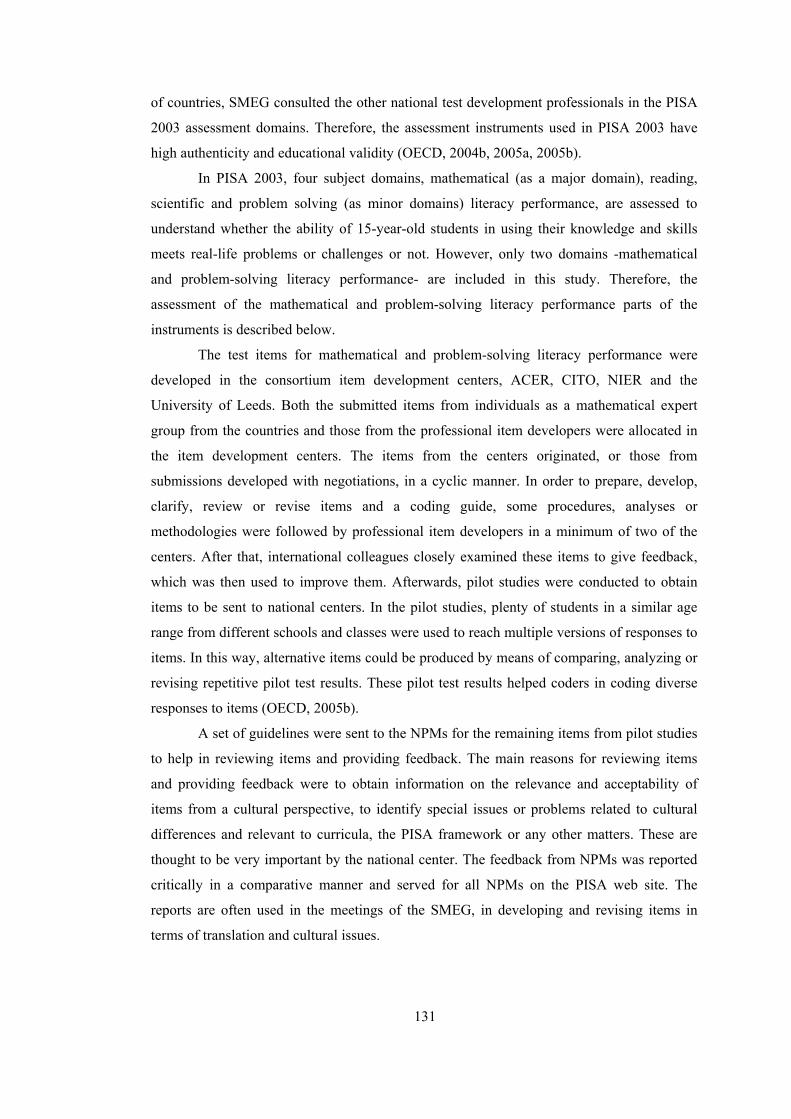
131
of countries, SMEG consulted the other national test development professionals in the PISA
2003 assessment domains. Therefore, the assessment instruments used in PISA 2003 have
high authenticity and educational validity (OECD, 2004b, 2005a, 2005b).
In PISA 2003, four subject domains, mathematical (as a major domain), reading,
scientific and problem solving (as minor domains) literacy performance, are assessed to
understand whether the ability of 15-year-old students in using their knowledge and skills
meets real-life problems or challenges or not. However, only two domains -mathematical
and problem-solving literacy performance- are included in this study. Therefore, the
assessment of the mathematical and problem-solving literacy performance parts of the
instruments is described below.
The test items for mathematical and problem-solving literacy performance were
developed in the consortium item development centers, ACER, CITO, NIER and the
University of Leeds. Both the submitted items from individuals as a mathematical expert
group from the countries and those from the professional item developers were allocated in
the item development centers. The items from the centers originated, or those from
submissions developed with negotiations, in a cyclic manner. In order to prepare, develop,
clarify, review or revise items and a coding guide, some procedures, analyses or
methodologies were followed by professional item developers in a minimum of two of the
centers. After that, international colleagues closely examined these items to give feedback,
which was then used to improve them. Afterwards, pilot studies were conducted to obtain
items to be sent to national centers. In the pilot studies, plenty of students in a similar age
range from different schools and classes were used to reach multiple versions of responses to
items. In this way, alternative items could be produced by means of comparing, analyzing or
revising repetitive pilot test results. These pilot test results helped coders in coding diverse
responses to items (OECD, 2005b).
A set of guidelines were sent to the NPMs for the remaining items from pilot studies
to help in reviewing items and providing feedback. The main reasons for reviewing items
and providing feedback were to obtain information on the relevance and acceptability of
items from a cultural perspective, to identify special issues or problems related to cultural
differences and relevant to curricula, the PISA framework or any other matters. These are
thought to be very important by the national center. The feedback from NPMs was reported
critically in a comparative manner and served for all NPMs on the PISA web site. The
reports are often used in the meetings of the SMEG, in developing and revising items in
terms of translation and cultural issues.
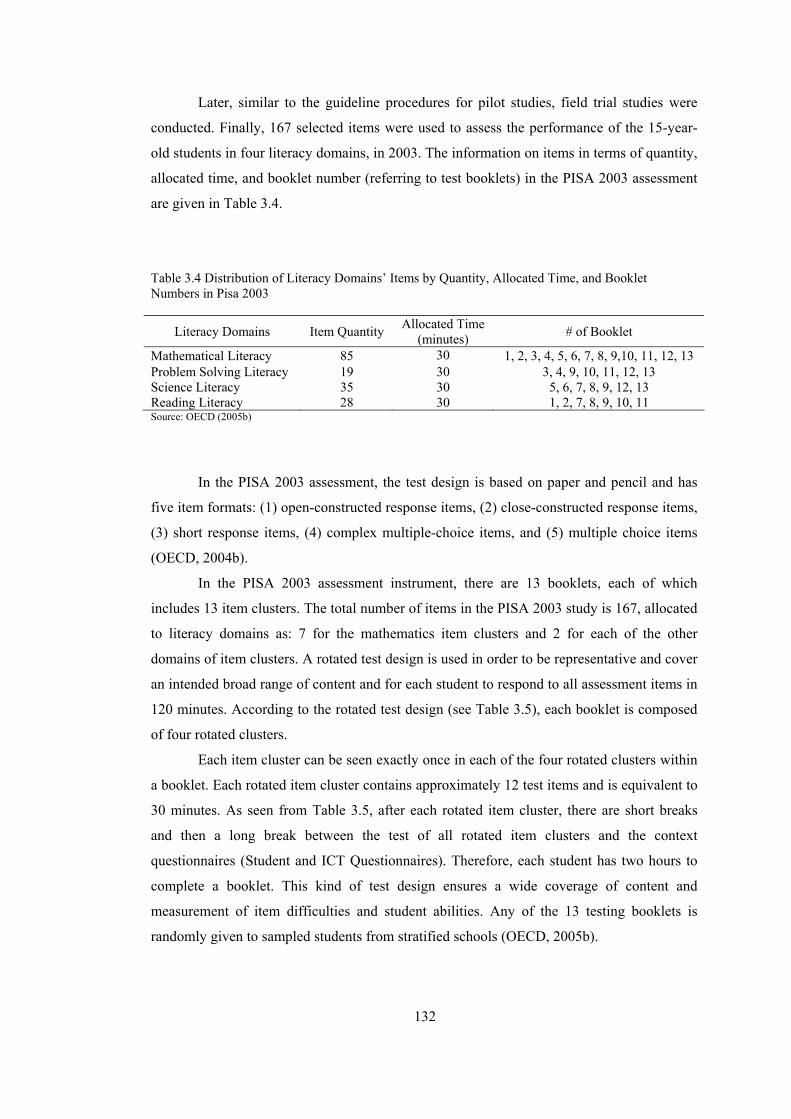
132
Later, similar to the guideline procedures for pilot studies, field trial studies were
conducted. Finally, 167 selected items were used to assess the performance of the 15-year-
old students in four literacy domains, in 2003. The information on items in terms of quantity,
allocated time, and booklet number (referring to test booklets) in the PISA 2003 assessment
are given in Table 3.4.
Table 3.4 Distribution of Literacy Domains’ Items by Quantity, Allocated Time, and Booklet Numbers in Pisa 2003
Literacy Domains Item Quantity Allocated Time (minutes) # of Booklet
Mathematical Literacy 85 30 1, 2, 3, 4, 5, 6, 7, 8, 9,10, 11, 12, 13 Problem Solving Literacy 19 30 3, 4, 9, 10, 11, 12, 13 Science Literacy 35 30 5, 6, 7, 8, 9, 12, 13 Reading Literacy 28 30 1, 2, 7, 8, 9, 10, 11 Source: OECD (2005b)
In the PISA 2003 assessment, the test design is based on paper and pencil and has
five item formats: (1) open-constructed response items, (2) close-constructed response items,
(3) short response items, (4) complex multiple-choice items, and (5) multiple choice items
(OECD, 2004b).
In the PISA 2003 assessment instrument, there are 13 booklets, each of which
includes 13 item clusters. The total number of items in the PISA 2003 study is 167, allocated
to literacy domains as: 7 for the mathematics item clusters and 2 for each of the other
domains of item clusters. A rotated test design is used in order to be representative and cover
an intended broad range of content and for each student to respond to all assessment items in
120 minutes. According to the rotated test design (see Table 3.5), each booklet is composed
of four rotated clusters.
Each item cluster can be seen exactly once in each of the four rotated clusters within
a booklet. Each rotated item cluster contains approximately 12 test items and is equivalent to
30 minutes. As seen from Table 3.5, after each rotated item cluster, there are short breaks
and then a long break between the test of all rotated item clusters and the context
questionnaires (Student and ICT Questionnaires). Therefore, each student has two hours to
complete a booklet. This kind of test design ensures a wide coverage of content and
measurement of item difficulties and student abilities. Any of the 13 testing booklets is
randomly given to sampled students from stratified schools (OECD, 2005b).
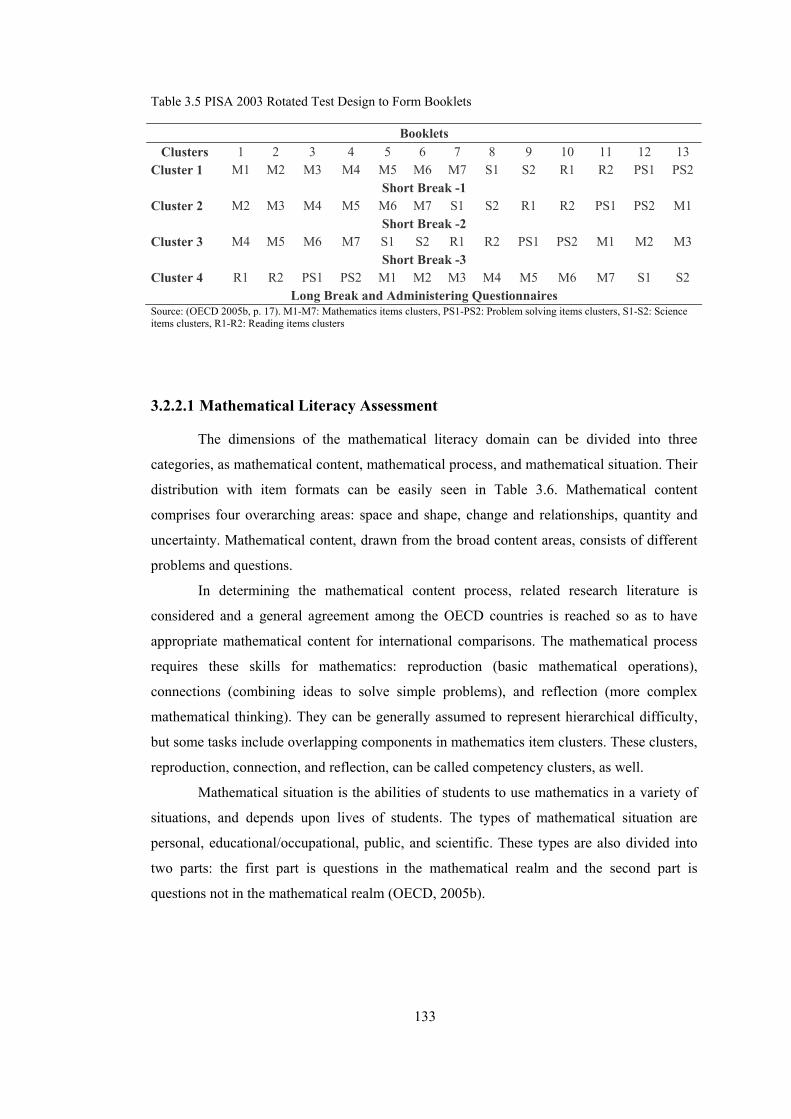
133
Table 3.5 PISA 2003 Rotated Test Design to Form Booklets
Booklets Clusters 1 2 3 4 5 6 7 8 9 10 11 12 13
Cluster 1 M1 M2 M3 M4 M5 M6 M7 S1 S2 R1 R2 PS1 PS2 Short Break -1
Cluster 2 M2 M3 M4 M5 M6 M7 S1 S2 R1 R2 PS1 PS2 M1 Short Break -2
Cluster 3 M4 M5 M6 M7 S1 S2 R1 R2 PS1 PS2 M1 M2 M3 Short Break -3
Cluster 4 R1 R2 PS1 PS2 M1 M2 M3 M4 M5 M6 M7 S1 S2 Long Break and Administering Questionnaires
Source: (OECD 2005b, p. 17). M1-M7: Mathematics items clusters, PS1-PS2: Problem solving items clusters, S1-S2: Science items clusters, R1-R2: Reading items clusters
3.2.2.1 Mathematical Literacy Assessment
The dimensions of the mathematical literacy domain can be divided into three
categories, as mathematical content, mathematical process, and mathematical situation. Their
distribution with item formats can be easily seen in Table 3.6. Mathematical content
comprises four overarching areas: space and shape, change and relationships, quantity and
uncertainty. Mathematical content, drawn from the broad content areas, consists of different
problems and questions.
In determining the mathematical content process, related research literature is
considered and a general agreement among the OECD countries is reached so as to have
appropriate mathematical content for international comparisons. The mathematical process
requires these skills for mathematics: reproduction (basic mathematical operations),
connections (combining ideas to solve simple problems), and reflection (more complex
mathematical thinking). They can be generally assumed to represent hierarchical difficulty,
but some tasks include overlapping components in mathematics item clusters. These clusters,
reproduction, connection, and reflection, can be called competency clusters, as well.
Mathematical situation is the abilities of students to use mathematics in a variety of
situations, and depends upon lives of students. The types of mathematical situation are
personal, educational/occupational, public, and scientific. These types are also divided into
two parts: the first part is questions in the mathematical realm and the second part is
questions not in the mathematical realm (OECD, 2005b).

134
Table 3.6 Distribution of Mathematical Literacy Categories with Item Formats in PISA 2003
Item Formats Mathematical
Literacy Categories
Multiple-choice items
Complex multiple-
choice items
Closed-constructed
response items
Open-constructed
response items
Short response
items Total
Mathematical Content
Space and Shape 4 4 6 4 2 20
Change and Relationship 1 2 4 11 4 22
Quantity 4 2 2 1 14 23
Uncertainty 8 3 1 5 3 20
Total 17 11 13 21 23 85 Mathematical Process (Competency)
Reproduction 7 0 7 3 9 26
Connections 5 9 4 9 13 40
Reflection 5 2 2 9 1 19
Total 17 11 13 21 23 85
Mathematical situation
Personal 5 3 1 3 6 18
Educational/occupational 2 4 6 2 6 20
Public 8 2 4 8 7 29
Scientific 2 2 2 8 4 18
Total 17 11 13 21 23 85 Source: (OECD 2004b, p. 334)
3.2.2.2 Problem-Solving Literacy Assessment
The problem-solving literacy domain can be categorized into three dimensions: (1)
the type of problem encountered, (2) the processes involved in solving a problem, and (3) the
situations involved. In the first dimension, there are three types of problem-solving
approaches, such as decision-making, system analysis and design, and trouble shooting. In
the second dimension, there are six processes: understanding, characterizing, representing,
solving, reflecting on the solution, and communicating the solution. In the third dimension,
the problems are formed from personal life, work and leisure, community and society. They
are given in Table 3.7 with their item formats (OECD, 2004a).
135
Table 3.7 Distribution of Problem Solving Approaches with Item Formats in PISA 2003
Item Formats Problem Solving Approaches
Multiple-choice items
Complex multiple-
choice items
Closed-constructed
response items
Open-constructed
response items
Short response
items Total
Decision Making 2 0 2 3 0 7
System Analysis and Design
2 0 1 4 0 7
Trouble shooting 3 0 0 2 0 5
Total 7 0 3 9 0 19 Source (OECD, 2004a, p.61)
The PISA 2003 study focused basically on creating both a national, and an
international educational survey, and assessing the knowledge and skills of the population,
not of particular students. Therefore, making fewer errors in making inferences for the target
population is more important than making fewer errors about individuals. In this sense,
student performances in the mathematical and problem-solving literacy domains are not
observed directly, but they are inferred from the student item responses. Although there are
several methodologies to make inferences of mathematical and problem-solving literacy
performance, PISA uses the imputation approach –called plausible values (PVs). According
to the PISA 2003 Data Analysis Manual, SPSS Users (OECD, 2005a), the methodology of
PVs calculates distributions around the reported values and assigns to each observation a set
of random values drawn from the posterior distributions. This imputation approach generates
reliable estimators of population parameters, so PVs are more appropriate to depict the
performance of populations than individuals (OECD, 2005b).
3.2.2.3 Student Questionnaire
Along with literacy domains, PISA collects data on the socioeconomic and cultural
background of students through a student questionnaire. In the preparation process of the
PISA 2003 student questionnaire, some constructs or variables in PISA 2000 were used, but
most of them were new and developed through the years 2001 to 2002. With international
experts, the PISA Governing Board (PGB) provided a development process of student
questionnaire with its priorities and elaborations in the framework of research realms. First
of all, an initial version of the student questionnaire was examined in the manner of
qualitative and quantitative aspects of item responses, belonging to students from a few
countries. After that, a second version of the student questionnaire was administered by

136
national centers and developed with guidance from experts from the OECD, national, and
international centers. Afterwards, two different student questionnaires were administered to
all participant countries for a field trial, in 2002. Later on, the results of field trial data
analysis and the criteria, constituted by national centers, international experts and the OECD,
determined the final student questionnaire (OECD, 2005b).
PISA 2003 has collected information about characteristics of 15-year-old students
with the help of the Student Questionnaire. This questionnaire could be obtained from the
official PISA web site (PISA, n.d.). Students had 35 minutes to respond to the student
questionnaire items. The socioeconomic and cultural background of students collected
through the Student Questionnaire is taken into account in the analyses of the present study.
In PISA 2003, the Student Questionnaire has many items about student
characteristics. Although some items are simple and analyzed as single items (e.g. gender),
some of them are not simple and not observed directly. Therefore, they can be measured with
latent constructs, for instance, the economic, social, and cultural status of students.
Consequently, transformations or scaling procedures are used to construct meaningful simple
or scale indexes in the PISA 2003 study. The concepts of simple and scale indexes are
defined in the PISA 2003 Technical Report (OECD 2005b, p. 272) as:
Simple indexes: These indexes were constructed through the arithmetical transformation or recoding of one or more items. Item responses were used to calculate meaningful variables.
Scale indexes: Variable construction through the scaling of items. Typically, scale scores for these indexes are estimates of latent traits derived through IRT (item response theory) scaling of dichotomous or Likert-type items.
The index of ESCS in PISA 2003 was derived from three family background
variables as follow: (1) PARED: the index of highest level of parental education in number
of years of education according to the ISCED (International Standard Classification of
Education, see Table 3.8); (2) HISEI: the index of highest parental occupation status; and (3)
HOMEPOS: the index of home possessions, ascribed to income (OECD, 2005a, p. 382).
These family background variables (scale indexes) were selected by PISA since education,
occupational status and income are usually seen as indicators of socioeconomic status
(OECD, 2005b). So as to confirm overlapping family background indexes with theory and
research, and to validate their comparability across (between or within) countries, structural
equation modeling is conducted to understand their appropriateness (OECD, 2004b, p. 282).
Details of the ESCS index, its component indexes, and their items are given in Table 3.9.
In PISA 2003, the ESCS index, particularly composed of PARED, HISEI, and
HOMEPOS, is naturally derived from items that require students to give responses in either a
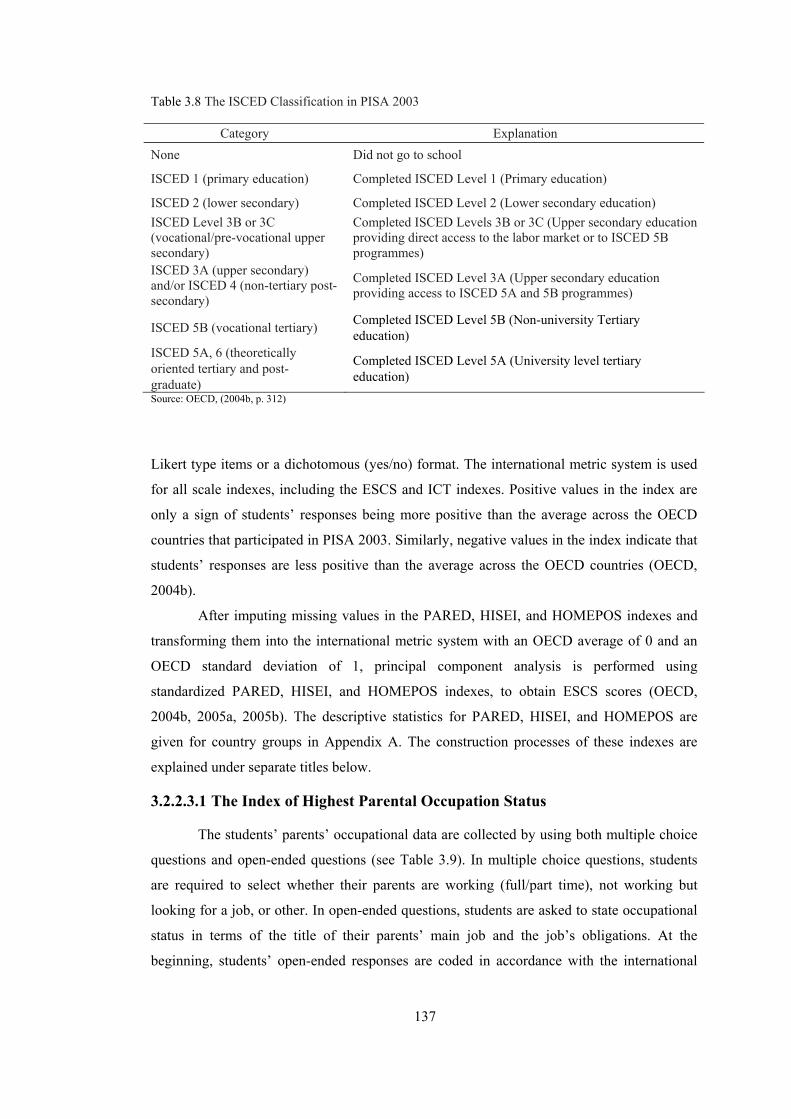
137
Table 3.8 The ISCED Classification in PISA 2003
Category Explanation None Did not go to school
ISCED 1 (primary education) Completed ISCED Level 1 (Primary education)
ISCED 2 (lower secondary) Completed ISCED Level 2 (Lower secondary education) ISCED Level 3B or 3C (vocational/pre-vocational upper secondary)
Completed ISCED Levels 3B or 3C (Upper secondary education providing direct access to the labor market or to ISCED 5B programmes)
ISCED 3A (upper secondary) and/or ISCED 4 (non-tertiary post-secondary)
Completed ISCED Level 3A (Upper secondary education providing access to ISCED 5A and 5B programmes)
ISCED 5B (vocational tertiary) Completed ISCED Level 5B (Non-university Tertiary education)
ISCED 5A, 6 (theoretically oriented tertiary and post-graduate)
Completed ISCED Level 5A (University level tertiary education)
Source: OECD, (2004b, p. 312) Likert type items or a dichotomous (yes/no) format. The international metric system is used
for all scale indexes, including the ESCS and ICT indexes. Positive values in the index are
only a sign of students’ responses being more positive than the average across the OECD
countries that participated in PISA 2003. Similarly, negative values in the index indicate that
students’ responses are less positive than the average across the OECD countries (OECD,
2004b).
After imputing missing values in the PARED, HISEI, and HOMEPOS indexes and
transforming them into the international metric system with an OECD average of 0 and an
OECD standard deviation of 1, principal component analysis is performed using
standardized PARED, HISEI, and HOMEPOS indexes, to obtain ESCS scores (OECD,
2004b, 2005a, 2005b). The descriptive statistics for PARED, HISEI, and HOMEPOS are
given for country groups in Appendix A. The construction processes of these indexes are
explained under separate titles below.
3.2.2.3.1 The Index of Highest Parental Occupation Status
The students’ parents’ occupational data are collected by using both multiple choice
questions and open-ended questions (see Table 3.9). In multiple choice questions, students
are required to select whether their parents are working (full/part time), not working but
looking for a job, or other. In open-ended questions, students are asked to state occupational
status in terms of the title of their parents’ main job and the job’s obligations. At the
beginning, students’ open-ended responses are coded in accordance with the international

138
standard classification of occupations (ISCO); and then the occupations, derived from the
ISCO, are recoded into the international socioeconomic index of occupational status (ISEI),
providing a comparable the index of occupations for PISA 2003 countries. Finally, three
indexes are calculated from the ISEI scores: (1) an index of mother’s occupational status, (2)
an index of father’s occupational status, and (3) an index of the highest occupational level of
parents (HISEI), which is derived from either parents’ or the available parent’s, higher ISEI
score. In the HISEI index, the meaning of higher (or lower) values is a higher (or lower)
level of occupational status of parents or parent (OECD, 2004b, 2005b).
3.2.2.3.2 The Index of Highest Level of Parental Education in Number of Years of Education
As can be seen easily from Table 3.9, data for the index of highest level of parental
education in terms of years of education is calculated from students’ responses to multiple
choice questions. In order to have internationally comparable categories of the educational
status of parents, the data on the index of highest level of parental education in number of
years of education (PARED) are then coded in accordance with the ISCED, a typology
systematically arranging school programs or educational qualifications. The data related to
the education status of both mothers and fathers are classified by means of the ISCED
categorization. At first, the indexes of the highest level of parental education status for
mothers and fathers are computed separately, and then the index of the highest educational
level of parents is calculated together. Finally, the index of the highest educational level of
parents is transformed into PARED on the basis of years of schooling (OECD, 2004b,
2005b).
3.2.2.3.3 The Index of Home Possessions
In the PISA 2003 study, considering that data on family income is not available,
there is an endeavor to indirectly understand family wealth by means of gathering
information on students’ home possessions. The data on home possession are collected
through a multiple choice question with 13 alternatives and a dichotomous question. As seen
from Table 3.9, there are 13 different household items and there is a dummy variable
indicating whether there are more than 100 books, or not. Since the structure of students’
responses is binary, the scale index of home possessions (HOMEPOS) construction is
realized by way of IRT scaling. Like HISEI, positive values in the index of HOMEPOS
signify higher levels of home possessions (OECD, 2004b, 2005b). Contrary to the indexes of
PARED and HISEI, the HOMEPOS index is categorized into Weighted Likelihood
Estimates (WLE) indexes.
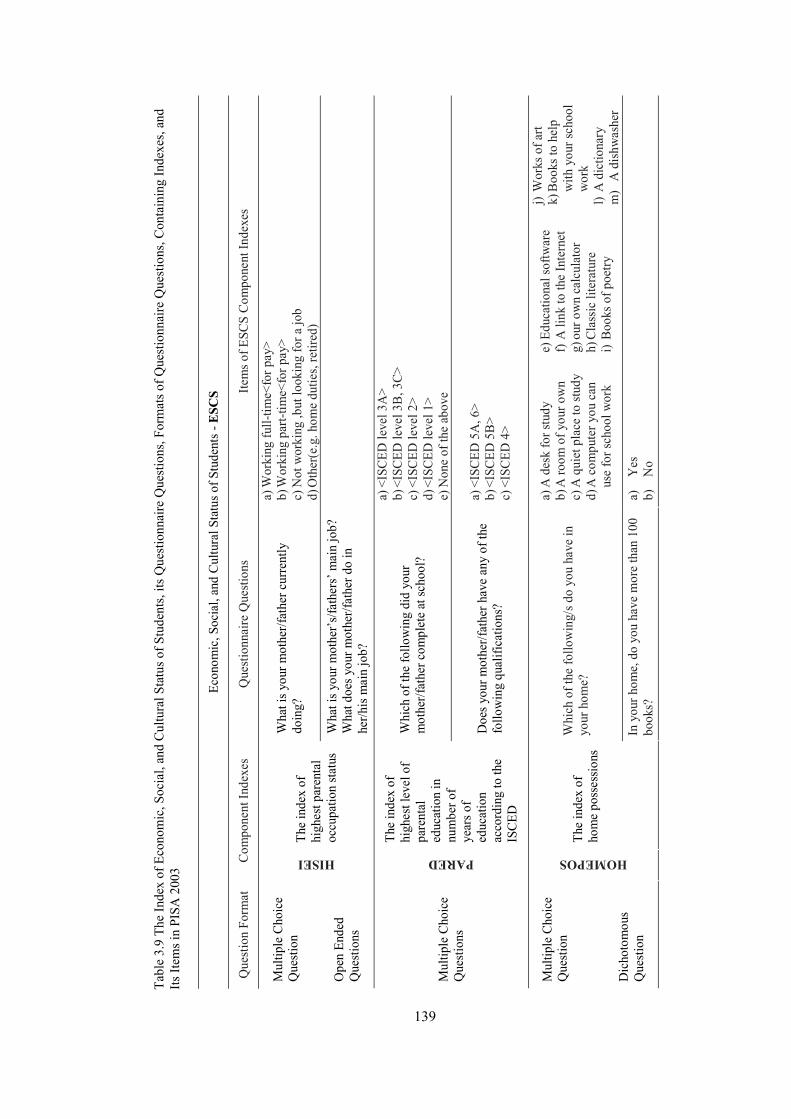
139
Tabl
e 3.
9 Th
e In
dex
of E
cono
mic
, Soc
ial,
and
Cul
tura
l Sta
tus o
f Stu
dent
s, its
Que
stio
nnai
re Q
uest
ions
, For
mat
s of Q
uest
ionn
aire
Que
stio
ns, C
onta
inin
g In
dexe
s, an
d Its
Item
s in
PISA
200
3
Econ
omic
, Soc
ial,
and
Cultu
ral S
tatu
s of S
tude
nts -
ESC
S
Que
stio
n Fo
rmat
Co
mpo
nent
Inde
xes
Que
stio
nnai
re Q
uesti
ons
Item
s of E
SCS
Com
pone
nt In
dexe
s
Wha
t is y
our m
othe
r/fat
her c
urre
ntly
do
ing?
a) W
orki
ng fu
ll-tim
e<fo
r pay
> b)
Wor
king
par
t-tim
e<fo
r pay
> c)
Not
wor
king
,but
look
ing
for a
job
d)
Oth
er(e
.g. h
ome
dutie
s, re
tired
)
Mul
tiple
Cho
ice
Que
stion
O
pen
Ende
d Q
uesti
ons
HISEI
The
inde
x of
hi
ghes
t par
enta
l oc
cupa
tion
statu
s W
hat i
s you
r mot
her’s
/fath
ers’
mai
n jo
b?
Wha
t doe
s you
r mot
her/f
athe
r do
in
her/h
is m
ain
job?
Whi
ch o
f the
follo
win
g di
d yo
ur
mot
her/f
athe
r com
plet
e at
scho
ol?
a) <
ISCE
D le
vel 3
A>
b) <
ISCE
D le
vel 3
B, 3
C>
c) <
ISCE
D le
vel 2
> d)
<IS
CED
leve
l 1>
e) N
one
of th
e ab
ove
Mul
tiple
Cho
ice
Que
stion
s
PARED
The
inde
x of
hi
ghes
t lev
el o
f pa
rent
al
educ
atio
n in
nu
mbe
r of
year
s of
educ
atio
n ac
cord
ing
to th
e IS
CED
Doe
s you
r mot
her/f
athe
r hav
e an
y of
the
follo
win
g qu
alifi
catio
ns?
a) <
ISCE
D 5
A, 6
> b)
<IS
CED
5B
> c)
<IS
CED
4>
Whi
ch o
f the
follo
win
g/s d
o yo
u ha
ve in
yo
ur h
ome?
a) A
des
k fo
r stu
dy
b) A
room
of y
our o
wn
c)
A q
uiet
pla
ce to
stud
y
d) A
com
pute
r you
can
us
e fo
r sch
ool w
ork
e) E
duca
tiona
l sof
twar
e
f) A
link
to th
e In
tern
et
g) ou
r ow
n ca
lcul
ator
h)
Cla
ssic
lite
ratu
re
i) Bo
oks o
f poe
try
j) W
orks
of a
rt
k) B
ooks
to h
elp
with
you
r sch
ool
wor
k
l) A
dic
tiona
ry
m)
A d
ishw
ashe
r
Mul
tiple
Cho
ice
Que
stion
D
icho
tom
ous
Que
stion
HOMEPOS
The
inde
x of
ho
me
poss
essio
ns
In y
our h
ome,
do
you
have
mor
e th
an 1
00
book
s?
a)
Yes
b)
N
o
140
3.2.2.4 Information and Communication Technologies Questionnaire
Along with tests of literacy domains and a student questionnaire, the PISA 2003
study also offered two subsequent and optional questionnaires –an educational career
questionnaire and an information and communication technology (ICT) questionnaire. After
or concurrently with the international student questionnaire, the ICT questionnaire is
administered to students. It takes around five minutes. Information concerning access to and
use of ICT at home and schools, type of ICT use, self-confidence in ICT, attitudes toward
computers, and the learning background of students’ ICT knowledge are collected through
ICT questionnaire as seen in Appendix B. The present study specifically analyzed ICT
aspects and their relationships with mathematical and problem-solving literacy performance,
along with the ESCS index. Therefore, ICT indexes, -specifically, type of ICT use
(Internet/entertainment use and Program/software use), self-confidence in ICT tasks
(Routine tasks, Internet tasks, and High level tasks), and attitudes toward computers-, are
called ICT aspects. These ICT aspects are the main focus of this study. The detailed
information on ICT aspects, ICT indexes, its items, and related questions are given in Table
3.10.
In the PISA 2003 study, similar to the HOMEPOS index, ICT indexes are also
calculated with the WLE method. All items in ICT indexes are inverted for scaling, as well.
The positive scores in all ICT indexes indicate more frequent use than the OECD
international average for the Internet/entertainment use (INTUSE) and program/software use
(PRGUSE) indexes, high self-confidence for confidence in routine tasks (ROUTCONF),
confidence in Internet tasks (INTCONF), and confidence in high level tasks (HIGHCONF)
indexes, and positive attitudes for the attitudes toward computers (ATTCOMP) index.
Negative scores in all ICT indexes denote less frequent use than the OECD international
average for INTUSE, and PRGUSE, and low self-confidence for ROUTCONF, INTCONF,
and HIGHCONF, and negative attitudes for ATTCOMP (OECD, 2005a, 2005b). As seen
from Table 3.10, likert-scale format and numbers of items in ICT indexes vary as follows: a
five-point likert-type scale is used with six items for each of INTUSE and PRGUSE, a four-
point likert-type scale is used for ROUTCONF with eleven items, INTCONF with five
items, HIGHCONF with seven items, and ATTCOMP with four items.
3.2.2.4.1 The Meaning of ICT Indexes
Each ICT index combines into a composite score each student’s responses to several
related questions in the ICT questionnaire. These scores are represented as index numbers so
that the average of each index is zero for all students in all OECD countries, and about two-

141
thirds of students’ scores are between -1 and +1. Thus, for example, a score of -1 for the
program/software use index indicates that a student uses computers more than about one
sixth of the students internationally, and a score of +1 indicates that he or she uses computers
more than about five-sixths of the students internationally. It should be considered that the
mean of any ICT index for a country indicates the relative position of that country compared
to the OECD average. In this sense, comparing two ICT index means of a country to decide
which one is higher is not possible, for instance in comparing program/software use and
Internet/entertainment use indexes such a comparison is not allowed between countries
(OECD, 2006c, p. 38). This comparison could only be made with the observed variables
constructing the index. For each country group, the observed variables with their descriptive
statistics for each ICT index used in this study can be seen in Appendix A. Comparing two
countries’ means of the same index shows that the country with the higher mean is at higher
position in that index with reference to the international scale.
3.2.3 Data Collection Procedure
PISA 2003 assessment is designed for international comparable studies, but it is
nationally realized in the participant countries. At a national level, NPMs, responsible for
school coordinators and test administrators, have operational responsibilities and duties in
the implementation of the PISA 2003 assessment. NPMs are assisted by school coordinators
and test administrators in the implementation process of assessment at the schools.
Pursuing two methods of data collection procedure in PISA 2003 ensures high
confidence, high standard and high quality. The first method is to design, develop and
document procedures, to obtain the desired data. The second is to monitor and record
implementation of the documented procedures. At the international level, the PISA
consortium as an authorized unit and NPMs as practitioners worked together on quality
monitoring procedures –continuous process that recognizes potential problems and
challenges, and takes precautions in advance against operational problems– in order to
systematically collect, retrieve and store data in accordance with previously developed
manuals and described procedures. the NPM manual, test administrator manual, school
coordinator manual, school sampling preparation manual and the PISA data management
manual were created for quality monitoring procedures and developed quality monitoring
instruments, such as The National Center Quality Monitor (NCQM) interview schedule,
PISA Quality Monitor (PQM) instruments, NPM quality surveys, and a PISA test
administrator test session report (OECD, 2005b).

142
In the NPM manual, there is detailed information on the responsibilities and duties
of NPMs. They are responsible for organizing the preparation of national versions of the test
instruments, questionnaires, manuals, and coding guides and for implementing the PISA
2003 assessment. NPMs are also supposed to make some adaptations to the questionnaires
and manuals given by PISA consortium. A school sampling preparation manual gives
instruction for NPMs to document a school sampling plan, frame, and issues, i.e. a definition
of target population, and school level exclusions. A test administrator manual developed by
the PISA consortium explains the activities and responsibilities of test administrators (from
not participating schools and assessment domains) to provide and maintain fair, objective,
consistent and valid assessment and questionnaires administration.
The PISA consortium also prepared a school coordinator manual to give precise
instructions and describe the activities and responsibilities of the school coordinators. In
addition to these manuals, the PISA consortium prepared data entry software (KeyQuest) for
data from the test booklets and questionnaires. A data entry and management manual given
to NPMs explained all aspects of the KeyQuest, as well (OECD, 2004b, 2005b). These
comprehensive procedural manuals, quality monitoring procedures, and their application
provide a rigorous quality assurance system for valid data collection procedure and its
implementation.
3.2.4 Data Sources and Preliminary Statistical Procedures for Data Analyses
In the PISA 2003 study, the students’ responses in the assessment booklets and three
questionnaires (the student questionnaire, the information communication technology
questionnaire, and the educational career questionnaire, the last two being internationally
optional) simply constitutes the PISA 2003 dataset. In the PISA 2003 international database,
there are three data files: the student questionnaire file, the assessment items file, and the
school file. Their names are as follow, respectively: int_stui_2003.txt, int_cogn_2003.txt,
and int_schi_2003.txt. These files, in text or ASCII format, correspond to both Statistical
Package for the Social Sciences (SPSS) and Statistical Analysis Software (SAS). Besides the
observed data, the student questionnaire file (int_stui_2003.txt) also includes indexes (ICT
indexes, PVs for mathematical and problem solving literacy performance, and ESCS index)
drawn from the original items in the questionnaires. Therefore, the student questionnaire file
(int_stui_2003.txt) was selected to conduct statistical data analyses in this study.

143
Tabl
e 3.
10 IC
T A
spec
ts, Q
uest
ionn
aire
Que
stio
ns, F
orm
ats o
f Que
stio
nnai
re Q
uest
ions
, IC
T In
dexe
s, an
d Its
Item
s in
PISA
200
3
Asp
ects
Q
uest
ionn
aire
Q
uest
ions
Q
uest
ion
Form
at
Inde
xes
Item
s use
d to
der
ive/
calc
ulat
e IC
T In
dexe
s
Inte
rnet
/ En
terta
inm
ent U
se
(IN
TUSE
)
a)
The
Inte
rnet
to lo
ok u
p in
form
atio
n ab
out
peop
le, t
hing
s, or
idea
s b)
G
ames
on
a co
mpu
ter
c)
The
Inte
rnet
to c
olla
bora
te w
ith a
gro
up o
r te
am
d)
The
Inte
rnet
to d
ownl
oad
softw
are
e)
The
Inte
rnet
to d
ownl
oad
mus
ic
f)
A c
ompu
ter f
or e
lect
roni
c co
mm
unic
atio
n
(e.g
. e-m
ail o
r “ch
at ro
oms”
)
ICT
Use
H
ow o
ften
do y
ou u
se…
Like
rt-ty
pe
• A
lmos
t eve
ry d
ay
• A
few
tim
es e
ach
wee
k •
Bet
wee
n on
ce a
wee
k an
d on
ce a
mon
th
• Le
ss th
an o
nce
a m
onth
•
Nev
er
Prog
ram
/ So
ftwar
e U
se
(PR
GU
SE)
a)
Wor
d pr
oces
sing
(e.g
. Mic
roso
ft W
ord
or
Wor
d Pe
rfec
t b)
Sp
read
shee
ts (e
.g. L
otus
1-2
-3 o
r Mic
roso
ft Ex
cel
c)
Dra
win
g, p
aint
ing
or g
raph
ics p
rogr
ams o
n a
com
pute
r
d)
Educ
atio
nal s
oftw
are
such
as m
athe
mat
ics
prog
ram
s e)
Th
e co
mpu
ter t
o he
lp y
ou le
arn
scho
ol
mat
eria
l f)
Th
e co
mpu
ter f
or p
rogr
amm
ing
Con
fiden
ce in
R
outin
e Ta
sks
(RO
UTC
ON
F)
a)
Star
t a c
ompu
ter g
ame.
b)
O
pen
a fil
e.
c)
Cre
ate/
edit
a do
cum
ent.
d)
Scro
ll a
docu
men
t up
and
dow
n a
scre
en.
e)
Cop
y a
file
from
a fl
oppy
dis
k f)
Sa
ve a
com
pute
r doc
umen
t or f
ile.
g)
Prin
t a c
ompu
ter d
ocum
ent o
r file
. h)
D
elet
e a
com
pute
r doc
umen
t or f
ile.
i) M
oves
file
s for
m o
ne p
lace
to a
noth
er
on a
com
pute
r. j)
Play
com
pute
r gam
es.
k)
Dra
w p
ictu
res u
sing
a m
ouse
.
Con
fiden
ce in
In
tern
et T
asks
(I
NTC
ON
F)
a)
Get
on
to th
e In
tern
et.
b)
Cop
y or
dow
nloa
d fil
es fr
om th
e In
tern
et.
c)
Atta
ch a
file
to a
n em
ail m
essa
ge
d)
Dow
nloa
d m
usic
from
the
Inte
rnet
. e)
W
rite
and
send
em
ails
.
Self-
co
nfid
ence
in
ICT
How
wel
l ca
n yo
u do
ea
ch o
f the
se
task
s on
a co
mpu
ter?
Like
rt-ty
pe
• I c
an d
o th
is v
ery
wel
l by
mys
elf.
• I c
an d
o th
is w
ith
help
from
som
eone
. •
I kno
w w
hat t
his
mea
ns b
ut I
cann
ot d
o it.
•
I don
’t kn
ow w
hat
this
mea
ns
Con
fiden
ce in
IC
T H
igh
Leve
l Ta
sks
(HIG
HC
ON
F)
a)
Use
softw
are
to fi
nd a
nd g
et ri
d of
com
pute
r vi
ruse
s. b)
U
se a
dat
abas
e to
pro
duce
a li
st o
f ad
dres
ses.
c)
Cre
ate
a co
mpu
ter p
rogr
am (e
.g. i
n Lo
go,
Pasc
al, B
asic
)
d)
Use
a sp
read
shee
t to
plot
a g
raph
e)
C
reat
e a
pres
enta
tion
(e
.g. u
sing
<M
icro
soft
Pow
erPo
int>
). f)
C
reat
e a
mul
ti-m
edia
pre
sent
atio
n
(with
soun
d, p
ictu
res,
vide
. g)
C
onst
ruct
a W
eb p
age.
Atti
tude
s to
war
d C
ompu
ter
How
muc
h do
you
dis
agre
e or
agr
ee w
ith th
e fo
llow
ing
stat
emen
ts a
bout
yo
u an
d co
mpu
ters
?
Like
rt-ty
pe
• St
rong
ly a
gree
•
Agr
ee
• D
isag
ree
• St
rong
ly d
isag
ree
Atti
tude
s Tow
ard
Com
pute
rs
(ATT
CO
MP)
a)
It is
ver
y im
porta
nt to
me
to w
ork
with
a
com
pute
r. b)
To
pla
y or
wor
k w
ith a
com
pute
r is r
eally
fu
n.
c)
I use
a c
ompu
ter b
ecau
se I
am v
ery
inte
rest
ed.
d)
I los
e tra
ck o
f tim
e, w
hen
I am
wor
king
w
ith
the
com
pute
r.

144
The raw PISA 2003 dataset was obtained from the official PISA web site on the
Internet. In addition to obtaining the raw data file, some other files, such as codebooks,
questionnaires, and manuals etc., were taken from the official PISA web site, as well. These
files were used to understand and refine the raw data file in order to make it statistically
understandable and analyzable in SPSS and LISREL. In the raw data file, data are in both
nominal and scale measure, and the names and labels of variables are well-defined by the
expert statisticians of the OECD. Deleting unrelated variables and making some
modifications required by research questions make the huge dataset become smaller and
easily manageable. The procedures for refining and modifying the complete data file
(int_stui_2003.txt), such as filtering, creating variable and transforming, were as follow:
1. Students from the countries included in this study (see Table 3.1) were selected for
all statistical analyses. Students from the other counties were deleted from the data
file.
2. Students who used computers (those who answered the question “Have you ever
used a computer” with “yes”), were drawn from the selected data. The other students
were deleted from data file. Thus, the study sample was filtered.
3. A new nominal variable was created to identify the country groups (labeled as 1: the
EU member group, 2: the new EU member group, and 3: Turkey).
4. User missing and system missing values in ICT indexes and ESCS index were
transformed into system missing in the data file.
5. Two data files were derived after the fourth stage.
a) Students for whom all ICT indexes and ESCS index were non-missing were
filtered for one-way MANCOVA and ANCOVA analyses.
b) Students for whom at least one of the ICT indexes was non-missing were
filtered for testing proposed path analytic models.
6. Consequently, seven data files were obtained for statistical analyses:
a) One data file was derived at stage 5a to conduct a one-way MANCOVA and
ANCOVA analyses. Therefore, the following variables in parentheses were
obtained by deleting unrelated variables in the data file (INTUSE, PRGUSE,
ROUTCONF, INTCONF, HIGHCONF, ATTCOMP, ESCS, and Country
Groups).
b) Six separate data files were derived at stage 5b to test path analyses of
mathematical and problem solving literacy performance for the three
country groups. Therefore, the following variables in parentheses were
obtained by deleting unnecessary variables in the data file (INTUSE,
145
PRGUSE, ROUTCONF, INTCONF, HIGHCONF, ATTCOMP, ESCS,
MATHLIT (Pv1math, Pv2math, Pv3math, Pv4math, and Pv5math), and
PROBSOL (Pv1prob, Pv2prob, Pv3prob, Pv4prob, and Pv5prob). Then
three files for mathematical literacy performance models, one for each
country group, were obtained (including ICT indexes, ESCS and five
PVmaths), and the other three files for problem solving literacy performance
models, one for each country group, were obtained (including ICT indexes,
ESCS and five PVprobs).
3.2.5 Statistical Data Analyses in the study
After obtaining original data from the OECD official web site and following the
preliminary procedures above, the data files for this study were ready to conduct statistical
data analyses. Research questions and the nature of variables determined the statistical data
analyses -one-way MANCOVA, univariate ANCOVA and path analytic models- to be
conducted. SPSS 13.0 and LISREL 8.30, statistical package programs, were used for data
analyses. The information on quantitative research questions, variables and statistical
analyses are given in Table 3.11.
3.2.5.1 Descriptive Statistics for MANCOVA and ANCOVA
The variables used in one-way MANCOVA and ANCOVA to answer the first three
research questions are examined through the descriptive statistics in this section. Table 3.12
includes basic descriptive statistics, such as mean, standard deviation, skewness and kurtosis
for the three country groups. Skewness and kurtosis values indicate the shape of distribution
compared to normal distribution (Hair, Black, Babin, Anderson & Tatham, 2006). Most of
the skewness and kurtosis values of variables are between -2 and +2. According to Hair et al.
(2006) and Tabachnick and Fidel (1996), violation of the normality assumption for
multivariate statistics can have serious effects in small samples (less than 200 cases), but the
impact effectively diminishes when sample sizes reach 200 cases or more. In this study,
since the sample sizes are large, the normality assumption is said to be ensured.

146
Quan
titat
ive R
esea
rch
Ques
tions
IV
DV
s CO
Vs
Stat
istica
l Dat
a Ana
lyses
1. Ho
w do
ICT
use –
INTU
SE an
d PRG
USE–
diffe
r am
ong s
tuden
ts in
PISA
2003
acro
ss co
untry
grou
ps,
contr
olling
ATT
COM
P an
d ESC
S?
2. Ho
w do
self-
conf
idenc
e in I
CT –R
OUTC
ONF,
INTC
ONF a
nd H
IGHC
ONF–
diffe
r amo
ng st
uden
ts in
PISA
2003
acro
ss co
untry
grou
ps, c
ontro
lling
AT
TCOM
P an
d ESC
S?
INTU
SE
PRGU
SE
ROUT
CONF
INTC
ONF
HIGH
CONF
ATTC
OMP
ESCS
One-w
ay M
ANCO
VA an
d fo
llow
– ups
(ANC
OVA
& Co
ntras
t-K m
atrix
for
pairw
ise co
mpari
son)
for
the 1st an
d 2nd
resea
rch
ques
tions
3. Ho
w do
es A
TTCO
MP
differ
amon
g stud
ents
in PI
SA 20
03 ac
ross
coun
try gr
oups
, con
trolli
ng
ESCS
?
Statu
s of a
coun
try
grou
p in E
U
1: EU
Mem
ber G
roup
2:
New
EU M
embe
r Gro
up
3: Tu
rkey
(as
a ca
ndida
te sta
te)
ATTC
OMP
ESCS
Un
ivaria
te AN
COVA
for
the 3rd
rese
arch q
uesti
on
4. Ho
w we
ll do
ICT
relate
d fac
tors a
nd st
uden
t ba
ckgr
ound
varia
bles e
xplai
n vari
ance
s of P
ISA
2003
stud
ents’
math
emati
cal l
iterac
y perf
orma
nce
acro
ss co
untry
grou
ps?
MAT
HLIT
AT
TCOM
P
5. Ho
w we
ll do
ICT
relate
d fac
tors a
nd st
uden
t ba
ckgr
ound
varia
bles e
xplai
n vari
ance
s of P
ISA
2003
stud
ents’
prob
lem so
lving
litera
cy pe
rform
ance
ac
ross
coun
try gr
oups
?
Exogenous Variables
INTU
SE
PRGU
SE R
OUTC
ONF
INTC
ONF
HIGH
CONF
ES
CS
Endogenous Variables
PROB
SOL
ATTC
OMP
-
Recu
rsive
Path
Ana
lysis
with
obse
rved
varia
bles
for t
he 4th an
d 5th re
searc
h qu
estio
ns
IV: I
ndep
ende
nt Va
riable
DV
s: De
pend
ent V
ariab
les
COVs
: Cov
ariate
s IN
TUSE
: Inte
rnet/
enter
tainm
ent u
se
PRGU
SE: P
rogr
ams/s
oftw
are us
e RO
UTCO
NF: C
onfid
ence
in ro
utine
task
s
INTC
ONF:
Con
fiden
ce in
Inter
net t
asks
HI
GHCO
NF: C
onfid
ence
in hi
gh-le
vel t
asks
AT
TCOM
P: A
ttitud
es to
ward
comp
uters
ESCS
: Eco
nomi
c, So
cial, a
nd C
ultur
al St
atus o
f Stud
ents
MAT
HLIT
: Math
emati
cal L
iterac
y PR
OBSO
L: P
roble
m So
lving
Lite
racy
Tabl
e 3.
11 R
esea
rch
Que
stio
ns, V
aria
bles
and
Sta
tistic
al D
ata
Ana
lyse
s of Q
uant
itativ
e Ph
ase
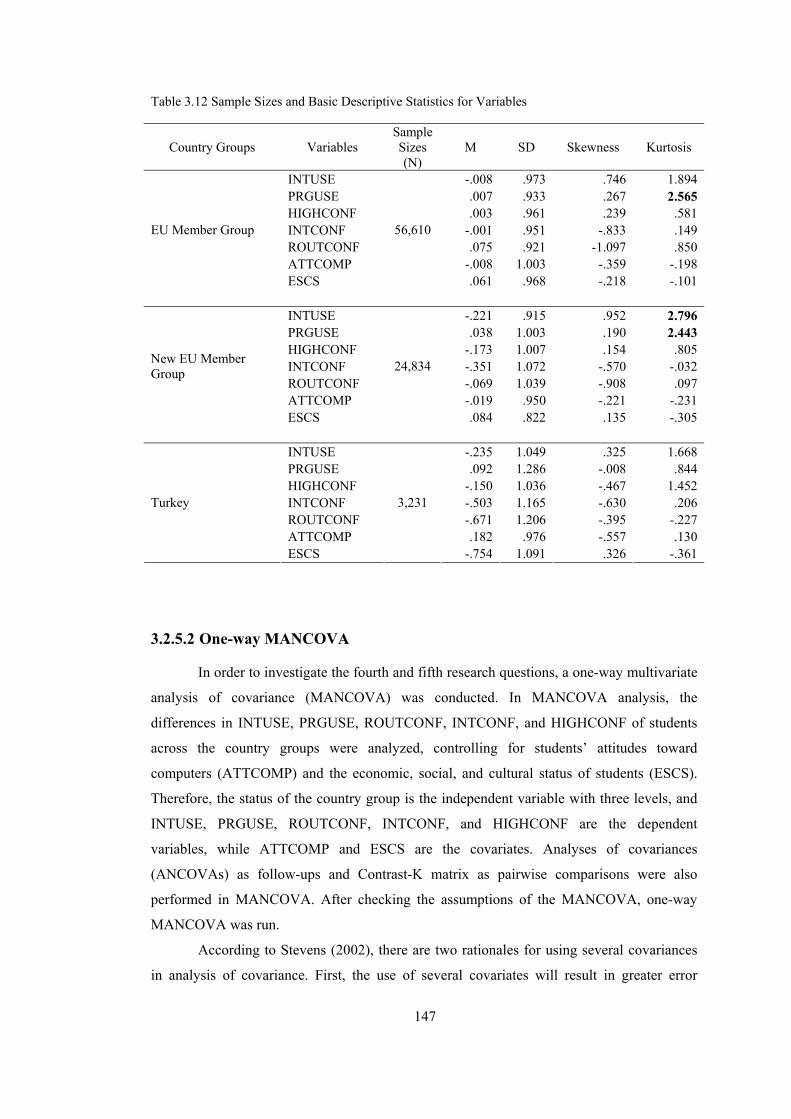
147
Table 3.12 Sample Sizes and Basic Descriptive Statistics for Variables
Country Groups Variables Sample Sizes (N)
M SD Skewness Kurtosis
INTUSE -.008 .973 .746 1.894 PRGUSE .007 .933 .267 2.565 HIGHCONF .003 .961 .239 .581 INTCONF -.001 .951 -.833 .149 ROUTCONF .075 .921 -1.097 .850 ATTCOMP -.008 1.003 -.359 -.198
EU Member Group
ESCS
56,610
.061 .968 -.218 -.101
INTUSE -.221 .915 .952 2.796 PRGUSE .038 1.003 .190 2.443 HIGHCONF -.173 1.007 .154 .805 INTCONF -.351 1.072 -.570 -.032 ROUTCONF -.069 1.039 -.908 .097 ATTCOMP -.019 .950 -.221 -.231
New EU Member Group
ESCS
24,834
.084 .822 .135 -.305
INTUSE -.235 1.049 .325 1.668 PRGUSE .092 1.286 -.008 .844 HIGHCONF -.150 1.036 -.467 1.452 INTCONF -.503 1.165 -.630 .206 ROUTCONF -.671 1.206 -.395 -.227 ATTCOMP .182 .976 -.557 .130
Turkey
ESCS
3,231
-.754 1.091 .326 -.361
3.2.5.2 One-way MANCOVA
In order to investigate the fourth and fifth research questions, a one-way multivariate
analysis of covariance (MANCOVA) was conducted. In MANCOVA analysis, the
differences in INTUSE, PRGUSE, ROUTCONF, INTCONF, and HIGHCONF of students
across the country groups were analyzed, controlling for students’ attitudes toward
computers (ATTCOMP) and the economic, social, and cultural status of students (ESCS).
Therefore, the status of the country group is the independent variable with three levels, and
INTUSE, PRGUSE, ROUTCONF, INTCONF, and HIGHCONF are the dependent
variables, while ATTCOMP and ESCS are the covariates. Analyses of covariances
(ANCOVAs) as follow-ups and Contrast-K matrix as pairwise comparisons were also
performed in MANCOVA. After checking the assumptions of the MANCOVA, one-way
MANCOVA was run.
According to Stevens (2002), there are two rationales for using several covariances
in analysis of covariance. First, the use of several covariates will result in greater error
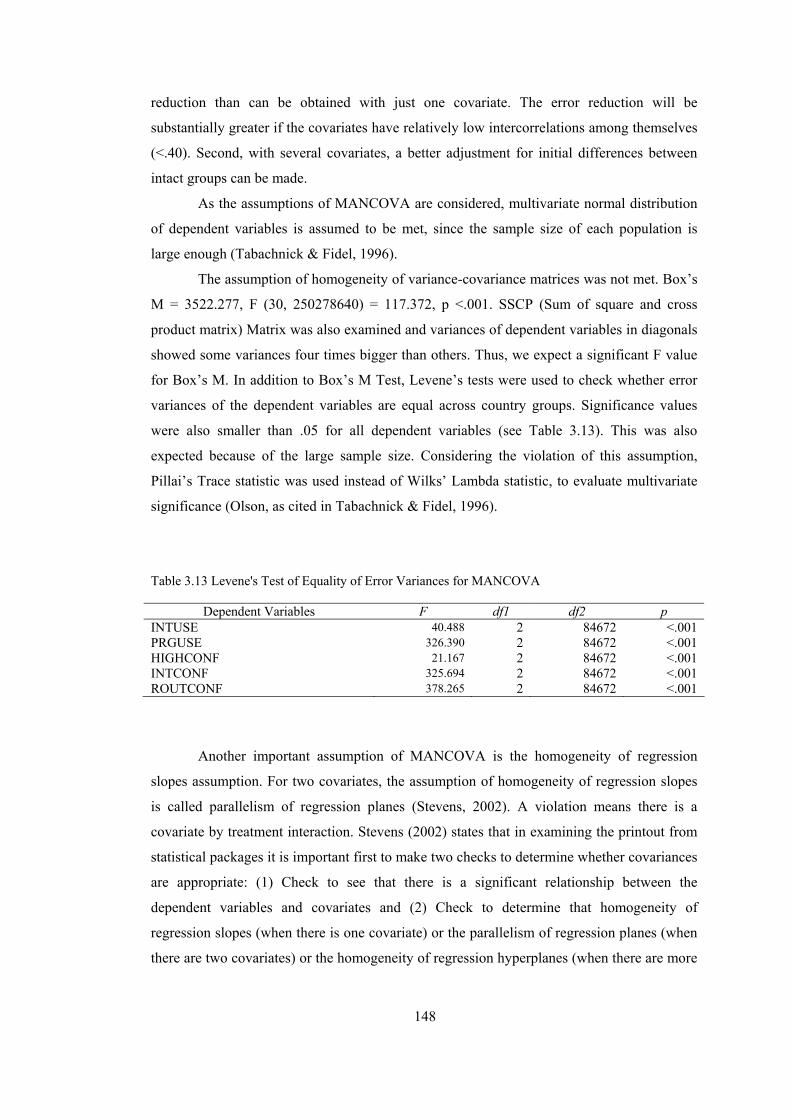
148
reduction than can be obtained with just one covariate. The error reduction will be
substantially greater if the covariates have relatively low intercorrelations among themselves
(<.40). Second, with several covariates, a better adjustment for initial differences between
intact groups can be made.
As the assumptions of MANCOVA are considered, multivariate normal distribution
of dependent variables is assumed to be met, since the sample size of each population is
large enough (Tabachnick & Fidel, 1996).
The assumption of homogeneity of variance-covariance matrices was not met. Box’s
M = 3522.277, F (30, 250278640) = 117.372, p <.001. SSCP (Sum of square and cross
product matrix) Matrix was also examined and variances of dependent variables in diagonals
showed some variances four times bigger than others. Thus, we expect a significant F value
for Box’s M. In addition to Box’s M Test, Levene’s tests were used to check whether error
variances of the dependent variables are equal across country groups. Significance values
were also smaller than .05 for all dependent variables (see Table 3.13). This was also
expected because of the large sample size. Considering the violation of this assumption,
Pillai’s Trace statistic was used instead of Wilks’ Lambda statistic, to evaluate multivariate
significance (Olson, as cited in Tabachnick & Fidel, 1996).
Table 3.13 Levene's Test of Equality of Error Variances for MANCOVA
Dependent Variables F df1 df2 p INTUSE 40.488 2 84672 <.001 PRGUSE 326.390 2 84672 <.001 HIGHCONF 21.167 2 84672 <.001 INTCONF 325.694 2 84672 <.001 ROUTCONF 378.265 2 84672 <.001
Another important assumption of MANCOVA is the homogeneity of regression
slopes assumption. For two covariates, the assumption of homogeneity of regression slopes
is called parallelism of regression planes (Stevens, 2002). A violation means there is a
covariate by treatment interaction. Stevens (2002) states that in examining the printout from
statistical packages it is important first to make two checks to determine whether covariances
are appropriate: (1) Check to see that there is a significant relationship between the
dependent variables and covariates and (2) Check to determine that homogeneity of
regression slopes (when there is one covariate) or the parallelism of regression planes (when
there are two covariates) or the homogeneity of regression hyperplanes (when there are more
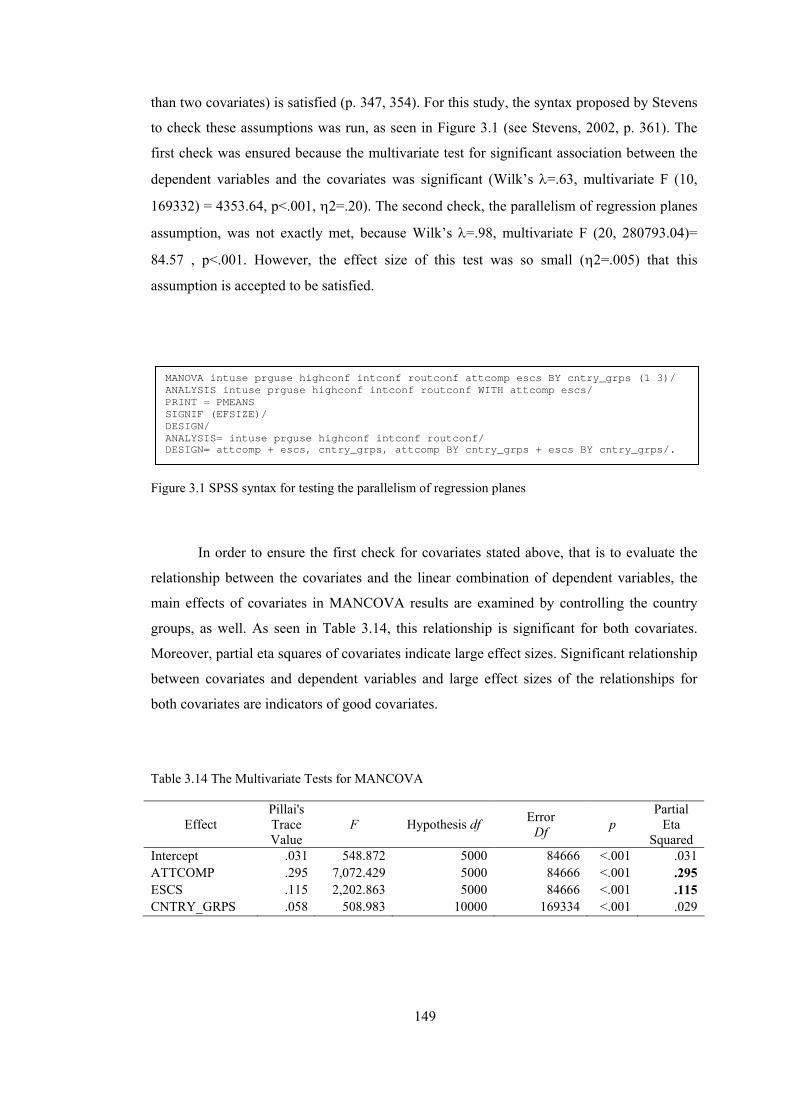
149
than two covariates) is satisfied (p. 347, 354). For this study, the syntax proposed by Stevens
to check these assumptions was run, as seen in Figure 3.1 (see Stevens, 2002, p. 361). The
first check was ensured because the multivariate test for significant association between the
dependent variables and the covariates was significant (Wilk’s λ=.63, multivariate F (10,
169332) = 4353.64, p<.001, η2=.20). The second check, the parallelism of regression planes
assumption, was not exactly met, because Wilk’s λ=.98, multivariate F (20, 280793.04)=
84.57 , p<.001. However, the effect size of this test was so small (η2=.005) that this
assumption is accepted to be satisfied.
Figure 3.1 SPSS syntax for testing the parallelism of regression planes
In order to ensure the first check for covariates stated above, that is to evaluate the
relationship between the covariates and the linear combination of dependent variables, the
main effects of covariates in MANCOVA results are examined by controlling the country
groups, as well. As seen in Table 3.14, this relationship is significant for both covariates.
Moreover, partial eta squares of covariates indicate large effect sizes. Significant relationship
between covariates and dependent variables and large effect sizes of the relationships for
both covariates are indicators of good covariates.
Table 3.14 The Multivariate Tests for MANCOVA
Effect Pillai's Trace Value
F Hypothesis df Error Df p
Partial Eta
Squared Intercept .031 548.872 5000 84666 <.001 .031 ATTCOMP .295 7,072.429 5000 84666 <.001 .295 ESCS .115 2,202.863 5000 84666 <.001 .115 CNTRY_GRPS .058 508.983 10000 169334 <.001 .029
MANOVA intuse prguse highconf intconf routconf attcomp escs BY cntry_grps (1 3)/ ANALYSIS intuse prguse highconf intconf routconf WITH attcomp escs/ PRINT = PMEANS SIGNIF (EFSIZE)/ DESIGN/ ANALYSIS= intuse prguse highconf intconf routconf/ DESIGN= attcomp + escs, cntry_grps, attcomp BY cntry_grps + escs BY cntry_grps/.
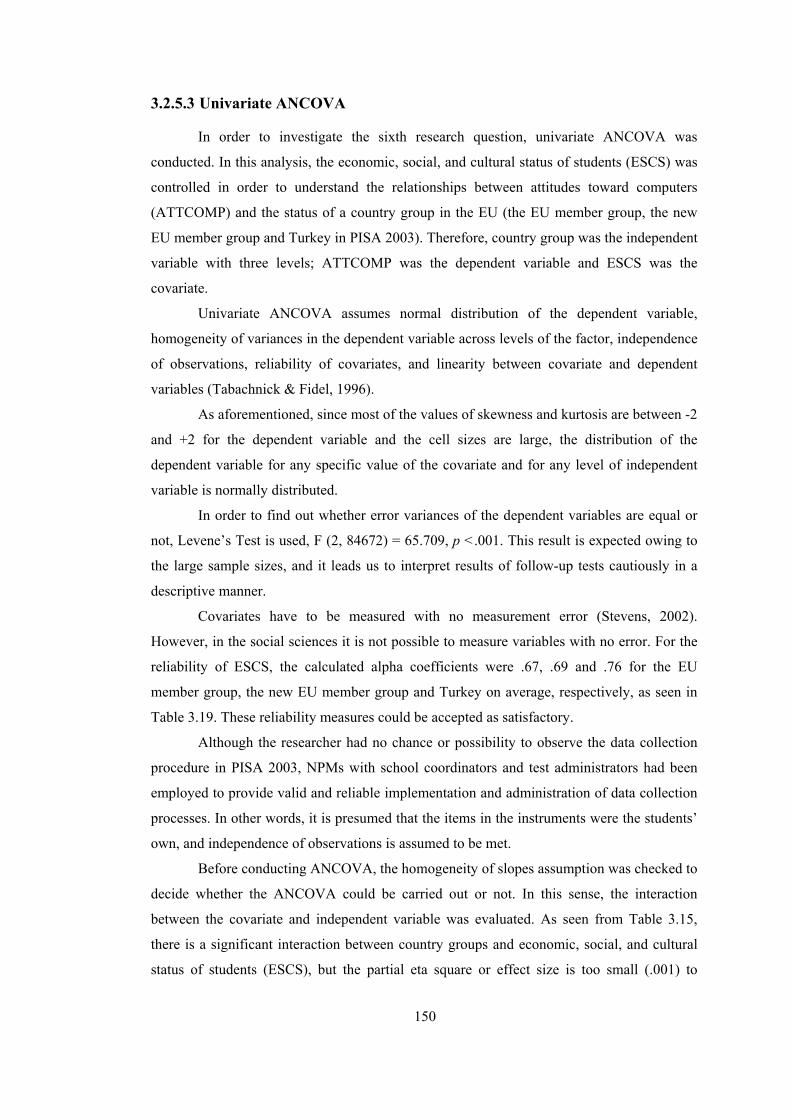
150
3.2.5.3 Univariate ANCOVA
In order to investigate the sixth research question, univariate ANCOVA was
conducted. In this analysis, the economic, social, and cultural status of students (ESCS) was
controlled in order to understand the relationships between attitudes toward computers
(ATTCOMP) and the status of a country group in the EU (the EU member group, the new
EU member group and Turkey in PISA 2003). Therefore, country group was the independent
variable with three levels; ATTCOMP was the dependent variable and ESCS was the
covariate.
Univariate ANCOVA assumes normal distribution of the dependent variable,
homogeneity of variances in the dependent variable across levels of the factor, independence
of observations, reliability of covariates, and linearity between covariate and dependent
variables (Tabachnick & Fidel, 1996).
As aforementioned, since most of the values of skewness and kurtosis are between -2
and +2 for the dependent variable and the cell sizes are large, the distribution of the
dependent variable for any specific value of the covariate and for any level of independent
variable is normally distributed.
In order to find out whether error variances of the dependent variables are equal or
not, Levene’s Test is used, F (2, 84672) = 65.709, p <.001. This result is expected owing to
the large sample sizes, and it leads us to interpret results of follow-up tests cautiously in a
descriptive manner.
Covariates have to be measured with no measurement error (Stevens, 2002).
However, in the social sciences it is not possible to measure variables with no error. For the
reliability of ESCS, the calculated alpha coefficients were .67, .69 and .76 for the EU
member group, the new EU member group and Turkey on average, respectively, as seen in
Table 3.19. These reliability measures could be accepted as satisfactory.
Although the researcher had no chance or possibility to observe the data collection
procedure in PISA 2003, NPMs with school coordinators and test administrators had been
employed to provide valid and reliable implementation and administration of data collection
processes. In other words, it is presumed that the items in the instruments were the students’
own, and independence of observations is assumed to be met.
Before conducting ANCOVA, the homogeneity of slopes assumption was checked to
decide whether the ANCOVA could be carried out or not. In this sense, the interaction
between the covariate and independent variable was evaluated. As seen from Table 3.15,
there is a significant interaction between country groups and economic, social, and cultural
status of students (ESCS), but the partial eta square or effect size is too small (.001) to

151
violate the homogeneity of slopes assumption. Besides, this significant interaction between
country groups and ESCS is likely to stem from the large sample sizes. Thus, the
homogeneity of slopes assumption is accepted as met.
Table 3.15 The Results of the Test of Homogeneity of Slopes for ANCOVA
Source Type III Sum of Squares
df Mean Square F Sig. Partial
Eta Squared
CNTRY_GRPS * ESCS 73.765 2 36.883 37.976 <.001 .001
3.2.5.4 Descriptive Statistics for Path Analytic Models
The variables that are used in path analytic models to answer the seventh and eighth
research questions are examined through the descriptive statistics in this section. Table 3.16
includes basic descriptive statistics, such as sample sizes, mean, standard deviation,
skewness and kurtosis for the three country groups.
Table 3.16 Sample Size and Basic Descriptive Statistics for Path Analytic Models
Country Groups Variables Sample Size (N) M SD Skewness Kurtosis
INTUSE -.012 .977 .732 1.875 PRGUSE .004 .939 .259 2.542 HIGHCONF .065 .930 -1.099 .886 INTCONF -.006 .955 -.834 .165 ROUTCONF .000 .965 .225 .593 ATTCOMP -.009 1.005 -.363 -.189 ESCS .054 .971 -.218 -.102 Pv1math 509.281 95.872 -.134 -.099 Pv2math 509.320 95.510 -.137 -.103 Pv3math 509.260 95.579 -.140 -.109 Pv4math 509.457 95.593 -.124 -.110 Pv5math 509.342 95.430 -.132 -.117 MATHLIT (average) 509.332 95.597 -.133 -.108
Pv1prob 51.372 93.897 -.272 .086 Pv2prob 51.474 93.892 -.284 .088 Pv3prob 51.328 93.741 -.285 .073 Pv4prob 51.458 93.815 -.273 .092 Pv5prob 51.533 93.762 -.261 .059
EU Member Group
PROBSOL (average)
57,787
51.433 93.822 -.275 .080

152
Table 3.16 Continued.
Country Groups Variables Sample Size (N)
M SD Skewness Kurtosis
INTUSE -.226 .919 .928 2.766 PRGUSE .033 1.011 .183 2.401 HIGHCONF -.081 1.047 -.909 .143 INTCONF -.357 1.075 -.569 -.034 ROUTCONF -.177 1.009 .147 .799 ATTCOMP -.023 .951 -.221 -.226 ESCS .074 .824 .132 -.275 Pv1math 508.671 92.944 .017 -.161 Pv2math 508.757 93.404 .004 -.145 Pv3math 508.729 93.092 .023 -.190 Pv4math 508.536 93.417 .000 -.185 Pv5math 508.903 93.297 .009 -.209 MATHLIT (average) 508.673 93.214 .011 -.170
Pv1prob 508.074 91.907 -.105 -.069 Pv2prob 508.333 92.036 -.115 .019 Pv3prob 508.351 92.060 -.115 -.038 Pv4prob 508.082 92.331 -.117 -.053 Pv5prob 508.355 91.966 -.110 -.069
New EU Member Group
PROBSOL (average)
25,359
508.210 92.083 -.113 -.035
INTUSE -.240 1.059 .284 1.538 PRGUSE .096 1.302 .000 .799 HIGHCONF -.705 1.197 -.344 -.245 INTCONF -.524 1.163 -.600 .173 ROUTCONF -.153 1.038 -.454 1.397 ATTCOMP .168 .977 -.550 .133 ESCS -.814 1.093 .338 -.283 Pv1math 436.941 105.364 .481 .381 Pv2math 435.255 104.745 .425 .185 Pv3math 436.691 104.794 .485 .243
Turkey
Pv4math
3,590
436.052 105.297 .461 .209 Pv5math 437.167 103.378 .429 .124 MATHLIT (average) 436.296 104.968 .463 .270
Pv1prob 419.336 94.440 .272 .446 Pv2prob 418.582 94.017 .282 .279 Pv3prob 418.989 94.387 .315 .235 Pv4prob 419.347 94.999 .324 .294 Pv5prob 419.389 93.134 .324 .288
Turkey
PROBSOL (average)
418.969 94.281 .290 .320
As mentioned before, since the sample sizes of the groups are large, the distributions
of dependent variables in country groups are assumed to be normal (Hair et al., 2006).
Therefore, the assumption of normality for SEM analyses is already ensured.
Table 3.17 represents the correlations among the predictor variables used in
mathematical and problem solving literacy performance models for each country group.

153
Most of the correlations among ICT indexes are medium or large according to Cohen’s
classification (Cohen, 1977). ESCS has generally medium level correlations with INTUSE,
ROUTCONF, and INTCONF in Turkey and the new EU member group, whereas these
correlations are relatively smaller in the EU member group.
Table 3.17 Correlation Matrix of the Predictor Variables in Mathematical and Problem Solving Literacy Performance Models for Country Groups
EU Member Group ATTCOMP INTUSE PRGUSE ROUTCONF INTCONF HIGHCONF ESCS ATTCOMP 1.00 INTUSE 0.49 1.00 PRGUSE 0.39 0.53 1.00 ROUTCONF 0.39 0.38 0.31 1.00 INTCONF 0.38 0.58 0.29 0.62 1.00 HIGHCONF 0.44 0.51 0.50 0.58 0.61 1.00 ESCS 0.02 0.18 0.06 0.21 0.28 0.15 1.00
New EU Member Group ATTCOMP INTUSE PRGUSE ROUTCONF INTCONF HIGHCONF ESCS ATTCOMP 1.00 INTUSE 0.42 1.00 PRGUSE 0.37 0.57 1.00 ROUTCONF 0.39 0.41 0.43 1.00 INTCONF 0.36 0.60 0.39 0.64 1.00 HIGHCONF 0.40 0.53 0.54 0.61 0.70 1.00 ESCS 0.07 0.26 0.19 0.36 0.34 0.25 1.00
Turkey ATTCOMP INTUSE PRGUSE ROUTCONF INTCONF HIGHCONF ESCS
ATTCOMP 1.00 INTUSE 0.37 1.00 PRGUSE 0.29 0.67 1.00 ROUTCONF 0.43 0.38 0.38 1.00 INTCONF 0.41 0.52 0.34 0.68 1.00 HIGHCONF 0.40 0.48 0.52 0.67 0.67 1.00 ESCS 0.13 0.27 0.14 0.36 0.36 0.22 1.00
3.2.5.5 Path Analytic Models
In order to specify and investigate the relationships between ICT aspects, students’
family backgrounds and mathematical literacy performance, and problem solving literacy
performance across country groups, substantive conceptual models were generated to answer
fourth and fifth research questions. As given Table 3.11, the exogenous (i.e predictor)
variables are PRGUSE: Programs/software use, INTUSE: Internet/entertainment use,
ROUTCONF: Confidence in routine tasks, INTCONF: Confidence in Internet, tasks,
HIGHCONF: Confidence in high-level tasks, and ESCS: Economic, Social, and Cultural

154
Status of Students; and endogenous (i.e. criterion) variables are ATTCOMP: Attitudes
toward computers, MATHLIT: Mathematical Literacy Performance, and PROBSOL:
Problem Solving Literacy Performance.
The path analytic models, constructed in connection with theoretical concepts and
constructs, were estimated through the structural equation modeling (SEM) approach with
LISREL (LInear Structural RELationship) software. SEM is a collection and an extension of
several multivariate statistical methods (factor analysis, MANOVA, and multiple regression
etc.) designed to examine a set or a series (not only a single) of relationships between
variables and to test whether data fit a causal theoretical model. As defined by Wright
(1934), “path analysis is a technique to assess the direct causal contribution of one variable
to another in a nonexperimental situation” (as cited in Jöreskog and Sörbom, 1993, p. 11).
Path analysis, one of the models performed in LISREL or one of the special types of SEM, is
a way to visualize relationships of variables along with estimated coefficients (Ullman,
1996).
There are several reasons for conducting SEM (the path analytic model with
observed variables) instead of multivariate statistical analyses in this study, but the major
ones are: first, SEM considers an overall model as a system of equations and it also estimates
all the coefficients directly rather than estimating each equation separately (Jöreskog &
Sörbom, 1993, p.11); second, SEM enables both an overall test of model fit and individual
parameter estimates simultaneously; third, SEM also unifies several multivariate methods
into one analytic framework to test simultaneously the estimation of multiple
equations/interrelated relationships with/between multiple dependent and independent
variables in a single model.
Although path analytic models are categorized into several types, two basic forms of
models are the recursive and nonrecursive ones. If all directions of paths move in one
direction with no feedback direction and no reciprocal patterns in any path diagram, this path
analytic model is called as a recursive path analysis. The path analytic models in this study,
therefore, are recursive ones.
In order to increase the comprehensibility of basic shapes, key terms, and concepts
about path analysis as a type of SEM, some definitions and explanations are given in Table
3.18 and below:
Path Diagram: A visual representation of a model and a complete set of relationships among
the variables of model.
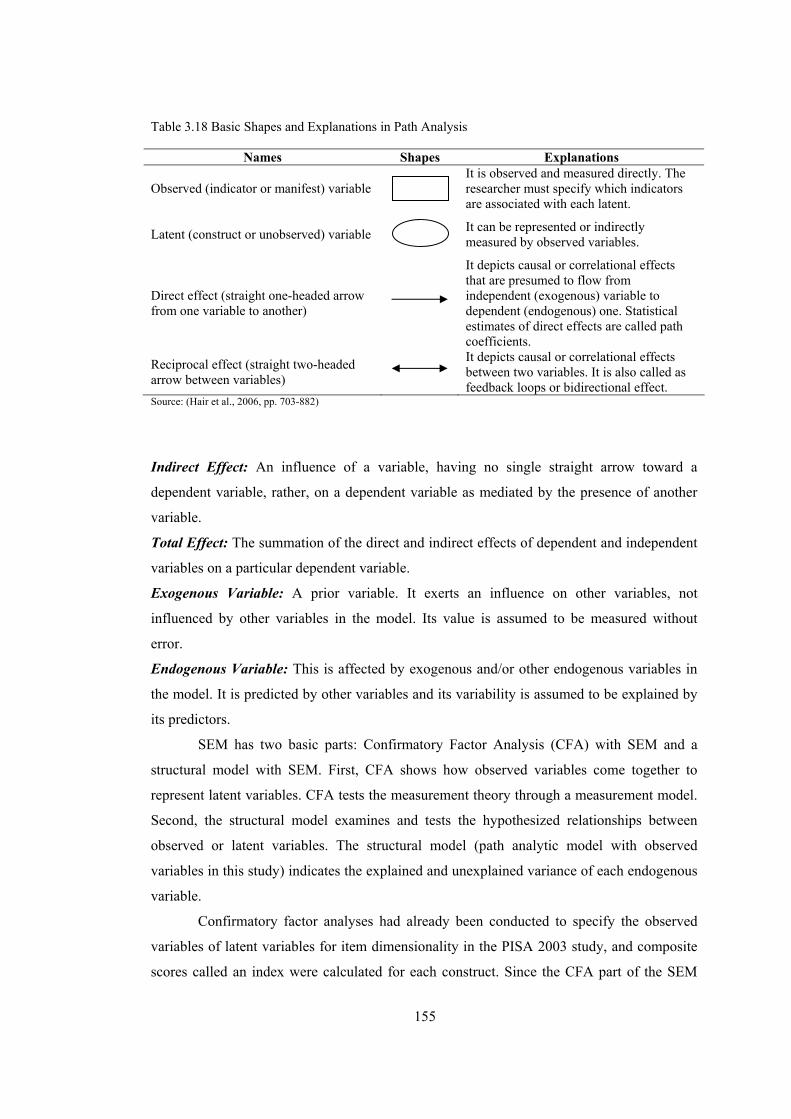
155
Table 3.18 Basic Shapes and Explanations in Path Analysis
Names Shapes Explanations Observed (indicator or manifest) variable
It is observed and measured directly. The researcher must specify which indicators are associated with each latent.
Latent (construct or unobserved) variable
It can be represented or indirectly measured by observed variables.
Direct effect (straight one-headed arrow from one variable to another)
It depicts causal or correlational effects that are presumed to flow from independent (exogenous) variable to dependent (endogenous) one. Statistical estimates of direct effects are called path coefficients.
Reciprocal effect (straight two-headed arrow between variables)
It depicts causal or correlational effects between two variables. It is also called as feedback loops or bidirectional effect.
Source: (Hair et al., 2006, pp. 703-882) Indirect Effect: An influence of a variable, having no single straight arrow toward a
dependent variable, rather, on a dependent variable as mediated by the presence of another
variable.
Total Effect: The summation of the direct and indirect effects of dependent and independent
variables on a particular dependent variable.
Exogenous Variable: A prior variable. It exerts an influence on other variables, not
influenced by other variables in the model. Its value is assumed to be measured without
error.
Endogenous Variable: This is affected by exogenous and/or other endogenous variables in
the model. It is predicted by other variables and its variability is assumed to be explained by
its predictors.
SEM has two basic parts: Confirmatory Factor Analysis (CFA) with SEM and a
structural model with SEM. First, CFA shows how observed variables come together to
represent latent variables. CFA tests the measurement theory through a measurement model.
Second, the structural model examines and tests the hypothesized relationships between
observed or latent variables. The structural model (path analytic model with observed
variables in this study) indicates the explained and unexplained variance of each endogenous
variable.
Confirmatory factor analyses had already been conducted to specify the observed
variables of latent variables for item dimensionality in the PISA 2003 study, and composite
scores called an index were calculated for each construct. Since the CFA part of the SEM
156
was completed in the PISA 2003 study (OECD, 2005b), this study focused mainly on testing
hypothesized relationships among variables in path analyses with observed variables. Note
that indexes and plausible values are used as observed variables in the models.
As Adams indicated, PVs are not students’ test scores and they are randomly
generated values, extracted from the distribution of scores for each individual (as cited in
OECD, 2005b). In the PISA 2003 student data file, there are 40 PVs. Mathematical literacy
as a major domain has 25 of them, 20 for the mathematical literacy subscales –space and
shape, change and relationship, uncertainty and quantity– and 5 for the combined
mathematical literacy scale. The other literacy domains, as minor ones, have 15 plausible
values: 5 for problem solving literacy, 5 for reading literacy and 5 for science literacy
(OECD, 2005b). In this study, five plausible values from PV1MATH to PV5MATH
(MATHLIT) for combined mathematical literacy performance and five plausible values from
PV1PROB to PV5PROB (PROBSOL) for problem solving literacy performance are used as
observed variables to represent mathematical, and problem solving literacy performance.
As the PISA 2003 Technical Report (OECD, 2005b) explains, the statistical analyses
involving plausible values should be run five times, each for one relevant plausible variable,
and the results should be averaged. Therefore, the path analyses were conducted five times
for mathematical, and five times for problem solving literacy performance models and their
results –p-values, t-values, estimates, error variances, and goodness-of-fit indexes etc.- were
averaged for mathematical and problem solving literacy performance models separately in
this study.
In order to conduct a path analytic model as a structural model in SEM, the indexes -
INTUSE, PRGUSE, INTCONF, ROUTCONF, HIGHCONF, ATTCOMP, and ESCS- and
plausible values (PVs) -MATHLIT and PROBSOL- were analyzed with LISREL 8.30 with
SIMPLIS Command Language.
In literature, SEM applications have several stages to develop and test measurement
and structural models. These stages are (1) defining individual constructs, (2) developing the
overall measurement model, (3) designing a study to produce empirical results, (4) assessing
the measurement model validity, (5) specifying the structural model and (6) assessing the
structural model validity (Hair et al., 2006). The first four stages belong to the measurement
model and last two stages belong to the structural model. Since the first four stages of SEM
applications had already been completed by PISA, the only last two stages were conducted
through reanalyzing the PISA 2003 dataset in this study.
Assessing the structural model validity stage requires testing the validity of the
structural model and its corresponding hypothesized relationships. The validation of
157
measurement model in stage four is a precondition for the specifying structural model and
assessing the structural model validity. Similar to measurement model assessment, structural
model assessment uses fit indexes to test how well a researcher’s theory of specified
structural relationships among variables really matches reality (Hair et al., 2006).
In order to asses fit indexes and statistically evaluate the structural model, the most
common fit indexes are used in this study, such as Chi-Square (χ2), Goodness of Fit Index
(GFI), Adjusted Goodness of Fit Index (AGFI), Root Mean Square Error of Approximation
(RMSEA), Standardized Root Mean Square Residual (S-RMR). These are explained below.
Chi-Square (χ2): In practice, chi-square is the fundamental measure of overall model fit, and
the other fit measures are functions of chi-square. A chi-square (χ2) test gives a statistical
test of the difference in the observed sample covariance matrix and SEM estimated
covariance matrix. This difference in these covariance matrices is the key value in
understanding how well the model specified. In other words, a non significant chi-square
value indicates that these matrices are not statistically different. This is exactly what the
researcher desired. Therefore, a small chi-square corresponds to a good fit, a large chi-square
corresponds to a bad fit, and a zero chi-square corresponds to a perfect fit. However, chi-
square is very sensitive to sample size due to its mathematical formula, and studies with
large sample sizes tend to produce significant probability (p-value). Since the sample sizes of
country groups in this study are considerably large, the other goodness-of-fit indexes are also
taken into account (Jöreskog and Sörbom, 1993; Hair et al., 2006).
Goodness-of-Fit Index (GFI): The goodness-of-fit index is less sensitive to sample size, but
it is still indirectly sensitive to sample size due to the effect of sample size on sampling
distribution. Nonetheless, the goodness-of-fit index can be proposed to reduce the effect of
sample size. The values of goodness-of-fit index theoretically range from 0 (poor fit) to 1
(perfect fit). Although there is inconsistency in setting the value of a goodness-of-fit index, a
value exceeding .90 is commonly accepted as a good fit (Hair et al., 2006).
Adjusted Goodness of Fit Index (AGFI): The AGFI is the GFI adjusted for the degrees of
freedom of a model relative to the number of variables. This fit index is generally used for
more complex models considering differing degrees of model complexity. No statistical test
is associated with either GFI or AGFI, only guidelines exist to fit. As with GFI, exceeding
.90 is assumed to be a good fit for AGFI. GFI and AGFI are less sensitive to sample size
than chi-square (Hair et al., 2006).
Root Mean Square Error of Approximation (RMSEA): This index is computed on the basis
of the analysis of residuals and adjusts for degrees of freedom. It tries to correct for both
model complexity and sample size by including each in its computation. RMSEA also

158
considers the error of approximation in the population. Moreover, the confidence interval
can be constructed in RMSEA by giving the range of RMSEA values for a given level of
confidence. A test of significance of the RMSEA is provided by LISREL and the RMSEA
values of less than .05 are accepted as indicating a better fit (Hair et al., 2006).
Standardized Root Mean Square Residual (S-RMR): This is the average difference between
the predicted and observed variances and covariances in the model, based on standardized
residuals. Standardized residuals are fitted residuals divided by the standard error of the
residual. S-RMR residuals are calculated for every possible covariance. The smaller the
standardized RMR, the better the model fit. Values of less than .05 are generally interpreted
as a good fit (Hair et al., 2006).
3.2.6 Validity and Reliability
In any research, Fraenkel and Wallen (2000, p. 169) define validity as “referring to
the appropriateness, meaningfulness, and usefulness of the specific inferences researchers
make based on data they collect”. According to Smith, high validity largely depends on
constructs consisting of observable variables; therefore, validity is higher in direct measuring
than in indirect measuring (as cited in Karasar, 1995). The concept of reliability is simpler
than that of validity. Reliability alone is necessary for validity, but it is not sufficient to
verify validity. In reliability, following same processes and using the same criteria give the
same measures or findings, -that is, reliably concerns consistency among independent
measurements of whatever the instrument measures for the same thing.
3.2.6.1 Content-Related Validity
In PISA 2003, students are required to respond to assessment instruments for various
literacy performance and student and ICT questionnaires as mentioned before. Content-
related validity focuses mainly on the content and format of instruments and questionnaires
to logically measure what was intended as determined by experts. Since the PISA 2003
assessment aims international comparisons, what is critical is to ensure content-related
evidence of validity, considering the language and cultural settings of the instruments’
content and format. In order to provide this, the PISA consortium experts worked
collaboratively with test developers, expert groups, a national expert from Mathematics
Forum, and so forth, on issues such as the development of assessment frameworks, test
development procedures, item submission guidelines, national and international review of
items, and translation (OECD, 2004b, 2005b).

159
The development of the PISA 2003 assessment frameworks was an initial and most
important phase of test development process. These assessment frameworks, approved by the
PGB, are used as a guideline in determining the definition of the literacy domains, the scope
of the assessment instruments, the number of items for each component in the domain, and
question types (OECD, 2005b).
In test development procedures, cognitive laboratory procedures are used as a new
kind of review and refinement test development methodology. By using this methodology,
weakly working items may be taken out before the field test, and an item pool is created.
Moreover, this methodology provides test developers trained by the consortium in this new
methodology with evidence on student responses that reflects the student’s actual cognitive
activities, as necessitated for the assessment item (OECD, 2005b).
Since PISA 2003 assessment is internationally comparative, the items in the
instruments are drawn from a consideration of different languages and cultural settings. In
order to support this situation, item submission guidelines of mathematical and problem
solving literacy domains were developed and distributed to NPMs. The inclusive and
detailed information on how to write items, sample items, and a submission form are given
in the item submission guidelines. Consortium test developers worked on all the submitted
items (OECD, 2005b).
Test developers and translation staff translated items from English to French in order
to obtain a double source language. Many revisions were made on items in the translation
and verification process, with the help of experts in French. This translation, as an initial
process, facilitated item translations into other languages in such a way that modification of
wording and identification of items provided a more accurate translation into other
languages. All selected items were edited by professional editors in terms of their
grammatical consistency, textual and layout regularities. So as to obtain a high quality in the
final product, the English and French versions of booklets, including items, clusters and
other materials for the field trial, distributed to all countries. All national centers adapted and
translated all selected items into their own languages (OECD, 2005b).
In the translation process, detailed adaptations, translation guidelines and strict
verification procedures were followed to translate the two source versions of the assessment
instruments, and the questionnaires, in English and French into their national language and
then reconcile them into one national version. A double translation procedure, requiring two
independent translations from two different source languages to one target language, was
followed. Then, a third person, a reconciler, reconciled them into one. Two national
translators, one reconciler and one verifier were used to provide linguistic equivalence
160
between source and target languages. Both national translators were trained and their
translations were verified by international translators appointed by the PISA consortium
(OECD, 2005b).
NPMs in national centers reviewed the items and gave feedback based on item
review guidelines. Besides, they identified, commented on, and rated items considering
differences as curricular and non-curricular, translation, and any other cultural issues in the
relatedness, appropriateness, and acceptability of different cultural, and contexts. The given
feedback generally brought about more revisions to the items. Then, mathematics items were
reviewed by national experts who participated in an international mathematics forum. The
problem solving items are also reviewed and revised by pertinent expert groups (OECD,
2005b).
3.2.6.2 Construct-Related Validity
Construct-related evidence of validity is necessary to compare student performances
on the basis of comparable constructs (indexes) drawn from instruments in international
educational-comparative studies. In the field trial process, the questionnaires with the
achievement test in PISA 2003 were used to develop constructs in all participating countries
during the two years prior to the main assessment. In order to review the dimensional
structure of questionnaire items and to determine constructs with items in the questionnaires,
exploratory and confirmatory factor analyses were performed to constitute constructs in field
trial data across countries. Cross-country validation of constructs is concerned with similar
characteristics, attitudes and perceptions in different national and cultural contexts.
Confirmatory factor analysis is used to acquire a theoretical model of item dimensionality,
and structural equation modeling (SEM) is used to confirm theoretically expected
dimensions. SEM also explores the validity of comparisons across countries (OECD, 2004b,
2005b).
The constructs -especially ICT related indexes and ESCS index- for this research are
derived from student and ICT questionnaires in the PISA 2003 study. Constructs of this
study are used to explore relationships in ICT aspects and the economic, social, and cultural
status of students across country groups (OECD, 2005b).
3.2.6.3 Reliability
A separate reliability analysis was conducted to obtain constructs’ internal-
consistency estimates of reliability for each country in the country groups. These constructs
are ICT indexes and the ESCS index. The internal-consistency estimates of reliabilities
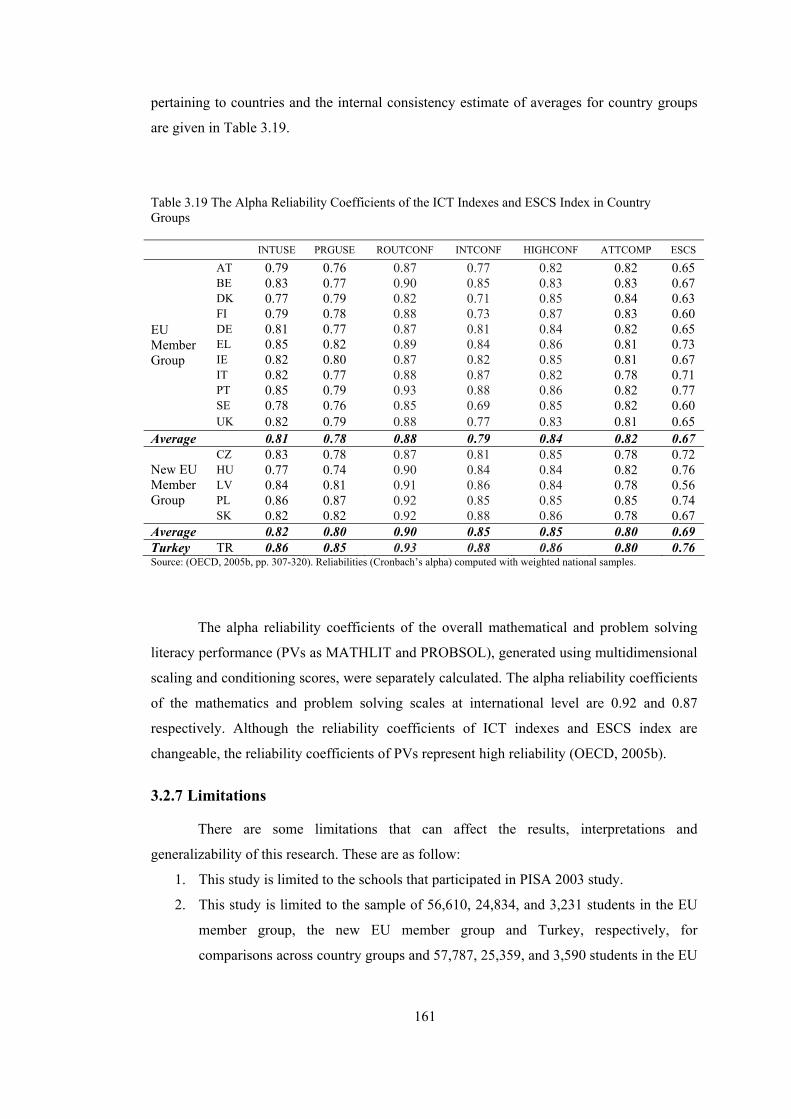
161
pertaining to countries and the internal consistency estimate of averages for country groups
are given in Table 3.19.
Table 3.19 The Alpha Reliability Coefficients of the ICT Indexes and ESCS Index in Country Groups
INTUSE PRGUSE ROUTCONF INTCONF HIGHCONF ATTCOMP ESCS
AT 0.79 0.76 0.87 0.77 0.82 0.82 0.65 BE 0.83 0.77 0.90 0.85 0.83 0.83 0.67 DK 0.77 0.79 0.82 0.71 0.85 0.84 0.63 FI 0.79 0.78 0.88 0.73 0.87 0.83 0.60 DE 0.81 0.77 0.87 0.81 0.84 0.82 0.65 EL 0.85 0.82 0.89 0.84 0.86 0.81 0.73 IE 0.82 0.80 0.87 0.82 0.85 0.81 0.67 IT 0.82 0.77 0.88 0.87 0.82 0.78 0.71 PT 0.85 0.79 0.93 0.88 0.86 0.82 0.77 SE 0.78 0.76 0.85 0.69 0.85 0.82 0.60
EU Member Group
UK 0.82 0.79 0.88 0.77 0.83 0.81 0.65 Average 0.81 0.78 0.88 0.79 0.84 0.82 0.67
CZ 0.83 0.78 0.87 0.81 0.85 0.78 0.72 HU 0.77 0.74 0.90 0.84 0.84 0.82 0.76 LV 0.84 0.81 0.91 0.86 0.84 0.78 0.56 PL 0.86 0.87 0.92 0.85 0.85 0.85 0.74
New EU Member Group
SK 0.82 0.82 0.92 0.88 0.86 0.78 0.67 Average 0.82 0.80 0.90 0.85 0.85 0.80 0.69 Turkey TR 0.86 0.85 0.93 0.88 0.86 0.80 0.76 Source: (OECD, 2005b, pp. 307-320). Reliabilities (Cronbach’s alpha) computed with weighted national samples.
The alpha reliability coefficients of the overall mathematical and problem solving
literacy performance (PVs as MATHLIT and PROBSOL), generated using multidimensional
scaling and conditioning scores, were separately calculated. The alpha reliability coefficients
of the mathematics and problem solving scales at international level are 0.92 and 0.87
respectively. Although the reliability coefficients of ICT indexes and ESCS index are
changeable, the reliability coefficients of PVs represent high reliability (OECD, 2005b).
3.2.7 Limitations
There are some limitations that can affect the results, interpretations and
generalizability of this research. These are as follow:
1. This study is limited to the schools that participated in PISA 2003 study.
2. This study is limited to the sample of 56,610, 24,834, and 3,231 students in the EU
member group, the new EU member group and Turkey, respectively, for
comparisons across country groups and 57,787, 25,359, and 3,590 students in the EU

162
member group, the new EU member group and Turkey, respectively, for path
analytic models.
3. The PISA study provides only observational data, that is, students who used ICT are
not randomly divided into a treatment group using ICT facilities and a control group
not using ICT facilities. In other words, in contrast to randomized experimental
design, the country groups used in this study are intact groups. As Stevens indicates,
inferring cause-effect from intact groups is untrustworthy, regardless of the type of
statistical analysis. Thus, the task is to do one’s best and exercise considerable
caution (Stevens, 2002). In this sense, the result of this study has to be interpreted
cautiously in the manner of descriptive conditional correlations, which do not
necessarily allow for causal inferences. In fact, the results may also reflect effects of
other factors, like unobservable characteristics of students and schools.
4. This study is limited to the honesty of the subjects’ responses to student and ICT
questionnaires in the PISA 2003 study.
5. This research is only focused on the aspects of ICT, students’ family background
and mathematical and problem solving literacy domains in the PISA 2003 study.
3.2.8 Missing Data Analysis
There are four types of missing data in the PISA 2003 study. According to the PISA
2003 Technical Report (2005b), they can be explained as follow:
1. Item level non-response: where items are not responded to, although the subjects
were expected to answer.
2. Multiple or invalid responses: if there are invalid responses or more than one
alternative answers for multiple choice question, they are accepted as missing data.
3. Not applicable: if items are not possible for respondents to answer because of some
reasons such as misprinting, deletion and not administering the questions, these are
also accepted as missing data.
4. Not reached items: if a cluster of items have no responses starting from the end of
each test session, they coded as not-reached, except for the first value of the missing
series, which is coded as missing.
Since user-missing and system-missing in data file are transformed into system-
missing in preliminary statistical procedure, and a listwise deletion method was preferred
and used in the handing of the missing data in one-way MANCOVA and ANCOVA
analyses, missing data analysis is not conducted for these analyses.

163
Missing data must always be addressed if missing data are more than 10% of the
data items (Hair et al., 2006). There was no missing value in sets of PVs for mathematical
and problem solving literacy performance, so there was no need to conduct missing data
analyses for PVs before SEM analyses. However, when the ICT indexes were analyzed
separately to examine the size of the missing percentages for each of the country groups,
there were missing values in the ICT indexes. As seen from Table 3.20, the percentages of
missing values in ICT indexes ranged from 0.4% to 6.3%. Since the percentages of the
missing values were less than 10%, there was no need to conduct missing value analysis. The
missing values of the EU member group are the lowest, but those of Turkey are the highest.
Table 3.20 The Percentages of Missing Values of ICT Indexes in Path Analytic Models
Mathematical and Problem Solving Literacy Performance
Country Groups
ICT Indexes EU Member Group (%) New EU Member Group (%) Turkey (%)
INTUSE 0.4 0.5 2.7 PRGUSE 0.5 0.8 4.7 INTCONF 0.5 0.7 3.5 ROUTCONF 0.8 1.0 5.8 HIGHCONF 0.6 1.0 6.3 ATTCOMP 1.0 1.0 4.0
As to handling missing data, since the sample sizes were large enough and the
amount of missing data was less than 10%, pairwise deletion was a good alternative in
handling missing data for path analytic models (Hair et al., 2006).
3.2.9 Effect Size
Fraenkel and Wallen (2000) defined the effect size as “an index used to indicate the
magnitude of an obtained result or relationship”. It can be considered as an indicator that
evaluates the magnitude of the relationship(s)/difference(s) between two or more
variables/groups, and that usually clarifies the proportion of explained variance on dependent
variables, regardless of whether statistical significance exists, or not (Cohen, Cohen, West, &
Aiken, 2003).
Although different classifications about effect size are suggested, the most prevalent
and acceptable guideline on effect size for the social sciences is Cohen’s (1977). Therefore,

164
his classification of effect size can be considered as standard for the social sciences. In
accordance with common practices, he offers the frame of reference as follow: .01 is small,
.09 is medium and .25 or greater is large. The effect size values of one-way MANCOVA
analysis and its follow-up ANCOVAs and univariate ANCOVA were interpreted according
to this classification. Since the roots of structural equation modeling are largely based on the
logic of multiple regression, and path coefficients can be estimated using multiple regression
methods, squared multiple correlation (R2) in structural equation modeling can be roughly
attributed to the effect size of multiple regression. Therefore, squared multiple correlation
(R2) in path analytic models is accepted and interpreted as the effect size, as well. Thus R2 of
the path analytic models were also interpreted according to the classification of Cohen
(1977).
3.3 Methodology for the Qualitative Phase of the Study
3.3.1 Participants
The natural structure of the present study, the qualitative research questions, and the
personal judgment of the researcher in selecting the key informants required a purposive
sampling method. Purposive sampling enables the researcher to select information-rich cases
for in-depth data collection (Fraenkel & Wallen, 2000). Although purposive sampling was
selected by the researcher, some of the prospective participants did not want to be
interviewed due to lack of time, inconvenience, their political positions and other reasons. It
is noticed that the cognitive load of the interview schedule required all prospective
participants to examine it. Therefore, some of them were not likely to be interviewed by the
researcher. The researcher then followed a strategy that asked the interviewee in the second
pilot study “who are the key informants that you know through considering this interview?”
The other interviews with policy makers were conducted in the same way. In this case, it can
be said that referential sampling, or snowball sampling was also used to sample policy
makers in this study. Referential sampling is most appropriate when identifying key
informant participants who are members of a group (Krathwohl, 1993). In other words, it can
be said that referential sampling was used to find key informants. However, referential
sampling did not work sampling academicians.
There were seven participants. Four of them from MONE and three of them were
from universities. Three of the policy makers (PM) are members in Authority of the Turkish
Education Board (TTKB) and the other is a policy implementer (PI) in the ICT related
projects in the Educational Research and Development Department (EARGED). Two of the
academicians (AC) are in Instructional Technology related departments as chairmen, one of

165
whom is in the team that is charge of new curriculum construction for basic education in
computer courses. The other academician (AC) has a Doctor of Philosophy (Ph.D.) degree
and is an expert in the field of Instructional Technology. The detailed background
information of the interviewees of this study is given in Table 3.21.
3.3.2 Data Collection Instrument
A comprehensive national and international literature review on ICT in education
policy was conducted to explain, interpret and give meaning to key findings in the first phase
of the study and an ICT related educational issues in Turkey. Reviewing related literature not
only enabled the researcher to understand the general trend of ICT in education with its
policies and practices, but also helped the researcher to determine qualitative research
questions, the data collection instrument and the participants. Since the perceptions,
thoughts, beliefs and views of policy makers could not be learnt through observation, semi-
structured interview was selected as the most appropriate data collection technique.
Furthermore, the semi-structured interview schedule was an instrument that provided the
researcher with additional, hypothetical, alternative questions and probing to collect
information on what the researcher wanted to learn or clarify in depth.
The findings of the first phase of the present study and ICT related educational
issues in Turkey were considered in the light of the qualitative research questions. In order to
collect data from policy makers on the findings of the first phase, these findings should be
transformed into representations whose meaning should be understood as the same by every
participant with different backgrounds. The process of transforming quantitative findings
into representations was challenging and demanding for the researcher. Therefore, the
researcher asked for consultation from two experts (one was an expert in the field of
Instructional Technology and the other one was an academic giving a course in this subject)
on qualitative research in education during this transformation process. The representations
were then transformed and embedded into the interview schedule. Furthermore, consultancy
in terms of meaningful, understandable and unambiguous questions in the interview schedule
was also taken from the experts. In the light of experts’ suggestions, some questions were
revised, one alternative question and some prompts were added and some questions were
removed. In this way the interview schedule was formulated for the pilot studies. In addition
to these, the interview schedule was also examined by a Turkish literature teacher in order to
increase the comprehensibility of the introduction, questions, representations and their
explanations. Some small grammar mistakes were corrected.
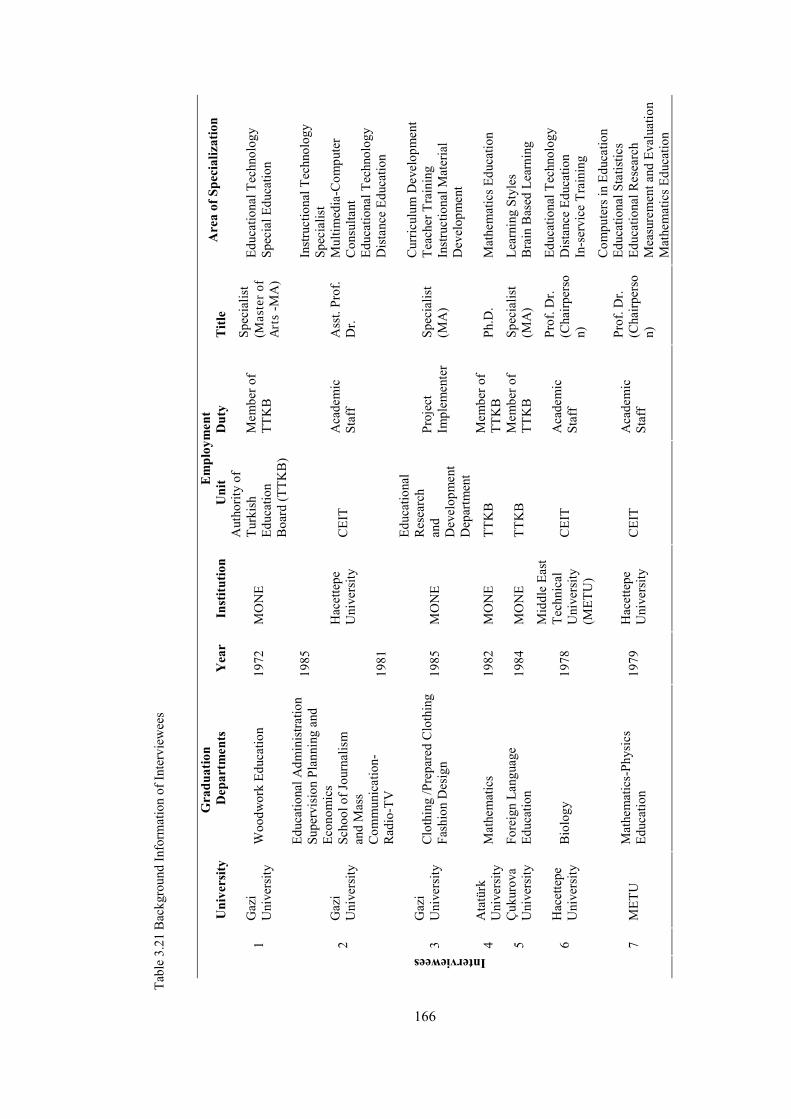
166
Gra
duat
ion
Em
ploy
men
t
Uni
vers
ity
Dep
artm
ents
Y
ear
Inst
itutio
n U
nit
Dut
y T
itle
A
rea
of S
peci
aliz
atio
n
1 G
azi
Uni
vers
ity
Woo
dwor
k Ed
ucat
ion
1972
M
ON
E
Aut
horit
y of
Tu
rkis
h Ed
ucat
ion
B
oard
(TTK
B)
Mem
ber o
f TT
KB
Spec
ialis
t (M
aste
r of
A
rts
-MA
)
Educ
atio
nal T
echn
olog
y Sp
ecia
l Edu
catio
n
2 G
azi
Uni
vers
ity
Educ
atio
nal A
dmin
istra
tion
Supe
rvis
ion
Plan
ning
and
Ec
onom
ics
Scho
ol o
f Jou
rnal
ism
an
d M
ass
Com
mun
icat
ion-
R
adio
-TV
1985
19
81
Hac
ette
pe
Uni
vers
ity
CEI
T A
cade
mic
St
aff
Ass
t. Pr
of.
Dr.
Inst
ruct
iona
l Tec
hnol
ogy
Spec
ialis
t M
ultim
edia
-Com
pute
r C
onsu
ltant
Ed
ucat
iona
l Tec
hnol
ogy
Dis
tanc
e Ed
ucat
ion
3 G
azi
Uni
vers
ity
Clo
thin
g /P
repa
red
Clo
thin
g Fa
shio
n D
esig
n 19
85
MO
NE
Educ
atio
nal
Res
earc
h an
d D
evel
opm
ent
Dep
artm
ent
Proj
ect
Impl
emen
ter
Spec
ialis
t (M
A)
Cur
ricul
um D
evel
opm
ent
Teac
her T
rain
ing
Inst
ruct
iona
l Mat
eria
l D
evel
opm
ent
4 A
tatü
rk
Uni
vers
ity
Mat
hem
atic
s 19
82
MO
NE
TTK
B
Mem
ber o
f TT
KB
Ph
.D.
Mat
hem
atic
s Edu
catio
n
5 Ç
ukur
ova
Uni
vers
ity
Fore
ign
Lang
uage
Ed
ucat
ion
1984
M
ON
E TT
KB
M
embe
r of
TTK
B
Spec
ialis
t (M
A)
Lear
ning
Sty
les
Bra
in B
ased
Lea
rnin
g
6 H
acet
tepe
U
nive
rsity
B
iolo
gy
1978
Mid
dle
East
Te
chni
cal
Uni
vers
ity
(MET
U)
CEI
T A
cade
mic
St
aff
Prof
. Dr.
(Cha
irper
son)
Educ
atio
nal T
echn
olog
y D
ista
nce
Educ
atio
n In
-ser
vice
Tra
inin
g
Interviewees
7 M
ETU
M
athe
mat
ics-
Phys
ics
Educ
atio
n 19
79
Hac
ette
pe
Uni
vers
ity
CEI
T A
cade
mic
St
aff
Prof
. Dr.
(Cha
irper
son)
Com
pute
rs in
Edu
catio
n Ed
ucat
iona
l Sta
tistic
s Ed
ucat
iona
l Res
earc
h M
easu
rem
ent a
nd E
valu
atio
n M
athe
mat
ics E
duca
tion
Tabl
e 3.
21 B
ackg
roun
d In
form
atio
n of
Inte
rvie
wee
s
167
Two pilot studies were conducted to test the comprehensibility of questions and
representations in the interview schedule. First a pilot study was conducted with a computer
teacher who was a doctoral student in Instructional Technology. The second one was
conducted with a policy maker. After the pilot studies, some explanations about
representations were added, in consultation with experts, to increase the understandability of
figures in the interview schedule.
The interview schedule consists of two separate parts. The first part, “Interview
Schedule-Interviewer”, was used by the researcher as an interviewer and the second part,
“Interview Schedule – Before and During Interview”, was used by both the interviewees and
the researcher. The first and second parts of the interview schedule are given in Appendix C
and D, respectively.
Interview Schedule-Interviewer was used during the interview. It covered the
introduction, main and closure parts. The introduction part explains the study. The main part
had two sections. The first one was related to demographic information about the
interviewee, but the demographic information was collected at the end of the interviews. The
second one covered questions concerning a separate evaluation of each finding and a general
evaluation of findings together, and ICT policies, implementations, issues, problems,
challenges, and suggestions for Turkey. Finally, the closure part was summarized spoken
issues, asking if the interviewees wanted to add something and thanking them.
Interview Schedule – Before and During Interview covered an explanation of the
study, representations of students’ socioeconomic and cultural background, attitudes toward
computers, and separate and entire representations of comparisons of ICT aspects and
models, and some explanations pertaining to representations. Since Interview Schedule –
Before and During Interview was cognitively loaded, due to these results and their
representations, it was given to interviewees before conducting the interview. More
concisely, this part concerned the policy makers’ perceptions about ICT in education with
respect to the findings of the quantitative phase of this study and ICT policies, and practices,
issues, problems, challenges and suggestions in the context of Turkey.
3.3.3 Data Collection Procedure
Before conducting interviews, the researcher applied to obtain official permission
from the Human Researches Ethic Committee within the university. This application
requires filling in forms involving detailed information about the study and attaching the
interview schedule with separate two parts. These forms and the interview schedule were

168
examined by the committee and then the permission was given to conduct the study. The
permission document is given in Appendix E.
Afterwards, Interview Schedule – Before and During Interview was given to the
interviewees approximately 10 days before the interviews. While giving it, general
information about the study, the purpose of the study, and information about the interview to
be conducted were explained. Furthermore, an appointment with the interviewee was fixed
and contact information was given to the interviewee in the case of any question. Seven
interviews were conducted at the offices of interviewees. Since appointed times and offices
were used for the interviews, there were no any distractions. Each of the interviews took
around one and a half hours. Similar to study of Özar (1996), the researcher recognized, in
the second pilot study, that interviewees (policy makers) felt hesitation and inhibition due to
the voice recording; from that reason, note taking instead of voice recording was used in the
interviews of all policy makers. However, voice recording was used for academic
participants. Before starting the interview, the researcher tried to make conversation and
build a rapport and intimacy with interviewees. Moreover, the questions concerning
background information about the participants were asked at the end of the interview to
avoid being misconceived by interviewees. The interviews were conducted between June
and July of 2007.
Before going on to the interview process, the researcher explained the purpose of the
study and interview, and confidentiality issues. The value and importance of their
perceptions, expressions and sayings in making a contribution to the Turkish education
system through this kind of study was also explained. The researcher prepared a printed form
to take notes during the interviews with policy makers. Almost all the words of the
interviewees were written in those printed forms. The researcher thanked the interviewees at
the end of the each interview session.
Interviewing participants for any academic study is not easy. A good interview
requires some knowledge and skills of interviewing. Not only having interviewing
knowledge and skills, but the personality of the interviewer is also important. Self-
confidence, a cool and positive manner are some necessary characteristics of the interviewer.
3.3.4 Data Analysis Procedure
The most challenging part of the qualitative study was data analysis. Data analysis in
the qualitative study systematically involved transcribing, organizing, examining, arranging,
categorizing, dividing, synthesizing, discovering, understanding data and presenting
findings. As Yıldırım and Şimşek (2000) stated, there are various methods of data analysis in

169
a qualitative study, descriptive and content data analyses being the most common ones.
Inductive, deductive and integrated coding approaches are used in content analysis in the
literature. In integrated coding, it is possible to define the general conceptual framework and
general categories, and to discuss whether new codes are added on the basis of predefined
categories, or predefined ones are changed as new codes emerged during the coding process
(Yıldırım & Şimşek, 2000). Integrated coding was selected for this study due to the existence
of the previous related studies.
Since the contents of data collection instruments with their representations and
explanations were different from ordinary qualitative research, the data collected were not
routine. In order to simplify and classify complex data, all transcriptions and notes,
excluding demographic information, belonging to each interview question were put into a
table and marked with numbers for each row, using Microsoft Word processor. This led to
more manageable and meaningful data chunks. Then, through reading these chunks several
times, the most relevant parts of the data were highlighted for data reduction and coding.
Later, one column was added to the right of the table and the highlighted parts were
translated and transformed into English with relevant phrases, sentences and labels. This was
the first level coding. Afterwards, one more column was added to the right of the table and
second level coding was done in such a way that relevant phrases, sentences and labels were
converted into patterns and major categories. Finally, a last right-hand column was printed
out, and then axial coding was conducted to develop a coding system through examining the
original data, major and sub categories and patterns. Axial coding is the act of relating
categories to sub-categories along the lines of their properties and dimensions (Strauss &
Corbin, 1998). In each coding level, predefined categories were considered in the approach
of integrated coding. After producing a coding system, it was revised to check coding, name
codes and describe codes operationally. The structure and components of the coding system
can be seen in Figure 3.2. The coding system provided the researcher with information on
who expresses thing, where, and what express and the frequency of expressions. In other
words, the researcher could track anything that was made during the data analysis.
While creating the coding system, in order to generate, understand and interpret
more meaningful patterns from the codes, selective coding processes were followed to
integrate and refine the theory (Strauss & Corbin, 1998). That is, the researcher clustered
some codes into broader categories and organized some subcodes logically according to
relationships, explanations and patterns. By doing so, a central concept and idea was
identified to make interpretations. The final coding system is given in Appendix F.
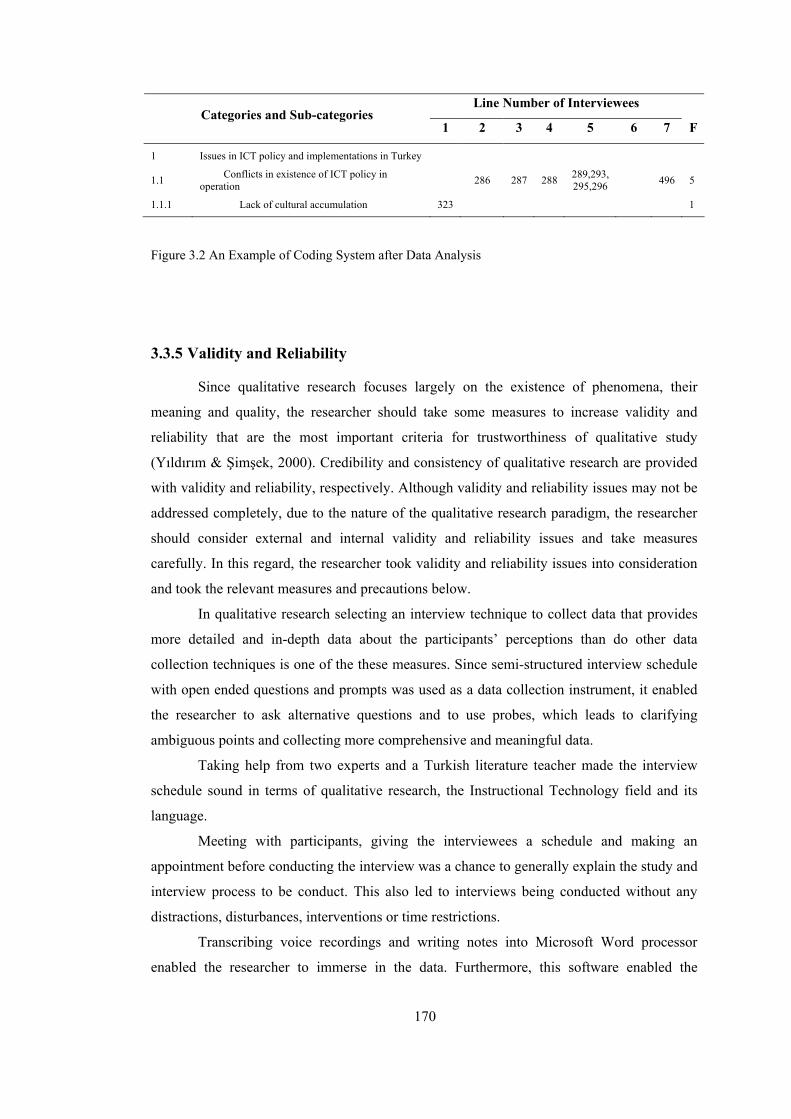
170
Line Number of Interviewees Categories and Sub-categories
1 2 3 4 5 6 7 F
1 Issues in ICT policy and implementations in Turkey
1.1 Conflicts in existence of ICT policy in operation 286 287 288 289,293,
295,296 496 5
1.1.1 Lack of cultural accumulation 323 1
Figure 3.2 An Example of Coding System after Data Analysis
3.3.5 Validity and Reliability
Since qualitative research focuses largely on the existence of phenomena, their
meaning and quality, the researcher should take some measures to increase validity and
reliability that are the most important criteria for trustworthiness of qualitative study
(Yıldırım & Şimşek, 2000). Credibility and consistency of qualitative research are provided
with validity and reliability, respectively. Although validity and reliability issues may not be
addressed completely, due to the nature of the qualitative research paradigm, the researcher
should consider external and internal validity and reliability issues and take measures
carefully. In this regard, the researcher took validity and reliability issues into consideration
and took the relevant measures and precautions below.
In qualitative research selecting an interview technique to collect data that provides
more detailed and in-depth data about the participants’ perceptions than do other data
collection techniques is one of the these measures. Since semi-structured interview schedule
with open ended questions and prompts was used as a data collection instrument, it enabled
the researcher to ask alternative questions and to use probes, which leads to clarifying
ambiguous points and collecting more comprehensive and meaningful data.
Taking help from two experts and a Turkish literature teacher made the interview
schedule sound in terms of qualitative research, the Instructional Technology field and its
language.
Meeting with participants, giving the interviewees a schedule and making an
appointment before conducting the interview was a chance to generally explain the study and
interview process to be conduct. This also led to interviews being conducted without any
distractions, disturbances, interventions or time restrictions.
Transcribing voice recordings and writing notes into Microsoft Word processor
enabled the researcher to immerse in the data. Furthermore, this software enabled the

171
researcher to effectively arrange, organize, highlight, analyze and code data. The researcher
utilized the previous conceptual framework through using an integrated coding approach
during the data analysis.
3.3.6 Limitations
This study is limited to responses from seven participants who were policy makers
and academicians from two division of MONE: the Authority of the Turkish Education
Board, and the Educational Research and Development Department, and two different
universities. So, this study can not be directly generalized to other institutions within MONE
and higher education. Furthermore, the results of this study are limited to the perceptions of
seven policy makers and academicians.
The interviews were only used as a data collection technique for this study.
Therefore, the source of data is based on the honesty of participants’ responses. Other
technique/s could have been used to make triangulation.
Along with an evaluation of comparisons of ICT aspects across country groups,
interviews also aimed to collect data on participants’ perceptual evaluation of path analyses
representing the relationships between ICT aspects and mathematical/problem solving
literacy performance. Although representations of path analyses results were designed to be
more understandable and simple through path diagrams, graphics illustrating the size and
direction of relationships among variables across country groups and simplified plain text
explanations, this part of the interviews did not work as intended. However, this difficulty
continued despite taking measures after the pilot studies. The possible reasons of this could
be that not all the participants’ educational, statistical and instructional technology
background and interest areas are suitable to interpret the relationships between ICT aspects
and students’ mathematical and problem solving literacy performance. Actually, most of the
interpretations about these relationships came from academicians. In order to prevent
participants from any misconceptions resulting from representations, different graphic styles
could have been used to represent comparisons of ICT aspects and the relationships in the
models.
3.4 Summary of the Methodology
Chapter three presented the methodology of the quantitative and qualitative phases
of this study, separately. Since the research questions investigating the what and how part of
the phenomena in quantitative research paradigm are followed by research questions to

172
understand the why part of the same phenomena in the qualitative research paradigm, this
study has a quantitative-dominant multimethod research design.
3.4.1 Summary of the Quantitative Methodology
In the quantitative phase, the target population in each country is defined as all 15-
year-old students, enrolling any type of educational programs, except for students schooled
at home or abroad. The target and accessible population of this study are computed by
adding up students from members in the country groups in the EU. The country groups are
formed on the basis of the status of a country in the EU, and that of having ICT data in the
PISA 2003 study. They are as follow: the EU member group (founded the EU or joined the
EU before 2004), the new EU member group (joined the EU in 2004), and Turkey (as a
candidate state for the EU). A two-stage stratified sample design is generally used by PISA
as a sampling procedure for most of the countries; schools and students are selected at the
first and second stages respectively. In this study, students who have used computers before
were selected as samples from each country group.
The data collection instruments were assessment instruments (measuring
mathematical and problem solving literacy performance), student questionnaires (only
socioeconomic and cultural background information is used in this study), and ICT
questionnaires (only ICT aspects). In order to design, develop and implement these
instruments, the PISA consortium works together with official institutions in the countries,
and national and international experts (in subject-matter, in measurement and evaluation)
from well-known institutions (ACER, CITO, Westat, and NIER etc.).
Note that the ESCS index and ICT indexes, as constructs and PVs estimating
mathematics and problem solving scores, are used in the statistical analyses in this study.
MANCOVA and ANCOVA are used to compare and contrast the country groups in terms of
ICT aspects, and path analytic models are used to understand the relationships between
students’ mathematical and problem solving literacy performance and ICT aspects and
socioeconomic and cultural background.
For ensuring content-related validity, the content and format of assessment
instruments and questionnaires are developed by experts to measure logically what is
intended, through considering the language and cultural context issues of students. In order
to provide international educational-comparative studies, construct-related validity is
particularly worked to draw constructs concerning similar characteristics, attitudes and
perceptions in different national and cultural contexts. Since the separate reliability analysis
was conducted to have reliable constructs for each country, the reliability of constructs in the

173
quantitative phase were averaged out for country groups. The alpha reliability coefficients
for overall mathematical and problem solving literacy performance at international level
were separately calculated. All averaged reliabilities of variables in the quantitative phase
were in the acceptable level.
User missing and system missing in data file were transformed into system missing
in the data. A listwise deletion method was preferred in handing the missing data in
MANCOVA and ANCOVA. On the other hand, a pairwise deletion was performed in the
path analytic models.
The classification (.01 is small, .09 is medium and .25 or greater is large) of Cohen
et al. (2003), the most prevalent and acceptable guideline on effect size for social sciences,
was preferred to interpret the effect size for MANCOVA, ANCOVA and squared multiple
correlation values of the path analytic models.
3.4.2 Summary of the Qualitative Methodology
Purposive and referential or snowball sampling procedures were used to conduct
interviews with participants. In the sampling procedure, referential or snowball sampling was
effective with policy makers, although purposive sampling is designed for academicians.
Four policy makers from MONE and three academicians from universities were the
participants in the qualitative phase of this study.
Since the qualitative phase is largely focused on ICT policy development and
implementation issues, and perceptual evaluation of the quantitative phase results, the
interview was selected as the best data collection technique. An interview schedule, as a data
collection instrument, was required to represent the results of the quantitative phase as
comprehensibly as possible for the interviewees. The interview schedule questions were then
developed through conducting a literature review on ICT-in-education policy. Finally, a
semi-structured interview schedule was developed with the help of two experts in the field of
qualitative research in education and Turkish literature teacher, for the grammar and
meaning of questions.
Approximately ten days before interviewing, the interview schedule, including the
results of the quantitative phase, was given to the participants, so that they could examine
and understand the results of the quantitative phase. Seven interviews were conducted at
appointed times and places. During the interviews, each of which lasted around one and a
half hours, note-taking and voice recording were used for policy makers and academicians,
respectively.

174
Recorded interviews were transcribed and notes were transformed into digital format
in a Word processor program. Transcriptions were analyzed with content analysis. More
specifically, integrated coding -both using inductive and deductive coding- was conducted to
understand the data and interpret the findings. In the data analysis, Microsoft Word processor
was used to simplify and classify complex data for more manageable and meaningful data
chunks. These chunks, such as relevant phrases and sentences, were labeled through open
coding, and then patterns and major themes emerged. Axial coding was then conducted to
develop a coding system through relating categories to sub-categories. Finally, selective
coding was conducted to identify a central category for interpreting the whole phenomena.
In connection with validity and reliability, the data collection of technique of a semi-
structured interview with open-ended questions and prompts is the most appropriate one to
clarify ambiguous points and collect more comprehensive and meaningful data. Taking help
from two experts and a Turkish literature teacher, and conducting two pilot studies also
contributes to increased validity and reliability of the qualitative phase. Furthermore, neither
using any leading probes, cues or corrections during the any of interviews, nor experiencing
any distraction, disturbance, and intervention or time restriction also enhance validity and
reliability. The qualitative phase of this study is limited to the responses of seven participants
from MONE and universities and to their honesty in their responses. The formats of
representations and their explanations about the quantitative phase of this study are limited to
participants’ background and perceptions.

175
CHAPTER 4
4. RESULTS
In this chapter, the findings of the quantitative and qualitative phases are given in
two sections. In the first section, the findings of the quantitative phase are presented in two
parts. The first part displays the findings of one-way MANCOVA and ANCOVA regarding
the comparison of country groups on ICT aspects, whether controlling for the students’
socioeconomic and cultural backgrounds and attitudes toward computers or not. The second
part separately explains the fitted mathematical and problem solving literacy performance
models for each country group. In the second section, the findings regarding the qualitative
phase of this study are presented.
4.1 Results for Quantitative Phase of the Present Study
4.1.1 Results of One-Way MANCOVA
In order to answer the first and second research questions, one–way MANCOVA
was conducted to investigate the relationships between students’ ICT use, self-confidence in
ICT and the status of a country in the EU, controlling for attitudes toward computers, and the
economic, social and cultural status of the students. The independent variable is the status of
a country in the EU (the EU member, the new EU member, and Turkey as a candidate state).
The dependent variables are the ICT indexes related to ICT use and self-confidence in ICT.
These indexes are specifically as follows: Internet/entertainment use (INTUSE),
Programs/software use (PRGUSE), Confidence in routine tasks (ROUTCONF), Confidence
in Internet tasks (INTCONF), and Confidence in high-level tasks (HIGHCONF). The
covariates are the indexes of attitudes toward computers (ATTCOMP), and the economic,
social and cultural status of the students (ESCS).
As mentioned in Chapter 3, Pillai's Trace statistic was preferred and interpreted from
the multivariate ANCOVA tests since Box’s M test was significant. Significant differences
were found among the three country groups on ICT indexes, controlling for ESCS and
ATTCOMP, Pillai’s Trace = .058, F (10, 169334) = 508.983, p <.001 (see Table 4.1).
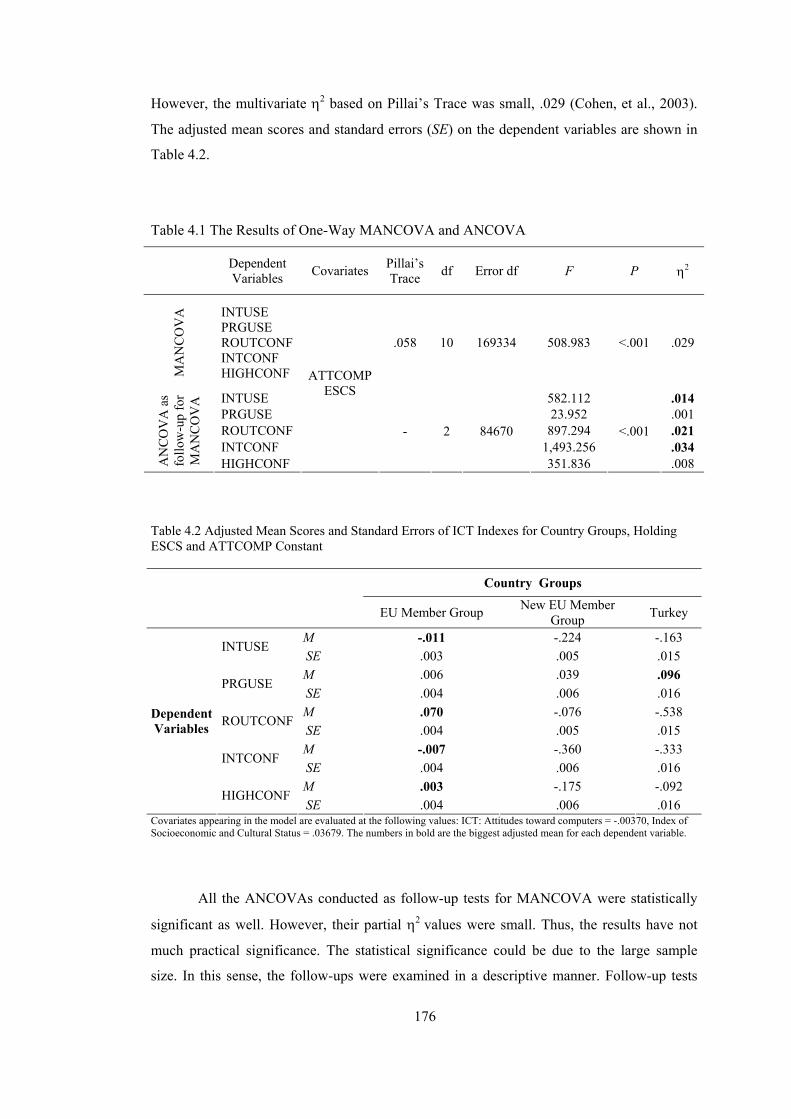
176
However, the multivariate η2 based on Pillai’s Trace was small, .029 (Cohen, et al., 2003).
The adjusted mean scores and standard errors (SE) on the dependent variables are shown in
Table 4.2.
Table 4.1 The Results of One-Way MANCOVA and ANCOVA
Dependent Variables Covariates Pillai’s
Trace df Error df F P η2
MA
NC
OV
A INTUSE
PRGUSE ROUTCONF INTCONF HIGHCONF
.058 10 169334 508.983 <.001 .029
INTUSE 582.112 .014 PRGUSE 23.952 .001 ROUTCONF 897.294 .021 INTCONF 1,493.256 .034
AN
CO
VA
as
follo
w-u
p fo
r M
AN
CO
VA
HIGHCONF
ATTCOMP ESCS
- 2 84670
351.836
<.001
.008 Table 4.2 Adjusted Mean Scores and Standard Errors of ICT Indexes for Country Groups, Holding ESCS and ATTCOMP Constant
Country Groups
EU Member Group New EU Member Group Turkey
M -.011 -.224 -.163 INTUSE
SE .003 .005 .015 M .006 .039 .096
PRGUSE SE .004 .006 .016 M .070 -.076 -.538
ROUTCONF SE .004 .005 .015 M -.007 -.360 -.333
INTCONF SE .004 .006 .016 M .003 -.175 -.092
Dependent Variables
HIGHCONF SE .004 .006 .016
Covariates appearing in the model are evaluated at the following values: ICT: Attitudes toward computers = -.00370, Index of Socioeconomic and Cultural Status = .03679. The numbers in bold are the biggest adjusted mean for each dependent variable.
All the ANCOVAs conducted as follow-up tests for MANCOVA were statistically
significant as well. However, their partial η2 values were small. Thus, the results have not
much practical significance. The statistical significance could be due to the large sample
size. In this sense, the follow-ups were examined in a descriptive manner. Follow-up tests
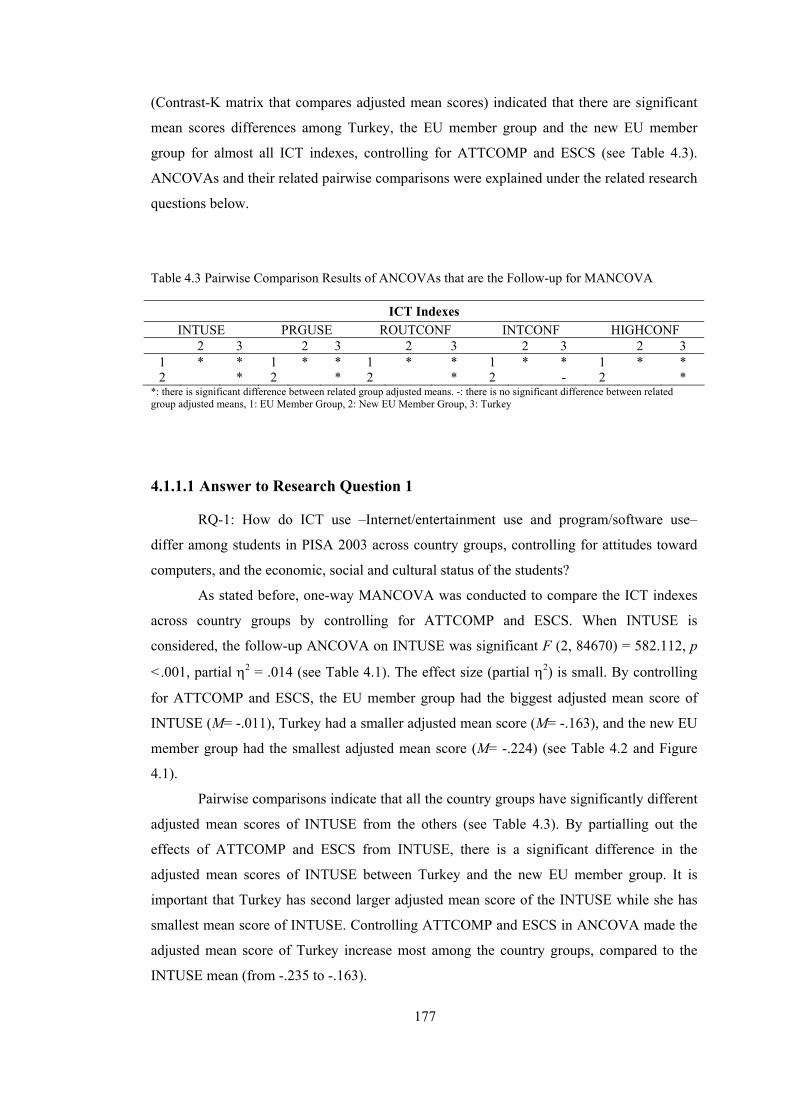
177
(Contrast-K matrix that compares adjusted mean scores) indicated that there are significant
mean scores differences among Turkey, the EU member group and the new EU member
group for almost all ICT indexes, controlling for ATTCOMP and ESCS (see Table 4.3).
ANCOVAs and their related pairwise comparisons were explained under the related research
questions below.
Table 4.3 Pairwise Comparison Results of ANCOVAs that are the Follow-up for MANCOVA
ICT Indexes INTUSE PRGUSE ROUTCONF INTCONF HIGHCONF
2 3 2 3 2 3 2 3 2 3 1 * * 1 * * 1 * * 1 * * 1 * * 2 * 2 * 2 * 2 - 2 *
*: there is significant difference between related group adjusted means. -: there is no significant difference between related group adjusted means, 1: EU Member Group, 2: New EU Member Group, 3: Turkey
4.1.1.1 Answer to Research Question 1
RQ-1: How do ICT use –Internet/entertainment use and program/software use–
differ among students in PISA 2003 across country groups, controlling for attitudes toward
computers, and the economic, social and cultural status of the students?
As stated before, one-way MANCOVA was conducted to compare the ICT indexes
across country groups by controlling for ATTCOMP and ESCS. When INTUSE is
considered, the follow-up ANCOVA on INTUSE was significant F (2, 84670) = 582.112, p
<.001, partial η2 = .014 (see Table 4.1). The effect size (partial η2) is small. By controlling
for ATTCOMP and ESCS, the EU member group had the biggest adjusted mean score of
INTUSE (M= -.011), Turkey had a smaller adjusted mean score (M= -.163), and the new EU
member group had the smallest adjusted mean score (M= -.224) (see Table 4.2 and Figure
4.1).
Pairwise comparisons indicate that all the country groups have significantly different
adjusted mean scores of INTUSE from the others (see Table 4.3). By partialling out the
effects of ATTCOMP and ESCS from INTUSE, there is a significant difference in the
adjusted mean scores of INTUSE between Turkey and the new EU member group. It is
important that Turkey has second larger adjusted mean score of the INTUSE while she has
smallest mean score of INTUSE. Controlling ATTCOMP and ESCS in ANCOVA made the
adjusted mean score of Turkey increase most among the country groups, compared to the
INTUSE mean (from -.235 to -.163).
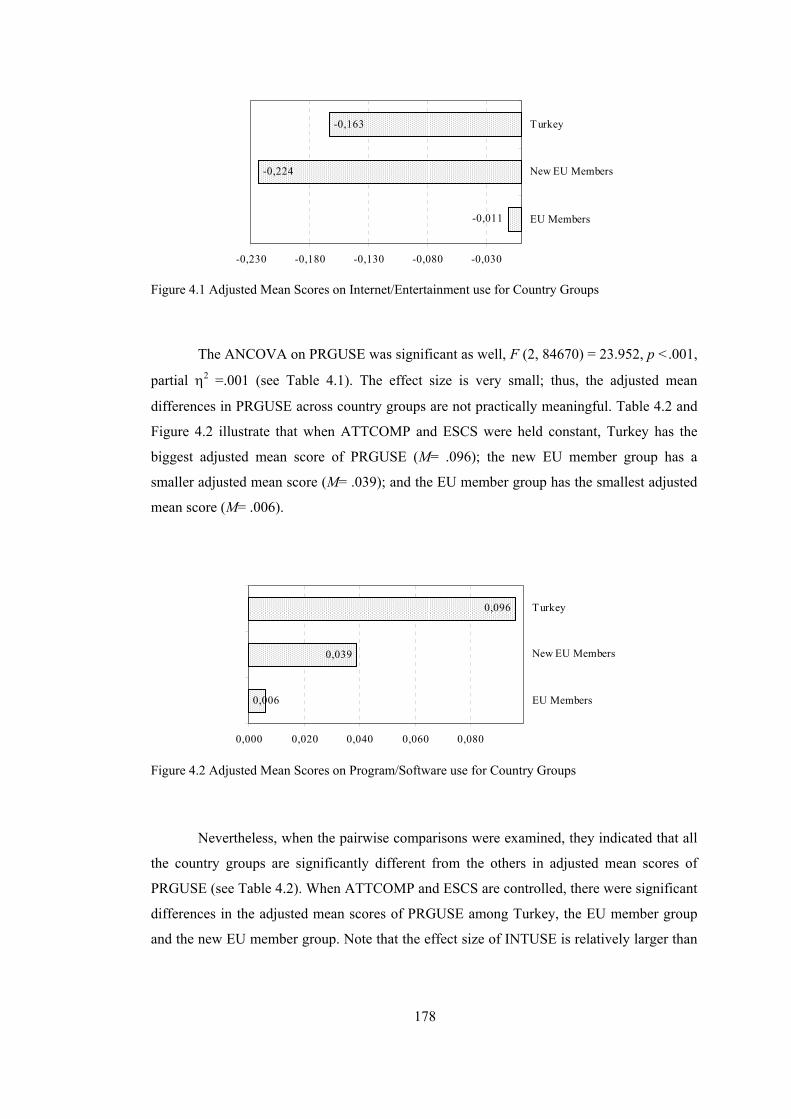
178
-0,163
-0,011
-0,224
-0,230 -0,180 -0,130 -0,080 -0,030
EU Members
New EU Members
Turkey
Figure 4.1 Adjusted Mean Scores on Internet/Entertainment use for Country Groups
The ANCOVA on PRGUSE was significant as well, F (2, 84670) = 23.952, p <.001,
partial η2 =.001 (see Table 4.1). The effect size is very small; thus, the adjusted mean
differences in PRGUSE across country groups are not practically meaningful. Table 4.2 and
Figure 4.2 illustrate that when ATTCOMP and ESCS were held constant, Turkey has the
biggest adjusted mean score of PRGUSE (M= .096); the new EU member group has a
smaller adjusted mean score (M= .039); and the EU member group has the smallest adjusted
mean score (M= .006).
0,096
0,039
0,006
0,000 0,020 0,040 0,060 0,080
EU Members
New EU Members
Turkey
Figure 4.2 Adjusted Mean Scores on Program/Software use for Country Groups
Nevertheless, when the pairwise comparisons were examined, they indicated that all
the country groups are significantly different from the others in adjusted mean scores of
PRGUSE (see Table 4.2). When ATTCOMP and ESCS are controlled, there were significant
differences in the adjusted mean scores of PRGUSE among Turkey, the EU member group
and the new EU member group. Note that the effect size of INTUSE is relatively larger than
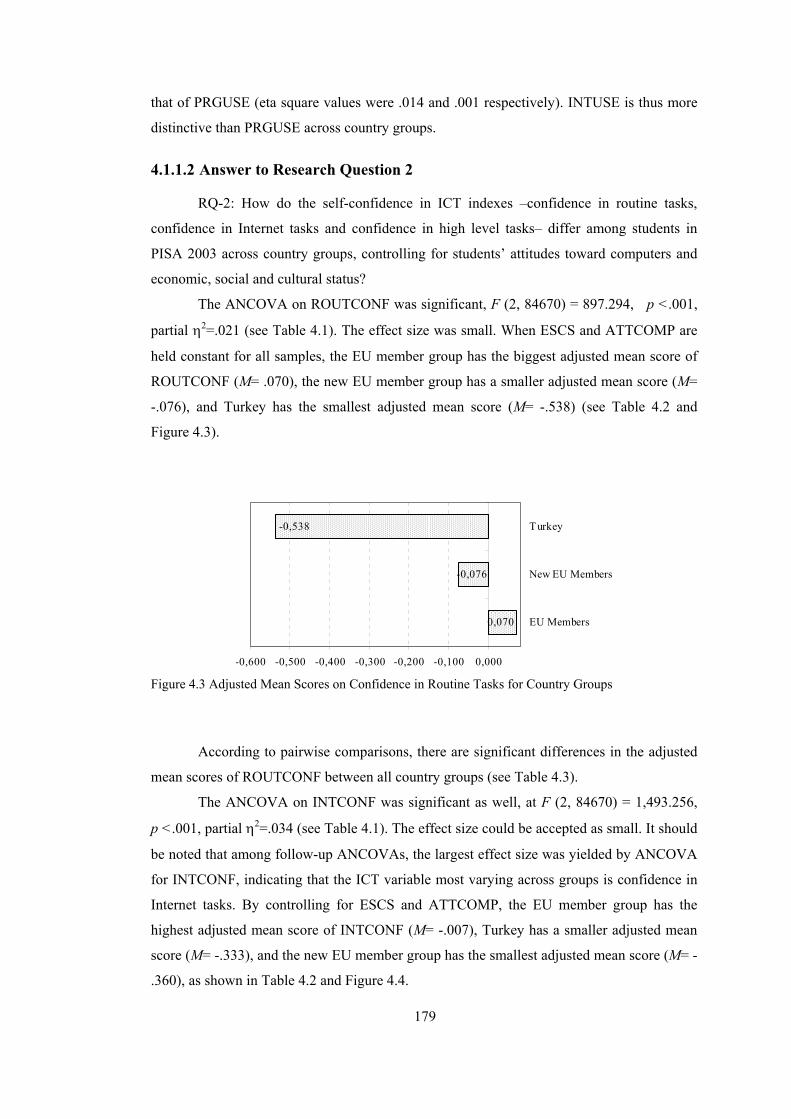
179
that of PRGUSE (eta square values were .014 and .001 respectively). INTUSE is thus more
distinctive than PRGUSE across country groups.
4.1.1.2 Answer to Research Question 2
RQ-2: How do the self-confidence in ICT indexes –confidence in routine tasks,
confidence in Internet tasks and confidence in high level tasks– differ among students in
PISA 2003 across country groups, controlling for students’ attitudes toward computers and
economic, social and cultural status?
The ANCOVA on ROUTCONF was significant, F (2, 84670) = 897.294, p <.001,
partial η2=.021 (see Table 4.1). The effect size was small. When ESCS and ATTCOMP are
held constant for all samples, the EU member group has the biggest adjusted mean score of
ROUTCONF (M= .070), the new EU member group has a smaller adjusted mean score (M=
-.076), and Turkey has the smallest adjusted mean score (M= -.538) (see Table 4.2 and
Figure 4.3).
-0,538
-0,076
0,070
-0,600 -0,500 -0,400 -0,300 -0,200 -0,100 0,000
EU Members
New EU Members
Turkey
Figure 4.3 Adjusted Mean Scores on Confidence in Routine Tasks for Country Groups
According to pairwise comparisons, there are significant differences in the adjusted
mean scores of ROUTCONF between all country groups (see Table 4.3).
The ANCOVA on INTCONF was significant as well, at F (2, 84670) = 1,493.256,
p <.001, partial η2=.034 (see Table 4.1). The effect size could be accepted as small. It should
be noted that among follow-up ANCOVAs, the largest effect size was yielded by ANCOVA
for INTCONF, indicating that the ICT variable most varying across groups is confidence in
Internet tasks. By controlling for ESCS and ATTCOMP, the EU member group has the
highest adjusted mean score of INTCONF (M= -.007), Turkey has a smaller adjusted mean
score (M= -.333), and the new EU member group has the smallest adjusted mean score (M= -
.360), as shown in Table 4.2 and Figure 4.4.

180
Figure 4.4 Adjusted Mean Scores on Confidence in Internet Tasks for Country Groups
According to pairwise comparisons for INTCONF, the EU member group has a
significantly higher adjusted mean score than do the new EU member group and Turkey. Yet
there is no significant difference in the adjusted mean scores of Turkey and the new EU
member group. In fact their adjusted mean scores are close to each other (see Figure 4.4).
The adjusted mean score of the new EU member group is slightly smaller, but that of Turkey
is higher by approximately .200 points, compared to their INTCONF means (see Table 3.12
and Table 4.2). Moreover, this places Turkey in second position in the adjusted mean scores
of INTCONF.
The ANCOVA on HIGHCONF was significant as well, at F (2, 84670) = 351.836,
p <.001, partial η2=.008 (see Table 4.1). Since the effect size is smaller than .01, the mean
differences are said to be not meaningful, according to Cohen’s effect size classification.
When ESCS and ATTCOMP were held constant, the EU member group had the biggest
adjusted mean score of HIGHCONF (M= .003), Turkey had a smaller adjusted mean score
(M= -.092), and the new EU member group had the smallest adjusted mean score (M= -.175)
(see Table 4.2 and Figure 4.5).
-0,092
0,003
-0,175
-0,200 -0,150 -0,100 -0,050 0,000 0,050
EU Members
New EU Members
T urkey
Figure 4.5 Adjusted Mean Scores on Confidence in High Level Tasks for Country Groups
-0,333
-0,360
-0,007
-0,400 -0,300 -0,200 -0,100 0,000
EU Members
New EU Members
Turkey

181
Nevertheless, pairwise comparisons indicate significant differences in these adjusted
mean scores of HIGHCONF between all pairs of country groups (see Table 4.3) when
ATTCOMP and ESCS are controlled.
4.1.2 Results of Univariate ANCOVA
4.1.2.1 Answer to Research Question 3
RQ-3: How do attitudes toward computers differ among students in PISA 2003
across country groups, controlling for economic, social and cultural status of students?
In order to answer the third research question, univariate ANCOVA was run to
investigate the relationship between students’ attitudes toward computers and the status of a
country in the EU, holding economic, social and cultural status of students constant. The
independent variable is the status of a country in the EU (the EU member, the new EU
member, and Turkey as a candidate state). The dependent variable is the students’ attitudes
toward computers (ATTCOMP). The covariate is the economic, social and cultural status of
the students (ESCS). Although there are several reasons why ANCOVA is used to analyze
data for different studies, the main reason for this study is that country groups may differ in
attitudes toward computers due to variables other than status of the country group in the EU,
such as ESCS. In fact, covariates enable a better adjustment for initial differences between
intact groups (Stevens, 2002), such as the country groups in this study.
ANCOVA was significant, at F (2, 84671) = 80.399, p <.001, partial η2=.002 (see
Table 4.4). Yet, the effect size is too small, thus the differences in the mean scores of
ATTCOMP are not practically meaningful. Turkey has the biggest adjusted mean score of
attitudes toward the computers index (M= .213). The EU member group has a smaller
adjusted mean score (M= -.009), and the new EU member group has the smallest adjusted
mean score (M= -.021) (see Table 4.5 and Figure 4.6).
Table 4.4 The Results of One-Way ANCOVA
Dependent Variable Covariate df Error df F p η2
ANCOVA ATTCOMP ESCS 2 84671 80.399 <.001 .002
ESCS: Economic, social and cultural status of students
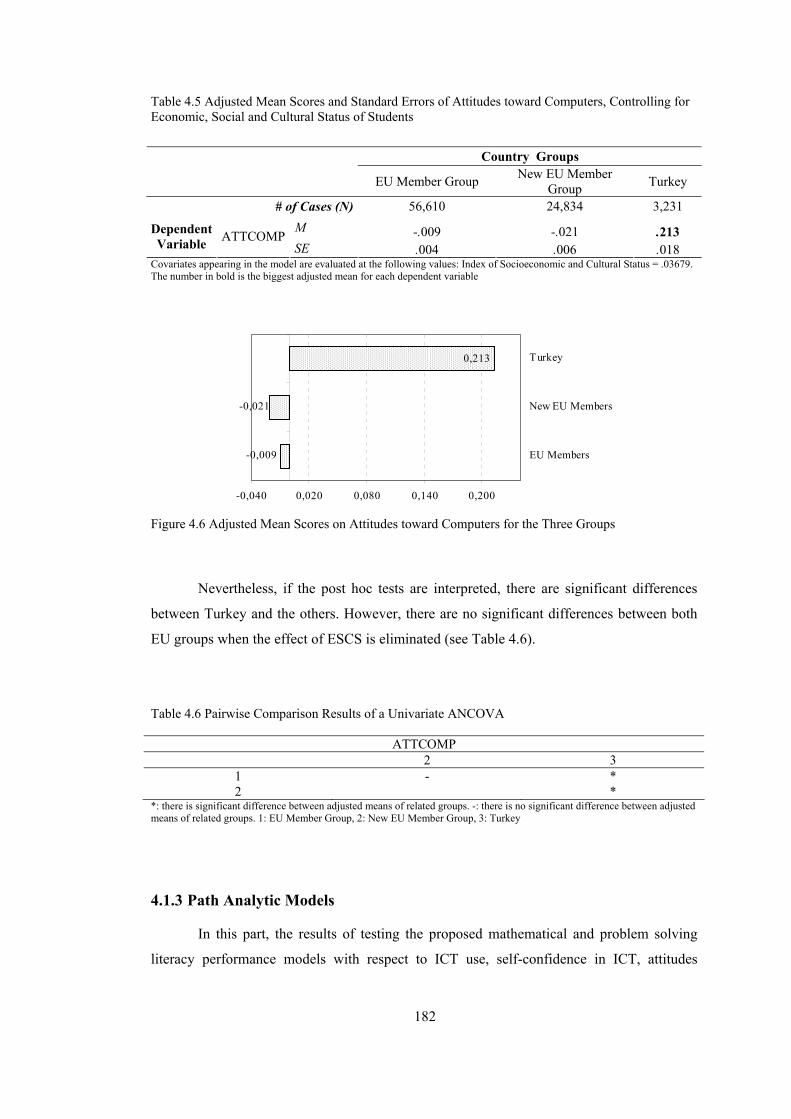
182
Table 4.5 Adjusted Mean Scores and Standard Errors of Attitudes toward Computers, Controlling for Economic, Social and Cultural Status of Students
Covariates appearing in the model are evaluated at the following values: Index of Socioeconomic and Cultural Status = .03679. The number in bold is the biggest adjusted mean for each dependent variable
0,213
-0,009
-0,021
-0,040 0,020 0,080 0,140 0,200
EU Members
New EU Members
Turkey
Figure 4.6 Adjusted Mean Scores on Attitudes toward Computers for the Three Groups
Nevertheless, if the post hoc tests are interpreted, there are significant differences
between Turkey and the others. However, there are no significant differences between both
EU groups when the effect of ESCS is eliminated (see Table 4.6).
Table 4.6 Pairwise Comparison Results of a Univariate ANCOVA
ATTCOMP 2 3
1 - * 2 *
*: there is significant difference between adjusted means of related groups. -: there is no significant difference between adjusted means of related groups. 1: EU Member Group, 2: New EU Member Group, 3: Turkey
4.1.3 Path Analytic Models
In this part, the results of testing the proposed mathematical and problem solving
literacy performance models with respect to ICT use, self-confidence in ICT, attitudes
Country Groups
EU Member Group New EU Member Group Turkey
# of Cases (N) 56,610 24,834 3,231 M -.009 -.021 .213 Dependent
Variable ATTCOMP SE .004 .006 .018
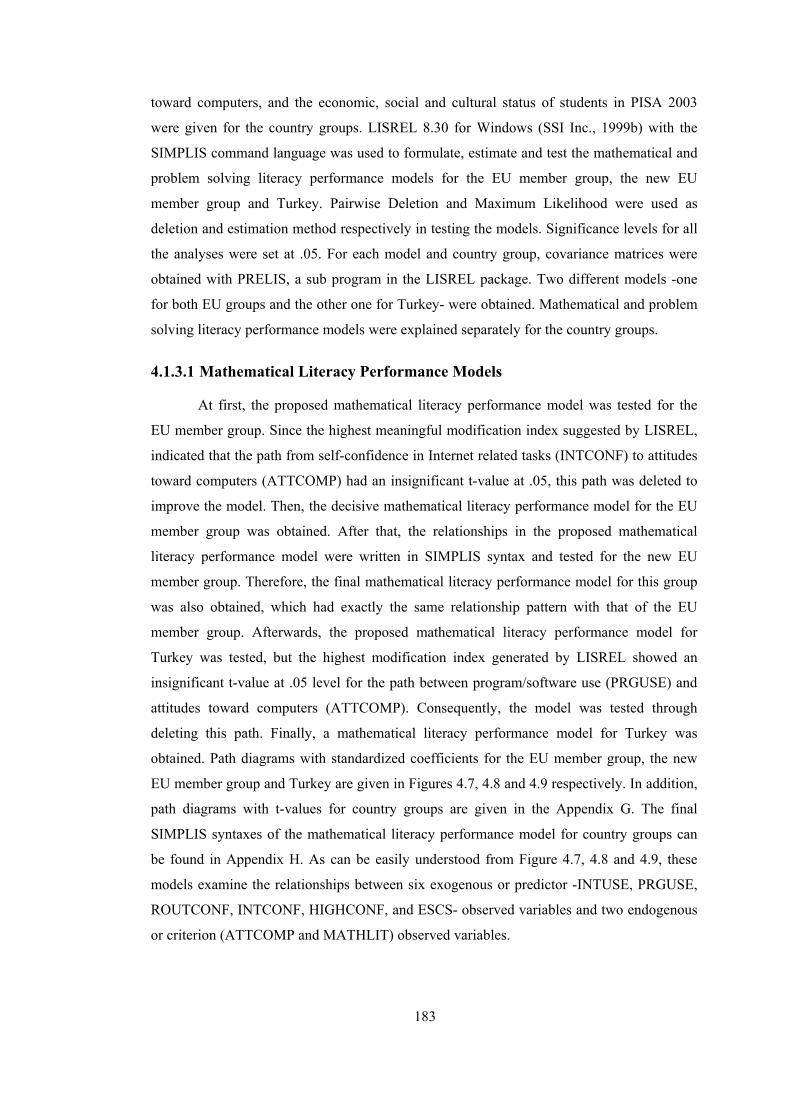
183
toward computers, and the economic, social and cultural status of students in PISA 2003
were given for the country groups. LISREL 8.30 for Windows (SSI Inc., 1999b) with the
SIMPLIS command language was used to formulate, estimate and test the mathematical and
problem solving literacy performance models for the EU member group, the new EU
member group and Turkey. Pairwise Deletion and Maximum Likelihood were used as
deletion and estimation method respectively in testing the models. Significance levels for all
the analyses were set at .05. For each model and country group, covariance matrices were
obtained with PRELIS, a sub program in the LISREL package. Two different models -one
for both EU groups and the other one for Turkey- were obtained. Mathematical and problem
solving literacy performance models were explained separately for the country groups.
4.1.3.1 Mathematical Literacy Performance Models
At first, the proposed mathematical literacy performance model was tested for the
EU member group. Since the highest meaningful modification index suggested by LISREL,
indicated that the path from self-confidence in Internet related tasks (INTCONF) to attitudes
toward computers (ATTCOMP) had an insignificant t-value at .05, this path was deleted to
improve the model. Then, the decisive mathematical literacy performance model for the EU
member group was obtained. After that, the relationships in the proposed mathematical
literacy performance model were written in SIMPLIS syntax and tested for the new EU
member group. Therefore, the final mathematical literacy performance model for this group
was also obtained, which had exactly the same relationship pattern with that of the EU
member group. Afterwards, the proposed mathematical literacy performance model for
Turkey was tested, but the highest modification index generated by LISREL showed an
insignificant t-value at .05 level for the path between program/software use (PRGUSE) and
attitudes toward computers (ATTCOMP). Consequently, the model was tested through
deleting this path. Finally, a mathematical literacy performance model for Turkey was
obtained. Path diagrams with standardized coefficients for the EU member group, the new
EU member group and Turkey are given in Figures 4.7, 4.8 and 4.9 respectively. In addition,
path diagrams with t-values for country groups are given in the Appendix G. The final
SIMPLIS syntaxes of the mathematical literacy performance model for country groups can
be found in Appendix H. As can be easily understood from Figure 4.7, 4.8 and 4.9, these
models examine the relationships between six exogenous or predictor -INTUSE, PRGUSE,
ROUTCONF, INTCONF, HIGHCONF, and ESCS- observed variables and two endogenous
or criterion (ATTCOMP and MATHLIT) observed variables.
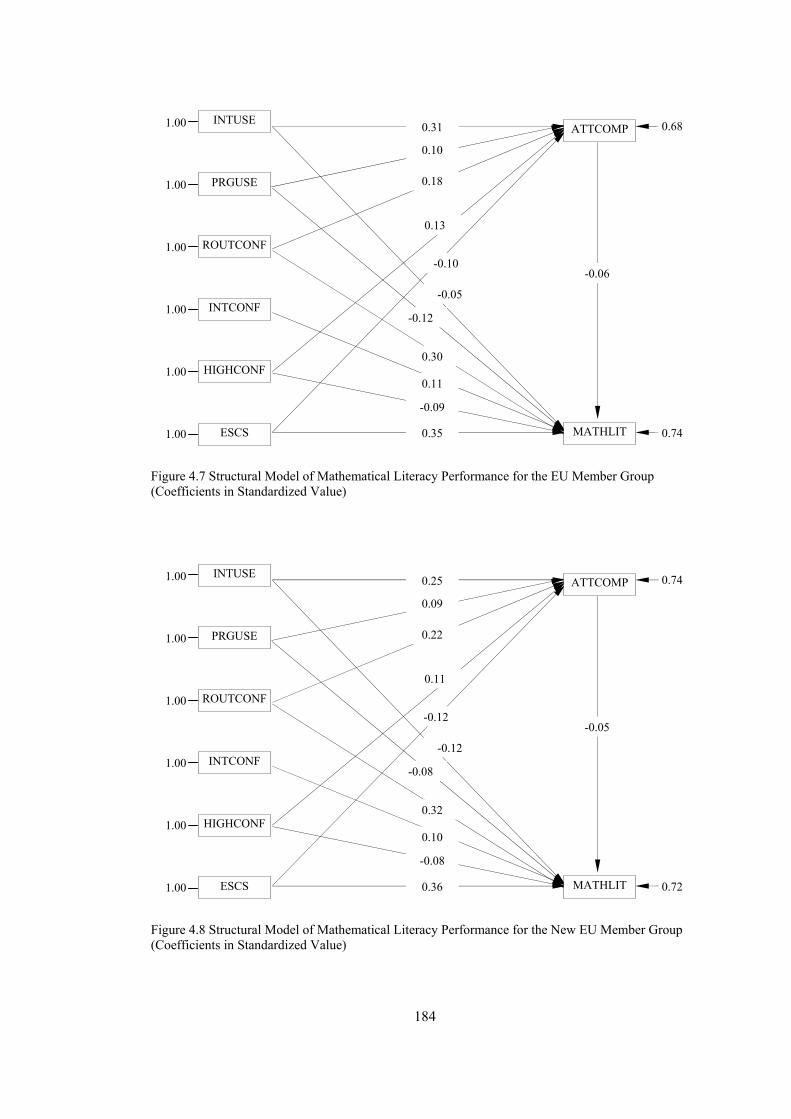
184
Figure 4.7 Structural Model of Mathematical Literacy Performance for the EU Member Group (Coefficients in Standardized Value)
Figure 4.8 Structural Model of Mathematical Literacy Performance for the New EU Member Group (Coefficients in Standardized Value)
ROUTCONF
1.00
0.68
0.74
PRGUSE
INTUSE
INTCONF
HIGHCONF
ESCS
ATTCOMP
MATHLIT
1.00
1.00
1.00
1.00
1.00
-0.06
0.13
0.31
0.18
0.10
-0.10
-0.05
-0.12
0.30
0.11
-0.09
0.35
ROUTCONF
1.00
0.74
0.72
PRGUSE
INTUSE
INTCONF
HIGHCONF
ESCS
ATTCOMP
MATHLIT
1.00
1.00
1.00
1.00
1.00
-0.05
0.11
0.25
0.22
0.09
-0.12
-0.12
-0.08
0.32
0.10
-0.08
0.36
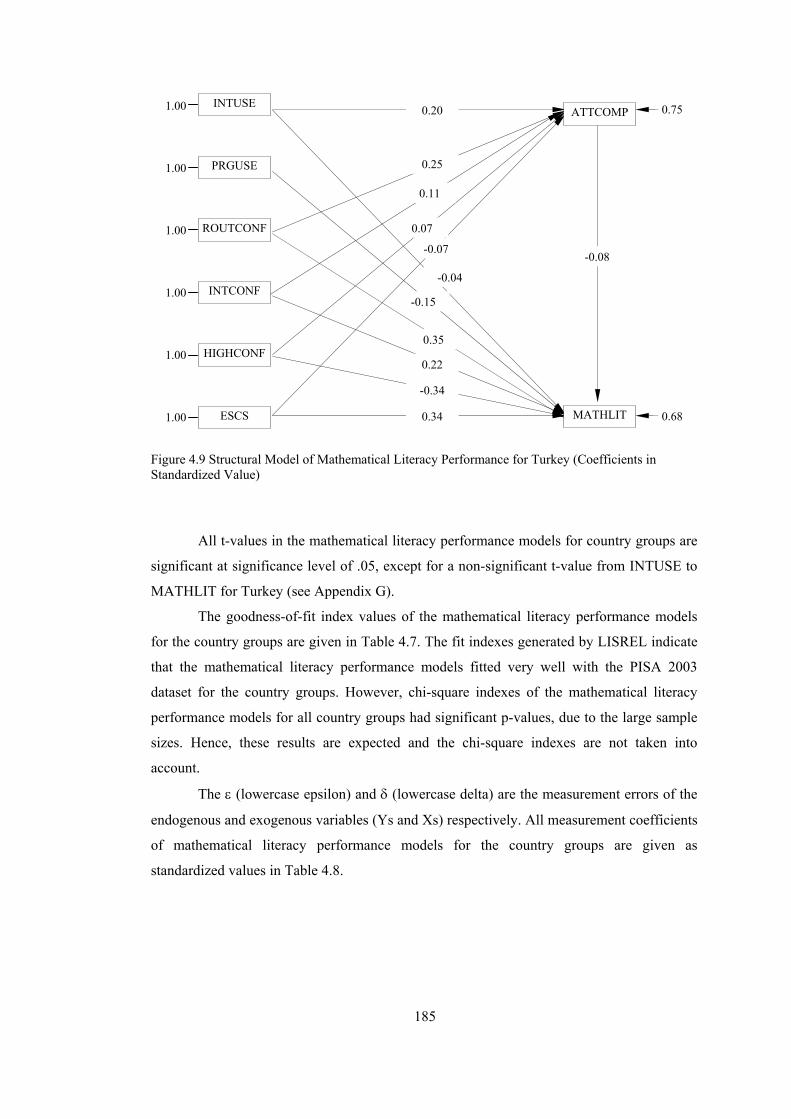
185
Figure 4.9 Structural Model of Mathematical Literacy Performance for Turkey (Coefficients in Standardized Value)
All t-values in the mathematical literacy performance models for country groups are
significant at significance level of .05, except for a non-significant t-value from INTUSE to
MATHLIT for Turkey (see Appendix G).
The goodness-of-fit index values of the mathematical literacy performance models
for the country groups are given in Table 4.7. The fit indexes generated by LISREL indicate
that the mathematical literacy performance models fitted very well with the PISA 2003
dataset for the country groups. However, chi-square indexes of the mathematical literacy
performance models for all country groups had significant p-values, due to the large sample
sizes. Hence, these results are expected and the chi-square indexes are not taken into
account.
The ε (lowercase epsilon) and δ (lowercase delta) are the measurement errors of the
endogenous and exogenous variables (Ys and Xs) respectively. All measurement coefficients
of mathematical literacy performance models for the country groups are given as
standardized values in Table 4.8.
ROUTCONF
1.00
0.75
0.68
PRGUSE
INTUSE
INTCONF
HIGHCONF
ESCS
ATTCOMP
MATHLIT
1.00
1.00
1.00
1.00
1.00
-0.08
0.07
0.20
0.25
0.11
-0.07
-0.04
-0.15
0.35
0.22
-0.34
0.34

186
Table 4.7 The Fit Index Values of the Mathematical Literacy Performance Model for Country Groups
Fit Indexes Criteria EU Member Group
New EU Member Group
Turkey
85.63 4.49 8.84 Chi Square Non-
significant p = .000 p = .03401 p = .0029
Goodness of Fit Index (GFI) > 0.9 1.00 1.00 1.00
Adjusted Goodness of Fit Index (AGFI) > 0.9 0.99 1.00 1.00
Root Mean Square Error (RMSEA) < 0.5 0.038 0.012 0.047
Standardized Root Mean Square Residual (S-RMR) < 0.5 0.0035 0.0012 0.005
Table 4.8 Measurement Errors of Mathematical Literacy Performance Model for Country Groups
Measurement Errors Observed Variables
EU Member Group New EU Member Group Turkey
ATTCOMP 0.68 (ε) 0.74 (ε) 0.75 (ε) MATHLIT 0.74 (ε) 0.72 (ε) 0.68 (ε) INTUSE 1.00 (δ) 1.00 (δ) 1.00 (δ) PRGUSE 1.00 (δ) 1.00 (δ) 1.00 (δ)
ROUTCONF 1.00 (δ) 1.00 (δ) 1.00 (δ) INTCONF 1.00 (δ) 1.00 (δ) 1.00 (δ)
HIGHCONF 1.00 (δ) 1.00 (δ) 1.00 (δ) ESCS 1.00 (δ) 1.00 (δ) 1.00 (δ)
The β (lowercase beta) value indicates the size and direction of the relationship
among the endogenous observed variables. The structure path coefficients for the
mathematical literacy performance models for the country groups were displayed as
standardized path coefficients in Figures 4.7, 4.8 and 4.9. The values of β as standardized
path coefficients from ATTCOMP to MATHLIT are negative and very small in the
mathematical literacy performance models for the EU member group (β = -0.06), the new
EU member group (β = -0.05) and Turkey (β = -0.08).
The γ (lowercase gamma) values indicate the size and direction of the relationship
between the exogenous observed variables and endogenous observed variables. All the
structure path coefficients for the mathematical literacy performance models for the country
groups are displayed as standardized values in Figures 4.7, 4.8 and 4.9 and Table 4.10. The
values of γ (lowercase gamma) as standardized path coefficients represent variability in
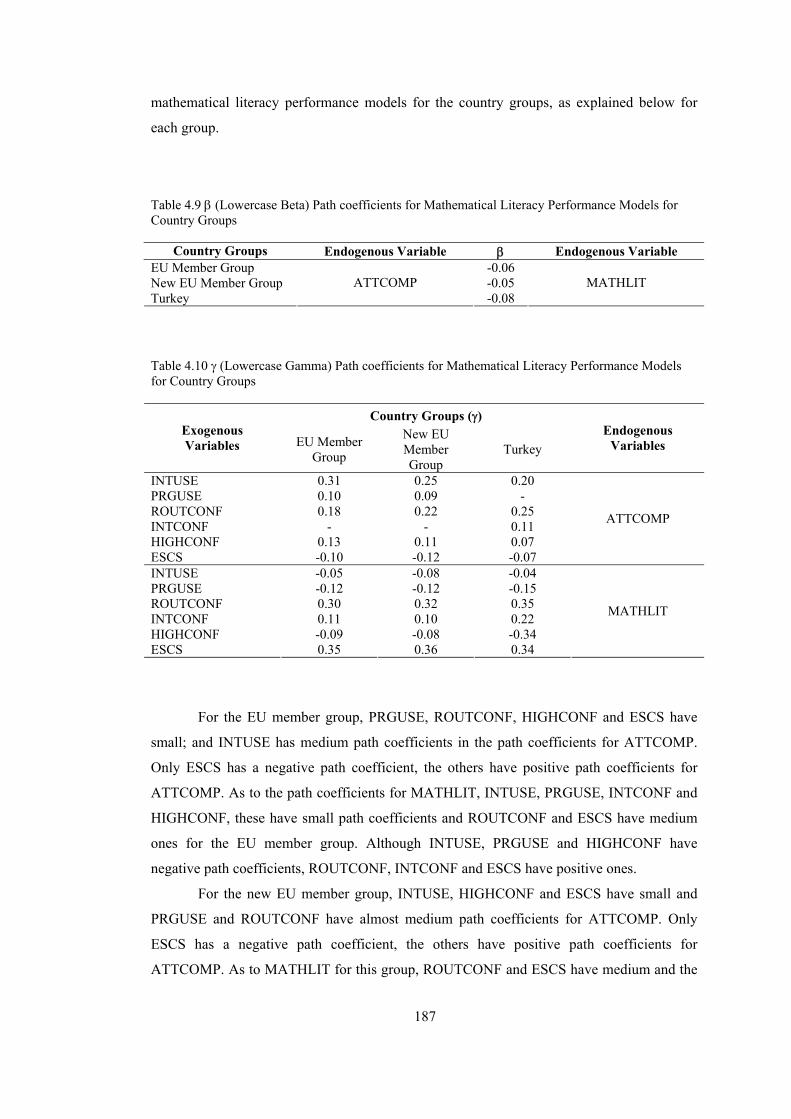
187
mathematical literacy performance models for the country groups, as explained below for
each group.
Table 4.9 β (Lowercase Beta) Path coefficients for Mathematical Literacy Performance Models for Country Groups
Country Groups Endogenous Variable β Endogenous Variable EU Member Group -0.06 New EU Member Group -0.05 Turkey
ATTCOMP -0.08
MATHLIT
Table 4.10 γ (Lowercase Gamma) Path coefficients for Mathematical Literacy Performance Models for Country Groups
Country Groups (γ) Exogenous Variables EU Member
Group
New EU Member Group
Turkey Endogenous
Variables
INTUSE 0.31 0.25 0.20 PRGUSE 0.10 0.09 - ROUTCONF 0.18 0.22 0.25 INTCONF - - 0.11 HIGHCONF 0.13 0.11 0.07 ESCS -0.10 -0.12 -0.07
ATTCOMP
INTUSE -0.05 -0.08 -0.04 PRGUSE -0.12 -0.12 -0.15 ROUTCONF 0.30 0.32 0.35 INTCONF 0.11 0.10 0.22 HIGHCONF -0.09 -0.08 -0.34 ESCS 0.35 0.36 0.34
MATHLIT
For the EU member group, PRGUSE, ROUTCONF, HIGHCONF and ESCS have
small; and INTUSE has medium path coefficients in the path coefficients for ATTCOMP.
Only ESCS has a negative path coefficient, the others have positive path coefficients for
ATTCOMP. As to the path coefficients for MATHLIT, INTUSE, PRGUSE, INTCONF and
HIGHCONF, these have small path coefficients and ROUTCONF and ESCS have medium
ones for the EU member group. Although INTUSE, PRGUSE and HIGHCONF have
negative path coefficients, ROUTCONF, INTCONF and ESCS have positive ones.
For the new EU member group, INTUSE, HIGHCONF and ESCS have small and
PRGUSE and ROUTCONF have almost medium path coefficients for ATTCOMP. Only
ESCS has a negative path coefficient, the others have positive path coefficients for
ATTCOMP. As to MATHLIT for this group, ROUTCONF and ESCS have medium and the

188
others have small path coefficients. Even though INTUSE, PRGUSE and HIGHCONF have
negative path coefficients, ROUTCONF, INTCONF and ESCS have positive ones of
MATHLIT for this group.
For Turkey, INTCONF, HIGHCONF and ESCS have small and INTUSE and
ROUTCONF have almost medium path coefficients for ATTCOMP. Only ESCS has a
negative path coefficient, the others have positive path coefficients for ATTCOMP. When
MATHLIT is considered, ROUTCONF, HIGHCONF and ESCS have medium path
coefficients for MATHLIT. INTUSE and PRGUSE have small and INTCONF has almost
medium path coefficients for MATHLIT, for Turkey. Even though INTUSE, PRGUSE and
HIGHCONF have negative path coefficients, ROUTCONF, INTCONF and ESCS have
positive ones of MATHLIT for Turkey.
Squared multiple correlation (R2) gives information about the strength of a linear
relationship, the proportion of explained variance in the endogenous variables accounted for
by the variables in the structural equations and model assessment and modification (Jöreskog
and Sörbom, 1993, 1996-2001, p.105). Table 4.11 indicates the magnitudes of squared
multiple correlation (R2) or effect sizes of the endogenous variables of ATTCOMP and
MATHLIT for the country groups. The R2 values can be interpreted according to the indexes
of Cohen et al. (2003). Both endogenous observed variables of ATTCOMP and MATHLIT
for the country groups have large effect sizes. Moreover, mathematical literacy performance
models explain the variances of the EU member group (R2 = .32), the new EU member group
(R2 = .26) and Turkey (R2 = .25) on ATTCOMP and that of the EU member group (R2 = .26),
the new EU member group (R2 = .28) and Turkey (R2 = .32) on MATHLIT.
Table 4.11 Squared Multiple Correlations of Endogenous Variables for Mathematical Literacy Performance Models for Country Groups
Endogenous Variables Country Groups R2 EU Member Group .32
New EU Member Group .26 ATTCOMP Turkey .25
EU Member Group .26 New EU Member Group .28 MATHLIT
Turkey .32
The sum of the direct effect and all indirect effect is called the total effect in LISREL
software (Jöreskog & Sörbom, 1996-2001). Therefore, the following mathematical equation
can be written: total effects = direct effects + indirect effects. The standardized direct,

189
indirect and total effects of exogenous variables on endogenous variables for country groups,
generated by the LISREL can be seen in Table 4.12, Table 4.13 and Table 4.14, respectively.
Since there is no path from MATHLIT to ATTCOMP in mathematical literacy performance
models for the country groups, there is no indirect effect on ATTCOMP. Therefore, direct
effects are equal to the total effects for ATTCOMP.
INTUSE has positive direct and total effects on ATTCOMP in the mathematical
literacy performance models of the EU member group (0.31), the new EU member group
(0.09) and Turkey (0.20), but it has negative direct, indirect and total effects on MATHLIT
in the mathematical literacy performance models of the EU member group (-0.05, -0.02 and -
0.07), the new EU member group (-0.12, -0.01 and -0.13) and Turkey (-0.04, -0.02 and -
0.06).
Table 4.12 Direct Effects of Exogenous Variables on Endogenous Variables of Mathematical Literacy Performance Models for Country Groups
Endogenous Variables
Country Groups INTUSE PRGUSE ROUTCONF INTCONF HIGHCONF ESCS
EU Members 0.31 0.10 0.18 - 0.13 -0.10
New EU Members 0.09 0.25 0.22 - 0.11 -0.12 ATTCOMP
Turkey 0.20 - 0.25 0.11 0.07 -0.07 EU Members -0.05 -0.12 0.30 0.11 -0.09 0.35
New EU Members -0.12 -0.08 0.32 0.10 -0.08 0.36 MATHLIT
Turkey -0.04 -0.15 0.35 0.22 -0.34 0.34 Table 4.13 Indirect Effects of Exogenous Variables on Endogenous Variables of Mathematical Literacy Performance Models for Country Groups
Endogenous Variables
Country Groups INTUSE PRGUSE ROUTCONF INTCONF HIGHCONF ESCS
EU Members -0.02 -0.01 -0.01 - -0.01 0.01
New EU Members -0.01 0.00 -0.01 - -0.01 0.01 MATHLIT
Turkey -0.02 - -0.02 -0.01 -0.01 0.01

190
Table 4.14 Total Effects of Exogenous Variables on Endogenous Variables of Mathematical Literacy Performance Models for Country Groups
Endogenous Variables
Country Groups INTUSE PRGUSE ROUTCONF INTCONF HIGHCONF ESCS
EU Members 0.31 0.10 0.18 - 0.13 -0.10
New EU Members 0.09 0.25 0.22 - 0.11 -0.12 ATTCOMP
Turkey 0.20 - 0.25 0.11 0.07 -0.07 EU Members -0.07 -0.13 0.29 0.11 -0.10 0.36
New EU Members -0.13 -0.08 0.31 0.10 -0.09 0.37 MATHLIT
Turkey -0.06 -0.15 0.33 0.21 -0.35 0.35
Since there is no path from PRGUSE to ATTCOMP for Turkey, PRGUSE has no
direct and total effects on ATTCOMP for Turkey. Thus, PRGUSE has no indirect effect on
MATHLIT for Turkey. PRGUSE has positive direct and total effects on ATTCOMP in the
mathematical literacy performance models of the EU member group (0.10) and the new EU
member group (0.25), but it has mostly negative direct, indirect and total effects on
MATHLIT in the mathematical literacy performance models of the EU member group (-
0.12, -0.01 and -0.13), the new EU member group (-0.08, 0.00 and -0.08) and Turkey (-0.15
and -0.15).
ROUTCONF has positive direct and total effects on ATTCOMP in the mathematical
literacy performance models of the EU member group (0.18), the new EU member group
(0.22) and Turkey (0.25). Although ROUTCONF has positive direct and total effects on
MATHLIT in the mathematical literacy performance models of the EU member group (0.30
and 0.29), the new EU member group (0.32 and 0.31) and Turkey (0.35 and 0.33), it has
negative indirect effects on MATHLIT in the mathematical literacy performance models of
the EU member group (-0.01), the new EU member group (-0.01) and Turkey (-0.02).
Since there is no path from INTCONF to ATTCOMP for both EU groups, there is no
direct and total effect of INTCONF on ATTCOMP for both EU groups. Thus, INTCONF
has no indirect effect on MATHLIT for both EU groups. INTCONF has only positive direct
and total effects on ATTCOMP for Turkey (0.11), but it has a negative indirect effect on
MATHLIT for Turkey (-0.01). INTCONF has positive direct and total effects on MATHLIT
in the mathematical literacy performance models of the EU member group (0.11 and 0.11),
the new EU member group (0.10, and 0.10) and Turkey (0.22 and 0.21).

191
HIGHCONF has positive direct and total effects on ATTCOMP in the mathematical
literacy performance models of the EU member group (0.13), the new EU member group
(0.11) and Turkey (0.07); but it has negative direct, indirect and total effects on MATHLIT
in the mathematical literacy performance models of the EU member group (-0.09, -0.01 and -
0.10), the new EU member group (-0.08, -0.01 and -0.09) and Turkey (-0.34, -0.01 and -
0.35).
Contrary to the ICT related factors, ESCS has a negative direct and total effect on
ATTCOMP in the mathematical literacy performance models of the EU member group (-
0.10), the new EU member group (-0.12) and Turkey (-0.07), but it has a positive direct,
indirect and total effect on MATHLIT in the mathematical literacy performance models of
the EU member group (0.35, 0.01 and 0.36), the new EU member group (0.36, 0.01 and
0.37) and Turkey (0.34, 0.01 and 0.35).
Finally, regression equations of mathematical literacy performance model for the EU
member group, the new EU member group and Turkey, YATTCOMP and YMATHLIT, including
standardized total effects as coefficients are given in Table 4.15.
Table 4.15 Regression Equations of Mathematical Literacy Performance Models for Country Groups
EU Member Group
YATTCOMP = 0.31*XINTUSE + 0.10*XPRGUSE + 0.18*XROUTCONF + 0.13*XHIGHCONF - 0.10*XESCS
YMATHLIT = - 0.07*XINTUSE - 0.13*XPRGUSE + 0.29*XROUTCONF - 0.11*X INTCONF - 0.10*XHIGHCONF + 0.36*XESCS
New EU Member Group
YATTCOMP = 0.09*XINTUSE + 0.25*XPRGUSE + 0.22*XROUTCONF + 0.11*XHIGHCONF - 0.12*XESCS
YMATHLIT = - 0.13*XINTUSE -0.08*XPRGUSE + 0.31*XROUTCONF + 0.10*X INTCONF - 0.09*XHIGHCONF + 0.37*XESCS
Turkey
YATTCOMP = 0.20*XINTUSE + 0.25*XROUTCONF +0.11*XINTCONF + 0.07*XHIGHCONF - 0.07*XESCS
YMATHLIT = - 0.06*XINTUSE - 0.15*XPRGUSE + 0.33*XROUTCONF + 0.21*X INTCONF - 0.35*XHIGHCONF + 0.35*XESCS
4.1.3.2 Problem Solving Literacy Performance Models
After completing mathematical literacy performance models for all country groups,
the proposed problem solving literacy performance model for the EU member group was set
in SIMPLIS syntax and tested. In the first attempt, since the path from self-confidence in

192
Internet related tasks (INTCONF) to attitudes toward computers (ATTCOMP) had an
insignificant t-value at .05 level, the problem solving literacy performance model for the EU
member group did not meet the criteria of fit indexes. Therefore, similar to the mathematical
literacy performance model, this path was removed from the problem literacy performance
model and the model was tested again. Consequently, the problem solving literacy
performance model for the EU member group fitted. After that, the relationships in the
proposed problem solving literacy performance model were written in SIMPLIS syntax and
tested for the new EU member group. Subsequently, the LISREL generated an insignificant
t-value (.05) for the path from self-confidence in Internet related tasks (INTCONF) to
attitudes toward computers (ATTCOMP) in problem solving literacy performance model for
the new EU member group. Then, this path was deleted from the model and it was tested
again. Therefore, the final problem solving literacy performance model for the new EU
member group was obtained. The relationships in SIMPLIS syntax of proposed problem
solving literacy performance model for Turkey did not generate the statistics that meet to fit
index criteria. Afterwards, highest meaningful modification index indicated that insignificant
t-value at .05 level for the path between program/software use (PRGUSE) and attitudes
toward computers (ATTCOMP). Therefore, this path was removed from the model and it
was tested again. Finally, the definite problem solving literacy performance model for
Turkey was acquired. Path diagrams with standardized coefficients for country groups are
given in Figures 4.10, 4.11 and 4.12 respectively. In addition, path diagrams with t-values
for country groups are given in Appendix G. The final SIMPLIS syntaxes of the problem
solving literacy performance models for the country groups can be seen in the Appendix I.
As can be easily understood from Figures 4.10, 4.11 and 4.12, these models examine the
relationships between six exogenous (INTUSE, PRGUSE, ROUTCONF, INTCONF,
HIGHCONF, and ESCS) observed variables and two endogenous (ATTCOMP and
PROBSOL) observed variables.

193
Figure 4.10 Structural Model of Problem Solving Literacy Performance for the EU Member Group (Coefficients in Standardized Value)
Figure 4.11 Structural Model of Problem Solving Literacy Performance for the New EU Member Group (Coefficients in Standardized Value)
1.00
0.68
0.76
PRGUSE
INTUSE
INTCONF
HIGHCONF
ESCS
ATTCOMP
PROBSOL
1.00
1.00
1.00
1.00
1.00
-0.06
0.13
0.31
0.18
0.10
-0.10
-0.09
-0.09
0.29
0.09
-0.19
0.35
ROUTCONF
ROUTCONF
1.00
0.74
0.77
PRGUSE
INTUSE
INTCONF
HIGHCONF
ESCS
ATTCOMP
PROBSOL
1.00
1.00
1.00
1.00
1.00
-0.06
0.11
0.25
0.22
0.09
-0.12
-0.13
-0.08
0.27
0.13
-0.15
0.34

194
Figure 4.12 Structural Model of Problem Solving Literacy Performance for Turkey (Coefficients in Standardized Value)
All t-values in the problem solving literacy performance models for country groups
are significant at .05. That is, all path coefficients have significant t-values.
The goodness-of-fit indexes and their criteria for the problem solving literacy
performance models for country groups are given in Table 4.16. The fit indexes, generated
by LISREL, indicate that the problem solving literacy performance models fitted very well
with the PISA 2003 dataset for country groups. The only exception is that the chi-square
indexes of the problem solving literacy performance models for all country groups had
significant p-values, due to the large sample sizes. Therefore, these chi-square indexes are
expected and they are not taken into account.
As in Table 4.8, the ε (lowercase epsilon) and δ (lowercase delta) are the
measurement errors of the endogenous and exogenous (Ys and Xs), respectively. All
measurement coefficients of problem solving literacy performance models for country
groups were given as standardized values in Table 4.17.
ROUTCONF
1.00
0.75
0.71
PRGUSE
INTUSE
INTCONF
HIGHCONF
ESCS
ATTCOMP
PROBSOL
1.00
1.00
1.00
1.00
1.00
-0.05
0.07
0.20
0.25
0.11
-0.07
-0.10
-0.12
0.34
0.17
-0.27
0.34

195
Table 4.16 The Fit Index Values of the Problem Solving Literacy Performance Model for Country Groups
Fit Indexes Criteria EU Member Group
New EU Member Group
Turkey
85.63 4.49 8.84 Chi Square Non-
significant p = .00 p = .03401 p = .00294
Goodness of Fit Index (GFI) > 0.9 1.00 1.00 1.00
Adjusted Goodness of Fit Index (AGFI) > 0.9 0.99 1.00 0.98
Root Mean Square Error (RMSEA) < 0.5 0.038 0.012 0.047
Standardized Root Mean Square Residual (S-RMR) < 0.5 0.0034 0.0012 0.0049
Table 4.17 Measurement Coefficients of Problem Solving Literacy Performance Model for Country Groups
Measurement Errors Observed Variables
EU Member Group New EU Member Group Turkey
ATTCOMP 0.68 (ε) 0.74 (ε) 0.75 (ε) PROBSOL 0.76 (ε) 0.77 (ε) 0.71 (ε) INTUSE 1.00 (δ) 1.00 (δ) 1.00 (δ) PRGUSE 1.00 (δ) 1.00 (δ) 1.00 (δ)
ROUTCONF 1.00 (δ) 1.00 (δ) 1.00 (δ) INTCONF 1.00 (δ) 1.00 (δ) 1.00 (δ)
HIGHCONF 1.00 (δ) 1.00 (δ) 1.00 (δ) ESCS 1.00 (δ) 1.00 (δ) 1.00 (δ)
Again, the β (lowercase beta) value indicates the size and direction of the
relationship among the endogenous observed variables. The structure path coefficients of the
problem solving literacy performance models for the country groups were displayed as
standardized path coefficients in Figures 4.10, 4.11 and 4.12. The values of β as standardized
path coefficient from ATTCOMP to PROBSOL are negative and very small in the problem
solving literacy performance models for the EU member group (β = -0.06), the new EU
member group (β = -0.06) and Turkey (β = -0.05).
The γ (lowercase gamma) values indicate the size and direction of the relationship
between the exogenous observed variables and endogenous observed variables. All the
structure path coefficients for the problem solving literacy performance models for country
groups were displayed as standardized values in Figures 4.10, 4.11 and 4.12. The values of γ
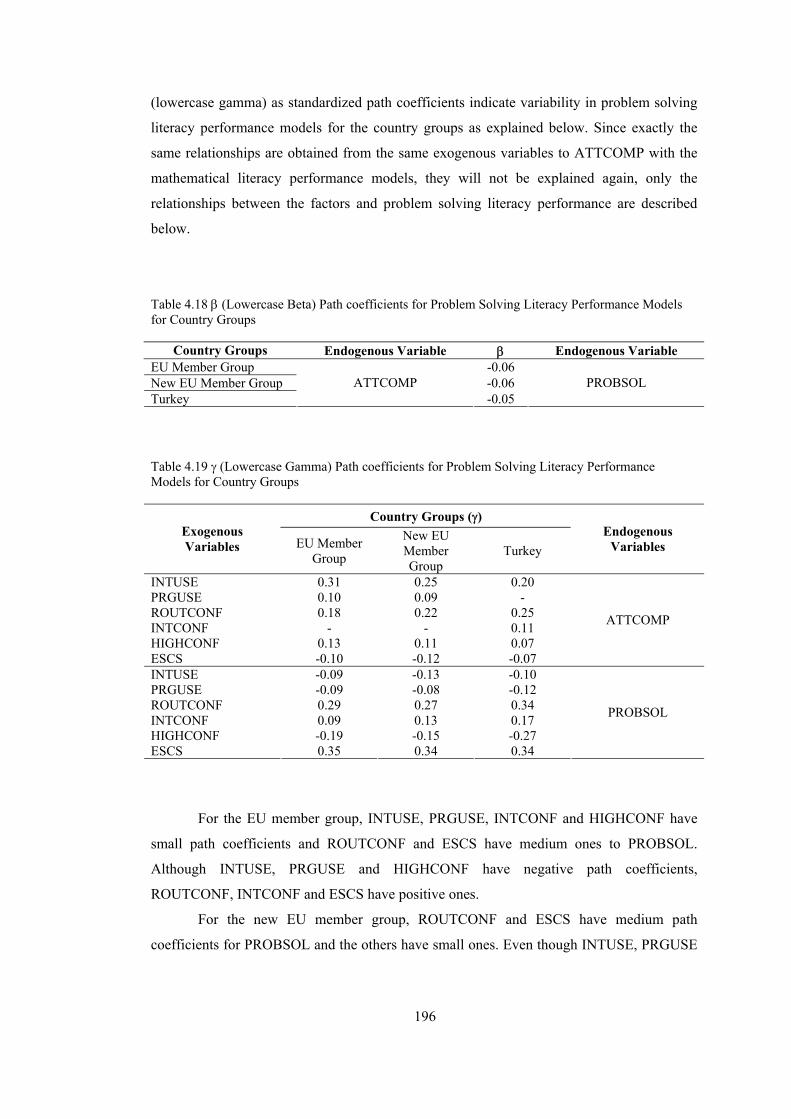
196
(lowercase gamma) as standardized path coefficients indicate variability in problem solving
literacy performance models for the country groups as explained below. Since exactly the
same relationships are obtained from the same exogenous variables to ATTCOMP with the
mathematical literacy performance models, they will not be explained again, only the
relationships between the factors and problem solving literacy performance are described
below.
Table 4.18 β (Lowercase Beta) Path coefficients for Problem Solving Literacy Performance Models for Country Groups
Country Groups Endogenous Variable β Endogenous Variable EU Member Group -0.06 New EU Member Group -0.06 Turkey
ATTCOMP -0.05
PROBSOL
Table 4.19 γ (Lowercase Gamma) Path coefficients for Problem Solving Literacy Performance Models for Country Groups
Country Groups (γ) Exogenous Variables EU Member
Group
New EU Member Group
Turkey Endogenous
Variables
INTUSE 0.31 0.25 0.20 PRGUSE 0.10 0.09 - ROUTCONF 0.18 0.22 0.25 INTCONF - - 0.11 HIGHCONF 0.13 0.11 0.07 ESCS -0.10 -0.12 -0.07
ATTCOMP
INTUSE -0.09 -0.13 -0.10 PRGUSE -0.09 -0.08 -0.12 ROUTCONF 0.29 0.27 0.34 INTCONF 0.09 0.13 0.17 HIGHCONF -0.19 -0.15 -0.27 ESCS 0.35 0.34 0.34
PROBSOL
For the EU member group, INTUSE, PRGUSE, INTCONF and HIGHCONF have
small path coefficients and ROUTCONF and ESCS have medium ones to PROBSOL.
Although INTUSE, PRGUSE and HIGHCONF have negative path coefficients,
ROUTCONF, INTCONF and ESCS have positive ones.
For the new EU member group, ROUTCONF and ESCS have medium path
coefficients for PROBSOL and the others have small ones. Even though INTUSE, PRGUSE
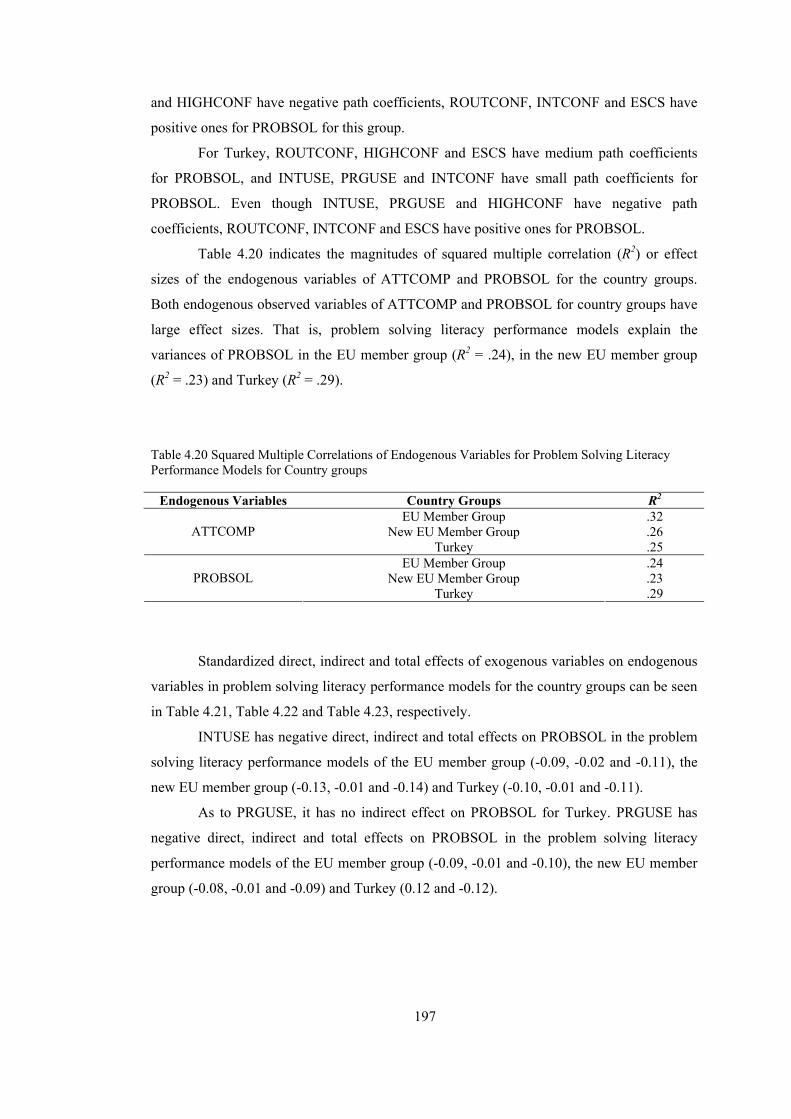
197
and HIGHCONF have negative path coefficients, ROUTCONF, INTCONF and ESCS have
positive ones for PROBSOL for this group.
For Turkey, ROUTCONF, HIGHCONF and ESCS have medium path coefficients
for PROBSOL, and INTUSE, PRGUSE and INTCONF have small path coefficients for
PROBSOL. Even though INTUSE, PRGUSE and HIGHCONF have negative path
coefficients, ROUTCONF, INTCONF and ESCS have positive ones for PROBSOL.
Table 4.20 indicates the magnitudes of squared multiple correlation (R2) or effect
sizes of the endogenous variables of ATTCOMP and PROBSOL for the country groups.
Both endogenous observed variables of ATTCOMP and PROBSOL for country groups have
large effect sizes. That is, problem solving literacy performance models explain the
variances of PROBSOL in the EU member group (R2 = .24), in the new EU member group
(R2 = .23) and Turkey (R2 = .29).
Table 4.20 Squared Multiple Correlations of Endogenous Variables for Problem Solving Literacy Performance Models for Country groups
Endogenous Variables Country Groups R2 EU Member Group .32
New EU Member Group .26 ATTCOMP Turkey .25
EU Member Group .24 New EU Member Group .23 PROBSOL
Turkey .29
Standardized direct, indirect and total effects of exogenous variables on endogenous
variables in problem solving literacy performance models for the country groups can be seen
in Table 4.21, Table 4.22 and Table 4.23, respectively.
INTUSE has negative direct, indirect and total effects on PROBSOL in the problem
solving literacy performance models of the EU member group (-0.09, -0.02 and -0.11), the
new EU member group (-0.13, -0.01 and -0.14) and Turkey (-0.10, -0.01 and -0.11).
As to PRGUSE, it has no indirect effect on PROBSOL for Turkey. PRGUSE has
negative direct, indirect and total effects on PROBSOL in the problem solving literacy
performance models of the EU member group (-0.09, -0.01 and -0.10), the new EU member
group (-0.08, -0.01 and -0.09) and Turkey (0.12 and -0.12).
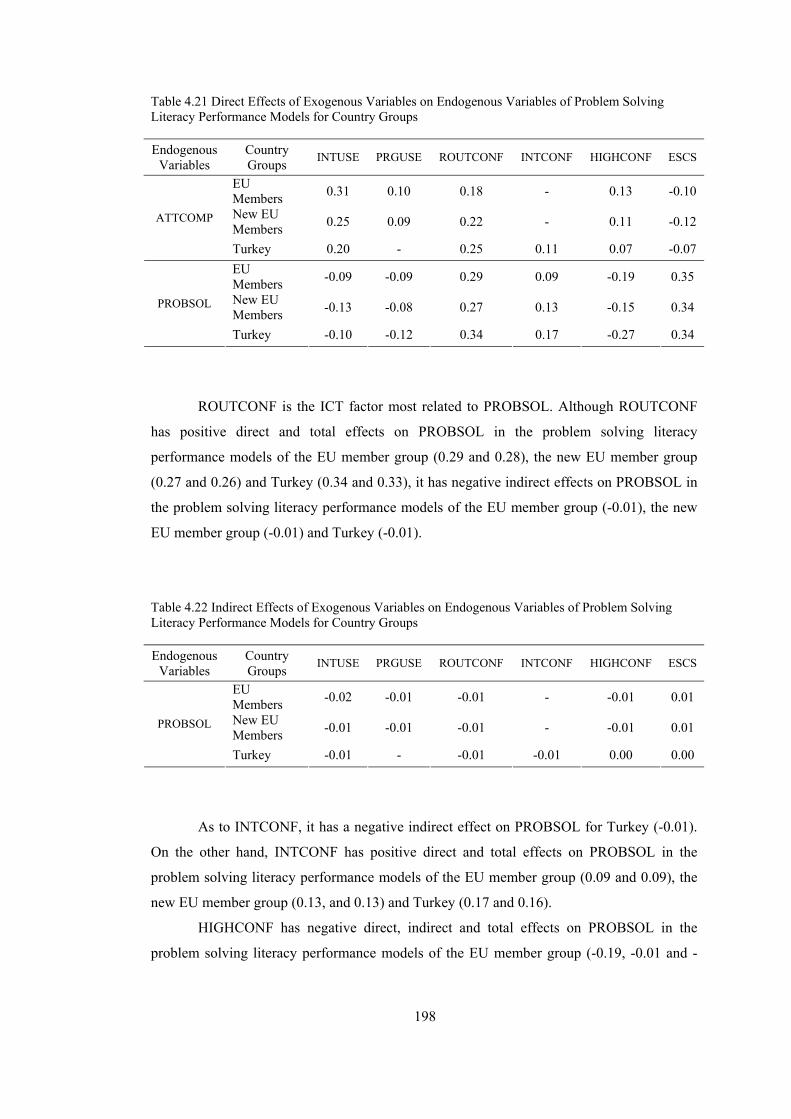
198
Table 4.21 Direct Effects of Exogenous Variables on Endogenous Variables of Problem Solving Literacy Performance Models for Country Groups
Endogenous Variables
Country Groups INTUSE PRGUSE ROUTCONF INTCONF HIGHCONF ESCS
EU Members 0.31 0.10 0.18 - 0.13 -0.10
New EU Members 0.25 0.09 0.22 - 0.11 -0.12 ATTCOMP
Turkey 0.20 - 0.25 0.11 0.07 -0.07 EU Members -0.09 -0.09 0.29 0.09 -0.19 0.35
New EU Members -0.13 -0.08 0.27 0.13 -0.15 0.34 PROBSOL
Turkey -0.10 -0.12 0.34 0.17 -0.27 0.34
ROUTCONF is the ICT factor most related to PROBSOL. Although ROUTCONF
has positive direct and total effects on PROBSOL in the problem solving literacy
performance models of the EU member group (0.29 and 0.28), the new EU member group
(0.27 and 0.26) and Turkey (0.34 and 0.33), it has negative indirect effects on PROBSOL in
the problem solving literacy performance models of the EU member group (-0.01), the new
EU member group (-0.01) and Turkey (-0.01).
Table 4.22 Indirect Effects of Exogenous Variables on Endogenous Variables of Problem Solving Literacy Performance Models for Country Groups
Endogenous Variables
Country Groups INTUSE PRGUSE ROUTCONF INTCONF HIGHCONF ESCS
EU Members -0.02 -0.01 -0.01 - -0.01 0.01
New EU Members -0.01 -0.01 -0.01 - -0.01 0.01 PROBSOL
Turkey -0.01 - -0.01 -0.01 0.00 0.00
As to INTCONF, it has a negative indirect effect on PROBSOL for Turkey (-0.01).
On the other hand, INTCONF has positive direct and total effects on PROBSOL in the
problem solving literacy performance models of the EU member group (0.09 and 0.09), the
new EU member group (0.13, and 0.13) and Turkey (0.17 and 0.16).
HIGHCONF has negative direct, indirect and total effects on PROBSOL in the
problem solving literacy performance models of the EU member group (-0.19, -0.01 and -
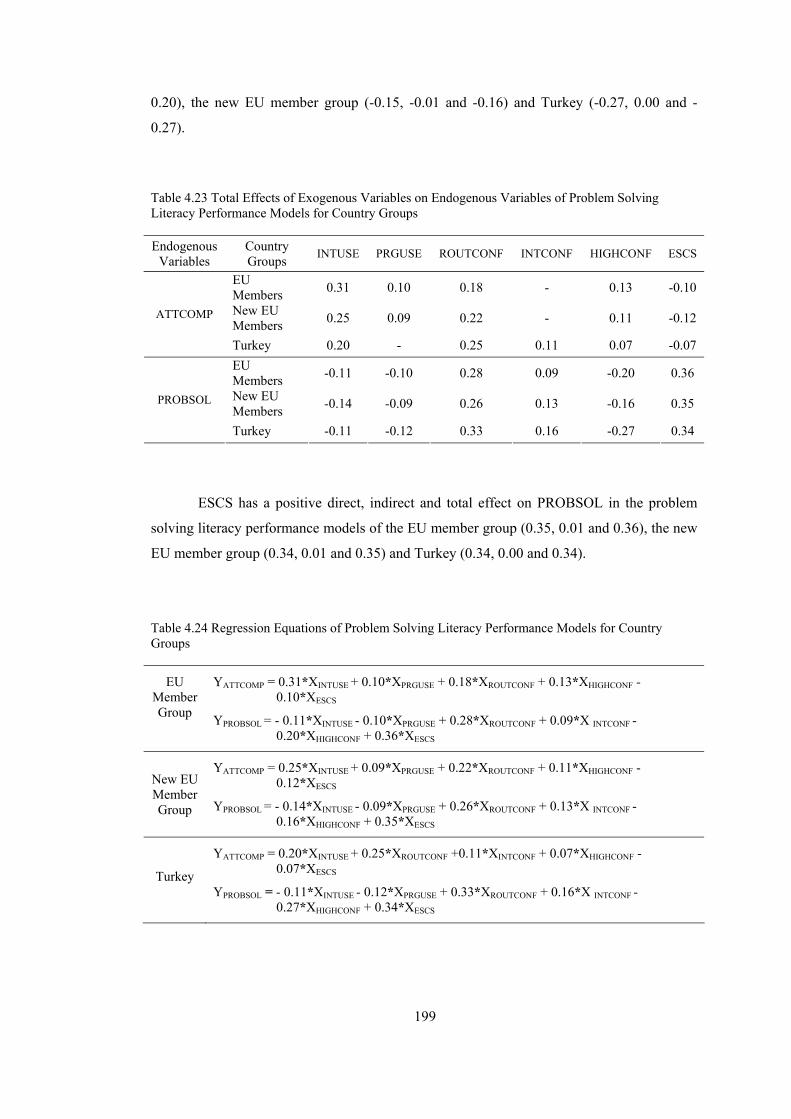
199
0.20), the new EU member group (-0.15, -0.01 and -0.16) and Turkey (-0.27, 0.00 and -
0.27).
Table 4.23 Total Effects of Exogenous Variables on Endogenous Variables of Problem Solving Literacy Performance Models for Country Groups
Endogenous Variables
Country Groups INTUSE PRGUSE ROUTCONF INTCONF HIGHCONF ESCS
EU Members 0.31 0.10 0.18 - 0.13 -0.10
New EU Members 0.25 0.09 0.22 - 0.11 -0.12 ATTCOMP
Turkey 0.20 - 0.25 0.11 0.07 -0.07 EU Members -0.11 -0.10 0.28 0.09 -0.20 0.36
New EU Members -0.14 -0.09 0.26 0.13 -0.16 0.35 PROBSOL
Turkey -0.11 -0.12 0.33 0.16 -0.27 0.34
ESCS has a positive direct, indirect and total effect on PROBSOL in the problem
solving literacy performance models of the EU member group (0.35, 0.01 and 0.36), the new
EU member group (0.34, 0.01 and 0.35) and Turkey (0.34, 0.00 and 0.34).
Table 4.24 Regression Equations of Problem Solving Literacy Performance Models for Country Groups
EU Member Group
YATTCOMP = 0.31*XINTUSE + 0.10*XPRGUSE + 0.18*XROUTCONF + 0.13*XHIGHCONF - 0.10*XESCS
YPROBSOL = - 0.11*XINTUSE - 0.10*XPRGUSE + 0.28*XROUTCONF + 0.09*X INTCONF - 0.20*XHIGHCONF + 0.36*XESCS
New EU Member Group
YATTCOMP = 0.25*XINTUSE + 0.09*XPRGUSE + 0.22*XROUTCONF + 0.11*XHIGHCONF - 0.12*XESCS
YPROBSOL = - 0.14*XINTUSE - 0.09*XPRGUSE + 0.26*XROUTCONF + 0.13*X INTCONF - 0.16*XHIGHCONF + 0.35*XESCS
Turkey
YATTCOMP = 0.20*XINTUSE + 0.25*XROUTCONF +0.11*XINTCONF + 0.07*XHIGHCONF - 0.07*XESCS
YPROBSOL = - 0.11*XINTUSE - 0.12*XPRGUSE + 0.33*XROUTCONF + 0.16*X INTCONF - 0.27*XHIGHCONF + 0.34*XESCS
200
Finally, the regression equations for the problem solving literacy performance model
for the EU member group, the new EU member group and Turkey, YATTCOMP and
YPROBSOL, including standardized total effects as coefficients, are given in Table 4.24.
4.2 Results for Qualitative Phase of the Present Study
In this section, the findings of the interviews are presented in the light of the
qualitative research questions. The findings regarding the following major themes will be
presented: issues in ICT policy and implementations in Turkey, suggestions for ICT policy
and implementations in Turkey, perceptual evaluation of ICT aspects, and relationships
between program/software use, self-confidence in high level tasks and socioeconomic
background with mathematical and problem solving literacy performance. The themes and
their related subcategories are given in Appendix F.
4.2.1 Issues in ICT Policy and Implementations in Turkey
Issues in ICT Policy and Implementations in Turkey is the first category including
the following sub-categories: conflicts in existence of ICT policy in operation, insufficient
financial resources, curriculum and teacher training. Each sub-category may also have a
second level sub-category. These are given below.
It is intriguing that most of the participants (PM-2,3, PI, and AC-1,3) in this study
expressed inconsistent statements on the ICT policy in operation in Turkey. There were
some contradictory expressions, as follows: “since I have low personal confidence in the
existence of an ICT policy in education in Turkey, I have generally superficial knowledge in
this issue” (AC-1), “there is no policy by the name of ICT … as far as I know I do not know
of an issue in respect of developments or change in ICT policy” (PM-2), “an ICT policy
should be developed” (AC-3) and “we do not know these results directly from PISA, but
news emerging from results really reflected on education policy, thereby they also reflected
on our studies” (PI). It can be concluded from the responses of the interviewees that there is
no concrete ICT policy document, namely, no consensus on the existence of an ICT policy
document.
Political intervention in MONE, in developing and implementing ICT policies,
results in discontinuity and lack of a monitoring and evaluation system in ICT policies. This
was stressed by two participants (AC-1,2). Discontinuity in ICT policy and implementations
in Turkey is indicated by two of the participants as one of the most critical issues. One of the
participants emphasized that discontinuity not only exists in ICT policy and
implementations, but it also in the general structure of Turkish society. More specifically, he

201
stated, “what the system tells us is to take and use, but not continuity; teachers are trained,
but there is no sustainability” (AC-1). The other participant pointed out a mistake, which is
that “every government carries its new thing, there is no sustainability” (AC-2). In this sense,
discontinuity in ICT policy and its implementations can be regarded as a negative effect of
political intervention.
A negative effect of political intervention on the evaluation of ICT policy and its
implementations is brought up by the same participants (AC-1,2), as well. They made
complaints about the nonexistence of an evaluation system for ICT policy and
implementations. Although one of the participants just mentioned that “there is no
monitoring mechanism, no evaluation system about ICT policy and implementations” (AC-
1), another stated, “we should not cancel policy or implementation until it is evaluated, for
example, nobody knows why we canceled the old curriculum, is there any data on hand?”
(AC-2). Furthermore, the nonexistence of an evaluation system makes identification of
possible problems or challenges in the ICT-related implementations difficult; therefore,
generating solutions to possible problems or challenges is likely to be difficult, too. In this
context, the absence of a monitoring and evaluation system can negatively affect the
continuity and sustainability of sound ICT policies and implementations, which can be
attributed again to the negative effects of political intervention.
In different contexts, the same participants also explicitly indicated negative effects
of political intervention due to the perception of managerial positions as power positions in
Turkey. One of them expressed the perception of authorities as “since people who take the
lead, consider a position of management as a position of power, they are in authority, but not
well aware [of what has to be done]” (AC-1). Another participant called attention to the
property of political implementation as, “I am sure that the same data will be differently
interpreted if you interview with another colleague, now, once these interpretations are
different, we act according to the person who has authority power” (AC-2). Unfortunately,
the negative effects of political intervention, discontinuity and lack of monitoring and
evaluation are indicators of lack of cultural accumulation in Turkey.
Policy makers’ lack of awareness and understanding about the importance of ICT
policy and implementations was expressed by two participants (AC-1 and PM-1) as another
indicator within the lack of cultural accumulation. One of them (AC-1) indirectly underlined
the importance of universities in ICT policy and implementations in Turkey. More
specifically, this person said “look at importance given by governments, I mean, does a
computer do itself? Somebody who is in education will do it; you know the importance of
202
trained manpower” Unawareness or not understanding the importance of ICT and its
implementations can be considered as possible underlying reasons for other issues.
In addition to these issues within cultural accumulation, conservatism is specified by
one participant (PM-1). Conservatism as a resistance to innovation is mentioned, “as an
obstacle, rejection of innovations in the system and not giving a chance to innovation”
Although one participant mentioned this issue, it seems to be crucial in the development and
implementations of ICT policy.
There are deficiencies in developing and implementing ICT policies in Turkey.
Three participants criticized MONE for its overemphasis on the distribution of hardware.
The most striking expressions are as follow: “while MONE is giving numerical information
to us, this much information technology, that many Internet connections” (AC-1),
“computers have already been installed in every school within the basic education project,
you know, Internet connections … that is, installing IT rooms, providing computer teachers
and a computer course curriculum is not sufficient anymore” (AC-3) and “it is true that IT
rooms initially installed have become outdated without having being used” (PI). It can be
understood from all these expressions and their contexts that the distribution of hardware to
schools is overemphasized by MONE, but other relevant issues such as software, the in-
service training of teachers and school staff, maintenance, sustainability, continuity, and
update, and upgrade etc. were not focused on by most of the participants as much as
hardware.
Not considering research findings, including the ICT dimension of the PISA 2003
study, is another sub-category of deficiencies in developing and implementing ICT policies.
Two policy makers and implementers talked about research including ICT. One of them put
the case with research results clearly, as “not a culture in this country, but I mean, these kind
of studies are conducted and put on shelves, putting them into practice is, of course, a
separate phenomenon” (PM-1). Another policy maker stated expressly the condition related
to research as “I can not say that the results of PISA are very effective in the 2004
curriculum” (PM-3). Furthermore, one policy implementer declared that, “we do not know
these results directly from PISA” (PI). However, only one participant (PM-2) pleaded in
favor of considering the PISA 2003 study findings, and the rest of the participants did not
touch on this issue. It is understood from the statements of the participants that the results of
PISA 2003 study are considered to be concerned with building a new curriculum, but the
ICT dimension was not considered.
In addition to these deficiencies, the following were also mentioned in relation to
developing and implementing ICT policies: using imported solutions, insufficiently active
203
role of universities and the private sector, and groundless and baseless solutions due to
focusing only on one component of the system. Each one was discussed by separate
participants. Using imported solutions is about using foreigners’ solutions generated for their
peculiar problems. One of the participants stressed this issue, saying “as for me, the biggest
problem is that foreigners also work on this data, now they generate solutions and we use
them as it is, through transferring” (AC-2). This is the key point in generating solutions
considering the peculiar problems or reality of any country. Other participants touched on
the lack of charging universities and the private sector with ICT related tasks. This is
expressed by one participant as “more active role can be given to universities, not only
universities, but also other parts of society” (AC-1). This issue indicates the importance of
cooperation between MONE, the universities and the private sector. Another participant
pointed out the wrong approach due to focusing only on one part of the system to work out
an ICT-related problem. More specifically, it is stated by the participant as, “the student, the
teacher, the environment should be considered as a whole, which is a thing that we do not
frequently” (PM-1).
Lack of a monitoring mechanism in the implementation process of ICT initiatives
and projects is another issue. In different contexts, two participants talk about not operating
IT rooms very well, hardware and software incompatibility, outdated IT rooms and
corruption in ICT-related implementations. Two participants spoke about the operation of IT
rooms. They contended that IT rooms are not operated functionally (AC-1, PI). One of them
declared, “from our students, I know that the situation of these laboratories is not very
good… they are not operated very well” (AC-1). The existence of IT rooms in schools does
not mean a functional use of them, for several reasons. The same participant pointed to the
technical conditions of laboratories, regarding outdating laboratories and hardware and
software compatibility. In his explanation, “technology rapidly becomes obsolete,
laboratories installed in 1998 are considered as outdated; therefore, they are not used since
new software does not work” The same participant went on to talk about corrupt practices in
ICT-related initiatives “when a project with the World Bank is on the agenda, big companies
try to become the preferred bidder for the project, some of the money is lost … relevant
administrative authorities may be always deceived” This issue also indicates a lack of a
monitoring mechanism before implementing ICT initiatives.
Insufficient financial resources is another issue raised by four participants. Although
different dimensions are expressed, serving a huge target audience, the role of power
authority, and the need for hardware distribution to students and teachers were focused on by
participants. All four participants stressed the importance of financial resources. Two policy
204
makers complained about the large number of people (students, teachers and other staff), and
they believe that sufficient financial resources will solve the problem, if sufficient money is
allocated by such external resources as the World Bank and the EU, or donations (PM-2,3).
One of the participants said, “we are huge mass, 20 million addresses, I mean, in this case,
we have difficulties as quantity” (AC-1). The numerical greatness of the target audience of
MONE is a striking fact, but it is inevitable that policy makers have to scope out this
challenge. Insufficient resource allocation is also emphasized by one academician (AC-1)
and a policy implementer. As one of the participants expressed, “the human being is slightly
egoist, if the human being is in politics, s/he is more egoist and reflects this egoism on
his/her behavior, I mean, the existence of sufficient resources resolves many things” (AC-1).
Power authority plays a critical role in providing sufficient resources for infrastructure,
distribution of hardware and software, in-service training, maintenance, sustainability and so
on. It is interesting that financial resources are mentioned within the context of hardware and
its distribution, but not in relation to other issues such as in-service training, and software
development etc.
The place of ICT in the curriculum is another important issue of the ICT policy and
implementation. Two of the policy makers emphasized the importance of the low ICT
readiness level of students, due to the low level of pre-primary education and its lack of an
ICT-related curriculum (PM-1,2). Since the introduction of ICT to children is left to families,
inequalities in acquisition of ICT knowledge and skills are inevitable, due to the different
socioeconomic and cultural statuses of families. One of the participants verbalized this issue
as:
Ignoring preschool education until seven years transforms the comparison into that of apples with pears … there is a natural difference between children who have natural ICT knowledge and skills and those who have not, he or she comes with ICT readiness (PM-1).
Furthermore, lack of an interdisciplinary approach to teaching ICT status and using it
in the curriculum is also put into words as a “lack of an interdisciplinary approach, that is,
ICT remains as only the computer, functional use of ICT in other disciplines, that is,
considering ICT as a tool in mathematics, physics, music, vocational education is ignored”
(PM-1) and “there is no ICT related course as a separate subject, we have separate courses”
(AC-3). Diffusing ICT use into other disciplines as a tool rather than offering it only as a
separate subject should be undertaken by MONE. One of the participants expressed some
problematic properties of the ICT course curriculum in different places and intensiveness as:
Not doing some things immediately, I mean, when the curriculum is changed, it lasts two or three years, for example, our students complain about this continuously, the same thing is done at grade 3, 4, 5, 6, 7 and 8, that is to say, the
205
child gets bored or feels a need to do a different thing, the curriculum is not digressed much (AC-1).
Teacher training is the last issue of the ICT policy and implementation. Although
teachers are the most important component of the education system, participants do not
stress teacher training as much as the other components. Three of the participants mentioned
teacher training. One of them blamed universities for educating unqualified teachers in this
quotation “MONE is the mirror of universities, the more failure in MONE, the more
reflection of products from the universities” (PM-1). Unfortunately, there seems to be a
mutual exclusion and a conflict between the universities and MONE. Therefore, people who
work in one side blame the other in terms of educational issues, which can be considered as a
negative interaction between them. Two other participants focused heavily on the lack of
sustainability in teacher training after graduation (AC-1, PI). Teacher training, especially
ongoing in-service training about ICT knowledge and skills, is indispensable to meet
teachers’ real needs in utilizing ICT in their teaching.
4.2.2 Suggestions for ICT Policy and Implementations in Turkey
Suggestions for ICT policy and implementations in Turkey is the second category
including the following sub-categories: sound and certain decision on policy, freedom from
political intervention, continuity in policy and implementations, strictly following to policy
and implementations, evaluation of completed policy implementations, filling the gaps in the
social, economic and cultural status of students through giving ICT education at school,
using a system approach in ICT integration into education, knowing Turkish reality and
taking measures peculiar to Turkey through research, curriculum, and teacher training. Most
of the suggestions are generally related to the issues mentioned in the previous part. The
suggestions are given below.
First and foremost, in order to put an end to the preeminent dispute of existence or
nonexistence of ICT policy document, the ICT policy document should be developed and
made public. There are several suggestions made by four participants to develop sound and
decisive ICT policy. In their expressions, they emphasized that everything should be explicit.
For example, one of the participants stressed that:
An ICT policy should be developed, that is to say, as for me, there is a sincere need for a 10-15 year policy document regarding ICT integration that includes what are the needs, what decisions need to be taken, what should be done and what kind of research should to be conducted (AC-3).
Another participant proposed cooperation between major institutions in Turkey,
saying:

206
Indeed within the framework of a national program, not only MONE, but also various scientific circles, like TÜBİTAK, in accordance with themselves set macro goals, realized by each institution through doing one’s own part, as a whole more positive results can be got (PM-2).
In this sense, it is critical that a long term national ICT policy should be explicitly
developed with the participation of public and private institutions and stakeholders. This
policy has to be developed through a consensus of all stakeholders. Furthermore, ICT-related
initiatives, projects and programmes should be supported, launched, monitored and evaluated
in cooperation between public and private institutions.
As mentioned in the issues part, political intervention in ICT-related
implementations exists in Turkey; therefore, one of the participants proposed that ICT policy
should have the following properties:
I mean, sustainability should be provided at first. In order to provide sustainability, appropriate policies for this sustainability should be certainly decided. Indeed, these policies should be inflexible and directly applicable, I mean, ICT policy should be above political parties, races, religions … we should not cancel the policy or implementation until it is evaluated (AC-2).
Most probably, political intervention originates from change of government. If the
ICT policy had the suggested properties, political intervention would not, probably, affect
ICT policy and implementations. At this point, the question of “How to maintain
sustainability of ICT policy and implementations when the government is changed?” is
explained to some extent. At different times, the same participant touched on such
interrelated points of ICT policy as: continuity in policy and its implementations, strictly
following to policy and its implementations, and evaluation of completed policy
implementations. These points, presented as issues in the previous part, involve developing a
sound and decisive ICT policy, strictly following its implementations, and evaluating them
without political intervention.
Three of the participants underlined the social, economic and cultural deficiencies,
and then indicated how to deal with this serious issue through using ICT and its facilities
(AC-2,3, PM-1). One participant approached this matter with the following statement:
That is, within this whole system, computer and Internet use should be given to children free from socioeconomic and cultural status, that is to say, it should be free from family or provisions of family, therefore, school should provide this (AC-3).
This participant loaded the responsibility of providing computer and Internet
connection on to schools. It is accepted as a plausible approach. On the other hand, another
participant suggested compensating for deficiencies in social, economic and cultural status
through using ICT, “more concentration on ICT education can be a chance to close the gap
207
originating from social and cultural differences [across country groups]” (PM-1).
Considering the social and cultural status and economical conditions of Turkey, schools
giving ICT knowledge and skills to students and utilizing ICT are the most important points
to fill the gap. In this sense, the provision of computer and Internet availability to students by
schools is accentuated by two participants. This should be also a very important
responsibility given to schools to lessen the inequalities in the social, economical and
cultural status of families.
Two of the participants commented on a system approach for integration ICT into
education and on interrogation of system components. One of the participants drew attention
to measures to be taken within the system approach, which is talked about in the issues part.
More explicitly, he expressed this as:
The system approach, that is, all components in compatible with each other in complete functioning and generating a product … our education system, implementations, curriculum, teacher education, school structure, learning environments should be seriously questioned … measures to be taken should be considered as a whole within the system approach (PM-1).
Here, the critical thing is that education system components including ICT should be
considered through holistic evaluation, the components should not be focused on separately.
Most of the participants expressed similar ideas about knowing the problematic
reality of Turkey and taking measures peculiar to Turkey through research. This process
requires transformation and takes time. In order to complete this process successfully, four of
the participants claimed that there should be cooperation between MONE, research
institutions and the universities. One of the participants spoke particularly about the
cooperation between MONE and universities, saying:
A system should be formed to provide MONE and research institutions with cooperation … a serious cooperation should be made between university and ministries … research should be oriented to cooperation and needs … scientific findings should be prescriptive (PM-1).
At this point, conflict between the universities and MONE should first be removed,
and then studies on joint research projects should be launched to give prescriptions towards
problems peculiar to Turkey. Furthermore, other participant focused on who should be
charged in ICT related tasks, saying that “policy makers should frequently assign experts …
a more active role can be given to universities” (AC-1). This is also an important factor in
realizing the transformation process. Moreover, another factor broached by another
participant is sharing responsibilities and performing one’s duty. Individuals should be
upstanding, as the participant indicated: “everyone should do one’s own duty, which is not
done” (PM-1). This is also mentioned by another participant for institutions (PM-2). In
208
addition, as one of the participants indicated, the transformation process also involves studies
on planning, implementing and research related to ICT (AC-3). As a consequence, the
transformation process of learning the problematic reality and taking measures peculiar to
Turkey requires policy makers to change their mentality or perspectives on ICT.
Suggestions for the curriculum in connection with ICT were put forward by five
participants. One of the participants focused largely on requiring ICT literacy as a
qualification in compulsory education. He emphasized at different times and places as:
ICT knowledge and skills should be a natural integral of people educated with ICT, should be goal of curriculum. All people who have graduated from basic or compulsory education should be master of this … if we demanded Turkish or Mathematics as a qualification from students who have graduated from basic education, ICT knowledge and skills should have been decreed by policy makers, as well (PM-1).
Giving ICT knowledge and skills to students at schools is inevitable for Turkey
because of the huge gap in the socioeconomic and cultural status of families and their ICT
facilities compared to families in both EU groups. The same participant proposed increasing
ICT courses in number and in hours (PM-1). Preparing an ICT related curriculum associating
virtual and real life was put forward by another participant (PI).
The majority of participants emphasized putting computers into classrooms and
utilizing ICT as a tool in other subjects across the curriculum, through integrating ICT into
the curriculum. Two of the participants suggested that learning environments with computers
should be supported and computers should be put into classrooms (PM-1, AC-3).
Furthermore, five of the participants focused largely on diffusing and integrating ICT into
other subjects, with two participants suggesting the “diffusion of ICT into disciplines, since
ICT is not anymore oneself alone, that is to say, ICT acts together with many disciplines”
(PI) and “ICT should be gotten into some more disciplines … that is to say, it is really my
belief that, ICT should be integrated into courses” (AC-3). Moreover, one of the participants
stated many times that homework and projects done by students using ICT should be
promoted with such incentives as bonuses, awards and exhibiting the products (PM-1). In
addition to these, two of the participants stressed a point on increasing the prevalence of pre-
primary education to introduce ICT education to children of more early ages, since families
may not have any ICT facility or not train their children about ICT as soundly as pre-primary
schools (PM-1,2).
Participants also called attention to teacher training, including in-service and
preservice education. One of the participants laid an emphasis on sharing educational
experiences and resources through online interaction at a provincial level. According to the
participant, “teachers in the same subjects can share their professional experiences and

209
problems lived at the province level, questions in exams and applications can be done” (PM-
1). Saving time and money in sharing sound and visuals through the Internet may increase
the motivation of teachers in their professional activities. This kind of online professional
experience can lead to a high quality of teaching. Two of the participants underlined the
necessity and importance of in-service teacher training about ICT (PM-1, PI). Another
participant gave information on the current trend in teachers’ ICT use in the developed
countries, through saying:
In a big educational technology fair in the England, that is to say that, the teacher manages all kinds of tasks through computer hereafter, complete management, I mean, there is a trend that the teacher completely manages through computer (AC-3).
In this sense, MONE and universities together should follow these developments,
develop policies and take measures on in-service and preservice teacher training. On the
other hand, one of the participants drew attention to preservice teacher training saying:
It is not possible to think of the teacher separately from the child, since the teacher conditions the student, sets the learning environment, solves learning problems, guides learning, then, in order to make this guidance, preservice teacher training should be in such a way that the teacher will be able to teach ICT (PM-1).
Teacher education programs should give prospective teachers ICT knowledge and
skills and MONE should demand ICT qualifications from teachers. In other words, if
knowledge and skills to utilize ICT are given to teachers and ICT utilization is given place in
the curriculum, then these will reflect on the students’ abilities.
Two participants drew attention to the positive effects of CEIT departments. One of
the participants made an explanation about the effects of graduates from CEIT departments
on the development of software. According to the participant,
Our CEIT graduates, for example, are continuously called to software companies, why? A CEIT student knows some things about software, knows design, knows educational dimension of job, knows instructional dimension of job (AC-1).
Considering the software buying capability conditions of Turkey, and addressing the
local needs of students, teachers and the curriculum, developing educational software as our
own production becomes vital. Another participant commented on that their existence of
CEIT departments, computer teachers and of computer courses in primary and lower
secondary school curriculum (AC-3) -this kind of course does not exist in EU primary
schools. The same participant also focused on transforming the role of computer teachers
into coordinator teachers to support subject teachers and to develop instructional materials in
schools. At least this situation could be turned to advantage through in-service teacher
210
training, working as coordinator and instructional material development consultant in
schools. The same participant went on to talk about the necessity for computer teachers who
have graduated from CEIT departments in the integration of ICT into other subjects.
4.2.3 Perceptual Evaluation of ICT Aspects
An ICT aspect is the third category of main themes including the following sub-
categories: attitudes toward computers, type of ICT use, self-confidence in ICT use, and the
perceptions of the EU member group and the new EU member group regarding ICT. Each
aspect has its own sub-categories that have also second level sub-category. They are given
below.
4.2.3.1 Attitudes toward Computers
All participants tried to give explanations for why Turkish students’ attitudes toward
computers are more positive than those in the EU culture. They related this finding to
cultural characteristics and low economic conditions. Four participants highlighted that the
entertainment and gratification dimension of computer use in Turkish culture reflect on
students’ attitudes toward computers. Some of the participants commented on the,
“perception of computers, perceiving and using computers as a preferential game and
entertainment tool, and a new, different, unusual and mysterious thing” (PI), saying: “our
students indulge themselves in games” (PM-3), and “our students have an extra aspiration
and interest in electronics and computers … perhaps, all electronic things are reminiscent of
games and entertainment, then they are pleased with them” (PM-2). This indicates that the
likeness dimension of attitudes toward computers due to entertainment is very effective on
students around 15 years old.
Most of the participants related the more positive attitudes of Turkish students
toward computers to the following rationales, stemming from low economic status: extra
aspiration, extra interest and curiosity to imported and popular technology, the image of
computers in society, still perceiving computer use as an indicator of social class, not
routine, prevalent and available, but still a luxury. These can be attributed to a hungriness for
computers due to the low economic conditions of families in Turkey. Some of the
participants gave voice to these reasons in this way:
Absence in family, state, home, school, environment. A natural result of high attitude towards computers due to this much absence” (PM-1), “There is such hungriness. There is a thing that is unavailable, guy hasn’t got a proper pants, but he has a mobile phone. That mobile phone is more important than pants, pardon me -than underpants! This value is in the general structure in society. As a consequence of this structure, there is an extra aspiration, an extra aspiration towards that technology. This positive attitude toward computers is a small

211
indicator of this” (AC-1) and “this nation is hungry for technology, that is to say, this culture is hungry for technology. This culture is the most curious than others, such a problem that they have (AC-2).
One participant insisted that having a computer is not an indicator of a social class
since people buy a computer for entertainment purposes actually, rather than showing off
(PM-3). However, another participant pointed out that the perception of Turkish society is
that “Computer use is still perceived as an indicator of social class” (PM-2). In addition to
these, one of the participants brought attention to the meaning of computers in Turkish
society with his statement that:
Most of the people in the society can not benefit from this. Television is routine, telephone is ever routine, but these technologies are not such, yet. There is a hungriness caused by not routine, society is not satisfied, that is to say that major portions of the society consider this as a luxury consumption material to be accessed. In the past, TV was such, not in every home (AC-1).
These rationales that emerged from a consideration of low economic status,
explaining why a positive attitude toward computers belongs to Turkish society, are in
interaction with cultural ones and influence each other mutually.
Four participants set forth some properties peculiar to the Turkish nation to explain
the more positive attitudes among these free from low economic status. In other words, they
were all connected by participants to the cultural structure of Turkish. These properties are
learning technology by a trial-error approach, no fear of using computers, rapid adaptation to
computers and the likeness of computers. They are labeled as a greater inclination towards
technology in the Turkish nation. For example, one of the participants stated that:
Learning by trial-error, that is, regular education has not worked for us … here, cultural difference arises, we are more inclined to technology use, that is all… the important thing is that if there is technologic instrument, you rapidly adapt this culturally … there is a such thing in you that whether there is no a fear of technology use, which is trouble, that is to say, this differentiates us from the European actually. In order to buy a computer as an European, before you buy it you should know it, but for me it is not necessary to know it to buy a computer, after bought it I will learn it in somehow (AC-2).
In addition, two participants underlined the importance of positive attitudes toward
computers; the readiness level of students can be increased and the ICT qualifications of
students can be developed and improved, if students’ positive attitudes toward computers are
utilized properly. One of the participant opined that:
This visible picture in connection with attitude tells us many things, that is, this is an event that will be able to change other pictures, forasmuch as attitude is important, that is, you can slowly improve self-confidence, Internet and computer use, as well. As for me, good attitude is an important variable … such a good attitude in us indicates having a good grounding of job, indicate people being ready, it is an advantage for us (AC-1).
212
Exploiting Turkish students’ positive attitudes toward computers give advantages to
students in an otherwise, disadvantageous position, in terms of ICT use and self-confidence
in computer tasks.
4.2.3.2 Type of ICT Use
Most of the participants talked about type of ICT use -Internet/entertainment use and
program/software use. Two participants remarked on the low level of ICT use for Internet
/entertainment in Turkey. They related this to inaccessibility due to the low national welfare.
They explained their perceptions on this issue by saying:
This indicates that the more welfare, the more wealth and the more the environment is enriched, this thing [Internet/entertainment use] gets better, I think” (PM-1) and “Socioeconomic and cultural status is a key factor, of course; does any man who is hungry use the Internet for games?, does any man who does not carry Internet to his home use Internet? that is, this is completely, directly monetary … if the same possibilities are provided to the new EU member group, a little later they catch up with the EU member group, Turkey catches up with them, too (AC-2).
In this context, some measures should be taken to increase levels of employment,
productivity and exportation for a better national welfare that positively affects access to and
use of technology. As to another type of ICT use, program/software use, four participants
gave opinions on its good position. Most of the participants supported the idea of the
existence of curriculum content and computer teacher regarding program/software for
students. This leads to an increase in the program/software use of students. Two of them
stated this, saying:
This, for example, is coherent with our basic paradigm … thing we teach as computer, when I look at this, thing we say curriculum in K-12 is seen here … since we have already worked to teach this from morning till night, students say that I use it, that’s all” (AC-2) and “There is no course in them, of course, we have courses. That is, this indicates status of CEIT departments, that is, teacher curriculum in existence, everything is defined, there is no such a thing in other countries (AC-3).
Stress is laid on the positive effects of the content of the curriculum, CEIT
departments and computer teachers on program/software use; therefore, Turkish students are
in better position in this type of ICT use.
4.2.3.3 Self-Confidence in ICT Use
The last ICT aspect is self-confidence in ICT use, including the following sub
categories: having a direct relation to functional computer use, reflecting Turkish students’
general low self confidence on other subjects, focusing only on chat and games, lack of

213
internalization of computer use, self confidence in routine tasks, self confidence in Internet
tasks, suggestions to improve self-confidence in Internet tasks and self confidence in high
level tasks.
Two of the participants established relations between students’ self-confidence in
ICT use and having functional computer competencies. One of them stated this as “This and
other self-confidences are completely related to content and functionality, to functionally
master and use a computer, when we realize this as a ratio, naturally self-confidence is in
that ratio” (PM-1). Another participant also indicated this issue by saying, “children do not
use computers for any purpose, needs … that is, children use computers like an aimless
game, any aimless object, that is, not a conscious use, that’s why self-confidence is low”
(PI). It is natural that aimless and nonfunctional ICT use may result in having low self-
confidence in ICT related tasks in Turkish students.
p. 206 Two of the participants explained their opinions on reflection of general low
self-confidence in other subjects that most probably students who are in general low self-
confidence in other subjects have low self-confidence in ICT use. As one of them stated as:
We use computer, but with low self-confidence. Of course, it should not be separated from thing, that is, students’ self-confidence in general courses and tasks done by them. That is, today if you ask about math, science, humanities and art, we may have a similar low self-confidence problem, that is, it may be considered in this framework (AC-3).
In addition to this, three participants called attention to the low self-confidence of
Turkish students in computer-related tasks, due to using computers heavily for chat and
computer games. Since chat and computer games do not require students to acquire many
computer related knowledge and skills, they have low self-confidence in computer related
tasks.
Most of the participants concentrated on the basic rationales of the low self-
confidence of students in computer-related tasks. More specifically, five participants put
forward a series of rationales or reasons why Turkish students have low self-confidence.
Their rationales can be ascribed to the general conception of a lack of internalization in
computer-related tasks. The lack of internalization in computer-related tasks has the
following dimensions: not feeling the need, reason or purpose to use a computer; insufficient
computer-related education about using computers functionally by oneself; lack of individual
computer use due to the high ratio of students per computer at schools; and having no home
computer due to the low SES of the family. Each dimension has its own effect on Turkish
students’ low self-confidence in computer related tasks. Every one influences every other,
since they are interdependent. Two of the participants noted some dimensions as:
214
I think, we could not internalize this computer, if we internalized, our self-confidence could have been developed despite this much interest and curiosity, high attitude” (PI) and “Here, put these in front of them, and ask them to do these [self-confidence items] yourself, they do not, since these [computers] do not exist at home, done at school, but a friend or teacher helped, and such like, and left the school, that’s that. That is, they tasted, but not ate, that’s all (AC-2).
As to self-confidence in specifically computer related routine tasks, three
participants indicated that the Turkish students’ reported program/software use contradicts
their self-confidence in routine tasks. This contradiction is generally related to not doing
computer tasks by oneself. The contradiction is commented on with statements like “a thing
is shown to him, he tells us what is shown, but not know what he does with that thing to
what extent? No, look, we always reach same place, he tells us what is shown to him, not
what he does” (AC-2). In such a case, there is a curriculum including program/software use
content and as far school conditions permit, the students are introduced to computers in
Turkey; however, most of them have no chance to use computers by themselves at school.
Therefore, their responses to questions on frequency of program/software use are positive,
but their responses to questions on self-confidence in similar tasks are negative, when doing
similar tasks by themselves is concerned. Another participant remarked on the effects of
income and educational level of parents on children’s self-confidence in routine computer
tasks and conscious computer use. She emphasized this in different cases by saying the
following:
The higher the income level and education of the family, naturally the more increase in the rate of schooling and computer use … I think, when level of income and education increases, computer is used more consciously and productively. This leads children or individuals to increase self-confidence (PI).
Most of the participants gave their opinions specifically on reasons for low self-
confidence in Internet-related tasks in Turkey, as well. Having high self-confidence in
Internet tasks involves having basic computer competencies and using the Internet by
oneself. Two participants touched on the prerequisite of self-confidence in Internet-related
tasks, that is, basic computer competencies. One of them remarked on this issue as “Since
using Internet requires basic knowledge and skills of computer use, our case may be affected
this” (PM-2). Furthermore, as the income level of families increase in all country groups,
self-confidence in Internet tasks increases. The relationship between Internet use and self-
confidence in Internet tasks with level of income is indicated by two participants. They
emphasized that the better the income, the more Internet use, and thus high self confidence,
regardless of country group. Moreover, there was limited Internet access and use in schools
in Turkey in 2003. In addition, Internet was not included in the curriculum in 2003. Three
participants established the grounds of low self-confidence in Internet tasks as: limited

215
Internet access and use and delay in entering Internet at schools. Some of statements on these
issues are as follow:
As to Internet, it is said that so many schools have Internet connection, but the question of ‘how many computers at schools have Internet connections?’ is not answered. However, when you go to school, there are 15-20 computers; only two of them are connected to Internet. These are bad mistakes” (AC-1) and “regarding entering Internet into Turkey, that is, a delay is point at issue compared to other countries, which may be affected (PM-2).
One of the participants noted the nonexistence of Internet-related content in the 2003
curriculum stating that, “actually Internet is seen as existing in previous programs, but
children do not apply it … Internet oriented education is not given in programs … an
Internet oriented education in school is not given by us, which is true” (PI).
One participant focused on other possible reasons for the low self-confidence, such
as unawareness of the Internet, its nonfunctional or purposeless use, and students, parents
and teachers’ perceptions about the Internet and its use. According to the participant, they
perceive the Internet as illegal or dangerous due to a lack of security and are afraid of its
limits (PI). In addition to these, another participant indicated the preparation for the central
examination, OKS (Ortaöğretim Kurumları Öğrenci Seçme ve Yerleştirme Sınavı), as a
reality for Turkish students at the end of the compulsory education. Note that this central
examination is chance for vertical movement in social class. There are some practices, such
as forbidding, abolishing or limiting Internet use due to that central examination. He gave an
example about such practices: “for example, we did not abolish computer use, but arranged
times that were limited to an hour in a day, but many family completely abolish it, some
students abolish it by themselves” (PM-3). Such limitations could impede students in
improving their self-confidence in Internet tasks.
There are several suggestions on how to improve low self-confidence in Internet-
related tasks, but they seem to be insufficient compared to the issues related above. Two
participants recommended the functional use of the Internet as an educational tool through
integrating it into the curriculum, sharing resources and experiences between students and
teachers, accessing information and motivating students with social, cultural and educational
activities through the Internet. More specifically, one of the participants stated his
recommendations by saying:
Using the Internet as educational tools should be emphasized. Internet, its communication facilities, such as sound and video and their high motivation should be exploited in doing homework, accessing information … teachers at same subjects and can share their troubles and experiences, questions in exams through using Internet at province level … students can be directed to Internet, a sibling school can be selected, students share their homeworks or music with students from sibling school (PM-1).

216
Most of the participants commented on Turkish students’ self-confidence in high
level computer tasks. One of them contended persistently, at different times, that the
relatively better position of Turkey in self-confidence in high level tasks was due to the fact
that some questions from the survey are likely to lead to better results compared to the new
EU member group. These questions involve using Microsoft PowerPoint, Excel software
applications and preparing multimedia presentation. He supported his claim by saying:
As if we were better, the reason for this is actually the PowerPoint part in multimedia … PowerPoint is taught at schools very frequently, which leads to close the difference … I think that the questions 4-5-6 should not be perceived as high level, since this 4-5-6 causes better results (AC-2).
Another participant talked about two other dimensions of self-confidence in high
level tasks. They are related to the content of self-confidence in high level tasks, and
approaches to this content. The first dimension depends largely on individual interest and
curiosity in the 2003 conditions in Turkey. Teachers and students not feeling the need to
perform high level computer tasks is the second dimension. She explained her opinions on
these dimensions as:
These items at basic level did not exist in the curriculum in 2003, these were at the advanced level education, that is, if you took computer education, they existed, I mean, if students were specialized [at vocational or technical high schools], they existed. Similarly with teachers, if teachers were not computer teachers, since they were not in the curriculum in such detail, teachers did not feel the need to learn, they were not given to students, as well. However, if students had a special interest and curiosity, they learned that time (PI).
Two of the participants also tried to clarify why Turkish students’ self-confidence in
high level tasks are lower than the EU member group. They rationalized this with relating to
nonexistence of related content in the curriculum in 2003. They expressed, “in order to
interpret these, I think, the curriculum should be looked, that is, I think, such things do
already not exist at this level” (PM-2) and “for example, such getting rid of virus such and
such are not exist very much, that is, high level use does not exist very much” (PI). Another
participant recommended that promotion should be given to students who perform
successfully computer related high level tasks in their homeworks and projects (PM-1).
4.2.4 Perceiving both the EU Groups regarding ICT
Three of the participants explained their perceptions about students’ ICT proficiency
level in the EU member group and the new EU member group. Two of them perceived the
EU education system as better than Turkey’s saying the following:
That is to say, their education system, education conception is more meaningful, it is not oriented to solve tests, but it is oriented to acquire a life philosophy … a
217
good educational infrastructure, a good education terminology, transformation of education into a science” (PM-1) and “education in the EU is more controlled, planned and has a certain program (PM-2).
In this context, one of the participants recommended that rather than focusing
specifically on producing any product, the process of producing any product through
functional use of ICT as a tool in the other subjects should be focused on, to close the gap
between the EU and Turkey through using ICT (PM-1). Another participant elucidated the
common practice of subject teachers’ using ICT as an educational tool in the EU. The same
participant also remarked that there is no curriculum with computers as a separate subject
and no computer teachers at schools in the EU (AC-3).
Two participants drew attention to the better economic welfare status of the EU
member group. One of them was of the opinion that economic power is a very strong factor
affecting educational environments and their richness in providing alternatives for children.
He commented on this situation as saying the following:
It is the normal, expected position of the EU member group due to their income, environments, educational background in each field. Development or underdevelopment as a roller snowball, you can not think anything on such underdevelopment situation, it is not possible to say that I am in the underdeveloped country, but I am a developed man … This affects all dimensions (PM-1).
The same participant also indicated that being a developed country is related to many
interrelated dimensions, such as socio-cultural structure, educational history and cultural
accumulation. Another participant focused specifically on the economic parameters and their
effects on the results of ICT aspects (AC-2). Furthermore, four participants emphasized that
using ICT is an integral part of routine life in the EU member group. Moreover, one of the
participants explained his perceptions about nonprofessional ICT use of high level tasks in
the new EU member group, as is the case in Turkey, contrary to the EU member group (PM-
1).
4.2.5 Relationships between PRGUSE, HIGHCONF and ESCS with MATHLIT and PROBSOL
Five participants gave their opinions on the relationships between students’
socioeconomic background and ICT aspects with mathematical and problem solving literacy
performance within the context of path analytic models. Their comments can be categorized
into the negative relationships of program/software use and self-confidence in high level
tasks with students’ performance, and the positive relationships of students’ socioeconomic
and cultural status with students’ performance. The negative relationship between
program/software use and students’ mathematical performance was explained by a
218
participant as “why children can not do mathematics, for example, they do arithmetical
calculations with calculators in computers, which leads to regression in children’s
arithmetical calculations” (PM-2).
In order to explain the relatively larger negative relationship between self-
confidence, high level tasks and performance of Turkish students, two alternative hypotheses
were proposed by two academicians (AC-2,3). First, one of them assigned the reasons of this
negative relationship to the fact that students may not arrange a time schedule for their study
and computer use in country groups (AC-3). She emphasized the technological novelty
effects on this time arrangement problem due to the fact that computer technology is
relatively new in Turkey. She stated these issues as:
Children spare very much time to these jobs [high level tasks], therefore, it can be concluded that children do not attach importance to mathematics or problem solving, namely, courses. There are such children, perhaps they are all, child creates webpage, play videos, takes, brings, makes something, programming. Such a child’s course is getting worse. This is matter of time, that is, each student has a certain time. Student should arrange his/her time and study. The more spare time to it, of course the higher self-confidence, but his/her performance decreases. Student can not arrange this. Actually, there is a similar case in other countries; of course, more exist in Turkey, maybe, this may be originating from [technology’s] being newer in Turkey (AC-3).
Second, the other participant tried to explain the negative relationship between low
self-confidence in high level tasks and students’ performance. He explained that high level
tasks are too structured and that they require students to be more specialised and to solve
problems monotonously, which involves non-holistic thinking. He expressed this by saying:
The more you specialize students, the more you teach students to think straightforward monotonous; students can not solve problem, which is this much simple. High level tasks make students to do these. If these are specialization, I think, result of these negatively reflects on both problem solving and mathematics model (AC-2).
On the other hand, three participants emphasized the positive relationship between
the economic, social and cultural status of students with students’ mathematical and problem
solving literacy performance. One of the participants explained her perceptions on the
positive, direct effects of parents’ education and income level on children’s self-confidence;
in this way, she said, children who have high self-confidence are more inclined to solving
problems. Another participant also emphasized the positive reflections of the socioeconomic
and cultural status of students on their performance. He expressed this in his open ended
responses as:
When this [socioeconomic and cultural status of students] increases, there should be positive reflections, that is, this actually necessary condition, is it enough? No
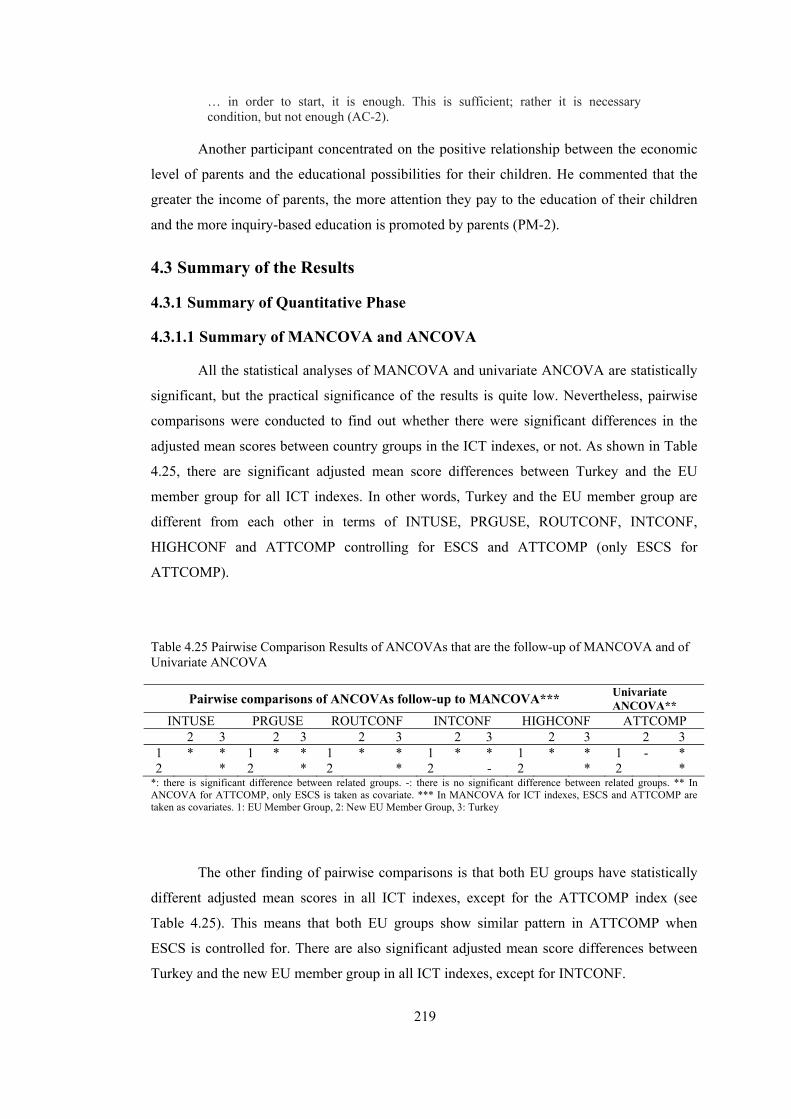
219
… in order to start, it is enough. This is sufficient; rather it is necessary condition, but not enough (AC-2).
Another participant concentrated on the positive relationship between the economic
level of parents and the educational possibilities for their children. He commented that the
greater the income of parents, the more attention they pay to the education of their children
and the more inquiry-based education is promoted by parents (PM-2).
4.3 Summary of the Results
4.3.1 Summary of Quantitative Phase
4.3.1.1 Summary of MANCOVA and ANCOVA
All the statistical analyses of MANCOVA and univariate ANCOVA are statistically
significant, but the practical significance of the results is quite low. Nevertheless, pairwise
comparisons were conducted to find out whether there were significant differences in the
adjusted mean scores between country groups in the ICT indexes, or not. As shown in Table
4.25, there are significant adjusted mean score differences between Turkey and the EU
member group for all ICT indexes. In other words, Turkey and the EU member group are
different from each other in terms of INTUSE, PRGUSE, ROUTCONF, INTCONF,
HIGHCONF and ATTCOMP controlling for ESCS and ATTCOMP (only ESCS for
ATTCOMP).
Table 4.25 Pairwise Comparison Results of ANCOVAs that are the follow-up of MANCOVA and of Univariate ANCOVA
Pairwise comparisons of ANCOVAs follow-up to MANCOVA*** Univariate ANCOVA**
INTUSE PRGUSE ROUTCONF INTCONF HIGHCONF ATTCOMP 2 3 2 3 2 3 2 3 2 3 2 3
1 * * 1 * * 1 * * 1 * * 1 * * 1 - * 2 * 2 * 2 * 2 - 2 * 2 *
*: there is significant difference between related groups. -: there is no significant difference between related groups. ** In ANCOVA for ATTCOMP, only ESCS is taken as covariate. *** In MANCOVA for ICT indexes, ESCS and ATTCOMP are taken as covariates. 1: EU Member Group, 2: New EU Member Group, 3: Turkey
The other finding of pairwise comparisons is that both EU groups have statistically
different adjusted mean scores in all ICT indexes, except for the ATTCOMP index (see
Table 4.25). This means that both EU groups show similar pattern in ATTCOMP when
ESCS is controlled for. There are also significant adjusted mean score differences between
Turkey and the new EU member group in all ICT indexes, except for INTCONF.
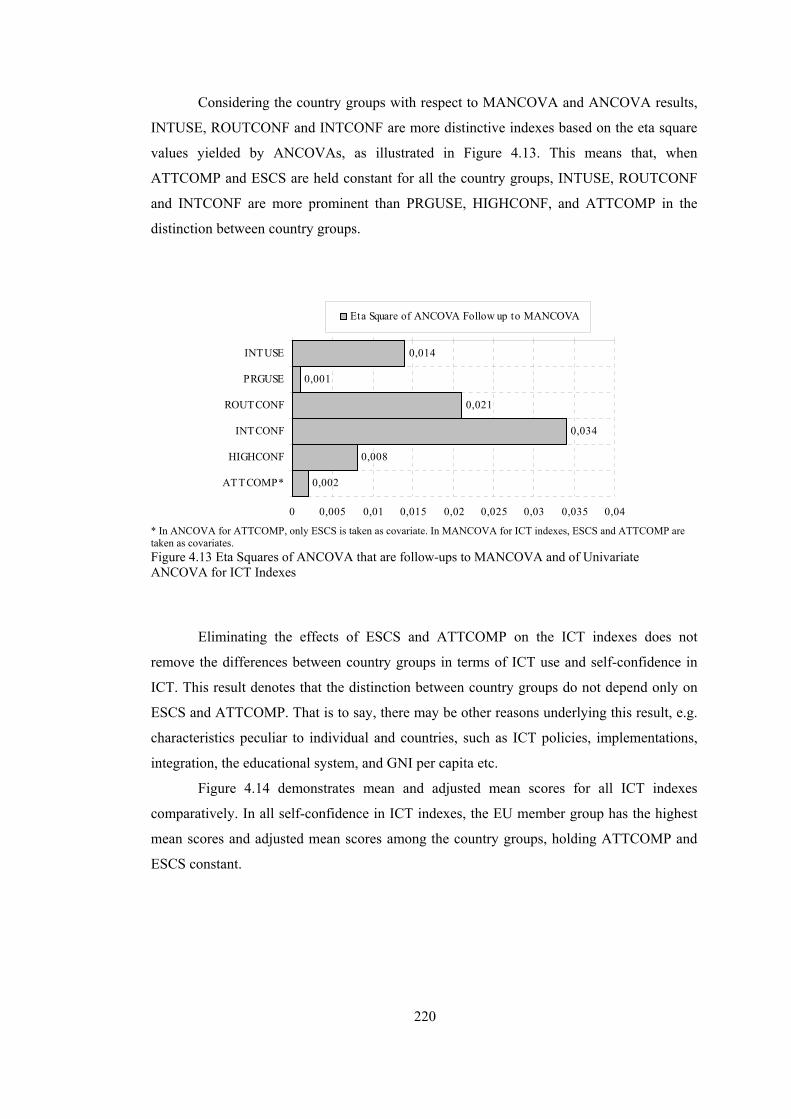
220
Considering the country groups with respect to MANCOVA and ANCOVA results,
INTUSE, ROUTCONF and INTCONF are more distinctive indexes based on the eta square
values yielded by ANCOVAs, as illustrated in Figure 4.13. This means that, when
ATTCOMP and ESCS are held constant for all the country groups, INTUSE, ROUTCONF
and INTCONF are more prominent than PRGUSE, HIGHCONF, and ATTCOMP in the
distinction between country groups.
0,014
0,001
0,021
0,034
0,008
0,002
0 0,005 0,01 0,015 0,02 0,025 0,03 0,035 0,04
INTUSE
PRGUSE
ROUTCONF
INTCONF
HIGHCONF
ATTCOMP*
Eta Square of ANCOVA Follow up to MANCOVA
* In ANCOVA for ATTCOMP, only ESCS is taken as covariate. In MANCOVA for ICT indexes, ESCS and ATTCOMP are taken as covariates. Figure 4.13 Eta Squares of ANCOVA that are follow-ups to MANCOVA and of Univariate ANCOVA for ICT Indexes
Eliminating the effects of ESCS and ATTCOMP on the ICT indexes does not
remove the differences between country groups in terms of ICT use and self-confidence in
ICT. This result denotes that the distinction between country groups do not depend only on
ESCS and ATTCOMP. That is to say, there may be other reasons underlying this result, e.g.
characteristics peculiar to individual and countries, such as ICT policies, implementations,
integration, the educational system, and GNI per capita etc.
Figure 4.14 demonstrates mean and adjusted mean scores for all ICT indexes
comparatively. In all self-confidence in ICT indexes, the EU member group has the highest
mean scores and adjusted mean scores among the country groups, holding ATTCOMP and
ESCS constant.
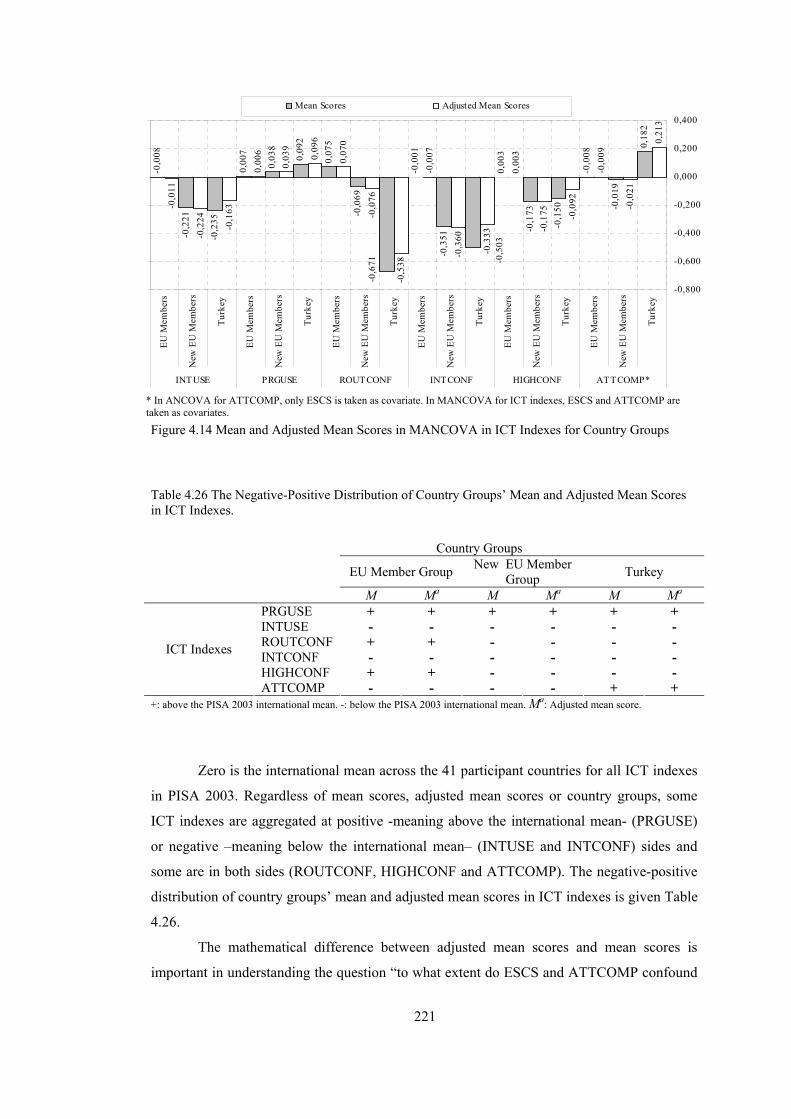
221
-0,0
08
-0,2
21
-0,2
35
0,00
7
0,03
8
0,09
2
0,07
5
-0,0
69
-0,0
01
-0,3
51
0,00
3
-0,1
73
-0,1
50
-0,0
08
-0,0
19
0,18
2
-0,0
11
-0,2
24
-0,1
63
0,00
6
0,03
9
0,09
6
0,07
0
-0,0
76
-0,5
38
-0,0
07
-0,3
60
-0,3
33
0,00
3
-0,1
75 -0,0
92
-0,0
09
-0,0
21
0,21
3
-0,6
71 -0,5
03
-0,800
-0,600
-0,400
-0,200
0,000
0,200
0,400
EU M
embe
rs
New
EU
Mem
bers
Turk
ey
EU M
embe
rs
New
EU
Mem
bers
Turk
ey
EU M
embe
rs
New
EU
Mem
bers
Turk
ey
EU M
embe
rs
New
EU
Mem
bers
Turk
ey
EU M
embe
rs
New
EU
Mem
bers
Turk
ey
EU M
embe
rs
New
EU
Mem
bers
Turk
ey
INTUSE PRGUSE ROUTCONF INTCONF HIGHCONF ATTCOMP*
Mean Scores Adjusted Mean Scores
* In ANCOVA for ATTCOMP, only ESCS is taken as covariate. In MANCOVA for ICT indexes, ESCS and ATTCOMP are taken as covariates.
Figure 4.14 Mean and Adjusted Mean Scores in MANCOVA in ICT Indexes for Country Groups
Table 4.26 The Negative-Positive Distribution of Country Groups’ Mean and Adjusted Mean Scores in ICT Indexes.
+: above the PISA 2003 international mean. -: below the PISA 2003 international mean. Ma: Adjusted mean score.
Zero is the international mean across the 41 participant countries for all ICT indexes
in PISA 2003. Regardless of mean scores, adjusted mean scores or country groups, some
ICT indexes are aggregated at positive -meaning above the international mean- (PRGUSE)
or negative –meaning below the international mean– (INTUSE and INTCONF) sides and
some are in both sides (ROUTCONF, HIGHCONF and ATTCOMP). The negative-positive
distribution of country groups’ mean and adjusted mean scores in ICT indexes is given Table
4.26.
The mathematical difference between adjusted mean scores and mean scores is
important in understanding the question “to what extent do ESCS and ATTCOMP confound
Country Groups
EU Member Group New EU Member Group Turkey
M Ma M Ma M Ma
PRGUSE + + + + + + INTUSE - - - - - - ROUTCONF + + - - - - INTCONF - - - - - - HIGHCONF + + - - - -
ICT Indexes
ATTCOMP - - - - + +
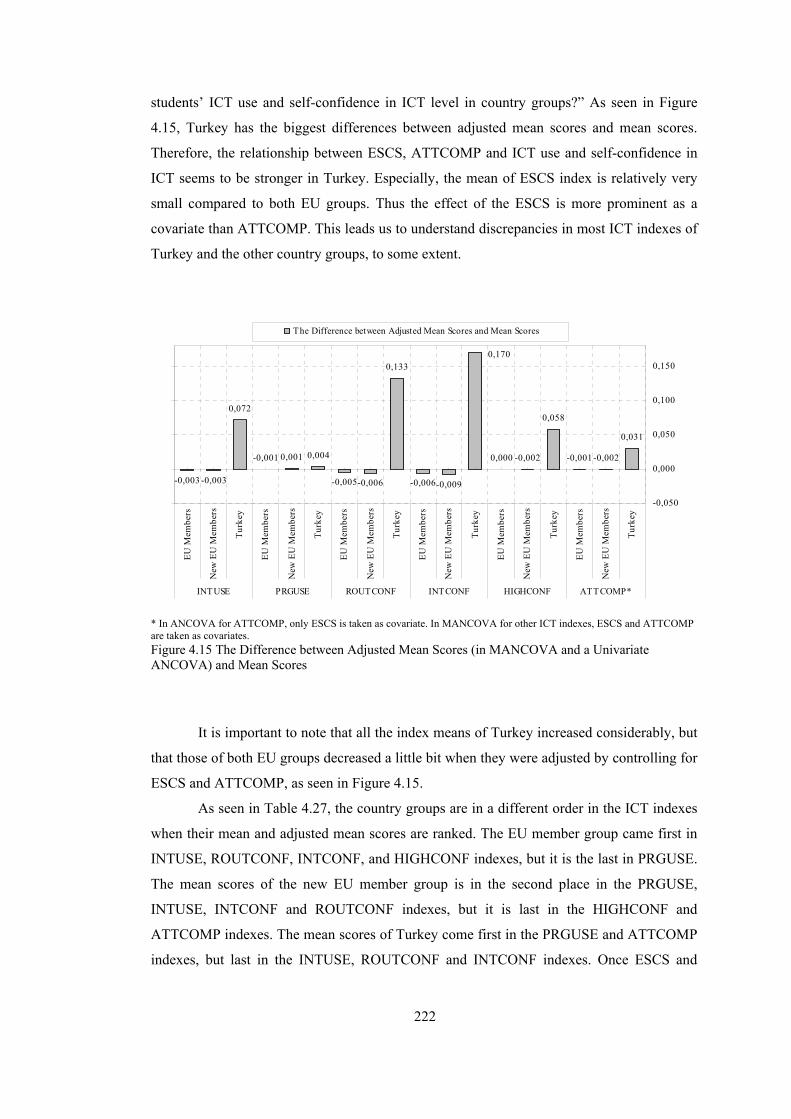
222
students’ ICT use and self-confidence in ICT level in country groups?” As seen in Figure
4.15, Turkey has the biggest differences between adjusted mean scores and mean scores.
Therefore, the relationship between ESCS, ATTCOMP and ICT use and self-confidence in
ICT seems to be stronger in Turkey. Especially, the mean of ESCS index is relatively very
small compared to both EU groups. Thus the effect of the ESCS is more prominent as a
covariate than ATTCOMP. This leads us to understand discrepancies in most ICT indexes of
Turkey and the other country groups, to some extent.
-0,003 -0,003
0,072
-0,001 0,001 0,004
-0,005-0,006
0,133
-0,006-0,009
0,000 -0,002
0,058
-0,001 -0,002
0,031
0,170
-0,050
0,000
0,050
0,100
0,150
EU M
embe
rs
New
EU
Mem
bers
Turk
ey
EU M
embe
rs
New
EU
Mem
bers
Turk
ey
EU M
embe
rs
New
EU
Mem
bers
Turk
ey
EU M
embe
rs
New
EU
Mem
bers
Turk
ey
EU M
embe
rs
New
EU
Mem
bers
Turk
ey
EU M
embe
rs
New
EU
Mem
bers
Turk
ey
INTUSE PRGUSE ROUTCONF INTCONF HIGHCONF ATTCOMP*
The Difference between Adjusted Mean Scores and Mean Scores
* In ANCOVA for ATTCOMP, only ESCS is taken as covariate. In MANCOVA for other ICT indexes, ESCS and ATTCOMP are taken as covariates. Figure 4.15 The Difference between Adjusted Mean Scores (in MANCOVA and a Univariate ANCOVA) and Mean Scores
It is important to note that all the index means of Turkey increased considerably, but
that those of both EU groups decreased a little bit when they were adjusted by controlling for
ESCS and ATTCOMP, as seen in Figure 4.15.
As seen in Table 4.27, the country groups are in a different order in the ICT indexes
when their mean and adjusted mean scores are ranked. The EU member group came first in
INTUSE, ROUTCONF, INTCONF, and HIGHCONF indexes, but it is the last in PRGUSE.
The mean scores of the new EU member group is in the second place in the PRGUSE,
INTUSE, INTCONF and ROUTCONF indexes, but it is last in the HIGHCONF and
ATTCOMP indexes. The mean scores of Turkey come first in the PRGUSE and ATTCOMP
indexes, but last in the INTUSE, ROUTCONF and INTCONF indexes. Once ESCS and
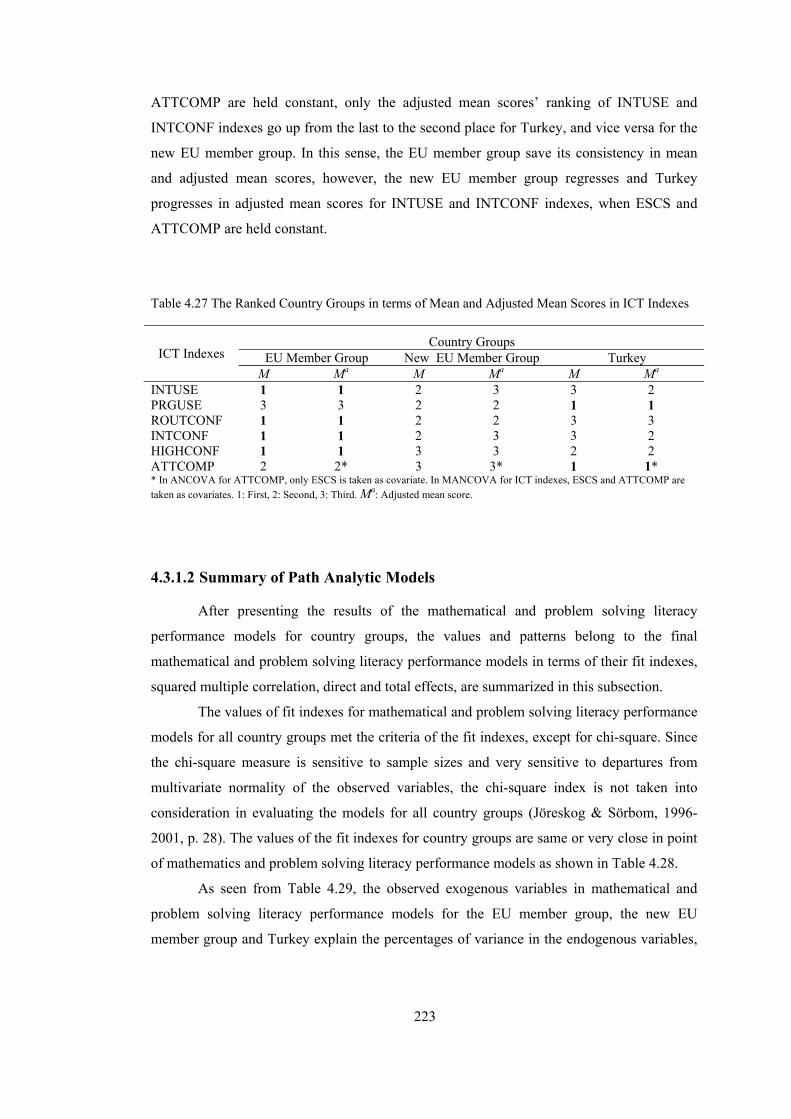
223
ATTCOMP are held constant, only the adjusted mean scores’ ranking of INTUSE and
INTCONF indexes go up from the last to the second place for Turkey, and vice versa for the
new EU member group. In this sense, the EU member group save its consistency in mean
and adjusted mean scores, however, the new EU member group regresses and Turkey
progresses in adjusted mean scores for INTUSE and INTCONF indexes, when ESCS and
ATTCOMP are held constant.
Table 4.27 The Ranked Country Groups in terms of Mean and Adjusted Mean Scores in ICT Indexes
INTUSE 1 1 2 3 3 2 PRGUSE 3 3 2 2 1 1 ROUTCONF 1 1 2 2 3 3 INTCONF 1 1 2 3 3 2 HIGHCONF 1 1 3 3 2 2 ATTCOMP 2 2* 3 3* 1 1* * In ANCOVA for ATTCOMP, only ESCS is taken as covariate. In MANCOVA for ICT indexes, ESCS and ATTCOMP are taken as covariates. 1: First, 2: Second, 3: Third. Ma: Adjusted mean score.
4.3.1.2 Summary of Path Analytic Models
After presenting the results of the mathematical and problem solving literacy
performance models for country groups, the values and patterns belong to the final
mathematical and problem solving literacy performance models in terms of their fit indexes,
squared multiple correlation, direct and total effects, are summarized in this subsection.
The values of fit indexes for mathematical and problem solving literacy performance
models for all country groups met the criteria of the fit indexes, except for chi-square. Since
the chi-square measure is sensitive to sample sizes and very sensitive to departures from
multivariate normality of the observed variables, the chi-square index is not taken into
consideration in evaluating the models for all country groups (Jöreskog & Sörbom, 1996-
2001, p. 28). The values of the fit indexes for country groups are same or very close in point
of mathematics and problem solving literacy performance models as shown in Table 4.28.
As seen from Table 4.29, the observed exogenous variables in mathematical and
problem solving literacy performance models for the EU member group, the new EU
member group and Turkey explain the percentages of variance in the endogenous variables,
Country Groups EU Member Group New EU Member Group Turkey ICT Indexes
M Ma M Ma M Ma
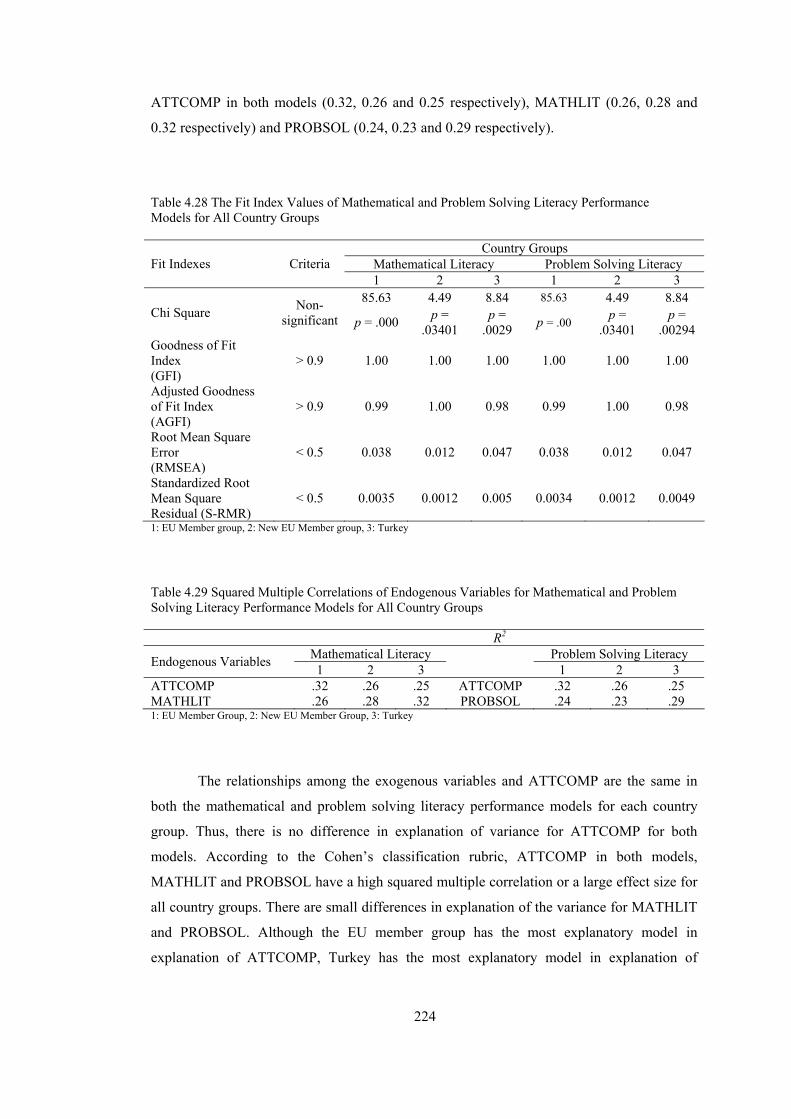
224
ATTCOMP in both models (0.32, 0.26 and 0.25 respectively), MATHLIT (0.26, 0.28 and
0.32 respectively) and PROBSOL (0.24, 0.23 and 0.29 respectively).
Table 4.28 The Fit Index Values of Mathematical and Problem Solving Literacy Performance Models for All Country Groups
Country Groups Mathematical Literacy Problem Solving Literacy Fit Indexes Criteria 1 2 3 1 2 3
85.63 4.49 8.84 85.63 4.49 8.84 Chi Square Non-
significant p = .000 p = .03401
p = .0029 p = .00 p =
.03401 p =
.00294 Goodness of Fit Index (GFI)
> 0.9 1.00 1.00 1.00 1.00 1.00 1.00
Adjusted Goodness of Fit Index (AGFI)
> 0.9 0.99 1.00 0.98 0.99 1.00 0.98
Root Mean Square Error (RMSEA)
< 0.5 0.038 0.012 0.047 0.038 0.012 0.047
Standardized Root Mean Square Residual (S-RMR)
< 0.5 0.0035 0.0012 0.005 0.0034 0.0012 0.0049
1: EU Member group, 2: New EU Member group, 3: Turkey Table 4.29 Squared Multiple Correlations of Endogenous Variables for Mathematical and Problem Solving Literacy Performance Models for All Country Groups
R2 Mathematical Literacy Problem Solving Literacy Endogenous Variables 1 2 3
1 2 3
ATTCOMP .32 .26 .25 ATTCOMP .32 .26 .25 MATHLIT .26 .28 .32 PROBSOL .24 .23 .29 1: EU Member Group, 2: New EU Member Group, 3: Turkey
The relationships among the exogenous variables and ATTCOMP are the same in
both the mathematical and problem solving literacy performance models for each country
group. Thus, there is no difference in explanation of variance for ATTCOMP for both
models. According to the Cohen’s classification rubric, ATTCOMP in both models,
MATHLIT and PROBSOL have a high squared multiple correlation or a large effect size for
all country groups. There are small differences in explanation of the variance for MATHLIT
and PROBSOL. Although the EU member group has the most explanatory model in
explanation of ATTCOMP, Turkey has the most explanatory model in explanation of
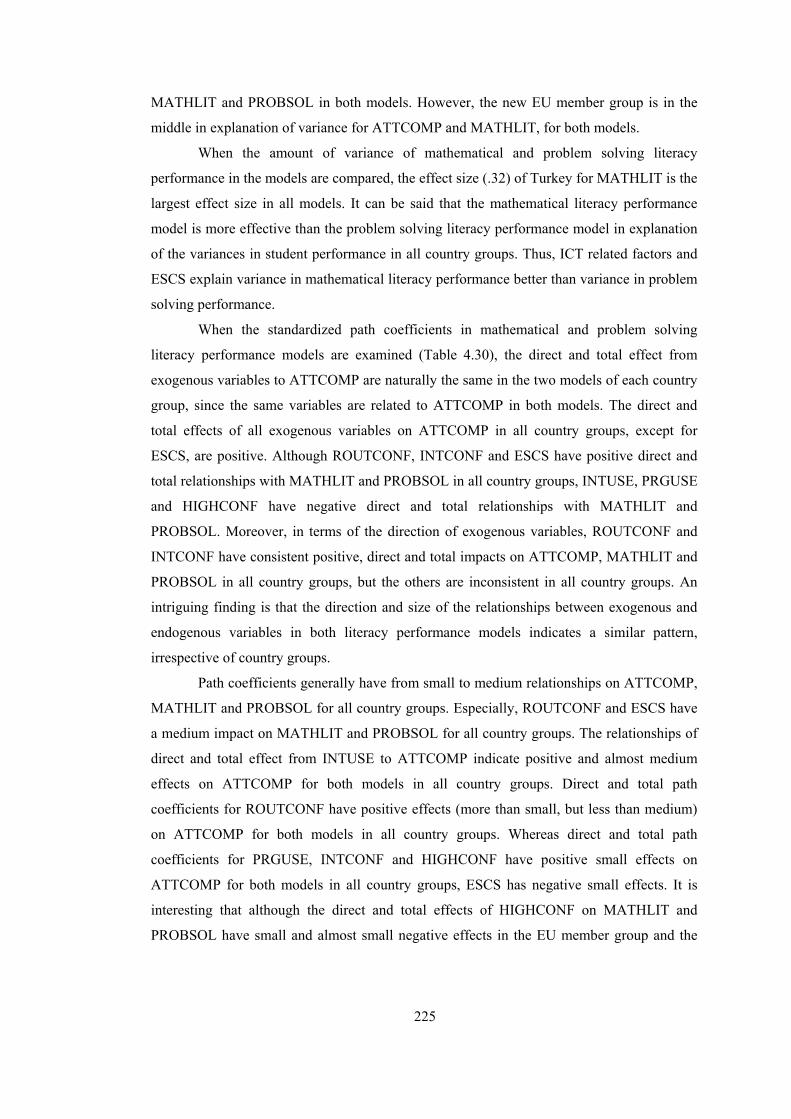
225
MATHLIT and PROBSOL in both models. However, the new EU member group is in the
middle in explanation of variance for ATTCOMP and MATHLIT, for both models.
When the amount of variance of mathematical and problem solving literacy
performance in the models are compared, the effect size (.32) of Turkey for MATHLIT is the
largest effect size in all models. It can be said that the mathematical literacy performance
model is more effective than the problem solving literacy performance model in explanation
of the variances in student performance in all country groups. Thus, ICT related factors and
ESCS explain variance in mathematical literacy performance better than variance in problem
solving performance.
When the standardized path coefficients in mathematical and problem solving
literacy performance models are examined (Table 4.30), the direct and total effect from
exogenous variables to ATTCOMP are naturally the same in the two models of each country
group, since the same variables are related to ATTCOMP in both models. The direct and
total effects of all exogenous variables on ATTCOMP in all country groups, except for
ESCS, are positive. Although ROUTCONF, INTCONF and ESCS have positive direct and
total relationships with MATHLIT and PROBSOL in all country groups, INTUSE, PRGUSE
and HIGHCONF have negative direct and total relationships with MATHLIT and
PROBSOL. Moreover, in terms of the direction of exogenous variables, ROUTCONF and
INTCONF have consistent positive, direct and total impacts on ATTCOMP, MATHLIT and
PROBSOL in all country groups, but the others are inconsistent in all country groups. An
intriguing finding is that the direction and size of the relationships between exogenous and
endogenous variables in both literacy performance models indicates a similar pattern,
irrespective of country groups.
Path coefficients generally have from small to medium relationships on ATTCOMP,
MATHLIT and PROBSOL for all country groups. Especially, ROUTCONF and ESCS have
a medium impact on MATHLIT and PROBSOL for all country groups. The relationships of
direct and total effect from INTUSE to ATTCOMP indicate positive and almost medium
effects on ATTCOMP for both models in all country groups. Direct and total path
coefficients for ROUTCONF have positive effects (more than small, but less than medium)
on ATTCOMP for both models in all country groups. Whereas direct and total path
coefficients for PRGUSE, INTCONF and HIGHCONF have positive small effects on
ATTCOMP for both models in all country groups, ESCS has negative small effects. It is
interesting that although the direct and total effects of HIGHCONF on MATHLIT and
PROBSOL have small and almost small negative effects in the EU member group and the
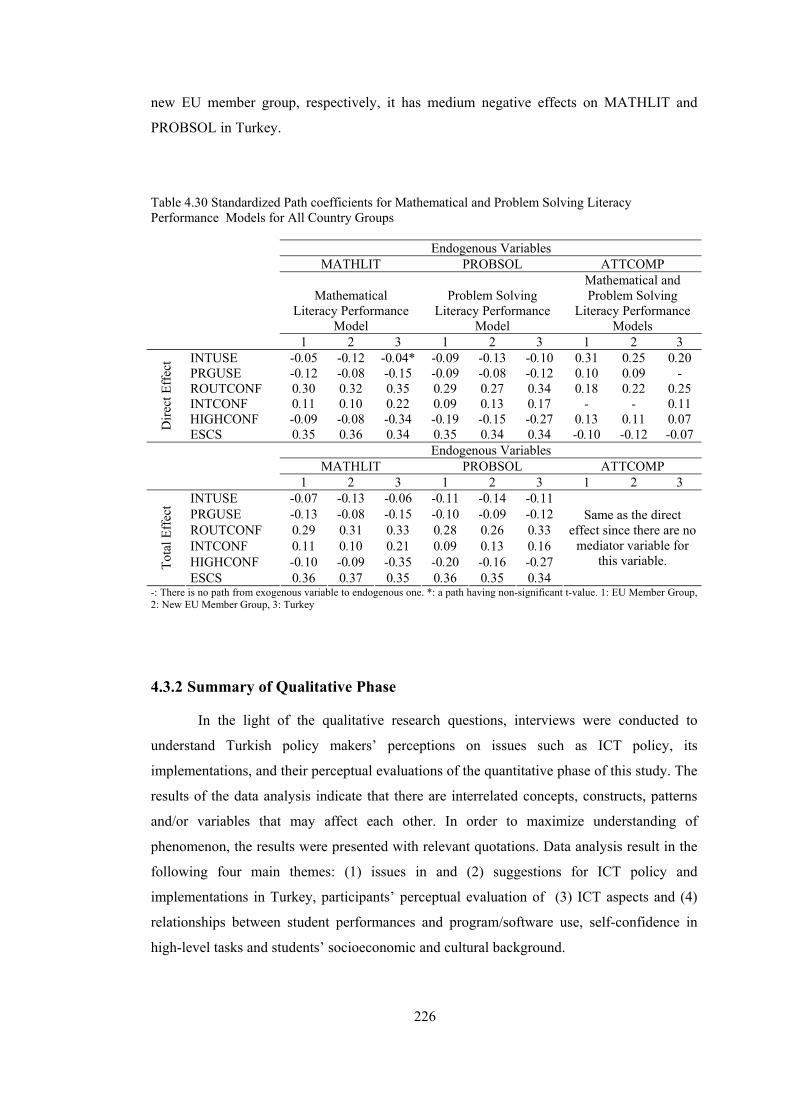
226
new EU member group, respectively, it has medium negative effects on MATHLIT and
PROBSOL in Turkey.
Table 4.30 Standardized Path coefficients for Mathematical and Problem Solving Literacy Performance Models for All Country Groups
Endogenous Variables MATHLIT PROBSOL ATTCOMP
Mathematical Literacy Performance
Model
Problem Solving Literacy Performance
Model
Mathematical and Problem Solving
Literacy Performance Models
1 2 3 1 2 3 1 2 3 INTUSE -0.05 -0.12 -0.04* -0.09 -0.13 -0.10 0.31 0.25 0.20 PRGUSE -0.12 -0.08 -0.15 -0.09 -0.08 -0.12 0.10 0.09 - ROUTCONF 0.30 0.32 0.35 0.29 0.27 0.34 0.18 0.22 0.25 INTCONF 0.11 0.10 0.22 0.09 0.13 0.17 - - 0.11 HIGHCONF -0.09 -0.08 -0.34 -0.19 -0.15 -0.27 0.13 0.11 0.07 D
irect
Eff
ect
ESCS 0.35 0.36 0.34 0.35 0.34 0.34 -0.10 -0.12 -0.07 Endogenous Variables
MATHLIT PROBSOL ATTCOMP
1 2 3 1 2 3 1 2 3 INTUSE -0.07 -0.13 -0.06 -0.11 -0.14 -0.11 PRGUSE -0.13 -0.08 -0.15 -0.10 -0.09 -0.12 ROUTCONF 0.29 0.31 0.33 0.28 0.26 0.33 INTCONF 0.11 0.10 0.21 0.09 0.13 0.16 HIGHCONF -0.10 -0.09 -0.35 -0.20 -0.16 -0.27 To
tal E
ffec
t
ESCS 0.36 0.37 0.35 0.36 0.35 0.34
Same as the direct effect since there are no
mediator variable for this variable.
-: There is no path from exogenous variable to endogenous one. *: a path having non-significant t-value. 1: EU Member Group, 2: New EU Member Group, 3: Turkey
4.3.2 Summary of Qualitative Phase
In the light of the qualitative research questions, interviews were conducted to
understand Turkish policy makers’ perceptions on issues such as ICT policy, its
implementations, and their perceptual evaluations of the quantitative phase of this study. The
results of the data analysis indicate that there are interrelated concepts, constructs, patterns
and/or variables that may affect each other. In order to maximize understanding of
phenomenon, the results were presented with relevant quotations. Data analysis result in the
following four main themes: (1) issues in and (2) suggestions for ICT policy and
implementations in Turkey, participants’ perceptual evaluation of (3) ICT aspects and (4)
relationships between student performances and program/software use, self-confidence in
high-level tasks and students’ socioeconomic and cultural background.
227
Issues in ICT policy and implementations in Turkey appeared as the first theme,
including conflicts in the existence of the ICT policy in operation, insufficient financial
resources, curriculum and teacher training. According to a majority of participants, the issue
of ambiguity in the presence or absence of ICT policy in operation is indicated as the most
serious barrier to develop and implement ICT related implementations. Insufficient financial
recourses to serve a huge target audience in terms of hardware and software distribution is
the other issue that was indicated as requiring the power authority to take responsibility for
allocating sufficient money from the budget. Participants point to curricular issues, involving
not using ICT across the curricula, slow change, no extracurricular activities, and being too
spiral. Having no sustainability of teacher training is the final major issue emphasized by
participants. Contrary to these issues, suggestions for ICT policy and implementations in
Turkey emerged as a second theme. Participants articulated some properties of ICT policy
that provide continuity in ICT policy and its implementations, such as being sound, definite
and free from political intervention. Some participants emphasized the importance of using a
system approach to integrate ICT into K-12 schools. Furthermore, it was advised that
knowing the ICT-related reality of Turkey through conducting research gives a chance to
take measures and solve the problems peculiar to Turkey. Moreover, the need for evaluation
of the ICT policy and implementations after their completion is also recommended, in order
to understand their effects.
Participants’ perceptual evaluation of ICT aspects is another theme, including
students’ attitudes toward computers, type of ICT use and self-confidence in ICT. The results
show that, comparing students across country groups, they have relatively higher positive
attitudes toward computers in Turkey although there are difficulties in computer and Internet
access. Participants generally relate this situation to the cultural characteristics of the Turkish
nation, a stronger inclination to technology than in others places, and low economic
conditions. As to the type of ICT use, the lower position of Turkish students in
Internet/entertainment use is related by participants to inaccessibility of the Internet due to
low welfare in Turkey. However, a relatively better position of Turkish students in
program/software use is associated with computer courses in the curriculum and the
existence of computer teacher in Turkey. In connection with self-confidence in ICT, Turkish
students generally have low self-confidence in ICT-related tasks, namely routine, Internet
and high-level tasks. Although participants set forth diverse reasons why Turkish students
have such a low self-confidence in each ICT related task, they are aggregated into the
following categories: lack of functional computer and Internet use due to the low access rate

228
at school, not having home computers due to the low SES, lack of internalization of
computer use, and a general low self-confidence in other subjects.
Participants’ perceptual evaluation of relationships among students’
program/software use, self-confidence in high-level tasks, socioeconomic and cultural
background and their mathematical and problem solving literacy performances (results of
path analytic models) is the final theme. Participants only interpret the possible influence of
students’ socioeconomic and cultural background on student performance and the reasons for
the inverse relationship between self-confidence in high-level computer tasks and student
performance. A few points are emphasized by the participants concerning the positive effects
of the socioeconomic and cultural background of families on the mathematical and problem
solving literacy performances of their children.
Giving qualitative results through displaying different representations (in
diagrammatic, graphic or tabular form) is likely to facilitate their understanding and
interpretation in a conceptual framework. In this sense, the relational representation of
qualitative results is given in the Table 4.31.

229
MA
IN T
HEM
ES A
ND
SU
B-TH
EMES
Issu
es in
ICT
polic
y an
d im
plem
enta
tions
in T
urke
y
• Co
nflic
ts in
exi
stenc
e of
ICT
polic
y in
ope
ratio
n •
Insu
ffici
ent f
inan
cial
reso
urce
s •
Curri
culu
m
• Te
ache
r tra
inin
g
Sugg
estio
ns to
ICT
polic
y an
d im
plem
enta
tions
in T
urke
y
• So
und
and
certa
in d
ecisi
on o
n po
licy
• Fr
ee fr
om p
oliti
cal i
nter
vent
ion
•
Cont
inui
ty in
pol
icy
and
its im
plem
enta
tions
•
Follo
wed
stric
tly to
pol
icy
and
its im
plem
enta
tions
•
Eval
uatio
n of
com
plet
ed p
olic
y im
plem
enta
tions
•
Filli
ng th
e gap
aris
ing
from
soci
al, e
cono
mic
and
cultu
ral o
f stu
dent
s th
roug
h gi
ving
ICT
educ
atio
n at
scho
ol
• Sy
stem
s app
roac
h in
ICT
inte
grat
ion
into
educ
atio
n •
Kno
win
g re
ality
of T
urke
y an
d ta
king
mea
sure
s pec
ulia
r to
Turk
ey th
roug
h re
sear
ches
•
Curri
culu
m
• Te
ache
r tra
inin
g
• Em
ploy
ing
CEIT
gra
duat
es fo
r sof
twar
e dev
elop
men
t
Pa
rtic
ipan
ts’ p
erce
ptua
l eva
luat
ion
of th
e re
latio
nshi
ps in
the
mod
els
•
Regr
essio
n of
stud
ents’
arith
met
ical
cal
cula
tions
due
to fr
eque
nt IC
T us
e •
Allo
catin
g m
uch
mor
e tim
e fo
r im
prov
ing
self-
conf
iden
ce in
hig
h le
vel
task
s •
The n
ewer
tech
nolo
gy, t
he m
ore t
ime
spar
ed to
it, a
s is t
he c
ase
in T
R •
Self-
conf
iden
ce in
hig
h le
vel t
asks
invo
lves
mor
e sp
ecia
lized
, str
aigh
tforw
ard,
mon
oton
ous a
nd n
on-h
olist
ic th
inki
ng
• Th
e be
tter e
cono
mic
, soc
ial a
nd c
ultu
ral s
tatu
s, th
e be
tter m
athe
mat
ical
and
pro
blem
solv
ing
liter
acy
perfo
rman
ce
• A
s par
ents’
eco
nom
ic, s
ocia
l and
cultu
ral s
tatu
s inc
reas
es, t
heir
care
on
educ
atio
n of
thei
r ch
ildre
n al
so in
crea
ses
• Th
e mor
e eco
nom
ic, s
ocia
l and
cul
tura
l sta
tus,
the
mor
e in
quiry
bas
ed ed
ucat
ion
prom
oted
by
par
ents
Tabl
e 4.
31 S
umm
ary
of Q
ualit
ativ
e R
esul
ts
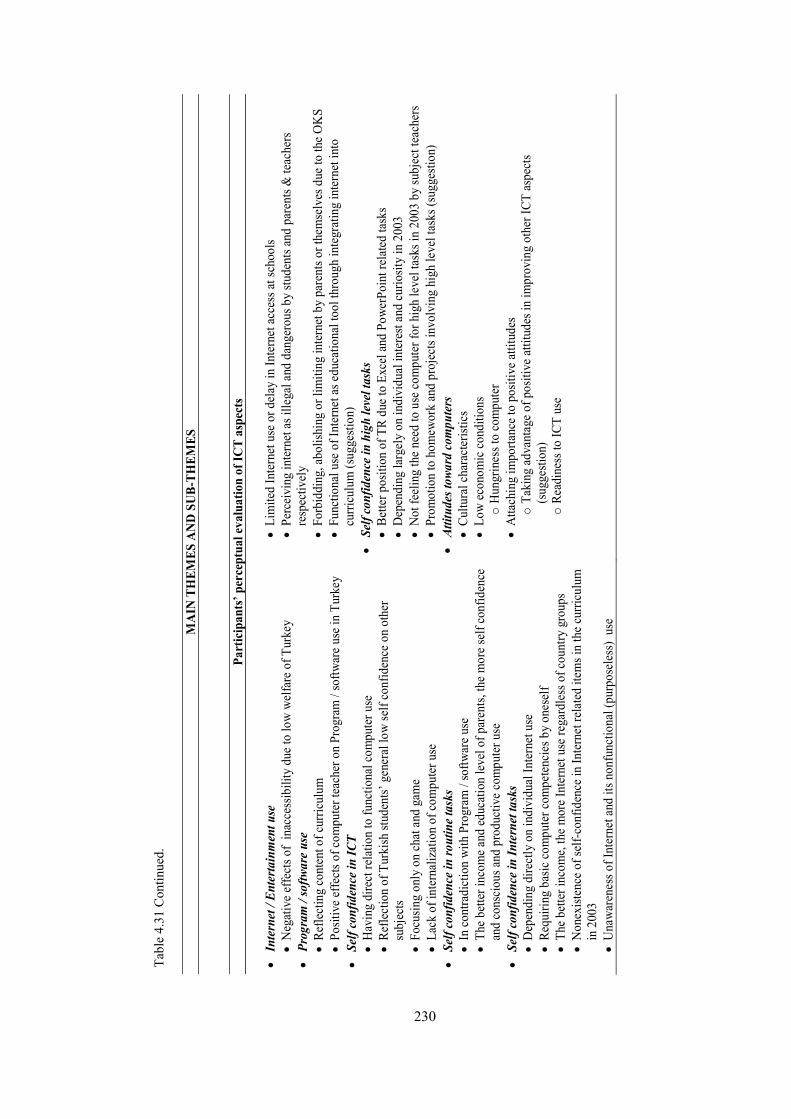
230
MA
IN T
HEM
ES A
ND
SU
B-TH
EMES
Part
icip
ants
’ per
cept
ual e
valu
atio
n of
ICT
aspe
cts
•
Inte
rnet
/ En
terta
inm
ent u
se
• N
egat
ive
effe
cts o
f in
acce
ssib
ility
due
to lo
w w
elfa
re o
f Tur
key
• Pr
ogra
m /
softw
are
use
• Re
flect
ing
cont
ent o
f cur
ricul
um
• Po
sitiv
e ef
fect
s of c
ompu
ter t
each
er o
n Pr
ogra
m /
softw
are
use i
n Tu
rkey
•
Self
conf
iden
ce in
ICT
• H
avin
g di
rect
rela
tion
to fu
nctio
nal c
ompu
ter u
se
• Re
flect
ion
of T
urki
sh st
uden
ts’ g
ener
al lo
w se
lf co
nfid
ence
on
othe
r su
bjec
ts •
Focu
sing
only
on
chat
and
gam
e •
Lack
of i
nter
naliz
atio
n of
com
pute
r use
•
Self
conf
iden
ce in
rout
ine t
asks
•
In co
ntra
dict
ion
with
Pro
gram
/ so
ftwar
e us
e •
The b
ette
r inc
ome a
nd ed
ucat
ion
leve
l of p
aren
ts, th
e m
ore
self
conf
iden
ce
and
cons
ciou
s and
pro
duct
ive
com
pute
r use
•
Self
conf
iden
ce in
Inte
rnet
task
s •
Dep
endi
ng d
irect
ly o
n in
divi
dual
Inte
rnet
use
•
Requ
iring
bas
ic co
mpu
ter c
ompe
tenc
ies b
y on
esel
f •
The b
ette
r inc
ome,
the
mor
e In
tern
et u
se re
gard
less
of c
ount
ry g
roup
s •
Non
exist
ence
of s
elf-c
onfid
ence
in In
tern
et re
late
d ite
ms i
n th
e cu
rricu
lum
in
200
3 •
Una
war
enes
s of I
nter
net a
nd it
s non
func
tiona
l (pu
rpos
eles
s) u
se
• Li
mite
d In
tern
et u
se o
r del
ay in
Inte
rnet
acc
ess a
t sch
ools
• Pe
rcei
ving
inte
rnet
as i
llega
l and
dan
gero
us b
y stu
dent
s and
par
ents
& te
ache
rs
resp
ectiv
ely
•
Forb
iddi
ng, a
bolis
hing
or l
imiti
ng in
tern
et b
y pa
rent
s or t
hem
selv
es d
ue to
the O
KS
• Fu
nctio
nal u
se o
f Int
erne
t as e
duca
tiona
l too
l thr
ough
inte
grat
ing
inte
rnet
into
cu
rricu
lum
(sug
gesti
on)
• Se
lf co
nfid
ence
in h
igh
leve
l tas
ks
• Be
tter p
ositi
on o
f TR
due
to E
xcel
and
Pow
erPo
int r
elat
ed ta
sks
• D
epen
ding
larg
ely
on in
divi
dual
inte
rest
and
curio
sity
in 2
003
• N
ot fe
elin
g th
e ne
ed to
use
com
pute
r for
hig
h le
vel t
asks
in 2
003
by su
bjec
t tea
cher
s •
Prom
otio
n to
hom
ewor
k an
d pr
ojec
ts in
volv
ing
high
leve
l tas
ks (s
ugge
stion
) •
Attit
udes
towa
rd c
ompu
ters
•
Cultu
ral c
hara
cter
istic
s •
Low
eco
nom
ic c
ondi
tions
o
Hun
grin
ess t
o co
mpu
ter
• A
ttach
ing
impo
rtanc
e to
posit
ive
attit
udes
o
Taki
ng ad
vant
age o
f pos
itive
atti
tude
s in
impr
ovin
g ot
her I
CT as
pect
s (s
ugge
stion
) o
Read
ines
s to
ICT
use
Tabl
e 4.
31 C
ontin
ued.
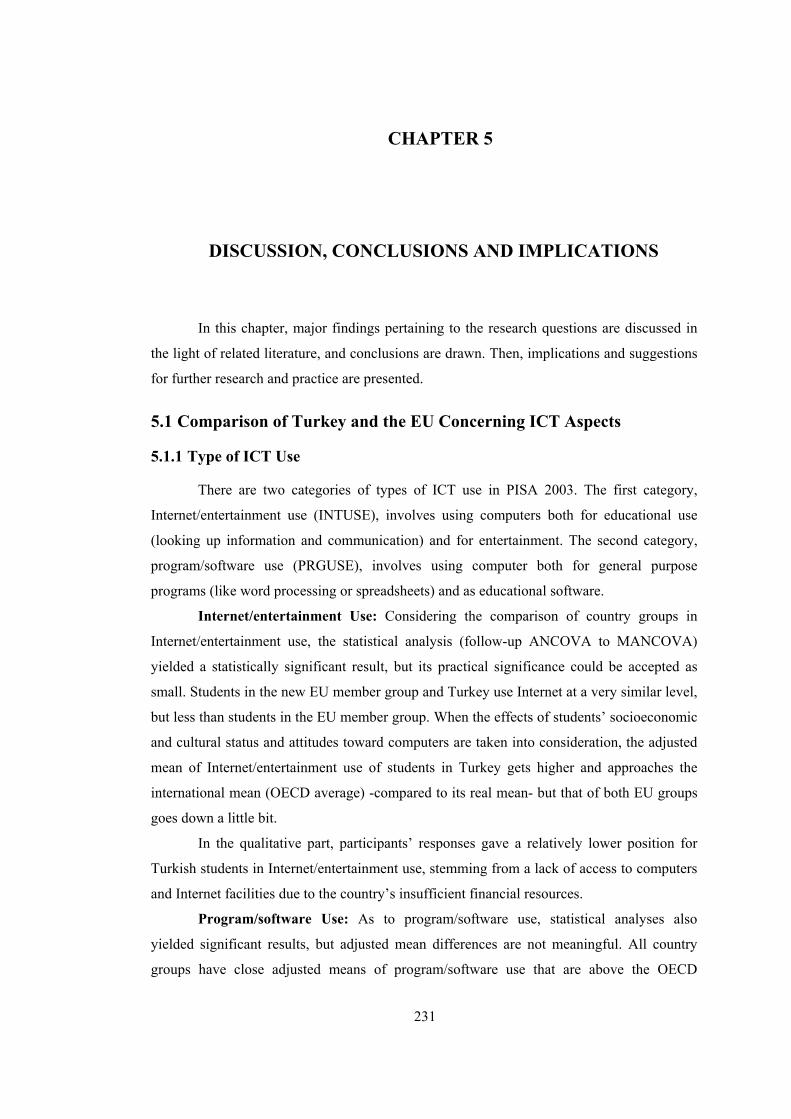
231
CHAPTER 5
5. DISCUSSION, CONCLUSIONS AND IMPLICATIONS
In this chapter, major findings pertaining to the research questions are discussed in
the light of related literature, and conclusions are drawn. Then, implications and suggestions
for further research and practice are presented.
5.1 Comparison of Turkey and the EU Concerning ICT Aspects
5.1.1 Type of ICT Use
There are two categories of types of ICT use in PISA 2003. The first category,
Internet/entertainment use (INTUSE), involves using computers both for educational use
(looking up information and communication) and for entertainment. The second category,
program/software use (PRGUSE), involves using computer both for general purpose
programs (like word processing or spreadsheets) and as educational software.
Internet/entertainment Use: Considering the comparison of country groups in
Internet/entertainment use, the statistical analysis (follow-up ANCOVA to MANCOVA)
yielded a statistically significant result, but its practical significance could be accepted as
small. Students in the new EU member group and Turkey use Internet at a very similar level,
but less than students in the EU member group. When the effects of students’ socioeconomic
and cultural status and attitudes toward computers are taken into consideration, the adjusted
mean of Internet/entertainment use of students in Turkey gets higher and approaches the
international mean (OECD average) -compared to its real mean- but that of both EU groups
goes down a little bit.
In the qualitative part, participants’ responses gave a relatively lower position for
Turkish students in Internet/entertainment use, stemming from a lack of access to computers
and Internet facilities due to the country’s insufficient financial resources.
Program/software Use: As to program/software use, statistical analyses also
yielded significant results, but adjusted mean differences are not meaningful. All country
groups have close adjusted means of program/software use that are above the OECD
232
average. What is intriguing is that Turkish students’ frequency of program/software use is
slightly higher than both EU groups, in spite of a striking inequality in the computer access
rate at home and at school in favor of both EU groups.
Participants explained this finding as the existence of content of program/software
use in the curriculum, and existence of computer teachers working in Turkish schools.
Discussion of type of ICT use: In 2003, 69% of students in the EU member group
had Internet access at home, while 28.5% of those in the new EU member group and only
14.4% of those in Turkey had home access (OECD, 2006c). Similarly, in 2005, 93% of
schools in the EU member group, 86% in the new EU member group, had an Internet
connection while only 40% in Turkey had an Internet connection (World Bank, 2008).
MONE initiated the Fast Internet Connection to Schools project in December 2003. Thus,
until this initiative was to take effect, there was a lack of, or slow, Internet connections at
schools (Akbaba-Altun, 2006) and the curriculum of computer courses generally did not
include the objectives of Internet-related tasks in 2003 (MONE, 1994, 1998, 2000). On the
contrary, parallel to their high Internet penetration at school, both EU groups generally have
Internet related objectives in the curriculum (Eurydice, 2001a, 2004). The common point for
the country groups is the similar proportion of students having access to computers in other
places. Accessing computers -and most probably also the Internet- in other places appears to
be somehow independent of the welfare of country groups. Using computers or Internet in
other places reminds existence of “Internet cafés” in 2003 in Turkey. Nevertheless, since
students have to pay money to use the Internet in such cafés, the prevalence of Internet use
may be negatively affected in Turkey, due to the low economic conditions. Relatively lower
computer and Internet access at home and at school in the new EU member group and in
Turkey make their students’ Internet use similar, and below the international mean, with a
quarter of standard deviation, whereas the EU member group is almost in the international
mean.
Taking the discrepancy between students’ socioeconomic and cultural status in
Turkey and both EU groups into consideration, the low socioeconomic and cultural status in
Turkey seems to be a barrier limiting the level of Internet/entertainment use. Obviously,
rather than the social and cultural status of Turkish students, the primary cause of this
situation appears to be low economic conditions negatively affecting access to computers
and Internet at home, at school and in other places, in 2003. Since GNI per capita in Turkey
is considerably lower than in both EU groups (World Bank, 2008; Yıldırım, 2006), there is a
very low access rate to computers and Internet, especially at home and school, for students in
Turkey (OECD, 2006c). Furthermore, there are relationships between GNI per capita,

233
population, and possession and utilization of ICT (OECD, 2006c; Eurydice, 2004; Göktaş,
2003). It can be said that there is a positive relationship between GNI per capita and
possession/utilization of ICT, but there is a negative relationship between population, and
possession/utilization of ICT. Considering the lower GNI per capita, the larger population
size and the population growth rate of Turkey (World Bank, 2008), it could be said that
Turkish students seem to be in a disadvantageous position in terms of access to and use of
computers and the Internet. Moreover, there is a trend that the more access there is to
computers at home, the more access there is to computers at school (Eurydice, 2004). In
other words, as family income increases, access to computers and Internet at home and
school increases.
Considering the large number of students in primary and secondary education in
Turkey, students generally go to IT rooms for one or two hours a week in K-12 schools and
usually more than one student has to share one computer for program/software and/or
Internet-related tasks or activities. Along with common problems of technical support and
maintenance of IT rooms, use of one computer by more than one student brings about critical
problems such as classroom management for teachers and lack of individual computer and
Internet use for a majority of students. In this case, even if all of the students are likely to be
aware of what is happening in an IT room, only a minority of them will have the chance to
use computers or the Internet individually, while the majority has no or little chance.
As regards similar level of program/software use across country groups, this may be
related to two possible causes. Firstly, ICT is in the primary and secondary school
curriculum in most of the EU countries (Eurydice, 2001a, 2004) and Turkey (MONE, 1994,
1998, 2000). When collecting PISA 2003 data, most of the students (97.5%) were attending
upper secondary schools in Turkey. Therefore, most probably those students were taking
courses such as Computer 1-2 or Information Technology 1-2. The relatively higher position
of Turkey in program/software use may be related to content of these courses, which include
word processing, spreadsheets, and drawing and graphic programs (see MONE, 1994, 2000).
As Göktaş (2003) proposes, primary school curricula should include ICT as a must course.
Secondly, all country groups generally employ ICT specialist teachers (i.e. computer
teachers) to reach ICT related objectives in the curriculum (YÖK, 1998; Eurydice, 2001a,
2004). Eurydice (2001a) informs that specialist ICT teachers teach students ICT as a separate
subject in secondary schools in most European countries. With the restructuring of teacher
education programs by YÖK in 1998, CEIT departments were opened to provide primary
and secondary schools with computer teachers in Turkey (YÖK, 1998). CEIT graduates
work as computer teachers in primary and secondary schools to teach students ICT skills in

234
optional courses in the curricula. Most probably, similar policies to employ computer
teachers to provide students with ICT knowledge and skills across country groups result in
similar frequencies of program/software use in these groups with reference to the OECD
average.
The result of program/software use for Turkey is similar to that of the other groups,
and is above the OECD average, which can be interpreted as an indicator of ICT
familiarization for Turkish students. Note that only 54% of Turkish students reported that
they have computer access at school in PISA 2003 (OECD, 2006c). This result shows that IT
rooms are used more with an increase in employment of computer teachers (Yalçınalp &
Yıldırım, 2006).
5.1.2 Self-confidence in ICT Tasks
Self-confidence in ICT related tasks has three categories formed by PISA 2003
experts. The first category, self-confidence in routine tasks (ROUTCONF), is related to
routine tasks on a computer, such as opening, saving, deleting, or copying files. The second
category, self-confidence in Internet tasks (INTCONF), is related to Internet tasks on a
computer, such as downloading files or music, or sending e-mail with an attachment file. The
final category, self-confidence in high-level tasks (HIGHCONF), is related to advanced
computer tasks, such as creating multimedia presentations, preparing a Web page,
programming, or using software to remove computer viruses.
Self-confidence in Routine Tasks: When students are compared in self-confidence
in routine tasks (ROUTCONF) across country groups, follow-up ANCOVA indicates a
significant result. Although its practical significance is relatively higher than that of analyses
comparing ICT use and attitudes toward computers, it could be nevertheless also accepted as
small. The variance in students’ self-confidence in routine tasks that could be attributed to
the status of a country group in the EU is small: 2.1%, when the effects of students’
socioeconomic and cultural status and attitudes toward computers are held constant in the
country groups. Students in both EU groups are substantially more self-confident in routine
tasks than those in Turkey. Turkish students’ self-confidence in routine tasks was, on
average, negatively differentiated from the students’ mean in both EU groups and the
international mean of the OECD. Indeed, Turkish students are less confident in routine
computer tasks than 72% of all students internationally. As is the case in
Internet/entertainment use, when students’ socioeconomic and cultural status and attitudes
toward computers are held constant, the adjusted mean of Turkish students’ self-confidence
in routine tasks rises from -0.671 to -0.538, while that of students in both EU groups fall a

235
little. This considerable increase in the Turkish students’ mean could be attributed to
removing the effect of their socioeconomic and cultural background. This means that the low
socioeconomic and cultural status of Turkish students negatively influences their self-
confidence in basic computer tasks.
Some participants related Turkish students’ low self-confidence in routine ICT tasks
to the low level of parental education and income in Turkey when compared to students in
both EU groups. They also emphasized that the higher the level of parental education and
income, the higher the self-confidence in routine tasks and the more conscious and
functional computer use.
Self-confidence in Internet Tasks: When the practical significance of follow up
ANCOVA is considered (.034), self-confidence in Internet tasks (INTCONF) is the most
differentiating ICT index across country groups. The EU member group is at the OECD
average in self-confidence in Internet tasks, meaning that students in the EU member group
are more self-confident than 50% of the students internationally. Students in the new EU
member group are more self-confident in Internet tasks than 38% of the students
internationally. As to Turkey, here the average is -0.503 for self-confidence in Internet tasks,
which is better than 33% of all students in PISA 2003. After the effects of students’
socioeconomic and cultural status and attitudes toward computers are removed, the adjusted
mean difference in students’ self-confidence in Internet tasks across country groups is
significant. However, in Turkey, the negative effect of students’ low socioeconomic and
cultural status is still seen on self-confidence in Internet tasks, as well. Because when the
effects of students’ socioeconomic and cultural status and attitudes toward computers are
removed, the adjusted means of Turkish students’ self-confidence in Internet tasks
approaches the OECD average (it rises from -0.503 to -0.333).
In the qualitative phase of this study, most participants attributed the negative
differentiation of Turkish students in self-confidence in Internet tasks to a low level of
individual access to and use of the Internet, due to the poor economic conditions of Turkey
in 2003, the lack of basic computer competencies, the nonexistence of Internet related
content in the curriculum in 2003, the delay in introducing Internet at schools, the limited
Internet infrastructure at schools and the students’ limited Internet use due to the central
examination necessary to enter high schools (OKS).
Self-confidence in High-Level Tasks: Since the practical significance of statistical
analysis (follow-up ANCOVA) is very small, the differences in the adjusted mean of self-
confidence in high-level tasks (HIGHCONF) across country groups are not meaningful. In
other words, the country groups could be regarded as homogeneous in students’ self-

236
confidence in high-level tasks. When the adjusted means of country groups are compared
descriptively, it is seen that the EU member group has the highest adjusted mean score,
which is on the OECD average, and Turkey and the new EU member group are in the second
and third place respectively, but their means are relatively close to each other and below the
OECD average.
In the qualitative phase, participants related the lower position of Turkish students in
self-confidence in high-level tasks to the nonexistence of high-level computer tasks in the
school curriculum in 2003, not feeling the need for advanced computer use by teachers
and/or students, depending largely on individual access to computers and the Internet, and on
personal interest and curiosity about advanced computer tasks.
Discussion of self-confidence in ICT tasks: The items of self-confidence in routine
tasks exist more in the computer courses’ curricula offered until 2003 than in other ICT
indexes in Turkey (see Table 2.1). Ironically, Turkish students have the lowest mean in self-
confidence in routine computer tasks. The World Bank (2004) also claims that there is no
evidence of students gaining computer literacy in Basic Education Project phase I. This
could be explained by two limitations of computer courses in Turkey. First, the curricula of
computer courses include objectives not related to using computers in a meaningful way, yet
objectives, such as “Show the printer” (MONE, 1998), and “Apply file menu options and
procedures” (MONE, 2000) for general software programs such as word processor are
common in the curriculum of computer courses. Second, as mentioned under the
Internet/entertainment use part, most of the Turkish students have little or no chance to
access and use a computer individually at school or at home, due to low economic
conditions. In such a case, it seems to be illogical to expect Turkish students to develop high
self-confidence in routine computer tasks.
Turkish students’ higher use of program/software and lower self-confidence in
routine ICT tasks, compared to both EU groups with reference to the international mean
seem to be conflicting results. If they really use program/software more frequently, they
should have already developed self-confidence in routine ICT tasks. However, due to a lack
of access to ICT resources at home in 2003 conditions and inflexible curricula, students most
probably use programs/software within computer courses, either with instructions given by
their computer teachers or in cooperation with their classmates who share the same computer
during lessons in IT rooms. This means that they do not engage in self-determined,
conscious, purposeful and meaningful computer use individually. The researcher claims that
without self-determined, conscious, purposeful and meaningful use of ICT facilities
individually, it is difficult to develop and improve self-confidence in using ICT. Turkish

237
students most probably had marked higher frequencies for program/software use items in the
ICT questionnaire because of their routine visits to IT rooms for computer courses. Yet,
when answering self-confidence related items, Turkish students could not be sure that they
were able to do certain tasks by themselves, such as opening a file, saving a file or deleting a
file. Since ICT facilities did not become widespread and ICT was not integrated across the
curriculum, most Turkish students could not practise what they had learned in computer
courses; thus these tasks were not their routine activities yet. Therefore such a result is
expected.
Another reason for this conflict could be due to the fact that each ICT index
represents a different frequency distribution internationally. It is reported that confidence in
routine ICT tasks has a right skewed distribution (OECD, 2006c). In fact, the majority of
students (at least 75%) across the OECD are comfortable and familiar enough with ICT to
have a self-confidence in routine ICT tasks (OECD, 2006c). Thus, Turkish students’ self-
confidence in routine tasks is relatively low compared to the OECD average.
As regards self-confidence in Internet tasks, there were no objectives related to the
Internet in the curriculum of computer courses (MONE, 1994, 1998). The only exceptions
are some objectives like searching for information on the Internet and using an e-mail
program at a basic level in the Computer 1 course (MONE, 2000). Furthermore, the Internet
connections at schools were very limited and even if they existed, they were very slow (TBŞ,
2002; Akbaba-Altun, 2006) until the Fast Internet Connection project was launched in
December 2003. On the contrary, students’ computer and Internet access rate in primary and
secondary schools in both EU groups are considerably higher than that of students in Turkey
(see Eurydice, 2004; OECD, 2006c; World Bank, 2008). Under these conditions, it is an
expected result that Turkish students have relatively lower self-confidence in Internet tasks
than students in both EU groups.
As to self-confidence in high level tasks, Turkish students are below the OECD
average and the EU member group. Yalçınalp and Yıldırım (2006) also state that Turkish
students in PISA 2003 feel least confident in some high level computer tasks like using
antivirus programs, designing web pages and programming, while they feel most confident
in some routine computer tasks like starting games, playing games and drawing picture with
the mouse. The relatively higher mean of self-confidence in high level tasks compared to the
other two types of self-confidence could then, be due to preparing presentations, using
spreadsheet programs and using database programs, all of which took place in the curriculum
of computer courses (MONE, 1998, 2000). Thus, Turkish students’ self-confidence in high

238
level tasks that is closer to the OECD average than that of self-confidence in Internet tasks
can be understood.
Developing self-confidence in ICT tasks involves engaging students in more
meaningful and purposeful ICT-related authentic tasks which should be undertaken by
oneself. This is also related to the computer access rate and integration of ICT into subjects
across the curriculum. Firstly, there is no comparison between the access rates of students in
the EU member group and that of the students in Turkey. In fact, there is a positive
relationship between countries’ prosperity and the development of home and school
computer facilities (Eurydice, 2004). As GNI per capita increases, home and school
computer possession indicators also increase. It is known from the World Bank (2008) that
GNI per capita was 23,173 for the EU member group, 4,414 for the new EU member group
and 2,980 for Turkey in 2000 (in US dollars). In 2005, GNI per capita increased to 34,648,
8,634, and 4,750, respectively. Then, the discrepancy in GNI per capita underlies the primary
reason of inequality in computer and Internet access rate. Indeed, ICT penetration at home
and at school is relatively lower in Turkey compared to both EU groups due to her low GNI
per capita. Thus, Turkish students had little or no chance to access computers, so they hardly
ever worked individually in computer courses or in other courses in IT rooms. Similarly,
after having analyzed 31 countries’ PISA 2000 data, Sweet and Meates (2004) conclude that
when considering differences between high and low achievers, inequality of access to ICT
resources at home is more important factor than at school regardless of prosperity level of a
country. The same trend is also detected in PISA 2003 data (OECD, 2006c). Sweet and
Meates (2004) propose that schools should have the mission of providing low achievers
(those having less ICT resources at home) with ICT resources.
Secondly, parallel to increasing access to computers and the Internet, integration of
ICT into the curriculum is carried out in the EU member group with the aim of using ICT in
an interdisciplinary manner. Using ICT as a tool to enhance knowledge and skills in other
subjects is notably more common in the EU member group (Eurydice, 2001a, 2004). Yet
Turkish curriculum in operation in 2003 did not cover using ICT as a tool in teaching other
subjects. Such attempts appeared first with the curriculum reform initiated in 2004 (TTKB,
2004).
For these two major reasons, Turkish students’ self-confidence in ICT tasks
drastically negatively deviates from the international average and that of both EU groups,
especially from the EU member group. These comparisons in self-confidence in ICT indicate
that both EU groups make more ICT related investments in K-12 schools than does Turkey.
Indeed, the EU member group has made earlier and greater investment in ICT integration

239
into the school system in terms of money, time and effort than the new EU member group
and Turkey (Eurydice 2001a, 2004).
5.1.3 Attitudes toward Computers
Attitudes toward computers is a construct in PISA 2003 consisting of the items of
feelings about computers on importance, fun, interest and loosing track of time.
Statistical analyses indicate that there are significant differences between Turkey and
both EU groups when the effects of socioeconomic and cultural status of students are
eliminated. However, there are no meaningful differences in the adjusted means of students’
attitudes toward computers across country groups due to the very small practical significant.
When the adjusted means are descriptively evaluated, Turkish students have the biggest
mean score of attitudes toward computers while students in both EU groups have relatively
smaller means that are close to each other around the international mean.
The majority of the participants made causal explanations as to why Turkish students
have more positive attitudes toward computers than students in both EU groups. Generally,
most participants related Turkish students’ more positive attitudes toward computers to
cultural characteristics and to poor economic conditions. More specifically, participants
commented on Turkish students’ perceptions about computers as entertainment and
gratification. Furthermore, it is stated that Turkish students are more inclined to computers
than students in both EU groups. Moreover, Turkish students have an extra aspiration,
interest and curiosity about computers due to hungriness for technology and the image of
computers in Turkish society in 2003 conditions.
Discussion of attitudes toward computers: Contrary to Turkish students’ lower
level of self-confidence in ICT tasks and Internet/entertainment use; they have more positive
attitudes toward computers than do students in both EU groups. Since there is one
proficiency level difference in the means of mathematics and problem solving achievement
between Turkey (at level 2) and both EU groups (at level 3) in PISA 2003, Turkish students
on average can be considered as “lower achievers” compared to students in both EU groups.
Sweet and Meates (2004) also report a similar pattern for low achievers in PISA 2000 data:
low achievers’ perceived confidence and competence in using ICT are generally lower than
their reported attitudes toward computers. This is actually as the case in the present study for
Turkish students.

240
5.2 Relationships between ICT Aspects and Student Performance
5.2.1 Mathematical Literacy Performance Modeling
All the fit indexes were considered adequate to interpret significant relationships in
the path analytic models of the mathematical literacy performance for the country groups.
Exactly the same pattern was observed in the mathematical literacy performance models of
both EU groups. In the models, the effect size (R2) for mathematical literacy performance is
.26 for the EU member group, .28 for the new EU member group and .32 for Turkey.
According to Cohen et al. (2003), these effect sizes are large, since they are greater than .25.
This means that the 26% of variance seen in mathematical literacy performance in the EU
member group is accounted for by the linear combination of ICT indexes and the
socioeconomic and cultural status of students. This explained ratio is 28% for the new EU
member group, and 32% for Turkey.
When the degree of relationship between ICT indexes and mathematical literacy
performance are concerned, the standardized path coefficients yielded by the models could
be interpreted as a correlation between the variables. According to Cohen’s classification,
.10, .30 and .50 are respectively small, medium and large levels for standardized path
coefficients.
Overall ICT use: This ICT aspect consists of Internet/entertainment use (INTUSE)
and program/software use (PRGUSE) indexes. Both of these indexes have negative and
small relationships with students’ mathematical literacy performance for all county groups.
This means that high achievers tend to use ICT less frequently than do low achievers, but
this is only a weak association.
One of the participants emphasizes the negative effect of using calculators in
arithmetical operations on mathematical performance. Using calculators in arithmetic may
lead to regression of students’ performance requiring arithmetical operations. Since
computers and Internet technologies are generally invented in foreign countries and imported
from them, there is a delay in arrival of these technologies in Turkey. Another participant
commented that Turkish students spend too much time using computers and Internet
technologies that are new for students in Turkey but not in the EU. In other words, these
technologies are routine for students in both EU groups, but they are new for Turkish
students, and therefore Turkish students spend too much time and energy with these
technologies. Consequently, this can be considered as negative effect of novelty in
technology on students’ mathematical literacy performance.
The negative relationship between overall ICT use and students’ mathematical
literacy performance could be explained by four major reasons. Firstly, low achievers could
241
be encouraged by their teachers to use some educational software in the format of drill and
practice, or tutorials, to improve and/or compensate for their performances at school
(Pelgrum & Plomp, 2002; Sweet & Meates, 2004; OECD, 2006c). However, there are
studies concluding that ICT intervention used for remedial purposes with low achieving
students is less effective than traditional teacher-centered interventions especially for the
basic difficulties that students encounter (Kroesbergen & Van Luit, 2003).
Secondly, computers may actually distract students from learning since students
devote much of their time to non-educational computer and Internet use, such as
entertainment and communication (Fusch & Woessmann, 2004; OECD, 2006c, Tuti, 2005).
Thirdly, current educational software used to supplement student learning is either not
effective (Fusch & Woessmann, 2004) or not used appropriately (Kulik, 2003). Balanskat,
Blamire and Kefala (2006) state that ICT is effective in improving the achievement of
students aged 7-16 in English, Science, and Design and Technology courses, but not in
Mathematics, particularly for primary schools in the EU. However, Kulik (2003) points to a
conditional positive effect of computers on mathematics achievement in the USA. According
to his meta-analysis, causal comparative studies propose a positive effect of ICT on
mathematics achievement, but this is limited to tutorial-based programs (Kulik, 2003).
Conflicting results from recent reviews and meta-analysis studies lead to infer that it is too
early to conclude definitely that ICT has a positive or a negative impact on mathematics
achievement. Finally, the use of educational software as a method of CAI is not common in
mathematics yet (Pelgrum & Plomp, 2002). For Turkey, computer facilities at school, mostly
in IT rooms, are only used for computer literacy courses and are not used in other courses in
a regular manner (Aşkar & Olkun, 2005; MONE, 2004). It appears that all of these reasons
may be influential in the negative and weak association between ICT use and mathematical
literacy performance.
Remember that the relationship between students’ mathematical literacy
performance with program/software use and Internet/Entertainment use is negative, but quite
small. This result corroborates studies in the literature concluding that frequency of students’
computer use is not linked to their performance in mathematics (e.g. Wittwer & Senkbeil,
2008). Similarly, the level of overall computer use by low achievers in reading literacy is not
significantly different from that of higher achiever students in PISA 2000 for most countries
(Sweet & Meates, 2004). However, Erbaş (2005) reveals that there is a positive relationship
between Turkish students’ frequency of Internet use and scientific literacy achievement in
PISA 2003. Yet, in his study, students’ socioeconomic background was not taken into
consideration, and the Internet use includes only looking up information and downloading
242
music from the Internet. When all the items related to Internet/entertainment use in the ICT
questionnaire are considered -as is the case in this study-, the relationship between
mathematical literacy performance and frequency of overall Internet use becomes negative.
As regards the effects of ICT use at home and at school, once the effects of students’
socioeconomic and cultural status are eliminated, the relationship between home computer
use and mathematical achievement diminishes for German students (Wittwer & Senkbeil,
2007), and even becomes negative when countries’ PISA 2000 data are reanalyzed (Fusch &
Woessmann, 2004). Only some conditional positive relationships between computer access
at home and student achievement are detected, if computers are used for education and
communication purposes (Fusch & Woessmann, 2004) and for problem-solving activities in
a self-determined way (Whitter & Senkbeil, 2008). Similarly, when the effects of school
characteristics are strictly eliminated, the relationship between access to computers at school
and achievement becomes insignificant (Fusch & Woessmann, 2004). Yet a conditional
relationship exists at school: computer use is associated with student achievement only at a
middle frequency, not at the highest or lowest frequency (Fusch & Woessmann, 2004; Aşkar
& Olkun, 2005). This infers that more ICT use does not necessarily mean better student
performance (OECD, 2006c). Considering the relationships reported in the literature
between student achievement and ICT access at home and school, it can be concluded that
how students use, which ICT facilities they use, and for what purposes may be determinants
of the impact of ICT on student achievement.
Self-confidence in ICT tasks: As to self-confidence in ICT tasks, self-confidence in
routine and Internet tasks have positive relationships, while self-confidence in high level ICT
tasks has a negative relationship with students’ mathematical literacy performance for all
country groups. Self-confidence in routine tasks, such as opening and saving a computer
document or file, has a positive and medium relationship with students’ mathematical
literacy performance (around .30). This finding is consistent with some inferences in the
literature. The OECD also deduces that self-confidence in routine computer tasks is a fairly
strong predictor of student performance by explaining 10% of the variance in mathematics
scores on average across the OECD countries (OECD, 2006c). Similarly, Turkish high
achiever students in science tend to have more basic computer skills than low achievers
(Erbaş, 2005).
Self-confidence in Internet tasks also has a positive relationship with students’
mathematical literacy performance, but at a low level for both EU groups (around 0.10), and
a small-medium level for Turkey (0.22). The higher association between self-confidence in
Internet tasks and mathematical literacy performance in Turkey could be explained by two

243
major reasons. Firstly, although the effect of students’ socioeconomic and cultural status is
controlled at the individual level in the models, students’ access to Internet and their ability
to use it were highly related to school characteristics and out of school activities, such as
extra curricular activities and ICT facilities for students in the 2003 conditions. Thus, this
result could be a reflection of school characteristics and out of school activities. Out-of-
school activities provided by families with high SES are considerably wealthier, more
various, and more likely to affect students’ cognitive development than those provided by
the families with lower SES. Note that the economical, social and cultural status of Turkey is
considerably lower than that of both EU groups, on average. Such a difference in
socioeconomic and cultural status, of course, reflects on the quality and wealth of the school
and out-of-school environments that students engage in for leisure time activities. Secondly,
the novelty effect of the Internet on Turkish students’ mathematical literacy performance
could increase the strength of relationship between self-confidence in Internet tasks and
student mathematical literacy achievement. This effect is proposed by İş Güzel and
Berberoğlu (2005) to explain relatively high association of use of technology in school and
student performance for Brazilian students when compared to that for Japanese and
Norwegian students.
Self-confidence in high level ICT tasks, such as using antivirus programs and
constructing a web page, has a negative relationship with students’ mathematical literacy
performance for country groups in this study. This association is small for both EU groups,
but it is larger in Turkey (-0.34). It indicates a negative and medium relationship between
self-confidence in high level ICT tasks and Turkish students’ mathematical literacy
performance.
In order to explain this finding, one of the participants calls attention to students’
failure in scheduling their study time due to spending too much time on computer tasks
requiring advanced use. Naturally, students have a certain time to study. If they spend most
of the time on advanced computer use, their mathematical literacy performance is likely to
be affected negatively. This seems to be a matter of time allocated to study, and how and on
what it is spent. Another participant focuses on the content of advanced computer use and its
negative effects on thinking and learning. Advanced computer use involves students being
more specialized and thinking non-holistically; so, they become specialists in advanced
computer use, but not good at other academic fields.
Similarly, there are international studies in the literature indicating a tendency of low
achievers to engage in computer programming more frequently (Sweet & Meates, 2004).
However, the OECD (2006c) reports that there is a positive significant association between
244
self-confidence in high level tasks and improvement in mathematical literacy performance
for most of the countries in PISA 2003, though this association is not as great as in self-
confidence in routine computer tasks and self-confidence in Internet tasks. This negative
association could be explained by two possible reasons. Firstly, gaining confidence in
performing high level computer tasks demands a considerable amount of time, which limits
students’ time for studying other courses, including mathematics. This means that students
who feel confident in high level computer tasks may neglect to study for their courses and
devote their study time to advanced computer use, due to their personal interest or curiosity.
Secondly, objectives towards improving self-confidence in high level computer tasks are
generally not placed in school curricula in both EU groups and Turkey (Eurydice 2001a,
2004). In Turkey, they take place only in the Computer 2 optional course and some courses
at VET programs. Berberoğlu (2005) detected significant differences in student achievement
between two groups of schools in Turkey in the PISA 2003 data: (1) schools having low
achievers: general high schools, vocational high schools, Anatolian vocational high schools
and basic education schools, (2) schools having high achievers: science lycées, Anatolian
high schools, and police colleges. Most probably, students of VET who specialized in high
level computer tasks and students of general high schools could already be low achievers in
mathematics due to the low quality education offered in these schools and their poor
academic background. On the other hand, students in the second group of schools could
already have high achiever backgrounds, deal with academic disciplines more and not get
involved in learning computer programming or other advanced computer tasks. This contrast
among schools could be more apparent in the Turkish education system, which strengthens
the relationship between self-confidence in high level ICT tasks and mathematical literacy
performance.
It can be expected that the more students have self-confidence in any field, such as
math, the more they feel self-confident in any other field, such as ICT. However, having self-
confidence in any field requires students to spend time and energy in that field. Therefore,
students can not feel self-confident at the same level in all or most fields. At this point,
developing self-confidence in ICT tasks and its effects on student academic performance
should be investigated, which is a gap in the reviewed literature.
Attitudes toward computers: There is a negative and very small relationship
between attitudes toward computers and mathematical literacy performance in all country
groups. A similar result is reported by Erbaş (2005) for the relationship between science
literacy performance and attitude toward computers in the PISA 2003 data.
245
Economic, social and cultural status (ESCS): Students’ socioeconomic and
cultural status has a positive and medium relationship to their mathematical literacy
performance, around 0.35 for all country groups.
Most participants touch on the positive effects of students’ socioeconomic and
cultural status on their academic performance. Students in high level socioeconomic and
cultural status groups have more opportunity to have a better formal and informal education
than those in lower level groups. The difference in students’ mathematical literacy
performance may be reflecting this situation, that is, as students’ economic, social and
cultural status rises, so too does mathematical literacy performance increase, and vice versa.
This result is consistent with the literature showing a medium relationship of around
0.30 between students’ socioeconomic background and achievement (Yang, 2003). In the
mathematical literacy performance model for each country group, this relationship is slightly
larger than in the literature. This could be due to the fact that school-level factors and out-of-
school activities were not taken into consideration due to the scope of the present study.
Thus, the effect of school characteristics and out-of-school activities as a reflection of
economic, social and cultural status could be slightly increasing the association between this
variable and mathematical literacy performance.
When the means of mathematical literacy performances in PISA 2003 are compared,
both EU groups are at proficiency Level 3, which is the OECD average as well, while
Turkey is at proficiency Level 2. The EU member group only having invested in time and
money and spent efforts in ICT infrastructure and professional development of teachers since
the mid 1990s, it is intriguing to find similar patterns that emerged in the models for all
country groups. Considering the similar patterns in the models, it is difficult to conclude that
the higher mathematical literacy performance of students in both EU groups is because of
overall ICT use, including ICT use in mathematics teaching and learning.
Indeed, this study indicates a negative and small effect of overall ICT use on student
mathematical and problem solving literacy performance, regardless of country groups. High
achievers tend to use ICT less frequently than low achievers do. This result means that ICT
is not commonly used in improving mathematical and problem solving knowledge and skills
at home, at school or in other places. It is also known from the literature that ICT is not
commonly used as an instructional tool in mathematics lessons (Pelgrum & Plomp, 2002).
In other words, instructional methods in teaching and learning mathematics still seem not to
employ ICT.
246
5.2.2 Problem Solving Literacy Performance Modeling
The values of fit indexes are sufficient to interpret the relationships between
students’ economic, social and cultural status, ICT indexes and problem solving literacy
performance in the path analytic models of problem solving literacy performance for the
country groups. In these models, 24% of the variance in student problem solving
performance for the EU member group, 23% for the new EU member group and 29% for
Turkey are explained. Their sizes are almost large for both EU groups and large for Turkey.
It should be noted that there is exactly the same pattern of relationships among the
variables in mathematical and problem solving literacy performance models for all country
groups. This pattern could be explained by the strong relationship between mathematical and
problem solving literacy performance (OECD, 2005b, p. 189). In this sense, the
interpretations made for the relationships in mathematical literacy performance models are
also valid for those in the problem solving literacy performance models. The only difference
is that practical significance and the strength of relationships slightly decrease in problem
solving literacy performance models for all country groups.
5.3 Issues in and Suggestions for ICT-in-education Policy Making and Implementations in Turkey
Only reviewing the literature about ICT policy and implementations and interpreting
the quantitative findings of this study are not sufficient to understand the issues in ICT policy
making and practice in Turkey. The quantitative part of the study drew a picture about the
perceived ICT literacy of students in the country groups. This picture led us compare the
Turkish and EU students in terms of ICT use, self-confidence in ICT, and attitudes towards
computers. On the other hand, the qualitative part of this study investigated the real reasons
of why students are similar or different in ICT aspects from the view of policy makers. This
phase also contributed to an understanding of “what really happens” in schools, in MONE
and in departments of CEIT for the improvement of ICT-in-education policies and practices.
This phase was necessary in order to understand what have been done up to now and what to
do from now on in Turkey. Özar (1996) conducted a qualitative study to investigate policy
makers’ opinions on the use of IT in education. He specified major issues in IT integration.
The qualitative phase of this study revealed that most of these issues still exist after 11 years.
Possible solutions to these issues are sought with the qualitative inquiry.
The most striking finding of the qualitative phase is the nonexistence of a policy
document explicitly written for schools describing “how to integrate ICT into the
curriculum”. This gap should be closed through a large commitment and consensus in the
247
education sector. Another disappointing finding is that PISA 2003 ICT questionnaire data
were not taken into consideration in the curriculum reform that began in 2004. The results of
that questionnaire should have been examined and the curriculum of computer courses
should have been updated, based on the results of that questionnaire. Luckily, the present
study shed light on this issue.
Issues in ICT-in-education Policy Making and Implementations: There are four
main issues in ICT-in-education policy and implementations that emerged in the qualitative
phase of this study. They are (1) conflict in the ICT policy in operation (2) insufficient
financial resources, (3) curriculum issues and (4) teacher training issues.
Firstly, conflict in existence of an ICT policy in operation is the most clearly
apparent issue to emerge from the data. According to the majority of participants, the issue
of ambiguity in the presence or absence of the ICT policy in operation is considered as the
most serious barrier to develop and implement ICT policies. Participants relate such an
ambiguity to a lack of cultural accumulation in developing and implementing ICT policies.
ICT policies and implementations are often interrupted by authority, which leads to a lack of
evaluation of and discontinuity in ICT policies and implementations. Not understanding the
importance of ICT and the conservatism of policy makers result in deficiencies in developing
and implementing ICT policies and lack of monitoring mechanism for the implementations.
This result is supported by the World Bank (2004) report which states that MONE had not
prepared and updated the IT policy paper and had not formulated a strategy to integrate IT
into curricula and teacher training before the closure of BEP I. Indeed, the early IT projects
in Turkey were not well-planned (Özar, 1996); thus they become unsuccessful in realizing
their aims (Uşun, 2004). Similar to this, Addo (2001) claims a lack of written national
information technology policies as one of the barriers to utilization of information
technology in education in developing countries.
The major deficiencies in developing and implementing ICT policies are: too much
emphasis on hardware, not considering research findings in the decision-making process, and
using imported solutions instead, the insufficiently active role of universities and the private
sector, and groundless and baseless solutions due to focusing on only one component of the
education system. Corruption in ICT projects results in outdated IT rooms, hardware and
software incompatibility; thus, IT rooms can not be utilized efficiently. This indicates a lack
of supervision and monitoring in the ICT policy and practices in the Turkish education
system. Such a monitoring could be provided by inspectors regularly visiting schools, but
Akbaba-Altun (2006) claims that there is a lack of appropriate supervision of IT rooms and
ICT integration. Focusing largely on pedagogical and organizational issues rather than on

248
technological ones, and using a holistic approach are necessary for ICT-in-education policies
and implementations in Turkey (Bhullar, 2005).
In order to overcome deficiencies in developing and implementing ICT policies,
school-based solutions are often suggested in the literature (Özar, 1996; Bhullar, 2005;
Aşkar, Usluel & Mumcu, 2006). Having a policy document or a plan for the integration of
ICT into schools is a necessity for successful integration (Gülbahar, 2007; Özar, 1996;
Reynolds, Treharne & Tripp, 2003; Şahinkayası & Şahinkayası, 2004; Bhullar, 2005). In
fact, the literature reveals that there is a need for clear guidelines on how to integrate
technology into the curriculum among teachers and administrative staff (Gülbahar, 2007).
After having examined IT-in-education policies of many countries all over the world, and
investigated issues on IT integration into schools in Turkey from the view of key policy
makers, Özar (1996) indicates the need for developing a policy document to be used in
schools. This document should address long-term and short-term goals, resource
management, technical support, staff development, and student entitlement etc. Furthermore,
as he states, this policy document should be revised regularly to keep up with recent
developments. Bhullar (2005) also proposes that each school should create an ICT vision and
strategy, and prepare its own ICT implementation plan with the participation of all
stakeholders. Bhullar (2005) suggests that schools should have some autonomy in selecting
the ICT resources that are most suitable for the needs of teachers and students, as well.
Similarly, Reynolds, Treharne and Tripp (2003) state that if a school has a strong whole-
school ICT policy in common, led by an expert in ICT, its teachers are more confident in
using ICT for teaching because they feel the necessary technical support exists. This
suggestion recalls the importance of CEIT graduates in schools as ICT experts and change
agents. Aşkar, Usluel and Mumcu (2006) also suggest that school-based solutions, especially
for in-service training, are more realistic in successful diffusion of ICT in schools besides
nationwide solutions.
Secondly, insufficiency in financial resources is another main issue in ICT-in-
education policy and implementations. Since the Turkish education system is huge in terms
of students, teachers, other staff, buildings and land area etc. when compared to most EU
countries, much greater financial resources are needed for the provision of ICT equipment,
software, and their support and maintenance to schools, teachers and students. Therefore,
this issue requires the power authority to allocate sufficient money from the budget or to
create new national and international financial resources. This issue is supported by Yıldırım
(2006), Uşun (2004) and Göktaş (2003). The problems of the Turkish education system are
directly related to the size of the education system with respect to students served and staff

249
working in the system (Yıldırım, 2006). Furthermore, Turkey has many challenges to its ICT
policy and implementations in the education system, such as the high number of students and
teachers, the large land area, a very large education system, poor economic conditions, and
insufficient technologies (Göktaş, 2003). Mostly due to insufficient financial resources,
inadequate number of computers, slow Internet connections and maintenance problems often
emerged as factors in previous studies (e.g. Yıldırım, 2006; Akbaba-Altun, 2006; Uşun,
2004; TBŞ, 2002; Çağıltay et al., 2001; Akkoyunlu, 1995). In addition, schools need
technical support personnel for the integration of technology into the curriculum (Çağıltay et
al., 2001). Despite large investments in hardware for basic education schools in BEP I, only
17% of primary and secondary schools had computerized in 2002 (TBŞ, 2002). This was the
first large-scale project to provide basic education schools with IT rooms. Yıldırım (2006)
states that the ideal student to computer ratio is 6:1. This ratio in Turkey was reported as
81:1 in the early 2000s (TBŞ, 2002) and has been lowered to 27:1 through ICT investments
in various projects, as of 2006. According to Yıldırım (2006), Turkey has to go on to invest
in ICT. Çağıltay et al. (2001) and Yıldırım (2006) propose especially that ICT should be put
into the classrooms with Internet connections. As regards maintenance problems, MONE is
not successful in managing, maintaining, updating and upgrading IT rooms at schools
(Yıldırım, 2006). In fact, the responsibility for finding financial resources to maintain ICT
facilities is left to schools, but basic education schools do not have their own budget
(Akbaba-Altun, 2006).
The notion of putting computers into schools, i.e. high emphasis on hardware
investments, is not a solution itself, as is often stressed in the literature (Özar, 1996; Bhullar,
2005). However, Bhullar (2005) states that hardware provision is not an issue peculiar to
Turkey, but also the dominant objective in ICT-in-education policies around the world.
While often giving priority to hardware procurement, human resources, curriculum change,
technical and pedagogical support and maintenance are often neglected. Work on these areas
and the budget allocated to them are inadequate or mostly ignored so far. Therefore, ICT-in-
education policies emphasizing the distribution of hardware -and to some extent in-service
training for administrative staff and teachers- result in failure due to lack of leadership in
ICT integration into the curriculum (Yıldırım, 2007; Akbaba-Altun, 2006). Akbaba-Altun
(2006) deduces that school principals interpret the laws and regulations about ICT
implementations according to their perceptions, and implement them based on their own
interpretations. She also states that school principals do not support ICT integration in
schools. In fact, the importance of strong leadership in implementations of ICT policies,
250
projects and initiatives at school level is often emphasized in the literature (Yıldırım, 2007;
Bhullar, 2005; Akbaba-Altun, 2006).
Thirdly, the participants mentioned ICT-related curriculum issues that are related to
the curriculum of ICT courses, and a lack of an interdisciplinary approach in teaching ICT
competencies. The curriculum for the ICT courses is much too spiral, and not responsive to
developments in technology and pedagogy. ICT courses do not include extracurricular
activities, either. ICT related objectives in the school curricula take place only in separate
ICT courses and ICT is not used as an instructional tool to enhance the learning and teaching
of other subjects.
There are many studies in the literature stressing the inconvenience or inflexibility of
the curriculum structure when it comes to integrating ICT into education (Çağıltay, et al.,
2001; Yıldırım, 2007; Göktaş, 2003; World Bank, 2004) until the 2004 curriculum reform
efforts. Low-quality or inappropriate software for the curriculum and local needs are the
other critical issues in ICT integration into the curriculum (Aydın & McIsaac, 2004; Akbaba-
Altun, 2006; Akkoyunlu, 1995). The software available to teach other subjects at schools is
often criticized (e.g. Aydın & McIsaac, 2004; Akbaba-Altun, 2006; Akkoyunlu, 1995) for its
poor quality or inappropriateness to the curriculum and local needs. One of the policy
makers also stated that software is not given importance in the 2004 curriculum reform.
The importance of needs analysis to identify local needs before purchasing or
developing software is emphasized in the literature (Özar, 1996; Aydın & McIsaac, 2004;
Akbaba-Altun, 2006). Aydın and McIsaac (2004) underline the cultural dimension of
technology integration into education. They indicate the necessity of analyzing the needs,
problems and characteristics of society and adapting IT to the properties of society instead of
applying imported IT solutions as-it-is from developed countries. They state that IT solutions
tailored to the culture’s needs diffuse better. Ready-to-use interventions have never been
successful in Turkey, particularly in the education system since most CAI initiatives offered
solutions that were not applicable to Turkish culture (Aydın & McIsaac, 2004). According to
Yıldırım (2006), if ICT is correctly and sufficiently used on time and in place, especially for
some of the problems peculiar to Turkey, it could be an effective solution tool. As Yıldırım
states, in order to take advantage of ICT as a solution, turning the ICT investments into a
product and added value is needed. In order to achieve this, the most needed hardware
should be provided, a Turkish content should be developed with the leading role of
universities and this content should be delivered through this hardware (Yıldırım, 2006).
Finally, problems related to training teachers on the use of ICT in teaching is the last
major issue stated by the participants. The complete lack of sustainable teacher training after

251
graduation, and problems in preservice teacher training are particularly emphasized.
Similarly, inadequate and low quality in-service training concerning integration of ICT into
the curriculum has been emphasized in almost every study on ICT integration in Turkey, as
well (Yıldırım, 2007; Akbaba-Altun, 2006; Aşkar, Usluel & Mumcu, 2006; Çağıltay et al.,
2001). Highly centralized and infrequent and/or irregular training events for teachers away
from the schools do not address the real needs of teachers (Akbaba-Altun, 2006; Aşkar,
Usluel & Mumcu, 2006). Thus, that kind of training in ICT is evaluated as not effective.
The in-service training of teachers is under the responsibility of MONE. On the other
hand, one policy maker blamed universities for graduating teachers not trained in how to use
technology in their courses. Göktaş (2006) comes to the conclusion that teachers’ perceived
ICT competencies are not high enough, even though they feel that ICT related courses in
their preservice teacher training are beneficial and effective. He suggests that ICT related
courses should be redesigned to have teachers acquire a competency in teaching with ICT. In
other words, in ICT-related courses more opportunities should be provided to preservice
teachers to integrate ICT into their own subject areas (Göktaş, 2006).
Because there is a lack of incentives for teachers to utilize ICT in their teaching, the
ICT facilities at school are not utilized by subject teachers (Yıldırım, 2007; MONE, 2004).
Yıldırım (2007) points out the lack of collaboration among Turkish teachers in using
technology. However, the literature emphasizes the necessity of incentives and collaboration
among teachers for successful ICT integration (Mumtaz, 2000). Turkish teachers use
Instructional software less frequently than any other professional uses of computers and they
feel least competent in using instructional software (Yıldırım, 2007).
Suggestions for ICT-in-education Policy Making and Implementations: The
suggestions made by participants concerning ICT-in-education policy and implementations
can be categorized into four main themes. These are (1) properties of a sound ICT policy and
implementation, (2) knowing the reality of Turkey and taking measures peculiar to Turkey
through conducting research, (3) curriculum, and (4) teacher training.
Firstly, participants specify the major properties of a sound ICT-in-education policy.
A nationwide long-term (10-15 years) ICT policy should include macro goals, what the
needs are, what decisions are to be taken, what kind of research should be conducted and
what should be done. Furthermore, ICT policy and implementations should be free from
political intervention; thereby ICT policies can be put into practice and related
implementations can be evaluated after their completion. In this way, continuity in policy
and its implementations can be possible on the basis of evaluation results. ICT policy should
consider all the components of the education system within a systems approach. Besides,
252
ICT policy should aim to close the gap in the socioeconomic and cultural status of Turkish
students through ICT education and integrating ICT into other subjects at school. For this
purpose, schools should provide computer and Internet access to all students.
The importance of developing ICT policies and strategies both nationwide and at
school level is stated in the literature (Bhullar, 2005). Both at ministry level and at school
level, ICT policy should explicitly describe the goals and objectives and prescribe how to use
of ICT in teaching and learning by teaching staff and students in the form of documents, ICT
integration plans as mentioned.
Secondly, in order to develop and implement ICT policy and overcome problems
peculiar to Turkey, participants advise cooperation between MONE, research institutions and
universities, to conduct research focusing on local problems in Turkey. Furthermore,
universities, MONE, and research institutions should share the responsibility of planning,
implementing and researching ICT policies in coordination. In fact, experts from universities
should be given a more active role in planning ICT-related initiatives and projects.
Participants are aware of the fact that overcoming problems in developing and implementing
ICT policies takes time, and requires a transformation of the power authority’s perspective.
The importance of research is often stressed in the literature as an indispensible
component of ICT policy and practices, as well (Bhullar, 2005, Aydın & McIsaac, 2004;
Uşun, 2004; Addo, 2001). Especially, developing countries need to develop a strong
commitment to research and to take advantage of local knowledge through its own research
for utilize ICT effectively and efficiently (Addo, 2001; Aydın & McIsaac, 2004).
The need for collaborative work between MONE and universities and the private
sector is also underlined in the literature (Özar, 1996; Yıldırım, 2006). Özar (1996) stresses
the lack of communication and cooperation on ICT integration in MONE as an important
obstacle for successful IT integration into schools. He also states that MONE should
cooperate with universities and the private sector in the ICT integration process. Indeed,
universities should play a leading role in integrating ICT into schools (Yıldırım, 2006; Özar,
1996), guiding MONE to determine courseware standards, helping MONE in producing and
evaluating software (Yıldırım, 2006; Özar, 1996), and providing in-service and preservice
teacher training (Özar, 1996). In addition to universities, the private sector should develop
the necessary instructional software, and help MONE financially or provide apprenticeship
facilities with students in VET (Özar, 2006).
Thirdly, participants make some suggestions concerning an ICT-related curriculum.
According to one participant, students successfully completing compulsory education should
have ICT competencies as a qualification, like mathematics or reading literacy. The
253
participants proposed that the weight of ICT courses as a separate subject, should be
increased in the curriculum and the curriculum of ICT courses should be prepared so as to
associate virtual and real life activities. Furthermore, most of the participants emphasize the
importance of integrating and utilizing ICT as a tool across the curriculum through curricular
reform. For successful ICT integration, the need for curriculum reform or revision was also
stressed in the literature (Özar, 1996; Akkoyunlu, 1992). Putting computers into classrooms,
transforming the role of computer teachers into coordinator teachers to support teaching
activities with ICT, developing and sharing instructional materials with ICT facilities at
schools, promoting functional ICT use through engaging students in doing ICT-related
homework and projects, and introducing ICT in pre-primary education are the participants’
primary suggestions to facilitate ICT integration into the curriculum. Özar (1996) also
proposes that objectives and implementations concerning ICT in education should be revised
to take advantage of IT facilities.
Note that once students’ ICT knowledge and skills come to a certain level, ICT can
be integrated into whole curricula (Reynolds, Treharne & Tripp, 2003). Kulik (2003) points
out that ICT has been used more efficiently since the 1990s than in earlier years, since
technology has advanced and become user-friendly, and teachers and students have become
more ICT- literate. However, Aydın and McIsaac (2004) contend that schools in Turkey are
not able to offer learning environments in which the young generation can learn how to use
the constructive power and potentials of ICT. They also claim that the digital divide is
getting wider, and only a small proportion of people have access to computers and the
Internet in Turkey. In order to integrate ICT successfully into the curriculum, Özar (1996)
and Bhullar (2005) state that the roles of teachers and students should be reconsidered in
teaching and learning.
Finally, participants advise on the matter of training teachers in ICT. Professional
development in ICT should be increased for teachers. Sharing educational experiences and
resources among teachers, and orienting subject teachers toward using computers as a
complete management tool in their profession are the participants’ some suggestions to
improve teachers’ ICT utilization. Preservice teachers should acquire ICT qualifications in
the school of teacher education programs.
The need for a more effective in-service training system for teachers is often
mentioned in the literature (Yıldırım, 2007; Aşkar, Usluel & Mumcu, 2006; Akbaba-Altun,
2006; Göktaş, 2003; Çağıltay et al., 2001; Addo, 2001). A well-planned and up-to-date, high
quality, on the job and ongoing training system that meets adult learner characteristics and
real needs is required (Yıldırım, 2007; Aşkar, Usluel & Mumcu, 2006; Akbaba-Altun, 2006;

254
Göktaş, 2003; and Çağıltay et al., 2001). In Özar’s study, key policy makers stressed that a
first priority has to be given to in-service training for teachers, and preservice education
programs should include IT courses, to integrate IT into the curriculum (Özar, 1996). Addo
(2001) proposes that the quality of in-service training is crucial and more important than the
nature of the hardware and software used in ICT integration into schools. In fact, not only
teachers, but also inspectors, school administrators and ICT coordinators should be trained
for a successful ICT integration (Akbaba-Altun, 2006).
The professional development system for teachers should involve some components
to increase teachers’ use of technology in their teaching. First of all, teachers’ beliefs about
teaching and learning play a crucial role in integrating ICT into schools (Reynolds, Treharne
& Tripp, 2003; Mumtaz, 2000). Indeed, teachers need to believe that ICT will improve their
teaching and their students’ learning (Reynolds, Treharne & Tripp, 2003). Access to ICT
resources, quality of software and hardware, ease of use, incentives to change, support and
collegiality at school, school and national policies, commitment to professional learning and
background in formal computer training are factors affecting teachers’ decision to use
technology in their teaching (Mumtaz, 2000). Besides having ICT literacy, preservice
teachers need training on how to utilize ICT in their subjects (Göktaş, 2003).
Policy makers do not seem to give importance to the policies and implementations of
integration of ICT into schools in any real sense. The human factor is still neglected, but it is
as crucial as the financial, social and organizational costs of using ICT in education
(Reynolds, Treharne & Tripp, 2003). The future of IT in Turkey is related to the extent of
increase in infrastructure, general Internet access, and training opportunities for teachers
(Aydın & McIsaac, 2004). In fact, the more infrastructures, access to Internet technologies
and in-service training on ICT use for teachers, the more possibilities there are for economic,
social and educational development in Turkey (Aydın & McIsaac, 2004).
5.4 Implications and Suggestions for Further Research and Practice
Suggestions for MONE and YÖK
In order to lessen the digital divide regarding overall ICT use and self-confidence in
ICT tasks within Turkey and between Turkey and the EU, MONE should take measures to
diffuse ICT at school, to develop sound ICT policies and projects to integrate ICT across the
curriculum, and to give clear prescriptions about how to implement that policy-not only at
national level, but also at local and school levels.
255
More specifically, the following suggestions for ICT-in-education policy and
implementations can be made:
1. Considering the ICT-related policies and implementations of European partners,
there is a need for a national short- and long-term ICT-in-education policy in a
written format for K-12 schools, as has emerged from this study. A long-term and a
short-term ICT-in-education policy document for K-12 schools should be developed
“not solely by political authority” but “through agreement of all stakeholders in the
education sector”, such as policy makers and policy implementers in MONE,
universities, local administrators, public and private school administrators, teachers,
students, non-governmental organizations, and parents to give ICT literacy to
students and integrate ICT into all curricula. These policies should include ICT-
related goals and objectives, benchmarks for students in each grade, and prescriptive
information on how to use ICT across the curriculum and be rationalized through
conducting needs analyses of teachers and students at schools in Turkey.
2. The ICT-in-education policy should include public and private initiatives and
projects regarding the provision of ICT infrastructure like Internet connections, ICT
equipment and software, integration of ICT across the curriculum, teacher training,
pedagogical and technical support and maintenance, and research.
3. An “ICT Task Force” should be established within MONE. This task force should be
responsible for developing ICT-in-education policies, and monitoring and evaluating
implementations, and it should have also authority in the procurement of, and
distribution of ICT facilities to schools. Furthermore, this task force should be
responsible for providing classrooms in all K-12 schools with one projector and at
least a computer linked to the Internet, through cooperating with private sector.
4. Each school should have an “Instructional Technology” plan developed by all
school-based stakeholders, in order to integrate ICT into schools and to utilize it
effectively and efficiently. Each school should be given autonomy to meet its own
peculiar needs for software and ICT facilities, within the framework of the
instructional technology plan for the school. For guidance on such plans, not only
national, but also regional/school level ICT integration policies should be specified
and published.
256
5. An “ICT Support Center” should be established in each K-12 school to develop
instructional materials across the curriculum, with the help of the computer teacher
in charge of this unit. This center should employ VET trainees as technical support
personnel to support teachers in provision of ICT equipment and facilities and in
using these materials. Considering the financial burden of employing a full-time
computer technician at school, students in computer-related departments at VET
schools should be assigned as trainees, within their apprenticeships, to help teachers
in the case of any breakdown or technical problem in classrooms or IT rooms. In this
way, just-in-time technological support would be provided for teachers.
Because of Turkish students’ relatively low Internet use and self-confidence in ICT
tasks compared to both EU groups, the following suggestions are made:
6. The ICT diffusion policy into primary and secondary schools should be continued.
All schools should be provided with secure, fast Internet connections. Besides,
establishing IT rooms in each school, each classroom should also be provided with a
multimedia computer, Internet connection and a projector, to facilitate integration of
ICT across the curriculum. In this way, Turkish students can develop self-confidence
in ICT tasks through individually engaging in learning environments with ICT.
7. The policy of employing computer teachers in primary and secondary schools should
be continued, but the roles and duties of computer teachers should be redefined.
They should not only teach students computer competencies in separate computer
courses –which is what they are mainly supposed to do at school at present-, they
should also be ICT coordinators acting as change agents and consultants in the
integration of ICT into the whole curriculum.
8. The curriculum of computer courses should be updated regularly in accordance with
technological and pedagogical developments. For instance, with the emerging
importance of the Internet in daily life, more objectives related to learning “how to
use the Internet effectively and efficiently” should be added to the curricula. The
approach of teacher-centered instruction and the objectives of the curriculum
including how to use menu options should be excluded. Rather, a more authentic,
learner-centered and problem-based learning should be given priority in giving ICT
literacy to students. The objectives of ICT related courses should be meaningful for
257
students and in accordance with their developmental stages. These courses should be
compulsory courses in the K-12 curriculum.
9. The ICT related objectives should not be part of separate ICT courses only; they
should also exist in the curriculum of other subjects. For instance, homework or
projects to be prepared in other subjects through utilizing ICT facilities like the
Internet should be promoted with bonus points, as long as students are provided with
ICT facilities to do homework. In this way, ICT competencies will be acquired
through authentic tasks and use of ICT will enhance student learning in other
subjects.
10. The student-to-computer ratio should be minimized to one-to-one in computer
courses. In order to achieve this, classes can be divided into two sections and one
section can take another course concurrently while the other section is taking an
ICT- related course in the IT room. Also, number of ICT related courses in a week
should be increased; besides number of students in a course can be reduced by
dividing them into two or three sections for ICT-related laboratory activities, so as to
give opportunity to students to use ICT individually.
11. IT rooms should be kept open to students, not only during computer courses, but
also at lunch breaks, after school, and at weekends. In this way, students will have
the opportunity to practise their computer skills without any cost. VET trainees can
be employed for operation and maintenance of IT rooms under the supervision of
computer teachers for out-of lesson hours.
12. Not only computer teachers but also subject teachers should be encouraged to use
ICT facilities and IT rooms for their lessons. For this aim, ongoing professional
development programs meeting the real needs of teachers should be planned and
implemented at schools, where they work in order to influence teachers’ attitudes
and beliefs about technology in teaching and learning. Computer teachers can also
work as coordinators of professional development for ICT integration into curricula
in every school.

258
13. In order to increase the contribution of computer teachers to, and the participation of
teachers in in-service training, some incentives such as an increase in salary and/or
promotion should be given.
14. A nationwide portal should be developed to share experiences and best examples on
ICT implementations across the curriculum for K-12 school teachers. Through this
portal, instructional materials developed in ICT Support Centers and the most
effective instructional methods for different subjects would also be shared by
teachers at different schools. The responsibility for service, maintenance and
updating of this portal should be given to the “ICT Task Force” with the consultation
of teacher education departments in universities.
15. The government should make regulations concerning reducing taxes on computers
and Internet connections to increase the diffusion of ICT at home.
Due to Turkish students’ relatively positive attitudes toward computers, the
following suggestion can be made:
16. The more positive attitudes toward computers of Turkish students can be exploited
in the affective domain of pedagogy across the curriculum. More specifically,
students with low motivation toward learning can be encouraged through
educational computer games to learn other subjects. Besides, basic computer skills
can be acquired by pupils through computer games.
Based on the results of mathematical and problem solving literacy performance
models, the following suggestions could be made:
17. The results indicate a negative and small correlational relationship between students’
mathematical and problem solving literacy performance with their overall ICT use.
Since both very frequent and rare ICT uses in teaching and learning affect student
learning negatively, the use of ICT in education should be adjusted to a medium
frequency at school.
18. Subject teachers should be trained in “how to use and evaluate instructional software
in their own fields” in preservice and in-service teacher training programs. They
should practise these skills in their preservice education.

259
19. Since there are negative relationships between students’ self-confidence in advance
ICT tasks and mathematical and problem solving literacy performances at moderate
level, objectives related to advanced ICT tasks should be limited in compulsory
curricula in order not to negatively affect students’ academic performance.
Suggestions for further research:
1. Since this is a macro level study, that is, it is very large in terms of scope, content,
and sample, more studies at a micro level should be conducted in order to understand
the specific reasons underlying the results of this study and to verify or falsify the
results of this study. Such micro level studies should be supported with the
qualitative research methods of interview, observation and document analysis.
2. Since data on ICT aspects, and socioeconomic and cultural status are completely
based on the perceptions of students in the comparison of students in the EU and
Turkey regarding ICT, more observational and/or experimental studies need to be
designed and conducted for more causal results, instead of correlational ones.
Therefore, the next logical step in forwarding this research is to conduct more micro
level causal-comparative studies based on experimental and observational data. In
this sense, in order to understand the direct effects of students’ ICT use, self-
confidence in ICT, attitudes toward computers, and socioeconomic and cultural
status on mathematical and problem solving literacy performance, more
experimental studies investigating the effects of ICT on student performance need to
be conducted at a micro level for different school types, ages, and regions etc.
3. The overall use of ICT represents a negative and small relationship with students’
mathematical and problem solving literacy performance. At this point, the questions
of how students use ICT and what students do with ICT gain importance and should
be answered in order to specify the real impact of ICT on student performance.
Drawing a profile of high-achieving students’ ICT use format may indicate how ICT
should be used for students with similar circumstances.
4. Since computers, especially ICT facilities are relatively new as educational
technologies, in order to integrate ICT successfully in mathematics teaching and
learning new pedagogical approaches need to be investigated.
260
REFERENCES
Addo, H. (2001). Utilizing Information and Communication Technology for Education and Development: Issues and challenging for developing countries. IFLA Journal, 27, 143-151. Sage.
Akbaba-Altun, S. (2006). Complexity of Integrating Computer Technologies into Education in Turkey. Educational Technology & Society, 9 (1), 176-187.
Akkoyunlu, B. (1992). İlköğretimin Niteliğinin Artırılmasında Bilgisayarların Yeri ve Önemi. Hacettepe Üniversitesi Eğitim Fakültesi Dergisi. 321-324.
Akkoyunlu, B. (1995). Bilgi Teknolojilerinin Okullarda Kullanımı ve Ögretmenlerin Rolü. Hacettepe Üniversitesi Eğitim Fakültesi Dergisi, 11: 105-109
Akkoyunlu, B., & İmer, G.(1998). Türkiye'de eğitim teknolojisinin görünümü in Ed. Özer, B., Çağdaş Eğitimde Yeni Teknolojiler. T.C. Anadolu Üniversitesi Yayınları No: 1021, Açıköğretim Fakültesi Yayınları No: 564.
Akkoyunlu, B., & Orhan, F. (2001). The Use of Computers in K-12 Schools in Turkey. TechTrend; Nov/Dec 2001, 45(6), Sciences Module pp. 29-31.
Anderson, L. S. (1996). Guidebook for Developing an Effective Instructional Technology Plan. Mississippi State University. 3rd Edition.
Anderson, L.S. (1999). Technology planning: It’s more than computers. National Center for Technology Planning.
Anderson, L.S., & Perry, J.F. (1994). Technology planning: Recipe for success. National Center for Technology Planning.
Arthur, W., J., & Olson, E. (1991). Computer attitudes, computer experience, and their correlates: An investigation of path linkages. Teaching of Psychology, 18{1) 51-54
Aşkar, P. & Olkun, S. (2005). PISA 2003 Sonuçları Açısından Okullarda Bilgi ve Iletişim Teknolojileri Kulanımı [The use of ICT in schools based on PISA 2003 data]. Eurasian Journal of Educational Research, Anı Yayıncılık, 19, pp. 15-34.
Aşkar, P., Usluel, Y. K. & Mumcu, F. K. (2006). Logistic Regression Modeling for Predicting Task-Related ICT Use in Teaching. Educational Technology & Society, 9 (2), 141-151.
Aux-Banfi, I., & Körös-Mikis, M. (2003). National policies and practices on ICT in education: Hungary. In T. Plomp, R. Anderson, N. Law, & A. Quale (Eds.), Cross-national information and communication technology policies and practices in education. (pp 267-282). Greenwich, Connecticut: IAP.

261
Aydın, C. H. & McIsaac, M. S. (2004). The Impact of Instructional Technology in Turkey. Educational Technology Research and Development, 52 (1), 105-112.
Balanskat, A., Blamire, R. & Kefala, S. (2006). The ICT Impact Report, A review of studies of ICT impact on schools in Europe. European Schoolnet, European Commission’s ICT cluster.
BEDK (2008). Campaign for Supporting Computer Aided Education, [Bilgisayarlı Eğitime Destek Kampanyası] Official website, Retrieved January 15, 2008, from http://www.bilgisayarliegitimedestek.org/
Berberoğlu, G. (2005). Student Achievement in the Turkish education systems, in World Bank (2005) Turkey—Education Sector Study, Sustainable Pathways to an Effective, Equitable, and Efficient Education System for Preschool through Secondary School Education (Report No. 32450-TU). pp. 112-115. Retrieved 22/02/2008 from http://siteresources.worldbank.org
Bhullar, H. (2005). ICTs in Education: Global Experience and Model Practices, with Implications for Turkey, in World Bank (2005) Turkey—Education Sector Study, Sustainable Pathways to an Effective, Equitable, and Efficient Education System for Preschool through Secondary School Education (Report No. 32450-TU). pp. 112-115. Retrieved 22/02/2008 from http://siteresources.worldbank.org
Blahova, V. (2003). National policies and practices on ICT in education: The Slovak Republic. In T. Plomp, R. Anderson, N. Law, & A. Quale (Eds.), Cross-national information and communication technology policies and practices in education. (pp 509-524). Greenwich, Connecticut: IAP.
Chatrie, I. and Wraight, P. (2000). Public Strategies for the Information Society in the Member States of the EU, Retrieved January 7, 2008, from http://www.eu-esis.org/download/ESIS_IS_Strategies.pdf
Cohen, J. (1977). Statistical Power Analysis for the Behavioral Sciences (Rev. Ed.). New York: Academic Press.
Cohen, J., Cohen, P., West, S. G. & Aiken, L.S. (2003). Applied Multiple Regression/Correlation Analysis for the Behavioral Sciences. Third Edition. New Jersey: Lawrence Erlbaum Associates, Inc., Publishers.
Commission. (1996). Learning in the Information Society Action plan for a European education initiative (1996-98). Brussels: Commission of the European Communities.
Commission. (2000). European Report on the Quality of School Education: Sixteen Quality Indicators. Luxembourg: Office for Official Publications of the European Communities, 2001.
Commission. (2001). The eLearning Action Plan: Designing tomorrow’s education. Brussels: Commission of the European Communities.
Commission. (2005b). Education and Training 2010: Austrian Interim Report on the Progress Achieved in the Implementation of the EU Work Programme. Retrieved December 10, from http://ec.europa.eu/education/policies/2010/nationalreport_en.html
262
Contreras, C. L. M. (2004) Predicting computer self-confidence from demographic and personality variables and computer use. The Quarterly Review of Distance Education, Volume 5(3), 2004, pp. 173-181. Information Age Publishing, Inc.
Council. (1983). ‘Resolution of the Council and the Ministers for Education, meeting within the Council, of 19 September 1983 on measures relating to the introduction of new information technology in education’, in Official Journal of the European Communities. C 256, 24/09/1983 P. 0001 – 0002.
Council. (1992a). ‘Conclusions Of The Council And The Ministers Of Education Meeting Within The Council of 1 June 1992 on the development of open and distance learning in the European Community (92/C 151/03)’, in Official Journal of the European Communities. C 151, 16/06/1992 P. 0003 – 0003.
Council. (1992b). ‘Conclusions Of The Council And Of The Ministers Of Education Meeting Within The Council of 27 November 1992 on criteria for actions on open and distance learning (92/C 336/04)’, in Official Journal of the European Communities. C 336 , 19/12/1992 P. 0006 – 0006.
Çağıltay, K., Çakıroğlu, J., Çağıltay, N. & Çakıroğlu, E. (2001). Teachers' Perspectives about the Use of Computers in Education. Hacettepe Üniversitesi Eğitim Fakültesi Dergisi, 21: 19-28.
Diaz, M. G. (2002). EU policy in the field of ICT in Higher Education. 2-4 September 2002, Rotterdam, the Netherlands. Retrieved October 19, 2007, from http://www.oecr.nl/conference/abstracts%20and%20presentations/presentations/Keynote_Guiterrez_Diaz.ppt
Downes, S. (2005). Understanding PISA. Turkish Online Journal of Distance Education. TOJDE 6 (2), April 2005, ISSN 1302-6488.
eFit Austria. (n.d.). Scope of eFit Austria. Retrieved December 10, 2007, from http://www.efit.at/english/titel.asp?Titel=Scope_of_eFit_Austria
Empirica. (2006a). Use of computers and the Internet in Schools in Europe 2006. Country Brief: Austria. Bonn: European Commission.
Empirica. (2006c). Use of computers and the Internet in Schools in Europe 2006. Country Brief: Denmark. European Commission.
Empirica. (2006d). Use of computers and the Internet in Schools in Europe 2006. Country Brief: Finland. European Commission.
Empirica. (2006e). Use of computers and the Internet in Schools in Europe 2006. Country Brief: Germany. European Commission.
Empirica. (2006f). Use of computers and the Internet in Schools in Europe 2006. Country Brief: Greece. European Commission.
Empirica. (2006g). Use of computers and the Internet in Schools in Europe 2006. Country Brief: Ireland. European Commission.
Empirica. (2006h). Use of computers and the Internet in Schools in Europe 2006. Country Brief: Italy. European Commission.
263
Empirica. (2006i). Use of computers and the Internet in Schools in Europe 2006. Country Brief: Portugal. European Commission.
Empirica. (2006j). Use of computers and the Internet in Schools in Europe 2006. Country Brief: Sweden. European Commission.
Empirica. (2006m). Use of computers and the Internet in Schools in Europe 2006. Country Brief: Hungary. European Commission.
Erbaş, K. C. (2005). Factors Affecting Scientific Literacy of Students in Turkey in Programme for International Student Assessment (PISA). Unpublished Master’s Thesis. METU, Ankara, Turkey.
Ertl, H. (2003). European Union Programmes for Education and Vocational Training: Development and Impact. SKOPE Research Paper No: 42 Spring 2003, ESRC, Oxford and Warwick Universities. ISSN 1466-1535.
Europa. (2006). Socrates - Minerva (ODL and ICT in Education). Retrieved November 28, 2007, from http://ec.europa.eu/education/programmes/socrates/minerva/descrip1_en.html
Europa. (2007). Education and Training 2010 Diverse Systems, Shared Goals. Retrieved December 3, 2007, from http://ec.europa.eu/education/policies/2010/et_2010_en.html
Eurydice (2001a). Basic indicators on the incorporation of ICT into European education systems, facts and figures, 2000/01 Annual Report. European Commission. Directorate-General for Education and Culture.
Eurydice (2001b). [email protected] Information and Communication Technology in European Education Systems. European Commission. Brussels.
Eurydice. (2004). Key data on information and communication technology in schools in Europe, 2004 Edition. European Commission, The Eurydice European Union Unit.
Eurydice. (2007a). Eurybase: The Information Database on Education Systems in Europe. The Education System in Turkey 2006/07. European Commission.
Fraenkel, J.R. & Wallen, N. (2000). How to Design and Evaluate Research in Education (4th
ed.). New York: McGraw-Hill.
Fusch, T., & Woessmann, L. (2004). Computers and student learning: bivariate and multivariate evidence on the availability and use of computers at home and at school. CESIFO working paper no. 1321 category 4: labour markets.
Göktaş, Y. (2003). A Comparative Analysis of EU Countries’ and Turkey’s Regarding the Integration of ICT in Primary Education Curricula and Teacher Education Programs. Unpublished master thesis. METU, Ankara, Turkey.
Göktaş, Y. (2006). The Current Status of Information And Communication Technologies Integration into Schools of Teacher Education and K-12 in Turkey. Unpublished doctoral dissertation. METU, Ankara, Turkey.

264
Gülbahar, Y. (2007) Technology planning: A roadmap to successful technology integration in schools, Computers & Education, 49 (2007) 943-956
Hair, J.F., William, C.B., Barry, J.B, Rolph, E.A., & Ronald, L.T. (2006). Multivariate Data Analysis. Six Edition, New Jersey: Pearson Prentice Hall, Inc.
Henriques, H., Riberio, F., Amaro, G., & Ferreira, C. (2003). National policies and practices on ICT in education: Portugal. In T. Plomp, R. Anderson, N. Law, & A. Quale (Eds.), Cross-national information and communication technology policies and practices in education. (pp 465-478). Greenwich, Connecticut: IAP.
İş Güzel, Ç., & Berberoğlu, G. (2005). An analysis of the programme for international student assessment 2000 (PISA 2000) mathematical literacy data for Brazilian, Japanese and Norwegian students. Studies in Educational Evaluation, 31 (2005) 283-314.
Jöreskog, K.G., & Sörbom, D. (1993). LISREL® 8: Structural Equation Modeling with the SIMPLIS Command Language. New Jersey: Lawrence Erlbaum Associates, Inc., Publishers.
Jöreskog, K.G., & Sörbom, D. (1996-2001). LISREL® 8: User’s Reference Guide. Scientific Software International Inc.
Kankaanranta, M. & Linnakyla, P. (2003). National policies and practices on ICT in education: Finland. In T. Plomp, R. Anderson, N. Law, & A. Quale (Eds.), Cross-national information and communication technology policies and practices in education. (pp 213-232). Greenwich, Connecticut: IAP.
Karasar, N. (1995). Bilimsel Araştırma Yöntemi: Kavramlar, İlkeler, Teknikler. 7. Basım. Ankara: 3A Araştırma Eğitim Danışmanlık Ltd.
Kay, H. K., & Knaack, L (2008). A formative analysis of individual differences in the effectiveness of learning objects in secondary school, Computers & Education, 51 (2008) 1304–1320.
Kirsch, I., Lennon, M., Mandinach, E., Smith, P., Kempster, B., & Schweizer, J. (2007). Digital Transformation: A Framework for ICT Literacy, A Report of the International ICT Literacy Panel. Educational Testing Service.
Kramplova, I. (2003). National policies and practices on ICT in education: Czech Republic. In T. Plomp, R. Anderson, N. Law, & A. Quale (Eds.), Cross-national information and communication technology policies and practices in education. pp 163-177. Greenwich, Connecticut: IAP.
Krathwohl, D. (1993). Methods of Educational and Social Science Research: An Integrated Approach. New York: Longman.
Kroesbergen, E. H., & Van Luit, J.E.H. (2003). Mathematics Interventions for Children with Special Educational Needs: A Meta-Analysis Remedial and Special Education 2003; 24; 97
Kulik, J. A. (2003). Effects of Using Instructional Technology in Elementary and Secondary Schools: What Controlled Evaluation Studies Say, Final Report. SRI International.
265
Kural Er, F., & Güven, B. (2008). İlköğretim 6, 7 ve 8. sınıf bilgisayar dersi programının içeriğine ilişkin öğretmen görüşleri. Sosyal Bilimler Dergisi, Sayı: 19, 175-184.
Lennon, M., Kirsch, I., Davier, M. V., Wagner, M., & Yamamoto, K. (2003). Feasibility study for the PISA ICT Literacy assessment, Report to Network A, ACER, ETS, NIER.
Markauskaite, L. (2006). Towards an integrated analytical framework of information and communications technology literacy: from intended to implemented and achieved dimensions. Information Research, 11(3).
McCaffery., C. (2003). The Digital Divide in the EU: National Policies and Access to ICTs in the Member States (MacKeogh, K, Ed). Oscail – National Distance Education Centre Dublin City University, Dublin 9, Ireland.
Melchiori, R., Picco, R. (2003). National policies and practices on ICT in education: Italy. In T. Plomp, R. Anderson, N. Law, & A. Quale (Eds.), Cross-national information and communication technology policies and practices in education. (pp 321-334). Greenwich, Connecticut: IAP.
MONE (1994). Tebliğler Dergisi. Talim ve Terbiye Kurulu Başkanlığı. Acception of Information Technology I-II curriculum [Bilgi Teknolojisi I-II dersi öğretim programlarının kabulü]. Decision date: 14.04.1994, Decision No: 259. Ankara: Milli Eğitim Basımevi, 2407.
MONE (1998). Tebliğler Dergisi. Talim ve Terbiye Kurulu Başkanlığı.Ankara: Milli Eğitim Basımevi, 2492.
MONE (1999). Policy Paper for IT Component of Basic Education Program. Republic of Turkey, July, 1999.
MONE (2000). Tebliğler Dergisi. Talim ve Terbiye Kurulu Başkanlığı.Ankara: Milli Eğitim Basımevi, 2519.
MONE (2002). Milli Eğitim Bakanlığı, Okullarda Bilgi Teknolojileri Uygulamalarına Yönelik Çalışmalar. Retrieved March 01, 2008 from http://okulweb.meb.gov.tr/18/01/965671/belgeler/bde/bakanlik_okullarda_bilgi_teknolojileri.mht
MONE. (2003). Eğitim Teknolojileri Etkinlikler 2002, TC, MEB, EĞİTEK Yayınları No: 12, Ankara: 4. Akşam Sanat Okulu Matbaası.
MONE. (2004). Temel Eğitim Programında Bilgi Teknolojisi Sınıflarının Etki Araştırması Final Raporu.
MONE. (2005a). Basic Education in Turkey: Background Report, Republic of Turkey, June, 2005. Retrieved February 11, 2008, from http://www.oecd.org/dataoecd/8/51/39642601.pdf
MONE. (2005b). Tebliğler dergisi. Talim ve Terbiye Kurulu Başkanlığı Subject: The curriculum of “Information and Communication Technology for Upper secondary schools” Orta Öğretim Kurumları Bilgi ve İletişim Teknolojisi Dersi Öğretim Programı Decision Date: 27/09/2005, Decision No: 329, p. 776.
266
Morse, J.M. (2003). Principles of Mixed Methods and Multimethod Research Design. In A. Tashakkori & C. Teddlie (Eds.), Handbook of Mixed Methods in Social & Behavioral Research (pp. 189-208). Thousand Oaks. London. New Delhi. Sage Publications.
Mumtaz, S. (2000). Factors Affecting Teachers’ use of Information and Communications Technology: a review on the literature. Journal of Information Technology for Teacher Education, 9 (3), 319-341.
OECD (2001a). Schooling for tomorrow, Learning to change: ICT in schools, Education and Skills. Paris: OECD publications. Center for Educational Research and Innovation.
OECD (2003a). The PISA 2003 Assessment Framework – Mathematics, Reading, Science and Problem Solving Knowledge and Skills, Paris: OECD publications.
OECD (2004a). Problem Solving for Tomorrow’s World – First Measures of Cross-Curricular Competencies from PISA 2003, Paris: OECD publications.
OECD (2004b). Learning for Tomorrow’s World: First Results from PISA 2003, Paris: OECD publications.
OECD (2005a). PISA 2003 Data Analysis Manual: SPSS® Users, Paris: OECD Publications.
OECD (2005b). PISA 2003 Technical Report, Paris: OECD publications.
OECD (2006a). News media inquiries. Paris: OECD publications.
OECD (2006b). OECD Annual Report 2006, Paris: OECD publications.
OECD (2006c). Are Students Ready for a Technology-rich World? What PISA Studies Tell Us, Paris: OECD publications.
OECD (n.d.). Organisation for Economic Co-operation and Development. Retrieved November 21, 2007, from http://www.oecd.org/dataoecd/29/23/2397890.ppt
Orhan, F., & Akkoyunlu, B. (2004). İlköğretim öğrencilerinin Internet kullanımları üzerine bir çalışma. Hacettepe Üniversitesi Eğitim Fakültesi Dergisi, 26, 107-116.
Özar, M. M. (1996). The Use of Information Technology in Education: The Opinions of Key Policy Makers in the Ministry of National Education in Turkey. Unpublished PhD. Thesis. METU, Ankara, Turkey.
Pedersen, D., (2003). National Policies and Practices on ICT in Education: Denmark. In T. Plomp, R. Anderson, N. Law, & A. Quale (Eds.), Cross-national information and communication technology policies and practices in education. Greenwich, Connecticut: IAP.
Pelgrum, W. J., & Plomp, T. (2002). Indicators of ICT in Mathematics: Status and Covariation with Achievement Measures, Chapter 19. in Ed. Robitaille, D. F. & Beaton, A. E. (2002) Secondary analysis of TIMSS data. Netherlands: Kluwer Academic Publishers.

267
Pelgrum, W. J., & Law, N. (2003). ICT in education around the world: trends, problems and prospects. Paris: International Institute for Educational Planning, UNESCO 2003.
PISA. (n.d.). PISA FAQ. Retrieved November 21, 2007, from http://www.oecd.org/dataoecd/10/60/38248407.pdf
Punie, Y., & Cabrera, M. (2006). The Future of ICT and Learning in the Knowledge Society. Report on a Joint DG JRC/IPTS-DG EACWorkshop held in Sevilla, 20–21 October 2005, DG JRC-IPTS, European Communities.
Reynolds, D., Treharne, D., & Tripp, H. (2003). ICT – the hopes and the reality. British Journal of Educational Technology, 34 (2) 151-167.
Rogers, M. R. (1995). Diffusion of Innovations. Fourth Edition. New York: The Free Press.
Schulz-Zander, R. (2003). National Policies and Practices on ICT in Education: Germany. In T. Plomp, R. Anderson, N. Law, & A. Quale (Eds.), Cross-National Information and Communication Technology Policies and Practices in Education. (pp 249-266). Greenwich, Connecticut: IAP.
Stevens, J. (2002). Applied Multivariate Statistics for the Social Sciences. Fourth Edition. New Jersey: Lawrence Erlbaum Associates, Inc., Publishers.
Strauss, A.L., & Corbin, J. (1998). Basics of Qualitative Research: Grounded Theory Procedures and Techniques, Second Edition, Thousand Oax, CA: Sage
Sweet, R., & Meates, A. (2004). ICT and Low Achievers: What Does Pisa Tell Us? In Karpati, A. (Ed.) (2004) Promoting Equity Through ICT in Education: Projects, Problems, Prospects. Budapest, Hungarian Ministry of Education and OECD.
Şahinkayası, Y., & Şahinkayası, H. (2004). Okullar İçin Öğretim Teknolojisi Planı (ÖTP) ve Öğeleri. Paper presented at XIII. Ulusal Eğitim Bilimleri Kurultayı, 6-9 Temmuz 2004, İnönü Üniversitesi, Eğitim Fakültesi, Malatya.
Tabachnick, B.G., & Fidell, L.S. (1996). Using Multivariate Statistics. Third Edition. New York: HarperCollins College Publishers.
TBŞ (2002). Türkiye Bilişim Şurası, Eğitim Çalışma Grubu, Taslak Rapor. Sürüm 3.0, 10-12 Mayıs 2002, Ankara. Retrieved January 15, 2008, from http://bilisimsurasi.org.tr/home.php?golink=rapor
TTKB (2004). Authority of the Turkish Education Board, Program Development Studies [Talim Terbiye Kurulu Program Geliştirme Çalişmaları]. Retrieved 10.04.2008 from http://ttkb.meb.gov.tr/programlar/prog_giris/prg_giris.pdf
Tuti, S. (2005) Eğitimde bilişim teknolojileri kullanımı performans göstergeleri, öğrenci görüşleri ve öz-yeterlik algılarının incelenmesi, Unpublished Master Thesis, Hacettepe University, Ankara.
Ullman, J.B. (1996). Structural Equation Modeling. In Tabachnick, B.G., & Fidell, L.S. Using Multivariate Statistics (pp. 709-811). Third Edition. New York: HarperCollins College Publishers.

268
UNESCO (2004). Turkey National Report. International Conference on Education 47th session, Geneva, 8-11 September 2004 "Quality education for all young people: Challenges, trends and priorities" International Bureau of Education. Retrieved February 22, 2008, from www.ibe.unesco.org/international/ICE47/English/Natreps/reports/turkey.pdf
Usluel, Y. K., & Askar, P. (2002). Teachers and Use of Computers. The Proceedings of BTIE -5, Informatics Association of Turkey Ankara-Turkey, 169-180.
Uşun, S. (2004). Instructional Technologies in the World and Turkey (A comparative review) AACE Journal, 12(3), 249-279.
Wittwer, J., & Senkbeil, M. (2008). Is Students’ Computer Use at Home related to their Mathematical Performance at School? Computers & Education, 50 (4), May 2008, 1558-1571.
World Bank (n.d.). Basic Education Project – Phase II APL, World Bank official web site. Retrieved February 22, 2008, from http://web.worldbank.org
World Bank (2001). Turkey-Basic Education II (Phase II APL). Report No. PID9625.
World Bank (2002). Project appraisal document on a proposed loan in the amount of US$300 million to the republic of turkey for a second basic education project in support of the second phase of the basic education program. (Report No: 21831-TU).
World Bank (2004). Implementation completion report (scl-43550) on a loan in the amount of us$300 million equivalent to the republic of Turkey for a basic education project in support of the first phase of the basic education program. Report No: 27696 – TU.
World Bank. (2008). Data and Statistics. ICT at a Glance Definitions and Sources. Retrieved October 10, 2007, from http://web.worldbank.org/
Yalçınalp, S. & Yıldırım, Z. (2006). Information and Communication Technology Usage in Turkey, Paper presented at the European Conference on Educational Research, University of Geneva, 13-15 September 2006.
Yang, Y. (2003). Dimensions of Socio-Economic Status and Their Relationship to Mathematics and Science Achievement at Individual and Collective Levels, Scandinavian Journal of Educational Research, 47 (1), 21-41.
Yıldırım, S. (2006). Avrupa ve Türkiye’de Eğitimde Teknolojileri Kullanımı. Akademik Görüş. GISAM METU.
Yıldırım, S. (2007). Current Utilization of ICT in Turkish Basic Education Schools: A Review of Teacher's ICT Use and Barriers to Integration. International Journal of Instructional Media, 34 (2), 171-186.
Yıldırım, A., & Şimşek, H. (2000). Sosyal Bilimlerde Nitel Araştırma Yöntemleri. Ankara: Seçkin Yayıncılık.
YÖK (1998). Reorganization of teacher training programs of teacher education schools. Ankara, Turkey.
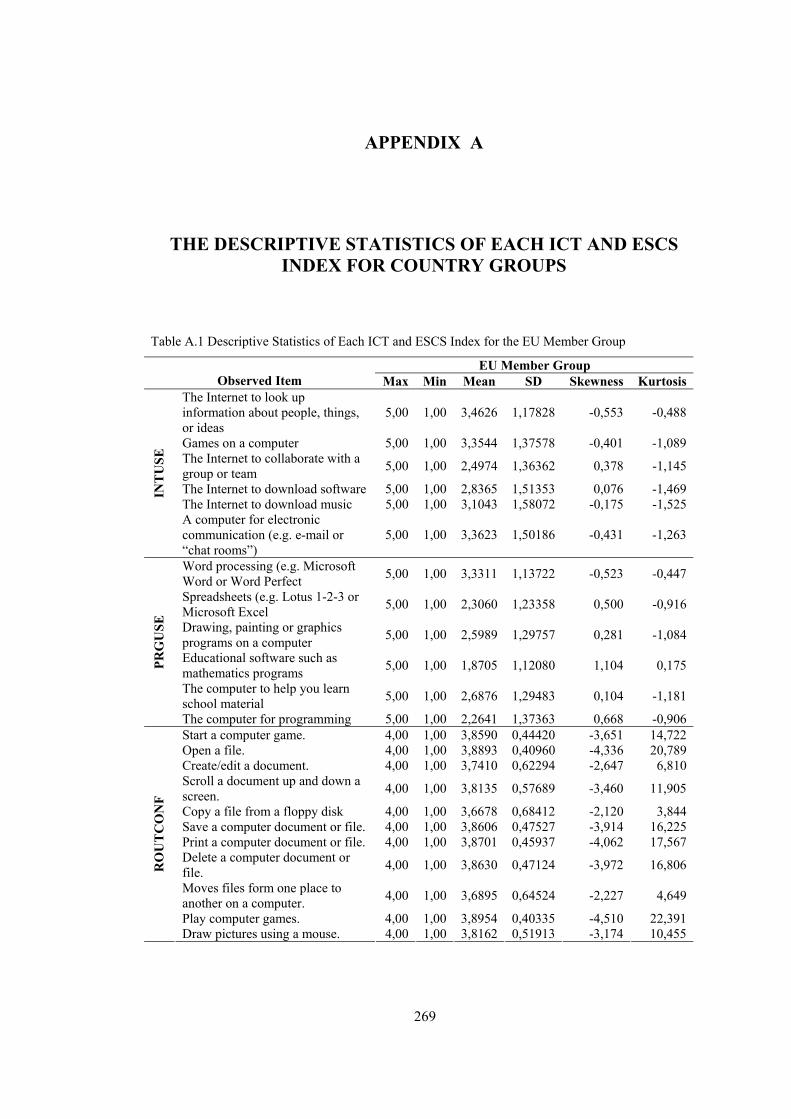
269
APPENDICES APPENDIX A
THE DESCRIPTIVE STATISTICS OF EACH ICT AND ESCS INDEX FOR COUNTRY GROUPS
Table A.1 Descriptive Statistics of Each ICT and ESCS Index for the EU Member Group
EU Member Group Observed Item Max Min Mean SD Skewness Kurtosis
The Internet to look up information about people, things, or ideas
5,00 1,00 3,4626 1,17828 -0,553 -0,488
Games on a computer 5,00 1,00 3,3544 1,37578 -0,401 -1,089 The Internet to collaborate with a group or team 5,00 1,00 2,4974 1,36362 0,378 -1,145
The Internet to download software 5,00 1,00 2,8365 1,51353 0,076 -1,469 The Internet to download music 5,00 1,00 3,1043 1,58072 -0,175 -1,525
INT
USE
A computer for electronic communication (e.g. e-mail or “chat rooms”)
5,00 1,00 3,3623 1,50186 -0,431 -1,263
Word processing (e.g. Microsoft Word or Word Perfect 5,00 1,00 3,3311 1,13722 -0,523 -0,447
Spreadsheets (e.g. Lotus 1-2-3 or Microsoft Excel 5,00 1,00 2,3060 1,23358 0,500 -0,916
Drawing, painting or graphics programs on a computer 5,00 1,00 2,5989 1,29757 0,281 -1,084
Educational software such as mathematics programs 5,00 1,00 1,8705 1,12080 1,104 0,175
The computer to help you learn school material 5,00 1,00 2,6876 1,29483 0,104 -1,181
PRG
USE
The computer for programming 5,00 1,00 2,2641 1,37363 0,668 -0,906 Start a computer game. 4,00 1,00 3,8590 0,44420 -3,651 14,722 Open a file. 4,00 1,00 3,8893 0,40960 -4,336 20,789 Create/edit a document. 4,00 1,00 3,7410 0,62294 -2,647 6,810 Scroll a document up and down a screen. 4,00 1,00 3,8135 0,57689 -3,460 11,905
Copy a file from a floppy disk 4,00 1,00 3,6678 0,68412 -2,120 3,844 Save a computer document or file. 4,00 1,00 3,8606 0,47527 -3,914 16,225 Print a computer document or file. 4,00 1,00 3,8701 0,45937 -4,062 17,567 Delete a computer document or file. 4,00 1,00 3,8630 0,47124 -3,972 16,806
Moves files form one place to another on a computer. 4,00 1,00 3,6895 0,64524 -2,227 4,649
Play computer games. 4,00 1,00 3,8954 0,40335 -4,510 22,391
RO
UT
CO
NF
Draw pictures using a mouse. 4,00 1,00 3,8162 0,51913 -3,174 10,455

270
Table A.1 Continued.
EU Member Group Observed Item Max Min Mean SD Skewness Kurtosis
Get on to the Internet. 4,00 1,00 3,8740 0,45313 -4,088 17,660 Copy or download files from the Internet. 4,00 1,00 3,5752 0,73470 -1,684 2,043
Attach a file to an email message 4,00 1,00 3,3349 0,88804 -1,124 0,211 Download music from the Internet. 4,00 1,00 3,4784 0,79481 -1,342 0,762 IN
TC
ON
F
Write and send emails. 4,00 1,00 3,6945 0,67148 -2,257 4,384 Use software to find and get rid of computer viruses. 4,00 1,00 2,9803 0,94483 -0,385 -1,016
Use a database to produce a list of addresses. 4,00 1,00 3,2105 0,94003 -0,993 -0,027
Create a computer program (e.g. in Logo, Pascal, Basic) 4,00 1,00 2,6438 0,95257 -0,125 -0,927
Use a spreadsheet to plot a graph 4,00 1,00 3,1010 0,97010 -0,763 -0,519 Create a presentation (e.g. using <Microsoft PowerPoint>). 4,00 1,00 3,1487 0,98118 -0,864 -0,404
Create a multi-media presentation (with sound, pictures, vide. 4,00 1,00 2,9928 0,90991 -0,451 -0,784
HIG
HC
ON
F
Construct a Web page. 4,00 1,00 2,8479 0,87004 -0,205 -0,808 It is very important to me to work with a computer. 4,00 1,00 3,2799 0,78100 -0,813 -0,057
To play or work with a computer is really fun. 4,00 1,00 3,4004 0,70021 -1,042 0,893
I use a computer because I am very interested. 4,00 1,00 3,1985 0,82829 -0,682 -0,430
AT
TC
OM
P
I lose track of time, when I am working with the computer. 4,00 1,00 3,0440 0,91313 -0,492 -0,831
Highest parental occupational status 90 16 48,87 16,444 0,293 -0,578
Highest parental education in years of schooling 17 0 13,01 3,596 -1,397 2,432
ESC
S
Index of home possessions (WLE) 1,94 -3,79 0,09 0,93 0,055 0,292
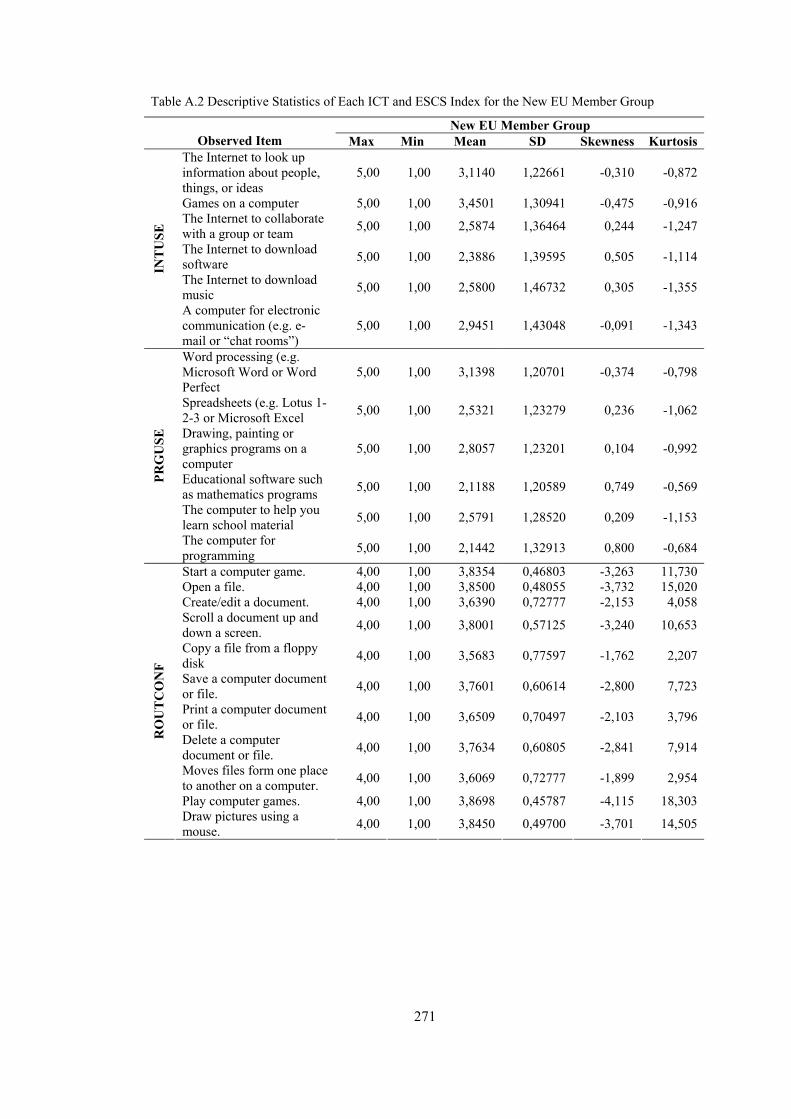
271
Table A.2 Descriptive Statistics of Each ICT and ESCS Index for the New EU Member Group
New EU Member Group Observed Item Max Min Mean SD Skewness Kurtosis
The Internet to look up information about people, things, or ideas
5,00 1,00 3,1140 1,22661 -0,310 -0,872
Games on a computer 5,00 1,00 3,4501 1,30941 -0,475 -0,916 The Internet to collaborate with a group or team 5,00 1,00 2,5874 1,36464 0,244 -1,247
The Internet to download software 5,00 1,00 2,3886 1,39595 0,505 -1,114
The Internet to download music 5,00 1,00 2,5800 1,46732 0,305 -1,355
INT
USE
A computer for electronic communication (e.g. e-mail or “chat rooms”)
5,00 1,00 2,9451 1,43048 -0,091 -1,343
Word processing (e.g. Microsoft Word or Word Perfect
5,00 1,00 3,1398 1,20701 -0,374 -0,798
Spreadsheets (e.g. Lotus 1-2-3 or Microsoft Excel 5,00 1,00 2,5321 1,23279 0,236 -1,062
Drawing, painting or graphics programs on a computer
5,00 1,00 2,8057 1,23201 0,104 -0,992
Educational software such as mathematics programs 5,00 1,00 2,1188 1,20589 0,749 -0,569
The computer to help you learn school material 5,00 1,00 2,5791 1,28520 0,209 -1,153
PRG
USE
The computer for programming 5,00 1,00 2,1442 1,32913 0,800 -0,684
Start a computer game. 4,00 1,00 3,8354 0,46803 -3,263 11,730 Open a file. 4,00 1,00 3,8500 0,48055 -3,732 15,020 Create/edit a document. 4,00 1,00 3,6390 0,72777 -2,153 4,058 Scroll a document up and down a screen. 4,00 1,00 3,8001 0,57125 -3,240 10,653
Copy a file from a floppy disk 4,00 1,00 3,5683 0,77597 -1,762 2,207
Save a computer document or file. 4,00 1,00 3,7601 0,60614 -2,800 7,723
Print a computer document or file. 4,00 1,00 3,6509 0,70497 -2,103 3,796
Delete a computer document or file. 4,00 1,00 3,7634 0,60805 -2,841 7,914
Moves files form one place to another on a computer. 4,00 1,00 3,6069 0,72777 -1,899 2,954
Play computer games. 4,00 1,00 3,8698 0,45787 -4,115 18,303
RO
UT
CO
NF
Draw pictures using a mouse. 4,00 1,00 3,8450 0,49700 -3,701 14,505
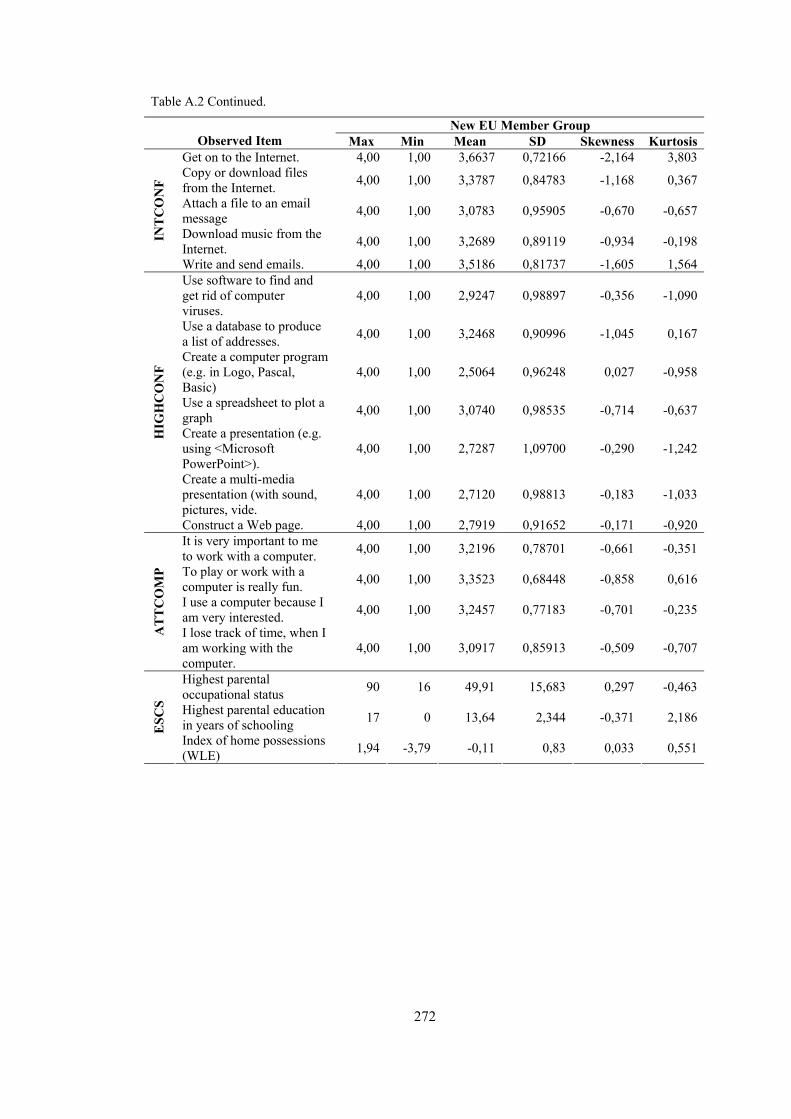
272
Table A.2 Continued.
New EU Member Group Observed Item Max Min Mean SD Skewness Kurtosis
Get on to the Internet. 4,00 1,00 3,6637 0,72166 -2,164 3,803 Copy or download files from the Internet. 4,00 1,00 3,3787 0,84783 -1,168 0,367
Attach a file to an email message 4,00 1,00 3,0783 0,95905 -0,670 -0,657
Download music from the Internet. 4,00 1,00 3,2689 0,89119 -0,934 -0,198 IN
TC
ON
F
Write and send emails. 4,00 1,00 3,5186 0,81737 -1,605 1,564 Use software to find and get rid of computer viruses.
4,00 1,00 2,9247 0,98897 -0,356 -1,090
Use a database to produce a list of addresses. 4,00 1,00 3,2468 0,90996 -1,045 0,167
Create a computer program (e.g. in Logo, Pascal, Basic)
4,00 1,00 2,5064 0,96248 0,027 -0,958
Use a spreadsheet to plot a graph 4,00 1,00 3,0740 0,98535 -0,714 -0,637
Create a presentation (e.g. using <Microsoft PowerPoint>).
4,00 1,00 2,7287 1,09700 -0,290 -1,242
Create a multi-media presentation (with sound, pictures, vide.
4,00 1,00 2,7120 0,98813 -0,183 -1,033
HIG
HC
ON
F
Construct a Web page. 4,00 1,00 2,7919 0,91652 -0,171 -0,920 It is very important to me to work with a computer. 4,00 1,00 3,2196 0,78701 -0,661 -0,351
To play or work with a computer is really fun. 4,00 1,00 3,3523 0,68448 -0,858 0,616
I use a computer because I am very interested. 4,00 1,00 3,2457 0,77183 -0,701 -0,235
AT
TC
OM
P
I lose track of time, when I am working with the computer.
4,00 1,00 3,0917 0,85913 -0,509 -0,707
Highest parental occupational status 90 16 49,91 15,683 0,297 -0,463
Highest parental education in years of schooling 17 0 13,64 2,344 -0,371 2,186
ESC
S
Index of home possessions (WLE) 1,94 -3,79 -0,11 0,83 0,033 0,551

273
Table A.3 Descriptive Statistics of Each ICT and ESCS Index for Turkey
Turkey Observed Item Max Min Mean SD Skewness Kurtosis
The Internet to look up information about people, things, or ideas
5,00 1,00 2,7787 1,42762 0,050 -1,386
Games on a computer 5,00 1,00 3,3870 1,29984 -0,534 -0,847 The Internet to collaborate with a group or team 5,00 1,00 2,4059 1,39853 0,419 -1,264
The Internet to download software 5,00 1,00 2,8136 1,44772 0,022 -1,427
The Internet to download music 5,00 1,00 2,9994 1,48956 -0,141 -1,433
INT
USE
A computer for electronic communication (e.g. e-mail or “chat rooms”)
5,00 1,00 2,8643 1,52745 0,005 -1,517
Word processing (e.g. Microsoft Word or Word Perfect
5,00 1,00 2,9147 1,42101 -0,126 -1,382
Spreadsheets (e.g. Lotus 1-2-3 or Microsoft Excel 5,00 1,00 2,4865 1,40422 0,300 -1,364
Drawing, painting or graphics programs on a computer
5,00 1,00 3,0358 1,33607 -0,216 -1,185
Educational software such as mathematics programs 5,00 1,00 2,3286 1,36995 0,522 -1,124
The computer to help you learn school material 5,00 1,00 2,4950 1,42956 0,335 -1,341
PRG
USE
The computer for programming 5,00 1,00 2,6780 1,47599 0,177 -1,454
Start a computer game. 4,00 1,00 3,7127 0,63929 -2,600 6,952 Open a file. 4,00 1,00 3,6172 0,74481 -2,108 3,909 Create/edit a document. 4,00 1,00 3,2042 0,93773 -1,032 0,120 Scroll a document up and down a screen. 4,00 1,00 3,5011 0,86044 -1,720 1,973
Copy a file from a floppy disk 4,00 1,00 3,4032 0,88289 -1,423 1,088
Save a computer document or file. 4,00 1,00 3,3905 0,91097 -1,404 0,921
Print a computer document or file. 4,00 1,00 3,2969 0,92462 -1,209 0,487
Delete a computer document or file. 4,00 1,00 3,4463 0,89079 -1,571 1,447
Moves files form one place to another on a computer. 4,00 1,00 3,4294 0,86993 -1,491 1,313
Play computer games. 4,00 1,00 3,6945 0,71811 -2,554 5,886
RO
UT
CO
NF
Draw pictures using a mouse. 4,00 1,00 3,6467 0,75498 -2,277 4,449

274
Table A.3 Continued.
Turkey Observed Item Max Min Mean SD Skewness Kurtosis
Get on to the Internet. 4,00 1,00 3,5450 0,81420 -1,823 2,470 Copy or download files from the Internet. 4,00 1,00 3,2314 0,92638 -1,058 0,178
Attach a file to an email message 4,00 1,00 3,0434 0,98876 -0,775 -0,458
Download music from the Internet. 4,00 1,00 3,3825 0,89627 -1,368 0,889 IN
TC
ON
F
Write and send emails. 4,00 1,00 3,2234 0,97944 -1,077 0,029 Use software to find and get rid of computer viruses.
4,00 1,00 2,6853 0,95035 -0,323 -0,793
Use a database to produce a list of addresses. 4,00 1,00 3,0891 0,95550 -0,862 -0,195
Create a computer program (e.g. in Logo, Pascal, Basic)
4,00 1,00 2,7693 1,03145 -0,435 -0,946
Use a spreadsheet to plot a graph 4,00 1,00 3,0181 0,99554 -0,732 -0,542
Create a presentation (e.g. using <Microsoft PowerPoint>).
4,00 1,00 2,9859 1,04457 -0,698 -0,732
Create a multi-media presentation (with sound, pictures, vide.
4,00 1,00 2,9565 0,99074 -0,659 -0,600
HIG
HC
ON
F
Construct a Web page. 4,00 1,00 2,8251 0,98604 -0,525 -0,714 It is very important to me to work with a computer. 4,00 1,00 3,3894 0,75966 -1,082 0,548
To play or work with a computer is really fun. 4,00 1,00 3,5158 0,66795 -1,397 2,013
I use a computer because I am very interested. 4,00 1,00 3,1221 0,89442 -0,673 -0,507
AT
TC
OM
P
I lose track of time, when I am working with the computer.
4,00 1,00 3,3779 0,80624 -1,214 0,843
Highest parental occupational status 88 16 43,51 15,707 0,429 -0,241
Highest parental education in years of schooling 16 0 9,65 4,181 -0,011 -0,848
ESC
S
Index of home possessions (WLE) 1,94 -3,79 -0,57 0,99 0,103 0,583

275
APPENDIX B
PISA 2003 ICT QUESTIONNAIRE
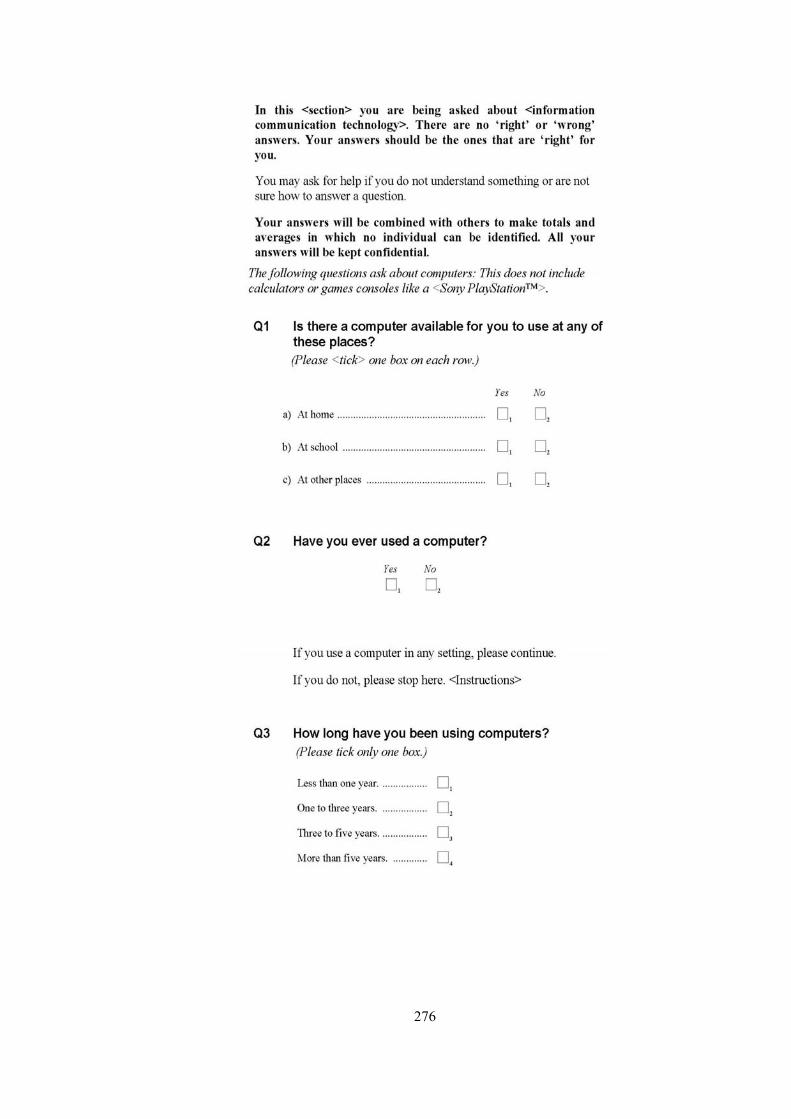
276
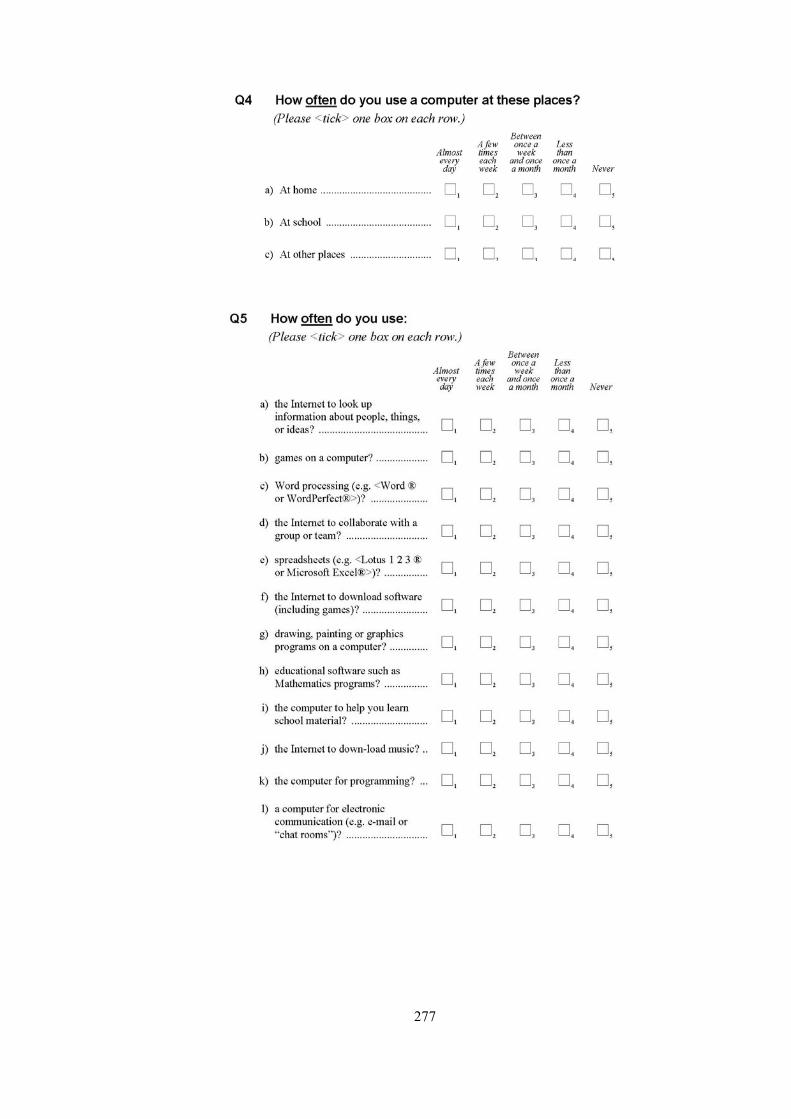
277
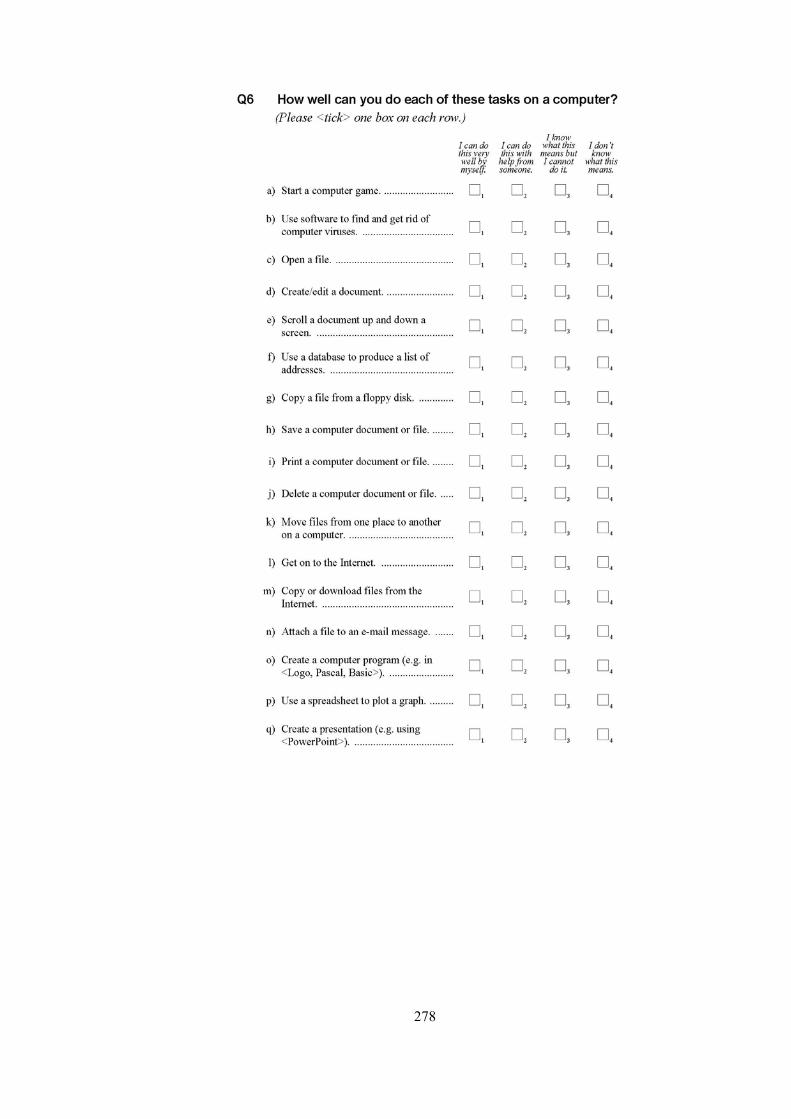
278
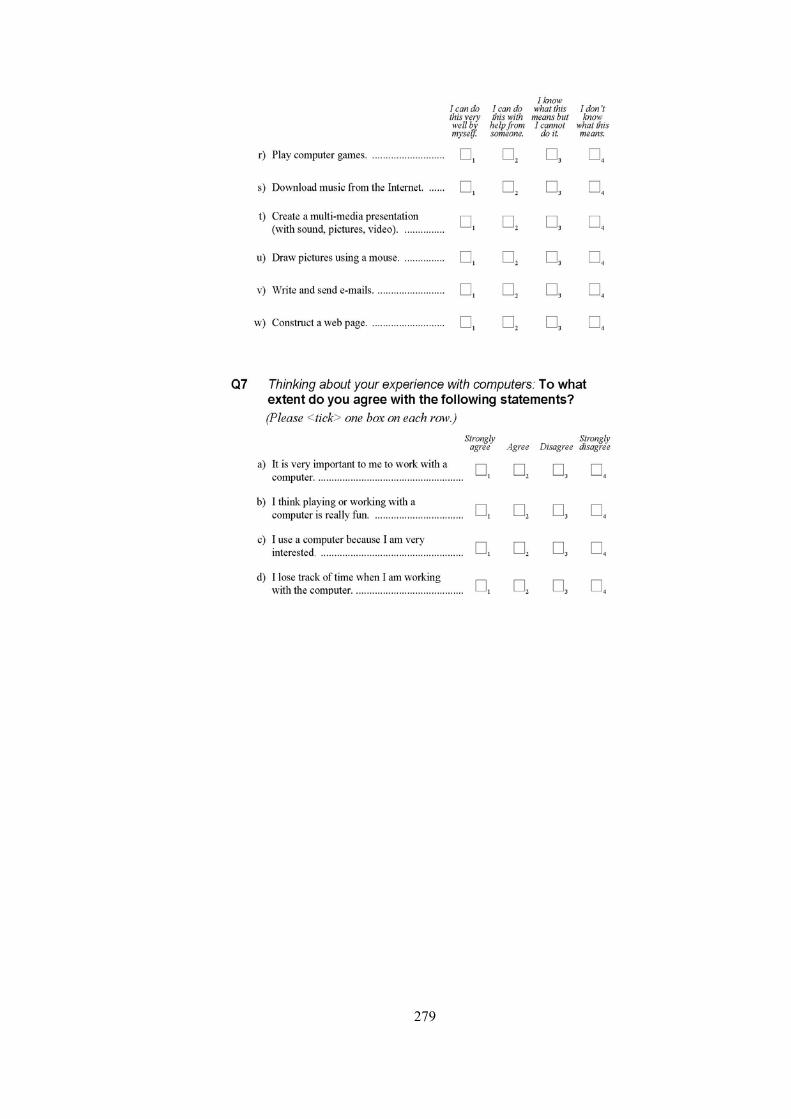
279

280

281
APPENDIX C
INTERVIEWER SCHEDULE – INTERVIEWER
GÖRÜŞME REHBERİ – GÖRÜŞMECİ
Görüşülen Görüşen Adı Soyadı: ____________________ Kurumu: ____________________ Birimi: ____________________ Görevi: ____________________ Unvanı: ____________________
Adı Soyadı: ____________________ Kurumu: ____________________ Birimi: ____________________ Görevi: ____________________ Unvanı: ____________________
Tarih: ____________________ Zaman: Başlama:________Bitiş:________
I. Giriş
Merhaba, benim adım Yunus Şahinkayası. ODTÜ, Eğitim Fakültesi, Bilgisayar ve
Öğretim Teknolojileri Eğitimi Bölümünde Araştırma Görevlisiyim ve doktora yapmaktayım.
OECD tarafından 2003 yılında aralarında Türkiye’nin de bulunduğu “Uluslararası Öğrenci
Değerlendirme Programı (PISA)” adlı bir proje gerçekleştirildi. Bu proje kapsamında
öğrencilerin algıladıkları bilgi ve iletişim teknolojileri (BİT) bilgisi, becerisi ve tutumu
incelendi. Ben, bu proje kapsamında öğrencilerin BİT boyutu sonuçları ve BİT boyutu ile
matematik ve problem çözme başarıları arasındaki ilişkileri gösteren modelleri Avrupa
Birliği üyeleri ve yeni üyeleri ile Türkiye açısından karşılaştırmalı bir araştırma yapıyorum.
Bu anlamda, politika oluşturanlarla görüşüyorum ve BİT politikalarıyla ilgili düşüncelerinizi
öğrenmek istiyorum. Özellikle, BİT politikalarıyla ilgili kişisel algılarınız, deneyimleriniz,
görüşleriniz ve yorumlarınızla ilgileniyorum. Görüşmemiz yaklaşık bir saat sürecektir.
Araştırma sonuçları yayınlanırken sizin kimliğiniz kesinlikle gizli kalacaktır. Bu arada sizce
bir sakıncası yoksa, görüşmenin daha sağlıklı analizi için görüşmeyi kaydedebilir miyim?
Bu çalışmaya katıldığınız için çok teşekkür ederim. Görüşmeye başlamadan önce herhangi
bir sorunuz var mı?
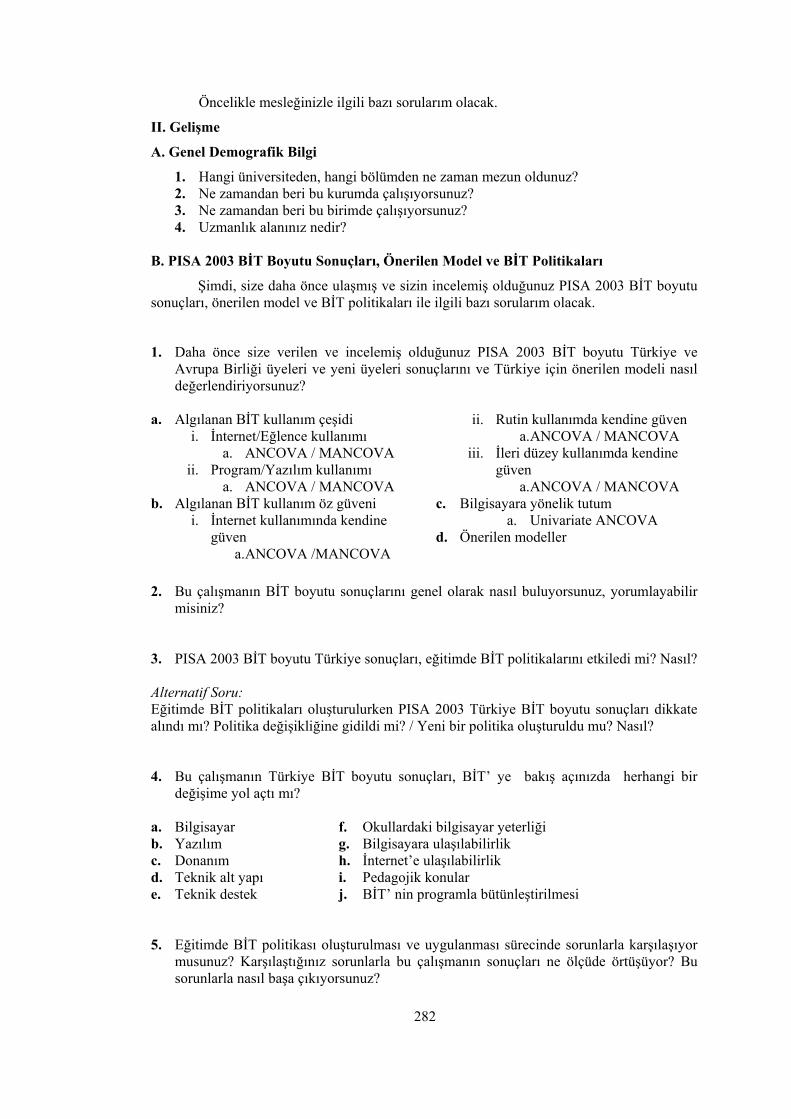
282
Öncelikle mesleğinizle ilgili bazı sorularım olacak.
II. Gelişme
A. Genel Demografik Bilgi
1. Hangi üniversiteden, hangi bölümden ne zaman mezun oldunuz? 2. Ne zamandan beri bu kurumda çalışıyorsunuz? 3. Ne zamandan beri bu birimde çalışıyorsunuz? 4. Uzmanlık alanınız nedir?
B. PISA 2003 BİT Boyutu Sonuçları, Önerilen Model ve BİT Politikaları
Şimdi, size daha önce ulaşmış ve sizin incelemiş olduğunuz PISA 2003 BİT boyutu sonuçları, önerilen model ve BİT politikaları ile ilgili bazı sorularım olacak.
1. Daha önce size verilen ve incelemiş olduğunuz PISA 2003 BİT boyutu Türkiye ve Avrupa Birliği üyeleri ve yeni üyeleri sonuçlarını ve Türkiye için önerilen modeli nasıl değerlendiriyorsunuz?
ii. Rutin kullanımda kendine güven
a. ANCOVA / MANCOVA iii. İleri düzey kullanımda kendine
güven a. ANCOVA / MANCOVA
a. Algılanan BİT kullanım çeşidi i. İnternet/Eğlence kullanımı
a. ANCOVA / MANCOVA ii. Program/Yazılım kullanımı
a. ANCOVA / MANCOVA b. Algılanan BİT kullanım öz güveni
i. İnternet kullanımında kendine güven
a. ANCOVA /MANCOVA
c. Bilgisayara yönelik tutum a. Univariate ANCOVA
d. Önerilen modeller
2. Bu çalışmanın BİT boyutu sonuçlarını genel olarak nasıl buluyorsunuz, yorumlayabilir
misiniz? 3. PISA 2003 BİT boyutu Türkiye sonuçları, eğitimde BİT politikalarını etkiledi mi? Nasıl? Alternatif Soru: Eğitimde BİT politikaları oluşturulurken PISA 2003 Türkiye BİT boyutu sonuçları dikkate alındı mı? Politika değişikliğine gidildi mi? / Yeni bir politika oluşturuldu mu? Nasıl? 4. Bu çalışmanın Türkiye BİT boyutu sonuçları, BİT’ ye bakış açınızda herhangi bir
değişime yol açtı mı? a. Bilgisayar b. Yazılım c. Donanım d. Teknik alt yapı e. Teknik destek
f. Okullardaki bilgisayar yeterliği g. Bilgisayara ulaşılabilirlik h. İnternet’e ulaşılabilirlik i. Pedagojik konular j. BİT’ nin programla bütünleştirilmesi
5. Eğitimde BİT politikası oluşturulması ve uygulanması sürecinde sorunlarla karşılaşıyor
musunuz? Karşılaştığınız sorunlarla bu çalışmanın sonuçları ne ölçüde örtüşüyor? Bu sorunlarla nasıl başa çıkıyorsunuz?
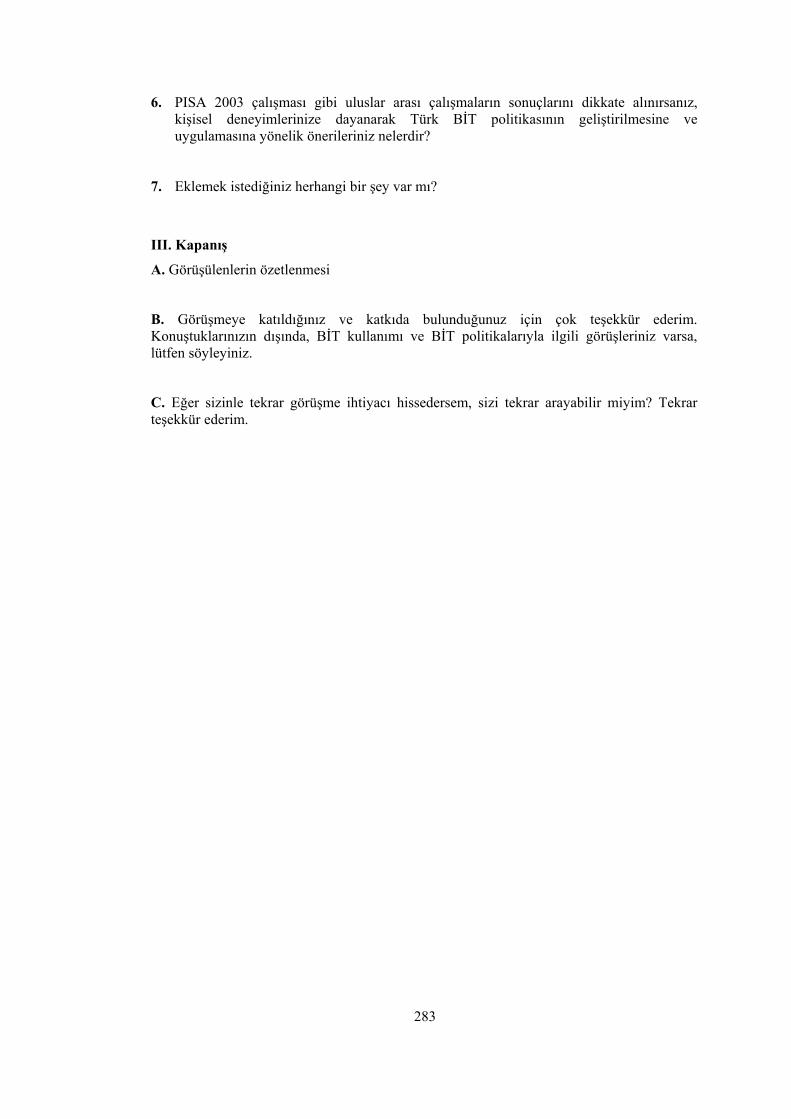
283
6. PISA 2003 çalışması gibi uluslar arası çalışmaların sonuçlarını dikkate alınırsanız, kişisel deneyimlerinize dayanarak Türk BİT politikasının geliştirilmesine ve uygulamasına yönelik önerileriniz nelerdir?
7. Eklemek istediğiniz herhangi bir şey var mı?
III. Kapanış
A. Görüşülenlerin özetlenmesi
B. Görüşmeye katıldığınız ve katkıda bulunduğunuz için çok teşekkür ederim. Konuştuklarınızın dışında, BİT kullanımı ve BİT politikalarıyla ilgili görüşleriniz varsa, lütfen söyleyiniz.
C. Eğer sizinle tekrar görüşme ihtiyacı hissedersem, sizi tekrar arayabilir miyim? Tekrar teşekkür ederim.
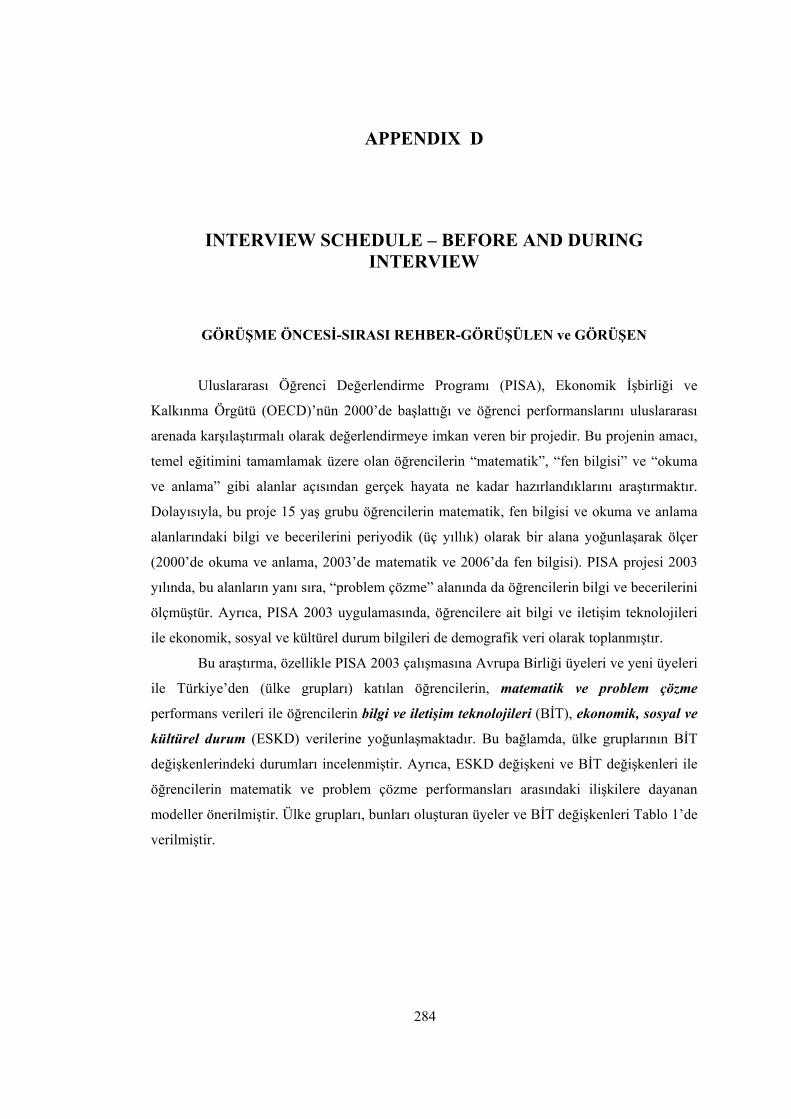
284
APPENDIX D
INTERVIEW SCHEDULE – BEFORE AND DURING INTERVIEW
GÖRÜŞME ÖNCESİ-SIRASI REHBER-GÖRÜŞÜLEN ve GÖRÜŞEN
Uluslararası Öğrenci Değerlendirme Programı (PISA), Ekonomik İşbirliği ve
Kalkınma Örgütü (OECD)’nün 2000’de başlattığı ve öğrenci performanslarını uluslararası
arenada karşılaştırmalı olarak değerlendirmeye imkan veren bir projedir. Bu projenin amacı,
temel eğitimini tamamlamak üzere olan öğrencilerin “matematik”, “fen bilgisi” ve “okuma
ve anlama” gibi alanlar açısından gerçek hayata ne kadar hazırlandıklarını araştırmaktır.
Dolayısıyla, bu proje 15 yaş grubu öğrencilerin matematik, fen bilgisi ve okuma ve anlama
alanlarındaki bilgi ve becerilerini periyodik (üç yıllık) olarak bir alana yoğunlaşarak ölçer
(2000’de okuma ve anlama, 2003’de matematik ve 2006’da fen bilgisi). PISA projesi 2003
yılında, bu alanların yanı sıra, “problem çözme” alanında da öğrencilerin bilgi ve becerilerini
ölçmüştür. Ayrıca, PISA 2003 uygulamasında, öğrencilere ait bilgi ve iletişim teknolojileri
ile ekonomik, sosyal ve kültürel durum bilgileri de demografik veri olarak toplanmıştır.
Bu araştırma, özellikle PISA 2003 çalışmasına Avrupa Birliği üyeleri ve yeni üyeleri
ile Türkiye’den (ülke grupları) katılan öğrencilerin, matematik ve problem çözme
performans verileri ile öğrencilerin bilgi ve iletişim teknolojileri (BİT), ekonomik, sosyal ve
kültürel durum (ESKD) verilerine yoğunlaşmaktadır. Bu bağlamda, ülke gruplarının BİT
değişkenlerindeki durumları incelenmiştir. Ayrıca, ESKD değişkeni ve BİT değişkenleri ile
öğrencilerin matematik ve problem çözme performansları arasındaki ilişkilere dayanan
modeller önerilmiştir. Ülke grupları, bunları oluşturan üyeler ve BİT değişkenleri Tablo 1’de
verilmiştir.
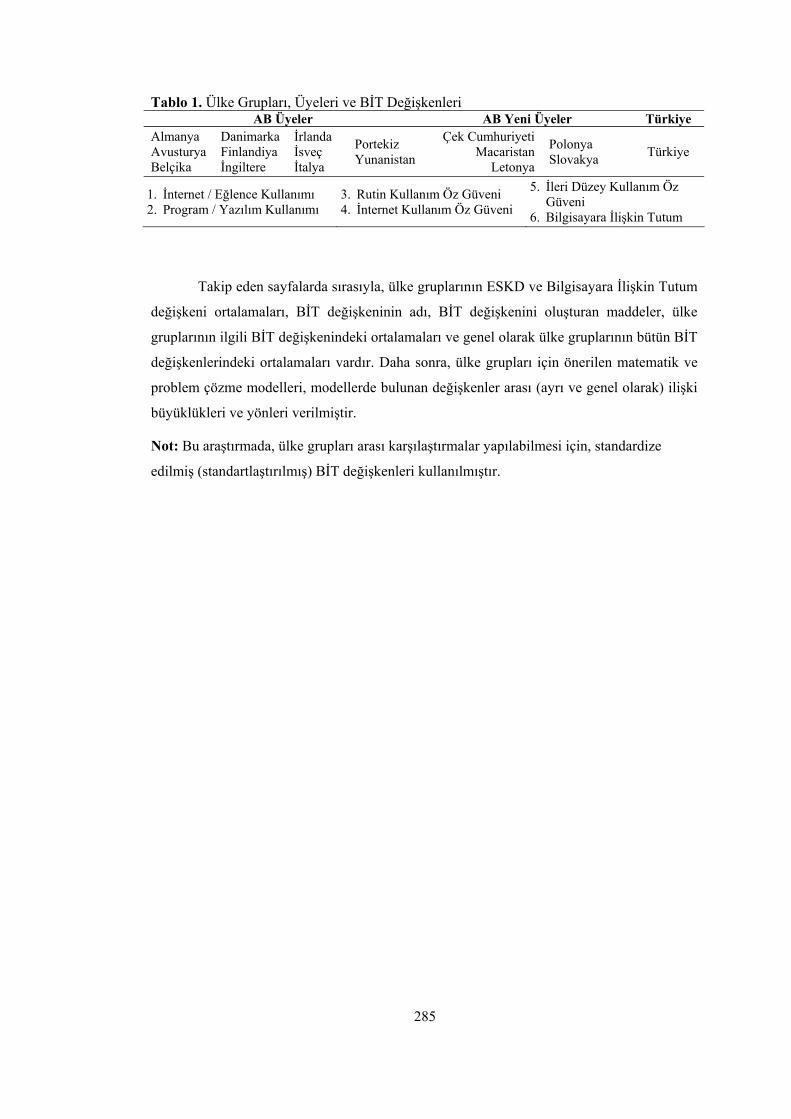
285
Tablo 1. Ülke Grupları, Üyeleri ve BİT Değişkenleri AB Üyeler AB Yeni Üyeler Türkiye
Almanya Avusturya Belçika
Danimarka Finlandiya İngiltere
İrlanda İsveç İtalya
Portekiz Yunanistan
Çek Cumhuriyeti Macaristan
Letonya
Polonya Slovakya Türkiye
1. İnternet / Eğlence Kullanımı 2. Program / Yazılım Kullanımı
3. Rutin Kullanım Öz Güveni 4. İnternet Kullanım Öz Güveni
5. İleri Düzey Kullanım Öz Güveni
6. Bilgisayara İlişkin Tutum
Takip eden sayfalarda sırasıyla, ülke gruplarının ESKD ve Bilgisayara İlişkin Tutum
değişkeni ortalamaları, BİT değişkeninin adı, BİT değişkenini oluşturan maddeler, ülke
gruplarının ilgili BİT değişkenindeki ortalamaları ve genel olarak ülke gruplarının bütün BİT
değişkenlerindeki ortalamaları vardır. Daha sonra, ülke grupları için önerilen matematik ve
problem çözme modelleri, modellerde bulunan değişkenler arası (ayrı ve genel olarak) ilişki
büyüklükleri ve yönleri verilmiştir.
Not: Bu araştırmada, ülke grupları arası karşılaştırmalar yapılabilmesi için, standardize
edilmiş (standartlaştırılmış) BİT değişkenleri kullanılmıştır.

286
EKONOMİK, SOSYAL ve KÜLTÜREL DURUM
Değişkenleri Oluşturan Bileşenler 1. Anne ve babanın eğitim durumu 2. Anne ve babanın iş durumu 3. Ailenin gelir durumu 4. Evdeki kitap sayısı
0,061 0,084
-0,754-0,8
-0,6
-0,4
-0,2
0
0,2
0,4
AB Eski Üyeler AB Yeni Üyeler Türkiye
Ülke gruplarının Ekonomik, Sosyal ve Kültürel Durum ortalamaları.
BİLGİSAYARA İLİŞKİN TUTUM
Değişkeni Oluşturan Maddeler 1. Bir bilgisayarla çalışmak benim için çok önemlidir. 2. Bir bilgisayarla oynamanın ya da çalışmanın gerçekten eğlenceli olduğunu
düşünüyorum. 3. Bir bilgisayarı kullanıyorum çünkü çok ilgileniyorum. 4. Bilgisayarla çalışırken zamanın nasıl geçtiğini anlamıyorum.
-0,008 -0,019
0,182
-0,800
-0,600
-0,400
-0,200
0,000
0,200
0,400
AB Eski Üyeler AB Yeni Üyeler Türkiye
Ülke gruplarının Bilgisayara İlişkin Tutum ortalamaları.

287
1. INTERNET / EĞLENCE KULLANIMI
Değişkeni Oluşturan Maddeler
1. İnsanlar, nesneler ya da düşünceler hakkında bilgi aramak için İnternet.
2. Bilgisayar oyunları.
3. Bir grup veya ekip ile birlikte çalışmak için İnternet.
4. İnternet’ten yazılım indirmek (oyunlar dahil).
5. Müzik parçası indirmek için İnternet.
6. Elektronik haberleşme için bilgisayar (Örneğin: e-posta ya da sohbet siteleri).
-0,008
-0,221-0,235-0,250
-0,200
-0,150
-0,100
-0,050
0,000
0,050
AB Eski Üyeler AB Yeni Üyeler Türkiye
Ülke gruplarının Internet / Eğlence Kullanım ortalamaları.
-0,011
-0,224
-0,163
-0,250
-0,200
-0,150
-0,100
-0,050
0,000
0,050
AB Eski Üyeler AB Yeni Üyeler Türkiye
Öğrencilerin ekonomik, sosyal ve kültürel durumları ile bilgisayara ilişkin tutumlarının sabitlenmesi durumunda, ülke gruplarının Internet / Eğlence Kullanım ortalamaları.
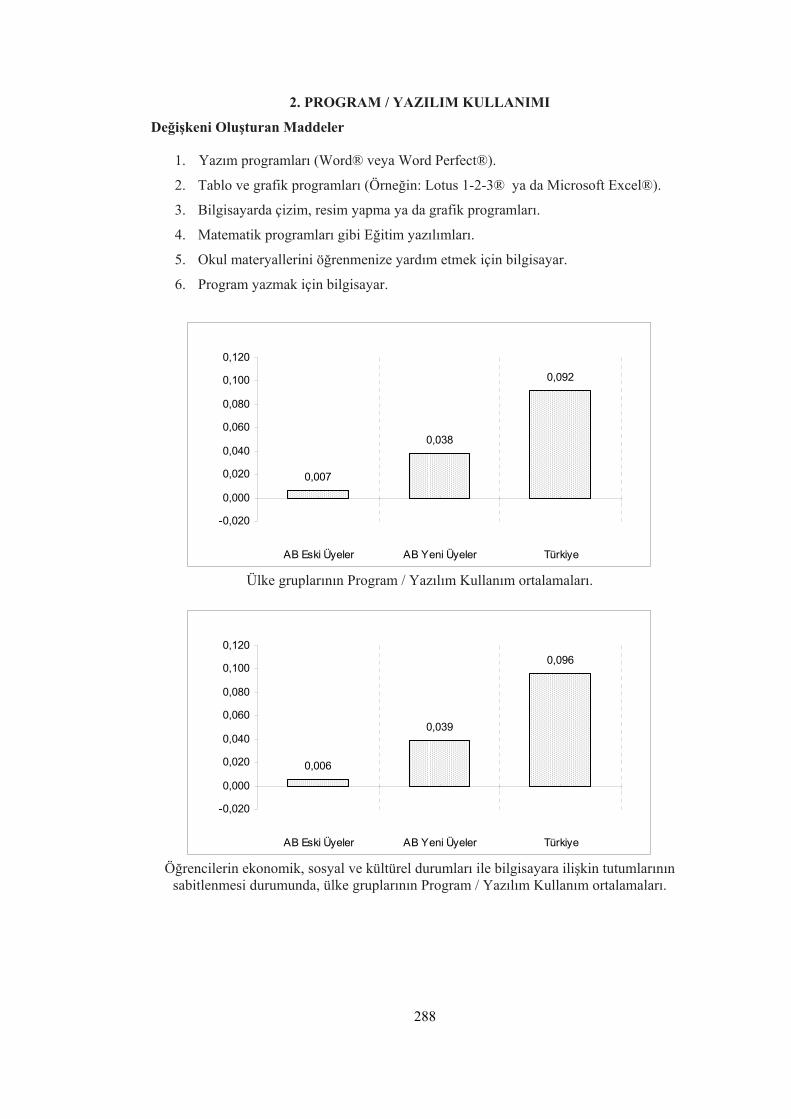
288
2. PROGRAM / YAZILIM KULLANIMI Değişkeni Oluşturan Maddeler
1. Yazım programları (Word® veya Word Perfect®).
2. Tablo ve grafik programları (Örneğin: Lotus 1-2-3® ya da Microsoft Excel®).
3. Bilgisayarda çizim, resim yapma ya da grafik programları.
4. Matematik programları gibi Eğitim yazılımları.
5. Okul materyallerini öğrenmenize yardım etmek için bilgisayar.
6. Program yazmak için bilgisayar.
0,007
0,038
0,092
-0,020
0,000
0,020
0,040
0,060
0,080
0,100
0,120
AB Eski Üyeler AB Yeni Üyeler Türkiye
Ülke gruplarının Program / Yazılım Kullanım ortalamaları.
0,006
0,039
0,096
-0,020
0,000
0,020
0,040
0,060
0,080
0,100
0,120
AB Eski Üyeler AB Yeni Üyeler Türkiye
Öğrencilerin ekonomik, sosyal ve kültürel durumları ile bilgisayara ilişkin tutumlarının sabitlenmesi durumunda, ülke gruplarının Program / Yazılım Kullanım ortalamaları.
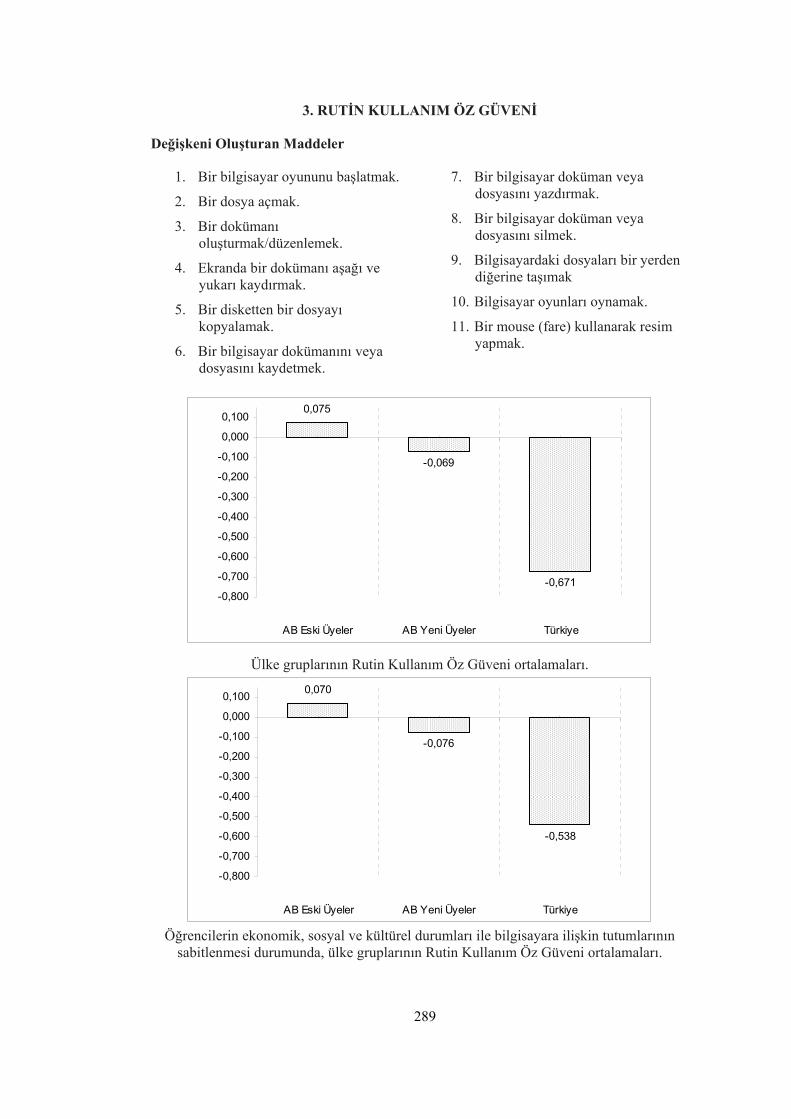
289
3. RUTİN KULLANIM ÖZ GÜVENİ
Değişkeni Oluşturan Maddeler
1. Bir bilgisayar oyununu başlatmak.
2. Bir dosya açmak.
3. Bir dokümanı oluşturmak/düzenlemek.
4. Ekranda bir dokümanı aşağı ve yukarı kaydırmak.
5. Bir disketten bir dosyayı kopyalamak.
6. Bir bilgisayar dokümanını veya dosyasını kaydetmek.
7. Bir bilgisayar doküman veya dosyasını yazdırmak.
8. Bir bilgisayar doküman veya dosyasını silmek.
9. Bilgisayardaki dosyaları bir yerden diğerine taşımak
10. Bilgisayar oyunları oynamak.
11. Bir mouse (fare) kullanarak resim yapmak.
0,075
-0,069
-0,671-0,800
-0,700
-0,600
-0,500
-0,400
-0,300
-0,200
-0,100
0,000
0,100
AB Eski Üyeler AB Yeni Üyeler Türkiye
Ülke gruplarının Rutin Kullanım Öz Güveni ortalamaları.
0,070
-0,076
-0,538
-0,800
-0,700
-0,600
-0,500
-0,400
-0,300
-0,200
-0,100
0,000
0,100
AB Eski Üyeler AB Yeni Üyeler Türkiye
Öğrencilerin ekonomik, sosyal ve kültürel durumları ile bilgisayara ilişkin tutumlarının sabitlenmesi durumunda, ülke gruplarının Rutin Kullanım Öz Güveni ortalamaları.

290
4. İNTERNET KULLANIM ÖZ GÜVENİ
Değişkeni Oluşturan Maddeler
1. İnternet’e girmek.
2. İnternet’ten dosyaları indirmek veya kopyalamak.
3. Bir e-posta mesajına dosya eklemek.
4. İnternet’ten müzik parçası indirmek.
5. E-posta mesajları yazmak ve göndermek.
-0,351
-0,503
-0,001
-0,600
-0,500
-0,400
-0,300
-0,200
-0,100
0,000
0,100
AB Eski Üyeler AB Yeni Üyeler Türkiye
Ülke gruplarının İnternet Kullanım Öz Güveni ortalamaları.
-0,360 -0,333
-0,007
-0,600
-0,500
-0,400
-0,300
-0,200
-0,100
0,000
0,100
AB Eski Üyeler AB Yeni Üyeler Türkiye
Öğrencilerin ekonomik, sosyal ve kültürel durumları ile bilgisayara ilişkin tutumlarının sabitlenmesi durumunda, ülke gruplarının İnternet Kullanım Öz Güveni ortalamaları.

291
5. İLERİ DÜZEY KULLANIM ÖZ GÜVENİ
Değişkeni Oluşturan Maddeler
1. Bilgisayar virüslerini bulmak ve onlardan kurtulmak.
2. Bir adres listesi oluşturmak için veritabanı kullanmak.
3. Bir bilgisayar programı yazmak (Örneğin: Logo, Pascal, Basic de).
4. Bir grafik çizmek için bir tablolama programı kullanmak.
5. Bir sunu hazırlamak (Örneğin: Microsoft PowerPoint kullanarak).
6. Çoklu-ortam sunusu hazırlamak (sesle, resimle, video ile).
7. Bir web sayfası oluşturmak.
0,003
-0,173-0,150
-0,200
-0,150
-0,100
-0,050
0,000
0,050
AB Eski Üyeler AB Yeni Üyeler Türkiye
Ülke gruplarının İleri Düzey Kullanım Öz Güveni ortalamaları.
0,003
-0,175
-0,092
-0,200
-0,150
-0,100
-0,050
0,000
0,050
AB Eski Üyeler AB Yeni Üyeler Türkiye
Öğrencilerin ekonomik, sosyal ve kültürel durumları ile bilgisayara ilişkin tutumlarının sabitlenmesi durumunda, ülke gruplarının İleri Düzey Kullanım Öz Güveni ortalamaları.

292
6. BİLGİSAYARA İLİŞKİN TUTUM
Değişkeni Oluşturan Maddeler
1. Bir bilgisayarla çalışmak benim için çok önemlidir.
2. Bir bilgisayarla oynamanın ya da çalışmanın gerçekten eğlenceli olduğunu düşünüyorum.
3. Bir bilgisayarı kullanıyorum çünkü çok ilgileniyorum.
4. Bilgisayarla çalışırken zamanın nasıl geçtiğini anlamıyorum.
-0,008 -0,019
0,182
-0,050
0,000
0,050
0,100
0,150
0,200
0,250
AB Eski Üyeler AB Yeni Üyeler Türkiye
Ülke gruplarının Bilgisayara İlişkin Tutum ortalamaları.
-0,009-0,021
0,213
-0,050
0,000
0,050
0,100
0,150
0,200
0,250
AB Eski Üyeler AB Yeni Üyeler Türkiye
Öğrencilerin ekonomik, sosyal ve kültürel durumlarının sabitlenmesi durumunda, ülke gruplarının Bilgisayara İlişkin Tutum ortalamaları.

293
ÜLK
E G
RU
PLA
RI B
İT O
RTA
LAM
ALA
RI
-0,0
08
-0,2
21-0
,235
0,00
70,
038
0,09
20,
075
-0,0
69
-0,0
01
-0,3
51
0,00
3
-0,1
73-0
,150
-0,0
08-0
,019
0,18
2
-0,5
03
-0,6
71-0
,800
-0,7
00-0
,600
-0,5
00-0
,400
-0,3
00-0
,200
-0,1
000,
000
0,10
00,
200
0,30
0
AB
Eski
Üyel
erA
B Y
eni
Üyel
erTü
rkiy
eA
B Es
kiÜy
eler
AB
Yen
iÜy
eler
Türk
iye
AB
Eski
Üyel
erA
B Y
eni
Üyel
erTü
rkiy
eA
B Es
kiÜy
eler
AB
Yen
iÜy
eler
Türk
iye
AB
Eski
Üyel
erA
B Y
eni
Üyel
erTü
rkiy
eA
B Es
kiÜy
eler
AB
Yen
iÜy
eler
Türk
iye
İnte
rnet
/ Eğ
lenc
e Ku
llanı
mı
Prog
ram
/ Y
azılım
Kul
lanı
mı
Rutin
Kul
lanı
m Ö
z G
üven
iİn
tern
et K
ulla
nım
Öz
Güv
eni
İleri
Düze
y Ku
llanı
m Ö
zG
üven
iBi
lgis
ayar
a İliş
kin T
utum
Bu
çalışm
a ka
psamın
da b
ütün
BİT
değ
işken
leri
gene
l ola
rak
dikk
ate
alın
dığı
nda,
AB
üyel
er P
ISA
200
3 ul
usla
r ara
sı or
tala
may
a en
yakın
; AB
yeni
üye
ler P
ISA
200
3 ul
usla
r
arası o
rtala
mad
an b
iraz
daha
uza
klaş
an; T
ürki
ye is
e PI
SA 2
003
ulus
lar a
rası
orta
lam
adan
en
çok
uzak
laşa
n ül
ke g
rubu
dur.
AB
üyel
erde
yaş
ayan
öğr
enci
ler,
BİT’
i dah
a sık
kulla
nmak
tadı
rlar
ve B
İT k
ulla
nım
özg
üven
leri
daha
yük
sekt
ir. B
u bağl
amda
, ül
ke g
rupl
arının
orta
lam
adan
uza
klaş
ma
büyü
klüğ
ü, u
lusla
r ar
ası
orta
lam
adan
ne
kada
r
ayrış
tığını g
öste
rir.
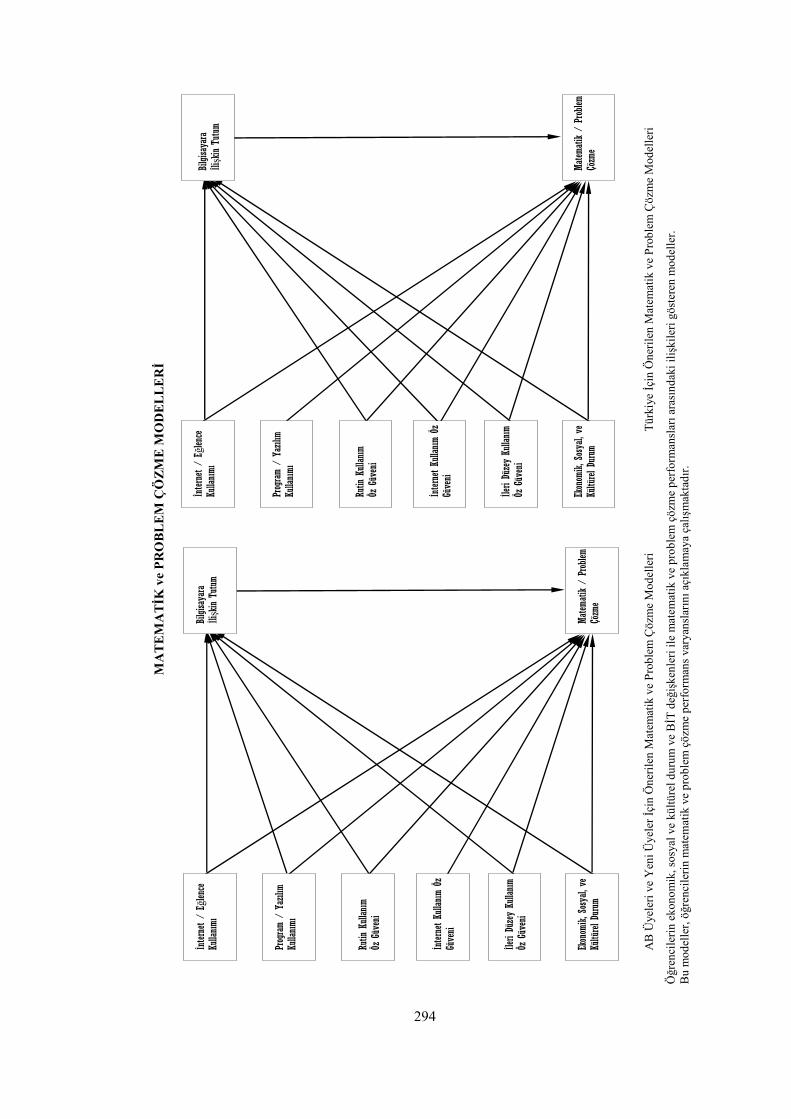
294
Prog
ram
/ Ya
zılım
Ku
llanımı
Ru
tin K
ullanım
Öz
Güv
eni
İn
tern
et K
ullanım
Öz
Güve
ni
İle
ri Dü
zey
Kulla
nım
Öz G
üven
i
Bilgi
saya
ra
İlişk
in T
utum
Matem
atik
/ Pr
oblem
Çö
zme
İntern
et /
Eğl
ence
Ku
llanımı
Ekon
omik, S
osya
l, ve
Kü
ltürel D
urum
Prog
ram
/ Ya
zılım
Ku
llanımı
Ru
tin K
ullanım
Öz
Güv
eni
İn
tern
et K
ullanım
Öz
Güve
ni
İle
ri Dü
zey
Kulla
nım
Öz G
üven
i
Bilgi
saya
ra
İlişk
in T
utum
Matem
atik /
Problem
Çö
zme
İntern
et /
Eğl
ence
Ku
llanımı
Ekon
omik, S
osya
l, ve
Kü
ltürel D
urum
MA
TE
MA
TİK
ve
PRO
BL
EM
ÇÖ
ZME
MO
DE
LL
ERİ
A
B Ü
yele
ri ve
Yen
i Üye
ler İ
çin
Öne
rilen
Mat
emat
ik v
e Pr
oble
m Ç
özm
e M
odel
leri
Türk
iye İç
in Ö
neril
en M
atem
atik
ve
Prob
lem
Çöz
me
Mod
elle
ri
Öğr
enci
lerin
eko
nom
ik, s
osya
l ve
kültü
rel d
urum
ve
BİT
değ
işke
nler
i ile
mat
emat
ik v
e pr
oble
m ç
özm
e pe
rform
ansl
arı a
rası
ndak
i iliş
kile
ri gö
ster
en m
odel
ler.
Bu
mod
elle
r, öğ
renc
ilerin
mat
emat
ik v
e pr
oble
m ç
özm
e pe
rfor
man
s var
yans
larını a
çıkl
amay
a ça
lışm
akta
dır.

295
INTERNET / EĞLENCE KULLANIMI Değişkeni Oluşturan Maddeler
1. İnsanlar, nesneler ya da düşünceler hakkında bilgi aramak için İnternet. 2. Bilgisayar oyunları. 3. Bir grup veya ekip ile birlikte çalışmak için İnternet. 4. İnternet’ten yazılım indirmek (oyunlar dahil). 5. Müzik parçası indirmek için İnternet. 6. Elektronik haberleşme için bilgisayar (Örneğin: e-posta ya da sohbet siteleri).
Matematik Modeli
-0,05
-0,12
-0,04
-0,25
-0,20
-0,15
-0,10
-0,05
0,00
0,05
AB Eski Üyeler AB Yeni Üyeler Türkiye
İnternet / Eğlence Kullanımı ile Matematik performansı arasındaki ilişkinin ülke
gruplarındaki büyüklükleri ve yönleri. Problem Çözme Modeli
-0,09
-0,13
-0,10
-0,25
-0,20
-0,15
-0,10
-0,05
0,00
0,05
AB Eski Üyeler AB Yeni Üyeler Türkiye
İnternet / Eğlence Kullanımı ile Problem Çözme performansı arasındaki ilişkinin ülke
gruplarındaki büyüklükleri ve yönleri. Bütün ülke grupları için, öğrencilerin İnternet/Eğlence kullanımı ile matematik ve problem çözme performansları arasında negatif ve küçük düzeyde ilişki vardır. Bir başka deyişle, İnternet/Eğlence kullanımı arttıkça matematik ve problem çözme performanslarının azaldığı söylenebilir.
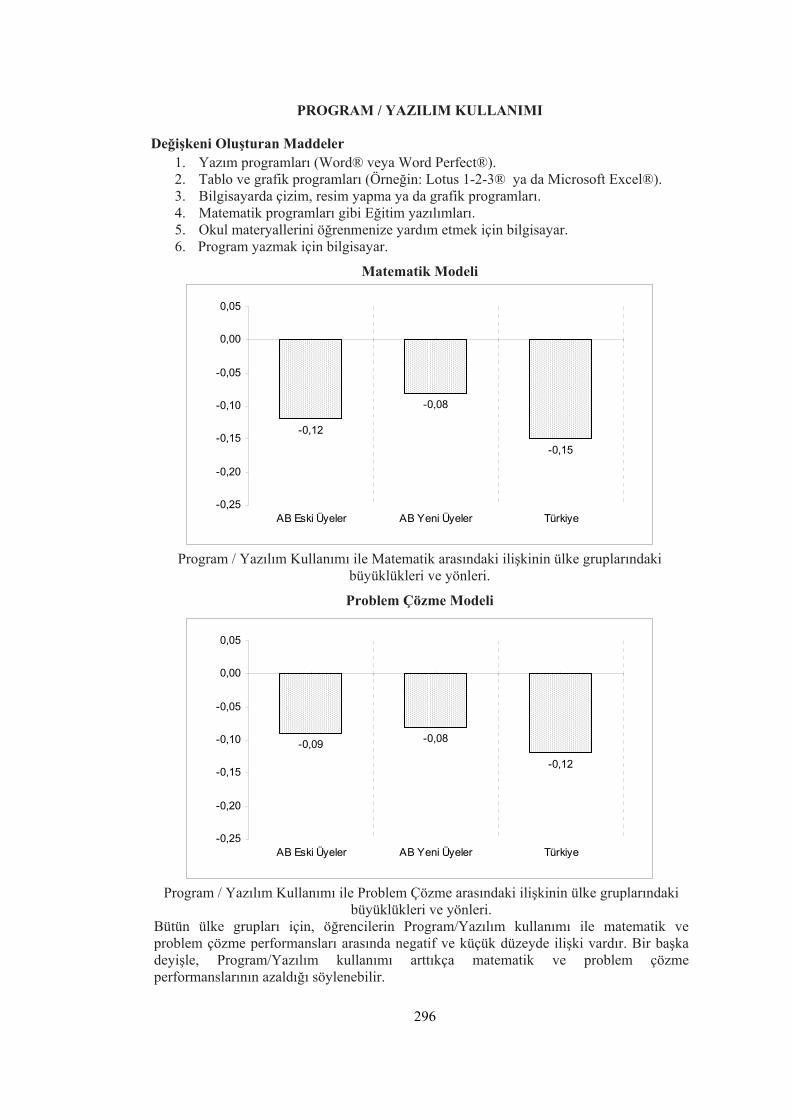
296
PROGRAM / YAZILIM KULLANIMI
Değişkeni Oluşturan Maddeler 1. Yazım programları (Word® veya Word Perfect®). 2. Tablo ve grafik programları (Örneğin: Lotus 1-2-3® ya da Microsoft Excel®). 3. Bilgisayarda çizim, resim yapma ya da grafik programları. 4. Matematik programları gibi Eğitim yazılımları. 5. Okul materyallerini öğrenmenize yardım etmek için bilgisayar. 6. Program yazmak için bilgisayar.
Matematik Modeli
-0,12
-0,08
-0,15
-0,25
-0,20
-0,15
-0,10
-0,05
0,00
0,05
AB Eski Üyeler AB Yeni Üyeler Türkiye
Program / Yazılım Kullanımı ile Matematik arasındaki ilişkinin ülke gruplarındaki
büyüklükleri ve yönleri.
Problem Çözme Modeli
-0,09 -0,08
-0,12
-0,25
-0,20
-0,15
-0,10
-0,05
0,00
0,05
AB Eski Üyeler AB Yeni Üyeler Türkiye
Program / Yazılım Kullanımı ile Problem Çözme arasındaki ilişkinin ülke gruplarındaki
büyüklükleri ve yönleri. Bütün ülke grupları için, öğrencilerin Program/Yazılım kullanımı ile matematik ve problem çözme performansları arasında negatif ve küçük düzeyde ilişki vardır. Bir başka deyişle, Program/Yazılım kullanımı arttıkça matematik ve problem çözme performanslarının azaldığı söylenebilir.
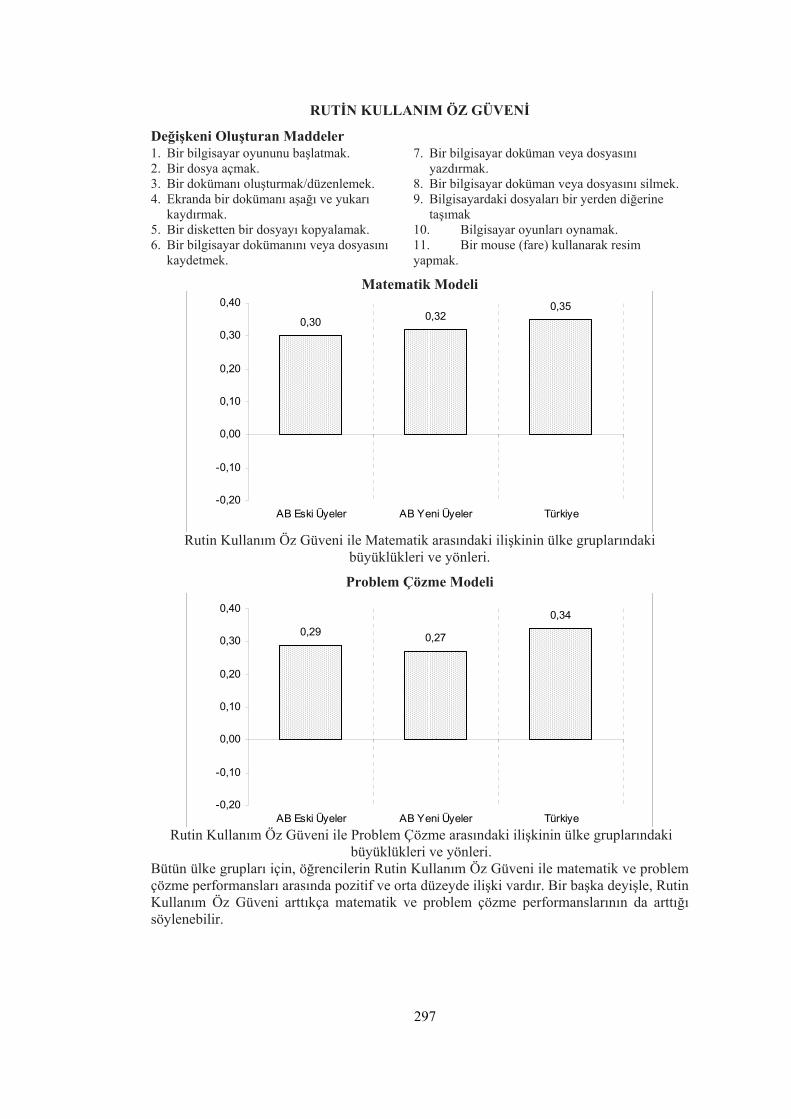
297
RUTİN KULLANIM ÖZ GÜVENİ
Değişkeni Oluşturan Maddeler 1. Bir bilgisayar oyununu başlatmak. 2. Bir dosya açmak. 3. Bir dokümanı oluşturmak/düzenlemek. 4. Ekranda bir dokümanı aşağı ve yukarı
kaydırmak. 5. Bir disketten bir dosyayı kopyalamak. 6. Bir bilgisayar dokümanını veya dosyasını
kaydetmek.
7. Bir bilgisayar doküman veya dosyasını yazdırmak.
8. Bir bilgisayar doküman veya dosyasını silmek. 9. Bilgisayardaki dosyaları bir yerden diğerine
taşımak 10. Bilgisayar oyunları oynamak. 11. Bir mouse (fare) kullanarak resim yapmak.
Matematik Modeli
0,30 0,320,35
-0,20
-0,10
0,00
0,10
0,20
0,30
0,40
AB Eski Üyeler AB Yeni Üyeler Türkiye
Rutin Kullanım Öz Güveni ile Matematik arasındaki ilişkinin ülke gruplarındaki büyüklükleri ve yönleri.
Problem Çözme Modeli
0,29 0,27
0,34
-0,20
-0,10
0,00
0,10
0,20
0,30
0,40
AB Eski Üyeler AB Yeni Üyeler Türkiye Rutin Kullanım Öz Güveni ile Problem Çözme arasındaki ilişkinin ülke gruplarındaki
büyüklükleri ve yönleri. Bütün ülke grupları için, öğrencilerin Rutin Kullanım Öz Güveni ile matematik ve problem çözme performansları arasında pozitif ve orta düzeyde ilişki vardır. Bir başka deyişle, Rutin Kullanım Öz Güveni arttıkça matematik ve problem çözme performanslarının da arttığı söylenebilir.
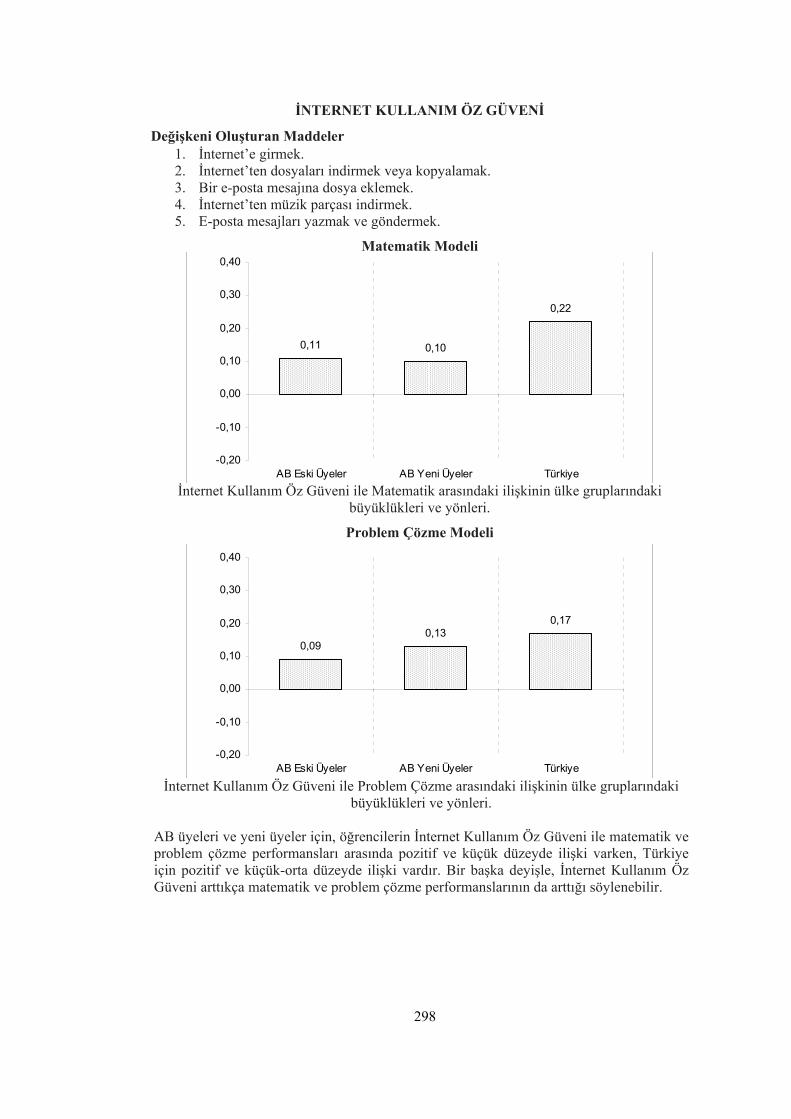
298
İNTERNET KULLANIM ÖZ GÜVENİ
Değişkeni Oluşturan Maddeler 1. İnternet’e girmek. 2. İnternet’ten dosyaları indirmek veya kopyalamak. 3. Bir e-posta mesajına dosya eklemek. 4. İnternet’ten müzik parçası indirmek. 5. E-posta mesajları yazmak ve göndermek.
Matematik Modeli
0,11 0,10
0,22
-0,20
-0,10
0,00
0,10
0,20
0,30
0,40
AB Eski Üyeler AB Yeni Üyeler Türkiye İnternet Kullanım Öz Güveni ile Matematik arasındaki ilişkinin ülke gruplarındaki
büyüklükleri ve yönleri.
Problem Çözme Modeli
0,090,13
0,17
-0,20
-0,10
0,00
0,10
0,20
0,30
0,40
AB Eski Üyeler AB Yeni Üyeler Türkiye İnternet Kullanım Öz Güveni ile Problem Çözme arasındaki ilişkinin ülke gruplarındaki
büyüklükleri ve yönleri.
AB üyeleri ve yeni üyeler için, öğrencilerin İnternet Kullanım Öz Güveni ile matematik ve problem çözme performansları arasında pozitif ve küçük düzeyde ilişki varken, Türkiye için pozitif ve küçük-orta düzeyde ilişki vardır. Bir başka deyişle, İnternet Kullanım Öz Güveni arttıkça matematik ve problem çözme performanslarının da arttığı söylenebilir.

299
İLERİ DÜZEY KULLANIM ÖZ GÜVENİ
Değişkeni Oluşturan Maddeler 1. Bilgisayar virüslerini bulmak ve onlardan kurtulmak. 2. Bir adres listesi oluşturmak için veritabanı kullanmak. 3. Bir bilgisayar programı yazmak (Örneğin: Logo, Pascal, Basic de). 4. Bir grafik çizmek için bir tablolama programı kullanmak. 5. Bir sunu hazırlamak (Örneğin: Microsoft PowerPoint kullanarak). 6. Çoklu-ortam sunusu hazırlamak (sesle, resimle, video ile). 7. Bir web sayfası oluşturmak.
Matematik Modeli
-0,09 -0,08
-0,34-0,40
-0,35
-0,30
-0,25
-0,20
-0,15
-0,10
-0,05
0,00
0,05
AB Eski Üyeler AB Yeni Üyeler Türkiye
İleri Düzey Kullanım Öz Güveni ile Matematik arasındaki ilişkinin ülke gruplarındaki büyüklükleri ve yönleri.
Problem Çözme Modeli
-0,19-0,15
-0,27
-0,40
-0,35
-0,30
-0,25
-0,20
-0,15
-0,10
-0,05
0,00
0,05
AB Eski Üyeler AB Yeni Üyeler Türkiye
İleri Düzey Kullanım Öz Güveni ile Problem Çözme arasındaki ilişkinin ülke gruplarındaki büyüklükleri ve yönleri.
AB üyeler ve yeni üyeler için, öğrencilerin İleri Düzey Kullanım Öz Güveni ile matematik ve problem çözme performansları arasında negatif ve küçük düzeyde ilişki varken, Türkiye için negatif ve orta düzeyde ilişki vardır. Bir başka deyişle, İleri Düzey Kullanım Öz Güveni azaldıkça matematik ve problem çözme performanslarının da azaldığı söylenebilir.
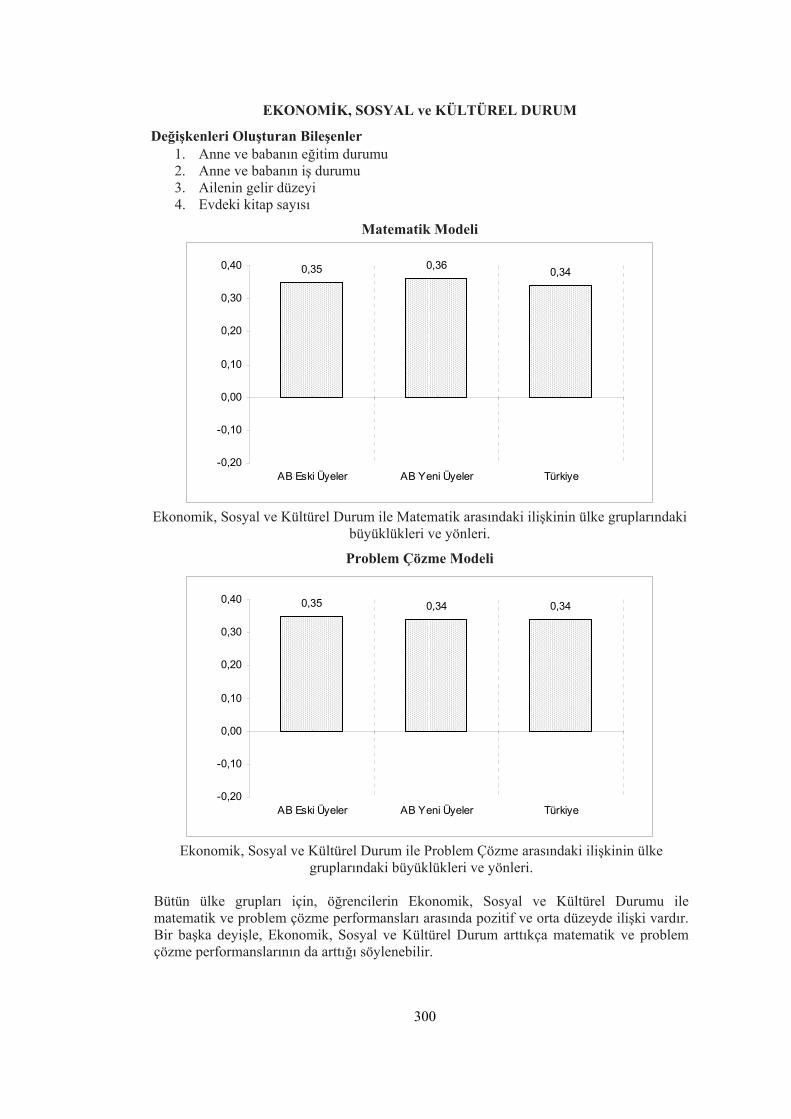
300
EKONOMİK, SOSYAL ve KÜLTÜREL DURUM
Değişkenleri Oluşturan Bileşenler 1. Anne ve babanın eğitim durumu 2. Anne ve babanın iş durumu 3. Ailenin gelir düzeyi 4. Evdeki kitap sayısı
Matematik Modeli
0,35 0,36 0,34
-0,20
-0,10
0,00
0,10
0,20
0,30
0,40
AB Eski Üyeler AB Yeni Üyeler Türkiye
Ekonomik, Sosyal ve Kültürel Durum ile Matematik arasındaki ilişkinin ülke gruplarındaki
büyüklükleri ve yönleri.
Problem Çözme Modeli
0,35 0,34 0,34
-0,20
-0,10
0,00
0,10
0,20
0,30
0,40
AB Eski Üyeler AB Yeni Üyeler Türkiye
Ekonomik, Sosyal ve Kültürel Durum ile Problem Çözme arasındaki ilişkinin ülke
gruplarındaki büyüklükleri ve yönleri.
Bütün ülke grupları için, öğrencilerin Ekonomik, Sosyal ve Kültürel Durumu ile matematik ve problem çözme performansları arasında pozitif ve orta düzeyde ilişki vardır. Bir başka deyişle, Ekonomik, Sosyal ve Kültürel Durum arttıkça matematik ve problem çözme performanslarının da arttığı söylenebilir.

301
MO
DEL
LER
DEK
İ DEĞ
İŞK
ENLE
RİN
İLİŞ
Kİ B
ÜY
ÜK
LÜK
LERİ V
E Y
ÖN
LERİ
MATEMATİK MODELİ
-0,0
5-0
,12
-0,0
4-0
,12
-0,0
8-0
,15
0,30
0,32
0,11
0,10
-0,0
9-0
,08
-0,3
4
0,35
0,36
0,34
0,22
0,35
-0,4
0
-0,2
0
0,00
0,20
0,40
PROBLEM ÇÖZME MODELİ
-0,0
9-0
,13
-0,1
0-0
,09
-0,0
8-0
,12
0,29
0,27
0,09
0,13
-0,1
9-0
,15
-0,2
7
0,35
0,34
0,34
0,34
0,17
-0,4
0
-0,2
0
0,00
0,20
0,40
AB
Eski
Üyel
erA
B Y
eni
Üyel
erTü
rkiy
eA
B Es
kiÜy
eler
AB
Yen
iÜy
eler
Türk
iye
AB
Eski
Üyel
erA
B Y
eni
Üyel
erTü
rkiy
eA
B Es
kiÜy
eler
AB
Yen
iÜy
eler
Türk
iye
AB
Eski
Üyel
erA
B Y
eni
Üyel
erTü
rkiy
eA
B Es
kiÜy
eler
AB
Yen
iÜy
eler
Türk
iye
İnte
rnet
/ Eğ
lenc
e Ku
llanı
mı
Prog
ram
/ Y
azılım
Kul
lanı
mı
Rutin
Kul
lanı
m Ö
z G
üven
iİn
tern
et K
ulla
nım
Öz
Güv
eni
İleri
Düze
y Ku
llanı
m Ö
zG
üven
iEk
onom
ik, S
osya
l ve
Kültü
rel D
urum
Değ
işken
ler,
ilişk
i yön
ü ve
büy
üklü
kler
i açı
sında
n ül
ke g
rupl
arı i
çin
gene
l ola
rak
karşılaştı
rıldığı
nda
mat
emat
ik v
e pr
oble
m ç
özm
e m
odel
i par
alel
lik g
öste
rmek
tedi
r. Bu
nun
anla
mı,
yapı
laca
k yo
rum
lar h
er ik
i mod
el iç
in d
e ge
çerli
dir.
Değ
işken
lerin
hep
si di
kkat
e alın
dığı
nda,
öğr
enci
lerin
mat
emat
ik v
e pr
oble
m ç
özm
e pe
rform
ansla
rıyla
bu
değişk
enle
rin a
rasın
daki
ilişk
iler k
üçük
-orta
düz
eyde
ve
pozi
tif y
a da
neg
atif
olduğu
göz
lenm
ekte
dir.

302
APPENDIX E
THE PERMISSION DOCUMENT
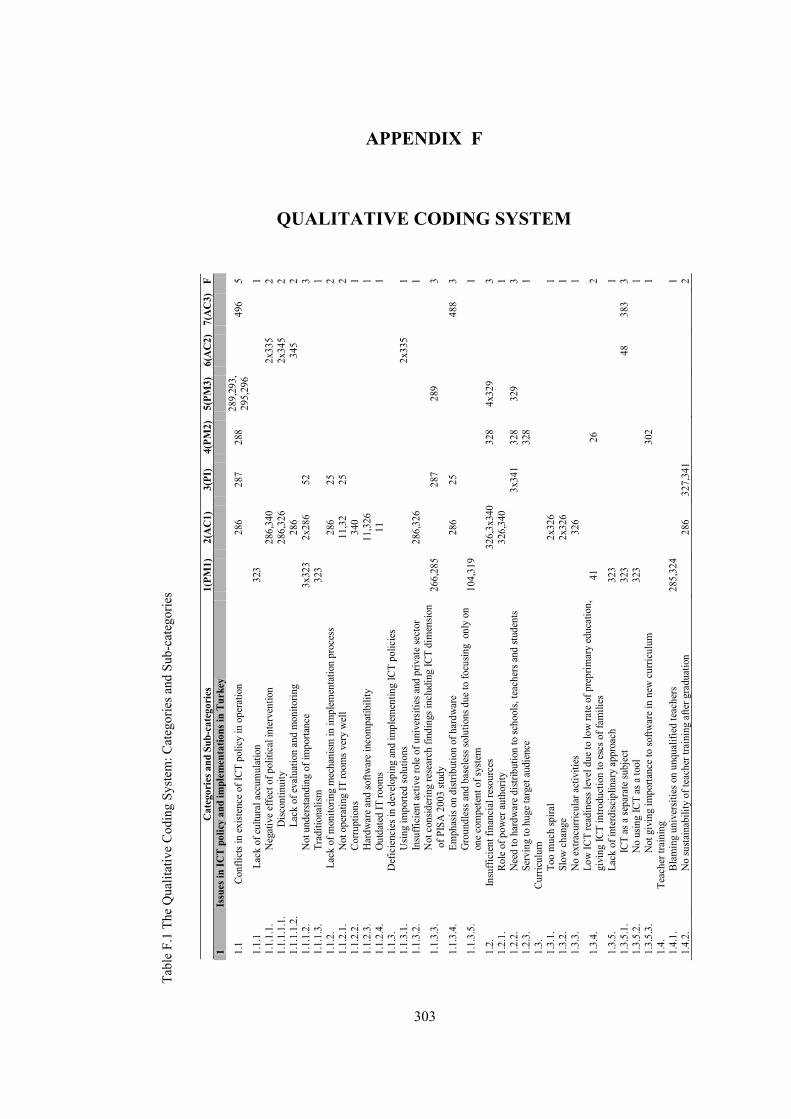
303
APPENDIX F
QUALITATIVE CODING SYSTEM
Tabl
e F.
1 Th
e Q
ualit
ativ
e C
odin
g Sy
stem
: Cat
egor
ies a
nd S
ub-c
ateg
orie
s
C
ateg
orie
s and
Sub
-cat
egor
ies
1(PM
1)2(
AC
1)
3(PI
) 4(
PM2)
5(PM
3)
6(A
C2)
7(
AC
3)F
1 Is
sues
in IC
T po
licy
and
impl
emen
tatio
ns in
Tur
key
1.1
Co
nflic
ts in
exi
stenc
e of
ICT
polic
y in
ope
ratio
n
28
6 28
7 28
8 28
9,29
3,
295,
296
49
6 5
1.1.
1
Lack
of c
ultu
ral a
ccum
ulat
ion
323
1 1.
1.1.
1.
N
egat
ive
effe
ct o
f pol
itica
l int
erve
ntio
n
28
6,34
0
2x33
5
2 1.
1.1.
1.1.
D
iscon
tinui
ty
28
6,32
6
2x34
5
2 1.
1.1.
1.2.
L
ack
of e
valu
atio
n an
d m
onito
ring
28
6
345
2
1.1.
1.2.
Not
und
ersta
ndin
g of
impo
rtanc
e 3x
323
2x28
6 52
3
1.1.
1.3.
Tra
ditio
nalis
m
323
1 1.
1.2.
Lack
of m
onito
ring
mec
hani
sm in
impl
emen
tatio
n pr
oces
s
286
25
2 1.
1.2.
1.
N
ot o
pera
ting
IT ro
oms v
ery
wel
l
11,3
2 25
2
1.1.
2.2.
Cor
rupt
ions
340
1
1.1.
2.3.
Har
dwar
e an
d so
ftwar
e in
com
patib
ility
11,3
26
1
1.1.
2.4.
Out
date
d IT
room
s
11
1
1.1.
3.
Def
icie
ncie
s in
deve
lopi
ng a
nd im
plem
entin
g IC
T po
licie
s
1.
1.3.
1.
U
sing
impo
rted
solu
tions
2x33
5
1 1.
1.3.
2.
In
suffi
cien
t act
ive
role
of u
nive
rsiti
es a
nd p
rivat
e se
ctor
286,
326
1
1.1.
3.3.
Not
con
sider
ing
rese
arch
find
ings
incl
udin
g IC
T di
men
sion
o
f PIS
A 2
003
study
26
6,28
5
287
28
9
3
1.1.
3.4.
Em
phas
is on
dist
ribut
ion
of h
ardw
are
28
6 25
488
3
1.1.
3.5.
Gro
undl
ess a
nd b
asel
ess s
olut
ions
due
to fo
cusin
g o
nly
on
o
ne c
ompe
tent
of s
yste
m
104,
319
1
1.2.
I
nsuf
ficie
nt fi
nanc
ial r
esou
rces
326,
3x34
0
328
4x32
9
3
1.2.
1.
Rol
e of
pow
er a
utho
rity
32
6,34
0
1 1.
2.2.
N
eed
to h
ardw
are
distr
ibut
ion
to sc
hool
s, te
ache
rs a
nd st
uden
ts
3x
341
328
329
3 1.
2.3.
S
ervi
ng to
hug
e ta
rget
aud
ienc
e
328
1
1.3.
C
urric
ulum
1.
3.1.
T
oo m
uch
spira
l
2x32
6
1 1.
3.2.
S
low
cha
nge
2x32
6
1 1.
3.3.
N
o ex
tracu
rricu
lar a
ctiv
ities
326
1
1.3.
4.
Low
ICT
read
ines
s lev
el d
ue to
low
rate
of p
repr
imar
y ed
ucat
ion,
giv
ing
ICT
intro
duct
ion
to e
scs o
f fam
ilies
41
26
2
1.3.
5.
Lac
k of
inte
rdisc
iplin
ary
appr
oach
32
3
1
1.3.
5.1.
ICT
as a
sepa
rate
subj
ect
323
48
383
3 1.
3.5.
2.
N
o us
ing
ICT
as a
tool
32
3
1
1.3.
5.3.
Not
giv
ing
impo
rtanc
e to
softw
are
in n
ew c
urric
ulum
302
1
1.4.
T
each
er tr
aini
ng
1.4.
1.
Bla
min
g un
iver
sitie
s on
unqu
alifi
ed te
ache
rs
285,
324
1 1.
4.2.
N
o su
stain
abili
ty o
f tea
cher
trai
ning
afte
r gra
duat
ion
286
327,
341
2

304
C
ateg
orie
s and
Sub
-cat
egor
ies
1(PM
1)
2(A
C1)
3(
PI)
4(PM
2)
5(PM
3)
6(A
C2)
7(
AC
3)
F 2
Sugg
estio
ns to
ICT
polic
y an
d im
plem
enta
tions
in T
urke
y
2.
1.
Sou
nd a
nd c
erta
in d
ecisi
on o
n po
licy
2x
345
1
2.1.
1.
M
akin
g a
long
term
ICT
polic
y th
roug
h se
tting
mac
ro g
oal f
or 1
0-15
yea
r
342
2x49
6 2
2.1.
1.1.
W
hat t
o be
don
e
49
6 1
2.1.
1.2.
W
hat d
ecisi
ons t
o be
take
n
49
6 1
2.1.
1.3.
W
hat k
ind
of re
sear
ches
to b
e co
nduc
ted
325
49
6 2
2.1.
1.4.
W
hat a
re th
e ne
eds
496
1 2.
2.
Fre
e fro
m p
oliti
cal i
nter
vent
ion
345
1
2.3.
C
ontin
uity
in p
olic
y an
d its
impl
emen
tatio
ns
2x
345
1
2.4.
F
ollo
wed
stric
tly to
pol
icy
and
its im
plem
enta
tions
345
1
2.5.
E
valu
atio
n of
com
plet
ed p
olic
y im
plem
enta
tions
2x34
5
1 2.
6.
Fill
ing
the
gap
arisi
ng fr
om so
cial
, eco
nom
ic a
nd c
ultu
ral o
f stu
dent
s thr
ough
giv
ing
ICT
educ
atio
n at
scho
ol
13
337
488
3 2.
6.1.
Prov
idin
g co
mpu
ter a
nd in
tern
et a
vaila
bilit
y at
scho
ols
11
4 48
8 2
2.7.
S
yste
m a
ppro
ach
in IC
T in
tegr
atio
n in
to e
duca
tion
171,
3x31
9
27
0
2
2.7.
1.
Re
visin
g th
e com
pone
nts o
f edu
catio
n sy
stem
(cur
ricul
um, t
each
er e
duca
tion,
scho
ol st
ruct
ure
and
lear
ning
en
viro
nmen
ts)
104
1
2.8.
K
now
ing
TR re
ality
and
taki
ng m
easu
res p
ecul
iar t
o TR
thro
ugh
rese
arch
es
33
7
1 2.
8.1.
Coop
erat
ion
betw
een
MO
NE,
rese
arch
insti
tutio
ns a
nd u
nive
rsiti
es
325
326
34
2
337
4
2.8.
2.
Ch
argi
ng e
xper
ts in
ICT
rela
ted
task
s
326,
340
1
2.8.
3.
Sh
arin
g re
spon
sibili
ties
323
342
2
2.8.
4.
Pl
anni
ng, i
mpl
emen
ting
and
rese
arch
ing
50
0 1
2.8.
5.
Re
quiri
ng tr
ansf
orm
atio
n 32
3
33
5
2 2.
8.6.
Taki
ng ti
me
33
5
1 2.
9.
Cur
ricul
um
2.9.
1.
Re
quiri
ng IC
T as
qua
lific
atio
n in
com
pulso
ry e
duca
tion
76,1
71
1 2.
9.2.
ICT
inte
grat
ion
acro
ss c
urric
ulum
2.9.
2.1.
U
tiliz
ing
ICT
as a
tool
thro
ugh
refo
rmin
g th
e al
l cur
ricul
um
9,50
,76,
2x
319,
323
2x
341
288
66
,337
48
8,49
2,49
6 5
2.9.
2.2.
P
uttin
g co
mpu
ters
into
cla
ssro
oms
50
48
8 2
2.9.
2.3.
N
eces
sity
of te
ache
rs g
radu
ated
fro
m C
EIT
to in
tegr
ate
ICT
496
1
2.9.
2.3.
1.
Tra
nsfo
rmin
g ro
le o
f com
pute
r tea
cher
into
coo
rdin
ator
teac
her t
o su
ppor
t tea
cher
s and
dev
elop
in
struc
tiona
l mat
eria
ls
48
8 1
2.9.
2.4.
In
cent
ives
to fu
nctio
nal c
ompu
ter u
se in
hom
ewor
k an
d pr
ojec
ts 10
,39,
50
1 2.
9.2.
5.
Incr
easin
g ra
te o
f pre
prim
ary
educ
atio
n in
ord
er p
artic
ular
ly to
intro
duce
ICT
in a
soun
d w
ay
41
26
2
2.9.
3.
Im
prov
ing
ICT
cour
se a
s a se
para
te su
bjec
t
2.
9.3.
1.
Incr
easin
g co
mpu
ter c
ours
e nu
mbe
r or h
ours
in th
e cu
rricu
lum
8,
39
1
2.9.
3.2.
P
repa
ring
a co
mpu
ter c
urric
ulum
ass
ocia
ting
virtu
al a
nd re
al li
fe
140,
34
1
1
Tabl
e F.
1 C
ontin
ued.

305
C
ateg
orie
s and
Sub
-cat
egor
ies
1(PM
1)
2(A
C1)
3(
PI)
4(PM
2)5(
PM3)
6(A
C2)
7(
AC
3)
F 2.
10.
Tea
cher
trai
ning
2.
10.1
.
In-s
ervi
ce
2.10
.1.1
.
Sh
arin
g ed
ucat
iona
l exp
erie
nces
and
reso
urce
s thr
ough
onl
ine
inte
ract
ion
at p
rovi
nce
leve
l 76
1
2.10
.1.2
.
In
crea
sing
teac
her t
rain
ing
8,39
,339
341
2 2.
10.1
.3
Orie
ntin
g to
war
d co
mpu
ter u
se a
s com
plet
e m
anag
emen
t too
l by
subj
ect t
each
ers
496
1 2.
10.2
Pres
ervi
ce
2.10
.2.1
.
Em
ploy
ing
teac
hers
with
ICT
qual
ifica
tions
by
univ
ersit
ies
17,3
x339
1
2.11
.
P
ositi
ve e
ffect
s of C
EIT
grad
uate
s on
softw
are
deve
lopm
ent
2x
326
383
2 3
Perc
eptu
al E
valu
atio
n of
ICT
Asp
ects
3.
1.
A
ttitu
des t
owar
d co
mpu
ters
3.
1.1.
C
ultu
ral c
hara
cter
istic
s
3.
1.1.
1.
R
emin
isce
nt o
f ent
erta
inm
ent a
nd g
ratif
icat
ion
50
106
107
108
4 3.
1.1.
2.
M
ore
incl
inat
ion
to te
chno
logy
than
oth
ers
39
114
2
3.1.
1.2.
1.
Lea
rnin
g te
chno
logy
by
trial
-erro
r app
roac
h
11
4
1 3.
1.1.
2.2.
N
o fe
ar o
f usin
g co
mpu
ter
120
1
3.1.
1.2.
3.
Rap
idly
ada
ptat
ion
to c
ompu
ter
12
0
1 3.
1.1.
2.4.
L
iken
ess t
o co
mpu
ter
108
40
1 2
3.1.
2.
Low
eco
nom
ic c
ondi
tions
3.
1.2.
1.
H
ungr
ines
s to
com
pute
r 13
,39
2x13
5
10
8 11
0,11
4
4 3.
1.2.
1.1.
E
xtra
asp
iratio
n 7,
8 13
5 26
9
108
110,
114
480
6 3.
1.2.
1.2.
E
xtra
inte
rest
& c
urio
sity
to im
porte
d an
d po
pula
r tec
hnol
ogy
10
4
24,7
9,2x
105
10
8 11
4 44
7 5
3.1.
2.1.
3.
Imag
e of
com
pute
rs in
soci
ety
7,9,
104
11
24
130,
114,
112
4
3.1.
2.1.
4.
Stil
l per
ceiv
ing
com
pute
r use
as i
ndic
ator
of s
ocia
l cla
ss
10
7
1 3.
1.2.
1.5.
N
ot ro
utin
e, p
reva
lenc
e an
d av
aila
ble,
but
still
luxu
ry
13
5
1 3.
1.3.
A
ttach
ing
impo
rtanc
e to
pos
itive
atti
tude
s
3.1.
3.1.
Ta
king
adva
ntag
e of
pos
itive
atti
tude
s in
impr
ovin
g ot
her I
CT a
spec
ts 16
, 17
,39,
76,
104,
139
267
2
3.1.
3.2.
Re
adin
ess t
o IC
T us
e
267
1
3.2.
IC
T us
e
3.
2.1.
Inte
rnet
/ En
terta
inm
ent u
se
3.2.
1.1.
N
egat
ive
effe
cts o
f in
acce
ssib
ility
due
to lo
w w
elfa
re o
f TR
17
4x31
2 3.
2.2.
Prog
ram
/ so
ftwar
e us
e
3.
2.2.
1.
Ref
lect
ing
cont
ent o
f cur
ricul
um
26
7
47
3x
48,1
84
383,
492
4 3.
2.2.
2.
Pos
itive
effe
cts o
f com
pute
r tea
cher
on
prgu
se u
se in
TR
383,
496
1
Tabl
e F.
1 C
ontin
ued.
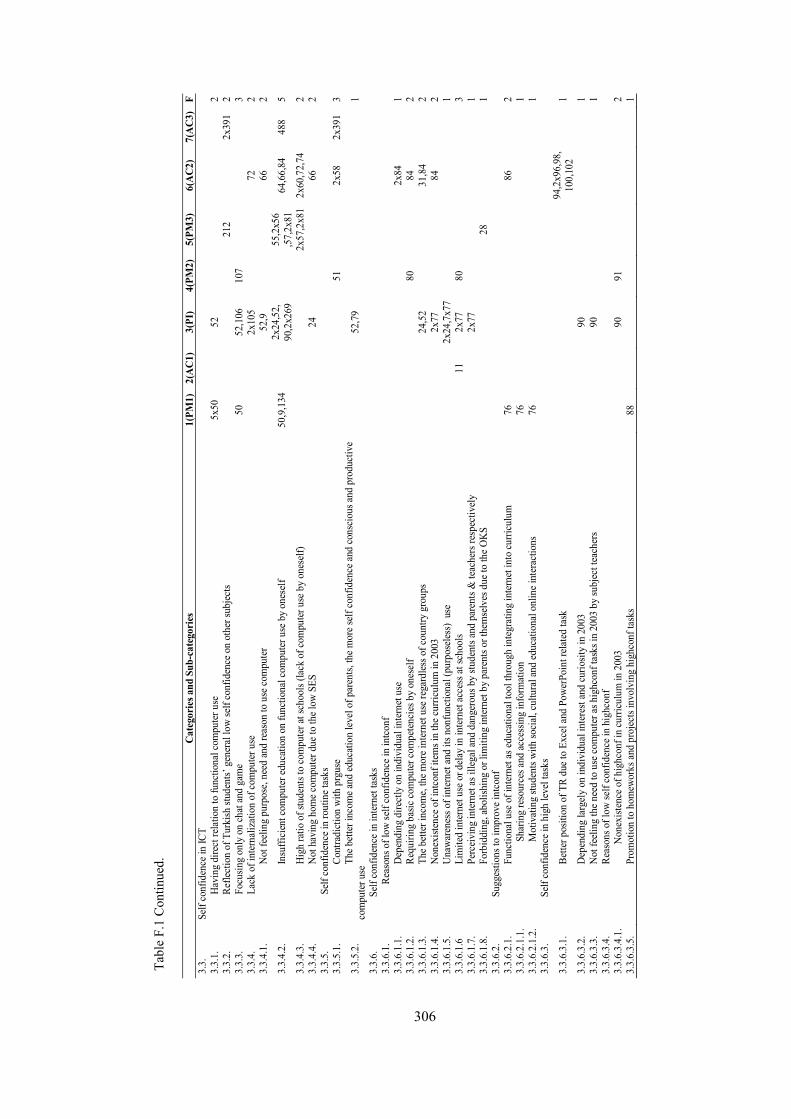
306
C
ateg
orie
s and
Sub
-cat
egor
ies
1(PM
1)
2(A
C1)
3(
PI)
4(PM
2)
5(PM
3)
6(A
C2)
7(
AC
3)
F 3.
3.
Self
conf
iden
ce in
ICT
3.3.
1.
H
avin
g di
rect
rela
tion
to fu
nctio
nal c
ompu
ter u
se
5x50
52
23.
3.2.
Ref
lect
ion
of T
urki
sh st
uden
ts’ g
ener
al lo
w se
lf co
nfid
ence
on
othe
r sub
ject
s
21
2
2x39
1 2
3.3.
3.
F
ocus
ing
only
on
chat
and
gam
e 50
52,1
06
107
3
3.3.
4.
L
ack
of in
tern
aliz
atio
n of
com
pute
r use
2x
105
72
2
3.3.
4.1.
Not
feel
ing
purp
ose,
need
and
reas
on to
use
com
pute
r
52
,9
66
2
3.3.
4.2.
Insu
ffici
ent c
ompu
ter e
duca
tion
on fu
nctio
nal c
ompu
ter u
se b
y on
esel
f 50
,9,1
34
2x24
,52,
90
,2x2
69
55
,2x5
6 ,5
7,2x
81
64,6
6,84
48
8 5
3.3.
4.3.
Hig
h ra
tio o
f stu
dent
s to
com
pute
r at s
choo
ls (la
ck o
f com
pute
r use
by
ones
elf)
2x57
,2x8
1 2x
60,7
2,74
23.
3.4.
4.
N
ot h
avin
g ho
me c
ompu
ter d
ue to
the l
ow S
ES
24
66
2
3.3.
5.
S
elf c
onfid
ence
in ro
utin
e tas
ks
3.3.
5.1.
Con
tradi
ctio
n w
ith p
rgus
e
51
2x
58
2x39
1 3
3.3.
5.2.
The
bet
ter i
ncom
e and
educ
atio
n le
vel o
f par
ents,
the m
ore s
elf c
onfid
ence
and
cons
ciou
s and
pro
duct
ive
com
pute
r use
52
,79
1
3.3.
6.
Se
lf co
nfid
ence
in in
tern
et ta
sks
3.3.
6.1.
R
easo
ns o
f low
self
conf
iden
ce in
intc
onf
3.3.
6.1.
1.
D
epen
ding
dire
ctly
on
indi
vidu
al in
tern
et u
se
2x
84
1
3.3.
6.1.
2.
R
equi
ring
basic
com
pute
r com
pete
ncie
s by
ones
elf
80
84
2
3.3.
6.1.
3.
T
he b
ette
r inc
ome,
the m
ore i
nter
net u
se re
gard
less
of c
ount
ry g
roup
s
24
,52
31,8
4
23.
3.6.
1.4.
Non
exist
ence
of i
ntco
nf it
ems i
n th
e cur
ricul
um in
200
3
2x
77
84
2
3.3.
6.1.
5.
U
naw
aren
ess o
f int
erne
t and
its n
onfu
nctio
nal (
purp
osel
ess)
use
2x
24,7
x77
13.
3.6.
1.6
L
imite
d in
tern
et u
se o
r del
ay in
inte
rnet
acce
ss at
scho
ols
11
2x
77
80
3
3.3.
6.1.
7.
P
erce
ivin
g in
tern
et as
ille
gal a
nd d
ange
rous
by
stude
nts a
nd p
aren
ts &
teac
hers
resp
ectiv
ely
2x
77
13.
3.6.
1.8.
For
bidd
ing,
abol
ishin
g or
lim
iting
inte
rnet
by
pare
nts o
r the
mse
lves
due
to th
e OK
S
28
1
3.3.
6.2.
Sugg
estio
ns to
impr
ove i
ntco
nf
3.3.
6.2.
1.
F
unct
iona
l use
of i
nter
net a
s edu
catio
nal t
ool t
hrou
gh in
tegr
atin
g in
tern
et in
to cu
rricu
lum
76
86
23.
3.6.
2.1.
1.
Sha
ring
reso
urce
s and
acce
ssin
g in
form
atio
n 76
1
3.3.
6.2.
1.2.
M
otiv
atin
g stu
dent
s with
soci
al, c
ultu
ral a
nd ed
ucat
iona
l onl
ine i
nter
actio
ns
76
13.
3.6.
3.
Se
lf co
nfid
ence
in h
igh
leve
l tas
ks
3.3.
6.3.
1.
B
ette
r pos
ition
of T
R du
e to
Exce
l and
Pow
erPo
int r
elat
ed ta
sk
94
,2x9
6,98
, 10
0,10
2
1
3.3.
6.3.
2.
D
epen
ding
larg
ely
on in
divi
dual
inte
rest
and
curio
sity
in 2
003
90
13.
3.6.
3.3.
Not
feel
ing
the n
eed
to u
se c
ompu
ter a
s hig
hcon
f tas
ks in
200
3 by
subj
ect t
each
ers
90
13.
3.6.
3.4.
Rea
sons
of l
ow se
lf co
nfid
ence
in h
ighc
onf
3.3.
6.3.
4.1.
N
onex
isten
ce o
f hig
hcon
f in
curri
culu
m in
200
3
90
91
23.
3.6.
3.5.
Pro
mot
ion
to h
omew
orks
and
pro
ject
s inv
olvi
ng h
ighc
onf t
asks
88
1
Tabl
e F.
1 C
ontin
ued.
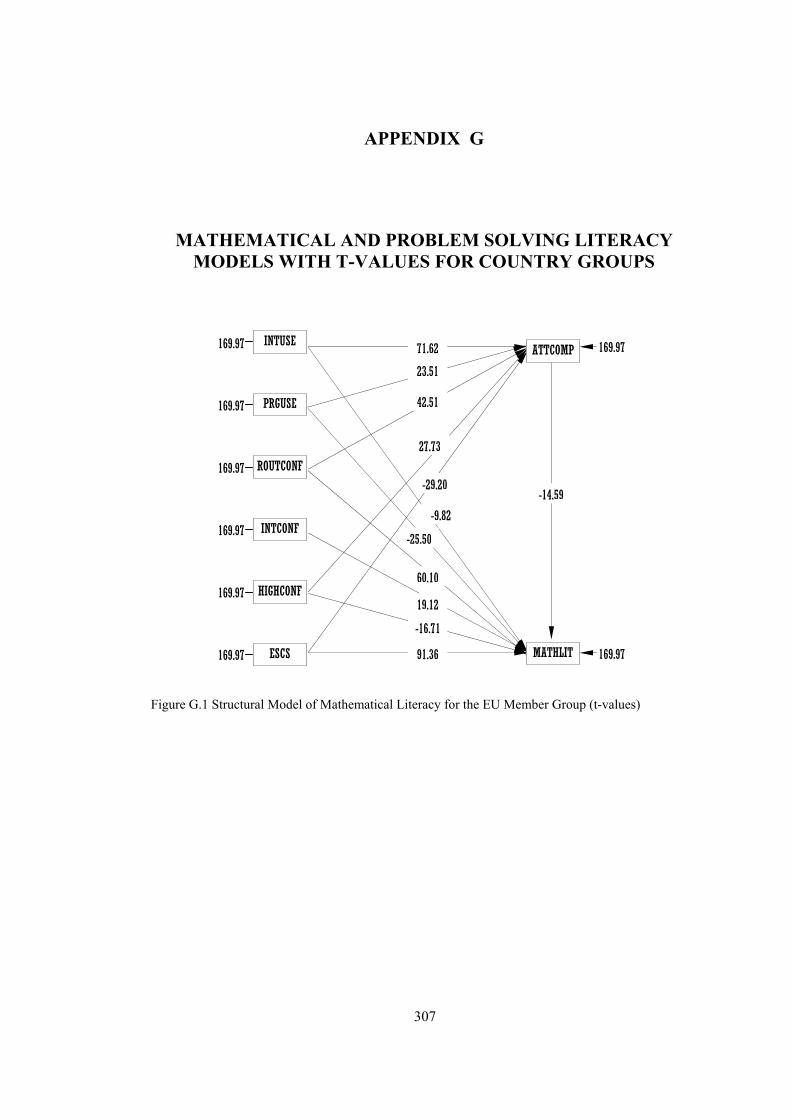
307
ROUTCONF
169.97
169.97
169.97
PRGUSE
INTUSE
INTCONF
HIGHCONF
ESCS
ATTCOMP
MATHLIT
169.97
169.97
169.97
169.97
169.97
-14.59
27.73
71.62
42.51
23.51
-29.20
-9.82
-25.50
60.10
19.12
-16.71
91.36
APPENDIX G
MATHEMATICAL AND PROBLEM SOLVING LITERACY MODELS WITH T-VALUES FOR COUNTRY GROUPS
Figure G.1 Structural Model of Mathematical Literacy for the EU Member Group (t-values)
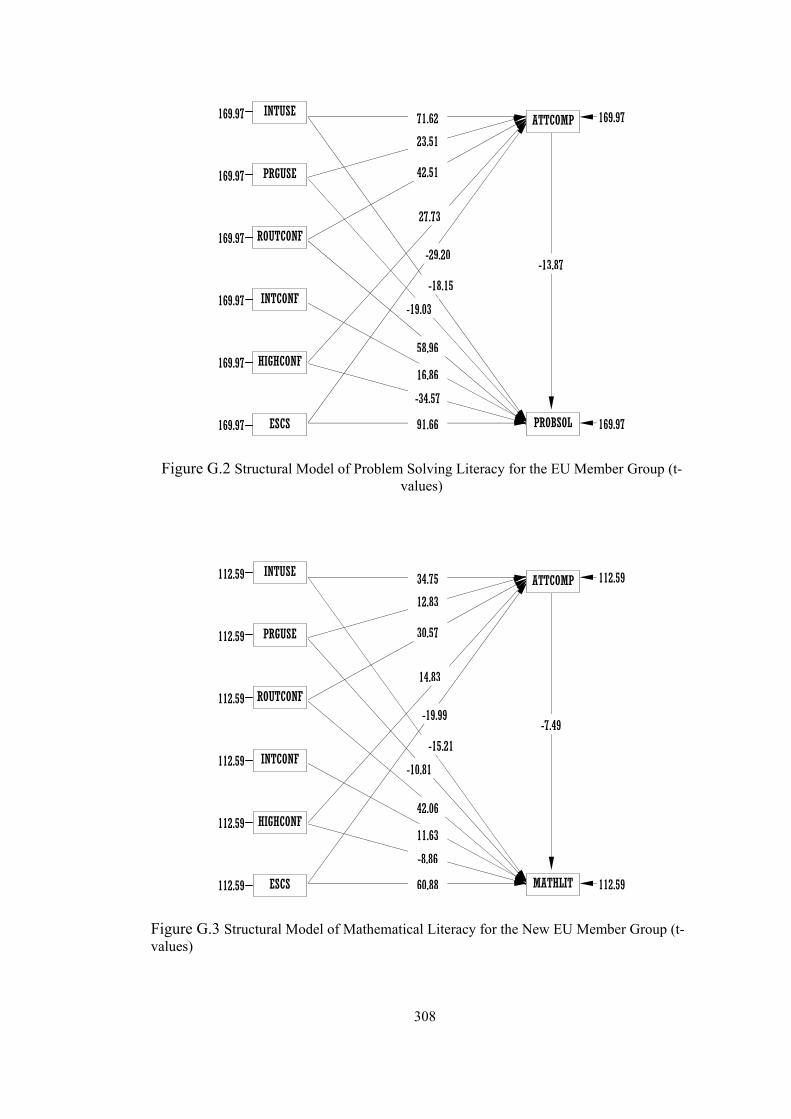
308
ROUTCONF
169.97
169.97
169.97
PRGUSE
INTUSE
INTCONF
HIGHCONF
ESCS
ATTCOMP
PROBSOL
169.97
169.97
169.97
169.97
169.97
-13.87
27.73
71.62
42.51
23.51
-29.20
-18.15
-19.03
58.96
16.86
-34.57
91.66
Figure G.2 Structural Model of Problem Solving Literacy for the EU Member Group (t-
values)
Figure G.3 Structural Model of Mathematical Literacy for the New EU Member Group (t-values)
ROUTCONF
112.59
112.59
112.59
PRGUSE
INTUSE
INTCONF
HIGHCONF
ESCS
ATTCOMP
MATHLIT
112.59
112.59
112.59
112.59
112.59
-7.49
14.83
34.75
30.57
12.83
-19.99
-15.21
-10.81
42.06
11.63
-8.86
60.88

309
Figure G.4 Structural Model of Problem Solving Literacy for the New EU Member Group (t-values)
Figure G.5 Structural Model of Mathematical Literacy for Turkey (t-values)
ROUTCONF
112.59
112.59
112.59
PRGUSE
INTUSE
INTCONF
HIGHCONF
ESCS
ATTCOMP
PROBSOL
112.59
112.59
112.59
112.59
112.59
-9.28
14.83
34.75
30.57
12.83
-19.99
-15.56
-10.49
34.84
14.80
-16.84
55.92
ROUTCONF
42.33
42.33
42.33
PRGUSE
INTUSE
INTCONF
HIGHCONF
ESCS
ATTCOMP
MATHLIT
42.33
42.33
42.33
42.33
42.33
-4.72
3.34
11.35
11.47
4.81
-4.58
-1.94
-7.32
16.39
9.62
-15.30
22.08

310
Figure G.6 Structural Model of Problem Solving Literacy for Turkey (t-values)
ROUTCONF
42.33
42.33
42.33
PRGUSE
INTUSE
INTCONF
HIGHCONF
ESCS
ATTCOMP
PROBSOL
42.33
42.33
42.33
42.33
42.33
-3.09
3.34
11.35
11.47
4.81
-4.58
-4.55
-5.87
15.41
7.56
-12.21
21.92

311
APPENDIX H
THE SIMPLIS SYNTAXES FOR THE MATHEMATICAL LITERACY MODELS FOR COUNTRY GROUPS
THE SIMPLIS SYNTAX FOR THE MATHEMATICAL LITERACY MODEL FOR THE EU MEMBER GROUP
PATH MODEL FOR THE EU MEMBER GROUP Observed Variables INTUSE PRGUSE ROUTCONF INTCONF HIGHCONF ATTCOMP ESCS PV1MATH PV2MATH PV3MATH PV4MATH PV5MATH Covariance Matrix from file: old_math.cov Sample Size = 57787 Relationships PV1MATH = INTUSE PRGUSE ROUTCONF INTCONF HIGHCONF ATTCOMP ESCS ATTCOMP = INTUSE PRGUSE ROUTCONF HIGHCONF ESCS Path diagram Method of Estimation: Maximum Likelihood Lisrel Output: EF RS MI SC WP End of Problem
THE SIMPLIS SYNTAX FOR THE MATHEMATICAL LITERACY MODEL FOR THE NEW EU MEMBER GROUP
PATH MODEL FOR THE NEW EU MEMBER GROUP Observed Variables INTUSE PRGUSE ROUTCONF INTCONF HIGHCONF ATTCOMP ESCS PV1MATH PV2MATH PV3MATH PV4MATH PV5MATH Covariance Matrix from file: new_math.cov Sample Size = 25359 Relationships PV1MATH = INTUSE PRGUSE ROUTCONF INTCONF HIGHCONF ATTCOMP ESCS ATTCOMP = INTUSE PRGUSE ROUTCONF HIGHCONF ESCS Path diagram Method of Estimation: Maximum Likelihood Lisrel Output: EF RS MI SC WP End of Problem

312
THE SIMPLIS SYNTAX FOR THE MATHEMATICAL LITERACY MODEL FOR TURKEY PATH MODEL FOR TURKEY Observed Variables INTUSE PRGUSE ROUTCONF INTCONF HIGHCONF ATTCOMP ESCS PV1MATH PV2MATH PV3MATH PV4MATH PV5MATH Covariance Matrix from file: turkey_math.cov Sample Size = 3590 Relationships PV1MATH = INTUSE PRGUSE ROUTCONF INTCONF HIGHCONF ATTCOMP ESCS ATTCOMP = INTUSE INTCONF ROUTCONF HIGHCONF ESCS Path diagram Method of Estimation: Maximum Likelihood Lisrel Output: EF RS MI SC WP End of Problem
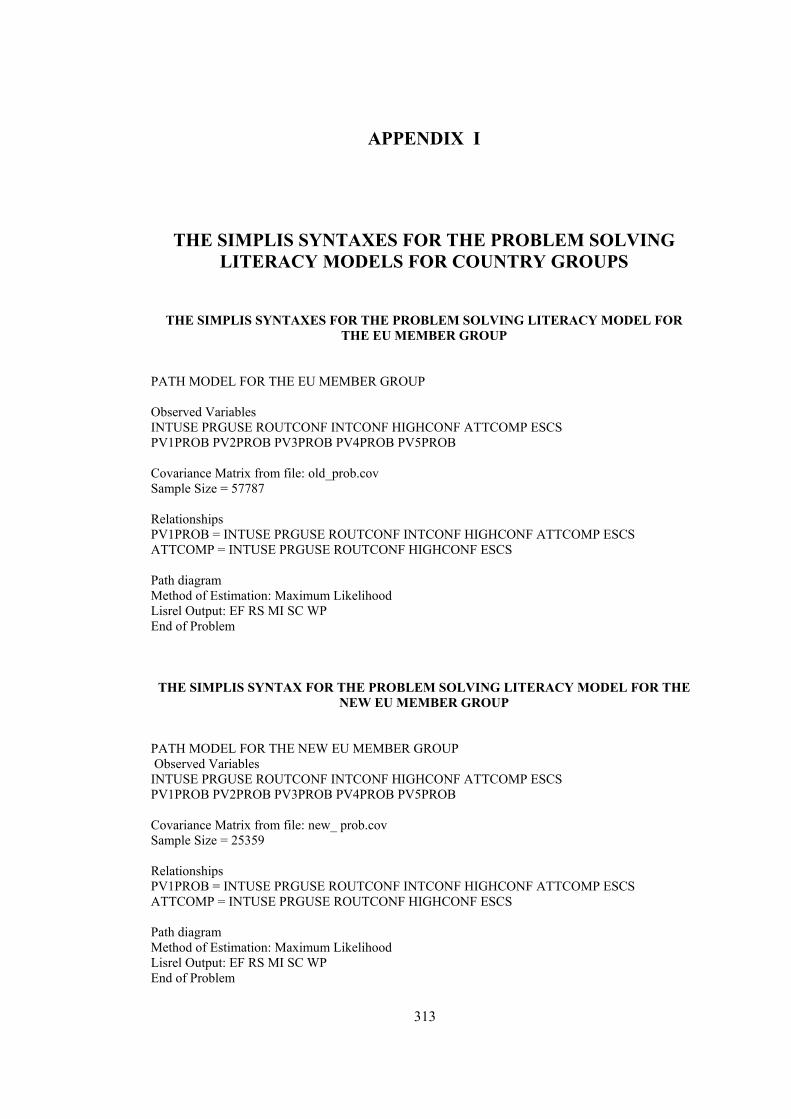
313
APPENDIX I
THE SIMPLIS SYNTAXES FOR THE PROBLEM SOLVING LITERACY MODELS FOR COUNTRY GROUPS
THE SIMPLIS SYNTAXES FOR THE PROBLEM SOLVING LITERACY MODEL FOR THE EU MEMBER GROUP
PATH MODEL FOR THE EU MEMBER GROUP Observed Variables INTUSE PRGUSE ROUTCONF INTCONF HIGHCONF ATTCOMP ESCS PV1PROB PV2PROB PV3PROB PV4PROB PV5PROB Covariance Matrix from file: old_prob.cov Sample Size = 57787 Relationships PV1PROB = INTUSE PRGUSE ROUTCONF INTCONF HIGHCONF ATTCOMP ESCS ATTCOMP = INTUSE PRGUSE ROUTCONF HIGHCONF ESCS Path diagram Method of Estimation: Maximum Likelihood Lisrel Output: EF RS MI SC WP End of Problem
THE SIMPLIS SYNTAX FOR THE PROBLEM SOLVING LITERACY MODEL FOR THE NEW EU MEMBER GROUP
PATH MODEL FOR THE NEW EU MEMBER GROUP Observed Variables INTUSE PRGUSE ROUTCONF INTCONF HIGHCONF ATTCOMP ESCS PV1PROB PV2PROB PV3PROB PV4PROB PV5PROB Covariance Matrix from file: new_ prob.cov Sample Size = 25359 Relationships PV1PROB = INTUSE PRGUSE ROUTCONF INTCONF HIGHCONF ATTCOMP ESCS ATTCOMP = INTUSE PRGUSE ROUTCONF HIGHCONF ESCS Path diagram Method of Estimation: Maximum Likelihood Lisrel Output: EF RS MI SC WP End of Problem
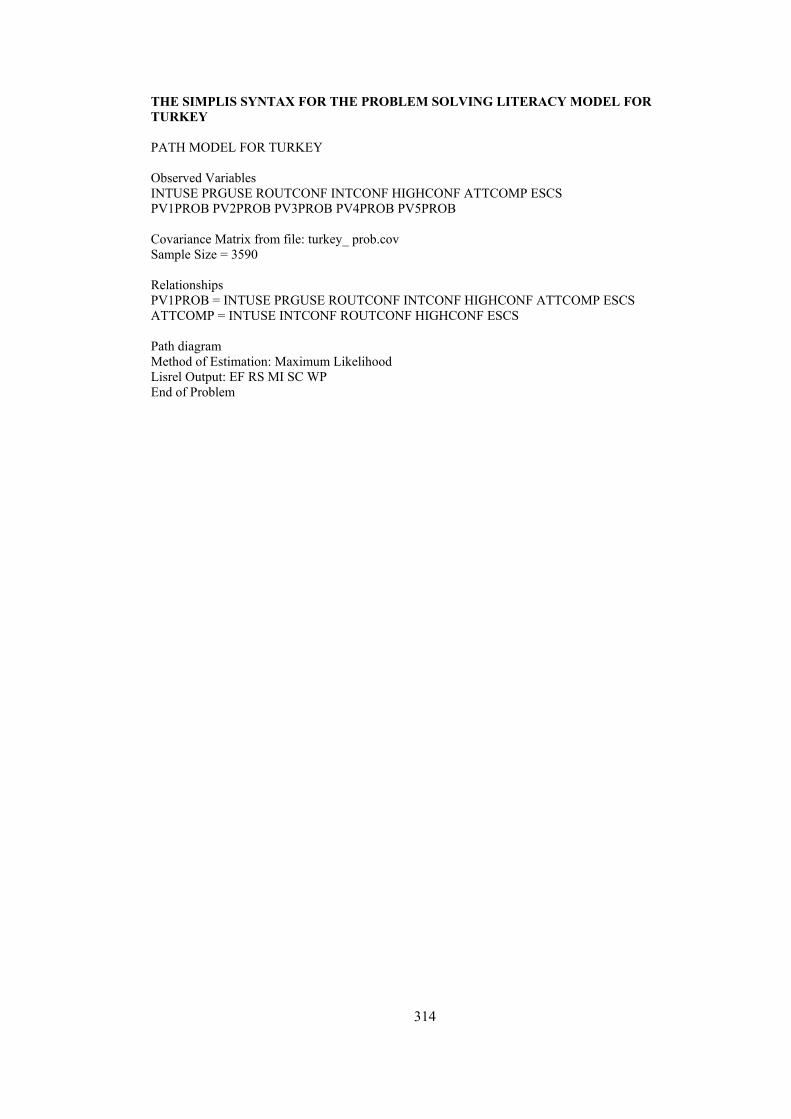
314
THE SIMPLIS SYNTAX FOR THE PROBLEM SOLVING LITERACY MODEL FOR TURKEY PATH MODEL FOR TURKEY Observed Variables INTUSE PRGUSE ROUTCONF INTCONF HIGHCONF ATTCOMP ESCS PV1PROB PV2PROB PV3PROB PV4PROB PV5PROB Covariance Matrix from file: turkey_ prob.cov Sample Size = 3590 Relationships PV1PROB = INTUSE PRGUSE ROUTCONF INTCONF HIGHCONF ATTCOMP ESCS ATTCOMP = INTUSE INTCONF ROUTCONF HIGHCONF ESCS Path diagram Method of Estimation: Maximum Likelihood Lisrel Output: EF RS MI SC WP End of Problem
315
CURRICULUM VITAE
PERSONAL INFORMATION Surname, Name: Şahinkayası, Yunis Nationality: Turkish (TC) Date and Place of Birth: 1 April 1974, Sivas Marital Status: Married Phone: 0 542 692 46 28 email: [email protected] EDUCATION Degree Institution Year of Graduation Ph.D. METU – CEIT 2000-2008 BS Gazi University – Printing Education 1993-1997 High School Buca Vocational High School, İzmir 1986-1990 WORK EXPERIENCE Year Place Enrollment 2000-present METU Research Assistant 1999-2000 Mustafa Kemal University Research Assistant 1998-1999 The Ministry of National Education Classroom Teacher 1997-1998 Bak Ambalaj Operator 1990-1992 Tufan Elektrik Electrician FOREIGN LANGUAGES English PUBLICATIONS 1. Kuzu, A., Şahinkayası, Y., Çakır, R. (2002). Öğretmenler İçin Hizmet-içi Amaçlı Web
Tabanlı Öğretim Modeli Önerisi, Uluslararası Katılımlı Açık ve Uzaktan Eğitimi Sempozyumu, Anadolu Üniversitesi, 23-25 Mayıs 2002.
2. Şahinkayası, Y., & Şahinkayası, H. (2004). Okullar için öğretim teknolojisi planı (ÖTP) ve öğeleri. Paper presented at XIII. Ulusal Eğitim Bilimleri Kurultayı, 6-9 Temmuz 2004, İnönü Üniversitesi, Eğitim Fakültesi, Malatya.
316
3. Şahinkayası, H., & Şahinkayası, Y. (2004). Bilgisayar ve Öğretim Teknolojileri Eğitimi (BÖTE) Bölümü Lisans Programında Bulunan “Öğretim Teknolojileri ve Materyal Geliştirme” Dersinin Analizi. Paper presented at XIII. Ulusal Eğitim Bilimleri Kurultayı, 6-9 Temmuz 2004, İnönü Üniversitesi, Eğitim Fakültesi, Malatya.
4. Şahinkayası, Y. (2008). Comparison of Turkey and EU Members Regarding ICT Use, Self-confidence in ICT and Attitudes toward Computers. Proceedings of VIII. International Educational Technology Conference, Anadolu University, 6-9 May 2008, Eskişehir, Turkey.
5. Şahinkayası, Y. (2008). Modeling the ICT Related Factors with the Mathematical Literacy and Problem Solving Skills of the Students in the PISA 2003. Proceedings of VIII. International Educational Technology Conference, Anadolu University, 6-9 May 2008, Eskişehir, Turkey.
HOBIES Playing basketball, saz, and folk dance, tennis and movies.
![Psychologia międzykulturowa [Cross-cultural psychology]](https://static.fdokumen.com/doc/165x107/631e5a483dc6529d5d07ecb7/psychologia-miedzykulturowa-cross-cultural-psychology-1675713982.jpg)