A Corpus-Based Methodology for Comparing and Evaluating Native and Non-Native Speaker Accents
212
A Corpus-Based Methodology for Comparing and Evaluating Native and Non-Native Speaker Accents Thesis submitted for the degree of Doctor of Philosophy May 2001 by Martin Weisser (MA Würzburg University) Department of Linguistics and Modern English Language Lancaster University
-
Upload
uni-bayreuth -
Category
Documents
-
view
1 -
download
0
Transcript of A Corpus-Based Methodology for Comparing and Evaluating Native and Non-Native Speaker Accents

A Corpus-Based Methodology for
Comparing and Evaluating
Native and Non-Native
Speaker Accents
Thesis submitted for the degree of Doctor of Philosophy May 2001
by
Martin Weisser (MA Würzburg University)
Department of Linguistics and Modern English Language Lancaster University

Abstract
The methodology I have developed for my PhD thesis provides a way of using rela-
tional databases in order to store transcriptions of native and non-native speaker data
and for capturing the differences between them statistically. The use of a relational da-
tabase furthermore not only makes it possible to enrich the basic segmental annotation
on different levels so as to include annotations of transitional or prosodic features –
such as assimilatory processes, pauses, stress, pitch patterns, etc. – but also to keep the
general architecture of the corpus open and easily expandable.
Comparing native and non-native speaker data makes it possible to create a kind of
reference model from the native speaker realisations, rather than relying on the more
abstract established teaching models, such as RP. Such a model may then be used to
evaluate the performance of the non-native speakers realistically. This has implica-
tions both for spoken language teaching, as well as testing purposes.
Apart from its use for the evaluation of non-native speaker accents, the methodology
can also easily be applied to the study of different native speaker accents, not only for
purely linguistic research purposes, but also potentially in order to establish criteria
that may be used to improve speech recognition and other language engineering
technology.
The thesis in its final form contains a comprehensive description of the methodology
and complete and partial implementations of the segmental and supra-segmental data-
bases respectively, complemented by an in-depth analysis of primarily the segmental
aspects of pronunciation.
The accompanying CD (Appendix D) contains the data in form of annotated .wav
files, an online copy of the thesis that may be used to view the sample spectrograms in
colour and play them back, and a copy of the freeware analysis program used to
perform the phonetic analysis and annotation.

I hereby declare that all the research and writing carried out in creating this thesis
was carried out by myself personally.
Lancaster, 15 May 2001

To my son Jin,
on whose first birthday this thesis
was finally submitted

Acknowledgements
I would like to express my sincere gratitude to the following people who have made
writing this thesis possible for me:
My mother, Brigitte Weißer, for supporting me financially in those times when it
would have been impossible for me to work on the PhD and concentrate on earning a
living at the same time.
Prof. Dr. Ernst Burgschmidt of Würzburg University, for providing me with a very
broad perspective on all aspects of Linguistics and for giving me the original, though
somewhat different, idea for this thesis.
My supervisor Gerry Knowles who has not only shown me the limitations of my
own knowledge, but also always guided me towards overcoming these problems and
ultimately not feeling too embarrassed about them in the first place.
To Damon Berridge of the Centre for Applied Statistics for his expert advice and
help with the statistics involved in my analysis. To John Pritchard and Ro Phelan from
Information Systems Services for their sometimes invaluable help with the program-
ming aspect of my database implementation.
And last, but not least, to Geoff Leech, whose comments on “end weight”, amongst
many other things, have hopefully helped me make this thesis more readable.

Table of Contents
1. Introduction. ........................................................................................................ 1
1.1. The General Aim .................................................................................................. 1
1.2. Raising Awareness ............................................................................................... 4
1.3. The Need for an Appropriate Reference Model ................................................... 6
1.4. The Social Context Or Why Foreign Learners Should Need to Learn How to
Speak ‘Better’. ..................................................................................................... 7
1.4.1. ‘Who Needs It, Anyway?’ ....................................................................... 7
1.4.2. The Foreign Learner and the Issue of National Identity. ........................ 9
1.4.3. Negative Attitudes Towards Local and Foreign Accents. ..................... 10
1.4.4. Implications. .......................................................................................... 12
2. The Evaluation of Non-Native Speaker Performance. ..................................... 13
2.1. Assessment Criteria in Language Testing. ......................................................... 13
2.2. Assessment Criteria in EFL Textbooks. ............................................................. 18
2.2.1. Kenworthy: Teaching English Pronunciation. ...................................... 19
2.2.2. Pennington: Phonology in English Language Teaching. ...................... 22
2.3. Defining a More Realistic Norm. ....................................................................... 27
2.3.1. General Criteria. .................................................................................... 27
2.3.2. Specific Criteria. ................................................................................... 28
3. Previous Research in this Area. ........................................................................ 31

3.1. Previous Research in Second Language (L2) Acquisition of English by
Speakers/Learners from a German-speaking Background. ............................... 31
3.1.1. Wieden/Nemser: “Compiling a Database on Regional Features in
Austrian-German English”. .......................................................................... 31
3.1.2. Grosser: “Aspects of Intonational L2 Acquisition”. ............................. 36
3.1.3. Munder: “Is Intonation Teachable?”. .................................................... 41
3.2. Relevant Issues in Phonetics. ............................................................................. 42
3.2.1. Defining a Standard. ............................................................................. 43
3.2.2. Textbooks on Prosody. .......................................................................... 46
4. The Methodology. ............................................................................................. 48
4.1. The Pilot. ............................................................................................................ 48
4.1.1. Familiarity and Naturalness. ................................................................. 49
4.2. Informants. ......................................................................................................... 50
4.2.1. The German Informants. ....................................................................... 50
4.2.2. The Native Speaker Informants. ........................................................... 51
4.3. The Dialogue. ..................................................................................................... 51
4.3.1. Advantages and Disadvantages of Using the Dialogue as a Means of
Gathering Information on Spoken Language. .............................................. 53
4.3.1.1. Analysability. ............................................................................... 53
4.3.1.2. Comparability. .............................................................................. 55

4.3.1.3. Familiarity. ................................................................................... 57
4.4. Recording and Recorded data. ........................................................................... 58
4.4.1. Recording of the Dialogue. ................................................................... 58
4.4.2. Digitisation and Audio Data Formats.................................................... 59
4.4.2.1. Digitisation. .................................................................................. 60
4.4.2.2. Conversion to Binary and .wav Formats. ..................................... 61
4.4.2.3. Retrieving and Converting the F0-Data. ....................................... 62
4.5. Statistics Employed in the Analysis ................................................................... 63
4.6. The Databases. ................................................................................................... 63
4.6.1. The Dialogues Database........................................................................ 65
4.6.1.1. The Main Table Structure ............................................................. 66
4.6.1.2. The Database as an Application ................................................... 74
4.6.2. The F0-Database. ................................................................................... 78
5. Preliminary Indicators of Difference. ............................................................... 82
5.1.1. Overall Length of Dialogues ................................................................. 82
5.1.2. Setting ................................................................................................... 85
6. Transcription of the Data. ................................................................................. 87
6.1. Transcription Issues. .......................................................................................... 87
6.2. Phonetic vs. Phonemic Transcriptions. .............................................................. 87

7. The ‘Reference Model’. .................................................................................... 90
7.1. Setting Up a ‘Pronouncing Dictionary’ ............................................................. 91
7.2. Handling Context & Weak Forms ...................................................................... 93
7.3. Discourse Structuring & Cohesion. ................................................................... 97
7.3.1. Pauses. ................................................................................................... 97
7.3.2. Final Release & Lengthening. ............................................................... 98
7.3.3. Pitch and Turn-taking/Dialogue Strategies. .......................................... 99
7.3.4. Stress, Accent and Prominence. .......................................................... 100
7.3.5. Cohesion and Prominence. .................................................................. 102
8. Analysis: A Revised Evaluation Model. ......................................................... 103
8.1. Segmental Features .......................................................................................... 103
8.1.1. H-dropping. ......................................................................................... 106
8.1.2. Assimilation. ....................................................................................... 108
8.1.3. Coalescence. ........................................................................................ 120
8.1.4. Liaison. ................................................................................................ 123
8.1.5. Linking- & Intrusive-r. ........................................................................ 125
8.1.6. Avoiding the Hiatus. ........................................................................... 127
8.1.7. Contraction. ......................................................................................... 129
8.1.8. Elision. ................................................................................................ 131

8.1.9. Non-linking Transitions. ..................................................................... 136
8.1.10. L-vocalisation & -clipping. ................................................................. 150
8.1.11. Rhoticity .............................................................................................. 155
8.1.12. ‘Syllabic’ Consonants. ........................................................................ 156
8.1.13. Weak Forms. ....................................................................................... 159
8.1.14. Central vs. Peripheral Qualities. ......................................................... 165
8.1.15. Triphthongs, Diphthongs & Monophthongs. ...................................... 167
8.1.16. Unusual or Old-Fashioned Qualities ................................................... 173
8.1.17. Aspiration or Strong Final Release. .................................................... 176
8.1.18. ‘Urban’ Features .................................................................................. 178
8.2. Discourse Structuring & Cohesion. ................................................................. 179
8.2.1. Pauses. ................................................................................................. 179
8.2.2. Stress & Rhythm. ................................................................................ 180
9. Conclusion ...................................................................................................... 183
10. Bibliography ................................................................................................... 187
11. Appendix A: The CLAWS 7 Tagset ................................................................ 193
12. Appendix B: Percentages of Individual Transition Categories ....................... 197
13. Appendix C: Combined Transition Categories ............................................... 198
14. Appendix D: Data CD & Online Version of Thesis ........................................ 199
Table of Figures
Figure 1 – Intonational effect caused by an unknown word in the pilot study. ........... 49
Figure 2 – Query for creating a tagged version of the dialogue. ................................. 65
Figure 3 – Snapshot of part of the “Realisations” table. .............................................. 72
Figure 4 – An input form for editing speaker realisations. .......................................... 72
Figure 5 – The ‘control centre’ for the “Dialogues” database. .................................... 75
Figure 6 – A comparison of native and non-native speaker realisations for the word
town. ..................................................................................................................... 94
Figure 7 – An example of anticipatory assimilation .................................................. 119
Figure 8 – Plosive elision vs. glottal stop (E07). ....................................................... 138
Figure 9 – Unreleased final plosive (E07). ................................................................ 139
Figure 10 – Intrusive glottal stops (G01). .................................................................. 145
Figure 11 – A less obvious example of intrusive ‘glottal stops’ (E05). ..................... 146
Figure 12 – l-clipping between tell and me. ............................................................... 152
Figure 13 – l-clipping between I and be representing 'll. ........................................... 153

Table of Tables
Table 1: Heaton’s example of a teacher’s rating scale for the lower intermediate level.
.............................................................................................................................. 15
Table 2: A coding example, adapted from the Austrian Learner database ................... 34
Table 3: Fields in the “Speakers” Table ....................................................................... 66
Table 4: The “Tagset” Table ......................................................................................... 70
Table 5 – A sample extract from an F0-frequency table. .............................................. 79
Table 6 – The initial set of transition values. ............................................................... 95
Table 7 – The final set of transitional categories. ........................................................ 96
Table 8 – Potential candidate words for h-dropping .................................................. 107
Table 9 – Word combinations involved in anticipatory assimilation. ........................ 115
Table 10 – Breakdown for assimilation examples 1 & 2. .......................................... 115
Table 11 – Occurrences of yod-coalescence. ............................................................. 121
Table 12 – Potential r-linking candidates (r signifies intrusive r) and number of
realisations. ........................................................................................................ 126
Table 13 – NS cases of j-linking unmatched by NNS. ............................................... 128
Table 14 – Candidate word combinations for contraction. ........................................ 130
Table 15 – Extreme vowel reduction (evr) in to ........................................................ 133
Table 16 – NS complete elisions (deletions) .............................................................. 135
Table 17 – NNS complete elisions ............................................................................. 135

Table 18 – Glottal onsets. ........................................................................................... 148
Table 19 – Potential candidates for l-vocalisation in the corpus. ............................... 154
Table 20 – Rhotic realisations by the non-native speakers. ....................................... 155
Table 21 – Potential candidates for word-final syllabic consonants. ......................... 157
Table 22 – Some potential weak forms ...................................................................... 161
Table 23 – Types of reduced vowel in the preposition to. ......................................... 163
Table 24 – NNS occurrences of final [Œ]. .................................................................. 166
Table 25 – NNS realisations ending in [‚ ]. ................................................................ 167
Table 26 – Smoothing of the [aU]-diphthong. ............................................................ 169
Table 27 – [«U] vs. [oU] vs. [‚ U]. ............................................................................... 170
Table 28 – C6 vs. C7 vs. C13 by words. .................................................................... 172
Table 29 – C6 vs. C7 vs. C13 counts of overall occurrences. .................................... 173
Table 30 – Unusual occurrence of [Ã]. ....................................................................... 174
Table 31 – Some non-final and non-diphthong occurrences of [‚ ]. ........................... 176

1
1. Introduction.
1.1. The General Aim
The original aim of my study was to find out what exactly is responsible for creating
the effect of a German accent when Germans speak English and to try to find ways in
which their competence in this area could potentially be improved. During the course
of my analysis, however, its scope and focus began to shift more and more, for two
different reasons.
The first reason was that I realised that what may be applied to a certain category of
non-native speakers could – with a little adaptation – probably just as well be genera-
lised and applied to all non-native speakers, and therefore be turned into a general me-
thodology for analysing and evaluating non-native speaker performance. Furthermore,
a suitable methodology for analysing differences between native and non-native spea-
kers also ought to naturally lend itself to an analysis of native speakers accents, which
often differ from the so-called standard accents in somewhat similar ways to non-
native speaker accents, and their use may have similar implications as far as general
acceptability is concerned. Applied to native speakers, such a methodology would
then become extremely useful, not only for general dialectology and linguistics, but
also to form the basis for research into variability for the design of speech recognition,
speech synthesis or spoken language systems, the latter being bound to become
increasingly common over the next decade or so.
The second reason was motivated by the fact that, although the data collected for the
study contained a large amount of material in the form of individual realisations and
their associated annotations, the overall rather low number of speakers – both native
and non-native – would not allow me to arrive at any statistically valid conclusions
concerning native and non-native speaker populations in general, but could at best
indicate relatively important trends. In the end, I therefore concentrated more on

Chapter 1: Introduction.
2
developing a solid, flexible and expandable methodology, rather than performing a
truly comprehensive analysis of all the relevant aspects. The methodology itself –
including its implementation in the form of multiple databases – is intended to provide
a means to perform an analysis that is as objective as possible under the circumstan-
ces. In the case of an analysis such as mine, it can of course only be called relatively
objective because, although I have taken great care in transcribing my data and being
as consistent in my transcriptions as possible, there will be obvious limitations.
One of these limitations is that, as a non-native speaker, I may not be able to hear all
the features that a native speaker would be able to pick up on and might be somewhat
biased towards the non-native speakers in my analysis. However, according to my
experience in teaching accents and dialects to native speakers of English, there is not
necessarily a disadvantage in being a non-native speaker, as native speakers do not
always seem to be very good at perceiving and describing nuances in their own
mother tongue. Therefore the previous argument may almost become invalidated to
some extent.
The factor, however, that could be seen as more of a problem with the analysis is
that I may not have been able to always maintain consistency, as doing research on
one’s own does not allow for having the constant checks and feedback from other
researchers that may be necessary to establish consistency and a higher degree of
objectivity in the first place. Thus, subjectivity and an element of inconsistency will
always be an issue in an analysis like mine, especially if there is a wealth of data to be
handled and therefore not all occurrences can be verified by making recourse to an in-
depth phonetic analysis based on acoustic parameters. On the other hand, as we shall
see in the later chapters on analysis, even when consulting waveforms, spectrograms,
etc., it will not always be 100% possible to verify or ascertain the presence or absence
of particular phonetic features in the speech signal.

Chapter 1: Introduction.
3
Contrary to most studies, which have so far mainly concentrated on features of pro-
nunciation on the purely segmental level, I had also originally intended to place con-
siderable emphasis on investigating features of intonation and cohesion because I be-
lieve that this is an area which has always been rather neglected in teaching students
from a Germanic (and other backgrounds) how to speak English, at least in language
classes taught by non-native speaker teachers. Judging from my own experience in
German secondary education and also at University level, hardly any attempt is ever
made to provide the learner with even a basic understanding of the importance of
intonation, let alone that the intonational systems of English and German show
marked differences at all.
Even at University – although of course there are basic courses in phonetics and
some universities even offer courses in practical phonetics –, future teachers of Eng-
lish in Germany are not properly taught how to make effective use of intonational
functions and the meanings conveyed by them. At most, intonation is treated in a very
academic, theoretical and scholarly fashion without any practical context whatsoever.
Because of this resulting lack of awareness of the important role that intonation
plays in everyday spoken language, most of the prospective teachers of English will
also not be able to perceive any nuances in the use of intonation on the part of native
speakers. This is not very surprising as, according to my own experience in teaching
certain aspects of prosody, even native speakers have great difficulty in identifying
those subtleties with any degree of accuracy. Nevertheless, at least the native speakers
will always be able to tell that somebody is making use of prosody to convey some
specific meaning, whereas this is in many cases completely lost on the non-native
speaker, even if he or she is a teacher of English. Therefore, at least a minimal degree
of awareness towards the functions that intonation can fulfil should be raised in the
foreign learner.

Chapter 1: Introduction.
4
To this extent, the implementation of my methodology goes at least some way to-
wards implementing the means of establishing ways of identifying the differences in
the use of suprasegmental features by native and non-native speakers, even though I
have ultimately not been able to perform any in-depth analysis of either stress or into-
nation in the corpus due to the large amount of data to be handled. However, to some
degree elements of prosody are incorporated into the analysis, too, in conjunction with
the segmental analysis, where some issues of pausing and rhythm become apparent
through segmental features such as final release or the absence of weak forms.
One further aim I developed during the course of my analysis was to provide rela-
tively detailed descriptions of some of the pitfalls and problem areas involved in per-
forming a computer-based analysis of speech. I believe that this is extremely im-
portant as most textbooks dealing with acoustic phonetics generally only present
examples of ‘picture-book segments’, i.e. extremely clear examples of phonetic
features, and tend not to point out areas where there are often grounds for confusion
between different phenomena that may not be immediately obvious to the
inexperienced researcher.
1.2. Raising Awareness
As a matter of fact, many prospective teachers of English in Germany and probably
other countries have no idea of the diversity of the English language with respect to its
many accents and dialects, a situation that strangely seems to be partly true for native
speaker teachers as well (c.f. 2.2.1, below). Many prospective teachers have also hard-
ly ever been exposed to any natural language outside the classroom – a situation that
does unfortunately not seem to improve considerably during the course of their stu-
dies. Much of this is probably due to the still prevalent anachronistic attitude in uni-

Chapter 1: Introduction.
5
versity circles that the study of a language is mainly the study of its history and litera-
ture, rather than actual contemporary usage1.
The obvious problem arising from this is that if even teachers of English do not
know how to speak in any but a rather ‘stilted’, artificial way, schoolchildren can
hardly ever be exposed to any natural language at all, unless of course they might be
so lucky as to participate in an exchange programme with a twin town in an English-
speaking country. Even exposure to mass media such as films or television program-
mes in foreign languages, which is technologically quite possible nowadays, does not
help in this context, as often (at least in Germany) this material tends to get dubbed
into the learners’ L1 and even specific language teaching programmes tend not to
reflect current usage.
Cruttenden, in his 5th edition of Gimson’s Pronunciation of English, defines the
competence required of the teacher of English in the following way:
“The foreign teacher of English constitutes a special case. He has the obligation of
presenting his students with as faithful a model of English pronunciation as possible.
In the first place, and particularly if he is dealing with young pupils, his students will
imitate a bad pronunciation as exactly as they will a good one; and secondly, if he is
using illustrative recorded material, his own pronunciation must not diverge marked-
ly from the native model.” (Cruttenden, ‘94: p. 273)
The first one of these two is a very important point, as particularly younger pupils
are more liable to imitate the teacher and thus form habits that may not easily be cor-
rected at a later stage in their learning; even more so since in recent years attempts
have been made to introduce EFL into primary school classrooms in Germany, as well
as at least some other European countries such as Greece. As far as the second point is 1 This can easily be seen in the names of many university departments in Germany that teach English
Language and Literature, which are commonly known as ‘Institutes of English Philology’, which illustrates the analogy with the study of classical philology, which is, by necessity, based upon written language.

Chapter 1: Introduction.
6
concerned, the problem there seems to be one of defining the “native model” and also
the fact that most of the “illustrative recorded material” used in the foreign language
classroom will usually be outdated anyway.
Joanne Kenworthy similarly states that:
“Learners who plan to become teachers of English will want to approximate a native
accent and, depending on their future teaching situations, may want to be familiar
with several of the major accents of English in the world.” (Kenworthy, ‘87, p. 3).
Even though I would certainly agree with her on both points, this statement seems to
somewhat over-optimistic considering the case that most prospective teachers of Eng-
lish are normally struggling to achieve the first of these two goals.
1.3. The Need for an Appropriate Reference Model
One of my aims in this study is therefore to devise a methodology that is suitable for
extracting the most salient features out of the speech of a group of native speakers of a
certain educational background and contrast them with commonly accepted ideas a-
bout the use and validity of RP as an appropriate teaching model. I believe that this
approach is more realistic than simply comparing the speech of non-native speakers to
a) established teaching models, whatever their ideological and practical
foundation may be, and
b) to a model of rhetorical capabilities often expected from non-native
speakers that would be unreasonable to expect from any but the most
educated professional native speakers.
The latter point is one that particularly comes up in the context of English language
assessment, where learners are often, and I personally believe unfairly, assessed on
their rhetorical skills in sustaining conversations and expressing complex ideas

Chapter 1: Introduction.
7
coherently, even if they may not – and cannot always be expected to – necessarily
have this ability in their own native language.
1.4. The Social Context Or Why Foreign Learners Should Need to
Learn How to Speak ‘Better’.
1.4.1. ‘Who Needs It, Anyway?’
English as a foreign language has been taught in schools in most countries all over
the world for quite a long time now, and always apparently quite successfully so. Its
use as a language of commerce and communication – in a variety of aspects ranging
from the political to the purely touristic – is generally accepted and, I believe, not
without reason. Mainly because of its character as a non-inflective language, its basic
SVO structure and the fact that it incorporates a large amount of vocabulary that
constitutes part of the learned vocabulary in other languages, its fundamental grammar
and vocabulary are rather easy to acquire and the foreign learner, whatever his or her
purposes may be, can make him/herself somehow understood after a relatively short
period of learning. This could be rather important in an area such as politics, and
especially within the changing face of the European Union and general trends of
globalisation, where communication between the members of individual countries is
becoming increasingly important. Thus the emphasis that is being placed on learning
English as opposed to learning and using other (European) languages whose basic
grammatical structures are far more difficult to grasp, in this context, seems to be fully
justified.2
2 Nevertheless, this argument should certainly not be perceived as an argument for teaching English
as the only foreign language in other European countries outside Britain, as being able to understand other languages and their ways of expressing concepts and ideas in a different manner is an important factor in establishing the general cultural understanding and acceptance that is needed for co-operation between the different member-states of the Union.

Chapter 1: Introduction.
8
Another, albeit admittedly controversial, factor in advocating the use of English as
an official language of world-wide communication is the fact that it has been widely
used and established as such for a fairly long time, so that more or less everybody in
the world has already been or will be exposed to it from a certain age onwards
(usually very early through mass media, popular culture or consumer goods), so that
there is at least a certain amount of passive knowledge present. In several European
countries such as the Netherlands, Greece and some within Scandinavia, and indeed
many other countries all over the world, this is even further facilitated by the
availability of subtitled films in English on television, which can represent excellent
learning tools. No matter how one might think about the ideological or commercial
reasons as to why the English language has come to gain this status, this argument can
be interpreted as something that is of possibly great advantage to the learner, who,
instead of having to familiarise him- or herself with something absolutely new, can
draw upon ‘resources’ that have been acquired outside the classroom.
However, the apparent ease of being able to learn the English language can also be
very deceptive. Although the basic grammatical structure of the English language may
be comparatively easy to acquire, many of the problems for foreign learners really
arise from the fact that they lack awareness of the use of collocations and, even more
importantly, intonation, which are two factors that are to a very large extent respon-
sible for perceiving and conveying meaning. Thus, while a foreign speaker may actu-
ally have a rather good command of vocabulary and syntax and be able to pronounce
the words of the language in a ‘fairly English way’, there will still remain lots of
grounds for misunderstanding.
Therefore, I believe that it is not, as some textbooks like Cruttenden (51994) seem to
claim, just a matter of making oneself ‘somehow understood’, but a question of
communicating one’s needs or the requirements of a situation. Cruttenden states that:

Chapter 1: Introduction.
9
“It must be admitted that the great majority of foreign learners will have a severely
practical purpose for acquiring English and will perceive no important benefit in
approaching the performance of the native speaker. Indeed, the learner may derive
some advantage in retaining a clearly foreign image in his dealings with English
speakers; e.g. the waiter or the taxi-driver, whose discourse with a native speaker is
likely to be limited and stereotyped, is unlikely to progress beyond a level of basic
intelligibility.” (Cruttenden, ‘94: p. 273).
It seems hard to imagine any such group of learners who might actually need to use
the language for such “a severely practical purpose” as opposed to those
“[...] many learners who, for academic reasons or because their work requires them to
deal on equal terms with native speakers in Britain or abroad or even as tourists,
[will] wish to communicate easily without signalling too blatantly their foreign
origin.” (ibid.),
and for whom he sets more realistic target standards. We can therefore assume that
the main target population of learners will have a very strong need to communicate as
efficiently and intelligibly in order to achieve whatever aims they have set for them-
selves.
1.4.2. The Foreign Learner and the Issue of National Identity.
There somehow seems to be a basic misconception of the importance of the learner’s
needs and choice in this argument, too. Some people even use the argument that non-
native speakers may not want to sound like native ones, as a means of preserving their
own cultural identity and status. While this may well be the case for some learners
who are particularly conscious of the image of their home-country they might want to
convey, it often seems to be used as an excuse for not being able to achieve the covert
aim of attaining a certain level of ‘proficiency’.

Chapter 1: Introduction.
10
Be that as it may, of course the learner cannot and should not be forced to give up
his/her native accent if he/she does not want to do so, but on the other hand should be
made aware of the fact that there may be a risk of mis-communication involved in not
trying to master the target language to the best of one’s abilities. The point I am here
trying to make about mis-communication is not necessarily that a few mispronounced
words here and there would make it absolutely impossible for the native speaker to
understand the learner, which seems to be one that many language teachers seem to
have in mind when they drill their students in the production of minimal pairs or talk
about concepts such as intelligibility (Kenworthy, ‘87, p. 13ff), but that not being able
to make certain distinctions a native speaker would make could lead to potential em-
barrassment. Thus imagine a tourist from one of the Southern European countries that
is not renowned for employing British politeness formulae saying to a hotel recep-
tionist “I want a [SIt]!”3. Not only could this potentially lead the receptionist to mista-
kenly direct the tourist towards the toilets, but even if it were understood correctly and
pointed out, make both the receptionist and the tourist feel embarrassed or the latter
begin to doubt his/her competence in communicating in English.
Thus it is not only politicians or business-people who are involved in important
negotiations who need to be aware of the subtleties of the language, but also the
common traveller who wants to enjoy the real cultural experience of communicating
with native speakers.
1.4.3. Negative Attitudes towards Local and Foreign Accents.
However, another commonly overlooked factor is that speaking with a foreign
accent is in some ways akin to speaking with certain types of local native-speaker
accents. In every country, certain types of local accent are more and some less
3 c.f. the similar example by Wells (1982, p. 84) about “[…] the Londoner […] who, invited back for
coffee by a visiting American, upset him by accepting the invitation [ÈÃp j�ùr ÈQ«s], sc. up (at) your house.”, where a similar kind of miscommunication occurs between speakers of what is often referred to as the same language.

Chapter 1: Introduction.
11
prestigious than others. In Britain, it is mostly urban accents, such as Cockney,
Scouse, Brummy, Geordie or Glaswegian, that are often perceived as particularly lazy
or ugly, and their speakers as being ‘lower class’ and ‘thick’. On the other hand, the
so-called standard accents (Wells, ‘82, p. 34ff), like RP or General American, are often
seen as more beautiful and characterising their speakers as being more intelligent. But
this kind of social prestige or acceptance can also be reversed. Very often speakers of
the urban accents mentioned above tend to look upon speakers of RP – or, to be more
exact, speakers of what they themselves perceive to be RP – as being posh and
snobbish, and it may therefore not be ideal for foreign learners to speak RP if they
should plan to travel around those areas. Furthermore, the influence of television
programmes, such as Eastenders and Brookside, can raise the acceptance level
towards some urban accents, so that they may even reach a relatively higher status as
people’s familiarity with them increases.
Thus, in some ways, negative reactions towards or outright stigmatisation of certain
accents seem to be linked to some extent to the level of exposure one has to them. The
less exposure there is, the more the likelihood of rejecting an accent as being ugly
seems to rise, just because it strikes the listener as being different. Joanne Kenworthy,
in her textbook on teaching the pronunciation of English, quite rightly points out that
familiarity with an accent is a major factor in native speakers’ understanding one
another:
“We can also make a comparison with the various regional accents of English – a
Cockney and a Scot from Glasgow may have a great deal of trouble understanding
each other, until they get used to each other’s accents.” (Kenworthy, ‘87, p. 15).
If we accept the above concept as being true, we then need to think further about the
reasons for accents appearing different and unfamiliar. Is there just one single level
that is responsible for creating this ‘foreign’ effect? Are there instead a number of dif-
ferent levels that work independently of one another? Or are there a number of diffe-

Chapter 1: Introduction.
12
rent levels that work together to achieve this effect? Very often it seems to be the case
that the latter is true, i.e. that it is not only due to segmental, but also suprasegmental
features, that someone’s accent leaves a strange impression on a listener. For example,
during seminars discussing issues on the evaluation and assessment of foreign lear-
ners, one invariably tends to hear stereotypes such as “Germans sound aggressive.”,
“Greeks are impolite.”, etc. A former student of mine who was writing an assignment
on Japanese English and had interviewed a few of his fellow students on their percep-
tion of Japanese students’ English was even told something along the lines of “They
sound so boring. We don’t want to talk to them anymore.”. When questioned further
about the topic, they often answered that this was only partly due to pronunciation
problems, but rather to an odd rhythm and lack of intonation.
1.4.4. Implications.
Returning to my previous argument about the social and political implications of
globalisation, it should be easy to see that there will also be an increasing number of
learners with an even more specific need of mastering English as a means of real and
effective communication caused by increasing social mobility in the world, mainly
those who come to Britain and other English-speaking to live and work, but also those
who move to any non-English-speaking countries and will need to use English as their
initial means of communication before they can acquire the language of this country.
Furthermore, foreign learners who want to be able to communicate effectively
should at least be aware of all the implications of what it means to, to use a colloquial
Scouse expression, ‘get up people’s noses’ when speaking with an accent that either
cannot easily be understood by the majority of the population in their host country or
that simply sounds odd because it does not conform with any accent that native spea-
kers will at least be familiar with. An awareness of this kind of problems may then
form an incentive to improve one’s speaking abilities.

13
2. The Evaluation of Non-Native Speaker Performance.
In the following chapter, I shall try to present some preliminary and tentative criteria
for evaluating the performance of non-native speakers of English. Evaluation of this
kind has so far more or less been the domain of Language Testing and ELT practice,
but the criteria developed in those domains for the evaluation of spoken language as
yet show considerable weaknesses as most of them are almost purely impressionistic.
I will begin by discussing relevant textbooks in both areas and, during the process, at-
tempt to dispel some of the more common myths about the kind of pronunciation and
rhetorical skill often expected from non-native speakers. Having pointed out where the
most serious conceptual problems lie, I shall then try to come up with an improved
general framework for handling the speech of learners that is both realistic and fair, as
well as aiming at greater objectivity. This framework itself will then be expanded
upon in the light of my analyses in later chapters.
2.1. Assessment Criteria in Language Testing.
Criteria for the assessment of spoken language in the domain of Language Testing
are not very highly developed, although testing is an area of research that normally
prides itself on its objectivity4. According to Heaton
“Testing the ability to speak is a most important aspect of language testing. However,
at all stages beyond the elementary levels of mimicry and repetition it is an ex-
tremely difficult skill to test, as it is far too complex a skill to permit any reliable an-
alysis to be made for the purpose of objective testing. Questions relating to the crite-
ria for measuring the speaking skills and to the weighting given to such components
as correct pronunciation remain largely unanswered.” (Heaton, ‘75, p.88).
4 N.B.: This section could have been subtitled “… or why someone has to come up with a few valid
and reliable criteria.”

Chapter 2: The Evaluation of Non-Native Speaker Performance.
14
As Heaton’s book from which this text is taken was first published in 1975, one
would assume that in the interim period, attempts may have been made to answer
those very questions, but even if they have, the answers are still not there. I assume
that this is due to three of the major constraints involved in the development and
implementation of language tests, time, knowledge and money:
“There are enormous practical constraints on the large-scale testing of spoken lan-
guage proficiency. These include administrative costs and difficulties and the sheer
logistics of testing large numbers of candidates either individually or in small
groups.” (Weir, ‘93, p.40).
Spoken language ‘proficiency’, as it was expressed in Heaton’s earlier quotation, is
far more difficult to assess than written language skills because it involves a combina-
tion of many features that would normally be assessed individually, such as
knowledge of grammar, comprehension of the structure of the language,
cultural/idiomatic elements, etc., and is of a far more volatile nature than written
communication. Thus a great amount of effort has been put into developing
methodologies that enable the assessor to elicit information about the more ‘rhetorical’
aspects of the learner’s competence, to the exclusion of hard and fast categories for the
assessment of basic features of pronunciation. Therefore the current approach in
language testing resembles more a top-down approach that tries to capture higher-
level features, rather than a bottom-up approach that attempts to resolve what it is that
may make certain learners more difficult to understand than others.
The very nature of this top-down approach, coupled with the above mentioned con-
straints, therefore encourages the assessor to conflate low-level features that should
technically be assessed separately, and leads to the establishment of impressionistic ra-
ting categories like fluency, accuracy, comprehensibility and appropriateness, as I
shall try to illustrate below.

Chapter 2: The Evaluation of Non-Native Speaker Performance.
15
The following table is taken from Heaton (Heaton, ‘75: p. 100) and represents an
example of a possible rating scale according to which a teacher may assess students at
the lower intermediate level. Highlighting is provided by me to draw attention to cer-
tain relevant criteria.
Accuracy Fluency Comprehensibility
6 Pronunciation is only very slightly influenced by the mother tongue. Two or three minor grammatical and lexical errors.
Speaks without too great an effort with a fairly wide range of expression. Searches for words occasionally but only one or two unnatural pauses.
Easy for the listener to under-stand the speaker’s intention and general meaning. Very few interruptions or clarifica-tions required.
5 Pronunciation is slightly influ-enced by the mother tongue. A few minor grammatical and lexical errors but most utte-rances are correct.
Has to make an effort at times to search for words. Neverthe-less, smooth delivery on the whole and only a few unnatu-ral pauses.
The speaker’s intention and general meaning are fairly clear. A few interruptions by the listener for the sake of clarification are necessary.
4 Pronunciation is still mode-rately influenced by the mother-tongue but no serious phonological errors. A few grammatical and lexical errors, but only one or two major er-rors causing confusion.
Although he has to make an effort and search for words, there are not too many unnatural pauses. Fairly smooth delivery mostly. Occa-sionally fragmentary but suc-ceeds in conveying the general meaning. Fair range of expression.
Most of what the speaker says is easy to follow. His intention is always clear but several interruptions are necessary to help him to convey the mes-sage or to seek clarification.
3 Pronunciation is influenced by the mother-tongue but only a few serious phonological er-rors. Several grammatical and lexical errors, some of which cause confusion.
Has to make an effort for much of the time. Often has to search for the desired meaning. Rather halting delivery and fragmentary. Range of expression often limited.
The listener can understand a lot of what is said, but he must constantly seek clarification. Cannot understand many of the speaker’s more complex or longer sentences.
2 Pronunciation seriously influ-enced by the mother tongue with errors causing a break-down in communication. Many ‘basic’ grammatical and lexical errors.
Long pauses while he searches for the desired meaning. Fre-quently fragmentary and hal-ting delivery. Almost gives up making an effort at times. Limited range of expression.
Only small bits (usually short sentences and phrases) can be understood - and then with considerable effort by some-one who is used to listening to the speaker.
1 Serious pronunciation errors as well as many ‘basic’ gram-matical and lexical errors. No evidence of having mastered any of the language skills and areas practised in the course.
Full of long and unnatural pauses. Very halting and frag-mentary delivery. At times gives up making an effort. Very limited range of expres-sion.
Hardly anything of what is said can be understood. Even when the listener makes a great effort or interrupts, the speaker is unable to clarify anything he seems to have said.
Table 1: Heaton’s example of a teacher’s rating scale for the lower intermediate level.
Chapter 2: The Evaluation of Non-Native Speaker Performance.
16
It is obvious from this example where the problems with such an approach lie. First
of all, the list of criteria in this table is far too complex to bear in mind while trying to
assess a student’s performance in an interview situation. It is difficult enough to con-
centrate on some of the criteria all of the time, but near impossible to keep track of all
of them, even if the interviewer him/herself is not actually the one who is doing the
assessment. Thus it would be at least strongly advisable to do the evaluation of the
interview in (minimally) two or three stages, instead of trying to conduct a ‘real-time’
analysis. However, this is not necessarily current practice as many interviews are still
not being recorded.
Furthermore, most of the above categories are not at all clear-cut and analytic, and
some of them are even conflated. For example, the criterion of being able to convey
meaning appears both under the headings of “fluency” and “comprehensibility” and is
at the same time not clearly distinguished from that of conveying intention, which is,
at least, only subsumed under comprehensibility. It is, to say the least, arguable
whether conveying meaning could ever be regarded as a feature of “fluency”, as the
latter is probably in general understood to refer to the presence or absence of features
of cohesion5 and the style of delivery. The very category of fluency is, in itself, highly
disputable as it represents a purely impressionistic category, based on the subjective
evaluation of the assessor as to what constitutes an appropriate rate of delivery,
number of hesitations and pauses for a given speaker. Heaton, for example, in the
above table refers to “unnatural pauses”, yet it is very difficult to say what actually
constitutes an unnatural pause. The common conception seems to be that it is a pause
of perhaps half a second, or a second, while the speaker is trying to prepare the next
utterance or is trying to find an appropriate wording for a response. If this is taken to
be the case, then probably many competent and even rhetorically skilled speakers like
teachers and lecturers may be regarded as non-fluent speakers as they might at times 5 I understand cohesion with respect to spoken language to refer to such features as the use of
intonation, accentuation and deaccentuation in order to relate different parts of a spoken text to one another.

Chapter 2: The Evaluation of Non-Native Speaker Performance.
17
find it necessary to pause for such a time in order to find an appropriate and exact
expression that will make their explanations as concise and easy to understand for the
listener as possible. However, whereas in a skilled speaker this kind of structural
device would probably be interpreted as a communication management device, the
learner in an interview situation may, by an assessor who has potentially had little
formally training, be judged as being ‘non-fluent’. To be fair, some of the more recent
textbooks about language testing practice, like Weir (1993), do tend to stress that
communication management strategies, which are referred to under the headings of
“routine” (p. 41) and “improvisational skills” (p. 42) represent an important part of
spoken language, but nevertheless do not give any concrete advice on how to deal
with them. Weir admits that
“Given that our understanding of the continuum of proficiency in speaking is cur-
rently limited, we might be better served for the moment by analytical scales where
assessments are made in terms of each criterion separately.” (Weir, ‘93: p. 45),
and gives an example of a table containing a list of “criteria of assessment” (Weir,
‘93: p. 43/44) containing a band of four descriptors each, comprising the categories of
“Appropriateness”, “Adequacy of vocabulary for purpose”, “Grammatical accuracy”,
“Intelligibility”, “Fluency”, and “Relevance and adequacy of content”, which are ne-
vertheless sometimes more appropriate for the assessment of written language skills.
For example, his category of “Fluency” specifies “Signs of developing attempts at u-
sing cohesive devices, especially conjunctions. Utterances may still be hesitant, but
are gaining in coherence, speed and length.”, in one band, or, “Inter-sentential
connectors are used effectively as fillers”, [my italics] in another. Those criteria still
show some misunderstanding of the basic nature of spoken interaction as the latter is
normally characterised by fairly short sentences with a rather low degree of syntactic
complexity, unless, of course, we are dealing with more academic genres, which are

Chapter 2: The Evaluation of Non-Native Speaker Performance.
18
obviously quite distinct from ordinary everyday spoken interaction6. Furthermore
“Inter-sentential connectors” can hardly be categorised as “fillers” as the latter are
normally defined as phatic devices like particles, such as well or hesitation markers (in
its neutral sense) such as the one commonly (and sometimes canonically)
transliterated e(r)m.
To sum up, while techniques for eliciting fairly natural language in the assessment of
spoken language are highly developed, most of the evaluation ‘criteria’ and
procedures so far established and implemented are too non-descript, difficult to
handle, highly inaccurate and non-quantifiable. Many of them represent more of an
attempt to test rhetorical skills which can probably in many cases not be learned in the
language classroom and may depend highly on the individual speaker’s personality.
Objective measures to evaluate spoken interaction in ‘real life situations’ based on
basic phonetic criteria are almost non-existent, even though the nature of spoken
language is supposedly taken into account.
Therefore some basic and realistic criteria that may help to develop a framework for
a bottom-up analysis and evaluation of the spoken language performance of non-na-
tive speakers, which I shall attempt to set from section 2.3, are desperately needed.
2.2. Assessment Criteria in EFL Textbooks.
In this section, I will discuss the way that textbooks in English Language Teaching
(EFL) deal with categorising and assessing the performance and level of non-native
speakers, and whether the concepts used in EFL teaching are any more realistic than
the ones employed in language testing. Out of a large variety of textbooks available in
the area, I have picked two that I consider quite exemplary of the genre. They are
Kenworthy, ‘87, which seems to be one of the most influential textbooks of this kind
6 However, this is not to say that a minimal set of coordinating conjunctions like and, but, etc. does
not have to be present even in basic spoken interaction.
Chapter 2: The Evaluation of Non-Native Speaker Performance.
19
in Britain, and Pennington, ‘96, which partly draws on the former and claims to ap-
proach the subject “[…] from a variationist, accent-neutral and international point of
view, explicitly comparing the major varieties of English around the world and using a
system of transcription which is relatively generic.” (Pennington, ‘96, p. xvi).
2.2.1. Kenworthy: Teaching English Pronunciation.
Kenworthy’s strategy for teaching the pronunciation of English is based on the no-
tion of achieving “intelligibility”, rather than native-speaker like pronunciation. She
claims that:
“Speaking with a foreign accent is only a ‘problem’ if it leads to a breakdown in
communication.” (Kenworthy, ‘87, p. 12),
and makes an attempt to grade pronunciation problems according to their severity.
However, as we have already seen in section 1.4, this cannot necessarily be taken at
face value. Her grades are “high priority” for problems that are “vital for intelligibi-
lity”, “low priority” for those that “do not affect intelligibility” and those that “can be
given optional attention” (Kenworthy, ‘87, p.123). The latter are assumed not to cause
problems because:
“1 native listeners are generally used to these features of foreign accents, or
2 there are regional accents or varieties of English that use the particular feature
so it is familiar to English ears, or
3 the feature is ‘close enough’ to the native feature ([...]), or
4 relatively few words are kept apart by the feature or sound.” (ibid.)
However, if we analyse or test her definitions for the different levels of priority with
regard to their implications, a somewhat strange picture might arise. I shall perform
this comparison based on Kenworthy’s list of features of problems for German lear-
ners, starting with some of the high priority problems in segmental productions.

Chapter 2: The Evaluation of Non-Native Speaker Performance.
20
One of the high priority issues according to Kenworthy is what we may call final
fortition (Germ. Auslautverhärtung), a feature that is generally said to occur in final
plosives in German, although, at least according to my experience and my own
pronunciation, it may only occur in the standard and northern accents. Kenworthy
claims that this is a problem in the pronunciation of words like bag, which may be
realised by German speakers as [bQk]. Assuming that this could really lead to serious
problems of misunderstanding, for example potentially in a phrase like “It’s in the
bag.” vs. “It’s in the back.”, I would claim that this kind of problem will only ever
occur in very few cases and then only at the end of a tone or utterance group. In other
words, in relatively few cases would there actually be the potential for causing any
misunderstandings at all and often the context will probably disambiguate this kind of
mispronunciation anyway, so that we would actually end up with one of Kenworthy’s
optional attention features, rather than a high priority one. This claim can be further
substantiated by the fact that final fortition, at least in non-final phrase/utterance posi-
tion, does also occur in at least one native British accent, i.e. in Yorkshire English, in a
phenomenon generally known as “Yorkshire assimilation” (Wells, ‘82, p. 366), where
the final voiced plosive in a word is influenced by a following voiceless obstruent at
the beginning of the next. This would then tie in with criterion number 2 for optional
attention features, i.e. the occurrence of a particular feature in a variety of English.7
The same, only to a far larger extent, would then apply to the ‘high priority problem’
of there being no /Ã/ in German. If occurrence of a feature in a regional variant makes
a feature an optional attention one, why should foreign learners have to learn how to
produce this particular sound in the first place if a very high percentage of the British
population uses an /U/ instead and does not have the /Ã/ in its inventory, either? Presu-
7 A similar case might be made for the non-aspiration of otherwise voiceless initial plosives that may
occur with my Franconian speakers, which is also found in some Yorkshire accents. However, the main difference between Franconian and Yorkshire here is that generally in Franconian voiced and voiceless/aspirated plosives tend to be confused, whereas in Yorkshire accents, non-aspiration is restricted to initial positions (c.f. Wells, ‘82, p. 370)

Chapter 2: The Evaluation of Non-Native Speaker Performance.
21
mably only if one strictly adhered to the ideology that the only form of representative
British English is some form of Southern English.
Similar arguments would apply to most of the other vocalic features Kenworthy sees
as high priority items, namely her claim that the diphthongs /eI/ and /ou/ (the latter
presumably standing for RP /«U/) tend to be realised as long monophthongs, and that
German speakers tend to confuse /a/ (presumably standing for RP /Q/) and /E/ (presu-
mably standing for RP /e/). As far as the former is concerned, this would again have to
be relegated to the level of optional attention as it is still a highly common feature in
many Northern accents. The latter could well fall somewhere between categories 2
and 3 as younger British speakers, and especially those from the North-West, do often
realise the /e/ phoneme with a very open quality [E¢] that could easily be confused with
an [Q£].
Bearing in mind that many of the problems on the segmental level mentioned by
Kenworthy would – even according to her own classification scheme – not really pre-
sent any problems, why is it then that we do get comments like the ones described in
1.4.3? The concept of similarity to a native accent on the segmental level, at least not
with respect to most of the features she has isolated, clearly does not seem to be a very
useful one.
A more useful way of approaching the problem would then be to think of it being
either due to segmental level features Kenworthy did not identify because she possibly
concentrated only on the most obvious ones, or to assume that suprasegmental
features play a far greater role in the perception of an accent as being a foreign one.
Kenworthy herself realises that:
“In general, the areas of rhythm, word stress and sentence stress are high priority
areas for all learners.” (Kenworthy, ‘87, 123),

Chapter 2: The Evaluation of Non-Native Speaker Performance.
22
but does not really want to commit herself to giving any priorities for intonation and
consigns herself to pointing out “potential ‘trouble spots’” (ibid) for learners of indivi-
dual languages.
We shall see in the analysis sections further on whether the German speakers’ pro-
nunciation patterns actually exhibit any of the problem areas pointed out by Kenwor-
thy in her section on German (Kenworthy, ‘87, pp. 136-138).
2.2.2. Pennington: Phonology in English Language Teaching.
In her introduction to the book, Pennington claims that:
“The course examines phonology from a variationist, accent-neutral and international
point of view, explicitly comparing the major varieties of English around the world
and using as system of description and transcription which is relatively generic. The
book is therefore usable in non-English speaking as well as English speaking coun-
tries.” (Pennington, ‘96, p. xvi)
In reality, however, her approach cannot really be termed “variationist” because
otherwise she would exhibit a better understanding of the situation regarding accents
of English in Britain and other countries. This lack of knowledge is exemplified
throughout the book, e.g. by her remarks on the prestige of accents:
“Nowadays, a certain reverse-prestige or new prestige is coming to be associated with
the non-RP accents of the major urban centers such as Liverpool and Manchester,
which are establishing their own unique and positive identities at home and abroad.”
(Pennington, ‘96, p. 14)
While it is undoubtedly true that Scouse has become increasingly popular and accep-
ted as a sort of quaint and funny accent that people on Brookside speak, one can clear-
ly not speak of Manchester having a “unique” and “positive” identity, mainly because

Chapter 2: The Evaluation of Non-Native Speaker Performance.
23
there is no such thing as a uniform Manchester accent that could convey such an iden-
tity. Without some kind of in-depth knowledge of the particular accents represented in
a particular country, it may therefore be regarded as slightly presumptuous to follow
the variationist attitude.
This lack of intimate knowledge can also be seen in her remarks on l-vocalisation,
where she describes Londoners (amongst others) saying [hEoUp|] for help and [sEoU]
for sell respectively, and rather absurdly claims that the Bristol l may be a phenome-
non that is possibly related to l-vocalisation. (Pennington, ‘96, p. 69)
Pennington also very laudably, but perhaps a touch unrealistically claims that “Con-
sistent with the variationist philosophy of this book, it is advocated that learners be
provided with multiple models of English phonology and that they be actively in-
volved in deciding what they will learn and in developing their own learning process.”
(Pennington, ‘96, p. 17), but it is difficult to see how this can really be achieved by
teachers who are largely untrained in recognising variation themselves, especially if
even the author of the book that is supposed to teach them how to do this is not
sufficiently qualified to understand the real difference between different variants.
A further minor factor demonstrating that the variationist approach may not be im-
plemented quite as far as the author claims is the fact that she does not use the regular
set of IPA symbols in her transcription, but rather an American set, including symbols
such as [só] for a voiceless palato-alveolar fricative. This already automatically makes
the book less usable in an international context. The same problem applies to her
general description of consonants, where she illustrates the potential complexity of
consonant clusters using a host of rhotic examples that would not be applicable to

Chapter 2: The Evaluation of Non-Native Speaker Performance.
24
many accents of English at all, without duly pointing out the difference, but instead
simply refers to them as “cluster types in English” (Pennington, ‘96, p.37).
A further claim made by Pennington about her textbook is:
“The coverage of the book offers language teachers and other interested readers the
background and experience necessary for:
(a) assessing student’s pronunciation and related aspects of listening proficiency
[…]” (Pennington, ‘96, p. xvii)
Whether a book like this can actually achieve this is questionable as, apart from the
obvious problems Pennington has with describing the different types of English, her
ability to make exact phonetic descriptions is also seriously lacking, as can be seen
from the following passage discussing the assimilatory effects of the prefix in-:
“In the case of words beginning with m, r and l, the initial sound of the adjective was
fully matched, i.e. assimilated, by the prefix in-. In the case of words beginning with
p or b, the assimilation – i.e. the match between the initial sound of the adjective and
the final sound of the prefix – was only partial [sic].” (Pennington, ‘96, p. 27)
and also from her confusion of elision as a process that facilitates pronunciation with
the complete elision (deletion) of whole words :
“In fact, it is common in English to elide individual words, i.e. to run words together
[sic], in casual, non-emphatic speech” (ibid.).
Even straightforward descriptions of some of the consonants of English are some-
times flawed to a certain degree. So, for example, she describes the sounds commonly
referred to by their phonetic symbols as eth and theta as being interdental in English,
whereas in most varieties they are actually realised as ‘pure’ dental consonants, i.e.

Chapter 2: The Evaluation of Non-Native Speaker Performance.
25
with the tongue against the back of the upper teeth, rather than between both rows of
teeth.
She also tends to describe rather unusual phenomena as if they were regular features
of varieties of English, such as for example denasalisation:
“Under the influence of a following non-nasal consonant, a nasal may lose its nasal
characteristic, i.e. be produced with a raised velum, so that air escapes through the
mouth instead of the nose. When this happens, the nasal is said to undergo a process
of denasalization, whereby, for example, hand and had become homophonous.”
(Pennington, ‘96, p. 55-56)
First of all, at least to my knowledge, this kind of denasalisation effect is not a
general feature of any accent of English, but more commonly associated with the
effects of a cold. Secondly, it is quite doubtful whether it may represent a coarticu-
latory effect at all because nasality in English tends to have a persistent effect, which
seems to override oral articulation, rather than the other way round. In a book meant
to provide teachers with elementary knowledge about the processes of connected
speech for teaching purposes, such an isolated and rare phenomenon is therefore quite
out of place and can potentially even be more confusing than useful. Furthermore, it
actually seems to me that, judging from the example Pennington gives, she may
simply be misinterpreting a realisation of hand where there is no separate nasal
segment present, but instead the preceding vowel may be realised as a nasal vowel, i.e.
[hQ)d], a feature which is not uncommon in many American accents. There are also
numerous further examples of this type of inaccuracy, but the ones I have given so far
probably serve as sufficient example of the overall scholarly quality of the book.
Chapter 2: The Evaluation of Non-Native Speaker Performance.
26
The exercises she uses in order to improve “Breath control” (Pennington, ‘96, p.
33f) are at least partially of dubious value because some of them seem to assume that
English is spoken either in longer “breath groups” or that its vowels and consonants
have to be produced with greater clarity of enunciation than a speaker’s L1. Rather
than actually improving the student’s pronunciation, these exercises seem to be de-
signed to improve rhetorical skills, which is not necessarily the most important part of
teaching the language.
Another reason why I believe that the textbook cannot achieve its explicit aim of
providing the reader with the skill of “assessing student’s pronunciation and related
aspects of listening proficiency “ is that Pennington herself does not provide any ade-
quate methodology for even deciding what constitutes a foreign accent, but simply
states that:
“The difficulty of defining ‘foreign accent’ is an important point which has largely
been overlooked by scholars and which is related to the difficulty of defining terms
such as language, dialect, and the like. In spite of these problems of definition, we
can see that a great variety of explanations for ‘foreign accents’ has been put forth in
the literature on first and second language learning […].” (Pennington, ‘96, p. 7)
However, she herself makes no attempts at discussing the results of these explana-
tions, let alone any attempt at setting up her own definition. In other words, she is
working in a vacuum and what little guidelines she gives for a “Hierarchical analysis
of student pronunciation” (Pennington, ‘96, p. 253ff) is relegated to an appendix
which contains more commonplaces than actually useful suggestions as to how to
determine and categorise pronunciation problems a learner might have. Instead, most
of the book is dedicated to, as pointed out before, relatively unqualified and

Chapter 2: The Evaluation of Non-Native Speaker Performance.
27
potentially confusing discussions of supposed native speaker pronunciation
phenomena.
2.3. Defining a More Realistic Norm.
2.3.1. General Criteria.
As far as more general criteria for the evaluation of spoken language performance
are concerned, we need to distinguish between two different levels. These levels may
also be interpreted as different levels of ‘error gravity’.
The first, and more serious one, concerns those phenomena produced by the non-
native speaker that can cause serious problems and may at its worst lead to or repre-
sent a breakdown in communication. This type of error can basically cause misunder-
standing or misinterpretation of various degrees on the part of the listener because the
speaker has mispronounced something.
The second, slightly less serious, level relates to those utterances of the speaker that
may appear unnatural to the listener and thus cause irritation on his or her part. Al-
though errors on this level undoubtedly do not normally lead to a breakdown in com-
munication, it cannot be foreseen what kind of an effect it may have on the listener. In
the worst case, however, this could lead to prejudice or non-acceptance of the speaker
as already outlined in 1.4.2 above.
However, both types of error may produce similar effects in the listener, i.e. cause
different degrees of non-acceptance towards the speaker, e.g. either an immediate
refusal to communicate with the speaker if the listener considers him/her far too dif-
ficult to understand or a gradual distancing due to increasing annoyance or unwil-
lingness to make an effort.

Chapter 2: The Evaluation of Non-Native Speaker Performance.
28
2.3.2. Specific Criteria.
On a more specific level, we can find certain error features like mispronunciation,
ellipses, hesitation, etc., which I shall outline and explain in a little more detail in the
following paragraphs.
a) Mispronunciation: Wrong realisation, erratic placement of stress or assimi-
lation may create different meaning from the one intended by the speaker. In
the worst case, this may lead to genuine misunderstanding, whereas in most
cases the context will resolve phenomena like inappropriate placement of
stress, e.g. using the stress pattern for a noun instead of a verb in those cases
where nouns and verbs are homographs (e.g. insult, export, etc.). The latter is a
very common error produced by all learners of foreign languages and thus
represents one of the more obvious criteria to look for. However, this issue is
often overrated and textbooks on EFL mostly tend to ignore the fact that within
utterance chunks or phrases, especially as their complexity grows, stress may
shift to accommodate to a more regularised pattern (cf. Knowles, 1987: p. 124
ff).
b) Epentheses: Vowels added at the end of words ending in consonants may
give the impression of an indefinite article following the word where none
would be expected. This phenomenon is very often caused by the learner’s
native language having a particular syllabic structure that does not allow for a
syllable to end in a consonant, as in Japanese or Korean. When speakers of
those or similar languages insert epenthetic vowels, this may create the impres-
sion of hesitation, even if none is present and thus ‘disturb’ speech rhythm/flow
or make it difficult for the listener to follow the argument. However, it should
not seriously hinder communication, and complete misunderstanding or actual
breakdown of communication are unlikely to be caused by this phenomenon.
Epenthetic vowels within the word may be more of a cause of misunderstan-

Chapter 2: The Evaluation of Non-Native Speaker Performance.
29
ding than word-final ones as they may actually turn one word into another.
Cruttenden (51994: p. 223) cites the example of sport being realised as [s«p�ùt]
and thus easily confused with support. In general though, epentheses represent
a feature that is more common with speakers of romance languages within
Europe, Arabic speakers and speakers of the aforementioned Asian languages,
and therefore is fairly unlikely to affect any of my German informants.
c) Ellipses: dropping of final plural ‘s’ may cause misunderstanding, but – on
the other hand – is also very widespread amongst native speakers in certain
contexts, e.g. in expressions of measurement, such as three pound, etc. where
there is a certain degree of redundancy established by the number already ex-
pressing plurality.
Elision of single or multiple phonemes in other positions may change words, so
that the overall utterance has a different meaning
d) Reduction of Vowels: normally unreduced vowels are reduced. Word stress
may be lost and words may become unintelligible or difficult to understand
e) Non-reduction of Vowels: normally reduced vowels are unreduced. May lead
to unnaturalness.
f) Hesitation: natural (native speaker-like) vs. unnatural (possibly caused by
lack of appropriate vocabulary), e.g. pauses/fillers which do not serve the
purpose of structuring the utterance
g) Rhythm: unnatural staccato caused by overabundance of stresses/failure to
deaccentuate, thus possibly causing exaggerated emphasis and misleading focus
(c.f. 3.1.2 below)
unnatural staccato caused by creating too many tone groups, thus possibly split-
ting units of sense

Chapter 2: The Evaluation of Non-Native Speaker Performance.
30
elision of too many phonemes, leading to ‘overassimilation’ and possible unin-
telligibility
h) Vowel quality: use of different vowel qualities in certain environments may
cause some misunderstanding, e.g. failure to make a distinction between singu-
lar and plural in man vs. men, etc.
The difficulty still remains to rank these criteria in any specific order, e.g. to set up a
scale of error gravity or unnaturalness, so that it will be possible to rate the perfor-
mance of any given speaker as objectively as possible.

31
3. Previous Research in this Area.
In the following sections, I shall give an outline of some of the more scholarly re-
search previously carried out in the area I am working in and which has given me
some of the main ideas on how to establish the methodology used for my own re-
search. Working in this field of research basically involves dealing with two separate
disciplines, that of research into the second language (L2) acquisition of English by
speakers/learners, in the case of my informants coming from a Germanic background,
and that of general applied phonetics in English. I shall therefore first discuss those
books and articles dealing with the issue of how research into the former can and has
been carried out and then go on to describe some of the most recent approaches in
phonetics. I will therein sometimes only give a brief sketch of some of the issues as
many of them need to be discussed in more detail in conjunction with the actual
methodology devised for my study, which will be outlined in chapter 4.
3.1. Previous Research in Second Language (L2) Acquisition of
English by Speakers/Learners from a German-speaking
Background.
In recent years, a major part of the empirically orientated studies into this area has
been carried out by researchers at Austrian Universities. Below, I shall present some
of those that have been of relevance to my own research, discussing the advantages
and drawbacks of the methodologies devised and used by them, and trying to point out
how they have influenced my own approach.
3.1.1. Wieden/Nemser: “Compiling a Database on Regional Features in Austrian-German English”.
The database set up by Wilfried Wieden and William Nemser is - to my knowledge -
the first ever database to be created in order to analyse what mistakes non-native spea-
kers of English from a specific country (/region within that country) make when trying
Chapter 3: Previous Research in this Area.
32
to speak8 English. In contrast to the database I have set up, however, it is mainly
geared towards analysing vowel and consonant qualities produced by the informants
and not necessarily intonation or stress/deixis (, or fluency9), although according to
the definition of the project, the latter aspects could well be included:
“The aim of the project is first of all to test current hypotheses on second language
(L2) phonological acquisition, e.g. the role of regional and social mother tongue (L1)
varieties as transfer sources for Austrian learners of English, universal constraints,
types of development, the role of such factors as motivation, aptitude, teaching me-
thods, etc.” (Wieden/Nemser, ‘91: p. 350)
Another major difference between the Austrian database approach and mine is the
age and proficiency level of the informants involved in the experiment. This – of
course – represents a reflection of the aim of the individual study. Whereas Wieden
and Nemser choose to try and trace the progress Austrian schoolchildren make in their
acquisition of English as a foreign language from when they first start learning
English to their final year in secondary education (Wieden/Nemser, ‘91: p. 351), my
German informants are all young adults who are or have been studying English at
University level, most of them intending to become teachers10.
Furthermore, there are also major differences between the ‘Austrian database’ and
mine as far as their design and implementation are concerned. Wieden/Nemser use a
non-relational (flatfile-/spreadsheet-like) database, based on the structural features of
SPSS-X, running on the mainframe operating system VMS. My database, on the other
8 Text corpora that aim to study the mistakes that foreign learners make in their writing have also
recently come into existence. One of the most notable amongst them is the Learner Corpus that is currently being developed at the Université Catholique de Louvain, Belgium (see Granger, 1998).
9 I here understand the term fluency as being able to verbally convey one’s ideas in a coherent manner, i.e. pausing in the appropriate places to direct the listener’s attention, making use of appropriate fillers where the speaker is searching for the right expressions and using intonational means to place emphasis on important aspects of the utterance.
10 For some of the implications concerning the age of the learners, see chapter 4.

Chapter 3: Previous Research in this Area.
33
hand, is organised according to a relational system, which makes it easier to link infor-
mation contained in different tables and at the same time reduces the kind of redun-
dancy that sometimes occurs in a flatfile database.
Bearing in mind that the Austrian database project began in 1984, it is easy to under-
stand why a mainframe-based analysis tool was chosen because at that time Windows
systems were not reliable enough for this kind of analysis and the first version of
SPSS for Windows did not appear on the market until sometime around 1989.
Nowadays, however, it should no longer be necessary to have to rely on mainframe
computers, which are, after all, much more complicated to operate and often require
the help of ‘expert computing people’, which a) is sometimes not easy to get and b)
does not allow the researcher to work independently.
One of the reasons for setting up my database under the Windows 9x/NT operating
system(s) was not only to make my work as ‘comfortable’ as possible, but also to
show that one does not have to rely on a Unix or mainframe environment in order to
do efficient computing for linguistic and phonetic purposes. By using commonly ac-
cessible, ‘everyday’ programs like Microsoft Access or Word, one can achieve more or
less the same kind of basic results that before could only be achieved by using highly
specialised packages. Of course, more advanced data analysis may require more
complex procedures and even some programming abilities, but in general, use of those
basic tools can already provide much of the information needed to judge the
usefulness of the collected data, etc., and allows the researcher to remain to some
degree independent of specialists in computing and data analysis. I shall give some
examples for this in the chapters/sections of this thesis that deal with the procedure for
analysis, etc.
Furthermore, using an Access database also effectively creates a corpus resource.
Not only because Access is widely available as part of the Microsoft Office (Professio-
nal) package in general, but also because it can be queried using programming langua-

Chapter 3: Previous Research in this Area.
34
ges such as Visual Basic and others, using the DAO (Data Access Objects) or ADO
(ActiveX Data Objects) interfaces and SQL (Structured Query Language).
Apart from its general availability, the other advantage of using Access is that because
of the relational database approach it is using, one can easily correlate/compare ‘plain
text’ variables, i.e. proper phonetic transcriptions including diacritics, which is a huge
advantage in comparison with a highly complicated numerically encoded database like
the Austrian one, which, because of this kind of encoding, is far more difficult to inter-
pret and highly error-prone. The way phonetic segments are encoded in this database
involves the use of eight digits, divided into two units of four digits respectively if
they are either “phonetically” or “phonemically deviant” (Wieden/Nemser, ‘91: p.
354) or – in the simplest case – a 1 followed by seven 0s, if the segment has been
uttered in an “RP-like” fashion (ibid.). An example cited (ibid.) of one of the
realisations of the word rubber, which only consists of four segments, thus looks like
this: “00004540000200001000000050020000”.
Obviously, encoding all the data in such a fashion is not only extremely time-consu-
ming and expensive, but one may also expect the ‘transcribers’ to make an indetermi-
nable number of mistakes in inputting the data, which might later skew the results of
the analysis. This is especially important, as sometimes current practice in research is
to have a basic transcription undertaken by untrained clerical assistants, as for
example in the transcription of the BNC. The ‘plain text’ approach thus helps to avoid
unnecessary mistakes caused by numerical complex coding as will easily become
apparent if the above example is ‘translated’ into a phonetic representation:
¨ Ã b « 00004540 00020000 10000000 50020000
Table 2: A coding example, adapted from the Austrian Learner database
Note that my ‘translation’ cannot be fully equivalent to the actual coding in the Wie-
den/Nemser database as I do not have access to all the coding information. I have

Chapter 3: Previous Research in this Area.
35
therefore given fully RP-compliant variants for each allophone, whereas in the origi-
nal example, only the [b] is actually RP-conformant.
One of the major problems of the Wieden/Nemser study is that they do not give any
explicit definition of what they understand by making reference to “RP” or how their
reference standard/pronunciation has been established. According to them, their
coding of the variables
“ [...] was based on mainly two types of auditory processing:
a) a normative evaluation of pupil responses by native speakers of English
(acceptability judgements);
b) a normative descriptive account by a trained phonetician, where the target
standard served as a reference norm for descriptive judgements (i.e. dimensional
rather than absolute phonetic values were indicated).” (Wieden/Nemser, ‘91: p. 352).
First of all, there seems to be a contradiction in terms in this statement since “norma-
tive” and “descriptive” methods should be considered mutually exclusive. Any genu-
inely descriptive approach can by definition not be normative since having a norm im-
plies the use of a rigid system that does not allow for a sufficient amount of deviation.
Any natural language, however, always incurs a fair amount of variation, which, for
purposes of description, has to be taken into account. As I shall describe later on
(chapter 7 below), in my reference model I shall try to incorporate a certain margin for
variation, based mainly on how my native speaker informants have actually realised
instances of the same word(s) in the same context(s) in different ways.
Secondly, some problems arise from the fact that there was only one phonetician
transcribing the utterances of the informants and that “acceptability judgements” were
used in order to establish their ‘correctness’. Concerning the first of those issues, sim-
ply no unbiased transcription can be established unless there are at least two indepen-
dent transcribers present, so that transcriptions can be cross-checked if there are any
doubts as to their correctness. According to my own experience in annotating my data,

Chapter 3: Previous Research in this Area.
36
it is extremely difficult to decide in which way exactly a word has been pronounced
and many times when one listens to a recording again, one may actually perceive and
be tempted to transcribe a different sound. Obviously this can also be considered one
of the drawbacks of my own study, but for the scope of a PhD thesis is still justifiable,
whereas for a large scale project it is not necessarily so. With regard to the latter, ac-
ceptability judgements should be considered as highly subjective statements, as accep-
tability for a given native speaker evaluator depends not only on the native speaker’s
own competence, but also to a large extent on his/her own speaking habits and/or (lan-
guage) background, apart from the fact that one may easily become positively or nega-
tively biased towards an individual speakers voice or speaking style and thus
automatically assume that he or she is using the (in)correct pronunciation. Thus, for
example, evaluators who belong to an older generation may regard at least some
pronunciation phenomena of the younger generation (glottal stops, etc.) as incorrect
and (possibly) vice versa. Therefore, it is important to find methods that ‘objectify’
transcription/evaluation as much as possible, such as the method I am using and shall
describe in more detail in my chapter on methodology.
3.1.2. Grosser: “Aspects of Intonational L2 Acquisition”.
In this article (Kettemann/Wieden, ‘93: pp. 81-92), Grosser describes four categories
in which his informants make mistakes with regard to their uses of accentuation
patterns:
a) cumulative accentuation:
is defined as the type of accentuation where more than the necessary number of words
or syllables are accented without it being necessitated by the context in order to give
special emphasis. In essence, this means that the learners have not yet learnt to make
use of stress as a cohesive device. They overemphasise both known and unknown in-
formation and do not know how to deaccentuate or reduce vowels in unaccented
words in order to produce appropriate weak forms.

Chapter 3: Previous Research in this Area.
37
b) alternating accentuation:
is characterised by “an over-abundance of tonal accents when compared to normal
speech, but they are additionally structured by an alternating principle.”, while “Items
with lexical content tend to be tonally accented, the grammatical items, however, are
not produced consistently without tonal accent.” (Kettemann/Wieden, ‘93: p. 84). This
implies that the learners are not familiar with the distinction between form and
function words. They seem to be aware that stress can be used as a cohesive device,
but they use it in a purely rhythmic, rather than ‘semantic’ way.
c) backshifting (final accentuation):
is a slightly misleading term, as “back-” - at least to me - seems to imply pointing
back towards the beginning of an utterance, while what is actually meant by it here is
a shift of accentuation towards the end of it. Grosser explains its effects and possible
reasons as follows:
“The learner utterances with their final accentuation invite a contrastive interpreta-
tion, which is inappropriate in the context given. The failure to shift the tonal accent
from the final position, which is the unmarked position for English as well as Ger-
man, to an item on the left is most probably to be attributed to a dominance of over-
productivity of the final accentuation or end-focus rule.” (Kettemann/Wieden, ‘93: p.
85)
d) fronting of accents:
this represents a phenomenon exactly opposite to the “backshifting” phenomenon,
namely causing a word to the left of the actual word to be accented to receive promi-
nence. This, according to Grosser, is “usually signalling ‘marked focus’” on the word
thus made prominent, “whereas the context would have required an accent further to
the right” (Kettemann/Wieden, ‘93: p.85).
Grosser’s first two categories seem to be fairly straightforward to me, although he
does not try to explain them sufficiently. However, the definitions and explanations for

Chapter 3: Previous Research in this Area.
38
the latter two may raise some doubt. First of all, as already indicated above, the term
for category c) is misleading and secondly the two should/need not necessarily be
treated as two separate phenomena as they are both phenomena which equally cause a
shift of focus to an otherwise unaccented syllable. In order to be able to explain them
better, I will hereafter refer to as c) as ‘right-shift’ and d) as ‘left-shift’ respectively, as
these provide a better way of describing positions relative to the word that should
actually be accented, but at the same time avoiding the use of an ambiguous term like
“backshifting”.
If one can really make a distinction between the two different functions right- and
left-shift seem to fulfil, they should rather be defined in exactly the opposite way to
that in which Grosser defines them because in most of his examples it is the left-shift
rather than the right-shift that fulfils a genuinely contrastive function, whereas the lat-
ter is actually responsible for what Grosser calls the “marked focus”. To illustrate my
point, I shall here give two of his examples and discuss them:
“(16) (What’s the time?) / It’s FOUR o’clock /”
“(12) (How far is the busstop?) / About a mile from HERE /” (Kettemann/Wieden,
‘93: p. 85)
For the type of response in Grosser’s example (16) – with prominence on “four”
rather than “o’clock” – one would usually presuppose a preceding question like Is it
three o’clock? and the answer possibly to be prefixed by an ‘antithetical’ No, ... ,
which would clearly mark it as contrastive instead of purely giving focus. However,
for example (12) a question that would render its function contrastive could not easily
be found, so that it is safer to assume that it is just giving some kind of prominence
which may not be categorised easily.
On the other hand, a left-shift need not always express a genuinely contrastive func-
tion, but may rather cause a pseudo-contrastive or pseudo-emphatic effect as can be
seen in another one of Grosser’s examples:

Chapter 3: Previous Research in this Area.
39
“(17) (Where is the poster?) / The POSTer is ON the wall /”
(Kettemann/Wieden, ‘93: p.86)
Here, the added focus on on simply cannot invite a contrastive interpretation as the
semantic relation between poster and wall can only be idiomatically expressed by this
one preposition and thus there can be no way of establishing a contrast. It would, for
example, usually not make sense to say The poster is in/over/above/behind/outside/
etc. the wall. In other words, it is the absence of paradigmatic choices which makes
the stress on the preposition appear ‘deviant’ in this case. On the phonetic level, this
manifests itself in a difference of rhythm where the prepositional phrase appears more
‘disjunct’ than it would if it had normal stress, which is at least to some extent due to
the fact that stress on the preposition tends to go along with a blocking of what I refer
to as perseverative nasal assimilation (c.f. 8.1.2 below) between the otherwise un-
stressed preposition and the following article.
In part four of his article, Grosser describes the changes observed in the intonational
behaviour of his informants at the end of their second year of learning. This, in itself,
does not have much relevance to my study as his informants are schoolchildren be-
tween the ages of 10 and 12 years, whose intonational competence in their own
mother tongue may not be fully developed yet, whereas my speakers are all adults and
should therefore at least be able to master the intonational intricacies of their own L1.
However, since Grosser here interprets phenomena similar to those that I had
originally planned to analyse in my own study, I shall at this point take a brief look at
some of his observations.
“In a structure of two syntactically co-ordinated parts the first member may be termi-
nated by practically any tone type, whereas the second most frequently selects some
kind of falling tone. […] It is a well-known fact that in the examples below a se-
quence of ‘rising + falling’ (a) signals greater cohesiveness than a sequence ‘falling +
falling’ (b).

Chapter 3: Previous Research in this Area.
40
(a) / The lion was the king of the animals↑/ but he was old and weak↓/
(b) / The lion was the king of the animals↓/ but he was old and weak↓/ ”
(Kettemann/Wieden, ‘93: 87)
Here, Grosser makes a rather sweeping generalisation, perhaps because he himself is
not sufficiently aware of the complex interplay between speaker’s intention, genre,
grammatical structure or coherence and features of stress and intonation. He apparent-
ly views syntactic co-ordination as something that is always directly reflected on the
intonational level, as his rather unfortunate example shows. He seems to attribute the
cohesive effect between the two co-ordinated phrases as being based upon a rise in
intonation at the end of the first one, while on the one hand underestimating the cohe-
sive force of the adversative conjunction but and on the other hand the simple fact that
the length of the pause between the two phrases, probably combined with the presence
or absence of something similar to what Cruttenden (‘86: p24) refers to as anacrusis in
the second phrase will probably be more effective in producing the ‘fairy tale effect’
he must have been thinking of when he chose this example.
He states that, as his learners progressed, their use of rising tones at the boundary
between the two sentences increased significantly (Kettemann/Wieden, ‘93: p. 87) and
concludes from this that:
“Despite the obvious differences in syntactic and semantic complexity of the struc-
tures involved in L1 and L2 learning it might be plausible to assume a similar pro-
sodic process which, in the initial stages of L2 acquisition, favours low ending tones
with stretches of utterances which may be seen as semantically complete. The in-
crease in high ending tones might then be seen as being due to a growing awareness
of the various prosodic options the text offers beyond the basic distinction complete
vs incomplete.” (Kettemann/Wieden, ‘93: p. 88),
but also remarks that

Chapter 3: Previous Research in this Area.
41
“Further evidence from more advanced learners is needed in order to decide at which
point accentual signalling of focus structure is fully developed.”
(Kettemann/Wieden, ‘93: p. 92)
However, some preliminary - but as yet still very superficial - auditory analysis of
the data in my corpus would seem to contradict his hypothesis, as my German “more
advanced learners” appear to make their distinctions between “complete vs incom-
plete” rather on the basis of punctuation than semantic content, especially in the case
of longer, syntactically more complex sentences. As far as the problem of misplaced
accentuation is concerned, Grosser may have made a good attempt to isolate which
particular phenomena occur and to classify them, but his classifications are unfortu-
nately only of an almost purely structural/syntactic kind and he does not make enough
of an attempt to explain the reasons behind the informants’ mistakes, and especially
does not even attempt to find a solution to the problem. Thus he only talks briefly
about “contrastive interpretation” or “marked focus”, but does not explain whether
they might be caused purely by the need to give emphasis or any kind of deictic (per-
sonal or local) functions as I shall attempt to do in my thesis. Overall, because of his
apparent preoccupation with phenomena on the structural level, his way of analysing
what the learners produced unfortunately seems more like a parse of a piece of written
language than an analysis of spoken utterances.
3.1.3. Munder: “Is Intonation Teachable?”.
Munder’s article appeared in a collection of papers (edited by Halford/Pilch in 1994)
presented at a symposium on intonation. In this paper, he argues for an approach to-
wards teaching intonation to foreign learners of English which would be quite diffe-
rent from the ‘traditional’ methods of using pattern drills and teaching the students a
complicated set of rules.

Chapter 3: Previous Research in this Area.
42
“In other words, the teaching of intonation should not make the student learn fixed
rules and patterns of intonation on the basis of isolated sample sentences. [...] Rather,
it is necessary for the learner to be able to evaluate each communicative situation to
the effect that he can always actively adapt his communicative behaviour on the
basis of what he knows about the elements of intonation in the above-mentioned
broad sense and their general functions, and above all of what he knows about the
communicative setting and the interrelations between the ongoing communication
process and this setting.” (Halford/Pilch, ‘94: p. 146)
In view of the complexity of the phenomenon of intonation, Munder’s proposal
seems to make some sense. As I have already pointed out in my introduction, even
native speakers cannot always tell what exactly is going on prosodically, so that
reacting to and being able to use intonation efficiently seems to somehow rely on the
speaker’s ability to produce something marked with respect to a certain kind of default
intonation contour (see e.g. Knowles, ‘87: p. 122 for a similar idea). However, the
difficulty of the situation remains that this default seems to change according to the
context and it may therefore be very difficult to come up with a set of ‘intonational
stereotypes’ that may represent default cases. Furthermore, as features of intonation
normally go hand in hand with other features of prominence, there is a need for a
more basic approach to the teaching of prominence itself as a prerequisite for
understanding and being able to use intonation more effectively.
3.2. Relevant Issues in Phonetics.
The basic theory behind phonetic analysis – unlike phonological theory – has not
changed dramatically since the late 1940s, when machines such as the sound spectro-
graph were invented and made the visualisation of speech sounds possible. Indeed,
some of the still universally accepted models for speech production, such as the
source-filter theory, even go back to the 19th century (Lieberman/Blumstein, ‘88,: p.
1). However, no comprehensive account of all the developments since then (or even

Chapter 3: Previous Research in this Area.
43
before) seems to exist and this is a topic that would definitely merit investigation.
However, a very useful account of the various aspects and principles of phonetics is
Laver, ‘94, although this book seems at times less than well-structured.
Most of the advancements in phonetic research since the 1930s seem to have been
made in the refinement of the methodologies and analysis algorithms used and are to a
large proportion due to the availability of computer programs which make the analysis
of the speech signal more accurate and easy. Thus significant advances have been
made through analysis of spoken corpora on a larger and finer scale or speech recogni-
tion and modelling based on statistical/probabilistic concepts like HMMs (Hidden
Markov models; cf. Knill/Young, ‘97).
Nevertheless, even with access to all the technological means of and tools for analy-
sis, there remain a few problems in trying to describe the phonetic features of any na-
tural language and establishing appropriate methods for teaching them, some of which
I shall describe in the following sections.
3.2.1. Defining a Standard.
Most textbooks on the pronunciation of English that are supposed to help teaching
foreign learners how to speak English correctly still adhere to the concept of Received
Pronunciation (RP) as a teaching standard – at least if they want to teach them British
English. They thereby completely disregard the fact that this is not necessarily a very
practical concept, as the foreign learner will probably hardly ever get a chance to hear
anybody speak using this particular accent outside the language classroom. On the
contrary, most accents that the learner may be exposed to in Britain will be more or
less non-standard and probably very difficult to understand if the learner expects to be
presented with the kind of “careful colloquial style” (Gimson, ‘62: p. 278 &
Ramsaran, ‘89: p. 306) or “relatively careful pronunciation” (Cruttenden, ‘94, p. 266)
that textbooks like Gimson’s Introduction to the Pronunciation of English propose as

Chapter 3: Previous Research in this Area.
44
a model for the learner to acquire. Even though in the fifth edition, slightly confusing-
ly now called Gimson’s Pronunciation of English, Cruttenden has reworded and pos-
sibly defused some of the rather biased-sounding terms like “rapid familiar” to “more
colloquial”, he is still using the same examples for illustration of the differences
between careful and colloquial speech that had been used ever since the first edition,
of which I shall here just present the beginning for illustrative purposes:
“A. What do you think we should do this evening?
(1) Èw�t dU jU ÈTINk wi(ù) SUd duù DIs iùvnIN
(2) Èw�dZU ÈTINk wI S«d duù D«s iùvnIN
B. How many of us will there be?
(1) ÈhaU menI È�v «s wIl De« biù
(2) ÈhaU mnI «v «s l D« biù [ ...]”
(Cruttenden, ‘94: p. 266 f.)
This text seems to contradict some of the advice given in the preceding paragraph,
mainly the one given to German speakers:
“German speakers, in particular, should avoid an excess of pre-vocalic glottal stops”
(Cruttenden, ‘94: p. 266)
The type of careful pronunciation shown above actually encourages the use of
glottal stops in all prevocalic positions because it makes the speaker treat all words
rather like individual, over-carefully enunciated units of the sentence, instead of
treating them as part of the speech chain by assimilating or linking them in the natural
way which is sometimes assumed to be more typical of spoken English than spoken
German. Therefore a German speaker trying to adopt a rather careful pronunciation
will automatically separate individual words more than any native speaker and by
pausing – and thus creating a hiatus – increase the occurrence of glottal stops in pre-
vocalic as well as other positions. For more on the differences in the usage of glottal

Chapter 3: Previous Research in this Area.
45
stops between the native and the German speakers in my analysis and the effects that
they produce, see 8.1.9.
Furthermore, the mere fact that any one particular accent may have been or still is
partly associated with a certain amount of prestige does not make this a reason for
using it as a teaching standard. Even less so if only about 3% percent of the population
use it (Hughes/Trudgill, ’87: p. 3) and some of its features like the Ã-sound in words
such as butter and but and the /Q/ in bad actually only are to be heard in maximally
half of England, c.f. Wells, ‘82:
“From a linguistic point of view, the population of England is about equally divided
between the north and the south. If we exclude the small number of RP speakers
(who are scattered throughout the whole country), about half of the English speak
with some degree of northern accent.” (Wells, ‘82: p. 349)
and according to Hughes/Trudgill, ’87 (p. 30/31) occurrence of the latter is questio-
nable in about another third of it. Of course, numbers like this can only give a very ge-
neral picture of the actual situation, which is far more complex because even if the
realisation of those vowels may be classified as being similar to the RP realisation,
their actual phonetic quality is likely to vary considerably from one accent to another
and their degree of similarity to RP may only be very superficial. On the basis of this
kind of variability, however, it would be rather ‘unfair’, for example, to judge as
incorrect a non-native speaker’s pronunciation that might in many respects be close to
that of a native speaker’s speaking with a regional accent.
Furthermore, not only does RP differ from many non-standard accents on the seg-
mental level, but also on the supra-segmental one:
“A specific case in point is provided by the intonation typically used in statements in
‘Urban North British’ (UNB) English. UNB is the cover term proposed by Crutten-
den (1994) for the varieties of English spoken in Belfast and Glasgow (and Northern

Chapter 3: Previous Research in this Area.
46
Ireland and western Scotland generally), together with the varieties of several major
English cities, in particular Birmingham, Liverpool, and Newcastle. Intonationally,
the most conspicuous characteristic of these varieties is that the ordinary intonation
on statements is rising or rising-falling.” (Ladd, ‘96: p. 123).
This may easily lead to confusion and misunderstanding on the part of the learner
trying to identify the intentions and cohesive strategies of many native speakers.
Therefore, I believe that there is a definite need for a redefinition of the current tea-
ching standard, one that does not remain based on the old-fashioned elitist stereotype
of the Cultured English Gentleman wearing his bowler hat and carrying his umbrella
around the financial district of the City of London, making constant allusion to the
works of William Shakespeare – an image that is still far too often to be found in text-
books.
3.2.2. Textbooks on Prosody.
As ultimately the main emphasis of the analysis has turned out to be on segmental
aspects my data, this section only represents a rather impressionistic and superficial
discussion of available textbooks on prosody, mainly pointing out some of the general
approaches covered by them and the problems that exist with these approaches. I
believe that an in-depth discussion would only have been practical had I been able to
properly contrast my findings with these approaches and their findings.
While there are many established textbooks that deal with almost exclusively
segmental aspects of the pronunciation of English, these days there are probably no
officially recognised standard textbooks for prosody. It seems to be more or less uni-
versally acknowledged that drill books such as O’Connor/Arnold, ‘73 do not really
capture the essence of intonational functions to an extent that would enable the learner
to reach a suitable level of abstraction and understanding of everyday English intona-
tion, a fact that comes as no surprise if one listens to the extremely artificial quality of

Chapter 3: Previous Research in this Area.
47
the accompanying recording. The same unfortunately goes for some of the more theo-
retical approaches, such as Cruttenden, ‘86, where the examples read by the author are
often characterised by an unrealistically slow speed leading to an over-enunciated and
unnaturally high number of tone groups.
Some of the main textbooks that currently exist are David Brazil’s The Communi-
cative Value of Intonation in English, Alan Cruttenden’s Intonation, Elizabeth Couper-
Kuhlen’s An Introduction to English Prosody and D. Robert Ladd’s Intonational
Phonology. In general, there seems to be a division between books like Brazil, ‘97,
which stress the communicative aspect of intonation, and those that treat intonation in
a more scientific, phonological way, only partly incorporating the notion of communi-
cative function. Another main difference between the individual textbooks is that most
of them still work on often invented or at least only impressionistically transcribed da-
ta, rather than attempting a combined auditory and acoustic analysis. The main notable
exception to this is Ladd, ‘96, whose approach of instrumental intonational phonology
provides a more realistic description of the data he discusses. I believe that a mix of
all three approaches is probably the most useful way of recording and describing the
essential features of intonation, and trying to reduce them to something that may at the
same time fulfil the criterion of being a scientific description, but yet explains the
communicative side in terms that represent an abstraction that may also be applied in
teaching.

48
4. The Methodology.
4.1. The Pilot.
Before the actual recordings for the data currently used for the study took place, a
pilot study was conducted to find out in which areas major differences in
pronunciation between native and non-native speakers may exist and which
phenomena would be particularly worth looking into. For this purpose, 26 test
sentences – taken from a list of sentences developed by W. Barry (Barry, ‘74: pp. 202-
208) for his study of the pronunciation of English by German schoolchildren from
different areas – were recorded. They were read by some of the non-native speaker
informants who were later on going to take part in the main study and two native
speakers who work as lectors at Würzburg University, teaching practical language
classes, excluding pronunciation.
From this pilot study several conclusions were drawn. First of all, isolated test sen-
tences could not produce any “natural” data as they are taken out of context and thus
always appear somewhat artificial. Therefore, a text representing/creating a possibly
more natural situation/environment was be needed.
In order to gather information about the use of intonation patterns, also a longer
piece of text was necessary, which could then reflect different types of intonational
behaviour placed in a context, especially since all of the test sentences had been
statements only.
Thirdly, the speakers would have to be familiar with the text they were reading, as
problems understanding the vocabulary could lead to “funny” intonation patterns. One
speaker (G06) for example did not understand the word tethered in the test sentence
“The horse was tethered to a pine.” and thus not only produced a very long pause be-
tween tethered and to, but also raised his pitch strongly towards the end of the sen-

Chapter 4: The Methodology.
49
tence so that his realisation of this sentence did no longer appear to be a statement, but
rather sounded like a highly astonished question.
Figure 1 – Intonational effect caused by an unknown word in the pilot study.
Only by having the speakers go through the text to see whether they understood
everything could therefore unanticipated parameters be avoided, which might
otherwise skew the end result, or at least lead to unforeseen difficulties during the
analysis.
4.1.1. Familiarity and Naturalness.
The above mentioned familiarity with the text is a factor of high importance, albeit
not an indisputable one. I shall refer to some of its implications further down in my
discussion of the advantages and disadvantages in using a dialogue as a means of data
collection.

Chapter 4: The Methodology.
50
4.2. Informants.
4.2.1. The German Informants.
The 10 German speakers (seven female and 3 male) all came from or had lived in
Franconia – an area at the northern edge of Bavaria – for a long time, as the original
study had originally been geared towards finding out about how speaking with the
particular accent from this area would affect the informants’ pronunciation of English.
Some of those features, as for example confusing voiced and voiceless consonants,
can be expected to influence their pronunciation in a particular way. However, this is
not only a feature of this particular German accent and as far as intonation is
concerned, more general information about all German speakers’ use of English can
probably be drawn from the data, and conclusions about the accents of other learners
of English should hopefully also be possible.
All of the informants studied or had studied English at the University of Würzburg,
either to become teachers of English or to obtain an MA. Studying learners of this age
group and trying to find ways of making it easier to teach pronunciation and
intonation to them should prove more challenging than observing schoolchildren,
especially since the former are at an age level where some people claim one can no
longer learn a foreign language effectively. All of the learners had been studying
English for at least seven years in school, and additionally another one to four years at
university. During their time at university, they would have had to attend various
practical language courses and most, if not all of them, would also have taken a
theoretical course in phonetics. Eight of them had also been involved in activities of
the University’s English Drama Group and had a little bit of acting experience, which
ought to have improved their accents and enunciation to some extent.

Chapter 4: The Methodology.
51
4.2.2. The Native Speaker Informants.
The native speaker informants (five female and two male) came from places all over
England and one of them even from Singapore. This last speaker was selected as an
informant because her accent is closer to RP than that of any of the other informants.
This shows how misleading and erroneous it can be to interpret RP as the only proper
English accent which should serve as the model for English language teaching.
Most of the informants had a teaching background as teachers of EFL and had spent
some time abroad. All of them were either studying for an MA or PhD in the Depart-
ment of Linguistics and Modern English Language at Lancaster at the time of recor-
ding.
4.3. The Dialogue.
The dialogue consists of 28 individual grammatical sentences of varying length and
complexity, most of which represent a speaker’s turn. Its subject represents an every-
day situation, one person asking another for the way to the train station and a follo-
wing description of how to get there.
It was written to include all the vowels occurring in the phonemic model of RP
English, so that there could be as much of a basis for comparison as possible between
the German and English speakers as far as the realisation of vowel qualities is con-
cerned. Its design is therefore akin to using a greedy algorithm in research for
language engineering, whereby a text is picked from newspaper or other corpus
material on the basis of covering as many words illustrating the phonetic phenomena
under investigation (c.f. Chollet et al, ‘98: p. 120). It also includes questions, answers
and enumeration-like sentence patterns, allowing for comparison between the different
intonational patterns used by native and non-native speakers. Analysis of these fea-
tures was originally intended to represent one of the main parts of the overall analysis.
The complete text is shown below:

Chapter 4: The Methodology.
52
Speaker 1: Excuse me, could you tell me the way to the train station?
Speaker 2: Oh, I'm not sure whether I can explain it from here. But look, there’s a map
of the area on that board over there. I might be able to show you more easily if we
look at that. Do you have your car with you or are you on foot?
Speaker 1: I think I'll be walking since I don’t have a car!
Speaker 2: Right, then! Go straight on until you get to the zebra crossing, then con-
tinue up to the town hall. You'll see a fountain in front of you and then bear right.
That road will take you down past the library on the left and the Crucible Theatre.
Look out for the underpass, go through it and head towards the University.
Speaker 1: Is that the big white building near the Odeon cinema?
Speaker 2: Yes, it is. From there you'll be able to see the station. It's at the very bottom
of the hill. Is that okay or would you rather take a bus.
Speaker 1: That depends on how far it is. How long do you think it will take me?
Speaker 2: Well, I usually manage it in about 20 minutes, but you’ll have to allow at
least a quarter of an hour to buy a ticket. The queues are always very long.
Speaker 1: Oh, that won’t be a problem. I already have my ticket.
Speaker 2: In that case I wouldn’t bother taking the bus. The number 60 is very unreli-
able anyway.
Speaker 1: That sounds simple enough. Thank you for your help. I hope I haven’t
made you miss your bus now! Goodbye!
Speaker 2: Goodbye!

Chapter 4: The Methodology.
53
4.3.1. Advantages and Disadvantages of Using the Dialogue as a Means of Gathering Information on Spoken Language.
As I have already described above, the dialogue was designed to elicit certain
aspects of pronunciation and prosody. In its design and consequent implementation, a
compromise had to be made between collecting natural(ly) spoken data and a text read
aloud. In the following, I shall attempt to explain why and where it is necessary to
make this kind of compromise in general and to justify my decisions with regard to
the aims of my analysis.
4.3.1.1. Analysability.
One of the main factors in analysing spoken data is the quality of the recordings.
The degree of quality required depends, of course, on the type of analysis one wants to
perform. If it is purely a matter of transcribing classroom or conversational data used
for semantic, gender or discourse analysis, then the quality need in most cases only be
high enough to understand what is being said, whereas for a ‘full-blown’ phonetic
analysis it has to be as high as only possible. Everyone who has ever tried to
transcribe a piece of spoken discourse from a tape even just orthographically knows
that it can be very difficult to make out just what a speaker is actually saying.
Background noise, loudness or clarity of enunciation can have a major influence on
the listener’s perception and therefore the quality of the transcription. In trying to
produce a phonetic/phonemic transcription, this becomes even more difficult as one
has to perceive not only what is said, but also, and especially, how. Having one’s
informants produce the same text makes the task of ‘transcribing the what’ a little
easier by somewhat ‘normalising’ the output. However, even if one supposedly knows
what the speakers are producing, one still has to allow for a certain variability on the
part of each individual speaker. Thus a particular speaker may show a strong
preference for certain fillers or produce a large amount of hesitation phenomena that
also have to be faithfully included in the transcription as they will affect the overall
speech rate and rhythm. Features like this have in the past sometimes tended to be

Chapter 4: The Methodology.
54
even ‘more normalised’ (i.e. deleted) because they often tended to be seen as
redundant, i.e. not contributing to the meaning of utterances. They were thus often
interpreted as unimportant, rather than interpreting them as strategies employed by the
speaker to structure the text. This was due to the fact that corpora of spoken language
have largely been interpreted in the same way as corpora of written language.
And those are only the problems the ‘human interpreter’ encounters when trying to
analyse the data. Yet the problem of analysability is far greater for the non-human in-
terpreter, i.e. the computer or rather those special programs that should enable the re-
searcher to detect and isolate certain features of speech that a purely auditory analysis
would fail to recognise. However, while the human listener is able to make a great
deal of allowance for irregularities in speech and can on the basis of inference still
determine the content of an utterance, computer programs usually need an extremely
high quality input in order to be able to interpret and display the data correctly and
may sometimes fail completely if they encounter a high degree of background noise:
“The signal-to-noise ratio should be maximized. That is, the signal should be at least
20 dB above the level of background noise. In most cases analysis procedures will
not work unless the voice of a single speaker can be recorded in a quiet environment.
For example, pitch extractors that derive the fundamental frequency of phonation
need a recorded signal that contains the speech signal of only one speaker. The pitch
extractor cannot track the voice of one speaker when a second voice simultaneously
occurs, as is often the case when one records a normal conversation. Nor will pitch
extractors work when competing periodic noises occur, for example, when the tape
recording contains the low frequency, low amplitude sounds produced by some cen-
tral air-conditioning systems.” (Lieberman/Blumstein, ‘88: p. 74)11
11 For more information on the constraints imposed on the collection and analysis of spoken data see
Gibbon et al., ‘98.

Chapter 4: The Methodology.
55
Therefore, although one might argue that the use of read material may lead to a kind
of precision in the delivery of the informants that would not occur in natural unscrip-
ted speech, it is to a certain extent necessitated by the need for qualitatively analysable
data. However, I believe that one can, and should always, try to alleviate the negative
effect of scripting by making the scripted situation as natural and close to real life as
only possible. After all, this also reflects the only way in which the teaching of spoken
language can be achieved in the language classroom, by approximating or simulating
situations as they may occur in real life situations the language learner may encounter.
4.3.1.2. Comparability.
A second major factor, especially in a contrastive analysis like mine, is the one of
comparability. In order to be able to draw any valid conclusions from individual rea-
lisations of spoken material, its instances have to be as similar to one another as pos-
sible since, even more so than it is the case in written language, realisations in spoken
language are highly context dependent. While in written language there is only a limi-
ted degree of variability as far as both (syntactic) context and realisation are con-
cerned – usually words in written texts are delimited by spaces or punctuation marks
and there are normally very few spelling variants, if any, for each word – in spoken
language no word is ever pronounced exactly the same way twice even by the same
speaker and there is a large amount of variability according to the speaker’s regional
and social background.
Using a prefabricated text to be produced by the informants can eliminate some of
those problems by doing two closely related things. The first one is to impose at least
a loose structure upon the utterance(s) of the speaker(s), so that relevant details may
later be more easily compared and identified by the researcher. In the case of my data
this is particularly important in order to be able to observe the (both native and non-
native) speakers’ turntaking behaviour and text comprehension abilities. The latter of
the two is obviously more important as far as the non-native speakers are concerned,
Chapter 4: The Methodology.
56
but can also reveal specific strategies the native speaker may employ to convey diffe-
rent types of information.
The other aim is to be able to elicit specific types of more performance-related infor-
mation like the pronunciation of individual words, features of assimilation, intonatio-
nal structures, etc. In any non-scripted situation, eliciting this type of information
would be rather difficult as there could only be very little direct control over which
words the individual speaker would be using to describe a particular incident or situa-
tion and thus to create a comparable context. The only alternative way of eliciting this
kind of information that I have come across so far is the one adopted in the HCRC
Map Task Corpus project (cf. Thompson et al., ‘95), which constrains the speaker’s
situation and choice by giving the participants in a dialogue two slightly diverging
maps with some common landmarks on the basis of which a route giver and a route
follower have to establish the way to a target point in a way that is similar to informa-
tion gap filling activities sometimes used in the language teaching classroom.
However, as convenient and necessary it may be to impose this kind of structure
upon the data, there are some problems one constantly needs to bear in mind when
analysing the material collected in this way later. For example, some of the
phenomena that typically occur in natural nonscripted spoken language like hesitation
phenomena may be governed by punctuation rather than the speaker’s overall
understanding of the text. The same may also be true of intonational contours. Apart
from this, when creating such material, one always runs the risk of creating something
‘constructed’ or artificial that may not be used much in everyday spoken language,
something similar to the degree of artificiality that is unfortunately to be found in most
textbooks for foreign learners. Thus certain phrases or expression may end up being
highly suitable for eliciting certain phonetic detail, but may sound rather odd to the
native speaker’s ear. This risk is especially high when the material is created by
researchers who are non-native speakers themselves, as they may sometimes not
possess enough knowledge of idiomaticity or current usage, especially if they

Chapter 4: The Methodology.
57
themselves have only/mainly learned their English from the aforementioned
textbooks. In order to avoid any danger of this happening, I created the dialogue used
for my study with the help of a native speaker friend of mine. However, even this did
not prevent some strange reactions to parts of the dialogue by other native speakers,
which seems to indicate that there is no absolutely foolproof way of creating any such
material.
4.3.1.3. Familiarity.
The final important advantage in using prefabricated material is that the speakers
can gain a certain degree of familiarity with the text they are later supposed to pro-
duce. Even though this might in the first instance rather seem like a disadvantage be-
cause it could lead to a high level of precision or a tendency for the informants to act
out the text instead of producing it naturally, it may nevertheless be a necessity for
both native and non-native speakers for two different reasons. The first of those is that
the informants need to know what the situation is so that they can actually produce
something natural since otherwise they would have to employ certain strategies for
understanding the text in the first place, which would lead to a style of delivery that is
closer to reading than to speaking, and may not use appropriate intonational structures
because they have to process the content first. The second reason is more important
for non-native speakers (although it could technically apply to native speakers as well)
and relates to knowledge of the vocabulary used in the text. If an informant comes
across a word he/she does not actually know or understand fully, this will not only in-
troduce hesitation phenomena like extended pauses that will render the speech rhythm
more unnatural, but may also lead to ‘distorted’ intonation patterns, for example when
a given speaker starts ‘questioning him/herself’ and thus intonationally turns a state-
ment into a question (c.f. my example in Section 4.1 above).

Chapter 4: The Methodology.
58
4.4. Recording and Recorded data.
4.4.1. Recording of the Dialogue.
Overall, 9 native and 10 non-native speakers were recorded. Of the nine native spea-
kers, the two speakers used for the pilot study were excluded from the final study as
they are of a different generation than all the other informants and therefore show a
strong deviation as far as vowel qualities and manner of pronunciation are concerned.
However, this may not only have been due to their being older than the rest of the
speakers, but could also have been influenced by two more factors. For one, both of
them had at the time of the recordings already been living in Germany for quite some
time and therefore probably spent more time speaking German than their own mother
tongue, which may have been an influence on the way they were speaking the latter.
The other is that as they had both been in the language teaching profession for a fairly
long time, they had apparently developed a kind of over-careful enunciation, which
was not to be found with the younger native speaker informants, even if most of them
were EFL teachers themselves.
Each informant was asked to read the dialogue on his/her own so that all the dif-
ferent sentence patterns described earlier would have to be realised by every one of
them. Due to the time and resource constraints of a PhD thesis, this seemed the best
way of eliciting the desired material, but has the disadvantage of making the dialogue
situation less realistic than it could be if there were real interaction between two
participants. For larger scale projects it is therefore definitely advisable to have the
same kind of dialogue read in complementing pairs, where first one informant reads
the first speaker’s part and the second informant the second speaker’s and then vice
versa. This is the strategy adopted in the aforementioned Map Task Corpus.
Recording conditions for all the German speakers were the same; for the native
speakers recordings sometimes took place in different rooms. By no means can those
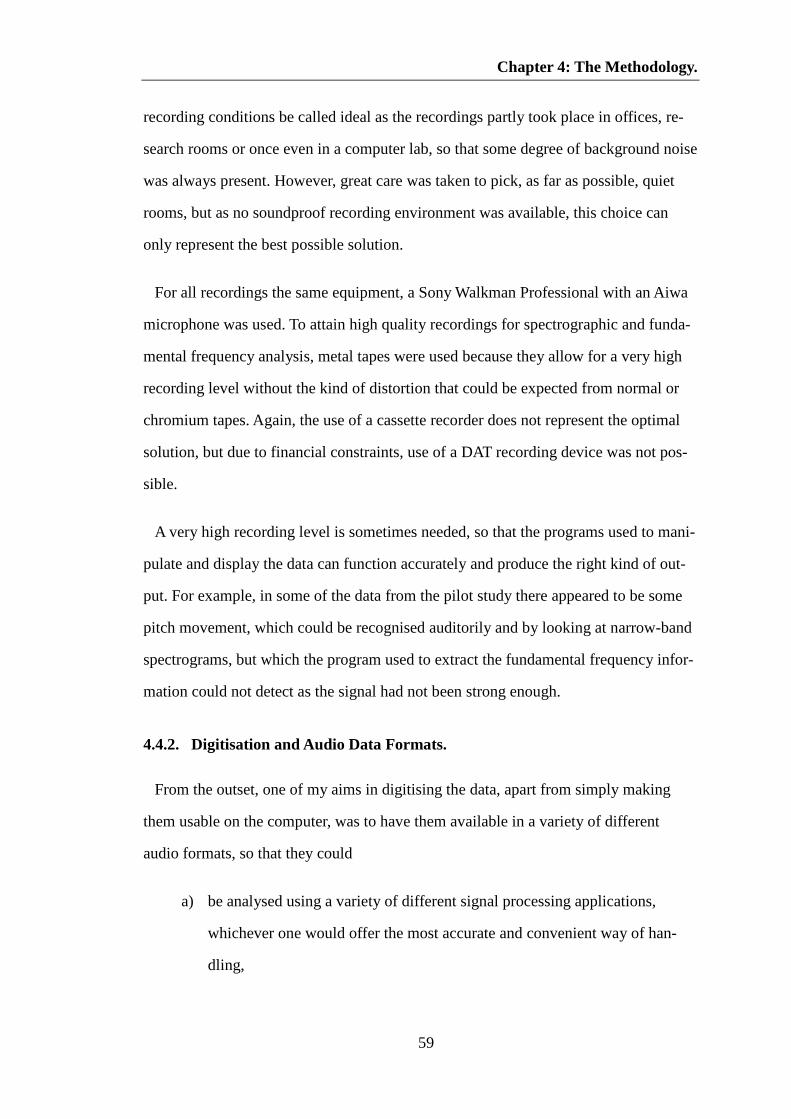
Chapter 4: The Methodology.
59
recording conditions be called ideal as the recordings partly took place in offices, re-
search rooms or once even in a computer lab, so that some degree of background noise
was always present. However, great care was taken to pick, as far as possible, quiet
rooms, but as no soundproof recording environment was available, this choice can
only represent the best possible solution.
For all recordings the same equipment, a Sony Walkman Professional with an Aiwa
microphone was used. To attain high quality recordings for spectrographic and funda-
mental frequency analysis, metal tapes were used because they allow for a very high
recording level without the kind of distortion that could be expected from normal or
chromium tapes. Again, the use of a cassette recorder does not represent the optimal
solution, but due to financial constraints, use of a DAT recording device was not pos-
sible.
A very high recording level is sometimes needed, so that the programs used to mani-
pulate and display the data can function accurately and produce the right kind of out-
put. For example, in some of the data from the pilot study there appeared to be some
pitch movement, which could be recognised auditorily and by looking at narrow-band
spectrograms, but which the program used to extract the fundamental frequency infor-
mation could not detect as the signal had not been strong enough.
4.4.2. Digitisation and Audio Data Formats.
From the outset, one of my aims in digitising the data, apart from simply making
them usable on the computer, was to have them available in a variety of different
audio formats, so that they could
a) be analysed using a variety of different signal processing applications,
whichever one would offer the most accurate and convenient way of han-
dling,

Chapter 4: The Methodology.
60
b) be used on different platforms, i.e. DOS, Windows 3.x/9x/NT and Unix,
c) possibly be set up as a small corpus resource for further analysis, either by
myself or other interested parties.
4.4.2.1. Digitisation.
The first step in saving the data in usable formats was to digitise and store the com-
plete recordings in worksheet files for use with the LSI (Loughborough Sound Images)
Speech Workstation, a DOS based hard-/software solution for digital signal
processing, which was initially the main instrument for analysing them. All recordings
were digitised with a sampling rate of 16 kHz (16 bit quantisation) so that both vowel
and consonant qualities could equally well be observed.
In order to facilitate comparison, the complete recordings were then ‘cut up’ into
smaller units of the length of about 1.5 sentences each, which was at first only
possible in binary format because the Speech Workstation has no facilities for saving
parts of a file in its proprietary format. Those files then had to be transformed into
WKS-format in order to be able to annotate them and make use of the Speech
Workstation’s functionality such as adjusting or filtering the display of the data, and to
then store those settings permanently within the file. Additionally, a description of
each worksheet was included, containing the filename and the orthographic
transcription of the sentence displayed within the spectrogram – the way it was
supposed to have been read by the speaker, rather than the actual realisation. This was
done so as to be able to recognise quickly which file (or files, if two files were opened
for comparison in two different windows) was open at the moment without having to
play it back and to make it easier to identify and manage printouts.
Each filename represents a combination of the speaker identification, an underscore
and the number of the sentence; the speaker identification consisting of a “language
identifier” – E for native speakers of English and G for German speakers – and the

Chapter 4: The Methodology.
61
number of the individual speaker. Thus the first sentence read by the English speaker
number 1 would be E1_1, the second E1_2, etc. and the complete recording E1a,
where ‘a’ stands for ‘all’. For technical reasons like sorting files according to speakers,
I later on changed the numbering for the complete files so that speakers with an ID of
less than 10 had a 0 prefixed, thus yielding E01a for native speaker number 1, etc. All
spectrogram files for use with the Speech Workstation have the default extension
‘.wks’.
The length of more than one sentence for the individual parts of the recording was de-
termined by the fact that sometimes intonational phenomena extending over sentence
boundaries would have to be observed.
4.4.2.2. Conversion to Binary and .wav Formats.
Next, the complete recordings had to be converted into binary format (file-extension
‘.raw’) and then both complete and partial recordings were again converted into
Wave-files (file-extension ‘.wav’) for use with the Spectrogram Analyser (a small
freeware program that allows the display of spectrograms) running on Windows. At
the time, this program was the only available non-commercial product that allowed
the display of spectrograms on the Windows platform, but unfortunately did not offer
any facilities for annotation. However, this program has in the meantime been
superseded by another freeware analysis program the Speech Analyzer, commissioned
and made available by the Summer Institute for Linguistics (http://www.sil.org),
which allows for both the display and playback of spectrograms, pitch contours, etc.
and annotation of the signal on different levels.
Wave-files also offer the added advantage that they can (technically) be stored in or
linked into the database and played back from there when auditory confirmation of
some phenomenon occurring within the data is needed. Using the Spectrogram Ana-
lyser or the Speech Analyzer also makes it possible to save and store spectrograms as

Chapter 4: The Methodology.
62
Bitmap-files, picture files that can be read by any Windows-based drawing program
and also be stored in the database for visual reference to the spectrogram if needed.
The other positive side effect of having stored all files in binary format before the
conversion to Wave-files is that this should technically allow any other program for
processing soundfiles (such as the ESPS/Waves+ package) to read them in. However,
as it later turned out, incompatibility between Unix and DOS-based systems extends
further than I had anticipated and even affects the level of binary files insofar as the
byte ordering within those files is concerned. It was therefore later necessary to write
another conversion program that swaps higher and lower order bytes in the binary
DOS-soundfiles in order to make them usable with the Unix-based Waves+ package.
4.4.2.3. Retrieving and Converting the F0-Data.
The following step consisted in running the F0-Tracker program provided with the
Speech Workstation package on the complete and partial recordings in order to extract
the pitch contours. The resulting F0-files (extension ‘.f0f’) from both the complete and
partial recordings were then in turn converted into text files (extension ‘.txt’) contai-
ning time and F0-values for use with the database. Unfortunately the DOS-based con-
version program originally used was not able to read all the data correctly so that it
had to be rewritten. However, rewriting the program also presented the opportunity to
write it as a Windows program, which was much more convenient and easier to use
and now allows the user to select and convert any number of files at the same time
without having to manually restart the conversion program again and again, which
would save a great amount of time for the conversion of any future recordings or re-
digitisations of existing recordings, should they be necessary.
To some extent, however, extracting and converting this type of information in this
way is no longer necessary now because the Speech Analyzer provides facilities for

Chapter 4: The Methodology.
63
exporting time-aligned information relating to f0- and other values to textfiles, which
can then be read into the database(s).
4.5. Statistics Employed in the Analysis
All the statistical analyses on the data were conducted in MS Excel, using f- and t-
tests, in order to establish which, if any, differences between the speaker populations
or parts of the populations might prove statistically significant.
However, Excel’s built-in f-test function does not allow the user to quickly determine
whether two populations have equal or unequal variances, but only offers this type of
functionality through its Analysis Toolpack, which produces an unnecessarily verbose
output and does not automatically recalculate this when the underlying data is
changed. This is clearly an undesirable feature in an analysis of spoken language data
where the data often has to be re-transcribed and updated, and it was therefore neces-
sary to write a user-defined function in VBA that automatically recalculates each time
the underlying data changes. Based upon the results of this f-test, a t-test assuming
either equal or unequal variances was then performed in order to establish whether
there were any tendencies amongst populations or whether any differences occurring
were significant below the 5% or 1% level. Any levels of significance are indicated in
the discussions of the individual features analysed further below and appear in round
brackets.
4.6. The Databases.
Much of the information contained in the databases is in line with the types of infor-
mation used in projects on speech assessment that have been or are currently being
undertaken within the speech community. I here understand the term speech commu-
nity as referring to those groups of people or institutions that are undertaking research
into speech not on a purely academic level, but rather for the development of

Chapter 4: The Methodology.
64
computer applications that make use of spoken in- and output in a variety of forms
such as speech recognition and speech synthesis for translation or telephony systems.
Projects in the speech community, such as the European Union funded ESPRIT
Speech Assessment Methods (SAM) project (see Gibbon et al., ‘98: p. 6/7) or the
German Verbmobil project (http://verbmobil.dfki.de) use multiple files (distinguish-
able by different extension) that contain various bits of information relating to recor-
dings, speaker characteristics, etc. or containing orthographic/phonetic/prosodic trans-
cription, that can be linked together (aligned) by the use of numerical codes within
each file, so that different types of information can be related to one another as re-
quired. One advantage of this is that only those files that are actually needed for a spe-
cific type of analysis need to be distributed and may to a certain extent be used inde-
pendently of a particular type of software, at the same time reducing the amount of
redundant/unnecessary information stored in each file. The one disadvantage of this
approach, however, is that one always has to write special software that can actually
perform the alignment as and when needed.
As previously pointed out (see 3.1.1 above), one of my original intentions was to use
relatively easy-to-use and widely available software packages in order to store and
analyse my data. However, the more I developed my schemes for storing and compa-
ring the data in MS Access databases, the more I realised that in order to increase the
efficiency and maximise the capabilities of the databases as analysis tools, I had to
develop solutions that went beyond the facilities offered by MS Access by default. I
therefore decided to increase its functionality by writing programs that manipulated
my data using VBA and gave me easier access to relevant parts of the information. In
this way, what began as a ‘simple’ database implementation, soon turned into a power-
ful reusable and relatively easily extensible application for comparing different spea-
ker populations and also changed the general direction of this thesis to a considerable
extent. The following sections describe the various aspects and interfaces provided.

Chapter 4: The Methodology.
65
4.6.1. The Dialogues Database.
At the heart of my analysis/methodology is the “Dialogues” database. It consists of
different tables containing information about the individual speakers, the dialogue
itself, stored as one word per record, the punctuation marks and grammatical tags
associated with the individual words of the dialogue, plus information about the
individual sentences, pauses, etc., which shall be explained in more detail below. It is
organised as a relational database so that the information from different tables can
easily be linked and correlated by running the appropriate queries on the data. For
example, by linking the tables containing the dialogue and the tagset, it is possible to
produce a tagged version of the dialogue, which can then be exported into Word and
converted from a vertical to a horizontal format by use of a macro in order to increase
readability.
Figure 2 – Query for creating a tagged version of the dialogue.
As we shall see in later sections, being able to combine the information on tags with
the orthographic or phonetic representations enables us to gain more detailed informa-
tion on which word-classes are involved in phenomena such as complete elision (dele-
tion) of words (8.1.8), or final release (8.1.9) as a potential marker of emphasis.

Chapter 4: The Methodology.
66
4.6.1.1. The Main Table Structure
The following section contains a description of the most important tables in the
“Dialogues” database and explains how they are related to one another.
The “Speakers” table contains all the information relevant for the individual speaker.
Some of the information is different for German and native speakers, as different fac-
tors, such as how long each learner has studied English for, etc., may be of interest:
Field Name Data Type Speaker_ID Text Firstname Text Surname Text Beg_Count Number Date_of_Birth Date/Time Semester Number Degree Text Time_of_study_Uni Number Time(s)_spent_abroad Number Place_of_Birth Text Place_of_Residence Text Telephone Text Transcription Yes/No Sex Text
Table 3: Fields in the “Speakers” Table
The different fields and their uses are listed below and, where necessary,
accompanied by detailed explanations as to their use.
1) The “Speaker_ID”: This represents the primary key for the whole table by
which it can be linked to other tables, e.g. in order to extract all the realisa-
tions for a particular speaker, etc. It contains a ‘speaker identification’ – as
described earlier – consisting of the ‘language identifier’ and the number of
the speaker.
2) “Firstname” & “Surname”

Chapter 4: The Methodology.
67
3) “Beg_Count”: This field contains information about where the beginning of
the respective recording for each speaker can be found on the original tape.
4) “Date_of_Birth”: This information may be relevant to see whether speakers
who differ (considerably) in age show different characteristics of pronuncia-
tion – e.g. in their use of glottal stops – or intonation and may thus be judged
to belong to different speaker generations.
5) “Semester”: This is one of the fields that only applies to the German learners
and contains information about how many semesters (years) they had been
studying at the University.
6) “Degree”: This information may be relevant in different ways for English
and German speakers. For the German speakers, having a degree may
(should) be an indicator of a certain level of proficiency. For the native
speakers, knowing where and when they took their first degree may be
relevant as the time spent at a certain University may have influenced their
accent to some degree. Knowing what the degree was in – English Language
or Literature, any other language or something completely different – can
provide some information as to whether they may have learned to be more
‘language-aware/conscious’ and thus more careful in the way they use (a)
language.
7) “Time_of_study” & “Time_of_study_Uni”: Those fields are relevant only to
the German speakers and were originally intended to show how many years
the speakers had spent learning English overall and how many years at the
University prior to the recording. Unfortunately, however, the information

Chapter 4: The Methodology.
68
was lost when I first started exporting it from Excel files to information
stored in the database.
8) “Time(s)_spent_abroad”: For the German speakers, this field provides infor-
mation as to whether they had spent any longer period of time (not counting
extended holidays) in an English-speaking country and if so, what they were
doing there (studying at the University or working as an assistant teacher,
etc.). For native speakers, knowing whether they have been in contact with a
foreign language, for how long and how long ago may explain any possible
deviation from patterns used by other native speakers.
9) “Place_of_Birth”: May be relevant to identify a certain accent unless, of
course, the informant has always been extremely mobile.
10) “Place_of_residence”, “Telephone”: Basic contact details.
11) “Transcription”: Shows whether the speaker’s recording has been
transcribed completely or not. Keeping track of this can be important,
especially if one decides to re-annotate speakers at a later date and may
switch between different speakers for comparison purposes.
12) “Sex”: This field may be used for statistical purposes, to establish whether
there are any significant differences in male and female language use, apart
from obvious factors such as different fundamental frequency levels/ranges.
These days, with the increasing importance of email, it would also be very useful to
include the speakers’ email addresses in their contact details, so that even if they may
move a way, there may still be a further possibility for contacting them in case any ad-
ditional information is required.

Chapter 4: The Methodology.
69
The “Dialogue” table contains four fields:
1) “Word_ID”: A numerical identifier for each word. Each identifier consists of
the number indicating the position of the word in the dialogue, multiplied by
10 in order to enable/facilitate sorting. Multiplying the position of the word
in the dialogue by 10 also allows the user to insert any extra words that have
potentially been uttered by a particular speaker. This can be done by making
use of the digits between 1 and 9 at the rightmost position of each ID, e.g. if
there are any additional words between word IDs 10 and 20, they can range
from 11-19, which yields enough extra positions for most purposes.
2) “Tag_ID”: A numerical identifier used to link each word to its associated tag
from the “Tagset” table.
3) “Word”: This field contains the word itself.
4) “MWU”: A field that can be used to indicate whether a particular word is
part of a “multi word unit”, which may affect features such as stress patterns
in compounds, etc. If a word is designated as part of a multi word unit, it
receives a number according to its position, i.e. the first word in a three-
word multi word unit is number 1, the second one number 2 and the final
one number 3.
In the original design of the database, I had also included punctuation marks in
the “Dialogue” table, so that each punctuation mark counted ‘as a word’. How-
ever, I later decided that as punctuation marks or markers for speaker turns per
se could not be seen as entities with a particular realisation, they should be taken
out and moved into a separate “Punctuation” table. In this table, there are two

Chapter 4: The Methodology.
70
fields, a “Word_ID” field, which links each entry to the word it is associated
within the dialogue, and a “Punct” field, which contains the ‘value’ of the punc-
tuation mark or “-----” for a speaker turn. For information about speaker beha-
viour at phrase-, sentence- or turn-boundaries, this information can easily be
combined with information about speaker realisations later.
The words in the “Dialogue” table are furthermore linked to the grammatical
tags associated with them in the “Tagset” table. Table 4 below shows some ex-
amples from the CLAWS 7 tagset used to tag the data. For the full tagset, see
Appendix A.
Tag_
Tag Tag_Description 10 ! punctuation tag - exclamation mark 20 " punctuation tag - quotes 30 ( punctuation tag - left bracket 40 ) punctuation tag - right bracket 50 , punctuation tag - comma 60 - punctuation tag - dash 70 ----- new sentence marker 80 . punctuation tag - full-stop 90 ... punctuation tag - ellipsis
100 : punctuation tag - colon 110 ; punctuation tag - semicolon 120 ? punctuation tag – question mark 130 APP
possessive pronoun, pre-nominal (e.g. my, your,
… … …
Table 4: The “Tagset” Table
The “Tagset” table itself contains the “Tag_ID”, used to link the tags to the words in
the dialogue, the “Tag” itself and a “Tag_Description” field, which gives information
about the grammatical category each word in the dialogue belongs to. The “Tag_ID”,
just like the “Word_ID” in the “dialogue per word” table, is a numerical identifier
multiplied by 10, which allows for insertion of extra numbers if additional special tags
similar to those already existing should need to be created.

Chapter 4: The Methodology.
71
In the current implementation of the database, all the realisations for each individual
word by each speaker are listed in a single table, called “Realisations”. As already
pointed out in 4.3.1 above, not only do the transcription on the phonetic/phonological
level have to include faithful reproductions of the speakers’ utterances of the words
appearing in the dialogue, but also additional information about any fillers, hesitation
phenomena or ‘dropped’ words. For this reason, when setting up the database table
containing the native and non-native speaker realisations, I had to diverge slightly
from the original conceptual design of a relational database, and implement the table
in the style similar to a flatfile table, rather than having a separate table for recording
the realisations of each speaker. This had to be done as it was the only convenient way
of adding Word_IDs representing hesitation phenomena such as false starts, etc. to the
realisations table and associating the IDs with the same phenomenon for different
speakers. For example if two different speakers had a false start in the same place in
the dialogue, but one of them would restart all the way from the beginning and the
other one only from the point where the original utterance went wrong, the same
words involved in the restart should be associated with the same IDs in order to deter-
mine how this may affect the rhetorical patterns and overall ‘fluency’ of native and
non-native speakers.
For larger-scale implementations of my approach, however, this kind of design
would become impractical as the resulting table would become too ‘unwieldy’ and it
would therefore be better to have all the realisations for each speaker in a separate
table. Identifying common disfluency features would then become more difficult,
though.
Because of a technical limitation, MS Access cannot display two different fonts with-
in a single table. This is why, originally, I had to use a pseudo transcription similar to
SAMPA (Speech Assessment Methods Phonetic Alphabet; Wells et al., ‘92) because
the IPA font does not contain enough numbers that could be used as field identifiers.
However, I later on realised that it would be possible to use textboxes for displaying

Chapter 4: The Methodology.
72
the contents of the different fields on Access forms, and that this would allow me to
assign different fonts to each field. This way, input and display of phonetic characters
is possible using the form, while what is actually saved in the database table is the un-
derlying character representation of each phonetic character.
Figure 3 – Snapshot of part of the “Realisations” table.
Figure 4 – An input form for editing speaker realisations.

Chapter 4: The Methodology.
73
This system not only makes it possible to use a much narrower transcription making
full use of diacritics, but also still allows for performing searches based upon particu-
lar characters, such as extracting all words produced with e.g. creaky voice, nasalised
vowels or glottal stops. There is one caveat in the current implementation of the data-
base, though, that I only found out about towards the end of my analysis, at which
time it was too late to make wholesale changes to the data. The problem lies in the fact
that the font I am using maps certain phonetic characters onto uppercase letters and
thus there is problem with some of the aggregate functions, such as counts, of some
realisations because SQL is case-insensitive and therefore groups some of the
realisations together when there should be a distinction between upper- and lowercase
characters. In my case, this affects words where there may be a distinction between
e.g. /U/ and /u/12 or /e/ and /E/. This problem, however, only affects a rather small set
of words and as long as the analyst is aware of the problem, will not lead to any grave
errors. However, in a ‘real’ implementation of my methodology, this problem could be
avoided by either using a Unicode font where the characters are mapped onto different
codes for which case-folding is not implemented in SQL or by generating hexadecimal
representations of each realisations and grouping the data according to these before
performing aggregate counts. Yet another alternative would be to write customised
routines that perform aggregate functions, but this approach would somewhat
‘contravene’ the idea behind a database approach as having access to SQL aggregate
functions represents one of the major advantages of using a database in the first place.
As can also be seen in Figure 3 and Figure 4 above, each realisation of a word by a
particular speaker is complemented by a field containing its corresponding transition.
The different types of transition I originally identified and how I later on modified and
refined these categories is explained in more detail in 7.2 below.
12 In most cases these two will be disambiguated by the fact that /u/ is often accompanied by
lengthmarks, anyway.

Chapter 4: The Methodology.
74
Within this first database, further refinements could still be undertaken, which would
extend the coding of sentence and word level elements, possibly by adding utterance
or phrase level coding on the structural annotation level, and by additional dialogue
act annotation on the functional level. Especially the latter should make it easier to
establish correspondences between the use of specific intonation contours and certain
types of semantic/pragmatic utterance categories. For further information on dialogue
act annotation, see Gibbon et al., ‘00: pp. 54-64.
4.6.1.2. The Database as an Application
The more I worked with the database, the more I realised that there were certain ana-
lysis features that were recurring and that I could simplify these by writing VBA rou-
tines that allowed me to set up one of the forms as a kind of ‘control centre’ for my ap-
plication. This form originally evolved from a simple form containing only a single
textbox using the phonetic font for testing/verifying realisations13 taken straight from
the “Realisations” table into a form that now provides access to much of the functio-
nality needed for my analyses and whose functionality is continuously being expanded
to incorporate access to further features when they turn out to be relevant.
As one of the most time-consuming parts of any phonetic research is the transcrip-
tion and potentially rather frequent re-transcription of the data in the light of new fin-
dings, any facility for speeding up of this process and keeping track of which speaker
the latest transcriptions were undertaken for will greatly simplify the task of the ana-
lyst. In order to achieve this, my database application contains various features for ac-
cessing and storing the relevant data and also provides a means for communicating to
some extent with the Speech Analyzer tool used for making the transcriptions. Figure
5 below shows the various features that can be controlled from the “Phontest” form.
13 hence the name of the form “Phontest”

Chapter 4: The Methodology.
75
Figure 5 – The ‘control centre’ for the “Dialogues” database.
The listbox in the top right-hand corner of the form allows the user to select a spea-
ker from the list (table) of speakers and, by clicking on the button immediately below
it, open a form that displays all the realisations for this particular speaker. This way,
not only can the same form be reused in order to keep the size of the database small
and therefore the application more responsive, but it also saves the user from the task
of having to find and open the appropriate form from within a potentially rather long
list of speaker forms. One further feature is that if the “ID ?” field on the top left-hand
side has also been clicked on, the form also opens displaying the word associated with
this particular ID, which the user can designate in a table called “Last Edit”, which
allows the user to store details of which speaker transcription has last been edited,
apart from containing byte offsets into the soundfile associated with the last edit
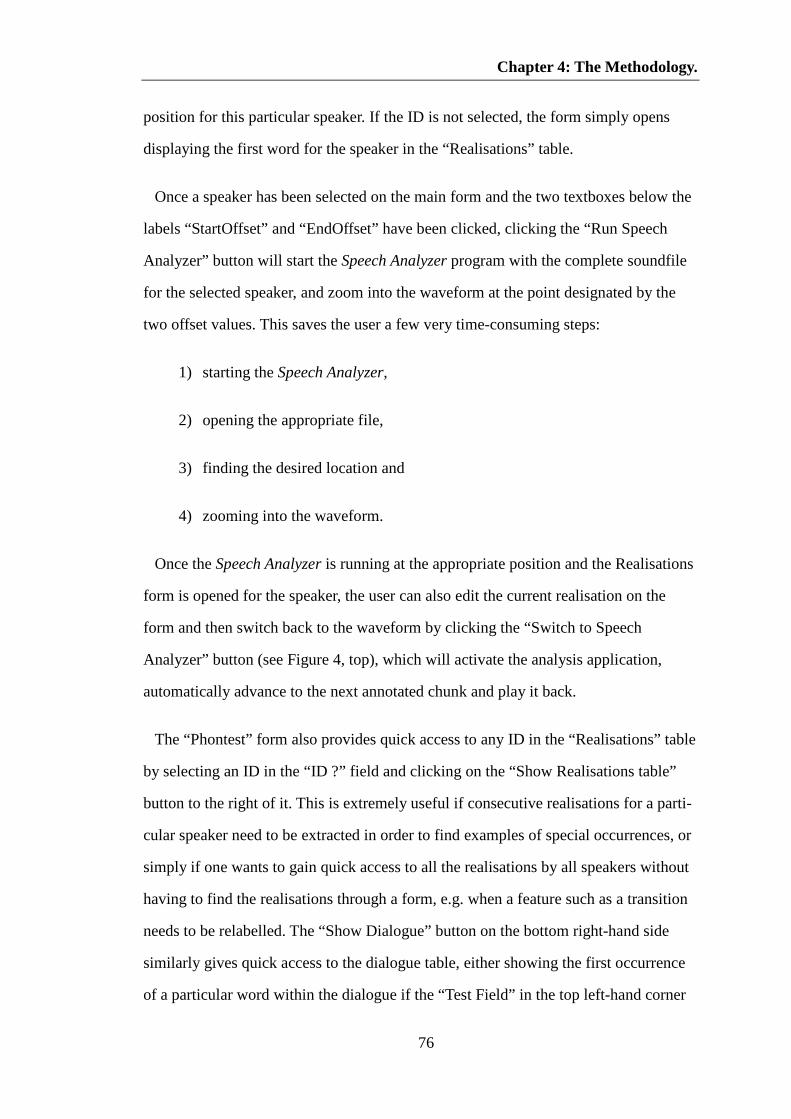
Chapter 4: The Methodology.
76
position for this particular speaker. If the ID is not selected, the form simply opens
displaying the first word for the speaker in the “Realisations” table.
Once a speaker has been selected on the main form and the two textboxes below the
labels “StartOffset” and “EndOffset” have been clicked, clicking the “Run Speech
Analyzer” button will start the Speech Analyzer program with the complete soundfile
for the selected speaker, and zoom into the waveform at the point designated by the
two offset values. This saves the user a few very time-consuming steps:
1) starting the Speech Analyzer,
2) opening the appropriate file,
3) finding the desired location and
4) zooming into the waveform.
Once the Speech Analyzer is running at the appropriate position and the Realisations
form is opened for the speaker, the user can also edit the current realisation on the
form and then switch back to the waveform by clicking the “Switch to Speech
Analyzer” button (see Figure 4, top), which will activate the analysis application,
automatically advance to the next annotated chunk and play it back.
The “Phontest” form also provides quick access to any ID in the “Realisations” table
by selecting an ID in the “ID ?” field and clicking on the “Show Realisations table”
button to the right of it. This is extremely useful if consecutive realisations for a parti-
cular speaker need to be extracted in order to find examples of special occurrences, or
simply if one wants to gain quick access to all the realisations by all speakers without
having to find the realisations through a form, e.g. when a feature such as a transition
needs to be relabelled. The “Show Dialogue” button on the bottom right-hand side
similarly gives quick access to the dialogue table, either showing the first occurrence
of a particular word within the dialogue if the “Test Field” in the top left-hand corner

Chapter 4: The Methodology.
77
of the form contains a word, or simply showing the beginning of the table. This
feature is sometimes useful if one wants to verify the context of a word quickly or
simply count how often a word occurs in the dialogue, in which case the user needs to
have the word in the “Test Field” box, open the “Dialogue” table displaying the word
and then using the “Filter by selection” option for the field in the table, which will
them only show occurrences of this particular word plus their corresponding IDs.
Most of the other functions accessible form the “PhonTest” form relate to displaying
forms or running queries on the database in order to perform specific analysis tasks
easily and are therefore best discussed in the appropriate analysis sections further
below. The only other more general type of functionality provided by the form is the
“SQL” textbox, which allows the user to type in or import an SQL query in order to
test or modify it quickly. This is particularly useful for complex queries that need to be
run repeatedly for different speaker populations or multiple speakers, in which case
the textbox can be used to search and replace references to input fields or queries14.
Below is an example of an SQL query that extracts and counts all the occurrences of
words that have been deleted completely by the native speakers and also lists their
associated tags:
SELECT [NS PronOccurrences].Word_ID, [NS PronOccurrences].Word, [NS
PronOccurrences].CountOfRealisation, Tagset.Tag
FROM [NS PronOccurrences] INNER JOIN (Tagset INNER JOIN Dialogue ON
Tagset.Tag_ID = Dialogue.Tag_ID) ON [NS PronOccurrences].Word_ID =
Dialogue.Word_ID
GROUP BY [NS PronOccurrences].Word_ID, [NS PronOccurrences].Word, [NS
PronOccurrences].Realisation, [NS PronOccurrences].CountOfRealisation,
Tagset.Tag
14 Search and Replace is not available in the SQL view of a query in Access, so that the query can
only be changed step by step by replacing each occurrence of the text to be replaced manually.

Chapter 4: The Methodology.
78
HAVING ((([NS PronOccurrences].Realisation) Like "[*]"))
ORDER BY Tagset.Tag;
By changing all references to the input query “[NS PronOccurrences]” to “[NNS
PronOccurrences]” and clicking the “Run SQL” button, the same information can be
extracted for all the non-native speakers. This mechanism is similar to the reuse of the
“Realisations” form described earlier and again keeps the size of the database low, as
well as saving the user from having to painstakingly recreate the new query. Clicking
the “Run SQL” button simply takes the SQL text from the textbox and rewrites an
existing query with it. In cases where one needs to repeat the same operation more
often, though, and especially if it is possible to make use of an existing list, such as the
one in the speaker listbox, it is generally advisable to allow the user to select an item
from the list and then rewrite the query based upon that item. An example of this is the
use of the button labelled “Count Transitions for Speaker” below the button that opens
the speaker form.
4.6.2. The F0-Database.
The second database contains information about the pitch patterns and ranges used
by the individual speakers, plus information linked to prosodic speaker behaviour at
sentence endings. Whereas the first type of information consists of numerical data that
can be used for statistical purposes, the second type represents information based upon
the visual observation of pitch contours. As pointed out earlier, though, due to limita-
tions of time in the present study, no full-scale analysis of this part of the data was
possible and the implementation of the database is not quite complete.
The F0-file tables contain all the data for each individual speaker that were first suc-
cessfully converted into textfiles from the binary files created by the Speech Worksta-
tion’s F0-Tracker, and which were then imported into the database. The three fields
they are made up of are ‘Sample’, representing the time at which the ‘F0-value’ (se-

Chapter 4: The Methodology.
79
cond field) was read, the value of the fundamental frequency at this given time, and
‘Frequency’, representing the number of 5 msec intervals the sample value remained
constant. Table 5 below gives an illustration of the data.
Sample F0 value Frequency 1 -1 20 21 285 2 23 296 5 28 -1 56 84 347 15 99 363 6 105 380 6 111 363 10 121 307 5 126 266 1 … … …
Table 5 – A sample extract from an F0-frequency table.
The second record in the above table shows that this particular speaker’s fundamen-
tal frequency at 110 msecs into the dialogue had the value of at 285 Hz, which re-
mained steady for two sample intervals, i.e. 10 msecs, before rising to 296 Hz.
These tables can be used to establish a variety of statistics concerning the intonation
of both native and non-native speakers, such as computing the overall pitch range of
the individual speaker, finding out whether there is something like a “neutral pitch”
region (similar to the concept of the “neutral vowel” /«/) and whether there are major
differences or similarities between native and non-native speaker pitch-range and
-pattern usage.
So far, this information has only been used to run some limited statistical analyses,
computing F0 maxima and minima and overall pitch range for each individual speaker.
However, a preliminary analysis using t-tests has already shown that the difference in
overall pitch range between the native and non-native speakers is not significant (a.
p=0.391508; b. p=0.517730). The results were computed on two different ranges, the
first one excluding all frequency values below 70 Hz, because my original assumption
was that all values below this threshold may represent artefacts of the F0-extraction.

Chapter 4: The Methodology.
80
The second one was added later after I had discovered that both speaker populations
use a considerable amount of creak in their realisations, so that values below the
threshold may well be important. If we exclude the potential effects of creak and look
at the filtered minima, there seems to be a slight tendency towards divergence in the
frequency band between 70 and 90Hz, with the non-native speakers having slightly
lower starting points. However, this still remains outside the 5% boundary for
statistical significance (0.055970).
In order to verify exactly where the differences might lie, the tests were also per-
formed individually for groups of male and female speakers. Regarding the filtered
minima for the male speakers, there again seems to be a tendency towards statistical
significance (0.068260). The same does not seem to apply to the female speakers,
though, who instead show significant differences below the 5% level for both the
filtered and full ranges (0.021333, 0.033556) and the unfiltered mean (0.033918).
However, while this in general indicates an exploitation of a greater pitch range by the
female non-native speakers, the main difference seems to be due to the their higher
maxima, appearing rather uniformly at 400Hz, with only one speaker (G05) below
this, at 380 Hz. This would therefore indicate that, at least as far as overall pitch range
is concerned, it is more the female German speakers who ought to sound ‘un-English’
to some extent. Yet it remains to be seen from further analysis whether there may be
significant differences in the way that the native and non-native speakers employ
specific pitch ranges for specific purposes or whether the pitch movements employed
by the German speakers show higher dynamics.
The database also contains a table with sentence definitions, which identify each
sentence by its start and end points. In order to be able to verify which sentence is
referred to by which ID, there is a “Sentence Definitions” form, with a “Show Sen-
tence” button that, when clicked, runs a query that retrieves and displays all the words
contained in the sentence from the “Dialogue” table. Further fields associated with
each sentence ID are “Sentence category”, which lists whether a particular sentence

Chapter 4: The Methodology.
81
contains a question, statement, etc., and “Pragmatic Force”, which shows which par-
ticular type of dialogue act (see Leech et al., 98: p. 57ff & Leech/Weisser, ‘01) is
associated with the sentence, e.g. request, reply, etc.
The ID of each sentence is linked to tables for each individual speaker that contain
information about the pitch contour at the end of the sentence. This was set up in order
to be able to compare the use of pitch contours for different sentences and different
speakers. The definitions for types of pitch contours are held in the “Contour catego-
ries” table. Essentially, this setup allows the user to run union queries for native and
non-native speakers, just like in the “Dialogues” database and then perform compar-
isons between the populations. Due to a lack of time, though, this has not been imple-
mented yet.
One further potential addition that could easily be implemented here is to link in the
partial recordings for each sentence and speaker, so that they can either be played back
from within the database or opened using the Speech Analyzer in order to verify con-
tours.

82
5. Preliminary Indicators of Difference.
In the following section, I will present some of my preliminary observations,
gleaned from superficial analyses of the data or observations made during
transcription of the data. These are to form the basis of a series of research questions
that I will try to elaborate on in later sections, after having performed more in-depth
statistical and phonetic analyses.
5.1.1. Overall Length of Dialogues
One thing that is immediately obvious from looking at the overall length of the
dialogues as realised by native and non-native speakers is that for the non-native
speakers, the dialogue realisation is on average nearly 9 seconds longer.
a) non-native speakers: 85,672.20 msecs
b) native speakers: 76,938.00 msecs
While in everyday life terms 9 seconds may not actually amount to much, in terms
of phonetic features it represents a rather long time span, in the case of the dialogue
actually at least the length of about three sentences. This difference seems to be a
very important distinguishing factor between native and non-native speakers, despite
the fact that it is statistically not significant (p=0.081995) according to a t-test
performed on both complete populations. However, this apparent paradox is easily
explained when comparing the differences between the averages of the male and
female sub-populations. Here, we can easily see that, on average, the female non-
native speakers take about 15 seconds longer than the female native speakers, but
that the situation is reversed for the male speakers, with the male non-native
speakers being almost 7 seconds faster in their delivery. Overall, this seems to have
a balancing effect on the total populations, which explains why the variances show
no significant differences.
Chapter 5: Preliminary Indicators of Difference.
83
Looking again at the variances between the sub-populations, we can also see that the
average 7 second difference in the male populations, perhaps surprisingly, is not suf-
ficient to cause any statistical level of significance (p=0.397457), but that the
average difference between the female populations is a highly significant one,
approaching 1% (p=0.013121).
These observations raise the question of what this variability may be due to. It may
intuitively be tempting to assume that the overall dialogue length for the female non-
native speakers is higher because they would show more features of hesitation, i.e.
have a higher incidence of repetitions, corrections and false starts, and that their
speech generally exhibits longer pauses and in more places than that of the female
native speakers. Conversely, we would then have to assume that the male non-native
speakers may actually be more ‘fluent’ speakers. However, as far as the length and
frequency of pauses is concerned, these assumption are potentially very dangerous
and misleading ones, as they do not take into account the fact that pausing in the
right places is actually a rhetorical skill. In other words, although we may easily be
able to quantify both the numbers and the length of the individual pauses made by
each speaker, it still remains a question of qualitative analysis to determine whether
a pause in a particular position and of a specific duration can be regarded as a
feature of ‘disfluency’ on the part of a non-native speaker or not. Conversely, it may
actually be necessary to investigate whether the female native speakers do actually
exhibit a higher level of rhetorical skill than the female non-native speakers, whether
this is in any way essential to them in order to make themselves understood better
and whether the male native speakers are then any more or less skilled because they
take longer in their delivery.
Developing a better concept of the level of rhetorical skill that is indeed necessary to
communicate in everyday-life situations is something that always seems to have been
neglected in both language teaching and assessment (c.f. 2 above). Although the no-
tion of comfortable intelligibility (c.f. Kenworthy, ‘87: p. 3) – albeit a still relatively

Chapter 5: Preliminary Indicators of Difference.
84
ill-defined one – seems to be becoming increasingly important in teaching circles, the
criteria employed in language testing and assessment discussed in 2.1 still clearly
reflect the idea that non-native speakers are expected to possess a comparatively
strong rhetorical competence, which more or less seems to exclude any scope for
disfluency features. What this means effectively is that non-native speakers are
expected to be more skilful speakers than native speakers, who frequently show
disfluency features, as demonstrated by various studies in the realm of Language
Engineering that deal with issues of intelligibility for speech recognition systems. For
example, research carried out on the ATIS (Airline Travel Information System) project
by Wang and Hirschberg, who report that:
“The quality of the ATIS corpus is extremely diverse. Speakers range in fluency from
close to isolated-word speech to exceptional fluency. Many utterances contain
hesitations and other disfluencies, as well as long pauses (greater than 3 sec. in some
cases).” (Wang/Hirschberg, ‘92: p. 12).
This point about native speaker variability seems to be confirmed by the fact that
variability amongst the native speakers in my data is greater than amongst the non-
native speakers, which seems to indicate that the latter are actually more rhetorically
skilled. This is rather surprising, considering the fact that most of my native speakers
informants were actually teachers of English. Nevertheless, the difference in
consistency is clearly reflected in the measures for standard deviation and it remains
to be investigated why this is so:
native speakers: 10,054.47 vs.
non-native speakers: 8,558.94
However, should it turn out that the differences are not actually due to a difference in
rhetorical skill, i.e. that a more qualitative analysis will reveal that both native spea-
kers and non-native speakers use pauses of comparable length in the same places, then

Chapter 5: Preliminary Indicators of Difference.
85
this would point towards distinct differences on the segmental level, e.g. possibly the
failure of non-native speakers to reduce unstressed syllables properly. Interestingly
enough, though, preliminary observations based upon partial transcriptions show that
the non-native speakers do use weak forms in most places where they would also be
expected from native speakers and that one the main differences may actually lie in
the fact that the native speakers’ reductions are not only reductions in quality, but to a
large extent also in segmental duration. In other words, the native speakers tend to
produce weak forms that are relatively shorter than the weak forms of the non-native
speakers, often to the point of (near-)elision of reduced vowels.
5.1.2. Setting
Another feature that became apparent during my transcriptions is that there is more
evidence of creak or creaky voice in the non-native speaker realisations. This initially
made me think that there may be a particular articulatory setting associated with non-
native speaker productions, as there often seem to be a certain amount of tenseness in
their voices, which, if I try to imitate it, automatically makes me constrict my pharynx.
This would tie in with an observation made by Honikman, who, in her article on arti-
culatory settings, points out:
“With regard to the pharynx, this is generally relaxed in French and English, there
being no contraction of the pharyngeal muscle, whereas in Arabic, and frequently in
German (especially in men), pharyngeal contraction is usual.” (Honikman, ’64, p.79)
Wells, however, seems to interpret creaky voice as a laryngeal, rather than a pharyn-
geal setting:
“Larynx settings can be divided into three groups: phonation types, pitch ranges, and
loudness ranges. Among phonation types (Catford 1964), as well as the obvious
‘voiced’ and ‘voiceless’ states of the glottis, important possibilities include ‘creak’
(which can be combined with voice as ‘creaky voice’) and murmur (also termed

Chapter 5: Preliminary Indicators of Difference.
86
‘breathy voice’). Obviously no variety of English uses either creaky voice or murmur
to the exclusion of ordinary voice; but some accents do seem to tend to use particular
special phonation types as frequent options, or in particular phonetic contexts (inclu-
ding their use as part of particular intonation patterns). Thus Norwich working-class
speech has been described by Trudgill (1974a: 186) as having a tendency to use crea-
ky voice, while Norwich middle-class speech shows no corresponding tendency; on
the other hand it has often been pointed out that RP-speaking men tend to go into
creak towards the end of an utterance spoken with a low fall nuclear tone.” (Wells,
‘82, p. 92).
Whether the tenseness in the non-native speaker voices represents a pharyngeal or
laryngeal setting, it is quite clear that the non-native speakers do something that is
related to the back part of the oral tract. From Wells’ description, it is also clear that
this feature may be one that is sometimes associated with accents of lower social
status, apart from the exceptional realisations in RP. If this were the case, then this
would a) support my earlier assumption that often particular features of non-native
speaker speech are similar to less-accepted features of native British accents and b)
potentially represent a strong distinguishing feature between native and non-native
speaker accents.
One possible explanation for this type of setting, if it can really be referred to as
such, is that it may be due to insecurity or bad planning strategies, i.e. ‘running out of
steam’ in longer utterances or a general nervousness of the non-native speakers.

87
6. Transcription of the Data.
After the digitisation of the recordings, the next step in the analysis was to produce
transcriptions. As the databases are meant to incorporate both segmental and supra-
segmental information, at this point it became important to decide which levels of
transcription were to be included in the analysis and which degree of detail the indi-
vidual transcription levels should incorporate. As a basic rule of thumb, one would
probably assume that the analysis should incorporate as much detail as possible, bea-
ring in mind that each further level of detail, while undoubtedly enriching the trans-
cription, could also potentially distract the analyst from arriving at a suitable level of
abstraction, apart from increasing the amount of time and effort to be spent on the
analysis.
6.1. Transcription Issues.
The first question in dealing with levels of transcription is which levels are needed
or desirable in order to perform an effective analysis. The basic design of the
“dialogues” database already makes provisions for two of the possible levels of
analysis by providing an orthographic representation of the dialogue in one table and
associated grammatical tags in another, should it prove interesting to look at
segmental and supra-segmental features occurring with specific types of words or in
particular syntactic contexts. What therefore remained to be implemented were the
phonetic/phonological and suprasegmental levels.
6.2. Phonetic vs. Phonemic Transcriptions.
On the phonetic/phonemic level, a decision had to be made on which level of detail
should be included, and I originally began to transcribe the materials as a rough pho-
nemic transcription, particularly because the original transcriptions were implemented
using the DOS-based LSI Speech Workstation (see 4.4. above). When I later began re-

Chapter 6: Transcription of the Data.
88
transcribing the data using the Windows-based Speech Analyzer, where I was able to
use a phonetic font including diacritics, I decided to switch to an enriched, more pho-
netic type of transcription, which was later to be transferred into the database. This
added information, however, necessitated the implementation of filtering mechanisms
inside the database, so that the data could be displayed showing different levels of de-
tail in order to be able to arrive at a basic set of rules for the patterns exhibited by both
native and non-native speakers.
The use of the word filtering in this context may necessitate some explanation. In
standard database terminology, a filter applied to some data is normally a mechanism
whereby a selection can be made from the data in order to display only data that com-
ply with certain criteria, such as all records that contain (or do not contain) a field
with a certain value. This represents a convenient way of displaying only the informa-
tion required at any given time and grouping it together. Most database management
systems (DBMS), such as Microsoft Access, provide various user-friendly ways of se-
lecting and sorting data in this way, either via built-in pre-defined routines accessible
via mouse-clicks, when displaying data in form of single tables, or via queries that
combine data from different tables. In general, this kind of filtering is achieved by the
DBMS’s retrieving and displaying the relevant records via SQL (Structured Query
Language), thereby keeping the original values stored in the database intact and dis-
playing a subset. My use of the word filtering above, though, relates to the action of
creating copies of the original data, which can then be manipulated by parsing the da-
ta, removing unwanted symbols (mainly diacritics) and displaying the data in a form
that represents a higher level of abstraction.
As the description of differences between two speaker populations, especially where
one is a non-native one, automatically necessitates the use of a more complex set of
symbols in order to be able to describe fine nuances, the more conventional set of pho-
nemes generally used for the transcription of RP was clearly not sufficient. I therefore
had to make recourse to symbols from the full IPA character set, which I have – to

Chapter 6: Transcription of the Data.
89
some extent – also had to refine/redefine, in order to be able to describe the
differences between the populations. Thus, for instance, I use the symbol for the
central vowel [‚ ] to represent a quality, mainly produced by the non-native speakers,
which is more close and front than a shwa, in other words closer towards cardinal 10
[O]. Another symbol that is sometimes used in an unconventional way is the diacritic
that is commonly used to indicate devoicing [ 8] to indicate a weakening of a glottal
onset in word-initial positions.

90
7. The ‘Reference Model’.
The following section discusses the details of the ‘reference model’, i.e. describes
the features an ideal model/methodology for assessing speaker performance needs to
include and how they can be implemented in a database structure.
Obviously, such a reference model would have to be a multi-tier one, incorporating a
number of different features, both on the segmental and supra-segmental level, as con-
centrating on purely segmental features would completely miss out on features of
rhythm, stress and intonation that may affect the rules of production on the segmental
level. In other words, ignoring suprasegmentals is most likely to lead to incomplete
explanations.
An ‘old-fashioned’ segmental way would probably have been to simply use a
general pronouncing dictionary and compare the pronunciations of the non-native
speakers to the relevant entries in this dictionary in order to find any deviances. This
could easily be achieved by setting up a dictionary table in the database, linking it to
the non-native speaker realisations via the words in the dialogue and then running a
program that compares each native speaker realisation to the relevant entries in the
dictionary and flags all deviant forms. However, although this could certainly be part
of a valid solution towards establishing deviant realisations, there are various
problems with this approach. General pronouncing dictionaries, i.e. those generated
for non-Language Engineering purposes,
a) tend to be based upon established pronunciation models, such as RP or
GenAm, which may only reflect the pronunciation of a minority of native
speakers, although they may additionally contain some accepted regional
forms (cf. Wells, ‘90, viii).
Chapter 7: The ‘Reference Model’.
91
b) seldom contain any kind of information about contextualised forms, apart
from possibly including such features as assimilation in compounds (c.f.
Wells, ‘90, ix).
A good starting point would therefore be to find a way to quickly and reliably com-
pare the two sets of pronunciations as generated by both native speakers and non-na-
tive speakers in order to detect specific recurring features in the speech behaviour of
the non-native speakers that are in some way deviant from those of the native spea-
kers, as well as identifying specific tendencies in native speaker pronunciations that
might indicate deviation from established (teaching) norms.
7.1. Setting Up a ‘Pronouncing Dictionary’
The first step in setting up a list of realisations by the native speakers would be to
generate a list of all the realisations for a given word in the dialogue. Using a relatio-
nal database, this is relatively simple task that can be achieved by extracting the rele-
vant data via queries and producing lists of realisations that can then be linked to the
orthographic word forms in the “Dialogue” table. This way, we arrive at a list of dif-
ferent realisations for each word in the dialogue. This list can then be filtered15 again,
depending on whether one might want to see all realisations of a particular word at
once or only those realisations occurring in particular context, i.e. in a particular posi-
tion in the dialogue. Frequency counts on the realisations in general and in specific en-
vironments in particular can then be used as indicators towards certain patterns exhibi-
ted by the native speakers. Using a ‘live list’, as it were, provides far better options for
analysis than simply using a dictionary compiled from the native speaker realisations
as not all the context forms have to be listed for all environments, but rather are avai-
lable whenever a comparison is made, thus simplifying the list of realisations by redu-
cing their number according to the context.
15 in the traditional database sense discussed in 6.2.

Chapter 7: The ‘Reference Model’.
92
This method of creating a reference pronunciation provides a far more objective al-
ternative to the common ‘tradition’ of referring to a rather abstract and unnatural entity
termed “RP”, as was for example done by Wieden/Nemser in their study, which I dis-
cussed in my chapter on previous research. I am hereby of course not referring to RP
as it is described and defined by Wells (1982), but rather to the non-existent standard
taught to learners of English. This is loosely based on RP, but with the modification
that it also seems to incorporate the avoidance of all the pitfalls foreign learners might
be subject to if they do not respect the principles Gimson (1962 and later) puts forth in
his Introduction to the Pronunciation of English in the sections called “Advice to
Foreign Learners” discussed above.
The list of native speaker realisations was obtained by extracting all their
realisations from the ‘flatfile’ table mentioned above by using an SQL Union Query.
SQL Union Queries are normally used to combine data from different tables, but in
this case provided the only solution to retrieving similar data from the same table,
including duplicate Word_IDs. Shown below is the syntax for the Union Query used
to extract the native speaker data:
SELECT [Word_ID], [E03] AS [Realisation]
FROM [Realisations]
UNION ALL SELECT [Word_ID], [E04]
FROM [Realisations]
UNION ALL SELECT ALL [Word_ID], [E05]
FROM [Realisations]
UNION ALL SELECT ALL [Word_ID], [E06]
FROM [Realisations]
UNION ALL SELECT ALL [Word_ID], [E07]
FROM [Realisations]
UNION ALL SELECT ALL [Word_ID], [E08]
FROM [Realisations]

Chapter 7: The ‘Reference Model’.
93
UNION ALL SELECT ALL[Word_ID], [E09]
FROM [Realisations];
Having extracted all the realisations, I was then able to set up aggregate queries al-
lowing me to count the different realisations for each word automatically.
7.2. Handling Context & Weak Forms
One of the advantages of not simply comparing data to a general pronouncing dic-
tionary is that weak forms are not actually an issue at all, as most of them will be
clearly observable from the realisations of the native speakers. In other words, when
comparing native and non-native speakers, the weak forms produced by the native
speakers will in most cases be an indicator as to which weak forms those non-native
speakers who want to achieve near-native-speaker competence should be aiming for.
In a similar – though not quite as straightforward – way, phonological context forms,
i.e. those produced due to coarticulation, can also be handled. With phonological con-
text forms, it depends on whether the features causing the differences occur at the be-
ginning or end of the affected syllables, i.e. at the boundaries (such as assimilation and
elision), or whether they occur in between the words, i.e. as linking elements (such as
rs or glides), or produce the opposite effect, i.e. a hiatus (as glottal stops or pauses).
The difference thus consists not in the way of comparing, but in the way of recording
phenomena. Whereas weak forms will always be observable from within the realisa-
tion of the word itself in the database table, contextual forms may be recorded in
either the realisation or the transition from one word to the next. Comparing context
forms will then often mean that the realisations will have to be filtered as to individual
occurrences, rather than looking at all the possible realisations, which makes more
sense for weak forms. Figure 6 below provides an illustration of how native speaker
realisations and their associated transition values can be compared to non-native

Chapter 7: The ‘Reference Model’.
94
speaker realisations, at the same time identifying tendencies for both populations in
the data.
Figure 6 – A comparison of native and non-native speaker realisations for the word town.
In order to verify or correct ‘global’ details about the realisations, such as inserting
additional markup, it is possible to switch to the “Realisations” table at the current
“Word_ID” by clicking on the “Show Realisations table” button in the top right-hand
corner. As the data displayed on this form is based on the respective Union queries
that combine all speakers of a population and therefore does not show any details as to
which speaker has realised a particular realisation, double-clicking on a particular rea-
lisation in either the NS or NNS speakers subform not only opens the “Realisations”
table, but also finds the first occurrence of that particular realisation for that particular
ID, which makes it easier to identify which speaker(s) use this pronunciation. If more
than one speaker has used the same pronunciation, it can easily be copied from the
first realisation and searched for using Access’ Find functionality.
When first setting up categories for transitions between the words of the dialogue, I
started out with a rather limited set of options. The original list of values is shown in
the table immediately below:
Transition_ID Value 0 none

Chapter 7: The ‘Reference Model’.
95
Transition_ID Value 1 short pause 2 medium pause 3 long pause 4 linking r 5 linking other 6 linking w 7 linking j
Table 6 – The initial set of transition values.
As can be seen from Table 6, my original concept of transitions included three diffe-
rent types of boundaries, apart from a relatively small set of only five simple transitio-
nal possibilities describing different options for linking or the complete absence of any
linking whatsoever.
During the course of the analysis, I also expanded the set of ‘genuine’ transitional
categories in order to accommodate the phenomena I observed from the transcriptions.
The resulting set of transitional categories thus represents an empirically motivated re-
finement. In refining the set of options, I have also as far as possible tried to progress
from a simple, more phonologically motivated set of categories to a more and more
accurate set of descriptive phonetic categories.
Transition_ID Value Description 3 a+e assimilation + elision 2 aa anticipatory assimilation 32 aav anticipatory voicing assimilation 11 apn perseverative nasal assimilation 16 apo perseverative oral assimilation 31 apv perseverative voicing assimilation 10 coa coalescence 14 contr contraction 8 e elision 30 e+l elision facilitating liaison 29 elp elision + long pause 28 esp elision + short pause 33 evr extreme vowel reduction 12 fcl final consonant lengthening

Chapter 7: The ‘Reference Model’.
96
Transition_ID Value Description 22 fcllp final consonant lengthening + long pause 23 fclsp final consonant lengthening + short pause 13 fr final release 20 frlp final release + long pause 21 frsp final release + short pause 9 gsfp glottal stop replacing final plosive 27 gsfplp glottal stop replacing final plosive + long pause 26 gsfpsp glottal stop replacing final plosive + short pause 17 gsi glottal stop intrusive 24 gsilp glottal stop intrusive + long pause 25 gsisp glottal stop intrusive + short pause 15 h-dr h-dropping 5 lg linking glide 1 lia liaison 7 lj linking j 4 lr linking r 6 lw linking w 0 nl no linking 18 nllp no linking + long pause 19 nlsp no linking + short pause
Table 7 – The final set of transitional categories.
Most of the categories in the final table should be self-evident, but those that may
not be are discussed and clarified in the relevant sections in chapter 8 below. The one
thing that should be noted, however, is that that absence of linking (category none) is
also included as a type of transition, which strongly affects the overall calculations of
transitions occurring in the data. One further feature that distinguishes the transitions
in Table 7 from those in Table 6 is that part of the expansion of categories is due to the
splitting-up of those categories that may potentially be followed by a pause into three
sub-categories, transitions followed by no pause, by a short pause or by a long one
(discussed further below).

Chapter 7: The ‘Reference Model’.
97
7.3. Discourse Structuring & Cohesion.
Suprasegmental features can be compared inside the database in a similar way to
segmental features, once they have been recorded as clearly being associated with a
certain position inside a word or sentence. For example, stress patterns for
polysyllabic words could be indicated in an additional field for each realisation that
lists the number of the syllable on which the (primary) stress occurs, and potential
pitch movements could be recorded in a similar way by having a field that holds a
code for the direction of the movement. Issues of discourse structuring, in turn, can be
analysed by comparing suprasegmental features and segmental phenomena at certain
points within the dialogue, such as at sentence endings, as provided for in the F0
Database.
7.3.1. Pauses.
The “Dialogues” database makes no assumptions about where individual pauses are
realised by a particular speaker. Instead, pauses are incorporated into all those types of
transitions that are not specifically linking transitions. In other words, it makes sense
to assume that a transition that e.g. links two words to each other via linking glides or
assimilation can by default not be followed by a pause, whereas a position where two
words abut onto each other may or may not be followed by a pause. Counts of all tran-
sitions containing pauses can then easily be conducted in order to establish differences
in the ‘fluency’ of delivery or discourse strategies.
Among the pauses, a distinction is made between short and long pauses. Short pau-
ses correspond to minor (Ž) tone group boundaries and are < 300 msecs, whereas long
ones correspond to major (’) tone group boundaries and are > 300 msecs. Pauses in
general represent a potential analysis problem as they can easily be confused with clo-
sure phases for initial plosives:

Chapter 7: The ‘Reference Model’.
98
“A silent pause within a speaking turn can be operationally defined as any silence
which is 200 msec or more in duration. The reason for setting a minimum threshold
to the duration of a silent pause is that the silence associated with the closure phase
of a voiceless stop can sometimes last up to 180 msec or so, depending on the overall
rate of speech.” (Laver, ‘94, p. 536)
Thus my short pauses include those parts of the speech signal that are approximately
100 msecs longer than the closure phases of plosives on their own, but may incorpo-
rate them, and long pauses represent any absence of a signal that is above the length of
a short pause.
7.3.2. Final Release & Lengthening.
In the phonetics literature, sometimes the term final aspiration can be encountered,
referring to the release of a consonant in word- or – even more generally – utterance-
final position. However, agreeing with Laver, ‘94 (p. 348 ff.), I prefer to use the term
final release, restricting the use of the term aspiration to mean a delay in voice-onset
time between the end of a consonant and a following vowel, which is obviously not
applicable in utterance-final position. In addition to its application to utterance-final
consonants, I also use the term to refer to a kind of whispery offset to relatively short
vowels.
Final release in my transcriptions is either indicated as a transition of a word on its
own, or at the end of a phrase or sentence. This makes sense because it can usually be
seen as a special transition into a pause/tone group boundary, i.e. akin to final lengthe-
ning in general, or as a feature that attracts attention to a word, so as to make it stand
out from all the other words around it. In this latter case, it may signal a special em-
phasis on this particular word and also give the auditory impression of a prosodic
break despite the fact that there is a continuous, uninterrupted speech signal present.

Chapter 7: The ‘Reference Model’.
99
Although final release may seem a very simple phenomenon to identify, both audi-
torily and instrumentally, it can nevertheless easily be confused during segmentation
of the speech signal as it may introduce a kind of auditory clipping effect. This effect
may make it appear similar to utterance-final stød (c.f.8.1.6 below), or even a full
glottal stop, especially if the final element is a vowel with either creaky or whispery
quality.
Final lengthening, on the other hand, may take one or more forms, only one of
which is actually marked as a transition category. This explicit category is the
category of final consonant lengthening, whereas final vowel lengthening – i.e. final
lengthening in the more traditional sense – can so far only partially be recovered if
phrase or word-final elements have been transcribed including lengthmarks. Should
this feature turn out to be a relevant analysis point, additional fields in an extra table
could be associated with all such final elements and also be used to indicate whether
there may be final lengthening perceptually although the use of lengthmarks is not yet
warranted.
7.3.3. Pitch and Turn-taking/Dialogue Strategies.
Apart from the general F0-measurements stored in the F0 database, it is intended to
include stylised transcriptions of pitch derived from the F0-curves, at first only taking
account of sentence endings. This should allow for identification of turn-taking or
continuation strategies used by the native speakers and the detection of discrepancies
in the turn-taking behaviour of non-native speakers.
In a similar way to the “Realisations” table in the “Dialogues” database, though, it
would also be possible to associate potential pitch movements with all individual
words in the dialogue for each individual speaker, in order to investigate the intra-turn
behaviour of a speaker, i.e. in order to see which strategies a speaker employs e.g. for
representing lists and other cohesive structures.

Chapter 7: The ‘Reference Model’.
100
7.3.4. Stress, Accent and Prominence.
Stress on words in the “Dialogues” database is indicated in the form of the more tra-
ditional stress mark systems used to identify word stress, where indicates primary
and secondary stress on lexically and acoustically prominent syllables. As marking
stress for all words in the dialogue would be extremely time-consuming, stress-marks
could only be incorporated for some words that may form a part of multi-word units,
such as compound nouns and set phrases, and for selected deictica where it is interes-
ting to observe patterns of accentuation and de-accentuation on the word- and sen-
tence level.
Stress patterning may be an important feature distinguishing native from non-native
speakers, as the latter are still often unaware especially of patterns of de-accentuation
in English because these do not normally form part of the language-learning curricu-
lum. Instead, non-native speakers are generally drilled far too much to ‘respect’
correct word stress in order to distinguish word classes from one another, and are only
taught about sentence stress according to examples like the following from
Kenworthy, ‘87:
“A: There’s plenty of salt.
B: There isn’t any salt on the table.” (p. 11)
After citing the example, she then goes on to describe the phenomenon in the
following way:
“Speakers often decide that they want to give more prominence to a particular word.
A word may be given less weight because it has been said already, or it may be given
more weight because the speaker wants to highlight it. In the above conversation, B
would probably give extra stress to ‘table’, meaning: ‘There may well be salt, but I
want to point out to you that there isn’t any in a particular place – on the table.’ This
aspect of pronunciation is called sentence stress.” (ibid)

Chapter 7: The ‘Reference Model’.
101
Apart from being a somewhat odd example as stress on “table” would be extremely
unnatural without at least having ‘sentence stress’ on “isn’t” as well, Kenworthy’s
description is rather to narrow and simplistic because it
a) does not point out any correlation between word and sentence stress,
b) seems to imply that sentence stress can be applied almost randomly to any
item that the speaker wishes to give prominence to and thus ‘downgrading’
all other elements in the sentence, and
c) conversely seems to imply that the kind of de-accentuation Kenworthy refers
to as “given less weight because it has been referred to already” also seems
to occur in isolation, rather than being governed by contextual possibilities.
Especially point b) is very reminiscent of previously discussed (see 3.1.2) slightly
misguided descriptions on focussing.
Confusions of the issue of prominence on word and sentence level may stem from
the fact that in much of the teaching literature to date, too much emphasis has always
been placed on the notion of word stress referred to above, without trying to come to
terms with the real issues involved in identifying the reasons for prominence, i.e. that
it is generally governed by a complex interplay of structural possibilities with regard
to syntactic constraints and ‘pragmatic foregroundability’, issues of cohesion and
intentionality on the part of the speaker.
However, apart from the general issues of which parts of a sentence can actually le-
gally be given prominence in English, there is still the issue to consider, whether the
non-native speakers may not actually either be introducing additional patterns based
on L1 interference or on some kind of learner intra-language.
Most books that deal with prominence, probably with the notable exception of Ladd,
‘96 and some others, deal with stress-related prominence in only a more theoretical

Chapter 7: The ‘Reference Model’.
102
fashion, a way that relies more on the perception and intuition of the authors, rather
than paying attention to any actual phonetic features. However, for a proper analysis
one would also need to investigate physiological correlates, such as amplitude, magni-
tude16 and sonority to try and identify elements that are given prominence in the
sentences of the dialogue. Once points of prominence have been identified this way,
they can be compared to points of accentuation, i.e. those points in the sentence where
the speakers actually realise a pitch accent.
7.3.5. Cohesion and Prominence.
This part of a potential analysis relates to patterns of accentuation vs. de-accentua-
tion as already referred to above and aims to investigate whether both native and non-
native speakers consistently de-accentuate previously mentioned items or other items
that do not represent focal points in the sentence. The comparison between native and
non-native speakers should then help to identify deviant and potentially misleading
patterns used by the non-native speakers.
16 Sometimes also referred to as RMS amplitude. I am using this term here because it corresponds to
the relevant plot produced by the Speech Analyzer software. It is described in its help file as follows: “The MAGNITUDE plot shows the contour of the absolute amplitude of the Waveform. The Amplitude plot is sometimes mistakenly called the Loudness plot. Loudness, however, is a perception of the physical amplitude of a wave form. This plot is smoothed so as to take out some of the noise in the Waveform.”

103
8. Analysis: A Revised Evaluation Model.
In this chapter I will present part of the originally intended analysis, focussing main-
ly on the analysis of features on the segmental level. The starting point for the analysis
will in most cases be a discussion of tendencies observed from the realisations of the
native speakers. Those tendencies are then contrasted with the tendencies discovered
in the realisations as produced by the non-native speakers and any discrepancies and
possible solutions as to how non-native speakers could be taught to avoid them –
should it be necessary to do so – pointed out.
8.1. Segmental Features
At the segmental level, the first step in the analysis is to evaluate the productions by
the native speakers in the light of established teaching models and representations in
pronouncing dictionaries. The native speaker tendencies observed from this analysis
may then be used to establish a realistic teaching model which may be deemed repre-
sentative of native speakers of a particular educational and age background with
respect to overall pronunciation features. Such a model also has the advantage of
being more or less free of any ideological bias about which particular accent should be
taught to foreign learners and which features of real, i.e. non-rhetorical, speech should
be permissible for both native and non-native speakers. Having established such a
model, the realisations by the non-native speakers can then be compared to it to see
whether the latter are markedly different in some respects and whether the differences
may serve to explain what constitutes any particular accent the non-native speakers
may be exhibiting.
I will begin my attempt at developing a reference model for the segmental level by
looking at issues affecting the realisation of consonants in context.
As far as consonant-related features are concerned, we can distinguish between two
different categories of phenomena,

Chapter 8: Analysis: A Revised Evaluation Model.
104
a) those phenomena that are generally regarded as ‘non-standard’ usage and
therefore often stigmatised, such as h-dropping, the use of glottal stops, etc.
and
b) those phenomena that are deemed acceptable features of connected speech,
such as assimilation, elision, etc.
As already pointed out in 7.2 above, on the segmental level, there are basically two
different types of data to analyse, data related to phenomena occurring within words,
where I will concentrate on the following features
a) weak forms & peripheral qualities
b) triphthongs, diphthongs & monophthongs
c) Unusual or old-fashioned qualities,
and to phenomena occurring between words, i.e. relating to transitional effects17
a) h-dropping
b) assimilation
c) coalescence
d) liaison
e) linking- & intrusive-r
f) (avoiding the) hiatus
g) contraction
17 obviously, many of the effects listed here can also apply within words, so that the boundary
between them and transitional features as I discuss them is not absolutely clear-cut.

Chapter 8: Analysis: A Revised Evaluation Model.
105
h) elision/deletion
i) non-linking transitions
j) l-vocalisation or -elision
k) syllabic consonants
l) rhoticity.
For consonants, most of the relevant phenomena belong to the latter type and that is
why the main part of my analysis concentrates on them.
In analysing transitions, we are concerned with two different types of results:
a) to establish the features occurring as transitional effects and their raw fre-
quencies for both groups of speakers in order to determine whether the native
and non-native speakers employ different sets of rules affecting their realisa-
tions
b) to what extent the transitions used by both groups of speakers represent indi-
cators of potential differences in the levels of (dis-)continuity and what effect
these might have as to the perception of ‘nativeness’.
Regarding b), it is especially important to realise that – at least in ordinary speech –
in categorising transitions, we are not necessarily dealing with absolutely discrete ca-
tegories, but rather phenomena that represent a gradual continuum from a maximum
discontinuity, such as in full pauses, to the kind of maximum continuity achieved by
linking processes such as liaison or assimilation. Furthermore, it is also necessary to
realise that there need not be a one-to-one mapping between the type of transition and
its effect on continuity, as we shall see in the discussion of elision (see 8.1.8 below).
Throughout my discussion of transitional phenomena, I will to some extent support
the tendencies I have observed by some rough percentage figures drawn from aggre-

Chapter 8: Analysis: A Revised Evaluation Model.
106
gate sums of my annotation of transitional features. However, the reader should al-
ways bear in mind that these figures can only be seen to describe tendencies as the
overall number of speakers does not allow for any statistically valid conclusions to be
drawn and also because some of the transitional categories may potentially still be
improved upon. Graphs detailing the percentages for all the individual transition cate-
gories and combined/grouped categories respectively are given in Appendices B and
C.
8.1.1. H-dropping.
H-dropping, although relatively frequent in more informal speaking styles and
widespread throughout almost all regions of England (cf. Hughes/Trudgill, ’87 &
Wells, ‘82 Vol. 2), is still considered one of the great shibboleths in language teaching
and only considered acceptable in unaccented positions and mainly for function
words:
“In many types of popular regional speech in England and Wales, and in Australia, /h/
is lost, so that no distinction is made between such RP minimal pairs as hill, ill; high,
eye; hair, air. […] Such loss of /h/ is usually considered characteristic of uneducated
speech, but certain function words (especially have, has, had, pronouns and prono-
minal adjectives) frequently lose /h/ in RP in unaccented, non-initial [sic?], situations
in connected speech […].” (Cruttenden, ‘94, p. 174)
It is therefore interesting to observe whether especially the native speakers do stick
to this ‘rule’ or may actually deviate from it in some way. As h-dropping is defined as
one of the transitional categories, it is relatively straightforward in the database to
count all its occurrences, although some forms of elision of /h/ may be obscured by
other phenomena, such as perseverative nasal assimilation after elision, such as in
don’t have (ID 870-890) being realised as [d‚ Unn«v] 18 by speaker E07. Problems of 18 the [‚ ] represents the quality referred to in 6.2, which in general tends to be more characteristic of
non-native speakers.

Chapter 8: Analysis: A Revised Evaluation Model.
107
this kind could, however, be avoided if the transition categories were constantly
refined to incorporate a higher level of detail, and thus only represent problems related
to the particular state of implementation of my methodology for this thesis.
Possible candidates for h-dropping in the dialogue are the words listed in the table
below, together with their overall occurrence in the dialogue and the number of
realisations by native (NS) and non-native speakers (NNS). Actual occurrences of h-
dropping are listed in the relevant columns, with the number of potential realisations
indicated after the forward slash. Cases of ‘h-dropping’ that occur as part of other pho-
nological processes, such as contractions or perseverative nasal assimilation (see 8.1.2
below for the definition), are indicated in round brackets.
Word
frequ. in dialogue NS NNS
hall 1 0 0 hav
e 5 4/35
(1x perseverative nasal assimilation,
1x contraction)
0
head
1 0 0
help 1 0 0 here 1 0 0 hill 1 0 0 hop
e 1 3/7 0
how 2 0 0
Table 8 – Potential candidate words for h-dropping
As is immediately obvious from the above table, both native and non-native spea-
kers generally avoid h-dropping, although there is some incidence among the native
speakers, especially for the high-frequency word have. What is interesting about this
frequency list, however, and possibly also conclusive, is that the native speakers make
a relatively clear distinction between the use of the word have as an auxiliary, i.e. a
function word, and as a main verb. As have in the dialogue is in most cases used as a
Chapter 8: Analysis: A Revised Evaluation Model.
108
main verb, there seems to be less of a tendency to reduce it, including the elision of
the initial h, which conforms with the general textbook view.
The second word in which h-dropping occurs, on the other hand, does contradict the
textbook view in that the verb hope is certainly not a function word and also would
hardly be unstressed in the syntactic combination I hope I. Furthermore, both cases
were even produced by native speakers who are actually teachers of English by pro-
fession and would therefore probably a) be considered more educated than many other
native speakers and b) generally exhibit a more careful style of speaking due to their
occupation.
8.1.2. Assimilation.
As far as features of assimilation are concerned, we need to distinguish between the
two different major categories anticipatory and perseverative. English is often as-
sumed to be a language that mainly favours the first category:
“The mutual influence of contiguous phonemes in English functions predominantly in
a REGRESSIVE or ANTICIPATORY direction, i.e. features of one phoneme are
anticipated in the articulation of the preceding phoneme; […]” (Cruttenden, ‘94,
p.255)
or
“In perseverative coarticulation, some aspect of the production of a sound is carried
over into the production of a later sound, causing a progressive type of (“left-to-
right”) assimilation. Such assimilations are not very common in English, where the
regressive type, resulting from anticipatory (“right-to-left”) coarticulation, is much
more usual” (Pennington, ‘96, p. 57).

Chapter 8: Analysis: A Revised Evaluation Model.
109
This may be a common assumption because, as far as types19 are concerned, most
assimilatory processes are anticipatory. However, according to my data the importance
of the types seems less significant than that of the tokens, and as far as tokens are con-
cerned, the native speakers produce a slightly higher amount of perseverative assimi-
lations than anticipatory ones, with a ratio of 3.89% to 3.24% of transitions. The
figure for anticipatory assimilation here includes both cases of ‘pure’ assimilation and
those cases where either elision forms the basis for assimilation or occurs after it.
What I refer to as perseverative assimilation is a type of assimilation that is by no
means as clear in its realisation as most cases of anticipatory assimilation. It often
involves cases where the second segment involved in the process seems to be so
weakly articulated that it becomes ‘distorted’ or ‘subdued’ by the other, which often
makes it very difficult to recognise. I distinguish two different sub-types:
a) perseverative oral assimilation, where a following dental fricative is assi-
milated to a preceding alveolar (oral) one in combinations like is that
/Izzat/20 and past the21/pasz«/, etc.
This type is described in Cruttenden’s edition of Gimson’s Pronunciation of English
as follows:
“[…] word-initial /D/ – especially in the article the – may assimilate to /s, z/
following /s, z/, e.g. What’s the time? /Èw�ts ze ™™taIm/, Has the post come?
/ÈhQz z« ‚p«Us kÃm/, in very rapid speech.” (Cruttenden, ‘94, p. 260)
19 As opposed to tokens.
20 In my transcriptions, I will generally use the Northern vowel phoneme /a/, where RP would have /Q/ or /Aù/ as this reflects the realisations of my native speakers better.
21 Cases of perseverative assimilation, where there is elision involved such as in this one are not counted separately for simplicity’s sake.

Chapter 8: Analysis: A Revised Evaluation Model.
110
Cruttenden here makes it sound as if it this phenomenon were almost exclusively
restricted to the definite article, which in fact it isn’t, as it can just as well apply to the
pronoun that and indeed probably any word beginning in a /D/. It may even to some
extent apply to completely different transitions between words that would normally
contain a combination of final fricative and initial semi-vowel, such as in if we [IffIá] 22
(ID 580-590), as realised by speaker E07, where there seems to be some degree of
labialisation occurring that does not appear to have the type of lip-rounding associated
with it that one would normally expect from a /w/. We therefore seem to encounter a
process of assimilation of manner, place and voicing in this example.
He also claims that the phenomenon may (only) occur “in very rapid speech”, which
is probably a statement based more on an idealised view of speech as rhetoric, rather
than any physical facts. What I mean by this is that the relevant phonetics literature,
such as Gimson’s Pronunciation, has for a long time referred to and often still keeps
on referring to naturally occurring speech as (very) rapid or frequently also as collo-
quial. These labels seem to be based on the ideology of regarding only the kind of
enunciation encountered in rather careful and often prepared speech as ‘proper’ and
worth learning for foreign learners. In reality, however, the native speakers in my
recordings, whose realisations cannot even be seen as fully natural or conversational
because of the circumstances of the recordings, tend to produce mostly these assimila-
ted forms in the appropriate conditions and most of them speak by no means rapidly,
as the text they are performing is of an explanatory nature. The overall number of
cases of perseverative oral assimilation for native speakers amounts to 1.72%, which
demonstrates that this feature is definitely not an uncommon one.
Furthermore, it is also interesting to note that perseverative oral assimilation is
responsible for realisations by the native speakers that are deemed high priority
22 The symbol used here for the assimilated segment only reflects an approximation, rather than an
exact value.

Chapter 8: Analysis: A Revised Evaluation Model.
111
problems by textbooks like Kenworthy, ‘87 (p.137), who fail to see that in specific
cases alveolar fricatives replacing dental ones represent a very natural phenomenon:
“Learners who substitute /s/, /z/, /t/, /d/ for ‘th’ may be helped by being told to
position the gum [sic] on the roof of the mouth immediately behind the upper front
teeth; […] One strategy is to tell learners to pause before any noun, adjective or verb,
i.e. any content word, and concentrate on getting the ‘th’ right. They shouldn’t worry
about ‘th’ in words like ‘the’, ‘this’, ‘that’, ‘there’, etc. When students begin to
improve on content words (which will usually be stressed and crucial for meaning)
they can extend their concentration to ‘then, this, that, these and those’ (which are
also usually in stressed position [sic]), and finally to ‘the’.” (Kenworthy, ‘87, p. 75).
Although she realises correctly that the ‘correct’ realisation of the function words is
not as important to overall intelligibility, she nevertheless insists on non-native spea-
kers’ learning how to produce forms that would often be unnatural for native speakers.
As similar thing is true for the second type of perseverative assimilation I distin-
guish.
b) perseverative nasal assimilation, where a following dental fricative is
assimilated to a preceding alveolar nasal in combinations like in the /Inn«/
and in that /Innat/.
Descriptions of this type of perseverative assimilation are even harder to find in the
literature, with the notable exception of Roach, ‘91:
“In one particular case, we find progressive assimilation of manner, when a word-
initial D follows a plosive or nasal at the end of a preceding word: it is very common
that to find that the Ci becomes identical in manner to the Cf but with dental place of
articulation. For example (the arrow symbol means “becomes”):
‘in the’ In D« → In0n0«” (Roach, ‘91, p. 125)

Chapter 8: Analysis: A Revised Evaluation Model.
112
One other way of seeing this type of assimilation is to assume that it may also be a
specific type of coalescence involving the masking of an initial eth by the simultane-
ous pronunciation of the final [n], where the masking is due to the relative weakness
of the former. In this case, the phenomenon could also be referred to as nasal
coalescence.
Despite the fact that most textbooks do not even deem this phenomenon worth
mentioning, it accounts for an even higher number of all transitions in my corpus than
perseverative oral assimilation, namely 2.17%.
The combinations it occurs in often include the definite article or pronouns as in on
the /�nn«/ (ID 1430-1440), and the /«nn«/ (ID 1460-1470), taking the [tHeIkInn«] (ID
1330-1340), in that [Inna?] (ID 2070-2980), mainly in conjunction with such high-
frequency function words as prepositions and the conjunction and, and also generally
when the second word in the combination starts in /D/, as pointed out by Roach in the
quotation above, such as in and then /«nn«n/ (ID 1280-1290; after elision of the final
/d/) and from there /f¨�mne«/ (ID 1860-1870). The latter type is even realised with
this type of assimilation by all but one of the native speakers. However, it does also
seem to occur in positions where initial /h/ can assimilate after processes of elision,
such as in don’t have [d‚ Unnev] (ID 870-890). In this case, this may easily be mista-
ken for h-dropping (c.f. 8.1.1 above) – i.e. a form of elision, rather than a case of
replacement of one segment by another –, when actually assimilation of the initial /h/
leads to ambisyllabic gemination of the final nasal. One further interesting feature is
that perseverative nasal assimilation by the native speakers also seems to be possible
across a phrase boundary as in [NNa?] (ID 2790-2810) as a somewhat odd and licen-
tious realisation of the Oh, that occurring in the text.
It remains difficult to generalise about which words or segments may be involved in
perseverative assimilation, but as we have seen above and was pointed out by Roach,
there seems to be a clear favour for words beginning in /D/. As far as types of words

Chapter 8: Analysis: A Revised Evaluation Model.
113
are concerned, however, it certainly appears as if it is generally combinations of
mono-syllabic, high-frequency and mainly closed-class words that are involved,
which would also account for the relatively high occurrence of tokens present in my
data.
Compared to the cases of perseverative assimilation produced by the native
speakers, the number of occurrences produced by the non-native speakers is
considerably lower, only amounting to overall 1.98% of all transitions. T-tests for
perseverative oral and nasal assimilation show that differences for both of these
transition categories between native and non-native speakers are statistically
significant, weighted towards the native speakers. For oral perseverative assimilation,
the significance is below the 5% level (p=0.038) and for nasal assimilation even below
the 1% level (p=0.003). What is also quite remarkable is that the balance between the
oral and the nasal type seems to have shifted. Whereas the ratio of oral to nasal as-
similation for the native speakers was 1.72% to 2.17% – app. 1.3 occurrences of nasal
for each case of oral assimilation –, for the non-native speakers it seems reversed at
1.17% (oral) to 0.81% (nasal), app. 1.5 to 1 in favour of oral assimilations. The statis-
tical significance and the reversal of the ratios seem to indicate that not only are these
two transition categories important markers of difference between the two speaker
populations, but also that the non-native speakers seem to be less aware of the legality
of perseverative nasal assimilation in English or – if they are aware of it – possibly
associate a loss of distinctiveness with its use. As all of the German speakers are
originally from the South of Germany, or have at least been living there for some time,
they are quite likely to be using this type of assimilation themselves in their L1 in
realisations of such common expressions as [ge>(m)m«] (gehen wir) or [k�(m)m«]
(kommen wir), or would at the very least be familiar with them.

Chapter 8: Analysis: A Revised Evaluation Model.
114
Apart from a few exceptional realisations, such as [?8I¼vvö>] (ID 580-590) for if we
and [üntH«¼lòlòö>] for until23 you (ID 1020-1030; both speaker G06), the non-native
speakers on average produce the same kind of types of perseverative assimilation as
the native speakers. Speaker G09 even once produces an interesting example of
perseverative nasal assimilation after elision of a final nasal [tHe¼Ik**n‚ ] (for taking
the), thus demonstrating that not only does he seem to be aware that native speakers
do tend to assimilate in this way, but also that because of this knowledge, he has
adjusted his articulatory posture accordingly, even though the final nasal seems to be
elided24.
Some other cases, such as the voicing assimilation in of you [öfC¬>/Cu>] (ID 1260-
1270; speakers G05 & G03), seem rather more typical of German learners than of
native speakers, although differences in voicing assimilation in general between native
and non-native speakers prove to be statistically insignificant, due to its extremely low
frequency of occurrence, only amounting to 0.10% (ns) and 0.18% (nns) respectively.
However, features like assimilation of place in [D«t0d0«á] (that the, ID 1690-1700; G05),
although they do not occur in the data in the corpus, would not be unthinkable of in
native speaker realisations either (cf. Roach, ‘91, p. 125).
Moving on to anticipatory assimilation, we find again that the percentage of native
speaker realisations is considerably higher – at 2.88%25 – than that of the non-native
speakers – at 1.52%26. Apart from the obvious differences in the percentages, T-tests
show that the difference between the number of ‘pure’ anticipatory elisions is statisti-
cally significant (p=0.018), whereas the difference in assimilations plus elisions is
only marginally so (p=0.044).
23 this type of assimilation would, however, not be unusual for some native speakers, either.
24 One minor difference here, though, is that the initial nasal does not actually become dentalised, which may actually support the assumption that there is coalescence.
25 including cases of assimilation + elision at 0.35%
26 again including cases of assimilation + elision at 0.07%.

Chapter 8: Analysis: A Revised Evaluation Model.
115
Table 9 below shows all actually occurring combinations of words in the dialogue
where either pure anticipatory assimilation (a) or anticipatory assimilation + elision
(a+e) may occur and which processes are involved27:
Ex. Transition Words Process(es) NS count NNS count 1 a that board t#b → p#b 7 8 2 a might be t#b → p#b 6 6 3 a that case t#k → k#k 6 0 4 a on foot n#f → M#f 3 0 5 a then continue n#k → N#k 4 3 6 a then bear n##b → m##b 3 1 7 a(+e) won’t be nt#b → m#b28
nt#b → mp#b 2 (a+e) 5 (a)
1 (a+e) 8 (a)
8 a+e haven’t made nt#m → m#m 4 1 Table 9 – Word combinations involved in anticipatory assimilation.
Examples number 1 & 2 in Table 9 indicate that as far as combinations of final
alveolar plosive and initial bilabial plosive are concerned, most native and non-native
speakers do share the same set of rules stating that the final alveolar plosive may be
assimilated to a bilabial one, but that they may not always be willing to actually apply
it in all cases. The following table gives a breakdown of the actual transitions
occurring:
NS NNS that board 7x anticipatory assimilation 8x anticipatory assimilation
1x none 1x final release
might be 6x anticipatory assimilation 1x glottal stop
6x anticipatory assimilation 2x none 2x final release
Table 10 – Breakdown for assimilation examples 1 & 2.
Table 10 suggests that, as far as the non-native speakers are concerned, any avoi-
dance of assimilation may possibly be due to some speakers’ attempts at placing 27 The numbers in the first column are used for convenient reference.
28 in cases like this, there is nevertheless still a shortening effect of the elided consonant on the preceding vowel present, so that we end up with realisations like [w�mp] (E03, E04).

Chapter 8: Analysis: A Revised Evaluation Model.
116
higher emphasis on the deictic that in ex. 1 or the modal might in ex. 2, as signalled by
the occurrence of final release, rather than just the absence of linking. This assumption
would also explain why none of the non-native speakers assimilate example 3, but in-
stead we find 4 cases of final release and 6 of no linking. Of course, one might equally
well argue that the non-native speakers just do not consider assimilating an alveolar
plosive to a velar one an option, but the fact that, again, this type of assimilation does
also occur in German could be taken in favour of the assumption that the non-native
speakers are simply trying to generate a higher level of explicitness.
Examples 4-8 all involve cases where there is a (pre-)final nasal potentially involved
in anticipatory assimilation. Example 4 is a case of assimilation where an alveolar na-
sal assimilates to a labio-dental fricative, thereby turning into the labio-dental nasal
/M/. This type of assimilation is generally only described in any detail in textbooks on
phonetics when it occurs across syllable boundaries within the same word:
“In English, a labiodental nasal, /M/, may occur when /m/ occurs before /f/, as in
‘emphasis’ or ‘symphony.’” (Ladefoged, ‘93, p.158).
One other ‘classic’ example recurs annually on British television news when all the
major political parties meet for their annual [pAùti k�Mf¨«ns] in one of the seaside
resorts. Occurrence across word boundaries, however, is often only listed very briefly,
such as in Cruttenden, ‘94, p. 255, who cites as examples “ten forks” and “come for
me”. The brevity of discussion of this feature is probably also responsible for the fact
that this kind of assimilation is, to my knowledge, not explicitly taught to foreign
learners as being a potential feature of spoken English, which is why it is rather
unsurprising that none of the non-native speakers produce it. However, the fact that
less than half of the native speakers realise an [M] in this position shows that it clearly
represents an optional type of assimilation and thus one that would not necessarily
have to be learnt by the non-native speakers.

Chapter 8: Analysis: A Revised Evaluation Model.
117
Example 5 (then continue) seems to indicate that the native speakers see a choice to
assimilate when an alveolar nasal is followed by a velar plosive, but with a tendency
in favour of assimilation, whereas only three of the non-native speakers do seem to
realise the potential for assimilation. Example 6 (then bear), although it involves the
same word on the left-hand side, seems to contradict the native speaker tendency for
assimilations. However, upon closer inspection, it turns out that at least 1 of the native
speakers realises a short pause after the first word and one shows a clear case of final
consonant lengthening, which makes it likely that the native speakers might see at
least a potential for a prosodic break at this point – possibly for stylistic purposes or
purposes of clarity –, and this break may be causing a suppression of the tendency to
assimilate. In example 5, on the other hand, it is extremely unlikely for a prosodic
break to occur at this point as it immediately follows one, which 5 native speakers
realise as a long pause and 2 as a short one.
The final two examples are those where elision of a final /t/ may provide the basis
for following assimilation. In both cases, the first word already represents a case of
contraction (won’t, haven’t). The clear tendency by both native and non-native spea-
kers to assimilate so readily in example 7 without many exceptions may to some ex-
tent be due this combination being one that should occur with relatively high frequen-
cy in spoken language and therefore have a higher degree of redundancy than the
combination haven’t made, which would explain two separate facts, a) that there is
possibly greater reluctance by the native speakers to assimilate the second combina-
tion, although all of them elide the final /t/, and b) also why the non-native speakers
tend to have a higher degree of assimilation for the first combination – because they
have simply heard it more often from native speakers –, whereas they tend to avoid
assimilation in the second combination completely and only choose to perform elision
(at 80%).
As far as I can tell after repeatedly annotating and checking my categories, the
counts of the phenomena discussed above are correct, but in analysing phenomena

Chapter 8: Analysis: A Revised Evaluation Model.
118
such as assimilation, elision and glottal stops, it is extremely easy to be misled by
preconceived assumptions. This is partly due to the fact that, on a purely auditory
basis, it may be extremely difficult to tell the different phenomena apart, especially
elisions and (word-)final glottal stops. This problem is furthermore compounded by
the difficulty for the inexperienced waveform/spectrogram reader in recognising the
separate consonants involved. This is especially true for plosives, which represent the
majority of consonants involved in processes of assimilation or elision. The way that
plosives are generally discussed in the relevant literature, one may well gain the im-
pression that the most characteristic features of plosives are their stop gaps, followed
by relatively distinct release bursts. This assumption, though, can easily become mis-
leading if one starts looking out for two closure phases and release bursts in a row
when segmenting an utterance.

Chapter 8: Analysis: A Revised Evaluation Model.
119
Figure 7 – An example of anticipatory assimilation
Figure 7 above illustrates part of the problem. Whereas there is a very distinct burst
for the final [p] to be seen in both the spectrogram and the waveform, the burst for the
initial [b] is almost impossible to detect in the spectrogram and rather indistinct in the
waveform, so that the inexperienced segmenter may easily assume that there is only
one burst present and hence that the final consonant of white is elided, rather than as-
similated29. A further problem at the auditory level may be that sometimes the final 29 This example, however, is not a prototypical one because in general a plosive in this position would
not be released if it is involved in an assimilatory process.
‘high-energy’ burst for [p] low-energy burst for [b]

Chapter 8: Analysis: A Revised Evaluation Model.
120
consonant may be unreleased, in which case the only way to recognise the assimi-
lation should be because of the formant transitions leading into the plosive. However,
this may also present a problem, as in the case of an assimilated unreleased plosive the
transitions might equally well be due to either of the two plosives, whereas only in the
case of non-assimilation should there be two different transitions present. And yet fur-
ther difficulties may be introduced by the artificial clipping effects that are artefacts of
the segmentation itself and may sometimes make final elided plosives sound like glot-
tal stops. In order to distinguish between true glottal stops and elisions, it may some-
times be necessary to zoom into the waveform for an extremely close analysis, which
may not always be possible if the overall amount of data to be segmented is very high.
Further details of this problem will be presented in 8.1.9 in conjunction with the dis-
cussion of glottal stops.
8.1.3. Coalescence.
Coalescence, i.e. the process whereby two (consonant) segments mutually influence
each other, accounts for 1.57% of the native speaker transitions and only 0.81% of all
non-native speaker transitions. In general, when textbooks talk about coalescence,
they often refer to only one type of it, that where a plosive or fricative is followed by
the semi-vowel /j/ to yield forms like /wUdZU/ or /TaNkCU/, etc. This phenomenon is
sometimes also referred to as “yod-coalescence” (Wells, ‘82, p. 247). I shall, however,
make a distinction between yod-coalescence and the type of coalescence that may
occur between /t/ and /¨/, discussed in Cruttenden, ‘94 (p. 157ff) under the heading of
affricates, which I shall refer to as tr-coalescence.30 The two cases are actually quite
distinct in the way they operate, as yod-coalescence is responsible for a kind of
transition between words whereby the final and initial segment of both words fuse,
which in turn creates the linking effect. Tr-coalescence, on the other hand, does not
30 As we have seen earlier in 8.1.2, what I have termed perseverative nasal assimilation may
potentially constitute a third type.

Chapter 8: Analysis: A Revised Evaluation Model.
121
necessarily have to involve both the final and the initial segment as such, but may
actually occur because of a reduction of the final syllable of the first word, thereby
creating the necessary condition for liaison with a second word beginning in a vowel.
There is only one example of this in my data, realised by two of the native speakers in
the sequence a quarter of an hour (ID 2600-2640), where quarter of is realised as
[kw�>tS«v ] by speaker E03 and as [kHo>tSöv] by speaker E07. This odd effect is actu-
ally created by the devoicing of the initial /¨/ as it assimilates in voicing to the final /t/.
Interestingly, though, also one of the non-native speakers, speaker G02, produces a
form of coalescence, but at the same time voicing the segments in question, so that it
no longer sounds native speaker-like ([kw�¼>dZµ v]). Overall, this probably represents
a phenomenon of relatively low frequency in any spoken corpus, but on the other
hand, it may be exactly one of those features which, when one ‘adds up’ all the detail,
makes up part of the difference between native and non-native speakers.
As far as the more common phenomenon of yod-coalescence between words is
concerned, Table 11 below gives an indication where it occurs and how many times
each potential occurrence has been realised by both native and non-native speakers.
Ex. Combination NS NNS 1 could you 3/7 2/10 2 do you 6/14 0/20 3 take you 1/7 3/10 4 would you 7/7 8/10 5 but you 1/7 1/10 6 thank you 3/7 3/10 7 made you 6/7 2/10
Table 11 – Occurrences of yod-coalescence.
Table 11 seems to indicate that native speakers have a (sometimes far) higher
preference for using coalescence in cases where the final segment of first word is a
voiced alveolar plosive (Ex. 1, 4, 7), but seem to be more reluctant in cases where the
final element is either a voiceless velar plosive (Ex 3, 6) or a voiceless alveolar

Chapter 8: Analysis: A Revised Evaluation Model.
122
plosive (Ex. 5). The latter is relatively easily explained by the fact that in Ex. 3, the
native speakers exhibit a rather high tendency (6x) to replace the final segment by a
glottal stop, thus removing the precondition(s) for coalescence. In Ex. 231, there also
seems to be some slight reluctance towards performing coalescence, possibly due to
the necessity of having to reduce the vowel of the first word extremely. In general,
something that is reminiscent of the parameters influencing assimilation as discussed
in 8.1.2 above is that it seems that there are mainly high-frequency function words
involved in the process.
Regarding the non-native speakers, there seems to be little discrimination between
final voiced and voiceless segments. The number of occurrences of coalescence is
relatively low throughout (0.81%), although at least the combination would you (Ex.
4, 8 occurrences) seems to trigger coalescence, possibly because it represents a high-
frequency combination, although the same should normally at least be equally true for
could you, (Ex. 1, with only 2 occurrences). The fact that the non-native speakers
seem to be reluctant to coalesce do you is – in my opinion – not very surprising, as it
first requires the deletion of the vowel in do, a phenomenon which they would probab-
ly associate more with a strongly ‘colloquial’ style. The combination but you (Ex. 5) is
interesting because there is only one occurrence by one non-native speaker. Again, this
may be due to the non-native speakers’ trying to place a kind of special emphasis on
the adversative but, an assumption that is supported by the fact that amongst all the
other realisations there are at least one case of final lengthening and 4 cases of non-
linking.
When coalescence occurs across word-boundaries, as in all the examples occurring
in my data, it invariably seems to lead to what could from a phonological point of
view be referred to as a ‘resyllabication’ of the final plosive of the first word, thus
31 In this case, obviously a precondition for coalescence is the elision of the vowel in the first word,
so that this might also count as an example of either elision or contraction, which demonstrates that some transitions could be ‘multi-valued’.

Chapter 8: Analysis: A Revised Evaluation Model.
123
yielding forms like /kU#dZU/ or /wU#dZU/, which represent complex forms of liaison
(see 8.1.4 below). On the phonetic level, this phenomenon seems to express itself in
the speed of transition between the two words involved. In case of a ‘resyllabication’,
the final vowel of the first word does not appear to be shortened by the effect of the
following plosive, whereas in the case of ‘non-resyllabication’ it would have to be.
This seems to be supported by the fact that whenever non-native speakers seem to
‘avoid’ coalescence, they nevertheless show a distinct tendency towards simple liaison
instead, thus producing /kU#djU/, without coalescing the plosive and the fricative,
simply ‘resyllabifying’ the final plosive to augment the onset of the second word.
In general the difference between native and non-native speakers in their use of
coalescence is statistically significant below the 1% level (p=0.004), so that this
feature certainly represents a distinguishing factor.
8.1.4. Liaison.
My use of the term liaison differs somewhat from the way it is defined in
Cruttenden, ‘94 (p. 262ff.), who discusses many different types of linking under the
same heading. I discuss some of those features separately below and limit my use of
the term to those occurrences where a final consonant other than /¨/ is resyllabified,
thereby turning into the onset of the following word. According to Cruttenden, liaison
is a feature that should be very uncommon in English:
“As regards boundaries where a consonant precedes a vowel, it is unusual for a word-
final consonant to be carried over as initial in a word beginning with an accented vo-
wel, the identity of the words being retained ([…]). Thus, run off, give in, less often,
are rarely /rà ™n�f, gI ™vIn, le ™s�fn/; more particularly, the voiceless plosives do not
acquire aspiration, such as would accompany their shift to an accented syllable-
initial position, e.g. get up, look out, stop arguing, are not
[ge ™tHÃp, lU ™kHaUt, st� ™pHAùgjUIN]. One or two phrases in common use do, however,

Chapter 8: Analysis: A Revised Evaluation Model.
124
show such transference, e.g. at home, not at all, often pronounced
[« ™tH«Um, n�t « ™tH�ùlò]; they may be considered as constituting, in effect, composite
word forms.” (Cruttenden, ‘94, p. 264)
However, this seems to be completely contradicted by my data, where liaison ac-
counts for 11.73% of all native speaker transitions, thus representing one of the major
means employed to achieve ‘fluency’. That liaison does indeed also happens in natu-
rally occurring speech and may present a major problem for non-native speakers in
understanding native speakers is confirmed by an anecdotal experience of mine. A few
years ago, when I was sharing a flat in postgraduate university accommodation with
students from different nationalities, an English flatmate of mine one day came into
the kitchen and said that had to “get up at eight o’clock” ([getH«pH«tHeItH«kl�k]) the
next day, whereupon a Greek flatmate astonishedly asked him what a “potato clock”
was.
As liaison is such a common feature amongst the native speakers, it is perhaps un-
surprising that the non-native speakers also seem to be well aware of it and attempt to
‘imitate’ it. Thus liaison represents the third-most common type of transition category
produced by the non-native speakers, with a percentage that is remarkably close to
that exhibited by the native speakers, namely of 10.97%. A T-test also shows that there
is no significant difference between the two populations (p=0.331). These findings
contradict textbooks such as Kenworthy, ‘87, who claims:
“There is one problem area. In English there is a smooth link between a final conso-
nant in one word and an initial vowel in the next word, as in ‘fullíup’. But in Ger-
man, words beginning in vowels have a preceding glottal stop (a kind of catch in the
throat). If this native language habit is carried over into English , the effect will be of
too many ‘jerks’ or slight pauses between words.” (Kenworthy, ‘87: p.136)
However, it has to be remembered that liaison as performed by the non-native spea-
kers does to some extent subsume cases where the native speakers would be using

Chapter 8: Analysis: A Revised Evaluation Model.
125
coalescence, so that the difference in usage rises somewhat if we look at the combined
percentages for coalescence and liaison of 13.30% (NS) and 11.79% (NNS), although
this difference still does not yet prove statistically significant (p=0.062), despite
showing a tendency. This finding also clearly illustrates another important point,
namely that if one were to rely purely on an automatic analysis of such data,
connections such as these would probably easily be missed.
8.1.5. Linking- & Intrusive-r.
Cruttenden, ‘94 classifies the phenomenon of linking-r as a type of liaison (p.
262ff.), together with other linking features that help to avoid a hiatus between words
that – at least in all non-rhotic accents of English – generally end and begin in a vowel
respectively (cf. Knowles, ‘87, p. 132ff.). However, from a learner’s perspective,
general liaison, i.e. in cases where there is a final consonant that can be resyllabified is
present, should be considered in a different way from introducing linking elements
that are not necessarily encountered in the written forms primarily encountered by
learners.
Amongst those semi-vowels or glides used to avoid the hiatus, again, rs may be seen
to have a special status, which is why I discuss them in a section separate from the
general section on avoiding the hiatus. The reason why they need to be handled sepa-
rately is partly that they may have two different realisations, as genuine linking-rs or
as intrusive ones. As far as genuine linking-rs are concerned, they may represent a
problem for learners, as even though they are linking elements that are actually repre-
sented in spelling, most learners who have been taught RP or any other non-rhotic ac-
cent of English will have been drilled not to produce word-final or post-vocalic rs to
the extent that they may have become reluctant to reintroduce them even if the fol-
lowing word begins in a vowel. This seems to be to some extent exemplified by the
data in Table 12, where the only major exception is the combination far it, where
nearly all non-native speakers do produce a linking-r.

Chapter 8: Analysis: A Revised Evaluation Model.
126
Realisation Word_ID NS NNS 1 whether I 230 7 1 2 there’s 350 0 1 3 arear on 410 4 0 4 more easily 560 7 0 5 or are 720 5 1 6 (are) your on 740 1 0 7 far it (is) 2250 7 9 8 quarter of 2610 0 3 9 are always 2730 5 3
Table 12 – Potential r-linking candidates (r signifies intrusive r) and number of realisations.
However, simply to assume that the absence of linking rs by the non-native speakers
is due to their efforts to produce strictly non-rhotic forms may be somewhat mislea-
ding as some of them do actually produce rhotic variants of Examples 4 (4x), 5 (1x)
and 8 (1x), which block the linking process. For the German speakers, these rhotic
forms may possibly be due to inconsistent teaching though, as in many German
schools it depends on the teacher which model of English is actually taught.
Example 2 is interesting in the sense that here we find a case of a linking-r realised
by a non-native speaker that would be highly unlikely to have been produced by a
native speaker, as the combination there is would almost automatically undergo
contraction, unless of course it would be used as an emphatic confirmation or answer
to a question. For this example, we again find 2 rhotic realisations, but in this case as
parts of contractions, again demonstrating the slight inconsistency among the non-
native speakers.
With regard to intrusive-rs, i.e. rs that do not appear in the spelling, we can only find
two combinations realised by native speakers, Examples 3 area on and 6 (are) you on.
More than half the native speakers (4) produce Example 3, whereas only one speaker
uses the intrusive-r in Example 6. This may potentially indicate a tendency amongst

Chapter 8: Analysis: A Revised Evaluation Model.
127
native speakers to insert intrusive-rs between words after a final shwa, but to employ
either other means of linking – such as /J/s or /W/s – after less central vowel qualities,
or be replaced by an even more extreme form of linking, which I have termed extreme
vowel reduction. This form of linking will be discussed further below in section 8.1.8
when I discuss aspects of elision. Regarding the non-native speakers, though, there
seems to be a general reluctance towards using any intrusive-rs at all, which also
manifests itself in a difference between the two speaker populations that is highly
significant (p=0.00004).
8.1.6. Avoiding the Hiatus.
In this section, I will discuss the occurrence of the two other segments that may be
used in order to avoid a hiatus, the two semi-vowels /J/ and /W/. Often, these two
‘bridging segments’ are described as representing something equivalent to forms of
perseverative assimilation on the consonant level as it is generally assumed that final
high front vowels in the first word trigger the insertion of a /J/, whereas back vowels
cause the insertion of a /W/. This is also often reflected in conventional phonemic tran-
scription practice. However, at least one of my examples contradicts this assumption
and suggests that there may well be the possibility of an anticipatory, rather than a
perseverative, process occurring. Speaker E06 produces this form of linking after a
front vowel in the combination (with) you or (are you on foot?), realised phonetically
as [ji¼W�¼WA¼ù] (ID 700-730), where the linking process even occurs across a phrase
boundary. However, as the symbol for creaky voice32 ( ¼) in the transcription indicates,
there seems to be some kind of activity going on in the larynx which may cause at
least a slight velarisation of the front vowel and would thus potentially explain the
preference for /W/ as a linking element in this position.
32 I have used the diacritic for creaky voice throughout my transcriptions to indicate an auditory
impression that may represent either true creaky voice or some degree of tenseness in the larynx.

Chapter 8: Analysis: A Revised Evaluation Model.
128
As far as the usage of the two linking elements is concerned, there is a distinct dif-
ference between native and non-native speakers, in that the latter show a far greater
reluctance to use /J/s (with 2.16% as opposed to 3.84% NS). This difference proves to
be a marker of high statistical significance, at p=0.00005. On the other hand, the non-
native speakers seem to have a slight preference for /W/s (1.35% as opposed to 1.31%
NS). The difference in usage, however, seems to generally be more one of tokens than
of types in my data, as there are only two combinations where the native speakers use
linking ws that are avoided by the non-native speakers, continue up (to the town hall)
(2x) and unreliable anyway (1x). Both occurrences are probably easily explainable,
the first by the fact that German speakers often seem to have a tendency to stress
deictica and may therefore prefer the hiatus to add emphasis to the preposition, and
the second that the basis for inserting the linking w in this case was actually provided
by the particular native speaker vocalising the final /l/ of the first word. Regarding j-
linking we have a similar situation, with the four separate types listed immediately
below:
Word_ID Combination Count 1 740 you on (foot) 1 2 1900 be able 7 3 3100 60 is 1 4 3120 very unreliable 7
Table 13 – NS cases of j-linking unmatched by NNS.
Out of these four types, Examples 1 & 3 represent ‘one-offs’ by native speakers, in
Ex. 1 speaker E07 contracts the phrase or are you on (foot) to [Î *i>J�m], where the
asterisk represents the complete elision (deletion) of the word are, and in Ex. 3
speaker E03 fails to produce the contraction that almost all other native speakers
make. Examples 2 & 4, though, seem to be more symptomatic of the difference
between native and non-native speakers, as all native speakers perform the linking in
these cases, while the non-native speakers avoid it. As a result of the non-native

Chapter 8: Analysis: A Revised Evaluation Model.
129
speakers’ avoidance of linking, they tend to produce a very specific form of hiatus,
which is discussed further below in section 8.1.9.
8.1.7. Contraction.
Contractions represent a very interesting transitional category to investigate, for
various reasons. The first is that, while other phenomena of spoken language such as
assimilation and elision rarely get taught at the less advanced levels in the language
classroom, contractions are introduced at a very early stage. It should therefore be
expected that the number of non-native speakers realisations would be very close to
that of the contractions made by the native speakers. We shall see further on below to
which extent this is true and whether there are any difference in the way contractions
are handled and perceived as necessary by both sets of speakers.
The second reason why contractions represent an interesting category is because
they represent a phenomenon that is not easily defined. Although they are often
subsumed under the heading of elision, this is by no means an unquestionable
categorisation as Roach points out:
“It is difficult to know whether contractions of grammatical words should be
regarded as examples of elision or not.” (Roach, ‘91, p.127)
I see contractions as definitely representing a category that is different from pure
elision because elision usually only involves the loss of one or more intermediate seg-
ments, whereas contraction can be seen as arising from a combination of two proces-
ses, the reduction and consequent elision of one or more reduced or unstressed seg-
ments. One of the best examples for illustrating this concept is probably the contrac-
tion of I have /aIhav/ to I’ve, which can be described in the following steps:

Chapter 8: Analysis: A Revised Evaluation Model.
130
[aIhav] → [aIJav] (elision of initial h)
→ [aIJ«v] (vowel reduction)33
→ [aIv] (elision of reduced vowel)
As pointed out above, technically there should not be too much of a difference
between the usages of native and non-native speakers, but surprisingly, the percentage
of contractions is actually slightly higher at 3.93% for the latter, whereas for the
former it is only 3.79%. This difference, however, proves to be of no statistical
significance. Below is a table of candidate word combinations, which, upon closer
examination, will help to explain why there is such a difference.
Word_ID Word NS NNS 1 3100 60(‘s) 5 7 2 870 do(n’t) 7 10 3 3330 have(n’t) 7 10 4 190 I(‘m) 7 10 5 810 I(‘ll) 1 7 6 1980 It(’s) 7 10 7 2350 it (will) 2 0 8 1350 road (will) 2 0 9 350 there(‘s) 7 9 10 2820 wo(n’t) 7 10 11 3000 would(n’t) 7 10 12 1190 You(‘ll) 4 7 13 1880 you(‘ll) 1 9 14 2530 you(‘ll) 2 8
Table 14 – Candidate word combinations for contraction.
The clue to the main differences seems to lie in examples 5, and 12 through 14, i.e.
those combinations where the second element represents a reduced form of the
auxiliary will. Table 14 may at first glance suggest that the native speakers here avoid
making any contractions altogether, but in reality they actually reduce the auxiliary to
such an extent that it becomes non-existent and the first word ends rather abruptly.
33 Alternatively, of course, the first two steps could be seen as co-occurring.

Chapter 8: Analysis: A Revised Evaluation Model.
131
This tendency ties in well with other phenomena that lead to abrupt breaks between
words, such as l-vocalisation. Examples 7 & 8 are also very interesting as they demon-
strate the naturalness of the dialogue situation for at least some of the native speakers,
as they produce a contracted form where the dialogue text has the full form of the
auxiliary, whereas the non-native speakers clearly show that they are concentrating
more on a faithful rendition of the text.
8.1.8. Elision.
Elision as a transitional category represents a problem of categorisation as it may
lead to two different types of effect. When there is pure elision, i.e. when one or more
segments get dropped without this having a linking effect, then we get the effect of
some kind of discontinuity. This is especially true if we end up with a combination of
two plosives, i.e. two complete closures with a stop gap between them. Examples of
this would be combinations like kept quiet becoming /kepkwaI«t/ (Knowles, ‘87, 129)
or in my data the realisation of the phrase be able to see (ID 1900-1930) as
[bIJEb*34tHUsi>] by speaker E08. At the less extreme end of the scale, we find examples
like the combination and then (ID 1280-1290), realised as [«n*D«n], where the
combination of final nasal and initial fricative may well cause a lesser effect of
discontinuity.
However, in cases where elision facilitates the linking process, it has to be catego-
rised along the same lines as liaison, for example in get to the (ID 1040-1060),
realised as [get0**D«] where the final /t/ of get may be elided along with the reduced
shwa of to in order to avoid a gemination of the left-over plosive, thereby facilitating
the articulation of an otherwise very difficult cluster.
Traditionally, elision is also often described as a phenomenon that affects either
consonants – when difficult clusters get simplified – or vowels – when they are re-
34 The asterisk is used to denote the element that is elided.

Chapter 8: Analysis: A Revised Evaluation Model.
132
duced to such an extent that there is little or no trace left of them, as in police being
realised as [pliùs]. However, rarely is it described as a feature that may be a pre-stage
to liaison, in a similar way as it may provide the basis for assimilation. If it acts in
such a capacity, it not only simplifies the complexity of segment combinations and
thus makes them easier to pronounce, but also seems to have an effect on the overall
rhythm by establishing the conditions for heightened continuity through setting up a
CV(C) structure across word boundaries, at the same time potentially ‘compressing’
reduced syllables and words so as to make them less prominent. Examples of this in
my data are [kIáRIá] (E08) or [k¬dIá] (E09) for could you (ID 50-60), where the speakers
choose not to coalescence, but instead to delete the glide at the onset of the following
word, thereby effectively replacing it by the coda of the preceding one35, and such
cases where (at least) the final vowel of the initial word is elided in order to avoid a
hiatus, as in do you realised as [d*j«] (ID 650-660; E04), you on as [j*�)m] (ID 740-
750; E0536), for your as [f*j ‚ ] (ID 3250-3260; E04, E06, E08, E09) and easily if (ID
570-580) as [i>z*l*If] or [i>zIl*If]. This final example is even realised in either of the
two ways by all native speakers.
The second type seems to be by far the more common one and in comparing native
and non-native speakers, it is interesting that the latter show a slight preference (3x) in
the combination you on to retain the vowel of the pronoun and elide the one in the pre-
position, thus producing forms like [j¬*n] or [jµ *n], which may indicate that they
perceive the pronoun as more important and therefore at least not completely redu-
cible, whereas they readily reduce the preposition on, which is generally not reduced
in the varieties of English spoken in England, although speaker E04 actually does it
once (ID 1430). A similar tendency may be seen in realisations of the combination to
35 An alternative interpretation would be to say that elision actually occurs on the vowel of the second
word and that the glide at the onset of the second word is only modified. In this case, it could obviously not count as an elision in the sense discussed above, but nevertheless, the amount of elisions occurring in the data would remain the same.
36 with perseverative assimilation occurring on the nasal in on.

Chapter 8: Analysis: A Revised Evaluation Model.
133
allow (ID 2560-2570), where again three non-native speakers produce more of a
strong form, this time for the preposition, rather than reducing and eliding the vowel.
Another type of elision, favoured solely by the native speakers, only involves
compression of reduced words, namely with the preposition to as the first element in
the combination. It occurs in such combinations as to show [t*S«U], to the [t*D«], to
see [t*siù] and to buy [t*baI] and is labelled in the database as transition type evr
(extreme vowel reduction). I use the label extreme vowel reduction for this category
because in many cases it is not absolutely clear whether the vowel has disappeared to
100%, in which case there should be no trace of it in the spectrogram, either, or whe-
ther it has simply been reduced so that it becomes almost imperceptible. Table 15
below gives a breakdown of all the occurrences:
Word_ID Word Count
2650 to buy 4 1920 to see 2 530 to show 5 110 to the 3 1050 to the 5 1130 to the 4
Table 15 – Extreme vowel reduction (evr) in to
The first three examples have to as an infinitive marker, rather than a preposition.
The combination to buy is especially interesting as it produces an abutment, which
would normally have the effect of blocking the linking process, while in this case, it is
almost reminiscent of coalescence. The preference amongst the affricates resulting
from the extreme vowel reduction may be due to the fact that the combination /t/ + /s/
is generally not to be found in word-initial position in isolated words in English,
whereas /t/ + /S/ has a wider distribution.
The final three examples, of the combination preposition + definite article, account
for more than 50% of all the realisations of this combination (12 out of 21). Again, we

Chapter 8: Analysis: A Revised Evaluation Model.
134
end up with a combination of plosive + fricative, but one that would probably be com-
pletely alien to most non-native speakers, apart from the fact that at least German
speakers tend to place more emphasis on prepositions, etc. and would therefore pos-
sibly never reduce this preposition to such an extent, anyway. The number of occur-
rences of extreme vowel reduction in my data shows that this kind of reduction is not
only confined to particular accents of British English, such as the Yorkshire and Lan-
cashire accents, as is sometimes stereotypically assumed, but rather represents a gene-
ral distinguishing feature between native and non-native speakers. Although it only ac-
counts for 2.33% of native speaker transitions, the difference between the two popu-
lations is statistically highly significant well beyond the 1% level (p=0.0005).
Another type that greatly contributes to the overall amount of elisions by the native
speakers is that of complete elisions (deletions). Overall, there are 50 instances of
varying grammatical categories in my data. A list of all deletions plus the relevant
word categories can be obtained by running a query that searches for all occurrences
of the elision marker *, linked to the grammatical tags37. Table 16 below shows all
native speaker occurrences:
Word_ID Count Word Tag 1640 1 the AT 2710 2 The AT 2600 1 a AT1 2670 4 a AT1 720 1 or CC 2230 1 on II 2020 1 very JJ 130 1 train NN1 190 1 I PPIS1 790 1 I PPIS1
37 SELECT [NS PronOccurrences].Word_ID, [NS PronOccurrences].Word, [NS
PronOccurrences].CountOfRealisation, Tagset.Tag FROM [NS PronOccurrences] INNER JOIN (Tagset INNER JOIN Dialogue ON Tagset.Tag_ID = Dialogue.Tag_ID) ON [NS PronOccurrences].Word_ID = Dialogue.Word_ID GROUP BY [NS PronOccurrences].Word_ID, [NS PronOccurrences].Word, [NS PronOccurrences].Realisation, [NS PronOccurrences].CountOfRealisation, Tagset.Tag HAVING ((([NS PronOccurrences].Realisation) Like "[*]")) ORDER BY Tagset.Tag;

Chapter 8: Analysis: A Revised Evaluation Model.
135
Word_ID Count Word Tag 2890 1 I PPIS1 3320 3 I PPIS1 1030 1 you PPY 3240 1 you PPY 3400 1 now RT 1100 1 then RT 170 1 Oh UH 730 1 are VBR 2730 4 are VBR 820 6 'll VM 1200 3 'll VM 1890 7 'll VM 2540 5 'll VM 880 1 n't XX
Table 16 – NS complete elisions (deletions)
If we compare these occurrences to the ones produced by the non-native speakers,
we find that not only do the non-native speakers produce far fewer complete word
elisions, but also that the ones they produce are limited to only a few grammatical
categories, as can be seen in Table 17 below.
Word_ID Count Word Tag 120 1 the AT 1640 1 the AT 370 1 a AT1 2850 1 a AT1 580 1 if CS 2460 1 it PPH1 3320 1 I PPIS1 660 1 you PPY 820 3 'll VM 1200 3 'll VM 1890 1 'll VM 2540 2 'll VM
Table 17 – NNS complete elisions
Both native and non-native speakers do elide articles or reduce the contracted form
of the auxiliary to such an extent that it is completely lost, but the native speakers also

Chapter 8: Analysis: A Revised Evaluation Model.
136
delete a much larger number of pronouns and even some types of content words
whose absence does not impede understanding, such as train from the combination
train station, when the word station on its own is sufficient to understand which
location is in question.
The final two types of elision discussed above make up for a large part of elisions by
the native speakers and the reluctance to produce extreme reductions on the part of the
non-native speakers explains why there is such a considerable difference in the total
percentages for elision38 between native (3.44%) and non-native speakers (2.65%).
However, while these two types do not necessarily have an influence on the segmental
(dis-)continuity of the dialogue, they will certainly have an influence on the overall
length and also on the cohesive structure. The type that facilitates liaison, though,
enhances continuity and is often used by the native speakers as an alternative to those
linking elements that help to avoid hiatus.
In determining elision, however there is one inherent problem. Where final plosives
are concerned, it may sometimes be rather difficult to determine whether there is
actually a case of elision occurring, whether the plosive may simply be unreleased and
therefore difficult to detect, or whether it may simply have been replaced by a glottal
stop. This problem will be discussed in more detail in the following section on non-
linking transitions.
8.1.9. Non-linking Transitions.
One of the basic assumptions in analysing the non-native speaker realisations was
that the German speakers would in general use fewer cohesive features, such as assi-
milation and elision, etc., and that this would manifest itself in the fact that there
would be a far higher incidence of (prevocalic) glottal stops occurring between
38 including contractions

Chapter 8: Analysis: A Revised Evaluation Model.
137
words39, which would make them ‘non-native’. However, even though the total
number of glottal stops realised by the native speakers is higher, with a percentage of
8.54%, the difference to those realised by non-native speakers, at 7.86%, is relatively
small, so that this feature on its own should hardly have a huge impact on the per-
ceived difference between native and non-native speakers. A T-test performed on the
two data-sets also shows that the difference between the two samples is statistically
not significant (p=0.558).
Before we actually look in detail at why this may be the case, it is important to dis-
cuss how the distinction between transitions manifested as glottal stops and other phe-
nomena is handled in my data. As already pointed out above, it may for example
sometimes be very difficult to distinguish between the elision of final plosives and
glottal stops. Figure 8 below shows examples of first the elision of a final plosive,
followed by a final plosive being replaced by a glottal stop in the next word.
39 c.f. Cruttenden, ‘94, p. 266, quoted in 3.2.1

Chapter 8: Analysis: A Revised Evaluation Model.
138
Figure 8 – Plosive elision vs. glottal stop (E07).
The fact that the final plosive in but in the combination but look is elided can be
seen in the notable absence of any F1-transition within the spectrogram, which, for an
alveolar plosive, should be towards 1800 Hz. Instead, we can clearly see that the
steady state of the shwa moves straight into the initial lateral of the second word. The
absence of a burst in the waveform also confirms this. In contrast, the realisation of
the final consonant in the second word as a glottal stop is characterised by a strong
spacing out of the vertical striations of the final vowel, indicating a creakiness that
often accompanies final glottal stops, plus a kind of spike that looks like a release
burst, but has no correspondence in the waveform.
The same thing may to some extent apply to weakly articulated final plosives in ge-
minations resulting from assimilatory processes or unreleased plosives in general, so
absence of notable transition or burst for alveolar plosive
creakiness and spike without any transition, indicating glottal stop

Chapter 8: Analysis: A Revised Evaluation Model.
139
that it may occasionally be almost impossible to detect whether there is a final conso-
nant present or not.
Figure 9 – Unreleased final plosive (E07).
Figure 9 depicts a case where there is auditorily no final plosive to be recognised,
while the waveform clearly shows a release burst and the spectrogram indicates at
least a vague transition towards 1800 Hz indicating an alveolar place of articulation.
This can easily present a problem in an analysis like mine that has to rely to a large
extent on auditory analysis because of the size of the data to be analysed.
The features I will discuss in this section are classified into the following sub-cate-
gories, with their corresponding abbreviations used in the Realisations table given in
parentheses:
F1-formant transition towards 1800 Hz
plosive burst

Chapter 8: Analysis: A Revised Evaluation Model.
140
a) None or no special linking (nl):
if the final segment is consonantal, there is more or less complete closure,
with absence of any linking features, such as liaison, assimilation, etc., or if
the final segment is a vowel or diphthong, then there must be a gradual,
rather than abrupt, decay. This gradual decay, however, should not take the
form of a final release.
b) glottal stop replacing final plosives (gsfp):
this category incorporates only word-final glottal stops that are replacing
plosives and is the one commonly associated with urban accents, such as
Cockney.
c) intrusive glottal stop (gsi)
this category is named in analogy to intrusive rs. It encompasses mainly
glottal stops that mark a hiatus if the affected word ends in a vowel, but to
some extent also some that follow a final plosive. In both cases, they are
usually also followed by a glottal onset to the next word.
d) final release (fr):
the audible release of a plosive in phrase- or sentence-final position,
indicating a prosodic break or special emphasis.
e) final consonant lengthening (fcl):
similar to d), an indicator of a prosodic break or special emphasis, often
when there is hesitation on the part of the speaker.
From the above list, we can see that there are more features than just glottal stops
that we need to take into account if we assume that the number of breaks between
words will somehow have an effect on the perceived ‘fluency’ and ‘nativeness’ of the

Chapter 8: Analysis: A Revised Evaluation Model.
141
speakers40. For the most part, these features will be features belonging to ‘pure’ inter-
word categories a), b) and c), but to some extent categories d) and e) will also play a
role if they occur frequently at phrase, rather than at sentence ends. In order to be able
to determine in which context exactly certain features occurred, all of the 5 categories
were split into three subcategories each, one for the feature occurring without a fol-
lowing pause, one for occurrences preceding a short pause and one preceding a long
pause.
In my data, category e), total final consonant lengthening, shows a difference be-
tween non-native speakers at 0.71% and native ones at 1.16%, which proves to be sta-
tistically insignificant (above the 20% level). None of the three sub-categories on their
own exhibit any statistically significant difference, either. Some instances, though,
may convey the impression of an unusually high degree of emphasis, such as in the is
in the combinations how far it is (ID 2240-2270; realised by speaker G06), where the
final consonant lengthening on is seems to be used as an idiosyncratic marker of
finality preceding a short pause.
Incidence of final release, on the other hand, is somewhat higher at 6.12% for the
non-native speakers, while for the native speakers, it amounts only to 5.01%. Even
though the T-test shows no significant difference, comparing the occurrences for
native and non-native speakers, it becomes apparent that there seems to be a tendency
among the latter to often use this feature not only as a conscious indicator for a proso-
dic (final) boundary, but rather to express a certain degree of emphasis or contrast on
individual words. This tendency manifests itself primarily in the higher incidence of
final release on such word-classes as determiners, personal pronouns and locative ex-
pressions (such as here and there), i.e. deictica, although items from other word clas-
ses, such as the adversative conjunction but and the adverb least (in at least) or the
40 An additional way of indicating perceived ‘fluency’ would be to add fields containing ToBI break
indices (cf. Leech et al., 98: p. 43).

Chapter 8: Analysis: A Revised Evaluation Model.
142
modal auxiliary might may also be receive special emphasis in this way. Features like
this can be revealed by running queries on the database that combine information
about the grammatical categories of the words in the dialogue and the realisations of
transitions. Such a query for example showed that the singular determiner41 that was
overemphasised by some non-native speakers to the extent that it sounded contrastive
in the following examples:
a) on that board…
b) Oh, that won’t…
c) In that case, …
The number of tokens in each case is generally not very high, but if we assume that
the overall effect of non-nativeness is triggered by a combination of ‘little oddities’,
such cohesive features realised in a counter-intuitive way should certainly have an
effect on the native listener.
The next category to be discussed here is that of glottal stops that replace final
plosives. We have already seen earlier how difficult it may sometimes be to distin-
guish these from final elisions or unreleased plosives. However, as we have seen in
Figure 8 above, what is generally perceived as glottal stops is often an abrupt closure,
accompanied or indicated by a period of creakiness in the preceding vowel.
Ladefoged/Maddieson, ‘96 describe the characteristics of glottal stop articulations
thus:
“In the great majority of languages we have heard, glottal stops are apt to fall short of
a complete closure, especially in intervocalic positions. In place of a true stop, a very
41 for most descriptive purposes, I will use the grammatical terms defined in the CLAWS7 tagset,
which was used to tag my data.

Chapter 8: Analysis: A Revised Evaluation Model.
143
compressed form of creaky voice or some less extreme form of stiff phonation may
be superimposed on the vocalic stream.” (Ladefoged/Maddieson, ‘96: p.75)
This description is very similar to what Laver, ‘94 refers to under the topic of
laryngealisation (p. 330):
“This is a process where the primary supralaryngeal articulation is accompanied by a
secondary stricture at the glottal level. This consists of an articulatory tendency to
create a glottal constriction, which normally fails nevertheless to reach the maximum
stricture of a full glottal stop.” (ibid.)
If the first quote above holds true for English, it is thus quite likely that what is
commonly referred to as glottal stops in textbooks are actually often not real glottal
stops, but represent a phenomenon similar to elision, only with accompanying
creakiness on the preceding vowel. This would also contradict textbooks such as
Cruttenden, ‘94 that claim that:
“[…] there is no acoustic manifestation of the glottal plosive other than the abrupt
cessation or onset of adjacent sounds.” (Cruttenden, ‘94: p. 155)
As far as the native speakers are concerned, the majority of tokens of this transition
type occur when there is no break following the first word, accounting for 4.20% of
all transitions. Another 0.91% of transitions realised as glottal stops replacing final
plosives occur before long pauses, i.e. either before phrase, sentence or turn breaks,
but only a negligible amount preceding short pauses (3x; 0.15%). However, this may
well be due to the fact that overall, the native speakers produce a far lower amount of
transitions before short pauses (2.78%) than before long pauses (9.91%), possibly
indicating a tendency to either produce no pauses at all or only rather distinctive ones
and hence to indicate phrase-boundaries primarily by other means, e.g. by pitch or
simply by an absence of linking.
Chapter 8: Analysis: A Revised Evaluation Model.
144
Due to the low amount of these glottal stops before short pauses by the native spea-
kers and their complete absence amongst the non-native speakers, it is not surprising
that they do not represent a statistically significant marker between the two popula-
tions. However, both of the other two subcategories prove significant, glottal stops
replacing final plosives without a following break highly (p=0.0002; 4.20% NS vs.
only 0.28% NNS) and those preceding a long break still well below the 5% level
(p=0.023; 0.91% NS vs. 0.11% NNS). Consequently, they have to seen as significant
markers distinguishing native and non-native speaker speech, clearly identifying the
native speakers.
The second main category of glottal stops occurring in my data represents those
glottal stops that do not replace a final plosive and that I have therefore termed in-
trusive. They can technically occur not only at the end of a word, where they are
solely marked as transitions in the transition field, but also as glottal onsets to words
beginning in a vowel. In the latter case, they are represented by a symbol for a glottal
stop in the transcription. Just like the type discussed above, they need not represent
full glottal occlusions, but are more often marked by strong transitional creakiness on
the preceding or following vowels. In the case of final intrusive glottal stops, my
observations closely match descriptions of stød in Danish, such as the one by Fischer-
Jørgensen, quoted in Laver, ‘94:
“The Danish stød is a prosodic phenomenon connected with certain syllables. It
generally shows up as a decrease in intensity and (often) pitch, in distinct speech
ending in irregular vibrations (creaky voice), in very emphatic speech probably
sometimes in a glottal closure. A distinction is often made between ‘stød in the
vowel’ and ‘stød in the consonant’. But the stød is not, primarily, connected with
specific segments. The irregularities (or dip of the F0- or intensity curves) are
generally found about 10-15 cs after the start of the vowel: therefore, if the vowel is
long they will coincide with the end of the vowel, and if the vowel is short with the

Chapter 8: Analysis: A Revised Evaluation Model.
145
beginning of the following sonorant consonant. The stød therefore requires for its
manifestation a certain stretch of voicing” (Laver, ‘94: pp. 330-331)
Creakiness in the vowel and – to a minor extent – drops in intensity are also obser-
vable in my data and in most cases the creakiness in the vowel certainly does not ex-
tend over the whole of the segment. However, in general, I have not been able to ob-
serve any strong drops in F0. Figure 10 below illustrates both creakiness and drops/-
rises in magnitude for intrusive glottal stops both at on- and offsets.
Figure 10 – Intrusive glottal stops (G01).
The clear drops and rises in magnitude visible in the waveform and the extreme ver-
tical striations notable in the spectrogram in Figure 10 represent an extreme example
of this phenomenon produced by a non-native speaker, but often the situation is not as
rises in intensity
drop in intensity
creak

Chapter 8: Analysis: A Revised Evaluation Model.
146
clear-cut. Figure 11 below shows a rather less distinct example, this time produced by
a native speaker.
Figure 11 – A less obvious example of intrusive ‘glottal stops’ (E05).
The only thing identifying this example as one pertaining to the same category as the
earlier one is the fact that the vertical striations here are very wide, relative to the ones
in the remaining part of the spectrogram42, and thus indicate creaky voice accompany-
ing a clearly audible hiatus. The magnitude curve, on the other hand, shows no steep
drops or rises at all.
At the lowest level, what I have termed an intrusive glottal stop therefore simply
represents a form of hiatus, i.e. an absence of any other form of linking between two
42 not visible in this illustration.

Chapter 8: Analysis: A Revised Evaluation Model.
147
words where the first one often ends in a vowel and the second one begins with a
vowel, characterised by at least strong creakiness in the voice and, in its strongest
form, also the presence of one or two glottal stops and strong drops or rises in inten-
sity. In most cases, the final versions of intrusive glottal stops occur indeed on vowels,
but in some rare cases, they may also take on the form of a glottal stop after43 a final
plosive44, which is, again, slightly reminiscent of stød in Danish, apart from the fact
that the consonants involved in stød in Danish are only nasals or laterals.
Whereas final intrusive glottal stops mainly occur in positions where there is a hi-
atus, initial glottal onsets appear both in sentence-initial position or in conjunction
with a hiatus. In my transcriptions, they appear not only marked with the symbol for a
glottal stop, but may also additionally be marked by the symbol that is conventionally
used for marking voicelessness (c.f. the transcription of the word area in Figure 11).
The reason for this is that I realised I needed to make a distinction between strong
glottal onsets and weak ones in order to be able to distinguish better between native
and non-native speaker realisations of this phenomenon. Additionally, a weak glottal
onset may also sometimes be accompanied by breathiness, rather than creak, in which
case the following vowel would also be marked with a breathiness symbol, rather than
the underscore tilde that I have otherwise used almost by default45 to mark a vowel
following a hard glottal onset. We therefore end up with a three-way distinction for
glottal onsets,
a) strong glottal onsets, followed by creak in the vowel,
b) weak glottal onsets, also followed by creak in the vowel, and
43 at least auditorily they seem to me to be occurring after the final plosive, rather than representing
cases of glottal reinforcement/ pre-glottalisation, but this may be very difficult to establish exactly without the aid of a laryngograph.
44 in which case they are also marked by a glottal stop symbol in the transcription.
45 there are some rare cases where I have marked a strong onset, followed by whispery voice.

Chapter 8: Analysis: A Revised Evaluation Model.
148
c) breathy weak glottal onsets, followed by breathy vowels.
Intrusive final glottal stops are not uncommon amongst the native speakers. Overall,
they account for 3.29% of all transitions, 2.78% without a following pause, 0.46%
followed by a long pause and 0.05% by a short one.
Whereas Kenworthy mistakenly attributes glottal onsets produced by German spea-
kers to the supposed absence of “linkage”, for which there is no evidence in my data
(cf. 8.1.4 above), they do occur with high frequency in conjunction with hiatus or as
glottal onsets at phrase or sentence beginnings. Overall, the non-native speakers pro-
duce 387 glottal onsets, while the native speakers only realise 152, a ratio of 2.5:1. A
comparison of all the different realisations is given in Table 18.
NNS NS Count 387 152 total46 296 52 strong 288 48 + creak
0 2 + whisper 91 98 weak 77 73 weak + creak 10 18 weak + whisper
Table 18 – Glottal onsets.
Table 18 also shows that weak glottal onsets account for 64% of all native speaker
glottal onsets, whereas they make up for only 23% of the ones realised by non-native
speakers. The situation is reversed for the strong onsets, making up for only 34% of
native speaker realisations and instead 76% by the non-native speakers.
The distinction between strong and weak glottal onsets is not an easy one to make
because very often there are no clear-cut indicators, at least in those cases, where there
is no whispery voice on the following vowel. Often, strong onsets do tend to have a
steeper rise in the magnitude curve, but in other cases they do not and then it seems to
be their magnitude relative to the rest of the utterance which gives the auditory clue.
46 includes some non-prevocalic ones, which is why the numbers do not seem to quite add up.

Chapter 8: Analysis: A Revised Evaluation Model.
149
Returning to the other type of intrusive glottal stops, i.e. those occurring at the end
of a word, we can see that just like glottal stops replacing final plosives were a marker
for ‘nativeness’, this type of glottal stop is a clear marker of ‘non-nativeness’. It con-
stitutes overall 7.47% of all non-native speaker realisations, while it only accounts for
3.29% of native speaker ones, which is statistically significant well below the 1%
level (p=0.0006). Looking at the three sub-groups, we find that the assumption that the
non-native speakers use most intrusive glottal stops in conjunction with hiatus suppor-
ted by the fact that most of them (6.23%) do occur without any pause following or
(0.67%) before short pauses only, and only a relatively small amount (0.57%) fol-
lowed by a long pause. In other words, when the non-native speakers create a hiatus,
they may or may not introduce a short pause between the two words concerned,
whereas at sentence boundaries, they tend not to have many glottal stops at all. Com-
pared to this, the native speakers produce 2.78% without any following pause, 0.46%
followed by a short pause and a mere 0.05% preceding a long pause, altogether still
far less than even the ones without following pause produced by the non-native spea-
kers. Both the sub-groups that proved most relevant as markers for ‘non-nativeness’
also prove to be statistically significant (p=0.001 for gsi & p=0.018 for gsisp).
Finally, transition category a), none or no special linking, shows that even though
English is a language that uses linking transitions to a large extent, the largest part of
transitions is still realised without linking, even for the native speakers (42.47%).
Even excluding the categories that are most likely to represent those points in the
dialogue where there are prosodic breaks or punctuation marks, categories nlsp
(1.62%) and nllp (4.25%), we still end up with 36.60% of all transitions. These of
course are partly made up of cases where there is a deliberate prosodic break on the
part of the speaker, i.e. a suppressed choice of using any of the linking categories and
partly of cases where there is an abutment of consonants that cannot be avoided or
modified by assimilation or elision.

Chapter 8: Analysis: A Revised Evaluation Model.
150
Regarding the non-native speakers, we still find significant differences for the cate-
gories nl (p=0.000003; 45.73%) and nllp (p=0.023; 5.91%), while the category prece-
ding a short pause is only insignificantly higher with 2.62% of all transitions. The
overall percentage of the combined category of non-linking amounts to 54.27% ,
which makes it statistically significant far below the 1% level (p=0.000004) and
therefore represents a useful marker between the populations.
8.1.10. L-vocalisation & -clipping.
L-vocalisation itself cannot necessarily be considered a transitional feature, which is
why I have not included it in my list of transitions in the database. However, the effect
of vocalising a final /l/ is that liaison with the next word is no longer an option, so that
this will directly affect the type of transition possible. In most cases, if there is a lin-
king transition possible, this will be a linking /W/, due to the fact that the /l/ vocalises
to a back vowel.
L-vocalisation is a stigmatised phenomenon in British English (cf. Wells, ‘82, p.
314), which is rare in RP, but does frequently occur in other accents:
“Vocalization of dark /l/ […] is occasionally met with in RP, particularly in the
environment of a preceding labial, as careful [ÈkE«fU], table [ÈteIbU]. On the whole,
though, L Vocalization must be considered only Near-RP or non-RP […].” (Wells,
‘82, p. 295).
Nevertheless, Wells also already accepts that l-vocalisation in British English in
general is clearly on the increase:
“From its putative origins in the local accent of London and the surrounding counties,
L Vocalization is now beginning to seep into RP. It seems likely that it will become
entirely standard over the course of the next century.” (ibid, p. 259)

Chapter 8: Analysis: A Revised Evaluation Model.
151
From a historical point of view, Wells’ statement about the “origins in the Local ac-
cent of London” seems to be slightly dubious, though, because traces of l-vocalisation
can even be found at least as far back as the 19th century in the writings of Tim Bobbin
(aka John Collier), a Lancashire author from Rochdale, such as in the example
“Theaw’rt aw on a Swat, I think; for theaw looks primely.” (Bobbin, 1894: p.41),
where we find vocalisation on the word all as represented as aw.
According to my data, for native speakers the back vowel that /l/ vocalises to tends
to predominantly have unrounded qualities, so that the two common realisations are
either [F] or [µ ]. This is slightly different from Wells’ account of l-vocalisation in
London English, an accent that is often seen as the prototypical example for urban l-
vocalisation and which is in many respects close to Estuary English.
“It seems most commonly to be rounded, although some investigators report
unrounded [F] after front vowels, as [fIF] fill. L Vocalization is a sound change still
very much in progress; speakers are by no means consistent.” (ibid, p. 313)
However, according to my data, this inconsistency does not only affect vocalisation,
but it is actually necessary to distinguish two different phenomena regarding the po-
tential modification of final /l/, vocalisation and an ill-definable transition (c.f. Figure
12 & Figure 13 below) where there is no distinct /l/ present between a final vowel and
the beginning of the next word. In case of vocalisation, we either end up with a diph-
thong, which has a central to back vowel as its second element, or with a single, rela-
tively open vowel due to the jaw being held more open in anticipation of an l-like qua-
lity, e.g. [tHeF] (vocalisation → diphthong) vs. [tsa*] for tell (ID 70 in tell me; Figure
12) or [aù*] for I’ll (ID 810-820; Figure 13). In the latter case, it almost appears as if
the /l/ has been elided, but without any indication of this or any transitions indicating a
lateral in the spectrogram, as can be seen in the two figures below. I will refer to this
latter phenomenon as l-clipping because auditorily, it seems to cut short the word con-
taining the final /l/. If /l/ follows a front vowel and that vowel becomes backer with

Chapter 8: Analysis: A Revised Evaluation Model.
152
the /l/ being lost, then we can assume that /l/ has been subsumed into this vowel, e.g.
[wµ *] (ID 1360) for will or [jF¼*] for you’ll (ID 1190-1200).
Figure 12 – l-clipping between tell and me.

Chapter 8: Analysis: A Revised Evaluation Model.
153
Figure 13 – l-clipping between I and be representing 'll.
Potential candidates for l-vocalisation in the corpus can be retrieved by extracting all
words that end either in –l or –le. They are listed in Table 19, together with frequen-
cies for l-vocalisation and -clipping.
ID Word NS voc. NS cl. NNS voc. NNS cl. 70 tell 1 4 1 2 820 1200 1890 2540
‘ll
0 1 5 3
6 0 0 0
0 2 1 2
3 1 0 0
1360 2360 will 3
2 0 0 0
2 0
1020 until 0 2 0 0 1160 hall 0 0 1 0 2060 hill 7 0 5 0 2410 Well 0 0 1 0 520 1910 able 7
4 0
047 4 9 0
1480 Crucible 6 0 7 0 3130 unreliable 0 0 5 0
47 2x complete elision without any vocalic element whatsoever.

Chapter 8: Analysis: A Revised Evaluation Model.
154
ID Word NS voc. NS cl. NNS voc. NNS cl. 3190 simple 0 0 2 0
Table 19 – Potential candidates for l-vocalisation in the corpus.
Table 19 shows that for the native speakers, l-vocalisation accounts for 34.8% (39x)
of all realisations of final /l/. This figure clearly indicates that the trend towards in-
creasing l-vocalisation predicted by John Wells in 1982, if we can actually talk about
such a trend in the light of my earlier comment, has fully established itself. However,
the fact that clipping makes up for a further 10.7% (12x) may indicate that there could
even be a general tendency towards l-loss in final position, similar to the loss of rhotic
r. Again, this is phenomenon already pointed out in Wells, ‘82, but only with respect
to vocalisation:
“Just as it was R Dropping which assured phonemic status for the diphthongs
/I«, E«, �«, U«/, so L Vocalization offers the prospect of eventual phonemic status for
new diphthongs such as /IU/ (milk), /EU/ (shelf), etc. […] It will also, incidentally,
simplify the foreign learner’s task: most will find [ÈmIdo] a good deal easier than the
laterally released [d] plus dark [lò] of [ÈmIdlò].” (Wells, ‘82, p. 259).
The similarity with the loss of final r becomes even more apparent when considering
those cases in my data where final /l/ is not vocalised or clipped at all, such as for the
combinations unreliable anyway and simple enough. In these cases the /l/ becomes
involved in liaison (see 8.1.4 above) and thus acts as a linking element, just like a
linking r.
As far as the non-native speakers are concerned, we encounter relatively far fewer
vocalisations (40x; 25%) and clippings (8x; 5%). The vowel qualities exhibited are in
many cases similar to those of the native speakers, but also include more qualities that
are less rounded and more front, such as in [?e¼Ib¬] (able) and [wö*] (will), whereas
the native speakers are relatively consistent in their use of [µ ] and [F].

Chapter 8: Analysis: A Revised Evaluation Model.
155
8.1.11. Rhoticity
A very interesting feature that only occurs with the non-native speakers is word-final
rhoticity. Out 28 potential tokens for this type of realisation, there are only 8 in which
one or more non-native speakers pronounce a final r. All the occurrences, along with
their frequencies, are listed in Table 20 below.
Word_ID Word Count 350 there 2 460 there 2 560 more 4 720 or 1 910 car 4 1490 Theatre 2 2610 quarter 1 3090 number 1
Table 20 – Rhotic realisations by the non-native speakers.
Upon first inspection, I initially assumed that the non-native speakers were using
rhoticity as a marker of finality, but only three tokens occur in sentence-final posi-
tions, followed by a relatively long pause. As most of the occurrences are restricted to
only three speakers, though (G01: 7x; G07: 3x; G10: 3x), it is relatively fair to assume
that rhoticity in this case is either due to inconsistent teaching, with some teachers of
my informants possibly favouring an American accent over a British one and vice
versa or to more exposure to American accents outside the classroom, as for speaker
G07, who has spent a year living in the US. In general, it is not unlikely for speakers
from Franconia to be exposed to American accents, due to the continuing presence of
American forces there. As far as the effect of this feature is concerned, apart from
giving me an impression of overall inconsistency, in conjunction with increased
occurrence of hiatus, it also creates the impression of increased hesitation and un-
necessary emphasis, which untrained observers may well interpret as a lack of
‘fluency’. However, in this case, they would probably also have to categorise many
American speakers as less ‘fluent’ than British ones.

Chapter 8: Analysis: A Revised Evaluation Model.
156
8.1.12. ‘Syllabic’ Consonants.
When foreign learners are being taught English, one of the features that they are of-
ten particularly drilled on is the use of syllabic consonants in words such as button and
bottle. Realisations that do not have a syllabic consonant are sometimes seen as pertai-
ning to ‘non-standard’ accents that are to be avoided:
“In the case of words such as ‘bottle’, ‘muddle’, ‘struggle’, which are quite common,
it would be a mispronunciation to insert a vowel between the l and the preceding
consonant. There are a few accents of English which may do this, so that, for ex-
ample, ‘cattle’ is pronounced kQt«l, but it is not the case in RP.” (Roach, ‘91: p. 79)
However, in recent years, and particularly with the development of Estuary English,
realisations with reduced vowels + non-syllabic consonants seem to have become
more common and just not to have found their way into the textbooks yet.
Realisations of this type should not be surprising if we look at descriptions of how
syllabic consonants may be analysed in terms of their underlying representation:
“[…] An example is the syllabic [n] which most accents have in words like hidden [-
dn]. There are compelling reasons for regarding this [n] as the realization of un-
derlying /«n/. These include the morphological fact that the –en suffix is pronounced
[«n] in other environments (swollen); possible free variation between [n] and [«n] in
some other environments (station); the possibility in some accents of getting [n] as
the realization of a /«/ and a /n/ which belong to different words in the sentence
([hQdnaIs ÈdeI] had a nice day); the extreme difficulty experienced by many native
speakers of English, including some of those undergoing training in phonetics, in
perceiving the difference between [n] and [«n].” (Wells, ‘82: p. 55).
Wells here even points out that there may be what he refers to as “free variation”,
which is yet another indicator of the fact that it is not easy to determine for native
speakers, either, whether to produce a reduced vowel or not and that there may be an

Chapter 8: Analysis: A Revised Evaluation Model.
157
element of choice. Despite the somewhat normative comment quoted earlier on,
Roach also gives many examples of potential syllabic consonants other than /l/, where
there is considerable choice for variation, and at the end of his discussion points out
that:
“I feel that the subject of syllabic consonants is an area that we need to know more
about, and that there has not yet been enough discussion of the problems found in
their analysis” (Roach, ‘91: 83).
This latter is one of the points that this part of my analysis is trying to address by
looking at all the realisations for word-final syllabic consonants occurring in my cor-
pus and discussing potential explanations for them. Table 21 below lists all occurren-
ces of syllabic consonants for both native and non-native speakers, comparing them to
occurrences where a reduced vowel + non-syllabic consonant occurs.
ID Word NS syll.
NS red.
NNS syll.
NNS red.
140; 1950 station 3
2 4 5
6 5
4 5
1230 fountain 0 6 4 6 250 can 5 2 1 2 2630 an 0 7 1 9 280; 1860 from 3
2 3 4 0 7
4 2030 bottom 4 3 1 9 2860 problem 1 6 0 10 3030 taking 3 4 2 7 520 1910 able 0
1 0 1
3 0
2 0
1480 Crucible 1 0 0 3 3130 unreliable 6 1 3 2 3190 simple 7 0 7 0
Table 21 – Potential candidates for word-final syllabic consonants.
Column 4 in Table 21 indicates that there is a relatively clear, albeit sometimes only
slight, preference by the native speakers to use a reduced vowel + non-syllabic conso-
nant, rather than to produce a syllabic consonant. The only main exceptions to this are

Chapter 8: Analysis: A Revised Evaluation Model.
158
the words ending in le, which show a preference for neither of the two options, but in-
stead have more instances of l-vocalisation (c.f. 8.1.10 above) if they appear before a
word that begins in a consonant. As we have already seen above, if the following word
begins in a vowel, though, as in the case of unreliable and simple, the /l/ is mostly rea-
lised, but loses its syllabicity because it is ‘resyllabified’ through liaison (c.f. 8.1.4
above), becoming the onset of the next syllable/word. Overall, it therefore seems that
there is a general tendency amongst the native speakers away from realising syllabic
consonants and replacing them with phonologically ‘more complete’ syllables or
vocalisations that completely exclude the consonants, unless there is also the option to
‘resyllabify’ through liaison.
The non-native speakers also show a marked preference for forms without a syllabic
consonant (70x; 46.7%), as opposed to those with syllabic consonants (33x; 22%).
However, the fact that the percentage for the former type of realisations is higher is
partly due to the non-native speakers’ reluctance to produce mono-syllabic words such
as can, an and from to the same extent as the native speakers, so that often they hardly
seem to see a choice for producing syllabic consonants in this environment. The same
seems to hold true for some di-syllabic words like bottom, problem and taking. Words
like station and fountain, on the other hand seem to be slightly ‘favoured’ with respect
to pronouncing syllabic consonants, which, particularly for the latter, appears slightly
unusual in comparison to native speaker pronunciation, where, according to Roach,
‘91, “clusters formed by nasal + plosive + syllabic nasal are very unusual” (p. 80).
Overall, though, the non-native speakers seem to be making relatively similar choi-
ces to the native speakers, apart from the absence of syllabic consonants in certain
types of reduced syllables, and in particular for words ending in /l/, at least where they
avoid a hiatus.

Chapter 8: Analysis: A Revised Evaluation Model.
159
8.1.13. Weak Forms.
One of the most common features of non-native speaker speech is that they often fail
to produce weak forms in their appropriate contexts. This may thus give the impres-
sion that they are stressing too many words, which tends to sound odd to native spea-
ker ears:
“[…], most native speakers of English find an ‘all-strong-form’ pronunciation unnatu-
ral and foreign-sounding, something that most learners would wish to avoid.”
(Roach, ‘91: p. 102).
This is often not the fault of the learners, who are frequently taught a kind of lan-
guage that is supposedly more formal and pertaining to a higher register and therefore
emphasises a kind of clear enunciation that is not appropriate to most situations. How-
ever, as Brown points out, even in slightly less than formal situations, a great number
of reductions are performed by native speakers:
“In a stressed syllable the initial consonant(s) and the vowel will be comparatively
clearly enunciated whereas in an unstressed syllable the consonants may be very
weakly enunciated and the vowel very obscure. It is important to realize that this is a
feature of slow colloquial speech just as much as it is of informal speech.” (Brown,
‘90, p. 46).
As my non-native speaker informants are already very proficient speakers, it should
therefore be even more interesting to see whether they a) do use weak forms in the ap-
propriate contexts and b) when they do, whether the weak forms they use correspond
to those used by the native speakers.
In the teaching literature it is often assumed – maybe for the sake of convenience –
that reduced vowels, which form a central part of most weak forms, are reduced to a
shwa or [I]-type vowel. However, according to Brown:

Chapter 8: Analysis: A Revised Evaluation Model.
160
“The ‘same’ vowels in unstressed syllables will be more obscure in quality, ‘round’
vowels will not have lip rounding and diphthongs will not be diphthongized. […] It
should be clear from this description that that it is not sufficient simply to describe
unstressed syllables in terms of the shwa vowel /«/ and the ‘reduced’ vowel [I] as it is
sometimes done. Not all unstressed vowels are reduced to these vowels […]”
(Brown, ‘90, p. 47)
This statement enforces the point that it is not quite as easy as one might initially as-
sume to even identify weak forms as opposed to their corresponding strong forms be-
cause there may well be a gradation from strong to weak with a potentially somewhat
arbitrary cut-off point between them. Furthermore, it is often assumed that weak forms
are categorised as forms that contain weak vowels, but, as I will try to show, this is too
limited a view. Wherever necessary I will therefore include details about my choice of
categorisation in my discussions of the weak forms occurring in my data.
Table 22 lists some of the potential weak forms, adapted from the list of weak form
options listed in Roach, ‘91 (p. 108-109).
word NS weak forms
Perc. NNS weak forms
Perc.
and (3x) 16 76% 26 76% but (2x) 13 93% 14 70% your (3x) 16 76% 2248 79% we 5 71% 8 80% at (3x) 21 100% 27 90% for (2x) 14 100% 18 70% from (2x) 13 93% 12 60% of (4x) 27 96% 21 53% to (7x) 48 98% 68 97% there (2x) 6 43% 4 20% can 7 100% 2 20% could 7 100% 9 90% have (5x) 21 60% 5 10% do (2x) 14 100% 18 90% Total: 228 214
48 2x replaced by what seems to be an indefinite article, rather than possessive. This also affects the
overall percentages.

Chapter 8: Analysis: A Revised Evaluation Model.
161
Percent: 86% 59% Table 22 – Some potential weak forms
As we can see, the non-native speakers use fewer weak forms than the native spea-
kers. They realise only 71% of all possible weak forms as opposed to 86%, but in
order to really understand why and where there is a difference, we need to look at the
individual occurrences or clusters of word categories.
Although the percentages of weak forms for the conjunction and for both speaker
populations are the same, there is a clear difference in the ‘degree of weakening’ as the
non-native speakers are more reluctant to elide final /d/ (9x), a feature that is univer-
sally present for the native speakers. The reluctance on the part of the non-native
speakers is particularly strong before head, where six speakers out of ten do not elide
the final plosive, and out of those four also show instances of final fortition.
A similar thing applies to but, where the native speakers show a strong tendency
(12x out of 14) towards a glottal stop or elision, whereas non-native speakers always
have a final consonant. The fact that the percentage of non-native speaker weak forms
is also lower (at only 70%) seems to indicate a slight reluctance to reduce this word
due to its adversative character. In other words, the non-native speakers may be stres-
sing it more because they want to establish a stronger contrast with what has been said
before.
As far as the possessive pronoun your is concerned, the non-native speakers actually
show a slightly higher percentage of weak forms than the native speakers. It may be
intuitively tempting at first to attribute this to the fact that six non-native speakers fail
to see that the word in this context (ID 3380) is quite likely to receive contrastive
stress, but the fact that also four native speakers do the same thing seems to invalidate
this simple explanation. An alternative interpretation of the native speakers’ reluctance
to produce a weak form is that their pronunciation is actually relatively close to RP,
where the weak form /j«/ is “unusual” (Wells, ‘90: p. 798), although Roach, ‘91 (p.

Chapter 8: Analysis: A Revised Evaluation Model.
162
104) lists it as a possibility. The non-native speaker realisations also exhibit a higher
degree of variation, with a preference for [‚ ] (c.f. 6.2 above) (9x), which is used only
once by one native speaker.
With regard to the prepositions at, for, from, of and to49, we can see that the native
speakers universally or almost universally produce weak forms, while the non-native
speakers again seem to be reluctant to do so, with the exception of to. There may thus
be a general tendency on the part of the non-native speakers to ‘over-stress’ preposi-
tions, thereby making them almost seem contrastive (c.f. 3.1.2 above). As far as the
native speakers are concerned, we again continue to find additional reduced forms,
different from those reductions that just affect the vowel. For at, this expresses itself
in the tendency to replace the final plosive by a glottal stop (x13) or once even com-
plete deletion of the word. In for, 8 out of the total 14 occurrences show evidence of
what I have earlier termed extreme vowel reduction, i.e. a reduction to the point of dis-
appearance of the vowel (see 8.1.8 above), and in from we find 7 occurrences of /r/-
less forms and a further 5 of vowel + /r/-less form, i.e. with only initial fricative + syl-
labic /m/ (c.f. 8.1.12 above). Loss of /r/ in from only occurs for one non-native spea-
ker once and in general this population shows some reluctance (40%) to produce weak
forms at all, something that is even more applicable to the word for, unless the occur-
rence of a C13-like quality [�] (15x) can be counted as such. The native speakers also
have additional options for of, where they seem to have a choice either eliding the
initial vowel (6x) or the final consonant (2x), whereas the non-native speakers have
almost to 50% strong forms and elide neither vowel nor consonant.
To represents the most complex case of all the prepositions, as can be seen in the
summary in Table 23:
reduction-type ns count nns count evr 23 2 [«]-like 8 9
49 n.b. none of these prepositions appear in final positions where they could not be reduced.

Chapter 8: Analysis: A Revised Evaluation Model.
163
[‚ ]-like 0 1 [U]-like 8 21 [¬]-like 1 20 [I]-like 6 12 [ö]-like 2 3 total: 48 68
Table 23 – Types of reduced vowel in the preposition to.
As to occurs 7 times in the data and there are no deletions of the word, we can see
that nearly all speakers reduce it. The native speakers again show a clear preference
for extreme vowel reduction, whereas the non-native speakers tend to opt for qualities
closer to the strong form, but with some tendency for unrounding or fronting the
vowel, i.e. tending more towards ‘peripheral’ rather than central qualities.
In there, the main distinction between strong and weak form is between whether the
realisation consists of a diphthong or long monophthong versus a relatively short
monophthong. For the non-native speakers, we find nearly half (10/21) of the forms
produced as a diphthong and another three as long monophthongs. However, it can
clearly be seen that the tendency towards longer elements is restricted to certain ‘final’
environments, i.e. the occurrence being either at a potential prosodic break point such
as in From there (, you’ll be able) (ID 1860-1870) or the end of a sentence as in (on
that board) over there (ID 450-460) where we might possibly expect final lengthe-
ning, anyway. On the other hand, the reduced form tends to predominantly occur in
(phrase-)initial or non-final position, such as in there’s a map… (ID 350). For the non-
native speakers, however, there seems to be a high degree of reluctance to reduce the
non-final occurrences, apart from the fact that they sometimes even produce rhotic
forms, which even heighten the effect of discontinuity/emphasis that is normally crea-
ted through the use of longer or diphthongal qualities.
The next group of words comprises the auxiliaries can, could, have and do. For can,
the native speakers again show a clear tendency towards extreme vowel reduction (6x)
while the non-native speakers tend to use a fuller vowel quality often closer to C2 [e]

Chapter 8: Analysis: A Revised Evaluation Model.
164
than a shwa. In could, both native (4x) and non-native speakers (8x) show a prefe-
rence for an unrounded quality close to C18 [¬]. The native speakers seem to have the
additional option of using a fronter vowel of the [I] (2x) or C17 [ö]-type (1x), but show
no central, shwa-type realisation, whereas at least one of the non-native speakers has a
shwa-like realisation.
For have, the native speakers show a distinct preference (15x/35) for a more ‘nor-
thern’ type pronunciation, closer to C4, which I have transcribed as [a]. As this realisa-
tion is characteristically rather short, it is often difficult to determine whether it repre-
sents a strong or a weak form, even though in the North of England it can certainly act
as one. It may thus be the case that the more ‘northern’ the type of pronunciation gets,
the more the distinction between strong and weak forms for this word disappears. As
far as the non-native speakers are concerned, though, the majority (42x/55) of realisa-
tions consists of strong, more RP-like [Q] forms, with only a limited number of re-
duced forms.
The auxiliary do occurs twice in the dialogue50 and we thus have 14 tokens for the
native and 20 for the non-native speakers. Each time, it is followed by the pronoun
you, which makes the combination a likely candidate for contraction. This is definitely
the case for the native speakers, where we again encounter a strong preference for
extreme reduction of the vowel (9x) resulting in the contraction, whereas the non-
native speakers avoid it almost completely. In all twenty possible realisations we only
find one ‘pseudo case’ where speaker G02 begins to produce a contraction, but then
nevertheless follows it by the complete pronoun, thus yielding [dZ¬j«]. In producing
the full form of the auxiliary, there is also a clear tendency towards anticipatory fron-
ting and unrounding noticeable for most non-native speakers in the majority of realisa-
tions (13x), thereby producing a C18-like quality.
50 excluding where it forms the first part of don’t.

Chapter 8: Analysis: A Revised Evaluation Model.
165
Throughout the preceding discussion on weak forms, it has become apparent that,
although the non-native speakers may overall produce a lower number of weak forms,
in most cases the main difference between native and non-native speaker realisations
does not lie in the number of weak forms used, but in the degree of weakening. In
other words, the native speakers tend to reduce their weak forms not just so that they
produce weak vowels in function words, but often reduce their vowels to such an
extent that they disappear completely, which results in additional weak forms that
often do not contain any vowels at all.
8.1.14. Central vs. Peripheral Qualities.
In the context of the weak forms described above, a certain tendency on the part of
both native and non-native speakers towards the use of more peripheral vowel quali-
ties, i.e. productions located away from the centre of the vowel space and towards its
edges, has been apparent. However, my data also contains some peripheral qualities
that are mainly observable for the non-native speakers and therefore represent poten-
tial identifying markers that distinguish the two populations from one another. These
peripheral qualities are observable in positions where one would generally expect to
find a shwa-like realisation, either as a single vowel or as the second part of a centring
diphthong, such as in Theatre or here. The additional types of realisations we see for
the non-native speakers are final [Œ] and [‚ ], both qualities that are clearly less central
than a shwa, with the latter being somewhere between cardinals 10 and 11. They also
both occur with or without creak and seem to represent extreme points of a continuum
of possible vowel qualities in word-final position ranging from close and front via
central to open and back.
Final [Œ] is a realisation that is not uncommon for urban British accents, such as
Cockney (c.f. Wells, ‘82, p. 305) or Brummy, but only occurs 10 times with my native
speakers, six times in Theatre and twice in cinema, once as a realisation of are (fol-

Chapter 8: Analysis: A Revised Evaluation Model.
166
lowed by a glottal stop) and once as part of a filled pause. For the non-native speakers,
however, it occurs 31 times and with the following words:
Word Count *car 1 *continue 1 *tell (l-voc) 1 *unreliable (l-voc) 1 area 3 cinema 6 here 1 or 2 Theatre 3 there 4 whether 2 zebra 6
Table 24 – NNS occurrences of final [Œ].
The starred forms at the top of Table 24 represent unusual and probably more idio-
syncratic and context-governed realisations, rather than systematic variations. Thus
there may be an ‘r-reflex’ left in the realisation of car as [kHaŒ], i.e. the speaker (G03)
may be aiming for a long monophthong, but is nevertheless possibly still influenced
by the spelling. In continue, the influence clearly comes from the following word up,
where the speaker (G07) anticipates an initial [Ã]. For tell and unreliable, we see odd
forms of l-vocalisation. As far as most of the other words are concerned, those might
well be forms that could be realised with a final [Œ] in the urban accents mentioned be-
fore, which demonstrates the point made earlier in 1.4.3 above that often non-native
speaker speech shows similar characteristics to native accents deemed as having low
acceptability by some native speakers.
For final [‚ ], we find even more occurrences, 44 altogether. The fact that we find
some of the same words we just encountered in Table 24 with final [Œ] shows that in
many cases the non-native speakers see the two realisations as straightforward alterna-
tives for unstressed vowels in final syllables.

Chapter 8: Analysis: A Revised Evaluation Model.
167
Word Count a 4 area 1 continue 2 for 1 go 2 here 2 hour 2 near 1 number 2 over 1 the 5 Theatre 4 ticket 1 to 1 you 4 your 9
Table 25 – NNS realisations ending in [ ‚ ].
As I know of no British accent that has any comparable realisation in final position,
I would assume that the use of final [‚ ] certainly represents a better marker of non-na-
tiveness than the final [Œ], which is at least attested for some British accents.
8.1.15. Triphthongs, Diphthongs & Monophthongs.
Whereas so far we have mainly discussed the realisation of vowels in unstressed
positions, we can now direct our attention towards the realisations of full vowels and
trace the differences between the two speaker populations. As previously pointed out,
foreign learners are often taught a far more careful and often also somewhat old-
fashioned style of pronunciation. For example, most textbooks for British English still
teach learners to use the /U«/-diphthong for words like poor and sure, while there has
already been a longstanding and increasing tendency in many British accents to use a
monophthong, often assumed to be /�ù/, instead:

Chapter 8: Analysis: A Revised Evaluation Model.
168
“The diphthong U« is included, but this is not used as much as the others – many Eng-
lish speakers use �ù in words like ‘moor’, ‘mourn’, ‘tour’. However, I feel that it is
preferable for foreign learners to learn this diphthong to ensure the maximum
distinctiveness of words in pairs like ‘moor’ and ‘more’, ‘poor’ and ‘paw’.” (Roach,
‘91, p. 24)
Even though Roach’s point may be right from a pedagogic point of view, it is never-
theless doubtful whether native speakers would actually attempt to achieve “maximum
distinctiveness” in this way in those cases where it is actually needed, even if they
needed to disambiguate one of the two words in a pair. In this section, we will there-
fore attempt to paint a realistic picture of native speaker behaviour and see how this
relates to what the non-native speakers have learned.
Regarding the use and potential modification of triphthongs through smoothing (c.f.
Wells, ‘82, p. 328ff.), there is very little data in my corpus of recordings. In fact, a
triphthong would only be possible in two words in the whole dialogue, unreliable (ID
3130) and hour (ID 2640). However, unreliable shows a relatively clear distinction
between the native and non-native speakers in that the former seem to have a three-
way system that allows them options from the original triphthongal /aI«/ (1x) to mo-
nophthongal realisations (2x), with the main preference being in the middle, i.e. for
diphthongs (4x), while the latter group of speakers seems to have only a two-way sys-
tem that excludes ‘smoothing down’ to the level of monophthongs, and where the
choices are completely balanced between triphthongs and diphthongs. In other words,
the non-native speakers do realise that there is an option of smoothing, but not that
there are actually two possible degrees of it.
In hour, where the middle element of the original triphthong /aU«/ is a back, rather
than a front vowel, we again see a distinct preference of the native speakers for diph-
thongs (6x), but this time there is not a single triphthong to be found among all the
realisations, and only one single monophthong. It therefore seems as if the native

Chapter 8: Analysis: A Revised Evaluation Model.
169
speakers may be showing a greater readiness to smooth this type of triphthong, but not
to the same degree as the earlier one with the front vowel as a middle element. In con-
trast to this, the non-native speakers seem to be reluctant to apply any smoothing as
only one single speaker even produces a diphthong.
In other words that contain an /aU/-diphthong, we can see that both native and non-
native speakers show some degree of smoothing, but again with a distinct preference
for diphthongal realisations:
Word_ID Word NS mono
NS diph
NNS mono
NNS diph
1230 fountain 2 5 5 5 1530 out 2 5 2 8 2480 about 3 4 3 7 3180 sounds 4 3 4 6
Table 26 – Smoothing of the [aU]-diphthong.
While there is little remarkable about the extent of smoothing in native speaker
realisations, the relatively high number of monophthong realisations by non-native
speakers in the words fountain and sounds clearly shows that most of them are aware
of the option of smoothing in these cases.
When teaching undergraduate native speakers about accents of English, one question
I have often encountered is how to transcribe the vowel in words like no and go. Many
of them are quite puzzled when they are told that they are supposed to use the /«U/
diphthong, as they do not perceive themselves as using either a diphthong51 or if they
do, as having a central vowel as its first element. At least some of them thought that
this type of realisation sounded more posh than the one they use. Upon first transcri-
bing my data, I also had the impression that somehow the realisations of my non-na-
tive speakers were sometimes too extreme to be natural and thought that this may be a
case of what Roach describes as follows:
51 most of the students in Lancaster tend to be from the ‘North’.

Chapter 8: Analysis: A Revised Evaluation Model.
170
“The other diphthong that requires comment is «U. English speakers seem to be
especially sensitive to the quality of this diphthong, particularly the first part. It often
happens that foreign learners, having understood that the first part of the diphthong is
not a back vowel, exaggerate this by using a vowel that is too front, producing a
diphthong like [eU]; unfortunately this gives the impression of a ‘posh’ accent – it
sounds like someone trying to copy an upper-class pronunciation, since [eU] for «U is
very noticeable in the speech of the Royal Family.” (Roach, ‘91, p. 24-25).
Rather than assuming a pronunciation of the first element that is closer to C2 /e/
though, as the one that Roach describes, I have transcribed this realisation as [‚ U] (c.f.
6.2 above), thus ending up with a three-way distinction between the former, the
quality with the central starting point [«U] and realisations a back vowel in initial
position, [oU].
In extracting occurrences of the three diphthong types from my data, it was impor-
tant to remember that each of the diphthong element may also be realised with creaky
voicing and therefore such occurrences are subsumed in the table below.
Word_ID Word NS [«U]
NS [oU]
NS [‚ U]
NNS [«U]
NNS [oU]
NNS [‚ U]
870-80 don’t 4 0 1 4 2 3 990; 1580 go 7 0 3 6 3 3
3310 hope 3 1 2 3 4 2 1760 Odeon 4 2 0 2 4 0 2790 Oh 1 1 0 0 5 4 2110 okay 6 0 0 2 0 2 450 over 7 0 1 3 4 1 1350 road 5 1 1 1 6 3 540 show 1 0 0 2 5 0 2820-30 won’t 1 0 0 0 0 0 total: 39 5 8 23 33 18
Table 27 – [«U] vs. [oU] vs. [‚ U].
Table 27 suggests that despite the intuitions of my undergraduate students, native
speakers show a clear preference for [«U] realisations. The other two types of realisa-

Chapter 8: Analysis: A Revised Evaluation Model.
171
tion are far lower and therefore seem to be relatively insignificant. However it also has
to be borne in mind that in general, only 52 out of the 77 possible forms were actually
realised as diphthongs by the native speakers and 74 out of 110 by the non-native
speakers, so that there is also still a fair number of monophthongal realisations occur-
ring.
The situation is different for the non-native speakers. We can see some preference
for the realisation with the back vowel as first element, but it does not appear to be as
clear a choice as for the native speakers. With regard to the ‘posher’ [‚ U]-form, we not
only find my initial impression confirmed, but also, perhaps surprisingly, that there are
even 8 occurrences of it by native speakers (mainly by E04 & E06, who are both more
‘Southern’ speakers).
As already mentioned earlier, it is often assumed that the /U«/ diphthong these days
tends to be replaced by a C6-like pronunciation /�ù/. However, according to my perso-
nal observation, this seems to imply far too open a quality of the vowel than many
speakers would actually use in this context. In have encountered this vowel quality
more with speakers that come from the Northwest or North of England. For most
other accents of English English at least, and including RP, the quality seems to be far
closer, more towards C7 /où/. The same applies to many other words that, according to
textbooks and pronouncing dictionaries, are supposed to be pronounced with /�ù/.
Table 28 lists all the candidate words for this type of pronunciation and compares
their realisations, including C13-like ones that seem to be relatively common for the
non-native speakers.

Chapter 8: Analysis: A Revised Evaluation Model.
172
Word_ID Word NS C6
NS C7
NS C13
NNS C6
NNS C7
NNS C13
220 sure 5 1 3260; 3380 your 1;
1 3
1
1
440 board 1 6 4/2 1/3 560 more 4 2 1 4/152 0/153 1/254 720; 2120 or 3 5 3 3 4/2 9/1 840 walking 1 6 9 1160 hall 4 1 2 7/155 1 1630 towards 2 5 1 8 2610 quarter 2 5 6 156 3 2740 always 6/1 6/1 1/1 1 2900 already 1 3/157 1 4 1 5
Table 28 – C6 vs. C7 vs. C13 by words.
Table 28 includes both purely monophthongal realisations and also some where the
relevant vowel represents the first vowel in diphthongs or is r-coloured. Slashes sepa-
rate pure monophthong realisations from the other types.
As we can see by looking at the top two rows of words in the table, for those words
where there used to be an /U«/-diphthong present, the native speakers at least show a
tendency towards C7. In sure, this tendency is very strong, whereas in your it seems to
be less so. However, this may be due to a general confusion on the part of both native
and non-native speakers to realise that this word was originally meant to be contras-
tive in the position with ID 3380 in the dialogue, in which case it should be realised as
52 1x followed by rhotic r.
53 1x followed by rhotic r.
54 followed by rhotic r.
55 resulting from l-vocalisation
56 3x [�].
57 second element [«].

Chapter 8: Analysis: A Revised Evaluation Model.
173
a strong form, but not necessarily otherwise. The native speakers, on the other hand,
show tendencies to either produce realisations closer to the original /U«/-diphthong or
different types of weak forms for both words.
Apart from in the words more and hall, the native speakers again show a rather dis-
tinct preference for qualities closer to C7, complemented mainly by a more limited
number of C6-like qualities. Occurrence of C13 is highly restricted and overall not
very prominent. In contrast, the non-native speakers clearly favour C6-like qualities,
followed by C13-like ones. The number of C7-like vowels is relatively limited,
however. Table 29 summarises the differences in numbers.
C6 C6+ C7 C7+ C13 C13+ total other ns 20 0 47 2 7 0 76 15 nns 45 5 9 7 29 3 98 32
Table 29 – C6 vs. C7 vs. C13 counts of overall occurrences.
The relatively strong inclination on the part of the non-native speakers may be ten-
tatively explained by the fact that the learners have probably been taught to realise the
vowel in these words with a very open quality to distinguish them from a closer quali-
ty deemed to be more German, used in such words Boot (boat), and hence unaccep-
table according to what the learners have been taught in school. Interestingly enough,
though, realising words like towards (ID 1630) (8x), quarter (3x) and already (5x)
with an /�/-like quality creates exactly the opposite effect, i.e. to make them sound far
more non-native. According to Kenworthy, ‘87, the /�/ vowel also represents a special
problem sound for German learners that needs special consideration, a claim that is
easily refuted by the fact that my speakers actually over-use it.
8.1.16. Unusual or Old-Fashioned Qualities
Under the heading of unusual or old-fashioned qualities, I want to discuss all those
vowel qualities produced by the non-native speakers that are different from the ones
used by the native speakers and have not already been included in the previous two
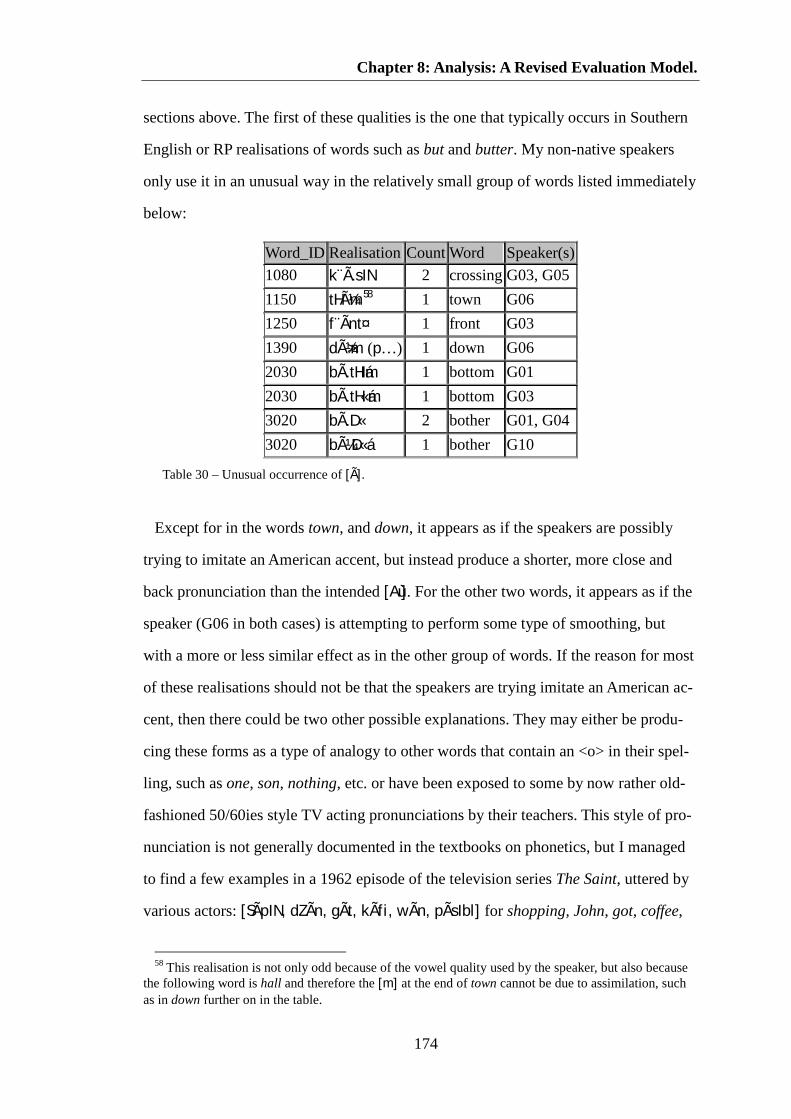
Chapter 8: Analysis: A Revised Evaluation Model.
174
sections above. The first of these qualities is the one that typically occurs in Southern
English or RP realisations of words such as but and butter. My non-native speakers
only use it in an unusual way in the relatively small group of words listed immediately
below:
Word_ID Realisation Count Word Speaker(s) 1080 k¨Ã.sIN 2 crossing G03, G05 1150 tHüm58 1 town G06 1250 f¨Ãnt¤ 1 front G03 1390 dü>m (p…) 1 down G06 2030 bÃ.tHIám 1 bottom G01 2030 bÃ.tH«ám 1 bottom G03 3020 bÃ.D« 2 bother G01, G04 3020 bü.D«á 1 bother G10
Table 30 – Unusual occurrence of [Ã].
Except for in the words town, and down, it appears as if the speakers are possibly
trying to imitate an American accent, but instead produce a shorter, more close and
back pronunciation than the intended [Aù]. For the other two words, it appears as if the
speaker (G06 in both cases) is attempting to perform some type of smoothing, but
with a more or less similar effect as in the other group of words. If the reason for most
of these realisations should not be that the speakers are trying imitate an American ac-
cent, then there could be two other possible explanations. They may either be produ-
cing these forms as a type of analogy to other words that contain an <o> in their spel-
ling, such as one, son, nothing, etc. or have been exposed to some by now rather old-
fashioned 50/60ies style TV acting pronunciations by their teachers. This style of pro-
nunciation is not generally documented in the textbooks on phonetics, but I managed
to find a few examples in a 1962 episode of the television series The Saint, uttered by
various actors: [SÃpIN, dZÃn, gÃt, kÃfi, wÃn, pÃsIbl] for shopping, John, got, coffee,
58 This realisation is not only odd because of the vowel quality used by the speaker, but also because
the following word is hall and therefore the [m] at the end of town cannot be due to assimilation, such as in down further on in the table.

Chapter 8: Analysis: A Revised Evaluation Model.
175
one and possible. Out of these examples, of course one in RP is still officially pro-
nounced with an /Ã/ ( i.e. /wÃn/) just as is front in my dialogue. However, at least the
latter can probably, at least judging by the realisations of the majority of my speakers,
be seen as somewhat old-fashioned or distinctly regional. As a regional phenomenon,
replacing /�/ by /Ã/ is only mentioned in one textbook on English pronunciation,
which is Ward, ‘45, who states:
“In some dialects � is replaced by Ã: e.g. not is pronounced nÃt, was wÃz.” (Ward,
‘45, p. 94).
Judging by the fact that this textbook is already more than half a century old and
none of the later textbooks refer to this feature, it is probably fair to assume that this
pronunciation is not only a regional, but also by now very old-fashioned one.
Another pronunciation that I originally assumed to be either an extremely old-
fashioned59 one, perhaps even going back to the 18th or 19th Centuries, or a more
regional feature, is the occurrence of the somewhat shwa-like, but more front
realisation that I have transcribed as [‚ ] in the words listed in the table below.
Word_ID Word NS Count NNS Count 2480 about 0 1 2570 allow 3 4 2000; 2580 at 2 6 2180; 3390 bus 2 0 2520 but 0 1 280; 1860 from 1 1 1250 front 1 0 210 not 0 2 3090 number 1 0 390; 1260 of 1 6 750; 1430; 2230 on 0 3 2860 problem 0 4
59 This notion is based on the fact that some older German speakers are still using the pronunciation
[k‚ t] for a type of frock that has dove-tails in the back and which reflects an old-fashioned type of pro-nunciation taught to them.

Chapter 8: Analysis: A Revised Evaluation Model.
176
Word_ID Word NS Count NNS Count 140; 1950 station 3 3 430; 2100; 2810 that 0 4 2680; 2930 ticket 0 4 1560 underpass 0 3 1120 up 1 0 2020; 2750; 3120 very 2 11
Table 31 – Some non-final and non-diphthong occurrences of [‚ ].
The table above only represents an excerpt of the most frequent or unusual occur-
rences and also excludes those realisations already discussed above as final realisa-
tions and in diphthongs. Overall, the non-native speakers have 78 occurrences of [‚ ],
while the native speakers only have 24. For the native speakers, occurrences of this
form seem indeed to represent a regionally restricted (and rather limited) feature as
almost all occurrences are produced by – in order of frequency – E06, E04 and E07,
who could all be characterised as more ‘Southern’ speakers. As the feature occurs in
various positions inside mono- and polysyllabic words and seems to be used rather
indiscriminately, it is extremely difficult to identify any underlying patterns of occur-
rence for any of the two populations.
8.1.17. Aspiration or Strong Final Release.
A further distinguishing feature between the two populations is the strength of aspi-
ration following initial and non-initial voiceless plosives. Overall, noticeably strong
aspiration is not a highly frequent feature for either of the two populations, but some
of the limited occurrences can be rather striking. In initial position, it occurs in the
words tell, train, town, take, to ticket, taking, 20, quarter and crossing for the native
speakers, but only in tell, town, ticket, could, 20 and quarter for the non-native spea-
kers. If we tentatively posit a hierarchy of strength60, starting from the weakest, of [h]
60 Some scholars may refer to this as sonority, but I have found this to be a rather ill-defined concept
and prefer to talk about the relative strength of segments in context.

Chapter 8: Analysis: A Revised Evaluation Model.
177
→ [ú] → [C] → [X] → [S] → [s], we can see the following distribution for initial aspi-
ration:
C X S s ns 3 1 3 18 nns 6 0 1 3
Most of the time, the aspiration for the native speakers is produced more or less
homorganically, for [s] 61 in words starting with [t] and for [C] in words with initial [k].
The same does not hold true for the non-native speakers, as 4 out of the 6 occurrences
of [C] are actually realised in the word twenty. The non-native speakers therefore seem
to be opting for the weaker type of aspiration, instead of preferring the more homorga-
nic realisation.
For medial aspiration, we find occurrences produced by the native speakers in the
words walking, taking, until, Theatre and bottom, and only in walking for the non-
native speakers:
C s ns 3 4 nns 2 0
The two occurrences of [C] actually occur without a preceding full plosive and are
therefore similar to the type of ‘undershoot’ often encountered in Scouse (c.f. Wells,
‘82, p. 371).
Final strong release by native speakers occurs in look and front, and in University by
the non-native speakers:
C ú s ns 1 0 1 nns 0 1 0
Even though the overall number of realisations of noticeably strong aspiration/
release is relatively low, we can nevertheless clearly see that the native speakers in
general have more variability in the strength of their aspiration and produce more
61 n.b. none of the speakers is a Scouser.

Chapter 8: Analysis: A Revised Evaluation Model.
178
strongly aspirated forms in potentially all positions, whereas the non-native speakers
seem to have a tendency to avoid very strong aspiration/release.
8.1.18. ‘Urban’ Features
As already pointed out earlier in 1.4.3 above, foreign and native urban accents may
sometimes share certain similarities that may contribute to the ‘stigma’ attached to
them. I will here only mention some examples of similarities that have come up in my
data.
The first one is one that we have already discussed in conjunction with peripheral
qualities occurring in unstressed final vowels (c.f. 8.1.14 above). It is the use of final
[Œ] in words like Theatre, here, there, etc., which occurs in urban accents such as
Brummy and Cockney, two of the accents that have an extremely low social accept-
ability in the eyes of many British native speakers.
The other one is the use of a labio-dental fricative /f/ or /v/ instead of dental /T/ or
/D/ in positions where this is not due to assimilation, a feature that has originally al-
ways been attributed to Cockney, but is claimed to be spreading with the increased
expansion of Estuary English these days. There are altogether four occurrences of this
phenomenon in my non-native speaker data, three for the word Theatre (1490) and
one for through (1590), realised as [fVu]. The latter realisation incidentally contains
another, possibly more urban, regional feature which I would associate with an area
somewhere around London and extending west towards and including Reading62, the
use of the approximant [V] instead of /¨/.
One explanation for the occurrence of such phenomena may be that they often repre-
sent simplifications of originally more difficult pronunciations, which is why they can
also often be found in particular stages of child language acquisition. On the other
62 This assumption, however, is only based upon one speaker I know who comes from there.

Chapter 8: Analysis: A Revised Evaluation Model.
179
hand, however, the use of such pronunciations by my non-native speakers may also
indicate that they have adopted native speaker simplification processes through expo-
sure to native accents, rather than to resort to L1 simplification processes any longer.
Maybe this is also the reason why only one of my non-native speakers only once pro-
duces the form [sINk] for think, while most textbooks on teaching the pronunciation of
English to foreign learners like Kenworthy, ‘87 (p. 136) still see this as a high priority
area for ‘remedial’ teaching for German learners.
8.2. Discourse Structuring & Cohesion.
Despite the fact that I have not been able to conduct a full-scale supra-segmental
analysis of my data including intonation, some results or insights about the prosodic
behaviour of my informants have come to light in the context of the segmental analy-
sis described before. I will summarise and discuss these below.
8.2.1. Pauses.
As we had noted in chapter 5 above, there is a statistically significant difference in
the overall length of the dialogues between female native and non-native speakers,
which could potentially be due to a difference in the use of long or short pauses by the
female non-native speakers. T-tests performed on both the male, female and combined
native and non-native speaker populations show that there is a significant difference in
the amount of short pauses produced by the female speakers (p=0.049), due to the
female non-native speakers’ producing on average 11 short pauses, while the female
native speakers only produce 6. For long pauses the situation with regard to gender
seems to be almost reversed, with the t-test showing a difference that is approaching
the 5% significance level (p=0.52), with the non-native speaker males having a
slightly higher average than the native speakers. These results, however, would still
seem to indicate that it is not only the amount of pauses that actually affects the
overall length of the dialogue as such, but that it is actually more likely to be

Chapter 8: Analysis: A Revised Evaluation Model.
180
segmental effects, such as reductions, at least as far as the male non-native speakers
are concerned, since, despite having more long pauses than the male native speakers,
their average length of dialogue is still shorter than that of the latter. In order to
determine precisely where the difference lies, however, one would probably have to
measure the exact length of all the pauses.
8.2.2. Stress & Rhythm.
That the non-native speakers sometimes place unusual stress on specific words has
already become apparent throughout the segmental analysis and during the first part of
this section, I will summarise all the different reasons why such an effect may be crea-
ted and which word-classes may be particularly affected.
According to my observations, it seems to be in general word classes that would
usually be counted among the function words, such as prepositions, demonstrative de-
terminers, locative adverbs, modal auxiliaries, adversative conjunctions and intensi-
fiers, that often appear to be given an unusual degree of stress in non-native speaker
realisations. For native speakers, on the other hand, these word classes belong to cate-
gories that are in most cases only stressed if they are either used contrastively or em-
phatically, and are in general also realised not only without stress, but also as weak
forms.
Amongst these categories, we can group prepositions, demonstrative determiners
and locative adverbs together and label them with the umbrella term deictic items. In
my corpus, the impression of stress on this type of word is often caused by a failure to
assimilate (c.f. 8.1.2 on non-assimilation), such as between that and board in the
phrase that board over there or to avoid a hiatus, such as between you and on in or are
you on foot when they appear in non-final position in the phrase or sentence. When
members of this group of words appear in phrase- or sentence-final position, this ef-
fect – or at least the impression of some kind of prominence – may also be created
Chapter 8: Analysis: A Revised Evaluation Model.
181
through final release (8.1.9) or rhoticity (8.1.11), e.g. in the locatives here and there in
explain it from here and on that board over there. For demonstrative determiners in
non-final position, final release (8.1.9) may effectively make them appear phrase-final
and thus ‘stressed’ because they appear to be in a separate tone group from the rest of
the noun phrase they belong to. The latter may then of course also represent a case of
non-assimilation in positions where assimilation would be possible. In general, many
of these features go hand in hand with a slight reluctance to produce weak forms (c.f.
8.1.13), too.
What these deictic items have in common and what may ultimately be the reason for
the non-native speakers to make them relatively more prominent, is that they all fulfil
a ‘pointing function’, i.e. they seem to single out certain items from their context.
What the non-native speakers do not seem to be aware of, though, is that this does not
necessarily trigger stress on these word categories in English.
For the other three categories, modal auxiliaries, adversative conjunctions and inten-
sifiers, the semantic content may also trigger the tendency to over-stress them. For
modal auxiliaries, such as in I might be able to, it may be the hypothetical content ex-
pressed, for adversative conjunctions, such as but, the adversative character, and for
intensifiers, such as least in at least a quarter of an hour, the intensification itself.
Unsurprisingly, we again find the same segmental features also triggering the stress-
effect as with the deictic items. However, for purposes of teaching non-native speaker
learners how to avoid overstressing these I believe that the two groupings I have es-
tablished may be useful to retain.
It is not very difficult to see that the features discussed above in relation to stress
will also have a significant effect on the overall difference in rhythm between native
and non-native speaker utterances. In particular, it is probably features such as not
avoiding to produce a hiatus and with this the occurrence of an abundance of intrusive
glottal stops, apart from failure to assimilate, overuse of final release, as well as the

Chapter 8: Analysis: A Revised Evaluation Model.
182
effect of occasional rhoticity (c.f. my comment in 8.1.11) that gives non-native spea-
ker utterances a slower, possibly somewhat harsher and more hesitant ‘appearance’.
On the other hand, native speakers not only tend to use more weak forms in general
86%63 (as opposed to 71% used by the non-native speakers), but also to shorten their
segments even more through extreme vowel reduction (8.1.8 above), l-clipping
(8.1.10) and a higher incidence of smoothing (8.1.15). These features, which seem to
create the ‘particularly native’ effect and are never taught to learners are features that
the latter will simply not be aware of, so that unless they are exposed to native speaker
language quite often, they will never even have a chance to try and imitate them.
63 out of all possible tokens discussed in my analysis.

183
9. Conclusion
As I hope to have demonstrated in this thesis, the methodology I have developed for
comparing and evaluating different accents can provide a convenient, extensible and
relatively straightforward way to identify major features of a particular accent, at the
same time allowing the researcher to compare and establish the salient differences be-
tween two different accents.
Based on the case-study of my two speaker populations, I believe it is possible to
identify important tendencies within these populations, despite the fact that the rela-
tively small number of speakers analysed in my study does not permit the claim that
the results of my analyses are statistically valid. As far as the native speakers are con-
cerned, we can posit that, apart from the general features of ‘nativeness’ and ‘fluency’
discussed in phonetics and EFL textbooks on English, there are also three features that
contribute in a distinctive manner to the impression of a native, educated and mildly,
but not completely, informal accent. These features are extreme vowel reduction, as a
feature affecting both transitions between words and weak forms, the relatively high
number of glottal stops replacing final plosives, and the tendency to perform liaison
between words where the final consonant can be ‘resyllabified’ (8.1.4). The latter is
particularly interesting because even widely acknowledged standard textbooks such as
Cruttenden, ‘94 claim that this is not a common feature of English, while the fact that
it amounts to 11.73% of all native speaker transitions in my corpus clearly seems to
disprove this assumption.
Further characteristic features appear to be a (perhaps growing) tendency towards l-
vocalisation and –clipping (8.1.10), a relatively strong dis-preference for the use of
syllabic consonants, apart from in constructions where there is the option for liaison
(8.1.12), and a clear preference for a more close, C7-like [o]-realisation in words like
more and sure, rather than the often generally assumed more open, C6-like [�]. As far
as the realisation of plosives is concerned, there also appears to be a slight tendency

Chapter 9: Conclusion
184
towards using an unusually high degree of aspiration, a feature which one would
perhaps more stereotypically associate with a Scouse or Irish accent.
Even in a language like English, where speech is often seen as far ‘more connected’
than in German, the most frequent transition category is still that of no linking. How-
ever, the level of difference between native and non-native speakers with respect to
non-linking is still striking and also statistically highly significant (8.1.9) well beyond
the 1% mark. But, as we have seen during the course of the segmental analysis, the
tendency to produce non-linking effects such as creating a hiatus by producing what I
have termed intrusive glottal stops or a failure to use certain types of – especially per-
severative – assimilation (8.1.2) or coalescence (8.1.3) consistently enhances the im-
pression of somewhat decreased ‘fluency’, despite the fact that the non-native spea-
kers ‘score’ almost equally high as the native speakers in the category of liaison.
In general, although there is of course a high amount of variation amongst the native
speakers, we also encounter a higher degree of inconsistency for the non-native spea-
kers. This encompasses features such as occasional rhoticity (8.1.11), higher variabi-
lity in the use of vowels in general, and some unusual or old-fashioned vocalic quali-
ties (8.1.16). Other prominent features seem to be due less to inconsistency, but to
represent more genuinely non-native realisation types. Amongst these, we can observe
the use of a relatively high number of C13-like qualities where the native speakers
prefer C7- or to some extent C6-like qualities, some specific occurrences of syllabic
consonants, in particular combinations of nasal + plosive +syllabic nasal, e.g. in words
like fountain, and the more frequent and stronger use of glottal onsets. Yet other fea-
tures, such as certain more peripheral qualities, are often closer to potentially less-ac-
cepted urban native accents (8.1.18) and may trigger a certain degree of prejudice in
some native listeners.
Overall though, one of the most striking characteristics – apart from the previously
mentioned lower incidence of linking features – is that the non-native speakers also

Chapter 9: Conclusion
185
produce fewer and often less extreme weak forms, avoiding phenomena such as ex-
treme vowel reduction or the deletion of word-internal consonants in weak forms
(8.1.13). This, however, does not necessarily mean that their pronunciation and style
of delivery is very remote from the teaching aims expressed in EFL textbooks, such as
Kenworthy, ‘87 or Pennington, ‘96, who do not tend to promote what some people
may consider ‘sloppy’ language, such as the use of extreme vowel reduction, and often
remain on far too general and simplistic a level in their descriptions to be useful for
the advanced learner of English.
As pointed out earlier, the findings summarised above can only represent observa-
tions of general tendencies amongst the two populations, even though they may al-
ready serve as the basis for implementing new teaching approaches to the pronuncia-
tion of English that place more emphasis on aspects of real-life connected speech than
most established textbooks. However, if the methodology outlined and partially imple-
mented in this thesis could be implemented on a large scale as a research project, it
could provide the basis for statistically valid research on real everyday spoken English
along the lines of a modernised Survey of English Dialects. For such an implementa-
tion, I would suggest setting up and recording dialogues with two participants in order
to achieve information on more genuine interaction than the one-speaker dialogues I
have used. As far as the type of vocabulary and pronunciation of individual segments
is concerned, a slightly improved approach compared to the one I have used would be
to create other real-life situations, but including as much as possible words that
comply with the criteria for lexical sets as established by Wells, ‘82. (p. 117ff.).
Ideally, such an implementation would also include a full implementation of
suprasegmental part, including intonation and thereby present a rounded picture of
modern-day British English. A database thus established would then not only provide
an extremely useful tool and reference for continuing work in dialectology, but also
provide a solid foundation for improving Language Engineering technology, such as
speech recognition and spoken dialogue systems.

Chapter 9: Conclusion
186
As far as the assessment of non-native speakers is concerned, my methodology
could provide a basis for developing a reliable and valid way of ranking ‘nativeness’
features and therefore ultimately lead to a fair and more objectified evaluation of indi-
vidual non-native speakers by looking at transitions, weak forms, stress, intonation
etc., as well as the more usual aspects of general pronunciation. Furthermore, it could
also provide a means of developing better and possibly also more realistic teaching
materials based on natural corpus data that can be adapted to the level of specific
groups or nationalities of students.
187
10. Bibliography
Bannert, Robert. 1976. Mittelbairische Phonologie auf akustischer und
perzeptorischer Grundlage. Travaux de l’Institut de Linguistique de Lund X. Lund:
CWK Gleerup.
Barbour, Stephen & Stevenson, Patrick. 1990. Variation in German: a Critical
approach to German Sociolinguistics. Cambridge: CUP.
Barry, William. 1974. Perzeption und Produktion im sub-phonemischen Bereich. Eine
kontrastive Untersuchung an intersprachlichen Minimalpaaren des Deutschen und
Englischen. Tübingen: Niemeyer. [Barry, ‘74]
Bobbin, Tim. 1894. The Works of John Collier (Tim Bobbin) in Verse and Prose.
Rochdale: James Clegg. [Bobbin, 1894]
Brazil, D. 1997 The Communicative Value of Intonation in English. Cambridge: CUP.
[Brazil, ‘97]
Brazil, David, Coulthard, Malcolm & Johns, Catherine. 1980. Discourse Intonation
and Language Teaching. London: Longman.
Brown, Gillian. 21990. Listening to Spoken English. London: Longman. [Brown, ‘90]
Chollet, Gerard, Cochard, Jean-Luc, Constantinescu, Andrei, Jaboulet, Cedric &
Langlais, Philippe. 1998. “Swiss French PolyPhone and PolyVar: Telephone
Speech Databases to Model Inter- and Intra-speaker Variability”. in: Nerbonne,
John. (ed.). 1998. Linguistic Databases. Center for the Study of Language and
Information: Stanford, California. pp. 117-135. [Chollet et al, ‘98]
Clark, John & Yallop, Colin. 21995. An Introduction to Phonetics and Phonology.
Oxford: Blackwell.

188
Couper-Kuhlen, Elisabeth. 1986. An Introduction to English Prosody. Tübingen:
Niemeyer. [Couper-Kuhlen, ‘86]
Cruttenden, Alan.
- 1986. Intonation. Cambridge: CUP. [Cruttenden, ‘86]
- 51994. Gimson’s Pronunciation of English. London: Edward Arnold. [Cruttenden,
‘94]
Flanagan, James L. 21972. Speech Analysis, Synthesis and Perception.
Berlin/Heidelberg/New York: Springer.
Fry, Dennis B.
- 1976. Acoustic Phonetics. Cambridge: CUP. (ed.)
- 1979. The Physics of Speech. Cambridge: CUP.
Gibbon, Dafydd, Mertins, Inge & Moore, Roger. 2000. Handbook of Multimodal and
Spoken Dialogue Systems. Berlin, New York: Kluwer Academic Publishers.
[Gibbon et al., ‘00]
Gibbon, Dafydd, Moore, Roger & Winski, Richard. 1998. Handbook of Standards and
Resources for Spoken Language Systems. Berlin: Mouton de Gruyter. [Gibbon et
al., ‘98]
Gimson, A. C. 1962. An Introduction to the Pronunciation of English. London:
Edward Arnold. [Gimson, ‘62]
Granger, Sylviane (ed.). 1998. Learner English on Computer. London: Longman.
Grosser, Wolfgang. “Aspects of Intonational L2 Acquisition“ in: Kettemann/Wieden
(eds.). 1993. pp. 81-92
Halford/Pilch (eds.). 1994 Intonation. Tübingen: Gunter Narr. [Halford/Pilch, ‘94]
Heaton, J.B. 1975. Writing English Language Tests. London: Longman. [Heaton, ‘75]
189
Helfrich, Hede. 1985. Satzmelodie und Sprachwahrnehmung: Psycholinguistische
Untersuchungen zur Grundfrequenz. Berlin/New York: de Gruyter.
Honikman, Beatrice. 1964. “Articulatory Settings” in: Abercrombie et al. (eds.). 1964.
In Honour of Daniel Jones. London: Longmans Green. pp. 73-84. [Honikman, ’64]
Hughes, Arthur & Trudgill, Peter. 21987. English Accents and Dialects. London:
Edward Arnold. [Hughes/Trudgill, ’87]
James, Allan. 1988. The Acquisition of a Second Language Phonology.
Kenworthy, Joanne. 1987. Teaching English Pronunciation. Longman Handbooks for
Language Teachers. London: Longman. [Kenworthy, ‘87]
Kettemann, Bernhard & Wieden, Wilfried (eds.). 1993. Current Issues in European
Second Language Acquisition Research. Tübingen: Gunter Narr.
[Kettemann/Wieden, ‘93]
Knill, Kate & Young. Steve. 1997. “Hidden Markov Models in Speech and Language
Processing“ in: Young, Steve & Bloothoft, Gerrit. (eds.) Corpus-Based Methods in
Language and Speech Processing. Kluwer: Dordrecht. [Knill/Young, ‘97]
Knowles, Gerald.
- 1987.Patterns of Spoken English: an Introduction to English Phonetics. London:
Longman. [Knowles, ‘87]
- ‘Pitch Contours and Tones in the Lancaster/IBM Spoken English Corpus’ in:
Leitner, Gerhard (ed.). New Directions in English Language Corpora. Berlin:
Mouton de Gruyter. S. 289-300.
- 1995. ‘Converting a corpus into a relational database: SEC becomes MARSEC.’
in: Leech, Geoffrey/Meyers, Greg/Thomas, Jenny (eds.). 1995. Spoken English on
Computer: Transcription, mark-up and application. Longman.
Ladd, Robert. 1996. Intonational Phonology. Cambridge: CUP. [Ladd, ‘96]

190
Ladefoged, Peter.
1962. Elements of Acoustic Phonetics. Chicago: The University of Chicago Press. 31993. A Course in Phonetics. New York: Harcourt Brace Jovanovich. [Ladefoged,
‘93]
Ladefoged, Peter & Maddieson, Ian. 1996. The Sounds of the World’s Languages.
Oxford: Blackwell Publishers Ltd. [Ladefoged/Maddieson, ‘96]
Laver, John. 1994. Principles of Phonetics. Cambridge: CUP. [Laver, ‘94]
Leech, Geoffrey & Meyers, Greg & Thomas, Jenny (eds.). 1995. Spoken English on
Computer: Transcription, mark-up and application. Longman.
Leech, Geoffrey/Weisser, Martin/Wilson, Andrew/Grice, Martine. 1998. “Survey and
Guidelines for the Representation and Annotation of Dialogue” in:
Gibbon/Mertins/Moore (eds.). 2000. Handbook of Multimodal and Spoken
Dialogue Systems. Dordrecht: Kluwer Academic Publishers. [Leech et al., 98]
Leech, Geoffrey & Weisser, Martin. (forthcoming) 2001. “Pragmatics and Dialogue”.
in: Mitkov, Ruslan. The Oxford Handbook of Computational Linguistics. Oxford:
OUP. [Leech/Weisser, ‘01]
Lehiste, Ilse (ed.). 1967. Readings in Acoustic Phonetics. Cambridge, Massachusetts:
M.I.T. Press.
Lieberman, Philip & Blumstein, Sheila. 1988. Speech Physiology, Speech Perception,
and Acoustic Phonetics. Cambridge: CUP. [Lieberman/Blumstein, ‘88]
Munder, Volkmar. 1994. “Is Intonation Teachable” in: Halford/Pilch (eds.). 1994.
Intonation. Tübingen: Gunter Narr. pp. 143-154. [Munder, ‘94]
Nerbonne, John. (ed.). 1998. Linguistic Databases. Center for the Study of Language
and Information: Stanford, California. [Nerbonne, ‘98]

191
O’Connor, J.D./Arnold, G.F. 21973. Intonation of Colloquial English: a Practical
Handbook. London: Longman. [O’Connor/Arnold, ‘73]
O’Shaughnessy, Douglas. 1987. Speech Communication. New York: Addison Wesley.
[O’Shaughnessy, ‘87]
Pennington, Martha. 1996. Phonology in English Language Teaching. London:
Longman. [Pennington, ‘96]
Ramsaran, Susan. 41989. An Introduction to the Pronunciation of English. London:
Edward Arnold. [Ramsaran, ‘89]
Roach, Peter. 21991. English Phonetics and Phonology: A practical course.
Cambridge: CUP. [Roach, ‘91]
Siegman, Aaron. & Feldstein, Stanley. (eds.) 1979. Of Speech and Time: Temporal
Patterns in Interpersonal Contexts. Hillsdale, NJ
Thompson, Henry, Anderson, Anne & Bader, Miles. 1995. “Publishing a spoken and
written corpus on CD-ROM: the HCRC Map Task experience”. in: Leech, Geoffrey
& Meyers, Greg & Thomas, Jenny (eds.). 1995. Spoken English on Computer:
Transcription, mark-up and application. Longman. pp. 168-180. [Thompson et al.,
‘95]
Wang, Michelle. & Hirschberg, Julia. 1992. “Automatic Classification of Intonational
Phrase Boundaries”. Computer Speech and Language , 6 (1992), pp. 175-196.
[Wang/Hirschberg, ‘92]
Ward, Ida. 41945. The Phonetics of English. Cambridge: W. Heffer & Sons Ltd.
[Ward, ‘45]
192
Weisser, Martin. 1997. “Naturalness and Spoken Data” in: Kyratzis, S. and Banerjee,
J. (eds.). 2000. Data in Applied Linguistics. Lancaster: Department of Linguistics
and Modern English Language, Lancaster University. [Weisser, ‘97]
Wells, John.
1982. Accents of English. CUP. [Wells, ‘82]
Vol. 1: An Introduction.
Vol. 2: The British Isles.
1990. Longman Pronouncing Dictionary. Harlow: Longman. [Wells, ‘90]
Wells John, Barry William, Grice Martine, Fourcin Adrian & Gibbon Dafydd. 1992.
“Standard Computer-compatible transcription.” Esprit project 2589 (SAM), Doc.
no. SAM-UCL-037. London: Phonetics and Linguistics Dept., UCL. [Wells et al.,
‘92]
Wieden, Wilfried & Nemser, William. 1991. The Pronunciation of English in Austria.
Tübingen: Gunter Narr. [Wieden/Nemser, ‘91]
Weir, Cyril. 1993. Understanding and Developing Language tests. Hemel Hempstead:
Prentice Hall International (UK). [Weir, ‘93]

193
11. Appendix A: The CLAWS 7 Tagset
Tag_ID Tag Tag_Description 10 ! punctuation tag - exclamation mark 20 " punctuation tag - quotes 30 ( punctuation tag - left bracket 40 ) punctuation tag - right bracket 50 , punctuation tag - comma 60 - punctuation tag - dash 70 ----- new sentence marker 80 . punctuation tag - full-stop 90 ... punctuation tag - ellipsis 100 : punctuation tag - colon 110 ; punctuation tag - semicolon 120 ? punctuation tag - questionmark 130 APPGE possessive pronoun, pre-nominal (e.g. my, your, our) 140 AT article (e.g. the, no) 150 AT1 singular article (e.g. a, an, every) 160 BCL before - clause marker (e.g. inorder (that), inorder (to)) 170 CC coordinating conjunction (e.g. and, or) 180 CCB adversative coordinating conjunction (but) 190 CS subordinating conjunction (e.g. if, because, unless, so, for) 200 CSA as (as conjunction) 210 CSN than (as conjunction) 220 CST that (as conjunction) 230 CSW whether (as conjunction) 240 DA after-determiner or post-determiner capable of pronominal function
(e.g. such, former, same) 250 DA1 singular after-determiner (e.g. little, much) 260 DA2 plural after-determiner (e.g. few, several, many) 270 DAR comparative after-determiner (e.g. more, less, fewer) 280 DAT superlative after-determiner (e.g. most, least, fewest) 290 DB before determiner or pre-determiner capable of pronominal function
(all, half) 300 DB2 plural before-determiner (both) 310 DD determiner (capable of pronominal function) (e.g. any, some) 320 DD1 singular determiner (e.g. this, that, another) 330 DD2 plural determiner (these, those) 340 DDQ wh-determiner (which, what) 350 DDQGE wh-determiner, genitive (whose) 360 DDQV wh-ever determiner, (whichever, whatever)

194
Tag_ID Tag Tag_Description 370 EX existential there 380 FO formula 390 FU unclassified word 400 FW foreign word 410 GE germanic genitive marker - ('or's) 420 IF for (as preposition) 430 II general preposition 440 IO of (as preposition) 450 IW with, without (as prepositions) 460 JJ general adjective 470 JJR general comparative adjective (e.g. older, better, stronger) 480 JJT general superlative adjective (e.g. oldest, best, strongest) 490 JK catenative adjective (able in be able to, willing in bewilling to) 500 MC cardinal number, neutral for number (two, three ..) 510 MC1 singular cardinal number (one) 520 MC2 plural cardinal number (e.g. sixes, sevens) 530 MCGE genitive cardinal number, neutral for number (two's, 100's) 540 MCMC hyphenated number (40-50, 1770-1827) 550 MD ordinal number (e.g.first, second, next, last) 560 MF fraction, neutral for number(e.g. quarters, two-thirds) 570 ND1 singular noun of direction (e.g. north, southeast) 580 NN common noun, neutral for number (e.g. sheep, cod, headquarters) 590 NN1 singular common noun (e.g. book, girl) 600 NN2 plural common noun (e.g. books, girls) 610 NNA following noun of title (e.g. M.A.) 620 NNB preceding noun of title(e.g. Mr., Prof.) 630 NNJ organization noun, neutral for number (e.g. council, department) 640 NNJ2 organization noun, plural (e.g. governments, committees) 650 NNL1 singular locative noun (e.g. island, street) 660 NNL2 plural locative noun (e.g. islands, streets) 670 NNO numeral noun, neutral for number (e.g. dozen, hundred) 680 NNO2 numeral noun,plural (e.g. hundreds, thousands) 690 NNT1 temporal noun, singular (e.g. day, week, year) 700 NNT2 temporal noun, plural (e.g. days, weeks, years) 710 NNU unit of measurement, neutral for number (e.g. in, cc) 720 NNU1 singular unit of measurement (e.g. inch, centimetre) 730 NNU2 plural unit of measurement (e.g. ins., feet) 740 NP proper noun, neutral for number (e.g. IBM, Andes) 750 NP1 singular proper noun (e.g. London, Jane, Frederick) 760 NP2 plural proper noun (e.g. Browns, Reagans, Koreas)

195
Tag_ID Tag Tag_Description 770 NPD1 singular weekday noun (e.g. Sunday) 780 NPD2 plural weekday noun (e.g. Sundays) 790 NPM1 singular month noun (e.g. October) 800 NPM2 plural month noun (e.g. Octobers) 810 NULL the nulltag, for words which receive no tag 820 PN indefinite pronoun, neutral for number (none) 830 PN1 indefinite pronoun, singular (e.g. anyone, everything, nobody, one) 840 PNQO objective wh-pronoun (whom) 850 PNQS subjective wh-pronoun (who) 860 PNQV wh-ever pronoun (whoever) 870 PNX1 reflexive indefinite pronoun (oneself) 880 PPGE nominal possessive personal pronoun (e.g. mine, yours) 890 PPH1 3rd person sing. neuter personal pronoun (it) 900 PPHO1 3rd person sing. objective personal pronoun (him, her) 910 PPHO2 3rd person plural objective personal pronoun (them) 920 PPHS1 3rd person sing. subjective personal pronoun (he, she) 930 PPHS2 3rd person plural subjective personal pronoun (they) 940 PPIO1 1st person sing. objective personal pronoun (me) 950 PPIO2 1st person plural objective personal pronoun (us) 960 PPIS1 1st person sing. subjective personal pronoun (I) 970 PPIS2 1st person plural subjective personal pronoun (we) 980 PPX1 singular reflexive personal pronoun (e.g. yourself, itself) 990 PPX2 plural reflexive personal pronoun (e.g. yourselves, themselves) 1000 PPY 2nd person personal pronoun (you) 1010 RA adverb, after nominal head (e.g. else, galore) 1020 REX adverb introducing appositional constructions (namely, e.g.) 1030 RG degree adverb (very, so, too) 1040 RGQ wh-degree adverb (how) 1050 RGQV wh-ever degree adverb (however) 1060 RGR comparative degree adverb (more, less) 1070 RGT superlative degree adverb (most, least) 1080 RL locative adverb (e.g. alongside, forward) 1090 RP prep. adverb, particle (e.g about, in) 1100 RPK prep. adv., catenative (about in be about to) 1110 RR general adverb 1120 RRQ wh-general adverb (where, when, why, how) 1130 RRQV wh-ever general adverb (wherever, whenever) 1140 RRR comparative general adverb (e.g. better, longer) 1150 RRT superlative general adverb (e.g. best, longest) 1160 RT quasi-nominal adverb of time (e.g. now, tomorrow)

196
Tag_ID Tag Tag_Description 1170 TO infinitive marker (to) 1180 UH interjection (e.g. oh, yes, um) 1190 VB0 be base form (finite i.e. imperative, subjunctive) 1200 VBDR were 1210 VBDZ was 1220 VBG being 1230 VBI be infinitive (To be or not... It will be..) 1240 VBM am 1250 VBN been 1260 VBR are 1270 VBZ is 1280 VD0 do base form (finite) 1290 VDD did 1300 VDG doing 1310 VDI do infinitive (I may do... To do...) 1320 VDN done 1330 VDZ does 1340 VH0 have base form (finite) 1350 VHD had (past tense) 1360 VHG having 1370 VHI have infinitive 1380 VHN had (past participle) 1390 VHZ has 1400 VM modal auxiliary (can, will, would, etc.) 1410 VMK modal catenative (ought, used) 1420 VV0 base form of lexical verb (e.g. give, work) 1430 VVD past tense of lexical verb (e.g. gave, worked) 1440 VVG -ing participle of lexical verb (e.g. giving, working) 1450 VVGK -ing participle catenative (going in be going to) 1460 VVI infinitive (e.g. to give... It will work...) 1470 VVN past participle of lexical verb (e.g. given, worked) 1480 VVNK past participle catenative (e.g. bound in be bound to) 1490 VVZ -s form of lexical verb (e.g. gives, works) 1500 XX not, n't 1510 ZZ1 singular letter of the alphabet (e.g. A,b) 1520 ZZ2 plural letter of the alphabet (e.g. A's, b's)

197
12. Appendix B: Percentages of Individual Transition Categories

198
13. Appendix C: Combined Transition Categories

199
14. Appendix D: Data CD & Online Version of Thesis
The accompanying CD-ROM contains two folders, one called “mw” and one
“speechtools”. The first one contains the online copy of the thesis in Word 2000
format with linked-in soundfiles of the sample spectrograms included in the thesis.
Thes soundfiles can be played back by clicking on the respective images. The folder
furthermore contains a copy of an Excel 2000 file containing some of the statistics,
which is linked to the Word document. In order to make proper use of the online ver-
sion, the folder must be copied to a local machine with the destination path “C:\mw”.
After copying the folder, the “Read-only” file attributes for the Word document and
the “dialogues” database should be switched off, so that the Word document can be re-
freshed from the linked spreadsheet and the VBA routines in the database can be run.
All the speaker data in the database have been anonymised.
In order to be able to call the Speech Analyzer program from within the “dialogues”
database, the freeware Speech Tools in the “speechtools” folder on the CD should be
installed in the destination folder “C:\asap”, so that the database application can run
the Speech Analyzer program with one of the appropriate soundfiles contained in
“C:\mw\data”. To do this, please follow the instructions in 4.6.1.2 closely. After
installing the Speech Tools, it is strongly advisable to reboot the computer because
otherwise there may be problems with the display of the phonetic font provided with
the Speech Tools and which I have also used for both the “dialogues” database and the
annotations contained in the soundfiles. Without installing the Speech Tools, the trans-
criptions in the database will not display properly!