A Content Analysis Investigation Relationships Between Communication and Business Continuity...
44
http://job.sagepub.com/ Communication Journal of Business http://job.sagepub.com/content/early/2009/03/31/0021943609333525 The online version of this article can be found at: DOI: 10.1177/0021943609333525 published online 31 March 2009 Journal of Business Communication Gabriel L. Adkins, Tyler J. Thornton and Kevin Blake business continuity planning A content analysis investigating relationships between communication and - Jun 5, 2009 version of this article was published on more recent A Published by: http://www.sagepublications.com On behalf of: Association for Business Communication can be found at: Journal of Business Communication Additional services and information for http://job.sagepub.com/cgi/alerts Email Alerts: http://job.sagepub.com/subscriptions Subscriptions: http://www.sagepub.com/journalsReprints.nav Reprints: http://www.sagepub.com/journalsPermissions.nav Permissions: at UNIV OF OKLAHOMA on May 23, 2014 job.sagepub.com Downloaded from at UNIV OF OKLAHOMA on May 23, 2014 job.sagepub.com Downloaded from
Transcript of A Content Analysis Investigation Relationships Between Communication and Business Continuity...

http://job.sagepub.com/Communication
Journal of Business
http://job.sagepub.com/content/early/2009/03/31/0021943609333525The online version of this article can be found at:
DOI: 10.1177/0021943609333525
published online 31 March 2009Journal of Business CommunicationGabriel L. Adkins, Tyler J. Thornton and Kevin Blake
business continuity planningA content analysis investigating relationships between communication and
- Jun 5, 2009version of this article was published on more recent A
Published by:
http://www.sagepublications.com
On behalf of:
Association for Business Communication
can be found at:Journal of Business CommunicationAdditional services and information for
http://job.sagepub.com/cgi/alertsEmail Alerts:
http://job.sagepub.com/subscriptionsSubscriptions:
http://www.sagepub.com/journalsReprints.navReprints:
http://www.sagepub.com/journalsPermissions.navPermissions:
at UNIV OF OKLAHOMA on May 23, 2014job.sagepub.comDownloaded from at UNIV OF OKLAHOMA on May 23, 2014job.sagepub.comDownloaded from

What is This?
- Mar 31, 2009 OnlineFirst Version of Record>>
- Jun 5, 2009Version of Record
at UNIV OF OKLAHOMA on May 23, 2014job.sagepub.comDownloaded from at UNIV OF OKLAHOMA on May 23, 2014job.sagepub.comDownloaded from

A CONTENT ANALYSIS INVESTIGATING RELATIONSHIPS
BETWEEN COMMUNICATION AND BUSINESS CONTINUITY PLANNING
Gabriel L. AdkinsTyler J. Thornton
Kevin BlakeThe University of Oklahoma
This study provides an exploratory content analysis of business continuity planning (BCP) literature. The researchers systematically sampled multiple databases and codified artifacts using a set of vari-ables developed by the research team. Based on the analysis, arguments are presented concerning the nature of BCP, the state of the BCP literature, and the nature of the conversations taking place in regard to BCP among academics, government/legal institutions, the media, and trade industries. Finally, the researchers demonstrate gaps in the current knowledge on BCP and suggest future direc-tions for applied and theoretical research.
Keywords: business continuity; content analysis; risk management; disaster preparedness; knowledge management
In recent years, there has been no shortage of crises and disasters in the United States and abroad, including the Virginia Tech Massacre, Hurricanes Katrina and Rita, the Southeast Asian Tsunami, SARS, Mad Cow Disease, the Enron scandal, the Y2K bug, terrorism in London, Madrid, and the Middle East, and of course the unforgettable 9/11 attacks. In 2008, we are facing one of the worst economic crises since the S&P index started 80 years ago (Norris, 2008). It is imperative to recognize that everything in the economy is inter-connected: corporations, small businesses, the housing market, the stock market, the unemployment rate, the federal government, and people’s per-sonal finances. That’s why, after the housing bubble burst, it initially affected mortgage lenders and the people who couldn’t afford to make payments on their homes anymore but spread to the commercial and service areas and now to the job market. The more people who can’t sell their homes, the worse the housing market gets, as everyone is in a race to the bottom to make any
Journal of Business Communication, Volume XX, Number X, Month XXXX xx-xx DOI: 10.1177/0021943609333525© 2009 by the Association for Business Communication
doi:10.1177/0021943609333525Journal of Business Communication OnlineFirst, published on March 31, 2009 as
at UNIV OF OKLAHOMA on May 23, 2014job.sagepub.comDownloaded from

2 JOURNAL OF BUSINESS COMMUNICATION
money they can before they are foreclosed upon. In addition, energy prices are escalating, which means that consumers are attempting to save more and spend less on things they enjoy such as dining out, taking vacations, and other leisure activities. Subsequently, major corporations such as financial institu-tions and insurance companies recently went insolvent destroying millions of people’s lives, who were expecting to receive steady retirement benefits or home loans from the now failed companies.
The list could go on, but a common trend is that these events are inevitable, widespread, and affect all types of organizations and individuals with vastly different missions, cultures, and goals. Knowing that bad things will happen would not be a problem except for this disturbing truth: The vast majority of organizations recognize that crises are inevitable, but far too many are not prepared to deal with them (Jackson, 2006; Pitt & Goyal, 2004). Swartz (2003) reported that as few as 20% of organizations have a plan they feel will be effective in the event of an emergency. Among European nations, Ireland is leading the way with continuity planning, with about 52% of businesses employing technology to back up data and review other emergency manage-ment (EM) measures, while Germany, Italy, and France all come in under 35% (Jackson, 2006). The lack of planning is even more disconcerting when you consider that the private sector in the United States controls as much as 85% of the country’s infrastructure (MCC, 2005) but are least prepared to handle a crisis.
When disasters, crises, or even minor hazards occur in a small or large workplace, it creates serious problems for employers, including massive losses in profits, time, and other resources (Jackson, 2006; Maher & Zimmerman, 2005). Because it is clear that something bad will eventually happen, it is difficult to comprehend why so many organizations (who risk
The members of the research team would like to gratefully acknowledge the assistance of Dr. H. Dan O’Hair, Dr. Jill Edy, and Dr. Glen Hansen in preparing this article for publication. Gabriel Adkins is a doctoral student who is currently working on his dissertation at the University of Oklahoma. His research interests include organizational communication, interorganizational networking, intercul-tural communication, crisis communication, and communication technology. Tyler J. Thornton is a doctoral student who is currently finishing course work and preparing his dissertation proposal at the University of Oklahoma. His research interests include intercultural communication with an emphasis in hermeneutics, phenomenology, and semiotics. He also does research in organizational communica-tion, networking, and communication technology. Kevin Blake is a staff employee at the University of Oklahoma and a graduate student who is currently finishing course work and preparing his pro-posal at the University of Oklahoma. His research interests include interorganizational networking and communication technology. Correspondence concerning this article should be addressed to Gabriel L. Adkins, The University of Oklahoma, 1203 Rebecca Lane #110, Norman, OK 73072; e-mail: [email protected].
at UNIV OF OKLAHOMA on May 23, 2014job.sagepub.comDownloaded from

Adkins et al. / CONTENT ANALYSIS OF BUSINESS 3
losing billions of dollars, stakeholders, resources, and possibly lives) refuse to put in money and time to be prepared for when the problems come. Considering that the business world is generally profit driven, the failure to minimize the risks related to crisis seems particularly troubling. If a business is able to grow and can continue its usual transactions and cycles without being interrupted, or only minimally interrupted, other organizational goals, including increasing profits, will be met. Therefore, insulating an organization against the disrupting forces of a disaster or crisis would seem to be an issue that should be a top priority for organizational leaders.
The study reviews the concept of business continuity (BC), which is directly related to risk management and EM planning. After a brief initial search through some of the literature related to business continuity planning (BCP), we found that this area has received lip service but not much else. Far too many articles are vague for practical use and have little or no theoretical underpinning. We are particularly concerned with the limited amount of com-munication scholarship we found in this area, considering that it should play a central role in all aspects of risk and EM. In order to better understand and hopefully begin to fill this gap, we proposed and conducted the following content analysis of the BCP literature. The first section defines business con-tinuity and related concepts. We then posit six research questions concerning the BCP literature. These questions address issues such as what events BCP is utilized for, what types of organizations are discussed, what strategies and theories are utilized, and how different communities are discussing BCP. We conducted a content analysis over a large sample of the available literature on business continuity in academic journals, government hearings and testimony, legal news and law reviews, trade journals and magazines, and various media sources from 1997 to 2007 excluding the current economic crisis. The final section shares the results and discusses findings, limitations, and future research possibilities in business continuity.
Because it is clear that something bad will eventually happen, it is difficult to comprehend why so many organizations (who risk losing billions of dollars, stake-holders, resources, and possibly lives) refuse to put in money and time to be prepared for when the problems come.
at UNIV OF OKLAHOMA on May 23, 2014job.sagepub.comDownloaded from

4 JOURNAL OF BUSINESS COMMUNICATION
LITERATURE REVIEW
What Is Business Continuity Planning?
There seems to be a common consensus that there are four or five subsets of risk or EM. Bajgoric (2006) defines the subset of BCP from an information technology (IT) standpoint as, “the ability of a business to continue with its operations even if some sort of failure or disaster occurs” (p. 632). Similar definitions can be found in other areas such as health care management (Iyer & Bandyopadhyay, 2000), physical facilities management (Pitt & Goyal, 2004), international business (Hofstede, Van Deusen, Mueller, Charles, & The Business Goals Network, 2002), international terrorism prevention (Then & Loosemore, 2006), human resources (Perry & Mankin, 2005), banking and finance (Hanna, 2005), and a host of government departments, including the Federal Emergency Management Association, the U.S. Energy Department, and the Department of Homeland Security (MCC, 2005). Despite this clearly understood definition, organizations still put this area of planning aside. The two most common reasons cited for the lack of planning are the high costs and extra time (MCC, 2005).
Botha and Gaadingwe (2006) reviewed 20 SEC International Information Security Conferences and found that only 9 of 802 papers (less than 1% of the entire pool) dealt with BC issues, and 7 of the 9 that were presented were overly technical and didn’t interact with risk management and security issues. Ramleth (2006) concludes that employees in technical fields lack the skills to effectively communicate the importance of BCP and that these employees need to make the idea simpler so executives can understand it, thereby helping to make it a higher priority in organizational planning. The Department of Homeland Security conducted a survey of 213 top executives and found that security initiatives receive support, but executives rarely are responsible or accountable for security matters even if they have a hand in making security decisions (Edmonson, 2006). The survey also concluded that executives see security as an operations problem rather than as a problem of the whole orga-nization. Furthermore, Hofstede et al. (2002) surveyed over 1,800 students from 21 countries who work as junior managers and professionals during the day and take MBA courses at night (presumably to move up the chain of com-mand). In the near future, this group will likely be responsible for organiza-tional crisis issues. Because they are currently working in an organization, they understand their organization’s culture as well as the kinds of goals their businesses want to pursue. The mean rankings of Hofstede’s study over the 21 countries showed that managers are primarily most interested in the
at UNIV OF OKLAHOMA on May 23, 2014job.sagepub.comDownloaded from

Adkins et al. / CONTENT ANALYSIS OF BUSINESS 5
growth of their business and secondarily in BCP. Other management goals addressed in this study included making a profit, gaining power, being ethical, societal responsibilities, being innovative, caring for employees and stake-holders, nationalism, and family interests.
Lack of Collaboration, Unrealistic Optimism, and No National Standards
Obviously, there is a gap in the communication between departments and among organizations. Originally, BCP was a concept that fell on the shoulders of IT departments and was limited to backing up, protecting, and providing redundancy of data (Gill, 2006), but more recently, risk management is more inclusive of human as well as technical concerns and affects all aspects of an organization. However, organizations still split responsibilities between opera-tions, security, IT, management, and other departments, thereby increasing the risk that something will fall through the cracks. Practitioners suggest that more collaboration should occur to make the most effect on BCP and other EM plans (Edmonson, 2006; MCC, 2005). One of the clearest cases of collabora-tion in preparation for a known crisis was federal, state, and local governments cooperating with foreign nations, local communities, corporations, schools, and other organizations to address the Y2K computer problem (Carter, 1998; Pearl, 1998; Willemssen, 1998). Both the 9/11 attacks and Katrina made emer-gency planning much more salient for the government and all other organiza-tions throughout the United States (Kelly & Peckham, 2002).
Even a brief reading of the 9/11 Commission Report (2004) shows that the United States should have been prepared for a terrorist attack, especially in the globalized society we live in today. Moreover, we knew about Katrina’s potential to create damage before she made landfall, and still, many organiza-tions from the federal and local government to businesses and communities failed to be ready when the storm hit. Powell, Bodon, and Hickson III (2001) explain that during the Y2K precrisis, there was a sense of apathy among the general population. According to their research, people made two faulty assumptions. First, they felt that the government and businesses had the mil-lennium bug under control because they talked about it for so long and, hence, assumed that they could control other risks. Second, there was no need to prepare because the crisis was not going to affect them personally. Scholars describe such apathy as unrealistic optimism, a widespread concept from personal health problems to organizational crises despite the fact that serious problems, hazards, disasters, and crises occur constantly (Aucote & Gold, 2005; Covey & Davies, 2004; Hermand et al., 2003; Park, Scherer, & Glynn,
at UNIV OF OKLAHOMA on May 23, 2014job.sagepub.comDownloaded from
6 JOURNAL OF BUSINESS COMMUNICATION
2001). Whether they are predictable or not, the clear message is that organiza-tions should prepare for when, not if, a disaster and/or crisis will occur.
Upon finding no national standard for emergency preparedness in the pri-vate sector, the 9/11 Commission recommended that the American National Standards Institute create a comprehensive set of guidelines and standards to help the private sector prepare itself for future terrorist attacks, natural disas-ters, or other crises (MCC, 2005). This was another attempt to create collabo-ration between and among organizations throughout the country as a means to increase the nation’s security. John Azzarello, former counsel to the Commission, explained that such standards would allow a common terminol-ogy or language that all entities could understand (MCC, 2005). Up to this point, technical language barriers across organizations have decreased suc-cessful collaborative efforts. Just like the idea that all departments in one company should work together to create a successful plan for their business, the national standard would allow many companies and government bodies to interact and create the best plan for preparing for and responding to disas-trous situations. However, the drawback to such a national standard is that there are few incentives for compliance. One suggestion was to have credit rating and ensure that insurance industries provide monetary incentive, but even that is a difficult process since insurance companies don’t want to lose money on insuring risky businesses. One would think that saving lives and profits might be enough, but this is simply not the case. Additional problems with previously existing guidelines such as the National Fire Protection Association (NFPA) 1600 guides include vague definitions, legal and liability issues, and untested criteria (NFPA, 2007). While this and other documents are a start, they are simply not enough. Furthermore, individuals must adapt to their particular circumstances, so standards are not nationally consistent. There are problems with how communication is happening when it comes to BCP, and there needs to be some direction on how to make the process more useful and collaborative.
Scholars describe such apathy as unrealistic optimism, a widespread concept from personal health problems to organizational crises despite the fact that serious problems, hazards, disasters, and crises occur constantly.
at UNIV OF OKLAHOMA on May 23, 2014job.sagepub.comDownloaded from

Adkins et al. / CONTENT ANALYSIS OF BUSINESS 7
Knowledge Management Theory
Knowledge management theory provides a framework to make BCP more relevant and practical in EM planning. Initially, Newman and Conrad (1999) defined knowledge management “[as] a discipline that seeks to improve the performance of individuals and organizations by maintaining and leveraging the present and future value of knowledge assets” (p. 2). They further describe a model where agents within organizations create, utilize, transfer, and retain all kinds of explicit,1 implicit,2 and tacit3 knowledge artifacts (bits of information). If applied correctly, Newman and Conrad (1999) suggest, “the framework is a general purpose tool that can be applied to variety of problems and solutions and adapted to individual work styles”. For example, if organizations lack effective and strategic communication because they don’t know how to conduct BCP, then they can’t prepare for future disasters. Using the model, we can illustrate the importance of knowing what knowl-edge currently exists, who has it, how it is disseminated, and whether it is in fact relevant and practical to a particular organization or situation. Once the known body of knowledge is thereby properly managed, we can begin the process of finding gaps in the knowledge and needed information that is cur-rently not available. Based on what we have seen thus far, the state of the literature indicates that knowledge regarding BCP is in dire need of manage-ment; this study seeks to assist with the process of understanding the knowl-edge that currently exists, in hopes that it will lead to the identification of knowledge gaps and the eventual generation of the knowledge needed to fill those gaps in regard to BCP.
Research Questions
We offer the following research questions (RQs) because our search indi-cated an obvious lack of knowledge regarding BCP, particularly in relation to communication in the planning process within and among organizations:
RQ1: According to the literature, what types of events should organizations utilize BCP for?
RQ2: What types of organizations are represented in the BCP literature?RQ3: What types of communication technologies are discussed as part of
BCP in the literature?RQ4: What strategic elements of BCP are discussed in the literature?RQ5: What communication theories are utilized or discussed in the BCP
literature?
at UNIV OF OKLAHOMA on May 23, 2014job.sagepub.comDownloaded from

8 JOURNAL OF BUSINESS COMMUNICATION
RQ6: Are academics, trade organizations, the media, and government/legal organizations discussing the same issues in regard to BCP? If not, what are the differences between these groups?
METHOD
We conducted a content analysis of the literature by searching five databases, including ABI/INFORM, Web of Science, LexisNexis Academic Universe, EBSCOhost, and ERIC. We used one search term—business continuity—and limited the dates to the last 10 years (1997-2007) and full text articles only. Our combined search located more than 2,500 articles, which we included in the sample frame for analysis. Furthermore, we stratified the articles into four subbodies of literature: academic articles, trade publications, media articles, and government/legal publications.
In order to find the answers to our research questions, which we could then place in the knowledge management framework to make the most effective use of the information for organizations, we used a grounded theory approach. We used the first 50 listings of each database to establish the initial code sheet categories. We created additional categories as necessary after the initial cod-ing process and interreliability testing. We created these only if all three cod-ers agreed that they were necessary. Because this is only a sample of the total body of available literature on BCP, we didn’t want to limit potential data that could help answer the research questions.
Code Sheets
Our initial code sheet (see the appendix) listed eight categories for each event type, from natural phenomena such as weather-related events and dis-eases to human-made problems like terrorism and corporate scandals. We included 16 types of organizations, some of which were domestic and inter-national governments; banking and finance; food, retail, and hospitalities services; IT services; and various industries from manufacturing to health care/hospitals. We represented nine types of communication technologies from a cell phone to the media of written and face-to-face communication. We had 10 BCP strategy elements, including various kinds of training, network-ing within and among organizations, and what, if any, written plans the orga-nizations had. Finally, we included two communication theories: systems theory and networking theory. After we concluded the intercoder reliability test, we expanded the code sheet (see the appendix) to include a total of 12
at UNIV OF OKLAHOMA on May 23, 2014job.sagepub.comDownloaded from

Adkins et al. / CONTENT ANALYSIS OF BUSINESS 9
event types, 27 organization types, 17 communication technologies, 25 strat-egy elements, and 3 categories for communication theories (networking, systems, and other).
Sampling Frame, Sample Selection, and Description of Sample
In order to learn the coding process, we conducted a small intercoder reli-ability test. This test was a nonsystematic random sample and included one academic, five trade, five government/legal, and five media articles, which all three researchers coded. Of the 16 articles assigned for this sample, 13 were located and coded by all three coders; the remaining 3 articles were coded by two of the coders and were eliminated from the analysis. The resulting inter-coder reliability rate was 94%, based on the calculation of simple percentage agreement that was initially utilized to determine general reliability on this initial sample. After learning how to code, we conducted a second intercoder reliability test as a part of the actual sample. We searched the databases to compile the four stratified bibliographies and then eliminated any duplicates between the four sets. The articles from the initial intercoder reliability test were not included in the final sample frame. This left 225 media, 152 aca-demic, 1,134 trade, and 484 government/legal articles (N = 1,995).
We then selected 75 articles from each of the four types of publications for the final sample (so that we would have equal representation of all four pub-lication types in our sample), using a random number generator to pick each article, which gave us an N of 300 in the final sample of articles to code. Several of the articles chosen in the final sample (6 academic, 1 media, and 1 government publications) were not locatable by the authors during the coding process, resulting in a final sample size of 292 articles coded. For the final intercoder reliability analysis, 28 articles were selected randomly from the 300 articles originally selected for inclusion in the sample; all 28 articles for the reliability analysis were located and coded. Table 1 presents a breakdown of the sample by type of publication.
Over 55% of the articles in the final sample were published between 2004 and 2006, as shown in Table 2. When a histogram of the dates of publication (see Figure 1) is created for our sample, a significant increase in BCP publications occurs during the years 2002 to 2006; the number of publications in our sample during this period went from a previous aver-age of 6.2 per year from 1997 to 2001 to an average of 46.6 per year between 2002 and 2006.
at UNIV OF OKLAHOMA on May 23, 2014job.sagepub.comDownloaded from

10 JOURNAL OF BUSINESS COMMUNICATION
We assert that the initial spike in publication of BCP literature is due in no small part to the 9/11 terrorist attacks and is sustained mostly as a result of the hurricane Katrina disaster that occurred in 2005. During both of these events, it is likely that organizations and publishers were more salient of the potentials both for a disaster to occur and of the devastating impacts that a disaster could have on an unprepared organization. Unfortunately, the graph also shows that our sample indicates a significant decline in BCP publications during 2007; this is possibly due to one of two factors (or a combination of both): This drop-off is either because the sample was collected during the second quarter of 2007, or it is quite possible that interest in BCP and the salience of potential disaster degenerates once a major public crisis or disaster gives way to a period of relative stability. There is some anecdotal evidence supporting the assertion that the latter possibility is likely to be a significant factor in the drop-off of publications on BCP in 2007; assuming that an even distribution of publications throughout the year would have been selected for the sample, only 36 articles from 2007 would have appeared in the sample, as opposed to 60 articles from 2006.
Table 1. Publication Type Distribution of Coded Articles
Publication Type Number of Articles Percentage of Total Sample
Academic publication 69 23.6Trade publication 75 25.7Media article 74 25.3
Government/Legal publication 74 25.3
Table 2. Publication Date Distribution of Sample
Publication Year Number of Articles Percentage of Sample
1997 4 1.41998 12 4.11999 16 5.52000 7 2.42001 8 2.72002 30 10.32003 42 14.42004 50 17.12005 51 17.52006 60 20.5
2007 12 4.1
at UNIV OF OKLAHOMA on May 23, 2014job.sagepub.comDownloaded from

Adkins et al. / CONTENT ANALYSIS OF BUSINESS 11
We assert that the initial spike in publication of BCP literature is due in no small part to the 9/11 terrorist attacks and is sustained mostly as a result of the hurricane Katrina disaster that occurred in 2005.
Coding Procedure and Intercoder Reliability
The unit of measurement was the article. Each researcher read entire arti-cles, not just abstracts or titles. Texts were coded, whereas additional tables and notes were not included. The unit of observation was the category items. The SPSS data file consisted of basic code items containing coder numbers, codes for stratifications, publication dates for every article, and unit numbers for each article. Each category item was individually “dummy coded”: If a
1996Date of Publication
0
10
20
30
40
50
60Fr
eque
ncy
Mean = 2003.57Std. Dev. = 2.43N = 292
200820062004200220001998
Figure 1. Histogram of Publication Date Distribution
at UNIV OF OKLAHOMA on May 23, 2014job.sagepub.comDownloaded from

12 JOURNAL OF BUSINESS COMMUNICATION
particular category was present, it received a 1, and if it was not present, it received a 2. There were 87 total variables in the final SPSS file, 82 of which were binary categories coded as described above.
Intercoder reliability analysis was conducted using the Cohen’s kappa statistic. Cohen’s kappa (Cohen, 1960) is designed to measure the reli-ability between two coders; in order to adjust the statistic to accommodate the use of three coders, a modified procedure for obtaining Cohen’s kappa was used. Our procedure for calculating Cohen’s kappa consisted of five steps: (a) calculating the percentage agreement between each of the coders for each coded item (comparing coders 1 and 2, 2 and 3, and 1 and 3 separately), (b) averaging the percentage agreement across the three cod-ers for each coded item in order to arrive at an overall percentage of agree-ment for each item, (c) calculating the average percentage agreement between the three coders for each major category (disaster/crisis types, organization types, communication technologies, BCP strategy elements, and communication theory usage), (d) using the average percentage agreement for each major category in the kappa calculation, and (e) cal-culating an average overall kappa for both the initial and the final inter-coder reliability samples by averaging the obtained kappa values for each major category in order to compare overall reliability between the initial and final samples. The Cohen’s kappa calculation utilized was the follow-ing: = (P(a) P(c))/(1 P(c)), where P(a)= percentage agreement and P(c)= percentage expected chance agreement. Percentage of expected chance agreement was designated at 50% in these calculations.
Thirteen units were coded for the initial intercoder reliability check (see Table 3). The overall kappa value obtained for the initial intercoder reliability was .7459. The kappa for the disaster/crisis types showed a fairly high level of intercoder reliability ( = .8077, range= .7436 to 1.00), as did the kappa values obtained for organization type ( = .8063, r = .6410 to 1.00). A moder-ate level of intercoder reliability was indicated by the kappa statistic obtained for BCP planning elements ( = .7374, r = .6410 to 1.00). Reliability for com-munication theory usage ( = .6924, r = .8462) and communication strategies ( = .6859, r = .6923 to .9487) fell slightly below the desired level of reli-ability ( = .70). Table 3 provides a detailed summary of the Cohen’s kappa calculations for the initial intercoder reliability analysis.
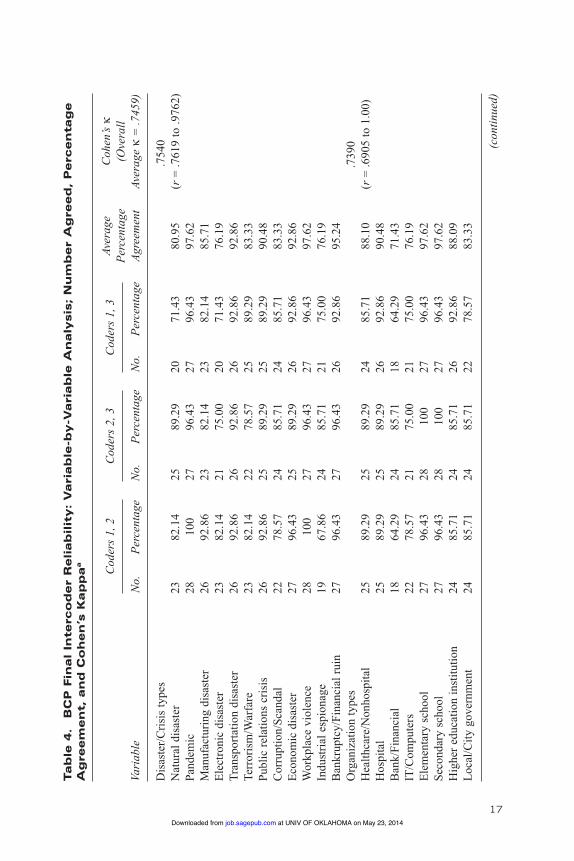
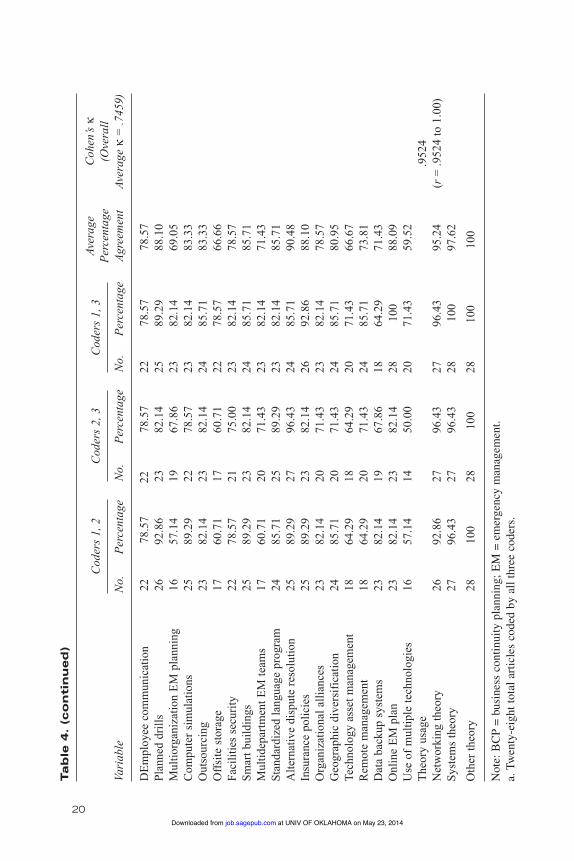
For the final intercoder reliability measure (see Table 4), 28 units from the final sample were coded by all three coders. The 28 articles selected for this procedure were selected randomly using a random number gen-erator. The overall kappa obtained for the final intercoder sample was .7459, reflecting no overall change in the moderate level of intercoder
at UNIV OF OKLAHOMA on May 23, 2014job.sagepub.comDownloaded from

13
Ta
ble
3.
BC
P I
nit
ial
Inte
rco
de
r R
eli
ab
ilit
y:
Va
ria
ble
-by
-Va
ria
ble
An
aly
sis
; N
um
be
r A
gre
ed
, P
erc
en
tag
e
Ag
ree
me
nt,
an
d C
oh
en
’s K
ap
pa
a
Av
erag
e C
ohen
’s
Per
cent
age
(Ove
rall
Vari
able
N
o.
Per
cent
age
No.
P
erce
ntag
e N
o.
Per
cent
age
Agr
eem
ent
Aver
age
= .7
459)
Dis
aste
r/C
risi
s ty
pes
.8
077
Nat
ural
dis
aste
r 12
92
.31
12
92.3
1 13
10
0 94
.87
(r =
.743
6 to
1.0
0)Pa
ndem
ic
12
92.3
1 12
92
.31
13
100
94.8
7 M
anuf
actu
ring
dis
aste
r 11
84
.62
9 69
.23
10
76.9
2 76
.92
Ele
ctro
nic
disa
ster
9
69.2
3 10
76
.92
10
76.9
2 74
.36
Tran
spor
tatio
n di
sast
er
11
84.6
2 10
76
.92
12
92.3
1 84
.62
Terr
oris
m/W
arfa
re
10
76.9
2 12
92
.31
11
84.6
2 84
.62
Publ
ic R
elat
ions
cri
sis
13
100
13
100
13
100
100
Cor
rupt
ion/
Scan
dal
12
92.3
1 13
10
0 12
92
.31
94.8
7 E
cono
mic
dis
aste
r 13
10
0 12
92
.31
12
92.3
1 94
.87
Wor
kpla
ce v
iole
nce
12
92.3
1 12
92
.31
13
100
94.8
7 In
dust
rial
esp
iona
ge
12
92.3
1 13
10
0 12
92
.31
94.8
7 B
ankr
uptc
y/Fi
nanc
ial r
uin
12
92.3
1 13
10
0 12
92
.31
94.8
7 O
rgan
izat
ion
type
s
.806
3 H
ealth
car
e/N
onho
spita
l 13
10
0 13
10
0 13
10
0 10
0 (r
= .6
410
to 1
.00)
Hos
pita
l 13
10
0 13
10
0 13
10
0 10
0 B
ank/
Fina
ncia
l 11
84
.62
10
76.9
2 10
76
.92
79.4
9 IT
/Com
pute
rs
8 61
.54
10
76.9
2 7
53.8
5 64
.10
Ele
men
tary
sch
ool
12
92.3
1 13
10
0 12
92
.31
94.8
7 Se
cond
ary
scho
ol
12
92.3
1 13
10
0 12
92
.31
94.8
7 H
ighe
r ed
ucat
ion
inst
itutio
n 12
92
.31
12
92.3
1 13
10
0 94
.87
(con
tinue
d)
Cod
ers
1, 3
Cod
ers
1, 2
Cod
ers
2, 3
at UNIV OF OKLAHOMA on May 23, 2014job.sagepub.comDownloaded from

14
Cod
ers
1, 2
Ta
ble
3.
(co
nti
nu
ed
)
Av
erag
e C
ohen
’s
Per
cent
age
(Ove
rall
Vari
able
N
o.
Per
cent
age
No.
P
erce
ntag
e N
o.
Per
cent
age
Agr
eem
ent
Aver
age
= .7
459)
Loc
al/C
ity g
over
nmen
t 12
92
.31
11
84.6
2 12
92
.31
89.7
5 C
ount
y go
vern
men
t 13
10
0 12
92
.31
12
92.3
1 94
.87
Stat
e go
vern
men
t 11
84
.62
10
76.9
2 10
76
.92
79.4
9 Fe
dera
l gov
ernm
ent
10
76.9
2 13
10
0 10
76
.92
84.6
1 A
viat
ion
indu
stry
12
92
.31
13
100
12
92.3
1 94
.87
NA
SA/ S
pace
indu
stry
13
10
0 13
10
0 13
10
0 10
0 M
anuf
actu
ring
indu
stry
11
84
.62
10
76.9
2 10
76
.92
79.4
9 R
eal e
stat
e 11
84
.62
12
92.3
1 12
92
.31
89.7
5 H
ospi
talit
ies
13
100
13
100
13
100
100
Non
com
pute
r se
curi
ty
12
92.3
1 10
76
.92
11
84.6
2 84
.62
Food
ser
vice
s 13
10
0 12
92
.31
12
92.3
1 94
.87
Ret
ail i
ndus
try
11
84.6
2 10
76
.92
10
76.9
2 79
.49
Inte
rnat
iona
l org
aniz
atio
n 8
61.5
4 9
69.2
3 12
92
.31
74.3
6 In
tern
atio
nal g
over
nmen
t 13
10
0 13
10
0 13
10
0 10
0 In
sura
nce
indu
stry
13
10
0 11
84
.62
11
84.6
2 89
.75
Tele
mar
ketin
g/C
all c
ente
r 12
92
.31
13
100
12
92.3
1 94
.87
Com
mun
ity/N
ongo
vern
men
t 12
92
.31
13
100
12
92.3
1 94
.87
Tran
spor
tatio
n in
dust
ry
12
92.3
1 13
10
0 12
92
.31
94.8
7 E
nerg
y in
dust
ry
12
92.3
1 13
10
0 12
92
.31
94.8
7 E
ngin
eeri
ng/C
onst
ruct
ion
12
92.3
1 13
10
0 12
92
.31
94.8
7 C
omm
unic
atio
n st
rate
gies
.685
9Fa
ce-t
o-Fa
ce
12
92.3
1 9
69.2
3 10
76
.92
79.4
9 (r
= .6
923
to .9
487)
(con
tinue
d)
Cod
ers
1, 3
Cod
ers
2, 3
at UNIV OF OKLAHOMA on May 23, 2014job.sagepub.comDownloaded from

15
Cod
ers
1, 2
Ta
ble
3.
(co
nti
nu
ed
)
Av
erag
e C
ohen
’s
Per
cent
age
(Ove
rall
Vari
able
N
o.
Per
cent
age
No.
P
erce
ntag
e N
o.
Per
cent
age
Agr
eem
ent
Aver
age
= .7
459)
Loc
al/C
ity g
over
nmen
t 12
92
.31
11
84.6
2 12
92
.31
89.7
5 C
ount
y go
vern
men
t 13
10
0 12
92
.31
12
92.3
1 94
.87
Stat
e go
vern
men
t 11
84
.62
10
76.9
2 10
76
.92
79.4
9 Fe
dera
l gov
ernm
ent
10
76.9
2 13
10
0 10
76
.92
84.6
1 A
viat
ion
indu
stry
12
92
.31
13
100
12
92.3
1 94
.87
NA
SA/ S
pace
indu
stry
13
10
0 13
10
0 13
10
0 10
0 M
anuf
actu
ring
indu
stry
11
84
.62
10
76.9
2 10
76
.92
79.4
9 R
eal e
stat
e 11
84
.62
12
92.3
1 12
92
.31
89.7
5 H
ospi
talit
ies
13
100
13
100
13
100
100
Non
com
pute
r se
curi
ty
12
92.3
1 10
76
.92
11
84.6
2 84
.62
Food
ser
vice
s 13
10
0 12
92
.31
12
92.3
1 94
.87
Ret
ail i
ndus
try
11
84.6
2 10
76
.92
10
76.9
2 79
.49
Inte
rnat
iona
l org
aniz
atio
n 8
61.5
4 9
69.2
3 12
92
.31
74.3
6 In
tern
atio
nal g
over
nmen
t 13
10
0 13
10
0 13
10
0 10
0 In
sura
nce
indu
stry
13
10
0 11
84
.62
11
84.6
2 89
.75
Tele
mar
ketin
g/C
all c
ente
r 12
92
.31
13
100
12
92.3
1 94
.87
Com
mun
ity/N
ongo
vern
men
t 12
92
.31
13
100
12
92.3
1 94
.87
Tran
spor
tatio
n in
dust
ry
12
92.3
1 13
10
0 12
92
.31
94.8
7 E
nerg
y in
dust
ry
12
92.3
1 13
10
0 12
92
.31
94.8
7 E
ngin
eeri
ng/C
onst
ruct
ion
12
92.3
1 13
10
0 12
92
.31
94.8
7 C
omm
unic
atio
n st
rate
gies
.685
9Fa
ce-t
o-Fa
ce
12
92.3
1 9
69.2
3 10
76
.92
79.4
9 (r
= .6
923
to .9
487)
(con
tinue
d)
Cod
ers
1, 3
Cod
ers
2, 3
Cod
ers
1, 2
Ta
ble
3.
(co
nti
nu
ed
)
Av
erag
e C
ohen
’s
Per
cent
age
(Ove
rall
Vari
able
N
o.
Per
cent
age
No.
P
erce
ntag
e N
o.
Per
cent
age
Agr
eem
ent
Aver
age
= .7
459)
e-M
ail
12
92.3
1 10
76
.92
11
84.6
2 84
.62
Gro
ups/
Mee
tings
11
84
.62
11
84.6
2 11
84
.62
84.6
2 D
atab
ase
man
agem
ent s
yste
ms
8 61
.54
10
76.9
2 9
69.2
3 69
.23
Fax
11
84.6
2 12
92
.31
12
92.3
1 89
.75
BC
P so
ftw
are
12
92.3
1 9
69.2
3 8
61.5
4 74
.36
Wri
tten
com
mun
icat
ion
11
84.6
2 12
92
.31
10
76.9
2 84
.62
Phon
e 11
84
.62
10
76.9
2 10
76
.92
79.4
9 Te
leco
nfer
enci
ng
9 69
.23
8 61
.54
10
76.9
2 69
.23
Tele
wor
king
N
/A
N/A
N
/A
N/A
N
/A
N/A
N
/A
Rad
io
13
100
12
92.3
1 12
92
.31
94.8
7 In
tern
et
9 69
.23
9 69
.23
9 69
.23
69.2
3 M
edia
/TV
12
92
.31
12
92.3
1 13
10
0 94
.87
Wir
eles
s 11
84
.62
13
100
11
84.6
2 89
.75
GPS
/Sat
ellit
e sy
stem
s 12
92
.31
13
100
12
92.3
1 94
.87
Ent
erpr
ise
com
mun
icat
ion
syst
ems
12
92.3
1 13
10
0 12
92
.31
94.8
7 R
edun
dant
com
mun
icat
ion
syst
ems
12
92.3
1 13
10
0 12
92
.31
94.8
7 B
CP
plan
ning
ele
men
ts
.7
374
Wri
tten
EM
pla
n 10
76
.92
12
92.3
1 9
69.2
3 79
.49
(r =
.641
0 to
1.0
0)E
mpl
oyee
trai
ning
11
84
.62
8 61
.54
10
76.9
2 74
.36
EM
pla
n re
dund
ancy
9
69.2
3 9
69.2
3 11
84
.62
74.3
6 E
M p
lan
fund
ing
8 61
.54
10
76.9
2 7
53.8
5 64
.10
Rea
dine
ss a
sses
smen
t 11
84
.62
10
76.9
2 12
92
.31
84.6
2
(con
tinue
d)
Cod
ers
1, 3
Cod
ers
2, 3
at UNIV OF OKLAHOMA on May 23, 2014job.sagepub.comDownloaded from

16
Cod
ers
1, 2
Ta
ble
3.
(co
nti
nu
ed
)
Av
erag
e C
ohen
’s
Per
cent
age
(Ove
rall
Vari
able
N
o.
Per
cent
age
No.
P
erce
ntag
e N
o.
Per
cent
age
Agr
eem
ent
Aver
age
= .7
459)
Net
wor
k w
ith o
ther
org
aniz
atio
ns
11
84.6
2 10
76
.92
10
76.9
2 79
.49
Em
ploy
ee c
omm
unic
atio
n 10
76
.92
10
76.9
2 11
84
.62
79.4
9 Pl
anne
d dr
ills
12
92.3
1 10
76
.92
11
84.6
2 84
.62
Mul
tiorg
aniz
atio
n E
M p
lann
ing
9 69
.23
9 69
.23
9 69
.23
69.2
3 C
ompu
ter
sim
ulat
ions
13
10
0 12
92
.31
12
92.3
1 94
.87
Out
sour
cing
12
92
.31
10
76.9
2 9
69.2
3 79
.49
Off
site
sto
rage
12
92
.31
7 53
.85
8 61
.54
69.2
3 Fa
cilit
ies
secu
rity
12
92
.31
13
100
12
92.3
1 94
.87
Smar
t bui
ldin
gs
12
92.3
1 13
10
0 12
92
.31
94.8
7 M
ultid
epar
tmen
t EM
team
s 12
92
.31
13
100
12
92.3
1 94
.87
Stan
dard
ized
lang
uage
pro
gram
13
10
0 13
10
0 13
10
0 10
0 A
ltern
ativ
e di
sput
e re
solu
tion
13
100
13
100
13
100
100
Insu
ranc
e po
licie
s 12
92
.31
13
100
12
92.3
1 94
.87
Org
aniz
atio
nal a
llian
ces
12
92.3
1 13
10
0 12
92
.31
94.8
7 G
eogr
aphi
c di
vers
ific
atio
n 11
84
.62
13
100
11
84.6
2 89
.75
Tech
nolo
gy a
sset
man
agem
ent
12
92.3
1 13
10
0 12
92
.31
94.8
7 R
emot
e m
anag
emen
t 12
92
.31
13
100
12
92.3
1 94
.87
Dat
a ba
ckup
sys
tem
s 12
92
.31
13
100
12
92.3
1 94
.87
Onl
ine
EM
pla
n 12
92
.31
13
100
12
92.3
1 94
.87
Use
of
mul
tiple
tech
nolo
gies
12
92
.31
13
100
12
92.3
1 94
.87
The
ory
usag
e
.692
4N
etw
orki
ng th
eory
10
76
.92
11
84.6
2 12
92
.31
84.6
2 (r
= .8
462)
Syst
ems
theo
ry
12
92.3
1 10
76
.92
11
84.6
2 84
.62
Not
e: B
CP
= bu
sine
ss c
ontin
uity
pla
nnin
g; E
M =
em
erge
ncy
man
agem
ent.
a. T
hirt
een
tota
l art
icle
s co
ded
by a
ll th
ree
code
rs.
Cod
ers
1, 3
Cod
ers
2, 3
at UNIV OF OKLAHOMA on May 23, 2014job.sagepub.comDownloaded from
17
Ta
ble
4.
BC
P F
ina
l In
terc
od
er
Re
lia
bil
ity
: V
ari
ab
le-b
y-V
ari
ab
le A
na
lysis
; N
um
be
r A
gre
ed
, P
erc
en
tag
e
Ag
ree
me
nt,
an
d C
oh
en
’s K
ap
pa
a
Av
erag
e C
ohen
’s
Per
cent
age
(Ove
rall
Vari
able
N
o.
Per
cent
age
No.
P
erce
ntag
e N
o.
Per
cent
age
Agr
eem
ent
Aver
age
= .7
459)
Dis
aste
r/C
risi
s ty
pes
.7
540
Nat
ural
dis
aste
r 23
82
.14
25
89.2
9 20
71
.43
80.9
5 (r
= .7
619
to .9
762)
Pand
emic
28
10
0 27
96
.43
27
96.4
3 97
.62
Man
ufac
turi
ng d
isas
ter
26
92.8
6 23
82
.14
23
82.1
4 85
.71
Ele
ctro
nic
disa
ster
23
82
.14
21
75.0
0 20
71
.43
76.1
9 Tr
ansp
orta
tion
disa
ster
26
92
.86
26
92.8
6 26
92
.86
92.8
6 Te
rror
ism
/War
fare
23
82
.14
22
78.5
7 25
89
.29
83.3
3 Pu
blic
rel
atio
ns c
risi
s 26
92
.86
25
89.2
9 25
89
.29
90.4
8 C
orru
ptio
n/Sc
anda
l 22
78
.57
24
85.7
1 24
85
.71
83.3
3 E
cono
mic
dis
aste
r 27
96
.43
25
89.2
9 26
92
.86
92.8
6 W
orkp
lace
vio
lenc
e 28
10
0 27
96
.43
27
96.4
3 97
.62
Indu
stri
al e
spio
nage
19
67
.86
24
85.7
1 21
75
.00
76.1
9 B
ankr
uptc
y/Fi
nanc
ial r
uin
27
96.4
3 27
96
.43
26
92.8
6 95
.24
Org
aniz
atio
n ty
pes
.7
390
Hea
lthca
re/N
onho
spita
l 25
89
.29
25
89.2
9 24
85
.71
88.1
0 (r
= .6
905
to 1
.00)
Hos
pita
l 25
89
.29
25
89.2
9 26
92
.86
90.4
8 B
ank/
Fina
ncia
l 18
64
.29
24
85.7
1 18
64
.29
71.4
3 IT
/Com
pute
rs
22
78.5
7 21
75
.00
21
75.0
0 76
.19
Ele
men
tary
sch
ool
27
96.4
3 28
10
0 27
96
.43
97.6
2 Se
cond
ary
scho
ol
27
96.4
3 28
10
0 27
96
.43
97.6
2 H
ighe
r ed
ucat
ion
inst
itutio
n 24
85
.71
24
85.7
1 26
92
.86
88.0
9 L
ocal
/City
gov
ernm
ent
24
85.7
1 24
85
.71
22
78.5
7 83
.33
(con
tinue
d)
Cod
ers
1, 3
Cod
ers
1, 2
Cod
ers
2, 3
at UNIV OF OKLAHOMA on May 23, 2014job.sagepub.comDownloaded from

18
Cod
ers
1, 2
Ta
ble
4.
(co
nti
nu
ed
)
Av
erag
e C
ohen
’s
Per
cent
age
(Ove
rall
Vari
able
N
o.
Per
cent
age
No.
P
erce
ntag
e N
o.
Per
cent
age
Agr
eem
ent
Aver
age
= .7
459)
Cou
nty
gove
rnm
ent
22
78.5
7 23
82
.14
25
89.2
9 83
.33
Stat
e go
vern
men
t 24
85
.71
23
82.1
4 23
82
.14
83.3
3 Fe
dera
l gov
ernm
ent
15
53.5
7 24
85
.71
19
67.8
6 69
.05
Avi
atio
n in
dust
ry
27
96.4
3 27
96
.43
26
92.8
6 95
.24
NA
SA/S
pace
indu
stry
28
10
0 28
10
0 28
10
0 10
0 M
anuf
actu
ring
indu
stry
25
89
.29
26
92.8
6 25
89
.29
90.4
8 R
eal e
stat
e 28
10
0 26
92
.86
26
92.8
6 95
.24
Hos
pita
litie
s 26
92
.86
26
92.8
6 28
10
0 95
.24
Non
com
pute
r se
curi
ty
20
71.4
3 23
82
.14
23
82.1
4 78
.57
Food
ser
vice
s 27
96
.43
28
100
27
96.4
3 97
.62
Ret
ail i
ndus
try
23
82.1
4 22
78
.57
25
89.2
9 83
.33
Inte
rnat
iona
l org
aniz
atio
n 20
71
.43
21
75.0
0 19
67
.86
71.4
3 In
tern
atio
nal g
over
nmen
t 19
67
.86
21
75.0
0 22
78
.57
73.8
1 In
sura
nce
indu
stry
25
89
.29
26
92.8
6 27
96
.43
92.8
6 Te
lem
arke
ting/
Cal
l cen
ter
25
89.2
9 26
92
.86
27
96.4
3 92
.86
Com
mun
ity/N
ongo
vern
men
t 17
60
.71
17
60.7
1 28
10
0 73
.81
Tran
spor
tatio
n in
dust
ry
25
89.2
9 25
89
.29
28
100
92.8
6 E
nerg
y in
dust
ry
25
89.2
9 25
89
.29
26
92.8
6 90
.48
Eng
inee
ring
/Con
stru
ctio
n 26
92
.86
26
92.8
6 28
10
0 95
.24
Com
mun
icat
ion
stra
tegi
es
.7
395
Face
-to-
Face
24
85
.71
23
82.1
4 27
96
.43
88.0
9 (r
= .6
429
to 1
.00)
e-M
ail
19
67.8
6 20
71
.43
27
96.4
3 78
.57
Gro
ups/
Mee
tings
23
82
.14
23
82.1
4 24
85
.71
83.3
3
(con
tinue
d)
Cod
ers
1, 3
Cod
ers
2, 3
at UNIV OF OKLAHOMA on May 23, 2014job.sagepub.comDownloaded from

19
Cod
ers
1, 2
Ta
ble
4.
(co
nti
nu
ed
)
Av
erag
e C
ohen
’s
Per
cent
age
(Ove
rall
Vari
able
N
o.
Per
cent
age
No.
P
erce
ntag
e N
o.
Per
cent
age
Agr
eem
ent
Aver
age
= .7
459)
Dat
abas
e m
anag
emen
t sys
tem
s 14
50
.00
25
89.2
9 15
53
.57
64.2
9 Fa
x 27
96
.43
28
100
27
96.4
3 97
.62
BC
P so
ftw
are
26
92.8
6 22
78
.57
24
85.7
1 85
.71
Wri
tten
com
mun
icat
ion
20
71.4
3 20
71
.43
26
92.8
6 78
.57
Phon
e 22
78
.57
23
82.1
4 27
96
.43
85.7
1 Te
leco
nfer
enci
ng
27
96.4
3 27
96
.43
26
92.8
6 95
.24
Tele
wor
king
27
96
.43
26
92.8
6 27
96
.43
95.2
4 R
adio
28
10
0 28
10
0 28
10
0 10
0 In
tern
et
19
67.8
6 22
78
.57
23
82.1
4 76
.19
Med
ia/T
V
23
82.1
4 24
85
.71
25
89.2
9 85
.71
Wir
eles
s 24
85
.71
25
89.2
9 25
89
.29
88.1
0 G
PS/S
atel
lite
syst
ems
27
96.4
3 28
10
0 27
96
.43
97.6
2 E
nter
pris
e co
mm
unic
atio
n sy
stem
s 27
96
.43
27
96.4
3 28
10
0 97
.62
Red
unda
nt c
omm
unic
atio
n sy
stem
s 22
78
.57
23
82.1
4 23
82
.14
80.9
5 B
CP
plan
ning
ele
men
ts
.5
448
Wri
tten
EM
pla
n 20
71
.43
17
60.7
1 23
82
.14
71.4
3 (r
= .5
952
to .9
048)
Em
ploy
ee tr
aini
ng
26
92.8
6 21
75
.00
21
75.0
0 80
.95
EM
pla
n re
dund
ancy
18
64
.29
20
71.4
3 26
92
.86
76.1
9 E
M p
lan
fund
ing
17
60.7
1 23
82
.14
18
64.2
9 69
.05
Rea
dine
ss a
sses
smen
t 16
57
.14
19
67.8
6 19
67
.86
64.2
9
Net
wor
k w
ith o
ther
org
aniz
atio
ns
21
75.0
0 24
85
.71
23
82.1
4 80
.95
(con
tinue
d)
Cod
ers
1, 3
Cod
ers
2, 3
at UNIV OF OKLAHOMA on May 23, 2014job.sagepub.comDownloaded from
20
Cod
ers
1, 2
Ta
ble
4.
(co
nti
nu
ed
)
Av
erag
e C
ohen
’s
Per
cent
age
(Ove
rall
Vari
able
N
o.
Per
cent
age
No.
P
erce
ntag
e N
o.
Per
cent
age
Agr
eem
ent
Aver
age
= .7
459)
DE
mpl
oyee
com
mun
icat
ion
22
78.5
7 22
78
.57
22
78.5
7 78
.57
Plan
ned
drill
s 26
92
.86
23
82.1
4 25
89
.29
88.1
0 M
ultio
rgan
izat
ion
EM
pla
nnin
g 16
57
.14
19
67.8
6 23
82
.14
69.0
5 C
ompu
ter
sim
ulat
ions
25
89
.29
22
78.5
7 23
82
.14
83.3
3 O
utso
urci
ng
23
82.1
4 23
82
.14
24
85.7
1 83
.33
Off
site
sto
rage
17
60
.71
17
60.7
1 22
78
.57
66.6
6 Fa
cilit
ies
secu
rity
22
78
.57
21
75.0
0 23
82
.14
78.5
7 Sm
art b
uild
ings
25
89
.29
23
82.1
4 24
85
.71
85.7
1 M
ultid
epar
tmen
t EM
team
s 17
60
.71
20
71.4
3 23
82
.14
71.4
3 St
anda
rdiz
ed la
ngua
ge p
rogr
am
24
85.7
1 25
89
.29
23
82.1
4 85
.71
Alte
rnat
ive
disp
ute
reso
lutio
n 25
89
.29
27
96.4
3 24
85
.71
90.4
8 In
sura
nce
polic
ies
25
89.2
9 23
82
.14
26
92.8
6 88
.10
Org
aniz
atio
nal a
llian
ces
23
82.1
4 20
71
.43
23
82.1
4 78
.57
Geo
grap
hic
dive
rsif
icat
ion
24
85.7
1 20
71
.43
24
85.7
1 80
.95
Tech
nolo
gy a
sset
man
agem
ent
18
64.2
9 18
64
.29
20
71.4
3 66
.67
Rem
ote
man
agem
ent
18
64.2
9 20
71
.43
24
85.7
1 73
.81
Dat
a ba
ckup
sys
tem
s 23
82
.14
19
67.8
6 18
64
.29
71.4
3 O
nlin
e E
M p
lan
23
82.1
4 23
82
.14
28
100
88.0
9 U
se o
f m
ultip
le te
chno
logi
es
16
57.1
4 14
50
.00
20
71.4
3 59
.52
The
ory
usag
e
.952
4 N
etw
orki
ng th
eory
26
92
.86
27
96.4
3 27
96
.43
95.2
4 (r
= .9
524
to 1
.00)
Syst
ems
theo
ry
27
96.4
3 27
96
.43
28
100
97.6
2
Oth
er th
eory
28
10
0 28
10
0 28
10
0 10
0
Not
e: B
CP
= bu
sine
ss c
ontin
uity
pla
nnin
g; E
M =
em
erge
ncy
man
agem
ent.
a. T
wen
ty-e
ight
tota
l art
icle
s co
ded
by a
ll th
ree
code
rs.
Cod
ers
1, 3
Cod
ers
2, 3
at UNIV OF OKLAHOMA on May 23, 2014job.sagepub.comDownloaded from

Adkins et al. / CONTENT ANALYSIS OF BUSINESS 21
reliability between the initial and final reliability checks. Communication theory usage demonstrated the highest level of reliability in the final sample ( = .9524, r = .9524 to 1.00), with disaster/crisis type ( = .7540, r = .7619 to .9762), communication strategies ( = .7395, r = .6429 to 1.00), and organization types ( = .7390, r = .7390 to 1.00) demonstrating a moderate level of intercoder reliability. The only major category to fall below our desired threshold of .70 in the final reliability sample was BCP planning elements ( = .5448, r = .5952 to .9048). Table 4 provides a complete summarization of the final intercoder reliability analysis.
RESULTS
Our final sample size was N = 292. This number includes the 28 articles we chose for intercoder reliability testing; the coding of the sample therefore resulted in the generation of 348 total code sheets. Articles that were coded by all three coders for the final reliability analysis were combined (by unit num-ber) into a single line of code in which the designated presence of a variable by any one of the coders was coded as being present, thereby giving the ben-efit of the doubt that the variable was actually present in that particular unit.
Although one of our major categories fell below our desired reliability threshold, we felt that the overall numbers obtained and the reliability num-bers of the other major categories indicated that, as a whole, the coders were coding in a reliable fashion. Additionally, our choice to use the more stringent 50% chance agreement expectation from the original kappa statistic calcula-tion formula (which is the designated threshold for comparing reliability between two coders) in the calculations of the reliability statistic created addi-tional weighting against the reliability levels in this study; the three-coder format utilized for this study should arguably have been calculated using a 33.33% of expected chance agreement. We believe that the level of intercoder reliability obtained between the three coders indicates that the coders were coding in a similar fashion and that the results generated in this study are generally reliable.
Our first research question concerns what types of events BCP should be utilized for according to the literature examined. As can be seen in Table 5, the data show that 31.8% of the cases refer to natural disasters (n = 93), 11.3% are pandemic/employee health (n = 33), 7.2 % are manufacturing disasters (n = 21), 41.8% are electronic disasters (n = 122), 3.8% are transportation disasters (n = 11), 34.6% are terrorism/warfare (n = 101), 7.2% are public relations crises (n = 21), 6.8% are corruption/scandal (n = 20), 7.2% are
at UNIV OF OKLAHOMA on May 23, 2014job.sagepub.comDownloaded from

22 JOURNAL OF BUSINESS COMMUNICATION
economic disasters (n = 21), 4.1% are workplace violence (n = 12), 14.0% are industrial espionage (n = 41), and 9.6% are financial ruin/bankruptcy (n = 28). Clearly, three types of events dominate the BCP literature: natural disasters, electronic disasters, and terrorism/warfare events. It is startling how little attention the other types of events are receiving.
In our second research question, we asked what types of organizations are represented in the BCP literature. As we can see in Table 6, three types of organizations dominate the literature: banking/financial, IT/computer systems, and federal government. The banking and IT organizations are each represented in over 35% of the literature coded, while the federal government is represented in over 25% of the sample.
Our third research question inquires as to what types of communication technologies are discussed in the BCP literature. We found that Internet and Web site communication is a dominant technology (represented in over 22% of the sample), followed closely by database management sys-tems. The use of phones and cellular phones seems to dominate the type of communication channel relied on in BCP (represented in 13.4% of the sample). Table 7 provides a summary of the results of our findings con-cerning the use of communication technology in BCP.
The fourth research question we asked in this study concerns what strategic elements of BCP are discussed in the literature. Table 8 provides a listing of these elements and our findings concerning this research ques-tion. What we cannot know from this study (partially as a result of the
Table 5. Types of Event BCP Is Utilized For
Event Type Frequency Percentage of Units Represented In
Natural disaster 93 31.8Pandemic/Employee health 33 11.3Manufacturing disaster event 21 7.2Electronic disaster 122 41.8Transportation disaster 11 3.8Terrorism/Warfare 101 34.6Public Relations crisis 21 7.2Corruption/Scandal 20 6.8Economic Disaster/ 21 7.2 Market collapse Workplace violence 12 4.1Industrial espionage 41 14.0Financial ruin/bankruptcy 28 9.6
Note: BCP = business continuity planning.
at UNIV OF OKLAHOMA on May 23, 2014job.sagepub.comDownloaded from

Adkins et al. / CONTENT ANALYSIS OF BUSINESS 23
limitation of the coding procedure used) is to what extent these elements are ideal strategies versus practically applied tools. Based on the literature we have read so far, most of these strategic elements seem to be directed in the context of what should be done but are not utilized to their full potential in actual BCP practice. The exception to this seems to be an agreement on the importance of written EM plans (represented in over 40% of the sample literature), technology asset management strategies (represented in over 40%), and threat assessment/readiness programs (36.6% of the sampled units mentioned this) as practical tools; but the widespread usage of even these strategic elements is questionable.
Table 6. Types of Organizations BCP Is Utilized For
Organization Type Frequency Percentage of Units Represented In
Health care/Nonhospital 21 7.2Hospital 15 5.1Bank/Financial 107 36.6IT/Computer systems 172 58.9Elementary school 6 2.1Secondary school 4 1.4Higher education institution 14 4.8Local city government 24 8.2County government 25 8.6State government 30 10.3Federal/National government 79 27.1Aviation industry 15 5.1NASA/Space industry 4 1.4Manufacturing industry 28 9.6Real estate 8 2.7Hospitalities services 11 3.8Noncomputer security systems 33 11.3Food services 10 3.4Retail 22 7.5International organization 44 15.1International government 28 9.6Insurance 38 13.0Telemarketing 14 4.8Community/Nongovernment 32 11.0Transportation 14 4.8Energy 12 4.1Engineering/Construction 8 2.7
Note: BCP = business continuity planning.
at UNIV OF OKLAHOMA on May 23, 2014job.sagepub.comDownloaded from

24 JOURNAL OF BUSINESS COMMUNICATION
Table 7. Types of Communication Strategies Utilized in BCP
Communication Strategy Frequency Percentage of Units Represented In
Face-to-face communication 14 4.8e-Mail 30 10.3Meetings/Group communication 28 9.6Database Management systems 59 20.2Fax 2 .7BCP software programs 48 16.4Written communication 20 6.8Phone/Cell phone 39 13.4Teleconferencing 10 3.4Teleworking/Telecommuting 27 9.2Radio 5 1.7Internet/Web site 66 22.6Media/Television 15 5.1Wireless 29 9.9GPS/Satellite 4 1.4Enterprise communication systems 6 2.1Redundant communication systems 23 7.9
Note: BCP = business continuity planning.
The fifth research question asks what communication theories are dis-cussed in the BCP literature. The findings for this question are both depressing and potentially exciting for communication scholars. On the downside, we have found that any mention of communication theory only occurs in 6.16% of the literature coded. Table 9 provides a summary of the representation of communication theory found in the sample of BCP literature coded in this research project. Based on this, it would seem that the work of communica-tion scholars is largely lacking in practical application to BCP strategies. Investigation in this area could prove to be a fruitful ground both for theo-retical development and as new territory for practical applications of com-munication scholarship. The lack of communication theory in the literature indicates a potential lack of understanding as to how communication can influence BCP effectiveness and/or the ways in which communication schol-arship can contribute to enhanced models for BCP practitioners to utilize. This is a potential area of opportunity for theoretical applications that communica-tion scholars need to more fully explore.
The sixth and final research question inquires as to the similarities and differences in the literature discussion of BCP between academics, trade organizations, the media, and government/legal organizations. In order to
at UNIV OF OKLAHOMA on May 23, 2014job.sagepub.comDownloaded from

Adkins et al. / CONTENT ANALYSIS OF BUSINESS 25
examine this issue, cross-tabulations were run between the types of literature and each of the variables coded for. The results of these cross-tabulations can be seen in Tables 10 to 14. The cross-tabulation data were then analyzed for patterns indicating issues of significant interest
Table 8. Elements of BCP Planning
Element of BCP Plan Frequency Percentage of Total
Written EM plan 125 42.8Regular training 66 22.6EM plan redundancy 39 13.4EM plan funding 60 20.5Ongoing threat/Readiness assessment 107 36.6Communication with networked organizations 83 28.4Communication with employees 79 27.1Planned drills 48 16.4Multiorganizational EM planning 43 14.7Simulations/Modeling 51 17.5Outsourcing 76 26.0Offsite storage 69 23.6Facilities security 39 13.4Smart buildings 19 6.5Multi-department EM teams 58 19.9Standardized language programs 16 5.5Alternate dispute resolution 8 2.7Insurance policies 54 18.5Organizational alliances 36 12.3Geographic diversification 78 26.7Technology asset management 121 41.4Remote management 32 11.0Data backups 92 31.5Online EM plan 12 4.1Use of multiple technologies 70 24.0
Note: BCP = business continuity planning; EM = emergency management.
Table 9. Use of Communication Theory in BCP Literature
Communication Theory Frequency Percentage of Units Represented In
Networking theory 7 2.4Systems theory 4 1.4
Other communication theory 7 2.4
Note: BCP = business continuity planning.
at UNIV OF OKLAHOMA on May 23, 2014job.sagepub.comDownloaded from

26 JOURNAL OF BUSINESS COMMUNICATION
(represented in at least 25% of a given body of literature), both in the individual bodies of literature and across the bodies of literature. A final analysis of the cross-tabulation data looked for indications of significant similarities and differences ( 10% disparity for similarity, 10% disparity for difference) in the conversations about BCP issues occurring between the various bodies of literature.
Regarding the relationship between the types of disaster/crises that are mentioned in the BCP literature and the types of publications that are repre-sented, it is interesting to first note that three disaster types dominate the lit-erature across all three categories: natural disasters (academic [A] = 47.83%, government/legal [G] = 27.03%, media [M] = 25.68%, trade [T] = 28%), electronic disasters (A = 55.07%, G = 43.24%, M = 39.19%, T = 30.67%), and terrorism/warfare (A = 40.58%, G = 36.49%, M = 31.08%, T = 30.67%). Table 10 provides a summary of the findings concerning the types of disas-ters/crises found in each body of literature. We believe that the dominance of these disaster types across all of the bodies of literature in these areas is explained by the salience (Kelly & Peckham, 2002) created for these disaster types as a result of the Y2K bug, Hurricane Katrina, and the 9/11 terrorist attacks.
Another pattern evident in the analysis of disaster types is that with the exception of trade publications (in which both electronic disasters and terror-ism/warfare are equally represented), electronic disasters are mentioned in a higher percentage of each body of literature than are the other two dominant categories. We believe that this is interesting because it could indicate that the groups represented via these bodies of literature are more likely to focus on disasters that can be potentially averted by taking action within the system (i.e., computer systems can be updated to be Y2K compliant, thereby averting the disaster) than those disasters that are perceived to be inflicted on and unavoidable by the affected systems (i.e., natural disasters and terrorist attacks are generated by forces outside of the victimized system).
An analysis of the disparities between the bodies of literature in terms of disaster type demonstrates that academics are having a conversation in their literature that is different from that of the other groups. While all of the litera-ture emphasizes natural disasters and electronic disasters, these issues are represented in a much higher percentage (over 10% more) of the academic literature than in the literature of the other groups. Additionally, the academic literature (A = 24.64%) discusses industrial espionage much more frequently than the other groups (G = 5.41%, M = 12.16%, T = 14.67%). Finally, we see another disparity between the conversations of academic (14.49%) and gov-ernment/legal (16.22%) publications versus those of media (5.41%) and trade
at UNIV OF OKLAHOMA on May 23, 2014job.sagepub.comDownloaded from

27
Ta
ble
10.
Cro
ss-T
ab
ula
tio
ns o
f L
ite
ratu
re T
yp
e a
nd
BC
P D
isa
ste
r/C
risis
Ty
pe
s
Dis
aste
r Ty
pe
No.
Yes
P
erce
ntag
e Ye
s N
o. Y
es
Per
cent
age
Yes
No.
Yes
P
erce
ntag
e Ye
s N
o. Y
es
Per
cent
age
Yes
Nat
ural
dis
aste
r 33
47
.83
20
27.0
3 19
25
.68
21
28Pa
ndem
ic/E
mpl
oyee
hea
lth
11
15.9
4 9
12.1
6 7
9.46
6
8M
anuf
actu
ring
dis
aste
r ev
ent
7 10
.14
8 10
.81
3 4.
05
3 4
Ele
ctro
nic
disa
ster
38
55
.07
32
43.2
4 29
39
.19
23
30.6
7Tr
ansp
orta
tion
disa
ster
4
5.80
5
6.76
0
0 2
2.67
Terr
oris
m/W
arfa
re
28
40.5
8 27
36
.49
23
31.0
8 23
30
.67
Publ
ic r
elat
ions
cri
sis
8 11
.59
6 8.
11
4 5.
41
3 4
Cor
rupt
ion/
Scan
dal
4 5.
80
6 8.
11
4 5.
41
6 8
Eco
nom
ic d
isas
ter/
Mar
ket
3 4.
35
11
14.8
6 4
5.41
3
4
colla
pse
Wor
kpla
ce v
iole
nce
4 5.
80
5 6.
76
2 2.
70
1 1.
33In
dust
rial
esp
iona
ge
17
24.6
4 4
5.41
9
12.1
6 11
14
.67
Fina
ncia
l rui
n/ba
nkru
ptcy
10
14
.49
12
16.2
2 4
5.41
2
2.67
Not
e: B
CP
= bu
sine
ss c
ontin
uity
pla
nnin
g.
Med
ia A
rtic
leTr
ade
Pub
licat
ion
Aca
dem
ic L
itera
ture
Gov
ernm
ent/L
egal
at UNIV OF OKLAHOMA on May 23, 2014job.sagepub.comDownloaded from

28
Ta
ble
11.
Cro
ss-T
ab
ula
tio
ns o
f L
ite
ratu
re T
yp
e a
nd
BC
P O
rga
niz
ati
on
Ty
pe
s
Org
aniz
atio
n Ty
pe
No.
Yes
P
erce
ntag
e Ye
s N
o. Y
es
Per
cent
age
Yes
No.
Yes
P
erce
ntag
e Ye
s N
o. Y
es
Per
cent
age
Yes
Hea
lthca
re/N
onho
spita
l 3
4.35
8
10.8
1 2
2.70
8
10.6
7H
ospi
tal
5 7.
25
5 6.
76
0 0
5 6.
67B
ank/
Fina
ncia
l 28
40
.58
26
35.1
4 23
31
.08
30
40IT
/Com
pute
r sy
stem
s 40
57
.97
35
47.3
0 49
66
.22
48
64E
lem
enta
ry s
choo
l 1
1.45
2
2.70
2
2.70
1
1.33
Seco
ndar
y sc
hool
1
1.45
1
1.35
2
2.70
0
0H
ighe
r ed
ucat
ion
inst
itutio
n 2
2.90
3
4.05
4
5.41
5
6.67
Loc
al c
ity g
over
nmen
t 7
10.1
4 14
18
.92
2 2.
70
1 1.
33C
ount
y go
vern
men
t 5
7.25
15
20
.27
4 5.
41
1 1.
33St
ate
gove
rnm
ent
8 11
.59
15
20.2
7 5
6.76
2
2.67
Fede
ral/N
atio
nal g
over
nmen
t 17
24
.63
34
45.9
5 15
20
.27
13
17.3
3A
viat
ion
indu
stry
4
5.80
5
6.76
2
2.70
4
5.33
NA
SA/S
pace
indu
stry
0
0 3
4.05
1
1.35
0
0M
anuf
actu
ring
indu
stry
6
8.70
5
6.76
6
8.11
11
14
.67
Rea
l est
ate
2 2.
90
3 4.
05
1 1.
35
2 2.
67H
ospi
talit
ies
serv
ices
3
4.35
2
2.70
1
1.35
5
6.67
Non
com
pute
r se
curi
ty s
yste
ms
4 5.
80
8 10
.81
12
16.2
2 9
12Fo
od s
ervi
ces
2 2.
90
7 9.
46
0 0
1 1.
33R
etai
l 8
11.5
9 6
8.11
4
5.41
4
5.33
Inte
rnat
iona
l org
aniz
atio
n 7
10.1
4 10
13
.51
15
20.2
7 12
16
Inte
rnat
iona
l gov
ernm
ent
3 4.
35
8 10
.81
12
16.2
2 5
6.67
Insu
ranc
e 4
5.80
24
32
.43
5 6.
76
5 6.
67Te
lem
arke
ting
2 2.
90
3 4.
05
4 5.
41
5 6.
67C
omm
unity
/Non
gove
rnm
ent
7 10
.14
10
13.5
1 8
10.8
1 7
9.33
Tran
spor
tatio
n 3
4.35
9
12.1
6 2
2.70
0
0E
nerg
y 4
5.80
3
4.05
3
4.05
2
2.67
Eng
inee
ring
/Con
stru
ctio
n 1
1.45
3
4.05
1
1.35
3
4
Not
e: B
CP
= bu
sine
ss c
ontin
uity
pla
nnin
g.
Med
ia A
rtic
leTr
ade
Pub
licat
ion
Aca
dem
ic L
itera
ture
Gov
ernm
ent/L
egal
at UNIV OF OKLAHOMA on May 23, 2014job.sagepub.comDownloaded from

29
Ta
ble
11.
Cro
ss-T
ab
ula
tio
ns o
f L
ite
ratu
re T
yp
e a
nd
BC
P O
rga
niz
ati
on
Ty
pe
s
Org
aniz
atio
n Ty
pe
No.
Yes
P
erce
ntag
e Ye
s N
o. Y
es
Per
cent
age
Yes
No.
Yes
P
erce
ntag
e Ye
s N
o. Y
es
Per
cent
age
Yes
Hea
lthca
re/N
onho
spita
l 3
4.35
8
10.8
1 2
2.70
8
10.6
7H
ospi
tal
5 7.
25
5 6.
76
0 0
5 6.
67B
ank/
Fina
ncia
l 28
40
.58
26
35.1
4 23
31
.08
30
40IT
/Com
pute
r sy
stem
s 40
57
.97
35
47.3
0 49
66
.22
48
64E
lem
enta
ry s
choo
l 1
1.45
2
2.70
2
2.70
1
1.33
Seco
ndar
y sc
hool
1
1.45
1
1.35
2
2.70
0
0H
ighe
r ed
ucat
ion
inst
itutio
n 2
2.90
3
4.05
4
5.41
5
6.67
Loc
al c
ity g
over
nmen
t 7
10.1
4 14
18
.92
2 2.
70
1 1.
33C
ount
y go
vern
men
t 5
7.25
15
20
.27
4 5.
41
1 1.
33St
ate
gove
rnm
ent
8 11
.59
15
20.2
7 5
6.76
2
2.67
Fede
ral/N
atio
nal g
over
nmen
t 17
24
.63
34
45.9
5 15
20
.27
13
17.3
3A
viat
ion
indu
stry
4
5.80
5
6.76
2
2.70
4
5.33
NA
SA/S
pace
indu
stry
0
0 3
4.05
1
1.35
0
0M
anuf
actu
ring
indu
stry
6
8.70
5
6.76
6
8.11
11
14
.67
Rea
l est
ate
2 2.
90
3 4.
05
1 1.
35
2 2.
67H
ospi
talit
ies
serv
ices
3
4.35
2
2.70
1
1.35
5
6.67
Non
com
pute
r se
curi
ty s
yste
ms
4 5.
80
8 10
.81
12
16.2
2 9
12Fo
od s
ervi
ces
2 2.
90
7 9.
46
0 0
1 1.
33R
etai
l 8
11.5
9 6
8.11
4
5.41
4
5.33
Inte
rnat
iona
l org
aniz
atio
n 7
10.1
4 10
13
.51
15
20.2
7 12
16
Inte
rnat
iona
l gov
ernm
ent
3 4.
35
8 10
.81
12
16.2
2 5
6.67
Insu
ranc
e 4
5.80
24
32
.43
5 6.
76
5 6.
67Te
lem
arke
ting
2 2.
90
3 4.
05
4 5.
41
5 6.
67C
omm
unity
/Non
gove
rnm
ent
7 10
.14
10
13.5
1 8
10.8
1 7
9.33
Tran
spor
tatio
n 3
4.35
9
12.1
6 2
2.70
0
0E
nerg
y 4
5.80
3
4.05
3
4.05
2
2.67
Eng
inee
ring
/Con
stru
ctio
n 1
1.45
3
4.05
1
1.35
3
4
Not
e: B
CP
= bu
sine
ss c
ontin
uity
pla
nnin
g.
Ta
ble
12.
Cro
ss-T
ab
ula
tio
ns o
f L
ite
ratu
re T
yp
e a
nd
BC
P C
om
mu
nic
ati
on
Str
ate
gie
s
Com
mun
icat
ion
Stra
tegy
N
o. Y
es
Per
cent
age
Yes
No.
Yes
P
erce
ntag
e Ye
s N
o. Y
es
Per
cent
age
Yes
No.
Yes
P
erce
ntag
e Ye
s
Face
-to-
face
com
mun
icat
ion
3 4.
35
5 6.
76
4 5.
41
2 2.
67e-
Mai
l 8
11.5
9 7
9.46
8
10.8
1 7
9.33
Mee
tings
/Gro
up c
omm
unic
atio
n 11
15
.94
7 9.
46
4 5.
41
6 8
Dat
abas
e m
anag
emen
t 24
34
.78
3 4.
05
12
16.2
2 20
26
.67
sy
stem
s Fa
x 2
2.90
0
0 0
0 0
0B
CP
soft
war
e pr
ogra
ms
9 13
.04
4 5.
41
11
14.8
6 24
32
Wri
tten
com
mun
icat
ion
2 2.
90
11
14.8
6 4
5.41
3
4Ph
one/
Cel
l pho
ne
10
14.4
9 9
12.1
6 9
12.1
6 11
14
.67
Tele
conf
eren
cing
2
2.90
4
5.41
2
2.70
2
2.67
Tele
wor
king
/ 10
14
.49
8 10
.81
6 8.
11
3 4
Te
leco
mm
utin
g R
adio
3
4.35
2
2.70
0
0 0
0In
tern
et/W
eb s
ite
17
24.6
4 17
22
.97
14
18.9
2 18
24
Med
ia/T
elev
isio
n 7
10.1
4 5
6.76
2
2.70
1
1.33
Wir
eles
s 3
4.35
12
16
.22
8 10
.81
6 8
GPS
/Sat
ellit
e 0
0 4
5.41
0
0 0
0E
nter
pris
e co
mm
unic
atio
n 2
2.90
0
0 2
2.70
2
2.67
syst
ems
Red
unda
nt c
omm
unic
atio
n 11
15
.94
5 6.
76
3 4.
05
4 5.
33
sy
stem
s
Not
e: B
CP
= bu
sine
ss c
ontin
uity
pla
nnin
g.
Med
ia A
rtic
leTr
ade
Pub
licat
ion
Aca
dem
ic L
itera
ture
Gov
ernm
ent/L
egal
at UNIV OF OKLAHOMA on May 23, 2014job.sagepub.comDownloaded from

30
Ta
ble
13.
Cro
ss-T
ab
ula
tio
ns o
f L
ite
ratu
re T
yp
e a
nd
BC
P P
lan
nin
g E
lem
en
ts
BC
P P
lan
Ele
men
t N
o. Y
es
Per
cent
age
Yes
No.
Yes
P
erce
ntag
e Ye
s N
o. Y
es
Per
cent
age
Yes
No.
Yes
P
erce
ntag
e Ye
s
Wri
tten
EM
pla
n 39
56
.52
23
31.0
8 23
31
.08
40
53.3
3R
egul
ar tr
aini
ng
27
39.1
3 17
22
.97
4 5.
41
18
24E
M p
lan
redu
ndan
cy
11
15.9
4 15
20
.27
5 6.
76
8 10
.67
EM
pla
n fu
ndin
g 21
30
.43
14
18.9
2 12
16
.22
13
17.3
3O
ngoi
ng th
reat
/Rea
dine
ss
37
53.6
2 24
32
.43
20
27.0
2 26
34
.67
as
sess
men
t C
omm
unic
atio
n w
ith
33
47.8
3 19
25
.68
12
16.2
2 19
25
.33
ne
twor
ked
orga
niza
tions
C
omm
unic
atio
n w
ith
37
53.6
2 15
20
.27
12
16.2
2 15
20
empl
oyee
s Pl
anne
d dr
ills
15
21.7
4 15
20
.27
6 8.
11
12
16M
ultio
rgan
izat
iona
l EM
16
23
.19
13
17.5
7 2
2.70
12
16
plan
ning
Si
mul
atio
ns/M
odel
ing
26
37.6
8 12
16
.22
4 5.
41
9 12
Out
sour
cing
18
26
.09
6 8.
11
21
28.3
8 31
41
.33
Off
site
sto
rage
15
21
.74
18
24.3
2 17
22
.97
19
25.3
3Fa
cilit
ies
secu
rity
19
27
.54
6 8.
11
9 12
.16
5 6.
67Sm
art b
uild
ings
6
8.70
9
12.1
6 2
2.70
2
2.67
Mul
tidep
artm
ent E
M te
ams
30
43.4
8 14
18
.92
3 4.
05
11
14.6
7St
anda
rdiz
ed la
ngua
ge
9 13
.04
3 4.
05
3 4.
05
1 1.
33
pr
ogra
ms
Alte
rnat
e di
sput
e re
solu
tion
1 1.
45
4 5.
41
1 1.
35
2 2.
67In
sura
nce
polic
ies
18
26.0
9 23
31
.08
7 9.
46
6 8
Org
aniz
atio
nal a
llian
ces
16
23.1
9 7
9.46
5
6.76
8
10.6
7G
eogr
aphi
c di
vers
ific
atio
n 27
39
.13
11
14.8
6 20
27
.02
20
26.6
7Te
chno
logy
ass
et m
anag
emen
t 33
47
.83
14
18.9
2 29
39
.19
45
60R
emot
e m
anag
emen
t 5
7.25
11
14
.86
6 8.
11
10
13.3
3D
ata
back
ups
26
37.6
8 24
32
.43
19
25.6
8 23
30
.67
Onl
ine
EM
pla
n 5
7.25
3
4.05
2
2.70
2
2.67
Use
of m
ultip
le te
chno
logi
es
14
20.2
9 21
28
.38
15
20.2
7 20
26
.67
Not
e: B
CP
= bu
sine
ss c
ontin
uity
pla
nnin
g; E
M =
em
erge
ncy
man
agem
ent.
Med
ia A
rtic
leTr
ade
Pub
licat
ion
Aca
dem
ic L
itera
ture
Gov
ernm
ent/L
egal
at UNIV OF OKLAHOMA on May 23, 2014job.sagepub.comDownloaded from

31
Ta
ble
13.
Cro
ss-T
ab
ula
tio
ns o
f L
ite
ratu
re T
yp
e a
nd
BC
P P
lan
nin
g E
lem
en
ts
BC
P P
lan
Ele
men
t N
o. Y
es
Per
cent
age
Yes
No.
Yes
P
erce
ntag
e Ye
s N
o. Y
es
Per
cent
age
Yes
No.
Yes
P
erce
ntag
e Ye
s
Wri
tten
EM
pla
n 39
56
.52
23
31.0
8 23
31
.08
40
53.3
3R
egul
ar tr
aini
ng
27
39.1
3 17
22
.97
4 5.
41
18
24E
M p
lan
redu
ndan
cy
11
15.9
4 15
20
.27
5 6.
76
8 10
.67
EM
pla
n fu
ndin
g 21
30
.43
14
18.9
2 12
16
.22
13
17.3
3O
ngoi
ng th
reat
/Rea
dine
ss
37
53.6
2 24
32
.43
20
27.0
2 26
34
.67
as
sess
men
t C
omm
unic
atio
n w
ith
33
47.8
3 19
25
.68
12
16.2
2 19
25
.33
ne
twor
ked
orga
niza
tions
C
omm
unic
atio
n w
ith
37
53.6
2 15
20
.27
12
16.2
2 15
20
empl
oyee
s Pl
anne
d dr
ills
15
21.7
4 15
20
.27
6 8.
11
12
16M
ultio
rgan
izat
iona
l EM
16
23
.19
13
17.5
7 2
2.70
12
16
plan
ning
Si
mul
atio
ns/M
odel
ing
26
37.6
8 12
16
.22
4 5.
41
9 12
Out
sour
cing
18
26
.09
6 8.
11
21
28.3
8 31
41
.33
Off
site
sto
rage
15
21
.74
18
24.3
2 17
22
.97
19
25.3
3Fa
cilit
ies
secu
rity
19
27
.54
6 8.
11
9 12
.16
5 6.
67Sm
art b
uild
ings
6
8.70
9
12.1
6 2
2.70
2
2.67
Mul
tidep
artm
ent E
M te
ams
30
43.4
8 14
18
.92
3 4.
05
11
14.6
7St
anda
rdiz
ed la
ngua
ge
9 13
.04
3 4.
05
3 4.
05
1 1.
33
pr
ogra
ms
Alte
rnat
e di
sput
e re
solu
tion
1 1.
45
4 5.
41
1 1.
35
2 2.
67In
sura
nce
polic
ies
18
26.0
9 23
31
.08
7 9.
46
6 8
Org
aniz
atio
nal a
llian
ces
16
23.1
9 7
9.46
5
6.76
8
10.6
7G
eogr
aphi
c di
vers
ific
atio
n 27
39
.13
11
14.8
6 20
27
.02
20
26.6
7Te
chno
logy
ass
et m
anag
emen
t 33
47
.83
14
18.9
2 29
39
.19
45
60R
emot
e m
anag
emen
t 5
7.25
11
14
.86
6 8.
11
10
13.3
3D
ata
back
ups
26
37.6
8 24
32
.43
19
25.6
8 23
30
.67
Onl
ine
EM
pla
n 5
7.25
3
4.05
2
2.70
2
2.67
Use
of m
ultip
le te
chno
logi
es
14
20.2
9 21
28
.38
15
20.2
7 20
26
.67
Not
e: B
CP
= bu
sine
ss c
ontin
uity
pla
nnin
g; E
M =
em
erge
ncy
man
agem
ent.
Med
ia A
rtic
leTr
ade
Pub
licat
ion
Aca
dem
ic L
itera
ture
Gov
ernm
ent/L
egal
Ta
ble
14.
Cro
ss-T
ab
ula
tio
ns o
f L
ite
ratu
re T
yp
e a
nd
Co
mm
un
ica
tio
n T
he
ory
Usa
ge
Com
mun
icat
ion
Theo
ry
No.
Yes
P
erce
ntag
e Ye
s N
o. Y
es
Per
cent
age
Yes
No.
Yes
P
erce
ntag
e Ye
s N
o. Y
es
Per
cent
age
Yes
Net
wor
king
theo
ry
6 8.
70
0 0
0 0
1 1.
33Sy
stem
s th
eory
4
5.80
0
0 0
0 0
0O
ther
com
mun
icat
ion
theo
ry
6 8.
70
1 1.
35
0 0
0 0
Med
ia A
rtic
leTr
ade
Pub
licat
ion
Aca
dem
ic L
itera
ture
Gov
ernm
ent/L
egal
at UNIV OF OKLAHOMA on May 23, 2014job.sagepub.comDownloaded from

32 JOURNAL OF BUSINESS COMMUNICATION
(2.67%) publications in terms of financial disasters. These disparities seem to indicate that academics place more emphasis on a wider variety of disaster types when writing about BCP than do the other groups; whether this is due to a higher level of interest in different types of disasters than the other groups or whether this is a function of the descriptive mechanics of academic writing as compared to the other literary styles cannot be addressed in this study.
Though there were over twice as many categories for organization type (27) compared with disaster type (12) in our study, there were only two orga-nization types that were found to be significantly represented across the bod-ies of literature: banking/financial (A = 40.58%, G = 35.14%, M = 31.08%, T = 40%) and IT/computer systems (A = 57.97%, G = 47.3%, M = 66.22%, T = 64%). Table 11 provides further details of our findings concerning orga-nization types represented in the bodies of literature. Government/legal pub-lications were the only body of literature to demonstrate significant interest in any of the government categories (federal/national government = 45.95%) or in the insurance industry (32.43%).
When organization types are examined for similarity/disparity across the bodies literature, it becomes apparent that once again there are differing con-versations occurring. Not surprisingly, and with the exception of local govern-ment, the government/legal publications are placing significantly higher emphasis on all levels of government BCP planning than are the others. Both the government/legal (18.92%) and the academic (10.14%) literature place much more emphasis on local government than do the other two groups (M = 2.70%, T = 1.33%). The government literature (12.16%) also placed a much greater emphasis on transportation issues than did the other bodies of literature (A = 4.35%, M = 2.70%, and T = 0%).
An analysis of the disparities between the bodies of literature in terms of disaster type demonstrates that aca-demics are having a conversation in their literature that is different from that of the other groups.
Finally, we were surprised to find that the government literature (32.43%) is also significantly more concerned with the insurance industry than are the others (A = 5.8%, M = 6.76%, and T = 6.67%). We found this to be a
at UNIV OF OKLAHOMA on May 23, 2014job.sagepub.comDownloaded from

Adkins et al. / CONTENT ANALYSIS OF BUSINESS 33
surprising pattern both in terms of the high level of government attention to the insurance industry and in terms of the extremely low level of attention given by the other bodies of literature, especially since proper management of insurance policies is so heavily stressed as an element of BCP planning across much of the overall BCP literature. Perhaps the interest on the part of govern-ment/legal publications is due to the need for a healthy insurance industry to act as a buffer between a disaster event and government financial support in recovery efforts (i.e., those who are insured can collect on insurance policies rather than needing to apply for government aid in the wake of a disaster), but this speculative explanation cannot be confirmed by the data collected for the purposes of this study and awaits further research.
Concerning the use of communication strategies in BCP, our analysis shows that no category of communication achieved significant representa-tion in all of the bodies of literature (see Table 12). In fact, only the use of database management systems (A = 34.78%, T = 26.67%) was signifi-cantly represented in more than one body of literature. The only other communication strategy to achieve significant representation in any body of literature was the use of BCP software programs, which was repre-sented in 32% of the trade publications. Finally, the most evenly dispersed communication strategy was the use of the Internet and/or Web sites (A = 24.64%, G = 22.97%, M = 18.92%, T = 24%), though it did not achieve a significant representation in any one body of literature.
In terms of disparities between the bodies of literature and communication strategies, it once again seems that there are different conversational empha-ses between these groups. The academic literature (34.78%) placed signifi-cantly more emphasis on database management systems than did the other groups (G = 4.05%, M = 16.22%, T = 26.67%), and the strategy of having redundant communication systems was also more discussed by academics (15.94%) than others (G = 6.76%, M = 4.05%, T = 5.33%). The strategy of written communication was significantly more highly represented in the government/legal literature (14.86%) than in the other bodies of literature (A = 2.9%, M = 5.41%, T = 4%), and the government/legal literature was also the only body of literature to address the use of GPS/satellite systems (5.41%). Finally, it is interesting to note that one other strategy was addressed by only one body of literature; academics were the only group found to be discussing the use of fax machines (2.9%) in their body of literature on BCP.
In terms of the significant representation of BCP planning elements in the literature, three elements achieved significant representation in all four bod-ies: the need for written EM plans (A = 56.52%, G = 31.08%, M = 31.08%, T = 53.33%), the need for ongoing threat/readiness assessments (A = 53.62%,
at UNIV OF OKLAHOMA on May 23, 2014job.sagepub.comDownloaded from

34 JOURNAL OF BUSINESS COMMUNICATION
G = 32.43%, M = 27.02%, T = 34.67%), and the need for data backups (A = 37.68%, G = 32.43%, M = 25.68%, T = 30.67%). Four elements also achieved significant representation across three bodies of literature: communication with networked organizations (A = 47.83%, G = 25.68%, T = 25.33%), the use of outsourcing (A = 26.09%, M = 28.38%, T = 41.33%), geographic diversification strategies (A = 39.13%, M = 27.02%, T = 26.67%), and technology asset management (A = 47.83%, M = 39.19%, T = 60%). Additionally, two elements were significantly represented in two bodies of literature: the use of insurance policies (A = 26.09%, G = 31.08%) and the use of multiple technologies (G = 28.38%, T = 26.67%). Finally, significant rep-resentation was achieved in one body of literature by seven elements: regular training (A = 39.13%), EM plan funding (A = 30.43%), communication with employees (A = 53.62%), the use of simulations/modeling (A = 37.68%), offsite storage (T = 25.33%), facilities security (A = 27.54%), and the use of multidepartment EM teams (A = 43.48%).
Analysis of the disparities between the bodies of literature and the BCP planning elements demonstrates the clearest evidence supporting our argu-ment that different conversations are occurring between these groups. As can be seen in Table 13, the use of written EM plans has significantly more rep-resentation in the literature of academics (56.52%) and the trades (53.33%) than those of the other groups (G = 31.08%, M = 31.08%), and the use of insurance policies is more frequently discussed in the literature of academics (26.09%) and government/legal sources (31.08%) than those of the other two groups (M = 9.46%, T = 8%). The trade publications address outsourcing (41.33%) significantly more often than the other groups of literature (A = 26.09%, G = 8.11%, M = 28.38%). The issue of technology asset manage-ment is also more highly represented in the trade publications (60%) than in other literature (A = 47.83%, G = 18.92%, M = 39.19%).
Finally, there are multiple strategy elements that the academic literature discusses significantly more often than any of the other bodies of literature. These elements include the use of regular training (A = 39.13%, G = 22.97%, M = 5.41%, T = 24%), EM plan funding (A = 30.43%, G = 18.92%, M = 16.22%, T = 17.33%), threat/readiness assessment (A = 53.62%, G = 32.43%, M = 27.02%, T = 34.67%), communication with networked organi-zations (A = 47.83%, G = 25.68%, M = 16.22%, T = 25.33%), communica-tion with employees (A = 53.62%, G = 20.27%, M = 16.22%, T = 25.33%), simulations/modeling (A = 37.68%, G = 16.22%, M = 5.41%, T = 12%), facilities security (A = 27.54%, G = 8.11%, M = 12.16%, T = 6.67%), the use of multidepartment EM teams (A = 43.48%, G = 18.92%, M = 4.05%, T = 14.67%), standardized language programs (A = 13.04%, G = 4.05%,
at UNIV OF OKLAHOMA on May 23, 2014job.sagepub.comDownloaded from

Adkins et al. / CONTENT ANALYSIS OF BUSINESS 35
M = 4.05%, T = 1.33%), the use of organizational alliances (A = 23.19%, G = 9.46%, M = 6.76%, T = 10.67%), and geographic diversification strate-gies (A = 39.13%, G = 14.86%, M = 27.02%, T = 26.67%). These vast dis-parities between the various bodies of literature and their representation of the various BCP strategy elements seems to indicate that the different groups who are producing these studies have differing levels of focus on the issues related to BCP and that, to some extent, each of these groups’ conversations in the literature are focused on different BCP elements.
Finally, we can see how little any of these bodies of literature include com-munication theories in their discussion of BCP. None of the communication theories (including the “other” catch-all category) even came close to achiev-ing significant representation in any of the bodies of literature. We found that practitioners in the media literature present almost no communication theo-ries in their work. Both networking theory and other communication theories were discussed in the nonacademic literature, though this representation was very weak (one article in the trade publications mentioned networking theory, and one article in the government/legal literature mentioned another com-munication theory). Perhaps what is most disturbing from the perspective of the application of communication scholarship in the wider discourse is that even the academic literature demonstrated a weak showing for discussing communication theory: Only 23% of the academic literature made any men-tion of any communication theory. Our findings concerning the presence of communication theories in the bodies of literature explored in this study are summarized in Table 14.
DISCUSSION
Limitations
This project was exploratory in nature. We wanted to find out what kinds of literature, if any, appeared regarding BCP and strategic communication within and among organizations. We narrowed our choices to journal type articles from academia, trade, and government/legal and media news stories because we felt that that was where we would find the bulk of the information for practitioners as well as any theoretical arguments from scholars. We did not include several pertinent subareas from databases such as the NASA articles from Web of Science, which contained almost 40,000 hits. In addition, in LexisNexis, we did not cover major business and international subsets that might be relevant. Moreover, we did not review books or any mass media
at UNIV OF OKLAHOMA on May 23, 2014job.sagepub.comDownloaded from

36 JOURNAL OF BUSINESS COMMUNICATION
outlets, including television, the radio, or the Internet. There is definitely room for more research in all of these areas.
A second restriction was the categories used in the study. We can define the variables more clearly by using specific subsets of how the literature classifies different crisis events. For example, in the energy sector, there are several specific types of accidents, from a nuclear meltdown to blackouts to environ-mental issues. Each variable was intentionally broad in scope due to the study being exploratory in nature. We can go into each specific category to find additional information. Once we have enough data, we can potentially make predictions across various organizational groups to see how they can increase their collaboration in BCP. More importantly, the collection of additional data on BCP will continue the process of knowledge management in BCP, thereby leading toward a better understanding of the gaps in knowledge that need to be addressed by both practitioners and researchers.
Future Research Directions
We confirmed our initial suspicions about the lip service given to BCP as a priority for organizations (except in the case of some IT departments, the banking and finance industry, and the considerable work done by the varying domestic federal and local governments, where it appears that actual implementation of BCP principles is being carried out to some extent). It appears that most of the literature we examined uses BCP as a buzzword or for rhetorical appeal, but there is minimal detail on what BCP actually is (especially in relation to strategic communication) and how to make it more effective. Furthermore, we know that three addi-tional complications (costs, time, and legal battles) make it difficult for some organizations who want to implement BCP to proceed.
We also found that certain technologies are preferable when organizations do communicate their BCP strategies. However, the specific details on how they function and if they are successful are missing (both in the literature and in this study). It seems to us that understanding these technologies should be a key element of managing BCP knowledge because knowing how, if, and why a technology works in BCP is essential to making informed decisions about what technologies to implement in an organization.
There also needs to be a broadening of the scope concerning which types of organizations should implement BCP strategies. The primary focus of he literary work we found was on industry and government, but BCP is potentially applicable across a much wider array of organizations within
at UNIV OF OKLAHOMA on May 23, 2014job.sagepub.comDownloaded from

Adkins et al. / CONTENT ANALYSIS OF BUSINESS 37
society. Crises are not just national events; local individuals and groups who experience them also need to implement and adapt management and recovery strategies. Finally, some organizations and groups might not even consider BCP as a necessity either because of unawareness of BCP concepts, unrealis-tic optimism about their ability to recover, or a tendency to minimize or deny the risks that they face. We can do more research to overcome these mis-guided assumptions and help organizations and communities attain a certain amount of protection from potential disasters.
Furthermore, there is limited information on the cultural aspects of BCP. The way in which cultures communicate and deal with crises may differ vastly. Perhaps, accounting for diverse cultural perspectives could help a broader range of cultures to do a better job of communicating their crisis and disaster preparation needs before and during a disaster event. We do not understand why the BCP literature ignores entire continents, including Asia, South America, parts of Africa, and the Middle East. Considering the global-ized nature of the economy, there should be at least a profit motive to encour-age the sharing of BCP information and techniques across the existing boundaries between cultures, nations, fields of knowledge, and industries.
In addition, considering how much attention the government paid to insurance companies, banks, and IT plans in the financial sector, it would seem reasonable that they should have been prepared for this coming recession and could have planned better accordingly. It would be interest-ing to include in a future study the impacts of the lack of BCP, which could have quickly dealt with this economic crisis rather than seeing it drag on for more than a year.
Finally, we are concerned with how little communication theory is rep-resented in the literature. Perhaps, it is because theory is often too abstract that practitioners find it of little use or value when trying to plan for future crises. Future research should consider how organizations could make theory more useful in the planning process, so rather than being reactive to events when damage is done and profits have been lost, we can take a more proactive stance.
In conclusion, O’Hair (2007) articulates that (where possible) commu-nication scholars have a responsibility to help solve humanity’s problems. He explains that the best research and theory in our field is also practical. It is important that the work that we do is useful and applicable to organi-zational realities. We see this study as a small step in the direction of pushing the boundaries of our field beyond the academy and into the realm of applied knowledge.
at UNIV OF OKLAHOMA on May 23, 2014job.sagepub.comDownloaded from

38 JOURNAL OF BUSINESS COMMUNICATION
APPENDIX
Item 1: Initial BCP Article Code Sheet
Basic Text Information
Title:Author(s):Source:Type of Text:Date of Publication:Study Unit #:
Type of Event BCP Utilized For
__ Natural Disaster __ Transportation Disaster__ Pandemic/ Employee Health __ Terrorism/Warfare__ Manufacturing Disaster Event __ Public Relations Crisis
Organization Types Represented in Unit
__ Healthcare/Nonhospital __ Higher education __ NASA/Space programs__ Hospital __ Local/City government __ Manufacturing__ Bank/Financial __ County government __ Hospitalities services__ IT/Computer Systems __ State government __ Security systems__ Elementary School __ Federal government __ (Noncomputer)__ Secondary School __ Aviation
Types of Communication Technology Utilized:
__ Ftf Communication __ Written Communication__ E-mail Communication __ Phone Communication__ Meetings/Group Communication __ Teleconferencing__ Database Management Systems __ Radio Communication__ BCP Software Programs
Name of System(s): _______________________________________________
BCP Strategy Elements:
__ Written EM Plan __ Regular Communication with Networked Orgs.__ Regular Training __ Communicate with Employees__ EM Plan Redundancy __ Planned Drills__ Funding for EM Readiness __ Multi-Organizational EM Planning__ Ongoing Threat/Readiness __ Computer Simulations Assessment
(continued)
at UNIV OF OKLAHOMA on May 23, 2014job.sagepub.comDownloaded from

Adkins et al. / CONTENT ANALYSIS OF BUSINESS 39
Theoretical Frameworks for Communication Strategy:
__ Networking Theory _____________________ Systems Theory ______________________________________ ___________________
Item 2: Final BCP Article Code Sheet
Coder Number: _________________________
Basic Text Information:
Title of Article:Author(s):Journal/ Source:Type of Text: Academic Media Government/Legal Trade Date of Publication:Study Unit #:
Type of Event BCP Utilized for:
__ Natural Disaster __ Transportation Disaster __ Economic Disaster/ Market Collapse__ Pandemic/Employee __ Terrorism/Warfare __ Workplace Violence Health __ Manufacturing Disaster __ Public Relations Crisis __ Industrial Espionage__ Electronic Disaster __ Corruption/Scandal __ Financial Ruin/ Bankruptcy
Organization Type Represented in Unit:
__ Healthcare/Non-hospital __ Manufacturing Industry__ Hospital __ Real Estate__ Bank/Financial __ Hospitalities Services__ IT/Computer Systems __ Non-computer Security Systems__ Elementary School __ Food Services__ Secondary School __ Retail Industry__ Higher Education Institution __ International Organization__ Local City Government __ International Government__ County Government __ Insurance Industry__ Federal/National Government __ Telemarketing/Call Center__ County Government __ Community/Non-government__ Federal/National Government __ Transportation Industry
(continued)
APPENDIX (continued)
at UNIV OF OKLAHOMA on May 23, 2014job.sagepub.comDownloaded from
40 JOURNAL OF BUSINESS COMMUNICATION
__ Aviation Industry __ Energy Industry__ NASA/Space Industry __ Engineering/Construction
Types of Communication Technology Utilized:
__ FtF Communication __ Teleworking/Telecommuting__ E-mail __ Radio__ Meetings/Group Communication __ Internet/Website__ Database Management Systems __ Media/T.V.__ Fax __ Wireless Technology__ BCP Software (list type(s) __ GPS/Satellite Systems on back of code sheet) __ Written Communication __ Enterprise Communications Systems__ Phone/Cell Phone __ Redundant Communications Systems__ Teleconferencing
BCP Strategy Elements:
__ Written EM Plan __ Smart Buildings__ Regular Training __ Multi-department EM Teams__ EM Plan Redundancy __ Standardized Language Program__ EM Plan Funding __ Alternate Dispute Resolution__ Ongoing Threat/Readiness Assessment __ Insurance Policies__ Communication with Networked __ Organizational Alliances Organizations __ Communication with Employees __ Geographic Diversification__ Planned Drills __ Technology Asset Management__ Multi-organization EM Planning __ Remote Management__ Simulations/Modeling __ Data Backups__ Outsourcing __ Online EM Plan__ Offsite Storage __ Use of Multiple Technologies__ Facilities Security
Theoretical Frameworks for Communication Strategy:
__ Networking Theory__ Systems Theory__ Other(s) (please list): __
NOTES
1. This refers to books, reports, data files, or any physically available information.2. Implicit knowledge artifacts refer to interpreting and inferring information based on
prior context and understanding.
APPENDIX (continued)
at UNIV OF OKLAHOMA on May 23, 2014job.sagepub.comDownloaded from
Adkins et al. / CONTENT ANALYSIS OF BUSINESS 41
3. Tacit knowledge artifacts include personally known information through experience with the organization. This could include anything from office culture and rumors to the internal workings of a budget or the way things get done.
REFERENCES
9/11 Commission. (2004). 9/11 Commission Report: Final Report of the National Commission on Terrorist Attacks Upon the United States. New York: Barnes & Noble.
Aucote, H. M., & Gold, R. S. (2005). Non-equivalence of direct and indirect measures of unrealistic optimism. Psychology, Health & Medicine, 10, 376-383.
Bajgoric, N. (2006). Information systems for e-business continuance: A systems approach. Kybernetes, 35, 632-652.
Botha, R. A., & Gaadingwe, T. G. (2006). Reflecting on 20 SEC conferences. Computers & Security, 25, 247-256.
Carter, R. L., Jr. (1998). Bracing for the millennium bug: Consider liability coverage to protect businesses facing Y2K claims. American Bar Association Journal, 84, 64.
Cohen, J. (1960). A coefficient of agreement for nominal scales. Educational and Psychological Measurement, 20, 37-46.
Covey, J. A., & Davies, A. D. M. (2004). Are people unrealistically optimistic? It depends how you ask them. British Journal of Health Psychology, 9, 39-49.
Edmonson, R. G. (2006, November 2). Security a tough sell to top managers: Survey [Electronic version]. Retrieved from http://proquest.umi.com.ezproxy.lib.ou.edu/ pqdweb? did=1155939411&sid=2&Fmt=3&clientId=41954&RQT=309&VName=PQD
Gill, T. J. (2006). Workplace continuity: How risk and technology will affect facilities strategy. Journal of Facilities Management, 4, 110-125.
Hanna, G. (2005). How to take a computer disaster in stride. Strategic Finance, 86, 48-52.Hermand, D., Karsenty, S., Py, Y., Guillet, L., Chauvin, B., Simeone, A., et al. (2003).
Rejection of crisis information: Public apathy and the macro-crisis of Y2K. Society for Risk Analysis, 23, 821-828.
Hofstede, G., Van Deusen, C. A., Mueller, C. B., Charles, T. A., & The Business Goals Network. (2002). What goals do business leaders pursue? Journal of International Business Studies, 33, 785-803.
Iyer, R. K., & Bandyopadhyay, K. (2000). Managing technology risks in the healthcare sector: Disaster recovery and business continuity planning. Disaster Prevention & Management, 9, 257-270.
Jackson, R. (2006). Business continuity: Preparation over prevention. Accountancy Ireland, 38, 51-53.
Kelly, S., & Peckham, R. (2002). Prepared for the worst. Communication News, 39, 12-18.Maher, K., & Zimmerman, A. (2005, September 6). In Katrina’s wake: Gulf firms seek to
assist workers, resume business. The Wall Street Journal, p. A-10.MCC. (2005). Standards for survival. Metropolitan Corporate Counsel Inc. Kirpatrick &
Lock Section, 13.National Fire Protection Association. (2007). NFPA 1600 standard on disaster/emergency
management and business continuity programs. Quincy, MA: Author.Newman, B., Conrad, K.K. (1999), "A framework for charactering knowledge manage-
ment methods, practices, and technologies", paper presented at Choosing Knowledge Management Technology Panel, at Santa Clara, CA, February.
at UNIV OF OKLAHOMA on May 23, 2014job.sagepub.comDownloaded from

42 JOURNAL OF BUSINESS COMMUNICATION
Norris, F. (2008, November 1). A monthlong walk on the wildest side of the stock market. The New York Times, Section B 1.
O’Hair, D. (2007). The promise of communication: A presidential address. National Communication Association, Spectra, 43(2), 6-10.
Park, E., Scherer, C. W., & Glynn, C. J. (2001). Community involvement and risk percep-tion at personal and societal levels. Health, Risk, & Society, 3, 281-292.
Pearl, M. A. (1998). Responding to the year 2000 challenge: Building partnerships towards a solution not litigation. Metropolitan Corporate Counsel Inc. In House Perspectives Section, 23.
Perry, R. W., & Mankin, L. D. (2005). Preparing for the unthinkable: Managers, terrorism and the HRM function. Public Personnel Management, 34, 175-193.
Pitt, M., & Goyal, S. (2004). Business continuity planning as a facilities management tool. Facilities, 22, 87-99.
Powell, L., Bodon, J., & Hickson, M., III. (2001). Rejection of crisis information: Public apathy and the macro-crisis of Y2K. Communication Research Reports, 18, 84-92.
Ramleth, G. (2006). Q&A: Global issues. Optimize, 5, 38.Swartz, N. (2003). Few organizations have effective continuity plans. Information
Management Journal, 37, 7.Then, K. S., & Loosemore, M. (2006). Terrorism prevention, preparedness, and response
in built facilities. Facilities, 24, 157-176.Willemssen, J. C. (1998). Year 2000 computing crisis: Significance risk remains to
Department of Education’s student financial aid systems. Testimony before the subcom-mittee on oversight & investigations, committee on education and the workforce (House of Representatives GAO/T-AIMD-98-302-September, 17, 1998). Washington, DC: U.S. Government Printing Office.