A comparison of ground-level air quality data with New York State Department of Environmental...
10
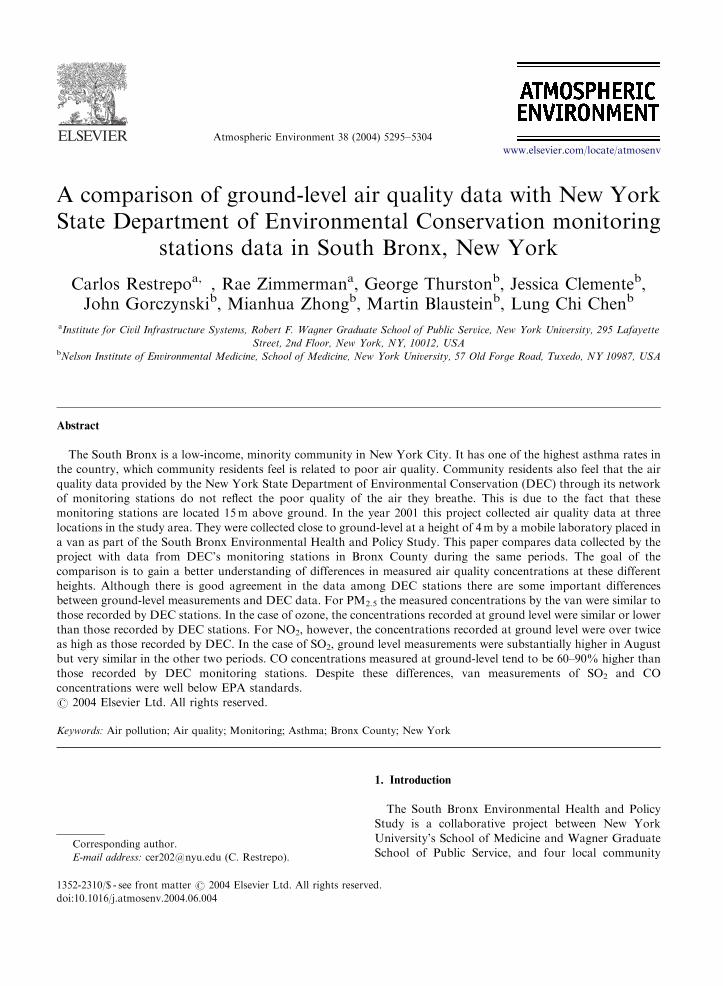
Atmospheric Environment 38 (2004) 5295–5304 A comparison of ground-level air quality data with New York State Department of Environmental Conservation monitoring stations data in South Bronx, New York Carlos Restrepo a, , Rae Zimmerman a , George Thurston b , Jessica Clemente b , John Gorczynski b , Mianhua Zhong b , Martin Blaustein b , Lung Chi Chen b a Institute for Civil Infrastructure Systems, Robert F. Wagner Graduate School of Public Service, New York University, 295 Lafayette Street, 2nd Floor, New York, NY, 10012, USA b Nelson Institute of Environmental Medicine, School of Medicine, New York University, 57 Old Forge Road, Tuxedo, NY 10987, USA Abstract The South Bronx is a low-income, minority community in New York City. It has one of the highest asthma rates in the country, which community residents feel is related to poor air quality. Community residents also feel that the air quality data provided by the New York State Department of Environmental Conservation (DEC) through its network of monitoring stations do not reflect the poor quality of the air they breathe. This is due to the fact that these monitoring stations are located 15 m above ground. In the year 2001 this project collected air quality data at three locations in the study area. They were collected close to ground-level at a height of 4 m by a mobile laboratory placed in a van as part of the South Bronx Environmental Health and Policy Study. This paper compares data collected by the project with data from DEC’s monitoring stations in Bronx County during the same periods. The goal of the comparison is to gain a better understanding of differences in measured air quality concentrations at these different heights. Although there is good agreement in the data among DEC stations there are some important differences between ground-level measurements and DEC data. For PM 2.5 the measured concentrations by the van were similar to those recorded by DEC stations. In the case of ozone, the concentrations recorded at ground level were similar or lower than those recorded by DEC stations. For NO 2 , however, the concentrations recorded at ground level were over twice as high as those recorded by DEC. In the case of SO 2 , ground level measurements were substantially higher in August but very similar in the other two periods. CO concentrations measured at ground-level tend to be 60–90% higher than those recorded by DEC monitoring stations. Despite these differences, van measurements of SO 2 and CO concentrations were well below EPA standards. r 2004 Elsevier Ltd. All rights reserved. Keywords: Air pollution; Air quality; Monitoring; Asthma; Bronx County; New York 1. Introduction The South Bronx Environmental Health and Policy Study is a collaborative project between New York University’s School of Medicine and Wagner Graduate School of Public Service, and four local community ARTICLE IN PRESS www.elsevier.com/locate/atmosenv 1352-2310/$ - see front matter r 2004 Elsevier Ltd. All rights reserved. doi:10.1016/j.atmosenv.2004.06.004 Corresponding author. E-mail address: [email protected] (C. Restrepo).
Transcript of A comparison of ground-level air quality data with New York State Department of Environmental...
ARTICLE IN PRESS
1352-2310/$ - se
doi:10.1016/j.at
�CorrespondE-mail addr
Atmospheric Environment 38 (2004) 5295–5304
www.elsevier.com/locate/atmosenv
A comparison of ground-level air quality data with New YorkState Department of Environmental Conservation monitoring
stations data in South Bronx, New York
Carlos Restrepoa,�, Rae Zimmermana, George Thurstonb, Jessica Clementeb,John Gorczynskib, Mianhua Zhongb, Martin Blausteinb, Lung Chi Chenb
aInstitute for Civil Infrastructure Systems, Robert F. Wagner Graduate School of Public Service, New York University, 295 Lafayette
Street, 2nd Floor, New York, NY, 10012, USAbNelson Institute of Environmental Medicine, School of Medicine, New York University, 57 Old Forge Road, Tuxedo, NY 10987, USA
Abstract
The South Bronx is a low-income, minority community in New York City. It has one of the highest asthma rates in
the country, which community residents feel is related to poor air quality. Community residents also feel that the air
quality data provided by the New York State Department of Environmental Conservation (DEC) through its network
of monitoring stations do not reflect the poor quality of the air they breathe. This is due to the fact that these
monitoring stations are located 15m above ground. In the year 2001 this project collected air quality data at three
locations in the study area. They were collected close to ground-level at a height of 4m by a mobile laboratory placed in
a van as part of the South Bronx Environmental Health and Policy Study. This paper compares data collected by the
project with data from DEC’s monitoring stations in Bronx County during the same periods. The goal of the
comparison is to gain a better understanding of differences in measured air quality concentrations at these different
heights. Although there is good agreement in the data among DEC stations there are some important differences
between ground-level measurements and DEC data. For PM2.5 the measured concentrations by the van were similar to
those recorded by DEC stations. In the case of ozone, the concentrations recorded at ground level were similar or lower
than those recorded by DEC stations. For NO2, however, the concentrations recorded at ground level were over twice
as high as those recorded by DEC. In the case of SO2, ground level measurements were substantially higher in August
but very similar in the other two periods. CO concentrations measured at ground-level tend to be 60–90% higher than
those recorded by DEC monitoring stations. Despite these differences, van measurements of SO2 and CO
concentrations were well below EPA standards.
r 2004 Elsevier Ltd. All rights reserved.
Keywords: Air pollution; Air quality; Monitoring; Asthma; Bronx County; New York
e front matter r 2004 Elsevier Ltd. All rights reserve
mosenv.2004.06.004
ing author.
ess: [email protected] (C. Restrepo).
1. Introduction
The South Bronx Environmental Health and Policy
Study is a collaborative project between New York
University’s School of Medicine and Wagner Graduate
School of Public Service, and four local community
d.
ARTICLE IN PRESSC. Restrepo et al. / Atmospheric Environment 38 (2004) 5295–53045296
groups: The Point Community Development Corpora-
tion, We Stay/Nos Quedamos, Sports Foundation, Inc.,
and Youth Ministries for Peace and Justice, Inc. The
main goal of the project is to study relationships
between environmental issues such as air quality, human
activities, such as transportation and waste transfer, and
their impact on human health. The South Bronx is a
predominantly low-income, minority community which
for the purposes of this study was defined to comprise
five community districts in the southwestern portion of
Bronx County, New York. According to Census 2000
data, this area has a population of approximately
522,412 people, which represents about 40% of the
total for Bronx County. About 39% of the population in
this area is African-American and 60% is Hispanic.
Traffic density in the area is very high. The Cross Bronx
Expressway, the Bruckner Expressway and the Major
Deegan Expressway, with annual average daily traffic of
75,000–150,000 vehicles all cross the South Bronx. In
addition, the area has a high concentration of waste
transfer stations and other commercial activities asso-
ciated with high diesel truck traffic volumes (Zimmer-
man et al., 2002).
From the beginning of the project the community
groups showed great interest in studying air quality in
their community and comparing it to available data
from the New York State Department of Environmental
Conservation (DEC). Their interest was mainly in
gaining a better understanding of air quality in the
area, since later stages of the project will examine the
association between air quality and asthma, which they
consider to be among the top health concerns of their
community. Previous studies have identified Bronx
County as having the highest rates of asthma morbidity
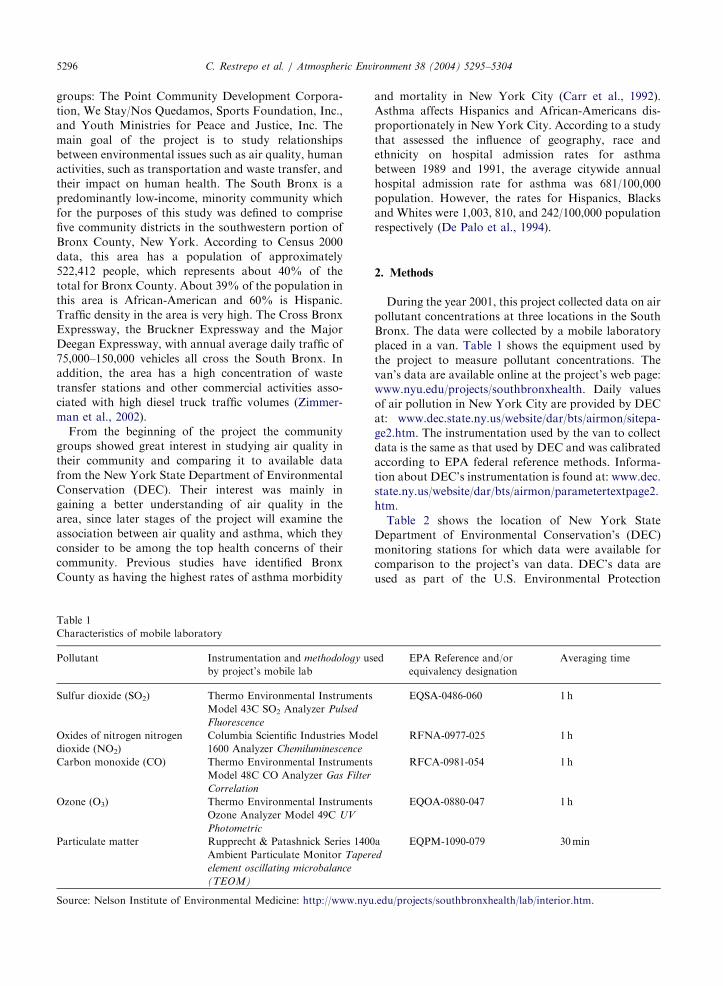
Table 1
Characteristics of mobile laboratory
Pollutant Instrumentation and methodology us
by project’s mobile lab
Sulfur dioxide (SO2) Thermo Environmental Instruments
Model 43C SO2 Analyzer Pulsed
Fluorescence
Oxides of nitrogen nitrogen
dioxide (NO2)
Columbia Scientific Industries Mode
1600 Analyzer Chemiluminescence
Carbon monoxide (CO) Thermo Environmental Instruments
Model 48C CO Analyzer Gas Filter
Correlation
Ozone (O3) Thermo Environmental Instruments
Ozone Analyzer Model 49C UV
Photometric
Particulate matter Rupprecht & Patashnick Series 1400
Ambient Particulate Monitor Taper
element oscillating microbalance
(TEOM)
Source: Nelson Institute of Environmental Medicine: http://www.nyu
and mortality in New York City (Carr et al., 1992).
Asthma affects Hispanics and African-Americans dis-
proportionately in New York City. According to a study
that assessed the influence of geography, race and
ethnicity on hospital admission rates for asthma
between 1989 and 1991, the average citywide annual
hospital admission rate for asthma was 681/100,000
population. However, the rates for Hispanics, Blacks
and Whites were 1,003, 810, and 242/100,000 population
respectively (De Palo et al., 1994).
2. Methods
During the year 2001, this project collected data on air
pollutant concentrations at three locations in the South
Bronx. The data were collected by a mobile laboratory
placed in a van. Table 1 shows the equipment used by
the project to measure pollutant concentrations. The
van’s data are available online at the project’s web page:
www.nyu.edu/projects/southbronxhealth. Daily values
of air pollution in New York City are provided by DEC
at: www.dec.state.ny.us/website/dar/bts/airmon/sitepa-
ge2.htm. The instrumentation used by the van to collect
data is the same as that used by DEC and was calibrated
according to EPA federal reference methods. Informa-
tion about DEC’s instrumentation is found at: www.dec.
state.ny.us/website/dar/bts/airmon/parametertextpage2.
htm.
Table 2 shows the location of New York State
Department of Environmental Conservation’s (DEC)
monitoring stations for which data were available for
comparison to the project’s van data. DEC’s data are
used as part of the U.S. Environmental Protection
ed EPA Reference and/or
equivalency designation
Averaging time
EQSA-0486-060 1 h
l RFNA-0977-025 1 h
RFCA-0981-054 1 h
EQOA-0880-047 1 h
a
ed
EQPM-1090-079 30min
.edu/projects/southbronxhealth/lab/interior.htm.
ARTICLE IN PRESSC. Restrepo et al. / Atmospheric Environment 38 (2004) 5295–5304 5297
Agency’s (EPA) Aerometric Information Retrieval
System (AIRS) database. Monitoring air pollution in a
dense urban environment such as New York City
presents some important challenges. In general, air
pollution monitoring station inlets should be exposed to
air from all sides. Moreover, they should be in open
areas or on roofs in order to obtain good exposure to the
atmosphere (Harrison, 1999). In the case of Bronx
Table 2
NYS DEC air quality monitoring station information
Station ID Location Height above
ground
709406 New York Botanical
Garden, 200th St. at
Southern Blvd.
15m
709407 I.S. 52 681 Kelly St., off
156th St.
15m
709408 I.S. 74 730 Bryant Ave. 15m
709409 P.S. 154 333 E. 135th St. 15m
Table 3
Location of the project’s van in 2001
Location Period
P.S. 154 1–29 August 2001
Hunts Point Avenue and
163rd Street
7–29 November 2001
Noble Field Park 2–31 December 2001
Fig. 1. Location of DEC monitoring stations and
County, such considerations, along with vandalism and
security concerns, have resulted in the placement of
monitoring stations 15m above ground. Three of the
four fixed-site monitoring stations are located on the
rooftops of schools. This is in compliance with current
U.S. regulations. According to Part 58, Appendix E of
the Code of Federal Regulations (2002) the height from
ground to probe for a monitoring station should be
3–15m for SO2, CO, O3, and NO2, and 2–15m for
PM2.5. However, such placement raises the issue
identified by the community groups of whether the data
collected by these stations truly reflects the quality of the
air residents breathe close to ground-level. The height of
the mobile laboratory’s intake probe used by the project
is 4m which is within the range established by the Code
of Federal Regulations for these pollutants. Table 3
shows the location of the van during the three periods
for which data were compared. The geographical
locations where the van collected data and that of
DEC’s monitoring stations are shown in Fig. 1.
3. Results
The data from the van’s mobile laboratory and DEC
stations were compared for fine particulate matter
(PM2.5), sulfur dioxide (SO2), nitrogen dioxide (NO2),
ozone (O3), and carbon monoxide (CO). The results of
the data comparisons for each pollutant are described in
the following sections.
project van sampling, Bronx County, 2001.
ARTICLE IN PRESS
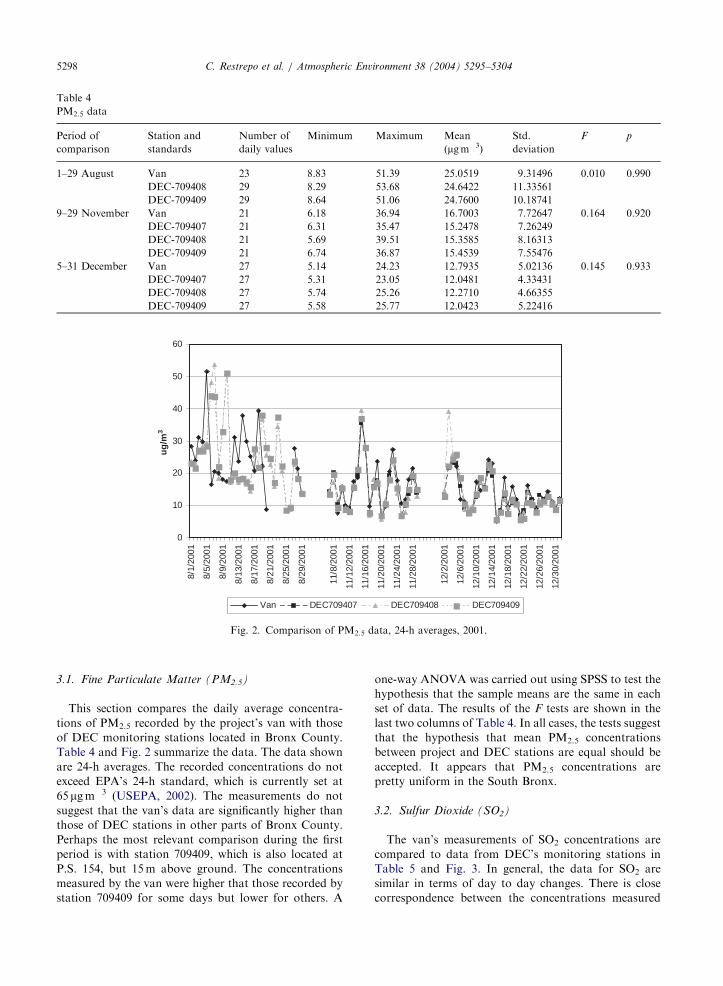
Table 4
PM2.5 data
Period of
comparison
Station and
standards
Number of
daily values
Minimum Maximum Mean
(mgm�3)
Std.
deviation
F p
1–29 August Van 23 8.83 51.39 25.0519 9.31496 0.010 0.990
DEC-709408 29 8.29 53.68 24.6422 11.33561
DEC-709409 29 8.64 51.06 24.7600 10.18741
9–29 November Van 21 6.18 36.94 16.7003 7.72647 0.164 0.920
DEC-709407 21 6.31 35.47 15.2478 7.26249
DEC-709408 21 5.69 39.51 15.3585 8.16313
DEC-709409 21 6.74 36.87 15.4539 7.55476
5–31 December Van 27 5.14 24.23 12.7935 5.02136 0.145 0.933
DEC-709407 27 5.31 23.05 12.0481 4.33431
DEC-709408 27 5.74 25.26 12.2710 4.66355
DEC-709409 27 5.58 25.77 12.0423 5.22416
0
10
20
30
40
50
60
8/1/
2001
8/5/
2001
8/9/
2001
8/13
/200
1
8/17
/200
1
8/21
/200
1
8/25
/200
1
8/29
/200
1
11/8
/200
1
11/1
2/20
01
11/1
6/20
01
11/2
0/20
01
11/2
4/20
01
11/2
8/20
01
12/2
/200
1
12/6
/200
1
12/1
0/20
01
12/1
4/20
01
12/1
8/20
01
12/2
2/20
01
12/2
6/20
01
12/3
0/20
01
ug
/m3
Van DEC709407 DEC709408 DEC709409
Fig. 2. Comparison of PM2.5 data, 24-h averages, 2001.
C. Restrepo et al. / Atmospheric Environment 38 (2004) 5295–53045298
3.1. Fine Particulate Matter (PM2.5)
This section compares the daily average concentra-
tions of PM2.5 recorded by the project’s van with those
of DEC monitoring stations located in Bronx County.
Table 4 and Fig. 2 summarize the data. The data shown
are 24-h averages. The recorded concentrations do not
exceed EPA’s 24-h standard, which is currently set at
65mgm�3 (USEPA, 2002). The measurements do not
suggest that the van’s data are significantly higher than
those of DEC stations in other parts of Bronx County.
Perhaps the most relevant comparison during the first
period is with station 709409, which is also located at
P.S. 154, but 15m above ground. The concentrations
measured by the van were higher that those recorded by
station 709409 for some days but lower for others. A
one-way ANOVA was carried out using SPSS to test the
hypothesis that the sample means are the same in each
set of data. The results of the F tests are shown in the
last two columns of Table 4. In all cases, the tests suggest
that the hypothesis that mean PM2.5 concentrations
between project and DEC stations are equal should be
accepted. It appears that PM2.5 concentrations are
pretty uniform in the South Bronx.
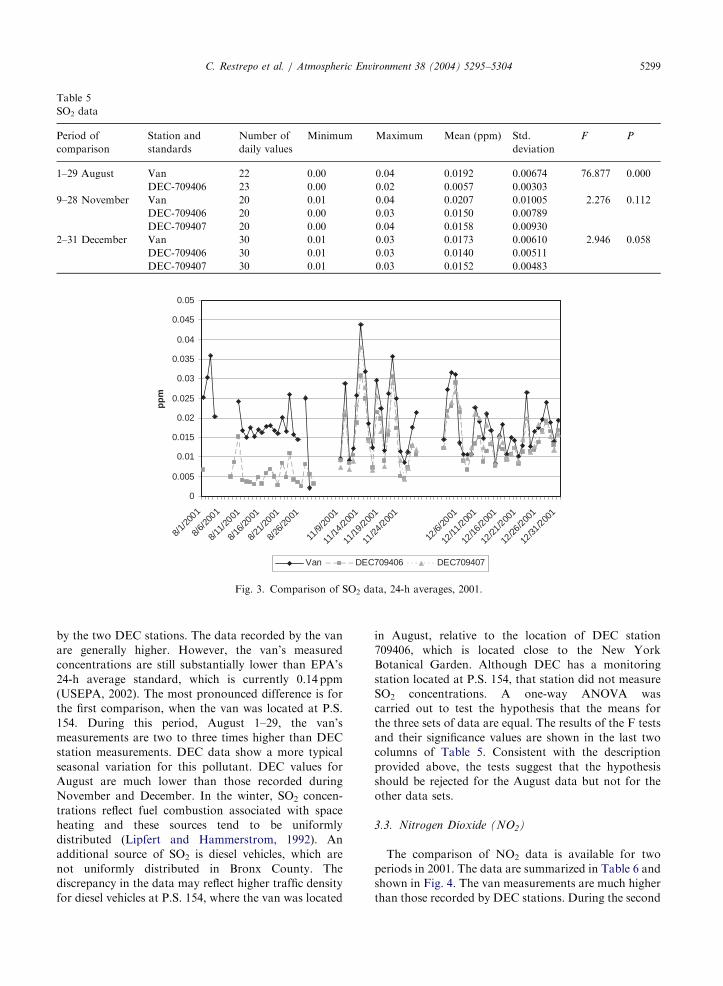
3.2. Sulfur Dioxide (SO2)
The van’s measurements of SO2 concentrations are
compared to data from DEC’s monitoring stations in
Table 5 and Fig. 3. In general, the data for SO2 are
similar in terms of day to day changes. There is close
correspondence between the concentrations measured
ARTICLE IN PRESS
0
0.005
0.01
0.015
0.02
0.025
0.03
0.035
0.04
0.045
0.05
8/1/
2001
8/6/
2001
8/11
/2001
8/16
/2001
8/21
/2001
8/26
/2001
11/9/
2001
11/14
/200
1
11/19
/200
1
11/24
/200
1
12/6/
2001
12/11
/200
1
12/16
/200
1
12/21
/200
1
12/26
/200
1
12/31
/200
1
pp
m
Van DEC709406 DEC709407
Fig. 3. Comparison of SO2 data, 24-h averages, 2001.
Table 5
SO2 data
Period of
comparison
Station and
standards
Number of
daily values
Minimum Maximum Mean (ppm) Std.
deviation
F P
1–29 August Van 22 0.00 0.04 0.0192 0.00674 76.877 0.000
DEC-709406 23 0.00 0.02 0.0057 0.00303
9–28 November Van 20 0.01 0.04 0.0207 0.01005 2.276 0.112
DEC-709406 20 0.00 0.03 0.0150 0.00789
DEC-709407 20 0.00 0.04 0.0158 0.00930
2–31 December Van 30 0.01 0.03 0.0173 0.00610 2.946 0.058
DEC-709406 30 0.01 0.03 0.0140 0.00511
DEC-709407 30 0.01 0.03 0.0152 0.00483
C. Restrepo et al. / Atmospheric Environment 38 (2004) 5295–5304 5299
by the two DEC stations. The data recorded by the van
are generally higher. However, the van’s measured
concentrations are still substantially lower than EPA’s
24-h average standard, which is currently 0.14 ppm
(USEPA, 2002). The most pronounced difference is for
the first comparison, when the van was located at P.S.
154. During this period, August 1–29, the van’s
measurements are two to three times higher than DEC
station measurements. DEC data show a more typical
seasonal variation for this pollutant. DEC values for
August are much lower than those recorded during
November and December. In the winter, SO2 concen-
trations reflect fuel combustion associated with space
heating and these sources tend to be uniformly
distributed (Lipfert and Hammerstrom, 1992). An
additional source of SO2 is diesel vehicles, which are
not uniformly distributed in Bronx County. The
discrepancy in the data may reflect higher traffic density
for diesel vehicles at P.S. 154, where the van was located
in August, relative to the location of DEC station
709406, which is located close to the New York
Botanical Garden. Although DEC has a monitoring
station located at P.S. 154, that station did not measure
SO2 concentrations. A one-way ANOVA was
carried out to test the hypothesis that the means for
the three sets of data are equal. The results of the F tests
and their significance values are shown in the last two
columns of Table 5. Consistent with the description
provided above, the tests suggest that the hypothesis
should be rejected for the August data but not for the
other data sets.
3.3. Nitrogen Dioxide (NO2)
The comparison of NO2 data is available for two
periods in 2001. The data are summarized in Table 6 and
shown in Fig. 4. The van measurements are much higher
than those recorded by DEC stations. During the second
ARTICLE IN PRESS
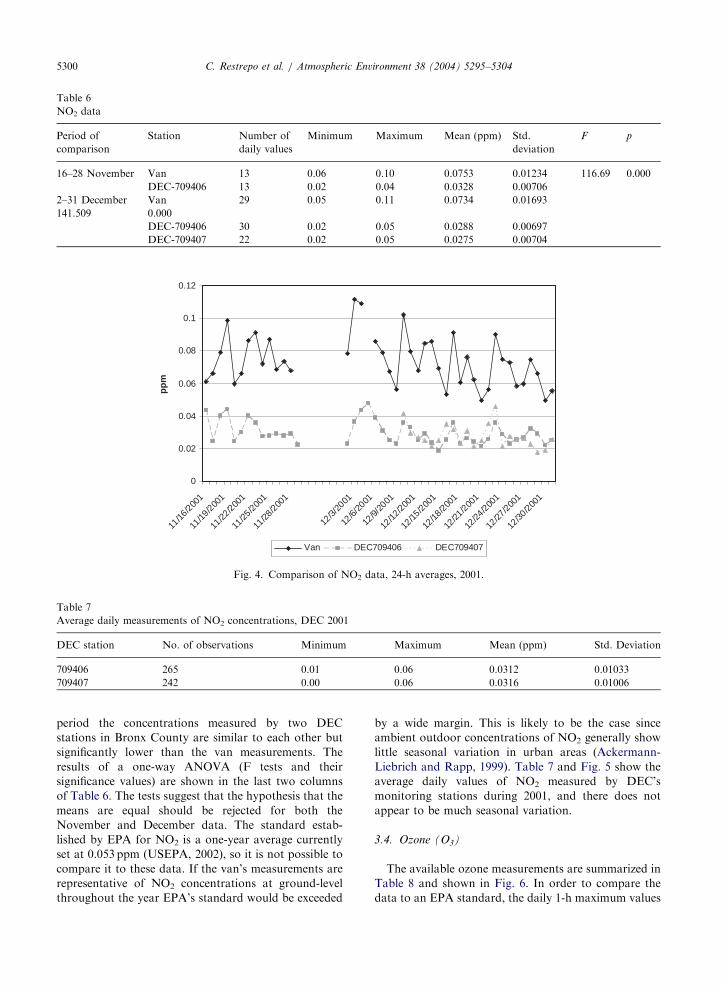
Table 6
NO2 data
Period of
comparison
Station Number of
daily values
Minimum Maximum Mean (ppm) Std.
deviation
F p
16–28 November Van 13 0.06 0.10 0.0753 0.01234 116.69 0.000
DEC-709406 13 0.02 0.04 0.0328 0.00706
2–31 December Van 29 0.05 0.11 0.0734 0.01693
141.509 0.000
DEC-709406 30 0.02 0.05 0.0288 0.00697
DEC-709407 22 0.02 0.05 0.0275 0.00704
0
0.02
0.04
0.06
0.08
0.1
0.12
11/16
/200
1
11/19
/200
1
11/22
/200
1
11/25
/200
1
11/28
/200
1
12/3/
2001
12/6/
2001
12/9/
2001
12/12
/200
1
12/15
/200
1
12/18
/200
1
12/21
/200
1
12/24
/200
1
12/27
/200
1
12/30
/200
1
pp
m
Van DEC709406 DEC709407
Fig. 4. Comparison of NO2 data, 24-h averages, 2001.
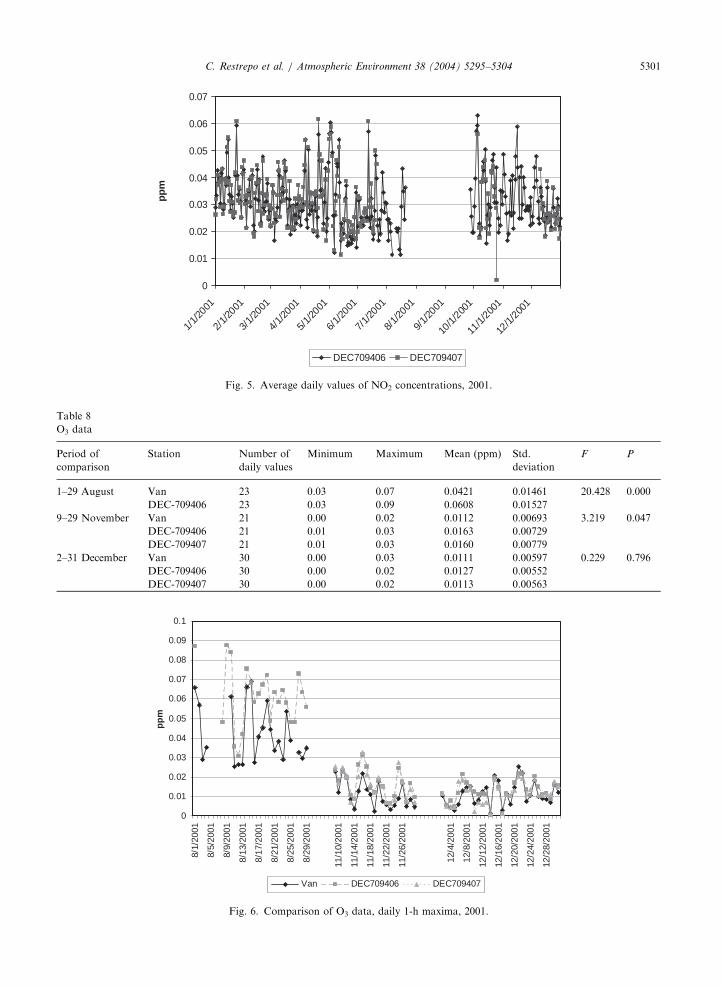
Table 7
Average daily measurements of NO2 concentrations, DEC 2001
DEC station No. of observations Minimum Maximum Mean (ppm) Std. Deviation
709406 265 0.01 0.06 0.0312 0.01033
709407 242 0.00 0.06 0.0316 0.01006
C. Restrepo et al. / Atmospheric Environment 38 (2004) 5295–53045300
period the concentrations measured by two DEC
stations in Bronx County are similar to each other but
significantly lower than the van measurements. The
results of a one-way ANOVA (F tests and their
significance values) are shown in the last two columns
of Table 6. The tests suggest that the hypothesis that the
means are equal should be rejected for both the
November and December data. The standard estab-
lished by EPA for NO2 is a one-year average currently
set at 0.053 ppm (USEPA, 2002), so it is not possible to
compare it to these data. If the van’s measurements are
representative of NO2 concentrations at ground-level
throughout the year EPA’s standard would be exceeded
by a wide margin. This is likely to be the case since
ambient outdoor concentrations of NO2 generally show
little seasonal variation in urban areas (Ackermann-
Liebrich and Rapp, 1999). Table 7 and Fig. 5 show the
average daily values of NO2 measured by DEC’s
monitoring stations during 2001, and there does not
appear to be much seasonal variation.
3.4. Ozone (O3)
The available ozone measurements are summarized in
Table 8 and shown in Fig. 6. In order to compare the
data to an EPA standard, the daily 1-h maximum values
ARTICLE IN PRESS
0
0.01
0.02
0.03
0.04
0.05
0.06
0.07
1/1/2
001
2/1/2
001
3/1/2
001
4/1/2
001
5/1/2
001
6/1/2
001
7/1/2
001
8/1/2
001
9/1/2
001
10/1/
2001
11/1/
2001
12/1/
2001
pp
m
DEC709406 DEC709407
Fig. 5. Average daily values of NO2 concentrations, 2001.
Table 8
O3 data
Period of
comparison
Station Number of
daily values
Minimum Maximum Mean (ppm) Std.
deviation
F P
1–29 August Van 23 0.03 0.07 0.0421 0.01461 20.428 0.000
DEC-709406 23 0.03 0.09 0.0608 0.01527
9–29 November Van 21 0.00 0.02 0.0112 0.00693 3.219 0.047
DEC-709406 21 0.01 0.03 0.0163 0.00729
DEC-709407 21 0.01 0.03 0.0160 0.00779
2–31 December Van 30 0.00 0.03 0.0111 0.00597 0.229 0.796
DEC-709406 30 0.00 0.02 0.0127 0.00552
DEC-709407 30 0.00 0.02 0.0113 0.00563
0
0.01
0.02
0.03
0.04
0.05
0.06
0.07
0.08
0.09
0.1
8/1/
2001
8/5/
2001
8/9/
2001
8/13
/200
1
8/17
/200
1
8/21
/200
1
8/25
/200
1
8/29
/200
1
11/1
0/20
01
11/1
4/20
01
11/1
8/20
01
11/2
2/20
01
11/2
6/20
01
12/4
/200
1
12/8
/200
1
12/1
2/20
01
12/1
6/20
01
12/2
0/20
01
12/2
4/20
01
12/2
8/20
01
pp
m
Van DEC709406 DEC709407
Fig. 6. Comparison of O3 data, daily 1-h maxima, 2001.
C. Restrepo et al. / Atmospheric Environment 38 (2004) 5295–5304 5301
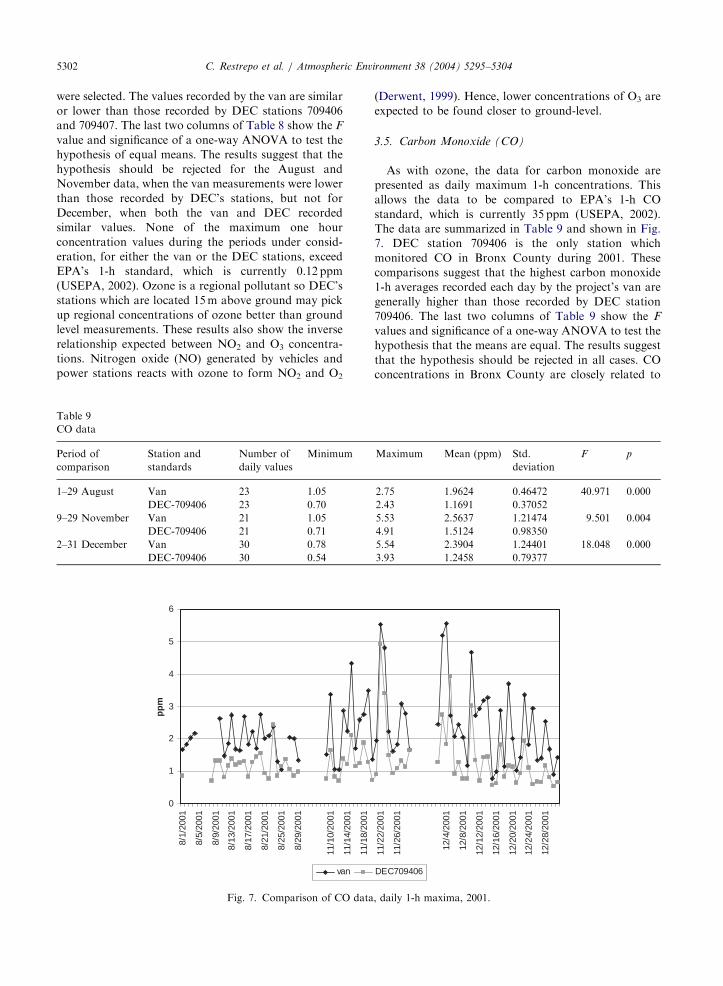
ARTICLE IN PRESSC. Restrepo et al. / Atmospheric Environment 38 (2004) 5295–53045302
were selected. The values recorded by the van are similar
or lower than those recorded by DEC stations 709406
and 709407. The last two columns of Table 8 show the F
value and significance of a one-way ANOVA to test the
hypothesis of equal means. The results suggest that the
hypothesis should be rejected for the August and
November data, when the van measurements were lower
than those recorded by DEC’s stations, but not for
December, when both the van and DEC recorded
similar values. None of the maximum one hour
concentration values during the periods under consid-
eration, for either the van or the DEC stations, exceed
EPA’s 1-h standard, which is currently 0.12 ppm
(USEPA, 2002). Ozone is a regional pollutant so DEC’s
stations which are located 15m above ground may pick
up regional concentrations of ozone better than ground
level measurements. These results also show the inverse
relationship expected between NO2 and O3 concentra-
tions. Nitrogen oxide (NO) generated by vehicles and
power stations reacts with ozone to form NO2 and O2
0
1
2
3
4
5
6
8/1/
2001
8/5/
2001
8/9/
2001
8/13
/200
1
8/17
/200
1
8/21
/200
1
8/25
/200
1
8/29
/200
1
11/1
0/20
01
11/1
4/20
01
11/1
8/20
01
pp
m
van
Fig. 7. Comparison of CO data
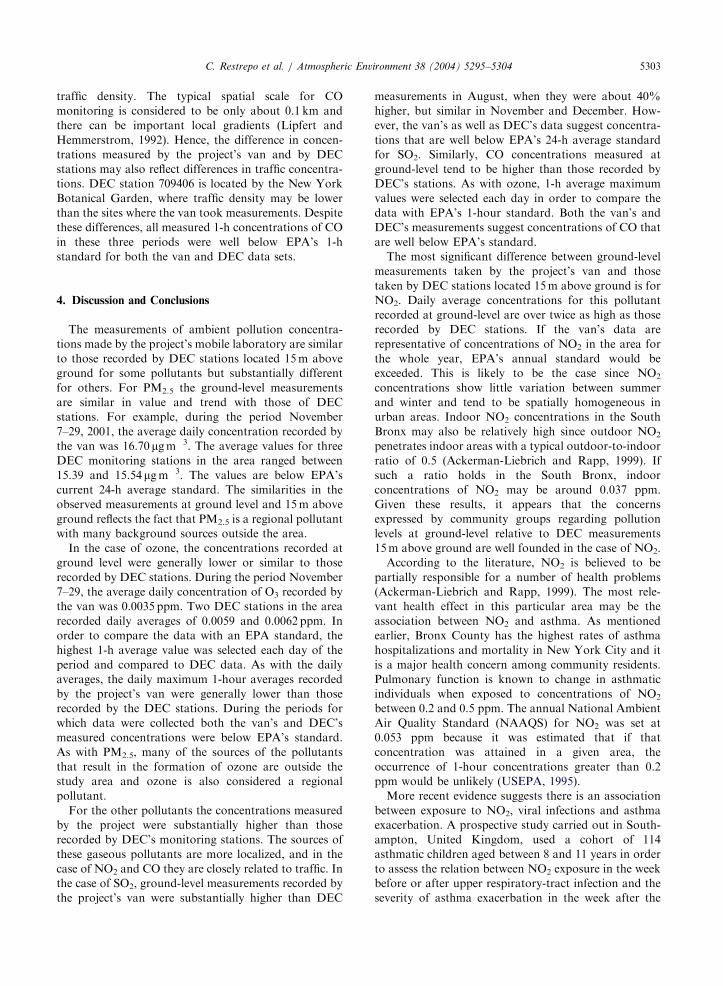
Table 9
CO data
Period of
comparison
Station and
standards
Number of
daily values
Minimum
1–29 August Van 23 1.05
DEC-709406 23 0.70
9–29 November Van 21 1.05
DEC-709406 21 0.71
2–31 December Van 30 0.78
DEC-709406 30 0.54
(Derwent, 1999). Hence, lower concentrations of O3 are
expected to be found closer to ground-level.
3.5. Carbon Monoxide (CO)
As with ozone, the data for carbon monoxide are
presented as daily maximum 1-h concentrations. This
allows the data to be compared to EPA’s 1-h CO
standard, which is currently 35 ppm (USEPA, 2002).
The data are summarized in Table 9 and shown in Fig.
7. DEC station 709406 is the only station which
monitored CO in Bronx County during 2001. These
comparisons suggest that the highest carbon monoxide
1-h averages recorded each day by the project’s van are
generally higher than those recorded by DEC station
709406. The last two columns of Table 9 show the F
values and significance of a one-way ANOVA to test the
hypothesis that the means are equal. The results suggest
that the hypothesis should be rejected in all cases. CO
concentrations in Bronx County are closely related to
11/22/
2001
11/2
6/20
01
12/4
/200
1
12/8
/200
1
12/1
2/20
01
12/1
6/20
01
12/2
0/20
01
12/2
4/20
01
12/2
8/20
01
DEC709406
, daily 1-h maxima, 2001.
Maximum Mean (ppm) Std.
deviation
F p
2.75 1.9624 0.46472 40.971 0.000
2.43 1.1691 0.37052
5.53 2.5637 1.21474 9.501 0.004
4.91 1.5124 0.98350
5.54 2.3904 1.24401 18.048 0.000
3.93 1.2458 0.79377
ARTICLE IN PRESSC. Restrepo et al. / Atmospheric Environment 38 (2004) 5295–5304 5303
traffic density. The typical spatial scale for CO
monitoring is considered to be only about 0.1 km and
there can be important local gradients (Lipfert and
Hemmerstrom, 1992). Hence, the difference in concen-
trations measured by the project’s van and by DEC
stations may also reflect differences in traffic concentra-
tions. DEC station 709406 is located by the New York
Botanical Garden, where traffic density may be lower
than the sites where the van took measurements. Despite
these differences, all measured 1-h concentrations of CO
in these three periods were well below EPA’s 1-h
standard for both the van and DEC data sets.
4. Discussion and Conclusions
The measurements of ambient pollution concentra-
tions made by the project’s mobile laboratory are similar
to those recorded by DEC stations located 15m above
ground for some pollutants but substantially different
for others. For PM2.5 the ground-level measurements
are similar in value and trend with those of DEC
stations. For example, during the period November
7–29, 2001, the average daily concentration recorded by
the van was 16.70 mgm�3. The average values for three
DEC monitoring stations in the area ranged between
15.39 and 15.54mgm�3. The values are below EPA’s
current 24-h average standard. The similarities in the
observed measurements at ground level and 15m above
ground reflects the fact that PM2.5 is a regional pollutant
with many background sources outside the area.
In the case of ozone, the concentrations recorded at
ground level were generally lower or similar to those
recorded by DEC stations. During the period November
7–29, the average daily concentration of O3 recorded by
the van was 0.0035 ppm. Two DEC stations in the area
recorded daily averages of 0.0059 and 0.0062 ppm. In
order to compare the data with an EPA standard, the
highest 1-h average value was selected each day of the
period and compared to DEC data. As with the daily
averages, the daily maximum 1-hour averages recorded
by the project’s van were generally lower than those
recorded by the DEC stations. During the periods for
which data were collected both the van’s and DEC’s
measured concentrations were below EPA’s standard.
As with PM2.5, many of the sources of the pollutants
that result in the formation of ozone are outside the
study area and ozone is also considered a regional
pollutant.
For the other pollutants the concentrations measured
by the project were substantially higher than those
recorded by DEC’s monitoring stations. The sources of
these gaseous pollutants are more localized, and in the
case of NO2 and CO they are closely related to traffic. In
the case of SO2, ground-level measurements recorded by
the project’s van were substantially higher than DEC
measurements in August, when they were about 40%
higher, but similar in November and December. How-
ever, the van’s as well as DEC’s data suggest concentra-
tions that are well below EPA’s 24-h average standard
for SO2. Similarly, CO concentrations measured at
ground-level tend to be higher than those recorded by
DEC’s stations. As with ozone, 1-h average maximum
values were selected each day in order to compare the
data with EPA’s 1-hour standard. Both the van’s and
DEC’s measurements suggest concentrations of CO that
are well below EPA’s standard.
The most significant difference between ground-level
measurements taken by the project’s van and those
taken by DEC stations located 15m above ground is for
NO2. Daily average concentrations for this pollutant
recorded at ground-level are over twice as high as those
recorded by DEC stations. If the van’s data are
representative of concentrations of NO2 in the area for
the whole year, EPA’s annual standard would be
exceeded. This is likely to be the case since NO2
concentrations show little variation between summer
and winter and tend to be spatially homogeneous in
urban areas. Indoor NO2 concentrations in the South
Bronx may also be relatively high since outdoor NO2
penetrates indoor areas with a typical outdoor-to-indoor
ratio of 0.5 (Ackerman-Liebrich and Rapp, 1999). If
such a ratio holds in the South Bronx, indoor
concentrations of NO2 may be around 0.037 ppm.
Given these results, it appears that the concerns
expressed by community groups regarding pollution
levels at ground-level relative to DEC measurements
15m above ground are well founded in the case of NO2.
According to the literature, NO2 is believed to be
partially responsible for a number of health problems
(Ackerman-Liebrich and Rapp, 1999). The most rele-
vant health effect in this particular area may be the
association between NO2 and asthma. As mentioned
earlier, Bronx County has the highest rates of asthma
hospitalizations and mortality in New York City and it
is a major health concern among community residents.
Pulmonary function is known to change in asthmatic
individuals when exposed to concentrations of NO2
between 0.2 and 0.5 ppm. The annual National Ambient
Air Quality Standard (NAAQS) for NO2 was set at
0.053 ppm because it was estimated that if that
concentration was attained in a given area, the
occurrence of 1-hour concentrations greater than 0.2
ppm would be unlikely (USEPA, 1995).
More recent evidence suggests there is an association
between exposure to NO2, viral infections and asthma
exacerbation. A prospective study carried out in South-
ampton, United Kingdom, used a cohort of 114
asthmatic children aged between 8 and 11 years in order
to assess the relation between NO2 exposure in the week
before or after upper respiratory-tract infection and the
severity of asthma exacerbation in the week after the
ARTICLE IN PRESSC. Restrepo et al. / Atmospheric Environment 38 (2004) 5295–53045304
start of an infection. The authors conclude that high
exposure to NO2 the week before the start of a
respiratory viral infection is associated with an increase
in the severity of a resulting asthma exacerbation
(Chauhan et al., 2003).
Although it is clear that DEC has sited its monitoring
stations in compliance with current regulations, the
measurements of NO2 concentrations at ground-level
made by the project’s van suggest that the use of DEC
data in health studies could underestimate human
exposures to this pollutant in the South Bronx. More-
over, evidence from a number of health studies suggests
that this pollutant could pose important health risks in
the project area. More research should be carried out to
ensure that ground-level concentrations of NO2 in this
area are within EPA’s standard. A future research
direction should be to take measurements at the same
location as DEC’s stations in order to make more direct
comparisons between measurements at various heights
and 15 meters above ground in order to obtain more
detailed information about the vertical profile of NO2.
Both street level measurements provided by the van and
broader areawide measurements provided by the DEC
stations are valuable measures of air quality in the South
Bronx, and a means to use both results with appropriate
comparisons is an important basis for policy. Such
comparisons would have important policy implications
if the ground-level measurements are found to be
consistently higher than DEC station measurements.
Since NO2 in the area is produced mostly by high traffic
densities associated with heavy concentrations of waste
transfer stations and other commercial and industrial
activities, such findings would help policymakers make
better decisions about the siting of facilities that impact
traffic patterns and air quality in the area.
Acknowledgements
Supported by US EPA Agreement X-982152. The
project has benefited enormously from the participation
of four South Bronx community groups: The Point
Community Development Corporation, We Stay/Nos
Quedamos, Sports Foundation, Inc., and Youth Minis-
tries for Peace and Justice, Inc. This work was also
supported by the following grants: NIEHS Center of
Excellence (ES00260) and US EPA PM Health Research
Center (R827351).
References
Ackermann-Liebrich, U., Rapp, R., 1999. Epidemiological
Effects of Oxides of Nitrogen, Especially NO2. In:
Holgate, S., Samet, J., Koren, H., Maynard, R. (Eds.),
Air Pollution and Health. New York, Academic Press,
pp. 561–584.
Carr, W., Zeitel, L., Weiss, K., 1992. Variations in asthma
hospitalizations and deaths in New York City. American
Journal of Public Health 82 (1), 59–65.
Chauhan, A., Inskip, H., Linaker, C., Smith, S., Schreiber, J.,
Johnston, S., Holgate, S., 2003. Personal exposure to
nitrogen dioxide (NO2) and the severity of virus-induced
asthma in children. The Lancet 361, 1939–1944.
Code of Federal Regulations. 2002. Environmental Protection
Agency. Appendix E to Part 58 – Probe and Monitoring
Path Siting Criteria for Ambient Air Quality Monitoring, 40
CFR (Chapter I). (7-1-02 ed). pp. 273–285.
De Palo, V., Mayo, P., Friedman, P., Rosen, M., 1994.
Demographic Influences on Asthma Hospital Admission
Rates in New York City. Chest 106 (2), 447–451.
Derwent, R., 1999. Atmospheric Chemistry. In: Holgate, S.,
Samet, J., Koren, H., Maynard, R. (Eds.), Air Pollution and
Health. New York, Academic Press, pp. 51–62.
Harrison, R., 1999. Measurements of Concentrations of Air
Pollutants. In: Holgate, S., Samet, J., Koren, H., Maynard,
R. (Eds.), Air Pollution and Health. New York, Academic
Press, pp. 63–82.
Lipfert, F., Hammerstrom, T., 1992. Temporal Patterns in Air
Pollution and Hospital Admissions. Environmental Re-
search 59, 374–399.
United States Environmental Protection Agency (USEPA),
1995. Review of the National Ambient Air Quality
Standards for Nitrogen Dioxide Assessment of Scientific
and Technical Information. Office of Air Quality Planning
and Standards (OAQPS) Staff Paper.
United States Environmental Protection Agency (USEPA),
2002. National Ambient Air Quality Standards (NAAQS).
ohttp://www.epa.gov/air/criteria.html4 (accessed 30,
2003).
Zimmerman, R., Restrepo, C., Hirschstein, C., Holguı́n-Veras,
J., Lara, J., Klebenov, D., 2002. South Bronx environmental
studies, public health and environmental policy analysis:
Final Report for Phase I. ohttp://www.epa.gov/air/criteria
.html4 (accessed date 30, 2003).