in vitro evaluation of marginal microleakage in restorations
Upload
khangminh22Category
view
2download
0
University of IowaIowa Research Online
Theses and Dissertations
2014
A comparison of gingival marginal adaptation andsurface microhardness of class II resin basedcomposites (conventional and bulk fill) placed inlayering versus bulk fill techniquesMohamed Ahmed Anis AbouelnagaUniversity of Iowa
Copyright 2014 Mohamed Ahmed Abouelnaga
This dissertation is available at Iowa Research Online: http://ir.uiowa.edu/etd/1281
Follow this and additional works at: http://ir.uiowa.edu/etd
Part of the Other Dentistry Commons
Recommended CitationAbouelnaga, Mohamed Ahmed Anis. "A comparison of gingival marginal adaptation and surface microhardness of class II resin basedcomposites (conventional and bulk fill) placed in layering versus bulk fill techniques." MS (Master of Science) thesis, University ofIowa, 2014.http://ir.uiowa.edu/etd/1281.

1
A COMPARISON OF GINGIVAL MARGINAL ADAPTATION AND SURFACE
MICROHARDNESS OF CLASS II RESIN BASED COMPOSITES
(CONVENTIONAL AND BULK FILL) PLACED IN LAYERING VERSUS BULK
FILL TECHNIQUES
by
Mohamed Ahmed Anis Abouelnaga
A thesis submitted in partial fulfillment
of the requirements for the Master of
Science degree in Operative Dentistry
in the Graduate College of
The University of Iowa
August 2014
Thesis Supervisors: Professor Gerald Denehy Professor Steven Armstrong

2
Copyright by
MOHAMED AHMED ANIS ABOUELNAGA
2014
All Rights Reserved

2
Graduate College
The University of Iowa
Iowa City, Iowa
CERTIFICATE OF APPROVAL
_______________________
MASTER'S THESIS
_______________
This is to certify that the Master's thesis of
Mohamed Ahmed Anis Abouelnaga
has been approved by the Examining Committee
for the thesis requirement for the Master of Science
degree in Operative Dentistry at the August 2014 graduation.
Thesis Committee: ___________________________________ Gerald Denehy, Thesis Supervisor
___________________________________ Steven Armstrong, Thesis Supervisor
___________________________________ Deborah S Cobb
___________________________________ Rodrigo Maia
___________________________________ Fang Qian

ii
To my parents, for their unconditional love and encouragement.
To all my family and friends, who in one way or another participated on this journey.

iii
3
ACKNOWLEDGMENTS
I would like to express my deepest gratitude to my mentor, Dr. Gerald Denehy, an
example of a person and a professional, who I had great pleasure to work with. Throughout
my thesis project he guided me and helped me make the most appropriate decisions. My
sincere thankfulness also goes to my thesis committee, who’s support, encouragement and
insightful comments were fundamental for the completion of my work. I would like to
deeply thank Dr. Steven Armstrong, my co-mentor in this project, for sharing his
phenomenal knowledge in the field of adhesion and marginal adaptation field of resin based
composites. Thanks for helping me to develop the methodology for my research project
and my critical thinking throughout these years. Thanks also to Dr. Deborah Cobb, who as
program director was always supportive and willing to help not only in my thesis project
but also in the entire master program. Special thanks goes to Dr. Fang Qian for providing
excellent and detailed statistical analysis. I also want to thank Dr. Rodrigo Maia for his
friendship and suggestions in my thesis project. Thanks to all my committee members for
the significant guidance on how to report the results in my thesis and continuous
suggestions to improve the quality of my research project and thesis.
I would like to acknowledge the manufacturers for their donation of materials:
Ivoclar Vivadent, Dr. Shashikant Singhal who was always there to help me with the
materials support and even to develop some steps of my methodology.
My gratitude is also due to all members of the Operative Dentistry Department,
faculty, staff and graduate students, who directly or indirectly helped me going through my
master program and in finishing my thesis. Thanks for making my life easier and my time
in Iowa enjoyable.

iv
4
TABLE OF CONTENTS
LIST OF TABLES ................................................................................................... vii
LIST OF FIGURES ................................................................................................ viii
LIST OF ABBREVIATIONS ................................................................................... xi
CHAPTER I INTRODUCTION ........................................................................... 1
Purpose of the study ................................................................................ 3
Research Hypotheses .............................................................................. 3
CHAPTER II LITERATURE REVIEW ............................................................... 5
Tooth Composition ................................................................................. 5
Enamel and Dentin Composition ........................................................ 5
History and Evolution ............................................................................ 8
Chemical Composition ......................................................................... 10
Classifications ................................................................................... 11
Posterior Restorations ........................................................................ 13
Adhesion and Bonding ......................................................................... 13
Polymerization Reaction ...................................................................... 20
Dental Photopolymerization .............................................................. 21
Polymerization Shrinkage ................................................................. 23
Mechanical and Physical Properties ..................................................... 24
Surface Micro-hardness ..................................................................... 25
Cavity Designs for Class II Resin Based Composites .......................... 29
Resin Based Composite Failures Related to the Class II Cavity
Design ................................................................................................... 31
Polymerization Shrinkage and C-factor ............................................ 31
Marginal Adaptation of Resin Based Composites (Marginal Gaps) . 33
Methods Introduced to Overcome Resin Based Composite Failures
with
Class II Restorations ............................................................................. 36
Different Techniques of Placement ................................................... 37
Incremental Placement Technique ................................................ 37
Bulk Placement Technique ............................................................ 39
Tetric EvoCeram and Tetric EvoCeram Bulk Fill Resin Based
Composites .................................................................................... 41
Comparing the Degree of Polymerization Shrinkage and
Marginal Adaptation using One Type of Resin Based
Composite Placed with Different Techniques (Layering versus
Bulk) ............................................................................................. 42
Comparing the Degree of Polymerization Shrinkage and

v
5
Marginal Adaptation using Different Types of Resin Based
Composites Placed with Different Techniques (Layering versus
Bulk) ............................................................................................. 43
Degree of Polymerization Shrinkage and Cuspal Deflection of
Teeth using Different Placement Techniques (Layering versus
Bulk) in Class II Posterior Cavities .............................................. 49
Resistance to Fracture ................................................................... 56
Creep Tendency ............................................................................ 57
Cavity Liners ....................................................................................... 59
Snowplow Technique.......................................................................... 60
Pre-heated Resin Based Composites ................................................... 60
Summary ............................................................................................... 62
CHAPTER III MATERIALS AND METHODS ................................................ 64
Overview ............................................................................................... 64
Research Question ............................................................................ 66
Methodology ......................................................................................... 66
Independent Variables ..................................................................... 66
Standardized Criteria ....................................................................... 66
Dependent Variables ........................................................................ 67
Experimental Groups ............................................................................ 67
Teeth Preparation .................................................................................. 68
Cavity Design................................................................................... 69
Restorative Procedure ........................................................................... 71
Matrixing of the Preparation ............................................................ 71
Adhesion Procedures ....................................................................... 73
Restorative Material Placement ....................................................... 76
SEM Sample Preparation and Image Capture ...................................... 79
Randomization and Blinding ................................................................ 83
Gingival Margins Evaluation ................................................................ 83
Scoring Criteria ................................................................................ 86
Surface Micro-hardness Testing ........................................................... 87
Pilot Study ............................................................................................ 89
Power Analysis ................................................................................ 90
Statistical Analysis ................................................................................ 90
Variables .......................................................................................... 91
Overall Statistical Methods ................................................................... 91
CHAPTER IV RESULTS .................................................................................... 93
Difference in Gingival Marginal Gap Scores between the Four
Tested Groups at the Distal and Mesial Surfaces ................................ 93
Difference in Gingival Marginal Gap Scores between the Mesial and
Distal Surfaces of Each Group of the Four Groups .............................. 95
Difference in the Internal Surface Micro-hardness (KHN) Scores
between the Three Different Layers (Depths) Tested of Each Group

vi
6
of the Four Tested Groups at the Distal and Mesial Surfaces ............. 97
Group 1 (bulk fill RBC, placed in bulk) ............................................ 97
Group 2 (bulk fill RBC, placed in layers) ........................................ 100
Group 3 (conventional RBC, placed in layers) ................................ 102
Group 4 (conventional RBC, placed in bulk) .................................. 105
Difference in the Internal Surface Micro-hardness (KHN) Scores
between the Four Tested Groups at the Distal and Mesial Surfaces .. 107
Difference in the Internal Surface Micro-hardness (KHN) Scores
between the Mesial and Distal Surfaces of Each Group of the Four
Tested Groups ..................................................................................... 110
Statements on Research Hypotheses .................................................. 112
Typical SEM Images of Tested Groups .............................................. 113
CHAPTER V DISCUSSION ......................................................................................... 117
Light Curing Source and Radiant Energy Exposure ........................... 117
Radiant Energy Exposure Standardization in Air ............................ 118
Radiant Energy Exposure Measurement in Resin Based
Composites ..................................................................................... 119
Polymerization Reaction and Depth of Cure ..................................... 121
Quantitative Marginal Analysis ......................................................... 122
Experimental Procedures .................................................................... 124
Replica Technique .......................................................................... 124
SEM Data Interpretation ................................................................. 124
Internal Surface Micro-hardness ..................................................... 125
Limiting Psychomotor Skills Variability ............................................ 126
Effect of Resin Based Composite Type and Placement Technique
on the Gingival Marginal Adaptation ................................................. 127
Effect of Resin Based Composite Type and Placement Technique
on the Internal Surface Micro-hardness .............................................. 130
Standardization of Procedures ........................................................... 133
Limitations of the Study ..................................................................... 134
Strengths of the Study ......................................................................... 135
Clinical Significance .......................................................................... 135
Future Research Suggestions .............................................................. 135
CHAPTER VI CONCLUSION ......................................................................... 137
APPENDIX ………………………………………………………………………………...…………….138
Descriptive Statistics for External Marginal Gap and Internal
Surface Micro-hardness by RBC Groups………...………...……..…138
Gingival Marginal Gaps of Each Image of the Seven Images Taken
For the Margins tested on the Mesial and Distal of Each Tooth ..…..141
REFERENCES ...................................................................................................... 142
vii
7
LIST OF TABLES
Table
1. Composition of resin based composites (Tetric EvoCeram system) ................... 65
2. Syntac bonding system composition (Ivoclar Vivadent) .................................... 73
3. The light curing time for each group ................................................................... 77
4. Scoring criteria illustrated with SEM images. ..................................................... 84
5. Results of one-way ANOVA for external marginal gap at distal surface. ........... 93
6. Results of one-way ANOVA for external marginal gap at mesial surface. ......... 94
7. Comparisons of External marginal gap among four resin composite restorative groups. .................................................................................................................. 95
8. Number of gap free margins and voids in the different restorative groups ......... 97
9. Comparisons of internal surface micro-hardness among three surface levels
within Bulk RBC placed in bulk technique (BB) group ......................................98
10. Comparisons of internal surface micro-hardness among three surface levels
within Bulk RBC placed in two layers (BL) group ...................................... ...101
11. Comparisons of internal surface micro-hardness among three surface levels
within conventional RBC placed in two layers (CL) group ............................103
12. Comparisons of internal surface micro-hardness among three surface levels
within conventional RBC placed in bulk technique (CB) group .....................106
13. Results of one-way ANOVA for internal surface micro-hardness at distal
surface. .......................................................................................................... ...108
14. Results of one-way ANOVA for internal surface micro-hardness at Mesial Surface. ............................................................................................................ 109
15. Comparisons of internal surface micro-hardness among four resin composite
restorative groups .............................................................................................111
16. Radiant energy exposure standardization in air…………………...……….…119
17. Radiant energy exposure measurement in resin based composites…..….……120
viii
8
LIST OF FIGURES
Figure
1. A flow chart of the step by step protocol of the study ......................................... 68
2. Flattened teeth on the occlusal, mesial and distal surfaces. ................................. 69
3. CNC Specimen Former machine used for standardizing cavity preparations.
b) mounted teeth for the CNC machine. c) standardized cavity preparations on
the mesial and distal of each tooth. ...................................................................... 70 4. a) teeth placed in putty for restorative procedures. b) placement of a tofflemire matrix band between both teeth. c) pushing teeth tight with a C-clamp.............. 72
5. a) Tetric EvoCeram Bulk Fill, b) Tetric EvoCeram filling material .................... 74
6. Ultra etch (UltraDent Products, Inc) .................................................................... 75
7. Syntac bonding system ........................................................................................ 75
8. Accurate measurement of the resin based composite increments ........................ 76
9. Restored tooth on the mesial and distal ............................................................... 78
10. a) impression of the margins b) Tooth out of the impression material.
c) replica after complete setting from the impression ........................................ 80
11. Gold sputter coating the replica for SEM examination. .................................... 81
12. The epoxy resin replica after gold sputtering .................................................... 81
13. a) The whole margins showing under magnification of 30X. b) the seven
images stitched together at 200 X using computer software. ............................ 82
14. a) Measuring the width of the restoration Buccolingually and marking with
Pencil at point of 1.99mm to section in this area. b) re-assuring
measurements and sectioning of teeth using the Isomet machine. .................... 87
15. a) teeth sectioned (occlusal view), b) teeth sectioned (Proximal view). ............ 88
16. Comparison of external marginal gaps between the four groups
(distal surface) .................................................................................................... 94
ix
9
17. Comparison of external marginal gaps between the four groups (mesial
surface).........................................................................................................…..94
18. Comparison of external marginal gaps between the mesial and distal surfaces of the four groups ............................................................................................... 96
19. Comparison between the three surface levels of internal surface
micro-hardness in the BB group (distal surface)…....……….……………......99
20. Comparison between the three surface levels of internal surface
micro-hardness in the BB group (mesial surface) .............................................. 99
21. Comparison between the three surface levels of internal surface
micro-hardness in the BL group (distal surface) .............................................. 101
22. Comparison between the three surface levels of internal surface
micro-hardness in the BL group (mesial surface)……..………...……………102
23. Comparison between the three surface levels of internal surface
micro-hardness in the CL group (distal surface)……………………………..104
24. Comparison between the three surface levels of internal surface
micro-hardness in the CL group (mesial surface)...………..…………..……104
25. Comparison between the three surface levels of internal surface
micro-hardness in the CB group (distal surface) ............................................. 106
26. Comparison between the three surface levels of internal surface
micro-hardness in the CB group (mesial surface)………………………...….107
27. Comparison of the internal surface micro-hardness between the four groups
tested (distal surface).………….......................................................................109
28. Comparison of the internal surface micro-hardness between the four groups
tested (mesial surface)……………………………………………...….…..…109
29. Comparison of internal surface micro-hardness between the mesial and distal
surfaces of the four groups…………………..…………...…...…………..….111
30. Typical SEM picture of group 1 (bulk RBC placed in bulk, BB) gingival
Marginal interface under magnification of 200X.............................................113
31. Typical SEM picture of group 2 (bulk RBC placed in layers, BL) gingival
Marginal interface under magnification of 200X……………………………114

x
10
32. Typical SEM picture of group 3 (conventional RBC placed in layers, CL)
Gingival marginal interface under magnification of 200X………..…………115
33. Typical SEM picture of group 4 (conventional RBC placed in bulk, CB)
Gingival marginal interface under magnification of 200X…………..…..…..116

xi
11
LIST OF ABBREVIATIONS
RBC: Resin based composite
BB: Bulk Fill RBC, placed in bulk technique
BL: Bulk Fill RBC, placed in layering technique
CL: Conventional RBC, placed in layering technique
CB: Conventional RBC, placed in bulk technique
CNC Specimen Former: Computer numerically controlled specimen former
SEM: Scanning electron microscope
LED: Light emitting diode
QTH: Quartz tungsten halogen

1
1
CHAPTER I
INTRODUCTION
In recent years, major advancements in restorative materials have been made in the
field of dentistry. These innovations have included changes in restorative materials,
instruments utilized in their manipulation and placement and, more importantly, the
methods of diagnosing, treatment planning, and preparing and restoring teeth. A material
that has played a very important role in these changes is resin based composite.
Advances in RBC materials and bonding systems have effectively changed many
of the principles for cavity preparation; from that of extension for prevention to preserving
tooth structure and using a minimally invasive technique according to the caries extension
(Summitt 2006), In addition to conservation, RBC’s have other provided advantages
including reinforcement of tooth structure and patient esthetics. Although originally used
primarily in the anterior teeth, improved physical properties and patient demand for
esthetics have greatly increased their uses in Class I and Class II restorations. RBC
restorations have now become the most commonly used direct restorative material placed
by dentists.
Along with their positive properties, RBC’s also exhibit certain disadvantages.
Marginal leakage is a major concern and cause of many of failures. A major reason for
marginal leakage is polymerization shrinkage (Hickel and Manhart 2001) which is present
in all RBC’s. Current RBC’s including flowable types exhibit a volumetric polymerization
shrinkage ranging from less than one to six percent (Kleverlaan and Feilzer 2005). Potential
for the effect of shrinkage can be determined by the C- Factor, the ratio is of bonded to
unbonded tooth surfaces. As the C-Factor increases, stresses on RBC’s and the probability
of marginal leakage also increased (Feilzer, De Gee et al. 1987). The C-Factor is considered

2
2
to be higher in posterior cavity preparations because their design often results in an increase
in the ratio of bonded to unbonded walls, (Davidson and Feilzer 1997).
Gingival cavo-surface margins of Class II restorations can be an early area of failure
(Moffa 1989). Possible causes include limited access of proximal boxes making the
placement of the material more challenging, insufficient polymerization of the RBC at the
gingival wall, and the high C-Factor characteristic of the box shape and the adhesive
bonding to the cervical tooth structure. This contribute to the increase in polymerization
shrinkage stresses during the setting reaction of the material (Sabatini 2007).
Many studies have looked at methods to improve marginal adaptation and reduce
the rate of polymerization shrinkage. These include layering techniques (Feilzer, De Gee
et al. 1987, Usha, Kumari et al. 2011), placement of liners (Chuang, Jin et al. 2004), heating
the RBC and pressure with two different RBC’s (Snow-plow technique) (Opdam, Roeters
et al. 2003, Chuang, Jin et al. 2004). Most of these studies have been done with
conventional RBC’s.
Although conventional RBC’s have typically been placed in layers not exceeding
2mm thick, the advent of newer high intensity lights, and the recent introduction by
manufacturers of modified resin systems which claim bulk cure up to 4 mm may offer
advantages to dentists in terms of simplicity and speed of Class II RBC placement. It is
important however with these new bulk fill systems, that the physical properties, marginal
adaptation and degree of conversion of the RBC restoration are not negatively affected.
More research is needed in this area before the products can be fully endorsed.
Studies have shown that the depth of cure and the degree of hardness was a direct
indication of the degree of polymerization of the RBC systems (Ferracane and Greener
1984, Ferracane 1985, DeWald and Ferracane 1987). Many of these studies accepted the
method of knoop hardness number (KHN) testing as an accurate indirect measurement of
the hardness of the RBC’s (Ferracane 1985).

3
3
Purpose of the Study
The purpose of this study was to compare the techniques of layering versus bulk
placement with a conventional RBC and a bulk fill RBC. Two areas were to be examined.
The first area was polymerization shrinkage as exhibited by the marginal adaptation of the
RBC to the gingival cavo-surface margin of the restorations. The second area was
determination of the degree of conversion measured by Knoop hardness numbers (KHN)
at different levels (depths) of the restoration.
Research Hypotheses
The five main null hypotheses proposed in this study were:
1) There is no difference in gingival marginal adaptation among different groups
restored with RBC (bulk fill and conventional types) placed in bulk or in
layering technique at the mesial and distal surfaces
2) There is no difference in gingival marginal adaptation between the mesial and
distal surfaces within each group restored with RBC (bulk fill and conventional
types) placed in bulk or in layering technique
3) There is no difference in the internal surface micro-hardness (KHN) among the
three different levels of measurements within each group restored in RBC (bulk
fill and conventional types) placed in bulk or in layering technique on the mesial
and distal surfaces
4) There is no difference in the internal surface micro-hardness (KHN) among
different groups restored with RBC (bulk fill and conventional types) placed in
bulk or in layering technique at the mesial and distal surfaces

4
4
5) There is no difference in the internal surface micro-hardness (KHN) between
the mesial and distal surfaces within each group restored with RBC (bulk fill
and conventional types) placed in bulk or in layering technique

5
5
CHAPTER II
REVIEW OF LITERATURE
Tooth Composition
Enamel and Dentin Composition
Enamel is the hardest and most mineralized tissue found in humans (AR 1985). Its
main component is inorganic (96% by weight and 86% by volume) composed of
hydroxyapatite crystals. Enamel also has a small volume of organic matrix in addition to
4% to 12% water which can be found intercrystalline and in the micropores of enamel rods.
These channels form some sort of communication with the pulpal tissue and the dentinal
tubules (Summitt 2006). Enamel has the property of brittleness due to the fact that its
inorganic content is high. Enamel is non vital and insensitive, therefore regeneration is
impossible after structure loss (AR 1985). Enamel is arranged in prisms or rods which are
parallel to each other but perpendicular to the tooth surface (Summitt 2006). The
interprismatic substance is found between these rods. Maturation of enamel and its
components results in increased mineral content which leads to high resistance against
demineralization (Lopes, Thys et al. 2007). Enamel surface acts as a semi-permeable
membrane where it has the ability to exchange substances and components with the outer
environment. Therefore fluoride containing water and tooth pastes result in the diffusion
of fluorides into the enamel structure to form fluoroapatite crystals which are more resistant
to demineralization. When teeth become dehydrated during mouth breathing or rubber dam
isolation, the color becomes whiter as the micropores lose water, however the condition is
reversible once the teeth are rehydrated. Teeth discoloration and darkness with aging may

6
6
be attributed to increased translucency of enamel or accumulation of trace elements in the
enamel structure or even the sclerosis of the dentin structure (Summitt 2006).
Normally the outer surface of the enamel layer is hyper-mineralized (Albers 2002).
The Striae of Retzius are found also in the enamel where they run perpendicular from the
dentino-enamel junction to the outer surface of enamel creating a parallel pattern of lines
which appear over the surface of these striae called perikymata. These striae result from
the formation of enamel and may represent growth lines (Heymann, Swift et al. 2012).
Caries in enamel is initiated by bacterial degradation of carbohydrates in the mouth where
the PH of the oral cavity is decreased and acidity is increased. Caries is caused as result of
a demineralization process of enamel due to the under-saturation of minerals and their
diffusion out of the enamel and insufficient remineralization (Featherstone 2008). Five
different zones can be seen in enamel lesions which are; 1) surface zone (less than 5%
mineral loss), 2) body of the lesion (5%-30% mineral loss), 3) dark zone (2%-4% mineral
loss), 4) translucent zone (1% mineral loss) and normal enamel (Hiremath 2011).
Dentin is the structure underlying the enamel which acts as a cushion for the brittle
enamel. It is more elastic as its inorganic content is less than (50% by volume) and its
organic content is 30% by volume. The organic phase in dentin is composed of around 90%
type one collagen and 10% non-collagen protein. Dentin consists primarily of dentinal
tubules extending from the pulp to the dentino-enamel junction (Heymann, Swift et al.
2012). These tubules are more dense and wider towards the pulp (45,000/mm and 2- 2.8
um wide) and less dense (20,000/mm2) and narrower (0.8 um) closer to the dentino-enamel
junction (Summit third edition Quintessence, 2006). The dentinal tubules contain the
dentinal fluids and odontoblasts which help in formation of dentin and pulp and are
considered an extension of the pulp morphology. The dentin is heterogeneous unlike
enamel (homogenous) and is composed of peritubular and intertubular dentin. Peritubular
dentin is hypermineralized whereas the intertubular dentin is less mineralized and contains

7
7
higher collagen content (Summitt 2006). The permeability of the dentin varies depending
on the area of the tooth surface. The coronal dentin is much more permeable compared
with the root dentin; also there are some differences in permeability within the coronal root
dentin. The permeability of dentin mainly depends on the diameter and thickness of the
remaining dentin. Dentinal tubules near the pulp are numerous, short and have large
diameters making deep dentin a less effective pulpal barrier compared with the superficial
dentin (Heymann, Swift et al. 2012). This difference in permeability makes bonding of
RBC’s different than enamel (Pashley 1989). The smear layer is a layer created during
preparation of a cavity using hand or rotary instruments. The thickness of this layer can
range from 1um-2um (Pashley 1992). Adhesion to enamel is much easier than adhesion to
the dentin substrate as enamel is made primarily from hydroxyapatite crystals with high
surface energy where dentin is composed of two different substrates, hydroxyapatite and
collagen, with low surface energy (Heymann, Swift et al. 2012). When teeth are prepared,
cutting debris is deposited on the surface of the prepared cavity forming what is known as
the smear layer. Removal of this layer is recommended to achieve a good bond between
the RBC and dentin. The removal of the smear layer is mainly done by etching of the dentin
with phosphoric acid (Summitt 2006). The process in the formation of a carious lesion in
dentin is not different than enamel as the demineralization process occurs in the presence
of bacteria and fermentable carbohydrates. The layers of carious lesions in dentine are; 1)
outer infected dentine (cavitated, irreversible) 2) turbid layer (affected dentine, reversible)
3) transparent layer (affected dentine, reversible) and 4) sub-transparent (affected dentine,
reversible) (Hiremath 2011).
8
8
History and Evolution
Dental materials have undergone major changes in properties and characteristics.
(Buonocore 1955) greatly enhanced the development of RBC’s by recommending acid
etching of enamel prior to placement of adhesive and RBC restorative material (Bowen
1982). These new techniques changed a key principle of G.V Black which was extension
for prevention (Black 1917). In addition these advancements in adhesive dentistry made
dentists depend more on adhesion rather than the mechanical means for retention. Cavity
preparation became more conservative and defect specific, preserving more tooth structure
(Bowen 1982).
Silicates were invented in 1878 and these materials are considered to be the first
tooth colored restorative materials invented for esthetic dentistry (Heymann, Swift et al.
2012). This material had many disadvantages such as, high coefficient expansion and
contraction, low color stability and weak adhesion to tooth structure. Thus researchers
sought a better material with greater physical and mechanical properties (Bowen 1956).
RBC’s were developed in the 1960's and offered a large esthetic advancement (Schulein
2005). RBC’s later became known as reinforced polymers. Early RBC’s were introduced
as a base and catalyst which were mixed together to start a chemical reaction and were
called self-cured RBC’s. These early types also had limitations such as incorporation of
voids and air bubbles while mixing, which directly affected the esthetic and the mechanical
outcome of the restorations. In the 1970's, new RBC’s were developed that became
activated by ultraviolet wavelengths (UV). Subsequent improvements and developments
led to curing RBC’s using visible light. This curing method is now used widely in dental
practices (Kwon, Bagheri et al. 2012)
Early RBC’s were used primarily for restoring anterior restorations because of their
large filler particles and resin content which had significant wear in the oral cavity. These

9
9
properties contraindicated them for use in high stress bearing areas such as posterior Class
I or II cavities (NJM 1997). Researchers worked to enhance the filler particle size and
volume of RBC’s to improve their functional and chemical properties. Developments were
made in the filler particle size, volume, shape and distribution which resulted in improved
physical, mechanical and functional properties (Moszner 2007). Dentists increasingly used
these new types with modified filler structure in high stress bearing areas such as posterior
teeth after many articles and studies were published testing those materials under different
stress and load conditions and confirming the success of these restorations (Letzel 1989,
Rowe 1989, Qvist, Johannessen et al. 1992).
Fillers added to dental RBC’s improve the translucency, reduce the coefficient of
thermal expansion and polymerization shrinkage of the RBC; and make the material harder,
denser, and more resistant to wear. The addition of fillers has a maximum limit where by
adding more than these limits the material may become too viscous for clinical use
(Summitt 2006). RBC may exhibit a wide range of filler particle size which affects the
properties of these restorations and indications for their use. This broad spectrum of
properties and clinical application gives versatility to the material. Current RBC restorative
materials provide patients with improved physical properties as well many options in shade
and opacity, providing highly esthetic and functional restorations.
Bonding to tooth structure not only allowed cavity preparations to become defect
specific, but also enhanced the mechanical properties of the restoration and tooth structure.
Bonded RBC’s reduce the chance of cuspal fracture compared to other restorations such as
amalgam (Roeters, Shortall et al. 2005). Retention of restorations also was improved by
bonding (Hinoura, Setcos et al. 1988). RBC’s have low thermal conductivity and electrical
conductivity decreasing sensitivity and post-operative pain. The majority of the
restorations are radiopaque making it easier to differentiate them from tooth structure in
radiographs.

10
10
RBC development has greatly affected the field of dentistry. Many problems and
limitations were overcome, but some limitations still remain that pose problems for
clinicians and patients. In order to better understand these problems and the methods
proposed to overcome them, we must first understand the chemistry and the basic
composition of these tooth colored restorations and the mechanism of bonding to tooth
structure.
Chemical Composition
RBC’s are made up of four main components; the polymer organic matrix, filler
particles, coupling agents and the initiator. The polymer matrix is the main component of
RBC’s to which the other components are added. Inorganic filler particles increase the
mechanical and physical properties of the RBC. RBC’s have high mechanical properties
and stability because of the good bond formed between resin matrix and the inorganic filler
particles using a silane coupling agent (Heymann, Swift et al. 2012). Filler particles are
coated with silane before mixing them to the unreacted organic matrix. The purpose of the
coupling agent is to transfer stresses to the particles in order to improve strength and
mechanical properties of RBC’s (Pierre 2011). RBC’s are supplied in many consistencies
and viscosities. The degree of viscosity is directly affected by the shape, content and size
of the resin matrix and filler particles (Lee, Um et al. 2006).
Most RBC’s have matrices based on the bis-GMA (bisphenol-A-glycidyl
methacrylate) resin while some others use UDMA (urethane dimethacrylate) and still
others use a combination of these two monomers. Generally bis-GMA is highly viscous,
so in order to increase the handling properties in clinical practice, lower molecular weight
diluents are added called TEGDMA (triethylene dimethacrylate). Other materials are also
used as diluents such as the EGDMA ethylene glycol dimethacrylate to decrease viscosity

11
11
(Peutzfeldt, 1997). Usually 75% bis-GMA is used in combination with 25% TEGDMA in
order to get a good consistency of the material for application.
The origin of fillers can be from triflouride, ytterbium, aluminum oxide, silicon
dioxide, quartz and glass and colloidal silica. The microfine particles are derived from the
colloidal silica where the fine particles are driven from glass and quartz. The smaller sized
filler particles have shown better polishing properties than the large sized irregular filler
particles (Marghalani 2010).
Classifications
RBC’s have been classified in a variety of methods to include by filler content and
particle size. Five main groups have been classified as macrofill, microfill, fine particle,
nanofill and hybrid RBC’s. Differences in the filler content and resin matrix affect the
viscosity of the material and make possible the flowable and packable RBC’s (Heymann,
Swift et al. 2012).
The first RBC type was introduced in the 1960's and was known as, traditional or
macrofill RBC. These RBC’s had large filler particles with average size of 8 um and high
filler loading (75%-80% by weight) which produced high amounts of wear and a rough
surface. In the 70's, microfill RBC’s (microfine) were introduced with very small particle
size of 0.04-0.01um resulting in smoother surfaces and better polishing properties, Fillers
were 35%- 60% by weight. However the microfill RBC’s exhibited lower mechanical and
physical properties and more of a tendency for chipping. Hybrid RBC’s were introduced
to try to combine the high mechanical properties of the macrofill RBC’s and the smooth
surface of the microfills and have replaced the macrofill RBC’s. These materials have high
filler content (75%-85% by weight) and an average filler size of (0.4-1um) that provide
good mechanical and physical properties. The latest generation of RBC’s developed was
12
12
the nanofill RBC’s. Nanofills contain extremely small sized fillers (0.005um-0.01um). It
is common for hybrid RBC’s to incorporate some nano sized filler particles into their
composition to optimize the material further. High filler content can be incorporated in the
nanofills which results in good physical properties and improved esthetics. These nanofills
and nanohybrids have become the most commonly used RBC’s in dentistry due to their
enhanced mechanical and esthetic properties (Heymann, Swift et al. 2012).
More recently two types of RBC’s have been introduced into the market, the
packable and flowable RBC’s. Packable RBC’s were introduced as having similar
condensing capabilities to amalgam. Methods were used to increase the viscosity of these
RBC’s by increasing the filler content and size, adding glass fibers or modifying the matrix.
The aim of these materials was to have similar packing properties as amalgams providing
greater ease in restoring proximal contacts compared to other RBC material. Packable
RBC’s failed to accomplish this goal because of the increased viscosity of the material
(Heymann, Swift et al. 2012).
Flowable RBC’s have less filler content (44% to 54% by weight) and are less
viscous than regular RBC’s. Flowable RBC’s exhibited lower mechanical properties due
to the reduced filler content. Flowable RBC’s are mainly used as sealants or cavity liners
and also to seal gingival margins in deep Class II proximal boxes under conventional
RBC’s. Recently new types of flowable RBC’s have been advocated for use with a bulk
filling technique to fill the entire cavity with a 4mm thick increment. The manufacturers
claim decreased polymerization shrinkage due to the low elastic modulus of these materials
(Heymann, Swift et al. 2012).

13
13
Posterior Restorations
Although in the past there has been controversy regarding the use of RBC’s in
posterior teeth, studies have shown that the longevity of posterior RBC’s is acceptable. A
study reported that the failure of amalgam annually was 0 % to 7% and 0% to 9% for
RBC’s (Hickel and Manhart 2001). (Roeters, Shortall et al. 2005) also reported that the
failure rates of RBC’s were similar to or less than amalgam. On the other hand, a
retrospective study by (Opdam, Bronkhorst et al. 2010)comparing the longevity of
amalgam and RBC restorations after 12 years showed that the RBC restorations had less
failure rates in the low caries risk group, but increased failure with the high caries risk
group. There was not enough evidence to predict the high failure rates of RBC’s compared
to the amalgam restorations. Authors also stated that there was not enough evidence of the
adverse toxic effects of mercury on the amalgam patients (Rasines Alcaraz, Veitz-Keenan
et al. 2014).
Adhesion and Bonding
Bonding of RBC’s depends on the chemical structure of both enamel and dentin.
As mentioned before enamel is more mineralized having higher inorganic content than
dentin. Dentin is less mineralized having more organic content and fluid compared to
enamel. As a result, bonding to enamel is stronger and more durable than bonding to dentin.
Dentin is unlike enamel in that its structure is heterogeneous having different dentinal
components throughout the whole crown. Many developments in adhesive systems were
made to overcome the problems of dentin bonding and to have more durable and
predictable restorations (Liu, Tjaderhane et al. 2011). The main two approaches used for

14
14
bonding are etch and rinse and self-etching systems. Both of these systems can come in
different forms and combinations (Heymann, Swift et al. 2012).
Michael Buonocore in 1955 discovered a way to create micropores in enamel and
dentine for bonding (acid etching). By using phosphoric acid on an in-vitro tooth he greatly
increased the bond between acrylic restoration and enamel, Dr. Buonocore concluded that
the high bond strength was due to the increased surface area and wettability of enamel
surface. In Buonocore’s study, the phosphoric acid concentration used was 85 % for 30
seconds (Buonocore 1955). It was later shown that decreasing the etching time of enamel
and dentine from 60 seconds to 15 seconds using the 37% phosphoric acid gave adequate
for shear bond strength of RBC’s (Fejerskov, Johnson et al. 1974).
Acid etching removes about 10 um of the top surface of enamel and leaves an
irregular surface with micropores of 5-50 um deep (Gwinnett 1971, Summitt 2006). Acid
etching increases the infiltration of the adhesive system of RBC’s into the micropores
formed by acid etching, as well as increasing the wettability and surface energy. After
polymerization the infiltrated resin, forms retentive resin tags which produce a strong long-
lasting bond (Buonocore, Matsui et al. 1968). Etching mainly appears as keyholes when
scanned under scanning electron microscope because of the dissolution of the
interprismatic substance (Summitt 2006).
Many dental adhesive systems were introduced in the field of dentistry (Summitt
2006). Classifications were made to differentiate between these systems. One of the
classifications was based on the conditioning mechanism and the number of steps included
in the bonding protocol. This classification was made to describe the self-etch and the total
etch (etch and rinse) bonding mechanisms.
Total etch and self-etch systems were further classified according to the number of
steps. Total etch systems depend mainly on removing the outer layer of enamel and the
smear layer produced as a result of instrumentation to ensure high bonding properties,

15
15
whereas the self-etching adhesives only partially dissolves those components (Summitt
2006). The gold standard system used among the different adhesive systems is currently
considered the three-step total-etch system.
Bonding to dentin is less reliable than bonding to enamel because of the high
organic and fluid content of the dentin and the flexible surface of dentin. The dentinal
tubules are wider close to the pulp and narrower and less close to the external enamel
surface, Dentin is also a vital tissue which undergoes structural changes with time (sclerotic
dentin, dead tracts, secondary dentin and tertiary dentin) (Perdigao 2010). Thus, adhesion
to dentin is less predictable and more variable dependent than bonding to enamel. When
bonding to dentin, the smear layer may be completely removed (total etch) or partially
dissolved (mild-etch). Past studies have shown total etch have shown the best results in the
longevity and strength of bond between the RBC’s and the tooth although the self-etch two
step adhesive systems are showing promising results (Casselli, Faria-e-Silva et al. 2013).
The development of adhesive systems that can enhance the bond strength of the RBC
restorations has gone through many steps and much research. Enhancements made to
bonding systems were as follows:
1) First generation, in 1956 Buonocore and colleagues suggested the use of
glycerophosphoric acid dimethacrylate resin to bond to dentin structure (Bowen 1956).
Later Bowen tried to modify in the chemical formula of the adhesive system by
incorporating N-phenylglycine, glycidyl methacrylate or NPG-GMA as a bifunctional
molecule or a coupling agent (Bowen 1965).
2) Second generation, in the late 1970's, the second generation came out with some
improvements and changes. The majority of these systems incorporated halophosphorous
esters of unfilled resins bisphenol A glycidyl methacrylate or bisGMA or Hydroxyethyl
methacrylate or HEMA. These systems bonded to dentin by forming ionic bonds to calcium

16
16
which was a stronger bond than the first generation. In this generation dentin wasn’t etched
and the bonding was applied over the smear layer.
3) Third generation, this group recommended the etching of dentin and modifying
the smear layer to let the primer adhere and penetrate (Kato and Nakabayashi 1998). The
primer presented contained hydrophilic resin monomers which included trihydroxyethyl
trimellitate anhydride, 4-META and biphenyl dimethacrylate. Following the primer
application, an unfilled resin was placed over enamel and dentin. This generation had better
results than the first and second generations.
4) Fourth generation, this was the start of the total etch or etch and rinse system. In
this system, the smear layer was totally removed to facilitate bonding to dentin, enamel
and dentin was etched with 40% phosphoric acid. The higher concentrations, however,
caused dentin to be over etched and the collagen fibers collapsed (Fusayama and Kohno
1989). In 1982 the formation of the hybrid layer was reported. The hybrid layer is defined
as "the structure formed in the dentin due to demineralization of the surface and subsurface
followed by infiltration of monomers and subsequent polymerization”. (Nakabayashi,
Kojima et al. 1982). The fourth generation used the total etch technique where enamel and
dentin were etched 15 to 20 seconds. The surface was left slightly wet for application of
the hydrophilic monomer followed by the unfilled resin for the dentinal tubules to be totally
sealed with the resin tags (Kanca 1991, Gwinnett 1993, Kanca 1996, Tay, Gwinnett et al.
1996)
5) Fifth generation, this generation involved the introduction of the self-etch system
as well as combination of the primer and adhesive with the total etch system. The concept
was to provide a faster and an easier way for bonding to enamel and dentin. With the self-
etch system, the primer and the conditioner were combined with the adhesive separate.
With the total etch system, the primer and adhesive were combined in one bottle to be
applied after etching of enamel and dentin (Tay, Gwinnett et al. 1994). The self-etching

17
17
primer developed was an aqueous solution of 20% phenyl P in 30% HEMA (Watanabe and
Nakabayashi 1993). The combination of the etching and priming step together was
advantageous in that less time was needed for the procedure, but the drawback was that the
smear layer partially remained between the bonded layers and the overall strengths with
the systems were less effective than the phosphoric acid etching (Kato and Nakabayashi
1998). The total removal of the smear layer was suggested to enhance the durability and
reliability of bonding to dentin (Toida 1995). However (Carvalho, Yoshiyama et al. 1996)
suggested that bond strength tests did not show statistical differences in bond strength
between the one bottle system and the self-etching primer bonding systems.
6) Sixth generation, these self-etch systems involved a one-step procedure for
bonding where the conditioner, primer and adhesive were combined into one bottle. Initial
products in this category had stability problems. Typically the bond to dentin was good but
enamel bond strengths were low since the solution has ph which is typically too high to
properly etch enamel. (Gerald Kugel, 2000)
A study by (Roggendorf, Kramer et al. 2011) was done to compare the marginal
integrity and the bonding of the bulk fill RBC’s and the conventional RBC’s when using a
self-etch adhesive versus etch and rinse adhesive. Five types of RBC’s were used (SDR,
Ceram X mono, Tetric EvoCeram, Filtek Supreme and Venus Diamond). These RBC’s
were bonded by using their respective adhesives, XP bond, Xeno V, Syntac, Adper Prompt
L-pop and iBond self-etch. Eighty MOD cavities were prepared in extracted human third
molars with gingival margins just below the DEJ. Teeth were divided into eight groups (10
teeth per group) where four groups had bulk Fill SDR placed and over it the conventional
RBC’s where the other four groups had only the conventional RBC’s placed. Teeth were
restored with different RBC types and were examined under a SEM at a magnification of
200X using epoxy resin replicas.
18
18
The results showed that all adhesive systems used showed high percentages of gap
free margins in enamel. Etch and rinse adhesives performed better (87.4%-91.5% gap free
margins) compared to the self-etch adhesives (42.1%-64.1% gap free margins). In dentin,
a high percentage of gap free margins was found with etch and rinse adhesives again
performing better (63.2%-66.6% gap free margins) than self-etch adhesives (38.5%- 56.2%
gap free). Internal adaptation to dentin was found to be better in etch and rinse adhesives
(66.3%-70.1% gap free) compared to self-etch adhesives (31%- 57% gap free). Generally
there was no difference in the marginal adaptation between the bulk Fill and conventional
RBC’s.
(Casselli, Faria-e-Silva et al. 2012) evaluated different adhesive systems and their
effect on the marginal adaptation of RBC’s. Forty bovine incisors were selected for testing.
Class V cavities were prepared with a 3mm height, 3mm width and 2mm depth and a C-
factor of 3.7. Four adhesive systems were evaluated, a two-step self-etching adhesive
(Clearfil SE Bond, Kuraray), a single step self-etching adhesive (Xeno IV, Dentsply), and
two different two-step etch and rinse adhesives (Single bond 2, 3M ESPE and Prime and
Bond NT, Dentsply). Cavities were restored with Filtek Z250, (3M ESPE) and filled in one
increment of 2mm thickness and cured for 20 seconds. The curing procedures were done
either by QTH light (Optilux 501, Kerr) or an LED light (Radii-Cal, SDI) without
mentioning the irradiance produced. Results of the study indicated no significant difference
in enamel margins in all cavities restored and cured either with the QTH or LED light.
However in dentin margins, Clearfil SE Bond demonstrated the lowest amount of gaps
regardless of the light cure used. The type of curing light used only affected results in the
enamel margins of Xeno IV, where larger gaps were formed when cured with Optilux 501
QTH light than those cured with Radii-Cal LED.
Another study conducted by (Casselli, Faria-e-Silva et al. 2013) tested the margin
location and type of adhesive system used on the marginal adaptation on the RBC’s used.
19
19
Forty bovine incisors were examined for marginal adaptation. Class V cavities were
prepared with dimensions of 3mm by 3mm and 2mm depth with a C-factor of 3.7. Adhesive
systems used were two-step etch and rinse (Single bond 2, 3M ESPE) and two-step self-
etch (Clearfil SE Bond, Kuraray). The cavities were all restored with Filtek Z250 (3M
ESPE) in one increment of 2mm and cured for 20 seconds. The procedure of light curing
was done by a LED Radii-Cal (SDI) producing irradiance of 600 mW/cm2. Results of this
study were similar to the previous study done by the same author where on the enamel
margins Single Bond 2 exhibited less marginal gaps compared to Clearfil SE, However in
dentin the opposite was true where Clearfil SE showed less gaps than Single Bond 2. In
dentin the Clearfil showed better marginal adaption however in enamel the Single Bond
was better. A study by (Casselli, Faria-e-Silva et al. 2012) compared bonding of RBC’s to
enamel and dentin using different adhesive systems showed that in dentin the best bond
with the lowest marginal gaps was demonstrated with the Clearfil SE bond however in
enamel margins there was no any difference between different adhesive systems.
(Blunck and Zaslansky 2011) evaluated the margins in enamel of Class I
restorations using a one bottle all in one adhesive systems. Ninety-six human molars were
selected for testing. Class I cavities were prepared 3mm deep, 6mm wide mesio-distally
and 4mm wide bucco-lingually. All teeth were divided into 12 groups of eight teeth each.
Each group was assigned to one adhesive system. Twelve adhesive systems were used with
three control groups as: 1) Optibond FL, 2) Clearfil SE Bond, 3) Adper Prompt L-Pop, and
nine one bottle one step self-etching adhesives (OBOSSEA) products : 4) Adhese one, 5)
Adper Easy Bond, 6) Bond Force, 7) G-Bond, 8) I-Bond Self Etch, 9) One Coat 7, 10)
Optibond All In One, 11) Tri-S-Bond and 12) Xeno V. All teeth were restored with Z250
RBC in three increments (one horizontal and two oblique layer) which were cured for 40
seconds using the Astralis 10 (Ivoclar). Results of the study indicated that all in one
adhesives exhibited significantly lower marginal integrity compared with etch and rinse

20
20
system (Optibond FL) and the two step self-etch system CSE. Comparing the nine all in
one groups, the best marginal adaptation was found in the groups of Bond Force, G-Bond
and Optibond All in One.
The bonding system used for the current investigation Syntac bonding system
(Ivoclar Vivadent) was from the same manufacturer as the RBC and light curing unit to get
the most accurate results. This bonding system is a three-step (sometimes referred as a
four step) total etch system. It is composed of an etchant, Syntac primer, Syntac adhesive
and the Heliobond.
Studies such as (Kanemura, Sano et al. 1999, Hannig and Fu 2001, Pashley and Tay
2001, Deliperi, Bardwell et al. 2006) stated that the use of self-etch adhesive systems
especially the mild etching systems produced a reduced bonding effectiveness to enamel
when compared to the total-etch systems. Generally the total etch systems and 2 step self-
etch systems have better bonding qualities compared to the one bottle all in one bonding
systems as stated by (Blunck and Zaslansky 2011).
Polymerization Reaction
The process of polymerization is a continuous process where at a certain stage the
monomers start forming a solid mass which is called the gel point. At this point, the RBC
starts losing its elasticity and becomes stiffer. Any contraction beyond this stage can form
direct stresses in the RBC, and if the RBC is bonded to the cavity walls shrinkage may
occur (Braga and Ferracane 2004). In the process of polymerization small molecules are
turned into large chains of polymers. The normal spaces between monomers before curing
is 3-4A whereas after polymerization it becomes 1.5A which can result in shrinkage of
1.5%-5%. The amount of shrinkage is dictated by the amount of covalent bonds formed

21
21
and the amount of double carbon bonds of the monomer conversion (Alvarez-Gayosso,
Barcelo-Santana et al. 2004).
A study done (Bouschlicher and Rueggeberg 2000) tested the rate of
polymerization shrinkage after light curing with different light intensities in a hybrid RBC.
They concluded that slower conversion rates resulting from the gradual increase in light
intensity resulted in lower the polymerization stress which was produced without affecting
the physical property of the restoration since the maximum degree of conversion occurred.
(Yoshikawa, Burrow et al. 2001) tested the effect of light curing intensity on the
marginal adaptation and contraction rate of the Conventional RBC (Clearfil Bright hybrid
RBC). RBC’s were cured with different light intensities of 600 and 270 mW/cm2 with
various curing times. The conclusion was that using a low light intensity of 270 mW/cm2
for 20 seconds yielded the lowest polymerization shrinkage rate and the best marginal
adaptation results compared with all other curing intensities.
Dental Photopolymerization
Most of the procedures nowadays done in the dental field needs a photocuring step.
The light curing systems are used mainly to initiate the polymerization reaction of the
dental materials. The type of light curing unit used has a direct effect on the polymerization
shrinkage and rate of cuspal deflection (Fleming, Khan et al. 2007). The light curing
systems went through a lot of advancements until getting to use the newer LED light curing
systems available today. The first light curing systems were developed in the early 1970’s
utilizing the ultra-violet light (365 nm) through a quartz rod from a high pressure source of
mercury (Lienhard O 1973). The typical exposure durations were 20 seconds to 60 seconds
(Murray, Yates et al. 1981). These light curing systems had many disadvantages such as,
the limited ability of light to penetrate deep within the material and the harmful effects of

22
22
the light when exposed to human eyes and the possible adverse effects on the oral
microflora (Craig 1981). A new light technology was then developed using a visible light
radiation in 1976 where the first dentist Dr. Mohamed Bassoiouny placed the first visible
light cures RBC as a restorative material. The light curing units were designed to activate
a photo-initiator camphorquinone and a tertiary amine co-initiator to increase success rates
in the RBC systems used (Stansbury 2000). The usage of visible light had some advantages
such as: curing RBC’s in 2mm increments for 40 or 60 seconds, the cataract and eye side
effects were minimized. However, still the retinal burning and macular degeneration were
still a probability of ocular damage.
The Quartz tungsten halogen lights (QTH) were then developed; it utilized a
halogen cycle to remain clear from the tungsten contamination around the quartz used.
Some advantages of these newer systems were: availability, easy installation, being
inexpensive. These lights had to be fan cooled to allow proper working mode of the halogen
cycle. Light systems then started developing by introduction of an argon ion laser with an
output wavelength of 514nm, then the Plasma arc lights were introduced being developed
in the mid 1960’s where the typical output for these systems was near 2000mW/cm2 with
a broad band of 380 to 500 nm wavelength.
The newest and the last generation introduced were the LED’s where these lights
depended mainly on the energy difference obtained from two dissimilar semiconductor
substrates (Rueggeberg 1999). The manufacturers supplied LED chips sets that had a
variety of emitting wavelengths which were suitable for the photo-initiators available in
the RBC systems. Many manufacturers nowadays recommend a curing time of 10 seconds
using a high intensity curing light delivering an irradiance of at least 1000 mW/cm2.
Manufactures have made a wide range of claims concerning the usage and qualities
of different light curing systems. Thus it becomes important to discover the true operating
characteristics of the curing lights. It was stated that the measurement of the light curing

23
23
output using the hand held dental curing radiometers resulted in inaccurate data in showing
the different depths of cure among lights (Hansen and Asmussen 1993). The total power
output (not differentiating between different frequencies) of the light curing systems should
be determined using a well calibrated thermopile, where black body absorbing plates with
layers of thermocouples are used to respond to the absorption of energy (Rueggeberg
2011). It was always known that the light cures have major differences in the light diversion
which required holding the tip of the light as close as possible to the detector plane however
the ISO 106500-1 testing standard for determining the exitance radiation, the tip ends are
held at a distance from the detector plate and thus may give inaccurate results of power
emission. The spectro-radiometers were used to evaluate the dental curing radiometers and
measure the power at the visible spectrum. These instruments used were referred as hand
held spectro-radiometers.
The light beam homogeneity (intensity contour generation) is very important in
detecting the different intensity patterns found in a specific light source and to know if the
beam power is higher in the core or in the periphery. The basic setup of the machine is
utilizing a charged coupled device (CCD) camera where the beam is targeted. The beam
power maybe measured by a thermopile and then the camera side image can be analyzed
using a software that shows on a screen. A color coded image is then generated of the beam
irradiance. It’s very important to mention that the light curing tip movement when tested
resulted in lower overall hardness at both the top and bottom (2mm) (Rueggeberg F 2010).
Polymerization Shrinkage
Light cured RBC’s harden after curing by a polymerization reaction changing the
viscous phase into a more hard or rigid phase. During this polymerization reaction

24
24
shrinkage occurs which can have direct effect on the cuspal stresses (Davidson, de Gee et
al. 1984).
The polymerization reaction that occurs in RBC’s is mandatory as these materials
proceed in their setting reactions. Cross linking of all monomers occurs thus decreasing
spaces between them and causing a reduction in the general volume of a restoration which
may result in marginal gaps at the tooth interface. No RBC is totally free from
polymerization shrinkage. Polymerization shrinkage mainly depends on the oligomers and
diluents which are main components of RBC’s, and shrinkage increases with increased
diluents present. During setting, the material pulls away from the surface with the weakest
link and creates space defects at the tooth interface (Lutz, Krejci et al. 1991). The
microhybrid and nanohybrid RBC’s are more highly filled compared to microfills
(Heymann, Swift et al. 2012). The amount of filler is critical as the increase in filler content
decreases the amount of polymerization shrinkage (Li, Li et al. 2012). Results of
polymerization shrinkage and gap formation can increase marginal leakage, discoloration,
sensitivity and increased stresses at tooth-restoration interface (Park, Chang et al. 2008)
Mechanical and Physical Properties
The type of RBC directly affects the rate of polymerization shrinkage, gap
formation and surface hardness of the restoration. The physical and mechanical properties
of the RBC’s depend mainly on the filler content, matrix system and their coupling
(Heymann, Swift et al. 2012). Polymerization shrinkage can be directly affected by filler
particle morphology and size. The surface hardness, stiffness and resistance to abrasion
and fracture toughness can be affected by the filler content, particle size and shape
(Summitt 2006). The amount of fillers incorporated in RBC’s are directly affected by the
shape of the particles, so spherical (round) shaped RBC particles can be more heavily filled

25
25
compared to the lathe cut irregular and Pre-polymerized type of particles (Kim, Ong et al.
2002). All properties of RBC’s such as resistance to abrasion, fracture toughness, surface
hardness and polymerization shrinkage are improved with higher filler content except for
the surface roughness and polishing. However, the increase in the filler content must not
surpass a certain limit or else the RBC will become too viscous for clinical handling
(Summitt 2006).
Surface Micro-hardness
The polymerization reaction leads to the hardening of RBC’s. The degree of
polymerization can be measured directly or indirectly. Many laboratory tests have been
used to measure the degree of conversion of RBC systems including infrared spectrometry
(Ferracane and Greener 1986, Moore, Platt et al. 2008), resonance imaging for direct
measuring, Knoop hardness testing and Vickers hardness testing for indirect
measurements. The standard most commonly used method was the scraping method ISO
4049 which has been shown to overestimate the depth of cure values (DeWald and
Ferracane 1987, Price, Felix et al. 2005). Hardness has been well correlated with the degree
of polymerization and depth of cure (Ferracane and Greener 1984, Ferracane 1985,
DeWald and Ferracane 1987). Hardness values are usually obtained at different points from
top to bottom and the mean values are calculated to get the depth of cure. This determines
the relative extent of conversion at different levels within a RBC restoration. Many
researchers have accepted that a percent depth of cure at the bottom of the restoration
compared to the maximum top hardness of 0.80 is clinically acceptable (Rueggeberg and
Craig 1988, Bouschlicher and Rueggeberg 2000, Bouschlicher, Rueggeberg et al. 2004,
Price, Felix et al. 2005). The fillers content and size play an important role in the surface
hardness of the RBC’s (Bouschlicher, Rueggeberg et al. 2004)

26
26
(Garcia, Yaman et al. 2013) compared the depth of cure and the surface micro-
hardness (KHN) between different types of bulk and conventional RBC’s Four types of
RBC’s were used: 1) SureFil SDR Flow (Dentsply), 2) Venus Bulk Fill (Heraeus Kulzer),
3) Sonic Fill (Kerr), 4) Filtek Supreme Ultra Flowable (3M ESPE). The hardness testing
procedures were done on ten specimens for each group (40 specimen's total) in a 10x10
mm mold and cured for 20 seconds using the Smart Lite iQ2. Specimens were tested at the
top surface (2mm, 3mm, 4mm and 5mm sections) and bottom surface (2mm, 3mm, 4mm
and 5mm sections) by using 100 gm load in 11 seconds. Results of the study revealed no
significant differences in hardness numbers between the different sections tested at the top
surface between different restorative materials. SureFil SDR Flow was the only material
of the bulk fills that showed lower values of Bottom to top KHN numbers of 70% where
Venus Bulk Fill and SonicFill both had an 80% acceptable B/T KHN. Filtek Supreme Ultra
Flowable was too soft to test at thickness of 4 and 5mm. The study was comparing also
between two methods of hardness testing the ISO 4049 and the knop hardness testing where
results showed that the Knoop hardness number testing (KHN) was more accurate
compared to the ISO 4049 which always overestimated the hardness numbers.
In the study done (El-Safty, Akhtar et al. 2012), the surface nano-hardness was
compared between different types of RBC’s to test the nano-mechanical properties of the
dental RBC’s. Ten different RBC materials were used including three flowable RBC’s
(GrandioSo Flow, GrandioSo Heavy flow and Estellite flow quick) and three bulk fill
materials (x-tra base, Tetric EvoCeram and SureFil SDR) and four conventional RBC’s (
GrandioSo, Venus Diamond, Filtek Supreme XTE and Spectrum TPH3). Disc specimens
(15mm X 2mm) were prepared and filled with the different types of RBC’s and cured in
multiple overlapping points for forty seconds each. Authors used a halogen light curing
unit (Optilux 501, Kerr, USA) with light irradiance of 650 mW/cm2. After restoration all
specimens were mounted in phenolic ring forms and embedded in a self-curing resin

27
27
(Polyestyrene). Specimens were ground and polished and stored in distilled water at 37
Celsius for 7 days. The specimens were loaded with one loading rate and three unloading
rates using Agilent Technology XP nano-indentor with 30 indentations for the unloading
rate at a load of 10 mN. Results of this study showed that the surface micro-hardness mean
values of the different RBC’s tested were between 0.73 GPa to 1.60 Gpa. The study also
showed a positive correlation between the amount of filler loading and the surface micro-
hardness numbers. Final results showed that the surface micro-hardness and modulus of
elasticity for bulk fills and flowable RBC’s were lower than those for conventional
nanohybrid RBC’s.
A study conducted by (Alrahlah, Silikas et al. 2014) compared the different surface
micro-harness numbers (VHN) using different bulk fill dental RBC’s. Five different bulk
fill RBC’s were tested (Tetric EvoCeram, x-tra base, Venus Bulk Fill, Filtek Bulk Fill and
Sonic Fill). Stainless steel molds were prepared and were restored with the different types
of RBC’s with dimensions of (15mm X 4mm X 2mm). Specimens were cured for 20
seconds each using a light curing device (Elipar S10, 3M ESPE, USA) with an irradiance
of 1200 mW/cm2. All specimens were stored at 37 Celsius for 24 hours. The Vickers
hardness number was measured in the materials at 0.3 mm intervals of depth to the
maximum depth of 4mm. The specimens were tested with a micro-hardness instrument
(FM-700, Future Tech Corp, Japan). The load applied was 300gm for 15 seconds. Authors
tested the maximum VHN, the 80% VHN and the depth of the 80% VHN in the different
RBC’s. Results of this study showed maximum VHN numbers ranging from 37.8 to 77.4.
Sonic fill and Tetric EvoCeram Bulk Fill showed highest VHN numbers (P less than
0.0001) while lowest numbers were for Venus Bulk Fill RBC (P less than 0.0001). Sonic
Fill and Tetric EvoCeram Bulk Fill materials had the best depth of cure and hardness
numbers compared to the x-tra base, Venus and Filtek Bulk Fill. All bulk Fill RBC’s tested
showed acceptable hardness numbers of 80% of the top layer hardness at depths of 4mm.

28
28
A study conducted by (Felix, Price et al. 2006) compared the surface micro-
hardness (KHN) of different RBC’s cured with two different light systems (LED light
emitting diode, QTH quartz-tungsten halogen in high and medium power). Two lights were
used for the study. An LED light (Free Light 2, 3M ESPE) used to cure at three levels
including 0mm (mean irradiance of 1300), 2mm (mean irradiance 400) and 9mm (mean
irradiance 140). A QTH curing light (Trilight 3M ESPE) used to cure at three different
levels including 0mm (mean irradiance 900 mW/cm2 in high power and 500 mW/cm2 in
medium power), 2mm (mean irradiance 700 mW/cm2 in high power and 400 mW/cm2 in
medium power) and 9mm (mean irradiance 200 mW/cm2 in high power and 100 mW/cm2
in medium power). Ten different available RBC brands were used for testing the surface
micro-hardness including : 1)Z250 (3M ESPE) shades A2 and B0.5, 2) Supreme (3M
ESPE) shades A2D and A2B, 3) Esthet X (Dentsply) shades A2B and A2O, 4) Heliomolar
(Ivoclar Vivadent) shades A2 and 110T and 5) Tetric EvoCeram (Ivoclar Vivadent) shades
A2 and bleach XL. Each tooth was sectioned into a mesial and distal half and placed in a
mold. Class I preparations were made with dimensions of 1.5 mm wide and 4mm deep
surrounded by dentin. RBC was placed and a Mylar strip was placed in the middle of the
two molds where the molds were closed for curing. After curing molds were opened for
Hardness testing. A good correlation between the Knoop hardness testing and the degree
of conversion has been shown. The Knoop diamond indentor was applied for 15 seconds
with 100 g weight measured at 0.5, 1, 1.5, 2, 2.5, 3 and 3.5mm from the top surface. The
mean of all hardness points was calculated for comparison between different groups.
Results showed that at a distance of 2mm with all RBC types the LED light produced
greater hardness than the QTH curing lights, however in distance of 9mm from the surface
of the RBC the QTH light delivered higher irradiance and produced harder RBC’s at depths
below 1.5mm.

29
29
A study done by Price et al (Price, Felix et al. 2005) was similar to the study by
Corey A. et al (Corey A. Felix et al, 2006) where the aim was to compare micro-hardness
(KHN) of different RBC’s cured with two different light systems (LED light emitting
diode, Free light 2, 3M ESPE; QTH quartz-tungsten halogen, Trilight, 3M ESPE). All
methods followed were the same as the other study however the distance from the tooth
surface in this study was standardized at 2mm. Results showed that using the LED curing
light at a distance of 2mm in all RBC’s produced significantly harder RBC’s at depth of
3mm compared to QTH lights on high power mode (P<0.01). All three RBC’s (Z250 A2,
Tetric EvoCeram A2 and Tetric EvoCeram Bleach XL) maintained a high Knoop hardness
number at depths of 3.5mm.
Cavity Designs for Class II Resin Based Composites
The cavity preparation for RBC’s is different from that of the G.V Black
preparation. Preparations are more conservative and defect specific preserving more tooth
structure. The preparation finish line (cavo-surface angle) is the line at the junction between
the prepared cavity surface and the unprepared surface (Summitt 2006). There are different
types of finish lines that can be prepared including 90 degree angle (butt joint), beveled,
chamfer and shoulder finish lines. These different types of finish lines are used depending
on the type of restoration used and the esthetic and retentive needs of the dentist. The 90
degree margin means that the junction between the prepared cavity and outer tooth surface
is 90 degrees (Heymann, Swift et al. 2012). These margins are prepared for amalgam as
these materials are brittle and need support at the cavo-surface margins to increase the
fracture resistance. A beveled cavo-surface angle is usually prepared for the RBC materials
to expose more ends of enamel rods and increase the bonding capacity of the RBC’s
adhesive systems. Studies have compared the marginal leakage between restorations with

30
30
beveled and unbeveled margins with the beveled margins showing less marginal leakage
(Crim, Swartz et al. 1984, Porte, Lutz et al. 1984, Coelho-De-Souza, Camargo et al. 2012).
It was shown that beveled cavities restored with RBC’s showed higher resistance to
fracture and better bonding of the restoration (Coelho-De-Souza, Camacho et al. 2008).
Restorations bonded to beveled margins also had better esthetic results due to the gradual
transition of color between the tooth and restoration (Albers 2002). However on the other
hand it has been suggested that bonding to beveled margins did not produce a better
marginal seal than the unbeveled margins but only improves esthetics (Baratieri and Ritter
2005, Bagheri and Ghavamnasiri 2008). Microleakage is defined as the infiltration of
bacteria, fluids and oral debris at the restoration and tooth interface (Papacchini, Monticelli
et al. 2007). Opinions differ whether or not to bevel the margins when bonding to RBC’s,
and the debate of which margins should be beveled still exists.
The gingival margin of cavity preparation in this investigation was placed below
the cemento-enamel junction at the dentin level as to provide more challenge in bonding
and adaptation to dentin and increase the possibility of detection of differences in marginal
adaptation. Bonding to dentin has been shown to be less predictable than bonding to enamel
leading to a weaker bond in resisting polymerization shrinkage (Manhart, Chen et al. 2001).
The cavity preparations were all standardized to the dimensions of 4mm occluso-
gingivally, 4mm bucco-lingially and 2mm mesio-distally. A study done by Sabatini et al
(Sabatini et al, 2010) used the same cavity dimensions to test different conventional RBC’s,
however the investigators in this study used the conventional burs to standardize the
preparations.

31
31
Resin Based Composite Failures Related to the Class II Cavity Design
Polymerization Shrinkage and C-Factor
Polymerization shrinkage of RBC’s is affected by the shape and depth of the cavity
and the degree of flow of the material (Taylor and Lynch 1993). The rate of polymerization
shrinkage is directly related to the configuration factor of the cavity preparation known as
the c-factor. The c-factor can be defined as the ratio of the bonded surfaces to the unbonded
surfaces (Feilzer, De Gee et al. 1987, Summitt 2006). An increased C-factor leads to
increased shrinkage stresses. Generally Class I and II posterior cavities possess a higher C-
Factor due to the walls of bonded restoration which increases the shrinkage stresses and
affects bonding (Cakir 2007, Karthick 2011).
Exact relation between the c-factor and its effect on bonding of RBC is unclear,
however it's well known that increased C-factor causes higher polymerization shrinkage
rates. Polymerization shrinkage increases in cavity designs with high c-factors. This is
because of the inability of RBC’s to reduce the extra stress by the flow through unbonded
surfaces of high C-factor preparations as the unbonded , the only surface that can act as a
reservoir for the plastic deformation that happens during polymerization shrinkage
(Karthick 2011).
An article by (Van Ende, De Munck et al. 2013) evaluated the influence of the high
c-factor when bonding of different types of RBC’s to cavity bottom dentine. Three types
of RBC’s were used in the study including a flowable RBC (Geanial Universal flow, GC),
a bulk fill RBC (SDR, Dentsply) and a hybrid type RBC (Z100, 3M ESPE). Different
cavity preparations were done with different c-factor numbers including C=3.86 (class I
cavity 2.5 mm deep, bulk filled), C=5.57 (Class I cavity of 4mm depth, bulk filled), C=
1.95 (Class I cavity of 2.5mm depth, filled into three equal layers) and C=0.26 (flat

32
32
surface). After being stored for one week in water, the specimens were sectioned into 4
rectangular parts for the micro-tensile bond strength test. Results of the study showed that
the micro-tensile values ranged from 0 MPa to 70.1 MPa. The RBC when filled in
increments or when it was built upon a flat surface didn’t have any significant differences
in bonding (P > 0.05), however for the flowable RBC and the conventional types, bulk
filling of the cavity resulted in a decrease in bond strength where the P value was less than
0.001. The authors concluded that satisfactory bond strengths were obtained when an
incremental filling technique or bulk was done in a low c-factor flat surface for all RBC’s
used, however the bulk fills showed significant lowered bond strengths in class I cavities
irrespective to the depth.
Another article (Boroujeni, Mousavinasab et al. 2014) compared the effect of the
c-factor on gap formation on three different restorative materials including a hybrid RBC,
a low shrinkage RBC and a resin modified glass ionomer restorative material. Cylindrical
5mm diameter cavities in dentin were prepared with three different depths (1mm, 2mm and
3mm). Ninety-nine human molars were selected for the cavities and were separated into 3
groups with 33 teeth in each. , Each group had three subgroups depending on the three
prepared depths. The three restorative materials used were a resin modified glass ionomer
(Fuji II LC) and two RBC materials (Filtek P90 and Filtek Z250). Teeth were then
sectioned mesio-distally, and gaps were measured under the stereomicroscope. The results
did not show any significant differences in the amount of gingival gaps between the two
RBC’s, regardless of C factor change (1.8-3.4), however the group restored with the resin
modified glass ionomer showed more gaps when the c-factor increased from 1.8 to 3.4.
The least gaps were found with Filtek P90 followed by Filtek Z250 and the majority of the
gaps were found in the group restored with resin modified glass ionomer (Fuji II LC). As
a conclusion, authors concluded higher c-factors resulted in more gap formation only with
the RMGI. This study may have got these results because of using a glass ionomer which
33
33
is less filled and weaker and may have had more gingival gaps because of its own inherent
properties not because of the difference in the c-factor.
Marginal Adaptation of Resin Based Composites (Marginal Gaps)
The marginal integrity is defined as the degree of proximity of a restoration to a
tooth surface. This property influences the longevity, esthetics and mechanical properties
of RBC’s (Schmidt and Ilie 2013). The marginal gap can start forming from a space created
between the restoration and tooth, 0.5 to 1 um wide, where bacteria, oral fluids and debris
may enter and destroy the bond decreasing the longevity of the restoration and speeding up
its functional and mechanical failure (Taylor and Lynch 1992). The association between
recurrent caries and gap formation was and still is a controversial topic, with some studies
stating a direct cause and effect while others state that no relation is found between both
phenomena. A study done by (Totiam, Gonzalez-Cabezas et al. 2007)studied the
relationship between the gap size and the extent of recurrent caries. Many gap sizes were
tested ranging from 0 to 1 um. Results showed that with increased gap size, the amount
of recurrent caries increased also. All gaps studied developed recurrent carries. An in-situ
study (Cenci, Tenuta et al. 2008), tested the gap formation while using fluoride from tooth
paste or glass ionomer. Results showed no association between gap formation and recurrent
carries. In another study done also by (Cenci, Pereira-Cenci et al. 2009) different sizes of
gaps were compared to their effect on recurrent carries. The authors concluded that gap
size directly influenced the recurrent carries but not when using fluoride in conjunction. In
another study (Hodges, Mangum et al. 1995) tested marginal gaps for recurrent decay, the
authors concluded that there was a direct relation between the gap width and the formation
of recurrent decay. However (Mjor 2000) stated that recurrent decay didn’t form from mild
micro leakage and minor marginal cracks but rather occurred with wide marginal voids.

34
34
Factors that directly affect the gap formation are the degree of polymerization shrinkage,
finishing, polishing and expansion of RBC’s.
Successful adhesion to enamel and dentin is the main goal when restoring using
adhesive resins. Although high quality adhesive systems have been recently introduced,
they cannot guarantee perfect adhesion to tooth structure. Despite all developments in
adhesive systems, polymerization shrinkage and marginal leakage remain the main cause
of RBC failures (Cakir 2007). Restorations are affected directly by many factors such as
cavity design, placement technique (layering versus bulk), curing mode and wavelength,
the adhesive system used, water sorption of the RBC and shade and opacity of RBC (Cakir
2007).
It is impossible to totally avoid marginal gaps and leakage between tooth interface
and RBC’s (Papacchini, Monticelli et al. 2007). It also has been stated (Samet, Kwon et al.
2006) that it is impossible to totally eliminate voids formed between the different layers of
RBC’s. Many factors will be introduced in this literature review to overcome or at least
decrease the amount of marginal gap formation such as using cavity liners, incremental
RBC placement, modifying the time and intensity of curing lights. Step or ramp cure light
cures that start with low intensity then switches to high intensity and the pulse delay cure
which is a discontinuous curing procedure may help decrease the polymerization shrinkage
and marginal leakage (Cakir 2007).
(Roeters, Shortall et al. 2005) summarized the main requirements for a posterior
RBC restoration as providing high strength against fracture, high marginal integrity, high
wear resistance and high radio-opacity. The main advantages also of RBC’s have been
described (Cenci, Demarco et al. 2005, Coelho-De-Souza, Camacho et al. 2008) as their
high esthetics, adhesion properties and the reinforcement of the remaining tooth structure.
Major problems of failure in RBC’s can be due to the degree of polymerization shrinkage.
Posterior fillings such as Class I and Class II restorations have higher C-factor compared

35
35
to anterior restorations which increases the amount of shrinkage (Deliperi and Bardwell
2002).
The increased degree of conversion of monomers to polymers increases mechanical
properties but at the same time increases shrinkage (Venhoven, de Gee et al. 1993, Roeters,
Shortall et al. 2005) concluded that the marginal gap was due mainly to the filler particles
size and content and type of degradation. Other opinions have suggested that marginal gap
is mainly formed due to the polymerization shrinkage and contraction stresses of RBC’s.
In the same study the authors discussed the white lines that may appear in enamel surface
adjacent to the restoration. These white lines were suggested to be craze lines or micro
fractures due to polymerization shrinkage (Olmez, Oztas et al. 2004, Cakir 2007).
Differences in the coefficient of thermal expansion and contraction between the restoration
and tooth play an important role in considering the amount of marginal leakage. This
difference causes the restoration and tooth to expand and contract differently at varying
temperatures creating gaps and leakage tendencies (Heymann, Swift et al. 2012).
Some reasons for the early failure of RBC’s are dependent on the operator and not
a deficiency of the material itself. Proper packing of RBC’s and elimination of all air voids
between restoration and tooth structure is crucial. The presence of voids at margins due to
improper adaptation can lead to marginal leakage, gap formation and subsequent failure.
These leakage sites can allow the ingress of bacteria, saliva and enzymes which can lead
to recurrent decay and post-operative sensitivity (Lutz and Kull 1980, Dietschi, De
Siebenthal et al. 1995, Dietschi, Scampa et al. 1995, NJM 1997). Gaps may form in the
internal line angles and can be altered and increased by forces of occlusal loading which in
time can lead to the percolation of fluids in dentinal tubules which may lead to fracture of
the restoration under recurrent heavy loads. Gaps formed at the external cavo-surface
margins can open a pathway for penetration of oral fluids and bi-products. Sometimes gaps

36
36
can appear as radiolucent areas in radiographs which can produce a dilemma in the
diagnostic phases (NJM 1997).
Methods Introduced to Overcome Resin Based Composite Failures with Class
II Restorations
Many approaches have been used in an attempt to decrease the amount of
polymerization shrinkage in restoring Class II RBC’s. These approaches have included an
incremental technique when applying RBC’s which decreases the bulk of RBC cured at
one time and helps in decreasing the polymerization shrinkage and gap formation (Lutz,
Krejci et al. 1991). Another approach is the use of bulk fill materials which manufacturers
claim have very good marginal adaptation and low polymerization shrinkage (Jackson
2011). Another method introduced to decrease the amount of shrinkage of RBC’s was the
use of different light curing units with increasing light irradiance or pulsed emission. Some
studies have shown that when light curing intensity was used at 150 mW/cm2 followed by
light curing at 650 mW/cm2, the curing reaction slowed down and enhanced the marginal
adaptation of the RBC’s without affecting the properties (Uno and Asmussen 1991, Feilzer,
Dooren et al. 1995, Mehl, Hickel et al. 1997). Also the use of liners before applying
conventional RBC’s and the use of low elasticity layers has been also shown to enhance
marginal integrity (Braga and Ferracane 2004)

37
37
Different Techniques of Placement
Incremental Placement Technique
The incremental technique is widely used in placing RBC’s in Class II cavities to
reduce the adverse effects of polymerization shrinkage and marginal gap formation. The
incremental technique reduces the bonded to unbonded surfaces thus reducing the C-factor
and stresses on the RBC restoration (Feilzer, 1987).
The study done by (Frankenberger, Kramer et al. 2007) using different adhesive
systems and layering techniques found that the horizontal layering technique had the best
bond quality compared to the vertical and oblique layering techniques. On the contrary, a
study done by (Versluis, Douglas et al. 1996) showed that the layering technique increased
the deformation of the restored tooth and caused higher polymerization shrinkage and
marginal gap formation.
In a study done by (Usha, Kumari et al. 2011), one type of RBC, a silorane low
shrinkage RBC (Filtek P90) was used to restore the teeth. The silorane self-etch primer and
adhesive were used. The cavity dimensions were 1.5 mm in depth, 3mm in length and 2mm
in width. The sample size was 40 premolar teeth which were extracted due to orthodontic
treatment. The Class V cavities were prepared and the teeth divided into two groups of 20
teeth: 1) Group 1 was restored by a horizontal split incremental technique in two steps.
The preparation was first filled using a 1.5 mm thick RBC increment where a diagonal cut
was made in this increment and the preparation was filled with both diagonal increments
and cured for 20 seconds each (total of 40 seconds). 2) Group 2 was restored by an oblique
layering technique where two layers were inserted obliquely and each one was cured for
20 seconds (total 40 second cure for 2 oblique increments). Restorations were tested for
the degree of shrinkage and marginal adaptation. Teeth were sectioned bucco-lingually
through the center of the restoration and a digital scale (Snagit digital scale) was used to

38
38
calculate the width of interface between the restoration and tooth. The split incremental
technique had a mean score marginal opening between restoration and tooth of 3.98
microns compared to 8.27 microns in the oblique layering technique. Authors concluded
that using a split layering technique produced less marginal gap than using an oblique
layering technique.
A study conducted by (Kramer, Reinelt et al. 2009) tested the marginal adaptation
of different RBC’s in Class II cavities over a four years period of time using the USPH
criteria. The study was a prospective split mouth study. Thirty-six Grandio restorations
were bonded using the Solobond M bonding system (Voco) and thirty-two teeth were
restored with Tetric EvoCeram bonded by Syntac bonding system (Ivoclar Vivadent). All
cavities were Class II MO, OD or MOD. The restorations were placed by incremental
technique with no mention of number of layers and cured for 40 seconds using Elipar
Trilight (3m ESPE) with irradiance of 650 mW/cm2. Restorations were examined at
baseline, one year and four years. Authors had many criteria of testing including surface
roughness, color change, marginal integrity, tooth integrity, proximal contact, sensitivity
and restoration integrity. Results showed no significant differences in the amount of gap
formation between the two restorative materials after four years of follow-up (P>0.05).
Authors concluded that Grandio and Tetric EvoCeram had satisfactory performance in
Class II cavities after four years. Significant changes over time were observed for all
criteria tested including tooth integrity which deteriorated due to enamel cracks (P<0.05).
A continuation of the previous study (Kramer, Garcia-Godoy et al. 2011) evaluated the
RBC’s after six years. Results didn’t differ from the previous study with a 100 % success
rate. Neither the material nor the restoration location affected the clinical outcome after
the six years testing period (P>0.05). Molar restorations performed the worst in marginal
integrity, filling integrity and tooth integrity. Significant changes were found for all criteria
recorded (P<0.05). Negative step formation due to wear was observed more in molars (87%

39
39
after 4 years) (P<0.05). Tooth integrity was found deteriorating due to cracks (P<0.05).
Restorations generally had more wear and roughness with 28% after one year, 75% after
two years, 84 % after four years and 91% after six years.
Another study (Sabatini, Blunck et al. 2010) evaluated the effect of preheating
RBC’s and using flowable liners on the gingival margin gap formation of Class II cavities.
Forty extracted third molars were prepared as class II cavities either on the mesial or distal
with dimensions of 4mm wide, 4mm high and 2mm deep with the gingival margins located
1mm below the CEJ in dentin. The adhesive system used was standardized for all
restorations (Optibond FL, Kerr). Teeth were divided into 5 groups with 8 specimens in
each group: 1) Preheated RBC at 130F/54.4C, 2) Preheated RBC at 155F/68.3C, 3) A layer
of 0.5 to 1mm of flowable RBC followed by placement of unheated RBC in 2mm thickness,
4) A 0.5 to 1mm thick layer of flowable RBC and placement of unheated RBC directly
over the uncured liner, 5) Room temperature RBC used in 2mm increments. The RBC used
was a microhybrid RBC (Filtek Z250, 3M ESPE) and a flowable RBC (Flow it, Pentron).
Restorations were cured for 40 seconds except for the flowable liner which was cured for
20 seconds, all with a LED light (G-light, GC America) with irradiance of 800 mW/cm2.
Results of marginal adaptation scores were calculated and showed that no significant
difference between the percentages of gap formation at the gingival margins was detected
between groups tested. For all the groups at least one specimen showed perfect marginal
adaptation. Generally the mean gap percentage for the 40 specimens tested were 6.3 with
a median of 1.1 and a SD of 14.8. Therefore the results indicate that the flowable or heated
RBC’s is not superior to conventional RBC’s.
Bulk Placement Technique
Innovations in the types and formulas of RBC’s have recently claimed significant
flow and low polymerization shrinkage values of new bulk fill RBC systems. These

40
40
systems are marketed as RBC’s having greater depth of cure that can be placed in a bulk
fill technique (4mm or 6mm cavity) instead of the standard increments of 2mm. Companies
claim that these RBC systems reduce the amount of polymerization shrinkage and working
time (Burgess and Cakir 2010, Ilie and Hickel 2011, Czasch and Ilie 2013). This new
technology and concept of these newer RBC systems was based on changing the monomer
chemistry to create monomers with lower viscosity. The new changes in RBC systems was
achieved by incorporating hydroxyl free Bis-GMA, aliphatic urethane dimethacrylates or
partially aromatic urethane dimethacrylates or highly branched methacrylates (Moszner,
Fischer et al. 2008). The new changes in the organic matrix of these new bulk fill RBC
systems showed significant reduction in the polymerization shrinkage values and stresses
of 60%-70 % (Giachetti, Bertini et al. 2007, Ilie and Hickel 2011)
A new clinical study conducted (Burgess and Munoz 2014) evaluated the success
of the bulk fill RBC SureFil (Dentsply, Caulk) with capping with a conventional RBC
Esthet X (Dentsply, Caulk). One hundred and seventy class I and class II cavities were
prepared in eighty seven subjects; all restorations were bonded using Prime and Bond
adhesive system (Dentsply, Caulk). The bulk fill RBC was placed in a layer of 4 mm
thickness then capped by the conventional RBC. The restorations were evaluated at
baseline and after six months, twelve months, twenty four months and 36 months. Five
main criteria were tested: 1) fractures and surface defects, 2) proximal contacts, 3) recurrent
caries, 4) sensitivity and 5) gingival index. Results showed: 1) the fracture and surface
defects category showed acceptable results after thirty six month evaluation with only one
restorations which needed replacement and five others that needed repair and the defects
were in the capping material not the bulk fill RBC. 2) proximal contacts were intact where
only six teeth had affected contacts. 3) recurrent decay was only noted in three restorations
at the occlusal surface not the gingival margins indicating the failure of the occlusal
capping restoration not the bulk fill material. 4) sensitivity evaluation was done showing
41
41
absence of sensitivity with the bulk fill RBC’s and as no relation between the sensitivity
and the bulk fill material appeared, sensitivity data were collected only at the twenty four
months recall. 5) no adverse effects on the gingival tissues was shown as all scores were
recorded as no to normal mild gingival inflammation. Authors concluded in this
investigation that the SureFil Bulk Fill RBC showed acceptable performance in three years
evaluation period.
Tetric EvoCeram and Tetric EvoCeram Bulk Fill
Resin Based Composites
The material of RBC used is crucial since the type and percentage of filler particles
and monomers dictate the degree of cure and the time needed for curing as well as the
quality of the polymerization reaction and the amount of polymerization shrinkage
(Amussen and Peutzfeldt, 1988; Amussen and Peutzfeldt, 2002). This study attempted to
use a commercial RBC which is available with quite similar physical composition yet
available in two different versions, that of a conventional fill and that of a bulk filled (Tetric
EvoCeram and Tetric EvoCeram Bulk Fill). The nanohybrid Tetric EvoCeram filling
material contains BIS-GMA, UDMA resins (dimethacrylates) which are all highly
molecular weight monomers. The main components of fillers in both Tetric EvoCeram
RBC systems are Barium glass, ytterbium triflouride, mixed oxide and prepolymers. The
filler content of the Tetric EvoCeram material is 75%-76% by weight and 53%-55% by
volume however the Tetric EvoCeram Bulk fill which has the same resin composition had
differences in the filler content 76%- 80% by weight and 53%-54% by volume. The
manufacturer claim that particles of Ivocerin are added to the resin monomer to act as
highly sensitive photo-initiators and have an important role in increasing the light
activation of the material, increasing the depth of cure and enhancing the polymerization

42
42
reaction, also pre-polymerized particles are added to the Tetric EvoCeram RBC’s to act as
shrinkage stress relievers (Ivoclarvivadent 2014).
Many new bulk fill RBC materials have recently been introduced on the dental
market, The use of one of these other RBC system with different composition may have
caused different results, however EvoCeram Bulk was used because it was indicated for
fully restoring a cavity preparation at a depth of 4mm not just as a base like some other
bulk fills (SureFil SDR). Also Tetric EvoCeram has shown good marginal adaptation and
excellent depth of cure compared to other bulk filling materials (A. Alrahlah et al, 2013).
The last reason for choosing the Tetric EvoCeram Bulk Fill was our need to compare the
two RBC systems which were very similar. The adhesive system was from the same
manufacturer to further standardize the conditions of the study.
Comparing the Degree of Polymerization
Shrinkage and Marginal Adaptation using One
Type of Resin Based Composite Placed with
Different Techniques (Layering versus Bulk)
(Mullejans, Lang et al. 2003) compared the marginal adaptation of RBC’s placed
in bulk or incremental technique. Thirty extracted premolars and molars were prepared as
Class V cavities that were extended past the DEJ. The dimensions were 3 mm mesio-
distally, 5 mm in the occluso-gingival and 2 mm in depth. Teeth were divided into three
groups of ten teeth each. All cavities were restored with Dyract AP (Dentsply detrey) and
the adhesive system Dyract-PSA and cured with spectrum 800 curing light (Dentsply). 1)
1mm thick layer of polyacid modified RBC was applied to the coronal portion and cured
for 40 seconds. The rest of the cavity was filled and cured for 40 seconds (Total of 80
seconds), 2) restored in the same manner of group 1 but the first layer was placed in the

43
43
apical portion instead of the coronal, 3) A single increment technique (bulk technique) was
used without mentioning the curing time.
Results of this study showed the percentage of gap formation at the enamel and
dentin interface were generally higher at the dentin margins. Gap formation for Groups 1-
3 in enamel margins were 28.2%, 30.0% and 26.5% with no statistical difference between
scores (P>0.05). Scores in dentin were 25.7% , 22.8% and 30.6% where Groups 1 and 2
were statistically lower in gap formation than Group 3 (P>0.05). Authors concluded that in
dentin margins of Class V cavities, the percentage of gap formation was less using the
incremental technique compared to a single 2mm increment, however it may take the
operator more time.
Comparing the Degree of Polymerization
Shrinkage and Marginal Adaptation using
Different Types of Resin Based Composites Placed
with Different Techniques (Layering versus Bulk)
(de Wet, Exner et al. 1991) compared the marginal gaps between the layering
technique and the bulk filling technique. Forty five molar teeth were prepared as DO or
MO Class II cavities all having the same dimensions. Three types of RBC’s were used to
restore the teeth to be tested including two microfilled RBC’s, Distalite (Johnson
professional, Inc) and Heliomolar (Ivoclar Vivadent) and one hybrid RBC, P-30 (3M St.
Paul) .The type of bonding system used was not mentioned. Three techniques were used,
two were a variation of layering including horizontal and vertical layering and the other
was a bulk fill technique. Teeth were divided into three groups of 15 teeth with each group
restored with the different techniques: 1) bulk filled and cured for 60 seconds, 2) filled by
using three horizontal layers of RBC, each 2mm in thickness and each individually cured
for 60 seconds (total cure 180 seconds), 3) restored by vertical layering technique by using

44
44
three vertical layers cured for 60 seconds each (total cure 180 seconds). Specimens were
cut longitudinally and examined by the SEM to compare the marginal gaps formed due to
shrinkage. The authors reported that the bulk technique resulted in significantly higher
marginal gaps (P-value less than 0.01) when compared to layering. Scores of the marginal
gap average in the proximal boxes using P-30 was 20 um with bulk technique and 6 um
with both vertical and horizontal layering techniques. Best scores were shown with the P-
30 RBC where the average marginal gaps at the floor of the cavity were 17 um compared
to 61 and 7 um in Heliomolar and Distalite. The authors stated that marginal gap between
the restoration and tooth increased with the bulk technique. They also concluded that the
hybrid P-30 RBC showed better scores (less marginal gaps) than the microfilled RBC’s,
Distalite and Heliomolar.
(Gallo, Bates et al. 2000) compared the marginal adaptation of different
conventional packable RBC’s placed in bulk or incremental technique. Sixty Class II
preparations were prepared on the mesial or distal sides with dimensions of 6 mm deep, 2
mm bucco-lingually and 1.5 mm mesio-distally. Teeth were divided into six groups (10
teeth in each group) with three types of RBC’s placed in incremental technique and with a
bulk fill technique. RBC’s used were: 1) SureFil (Dentsply) bonded with Prime and bond
2, 2) Solitaire bonded with Solid Bond P (Heraeus Kulzer), 3) ALERT Bond -1 Flow It
(Synca). All restorations were cured for 40 seconds from the occlusal and another 40
seconds from the facial and lingual (total cure of 80 seconds) using a XL300 light with
irradiance of 650 mW/cm2. Specimens were submerged in silver nitrate and examined
under a light microscope. Results showed no significant difference in marginal adaptation
between different technique of placement either with bulk or incremental technique
(P>0.05). In comparing different types of RBC, ALERT had the least amount of gaps and
leakage in both technique (bulk and incremental) compared to other restorations (P<0.05).
45
45
Differences in the technique of placement (bulk or layering) using conventional RBC’s
didn’t affect the marginal adaptation of the restorations.
A study done by (Opdam, Roeters et al. 2003) investigated the voids that formed at
the margins of different consistencies of RBC’s placed in different techniques (layering
and bulk technique). Preparations were made in one hundred fifty two Perspex blocks
(Dimensions of 4mm depth, 3mm in diameter). Three different RBC consistencies were
used, 1) High viscous RBC (Packable Prodigy, Kerr), 2) Medium viscosity (Clearfil,
Kuraray) and 3) Low viscosity or flowable RBC (Revolution, Kerr). Restorations were
placed according to one of eight protocols (Each group having nineteen restorations), 1)
bulk filled with packable RBC and cured for 40 seconds, 2) bulk filled with medium
viscosity RBC, 3) bulk filled with the flowable RBC, 4) Snow plow technique where
flowable RBC was placed on the gingival margins, left uncured and placed over it the
medium viscosity RBC and cured for 40 seconds. 5) Same as group 4 but using packable
RBC. 6) Flowable RBC placed in two layers and cured for 40 seconds. 7) Flowable RBC
placed in one layer and cured for 20 seconds followed by a layer of medium consistency
RBC and cured for 20 seconds. 8) Same as previous group but second layer was packable
RBC. Light curing was done from the occlusal surface using a Kulzer Translux CL light
(Irradiance of 700mW/cm2). Adhesive system used was not mentioned. Light microscope
was used for marginal analysis. Authors stated that restoring cavities with absence of voids,
porosities or gaps was very hard to achieve and all restorations had voids except for Group
4 (Snow plow technique where flowable RBC was placed on the gingival margins, left
uncured and placed over it the medium viscosity RBC) where eight restorations were gap
free and Group 2 (bulk filled with medium viscosity RBC) where three restorations were
gap free. The best results were observed in Group 4 where the snow plow technique was
used with medium consistency RBC (11 voids only present, P<0.05).

46
46
(St Georges, Wilder et al. 2002) tested two types of RBC’s including a hybrid RBC,
Z250 (3M ESPE), and a microfill Silux Plus (3M ESPE). Class V cavities with of
dimensions were 1.5 mm in depth, 2mm in height, and 4mm in length were prepared in
100 freshly extracted premolars. The teeth were equally divided into two main groups of
fifty which were each restored with a different type of RBC. Within each group, teeth were
divided into 5 subgroups of ten teeth each where different techniques of RBC placement
were tested: 1) restored by two triangular increments placed obliquely over each other to
fill the entire cavity with both increments individually cured for 40 seconds each from the
facial surface. 2) used the same technique of placement, but the RBC surface was re-bonded
with an adhesive, Singlebond. With both subgroups, the two layers of RBC’s were
individually cured for 40 seconds each as well as an additional10 seconds cure from the
facial. 3) bulk filled in one increment, and cured for 40 seconds. 4) also filled by bulk
technique, but RBC surface was re-bonded with an adhesive, Singlebond, similar to
Subgroup 2. No mention was made of the light curing times for this group. 5) Layered
with the same technique as Subgroup 1, but each layer was cured for 40 seconds (80 total
seconds for both layers) from the lingual (Through the tooth) and an additional 20 seconds
from facial. The teeth were stained with methylene blue dye and then sectioned bucco-
lingually and examined under an optical microscope at 15x magnification to determine the
extent of microleakage in both enamel and dentine. Results of the study stated that in
general the two types of RBC’s placed by layering technique and bulk were successful with
no significant differences between the five techniques of placement in the amount of
marginal leakage. The P-values were p=0.72 for Z250 and P= 0.54 for Silux Plus. The
microleakge scores showed significant differences between enamel and dentin for both
RBC systems. The Silux Plus group had 90% zero leakage scores in enamel and 70% zero
scores in dentin. The P- values were less than 0.005 (P<0.001 for Z250 and P<0.0001 for
Silux Plus). The main conclusion of the study was that the different techniques of layering

47
47
and bulk fill didn’t have any significant differences on marginal leakage. However, the
specific bonded tooth surface had an effect on the leakage with enamel better than dentin.
Two different studies compared the marginal gaps formed with conventional and
bulk RBC’s placed in bulk and layering technique. The first study (Furness, Tadros et al.
2014) compared the internal marginal adaptation of different Class I cavities restored in
bulk or incremental technique at enamel, mid-dentin and pulpal floor areas using different
conventional and bulk fill RBC’s. Class I preparations with dimensions of 4mm diameter,
4mm deep and c-factor of 5 were made in fifty molar teeth. All restorations were bonded
using total etch adhesive systems. Five groups of 10 teeth each were tested. Four bulk
filling materials were used SureFil (Dentsply), Quixx (Dentsply) bonded by Prime and
Bond NT (Dentsply) / Sonic fill (Kerr) bonded with Optibond FL (Kerr) and Tetric
EvoCeram (Ivoclar Vivadent) bonded with Excite F (Ivoclar Vivadent) and one
conventional RBC used as a control Filtek Supreme Ultra (3M ESPE). Teeth were
sectioned and the internal marginal leakage was assessed after applying carries detecting
dye on the internal margins of the restorations and obtaining images of these dyes using a
digital camera and visually examining the samples. Results of the study showed no
significant differences among different restorative procedures or materials at a significance
level (P=0.01) however significant differences were found between different locations of
measurements of internal gaps (enamel, dentin or pulpal) with significance level (P=0.01).
Authors concluded that: 1) Usage of bulk fill or conventional RBC’s resulted in the same
amount of marginal adaptation in the mid-dentin and enamel portion, 2) The amount of gap
formation at the pulpal floor was lower than in enamel and dentin margins for all types
tested except for two, SureFil and the Filtek Supreme Ultra. 3) Gaps in the conventional
group were less in the enamel and mid-dentin portions when it was used as recommended
in 2mm thick layers instead of bulk filling in 4mm layers. Results showed that the
technique of placement and the type of RBC used didn’t have a significant effect on the

48
48
marginal adaptation of the restorations however the location of bonding directly affected
the adaptation of restorations where it was better in enamel than in dentin than in deep
dentin (pulpal walls).
The second study (Campos, Ardu et al. 2014) compared the marginal adaptation in
Class II cavities restored with bulk and layering techniques using bulk fill and conventional
RBC’s. Forty extracted human molars were prepared with large MOD cavities with parallel
walls and beveled margins with the gingival margin 1mm below the enamel-cementum
junction. The dimensions of all cavities were standardized to 5mm wide and 4mm deep in
the occlusal box, 5mm wide and 2mm deep in the proximal box. All bonding procedures
used Optibond FL adhesive system (Ivoclar Vivadent). The teeth were restored with two
horizontal increments of 4mm and 2mm and cured for 40 seconds using a LED light (Demi
plus, Kerr) with irradiance of 1100 mW/cm2. Teeth were divided into five restorative
groups according to first/second increment, Group A: Venus bulk fill/Venus Diamond;
Group B: Tetric EvoCeram bulk fill/Tetric EvoCeram; Group C: SureFil SDR/Ceram X;
Group D: Sonic fill; Group E: Ceram X/ Ceram X (Control group). The results showed that
the differences in percentage of intact margins found between all restorative materials
weren’t significant (P= 0.164). The lowest amount of intact margins were found in Goup
A (Venus bulk fill/Venus Diamond). Scores of intact margins were; Group A: 71.96%,
Group B: 82.45%; Group C: 87.22%; Group D: 82.45% and Group E: 86.14%. The results
for the percentage of intact margins in occlusal enamel margins and proximal enamel
margins showed no statistical differences (P= 0.060 and P= 0.091). Authors concluded that
the margins in dentin showed more discontinuous margins than those located in enamel
and that there was no difference in marginal gaps/adaptation between the bulk and standard
(conventional) RBC’s. Again results showed no differences in marginal adaptation
between different restorations (bulk or conventional) placed either in layering or bulk fill
49
49
technique however the location of bonding differed were more marginal gaps were found
in the dentin margins compared to the enamel margins.
Degree of Polymerization Shrinkage and Cuspal
Deflection of Teeth using Different Placement
Techniques (Layering versus bulk) in Class II
Posterior Cavities
Articles by (Kuijs, Fennis et al. 2003, Park, Chang et al. 2008) compared different
techniques of placement of RBC restorations using layering vs. bulk and evaluated their
effect on polymerization shrinkage and its effect on cuspal deflection in Class II cavities.
In the study done by (Park, Chang et al. 2008), the samples being tested were 15
aluminum molds which were MOD cavities and identical in shape and size with 4mm
depth, 8mm length and 6mm width, to minimize the substrate variation inherent with the
use of natural teeth. Time dependent measurements were performed using linear variable
differential transformers (LVDT).The aluminum molds were divided into three groups: 1)
restored by bulk fill and cured 40 seconds from occlusal and 20 seconds from both mesial
and distal (total 80 seconds cure). 2) layered in three horizontal layers with each layer cured
for 20 seconds and an additional cure of 20 seconds from occlusal (total of 80 seconds
cure). 3) layered in three oblique layers which were individually cured for 20 seconds each
and an additional 20 seconds (total of 80 seconds). All groups were cured using a curing
light with an intensity of 800mW/cm2. The authors didn’t mention the type of RBC used.
The authors had the main purpose of testing the results of polymerization shrinkage when
using the layering technique and bulk fill. The aim was comparing different layering
techniques while standardizing the type of cavities prepared (MOD) and comparing the
effects of polymerization shrinkage on cuspal deflection. Results of the study showed
incremental filling of cavities produced significantly less polymerization shrinkage (p-

50
50
value less than 0.05) compared with the bulk techniques with cuspal pressures recording a
mean value of 21.6 um in the bulk fills, 19.3 um in the horizontal layering and 18.4 um in
the oblique layering. There were no significant differences between either techniques of
layering.
In the study done by (Kuijs, Fennis et al. 2003) RBC was used to restore Class II
cavities and different placement layering techniques were compared to test their effects on
polymerization shrinkage. An FEA (Finite Element Analysis) model was simulated to
mimic an extracted upper premolar tooth with an MOD cavity preparation. The dimensions
of the cavity preparation were not described. The software for the FEA helped observers
to input the properties of the restoration (the compressive, shear and tensile strength and
modulus of elasticity and Poisson's ratio) and calculate the outcome with different designs
on the computer. Techniques of placement of the RBC were by bulk filling and layering
the RBC either from center to periphery or the opposite. The authors didn’t mention the
specific types of RBC used, however they mentioned that one was light cured while the
other was self-cured. The FEA model was tested by one observer only and there were no
control groups.
The authors were testing, the results of polymerization shrinkage when using the
layering technique and bulk fill. The type of RBC used wasn’t mentioned neither was the
sample size nor the light cure unit. Authors were comparing different layering techniques
while standardizing the type of cavities prepared (MOD). The aim was to compare the
effects of polymerization shrinkage on cuspal deflection.
Authors stated that the amount of polymerization shrinkage and stress on cusps was
shown to be less in the self-cured RBC in comparison to the light cured RBC, however in
the higher stress testing (higher than 6 MPa) the differences were small. There were no
significant differences using bulk and different layering techniques with the mean volume

51
51
change in enamel for both techniques were around 25% at 4 MPa stresses. These stresses
were mainly concentrated in the cervical part of the remaining cusps.
A comparison of the results from the two studies mentioned above showed different
results concerning the polymerization shrinkage and the stresses resulting on cusps. (Park,
Chang et al. 2008) concluded that the incremental and layering technique had less
shrinkage and therefore less stresses on the cusps whereas (Kuijs, Fennis et al.
2003)concluded that layering and bulk filling didn’t directly affect the polymerization
shrinkage but that it was affected more by the mode of cure, where chemical cure RBC’s
showed less shrinkage and stresses than light cured RBC’s. (Kuijs, Fennis et al. 2003) also
evaluated the location of stresses and concluded that the greatest forces were found in the
cervical areas and especially high in enamel.
In conclusion both articles considered similar variables of the degree of shrinkage
and its stress effects on the cusps. Results differed between the articles with Park stating
that layering was better than bulk filling but Kujis concluding that both were almost the
same, and that it was the mode of cure that directly affected the shrinkage and stress pattern.
Although self-cured RBC are rarely used today in restoring posterior teeth, these two
articles still reflect the controversy concerning the rate of shrinkage and the stresses on the
remaining tooth structure causes and factors.
Two additional studies (Campodonico, Tantbirojn et al. 2011, Kwon, Ferracane et
al. 2012) compared the degree of polymerization shrinkage and its effect on the cuspal
deflection. In the study done by (Campodonico, Tantbirojn et al. 2011) twenty-five
extracted human teeth including both premolars and molars were selected to be restored
with two different types of RBC’s including x-tra fil bulk fill RBC (Voco America, USA)
and Filtek Supreme Plus (3M ESPE). MOD cavities 4mm deep and 4mm bucco-lingual
were prepared. The prepared teeth were stabilized in a stainless steel ring and digitized
using an optical scanning model (Lava Scan ST, 3M ESPE) on a computer to help in
52
52
showing the high stress areas on cusps. Ten teeth were chosen to be restored with the x-tra
fil RBC in which five were filled with the layering technique and the other five with the
bulk fill technique. The remaining fifteen teeth were restored using Filtek Supreme Plus
with 5 placed in a layering technique, 5 placed in bulk fill and 5 restored in transtooth
illumination bulk fill technique. The layering technique employed the placement of two
layers of 2mm each with curing for 20 seconds (10 from buccal and 10 seconds from
lingual). The bulk fill technique restored the prepared cavity with RBC thickness of 4mm
cured for 40 seconds (20 from occluso-buccal and 20 seconds from occluso-lingual
direction). The transtooth technique placed the RBC in one increment of 4mm and light
cured it for 20 seconds simultaneously with two curing lights through the buccal and
lingual surfaces followed by 20 seconds from the occlusal direction. Authors used two high
intensity curing units (Curemax V LED and Allegro high intensity LED) with intensities
measured around 1300 Mw/cm2. The bonding technique was the same for all cavity
preparations using Prime and Bond NT (Dentsply, Caulk). Cuspal analysis was done by
aligning accurately the digitized images of the tooth before and after the restoration using
the Cumulus Software to calculate the contour changes in the lingual and buccal cusps
perpendicular to the original tooth surfaces. The results of this cuspal defelection study
showed that the teeth restored with both types of fillings had inward movement of their
cusps after the restoration was placed. Filtek Supreme Plus caused more cuspal deflection
compared to x-tra fil. Authors reported no significant difference in cuspal deflection
between the different filling techniques including layering, bulk and transtooth
illumination however the difference was in the type of RBC used only where the bulk fill
RBC showed less cuspal deflection in comparison with the conventional RBC.
A study done by (Kwon, Ferracane et al. 2012) used twenty four aluminum blocks
with MOD cavities prepared to dimensions of 6mm width, 8mm length and 4 mm depth.
Three types of RBC’s were used in restoration including a hybrid RBC (Z250 - 3M ESPE),
53
53
a flowable RBC (Z350 Flowable - 3M ESPE), and a silorane based RBC (P90 - 3M ESPE).
The bonding system, Scotch Bond MP (3M ESPE), was applied before Z250 and Z350
flowable materials and the P90 system utilized its own silane adhesive prior to the
placement. An LED light curing unit (Elipar S10, 3M ESPE) with light intensity of 1160
mW/cm2 was used to polymerize the restorations. The teeth were divided into four different
groups and restored with the following four placement techniques: 1) a bulk filling
technique where Z250 was placed in bulk and light cured for 80 seconds total (20s from
occlusal, 20s mesially, 20s distally and 20s again occlusally), 2) an incremental filling
technique with the Z250 placed in four incremental layers cured for 80 seconds total (first
horizontal layer 1mm in thickness cured from upper side, two oblique layers cured from an
oblique way and the final horizontal layer cured from the upper side), 3) an incremental
flowable liner technique where the first layer was filled with Z350 flowable RBC in 1mm
thickness followed directly with three layers of Z250 cured for 80 seconds total (each
increment was cured for 20 seconds) and 4) an incremental filling with the silorane based
RBC, P90, placed in four incremental layers cured for 80 seconds total (each layer was
cured for 20 seconds). Cuspal deflection was measured using two LVDT probes (Linear
Variable Differential Transformers) placed on the buccal and lingual sides with
measurements starting at 30 second prior curing and continuing for 2000 seconds during
and after curing. A sum of six measurements of cuspal deflection was taken for all teeth.
In this study the cuspal deflection rates showed a rapid increase within the first 500 seconds
and then gradually increased thereafter. In Group 1 (bulk filled group), 50 % of the total
cuspal deflection occurred within the first 40s after initiation of curing, however in Groups
2-4 (incrementally filled) the amount of deflection increased in a stepwise manner in
relationship to light initiation. The incrementally filled groups 2-4 showed less cuspal
deflection compared to the bulk filled Group 1 (P< 0.001). The incremental filled group
with flowable liner showed higher cuspal deflection compared to the group filled

54
54
incrementally without a flowable liner (P= 0.035). Finally, the cuspal deflection rates with
the silorane based RBC P90 showed significant lower values (P< 0.001) than the groups
filled with methacrylate based RBC’s (Z250).
A study comparing the degree of cuspal deflection when restoring teeth with both
the incremental and bulk fill techniques using bulk fill and conventional RB’s was done by
(Moorthy, Hogg et al. 2012). In this study, 24 maxillary premolar teeth containing Class II
preparations (MOD) were utilized. Three types of different RBC’s were used for this study
including two bulk fill flowable RBC’s. x-tra Base (Voco) and SureFil SDR (Caulk) bulk
fills and a conventional RBC (GrandioSO – Voco). A layering technique was used for
GrandioSO RBC and bulk filling in 2mm increment was done with the bulk fills SDR and
x-tra base followed by a surface application of GrandioSO. The restorations were all
bonded in using a three step adhesive (All-Bond 2). The samples were divided into three
groups with 8 teeth in each: 1) restored with GrandioSO RBC only by applying three
oblique increments mesially and three distally and two increments occlusally with each
increment cured for 20 seconds (total of 160 seconds). Groups 2 and 3 were bulk filled by
SDR and x-tra base respectively in a 1.5 mm thick layer at the isthmus portion and cured
for 20 seconds and the last 2 increments in 2mm thickness occlusally were added with
Grandio SO RBC and cured for 20 seconds each (total of 60 seconds curing time). A twin
channel deflection measuring gauge was used to measure the cuspal deflection resulting
from polymerization shrinkage. This study reported that the mean total cuspal deflection
for the oblique incremental restoration was higher than when restored with bulk fill
technique. The mean total cuspal deflection for the oblique incremental technique was
11.26um. Maxillary premolar teeth restored by bulk fill SDR and x-tra base and veneered
by GrandioSO had mean total cuspal deflection of 4.63 and 4.73 respectively. One way
ANOVA showed significant increase in the mean total cuspal deflection for the
incrementally filled GrandioSO compared to the SDR (P=0.007) and x-tra base (P=0.005).

55
55
No significant difference was found between teeth restored with SDR and x-tra base
(P=1.000).
A study by (Kim and Park 2011) compared the degree of cuspal deflection in a
range of conventional RBC restorations placed in either bulk or incremental technique.
One hundred and twenty premolar teeth had MOD cavities prepared (3.5 mm in width and
3mm in depth). Four different RBC systems were used: 1) Heliomolar (Ivoclar Vivadent),
2) Heliomolar HB (Ivoclar Vivadent), 3) Filtek Supreme (3M) and 4) Renew (Bisco). The
four groups was restored using three different techniques: 1) bulk placement, 2) horizontal
placement in two layers and 3) horizontal placement in three layers. Restorations were
bonded using AdheSE (Ivoclar Vivadent). Restorations were cured for a total of 180
seconds total (60 occlusal, 60 mesial and 60 distal) using a Bluephase LED light (Ivoclar
Vivadent) with irradiance of 900 mW/cm2. A cuspal deflection measuring system was in
contacted to the buccal and lingual cusp tips of the teeth. Results of the study showed that
the amount of cuspal deflection with Heliomolar HB was significantly larger than the other
materials (P<0.05). There was no significant difference in cuspal deflection between the
other three RBC systems. Within the different techniques, the highest cuspal deflection
was found in Group 1 (bulk technique) followed by Groups 2 and 3 (P<0.05). The authors
concluded that the layering technique reduced the amount of cuspal deflection where the
three layers had less cuspal deflection than the two layers than the bulk filled restorations.
(Abbas, Fleming et al. 2003) assessed the cuspal deflection in premolar teeth
restored with a packable RBC placed and cured in bulk or in increments. Large MOD
cavities were prepared in forty extracted upper premolars with the isthmus portion
standardized to 3.5mm and to the gingival margin to 1mm above the DEJ. All cavities were
restored with the same packable RBC (SureFil, Dentsply) and it’s associated bonding
system (Prime and Bond NT, Dentsply). Teeth were divided into four groups with 10 teeth
in each one. 1) bulk placed and cured with Plasma Arc (Kent Uk) for 9 seconds. 2) Material
56
56
was placed in bulk and cured with the Optilux 501 light (Kerr) operated at the turbo boost
mode (10 seconds boost + 30 seconds regular). 3) Material placed in eight increments, three
in the mesial box and three in the distal box and two over the occlusal portion and cured
with the plasma arc light for 3 seconds each increment (24 seconds total). 4) Teeth restored
in eight increments using the Optilux 501 light curing unit in turbo boost mode (10 seconds
+ 30 seconds). The degree of cuspal deflection was measured by approximating the buccal
and lingual cusps to the receptors of a deflection measuring gauge. Baseline and each step
of polymerization records were taken for the cuspal deflection. Three measurements for
Groups 1 and 2 and eight measurements for Groups 3 and 4 were taken. Results showed a
significant increase in cuspal deflection with the turbo boosted mode curing light as
compared to the plasma arc light (P<0.05). The total mean of the cuspal deflection with the
incremental cure were significantly increased compared with the bulk cure for both light
sources (P<0.05). The lowest mean cuspal deflection was observed in Group 1 (bulk placed
and cured with Plasma Arc) 4.98; and the highest mean cuspal deflection was found in
Group 4 (Teeth restored in eight increments using the Optilux 501 light curing unit in turbo
boost mode)34.03; the scores of cuspal mean deflection were 19.37 for Group 2 (Material
was placed in bulk and cured with the Optilux 501 light (Kerr) operated at the turbo boost
mode) and 17.75 for Group 3 (Material placed in eight increments, three in the mesial box
and three in the distal box and two over the occlusal portion and cured with the plasma arc
light for 3 seconds each increment ,24 seconds total) .
Resistance to Fracture
A study done by (Wieczkowski, Joynt et al. 1988) presented data for comparing
resistance for cuspal fracture when placement of RBC’s by layering or bulk filling cavities.
Extracted premolar teeth were restored using two different RBC’s Fulfil (Dentsply) and P-
30 (3M/ESPE) with two different placement techniques (bulk versus layering). MOD
57
57
cavities were prepared to 2mm in depth in the isthmus portion and 4mm in the proximal
box. The samples were divided into four groups with Group 1 and Group 2 were restored
by P-30 (3M) RBC by bulk and layering techniques respectively. Groups 3 and 4 were
restored with Fulfil RBC using also the bulk and layering techniques. Force was applied to
the cusps of teeth using the Universal Instron machine and the resistance to fracture was
calculated and compared between the different placement techniques and different RBC’s.
This study reported that layering resisted cuspal fracture better than the bulk
technique. The authors concluded that cuspal stresses increased when bulk technique was
used rather than the layering technique. Authors also stated that P-30 RBC showed better
scores than Fulfil
Creep Tendency
(El-Safty, Silikas et al. 2012) used stainless steel split molds of 4mm in diameter
and 6mm in length to prepare cylindrical specimens for creep testing. Authors used six
types of RBC’s in which four were bulk filled (Venus, SureFil (SDR), Tetric EvoCeram
and x-tra base) and 2 were layered (Beautiful Flow Plus and Filtek Supreme). Sample size
was 60 molds with10 molds each restored by a different type of RBC. The six groups of
the RBC were divided into halves (5 samples in each group) to be tested in a dry or wet
environment. A creep measuring apparatus was used to measure creep values. Results were
different depending on the material used (type of RBC) and the condition (wet or dry).
Within the materials used, Filtek Supreme had the lowest creep values (mean of 0.74%)
compared to Venus Bulk Fill (mean of 1.50%). The dry conditions had better (lower) creep
values compared to wet field. In the cavities filled with Beautiful fill the creep score was
0.90% in the dry field compared to 1.10% in the wet field where the lowest creep values
were exhibited by Filtek Supreme RBC (0.72% and 0.79%). The highest creep values
(strain and permanent set) in dry conditions were recorded for the SureFil Bulk Fill group
58
58
(1.55% and 0.49%), where in the wet conditions it was recorded in the Venus Bulk Fill
group (1.80% and 0.59%). The authors concluded that the conventional RBC’s placed by
the layering technique lowered creep tendency compared with the bulk fill RBC’s placed
in bulk technique yet the bulk RBC’s placed in bulk exhibited acceptable creep which can
be explained as due to the increased filler loading in the recent bulk fill materials.
Another study (Czasch and Ilie 2013) compared the creep deformation as well as
other mechanical properties of bulk fill RBC restorations. Seven bulk fill RBC’s were
tested: 1) Venus Bulk Fill (Heraeus Kulzer), 2) SureFil SDR flow (Dentsply Caulk), 3) x-
tra base (VOCO), 4) x-tra fil (VOCO), 5) Filtek Bulk Fill (3M ESPE), 6) Sonic Fill (Kerr),
7) Tetric EvoCeram Bulk Fill (Ivoclar Vivadent). Five different mechanical properties
were tested including flexural strength, flexural modulus, indentation modulus, Vickers
hardness and creep deformation. The flexural strength and modulus were determined in a
three point bending test. One hundred and forty samples were made in a steel mold having
dimensions of 2x2x16mm. The specimens were cured for 20 seconds for three light
exposures (total of 60 seconds) using an Elipar Freelight 2 (3M ESPE) with irradiance of
1250 mW/cm2. The micromechanical properties were determined by using fragments of
the same specimens used for flexural testing which were larger than 8mm. Results of the
study showed the highest significant flexural strength values for Sonic fill, x-tra Base and
x-tra Fil as 142, 139 and 137 (P<0.05). The differences between materials were more in
the comparison of flexural and indentation modulus where x-tra fil had the highest
significant values (9.5) and Filtek and Venus Bulk Fills achieved the lowest (3.6 and 3.8)
(P<0.05). Authors stated that bulk fills had the same flexural strength when compared to
nanohybrid and micro hybrid RBC’s. Flexural modulus, indentation modulus and Vickers
hardness values for the bulk fills were between the hybrid and flowable RBC’s. In terms
of creep values, bulk fills showed high creep deformation which made them similar to the
flowable RBC’s.

59
59
Cavity Liners
Many materials have been used under posterior RBC’s in order to increase the
wettability and adaptation of RBC’s to gingival margins. These materials include resin
modified glass ionomers (RMGI) and the flowable RBC liners.
Recent research results vary with some studies showing that these liners decreased
the marginal gaps and increased the adaptation (Frankenberger, Kramer et al. 1999,
Peutzfeldt and Asmussen 2002, Opdam, Roeters et al. 2003, Chuang, Jin et al. 2004), some
showed no affect (Chuang, Liu et al. 2001, Haak, Wicht et al. 2003, Sensi, Marson et al.
2004, Lindberg, van Dijken et al. 2005, Ziskind, Adell et al. 2005), and one study showed
that these liners worsened the adaptation and increased the marginal leakage (Chuang, Jin
et al. 2003).
An article (Chuang, Liu et al. 2001) compared the use of a flowable RBC at the
gingival margin below RBC to using only conventional RBC’s and the effect on gap
formation and marginal microleakage. This experiment was done by two dentists; one of
them was experienced while the other was inexperienced. The results measured by dye
penetration showed that operator experience was the only factor that affected the amount
of gingival leakage with the flowable RBC liner best with the experienced dentist.
(Peutzfeldt and Asmussen 2002) compared the use of flowable RBC’s and self-
curing RBC’s in MOD cavities with gingival margins below the CEJ. The RBC used was
a hybrid (Renew). A flowable liner (Aeliteflo) was compared to a self-curing RBC (Bisfil
2B). Dye penetration was used to assess the degree of microleakage. The group that was
restored with flowable RBC’s showed lower marginal gaps compared with the other group
restored with self-curing RBC’s.
60
60
Snowplow Technique
A study (Chuang, Jin et al. 2004) compared the thickness of the RBC liner beneath
the RBC and its effect on the marginal leakage in Class II cavities. Four main groups were
used in this study: 1) RBC only, 2) thin layer of flowable RBC cured simultaneously with
conventional RBC, 3) thin layer of flowable RBC pre-cured, and 4) thicker layer of
flowable RBC pre-cured. Dye penetration was used to assess the amount of microleakage
at the margins. Marginal quality was assessed using SEM. Results showed that the best
margins were found in Group 2 where the RBC was placed and cured at the same time with
the conventional RBC. The worst group was Group 4 with the thick liner.
(Opdam, Roeters et al. 2003) examined the difference in marginal leakage and
marginal adaptation between different techniques of placing RBC’s. The study groups
were; 1) bulk filling technique, 2) Flowable liner pre-cured and then applying over it the
conventional RBC, and 3) Flowable RBC placed and cured simultaneously with the
conventional RBC. All restorations were sectioned and tested under the light microscope
for marginal gaps. The results showed that all three techniques resulted in some sort of
voids, however, the least voids were found in Group 3, the flowable RBC cured with the
conventional RBC.
Pre-heated Resin Based Composites
Higher temperatures may be used to mold and shape plastic materials, which turn
more rigid and attained their form when cooled (Hackman, Pohjola et al. 2002).
Advantages have been mentioned for applying heat to RBC’s (Bagis and Rueggeberg
2000). RBC’s could be heated to temperatures up to 155 degrees F. Studies have tested the
heated RBC’s for their monomer conversion, Kinetics and decrease of viscosity. These
61
61
show that when heated, the degree of monomer conversion increased and the residual
monomers decreased increasing the RBC adaptation to cavity walls (Daronch, Rueggeberg
et al. 2005). Other studies (Trujillo, Newman et al. 2004, D'Alpino, Pereira et al. 2006)
showed that heating RBC’s increased the degree of monomer conversion which minimized
the amount of curing light needed.
Pre-heated RBC’s are characterized to have lower viscosity compared to regular
RBC’s. This property of lower viscosity increases the marginal adaptation and surface
wetting of RBC’s. A study done by (Blalock, Holmes et al. 2006) tested the direct effect
of the heating of RBC’s on the viscosity of different types of RBC’s. Seven different
conventional types of RBC’s were used containing different amount of fillers of different
sizes (packable, hybrid and microfilled) and also five different flowable types. Results from
this studies showed that all conventional RBC’s film thickness decreased from 54% to 77%
of their original film thickness when heated. Different types of RBC’s differed in their
degree of viscosity. Another study (Broome 2006) compared also the film thickness of five
different RBC when heated, and reported a 5%-76% decrease in viscosity.
(Aksu 2004) tested the amount of marginal microleakage with different pre-heated
RBC’s in Class II cavity preparations. Four methods where tested as follows : Group 1)
Esthet X control, Group 2) Flowables esthet X flow with Esthet X, Group 3) preheating of
Esthet X to 130 degrees F, Group 4) Delayed cure for 15 seconds. Ten cavities were
prepared in third molars, then they were restored and after thermocycling they were
sectioned and examined under the microscope for the amount of die penetration. Results
showed that leakage scores were less in the group of pre-heated RBC’s compared with the
control and flowable groups.
Another study (Froes-Salgado, Silva et al. 2010) tested the effect of RBC pre-
polymerization temperature and energy density on the marginal adaptation and the flexural
strength, cross linking and degree of conversion. Class V cavities were prepared in 40

62
62
bovine incisors were all restorations were bonded using the Single Bond 2 system and
restored with Filtek Z350 (3M/ESPE). The RBC was either left at room temperature (25
C) or pre-heated to 60 C in the Calset device. Four groups were tested: 1) room temperature
RBC cured for 40 seconds. 2) preheated RBC cured for 40 seconds. 3) room temperature
cured for 20 seconds. 4) preheated RBC cured for 20 seconds. Results showed that the pre-
heated RBC’s exhibited better marginal adaptation than the room temperature RBC’s
however the degree of conversion, flexural strength and polymer cross-linking was the
same between both groups.
Summary
Different techniques and RBC systems have been developed to improve the
marginal adaptation and mechanical properties of the Class II restoration. Many of these
techniques involve variations of material placement. These have included incremental
placement, usage of cavity liners, Snow plow technique, pre-heating of RBC materials and
bulk filling materials.
The review of the literature targeted articles and studies examining marginal
adaptation and gap formation with different materials and placement techniques. Results
have shown conflicting results. Older studies showed that layering technique and
conventional RBC’s had better marginal adaptation compared to RBC’s restored and cured
in bulk. However newer studies have shown different results where both RBC systems and
techniques (layering versus bulk fills) exhibited similar marginal adaptation scores
(Furness et al, 2014; Campos et al, 2014). This may be the result of the recent development
of newer RBC systems which have specifically recommended for bulk placement.
Many questions still exist about these new bulk fill RBC systems including
marginal adaptation, depth of cure, surface micro-hardness, and the best method of

63
63
placement. These questions and properties need to be evaluated to determine whether the
bulk Fill materials have advantages over the conventional RBC’s in the clinical application.
It is very important to compare between both the type of RBC (bulk fill and conventional)
and the placement technique (bulk and layering) as most literature compared only one
variable either the type of RBC used or the placement technique (bulk and layering) using
one type of RBC. The continuous development of bulk fill RBC’s needs continuous
research and testing to approve these restorations as successful.
Therefore, the objective of this research study was to compare a new bulk fill RBC
Tetric EvoCeram bulk fill to a conventional RBC Tetric EvoCeram filling material by
varying the method of placement (layering versus bulk fill) and evaluating the marginal
adaption and depth of cure through the determination of surface micro-hardness.
64
64
CHAPTER III
MATERIALS AND METHODS
Overview
The purpose of this in-vitro study was to test the effects in a Class II cavity
preparation of layering versus bulk filling of two different types of Tetric EvoCeram RBC’s
as determined by evaluation of the external gingival marginal adaptation and the internal
surface micro-hardness. The types of RBC used in the study were a conventional RBC and
a bulk-fill RBC.
The study utilized Class II proximal boxes prepared on molar teeth. Two different
RBC’s (Ivoclar Vivadent) were used for this study including Tetric EvoCeram
recommended for the layering technique and the Tetric EvoCeram Bulk Fill recommended
for the bulk filling technique. All increments used in the layering technique were placed in
a 2mm thickness while on the bulk fill RBC’s were placed in a 4mm increment following
the manufacturer's instructions (table 1).

65
65
Additional
contents Size
Vol.,
%
Wt.,
% Filler Resin Shade Type
Additives,
catalysts,
stabilizers
and
pigments
Avg.
550
nm
53-
54%
76%-
80%
Barium
glass,
ytterbium
triflouride,
mixed
oxide and
prepolymer
Dimethacrylates A2
Tetric
EvoCeram
Bulk Fill
Material
Additives,
catalysts,
stabilizers
and
pigments
Avg.
550
nm
53%-
55%
75%-
76%
Barium
glass,
ytterbium
triflouride,
mixed
oxide and
prepolymer
Dimethacrylates A2
Tetric
EvoCeram
Filling
Material
Table 1 Composition of resin based composite (Tetric EvoCeram system)
Marginal adaptation between the RBC and tooth structure can be defined as the
degree of integrity or seal that forms at the junction between the restoration and the tooth
cavo-surface and also can be described as the presence or absence of gaps at this junction.
A Scanning Electron Microscope with a final magnification of 200X was used in the study
to evaluate the integrity of the gingival margins of the RBC restorations. The marginal gaps
that formed at the gingival margins were recorded and evaluated along the whole length of
the gingival margins and were measured in microns from the images that resulted from the
SEM images.
The other outcome variable which was evaluated was surface micro-hardness.
Teeth were sectioned in buccal and lingual halves where nine points of hardness testing
were measured on both techniques used.

66
66
Research Question
The research question proposed in this study was to determine which of the two
techniques (the layering or the bulk filling technique) in combination with two materials
(conventional or bulk filled RBC’s) provided better marginal adaptation with less marginal
gaps and had higher surface micro-hardness numbers at different levels of measurements
in a proximal Class II tooth preparation.
Methodology
Independent Variables
The effect of the placement technique and RBC type was evaluated by
standardizing the main factors in the experiment to get accurate and reliable results. The
RBC’s used were the Tetric EvoCeram Bulk Fill and the conventional Tetric EvoCeram
filling material. Two techniques of placements were tested the layering technique (two
increments of 2mm each) and the bulk fill technique (one layer of 4mm increment).
Standardized Criteria
The materials used for each and every step of the investigation was standardized.
These included: A) dimensions of the Class II proximal boxes restored in RBC, B) bulk
filling technique using two nanohybrid filled RBC’s (Tetric EvoCeram Bulk Fill and Tetric
EvoCeram conventional RBC from Ivoclar Vivadent), C) layering technique using both a
conventional RBC (Tetric EvoCeram) and a bulk fill RBC (Tetric EvoCeram Bulk Fill)

67
67
from Ivoclar Vivadent, D) adhesive system used (Syntac three step total etch system from
Ivoclar Vivadent), E) light curing time and intensity using the LED Bluephase 16i light
cure. The LED light which was used produced a narrow spectrum of blue light in the 400-
500 nm range (with a peak wavelength of about 460 nm) and irradiance of around 1200
mW/cm2.
Dependent Variables
The main dependent variables measured in this study were: a) the percentage of intact
gingival margins compared to the non-intact margins to determine amount of gap
formation as determined by SEM, B) Knoop hardness (KHN) testing at different levels to
determine degree of polymerization.
Experimental Groups
The Experimental Groups were: Group 1: Restoration using the bulk fill RBC placed in
bulk (BB), Group 2: Restoration using bulk fill RBC placed in layers (BL) (experimental
group), Group 3: Restoration using Conventional RBC placed in layers (CL) (positive
control), Group 4 – Restoration using Conventional RBC placed in bulk (CB) (negative
control) (Figure 1).
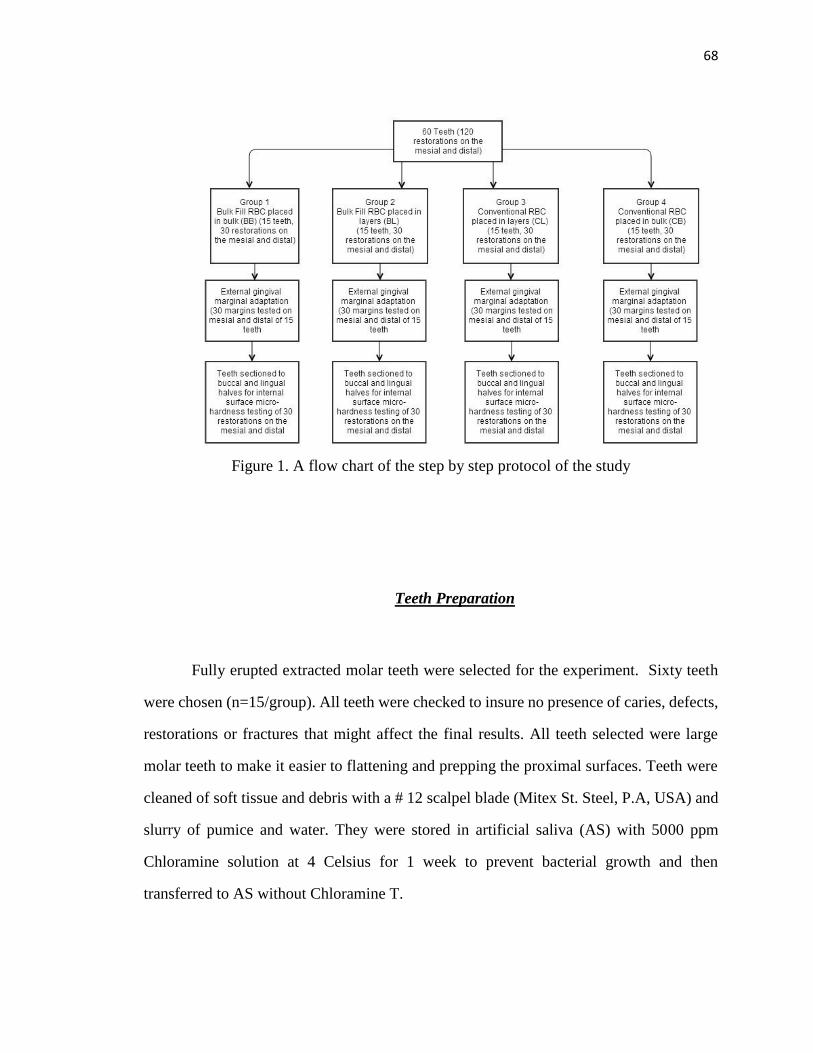
68
68
Figure 1. A flow chart of the step by step protocol of the study
Teeth Preparation
Fully erupted extracted molar teeth were selected for the experiment. Sixty teeth
were chosen (n=15/group). All teeth were checked to insure no presence of caries, defects,
restorations or fractures that might affect the final results. All teeth selected were large
molar teeth to make it easier to flattening and prepping the proximal surfaces. Teeth were
cleaned of soft tissue and debris with a # 12 scalpel blade (Mitex St. Steel, P.A, USA) and
slurry of pumice and water. They were stored in artificial saliva (AS) with 5000 ppm
Chloramine solution at 4 Celsius for 1 week to prevent bacterial growth and then
transferred to AS without Chloramine T.

69
69
The occlusal surfaces and proximal surfaces of the teeth were flattened using a
grinder (Whip Mix Corporation, KY, USA). After flattening, the proximal and occlusal
surfaces were lightly polished using the 600, 1200 and 2000 grit sand paper (Buehler
company, IL, USA). Teeth were stored in AS Chloramine solution 4 Celsius until they
were required for cavity preparation (Figure 2).
Figure 2. Flattened teeth on the occlusal, mesial and distal surfaces
Cavity Design
For the study, Class II slot preparations were prepared on the flattened mesial and
distal parts of each tooth. All occlusal surfaces were flattened to eliminate the cusps. The
proximal box basic outline was prepared using the CNC Specimen Former machine (the
University of Iowa) with a 55 carbide bur (Brasseler, USA) (Figure3). The basic prepared
cavities had dimensions of 4mm length occluso-gingivally, 4mm width bucco-lingually
and 2mm depth mesio-distally. All external margins were ninety degree butt joint margins
without any bevels. All cavity walls were located at least 2mm in dentin gingivally to
provide a 2mm amount of dentin at the ginigival margins of the preparations. Preparations

70
70
were checked for standardization using a digital caliper (Mitutoya, Japan) and were cleaned
using the air water stream.
(a)
(b)
(c)
Figure 3. a) CNC Specimen Former machine used for standardizing cavity preparations.
b) mounted teeth for the CNC machine. c) standardized cavity preparations on the mesial
and distal of each tooth.

71
71
Restorative Procedure
Matrixing of the Preparation
Two teeth were mounted in contact with each other in vinyl polysiloxane putty
material (Exaflex, GC, America, IL, USA) to stimulate a clinical situation. One tooth
proximal contained the preparation while the adjacent tooth was flattened to provide even
contact with the preparation of the other tooth during restoring it. The putty was allowed
to set for 2 minutes. A straight matrix band (WaterPik, USA) was placed between both
teeth to ensure an accurate confinement of restorative material adaptation. A c-clamp was
placed over the putty material on the mesial and distal of both teeth to tighten both teeth
together. The C-clamp was placed on the putty not the tooth as the clamp adapts better on
the putty which in turn pushes the teeth tight (Figure 4).

72
72
(a)
(b)
(c)
Figure 4. a) teeth placed in putty for restorative procedures. b) placement of a tofflemire
matrix band between both teeth. C) pushing teeth tight with a C-clamp

73
73
Adhesion Procedures
Two different RBC’s supplied by Ivoclar Vivadent were used for this study. These
materials included a conventional RBC, Tetric EvoCeram, recommended for placement in
layers of 2mm or less, and the other a bulk fill RBC, Tetric EvoCeram Bulk Fill,
recommended for one increment placement used for the bulk filling (Figure 5). All
preparations were restored with a total-etch bonding system (Syntac, three-step total etch
bonding system, Ivoclar Vivadent, USA. (Table 2)
Heliobond
composition
Adhesive
composition
Primer
composition
Type Name
Bis-GMA,
triethylene
glycol
dimethacrylate
, stabilizers
and catalysts.
Polyethylene
glycol
dimethacrylate,
glutaraldehyde
in an aqueous
solution.
Triethylene
glycol
dimethacrylate,
polyethylene
glycol
dimethacrylate,
maleic acid and
acetone in an
aqueous
solution.
Three step
total etch
system
Syntac
Bonding
System
Table 2. Syntac bonding system composition (Ivoclar Vivadent)

74
74
(a)
(b)
Figure 5. a) Tetric EvoCeram Bulk Fill, b) Tetric EvoCeram filling material
Light energy delivery system was standardized between all the bonding and
restorative procedures to ensure equal degree of cure and polymerization reaction between
the different experimental groups. The manufacturer's recommendations for the light
energy delivery was followed which recommended curing the adhesive system for 10
seconds using a light producing irradiance of 1000 mW/cm2 at least. The energy delivered
for curing of the restorative materials were also standardized using the manufacturer's
instructions to cure the RBC restorations for 10 seconds with a light producing irradiance
of not less than 1000 mW/cm2. The exact mean irradiance of the curing light used

75
75
(Bluephase 16i Ivoclar Vivadent) was measured by the MARC Resin Calibrator (Bluelight
Analytics, Inc) at 2100 mW/cm2 delivering 22.43 J/cm2 at 0mm distance and 1380 mW/cm2
delivering 14 J/cm2 at 4mm. The amount of energy delivered was standardized to 14 J/cm2
to each increment placed which was 11 seconds of cure for the first layer and 7 seconds
of cure for the second layer. The bulk RBC placed in bulk was cured for 11 seconds. The
bulk RBC placed in 2 layers and placed in bulk was cured for 18 seconds.
A step by step procedure was followed with phosphoric acid gel applied first on the
prepared enamel and then to the dentin surfaces. The etchant was left on the teeth for 15
seconds then all etchant gel was removed with vigorous water spray for at least 5 seconds.
Any excess moisture was removed by gently blotting the surface with a piece of cotton
removed leaving the dentin surface with slightly a glossy wet appearance (wet bonding).
Syntac Primer was applied with a brush in the cavity and gently rubbed for a contact time
of 15 seconds on the dentin. Excess Syntac primer was dispersed and dried thoroughly with
air. Syntac adhesive was then applied and left for 10 seconds and then thoroughly dried
with an air syringe. Heliobond then was applied and blown to a thin layer and light cured
for 10 seconds with a curing light (Bluephase 16i Ivoclar Vivadent). The irradiance of the
curing light was monitored throughout the whole study to insure that it was not less than
1000 mW/cm2. (Figure 6, 7).
Figure 6. Ultra etch (UltraDent Products, Inc) Figure 7. Syntac bonding system
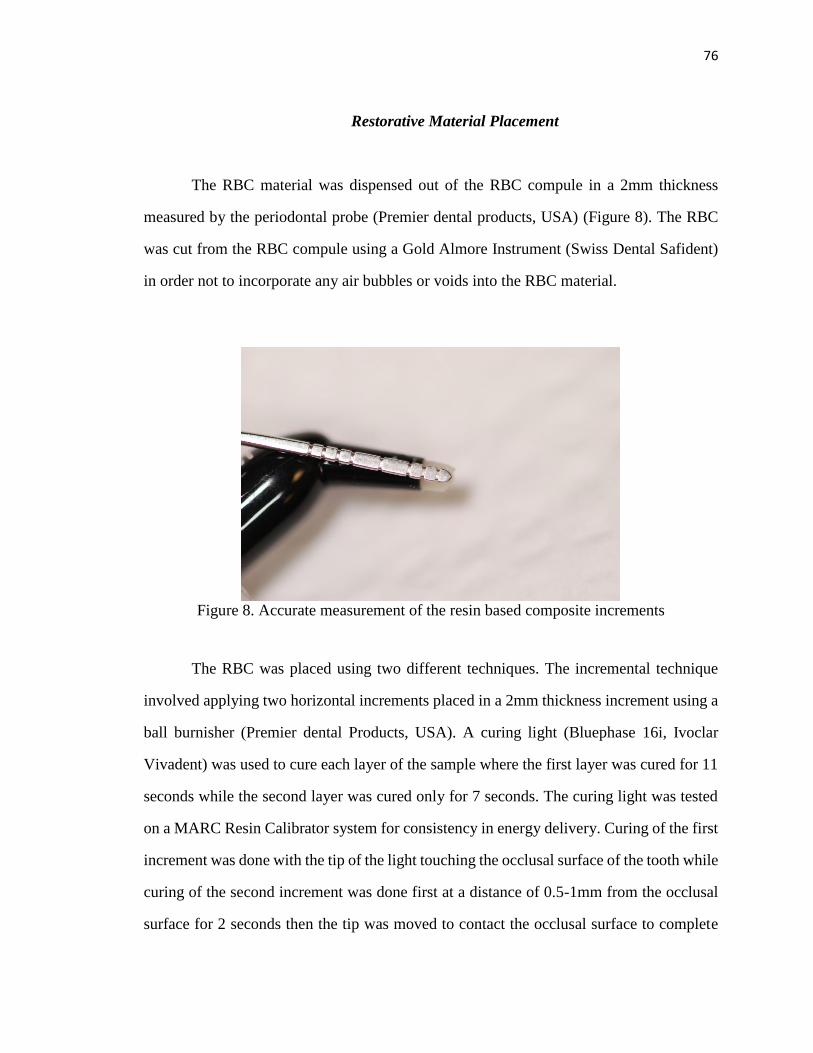
76
76
Restorative Material Placement
The RBC material was dispensed out of the RBC compule in a 2mm thickness
measured by the periodontal probe (Premier dental products, USA) (Figure 8). The RBC
was cut from the RBC compule using a Gold Almore Instrument (Swiss Dental Safident)
in order not to incorporate any air bubbles or voids into the RBC material.
Figure 8. Accurate measurement of the resin based composite increments
The RBC was placed using two different techniques. The incremental technique
involved applying two horizontal increments placed in a 2mm thickness increment using a
ball burnisher (Premier dental Products, USA). A curing light (Bluephase 16i, Ivoclar
Vivadent) was used to cure each layer of the sample where the first layer was cured for 11
seconds while the second layer was cured only for 7 seconds. The curing light was tested
on a MARC Resin Calibrator system for consistency in energy delivery. Curing of the first
increment was done with the tip of the light touching the occlusal surface of the tooth while
curing of the second increment was done first at a distance of 0.5-1mm from the occlusal
surface for 2 seconds then the tip was moved to contact the occlusal surface to complete

77
77
curing. The light curing tip was placed in the same orientation, position and distance with
each restoration.
Group
number
Resin based
composite
Technique of
placement
Abbreviation of
group (Composite
type/ technique)
Bonding Curing time
1 Tetric EvoCeram
Bulk Fill bulk technique BB
Syntac
bonding
system
11
Seconds(for
one whole
increment)
2 Tetric EvoCeram
Bulk Fill
Layering
technique BL
Syntac
bonding
system
11 seconds
(first
increment)
7 seconds
(second
increment)
Total of 18
seconds
3 Tetric EvoCeram
Filling Material
Layering
technique CL
Syntac
bonding
system
11 seconds
(first
increment)
7 seconds
(second
increment)
Total of 18
seconds
4 Tetric EvoCeram
Filling Material bulk technique CB
Syntac
bonding
system
11 seconds
(first
increment)
7 seconds
(second
increment)
Total of 18
seconds
Table 3. The light curing time for each group
With the bulk fill technique, the RBC was applied in one increment to fill the entire
proximal box to a thickness of 4mm using the ball burnisher (Premier Dental Products,
USA).The same curing light was used Bluephase 16i (Ivoclar Vivadent) and a curing time
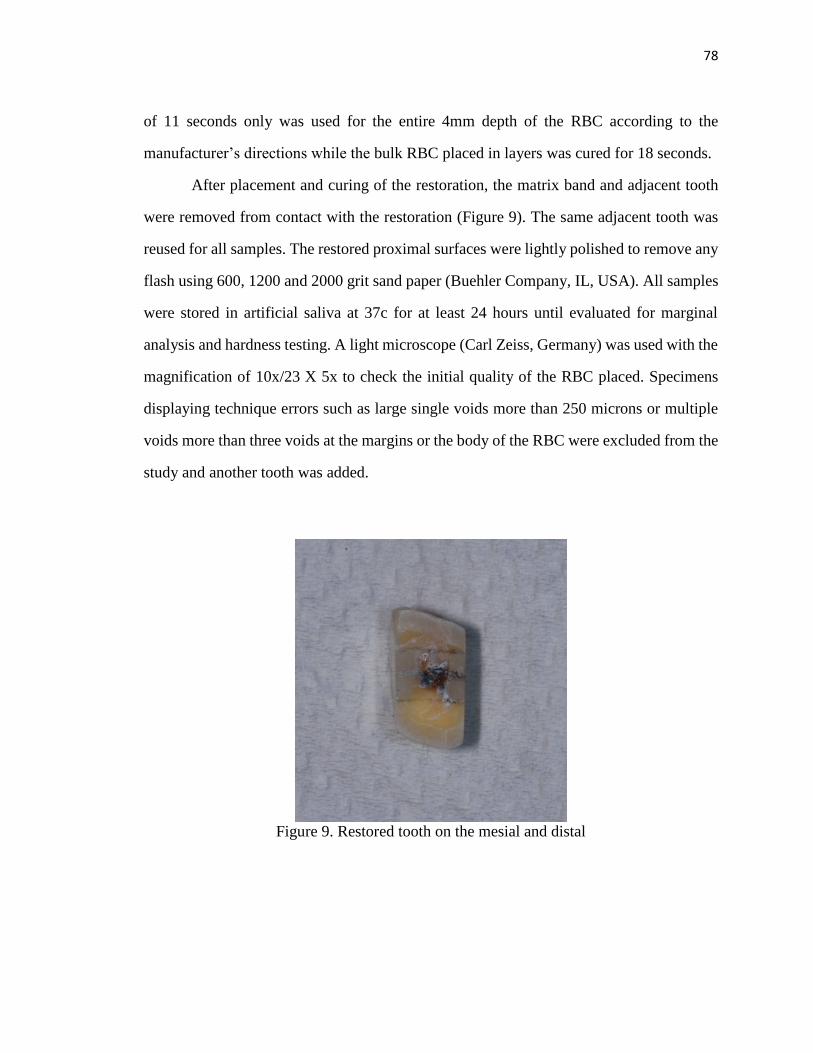
78
78
of 11 seconds only was used for the entire 4mm depth of the RBC according to the
manufacturer’s directions while the bulk RBC placed in layers was cured for 18 seconds.
After placement and curing of the restoration, the matrix band and adjacent tooth
were removed from contact with the restoration (Figure 9). The same adjacent tooth was
reused for all samples. The restored proximal surfaces were lightly polished to remove any
flash using 600, 1200 and 2000 grit sand paper (Buehler Company, IL, USA). All samples
were stored in artificial saliva at 37c for at least 24 hours until evaluated for marginal
analysis and hardness testing. A light microscope (Carl Zeiss, Germany) was used with the
magnification of 10x/23 X 5x to check the initial quality of the RBC placed. Specimens
displaying technique errors such as large single voids more than 250 microns or multiple
voids more than three voids at the margins or the body of the RBC were excluded from the
study and another tooth was added.
Figure 9. Restored tooth on the mesial and distal
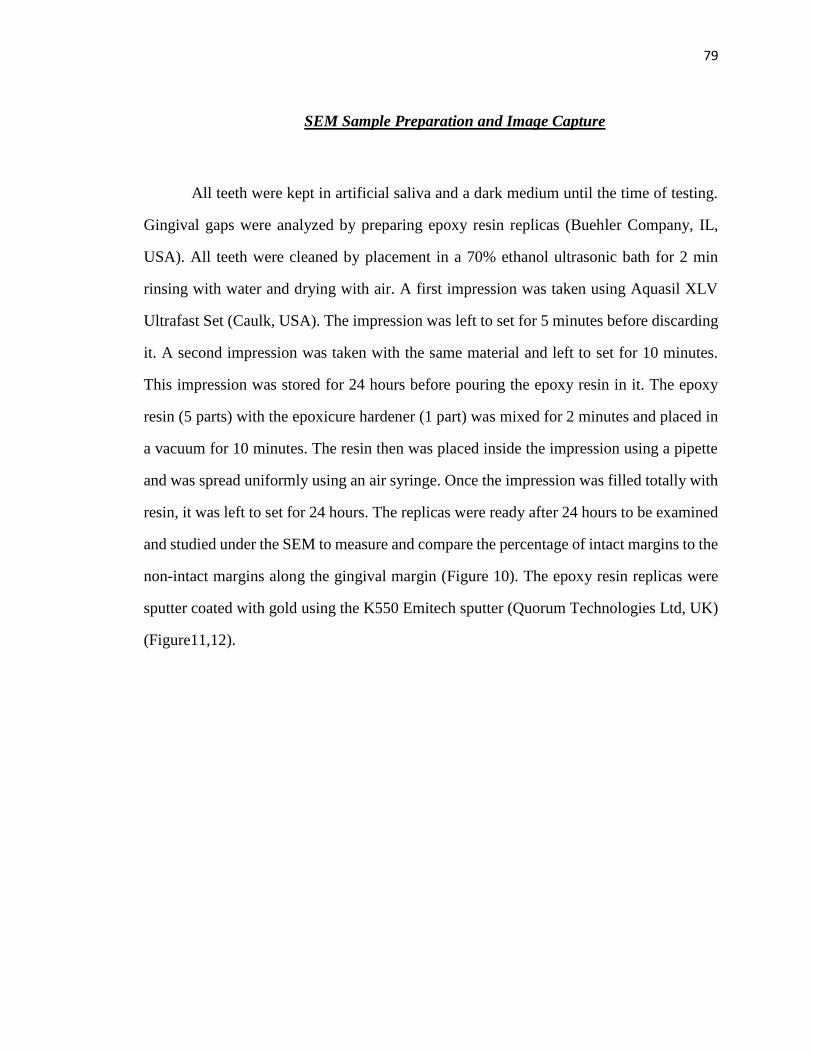
79
79
SEM Sample Preparation and Image Capture
All teeth were kept in artificial saliva and a dark medium until the time of testing.
Gingival gaps were analyzed by preparing epoxy resin replicas (Buehler Company, IL,
USA). All teeth were cleaned by placement in a 70% ethanol ultrasonic bath for 2 min
rinsing with water and drying with air. A first impression was taken using Aquasil XLV
Ultrafast Set (Caulk, USA). The impression was left to set for 5 minutes before discarding
it. A second impression was taken with the same material and left to set for 10 minutes.
This impression was stored for 24 hours before pouring the epoxy resin in it. The epoxy
resin (5 parts) with the epoxicure hardener (1 part) was mixed for 2 minutes and placed in
a vacuum for 10 minutes. The resin then was placed inside the impression using a pipette
and was spread uniformly using an air syringe. Once the impression was filled totally with
resin, it was left to set for 24 hours. The replicas were ready after 24 hours to be examined
and studied under the SEM to measure and compare the percentage of intact margins to the
non-intact margins along the gingival margin (Figure 10). The epoxy resin replicas were
sputter coated with gold using the K550 Emitech sputter (Quorum Technologies Ltd, UK)
(Figure11,12).
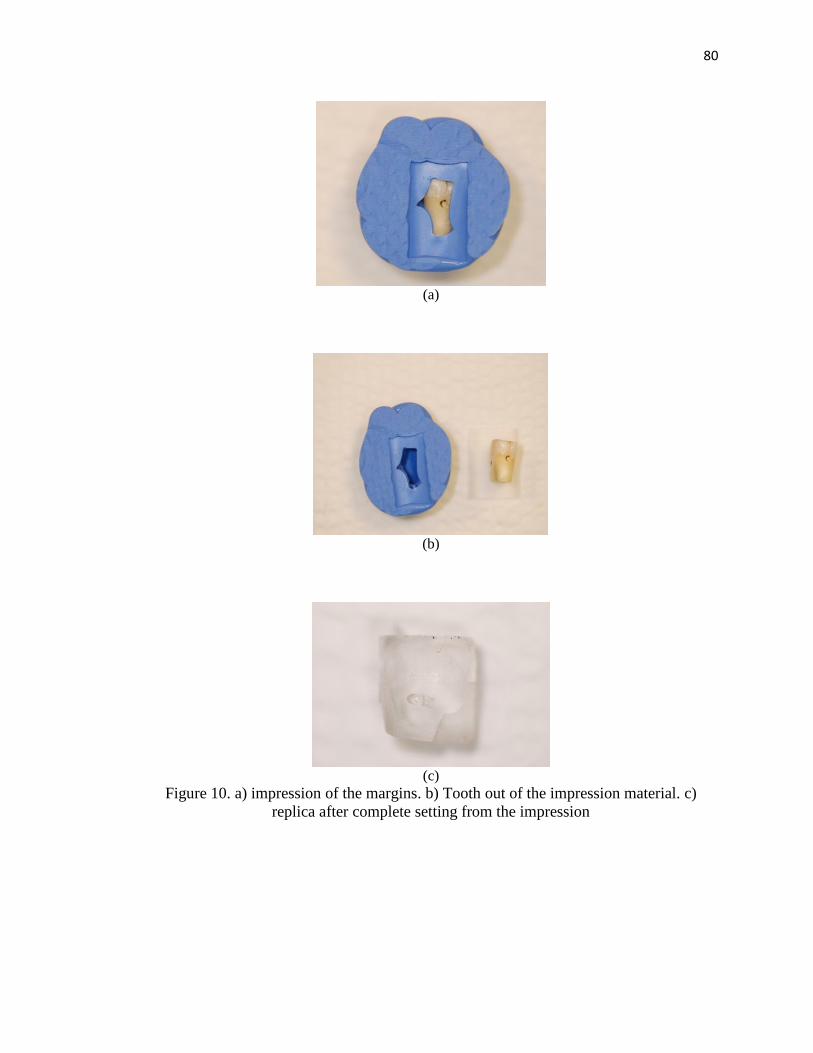
80
80
(a)
(b)
(c)
Figure 10. a) impression of the margins. b) Tooth out of the impression material. c)
replica after complete setting from the impression

81
81
Figure 11. Gold sputter coating the replica for SEM examination
Figure 12. The epoxy resin replica after gold sputtering
All the external gingival margins were examined under a magnification of 200X by
the same evaluator using the Scanning Electron Microscope (Hitachi S4500). A sequence

82
82
of the gingival margin was captured for all samples. All teeth had eight captured images.
One image was taken at a 30X magnification which showed the entire gingival margin
including at least 2mm up the buccal and lingual margins. This image was taken to evaluate
the cavity form and shape and also to ensure that there wasn’t any RBC flash that may
affect the marginal analysis. Seven images were taken of the gingival margin at a
magnification of 200X. The margins were examined at the along the gingival area and at
least 0.2 mm up the buccal and lingual margins. The images taken for the samples depended
on the landmarks chosen on each image to be the reference for the subsequent image
without overlapping, capturing the gingival floor, corners and line angles (Figure 13).
(a)
(b)
Figure 13. a) The whole margins showing under magnification of 30X. b) the seven
images stitched together at 200 X using computer software
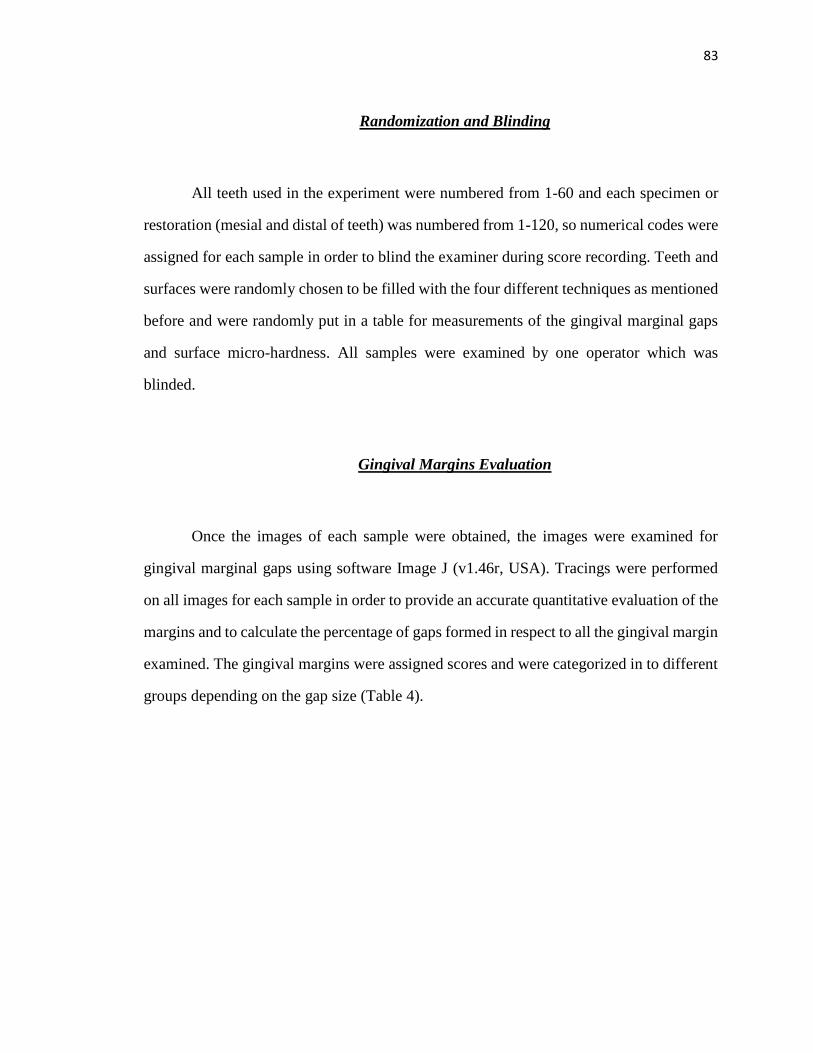
83
83
Randomization and Blinding
All teeth used in the experiment were numbered from 1-60 and each specimen or
restoration (mesial and distal of teeth) was numbered from 1-120, so numerical codes were
assigned for each sample in order to blind the examiner during score recording. Teeth and
surfaces were randomly chosen to be filled with the four different techniques as mentioned
before and were randomly put in a table for measurements of the gingival marginal gaps
and surface micro-hardness. All samples were examined by one operator which was
blinded.
Gingival Margins Evaluation
Once the images of each sample were obtained, the images were examined for
gingival marginal gaps using software Image J (v1.46r, USA). Tracings were performed
on all images for each sample in order to provide an accurate quantitative evaluation of the
margins and to calculate the percentage of gaps formed in respect to all the gingival margin
examined. The gingival margins were assigned scores and were categorized in to different
groups depending on the gap size (Table 4).

84
84
Table 4. Scoring criteria illustrated with SEM images (continued)
SEM Images (200 X) Definition Marg
inal
Quali
ty
Intact
margins
MQ=
1
Severe
irregulariti
es
MQ=
2

85
85
Table 4. Scoring criteria illustrated with SEM images (continued)
Marginal
gap < 2um
MQ=
3
Marginal
gap 2-20
um
MQ=
4
Marginal
gap > 20
um
MQ=
5
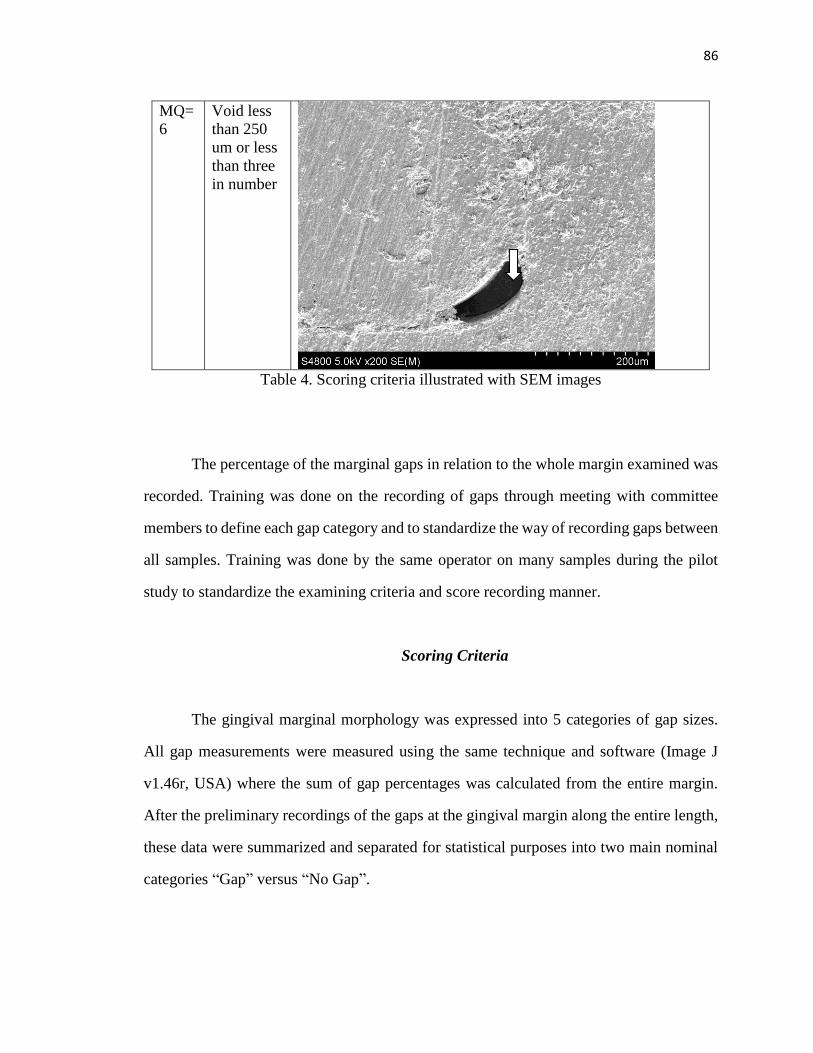
86
86
Void less
than 250
um or less
than three
in number
MQ=
6
Table 4. Scoring criteria illustrated with SEM images
The percentage of the marginal gaps in relation to the whole margin examined was
recorded. Training was done on the recording of gaps through meeting with committee
members to define each gap category and to standardize the way of recording gaps between
all samples. Training was done by the same operator on many samples during the pilot
study to standardize the examining criteria and score recording manner.
Scoring Criteria
The gingival marginal morphology was expressed into 5 categories of gap sizes.
All gap measurements were measured using the same technique and software (Image J
v1.46r, USA) where the sum of gap percentages was calculated from the entire margin.
After the preliminary recordings of the gaps at the gingival margin along the entire length,
these data were summarized and separated for statistical purposes into two main nominal
categories “Gap” versus “No Gap”.
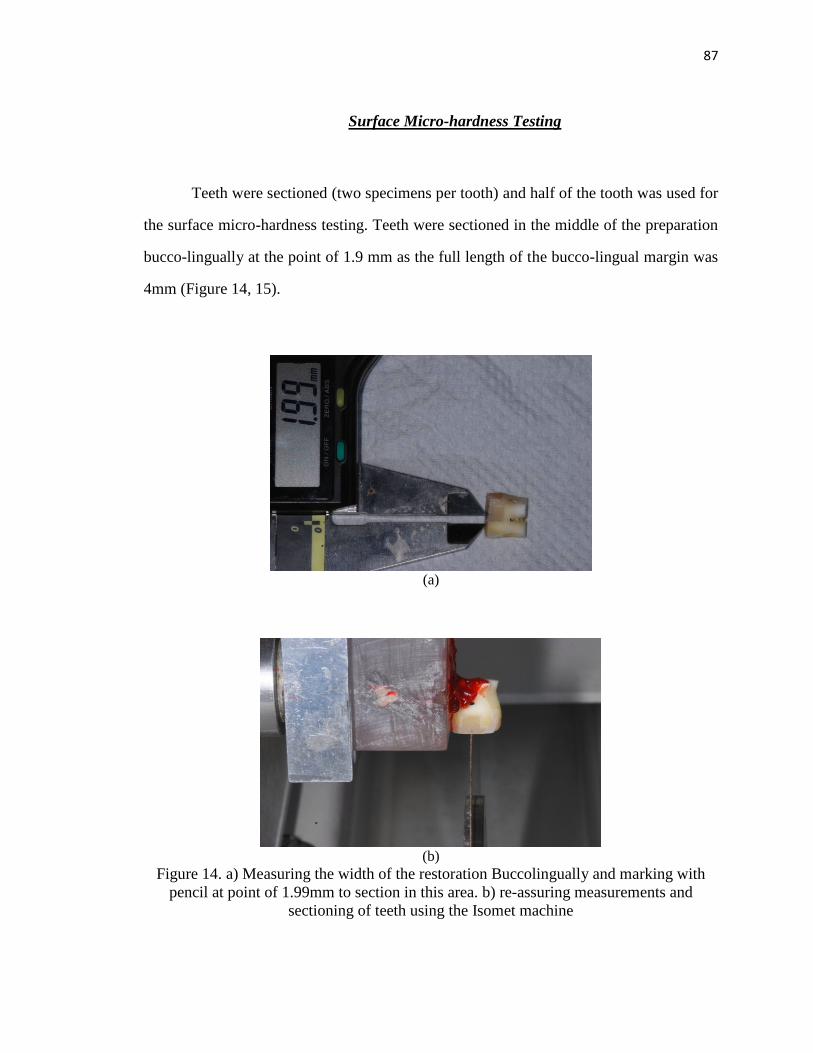
87
87
Surface Micro-hardness Testing
Teeth were sectioned (two specimens per tooth) and half of the tooth was used for
the surface micro-hardness testing. Teeth were sectioned in the middle of the preparation
bucco-lingually at the point of 1.9 mm as the full length of the bucco-lingual margin was
4mm (Figure 14, 15).
(a)
(b)
Figure 14. a) Measuring the width of the restoration Buccolingually and marking with
pencil at point of 1.99mm to section in this area. b) re-assuring measurements and
sectioning of teeth using the Isomet machine
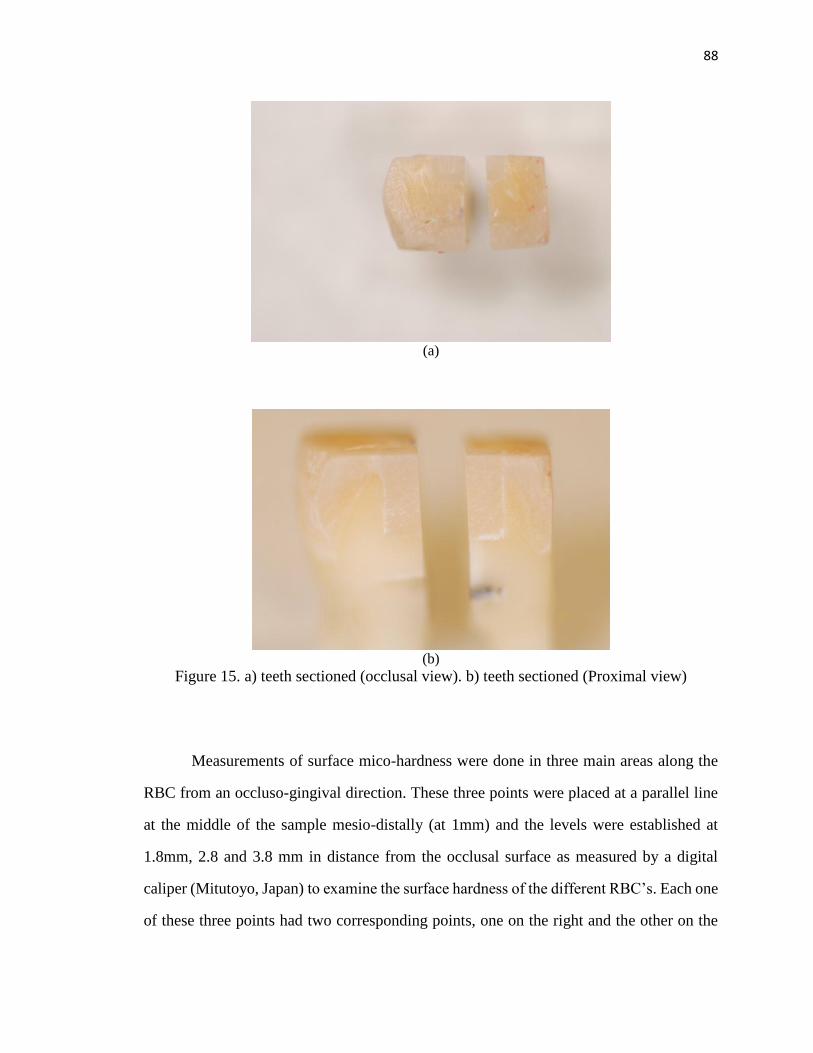
88
88
(a)
(b)
Figure 15. a) teeth sectioned (occlusal view). b) teeth sectioned (Proximal view)
Measurements of surface mico-hardness were done in three main areas along the
RBC from an occluso-gingival direction. These three points were placed at a parallel line
at the middle of the sample mesio-distally (at 1mm) and the levels were established at
1.8mm, 2.8 and 3.8 mm in distance from the occlusal surface as measured by a digital
caliper (Mitutoyo, Japan) to examine the surface hardness of the different RBC’s. Each one
of these three points had two corresponding points, one on the right and the other on the
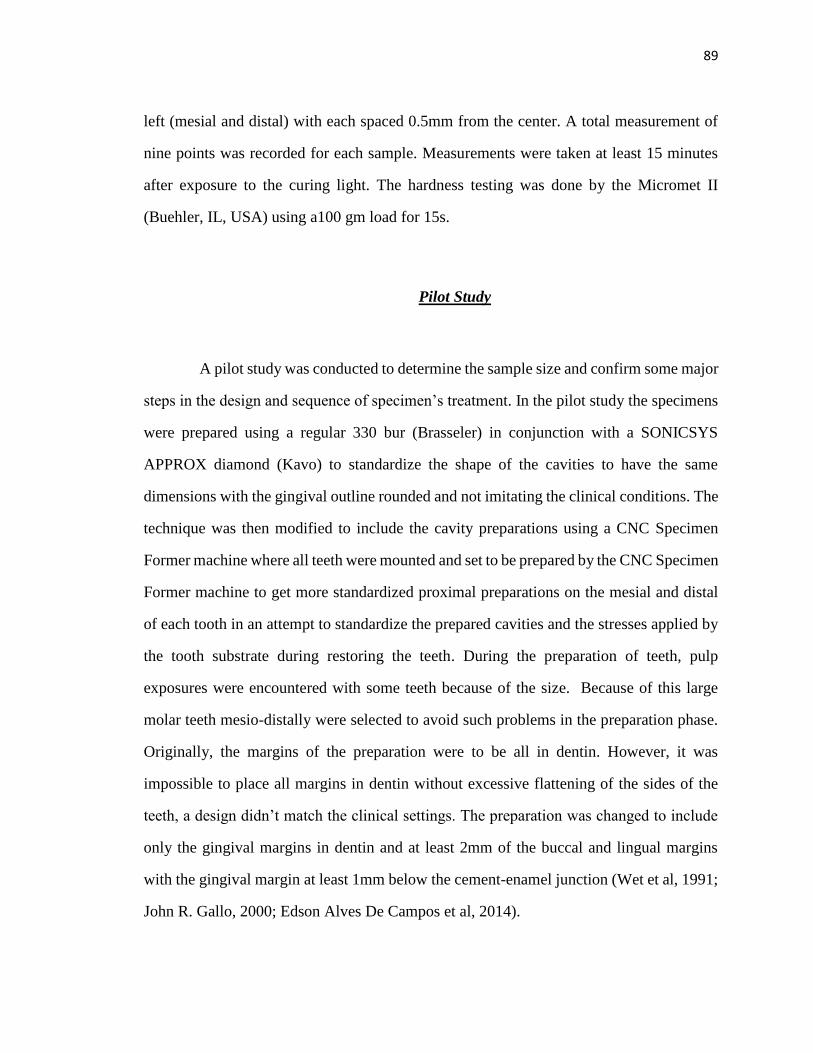
89
89
left (mesial and distal) with each spaced 0.5mm from the center. A total measurement of
nine points was recorded for each sample. Measurements were taken at least 15 minutes
after exposure to the curing light. The hardness testing was done by the Micromet II
(Buehler, IL, USA) using a100 gm load for 15s.
Pilot Study
A pilot study was conducted to determine the sample size and confirm some major
steps in the design and sequence of specimen’s treatment. In the pilot study the specimens
were prepared using a regular 330 bur (Brasseler) in conjunction with a SONICSYS
APPROX diamond (Kavo) to standardize the shape of the cavities to have the same
dimensions with the gingival outline rounded and not imitating the clinical conditions. The
technique was then modified to include the cavity preparations using a CNC Specimen
Former machine where all teeth were mounted and set to be prepared by the CNC Specimen
Former machine to get more standardized proximal preparations on the mesial and distal
of each tooth in an attempt to standardize the prepared cavities and the stresses applied by
the tooth substrate during restoring the teeth. During the preparation of teeth, pulp
exposures were encountered with some teeth because of the size. Because of this large
molar teeth mesio-distally were selected to avoid such problems in the preparation phase.
Originally, the margins of the preparation were to be all in dentin. However, it was
impossible to place all margins in dentin without excessive flattening of the sides of the
teeth, a design didn’t match the clinical settings. The preparation was changed to include
only the gingival margins in dentin and at least 2mm of the buccal and lingual margins
with the gingival margin at least 1mm below the cement-enamel junction (Wet et al, 1991;
John R. Gallo, 2000; Edson Alves De Campos et al, 2014).
90
90
During the pilot study the operator wasn’t blinded to the teeth being tested. To
decrease possible bias during the study testing each tooth was coded by a numerical code
for the purpose of blinding and all codes were tabulated corresponding to their type of RBC
and technique used for future referral whole collecting the results for statistical analysis.
The procedures explained previously were followed to compare between both
techniques of layering versus bulk filling using two different RBC’s which included
conventional and bulk filled.
Power Analysis
To determine the sample size needed for the present study, statistical power analysis
was conducted based on the prior pilot data. In order to achieve significant results, this
analysis suggested that a sample size of at least 15 teeth per group was needed to detect a
significant difference in the external marginal gaps and the internal surface micro-hardness
among the four RBC restorative groups with 80% power and an effect size of 0.895 for the
external marginal gaps and 0.904 for the internal surface micro-hardness at 5 %
significance level, using one-way ANOVA.
Statistical Analysis
Sixty teeth with one hundred and twenty restorations prepared on the mesial and
distal of each tooth were selected and randomly divided into four RBC restorative groups,
including15 teeth per group with thirty (n=2/per tooth) restorations total per group.
External marginal gap and internal surface micro-hardness were measured at both mesial
and distal surfaces of the same tooth, while internal surface micro-hardness scores were
measured at three different hardness levels (depths) within each surface for the same tooth

91
91
at levels of 1.8mm, 2.8mm and 3.8mm depth from the top surface. Mean values of hardness
at three levels and mean marginal gaps of the different seven SEM images by each surface
and tooth were used for the statistical comparisons.
Variables
In this study, the independent variables were, the dimensions of the Class II
proximal boxes restored in RBC, the bulk filling technique using two nanohybrid filled
RBC’s (Tetric EvoCeram Bulk Fill and Tetric EvoCeram conventional RBC from Ivoclar
Vivadent), the layering technique using both a conventional RBC (Tetric EvoCeram) and
a bulk fill RBC (Tetric EvoCeram Bulk Fill) from Ivoclar Vivadent. The adhesive system
used (Syntac three step total etch system from Ivoclar Vivadent) and the light curing time
and intensity using the LED Bluephase 16i light cure of 12000 mW/cm2 from Ivoclar
Vivadent. However the dependent variables were the percentage of intact gingival margins
compared to the non-intact margins to determine amount of gap formation as determined
by SEM and the Knoop hardness (KHN) testing at different levels to determine degree of
polymerization.
Overall Statistical Methods
Descriptive statistics were conducted (Refer to appendix A). One-way ANOVA
was performed to evaluate the effect of RBC restorations and placement technique on the
external marginal gap and internal surface micro-hardness. If a significant effect existed,
the post-hoc Tukey’s HSD (Honestly Significant Difference) test was used for the multiple
pairwise comparisons to determine which pairs of groups differed. Within each RBC
restorative group, either a paired-sample t-test or a nonparametric Wilcoxon signed-rank

92
92
test, as appropriate, was used to test the difference in external marginal gap and internal
micro-hardness between mesial and distal surfaces.
For assessing the effect of hardness levels on internal surface micro-hardness, when
taking into account the correlated data obtained (i.e. three specimens from the same tooth
for the three hardness levels of internal surface micro-hardness measured on the same
tooth), the random effects in Mixed Models ANOVA (i.e. to allow correlation between
three specimens obtained from the same tooth) was conducted to evaluate the effect of
hardness levels on internal surface micro-hardness within each RBC restorative group.
Additionally, the Shapiro-Wilks’ test was applied to verify the assumption of normality as
nonparametric statistical procedures were carried out.
All tests employed a 0.05 level of statistical significance. SAS for Windows (v9.3,
SAS Institute Inc, Cary, NC, USA) was used for the data analysis.

93
93
CHAPTER IV
RESULTS
Difference in Gingival Marginal Gap Scores between the Four Tested Groups
at the Distal and Mesial Surfaces
The Gingival marginal gap scores were recorded for the four tested groups on the
mesial and distal surfaces. Comparisons were made to evaluate differences in marginal
gaps between the different restorative groups on each tested surface (mesial and distal).
The results of the average marginal gaps of the different seven SEM images for each group
were recorded (Refer to Appendix B).
Data were analyzed using one-way ANOVA. This analysis revealed that there was
no significant effect of RBC restorations on external marginal gap at distal surface (F(3,
56)=1.66; p=0.1870) or at the mesial surface (F(3, 56)=0.97; p=0.4130). That is, no
significant difference in external marginal gap was found among four RBC restorative
groups (Tables 5, 6 and 7) and (Figures 16 and 17).
Source of Variation
Degrees of
Freedom
Sum of
Squares
Mean
Square F
P
value
Type of RBC used and
technique of placement
3 0.28 0.09 1.66 0.1870
Error 56 3.15 0.06
Total 59 3.43
Table 5. Results of one-way ANOVA for external marginal gap at distal surface

94
94
Figure 16. Comparison of external marginal gaps between the four groups (distal surface)
Source of Variation
Degrees of
Freedom
Sum of
Squares
Mean
Square F
P
value
Type of RBC used and technique
of placement
3 0.21 0.07 0.97 0.4130
Error 56 4.06 0.07
Total 59 4.27
Table 6. Result of one-way ANOVA for external marginal gap at mesial surface
Figure 17. Comparison of external marginal gaps between the four groups (mesial
surface)
0.452 0.432 0.421
0.28
0
0.1
0.2
0.3
0.4
0.5
CB CL BL BBMEA
N E
XTE
RN
AL
MA
RG
INA
L G
AP
RESTORATIVE GROUPS
MEAN EXTERNAL MARGINAL GAPS
Distal Surface
0.4880.419 0.433
0.323
0
0.1
0.2
0.3
0.4
0.5
0.6
CB CL BL BB
Mea
n E
xter
nal
Mar
gin
al G
ap
Restorative Groups
Mean External Marginal Gaps
Mesial Surface

95
95
Difference in Gingival Marginal Gap Scores between the Mesial and Distal Surfaces of
Each Group of the Four Tested Groups
Based on a paired-sample t-test, no significant difference in external marginal gap
was found between the mesial and distal surfaces within BB group (bulk RBC, placed in
bulk) (p=0.6728), the BL group (bulk RBC, placed in layers) (p=0.8711), the CL group
(conventional RBC, placed in layers) (p=0.8554) and the CB group (conventional RBC,
placed in bulk) (p=0.5883), and mean external marginal gap difference between distal and
mesial (Table7) and (Figure 18).
Resin
Composite
Restorative
Groups
Mean External Marginal Gap
(SD)
Mean External
Marginal Gap
Difference
Between Distal
and Mesial
Surface
(SD)
Distal Surface
Mesial Surface
CB
0.452 (0.229)A,1
0.488 (0.292)A,1
-0.036 (0.247)
CL
0.432 (0.292)A,1
0.419 (0.217)A,1
0.013 (0.256)
BL
0.421 (0.213)A,1
0.433 (0.221)A,1
-0.012 (0.283)
BB
0.280 (0.206)A,1
0.323 (0.329)A,1
-0.043 (0.393)
Table 7. Comparisons of external marginal gap among four resin composite restorative
groups
*Column means with the same letter are not significantly different using the post-hoc
Tukey’s HSD test (P>.05).
**Row means with the same number are not significantly different using a paired-sample
t-test
(p>0.05)
***External marginal gap difference between distal and mesial Surface=external
marginal gap at distal surface minus external marginal gap at mesial surface

96
96
Figure 18. Comparison of external marginal gaps between the mesial and distal surfaces
of the four groups
Results showed that there were no any significant differences in the gingival
marginal adaptation between the different restorative groups on the mesial and distal
surfaces, also there was no any significant differences in gingival marginal adaptation
between the mesial and distal restorations within the same group. Results of the mean score
of gaps on the mesial and distal restorations, the number of no gaps and voids scores that
were scored in each restorative group are illustrated (Table 8).
0.4520.432 0.421
0.28
0.488
0.419 0.433
0.323
0
0.1
0.2
0.3
0.4
0.5
0.6
CB CL BL BB
Mea
n E
xter
nal
Mar
gin
al G
ap
Restorative Groups
Mean External Marginal Gaps
Distal Mesial

97
97
Group Mean gap score on the
mesial and distal
surfaces
Number of specimens
with no gaps/ group
Number of samples
with voids/ group
bulk RBC placed
in bulk (BB)
0.302 1 5
bulk RBC placed
in layers (BL)
0.427 0 8
Conventional RBC
placed in layers
(CL)
0.426 1 7
Conventional RBC
placed in bulk
(CB)
0.47 0 7
Table 8. Number of gap free margins and voids in the different restorative groups
Difference in the Internal Surface Micro-hardness (KHN) Scores between the
Three Different Layers (Depths) Tested of Each Group of the Four Tested Groups at
the Distal and Mesial Surfaces
Group 1 (bulk fill RBC, placed in bulk)
Results of internal surface micro-hardness were recorded at three different levels
1.8mm, 2.8mm and 3.8mm. The scores were compared between different levels of hardness
testing in the restorations on the distal and mesial surfaces within the same group.
The data were analyzed using a simple random effect in Mixed Model ANOVA to
allow correlation between three specimens from the same tooth. This analysis revealed
there was a statistically significant effect of hardness level on internal surface micro-
hardness at distal surface within BB (bulk RBC, placed in bulk) group (p<0.0001). It
showed that mean internal surface micro-hardness for KHN 1.8mm below top surface of
RBC was significantly greater than KHN 2.8mm and 3.7mm below top surface of RBC

98
98
(p<0.0001 and p<0.0001), while the mean internal surface micro-hardness for KHN 2.8mm
below top surface of RBC was significantly greater than that for KHN 3.8mm below top
surface of RBC (p=0.0010). Using the same analysis model on the mesial surfaces ,
analysis revealed there was a statistically significant effect of hardness level on internal
surface micro-hardness at mesial surface within BB (bulk RBC, placed in bulk) group
(p=0.0040). It showed that mean internal surface micro-hardness for KHN 1.8mm below
top surface of RBC was significantly greater than KHN 2.8mm and 3.7mm below top
surface of RBC (p=0.0077 and p=0.0011), while the mean internal surface micro-hardness
for KHN 2.8mm below top surface of RBC was significantly greater than that for KHN
3.8mm below top surface of RBC (p=0.0169).
Results of multiple pairwise comparisons based on the differences of least squares
means among three surface levels on the mesial and distal can be shown in (Table 9) and
(Figures 19 and 20).
Surface Level (BB)
Mean Internal Surface Micro-Hardness (SD)
Distal Surface Mesial Surface
KHN 1.8mm Below Top Surface of Composite
62.833 (6.951)A
58.853 (6.695)A
KHN 2.8mm Below Top Surface of Composite
55.653 (3.449)B
55.213 (5.079)B
KHN 3.8mm Below Top Surface of Composite
52.427 (4.259)c
52.180 (4.518)C
Table 9. Comparisons of internal surface micro-hardness among three surface levels
within bulk RBC placed in bulk technique (BB) group
*Column means with the same letter are not significantly different (P>0.05).

99
99
Figure 19. Comparison between the three surface levels of internal surface micro-
hardness in the BB group (distal surface)
Figure 20. Comparison between the three surface levels of internal surface micro-
hardness in the BB group (mesial surface)
62.833
55.653
52.427
50
55
60
65
70
KHN 1.8mm
KHN 2.8mm
KHN 3.8mm
INTE
RN
AL
SUR
FAC
E M
ICR
O-H
AR
DN
ESS
THREE SURFACE LEVELS
Mean Internal Surface Micro-hardness (BB)
Distal Surface
50
52
54
56
58
60
62
64
66
68
70
KHN 1.8mm
KHN 2.8mm
KHN 3.8mm
Inte
rnal
Su
rfac
e M
icro
-har
dn
ess
Three Surface Levels
Mean Internal Surface Micro-hardness (BB)
Mesial Surface
100
100
Group 2 (bulk fill RBC, placed in layers)
The data were analyzed using a simple random effect in Mixed Model ANOVA to
allow correlation between three specimens from the same tooth. This analysis revealed
there was a statistically significant effect of hardness level on internal surface micro-
hardness at distal surface within BL (bulk RBC, placed in layers) group (p=0.0003). It
showed that mean internal surface micro-hardness for KHN 1.8mm below top surface of
RBC was significantly greater than KHN 2.8mm and 3.7mm below top surface of RBC
(p=0.0005 and p<0.0001), while the mean internal surface micro-hardness for KHN 2.8mm
below top surface of RBC was significantly greater than that for KHN 3.8mm below top
surface of RBC (p=0.0160). Using the same analysis on the mesial surfaces, This analysis
revealed there was a statistically significant effect of hardness level on internal surface
micro-hardness at mesial surface within BL (bulk RBC, placed in layers) group (p=0.0008).
It showed that mean internal surface micro-hardness for KHN 1.8mm below top surface of
RBC was significantly greater than KHN 2.8mm and 3.7mm below top surface of RBC
(p=0.0049 and p=0.0004), while the mean internal surface micro-hardness for KHN 2.8mm
below top surface of RBC was significantly greater than that for KHN 3.8mm below top
surface of RBC (p=0.0107).
The results of multiple pairwise comparisons based on the differences of least
squares means among three surface levels on the mesial and distal surfaces are displayed
in (Table 10) and (Figures 21 and 22).
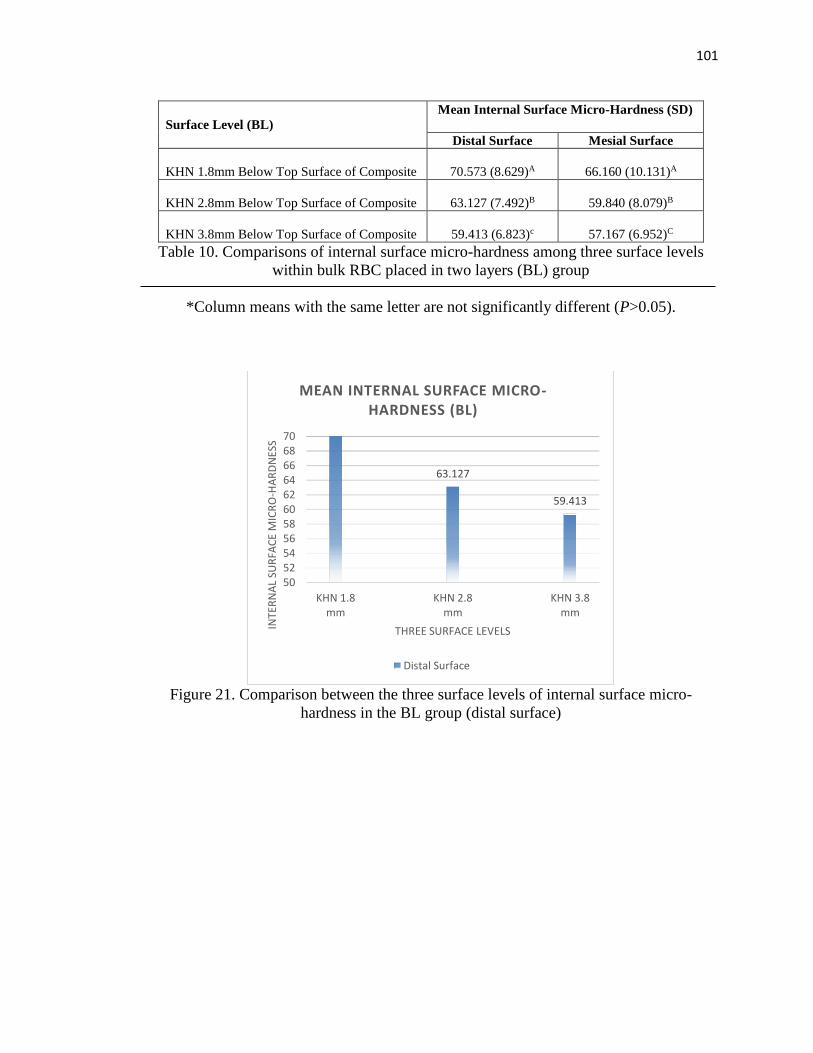
101
101
Surface Level (BL)
Mean Internal Surface Micro-Hardness (SD)
Distal Surface Mesial Surface
KHN 1.8mm Below Top Surface of Composite
70.573 (8.629)A
66.160 (10.131)A
KHN 2.8mm Below Top Surface of Composite
63.127 (7.492)B
59.840 (8.079)B
KHN 3.8mm Below Top Surface of Composite
59.413 (6.823)c
57.167 (6.952)C
Table 10. Comparisons of internal surface micro-hardness among three surface levels
within bulk RBC placed in two layers (BL) group
*Column means with the same letter are not significantly different (P>0.05).
Figure 21. Comparison between the three surface levels of internal surface micro-
hardness in the BL group (distal surface)
63.127
59.413
5052545658606264666870
KHN 1.8mm
KHN 2.8mm
KHN 3.8mm
INTE
RN
AL
SUR
FAC
E M
ICR
O-H
AR
DN
ESS
THREE SURFACE LEVELS
MEAN INTERNAL SURFACE MICRO-HARDNESS (BL)
Distal Surface
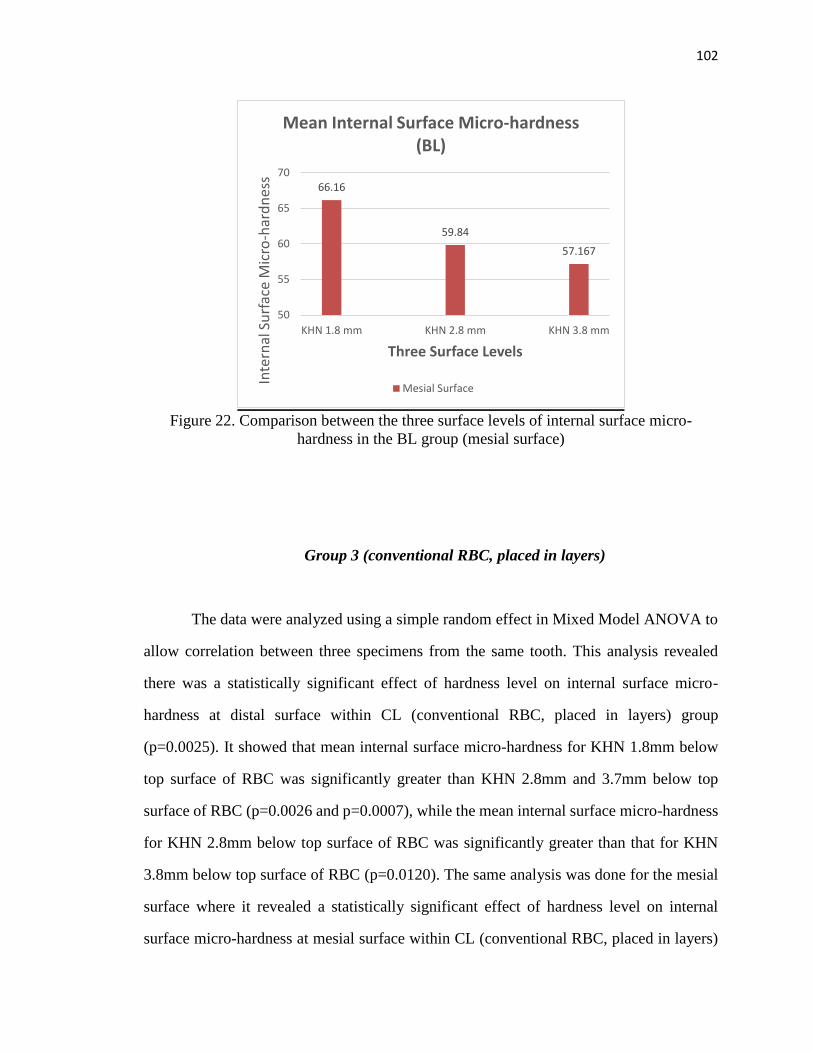
102
102
Figure 22. Comparison between the three surface levels of internal surface micro-
hardness in the BL group (mesial surface)
Group 3 (conventional RBC, placed in layers)
The data were analyzed using a simple random effect in Mixed Model ANOVA to
allow correlation between three specimens from the same tooth. This analysis revealed
there was a statistically significant effect of hardness level on internal surface micro-
hardness at distal surface within CL (conventional RBC, placed in layers) group
(p=0.0025). It showed that mean internal surface micro-hardness for KHN 1.8mm below
top surface of RBC was significantly greater than KHN 2.8mm and 3.7mm below top
surface of RBC (p=0.0026 and p=0.0007), while the mean internal surface micro-hardness
for KHN 2.8mm below top surface of RBC was significantly greater than that for KHN
3.8mm below top surface of RBC (p=0.0120). The same analysis was done for the mesial
surface where it revealed a statistically significant effect of hardness level on internal
surface micro-hardness at mesial surface within CL (conventional RBC, placed in layers)
66.16
59.84
57.167
50
55
60
65
70
KHN 1.8 mm KHN 2.8 mm KHN 3.8 mm
Inte
rnal
Su
rfac
e M
icro
-har
dn
ess
Three Surface Levels
Mean Internal Surface Micro-hardness (BL)
Mesial Surface

103
103
group (p=0.0001). It showed that mean internal surface micro-hardness for KHN 1.8mm
below top surface of RBC was significantly greater than KHN 2.8mm and 3.7mm below
top surface of RBC (p=0.0006 and p<0.0001), while the mean internal surface micro-
hardness for KHN 2.8mm below top surface of RBC was significantly greater than that for
KHN 3.8mm below top surface of RBC (p=0.0011).
The results of multiple pairwise comparisons based on the differences of least
squares means among three surface levels on the mesial and distal surfaces are displayed
in (Table 11) and (Figures 23 and 24).
Surface Level (CL)
Mean Internal Surface Micro-Hardness (SD)
Distal Surface Mesial Surface
KHN 1.8mm Below Top Surface of Composite
61.607 (7.159)A
62.007 (6.046)A
KHN 2.8mm Below Top Surface of Composite
56.067 (3.411)B
57.427 (4.433)B
KHN 3.8mm Below Top Surface of Composite
53.113 (4.394)c
53.973 (5.034)C
Table 11. Comparisons of internal surface micro-hardness among three surface levels
within Conventional RBC Placed in Two Layers (CL) group
*Column means with the same letter are not significantly different (P>0.05).

104
104
Figure 23. Comparison between the three surface levels of internal surface micro-
hardness in the CL group (distal surface)
Figure 24. Comparison between the three surface levels of internal surface micro-
hardness in the CL group (mesial surface)
61.607
56.067
53.113
5052545658606264666870
KHN 1.8mm
KHN 2.8mm
KHN 3.8mm
INTE
RN
AL
SUR
FAC
E M
ICR
O-H
AR
DN
ESS
THREE SURFACE LEVELS
MEAN INTERNAL SURFACE MICRO-HARDNESS (CL)
Distal Surface
62.007
57.427
53.973
50
55
60
65
70
KHN 1.8 mm KHN 2.8 mm KHN 3.8 mm
Inte
rnal
Su
rfac
e M
icro
-har
dn
ess
Three Surface Levels
Mean Internal Surface Micro-hardness (CL)
Mesial Surface

105
105
Group 4 (conventional RBC, placed in bulk)
The data were analyzed using a simple random effect in Mixed Model ANOVA to
allow correlation between three specimens from the same tooth. This analysis revealed
there was a statistically significant effect of hardness level on internal surface micro-
hardness at distal surface within CB (conventional RBC, placed in bulk) group (p=0.0003).
It showed that mean internal surface micro-hardness for KHN 1.8mm below top surface of
RBC was significantly greater than KHN 2.8mm and 3.7mm below top surface of RBC
(p=0.0021 and p<0.0001), while the mean internal surface micro-hardness for KHN 2.8mm
below top surface of RBC was significantly greater than that for KHN 3.8mm below top
surface of RBC (p=0.0012). Same analysis was done the mesial surfaces, This analysis
revealed there was a statistically significant effect of hardness level on internal surface
micro-hardness at mesial surface within CB (conventional RBC, placed in bulk) group
(p=0.0004). It showed that mean internal surface micro-hardness for KHN 1.8mm below
top surface of RBC was significantly greater than KHN 2.8mm and 3.7mm below top
surface of RBC (p=0.0032 and p=0.0002), while the mean internal surface micro-hardness
for KHN 2.8mm below top surface of RBC was significantly greater than that for KHN
3.8mm below top surface of RBC (p=0.0017).
The results of multiple pairwise comparisons based on the differences of least
squares means among three surface levels are displayed (Table 12) and (Figures 25 and
26).

106
106
Surface Level (CB)
Mean Internal Surface Micro-Hardness (SD)
Distal Surface
Mesial Surface
KHN 1.8mm Below Top Surface of Composite
64.440 (9.029)A
62.720 (10.061)A
KHN 2.8mm Below Top Surface of Composite
59.467 (6.770)B
55.380 (4.705)B
KHN 3.8mm Below Top Surface of Composite
53.587 (4.685)C
51.840 (5.244)C
Table 12. Comparisons of internal surface micro-hardness among three surface levels
within conventional RBC placed in bulk technique (CB) group
*Column means with the same letter are not significantly different (P>0.05).
Figure 25. Comparison between the three surface levels of internal surface micro-
hardness in the CB group (distal surface)
64.44
59.467
53.587
5052545658606264666870
KHN 1.8mm
KHN 2.8mm
KHN 3.8mm
INTE
RN
AL
SUR
FAC
E M
ICR
O-H
AR
DN
ESS
THREE SURFACE LEVELS
MEAN INTERNAL SURFACE MICRO-HARDNESS (CB)
Distal Surface
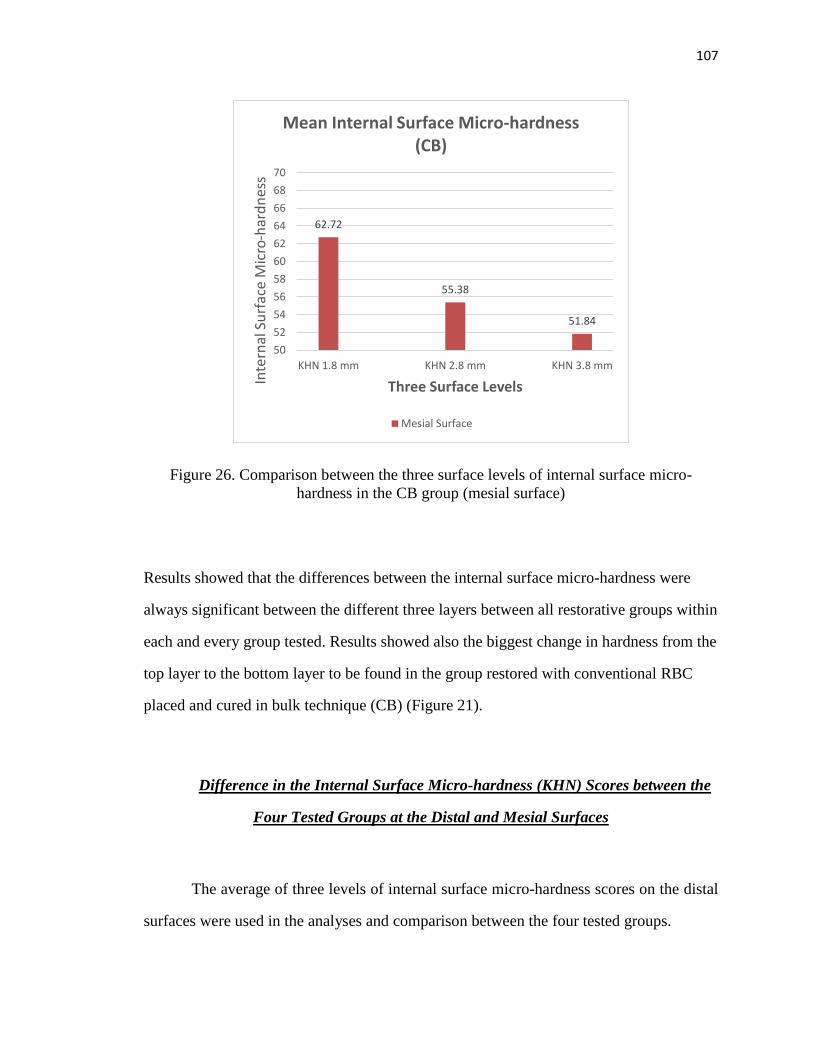
107
107
Figure 26. Comparison between the three surface levels of internal surface micro-
hardness in the CB group (mesial surface)
Results showed that the differences between the internal surface micro-hardness were
always significant between the different three layers between all restorative groups within
each and every group tested. Results showed also the biggest change in hardness from the
top layer to the bottom layer to be found in the group restored with conventional RBC
placed and cured in bulk technique (CB) (Figure 21).
Difference in the Internal Surface Micro-hardness (KHN) Scores between the
Four Tested Groups at the Distal and Mesial Surfaces
The average of three levels of internal surface micro-hardness scores on the distal
surfaces were used in the analyses and comparison between the four tested groups.
62.72
55.38
51.84
50
52
54
56
58
60
62
64
66
68
70
KHN 1.8 mm KHN 2.8 mm KHN 3.8 mm
Inte
rnal
Su
rfac
e M
icro
-har
dn
ess
Three Surface Levels
Mean Internal Surface Micro-hardness (CB)
Mesial Surface

108
108
Data were analyzed using one-way ANOVA. This analysis revealed that there was
a significant effect of RBC restorations on internal surface micro-hardness at distal surface
(F(3, 56)=6.39; p=0.0008). The post-hoc Tukey’s HSD test indicated that the mean internal
surface micro-hardness observed on the distal surface of the BL group was significantly
greater than the other three groups, while no significant difference was found among BB,
CL, and CB (Table 13).
Source of Variation
Degrees of
Freedom
Sum of
Squares
Mean
Square F
P
value
Type of RBC used and technique
of placement
3 552.10 184.03 6.39 0.0008
Error 56 1614.01 28.82
Total 59 2166.10
Table 13. Results of one-way ANOVA for internal surface micro-hardness at distal
surface
The average of three levels of internal surface micro-hardness scores on the mesial
surfaces were used in the analyses and comparison between the four tested groups.
Data were analyzed using one-way ANOVA. This analysis revealed that there was
no significant effect of RBC restorations on internal surface micro-hardness at mesial
surface (F (3, 56) =2.59; p=0.0620). That is, no significant difference in internal surface
micro-hardness was found among four RBC restorative groups (Table14) and (Figures 27
and 28).

109
109
Source of Variation
Degrees of
Freedom
Sum of
Squares Mean Square F
P
value
Type of RBC used and
technique of placement
3 263.05 87.68 2.59 0.0620
Error 56 1897.58 33.89
Total 59 2160.63
Table 14. Results of one-way ANOVA for internal surface micro-hardness at mesial
surface
Figure 27. Comparison of the internal surface micro-hardness between the four groups
tested (distal surface)
Figure 28. Comparison of the internal surface micro-hardness between the four groups
tested (mesial surface)
64.3
59.1
56.9 56.8
50
52
54
56
58
60
62
64
66
BL CB BB CL
INTE
RN
AL
SUR
FAC
E M
ICR
O-H
AR
DN
ESS
RESTORATIVE GROUPS
MEAN INTERNAL SURFACE MICRO-HARDNESS
Distal Surface
60.9
57.6
56.455.3
52
54
56
58
60
62
BL BB CB CL
Inte
rnal
Su
rfac
e M
icro
-h
ard
nes
s
Restorative GroupsMesial surface
Mean Internal Surface Micro-hardness

110
110
Difference in the Internal Surface Micro-hardness (KHN) Scores between the
Mesial and Distal Surfaces of Each Group of the Four Tested Groups
The average of the three levels of internal surface micro-hardness was used in the
analyses and comparison between the mesial and distal surface of the four groups. (Table
15).
Based on a paired-sample t-test, no significant difference in internal surface micro-
hardness was found between the mesial and distal surfaces within BB (bulk RBC, placed
in bulk) group (p=0.1859). However a significant difference was detected in internal
surface micro-hardness between the mesial and distal surfaces within BL (bulk RBC,
placed in layers) group (p=0.0043). The data showed that mean internal surface micro-
hardness at distal surface was significantly greater than that observed at mesial surface.
Based on a paired-sample t-test, no significant difference in internal surface micro-
hardness was found between the mesial and distal surfaces within CL (conventional RBC,
placed in layers) group (p=0.5268). Due to lack of normality, a nonparametric Wilcoxon
signed-rank test was used to analyze the data. No significant difference in internal surface
micro-hardness was found between the mesial and distal surfaces within CB (conventional
RBC, placed in bulk) group (p=0.3094) (Figure 29).
Results of internal surface micro-hardness showed the group restored with Tetric
EvoCeram Bulk fill RBC and restored in Layers (BL) showed statistical high hardness
numbers (KHN) on the distal compared to the other three groups, where there was no any
statistical differences between the hardness numbers of the other three groups. Comparing
the mesial and distal surfaces the group filled in bulk fill RBC placed in layering technique
was the only group to show statistical significant higher hardness numbers in the distal
compared to the mesial.
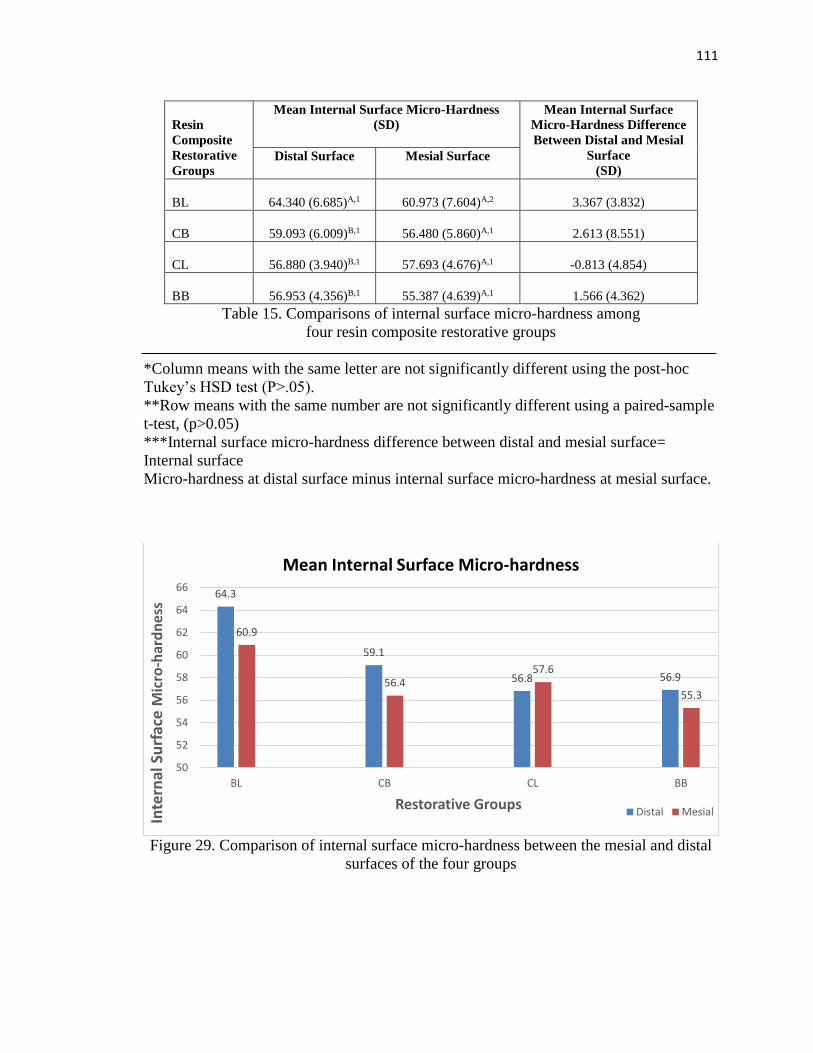
111
111
Resin
Composite
Restorative
Groups
Mean Internal Surface Micro-Hardness
(SD)
Mean Internal Surface
Micro-Hardness Difference
Between Distal and Mesial
Surface
(SD) Distal Surface
Mesial Surface
BL
64.340 (6.685)A,1
60.973 (7.604)A,2
3.367 (3.832)
CB
59.093 (6.009)B,1
56.480 (5.860)A,1
2.613 (8.551)
CL
56.880 (3.940)B,1
57.693 (4.676)A,1
-0.813 (4.854)
BB
56.953 (4.356)B,1
55.387 (4.639)A,1
1.566 (4.362)
Table 15. Comparisons of internal surface micro-hardness among
four resin composite restorative groups
*Column means with the same letter are not significantly different using the post-hoc
Tukey’s HSD test (P>.05).
**Row means with the same number are not significantly different using a paired-sample
t-test, (p>0.05)
***Internal surface micro-hardness difference between distal and mesial surface=
Internal surface
Micro-hardness at distal surface minus internal surface micro-hardness at mesial surface.
Figure 29. Comparison of internal surface micro-hardness between the mesial and distal
surfaces of the four groups
64.3
59.1
56.8 56.9
60.9
56.457.6
55.3
50
52
54
56
58
60
62
64
66
BL CB CL BB
Inte
rnal
Su
rfac
e M
icro
-har
dn
ess
Restorative Groups
Mean Internal Surface Micro-hardness
Distal Mesial

112
112
Statements on Research Hypotheses
1) There is no difference in gingival marginal adaptation among different groups
restored with RBC (bulk fill and conventional types) placed in bulk or in
layering technique at the mesial and distal surfaces (Accept)
2) There is no difference in gingival marginal adaptation between the mesial and
distal surfaces within each group restored with RBC (bulk fill and conventional
types) placed in bulk or in layering technique (Accept)
3) There is no difference in the internal surface micro-hardness (KHN) among the
three different levels of measurements within each group restored in RBC (bulk
fill and conventional types) placed in bulk or in layering technique on the mesial
and distal surfaces (Reject)
4) There is no difference in the internal surface micro-hardness (KHN) among
different groups restored with RBC (bulk fill and conventional types) placed in
bulk or in layering technique at the mesial and distal surfaces
- Bulk Fill RBC, placed in bulk (Accept)
- Bulk Fill RBC, placed in layers (Reject on the distal surface only)
- Conventional RBC, placed in layers (Accept)
- Conventional RBC, placed in bulk (Accept)
5) There is no difference in the internal surface micro-hardness (KHN) between
the mesial and distal surfaces within each group restored with RBC (bulk fill
and conventional types) placed in bulk or in layering technique
- Bulk Fill RBC, placed in bulk (Accept)
- Bulk Fill RBC, placed in layers (Reject)
- Conventional RBC, placed in layers (Accept)
- Conventional RBC, placed in bulk (Accept)
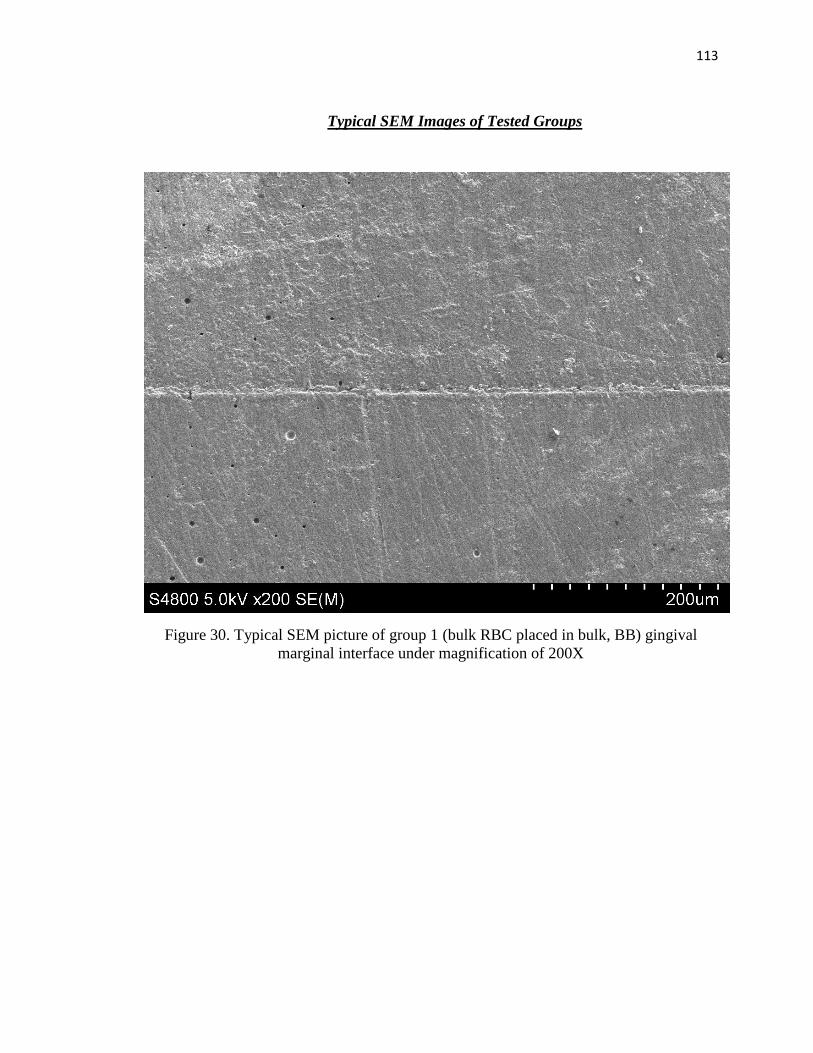
113
113
Typical SEM Images of Tested Groups
Figure 30. Typical SEM picture of group 1 (bulk RBC placed in bulk, BB) gingival
marginal interface under magnification of 200X

114
114
Figure 31. Typical SEM picture of group 2 (bulk RBC placed in layers, BL)
gingival marginal interface under magnification of 200X

115
115
Figure 32. Typical SEM picture of group 3 (conventional RBC placed in layers, CL)
gingival marginal interface under magnification of 200X
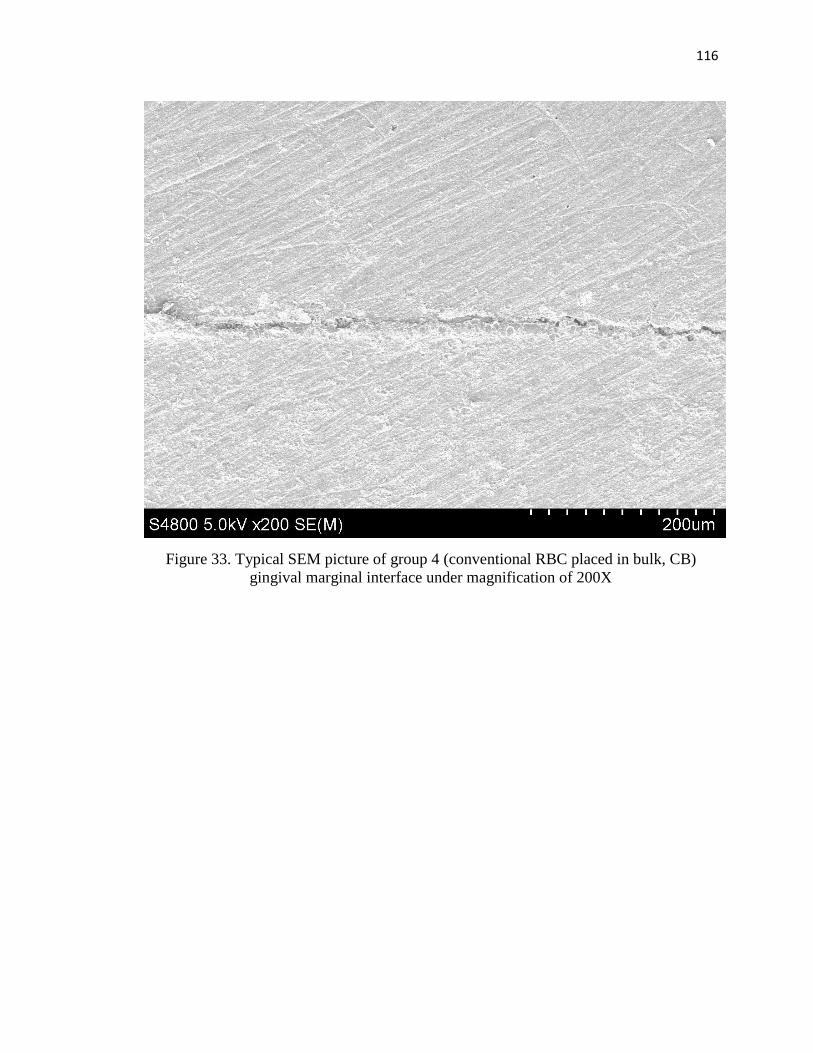
116
116
Figure 33. Typical SEM picture of group 4 (conventional RBC placed in bulk, CB)
gingival marginal interface under magnification of 200X
117
117
CHAPTER V
DISCUSSION
Bulk fill RBC materials have been introduced to help dentists reduce placement
time and work more efficiently. Manufacturers make claims of these products being able
to fill a cavity in a single 4mm-6mm thickness placement instead of 2mm thick increments
with conventional RBC’s. In a study by Alrahlah et al (Alrahlah, Silikas et al. 2014) Tetric
EvoCeram Bulk Fill was shown to have the highest depth of cure and surface micro-
hardness among the tested materials. Therefore, this bulk fill material was selected for the
current study for comparison of the external gingival marginal adaptation and internal
surface micro-hardness to the conventional RBC of the same manufacturer.
This investigation evaluated Class II marginal adaptation and the internal surface
micro-hardness of two different RBC materials (Tetric EvoCeram and Tetric EvoCeram
Bulk Fill) placed in two different techniques (layering versus bulk filling). Four different
groups including two filled by conventional RBC and two filled by bulk fill RBC were
used with both techniques of layering and bulk fill for comparison of marginal gaps and
internal surface micro-hardness. The group of the conventional RBC filled in bulk was
used as a control group for comparison reasons.
Light Curing Source and Radiant Energy Exposure
Our intention was to cure each increment of RBC with an energy delivery of
14J/cm2 based on studies demonstrating that bulk fill RBC’s had acceptable hardness at
4mm if cured by a light cure delivering energy more than 12J/cm2 (Campodonico,
Tantbirojn et al. 2011, Flury, Hayoz et al. 2012, Czasch and Ilie 2013, El-Damanhoury and
Platt 2013, Finan, Palin et al. 2013).

118
118
Radiant Energy Exposure Standardization in Air
A single LED light curing unit was used in an attempt to standardize all the
restorative procedures and ensure equal degree of cure and polymerization reaction
between the different experimental groups. The energy delivered for curing of the
restorative materials were attempted to be standardized using the manufacturer's
instructions to cure the RBC restorations for 10 seconds with a light producing irradiance
of not less than 1000 mW/cm2. The exact mean irradiance of the curing light used
(Bluephase 16i Ivoclar Vivadent) was measured by the MARC Resin Calibrator system.
The light curing unit was delivering 2100 mW/cm2 delivering 21 J/cm2 at 0mm distance
and 1380 mW/cm2 delivering about 14 J/cm2 at 4mm. The amount of energy delivered was
standardized to 14 J/cm2 to all RBC increments that was 11 seconds of cure for the first
layer and 7 seconds of cure for the second layer. The bulk RBC placed in bulk was cured
for 11 seconds. The bulk RBC placed in 2 layers and placed in bulk was cured for 18
seconds (Table 16).

119
119
Depth of measurements of
radiant energy exposure in air
Irradiance
delivered
Radiant energy
delivered in 10 seconds
Time to deliver 14 J/cm2
Radiant energy exposure at
0mm from sensor
2100 mW/cm2 21 J/cm2 7 seconds of cure
Radiant energy exposure at
4mm from sensor
1380 mW/cm2 13.8 J/cm2 11 seconds of cure
Table 16. Radiant energy exposure standardization in air
Radiant Energy Exposure Measurement in Resin Based Composites
The amount of radiant energy exposure was measured on the MARC Resin
Calibrator through the different types of RBC used (the Tetric EvoCeram bulk fill and the
conventional Tetric EvoCeram RBC). The aim of measuring the amount of total irradiance
and the amount of radiant energy exposure was to detect any differences between the
conventional Tetric EvoCeram and the Tetric EvoCeram bulk fill in the degree of
translucency in attenuating the light. It was observed always a higher translucency with the
Tetric EvoCeram bulk fill RBC where more irradiance and radiant energy exposure was
detected by the MARC Resin Calibrator sensor in both the layering and the bulk filling
technique measurements (Table 17).

120
120
Group column 1 column 2 column 3 column 4
First
(bottom)
increment
initial
radiant
exposure
[time in
seconds]
Total radiant
exposure
received by
First (bottom)
increment =
column 1 +
column 4 [time
in seconds]
Second (top)
increment
radiant
exposure
[time in
seconds]
Bulk 4mm RBC
radiant exposure
or
second (top)
increment radiant
exposure with
bottom increment
in place
Total energy
exposure
[total delivery time]
Bulk = column 4
Layered = Column 2
BB NA NA NA 1 J/cm2
[11s]
1 J/cm2
[11s]
BL 3 J/cm2
[11s]
4 J/ cm2
[11s + 7s]
3.6 J/cm2
[7s]
1 J/cm2 4 J/cm2
[18s]
CL 2.34 J/cm2
[11s]
2.74 J/ cm2
[11s + 7s]
2.76 J/cm2
[7s]
0.4J/cm2 2.74 J/cm2
[18s]
CB NA NA NA 0.4 J/cm2
[18s]
0.4 J/cm2
[18s]
Illustr
ation
2 mm of air
above 2 mm
increment of
RBC
Column 1
+
Column 4
2 mm
increment of
RBC and
curing done
in contact to
the surface
2 mm of RBC
below 2 mm
increment of RBC
Table 17. Radiant energy exposure measurement in resin based composites

121
121
Polymerization Reaction and Depth of Cure
Bulk materials can increase depth of cure in a variety of ways including
translucency (Garcia, Yaman et al. 2013) and refractive index by modifying the filler and
matrix components (Lassila, Nagas et al. 2012) Presence of additional co-initiators also
can raise the curing response of the RBC to the intensity of light and increase curing ability
(Fleming G.J, 2008). Tetric EvoCeram Bulk Fill uses both filler modification as well as
the addition of a co-initiator, Ivocerin, to the matrix material in order to achieve a higher
depth of cure and a better degree of polymerization (Ivoclarvivadent 2014). When
compared to other bulk fill RBC’s, Tetric EvoCeram contains a higher percentage of fillers
(76-80% by weight) which has a potential to increase the elastic modulus and hardness of
the restoration (El-Safty, Akhtar et al. 2012).
Adequate depth of cure is very important since insufficiently cured or polymerized
RBC’s have been shown to decrease the quality and longevity of RBC restorations
(Carvalho, Moreira Fdo et al. 2012). It has been reported that the bulk fill RBC’s have
significantly greater flow and lower polymerization shrinkage compared to conventional
RBC’s as their resin matrix is more elastic decreasing the rate of shrinkage (Ilie and Hickel
2011, Czasch and Ilie 2013). These claims were not verified in the current study since no
difference was found in marginal adaptation.
Very minimal differences were found in the current study between Tetric
EvoCeram and Tetric EvoCeram Bulk Fill in both areas tested the external marginal gaps
and the internal surface micro-hardness. If a bulk fill material is to replace a conventional
material, it is important that it be equal or better in all physical properties, Ilie et al (Ilie,
Bucuta et al. 2013) showed that the bulk fill RBC systems had the same flexural strength
when compared to nanohybrid and micro hybrid RBC’s and that flexural modulus,
indentation modulus and Vickers hardness values for the bulk fills were between the hybrid
122
122
and flowable RBC’s. Bulk fills showed higher creep deformation which made them similar
to the flowable RBC’s. Other studies demonstrated similar conclusions where they stated
that the properties of bulk fill RBC’s were equal or slightly lower than the conventional
RBC systems (El-Safty, Akhtar et al. 2012, El-Damanhoury and Platt 2013). These factors
are important when added to the results of our study when deciding whether to use a bulk
fill RBC. Particularly since the current study showed no advantages in the gingival
marginal adaptation or depth of cure (KHN) for the bulk filled RBC’s. Evidence of the
current study didn’t suggest an advantage in the marginal adaptation and surface micro-
hardness when using these materials over conventional RBC’s.
Quantitative Marginal Analysis
The marginal seal of a restoration to the tooth structure can be measured by either
marginal adaptation measurements or micro-leakage measurements. Marginal adaptation
was chosen for this study to provide a quantitative analysis of the amount and width of
gaps formed at the margins and marginal irregularities rather than the qualitative isolated
analysis provided by microleakage.
Quantitative marginal analysis was introduced by (Porte, Lutz et al. 1984)and was
later refined by (Blunck and Roulet 1989). This refined method of recording of marginal
gaps was selected for the current study to decrease subjectivity and to more completely
measure the width and number of gaps for statistical comparisons between different
restorative and placement techniques.
The criteria for scoring marginal gaps in different marginal analysis studies range
from two criteria (Pass or Fail) (Frankenberger, Lohbauer et al. 2008), four in the studies
by (Roulet, Reich et al. 1989, Blunck and Zaslansky 2011) and up to seven criteria
(Gjorgievska, Nicholson et al. 2008, Sabatini, Blunck et al. 2010). The number of criteria

123
123
is crucial to detect differences between tested groups. Too many criteria created to detect
differences in marginal gaps may lead to errors during scoring, and calculating the marginal
data. In addition too many scores could lead to reliability issues and may increase the
subjectivity of different examiners or researchers during marginal analysis. Therefore,
different categories and scores used are often narrowed down and collapsed to the criteria
of gap versus no gap to make statistical analysis and interpretation of results easier. A study
by Sabatini et al. (Sabatini, Blunck et al. 2010) had seven different gap criteria, however
scores and data were reduced to four categories then later reduced again to only two
categories (gap/no gap) for their statistical analysis of results.
In our study, five criteria were used to describe the marginal integrity. A sixth void
formation criteria was added to account for areas on the samples that had void formation
during restoration placement not dependent on the RBC, technique or the polymerization
shrinkage. This sixth criteria of voids was a separate criteria and was not counted as a
marginal gap. The five item scoring system was chosen because the pilot study showed a
good power of differentiating between the different types of gaps and without
overestimating the amount of marginal gaps. The criteria were then collapsed to only two
main criteria which was gap versus no gap as described by Sabatini et al (Sabatini et al,
2010) because the main target of our study was to distinguish between a gap and a gap free
gingival margin. It was stated (Davidson CL, 1988) that the gap formation at the gingival
margins can cause: 1) marginal micro-leakage, 2) debonding of restorations, 3) secondary
decay and 4) teeth sensitivity.
124
124
Experimental Procedures
Replica Technique
Examination of the gingival marginal adaptation between different specimens was
made using the scanning electron microscope. Positive replicas were prepared for the
purpose of this study. The decision to use replicas was made based on several studies. A
study by (Taylor and Lynch 1993) reported that the technique of epoxy resin replicas is
widely used and accepted in the investigation and testing of the marginal adaptation studies
involving SEM. It was also reported that the technique of replicas was more accurate and
precise for detecting marginal gaps than testing the dental tissues directly since this
technique may cause specimen dehydration and shrinkage leading to widening of gaps
(Davila, Gwinnett et al. 1989) Many other studies have successfully incorporated the same
technique of replicas in comparing marginal gaps (Iida, Inokoshi et al. 2003, Heintze,
Cavalleri et al. 2005, Magni, Zhang et al. 2008, Maresca, Pimenta et al. 2010)
Our study showed some disadvantages of the epoxy resin replicas compared to
direct examination of dental structure. These included the fact that it was time consuming
and that some specimens had voids or excess epoxy resin. Specimens were sorted out if the
voids were related to the margins in the replicas and were discarded and the replicas were
remade.
SEM Data Interpretation
The epoxy resin replicas were examined under the SEM at a magnification of 30X
and 200X. In our study, one image was taken at 30X to view the entire cavity margin to
confirm accuracy of preparation and polishing of the restorations. Seven non overlapping

125
125
images were taken for the entire gingival margin extending at least 0.2mm up the buccal
and lingual walls using a magnification of 200X. This magnification was necessary to
discriminate between the different gap criteria, and was chosen based on other studies
which .have examined the external marginal adaptation of different dental restorations
under the same magnification of 200X (Dietrich, Kraemer et al. 2000, Stoll, Remes et al.
2000, Strobel, Petschelt et al. 2005, Sabatini, Blunck et al. 2010, Souza-Junior, Borges et
al. 2012).
The seven images taken for analysis were non-overlapping to try not to replicate
the same gap score of a previous image. The seven images taken were examined for major
defects (voids more than 250um or more than three in number) as agreed upon from the
pilot study and the gingival margins were traced. The six evaluation scores given were
modified from the study done by (Blunck and Zaslansky 2011). All scores were then
tabulated and then were narrowed down to the intact surface (no gap) versus the non-intact
surface (gap). The percentage of the whole gaps in the gingival margins was calculated and
tabulated for statistical comparison between groups.
Calibration of the readings was required for the examiner prior to assignment of
scores. This calibration was done through setting direct meetings with two members of the
committee.
Internal Surface Micro-hardness
Internal surface micro-hardness was measured by using the Micromet II machine
(Buehler) where the Knoop hardness numbers were measured at nine different locations
each having three points at three different depths of 1.8mm, 2.8mm and 3.8mm. Other
studies had different number of testing points to calculate the Knoop hardness number
RBC’s. These include studies done by (Price, Felix et al. 2005, Felix, Price et al. 2006)
126
126
where seven different depths were tested at 0.5mm,1mm, 1.5mm, 2mm, 2.5mm, 3mm and
3.5 mm. Each point of those had three readings were made at each depth making the sum
of all readings 21 points. (Bechtold, Dos Santos et al. 2012) used four levels of hardness
were at 1, 2, 3 and 4mm depth with three readings at each layer (12 readings total). A study
by (Cilli, Pereira et al. 2012) measured the surface micro-hardness of RBC’s with the
Knoop hardness tester using only five points. Different points of depth testing were
considered in our experiment. After testing at different levels and finding minor differences
in the KHN between samples, the decision in the current study was to use three levels with
the bottom level as close as possible to the bottom of the restoration. The 3.8 mm depth
was the deepest that could be tested in the 4mm deep cavity preparation.
Knoop hardness testing was done for all specimens using the Micromet II machine
with a load of 100gm applied for 15 seconds. Although other studies have used different
loads and times (Bechtold, Dos Santos et al. 2012, Garcia, Yaman et al. 2013, Alrahlah,
Silikas et al. 2014) the technique was chosen to compare with other studies using the same
load and time (Price, Felix et al. 2005, Felix, Price et al. 2006).
Limiting Psychomotor Skills Variability
The acquiring of the psychomotor skills specific to the materials used by the
operator was crucial to get reliable and accurate results. This was done through rehearsing
the different experimental procedures several times before the beginning of the actual
study. All test procedures were then replicated with the different specimens with the same
time, sequence and technique.
127
127
Effect of Resin Based Composite Type and Placement Technique on the
Gingival Marginal Adaptation
The first null hypothesis was accepted as results of our study showed no significant
differences in the marginal adaptation between the four different restorative groups when
compared on the mesial surfaces and also when compared on all the distal surfaces
(P>0.05). We compared all mesial surfaces together and the distal surfaces together
between the four different groups to try to standardize the preparations examined, the
orientation of the light curing source, the radiant energy exposure (energy delivery) and
the degree of homogeneity of the curing light. It was also essential to standardize as much
as possible the tooth substrate to which the restoration will bond as studies showed
different bonding results with dentin and enamel where always bonding to enamel was
better (less marginal gaps) compared to dentin and deep dentinal (pulpal floor) bonding
(Campos, Ardu et al. 2014, Furness, Tadros et al. 2014).
Our results are in agreement with other studies comparing the different placement
techniques (layering versus bulk filling) with different RBC systems (conventional versus
bulk) (Roggendorf, Kramer et al. 2011, Campos, Ardu et al. 2014, Furness, Tadros et al.
2014). Other studies also showed similar results where the comparison was made in the
placement technique (layering versus bulk) using only conventional RBC systems (Gallo,
Bates et al. 2000, St Georges, Wilder et al. 2002), and when the comparison was made in
the type of RBC (bulk fill RBC versus conventional RBC) placed in layering technique
(Moorthy, Hogg et al. 2012).
Our results differed from a study done by (de Wet, Exner et al. 1991) and
(Mullejans, Lang et al. 2003) comparing the technique of placement (layering versus bulk)
using one conventional RBC showed that incremental placement decreased the gingival
128
128
gap formation. These results may have differed from our study due to the fact that only
conventional RBC was used and the types of RBC systems used were different.
It was stated that it’s not realistically achievable to get a 100% gap free margins
(Garcia-Godoy F, Kramer N et al 2010, Blunk U 2011). Slight differences in the marginal
gaps between groups (non-significant differences) were observed. Where the group
restored with conventional RBC placed in bulk (CB) had the highest amount of gaps where
the lowest gap amounts were in the bulk RBC placed in bulk. Maybe these slight changes
were due to the slight increase in the filler content in the bulk Fill Tetric Evoceram
enhancing the modulus of elasticity and decreasing the polymerization shrinkage of these
materials (Masouras, Silikas et al. 2008, Moorthy, Hogg et al. 2012, Ilie, Bucuta et al.
2013). Another reason may be due decreased viscosity of the bulk fill materials by
modifying the monomers and adding hydroxyl free BIS-GMA and highly branched
methacrylates which make them adapt well although placed in bulk not in layers (Burgess
2010, Czasch P 2013, Garcia et al 2014). It was suggested (Leung RL, Fan PL, Johnston
WM 1983) that the polymerization reaction continues at a slower rate after the removal of
the light curing system, this reaction may reach a termination point after almost one day
(24 hours). The bulk RBC placed in bulk was cured for the least time (11 seconds only)
compared to the other three groups (18 seconds) which may have decreased the amount of
polymerization reaction decreasing the amount of shrinkage showing this insignificant
better marginal seal. It was stated by the manufacturers (Ivoclar Vivadent) that stress
relievers (special patented filler which is partially functionalized by silanes) were added to
the Tetric Evo-Ceram Bulk Fills which decreased the modulus of elasticity decreasing the
shrinkage stresses which may have led to the decreased marginal gaps in the Tetric
EvoCeram Bulk Fill RBC placed in bulk compared to the other groups (Ivoclarvivadent
2014).
129
129
The type of adhesive system used could directly affect the amount of gap formation
(De campos 2014). The Adhesive system used was the Syntac system (etch and rinse
considered four step) standardized for all restorations. The good bonding properties of this
adhesive system may have masked the differences between groups enhancing the bond
between the restorations placed and the teeth margins resulting in a better gingival marginal
seal (Frankenberger and Tay 2005). All groups showed minimal gap formation with slight
insignificant differences in the number and size of gaps formed.
The second null hypothesis was also accepted as Results comparing the gingival
marginal adaptation between different RBC’s (Tetric EvoCeram filling versus Tetric
EvoCeram Bulk Fill) used in layering and bulk fill technique showed no significant
differences between the mesial and distal restorations (P>0.05). No studies to our
knowledge was done comparing the mesial and distal marginal adaptation using different
types of RBC’s (bulk fill versus conventional RBC’s) placed either in bulk or in layers
however some studies had the same design of two proximal boxes on the mesial and distal
(Zaruba, Wegehaupt et al. 2013).
It is believed that the location of the preparation either on the mesial and distal
specimens should not significantly affect the results because all specimens on the mesial
and distal were similarly prepared on the same tooth with the same type of RBC and
technique of placement, however the tooth substrate to which the restoration bonds to may
have an effect on the shrinkage stresses due to the different substrate compliances to the
applied stresses, which may have affected the amount of gap formation.

130
130
Effect of Resin Based Composite Type and Placement Technique on the
Internal Surface Micro-hardness
The surface micro-hardness was compared between the different specimens at three
different levels of 1.8mm, 2.8mm and 3.8mm. The third null hypothesis was rejected as
Results showed that in all the specimens tested there was a significant difference in the
internal surface micro-hardness (KHN) between each of the three layers from occlusal to
gingival (P<0.05). The gingival surface micro-hardness (3.8mm) was significantly less
than the hardness in the middle layer (2.8mm) which was significantly less than the
hardness in the top surface layer (1.8mm). The hardness was believed to decrease towards
the gingival levels because of the decrease of intensity of light, decrease of depth of cure
and in turn decrease in degree of conversion of the RBC (Bouschlicher, Rueggeberg et al.
2004). The surface micro-hardness numbers were shown to decrease with increased depth
of the restoration (Campodonico, Tantbirojn et al. 2011).
The amount of radiant energy delivery was shown in this study to decrease with
increased depth of the RBC (refer to table 17). Where the bulk fill Tetric EvoCeram RBC’s
still showed a better light propagation manner compared to the conventional Tetric
EvoCeram RBC’s.
The fourth null hypothesis was partially accepted as Results of internal surface
micro-hardness (KHN) testing between the different restorative groups showed a
significant increase in the surface micro-hardness numbers (KHN) on the distal surface of
the group restored with bulk RBC placed and cured in layers compared to the other three
groups (P<0.05). However there were no significant differences in the internal surface
micro-hardness numbers (KHN) in the other three groups on both the mesial and distal
surfaces. It was believed that the KHN in the bulk RBC placed in layers group was higher
since the depth of cure of bulk fills may be greater than the conventional RBC’s due to a
131
131
photo co-initator particle, Ivocerin (Ivoclarvivadent 2014) added to the resin matrix and
the fact that this group was cured in two layers for an increased time, therefore the material
may have undergone a greater polymerization reaction and a higher percentage of cure
(Czasch and Ilie 2013, Ilie, Bucuta et al. 2013).
Our results were not in agreement with a study done by (El-Safty, Akhtar et al.
2012) where the authors concluded that the conventional RBC’s were the hardest followed
by the bulk fill RBC’s followed by the flowable RBC’s being the least hard. The results
were in agreement with a study done by (Garcia, Yaman et al. 2013) which concluded that
there was no difference in the surface micro-hardness of conventional and the bulk fill
RBC’s at the different levels of testing, however the conventional RBC used in this study
was a flowable type. Our results showed acceptable hardness numbers compared to the
conventional RBC’s. Our results also confirmed the fact that bulk filled RBC’s cured well
in 4mm bulk placement which was agreement with other studies (Campodonico, Tantbirojn
et al. 2011, Flury, Hayoz et al. 2012, Czasch and Ilie 2013, El-Damanhoury and Platt 2013,
Finan, Palin et al. 2013) . It was observed in our study that bottom to top surface hardness
scores were higher than 80% in all the tested groups as stated by other authors (Yearn 1985,
Bouschlicher, Rueggeberg et al. 2004).
There was a slight but insignificant increase in hardness in the conventional RBC
group filled in bulk compared to the one filled in layers. It was believed that perhaps the
orientation of the light curing tip may have caused this slight increase and also when
Examining the different levels of surface micro-hardness, the mean hardness of the first
two levels of the conventional RBC placed in bulk were higher than the mean hardness of
the same layers in the conventional RBC placed in layers because the curing time was
almost doubled at these layers in the first group. However, the gingival layer in the
conventional RBC’s placed in bulk still showed good hardness numbers which suggested

132
132
that the depth of cure of the conventional Tetric EvoCeram materials were still good
compared to the Tetric EvoCeram Bulk Fill RBC’s. The lowest group hardness numbers
were found in the bulk RBC’s (non-significant) placed and cured in bulk technique. This
non-significant decrease in hardness may have occurred due to the fact that this group had
the lowest curing time (11 seconds only compared to 18 seconds for all other groups).
Another explanation of the increase in hardness numbers in the bulk fill RBC group placed
in layers is the increased depth of cure and translucency of the Tetric EvoCeram Bulk Fill
RBC compared to the conventional Tetric EvoCeram RBC which increased the hardness
numbers of this specific group, where it was stated (Musanje L and Darvell BW 2006,
Azopardi N and Moharamzadeh K 2009) that for proper polymerization and increased
depth of cure a good match between refractive indices of the resin matrix and silica
particles is required. The manufacturers stated adding a new component in the resin matrix
called Ivocerin which is a Di-benzoyl germanium compound (Al Rahlah 2013) that act as
a photo-initiator booster increasing the depth of cure and degree of polymerization and
hardness. Maybe this component was the cause of increased hardness numbers in the bulk
fill RBC filled in layers group however the hardness of the bulk RBC placed in bulk
remained the lowest compared to other groups which suggested that for increased hardness
of the Tetric EvoCeram bulk fill and for the Ivocerin photo-initiator to have an increased
effect on hardness an increase in curing time was required.
Our results compared the mesial and distal restorations on the same tooth to see if
the tooth surface had an effect on the hardness and depth of cure of RBC’s RBC’s used
with different techniques of placement. The fifth null hypothesis was partially accepted as
No specimens showed any significant differences between the surface micro-hardness
numbers (KHN) of the mesial and distal restorations (P<0.05) except for one group restored
with bulk RBC placed in layers, the distal specimens were significantly harder than the
mesial. It was believed that this change in hardness may have resulted due to improper
133
133
orientation or slight change in orientation between both the mesial and distal restorations.
Another reason for this change may have been due to change in rotational placement of the
light cure where the light homogeneity could have cured one surface more than the other
(Price, Rueggeberg et al. 2010, Rueggeberg F 2010). Again no known studies till now
compared the mesial and distal surface micro-hardness between the restorations (bulk Fill
RBC and conventional RBC) placed either in bulk or in layers.
Standardization of Procedures
Care was taken to control for variability and bias that may occur during the tooth
selection, tooth preparation, tooth restoration, SEM measurements, sectioning and surface
micro-hardness testing. All the steps of the experiment were done by the same operator.
The selection of teeth was done from different sources to ensure that the teeth origins
weren’t biased. Cavity preparations were all standardized by the CNC Specimen Former
machine to the same exact dimensions (Raposo, Armstrong et al. 2012). The restorative
techniques were all practiced to standardize the placement, handling and curing of all
specimens.
Testing specimens under the SEM was done after carefully placing the replicas in
a perpendicular position to the electron beam to ensure proper recording of gap sizes. It has
been reported that a small angulation of the replica under the SEM may change the gap
size to make it appear smaller than it actually is (Taylor and Lynch 1993). Sectioning of
all samples for internal micro-hardness testing was all done by the same manner by
dividing the restoration by half. All specimens were assigned numerical codes for blindness
purposes where the operator measured the gingival marginal adaptation and internal
surface micro-hardness.
134
134
Limitations of the Study
This in vitro study had its own limitations due to techniques done to standardize the
specimens which are not possible in the clinical situation such as: a) The occlusal surface
was flattened to ensure accurate curing of RBC and proximal surfaces were flattened to
ensure perfect adaptation and placement of RBC material in all specimens and to allow
better definition of the margins under the SEM. This may have removed some of the outer
layer of enamel which contains high amount of fluoride and aprismatic hypermineralized
enamel (Whittaker 1982, Albers 2002), b)All specimen preparations were standardized by
the CNC machine which cannot be used in the clinical situation, c) All margins were
polished for accurate testing where in a clinical situation it is impossible to polish.
The present study tested the gingival marginal adaptation where all gingival
margins were bonded to dentin below the level of the cement-enamel junction. However,
in the real clinical setting it is contra-indicated to place RBC restorations below the CEJ.
The light curing unit orientation may have been a possible area for bias as the light
tip was placed over the occlusal surface of all specimens without a definite orientation
guide. Calibration of the SEM data was very difficult as the gaps/ non gap marginal analysis
was a subjective analysis where with different evaluators different scores may have been
given. The sample size may have been relatively small where if a larger sample size was
used the statistical power would have increased substantially.
The present study tested only the Tetric EvoCeram and Tetric EvoCeram Bulk Fill
RBC systems therefore results cannot be extrapolated to other systems.
135
135
Strengths of the Study
The present study had a large sample size of 15 teeth (restored on the mesial and
distal surfaces, a total of 30 restorations) per each group for comparison purposes between
the different restorative materials and techniques. Standardization of the class II Cavity
preparations by the CNC Specimen Former machine where other studies used conventional
burs to prepare the Class II cavities which may have caused some bias in the specimens.
Similar RBC products were used for each step including restorative material, bonding
system and light curing unit was advantageous since the study was able to exactly follow
the manufacturer’s instructions. The light radiant energy exposure was standardized in all
the increments placed to ensure accurate and reliable results.
Clinical Significance
Within the limitations of the current study, Tetric EvoCeram Bulk Fill RBC’s
doesn’t offer any clinical advantages compared to the conventional Tetric EvoCeram
RBC’s in the external marginal adaptation and surface micro-hardness. More studies need
to be done to compare the longevity, the mechanical and physical properties of the different
bulk fill materials in comparison with the conventional RBC’s.
Future Research Suggestions
This study was conducted as an in vitro study where results and conclusions
couldn’t be extended and generalized to different in vivo situations. A similar investigation
conducted in vivo would certainly help confirm the results of the current study. A study

136
136
could be conducted to test the long term durability and longevity of the bulk fill RBC
restorations after thermo-cycling the specimens and testing them aging. More studies
should be done to compare the different mechanical and physical properties of the bulk fill
RBC’s compared to the conventional RBC materials placed in layering technique.
137
137
CHAPTER VI
CONCLUSION
Considering the limitations and disadvantages of this in-vitro study, it was
concluded that there was no significant differences in the gingival marginal adaptation
between all of the tested groups (Bulk Fill Tetric EvoCeram and Tetric EvoCeram) placed
in bulk or layering technique on the mesial and distal surfaces.
Our study also concluded that there was no significant differences in the gingival
marginal adaptation between the mesial and distal surfaces of the same tooth in all the
tested groups when restored with Bulk Fill Tetric EvoCeram and Tetric EvoCeram placed
in bulk or layering technique.
Internal surface micro-hardness measured at three different levels showed
significant differences between the four groups tested on both surfaces mesial and distal.
The first layer tested was always harder than the second layer harder than the third layer.
Bulk Fill RBC placed in layering technique had significant higher internal surface
micro-hardness (KHN) than all the other tested groups where there wasn’t any significant
difference in hardness numbers between the other three groups tested. The surface micro-
hardness numbers were highest in the bulk layered group compared to the other three
groups.
The mesial and distal surfaces surface micro-hardness (KHN) didn’t show any
significant changes except for the group restored in bulk Fill RBC placed in layers, where
the distal surface micro-hardness was higher significantly than the mesial surface.

138
138
APPENDIX
Descriptive Statistics for External Marginal Gap and Internal Surface Micro-hardness by
RBC Groups --------------------------------------------------Group1= bulk RBC placed in bulk tech (BB) ------------------------------------- Standard Lower Upper Quartile Variable N Mean Deviation Minimum Maximum Median Quartile Quartile Range ------------------------------------------------------------------------------------------------------------------------------- MG_M 15 0.323 0.329 0.000 1.000 0.178 0.077 0.571 0.494 MG_D 15 0.280 0.206 0.005 0.677 0.304 0.094 0.470 0.376 Hardness_M1 15 58.853 6.695 48.400 75.000 59.200 52.900 62.700 9.800 Hardness_M2 15 55.213 5.079 46.700 63.200 55.300 51.200 59.900 8.700 Hardness_M3 15 52.180 4.518 44.000 59.700 53.500 48.600 54.700 6.100 Hardness_M 15 55.387 4.639 47.500 64.700 55.700 51.900 59.600 7.700 Hardness_D1 15 62.833 6.951 53.900 75.600 63.900 55.400 67.300 11.900 Hardness_D2 15 55.653 3.449 50.500 63.500 56.300 53.000 57.300 4.300 Hardness_D3 15 52.427 4.259 46.000 60.300 52.100 48.800 56.600 7.800 Hardness_D 15 56.953 4.356 51.200 65.900 57.900 51.900 59.200 7.300 ------------------------------------------------------------------------------------------------------------------------------- ------------------------------------------------- Group2= bulk RBC placed in 2 layers (BL) --------------------------------------- Standard Lower Upper Quartile Variable N Mean Deviation Minimum Maximum Median Quartile Quartile Range ------------------------------------------------------------------------------------------------------------------------------- MG_M 15 0.433 0.221 0.037 0.810 0.424 0.267 0.607 0.340 MG_D 15 0.421 0.213 0.162 0.868 0.368 0.254 0.602 0.348 Hardness_M1 15 66.160 10.131 54.300 86.800 64.800 57.400 70.500 13.100 Hardness_M2 15 59.840 8.079 50.200 77.900 58.000 53.600 64.200 10.600 Hardness_M3 15 57.167 6.952 50.000 74.400 55.400 52.900 59.300 6.400 Hardness_M 15 60.973 7.604 52.200 78.000 59.300 55.600 62.000 6.400 Hardness_D1 15 70.573 8.629 58.000 90.600 71.700 63.900 75.600 11.700 Hardness_D2 15 63.127 7.492 52.200 75.800 60.300 56.600 69.000 12.400 Hardness_D3 15 59.413 6.823 49.300 72.000 58.700 54.100 63.000 8.900

139
139
Hardness_D 15 64.340 6.685 55.000 78.300 61.700 58.300 70.000 11.700 ------------------------------------------------------------------------------------------------------------------------------- ----------------------------------------------- Group3= Conventional RBC placed in 2 layers (CL) ---------------------------------- Standard Lower Upper Quartile Variable N Mean Deviation Minimum Maximum Median Quartile Quartile Range ------------------------------------------------------------------------------------------------------------------------------- MG_M 15 0.419 0.217 0.000 0.827 0.432 0.267 0.548 0.281 MG_D 15 0.432 0.292 0.041 0.941 0.418 0.127 0.707 0.580 Hardness_M1 15 62.007 6.046 54.000 71.300 60.600 57.000 67.600 10.600 Hardness_M2 15 57.427 4.433 48.300 67.100 56.900 55.600 58.500 2.900 Hardness_M3 15 53.973 5.034 44.100 63.200 53.400 49.500 57.000 7.500 Hardness_M 15 57.693 4.676 49.800 65.800 58.100 54.000 58.800 4.800 Hardness_D1 15 61.607 7.159 52.500 74.900 59.900 54.900 66.800 11.900 Hardness_D2 15 56.067 3.411 50.500 62.300 55.400 54.000 58.500 4.500 Hardness_D3 15 53.113 4.394 44.300 63.000 53.600 49.600 55.800 6.200 Hardness_D 15 56.880 3.940 51.400 63.500 56.200 53.300 60.900 7.600 ------------------------------------------------------------------------------------------------------------------------------- ----------------------------------------------- Group4= Conventional RBC placed in bulk (CB) ------------------------------------ Standard Lower Upper Quartile Variable N Mean Deviation Minimum Maximum Median Quartile Quartile Range ------------------------------------------------------------------------------------------------------------------------------- MG_M 15 0.488 0.292 0.120 0.945 0.475 0.224 0.820 0.596 MG_D 15 0.452 0.229 0.031 0.902 0.418 0.320 0.574 0.254 Hardness_M1 15 62.720 10.061 48.400 90.900 61.600 56.300 67.600 11.300 Hardness_M2 15 55.380 4.705 46.600 65.600 55.600 52.900 57.600 4.700 Hardness_M3 15 51.840 5.244 43.100 60.000 51.400 48.200 57.900 9.700 Hardness_M 15 56.480 5.860 45.000 71.200 57.100 52.900 59.300 6.400 Hardness_D1 15 64.440 9.029 50.300 84.600 60.500 58.100 72.200 14.100 Hardness_D2 15 59.467 6.770 50.800 75.000 58.100 53.300 65.000 11.700 Hardness_D3 15 53.587 4.685 46.300 60.800 54.900 49.200 57.500 8.300 Hardness_D 15 59.093 6.009 51.100 72.900 58.500 53.000 62.600 9.600 --------------------------------------------------------------------------------------------------------------------------------

140
140
******************************************************************************
************************************** Low Quartile: 25% of values are lower than this Upper Quartile: 75% of values are lower than this Interquartile range: the difference between the 75th and 25th percentile
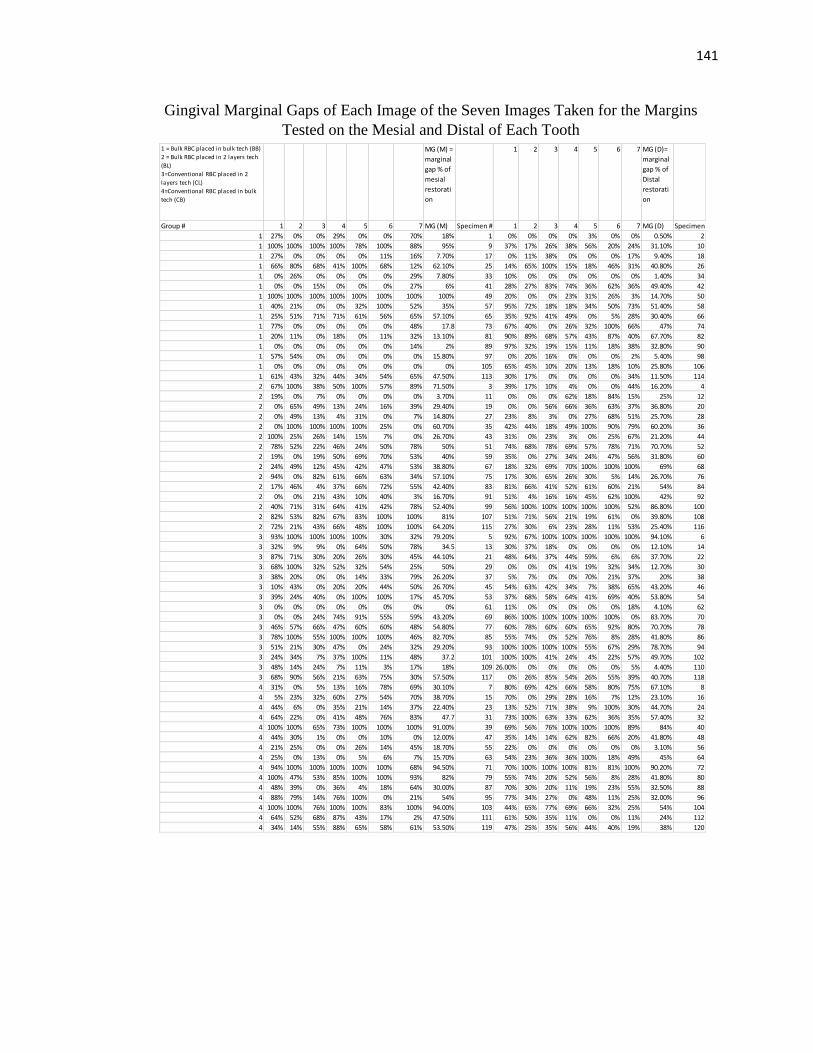
141
141
Gingival Marginal Gaps of Each Image of the Seven Images Taken for the Margins
Tested on the Mesial and Distal of Each Tooth
1 = Bulk RBC placed in bulk tech (BB)
2 = Bulk RBC placed in 2 layers tech
(BL)
3=Conventional RBC placed in 2
layers tech (CL)
4=Conventional RBC placed in bulk
tech (CB)
MG (M) =
marginal
gap % of
mesial
restorati
on
1 2 3 4 5 6 7 MG (D)=
marginal
gap % of
Distal
restorati
on
Group # 1 2 3 4 5 6 7 MG (M) Specimen # 1 2 3 4 5 6 7 MG (D) Specimen #
1 27% 0% 0% 29% 0% 0% 70% 18% 1 0% 0% 0% 0% 3% 0% 0% 0.50% 2
1 100% 100% 100% 100% 78% 100% 88% 95% 9 37% 17% 26% 38% 56% 20% 24% 31.10% 10
1 27% 0% 0% 0% 0% 11% 16% 7.70% 17 0% 11% 38% 0% 0% 0% 17% 9.40% 18
1 66% 80% 68% 41% 100% 68% 12% 62.10% 25 14% 65% 100% 15% 18% 46% 31% 40.80% 26
1 0% 26% 0% 0% 0% 0% 29% 7.80% 33 10% 0% 0% 0% 0% 0% 0% 1.40% 34
1 0% 0% 15% 0% 0% 0% 27% 6% 41 28% 27% 83% 74% 36% 62% 36% 49.40% 42
1 100% 100% 100% 100% 100% 100% 100% 100% 49 20% 0% 0% 23% 31% 26% 3% 14.70% 50
1 40% 21% 0% 0% 32% 100% 52% 35% 57 95% 72% 18% 18% 34% 50% 73% 51.40% 58
1 25% 51% 71% 71% 61% 56% 65% 57.10% 65 35% 92% 41% 49% 0% 5% 28% 30.40% 66
1 77% 0% 0% 0% 0% 0% 48% 17.8 73 67% 40% 0% 26% 32% 100% 66% 47% 74
1 20% 11% 0% 18% 0% 11% 32% 13.10% 81 90% 89% 68% 57% 43% 87% 40% 67.70% 82
1 0% 0% 0% 0% 0% 0% 14% 2% 89 97% 32% 19% 15% 11% 18% 38% 32.80% 90
1 57% 54% 0% 0% 0% 0% 0% 15.80% 97 0% 20% 16% 0% 0% 0% 2% 5.40% 98
1 0% 0% 0% 0% 0% 0% 0% 0% 105 65% 45% 10% 20% 13% 18% 10% 25.80% 106
1 61% 43% 32% 44% 34% 54% 65% 47.50% 113 30% 17% 0% 0% 0% 0% 34% 11.50% 114
2 67% 100% 38% 50% 100% 57% 89% 71.50% 3 39% 17% 10% 4% 0% 0% 44% 16.20% 4
2 19% 0% 7% 0% 0% 0% 0% 3.70% 11 0% 0% 0% 62% 18% 84% 15% 25% 12
2 0% 65% 49% 13% 24% 16% 39% 29.40% 19 0% 0% 56% 66% 36% 63% 37% 36.80% 20
2 0% 49% 13% 4% 31% 0% 7% 14.80% 27 23% 8% 3% 0% 27% 68% 51% 25.70% 28
2 0% 100% 100% 100% 100% 25% 0% 60.70% 35 42% 44% 18% 49% 100% 90% 79% 60.20% 36
2 100% 25% 26% 14% 15% 7% 0% 26.70% 43 31% 0% 23% 3% 0% 25% 67% 21.20% 44
2 78% 52% 22% 46% 24% 50% 78% 50% 51 74% 68% 78% 69% 57% 78% 71% 70.70% 52
2 19% 0% 19% 50% 69% 70% 53% 40% 59 35% 0% 27% 34% 24% 47% 56% 31.80% 60
2 24% 49% 12% 45% 42% 47% 53% 38.80% 67 18% 32% 69% 70% 100% 100% 100% 69% 68
2 94% 0% 82% 61% 66% 63% 34% 57.10% 75 17% 30% 65% 26% 30% 5% 14% 26.70% 76
2 17% 46% 4% 37% 66% 72% 55% 42.40% 83 81% 66% 41% 52% 61% 60% 21% 54% 84
2 0% 0% 21% 43% 10% 40% 3% 16.70% 91 51% 4% 16% 16% 45% 62% 100% 42% 92
2 40% 71% 31% 64% 41% 42% 78% 52.40% 99 56% 100% 100% 100% 100% 100% 52% 86.80% 100
2 82% 53% 82% 67% 83% 100% 100% 81% 107 51% 71% 56% 21% 19% 61% 0% 39.80% 108
2 72% 21% 43% 66% 48% 100% 100% 64.20% 115 27% 30% 6% 23% 28% 11% 53% 25.40% 116
3 93% 100% 100% 100% 100% 30% 32% 79.20% 5 92% 67% 100% 100% 100% 100% 100% 94.10% 6
3 32% 9% 9% 0% 64% 50% 78% 34.5 13 30% 37% 18% 0% 0% 0% 0% 12.10% 14
3 87% 71% 30% 20% 26% 30% 45% 44.10% 21 48% 64% 37% 44% 59% 6% 6% 37.70% 22
3 68% 100% 32% 52% 32% 54% 25% 50% 29 0% 0% 0% 41% 19% 32% 34% 12.70% 30
3 38% 20% 0% 0% 14% 33% 79% 26.20% 37 5% 7% 0% 0% 70% 21% 37% 20% 38
3 10% 43% 0% 20% 20% 44% 50% 26.70% 45 54% 63% 42% 34% 7% 38% 65% 43.20% 46
3 39% 24% 40% 0% 100% 100% 17% 45.70% 53 37% 68% 58% 64% 41% 69% 40% 53.80% 54
3 0% 0% 0% 0% 0% 0% 0% 0% 61 11% 0% 0% 0% 0% 0% 18% 4.10% 62
3 0% 0% 24% 74% 91% 55% 59% 43.20% 69 86% 100% 100% 100% 100% 100% 0% 83.70% 70
3 46% 57% 66% 47% 60% 60% 48% 54.80% 77 60% 78% 60% 60% 65% 92% 80% 70.70% 78
3 78% 100% 55% 100% 100% 100% 46% 82.70% 85 55% 74% 0% 52% 76% 8% 28% 41.80% 86
3 51% 21% 30% 47% 0% 24% 32% 29.20% 93 100% 100% 100% 100% 55% 67% 29% 78.70% 94
3 24% 34% 7% 37% 100% 11% 48% 37.2 101 100% 100% 41% 24% 4% 22% 57% 49.70% 102
3 48% 14% 24% 7% 11% 3% 17% 18% 109 26.00% 0% 0% 0% 0% 0% 5% 4.40% 110
3 68% 90% 56% 21% 63% 75% 30% 57.50% 117 0% 26% 85% 54% 26% 55% 39% 40.70% 118
4 31% 0% 5% 13% 16% 78% 69% 30.10% 7 80% 69% 42% 66% 58% 80% 75% 67.10% 8
4 5% 23% 32% 60% 27% 54% 70% 38.70% 15 70% 0% 29% 28% 16% 7% 12% 23.10% 16
4 44% 6% 0% 35% 21% 14% 37% 22.40% 23 13% 52% 71% 38% 9% 100% 30% 44.70% 24
4 64% 22% 0% 41% 48% 76% 83% 47.7 31 73% 100% 63% 33% 62% 36% 35% 57.40% 32
4 100% 100% 65% 73% 100% 100% 100% 91.00% 39 69% 56% 76% 100% 100% 100% 89% 84% 40
4 44% 30% 1% 0% 0% 10% 0% 12.00% 47 35% 14% 14% 62% 82% 66% 20% 41.80% 48
4 21% 25% 0% 0% 26% 14% 45% 18.70% 55 22% 0% 0% 0% 0% 0% 0% 3.10% 56
4 25% 0% 13% 0% 5% 6% 7% 15.70% 63 54% 23% 36% 36% 100% 18% 49% 45% 64
4 94% 100% 100% 100% 100% 100% 68% 94.50% 71 70% 100% 100% 100% 81% 81% 100% 90.20% 72
4 100% 47% 53% 85% 100% 100% 93% 82% 79 55% 74% 20% 52% 56% 8% 28% 41.80% 80
4 48% 39% 0% 36% 4% 18% 64% 30.00% 87 70% 30% 20% 11% 19% 23% 55% 32.50% 88
4 88% 79% 14% 76% 100% 0% 21% 54% 95 77% 34% 27% 0% 48% 11% 25% 32.00% 96
4 100% 100% 76% 100% 100% 83% 100% 94.00% 103 44% 65% 77% 69% 66% 32% 25% 54% 104
4 64% 52% 68% 87% 43% 17% 2% 47.50% 111 61% 50% 35% 11% 0% 0% 11% 24% 112
4 34% 14% 55% 88% 65% 58% 61% 53.50% 119 47% 25% 35% 56% 44% 40% 19% 38% 120

142
142
REFERENCES
Abbas, G., G. J. Fleming, E. Harrington, A. C. Shortall and F. J. Burke (2003). "Cuspal
movement and microleakage in premolar teeth restored with a packable composite cured
in bulk or in increments." J Dent 31(6): 437-444.
Aksu, M. (2004). Effect of Preheating Composite on Microleakage in class II
Restorations. IADR/AADR
Albers, H. F. (2002). Tooth-colored Restoratives: Principles and Techniques, BC Decker.
Alrahlah, A., N. Silikas and D. C. Watts (2014). "Post-cure depth of cure of bulk fill
dental resin-composites." Dent Mater 30(2): 149-154.
Alvarez-Gayosso, C., F. Barcelo-Santana, J. Guerrero-Ibarra, G. Saez-Espinola and M. A.
Canseco-Martinez (2004). "Calculation of contraction rates due to shrinkage in light-
cured composites." Dent Mater 20(3): 228-235.
AR, T. C. (1985). "Oral Histology: Development , Structure and function." Toronto,
Canada: Mosby.
Bagheri, M. and M. Ghavamnasiri (2008). "Effect of cavosurface margin configuration of
Class V cavity preparations on microleakage of composite resin restorations." J Contemp
Dent Pract 9(2): 122-129.
Bagis, Y. H. and F. A. Rueggeberg (2000). "The effect of post-cure heating on residual,
unreacted monomer in a commercial resin composite." Dent Mater 16(4): 244-247.
Baratieri, L. N. and A. V. Ritter (2005). "Critical appraisal. To bevel or not in anterior
composites." J Esthet Restor Dent 17(4): 264-269.
Bechtold, J., P. J. Dos Santos, A. Anido-Anido, V. Di Hipolito, R. C. Alonso and P. H.
D'Alpino (2012). "Hardness, polymerization depth, and internal adaptation of Class II
silorane composite restorations as a function of polymerization protocol." Eur J Dent
6(2): 133-140.
Black, G. V. (1917). "A workshop on Operative Dentistry in Two Volumes." Medico-
Dental publishing
Blalock, J. S., R. G. Holmes and F. A. Rueggeberg (2006). "Effect of temperature on
unpolymerized composite resin film thickness." J Prosthet Dent 96(6): 424-432.
Blunck, U. and J. F. Roulet (1989). "In vitro marginal quality of dentin-bonded
composite resins in Class V cavities." Quintessence Int 20(6): 407-412.

143
143
Blunck, U. and P. Zaslansky (2011). "Enamel margin integrity of Class I one-bottle all-
in-one adhesives-based restorations." J Adhes Dent 13(1): 23-29.
Boroujeni, P. M., S. M. Mousavinasab and E. Hasanli (2014). "Effect of configuration
factor on gap formation in hybrid composite resin, low-shrinkage composite resin and
resin-modified glass ionomer." J Investig Clin Dent.
Bouschlicher, M. R. and F. A. Rueggeberg (2000). "Effect of ramped light intensity on
polymerization force and conversion in a photoactivated composite." J Esthet Dent 12(6):
328-339.
Bouschlicher, M. R., F. A. Rueggeberg and B. M. Wilson (2004). "Correlation of bottom-
to-top surface microhardness and conversion ratios for a variety of resin composite
compositions." Oper Dent 29(6): 698-704.
Bowen, R. L. (1956). "Use of epoxy resins in restorative materials." J Dent Res 35(3):
360-369.
Bowen, R. L. (1965). "Adhesive bonding of various materials to hard tooth tissues. 3.
Bonding to dentin improved by pre-treatment and the use of surface-active comonomer."
J Dent Res 44(5): 903-905.
Bowen, R. L. (1982). "Composite and sealant resins--past, present, and future." Pediatr
Dent 4(1): 10-15.
Braga, R. R. and J. L. Ferracane (2004). "Alternatives in polymerization contraction
stress management." J Appl Oral Sci 12(spe): 1-11.
Broome, J. (2006). "Effects of Preheating Resin composite on Flowability " Dent
Advisor.
Buonocore, M. G. (1955). "A simple method of increasing the adhesion of acrylic filling
materials to enamel surfaces." J Dent Res 34(6): 849-853.
Buonocore, M. G., A. Matsui and A. J. Gwinnett (1968). "Penetration of resin dental
materials into enamel surfaces with reference to bonding." Arch Oral Biol 13(1): 61-70.
Burgess, J. and D. Cakir (2010). "Comparative properties of low-shrinkage composite
resins." Compend Contin Educ Dent 31 Spec No 2: 10-15.
Burgess, J. and C. Munoz (2014). http://dentsplymea.com/news/sdr-36-month-clinical-
trial-results-released.
Cakir, D. (2007). Polymerization Shrinkage—A Clinical Review, AEGIS
Communications. 3.

144
144
Campodonico, C. E., D. Tantbirojn, P. S. Olin and A. Versluis (2011). "Cuspal deflection
and depth of cure in resin-based composite restorations filled by using bulk, incremental
and transtooth-illumination techniques." J Am Dent Assoc 142(10): 1176-1182.
Campos, E. A., S. Ardu, D. Lefever, F. F. Jasse, T. Bortolotto and I. Krejci (2014).
"Marginal adaptation of class II cavities restored with bulk-fill composites." J Dent 42(5):
575-581.
Carvalho, A. A., C. Moreira Fdo, R. B. Fonseca, C. J. Soares, E. B. Franco, J. B. Souza
and L. G. Lopes (2012). "Effect of light sources and curing mode techniques on sorption,
solubility and biaxial flexural strength of a composite resin." J Appl Oral Sci 20(2): 246-
252.
Carvalho, R. M., M. Yoshiyama, P. D. Brewer and D. H. Pashley (1996). "Dimensional
changes of demineralized human dentine during preparation for scanning electron
microscopy." Arch Oral Biol 41(4): 379-386.
Casselli, D. S., A. L. Faria-e-Silva, H. Casselli and L. R. Martins (2012). "Effect of
curing unit and adhesive system on marginal adaptation of composite restorations." Gen
Dent 60(6): e408-412.
Casselli, D. S., A. L. Faria-e-Silva, H. Casselli and L. R. Martins (2013). "Marginal
adaptation of class V composite restorations submitted to thermal and mechanical
cycling." J Appl Oral Sci 21(1): 68-73.
Cenci, M., F. Demarco and R. de Carvalho (2005). "Class II composite resin restorations
with two polymerization techniques: relationship between microtensile bond strength and
marginal leakage." J Dent 33(7): 603-610.
Cenci, M. S., T. Pereira-Cenci, J. A. Cury and J. M. Ten Cate (2009). "Relationship
between gap size and dentine secondary caries formation assessed in a microcosm
biofilm model." Caries Res 43(2): 97-102.
Cenci, M. S., L. M. Tenuta, T. Pereira-Cenci, A. A. Del Bel Cury, J. M. ten Cate and J.
A. Cury (2008). "Effect of microleakage and fluoride on enamel-dentine demineralization
around restorations." Caries Res 42(5): 369-379.
Chuang, S. F., Y. T. Jin, T. S. Lin, C. H. Chang and F. Garcia-Godoy (2003). "Effects of
lining materials on microleakage and internal voids of Class II resin-based composite
restorations." Am J Dent 16(2): 84-90.
Chuang, S. F., Y. T. Jin, J. K. Liu, C. H. Chang and D. B. Shieh (2004). "Influence of
flowable composite lining thickness on Class II composite restorations." Oper Dent
29(3): 301-308.

145
145
Chuang, S. F., J. K. Liu, C. C. Chao, F. P. Liao and Y. H. Chen (2001). "Effects of
flowable composite lining and operator experience on microleakage and internal voids in
class II composite restorations." J Prosthet Dent 85(2): 177-183.
Cilli, R., J. C. Pereira and A. Prakki (2012). "Properties of dental resins submitted to pH
catalysed hydrolysis." J Dent 40(12): 1144-1150.
Coelho-De-Souza, F. H., G. B. Camacho, F. F. Demarco and J. M. Powers (2008).
"Fracture resistance and gap formation of MOD restorations: influence of restorative
technique, bevel preparation and water storage." Oper Dent 33(1): 37-43.
Coelho-De-Souza, F. H., J. C. Camargo, T. Beskow, M. D. Balestrin, C. A. Klein-Junior
and F. F. Demarco (2012). "A randomized double-blind clinical trial of posterior
composite restorations with or without bevel: 1-year follow-up." J Appl Oral Sci 20(2):
174-179.
Craig, R. (1981). Symposium on composite resins in dentistry. The Dental Clinics of
North America: 219-239.
Crim, G. A., M. L. Swartz and R. W. Phillips (1984). "An evaluation of cavosurface
design and microleakage." Gen Dent 32(1): 56-58.
Czasch, P. and N. Ilie (2013). "In vitro comparison of mechanical properties and degree
of cure of bulk fill composites." Clin Oral Investig 17(1): 227-235.
D'Alpino, P. H., J. C. Pereira, F. A. Rueggeberg, N. R. Svizero, K. Miyake and D. H.
Pashley (2006). "Efficacy of composite surface sealers in sealing cavosurface marginal
gaps." J Dent 34(3): 252-259.
Daronch, M., F. A. Rueggeberg and M. F. De Goes (2005). "Monomer conversion of pre-
heated composite." J Dent Res 84(7): 663-667.
Davidson, C. L., A. J. de Gee and A. Feilzer (1984). "The competition between the
composite-dentin bond strength and the polymerization contraction stress." J Dent Res
63(12): 1396-1399.
Davidson, C. L. and A. J. Feilzer (1997). "Polymerization shrinkage and polymerization
shrinkage stress in polymer-based restoratives." J Dent 25(6): 435-440.
Davila, J. M., A. J. Gwinnett and J. C. Robles (1989). "Marginal adaptation of composite
resins and dentinal bonding agents." Future Dent 4(3): 12-13.
de Wet, F. A., H. V. Exner, I. C. du Preez and J. P. van Niekerk (1991). "The effect of
placement technique on marginal adaptation of posterior resins." J Dent Assoc S Afr
46(3): 171-174.

146
146
Deliperi, S. and D. N. Bardwell (2002). "An alternative method to reduce polymerization
shrinkage in direct posterior composite restorations." J Am Dent Assoc 133(10): 1387-
1398.
Deliperi, S., D. N. Bardwell, C. Wegley and M. D. Congiu (2006). "In vitro evaluation of
giomers microleakage after exposure to 33% hydrogen peroxide: self-etch vs total-etch
adhesives." Oper Dent 31(2): 227-232.
DeWald, J. P. and J. L. Ferracane (1987). "A comparison of four modes of evaluating
depth of cure of light-activated composites." J Dent Res 66(3): 727-730.
Dietrich, T., M. Kraemer, G. M. Losche and J. Roulet (2000). "Marginal integrity of large
compomer Class II restorations with cervical margins in dentine." J Dent 28(6): 399-405.
Dietschi, D., G. De Siebenthal, L. Neveu-Rosenstand and J. Holz (1995). "Influence of
the restorative technique and new adhesives on the dentin marginal seal and adaptation of
resin composite Class II restorations: an in vitro evaluation." Quintessence Int 26(10):
717-727.
Dietschi, D., U. Scampa, G. Campanile and J. Holz (1995). "Marginal adaptation and seal
of direct and indirect Class II composite resin restorations: an in vitro evaluation."
Quintessence Int 26(2): 127-138.
El-Damanhoury, H. and J. Platt (2013). "Polymerization Shrinkage Stress Kinetics and
Related Properties of Bulk-fill Resin Composites." Oper Dent.
El-Safty, S., R. Akhtar, N. Silikas and D. C. Watts (2012). "Nanomechanical properties
of dental resin-composites." Dent Mater 28(12): 1292-1300.
El-Safty, S., N. Silikas and D. C. Watts (2012). "Creep deformation of restorative resin-
composites intended for bulk-fill placement." Dent Mater 28(8): 928-935.
Featherstone, J. D. (2008). "Dental caries: a dynamic disease process." Aust Dent J 53(3):
286-291.
Feilzer, A. J., A. J. De Gee and C. L. Davidson (1987). "Setting stress in composite resin
in relation to configuration of the restoration." J Dent Res 66(11): 1636-1639.
Feilzer, A. J., L. H. Dooren, A. J. de Gee and C. L. Davidson (1995). "Influence of light
intensity on polymerization shrinkage and integrity of restoration-cavity interface." Eur J
Oral Sci 103(5): 322-326.
Fejerskov, O., N. W. Johnson and L. M. Silverstone (1974). "The ultrastructure of
fluorosed human dental enamel." Scand J Dent Res 82(5): 357-372.
147
147
Felix, C. A., R. B. Price and P. Andreou (2006). "Effect of reduced exposure times on the
microhardness of 10 resin composites cured by high-power LED and QTH curing lights."
J Can Dent Assoc 72(2): 147.
Ferracane, J. L. (1985). "Correlation between hardness and degree of conversion during
the setting reaction of unfilled dental restorative resins." Dent Mater 1(1): 11-14.
Ferracane, J. L. and E. H. Greener (1984). "Fourier transform infrared analysis of degree
of polymerization in unfilled resins--methods comparison." J Dent Res 63(8): 1093-1095.
Ferracane, J. L. and E. H. Greener (1986). "The effect of resin formulation on the degree
of conversion and mechanical properties of dental restorative resins." J Biomed Mater
Res 20(1): 121-131.
Finan, L., W. M. Palin, N. Moskwa, E. L. McGinley and G. J. Fleming (2013). "The
influence of irradiation potential on the degree of conversion and mechanical properties
of two bulk-fill flowable RBC base materials." Dent Mater 29(8): 906-912.
Fleming, G. J., S. Khan, O. Afzal, W. M. Palin and F. J. Burke (2007). "Investigation of
polymerisation shrinkage strain, associated cuspal movement and microleakage of MOD
cavities restored incrementally with resin-based composite using an LED light curing
unit." J Dent 35(2): 97-103.
Flury, S., S. Hayoz, A. Peutzfeldt, J. Husler and A. Lussi (2012). "Depth of cure of resin
composites: is the ISO 4049 method suitable for bulk fill materials?" Dent Mater 28(5):
521-528.
Frankenberger, R., N. Kramer, U. Lohbauer, S. A. Nikolaenko and S. M. Reich (2007).
"Marginal integrity: is the clinical performance of bonded restorations predictable in
vitro?" J Adhes Dent 9 Suppl 1: 107-116.
Frankenberger, R., N. Kramer, M. Pelka and A. Petschelt (1999). "Internal adaptation and
overhang formation of direct Class II resin composite restorations." Clin Oral Investig
3(4): 208-215.
Frankenberger, R., U. Lohbauer, R. B. Schaible, S. A. Nikolaenko and M. Naumann
(2008). "Luting of ceramic inlays in vitro: marginal quality of self-etch and etch-and-
rinse adhesives versus self-etch cements." Dent Mater 24(2): 185-191.
Frankenberger, R. and F. R. Tay (2005). "Self-etch vs etch-and-rinse adhesives: effect of
thermo-mechanical fatigue loading on marginal quality of bonded resin composite
restorations." Dent Mater 21(5): 397-412.
Froes-Salgado, N. R., L. M. Silva, Y. Kawano, C. Francci, A. Reis and A. D. Loguercio
(2010). "Composite pre-heating: effects on marginal adaptation, degree of conversion and
mechanical properties." Dent Mater 26(9): 908-914.

148
148
Furness, A., M. Y. Tadros, S. W. Looney and F. A. Rueggeberg (2014). "Effect of
bulk/incremental fill on internal gap formation of bulk-fill composites." J Dent 42(4):
439-449.
Fusayama, A. and A. Kohno (1989). "Marginal closure of composite restorations with the
gingival wall in cementum/dentin." J Prosthet Dent 61(3): 293-296.
Gallo, J. R., 3rd, M. L. Bates and J. O. Burgess (2000). "Microleakage and adaptation of
Class II packable resin-based composites using incremental or bulk filling techniques."
Am J Dent 13(4): 205-208.
Garcia, D., P. Yaman, J. Dennison and G. Neiva (2013). "Polymerization Shrinkage and
Depth of Cure of Bulk Fill Flowable Composite Resins." Oper Dent.
Giachetti, L., F. Bertini, C. Bambi and D. Scaminaci Russo (2007). "A rational use of
dental materials in posterior direct resin restorations in order to control polymerization
shrinkage stress." Minerva Stomatol 56(3): 129-138.
Gjorgievska, E., J. W. Nicholson, S. Iljovska and I. J. Slipper (2008). "Marginal
adaptation and performance of bioactive dental restorative materials in deciduous and
young permanent teeth." J Appl Oral Sci 16(1): 1-6.
Gwinnett, A. J. (1971). "Histologic changes in human enamel following treatment with
acidic adhesive conditioning agents." Arch Oral Biol 16(7): 731-738.
Gwinnett, A. J. (1993). "Quantitative contribution of resin infiltration/hybridization to
dentin bonding." Am J Dent 6(1): 7-9.
Haak, R., M. J. Wicht and M. J. Noack (2003). "Marginal and internal adaptation of
extended class I restorations lined with flowable composites." J Dent 31(4): 231-239.
Hackman, S. T., R. M. Pohjola and F. A. Rueggeberg (2002). "Depths of cure and effect
of shade using pulse-delay and continuous exposure photo-curing techniques." Oper Dent
27(6): 593-599.
Hannig, M. and B. Fu (2001). "Effect of air abrasion and resin composite on
microleakage of Class V restorations bonded with self-etching primers." J Adhes Dent
3(3): 265-272.
Hansen, E. K. and E. Asmussen (1993). "Reliability of three dental radiometers." Scand J
Dent Res 101(2): 115-119.
Heintze, S. D., A. Cavalleri and V. Rousson (2005). "The marginal quality of luted
ceramic inserts in bovine teeth and ceramic inlays in extracted molars after occlusal
loading." J Adhes Dent 7(3): 213-223.

149
149
Heymann, H. O., E. J. Swift, A. V. Ritter and C. M. Sturdevant (2012). Sturdevant's Art
and Science of Operative Dentistry, Elsevier/Mosby.
Hickel, R. and J. Manhart (2001). "Longevity of restorations in posterior teeth and
reasons for failure." J Adhes Dent 3(1): 45-64.
Hinoura, K., J. C. Setcos and R. W. Phillips (1988). "Cavity design and placement
techniques for Class 2 composites." Oper Dent 13(1): 12-19.
Hiremath, S. (2011). Textbook of Community and Preventive Dentistry
Hodges, D. J., F. I. Mangum and M. T. Ward (1995). "Relationship between gap width
and recurrent dental caries beneath occlusal margins of amalgam restorations."
Community Dent Oral Epidemiol 23(4): 200-204.
Iida, K., S. Inokoshi and N. Kurosaki (2003). "Interfacial gaps following ceramic inlay
cementation vs direct composites." Oper Dent 28(4): 445-452.
Ilie, N., S. Bucuta and M. Draenert (2013). "Bulk-fill resin-based composites: an in vitro
assessment of their mechanical performance." Oper Dent 38(6): 618-625.
Ilie, N. and R. Hickel (2011). "Resin composite restorative materials." Aust Dent J 56
Suppl 1: 59-66.
Ivoclarvivadent. (2014). "Ivoclarvivadent." Retrieved 04/01/14.
Jackson, R. D. (2011). Placing Posterior Composites: Increasing Efficiency. Dentistry
today.
Kanca, J., 3rd (1991). "The all-etch bonding technique/wetbonding." Dent Today 10(9):
58, 60-51.
Kanca, J., 3rd (1996). "Wet bonding: effect of drying time and distance." Am J Dent 9(6):
273-276.
Kanemura, N., H. Sano and J. Tagami (1999). "Tensile bond strength to and SEM
evaluation of ground and intact enamel surfaces." J Dent 27(7): 523-530.
Karthick, K. (2011). "Polymerization Shrinkage of Composites- A Review." JIADS 2(2).
Kato, G. and N. Nakabayashi (1998). "The durability of adhesion to phosphoric acid
etched, wet dentin substrates." Dent Mater 14(5): 347-352.
Kim, K. H., J. L. Ong and O. Okuno (2002). "The effect of filler loading and morphology
on the mechanical properties of contemporary composites." J Prosthet Dent 87(6): 642-
649.
150
150
Kim, M. E. and S. H. Park (2011). "Comparison of premolar cuspal deflection in bulk or
in incremental composite restoration methods." Oper Dent 36(3): 326-334.
Kleverlaan, C. J. and A. J. Feilzer (2005). "Polymerization shrinkage and contraction
stress of dental resin composites." Dent Mater 21(12): 1150-1157.
Kramer, N., F. Garcia-Godoy, C. Reinelt, A. J. Feilzer and R. Frankenberger (2011).
"Nanohybrid vs. fine hybrid composite in extended Class II cavities after six years." Dent
Mater 27(5): 455-464.
Kramer, N., C. Reinelt, G. Richter, A. Petschelt and R. Frankenberger (2009).
"Nanohybrid vs. fine hybrid composite in Class II cavities: clinical results and margin
analysis after four years." Dent Mater 25(6): 750-759.
Kuijs, R. H., W. M. Fennis, C. M. Kreulen, M. Barink and N. Verdonschot (2003). "Does
layering minimize shrinkage stresses in composite restorations?" J Dent Res 82(12): 967-
971.
Kwon, T. Y., R. Bagheri, Y. K. Kim, K. H. Kim and M. F. Burrow (2012). "Cure
mechanisms in materials for use in esthetic dentistry." J Investig Clin Dent 3(1): 3-16.
Kwon, Y., J. Ferracane and I. B. Lee (2012). "Effect of layering methods, composite
type, and flowable liner on the polymerization shrinkage stress of light cured
composites." Dent Mater 28(7): 801-809.
Lassila, L. V., E. Nagas, P. K. Vallittu and S. Garoushi (2012). "Translucency of
flowable bulk-filling composites of various thicknesses." Chin J Dent Res 15(1): 31-35.
Lee, J. H., C. M. Um and I. B. Lee (2006). "Rheological properties of resin composites
according to variations in monomer and filler composition." Dent Mater 22(6): 515-526.
Letzel, H. (1989). "Survival rates and reasons for failure of posterior composite
restorations in multicentre clinical trial." J Dent 17 Suppl 1: S10-17; discussion S26-18.
Li, J., H. Li, A. S. Fok and D. C. Watts (2012). "Numerical evaluation of bulk material
properties of dental composites using two-phase finite element models." Dent Mater
28(9): 996-1003.
Lienhard O (1973). Instrument for transmitting ultra-violet radiation to a limited area
United States Patent. 3.
Lindberg, A., J. W. van Dijken and P. Horstedt (2005). "In vivo interfacial adaptation of
class II resin composite restorations with and without a flowable resin composite liner."
Clin Oral Investig 9(2): 77-83.

151
151
Liu, Y., L. Tjaderhane, L. Breschi, A. Mazzoni, N. Li, J. Mao, D. H. Pashley and F. R.
Tay (2011). "Limitations in bonding to dentin and experimental strategies to prevent
bond degradation." J Dent Res 90(8): 953-968.
Lopes, G. C., D. G. Thys, P. Klaus, G. M. Oliveira and N. Widmer (2007). "Enamel acid
etching: a review." Compend Contin Educ Dent 28(1): 18-24; quiz 25, 42.
Lutz, F., I. Krejci and F. Barbakow (1991). "Quality and durability of marginal
adaptation in bonded composite restorations." Dent Mater 7(2): 107-113.
Lutz, F. and M. Kull (1980). "The development of a posterior tooth composite system, in-
vitro investigation." SSO Schweiz Monatsschr Zahnheilkd 90(5): 455-483.
Magni, E., L. Zhang, R. Hickel, M. Bossu, A. Polimeni and M. Ferrari (2008). "SEM and
microleakage evaluation of the marginal integrity of two types of class V restorations
with or without the use of a light-curable coating material and of polishing." J Dent
36(11): 885-891.
Manhart, J., H. Y. Chen, A. Mehl, K. Weber and R. Hickel (2001). "Marginal quality and
microleakage of adhesive class V restorations." J Dent 29(2): 123-130.
Maresca, C., L. A. Pimenta, H. O. Heymann, T. L. Ziemiecki and A. V. Ritter (2010).
"Effect of finishing instrumentation on the marginal integrity of resin-based composite
restorations." J Esthet Restor Dent 22(2): 104-112.
Marghalani, H. Y. (2010). "Effect of filler particles on surface roughness of experimental
composite series." J Appl Oral Sci 18(1): 59-67.
Masouras, K., N. Silikas and D. C. Watts (2008). "Correlation of filler content and elastic
properties of resin-composites." Dent Mater 24(7): 932-939.
Mehl, A., R. Hickel and K. H. Kunzelmann (1997). "Physical properties and gap
formation of light-cured composites with and without 'softstart-polymerization'." J Dent
25(3-4): 321-330.
Mjor, I. A. (2000). "Testing of dentin adhesives." J Dent Res 79(4): 892.
Moffa, J. (1989). "Comparative performance of amalgam and composite resin
restorations and criteria for their use. In: Anusavice K (ed). Quality evaluation of dental
restorations." Chicago, Quintessence: 125-131.
Moore, B. K., J. A. Platt, G. Borges, T. M. Chu and I. Katsilieri (2008). "Depth of cure of
dental resin composites: ISO 4049 depth and microhardness of types of materials and
shades." Oper Dent 33(4): 408-412.
152
152
Moorthy, A., C. H. Hogg, A. H. Dowling, B. F. Grufferty, A. R. Benetti and G. J.
Fleming (2012). "Cuspal deflection and microleakage in premolar teeth restored with
bulk-fill flowable resin-based composite base materials." J Dent 40(6): 500-505.
Moszner, N. (2007). "Recent developments of new components for dental adhesives and
composites." Macromol Mater 292.
Moszner, N., U. K. Fischer, J. Angermann and V. Rheinberger (2008). "A partially
aromatic urethane dimethacrylate as a new substitute for Bis-GMA in restorative
composites." Dent Mater 24(5): 694-699.
Mullejans, R., H. Lang, N. Schuler, M. O. Baldawi and W. H. Raab (2003). "Increment
technique for extended Class V restorations: an experimental study." Oper Dent 28(4):
352-356.
Murray, G. A., J. L. Yates and S. M. Newman (1981). "Ultraviolet light and ultraviolet
light-activated composite resins." J Prosthet Dent 46(2): 167-170.
Nakabayashi, N., K. Kojima and E. Masuhara (1982). "The promotion of adhesion by the
infiltration of monomers into tooth substrates." J Biomed Mater Res 16(3): 265-273.
NJM, O. (1997). Clinical Procedures for Posterior Composite Restorations.
Olmez, A., N. Oztas and H. Bodur (2004). "The effect of flowable resin composite on
microleakage and internal voids in class II composite restorations." Oper Dent 29(6):
713-719.
Opdam, N. J., E. M. Bronkhorst, B. A. Loomans and M. C. Huysmans (2010). "12-year
survival of composite vs. amalgam restorations." J Dent Res 89(10): 1063-1067.
Opdam, N. J., J. J. Roeters, T. de Boer, D. Pesschier and E. Bronkhorst (2003). "Voids
and porosities in class I micropreparations filled with various resin composites." Oper
Dent 28(1): 9-14.
Papacchini, F., F. Monticelli, I. Hasa, I. Radovic, A. Fabianelli, A. Polimeni and M.
Ferrari (2007). "Effect of air-drying temperature on the effectiveness of silane primers
and coupling blends in the repair of a microhybrid resin composite." J Adhes Dent 9(4):
391-397.
Park, J., J. Chang, J. Ferracane and I. B. Lee (2008). "How should composite be layered
to reduce shrinkage stress: incremental or bulk filling?" Dent Mater 24(11): 1501-1505.
Pashley, D. H. (1989). "Dentin: a dynamic substrate--a review." Scanning Microsc 3(1):
161-174; discussion 174-166.
Pashley, D. H. (1992). "Smear layer: overview of structure and function." Proc Finn Dent
Soc 88 Suppl 1: 215-224.

153
153
Pashley, D. H. and F. R. Tay (2001). "Aggressiveness of contemporary self-etching
adhesives. Part II: etching effects on unground enamel." Dent Mater 17(5): 430-444.
Perdigao, J. (2010). "Dentin bonding-variables related to the clinical situation and the
substrate treatment." Dent Mater 26(2): e24-37.
Peutzfeldt, A. and E. Asmussen (2002). "Composite restorations: influence of flowable
and self-curing resin composite linings on microleakage in vitro." Oper Dent 27(6): 569-
575.
Pierre, S. (2011). Effect of finishing and Polishing Direction on the Marginal Adaptation
of Resin Based Composite Restorations In-vitro.
Porte, A., F. Lutz, M. R. Lund, M. L. Swartz and M. A. Cochran (1984). "Cavity designs
for composite resins." Oper Dent 9(2): 50-56.
Price, R. B., C. A. Felix and P. Andreou (2005). "Evaluation of a dual peak third
generation LED curing light." Compend Contin Educ Dent 26(5): 331-332, 334, 336-338
passim; quiz 348.
Price, R. B., C. A. Felix and P. Andreou (2005). "Knoop hardness of ten resin composites
irradiated with high-power LED and quartz-tungsten-halogen lights." Biomaterials
26(15): 2631-2641.
Price, R. B., F. A. Rueggeberg, D. Labrie and C. M. Felix (2010). "Irradiance uniformity
and distribution from dental light curing units." J Esthet Restor Dent 22(2): 86-101.
Qvist, V., L. Johannessen and M. Bruun (1992). "Progression of approximal caries in
relation to iatrogenic preparation damage." J Dent Res 71(7): 1370-1373.
Raposo, L. H., S. R. Armstrong, R. R. Maia, F. Qian, S. Geraldeli and C. J. Soares
(2012). "Effect of specimen gripping device, geometry and fixation method on
microtensile bond strength, failure mode and stress distribution: laboratory and finite
element analyses." Dent Mater 28(5): e50-62.
Rasines Alcaraz, M. G., A. Veitz-Keenan, P. Sahrmann, P. R. Schmidlin, D. Davis and Z.
Iheozor-Ejiofor (2014). "Direct composite resin fillings versus amalgam fillings for
permanent or adult posterior teeth." Cochrane Database Syst Rev 3: Cd005620.
Roeters, J. J., A. C. Shortall and N. J. Opdam (2005). "Can a single composite resin serve
all purposes?" Br Dent J 199(2): 73-79; quiz 114.
Roggendorf, M. J., N. Kramer, A. Appelt, M. Naumann and R. Frankenberger (2011).
"Marginal quality of flowable 4-mm base vs. conventionally layered resin composite." J
Dent 39(10): 643-647.
154
154
Roulet, J. F., T. Reich, U. Blunck and M. Noack (1989). "Quantitative margin analysis in
the scanning electron microscope." Scanning Microsc 3(1): 147-158; discussion 158-149.
Rowe, A. H. (1989). "A five year study of the clinical performance of a posterior
composite resin restorative material." J Dent 17 Suppl 1: S6-9; discussion S26-28.
Rueggeberg, F. (1999). "Contemporary issues in photocuring." Comp Cont Educ Dent.
Rueggeberg F, P. R., Felix CA, Mutluay M (2010). "Effect of light tip movement during
exposure on composite hardness " J Dent Res 89(Special issue A ): 536.
Rueggeberg, F. A. (2011). "State-of-the-art: dental photocuring--a review." Dent Mater
27(1): 39-52.
Rueggeberg, F. A. and R. G. Craig (1988). "Correlation of parameters used to estimate
monomer conversion in a light-cured composite." J Dent Res 67(6): 932-937.
Sabatini, C. (2007). Effect of Pre-heated Composites and Flowable liners on Class II
Gingival Marginal Adaptation, University of Iowa.
Sabatini, C., U. Blunck, G. Denehy and C. Munoz (2010). "Effect of pre-heated
composites and flowable liners on Class II gingival margin gap formation." Oper Dent
35(6): 663-671.
Samet, N., K. R. Kwon, P. Good and H. P. Weber (2006). "Voids and interlayer gaps in
Class 1 posterior composite restorations: a comparison between a microlayer and a 2-
layer technique." Quintessence Int 37(10): 803-809.
Schmidt, C. and N. Ilie (2013). "The effect of aging on the mechanical properties of
nanohybrid composites based on new monomer formulations." Clin Oral Investig 17(1):
251-257.
Schulein, T. M. (2005). The History of Operative Dentistry. Journal of the History of
Dentistry 53.
Sensi, L. G., F. C. Marson, S. Monteiro, Jr., L. N. Baratieri and M. A. Caldeira de
Andrada (2004). "Flowable composites as "filled adhesives:" a microleakage study." J
Contemp Dent Pract 5(4): 32-41.
Souza-Junior, E. J., B. C. Borges, M. A. Montes, R. C. Alonso, G. M. Ambrosano and M.
A. Sinhoreti (2012). "Influence of etching time and bonding strategies on the microshear
bond strength of self- and light-cured pit-and-fissure sealants." Braz Dent J 23(5): 477-
483.

155
155
St Georges, A. J., A. D. Wilder, Jr., J. Perdigao and E. J. Swift, Jr. (2002). "Microleakage
of Class V composites using different placement and curing techniques: an in vitro
study." Am J Dent 15(4): 244-247.
Stansbury, J. W. (2000). "Curing dental resins and composites by photopolymerization."
J Esthet Dent 12(6): 300-308.
Stoll, R., H. Remes, K. H. Kunzelmann and V. Stachniss (2000). "Marginal
characteristics of different filling materials and filling methods with standardized cavity
preparation." J Adhes Dent 2(2): 129-138.
Strobel, W. O., A. Petschelt, M. Kemmoona and R. Frankenberger (2005). "Ceramic
inserts do not generally improve resin composite margins." J Oral Rehabil 32(8): 606-
613.
Summitt, J. B. (2006). Fundamentals of operative dentistry: a contemporary approach,
Quintessence Pub.
Tay, F. R., A. J. Gwinnett, K. M. Pang and S. H. Wei (1994). "Structural evidence of a
sealed tissue interface with a total-etch wet-bonding technique in vivo." J Dent Res 73(3):
629-636.
Tay, F. R., A. J. Gwinnett and S. H. Wei (1996). "The overwet phenomenon: a scanning
electron microscopic study of surface moisture in the acid-conditioned, resin-dentin
interface." Am J Dent 9(3): 109-114.
Taylor, M. J. and E. Lynch (1992). "Microleakage." J Dent 20(1): 3-10.
Taylor, M. J. and E. Lynch (1993). "Marginal adaptation." J Dent 21(5): 265-273.
Toida, T. (1995). "Effect of smear layer on bonding to dentin prepared with bur." J Jpn
Soc Dent Mater Devices 14: 109-116.
Totiam, P., C. Gonzalez-Cabezas, M. R. Fontana and D. T. Zero (2007). "A new in vitro
model to study the relationship of gap size and secondary caries." Caries Res 41(6): 467-
473.
Trujillo, M., S. M. Newman and J. W. Stansbury (2004). "Use of near-IR to monitor the
influence of external heating on dental composite photopolymerization." Dent Mater
20(8): 766-777.
Uno, S. and E. Asmussen (1991). "Marginal adaptation of a restorative resin polymerized
at reduced rate." Scand J Dent Res 99(5): 440-444.
Usha, H., A. Kumari, D. Mehta, A. Kaiwar and N. Jain (2011). "Comparing microleakage
and layering methods of silorane-based resin composite in class V cavities using confocal
microscopy: An in vitro study." J Conserv Dent 14(2): 164-168.
156
156
Van Ende, A., J. De Munck, K. L. Van Landuyt, A. Poitevin, M. Peumans and B. Van
Meerbeek (2013). "Bulk-filling of high C-factor posterior cavities: effect on adhesion to
cavity-bottom dentin." Dent Mater 29(3): 269-277.
Venhoven, B. A., A. J. de Gee and C. L. Davidson (1993). "Polymerization contraction
and conversion of light-curing BisGMA-based methacrylate resins." Biomaterials 14(11):
871-875.
Versluis, A., W. H. Douglas, M. Cross and R. L. Sakaguchi (1996). "Does an incremental
filling technique reduce polymerization shrinkage stresses?" J Dent Res 75(3): 871-878.
Watanabe, I. and N. Nakabayashi (1993). "Bonding durability of photocured phenyl-P in
TEGDMA to smear layer-retained bovine dentin." Quintessence Int 24(5): 335-342.
Whittaker, D. K. (1982). "Structural variations in the surface zone of human tooth enamel
observed by scanning electron microscopy." Arch Oral Biol 27(5): 383-392.
Wieczkowski, G., Jr., R. B. Joynt, R. Klockowski and E. L. Davis (1988). "Effects of
incremental versus bulk fill technique on resistance to cuspal fracture of teeth restored
with posterior composites." J Prosthet Dent 60(3): 283-287.
Yearn, J. A. (1985). "Factors affecting cure of visible light activated composites." Int
Dent J 35(3): 218-225.
Yoshikawa, T., M. F. Burrow and J. Tagami (2001). "A light curing method for
improving marginal sealing and cavity wall adaptation of resin composite restorations."
Dent Mater 17(4): 359-366.
Zaruba, M., F. J. Wegehaupt and T. Attin (2013). "Comparison between different flow
application techniques: SDR vs flowable composite." J Adhes Dent 15(2): 115-121.
Ziskind, D., I. Adell, E. Teperovich and B. Peretz (2005). "The effect of an intermediate
layer of flowable composite resin on microleakage in packable composite restorations."
Int J Paediatr Dent 15(5): 349-354.
Copyright © 2022 FDOKUMEN