Can a Commercial Screening Tool Help Select Better Teachers?
Upload
khangminh22Category
view
1download
0
A COMPARISON OF A TANNIC ACID BIOPESTICIDE AND A COMMERCIALFUNGICIDE USED FOR CROP PROTECTION AGAINST FUSARIUM HEAD BLIGHT
A thesis presented to the faculty of the Graduate School ofWestern Carolina University in partial fulfillment of the
requirements for the degree of Masters of Science in Chemistry.
By
Brooke Bien
Advisor: Dr. Cynthia AtterholtAssociate Professor of Chemistry
Department of Chemistry & Physics
Committee Members: Dr. Arthur Salido, Chemistry & PhysicsDr. Scott Huffman, Chemistry & Physics
November 2016
ACKNOWLEDGMENTS
I would like to acknowledge past students that contributed to the tannic biopesticide
research, Shea Connelly and Crystal Noel for researching formulations to achieve a stable
tannic acid emulsion. Also Catherine Murray for researching various emulsifiers for the
tannic acid emulsion. Also thanks to Dr. Christina Cowger, Small Grains Pathologist,
USDA-ARS, Department of Plant Pathology, North Carolina State University, Raleigh, NC
for performing field trials using the fungicide and biopesticide.
Thank you to my thesis committee members, Arthur Salido and Scott Huffman, for their
assistance. A special thanks to my advisor, Cynthia Atterholt for our many discussions, her
helpful advice, and continuous encouragement. I also extend thanks to Western Carolina
University Department of Chemistry & Physics for funding this project.
I am thankful to God for my determination and calmness during this process as well as
for this opportunity. Lastly, I thank my wonderful husband and my awesome parents for all
of their support and encouragement.
ii
TABLE OF CONTENTS
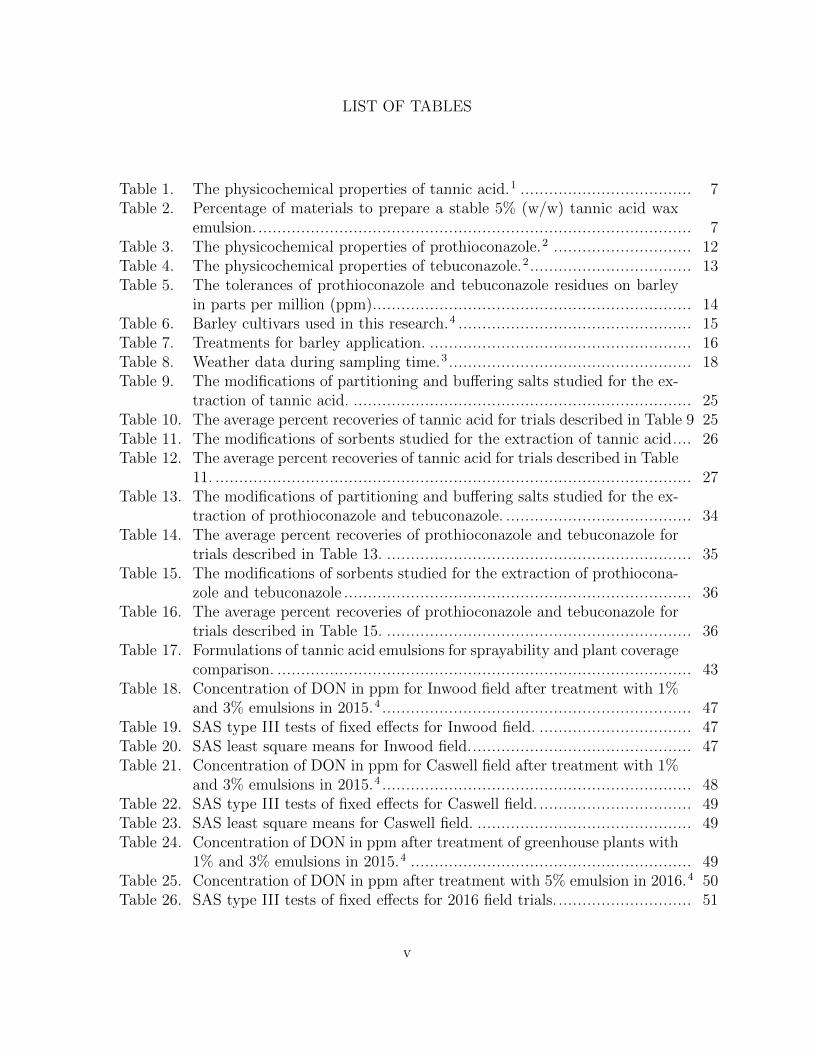
LIST OF TABLES ................................................................................................. v
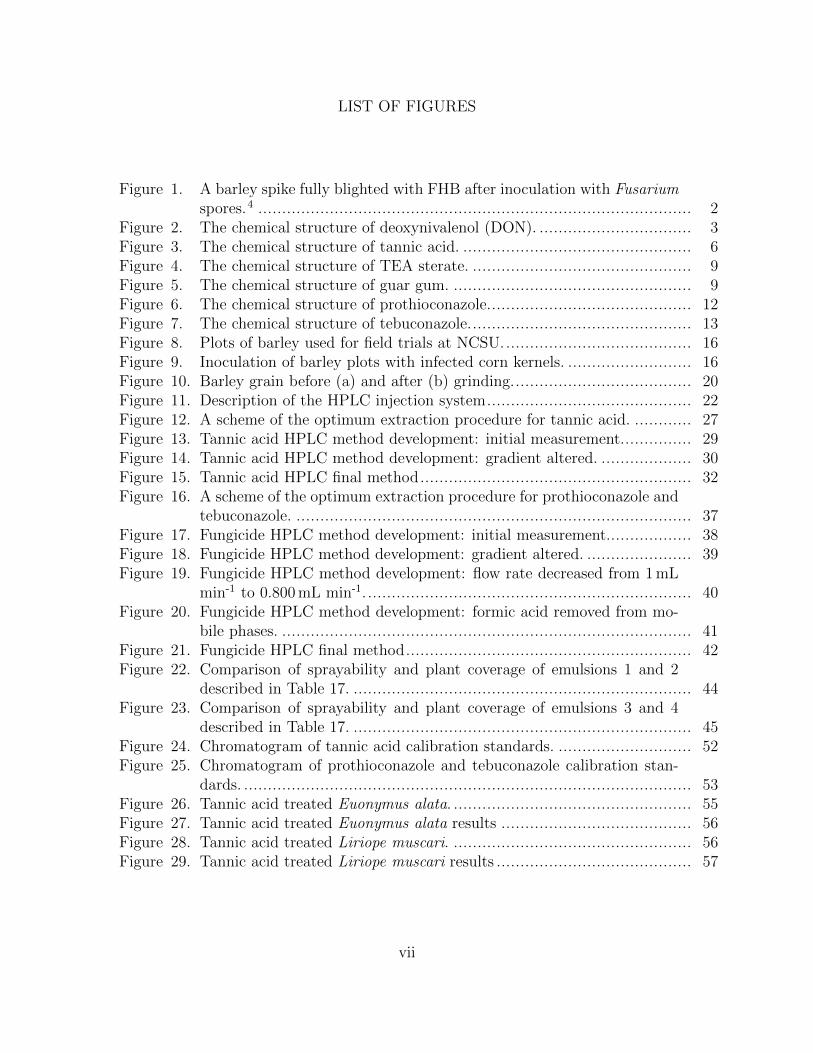
LIST OF FIGURES ............................................................................................... vii
LIST OF ABBREVIATIONS .................................................................................. viii
ABSTRACT .......................................................................................................... ix
CHAPTER ONE: INTRODUCTION ................................................................. 11.1 Biopesticides ............................................................................................. 11.2 Fusarium Head Blight ................................................................................ 21.3 Chromatography ........................................................................................ 3
CHAPTER TWO: TANNIC ACID BIOPESTICIDE ............................................ 52.1 Tannic Acid............................................................................................... 52.2 Wax Emulsion ........................................................................................... 6
2.2.1 Wax ............................................................................................... 72.2.2 Emulsifier ....................................................................................... 82.2.3 Guar Gum ...................................................................................... 82.2.4 Preparation..................................................................................... 8
CHAPTER THREE: COMMERCIAL FUNGICIDE ................................................ 113.1 ProsaroTM ................................................................................................. 11
3.1.1 Prothioconazole ............................................................................... 113.1.2 Tebuconazole .................................................................................. 13
3.2 Mode of Action.......................................................................................... 133.3 Tolerances ................................................................................................. 14
CHAPTER FOUR: APPLICATION STUDIES ..................................................... 154.1 Barley Plot Trials ...................................................................................... 154.2 Longevity of Biopesticide After Application.................................................. 15
CHAPTER FIVE: EXPERIMENTAL DESIGN ................................................... 195.1 QuEChERS Extraction............................................................................... 19
5.1.1 Procedure ....................................................................................... 195.1.2 Homogenization............................................................................... 205.1.3 Partitioning and Buffer Salts ............................................................ 205.1.4 D-SPE............................................................................................ 21
5.2 Operations of HPLC .................................................................................. 215.2.1 Solvent Delivery System ................................................................... 215.2.2 Injection System.............................................................................. 225.2.3 Separation ...................................................................................... 235.2.4 Column Information ........................................................................ 235.2.5 Detector Description ........................................................................ 23
CHAPTER SIX: METHOD DEVELOPMENT FOR TANNIC ACID ANALYSIS 246.1 Optimization of Extraction Method ............................................................. 24
iii
6.1.1 Partitioning and Buffer Salts ............................................................ 246.1.2 D-SPE............................................................................................ 266.1.3 Optimum Extraction Procedure ........................................................ 27
6.2 Instrumental Analysis................................................................................. 276.2.1 Gradient ......................................................................................... 286.2.2 Flow Rate ....................................................................................... 286.2.3 Detection Wavelength ...................................................................... 316.2.4 Temperature ................................................................................... 316.2.5 Final Instrument Parameters ............................................................ 31
CHAPTER SEVEN: METHOD DEVELOPMENT FOR PROTHIOCONAZOLE ANDTEBUCONAZOLE ANALYSIS............................................... 33
7.1 Optimization of Extraction Method ............................................................. 337.1.1 Partitioning and Buffer Salts ............................................................ 337.1.2 D-SPE............................................................................................ 347.1.3 Optimum Extraction Procedure ........................................................ 35
7.2 Instrumental Analysis................................................................................. 377.2.1 Gradient ......................................................................................... 387.2.2 Flow Rate ....................................................................................... 397.2.3 Mobile Phases ................................................................................. 417.2.4 Detection Wavelength ...................................................................... 417.2.5 Temperature ................................................................................... 427.2.6 Final Instrument Parameters ............................................................ 42
CHAPTER EIGHT: RESULTS ............................................................................. 438.1 Sprayability and Plant Coverage.................................................................. 438.2 Barley Plot Trials ...................................................................................... 46
8.2.1 Effectiveness Data ........................................................................... 468.2.2 Tannic Acid Residue Extracts........................................................... 528.2.3 Fungicide Residue Extracts............................................................... 53
8.3 Longetivity of Biopesticide After Application ............................................... 538.3.1 Euonymus alata ............................................................................... 548.3.2 Liriope muscari ............................................................................... 54
CHAPTER NINE: CONCLUSION...................................................................... 58
CHAPTER TEN: FUTURE RESEARCH........................................................... 60
REFERENCES ...................................................................................................... 61
iv
LIST OF TABLES
Table 1. The physicochemical properties of tannic acid.1 .................................... 7Table 2. Percentage of materials to prepare a stable 5% (w/w) tannic acid wax
emulsion. ........................................................................................... 7Table 3. The physicochemical properties of prothioconazole.2 ............................. 12Table 4. The physicochemical properties of tebuconazole.2.................................. 13Table 5. The tolerances of prothioconazole and tebuconazole residues on barley
in parts per million (ppm)................................................................... 14Table 6. Barley cultivars used in this research.4 ................................................. 15Table 7. Treatments for barley application. ....................................................... 16Table 8. Weather data during sampling time.3 ................................................... 18Table 9. The modifications of partitioning and buffering salts studied for the ex-
traction of tannic acid. ....................................................................... 25Table 10. The average percent recoveries of tannic acid for trials described in Table 9 25Table 11. The modifications of sorbents studied for the extraction of tannic acid.... 26Table 12. The average percent recoveries of tannic acid for trials described in Table
11. .................................................................................................... 27Table 13. The modifications of partitioning and buffering salts studied for the ex-
traction of prothioconazole and tebuconazole. ....................................... 34Table 14. The average percent recoveries of prothioconazole and tebuconazole for
trials described in Table 13. ................................................................ 35Table 15. The modifications of sorbents studied for the extraction of prothiocona-
zole and tebuconazole ......................................................................... 36Table 16. The average percent recoveries of prothioconazole and tebuconazole for
trials described in Table 15. ................................................................ 36Table 17. Formulations of tannic acid emulsions for sprayability and plant coverage
comparison. ....................................................................................... 43Table 18. Concentration of DON in ppm for Inwood field after treatment with 1%
and 3% emulsions in 2015.4 ................................................................. 47Table 19. SAS type III tests of fixed effects for Inwood field. ................................ 47Table 20. SAS least square means for Inwood field............................................... 47Table 21. Concentration of DON in ppm for Caswell field after treatment with 1%
and 3% emulsions in 2015.4 ................................................................. 48Table 22. SAS type III tests of fixed effects for Caswell field. ................................ 49Table 23. SAS least square means for Caswell field. ............................................. 49Table 24. Concentration of DON in ppm after treatment of greenhouse plants with
1% and 3% emulsions in 2015.4 ........................................................... 49Table 25. Concentration of DON in ppm after treatment with 5% emulsion in 2016.4 50Table 26. SAS type III tests of fixed effects for 2016 field trials. ............................ 51
v

Table 27. SAS least square means for 2016 field trials. ......................................... 51Table 28. Tannic acid residuals for Euonymus alata over a period of three weeks. ... 55Table 29. Tannic acid residuals for Liriope muscari over a period of four weeks. ..... 57
vi
LIST OF FIGURES
Figure 1. A barley spike fully blighted with FHB after inoculation with Fusariumspores.4 ........................................................................................... 2
Figure 2. The chemical structure of deoxynivalenol (DON). ................................ 3Figure 3. The chemical structure of tannic acid. ................................................ 6Figure 4. The chemical structure of TEA sterate. .............................................. 9Figure 5. The chemical structure of guar gum. .................................................. 9Figure 6. The chemical structure of prothioconazole........................................... 12Figure 7. The chemical structure of tebuconazole............................................... 13Figure 8. Plots of barley used for field trials at NCSU........................................ 16Figure 9. Inoculation of barley plots with infected corn kernels. .......................... 16Figure 10. Barley grain before (a) and after (b) grinding...................................... 20Figure 11. Description of the HPLC injection system........................................... 22Figure 12. A scheme of the optimum extraction procedure for tannic acid. ............ 27Figure 13. Tannic acid HPLC method development: initial measurement............... 29Figure 14. Tannic acid HPLC method development: gradient altered. ................... 30Figure 15. Tannic acid HPLC final method......................................................... 32Figure 16. A scheme of the optimum extraction procedure for prothioconazole and
tebuconazole. ................................................................................... 37Figure 17. Fungicide HPLC method development: initial measurement.................. 38Figure 18. Fungicide HPLC method development: gradient altered. ...................... 39Figure 19. Fungicide HPLC method development: flow rate decreased from 1 mL
min-1 to 0.800 mL min-1. .................................................................... 40Figure 20. Fungicide HPLC method development: formic acid removed from mo-
bile phases. ...................................................................................... 41Figure 21. Fungicide HPLC final method............................................................ 42Figure 22. Comparison of sprayability and plant coverage of emulsions 1 and 2
described in Table 17. ....................................................................... 44Figure 23. Comparison of sprayability and plant coverage of emulsions 3 and 4
described in Table 17. ....................................................................... 45Figure 24. Chromatogram of tannic acid calibration standards. ............................ 52Figure 25. Chromatogram of prothioconazole and tebuconazole calibration stan-
dards. .............................................................................................. 53Figure 26. Tannic acid treated Euonymus alata. .................................................. 55Figure 27. Tannic acid treated Euonymus alata results ........................................ 56Figure 28. Tannic acid treated Liriope muscari. .................................................. 56Figure 29. Tannic acid treated Liriope muscari results ......................................... 57
vii
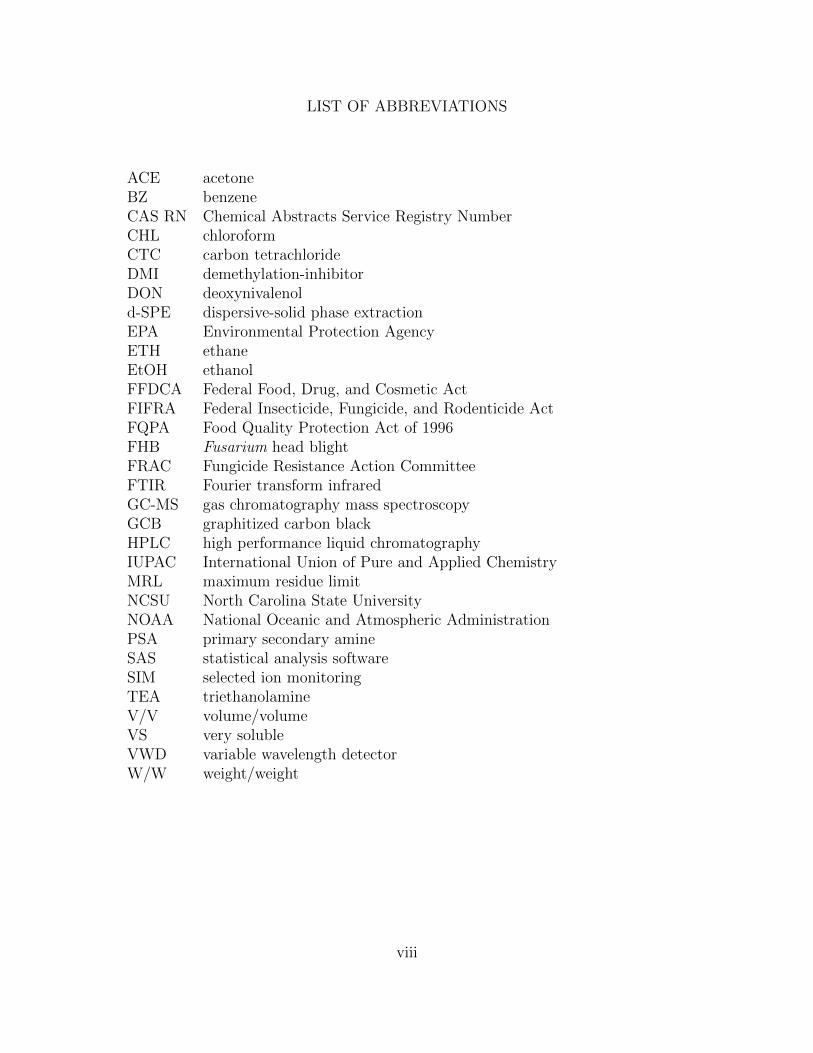
LIST OF ABBREVIATIONS
ACE acetoneBZ benzeneCAS RN Chemical Abstracts Service Registry NumberCHL chloroformCTC carbon tetrachlorideDMI demethylation-inhibitorDON deoxynivalenold-SPE dispersive-solid phase extractionEPA Environmental Protection AgencyETH ethaneEtOH ethanolFFDCA Federal Food, Drug, and Cosmetic ActFIFRA Federal Insecticide, Fungicide, and Rodenticide ActFQPA Food Quality Protection Act of 1996FHB Fusarium head blightFRAC Fungicide Resistance Action CommitteeFTIR Fourier transform infraredGC-MS gas chromatography mass spectroscopyGCB graphitized carbon blackHPLC high performance liquid chromatographyIUPAC International Union of Pure and Applied ChemistryMRL maximum residue limitNCSU North Carolina State UniversityNOAA National Oceanic and Atmospheric AdministrationPSA primary secondary amineSAS statistical analysis softwareSIM selected ion monitoringTEA triethanolamineV/V volume/volumeVS very solubleVWD variable wavelength detectorW/W weight/weight
viii
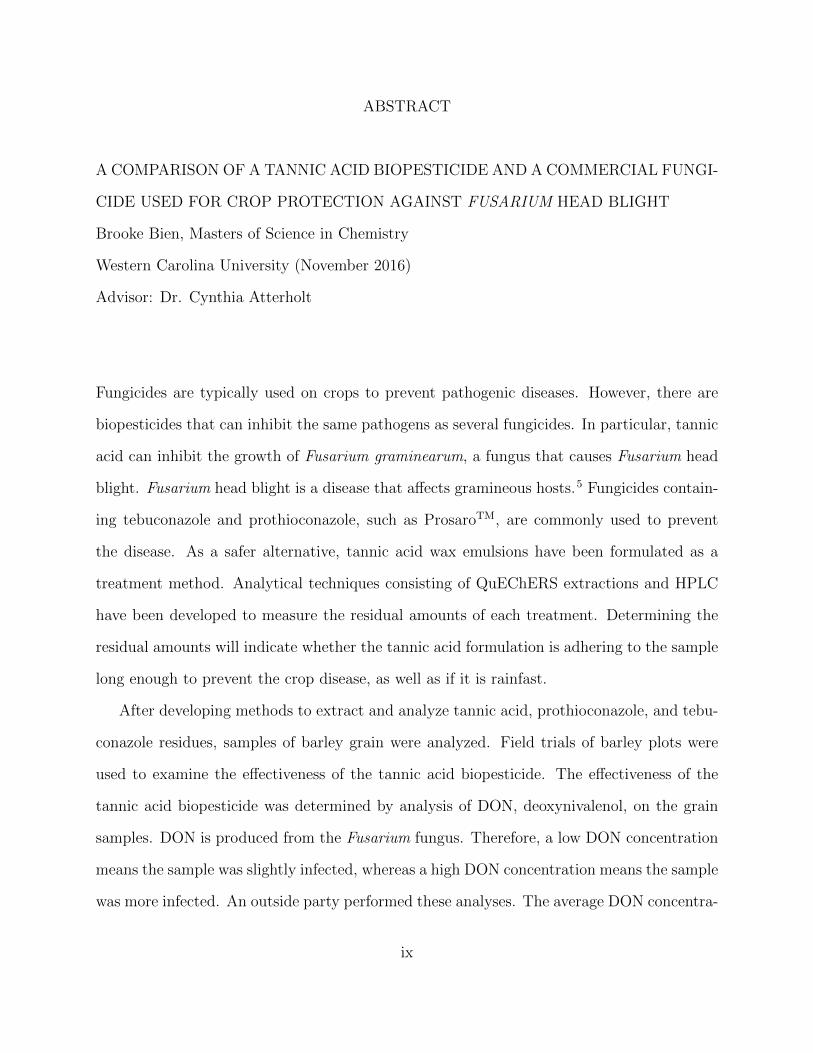
ABSTRACT
A COMPARISON OF A TANNIC ACID BIOPESTICIDE AND A COMMERCIAL FUNGI-
CIDE USED FOR CROP PROTECTION AGAINST FUSARIUM HEAD BLIGHT
Brooke Bien, Masters of Science in Chemistry
Western Carolina University (November 2016)
Advisor: Dr. Cynthia Atterholt
Fungicides are typically used on crops to prevent pathogenic diseases. However, there are
biopesticides that can inhibit the same pathogens as several fungicides. In particular, tannic
acid can inhibit the growth of Fusarium graminearum, a fungus that causes Fusarium head
blight. Fusarium head blight is a disease that affects gramineous hosts.5 Fungicides contain-
ing tebuconazole and prothioconazole, such as ProsaroTM, are commonly used to prevent
the disease. As a safer alternative, tannic acid wax emulsions have been formulated as a
treatment method. Analytical techniques consisting of QuEChERS extractions and HPLC
have been developed to measure the residual amounts of each treatment. Determining the
residual amounts will indicate whether the tannic acid formulation is adhering to the sample
long enough to prevent the crop disease, as well as if it is rainfast.
After developing methods to extract and analyze tannic acid, prothioconazole, and tebu-
conazole residues, samples of barley grain were analyzed. Field trials of barley plots were
used to examine the effectiveness of the tannic acid biopesticide. The effectiveness of the
tannic acid biopesticide was determined by analysis of DON, deoxynivalenol, on the grain
samples. DON is produced from the Fusarium fungus. Therefore, a low DON concentration
means the sample was slightly infected, whereas a high DON concentration means the sample
was more infected. An outside party performed these analyses. The average DON concentra-
ix
tions of the treatments seem to confirm that tannic acid treated barley is less infected than
untreated barley. However, SAS analysis confirms that there is no significant difference in
DON concentration of tannic acid treated barley and untreated barley. Grain samples from
these plots were also analyzed for tannic acid or prothioconazole and tebuconazole residue.
It was hypothesized that since treatment occurred prior to grain formation, that little to no
residue would be present on the grain at harvest. After analysis, it was determined that this
hypothesis was correct.
How long the biopesticide would remain on the plant was also examined. Tannic acid
was present on Euonymus alata up to three weeks and on Liriope muscari for up to four
weeks. This time period is ideal considering the plant only needs to be protected during a
specific growth stage lasting approximately 10 days. Additionally, there would be little to no
residue present on the grain at harvest. Overall, this research found that tannic acid could
be effectively used to protect crops from FHB.
x
CHAPTER ONE: INTRODUCTION
1.1 Biopesticides
The Environmental Protection Agency (EPA) defines biopesticides as “certain types of pes-
ticides derived from such natural materials as animals, plants, bacteria, and certain miner-
als.”6 Three categories of biopesticides include biochemical, plant-incorporated protectancts,
and biocontrol organisms. Biopesticides are naturally occurring compounds that are target
specific and have low toxicity to nontarget organisms.7 Even though biopesticides are not
harmful to farmworkers and are ideal in organic agriculture, they are “only 3 % of the global
annual market for pesticides, but currently increasing.”7
Pesticides are registered by federally mandated statutes such as the Federal Insecticide,
Fungicide, and Rodenticide Act (FIFRA) and the Federal Food, Drug, and Cosmetic Act
(FFDCA). The Food Quality Protection Act of 1996 (FQPA) changed the EPA regulation
standards of pesticides.8 Pesticides are heavily regulated to prevent harm to human health
and to the environment, as well as to develop specific levels that pesticides cannot exceed.8
Some biopesticides are considered “minimum risk pesticides” and are exempt from FIFRA
registration.6
Organically grown crops are not treated with traditional pesticides and are instead treated
with non-toxic biological pesticides, or biopesticides, that are derived from natural sources.
Biopesticides are not as harmful to humans and the environment as traditional pesticides.
Conventional pesticides contain compounds that are toxic to humans through ingestion or
inhalation. Even though these compounds are harmful when ingested, they are used as
pesticides. “Most applied pesticides find their way as residue in the environment into the
terrestrial and aquatic food chains where they undergo concentration and exert potential,
long term, adverse health effects.”9
1
1.2 Fusarium Head Blight
Fusarium Head Blight (FHB), also called ear blight or scab, is a fungal disease that affects
gramineous hosts such as wheat, barley, and other cereal grains. “F. graminearum is the
predominant FHB pathogen in much of the world,”10 perhaps because it produces several
different mycotoxins and the negative impact that it has on crop quality and yield.11 The
pathogen affects the gramineous host after coming into contact with the head of the plant.
The pathogen spore will germinate there if conditions are suitable.10 Once crops are infected
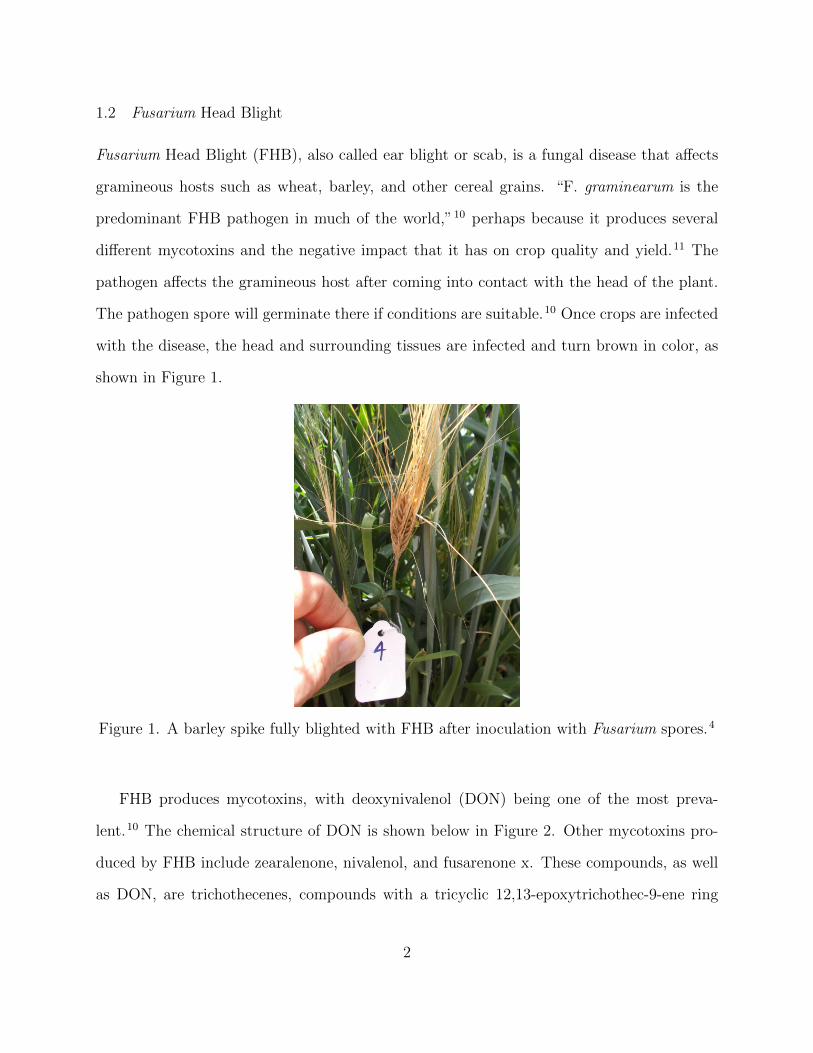
with the disease, the head and surrounding tissues are infected and turn brown in color, as
shown in Figure 1.
Figure 1. A barley spike fully blighted with FHB after inoculation with Fusarium spores.4
FHB produces mycotoxins, with deoxynivalenol (DON) being one of the most preva-
lent.10 The chemical structure of DON is shown below in Figure 2. Other mycotoxins pro-
duced by FHB include zearalenone, nivalenol, and fusarenone x. These compounds, as well
as DON, are trichothecenes, compounds with a tricyclic 12,13-epoxytrichothec-9-ene ring
2
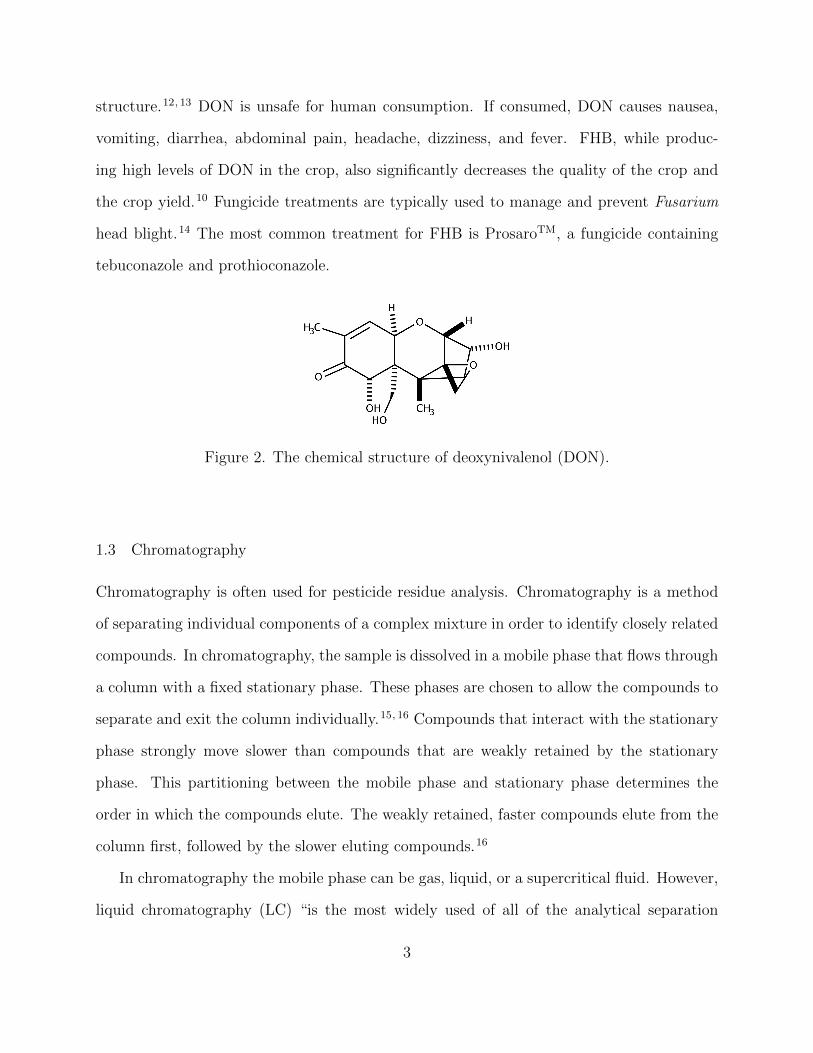
structure.12, 13 DON is unsafe for human consumption. If consumed, DON causes nausea,
vomiting, diarrhea, abdominal pain, headache, dizziness, and fever. FHB, while produc-
ing high levels of DON in the crop, also significantly decreases the quality of the crop and
the crop yield.10 Fungicide treatments are typically used to manage and prevent Fusarium
head blight.14 The most common treatment for FHB is ProsaroTM, a fungicide containing
tebuconazole and prothioconazole.
Figure 2. The chemical structure of deoxynivalenol (DON).
1.3 Chromatography
Chromatography is often used for pesticide residue analysis. Chromatography is a method
of separating individual components of a complex mixture in order to identify closely related
compounds. In chromatography, the sample is dissolved in a mobile phase that flows through
a column with a fixed stationary phase. These phases are chosen to allow the compounds to
separate and exit the column individually.15, 16 Compounds that interact with the stationary
phase strongly move slower than compounds that are weakly retained by the stationary
phase. This partitioning between the mobile phase and stationary phase determines the
order in which the compounds elute. The weakly retained, faster compounds elute from the
column first, followed by the slower eluting compounds.16
In chromatography the mobile phase can be gas, liquid, or a supercritical fluid. However,
liquid chromatography (LC) “is the most widely used of all of the analytical separation
3

techniques.”16 This is because of its sensitivity, automation, quantitative determination,
and its almost universal applicability. Further information will be discussed in section 5.2,
including HPLC operations and specifics about the instrument used for this research.
4
CHAPTER TWO: TANNIC ACID BIOPESTICIDE
2.1 Tannic Acid
Tannins, including tannic acid, are plant polyphenols that contribute to the color and taste
of food and beverages.17 Polyphenols are secondary metabolites of plants and are often found
in foods, such as fruits, vegetables, and cereals, as well as beverages such as wine, coffee,
and tea.18 Polyphenols are “involved in defense against ultraviolet radiation or aggression
by pathogens, parasites and predators.”19 Tannins are only one type of polyphenols; other
types include phenolic acids, flavonoids, stilbenes, and lignans. Overall there are more than
8,000 polyphenols currently known.19
Polyphenols exist in free and bound forms. Flavanols compose the majority of free
phenolics, and phenolic acids are the main bound phenolics.20 Bound phenolics are esterified
to cell-wall polymers, whereas free forms are not.21 It is suggested that phenolic acids are
absorbed when consumed and have antioxidant activity that may reduce the risk of diseases,
cancers, and aging.20 Polyphenols, free and bound, that naturally occur in cereal grains
exist primarily in the outer layers (husk, pericarp, testa, and aleurone cells). However,
some also exist in the endosperm and germ.21, 22 Since tannic acid naturally occurs in cereal
grains, it supports the fact that a tannic acid biopesticide is a safer alternative treatment for
FHB prevention. It also suggests that residues remaining on the grain are safe for human
consumption.
Hans-Rudolf5 suggested that tannic acid, a naturally occurring compound, inhibits the
growth of the Fusarium pathogen. As early as 1913, Knudson reported tannic acid to
be toxic to many fungi, even at low concentrations.5 This discovery began with the idea
that botanicals are used for medicinal purposes and have high tannin and phenolic content,
which have antioxidant and antimicrobial activity.5 Based on this research, tannic acid wax
5
emulsions have been formulated to apply to crops, specifically barley, as an alternative
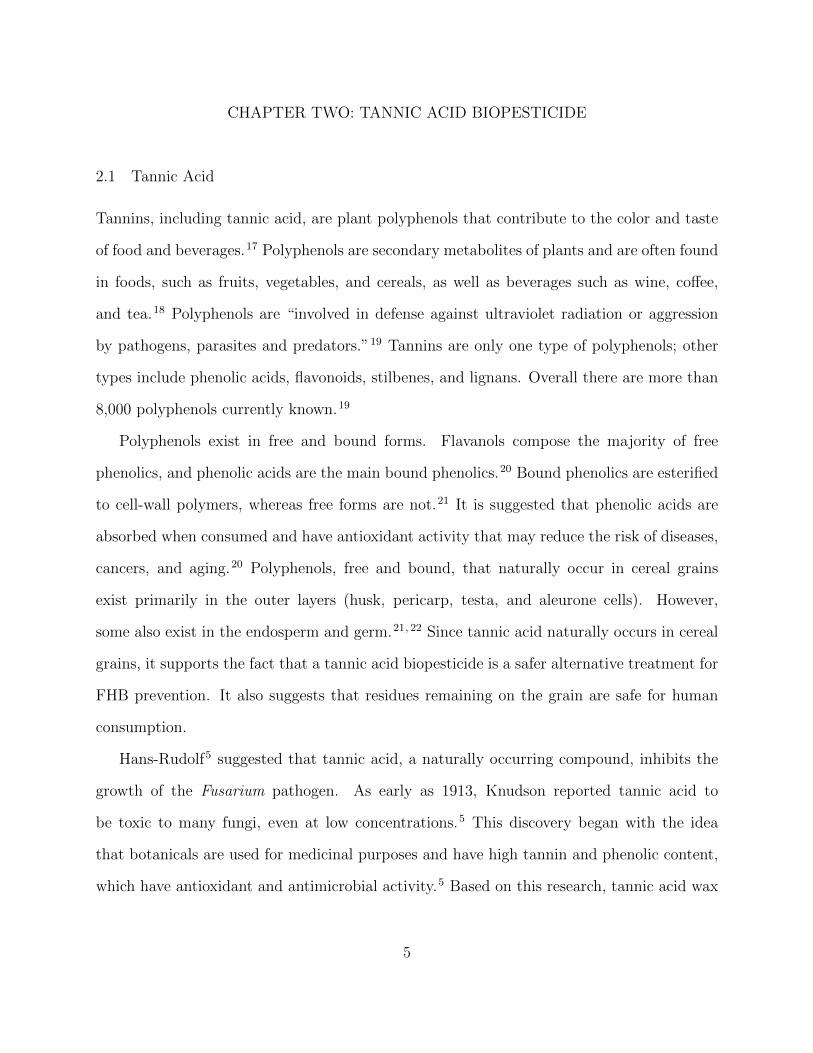
treatment method for FHB. The physicochemical properties of tannic acid are included in
Table 1. The chemical structure of tannic acid is shown below in Figure 3.
Figure 3. The chemical structure of tannic acid.
2.2 Wax Emulsion
In order for tannic acid to remain on the crop for a lengthy period of time, it is incorporated
into a wax emulsion of food grade materials. To prepare an emulsion, the following materials
were required: water, vegetable oil, tannic acid, an emulsifier, soy wax, and guar gum. The
following sections describe the purpose of each material. Table 2 shows the percentages
of each material needed to prepare a stable 5% (w/w) tannic acid wax emulsion. Past
6
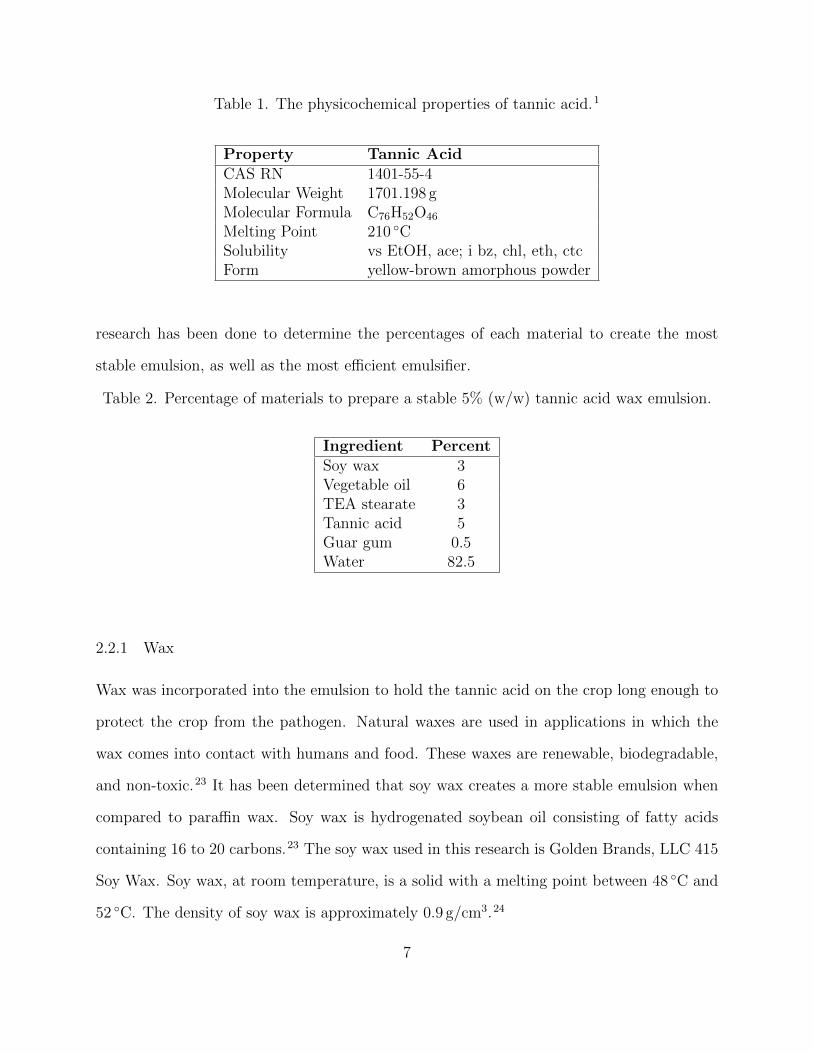
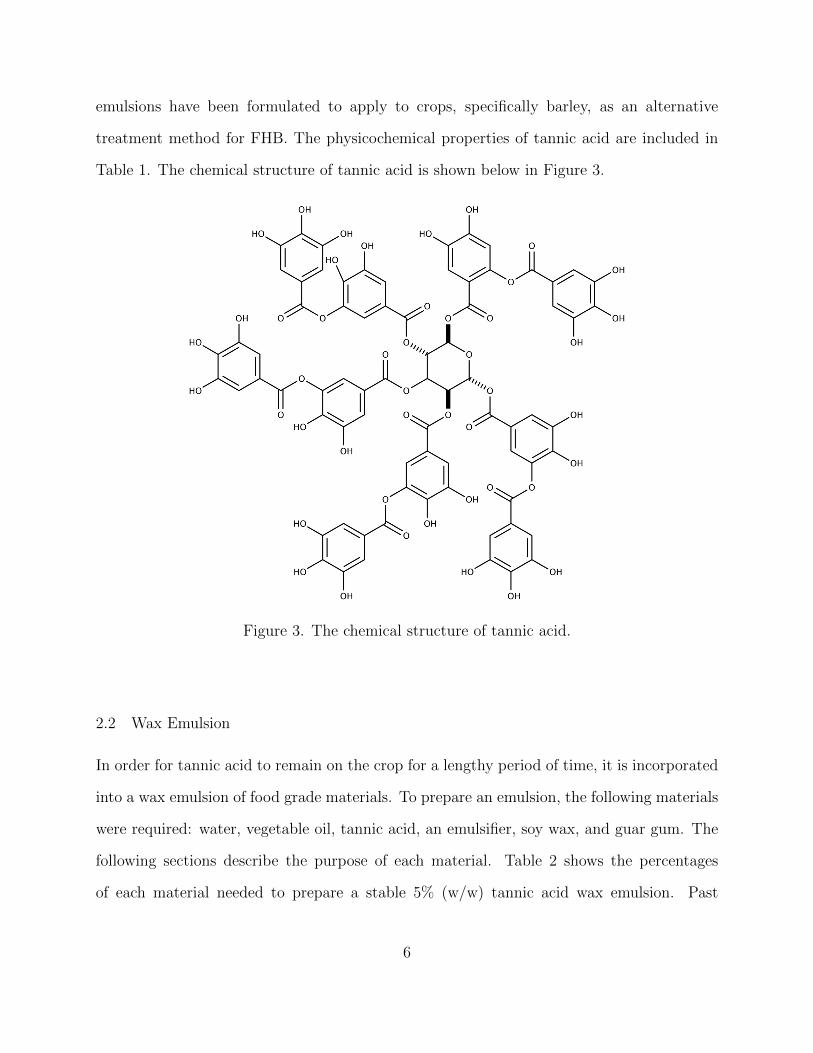
Table 1. The physicochemical properties of tannic acid.1
Property Tannic AcidCAS RN 1401-55-4Molecular Weight 1701.198 gMolecular Formula C76H52O46
Melting Point 210 ◦CSolubility vs EtOH, ace; i bz, chl, eth, ctcForm yellow-brown amorphous powder
research has been done to determine the percentages of each material to create the most
stable emulsion, as well as the most efficient emulsifier.
Table 2. Percentage of materials to prepare a stable 5% (w/w) tannic acid wax emulsion.
Ingredient PercentSoy wax 3Vegetable oil 6TEA stearate 3Tannic acid 5Guar gum 0.5Water 82.5
2.2.1 Wax
Wax was incorporated into the emulsion to hold the tannic acid on the crop long enough to
protect the crop from the pathogen. Natural waxes are used in applications in which the
wax comes into contact with humans and food. These waxes are renewable, biodegradable,
and non-toxic.23 It has been determined that soy wax creates a more stable emulsion when
compared to paraffin wax. Soy wax is hydrogenated soybean oil consisting of fatty acids
containing 16 to 20 carbons.23 The soy wax used in this research is Golden Brands, LLC 415
Soy Wax. Soy wax, at room temperature, is a solid with a melting point between 48 ◦C and
52 ◦C. The density of soy wax is approximately 0.9 g/cm3.24
7
2.2.2 Emulsifier
An emulsifier is used to stabilize the emulsion by preventing the components of the mixture
from separating. Span60, sorbitan monostearate, was used as the emulsifier for the tannic
acid emulsion used in the 2015 field trials. For the 2016 emulsions, triethanolamine (TEA)
stearate was used as the emulsifier. TEA stearate has a molecular weight of 433.67 g/mol
and a molecular formula of C24H51NO5.24 The chemical structure of TEA stearate is shown
in Figure 4.
TEA stearate was synthesized from TEA and stearic acid according to the following
equation:
N(CH2CH2OH)3 + CH3(CH2)16COOH −−→ NH(CH2CH2OH)3CH3(CH2)16COO
A stoichiometric amount of stearic acid was added to a beaker and heated at 140 ◦C
until completely melted. While stirring, TEA was added dropwise and the temperature was
slightly increased to form an isotropic solution. The properties of an isotropic solution are
uniform in all directions. The isotropic solution was transferred to an aluminum boat where
it cooled and hardened overnight. TEA stearate is a white solid that can be ground to a
powder using a mortar and pestle and stored in a glass jar until use as the emulsifier of the
emulsion.24
2.2.3 Guar Gum
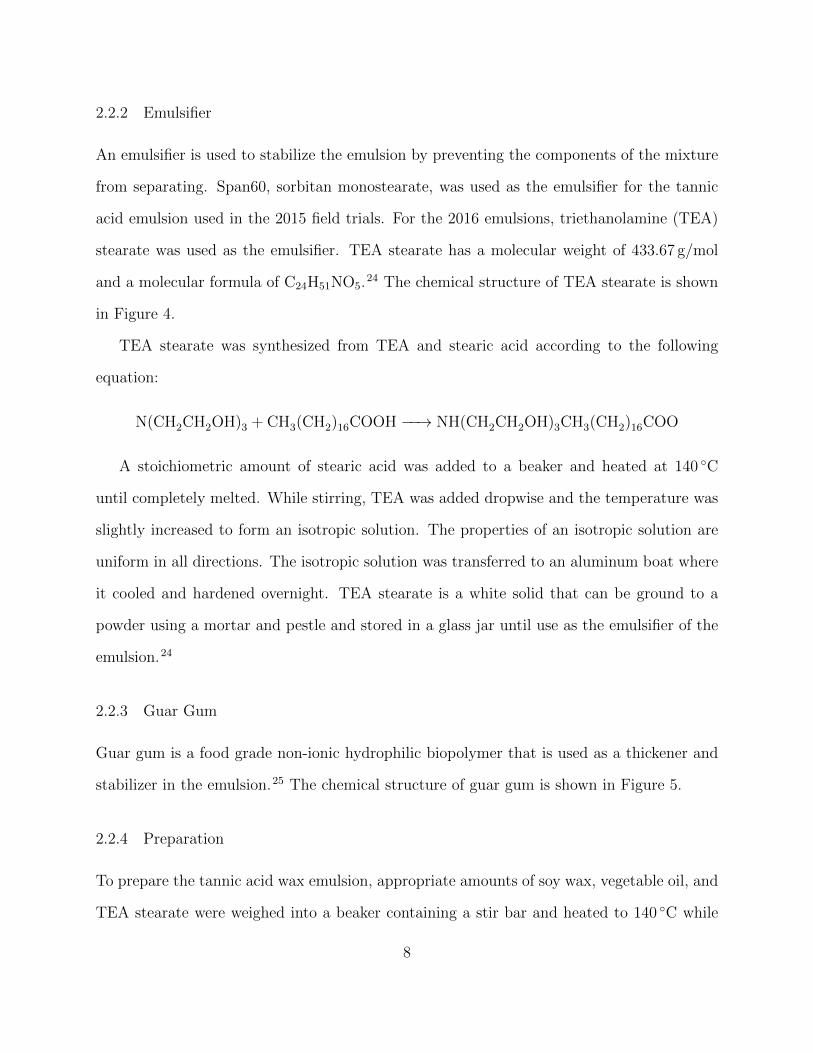
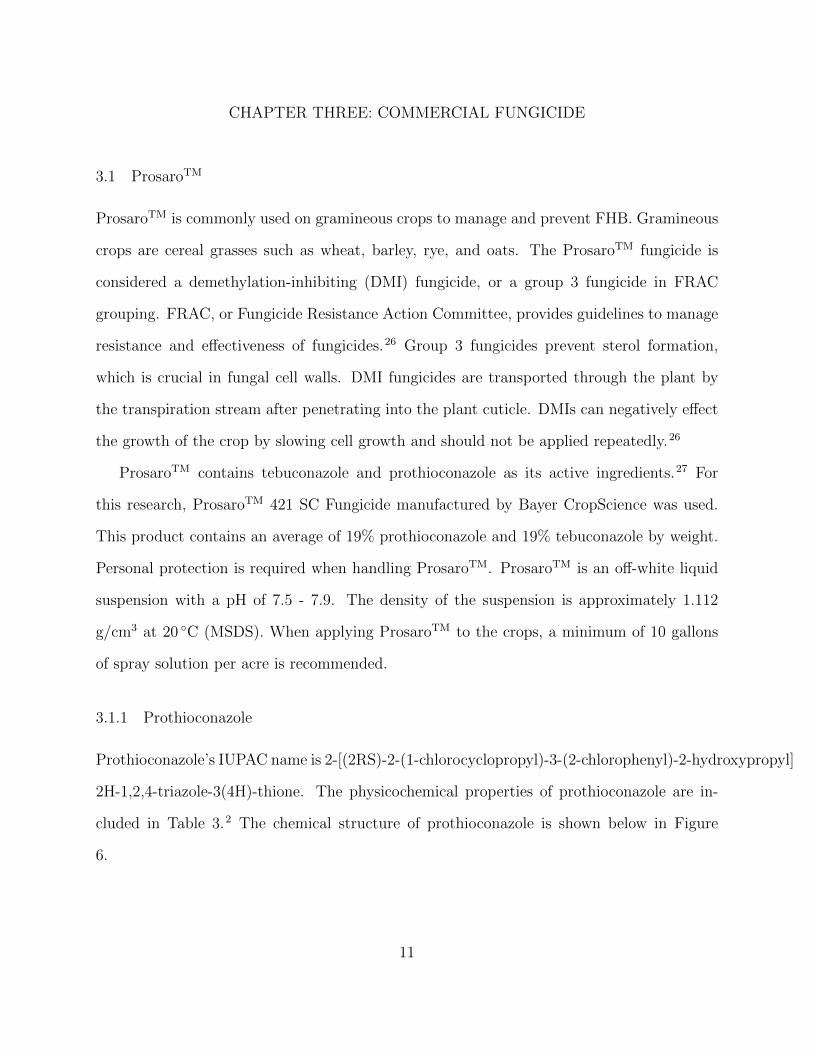
Guar gum is a food grade non-ionic hydrophilic biopolymer that is used as a thickener and
stabilizer in the emulsion.25 The chemical structure of guar gum is shown in Figure 5.
2.2.4 Preparation
To prepare the tannic acid wax emulsion, appropriate amounts of soy wax, vegetable oil, and
TEA stearate were weighed into a beaker containing a stir bar and heated to 140 ◦C while
8
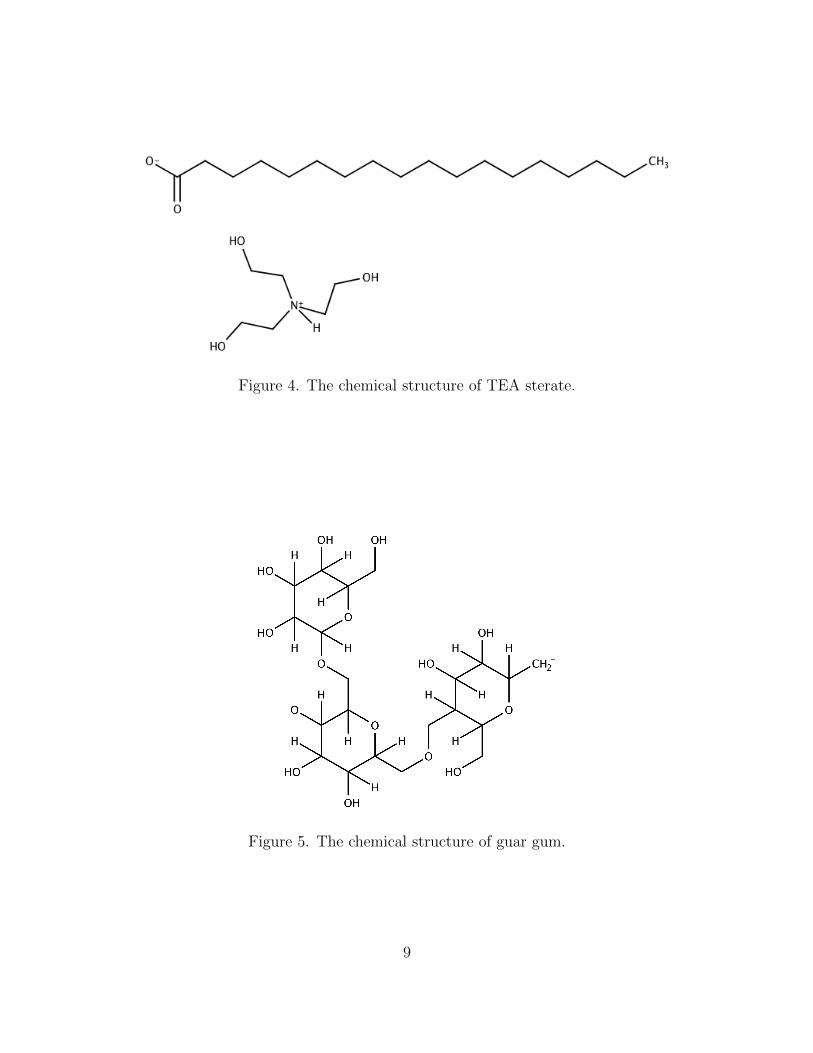
Figure 4. The chemical structure of TEA sterate.
Figure 5. The chemical structure of guar gum.
9
stirring at a slow speed. The tannic acid was measured in a separate beaker. Enough water
was added to the tannic acid to dissolve the solid, and the remaining water was added to
the wax mixture. Once the water was added, the stir rate was increased to medium speed,
and the tannic acid solution was added. The stir rate was then increased to high speed and
the appropriate amount of guar gum was added very slowly. The mixture was removed from
the hot plate and homogenized immediately using a high shear homogenizer. The emulsion
was homogenized every 20 min until it reached room temperature; it was then stored in the
refrigerator at 4 ◦C until use.
10
CHAPTER THREE: COMMERCIAL FUNGICIDE
3.1 ProsaroTM
ProsaroTM is commonly used on gramineous crops to manage and prevent FHB. Gramineous
crops are cereal grasses such as wheat, barley, rye, and oats. The ProsaroTM fungicide is
considered a demethylation-inhibiting (DMI) fungicide, or a group 3 fungicide in FRAC
grouping. FRAC, or Fungicide Resistance Action Committee, provides guidelines to manage
resistance and effectiveness of fungicides.26 Group 3 fungicides prevent sterol formation,
which is crucial in fungal cell walls. DMI fungicides are transported through the plant by
the transpiration stream after penetrating into the plant cuticle. DMIs can negatively effect
the growth of the crop by slowing cell growth and should not be applied repeatedly.26
ProsaroTM contains tebuconazole and prothioconazole as its active ingredients.27 For
this research, ProsaroTM 421 SC Fungicide manufactured by Bayer CropScience was used.
This product contains an average of 19% prothioconazole and 19% tebuconazole by weight.
Personal protection is required when handling ProsaroTM. ProsaroTM is an off-white liquid
suspension with a pH of 7.5 - 7.9. The density of the suspension is approximately 1.112
g/cm3 at 20 ◦C (MSDS). When applying ProsaroTM to the crops, a minimum of 10 gallons
of spray solution per acre is recommended.
3.1.1 Prothioconazole
Prothioconazole’s IUPAC name is 2-[(2RS)-2-(1-chlorocyclopropyl)-3-(2-chlorophenyl)-2-hydroxypropyl]
2H-1,2,4-triazole-3(4H)-thione. The physicochemical properties of prothioconazole are in-
cluded in Table 3.2 The chemical structure of prothioconazole is shown below in Figure
6.
11
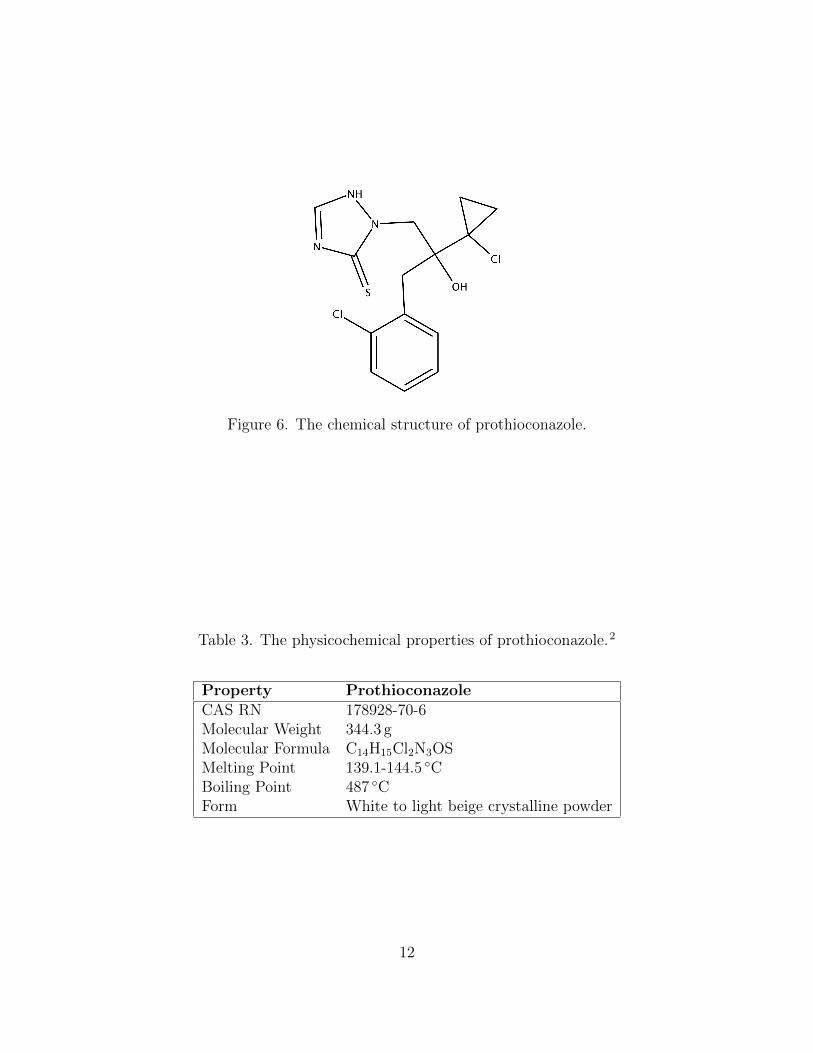
Figure 6. The chemical structure of prothioconazole.
Table 3. The physicochemical properties of prothioconazole.2
Property ProthioconazoleCAS RN 178928-70-6Molecular Weight 344.3 gMolecular Formula C14H15Cl2N3OSMelting Point 139.1-144.5 ◦CBoiling Point 487 ◦CForm White to light beige crystalline powder
12
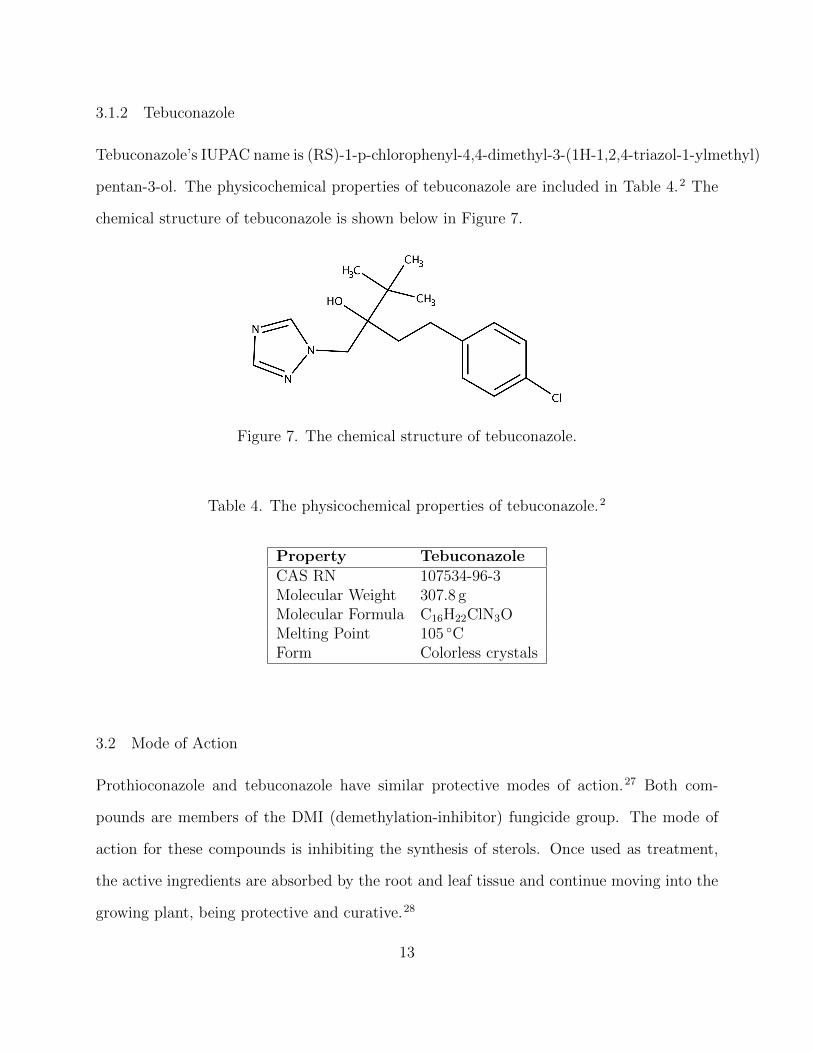
3.1.2 Tebuconazole
Tebuconazole’s IUPAC name is (RS)-1-p-chlorophenyl-4,4-dimethyl-3-(1H-1,2,4-triazol-1-ylmethyl)
pentan-3-ol. The physicochemical properties of tebuconazole are included in Table 4.2 The
chemical structure of tebuconazole is shown below in Figure 7.
Figure 7. The chemical structure of tebuconazole.
Table 4. The physicochemical properties of tebuconazole.2
Property TebuconazoleCAS RN 107534-96-3Molecular Weight 307.8 gMolecular Formula C16H22ClN3OMelting Point 105 ◦CForm Colorless crystals
3.2 Mode of Action
Prothioconazole and tebuconazole have similar protective modes of action.27 Both com-
pounds are members of the DMI (demethylation-inhibitor) fungicide group. The mode of
action for these compounds is inhibiting the synthesis of sterols. Once used as treatment,
the active ingredients are absorbed by the root and leaf tissue and continue moving into the
growing plant, being protective and curative.28
13
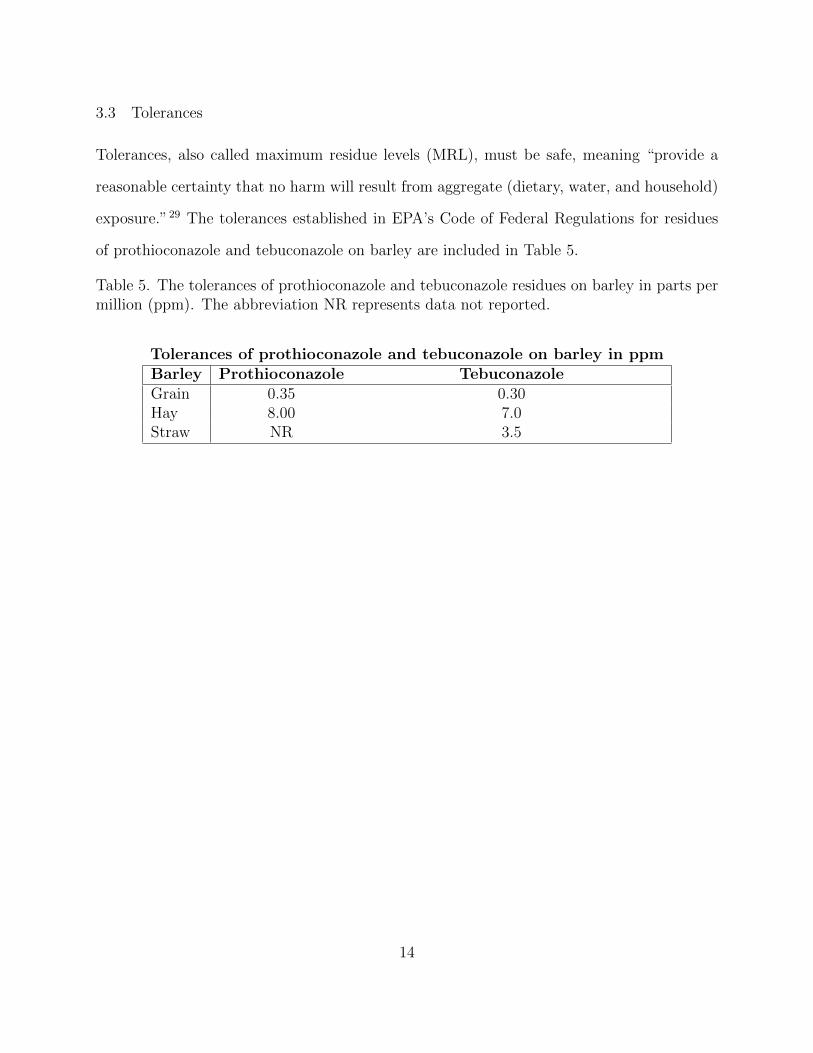
3.3 Tolerances
Tolerances, also called maximum residue levels (MRL), must be safe, meaning “provide a
reasonable certainty that no harm will result from aggregate (dietary, water, and household)
exposure.”29 The tolerances established in EPA’s Code of Federal Regulations for residues
of prothioconazole and tebuconazole on barley are included in Table 5.
Table 5. The tolerances of prothioconazole and tebuconazole residues on barley in parts permillion (ppm). The abbreviation NR represents data not reported.
Tolerances of prothioconazole and tebuconazole on barley in ppmBarley Prothioconazole TebuconazoleGrain 0.35 0.30Hay 8.00 7.0Straw NR 3.5
14
CHAPTER FOUR: APPLICATION STUDIES
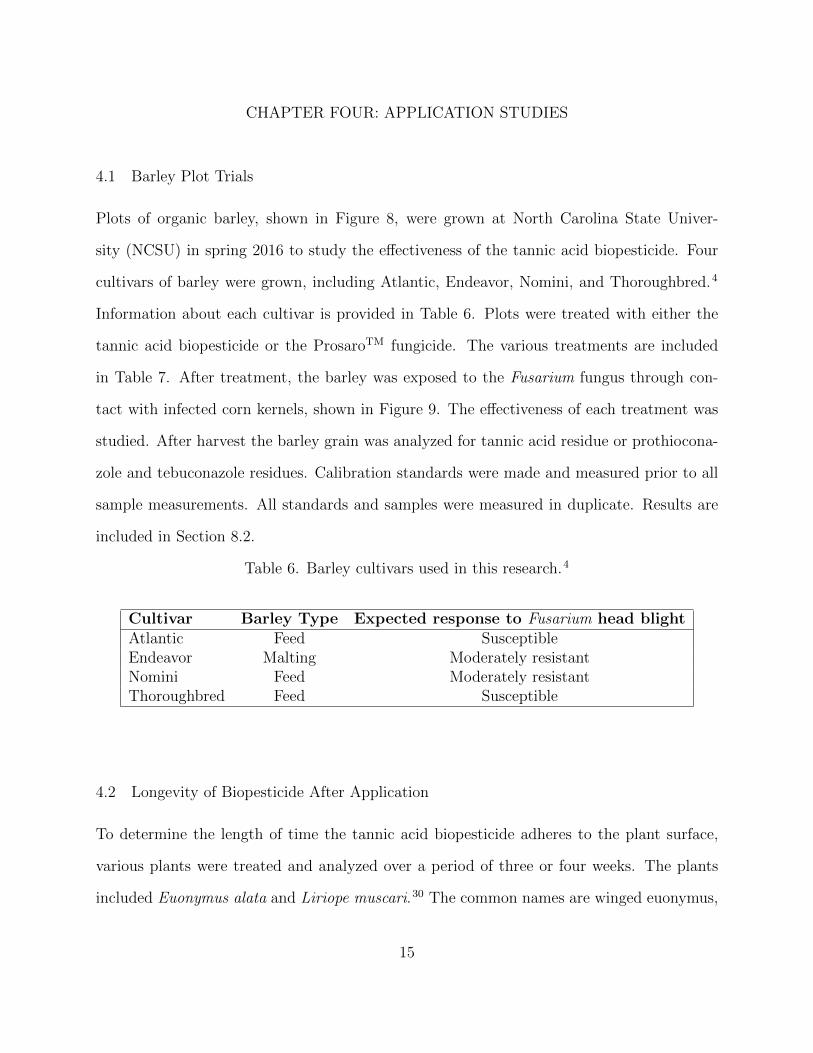
4.1 Barley Plot Trials
Plots of organic barley, shown in Figure 8, were grown at North Carolina State Univer-
sity (NCSU) in spring 2016 to study the effectiveness of the tannic acid biopesticide. Four
cultivars of barley were grown, including Atlantic, Endeavor, Nomini, and Thoroughbred.4
Information about each cultivar is provided in Table 6. Plots were treated with either the
tannic acid biopesticide or the ProsaroTM fungicide. The various treatments are included
in Table 7. After treatment, the barley was exposed to the Fusarium fungus through con-
tact with infected corn kernels, shown in Figure 9. The effectiveness of each treatment was
studied. After harvest the barley grain was analyzed for tannic acid residue or prothiocona-
zole and tebuconazole residues. Calibration standards were made and measured prior to all
sample measurements. All standards and samples were measured in duplicate. Results are
included in Section 8.2.
Table 6. Barley cultivars used in this research.4
Cultivar Barley Type Expected response to Fusarium head blightAtlantic Feed SusceptibleEndeavor Malting Moderately resistantNomini Feed Moderately resistantThoroughbred Feed Susceptible
4.2 Longevity of Biopesticide After Application
To determine the length of time the tannic acid biopesticide adheres to the plant surface,
various plants were treated and analyzed over a period of three or four weeks. The plants
included Euonymus alata and Liriope muscari.30 The common names are winged euonymus,
15
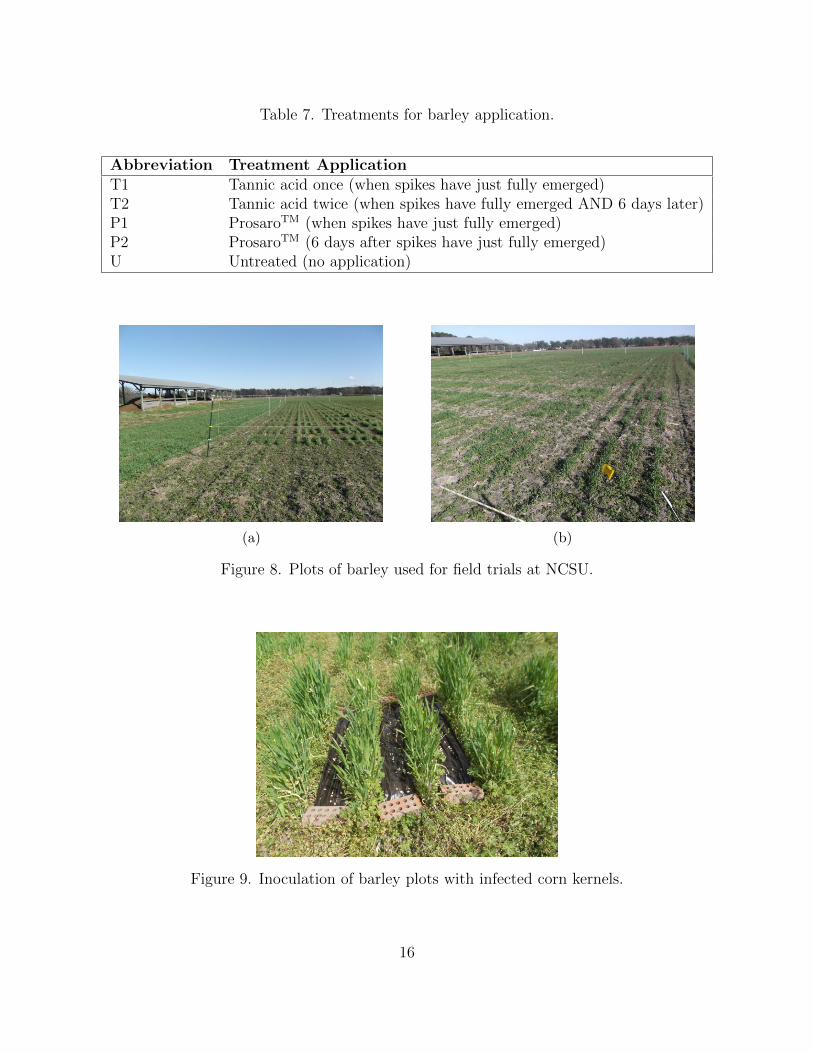
Table 7. Treatments for barley application.
Abbreviation Treatment ApplicationT1 Tannic acid once (when spikes have just fully emerged)T2 Tannic acid twice (when spikes have fully emerged AND 6 days later)P1 ProsaroTM (when spikes have just fully emerged)P2 ProsaroTM (6 days after spikes have just fully emerged)U Untreated (no application)
(a) (b)
Figure 8. Plots of barley used for field trials at NCSU.
Figure 9. Inoculation of barley plots with infected corn kernels.
16
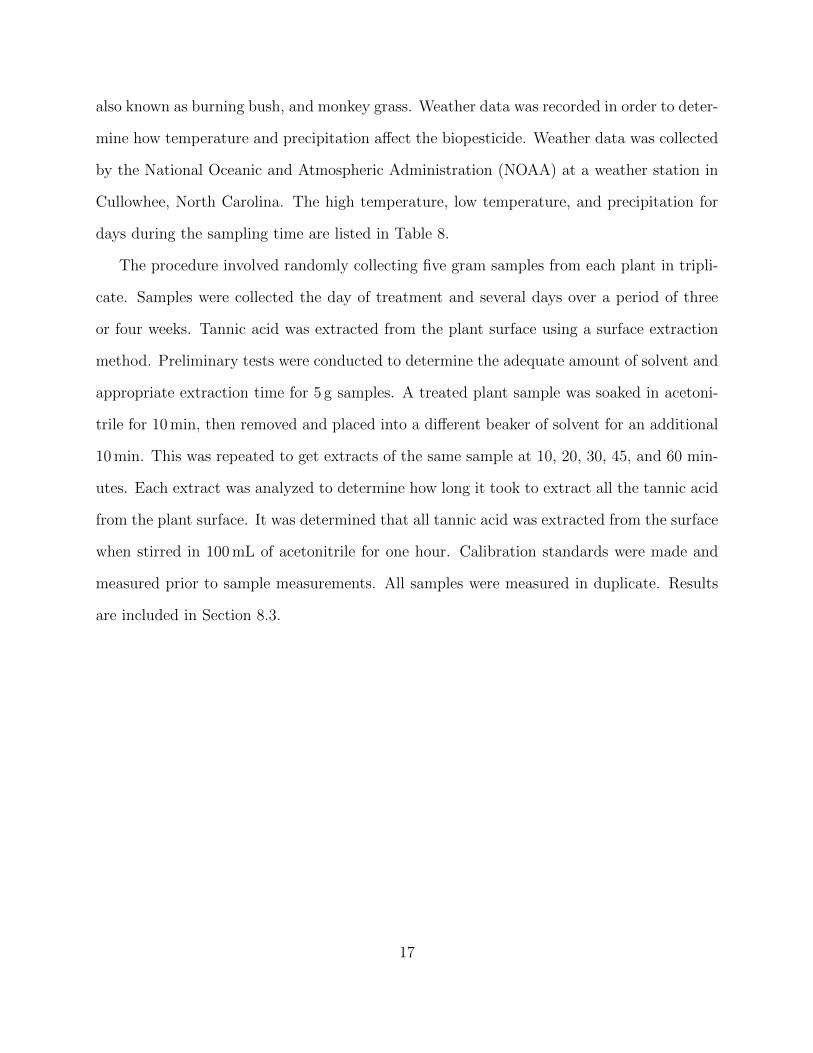
also known as burning bush, and monkey grass. Weather data was recorded in order to deter-
mine how temperature and precipitation affect the biopesticide. Weather data was collected
by the National Oceanic and Atmospheric Administration (NOAA) at a weather station in
Cullowhee, North Carolina. The high temperature, low temperature, and precipitation for
days during the sampling time are listed in Table 8.
The procedure involved randomly collecting five gram samples from each plant in tripli-
cate. Samples were collected the day of treatment and several days over a period of three
or four weeks. Tannic acid was extracted from the plant surface using a surface extraction
method. Preliminary tests were conducted to determine the adequate amount of solvent and
appropriate extraction time for 5 g samples. A treated plant sample was soaked in acetoni-
trile for 10 min, then removed and placed into a different beaker of solvent for an additional
10 min. This was repeated to get extracts of the same sample at 10, 20, 30, 45, and 60 min-
utes. Each extract was analyzed to determine how long it took to extract all the tannic acid
from the plant surface. It was determined that all tannic acid was extracted from the surface
when stirred in 100 mL of acetonitrile for one hour. Calibration standards were made and
measured prior to sample measurements. All samples were measured in duplicate. Results
are included in Section 8.3.
17
Table 8. Weather data during sampling time.3
Date High Temp. (◦C) Low Temp. (◦C) Precipitation (in)Aug. 27 92 64 0.00Aug. 28 90 64 0.00Aug. 29 87 58 0.02Aug. 30 89 58 0.00Aug. 31 87 59 0.00Sept. 1 89 60 1.09Sept. 2 87 63 0.09Sept. 3 75 56 0.01Sept. 4 82 57 0.00Sept. 5 83 58 0.00Sept. 6 86 58 0.00Sept. 7 87 56 0.00Sept. 8 89 56 0.00Sept. 9 89 56 0.00Sept. 10 88 58 0.00Sept. 11 86 60 0.12Sept. 12 85 57 0.00Sept. 13 87 57 0.00Sept. 14 87 57 0.00Sept. 15 88 59 0.00Sept. 16 89 59 0.00Sept. 17 89 61 0.02Sept. 18 82 60 0.00Sept. 19 73 62 0.21Sept. 20 82 58 0.00Sept. 21 84 55 0.00Sept. 22 87 55 0.00Sept. 23 86 58 0.00Sept. 24 86 56 0.00Sept. 25 88 56 0.00Sept. 26 90 58 0.00Sept. 27 87 63 0.22Sept. 28 79 59 0.28Sept. 29 82 47 0.00Sept. 30 75 47 0.00Oct. 1 73 44 0.00Oct. 2 72 45 0.00
18
CHAPTER FIVE: EXPERIMENTAL DESIGN
5.1 QuEChERS Extraction
The QuEChERS extraction method was used for analysis of residual tannic acid or the fungi-
cide compounds, prothioconazole and tebuconazole. QuEChERS is an acronym for quick,
easy, cheap, effective, rugged, and safe.31 The QuEChERS method was developed in 2003 by
Anastassiades as a multipesticide extraction method that removes matrix compounds. This
method was used to shorten the process of extraction and cleanup.32, 33 The QuEChERS
method uses very little solvent and time.
5.1.1 Procedure
The original extraction method developed by Anastassiades33 includes the sample being
homogenized and mixed with acetonitrile. Magnesium sulfate and sodium chloride are added
for a salting out step and the removal of water. The sample is then vortexed and centrifuged.
After centrifugation, an aliquot is mixed with primary secondary amine (PSA) bonded silica
for a dispersive-solid phase extraction (d-SPE) step. After centrifugation, an aliquot is
analyzed.33
Many variations of this method now exist. There are variations using different solvents,
salts, and sorbents. Also many modifications of the original method have been made to
accommodate different types of samples. For this research, a modified method for samples
with little to no water content was used. This method includes adding water to the sample
during the process of homogenization.
19
5.1.2 Homogenization
Recommendations from literature for homogenizing the sample include air-drying or freeze-
drying the sample prior to homogenization.19 Multiple techniques have previously been used
to homogenize the sample, such as using a blender, mortar and pestle, grinder, or high sheer
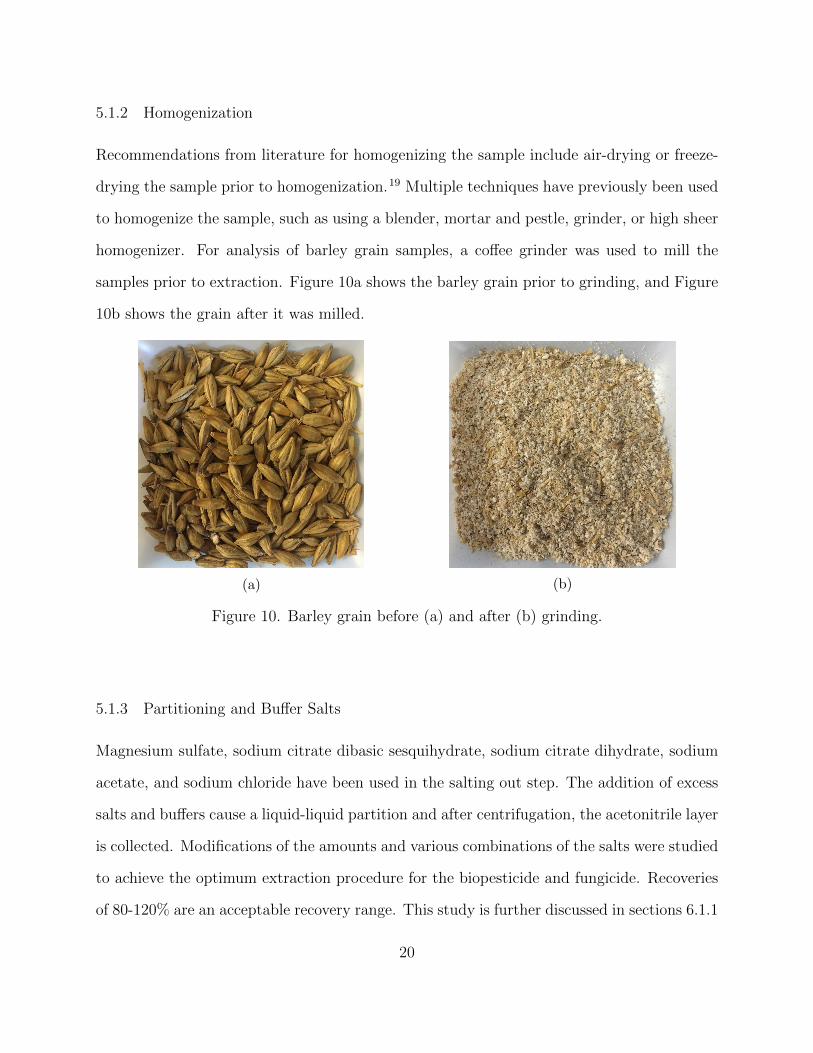
homogenizer. For analysis of barley grain samples, a coffee grinder was used to mill the
samples prior to extraction. Figure 10a shows the barley grain prior to grinding, and Figure
10b shows the grain after it was milled.
(a) (b)
Figure 10. Barley grain before (a) and after (b) grinding.
5.1.3 Partitioning and Buffer Salts
Magnesium sulfate, sodium citrate dibasic sesquihydrate, sodium citrate dihydrate, sodium
acetate, and sodium chloride have been used in the salting out step. The addition of excess
salts and buffers cause a liquid-liquid partition and after centrifugation, the acetonitrile layer
is collected. Modifications of the amounts and various combinations of the salts were studied
to achieve the optimum extraction procedure for the biopesticide and fungicide. Recoveries
of 80-120% are an acceptable recovery range. This study is further discussed in sections 6.1.1
20
and 7.1.1.
5.1.4 D-SPE
The next step is a dispersive-solid phase extraction (d-SPE). In this step, sorbents such as
primary secondary amine (PSA) bonded silica, C18, and graphitized carbon black (GCB) are
used to remove fatty acids and sugars from the sample.31 The PSA is used to remove polar
components of the matrix, such as sugars and organic acids.33 C18 removes lipid material
that has been coextracted from the matrix.34 GCB is used to remove pigment from the
matrix. Modifications of the amounts and various combinations of the sorbents were studied
to achieve the optimum procedure for the cleanup step for both the biopesticide and the
fungicide. Recoveries of 80-120% are an acceptable recovery range. This study is further
discussed in sections 6.1.2 and 7.1.2.
5.2 Operations of HPLC
For this research, analysis was performed with an Agilent 1220 Infinity HPLC featuring a
dual channel gradient pump, autosampler, and variable wavelength detector to analyze tannic
acid, prothioconazole, and tebuconazole. The LC was equipped with a 250 mm i.d., 5 µm
C18 column. As mentioned in section 1.3, chromatography is used to separate components
in a mixture by forcing a mobile phase through an immiscible stationary phase fixed inside
the column.16 The following sections further discuss how an HPLC operates.
5.2.1 Solvent Delivery System
The solvent is delivered from the solvent bottles, through the injector, column, and detector
by pumps operated by pistons made of sapphire. The solvents are degassed by passing
through an online vacuum degasser.35, 36
21
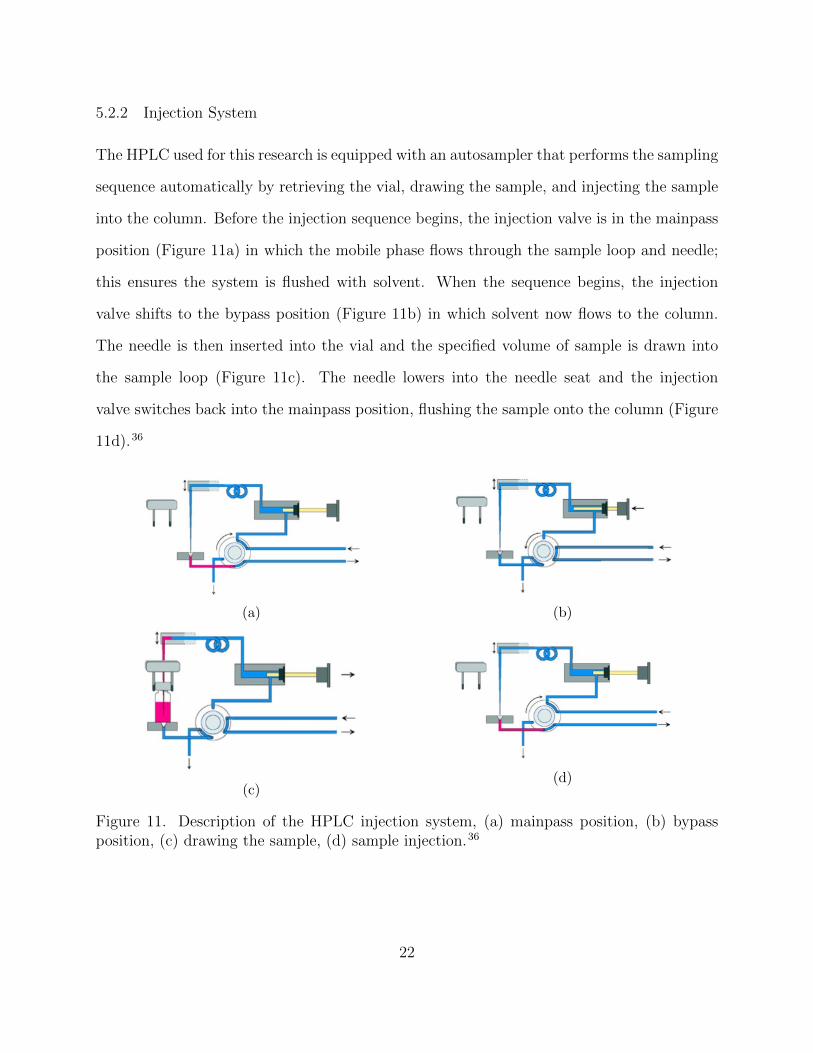
5.2.2 Injection System
The HPLC used for this research is equipped with an autosampler that performs the sampling
sequence automatically by retrieving the vial, drawing the sample, and injecting the sample
into the column. Before the injection sequence begins, the injection valve is in the mainpass
position (Figure 11a) in which the mobile phase flows through the sample loop and needle;
this ensures the system is flushed with solvent. When the sequence begins, the injection
valve shifts to the bypass position (Figure 11b) in which solvent now flows to the column.
The needle is then inserted into the vial and the specified volume of sample is drawn into
the sample loop (Figure 11c). The needle lowers into the needle seat and the injection
valve switches back into the mainpass position, flushing the sample onto the column (Figure
11d).36
(a) (b)
(c)(d)
Figure 11. Description of the HPLC injection system, (a) mainpass position, (b) bypassposition, (c) drawing the sample, (d) sample injection.36
22
5.2.3 Separation
Separation in the column occurs by the interaction, or partitioning, of the analyte between
the mobile phase and stationary phase. The polar phase attracts polar compounds and the
nonpolar phase attracts nonpolar compounds. If the stationary phase is polar, nonpolar
compounds will elute first followed by the polar compounds, and vice versa.35
5.2.4 Column Information
Analytical columns for HPLC are typically 5 to 25 cm in length with a diameter of 3 to
5 mm. The packing material of the column is usually 3 or 5 µm. The packing material is
often alumina, a synthetic resin, an ion-exchange resin, or silica which is the most common.16
The Agilent 1220 Infinity LC used in this research is equipped with a 250 mm C18 column
with 5 µm packing. A C18 column is an octadecyl column coated with a long-chain, saturated
hydrocarbon consisting of 18 carbons.35
5.2.5 Detector Description
There are many types of detectors used with liquid chromatography. Some of the most
common include absorbance, fluorescence, electrochemical, refractive index, FTIR, and mass
spectrometry.16 The Agilent 1220 Infinity LC used in this research is equipped with a variable
wavelength detector (VWD) that covers the wavelength range from 195 to 650 nm.
23
CHAPTER SIX: METHOD DEVELOPMENT FOR TANNIC ACID ANALYSIS
6.1 Optimization of Extraction Method
As mentioned above in section 5.1.1, the extraction procedure has been modified to achieve
the method with the highest percent recovery for the compounds of interest. The following
sections discuss in detail the modifications to each step of the procedure to achieve the
highest percent recovery of tannic acid from the sample.
6.1.1 Partitioning and Buffer Salts
Modifications of the original QuEChERS method studied in this research included vari-
ous combinations and amounts of magnesium sulfate, sodium citrate dibasic sesquihydrate,
sodium citrate dihydrate, sodium acetate, and sodium chloride in the extraction step. In
each trial, 5 mL of a 250 ppm standard diluted with ethanol was added to a 50 mL conical
tube and mixed with 10 mL of ultrapure water and 10 mL acetonitrile. The salts and buffers,
according to Table 9, were then added, the tube was immediately shaken and vortexed for
one minute. After centrifugation the solution was analyzed to determine the percent recovery
for this step. Each trial was repeated twice and each extract was measured in duplicate.
Table 9 lists the combinations and amounts of salts and buffers used to determine the
procedure with the highest percent recovery. The average percent recoveries are included in
Table 10. The original extraction procedure from Anastassiades developed method was first
tested.33 Trials 1 through 8 are modifications from other literature.
The optimum method for this step was determined to be trial 1. The percent recovery for
this trial was 82.62%, which is within the acceptable range. This trial used 4 g of magnesium
sulfate, 0.5 g of sodium citrate dibasic sesquihydrate, 1 g sodium citrate dihydrate and 1 g
sodium chloride.
24
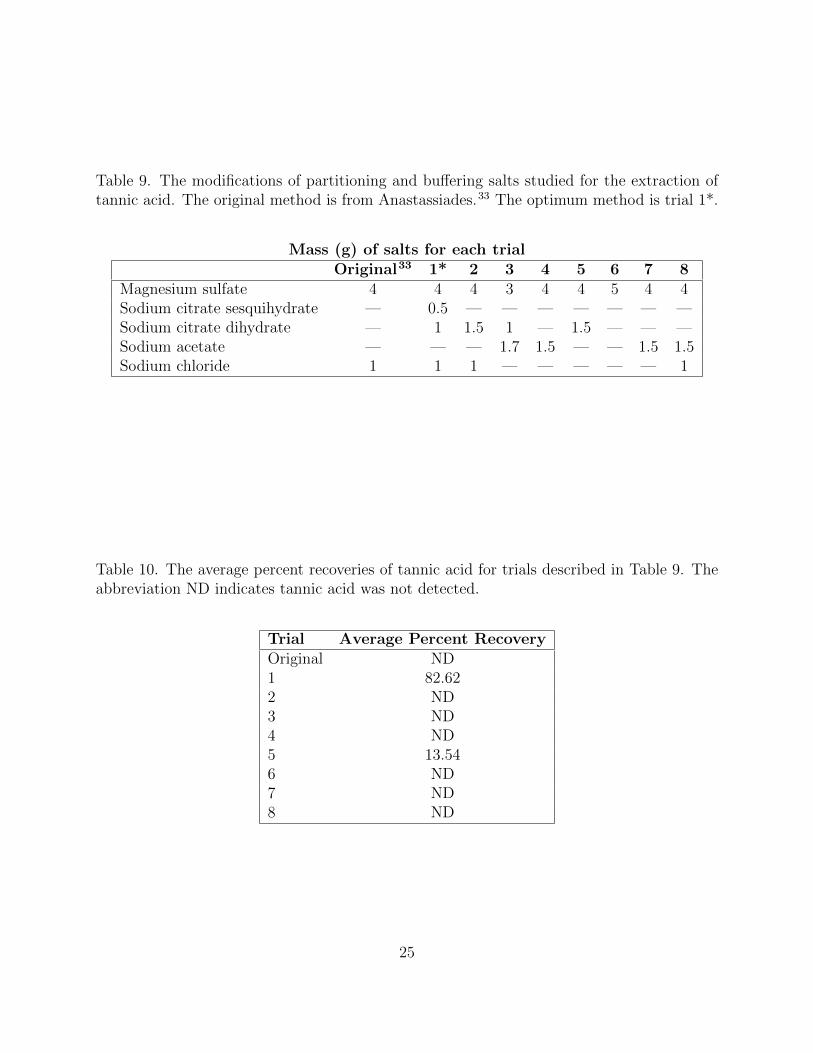
Table 9. The modifications of partitioning and buffering salts studied for the extraction oftannic acid. The original method is from Anastassiades.33 The optimum method is trial 1*.
Mass (g) of salts for each trialOriginal33 1* 2 3 4 5 6 7 8
Magnesium sulfate 4 4 4 3 4 4 5 4 4Sodium citrate sesquihydrate — 0.5 — — — — — — —Sodium citrate dihydrate — 1 1.5 1 — 1.5 — — —Sodium acetate — — — 1.7 1.5 — — 1.5 1.5Sodium chloride 1 1 1 — — — — — 1
Table 10. The average percent recoveries of tannic acid for trials described in Table 9. Theabbreviation ND indicates tannic acid was not detected.
Trial Average Percent RecoveryOriginal ND1 82.622 ND3 ND4 ND5 13.546 ND7 ND8 ND
25
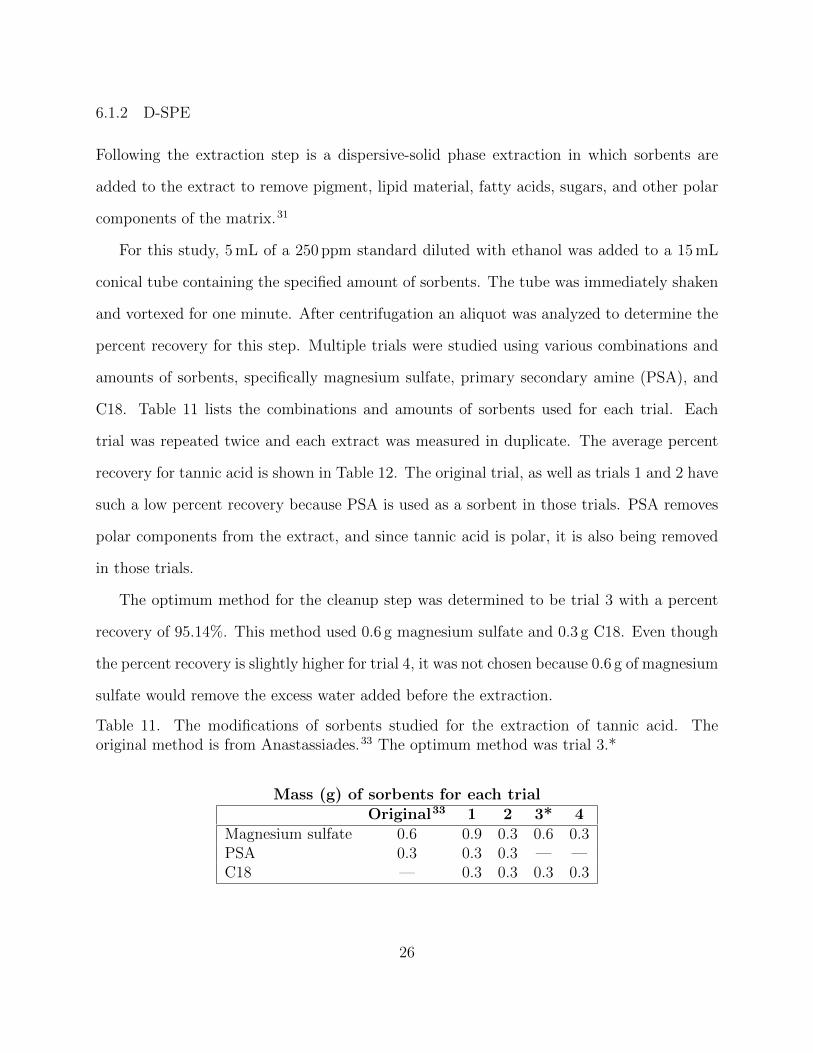
6.1.2 D-SPE
Following the extraction step is a dispersive-solid phase extraction in which sorbents are
added to the extract to remove pigment, lipid material, fatty acids, sugars, and other polar
components of the matrix.31
For this study, 5 mL of a 250 ppm standard diluted with ethanol was added to a 15 mL
conical tube containing the specified amount of sorbents. The tube was immediately shaken
and vortexed for one minute. After centrifugation an aliquot was analyzed to determine the
percent recovery for this step. Multiple trials were studied using various combinations and
amounts of sorbents, specifically magnesium sulfate, primary secondary amine (PSA), and
C18. Table 11 lists the combinations and amounts of sorbents used for each trial. Each
trial was repeated twice and each extract was measured in duplicate. The average percent
recovery for tannic acid is shown in Table 12. The original trial, as well as trials 1 and 2 have
such a low percent recovery because PSA is used as a sorbent in those trials. PSA removes
polar components from the extract, and since tannic acid is polar, it is also being removed
in those trials.
The optimum method for the cleanup step was determined to be trial 3 with a percent
recovery of 95.14%. This method used 0.6 g magnesium sulfate and 0.3 g C18. Even though
the percent recovery is slightly higher for trial 4, it was not chosen because 0.6 g of magnesium
sulfate would remove the excess water added before the extraction.
Table 11. The modifications of sorbents studied for the extraction of tannic acid. Theoriginal method is from Anastassiades.33 The optimum method was trial 3.*
Mass (g) of sorbents for each trialOriginal33 1 2 3* 4
Magnesium sulfate 0.6 0.9 0.3 0.6 0.3PSA 0.3 0.3 0.3 — —C18 — 0.3 0.3 0.3 0.3
26
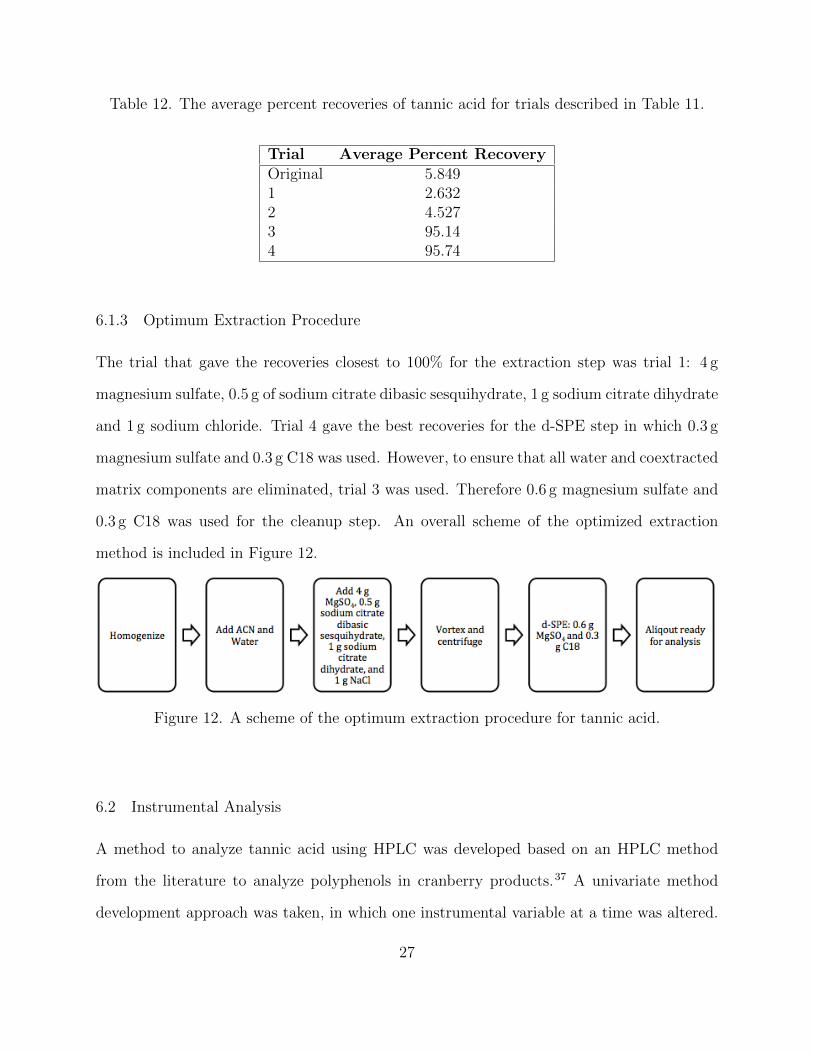
Table 12. The average percent recoveries of tannic acid for trials described in Table 11.
Trial Average Percent RecoveryOriginal 5.8491 2.6322 4.5273 95.144 95.74
6.1.3 Optimum Extraction Procedure
The trial that gave the recoveries closest to 100% for the extraction step was trial 1: 4 g
magnesium sulfate, 0.5 g of sodium citrate dibasic sesquihydrate, 1 g sodium citrate dihydrate
and 1 g sodium chloride. Trial 4 gave the best recoveries for the d-SPE step in which 0.3 g
magnesium sulfate and 0.3 g C18 was used. However, to ensure that all water and coextracted
matrix components are eliminated, trial 3 was used. Therefore 0.6 g magnesium sulfate and
0.3 g C18 was used for the cleanup step. An overall scheme of the optimized extraction
method is included in Figure 12.
Figure 12. A scheme of the optimum extraction procedure for tannic acid.
6.2 Instrumental Analysis
A method to analyze tannic acid using HPLC was developed based on an HPLC method
from the literature to analyze polyphenols in cranberry products.37 A univariate method
development approach was taken, in which one instrumental variable at a time was altered.
27
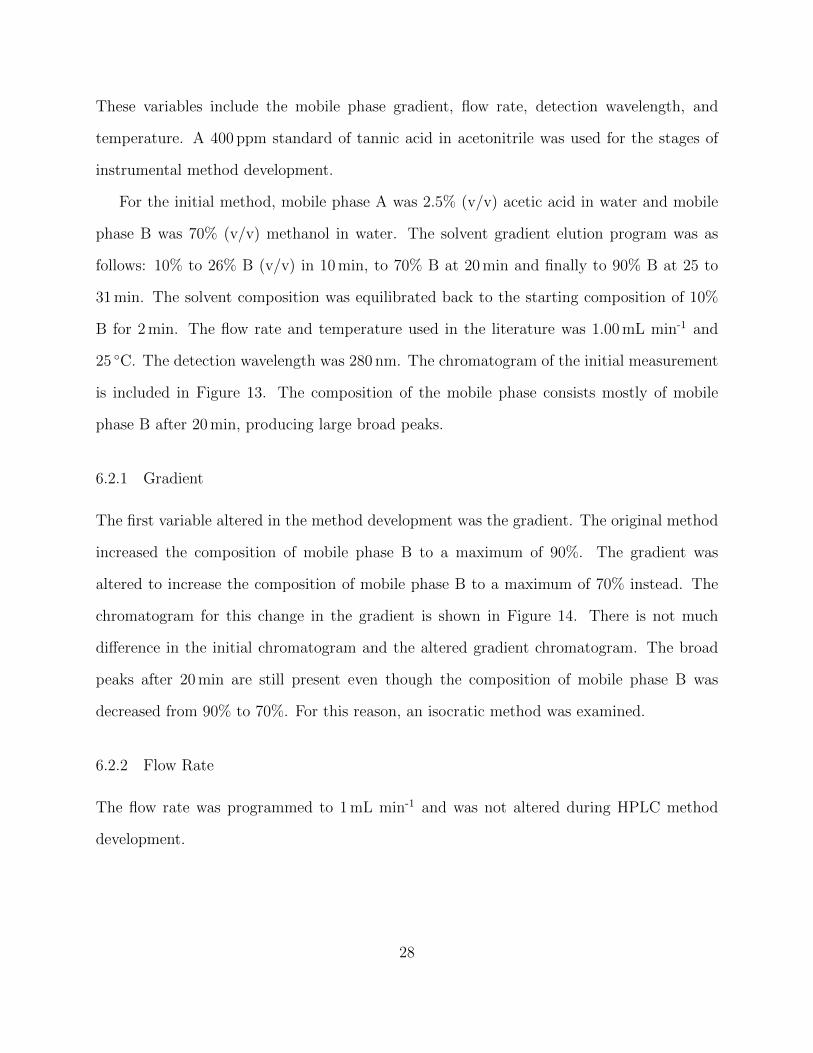
These variables include the mobile phase gradient, flow rate, detection wavelength, and
temperature. A 400 ppm standard of tannic acid in acetonitrile was used for the stages of
instrumental method development.
For the initial method, mobile phase A was 2.5% (v/v) acetic acid in water and mobile
phase B was 70% (v/v) methanol in water. The solvent gradient elution program was as
follows: 10% to 26% B (v/v) in 10 min, to 70% B at 20 min and finally to 90% B at 25 to
31 min. The solvent composition was equilibrated back to the starting composition of 10%
B for 2 min. The flow rate and temperature used in the literature was 1.00 mL min-1 and
25 ◦C. The detection wavelength was 280 nm. The chromatogram of the initial measurement
is included in Figure 13. The composition of the mobile phase consists mostly of mobile
phase B after 20 min, producing large broad peaks.
6.2.1 Gradient
The first variable altered in the method development was the gradient. The original method
increased the composition of mobile phase B to a maximum of 90%. The gradient was
altered to increase the composition of mobile phase B to a maximum of 70% instead. The
chromatogram for this change in the gradient is shown in Figure 14. There is not much
difference in the initial chromatogram and the altered gradient chromatogram. The broad
peaks after 20 min are still present even though the composition of mobile phase B was
decreased from 90% to 70%. For this reason, an isocratic method was examined.
6.2.2 Flow Rate
The flow rate was programmed to 1 mL min-1 and was not altered during HPLC method
development.
28
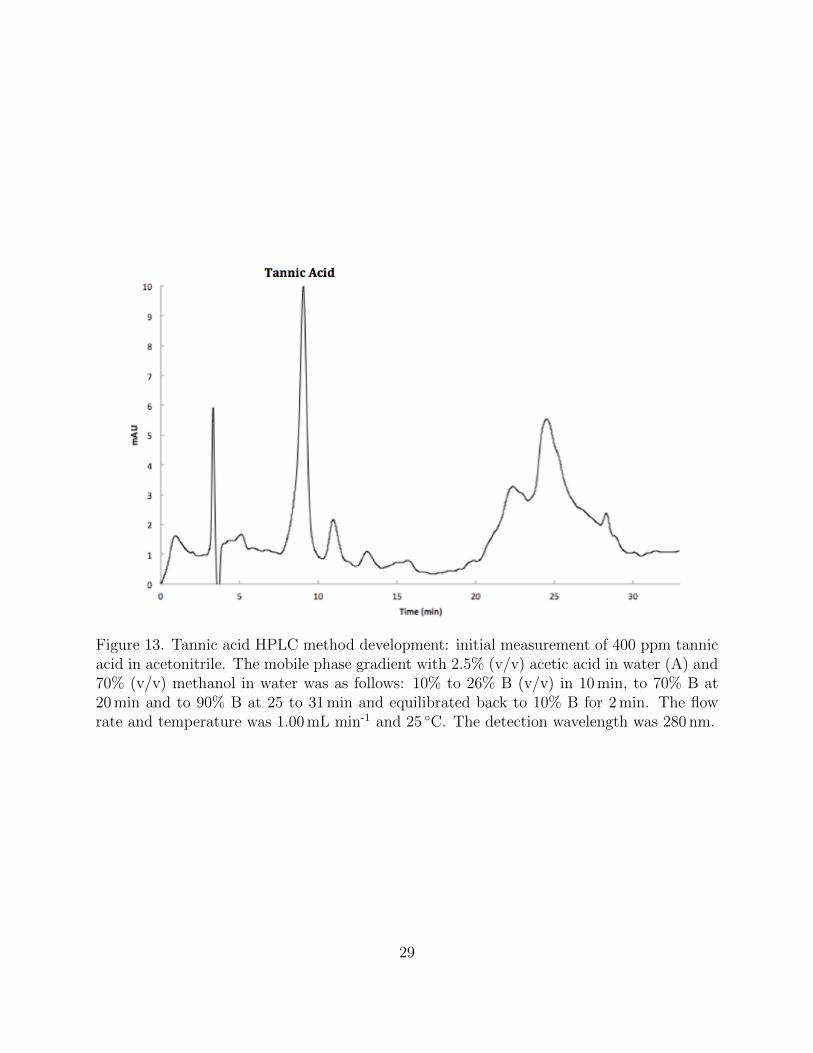
Figure 13. Tannic acid HPLC method development: initial measurement of 400 ppm tannicacid in acetonitrile. The mobile phase gradient with 2.5% (v/v) acetic acid in water (A) and70% (v/v) methanol in water was as follows: 10% to 26% B (v/v) in 10 min, to 70% B at20 min and to 90% B at 25 to 31 min and equilibrated back to 10% B for 2 min. The flowrate and temperature was 1.00 mL min-1 and 25 ◦C. The detection wavelength was 280 nm.
29
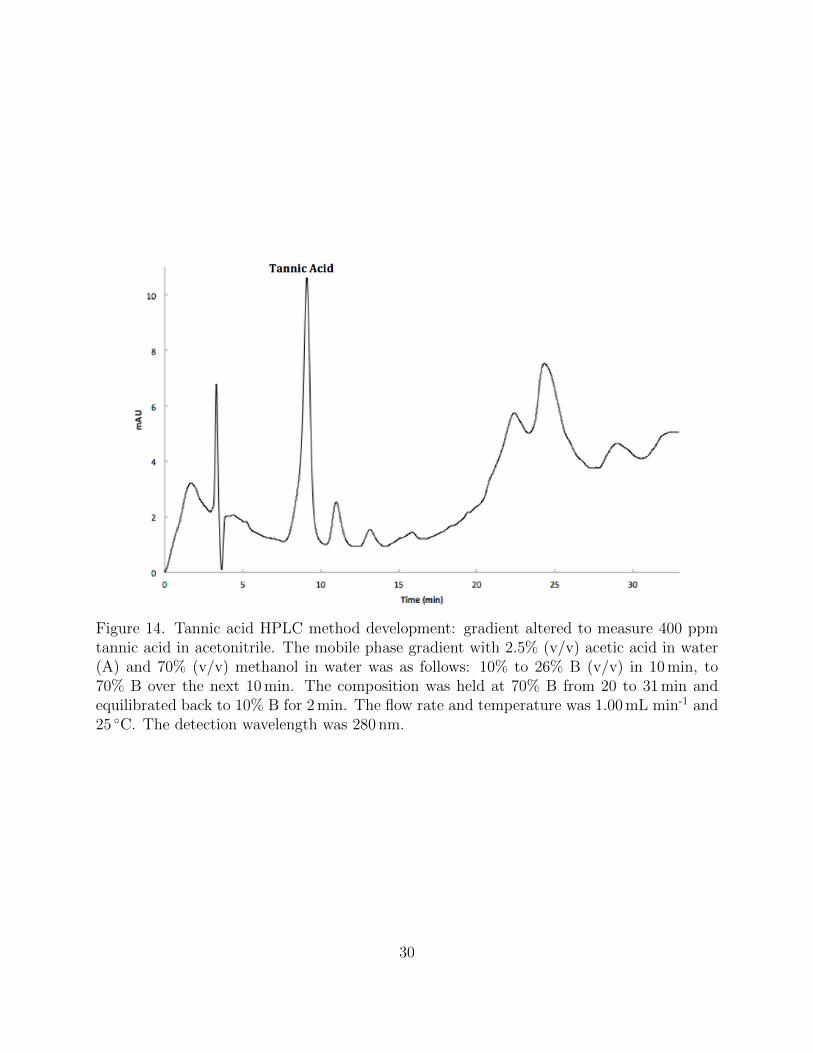
Figure 14. Tannic acid HPLC method development: gradient altered to measure 400 ppmtannic acid in acetonitrile. The mobile phase gradient with 2.5% (v/v) acetic acid in water(A) and 70% (v/v) methanol in water was as follows: 10% to 26% B (v/v) in 10 min, to70% B over the next 10 min. The composition was held at 70% B from 20 to 31 min andequilibrated back to 10% B for 2 min. The flow rate and temperature was 1.00 mL min-1 and25 ◦C. The detection wavelength was 280 nm.
30
6.2.3 Detection Wavelength
The detection wavelength was programmed to 280 nm and was not altered during HPLC
method development.
6.2.4 Temperature
The temperature was programmed to 25 ◦C and was not altered during HPLC method de-
velopment.
6.2.5 Final Instrument Parameters
After determining the most efficient gradient, flow rate, detection wavelength, and tempera-
ture for the detection and quantification of tannic acid, the optimum method was developed.
An isocratic method of 20% mobile phase B was examined in order to achieve a clean chro-
matogram. This mobile phase composition resulted in a chromatogram without the broad
peak at 20 min. The following paragraph discusses the final instrumental parameters in
detail.
An isocratic elution was used with mobile phase A as 2.5% (v/v) acetic acid in water
and mobile phase B as 70% (v/v) methanol in water. The composition of the mobile phases
were 80% A and 20% B for 15 min. The injection volume and flow rate were 10 µL and
1.00 mL min-1. The column temperature was maintained at 25 ◦C. Tannic acid analysis was
performed at a wavelength of 280 nm. The retention time of tannic acid was determined to be
7.9 min. Figure 15 shows a chromatogram of tannic acid analyzed with the final instrument
parameters. The unlabeled peaks may be contaminants in the tannic acid.
31
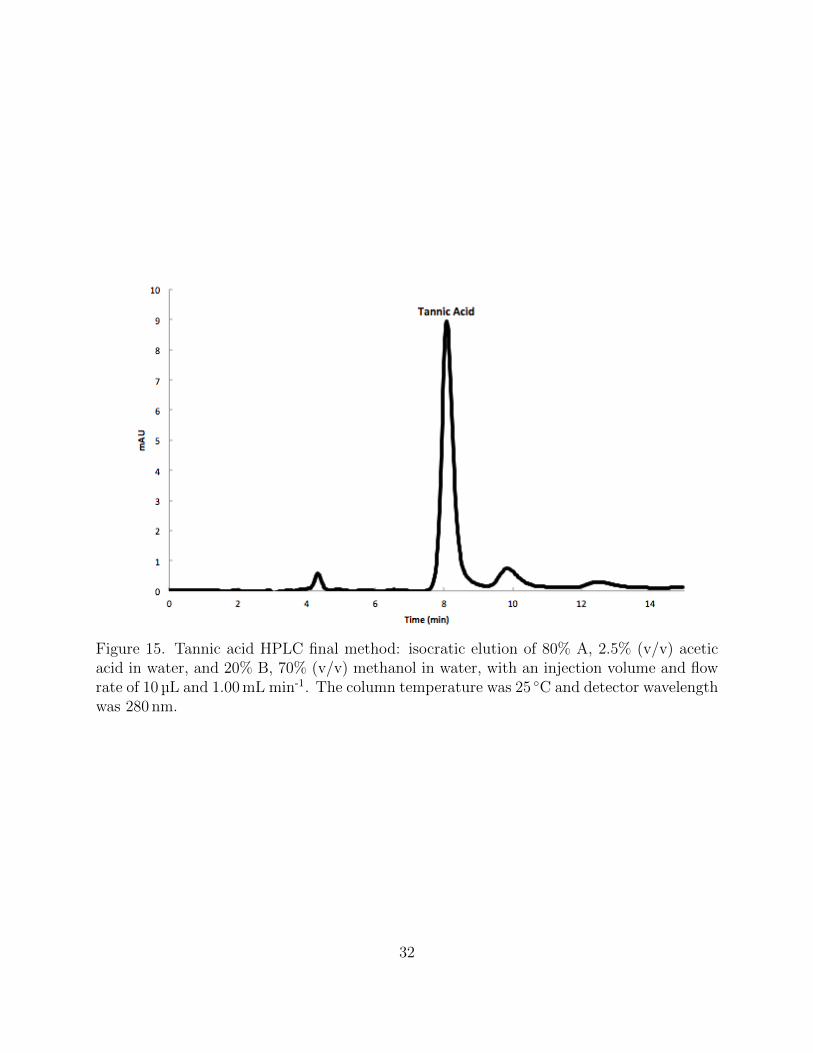
Figure 15. Tannic acid HPLC final method: isocratic elution of 80% A, 2.5% (v/v) aceticacid in water, and 20% B, 70% (v/v) methanol in water, with an injection volume and flowrate of 10 µL and 1.00 mL min-1. The column temperature was 25 ◦C and detector wavelengthwas 280 nm.
32
CHAPTER SEVEN: METHOD DEVELOPMENT FOR PROTHIOCONAZOLE AND
TEBUCONAZOLE ANALYSIS
7.1 Optimization of Extraction Method
The extraction procedure has also been modified to achieve the method with the highest
percent recovery for prothioconazole and tebuconazole. The following sections discuss the
modifications to each step of the procedure in detail. When determining the optimum
method for each step of the procedure, the percent recoveries for both compounds were
examined because it is more efficient to have one procedure to extract both compounds.
Also the compounds will exist in the same sample, so in order to analyze both compounds
the procedure must be effective for both.
7.1.1 Partitioning and Buffer Salts
Modifications of the original QuEChERS method studied in this research included vari-
ous combinations and amounts of magnesium sulfate, sodium citrate dibasic sesquihydrate,
sodium citrate dihydrate, sodium acetate, and sodium chloride in the extraction step. The
following trials involved analyzing pure prothioconazole and tebuconazole standards diluted
with acetonitrile. In each trial, 5 mL of a 250 ppm standard of prothioconazole and tebu-
conazole diluted with acetonitrile was added to a 50 mL conical tube and mixed with 10 mL
of ultrapure water and 10 mL acetonitrile. The same trials used with tannic acid were used
for the fungicide compounds and these amounts are restated in Table 13. Once the salts and
buffers were added, the tube was immediately shaken and vortexed for one minute. After
centrifugation the solution was analyzed to determine the percent recovery for this step.
Each trial was repeated twice and each extract was measured in duplicate.
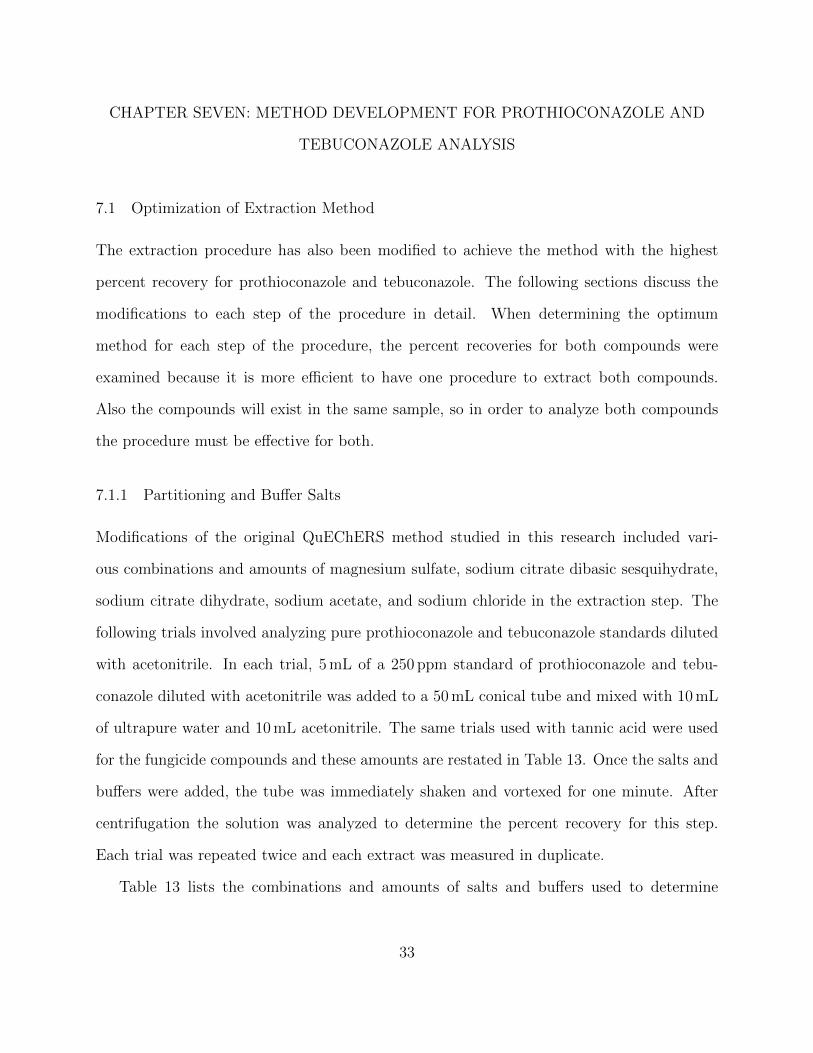
Table 13 lists the combinations and amounts of salts and buffers used to determine
33
the procedure with the highest percent recovery. The original extraction procedure from
Anastassiades was first tested.33 Trials 1 through 8 are modifications from other literature.
The average percent recoveries for prothioconazole and tebuconazole are included in Table
14. A percent recovery greater than 100% may have been caused by evaporation of solvent
and instrumental error, such as peaks overlapping from sample and background.
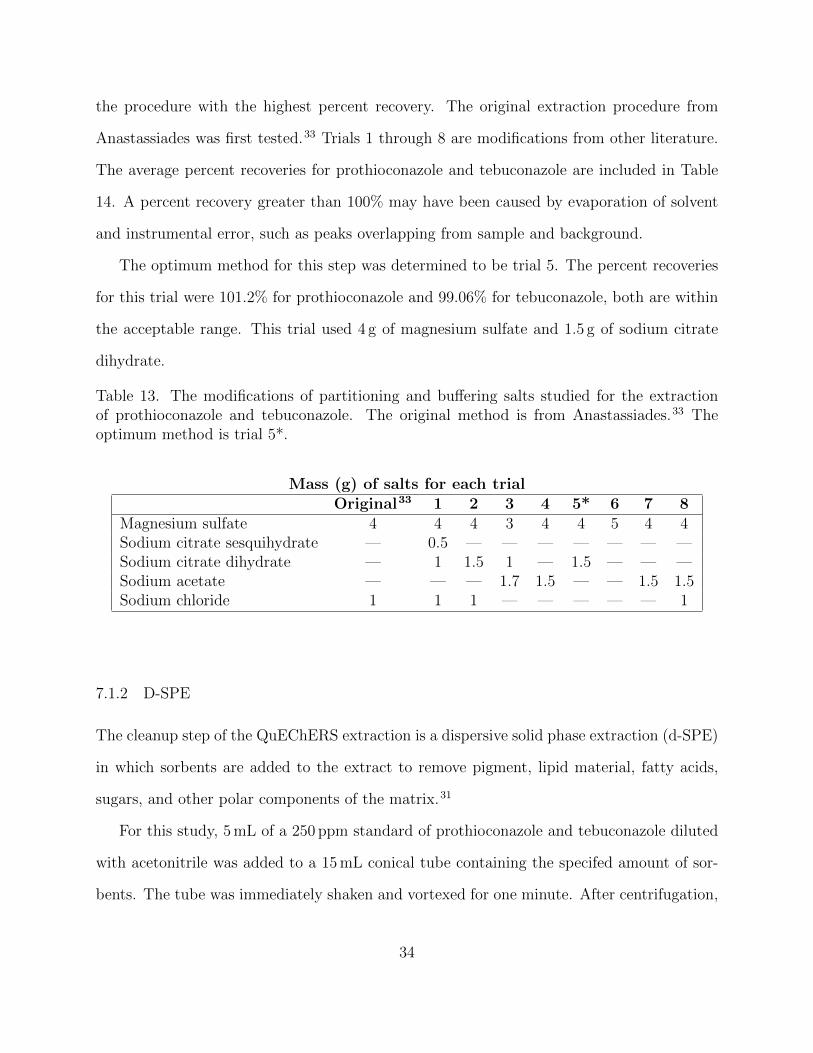
The optimum method for this step was determined to be trial 5. The percent recoveries
for this trial were 101.2% for prothioconazole and 99.06% for tebuconazole, both are within
the acceptable range. This trial used 4 g of magnesium sulfate and 1.5 g of sodium citrate
dihydrate.
Table 13. The modifications of partitioning and buffering salts studied for the extractionof prothioconazole and tebuconazole. The original method is from Anastassiades.33 Theoptimum method is trial 5*.
Mass (g) of salts for each trialOriginal33 1 2 3 4 5* 6 7 8
Magnesium sulfate 4 4 4 3 4 4 5 4 4Sodium citrate sesquihydrate — 0.5 — — — — — — —Sodium citrate dihydrate — 1 1.5 1 — 1.5 — — —Sodium acetate — — — 1.7 1.5 — — 1.5 1.5Sodium chloride 1 1 1 — — — — — 1
7.1.2 D-SPE
The cleanup step of the QuEChERS extraction is a dispersive solid phase extraction (d-SPE)
in which sorbents are added to the extract to remove pigment, lipid material, fatty acids,
sugars, and other polar components of the matrix.31
For this study, 5 mL of a 250 ppm standard of prothioconazole and tebuconazole diluted
with acetonitrile was added to a 15 mL conical tube containing the specifed amount of sor-
bents. The tube was immediately shaken and vortexed for one minute. After centrifugation,
34
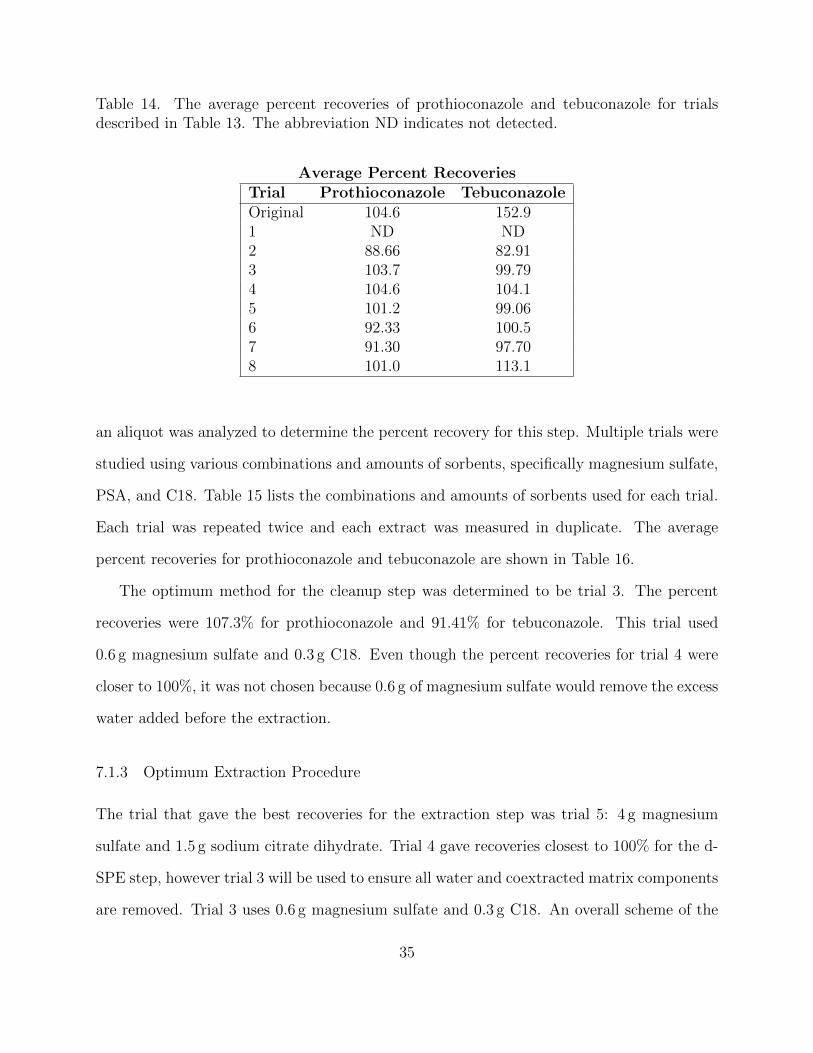
Table 14. The average percent recoveries of prothioconazole and tebuconazole for trialsdescribed in Table 13. The abbreviation ND indicates not detected.
Average Percent RecoveriesTrial Prothioconazole TebuconazoleOriginal 104.6 152.91 ND ND2 88.66 82.913 103.7 99.794 104.6 104.15 101.2 99.066 92.33 100.57 91.30 97.708 101.0 113.1
an aliquot was analyzed to determine the percent recovery for this step. Multiple trials were
studied using various combinations and amounts of sorbents, specifically magnesium sulfate,
PSA, and C18. Table 15 lists the combinations and amounts of sorbents used for each trial.
Each trial was repeated twice and each extract was measured in duplicate. The average
percent recoveries for prothioconazole and tebuconazole are shown in Table 16.
The optimum method for the cleanup step was determined to be trial 3. The percent
recoveries were 107.3% for prothioconazole and 91.41% for tebuconazole. This trial used
0.6 g magnesium sulfate and 0.3 g C18. Even though the percent recoveries for trial 4 were
closer to 100%, it was not chosen because 0.6 g of magnesium sulfate would remove the excess
water added before the extraction.
7.1.3 Optimum Extraction Procedure
The trial that gave the best recoveries for the extraction step was trial 5: 4 g magnesium
sulfate and 1.5 g sodium citrate dihydrate. Trial 4 gave recoveries closest to 100% for the d-
SPE step, however trial 3 will be used to ensure all water and coextracted matrix components
are removed. Trial 3 uses 0.6 g magnesium sulfate and 0.3 g C18. An overall scheme of the
35
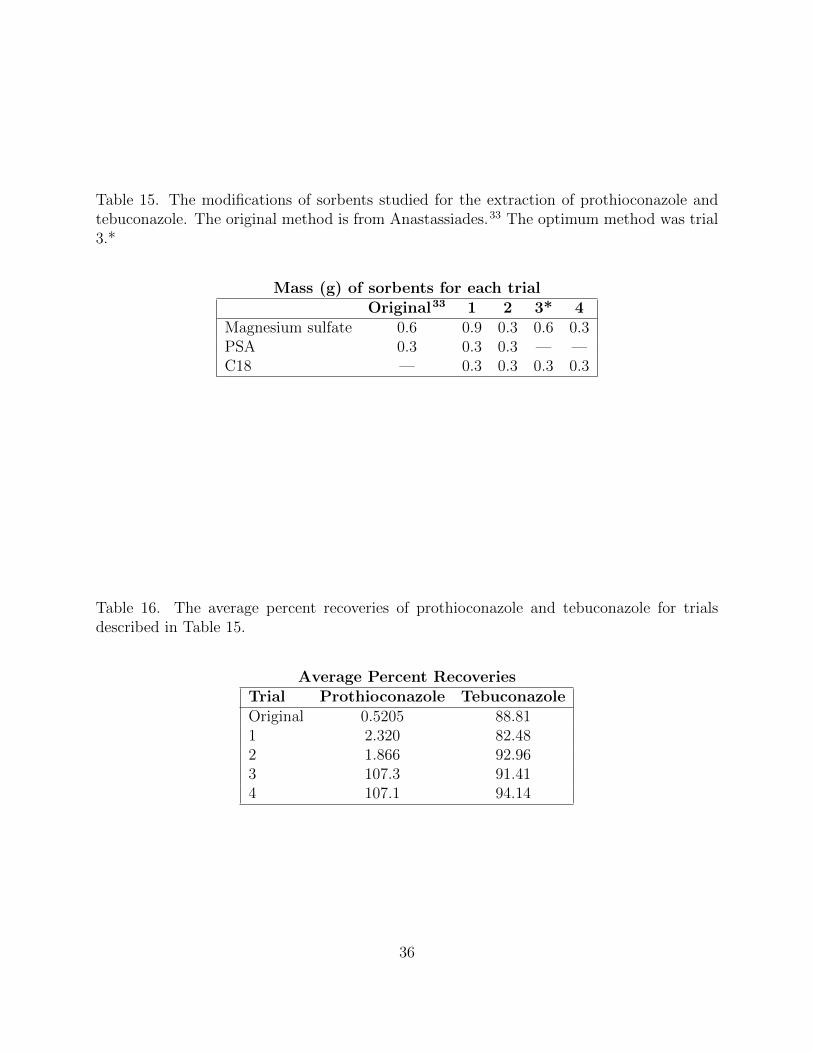
Table 15. The modifications of sorbents studied for the extraction of prothioconazole andtebuconazole. The original method is from Anastassiades.33 The optimum method was trial3.*
Mass (g) of sorbents for each trialOriginal33 1 2 3* 4
Magnesium sulfate 0.6 0.9 0.3 0.6 0.3PSA 0.3 0.3 0.3 — —C18 — 0.3 0.3 0.3 0.3
Table 16. The average percent recoveries of prothioconazole and tebuconazole for trialsdescribed in Table 15.
Average Percent RecoveriesTrial Prothioconazole TebuconazoleOriginal 0.5205 88.811 2.320 82.482 1.866 92.963 107.3 91.414 107.1 94.14
36
optimized extraction method is included in Figure 16.
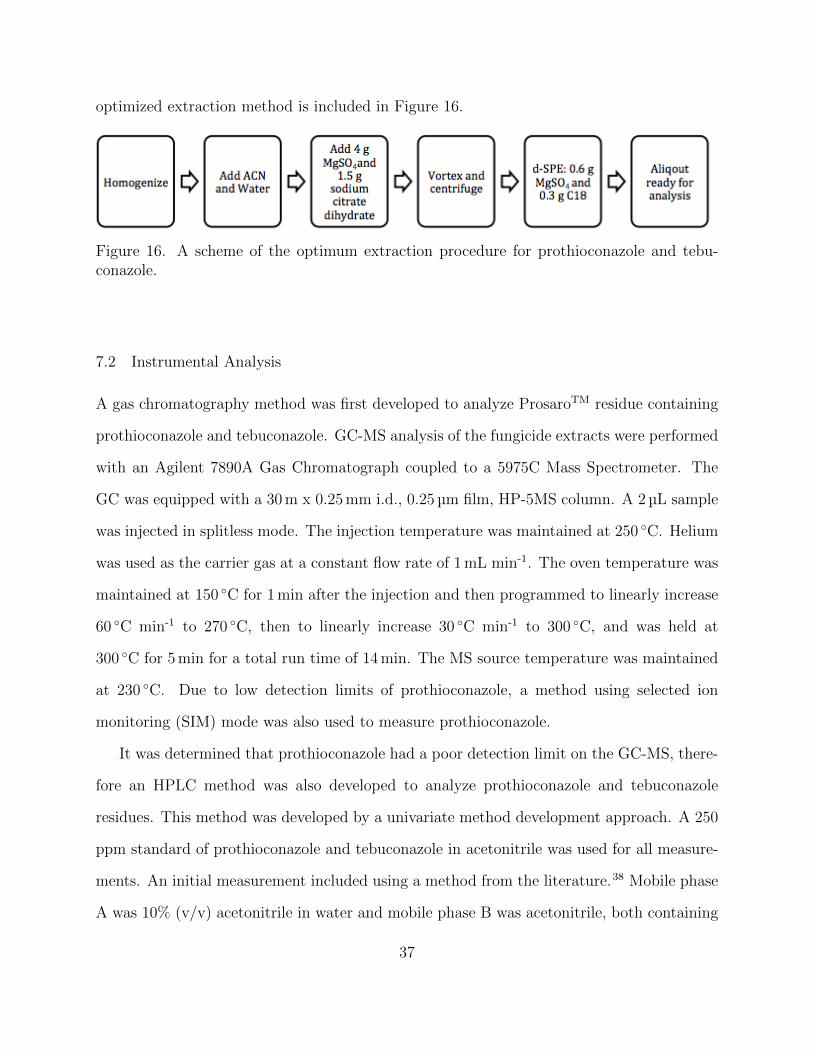
Figure 16. A scheme of the optimum extraction procedure for prothioconazole and tebu-conazole.
7.2 Instrumental Analysis
A gas chromatography method was first developed to analyze ProsaroTM residue containing
prothioconazole and tebuconazole. GC-MS analysis of the fungicide extracts were performed
with an Agilent 7890A Gas Chromatograph coupled to a 5975C Mass Spectrometer. The
GC was equipped with a 30 m x 0.25 mm i.d., 0.25 µm film, HP-5MS column. A 2 µL sample
was injected in splitless mode. The injection temperature was maintained at 250 ◦C. Helium
was used as the carrier gas at a constant flow rate of 1 mL min-1. The oven temperature was
maintained at 150 ◦C for 1 min after the injection and then programmed to linearly increase
60 ◦C min-1 to 270 ◦C, then to linearly increase 30 ◦C min-1 to 300 ◦C, and was held at
300 ◦C for 5 min for a total run time of 14 min. The MS source temperature was maintained
at 230 ◦C. Due to low detection limits of prothioconazole, a method using selected ion
monitoring (SIM) mode was also used to measure prothioconazole.
It was determined that prothioconazole had a poor detection limit on the GC-MS, there-
fore an HPLC method was also developed to analyze prothioconazole and tebuconazole
residues. This method was developed by a univariate method development approach. A 250
ppm standard of prothioconazole and tebuconazole in acetonitrile was used for all measure-
ments. An initial measurement included using a method from the literature.38 Mobile phase
A was 10% (v/v) acetonitrile in water and mobile phase B was acetonitrile, both containing
37
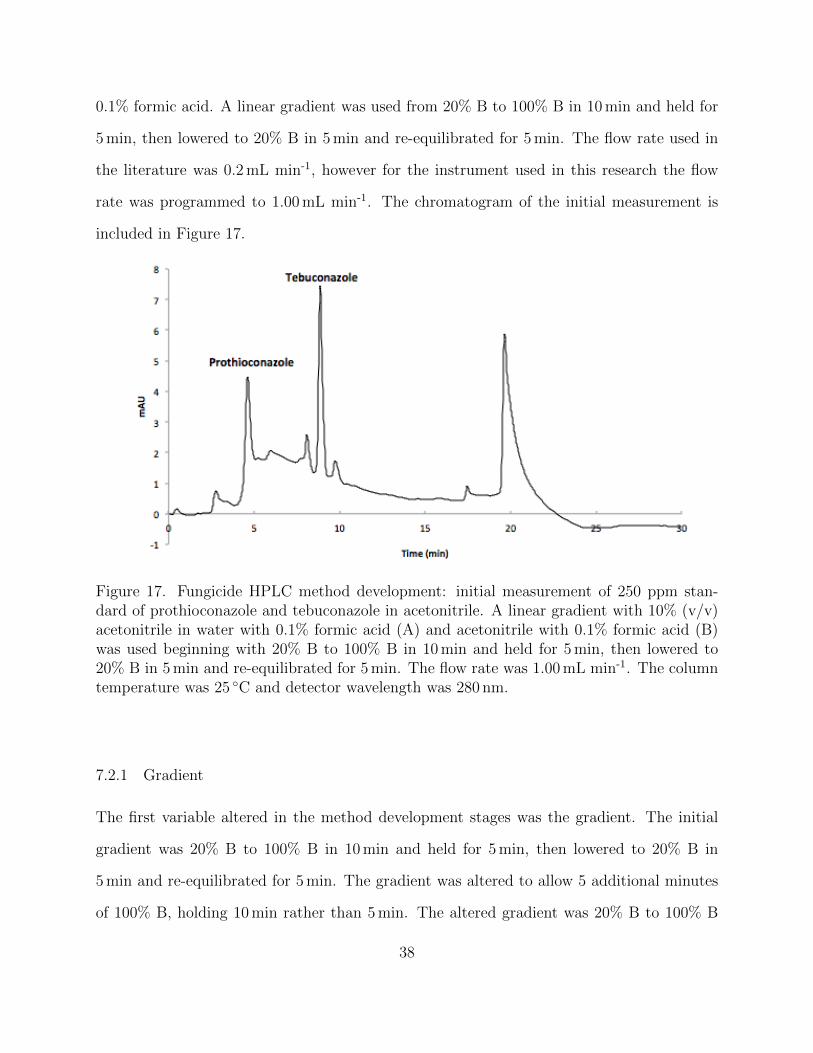
0.1% formic acid. A linear gradient was used from 20% B to 100% B in 10 min and held for
5 min, then lowered to 20% B in 5 min and re-equilibrated for 5 min. The flow rate used in
the literature was 0.2 mL min-1, however for the instrument used in this research the flow
rate was programmed to 1.00 mL min-1. The chromatogram of the initial measurement is
included in Figure 17.
Figure 17. Fungicide HPLC method development: initial measurement of 250 ppm stan-dard of prothioconazole and tebuconazole in acetonitrile. A linear gradient with 10% (v/v)acetonitrile in water with 0.1% formic acid (A) and acetonitrile with 0.1% formic acid (B)was used beginning with 20% B to 100% B in 10 min and held for 5 min, then lowered to20% B in 5 min and re-equilibrated for 5 min. The flow rate was 1.00 mL min-1. The columntemperature was 25 ◦C and detector wavelength was 280 nm.
7.2.1 Gradient
The first variable altered in the method development stages was the gradient. The initial
gradient was 20% B to 100% B in 10 min and held for 5 min, then lowered to 20% B in
5 min and re-equilibrated for 5 min. The gradient was altered to allow 5 additional minutes
of 100% B, holding 10 min rather than 5 min. The altered gradient was 20% B to 100% B
38
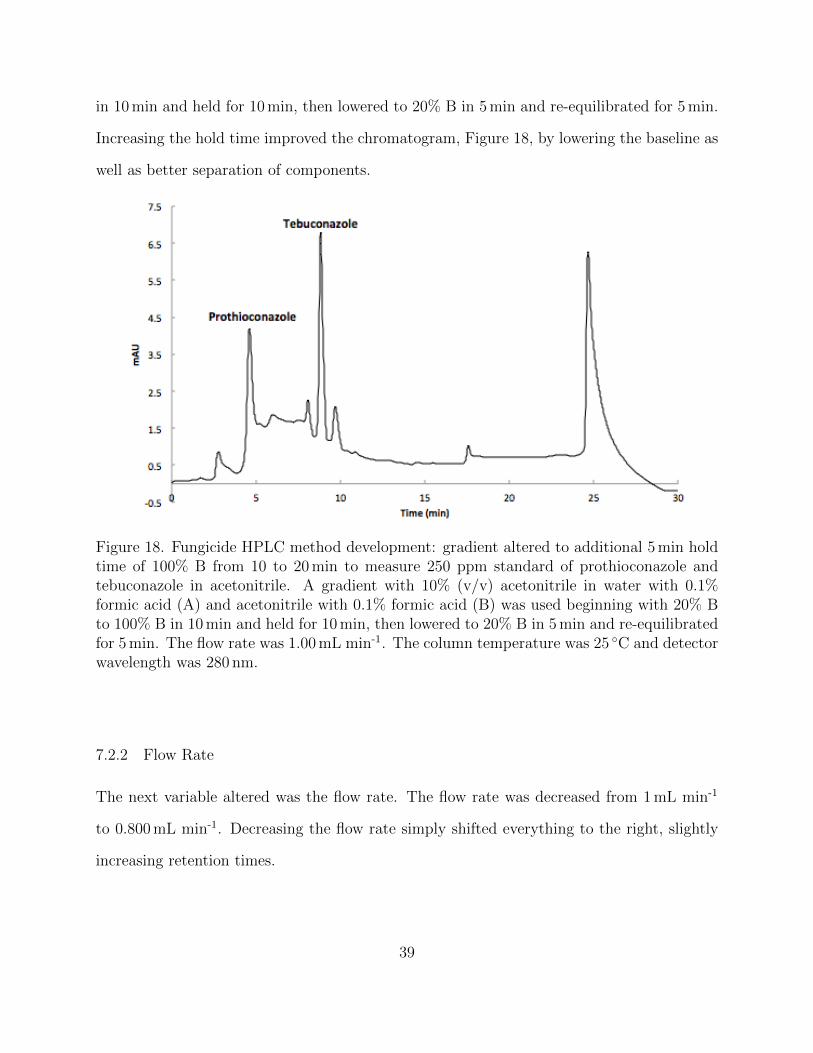
in 10 min and held for 10 min, then lowered to 20% B in 5 min and re-equilibrated for 5 min.
Increasing the hold time improved the chromatogram, Figure 18, by lowering the baseline as
well as better separation of components.
Figure 18. Fungicide HPLC method development: gradient altered to additional 5 min holdtime of 100% B from 10 to 20 min to measure 250 ppm standard of prothioconazole andtebuconazole in acetonitrile. A gradient with 10% (v/v) acetonitrile in water with 0.1%formic acid (A) and acetonitrile with 0.1% formic acid (B) was used beginning with 20% Bto 100% B in 10 min and held for 10 min, then lowered to 20% B in 5 min and re-equilibratedfor 5 min. The flow rate was 1.00 mL min-1. The column temperature was 25 ◦C and detectorwavelength was 280 nm.
7.2.2 Flow Rate
The next variable altered was the flow rate. The flow rate was decreased from 1 mL min-1
to 0.800 mL min-1. Decreasing the flow rate simply shifted everything to the right, slightly
increasing retention times.
39
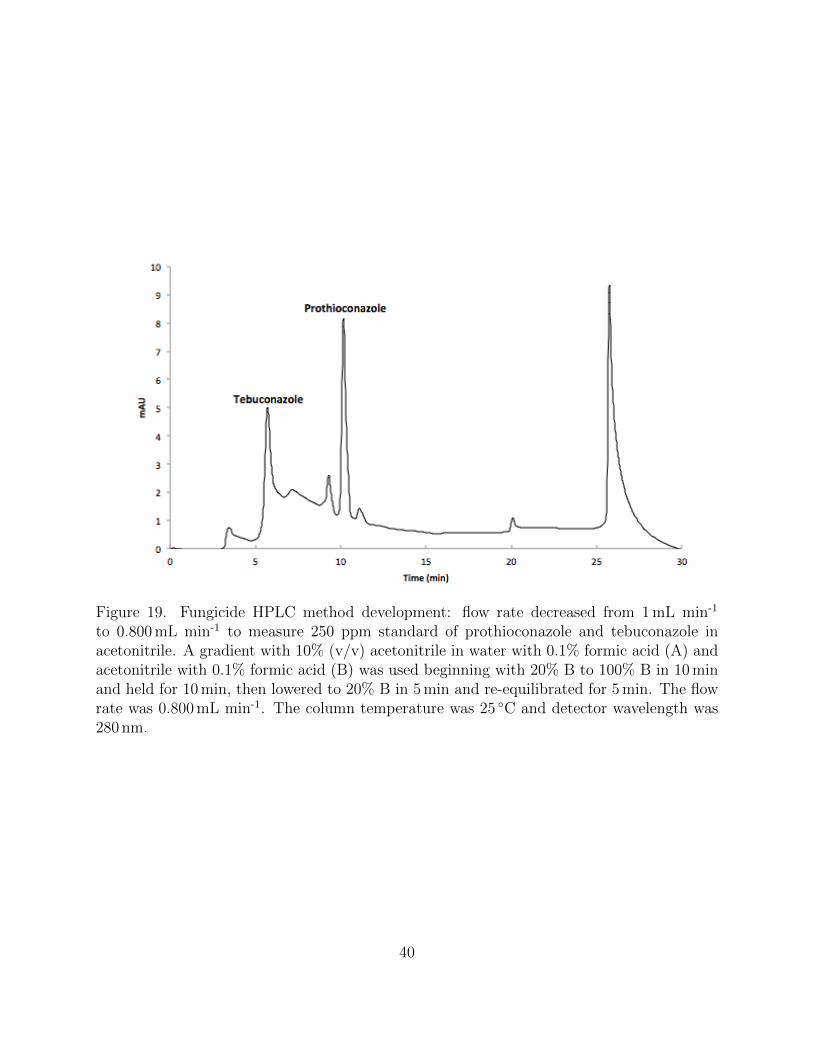
Figure 19. Fungicide HPLC method development: flow rate decreased from 1 mL min-1
to 0.800 mL min-1 to measure 250 ppm standard of prothioconazole and tebuconazole inacetonitrile. A gradient with 10% (v/v) acetonitrile in water with 0.1% formic acid (A) andacetonitrile with 0.1% formic acid (B) was used beginning with 20% B to 100% B in 10 minand held for 10 min, then lowered to 20% B in 5 min and re-equilibrated for 5 min. The flowrate was 0.800 mL min-1. The column temperature was 25 ◦C and detector wavelength was280 nm.
40
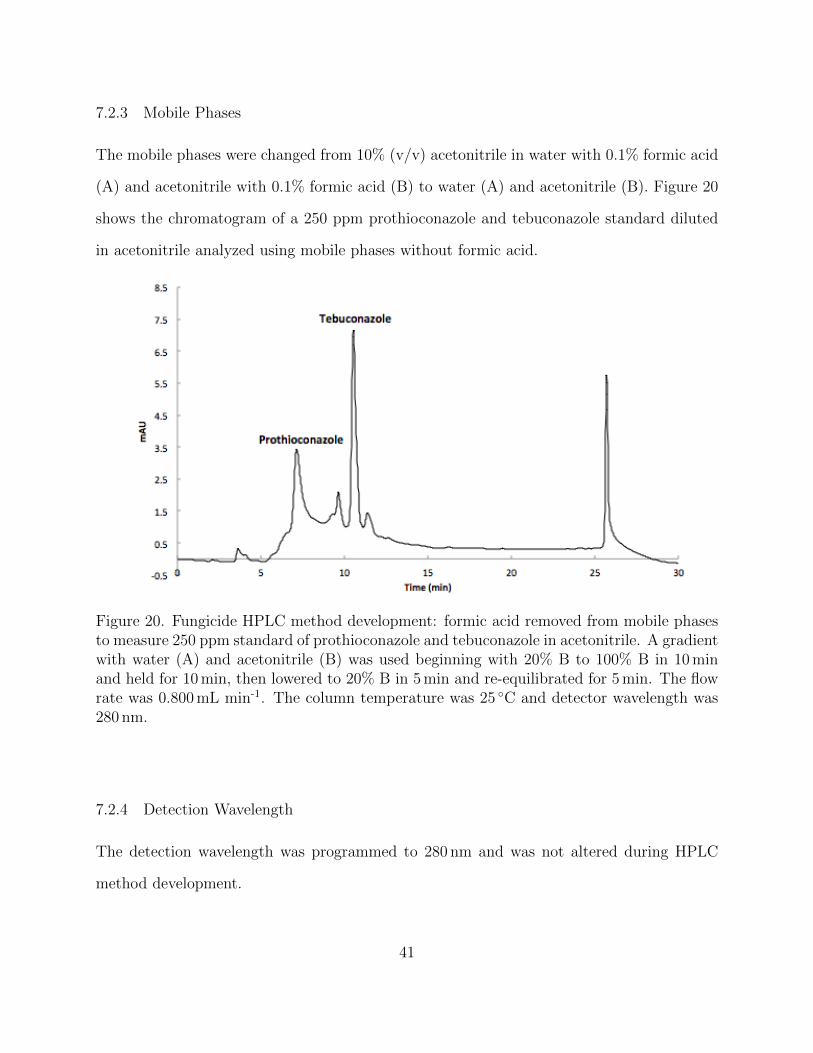
7.2.3 Mobile Phases
The mobile phases were changed from 10% (v/v) acetonitrile in water with 0.1% formic acid
(A) and acetonitrile with 0.1% formic acid (B) to water (A) and acetonitrile (B). Figure 20
shows the chromatogram of a 250 ppm prothioconazole and tebuconazole standard diluted
in acetonitrile analyzed using mobile phases without formic acid.
Figure 20. Fungicide HPLC method development: formic acid removed from mobile phasesto measure 250 ppm standard of prothioconazole and tebuconazole in acetonitrile. A gradientwith water (A) and acetonitrile (B) was used beginning with 20% B to 100% B in 10 minand held for 10 min, then lowered to 20% B in 5 min and re-equilibrated for 5 min. The flowrate was 0.800 mL min-1. The column temperature was 25 ◦C and detector wavelength was280 nm.
7.2.4 Detection Wavelength
The detection wavelength was programmed to 280 nm and was not altered during HPLC
method development.
41
7.2.5 Temperature
The temperature was programmed to 40 ◦C and was not altered during HPLC method de-
velopment.
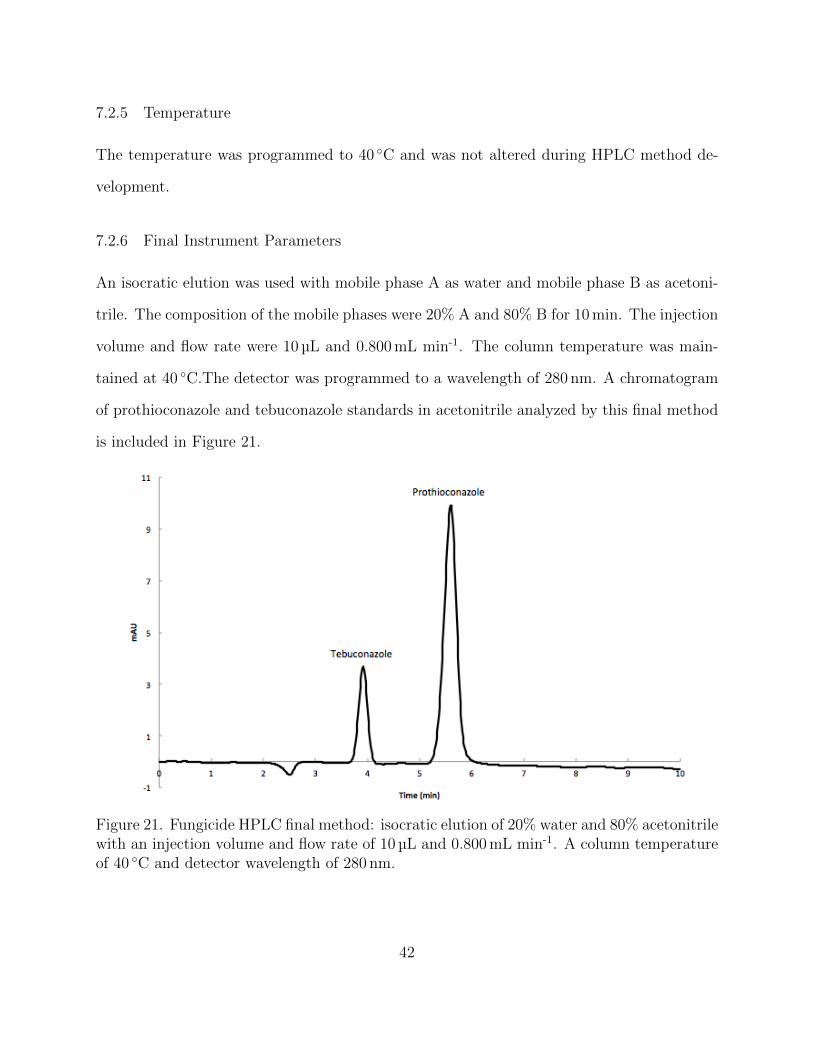
7.2.6 Final Instrument Parameters
An isocratic elution was used with mobile phase A as water and mobile phase B as acetoni-
trile. The composition of the mobile phases were 20% A and 80% B for 10 min. The injection
volume and flow rate were 10 µL and 0.800 mL min-1. The column temperature was main-
tained at 40 ◦C.The detector was programmed to a wavelength of 280 nm. A chromatogram
of prothioconazole and tebuconazole standards in acetonitrile analyzed by this final method
is included in Figure 21.
Figure 21. Fungicide HPLC final method: isocratic elution of 20% water and 80% acetonitrilewith an injection volume and flow rate of 10 µL and 0.800 mL min-1. A column temperatureof 40 ◦C and detector wavelength of 280 nm.
42
CHAPTER EIGHT: RESULTS
8.1 Sprayability and Plant Coverage
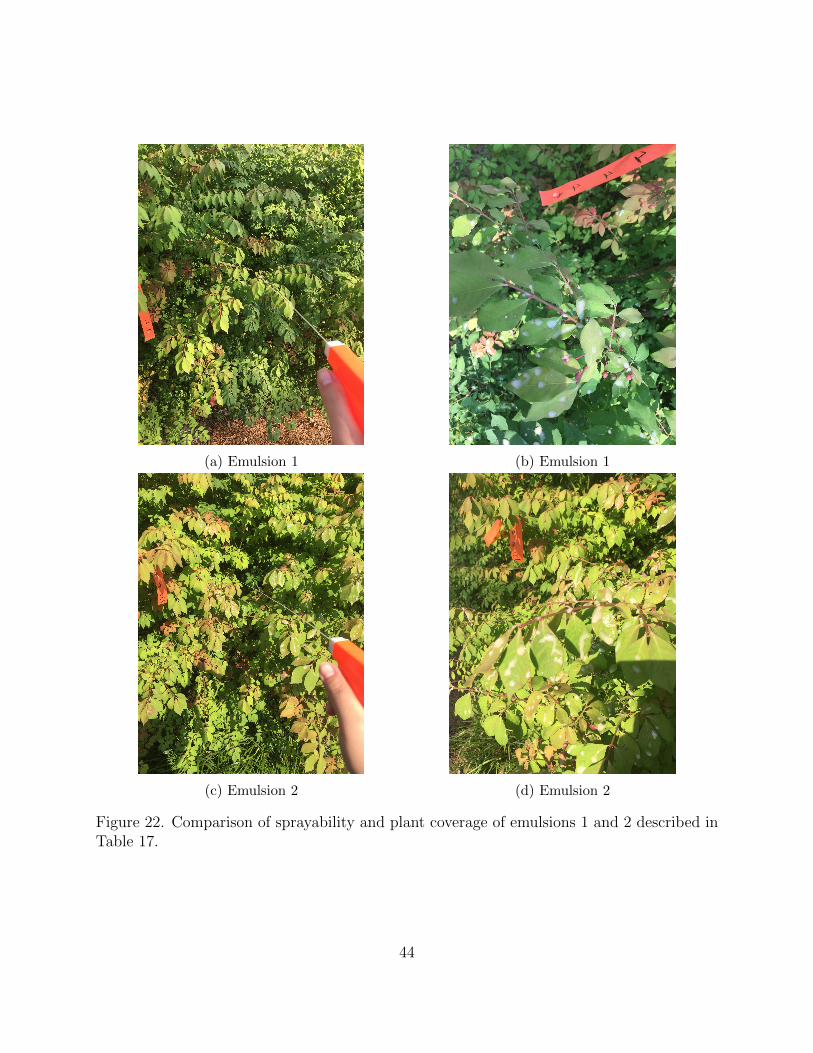
Sprayability of the stable emulsion was tested and compared to other 5% tannic acid wax
emulsions by visual examination. The formulations for the emulsions varied in their per-
centage of soy wax and/or vegetable oil. The ideal emulsion will spray through a nozzle to
achieve good coverage but not immediately drip off of the plant. A mist spray results in
optimum coverage of the plants, whereas a stream spray results in minimum coverage. Table
17 list the formulations of each emulsion used for sprayability and plant coverage compar-
ison, as well as the formulation used as treatment for 2015 field trials. The emulsion used
for 2015 treatments used Span60 as the emulsifier instead of TEA stearate. This emulsion
also differed from the 2016 emulsion in percentage of soy wax, vegetable oil, tannic acid,
and guar gum. Figures 22 and 23 show each of the 2016 emulsions being sprayed through
a spray nozzle, as well as the plant coverage for each. Emulsion 4 was the only formulation
able to achieve a mist spray for optimum plant coverage. This formulation was used for the
2016 barley plot trials, as well as the studies to determine the length of time that tannic
acid remains on the surface of the plant.
Table 17. Formulations of tannic acid emulsions for sprayability and plant coverage compar-ison. Emulsion 4 was used for 2016 field trials.
Percent Composition2015 2016 1 2 3 4Soy wax 1 Soy Wax 3 5 5 3Vegetable Oil 5 Vegetable Oil 2.5 6 2.5 6Span60 2 TEA Stearate 3 3 3 3Tannic Acid 1 or 3 Tannic Acid 5 5 5 5Guar Gum 0.75 Guar Gum 0.5 0.5 0.5 0.5
43
(a) Emulsion 1 (b) Emulsion 1
(c) Emulsion 2 (d) Emulsion 2
Figure 22. Comparison of sprayability and plant coverage of emulsions 1 and 2 described inTable 17.
44
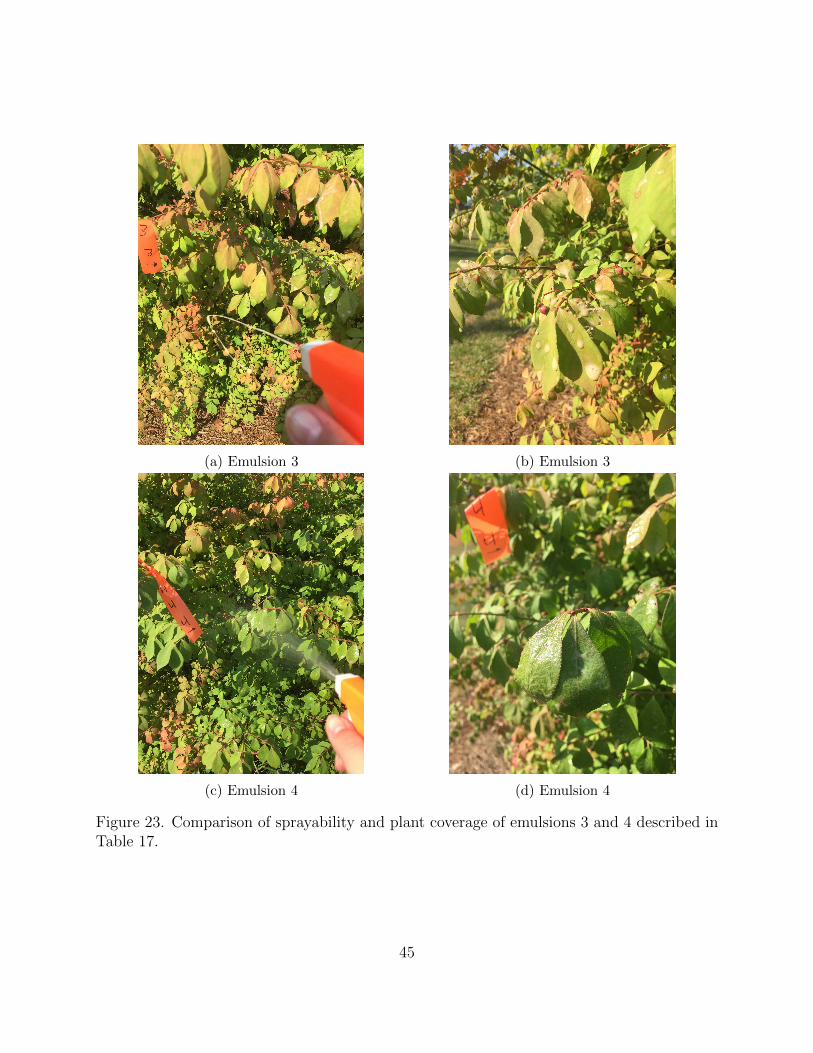
(a) Emulsion 3 (b) Emulsion 3
(c) Emulsion 4 (d) Emulsion 4
Figure 23. Comparison of sprayability and plant coverage of emulsions 3 and 4 described inTable 17.
45
8.2 Barley Plot Trials
8.2.1 Effectiveness Data
For each plot, all of the grain was harvested, weighed, and sub-sampled for mycotoxin deter-
minations to examine the effectiveness of the biopesticide. An outside party performed DON
analysis. The lower the concentration of DON in the sample, or the less infected the sam-
ple, the more effective the treatment was. In 2015, three trials were conducted, including a
greenhouse trial and two field trials, Inwood and Caswell. Endeavor and Nomini were grown
in the Inwood field and Endeavor, Nomini, Atlantic, and Thoroughbred were grown in the
Caswell field. In all trials barley was treated with either a 1% or 3% tannic acid emulsion.
The formulations are included in Table 17.
The average concentration of DON for each treatment for the Inwood field is included is
Table 18. The data were also analyzed by statistical analysis software, SAS, with DON as
the dependent variable. Table 19 includes the type III tests of fixed effects, which include
hypothesis tests for the significance of each of the fixed effects. Num DF is the number of
degrees of freedom of the effect, variety and treatment. Den DF is the number of degrees
of freedom associated with model errors. The F value is the statistic for the given predictor
and text statistic. The Pr > F value is the p-value associated with the F statistic. There
is a significant difference in DON concentration among the varieties since the p-value is
less than 0.05. However, there is no significant difference in DON concentration among
the treatments. The high p-value for variety*treatment means that there is no significant
difference in treatment across varieties. Table 20 includes the least square means for each
effect. The variety Endeavor has a very low DON concentration, estimate, compared to
Nomini, meaning that Endeavor was less infected. The untreated barley has the highest
DON concentration, making it appear that it was more infected than the treated barley.
However there is no significant difference between the treatments, shown in Table 19.
46
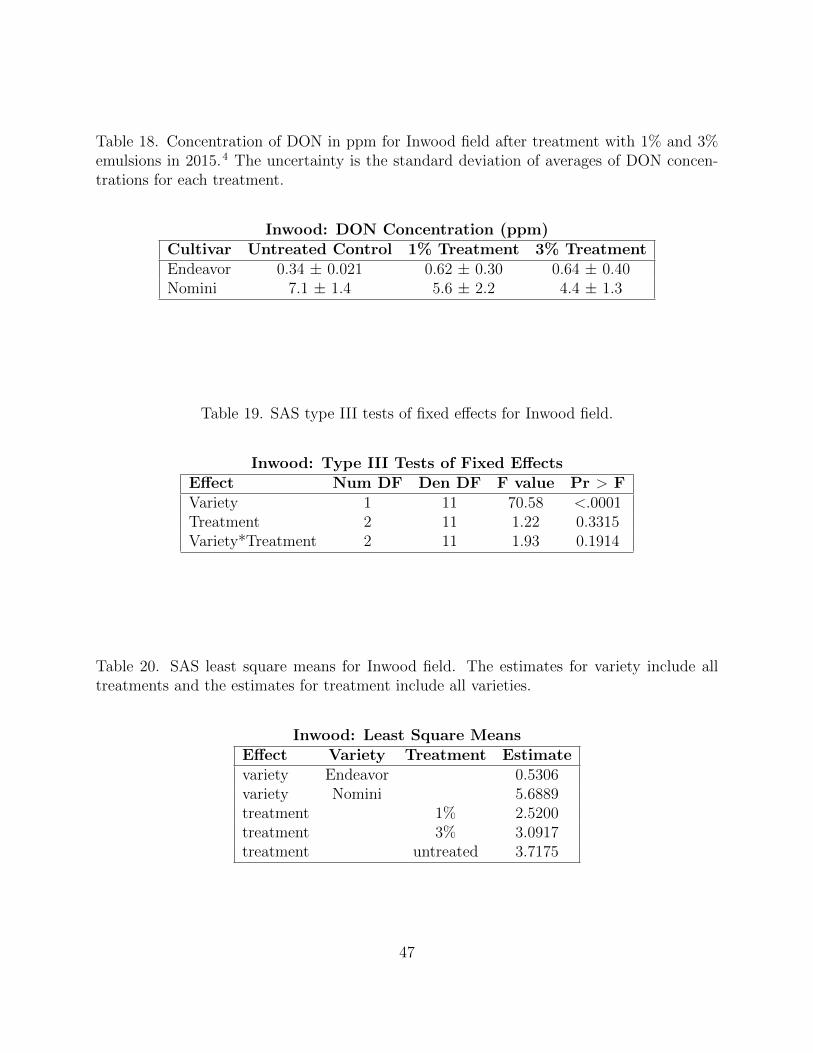
Table 18. Concentration of DON in ppm for Inwood field after treatment with 1% and 3%emulsions in 2015.4 The uncertainty is the standard deviation of averages of DON concen-trations for each treatment.
Inwood: DON Concentration (ppm)Cultivar Untreated Control 1% Treatment 3% TreatmentEndeavor 0.34 ± 0.021 0.62 ± 0.30 0.64 ± 0.40Nomini 7.1 ± 1.4 5.6 ± 2.2 4.4 ± 1.3
Table 19. SAS type III tests of fixed effects for Inwood field.
Inwood: Type III Tests of Fixed EffectsEffect Num DF Den DF F value Pr > FVariety 1 11 70.58 <.0001Treatment 2 11 1.22 0.3315Variety*Treatment 2 11 1.93 0.1914
Table 20. SAS least square means for Inwood field. The estimates for variety include alltreatments and the estimates for treatment include all varieties.
Inwood: Least Square MeansEffect Variety Treatment Estimatevariety Endeavor 0.5306variety Nomini 5.6889treatment 1% 2.5200treatment 3% 3.0917treatment untreated 3.7175
47
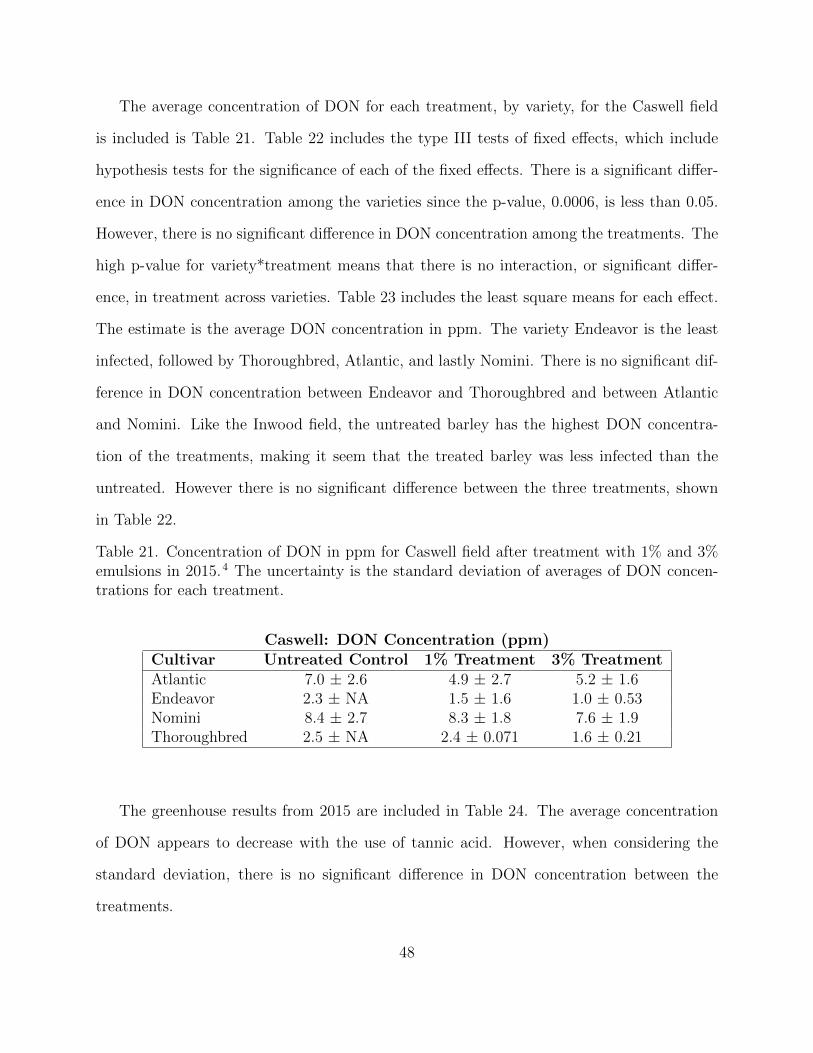
The average concentration of DON for each treatment, by variety, for the Caswell field
is included is Table 21. Table 22 includes the type III tests of fixed effects, which include
hypothesis tests for the significance of each of the fixed effects. There is a significant differ-
ence in DON concentration among the varieties since the p-value, 0.0006, is less than 0.05.
However, there is no significant difference in DON concentration among the treatments. The
high p-value for variety*treatment means that there is no interaction, or significant differ-
ence, in treatment across varieties. Table 23 includes the least square means for each effect.
The estimate is the average DON concentration in ppm. The variety Endeavor is the least
infected, followed by Thoroughbred, Atlantic, and lastly Nomini. There is no significant dif-
ference in DON concentration between Endeavor and Thoroughbred and between Atlantic
and Nomini. Like the Inwood field, the untreated barley has the highest DON concentra-
tion of the treatments, making it seem that the treated barley was less infected than the
untreated. However there is no significant difference between the three treatments, shown
in Table 22.
Table 21. Concentration of DON in ppm for Caswell field after treatment with 1% and 3%emulsions in 2015.4 The uncertainty is the standard deviation of averages of DON concen-trations for each treatment.
Caswell: DON Concentration (ppm)Cultivar Untreated Control 1% Treatment 3% TreatmentAtlantic 7.0 ± 2.6 4.9 ± 2.7 5.2 ± 1.6Endeavor 2.3 ± NA 1.5 ± 1.6 1.0 ± 0.53Nomini 8.4 ± 2.7 8.3 ± 1.8 7.6 ± 1.9Thoroughbred 2.5 ± NA 2.4 ± 0.071 1.6 ± 0.21
The greenhouse results from 2015 are included in Table 24. The average concentration
of DON appears to decrease with the use of tannic acid. However, when considering the
standard deviation, there is no significant difference in DON concentration between the
treatments.
48
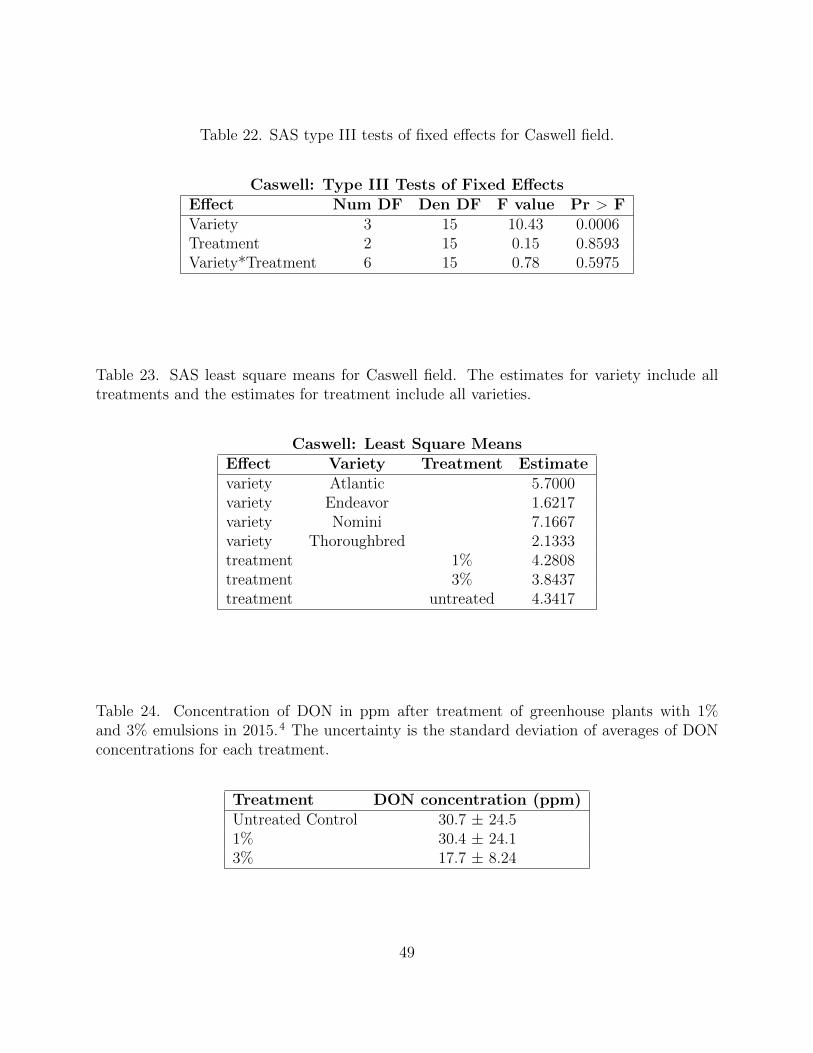
Table 22. SAS type III tests of fixed effects for Caswell field.
Caswell: Type III Tests of Fixed EffectsEffect Num DF Den DF F value Pr > FVariety 3 15 10.43 0.0006Treatment 2 15 0.15 0.8593Variety*Treatment 6 15 0.78 0.5975
Table 23. SAS least square means for Caswell field. The estimates for variety include alltreatments and the estimates for treatment include all varieties.
Caswell: Least Square MeansEffect Variety Treatment Estimatevariety Atlantic 5.7000variety Endeavor 1.6217variety Nomini 7.1667variety Thoroughbred 2.1333treatment 1% 4.2808treatment 3% 3.8437treatment untreated 4.3417
Table 24. Concentration of DON in ppm after treatment of greenhouse plants with 1%and 3% emulsions in 2015.4 The uncertainty is the standard deviation of averages of DONconcentrations for each treatment.
Treatment DON concentration (ppm)Untreated Control 30.7 ± 24.51% 30.4 ± 24.13% 17.7 ± 8.24
49
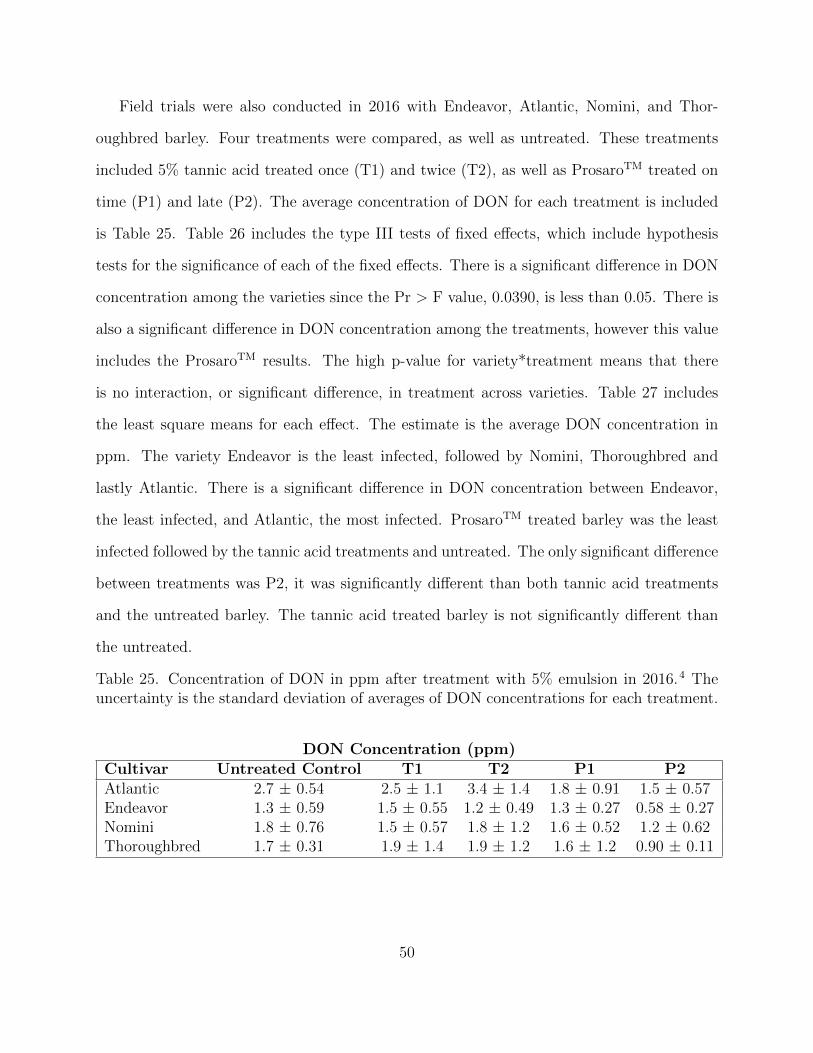
Field trials were also conducted in 2016 with Endeavor, Atlantic, Nomini, and Thor-
oughbred barley. Four treatments were compared, as well as untreated. These treatments
included 5% tannic acid treated once (T1) and twice (T2), as well as ProsaroTM treated on
time (P1) and late (P2). The average concentration of DON for each treatment is included
is Table 25. Table 26 includes the type III tests of fixed effects, which include hypothesis
tests for the significance of each of the fixed effects. There is a significant difference in DON
concentration among the varieties since the Pr > F value, 0.0390, is less than 0.05. There is
also a significant difference in DON concentration among the treatments, however this value
includes the ProsaroTM results. The high p-value for variety*treatment means that there
is no interaction, or significant difference, in treatment across varieties. Table 27 includes
the least square means for each effect. The estimate is the average DON concentration in
ppm. The variety Endeavor is the least infected, followed by Nomini, Thoroughbred and
lastly Atlantic. There is a significant difference in DON concentration between Endeavor,
the least infected, and Atlantic, the most infected. ProsaroTM treated barley was the least
infected followed by the tannic acid treatments and untreated. The only significant difference
between treatments was P2, it was significantly different than both tannic acid treatments
and the untreated barley. The tannic acid treated barley is not significantly different than
the untreated.
Table 25. Concentration of DON in ppm after treatment with 5% emulsion in 2016.4 Theuncertainty is the standard deviation of averages of DON concentrations for each treatment.
DON Concentration (ppm)Cultivar Untreated Control T1 T2 P1 P2Atlantic 2.7 ± 0.54 2.5 ± 1.1 3.4 ± 1.4 1.8 ± 0.91 1.5 ± 0.57Endeavor 1.3 ± 0.59 1.5 ± 0.55 1.2 ± 0.49 1.3 ± 0.27 0.58 ± 0.27Nomini 1.8 ± 0.76 1.5 ± 0.57 1.8 ± 1.2 1.6 ± 0.52 1.2 ± 0.62Thoroughbred 1.7 ± 0.31 1.9 ± 1.4 1.9 ± 1.2 1.6 ± 1.2 0.90 ± 0.11
50
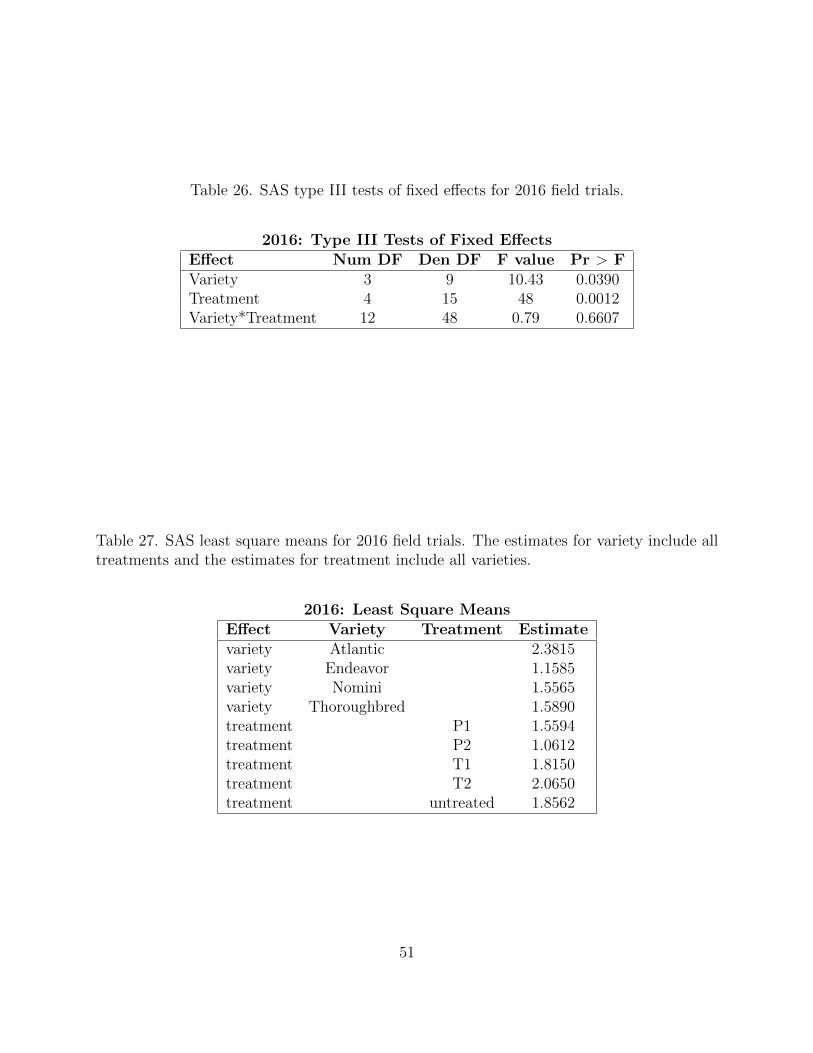
Table 26. SAS type III tests of fixed effects for 2016 field trials.
2016: Type III Tests of Fixed EffectsEffect Num DF Den DF F value Pr > FVariety 3 9 10.43 0.0390Treatment 4 15 48 0.0012Variety*Treatment 12 48 0.79 0.6607
Table 27. SAS least square means for 2016 field trials. The estimates for variety include alltreatments and the estimates for treatment include all varieties.
2016: Least Square MeansEffect Variety Treatment Estimatevariety Atlantic 2.3815variety Endeavor 1.1585variety Nomini 1.5565variety Thoroughbred 1.5890treatment P1 1.5594treatment P2 1.0612treatment T1 1.8150treatment T2 2.0650treatment untreated 1.8562
51
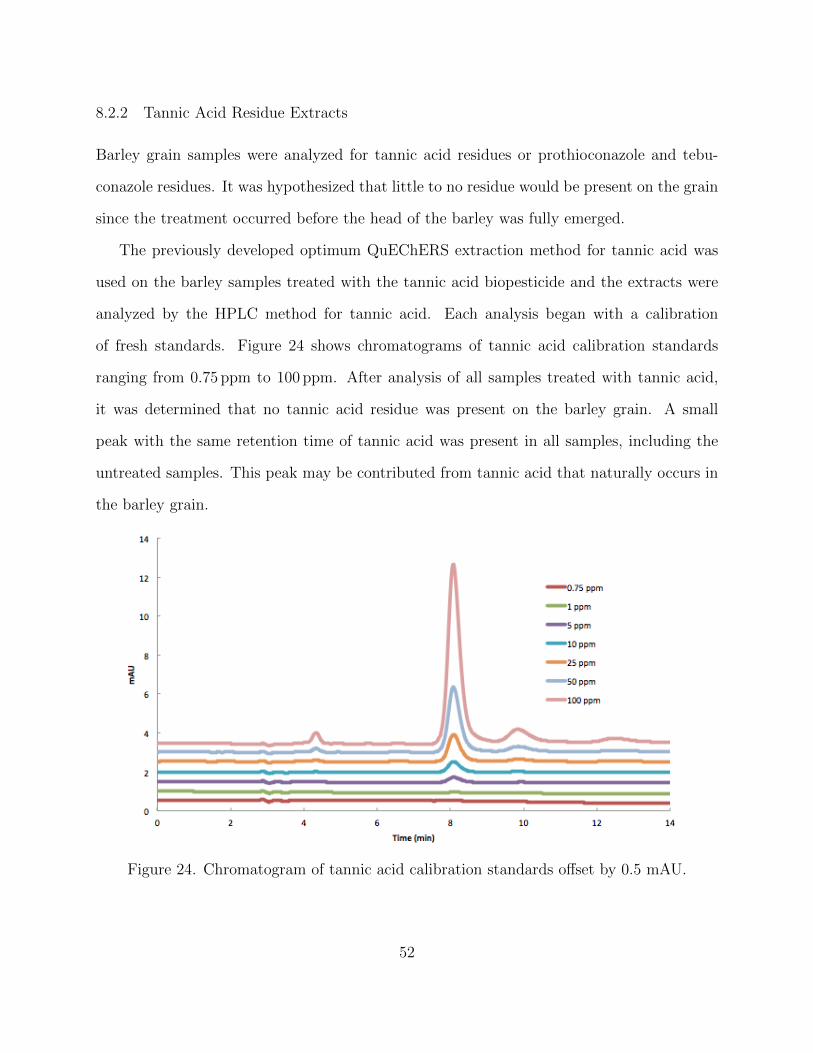
8.2.2 Tannic Acid Residue Extracts
Barley grain samples were analyzed for tannic acid residues or prothioconazole and tebu-
conazole residues. It was hypothesized that little to no residue would be present on the grain
since the treatment occurred before the head of the barley was fully emerged.
The previously developed optimum QuEChERS extraction method for tannic acid was
used on the barley samples treated with the tannic acid biopesticide and the extracts were
analyzed by the HPLC method for tannic acid. Each analysis began with a calibration
of fresh standards. Figure 24 shows chromatograms of tannic acid calibration standards
ranging from 0.75 ppm to 100 ppm. After analysis of all samples treated with tannic acid,
it was determined that no tannic acid residue was present on the barley grain. A small
peak with the same retention time of tannic acid was present in all samples, including the
untreated samples. This peak may be contributed from tannic acid that naturally occurs in
the barley grain.
Figure 24. Chromatogram of tannic acid calibration standards offset by 0.5 mAU.
52
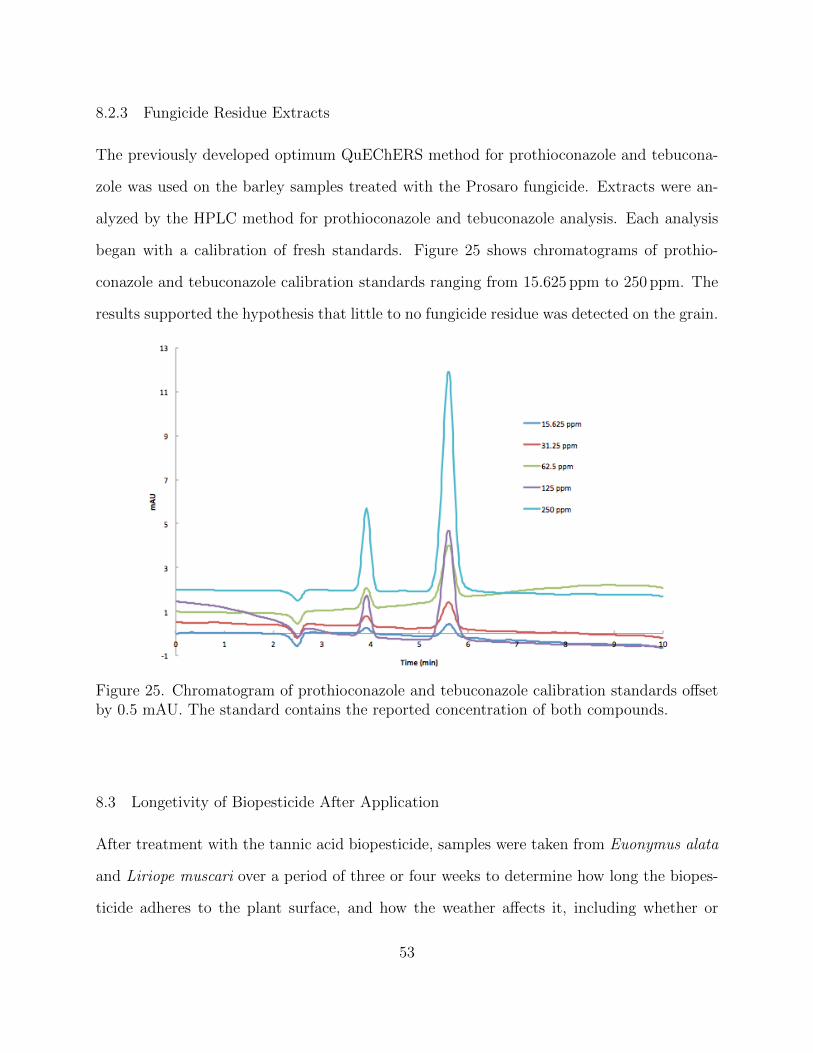
8.2.3 Fungicide Residue Extracts
The previously developed optimum QuEChERS method for prothioconazole and tebucona-
zole was used on the barley samples treated with the Prosaro fungicide. Extracts were an-
alyzed by the HPLC method for prothioconazole and tebuconazole analysis. Each analysis
began with a calibration of fresh standards. Figure 25 shows chromatograms of prothio-
conazole and tebuconazole calibration standards ranging from 15.625 ppm to 250 ppm. The
results supported the hypothesis that little to no fungicide residue was detected on the grain.
Figure 25. Chromatogram of prothioconazole and tebuconazole calibration standards offsetby 0.5 mAU. The standard contains the reported concentration of both compounds.
8.3 Longetivity of Biopesticide After Application
After treatment with the tannic acid biopesticide, samples were taken from Euonymus alata
and Liriope muscari over a period of three or four weeks to determine how long the biopes-
ticide adheres to the plant surface, and how the weather affects it, including whether or
53
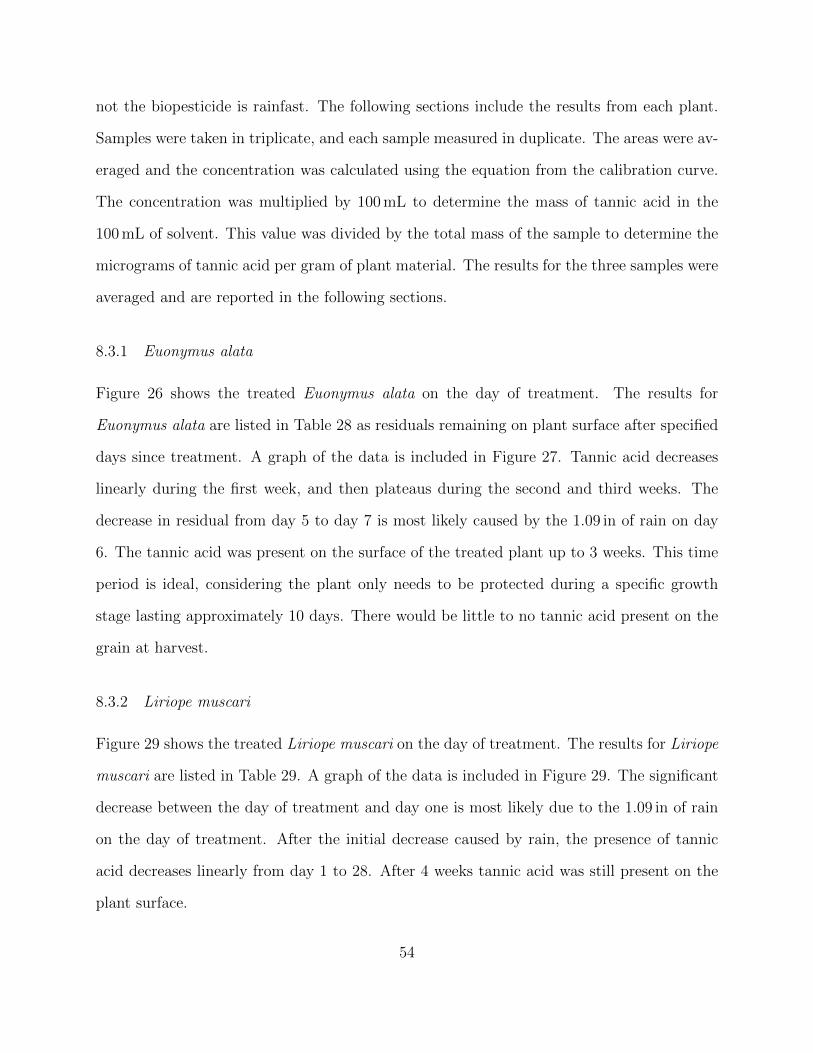
not the biopesticide is rainfast. The following sections include the results from each plant.
Samples were taken in triplicate, and each sample measured in duplicate. The areas were av-
eraged and the concentration was calculated using the equation from the calibration curve.
The concentration was multiplied by 100 mL to determine the mass of tannic acid in the
100 mL of solvent. This value was divided by the total mass of the sample to determine the
micrograms of tannic acid per gram of plant material. The results for the three samples were
averaged and are reported in the following sections.
8.3.1 Euonymus alata
Figure 26 shows the treated Euonymus alata on the day of treatment. The results for
Euonymus alata are listed in Table 28 as residuals remaining on plant surface after specified
days since treatment. A graph of the data is included in Figure 27. Tannic acid decreases
linearly during the first week, and then plateaus during the second and third weeks. The
decrease in residual from day 5 to day 7 is most likely caused by the 1.09 in of rain on day
6. The tannic acid was present on the surface of the treated plant up to 3 weeks. This time
period is ideal, considering the plant only needs to be protected during a specific growth
stage lasting approximately 10 days. There would be little to no tannic acid present on the
grain at harvest.
8.3.2 Liriope muscari
Figure 29 shows the treated Liriope muscari on the day of treatment. The results for Liriope
muscari are listed in Table 29. A graph of the data is included in Figure 29. The significant
decrease between the day of treatment and day one is most likely due to the 1.09 in of rain
on the day of treatment. After the initial decrease caused by rain, the presence of tannic
acid decreases linearly from day 1 to 28. After 4 weeks tannic acid was still present on the
plant surface.
54
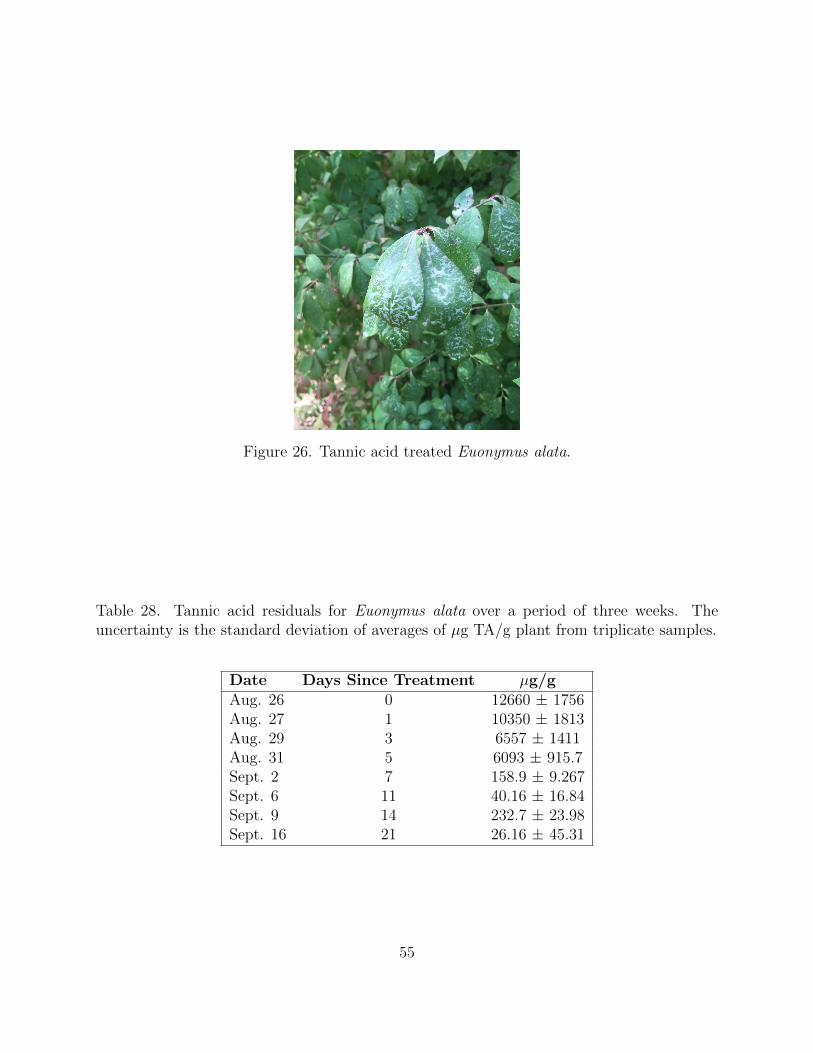
Figure 26. Tannic acid treated Euonymus alata.
Table 28. Tannic acid residuals for Euonymus alata over a period of three weeks. Theuncertainty is the standard deviation of averages of µg TA/g plant from triplicate samples.
Date Days Since Treatment µg/gAug. 26 0 12660 ± 1756Aug. 27 1 10350 ± 1813Aug. 29 3 6557 ± 1411Aug. 31 5 6093 ± 915.7Sept. 2 7 158.9 ± 9.267Sept. 6 11 40.16 ± 16.84Sept. 9 14 232.7 ± 23.98Sept. 16 21 26.16 ± 45.31
55
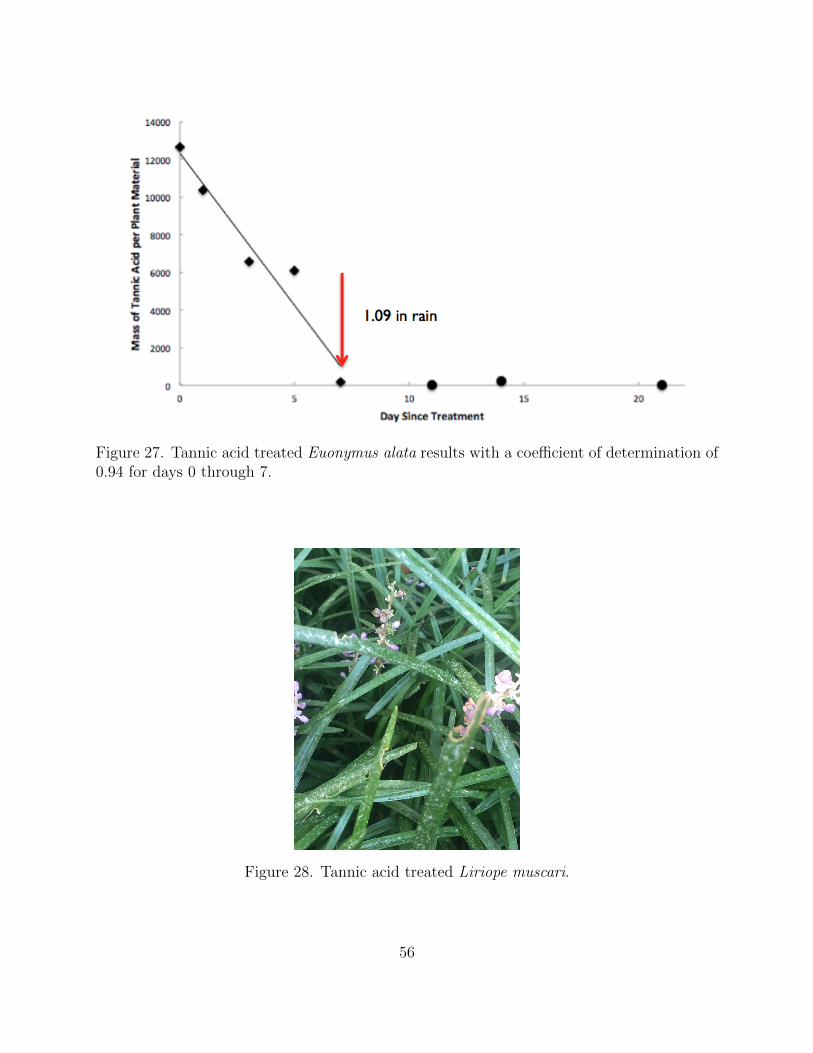
Figure 27. Tannic acid treated Euonymus alata results with a coefficient of determination of0.94 for days 0 through 7.
Figure 28. Tannic acid treated Liriope muscari.
56
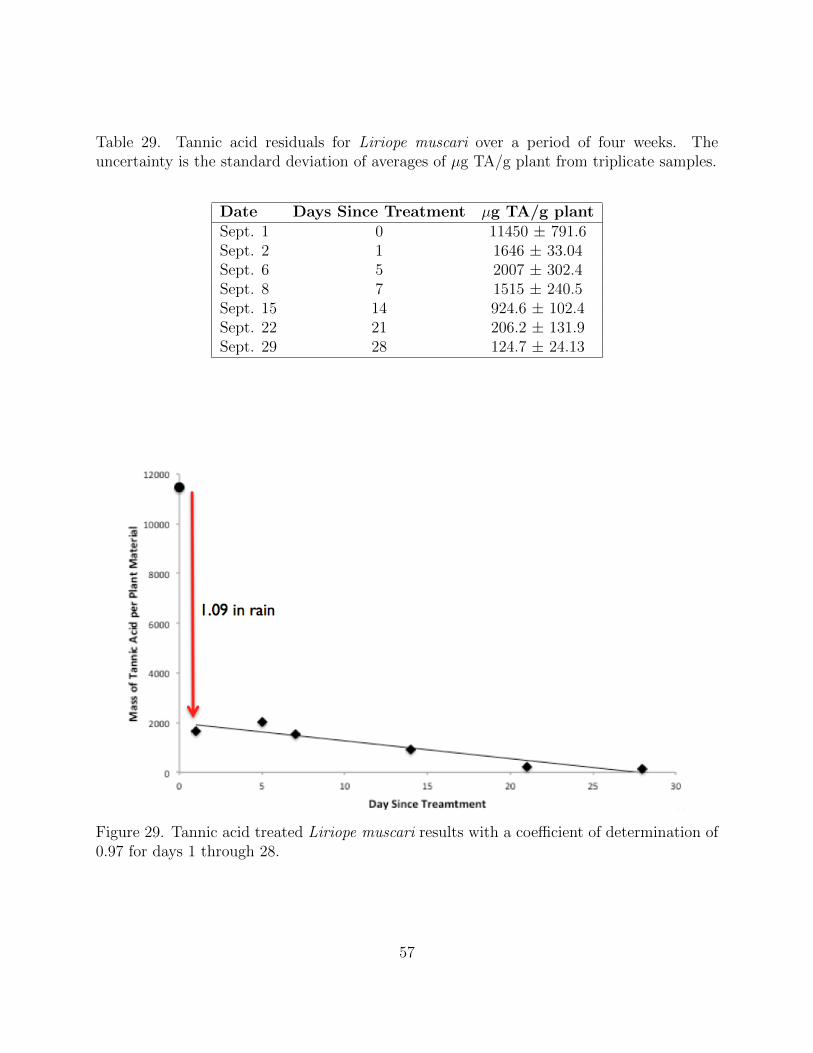
Table 29. Tannic acid residuals for Liriope muscari over a period of four weeks. Theuncertainty is the standard deviation of averages of µg TA/g plant from triplicate samples.
Date Days Since Treatment µg TA/g plantSept. 1 0 11450 ± 791.6Sept. 2 1 1646 ± 33.04Sept. 6 5 2007 ± 302.4Sept. 8 7 1515 ± 240.5Sept. 15 14 924.6 ± 102.4Sept. 22 21 206.2 ± 131.9Sept. 29 28 124.7 ± 24.13
Figure 29. Tannic acid treated Liriope muscari results with a coefficient of determination of0.97 for days 1 through 28.
57
CHAPTER NINE: CONCLUSION
The purpose of this research was to compare a tannic acid biopesticide with a commer-
cial fungicide that is used for crop protection against Fusarium head blight. The commercial
fungicide examined was ProsaroTM, containing prothioconazole and tebuconazole. Analyt-
ical methods were developed to extract and analyze tannic acid or prothioconazole and
tebuconazole residue. The original QuEChERS method was modified to achieve the highest
percent recovery for the tannic acid and the commercial fungicide compounds. HPLC was
used for analysis of the residue extracts. Optimum instrumental parameters were developed
by altering one parameter at a time until a clean chromatogram was achieved.
Using the developed methods, the application and effectiveness of the tannic acid biopes-
ticide were examined. Barley plots were treated with either the tannic acid biopesticide
or the commercial fungicide, and the grain was harvested and analyzed for residuals. The
barley was treated once the heads were just fully emerged, but before grain formation. Since
the grain was not treated directly, it was hypothesized that little to no residue would be
present on the grain. After the grain was analyzed, this hypothesis was supported. There
was little to no residue of tannic acid or prothioconazole and tebuconazole present on the
grain samples from each plot.
The effectiveness of the tannic acid biopesticide was determined by analysis of DON on
the grain samples. Deoxynivalenol, DON, is produced from the Fusarium fungus. Therefore,
a low DON concentration means the sample was slightly infected, whereas a high DON con-
centration means the sample was more infected. An outside party performed these analyses.
The average DON concentrations of the treatments seem to confirm that tannic acid treated
barley is less infected than untreated barley. However, SAS analysis confirms that there is
no significant difference in DON concentration of tannic acid treated barley and untreated
barley.
58
Plants were also treated to determine how long the wax emulsion holds the tannic acid
on the surface of the plant. Euonymus alata and Liriope muscari were the plants treated for
this study. Tannic acid was extracted from the surface of the plants on the day of treatment
and over a period of three or four weeks. Tannic acid was present on Euonymus alata up
to three weeks and on Liriope muscari for up to four weeks. The difference in time may
have been caused by exposure to weather, such as as temperature and precipitation. This
time period is ideal since the plant only needs to be protected during a specific growth
period lasting approximately ten days. This study also determined that the emulsion is
not completely rainfast. After one inch of rainfall the amount of tannic acid on the plant
significantly decreased. Overall, this research suggests promising results for tannic acid to
be effective in inhibiting Fusarium head blight, however, much further research is required.
59
CHAPTER TEN: FUTURE RESEARCH
There are several areas of interest that could be further researched. The tannic acid wax
emulsion could be further explored to achieve a stable formulation with a higher concentra-
tion of tannic acid as well as an emulsion that is more rainfast and able to hold the tannic
acid to the crop longer. Also, determining the concentration of tannic acid needed, as well as
the coverage needed, on the crop to prevent FHB could be researched. The previous research
examined the sprayability of various emulsions with a simple household spray nozzle, how-
ever further research on application methods would be useful. Application methods, such
as a pressurized spray nozzle, would apply better coverage on the crop. This type of nozzle
would also be able to achieve a mist spray with a thicker emulsion containing more wax,
allowing the treatment to be more rainfast.
Continued research on optimizing the extraction method could also be conducted. This
research determined that the use of sodium citrate dibasic sesquihydrate in the partitioning
and buffer extraction step significantly increased the percent recoveries of tannic acid, tebu-
conazole, and prothioconazole. Further trials can be examined with the use of sodium citrate
dibasic sesquihydrate to achieve a better extraction procedure. Longevity studies should be
conducted on barley samples to determine how long tannic acid is held to the surface.
60
REFERENCES
[1] Haynes, W. M., Ed. Handbook of Chemistry and Physics, 97th ed.; CRC Press, 2016.
[2] MacBean, C., Ed. The Pesticide Manual, sixteenth ed.; BCPC: Alton, 2012; pp 956–958,
1063–1065.
[3] Record of Climatological Observations ; 2016.
[4] Cowger, C. personal communication.
[5] Forrer, H.-R.; Musa, T.; Schwab, F.; Jenny, E.; Bucheli, T.; Wettstein, F.; Vogelgsang, S.
Fusarium head blight control and prevention of mycotoxin contamination in wheat with
botanicals and tannic acid. Toxins 2014, 6, 830–849.
[6] EPA, What are biopesticides? 2016; https://www.epa.gov/
ingredients-used-pesticide-products/what-are-biopesticides.
[7] Seiber, J. N.; Coats, J.; Duke, S. O.; Gross, A. D. Biopesticides: state of the art and
future opportunities. Journal of Agricultural and Food Chemistry 2014, 62, 11613–
11619.
[8] Cantrell, C. L.; Dayan, F. E.; Duke, S. O. Natural products as sources for new pesticides.
Journal of Natural Products 2012, 75, 1231–1242.
[9] Kaushik, G.; Satya, S.; Naik, S. N. Food processing a tool to pesticide residue dissipation
- A review. Food Research International 2009, 42, 26–40.
[10] Osborne, L. E.; Stein, J. M. Epidemiology of Fusarium head blight on small-grain
cereals. International Journal of Food Microbiology 2007, 119, 103–108.
61
[11] Grafenhan, T.; Patrick, S. K.; Roscoe, M.; Trelka, R.; Gaba, D.; Chan, J. M.; Mck-
endry, T.; Clear, R. M.; Tittlemier, S. A. Fusarium damage in cereal grains from western
Canada. 1. Phylogenetic analysis of moniliformin-producing Fusarium species and their
natural occurrence in mycotoxin-contaminated wheat, oats, and rye. Journal of Agri-
cultural and Food Chemistry 2013, 61, 5425–5437.
[12] Tittlemier, S. A.; Roscoe, M.; Trelka, R.; Gaba, D.; Chan, J. M.; Patrick, S. K.; Su-
lyok, M.; Krska, R.; Mckendry, T.; Gra, T. Fusarium damage in small cereal grains
from western Canada. 2. Occurrence of Fusarium toxins and their source organisms in
durum wheat harvested in 2010 . Journal of Agricultural and Food Chemistry 2013, 61,
5438–5448.
[13] Lin, T.; Wang, G.; Zhou, Y.; Zeng, D.; Liu, X.; Ding, R.; Jiang, X.; Zhu, D.; Shan, W.;
Chen, H. Structure elucidation and biological activity of two new trichothecenes from an
endophyte, myrothecium roridum. Journal of Agricultural and Food Chemistry 2014,
62, 5993–6000.
[14] Sobrova, P.; Adam, V.; Vasatkova, A.; Beklova, M.; Zeman, L.; Kizek, R. Deoxynivalenol
and its toxicity. Interdisciplinary Toxicology 2010, 3, 94–99.
[15] Wilson, C. L., Wilson, D. W., Eds. Comprehensive Analytical Chemistry ; Elsevier Pub-
lishing Company: Amsterdam, 1968.
[16] Skoog, D. A.; Holler, F. J.; Crouch, S. R. Principles of Instrumental Analysis, sixth ed.;
Cenage Learning: Andover, 2007.
[17] Vernhet, A.; Dubascoux, S.; Cabane, B.; Fulcrand, H.; Dubreucq, E.; Poncet-
Legrand, C. Characterization of oxidized tannins: comparison of depolymerization
methods, asymmetric flow field-flow fractionation and small-angle x-ray scattering. An-
alytical and Bioanalytical Chemistry 2011, 401, 1559–1569.
62
[18] Perez-Jimenez, J.; Neveu, V.; Vos, F.; Scalbert, A. Systematic analysis of the content
of 502 polyphenols in 452 foods and beverages: an application of the phenol-explorer
database. Journal of Agricultural and Food Chemistry 2010, 58, 4959–4969.
[19] Dai, J.; Mumper, R. J. Plant phenolics: extraction, analysis and their antioxidant and
anticancer properties. Molecules 2010, 15, 7313–7352.
[20] Holtekjølen, A. K.; Kinitz, C.; Knutsen, S. H. Flavanol and bound phenolic acid contents
in different barley varieties. Journal of Agricultural and Food Chemistry 2006, 54, 2253–
2260.
[21] Kandil, A.; Li, J.; Vasanthan, T.; Bressler, D. C. Phenolic acids in some cereal grains and
their inhibitory effect on starch liquefaction and saccharification. Journal of Agricultural
and Food Chemistry 2012, 60, 8444–8449.
[22] Yu, J.; Vasanthan, T.; Temelli, F. Analysis of phenolic acids in barley by high-
performance liquid chromatography. Journal of agricultural and food chemistry 2001,
49, 4352–4358.
[23] Yao, L.; Lio, J.; Wang, T.; Jarboe, D. H. Synthesis and characterization of acetylated
and stearylyzed soy wax. J. Am. Oil Chem. Soc. 2013, 90, 1063–1071.
[24] Ballew, S. D. Rheological characteristics of aqueous wax emulsions used for the con-
trolled release of pheromones as an alternative to the use of pesticides for insect pest
managment. M.Sc. thesis, Western Carolina University, Cullowhee, NC USA, 2011.
[25] Furukawa, Y.; Reed, A. H. Effect of organic matter on estuarine flocculation: a labo-
ratory study using montmorillonite, humic acid, xanthan gum, guar gum and natural
estuarine flocs. Geochemical Transactions 2014, 15 .
63
[26] Pscheidt, J. W. Fungicide resistance and fungicide groups. 2016; http://pnwhandbooks.
org/plantdisease/pesticide-articles/fungicide-resistance-and-fungicide-groups.
[27] Andersen, K. F.; Morris, L.; Derksen, R. D.; Madden, L. V.; Paul, P. A. Rainfast-
ness of prothioconazole + tebuconazole for Fusarium head blight and deoxynivalenol
management in soft red winter wheat. Plant Disease 2014, 98, 1398–1406.
[28] Navarro, S.; Perez, G.; Navarro, G.; Mena, L.; Vela, N. Influence of fungicide residues
on the primary fermentation of young lager beer. Journal of Agricultural and Food
Chemistry 2007, 55, 1295–1300.
[29] Wheeler, W. Role of research and regulation in 50 years of pest management in agri-
culture. J. Agric. Food Chem 2002, 50, 4151–4155.
[30] Mathews, K. personal communication.
[31] Walorczyk, S.; Drozdzyriski, D.; Kierzek, R. Determination of pesticide residues in
samples of green minor crops by gas chromatography and ultra performance liquid
chromatography coupled to tandem quadrupole mass spectrometry. Talanta 2015, 132,
197–204.
[32] Takatori, S.; Okihashi, M.; Kitagawa, Y.; Fukui, N. Rapid and easy multiresidue method
for determination of pesticide residues in foods using gas or liquid chromatography
tandem mass spectrometry. Pesticides - Strategies for Pesticide Analysis 2005, 2003,
19 pp.
[33] Anastassiades, M.; Lehotay, S. J. Fast and easy multiresidue method employing acetoni-
trile extraction/partitioning and dispersive solid-phase extraction for the determination
of pesticide residues in produce. Journal of AOAC International 2003, 86, 412–431.
64
[34] Kowalski, J.; Lupo, S.; Cochran, J. Mitigating matrix effects: examination of dilution,
QuEChERS, and calibration strategies for LC-MS/MS analysis of pesticide residues in
diverse food types. Restek 2014, 1–22.
[35] McMaster, M. C. HPLC: A Practical User’s Guide, 2nd ed.; John Wiley & Sons, Inc.:
Hoboken, 2007.
[36] Agilent Technologies, Agilient 1220 Infinity LC User Manual. 2015.
[37] Biswas, N.; Balac, P.; Narlakanti, S. K.; Haque, E.; Hassan, M. Identification of phenolic
compounds in processed cranberries by HPLC method. Journal of Nutrition & Food
Sciences 2013, 3, 1–6.
[38] Lehoczki-krsjak, S. Translocation and degradation of tebuconazole and prothioconazole
in wheat following fungicide treatment at flowering. Pest Management Science 2013,
69, 1216–1224.
65
Copyright © 2022 FDOKUMEN