subpixel location identification using super resolved multilooking chris data
A comparative study on bulk and nanoconfined water by time-resolved optical Kerr effect spectroscopy
16
A comparative study on bulk and nanoconfined water by time-resolved optical Kerr effect spectroscopy Andrea Taschin, a Paolo Bartolini, a Agnese Marcelli, a Roberto Righini ab and Renato Torre * ac Received 24th April 2013, Accepted 28th May 2013 DOI: 10.1039/c3fd00060e The low frequency (n < 500 cm 1 ) vibrational spectra of hydrated porous silica are specifically sensitive to the hydrogen bond interactions and provide a wealth of information on the structural and dynamical properties of the water contained in the pores of the matrix. We investigate systematically this spectral region for a series of Vycor porous silica samples (pore size z 4 nm) at different levels of hydration, from the dry matrix to completely filled pores. The spectra are obtained as the Fourier transforms of time-resolved heterodyne detected optical Kerr effect (HD-OKE) measurements. The comparison of these spectra with that of bulk water enables us to separately extract and analyze the spectral contributions of the first and second hydration layers, as well as that of bulk-like inner water. We conclude that the extra water entering the pores above z10% water/silica weight ratio behaves very similarly to bulk water. At lower levels of hydration, corresponding to two complete superficial water layers or less, the H-bond bending and stretching bands, characteristic of the tetrahedral coordination of water in the bulk phase, progressively disappear: clearly in these conditions the H-bond connectivity is very different from that of liquid water. A similar behavior is observed for the structural relaxation times measured from the decay of the time-dependent HD-OKE signal. The value for the inner water is very similar to that of the bulk liquid; that of the first two water layers is definitely longer by a factor z4. These findings should be carefully taken into account when employing pore confinement to extend towards lower temperatures the accessible temperature range of supercooled water. 1 Introduction The surface interactions between a liquid and a solid produce local modication on both material properties. In particular, the liquid layers at the interface show structural and dynamic alterations that turn into non-trivial modication of the a European lab. for Non-Linear Spectroscopy (LENS), Univ. di Firenze, via N. Carrara 1, I-50019 Sesto Fiorentino, Firenze, Italy. E-mail: [email protected].it b Dip. di Chimica, Univ. di Firenze, via Della Lastruccia 13, I-50019 Sesto Fiorentino, Firenze, Italy c Dip. di Fisica e Astronomia, Univ. di Firenze, via Sansone 1, I-50019 Sesto Fiorentino, Firenze, Italy This journal is ª The Royal Society of Chemistry 2013 Faraday Discuss., 2013, 167, 293–308 | 293 Faraday Discussions Cite this: Faraday Discuss., 2013, 167, 293 PAPER
Transcript of A comparative study on bulk and nanoconfined water by time-resolved optical Kerr effect spectroscopy

Faraday DiscussionsCite this: Faraday Discuss., 2013, 167, 293
PAPER
A comparative study on bulk andnanoconfined water by time-resolved opticalKerr effect spectroscopy
Andrea Taschin,a Paolo Bartolini,a Agnese Marcelli,a Roberto Righiniab
and Renato Torre*ac
Received 24th April 2013, Accepted 28th May 2013
DOI: 10.1039/c3fd00060e
The low frequency (n < 500 cm�1) vibrational spectra of hydrated porous silica are
specifically sensitive to the hydrogen bond interactions and provide a wealth of
information on the structural and dynamical properties of the water contained in the
pores of the matrix. We investigate systematically this spectral region for a series of Vycor
porous silica samples (pore size z 4 nm) at different levels of hydration, from the dry
matrix to completely filled pores. The spectra are obtained as the Fourier transforms of
time-resolved heterodyne detected optical Kerr effect (HD-OKE) measurements. The
comparison of these spectra with that of bulk water enables us to separately extract and
analyze the spectral contributions of the first and second hydration layers, as well as that
of bulk-like inner water. We conclude that the extra water entering the pores above
z10% water/silica weight ratio behaves very similarly to bulk water. At lower levels of
hydration, corresponding to two complete superficial water layers or less, the H-bond
bending and stretching bands, characteristic of the tetrahedral coordination of water in
the bulk phase, progressively disappear: clearly in these conditions the H-bond
connectivity is very different from that of liquid water. A similar behavior is observed for
the structural relaxation times measured from the decay of the time-dependent HD-OKE
signal. The value for the inner water is very similar to that of the bulk liquid; that of the
first two water layers is definitely longer by a factor z4. These findings should be
carefully taken into account when employing pore confinement to extend towards lower
temperatures the accessible temperature range of supercooled water.
1 Introduction
The surface interactions between a liquid and a solid produce local modicationon both material properties. In particular, the liquid layers at the interface showstructural and dynamic alterations that turn into non-trivial modication of the
aEuropean lab. for Non-Linear Spectroscopy (LENS), Univ. di Firenze, via N. Carrara 1, I-50019 Sesto
Fiorentino, Firenze, Italy. E-mail: [email protected]. di Chimica, Univ. di Firenze, via Della Lastruccia 13, I-50019 Sesto Fiorentino, Firenze, ItalycDip. di Fisica e Astronomia, Univ. di Firenze, via Sansone 1, I-50019 Sesto Fiorentino, Firenze, Italy
This journal is ª The Royal Society of Chemistry 2013 Faraday Discuss., 2013, 167, 293–308 | 293

Faraday Discussions Paper
fundamental chemical–physical properties of the liquid. Thus, in case ofcomplete spatial connement the behaviour of the liquid is determined by itsinterfacial properties.1
The investigation and study of conned liquids is relevant to a broad variety ofscientic topics, spanning from biology to geophysics. Recently, studies aimed tounderstand water anomalies have boosted a large interest on the proprieties ofwater conned in silica nanopores. It is well known that a number of chemical–physical properties of bulk water differ from those of the other liquids.2,3 Inparticular the temperature dependence of several experimental observables haveunexpected and counter-intuitive behaviours. For example, some thermodynamicquantities (e.g. isothermal compressibility, isobaric heat capacity) show a sharpincrease upon cooling and as well, some dynamic features (e.g. viscosity andstructural relaxation time) present a critical slowing down when temperature islowered. Many experimental and simulation works suggested the existence of awater singularity temperature, Ts, around 223–228 K at atmospheric pressure,which should reect the existence of a critical process taking place in the super-cooled water phase (i.e. the metastable non-equilibrium phase that water enterswhen it is cooled below the melting point and crystallization does not take place).The nature of this critical phenomenon is still largely debated: some authorspostulate the existence of a liquid–liquid phase transition,4,5 another approach seesthe water anomalies as non-equilibrium phenomena precursory of the liquid–crystal transition.6 Moreover, the relevance of ice spontaneous nucleation has beenrecognized.7,8 A relevant experimental drawback is that the critical evidence isexpected to occur at temperature/pressure values not directly accessible in bulksamples, and this prevents a direct experimental solution of the problem; homo-geneous nucleation xes the lowest reachable temperature at about 231 K for bulkwater. Actually, in a macroscopic bulk sample the crystallization phenomena andthe experimental difficulties limit the minimum temperatures around 243 K.
Nanoconnement has the advantage of preventing water freezing and ofenabling the experimental investigation of the supercooled phase down to verylow temperatures. Nevertheless, the water crystallization doesn't take place only ifthe connement is very tight, reaching the nanometric length scale. Already theconnement of water in silica nanopores of 10 nm diameter produces a loweringof the crystallization temperature of about 15 degrees. In order to maintain thewater liquid approaching Ts a connement of about 2.5 nm is required,9 in pore ofdiameter #2 nm water remains in a liquid-like phase also below that singularitytemperature.10
Here comes the basic question: to what extent do the interactions with the poresurfaces modify the water properties?
The debate on this issue is open.11–22 All the researchers agree that somestructural and dynamic properties of water at the silica interface are modiedfrom those of the bulk liquid, but there is no agreement about if these modi-cations involve also the water fraction situated in the inner part of the pore, not indirect contact with the surface.
In order to give a contribution to the understanding of this problem, weundertook a comparative investigation of bulk and nanoconned water by meansof time-resolved optical Kerr effect spectroscopy.
Because of the intrinsic experimental difficulties, time-resolved non-linearspectroscopy23 has been adopted in a limited number of cases to investigate the
294 | Faraday Discuss., 2013, 167, 293–308 This journal is ª The Royal Society of Chemistry 2013

Paper Faraday Discussions
dynamics of nanoconned liquids. Optical Kerr effect experiments (OKE) provedto be capable of measuring the sub-picosecond dynamics of liquids insidenanopores;24 the transient grating technique has been utilized to study slowerdynamical processes in liquid lled nanoporous glasses.11,25–29 In a previousstudy30 the effect of nanoconnement on the relaxation dynamics of liquid waterhas been investigated by OKE experiments.
Here we present an experimental investigation of nanoconned water byheterodyne detected optical Kerr effect spectroscopy. By using an improved exper-imental set-up,31,32 we were able to measure the entire water dynamics, includingthe vibrational components not previously investigated. Moreover, the precisedetermination of the instrumental function, the very good signal-to-noise level ofthe acquired data and the wide dynamic range investigated enabled us to Fouriertransform the measured data into the frequency domain with very high accuracy.
2 Optical Kerr effect experiments
In an optical Kerr effect (OKE) experiment33,34 a linear-polarized short laser pulse(the pump) induces a transient birefringence in an optically transparent medium.The induced birefringence is measured by monitoring the polarization changesproduced in second laser pulse (the probe), which is spatially superimposed withthe pump pulse into the sample. The time behaviour of the induced birefringenceis reconstructed by changing the time delay between the pump and probe.
The resulting signal reects the relaxation and vibrational response of themolecules in the sample. The method enables to measure the fast relaxationprocesses and the low frequency vibrational correlation functions of the system byemploying femtosecond laser pulses. OKE techniques enable measurements in awide time window (from tens of femtoseconds to hundreds of picoseconds) and isable to reveal very different dynamic regimes, from that typical of simple liquidsto that characterizing supercooled liquids and glass formers.35–39
In our case, the laser system is a self-mode-locked Ti:sapphire laser producingpulse of 20 fs duration with energy of 3 nJ. A detailed description of the optical set-up and of the experimental apparatus is reported in ref. 31, 32. We adopted apeculiar conguration for the heterodyne detection,40 with a circularly polarizedprobe beam and differential acquisition of two opposite-phase signals on abalanced double photodiode. Thus, the measured OKE signal is automaticallyheterodyned and free from possible spurious signals. Finally, the photodiodeoutput signal is processed by a lock-in amplier phase locked to the referencefrequency at which the pump beam is chopped.
With optical heterodyne detection, the OKE signal is directly proportional tothe material response function, R(t), convoluted with the instrumental function,G(t). The response R(t) is directly connected to the time derivative of the time-dependent correlation function of the dielectric susceptibility:33,34
RðtÞf� v
vt
�cðtÞcð0Þ� (1)
The Fourier transform of R(t) corresponds to the frequency-dependentresponse measured in depolarized light scattering (DLS) experiments.33,34
In order to get access to the OKE response, the knowledge of the correctinstrumental functionG(t) is fundamental, especially for the short delay time range.
This journal is ª The Royal Society of Chemistry 2013 Faraday Discuss., 2013, 167, 293–308 | 295

Faraday Discussions Paper
This is particularly critical for weak signals characterized by complex relaxationdynamics, as in the case of bulk water or conned water. In short, the critical pointin the acquisition of the instrumental function is that any minor, apparentlynegligible, adjustment of the optical set-up when passing from recording theinstrumental function to measuring the water signal, prevents the extraction of thecorrect instrumental function. The resulting inaccurate deconvolution of the watersignal degrades the quality of the overall tting. To minimize these effects, G(t) wasobtained in our experiment by measuring the OKE signal of a CaF2 plate of thesame thickness as the Vycor sample placed side by side in the same cell. Theswitching from the water measurement conguration to the instrumental one wasachieved by simply translating the cell perpendicularly to the optical axis of theexperiment without even touching the rest of optical set-up.32
Our samples are Vycor slabs (code 7930 by Corning Company) of 8 � 8 �2mm3 dimensions, with porosity 28% of volume, internal surface area S¼ 250m2
g�1, average pore diameter of 4 nm and density of 1.5 g cm�3 (in dry condition),according to the manufacturer technical data sheet. The samples were cleanedwith 35% hydrogen peroxide solution (heating up to 90 �C for 2 h) and washed indistilled water. They were then stored in P2O5 (phosphoric anhydride) until use.All the measurements have been carried out at room temperature.
The HD-OKE experiments require a very good optical quality of the samplesinvestigated. Vycor porous glass is among the few porous glasses having a solidstructure that enables preparation of macroscopic samples with polished surfacesof optical quality.
In spite of the good surface quality, the Vycor samples have, especially at lowhydration level, an intrinsic scattering ability, probably due to the presence ofsome heterogeneities whose size is comparable to the laser wavelength. Part of thescattered pump light propagates collinearly to the probe and interferes with it onthe photodetector, giving rise to an unwanted signal. This spurious contributionappears only during the time superposition of the two pulses and degrades thequality of the OKE data at very short delay time. This disturbing signal wasremoved by inserting a piezo-driven vibrating mirror in the optical path of thepump arm. We set the amplitude of the mirror stroke and the frequency ofthe sinusoidal driving signal in a way that the induced frequency modulationtransfers the spectral content of the spurious signal out of the acceptance band ofthe lock-in amplier (the bandwidth is determined by the chopper frequency andby the bandwidth of the notch-lter at the lock-in amplier input). This deviceallowed us to almost completely remove the unwanted contribution.
3 Results on bulk liquid water
The hydrogen bond network largely determines the intra- and inter-molecularvibrational spectrum of liquid water; thus the experimental investigation of thespectral features gives precious information on the local H-bond network struc-tures. The investigation of the high frequency vibrational spectrum, 1000–4000 cm�1, gives access to the intramolecular vibrational dynamics. The lowfrequency spectrum of water, n < 1000 cm�1, reects its intermolecular dynamicsand so it is particularly sensitive to local molecular structures. This frequencyrange of the water spectrum has been investigated in several light scatteringstudies, see for example ref. 41–47. Two main broad peaks are observed around
296 | Faraday Discuss., 2013, 167, 293–308 This journal is ª The Royal Society of Chemistry 2013
Paper Faraday Discussions
50 and 175 cm�1 at room temperature, generally attributed to the hydrogen bond“bending” and “stretching” vibrations, respectively. The spectra show also a verylow frequency wing, n < 10 cm�1, which has been attributed to “relaxation”processes.42 The light scattering data were measured at relatively high tempera-tures and have rather poor signal-to-noise ratio due to the very weak water signal.These drawbacks did not enable identication of all the possible vibrationalmodes possibly contributing to the water spectrum in this region. Time-resolvednon-linear spectroscopy has been shown in recent years to be a very useful tool forthe investigation of complex liquid dynamics,23,33 and in particular of liquidwater.32,38,48–51 Recent heterodyne-detected optical Kerr effect (HD-OKE) investi-gations of liquid water32,38 at temperature below the melting point (i.e. in thesupercooled phase) report interesting evidence of critical phenomena.
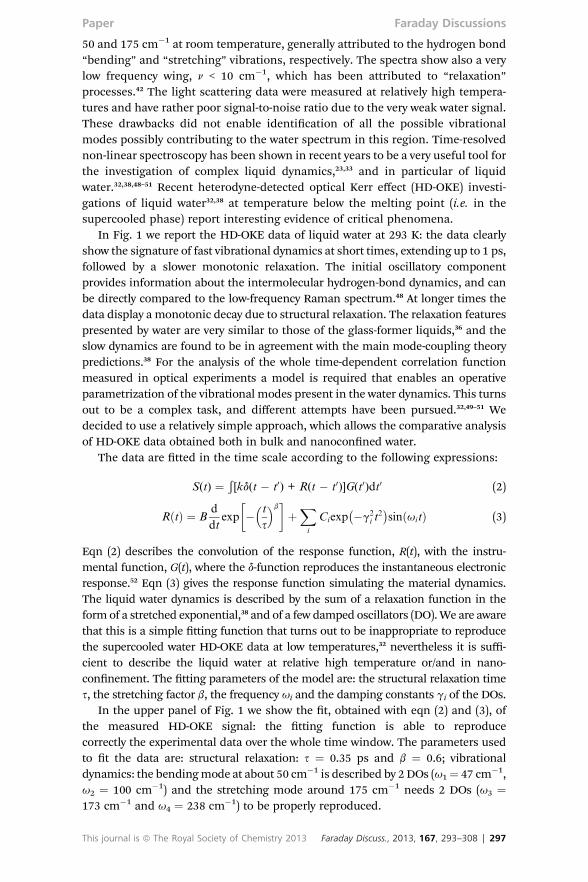
In Fig. 1 we report the HD-OKE data of liquid water at 293 K: the data clearlyshow the signature of fast vibrational dynamics at short times, extending up to 1 ps,followed by a slower monotonic relaxation. The initial oscillatory componentprovides information about the intermolecular hydrogen-bond dynamics, and canbe directly compared to the low-frequency Raman spectrum.48 At longer times thedata display a monotonic decay due to structural relaxation. The relaxation featurespresented by water are very similar to those of the glass-former liquids,36 and theslow dynamics are found to be in agreement with the main mode-coupling theorypredictions.38 For the analysis of the whole time-dependent correlation functionmeasured in optical experiments a model is required that enables an operativeparametrization of the vibrational modes present in the water dynamics. This turnsout to be a complex task, and different attempts have been pursued.32,49–51 Wedecided to use a relatively simple approach, which allows the comparative analysisof HD-OKE data obtained both in bulk and nanoconned water.
The data are tted in the time scale according to the following expressions:
S(t) ¼ Ð[kd(t � t0) + R(t � t0)]G(t0)dt0 (2)
RðtÞ ¼ Bd
dtexp � t
s
� �b� �
þXi
Ciexp��g2
i t2sinðuitÞ (3)
Eqn (2) describes the convolution of the response function, R(t), with the instru-mental function, G(t), where the d-function reproduces the instantaneous electronicresponse.52 Eqn (3) gives the response function simulating the material dynamics.The liquid water dynamics is described by the sum of a relaxation function in theform of a stretched exponential,38 and of a few damped oscillators (DO).We are awarethat this is a simple tting function that turns out to be inappropriate to reproducethe supercooled water HD-OKE data at low temperatures,32 nevertheless it is suffi-cient to describe the liquid water at relative high temperature or/and in nano-connement. The tting parameters of the model are: the structural relaxation times, the stretching factor b, the frequency ui and the damping constants gi of the DOs.
In the upper panel of Fig. 1 we show the t, obtained with eqn (2) and (3), ofthe measured HD-OKE signal: the tting function is able to reproducecorrectly the experimental data over the whole time window. The parameters usedto t the data are: structural relaxation: s ¼ 0.35 ps and b ¼ 0.6; vibrationaldynamics: the bendingmode at about 50 cm�1 is described by 2 DOs (u1¼ 47 cm�1,u2 ¼ 100 cm�1) and the stretching mode around 175 cm�1 needs 2 DOs (u3 ¼173 cm�1 and u4 ¼ 238 cm�1) to be properly reproduced.
This journal is ª The Royal Society of Chemistry 2013 Faraday Discuss., 2013, 167, 293–308 | 297

Fig. 1 We report here a HD-OKE data of bulk water at 293 K. In the upper panel, the experimental dataare reported in the time scale with the best fit result (red line). The data are reported on a log–linearscale. In the lower panel, we show the HD-OKE response function Fourier transform in the frequencydomain. The water spectrum displays the two main vibrational bands: bending and stretching locatedaround 50 and 175 cm�1, respectively.
Faraday Discussions Paper
The HD-OKE data, collected in time domain, can be Fourier transformed in thefrequency domain to yield the corresponding spectra. This enables a more imme-diate visualization of the different vibrational modes present in the water dynamicsand a direct comparison with the depolarized light scattering experiments.23,32,33 Inorder to get the spectra of the HD-OKE response function, we need to: i) Fouriertransform themeasured data, ii) deconvolute them from the instrumental responseand iii) retain the imaginary part of it, i.e. Im[~R(n)] f Im{FT[S(t)]/FT[G(t)]}. Thedetails about these procedures are reported by Taschin et al.32
The Im[~R(n)] obtained from the HD-OKE data and the corresponding ts arereported in the lower panel of Fig. 1. The frequency response shows clearly themain vibrational features present in the liquid water spectrum: the two bandsaround 50 and 175 cm�1, the “bending” and “stretching”modes. These vibrationsare characteristic of the intermolecular dynamics of the rst neighbour molecularcage,53–55 that for liquid water are largely determined by the hydrogen bonds. Theshoulder appearing at very low frequency, n < 10 cm�1, is due to the relaxation
298 | Faraday Discuss., 2013, 167, 293–308 This journal is ª The Royal Society of Chemistry 2013

Paper Faraday Discussions
processes. As expected, this feature is hardly detectable in the frequency domain,whereas the vibrational modes are clearly visible.
4 Results on nanoconfined water4.1 Hydration control and FT-IR spectroscopy
We studied Vycor glasses characterized by variable water lling, from “dry” to“fully hydrated”. The hydrophilic properties of porous silica samples depend onthe degree of surface hydroxylation, i.e. on the amount of Si–OH groups. Thisquantity determines the potential hydration rate of the surface and may inuencealso the structure of the rst water layer, in which the molecules interact with thesilanol groups. In the literature, silanols are oen indicated as chemical (orchemisorbed) water, as they are the result of dissociative chemisorption of watermolecules onto the silica surface, while the molecular water interacting with thesurface is referred to as physical (or physisorbed) water.56,57
In spite of the amount of work done on this subject, water lling in silicananopores is still a debated issue.13,58 Basically, two different hypothesis havebeen formulated. According to the rst model, water lls the pore following alayer by layer process until the full hydration level is reached.58 A second differentlling process has been described in a recent study:13 at low hydration level waterlls the pore forming the rst layer, as in the previous model, but at higherhydration water starts to form liquid plugs connecting the pore surfaces thatcoexist with the surface-adsorbed water.
Fourier Transform Infrared (FT-IR) spectroscopy is a valid tool to qualitativelyand quantitatively characterize the hydration process of porous glass. Spectrawere recorded by an ALPHA FT-IR spectrometer (Bruker Optics) in the range of4200–5500 cm�1, where two absorption bands can be well-distinguished atz4550 and z5260 cm�1 arising from combination of stretching and bendingmodes of silanol and water, respectively.59
Dry samples were obtained by heating Vycor at 400 �C for 10 h, while samplesat different hydration levels were prepared by exposing dry Vycor slabs to a wateratmosphere for 12 h in closed vials, previously purged with nitrogen. Sampleswith different amounts of water lled nanopores were obtained via a vapor phaseexothermic transfer from the bulk.60 The water concentration in each sample wasadjusted adding different volumes of bulk water into the vial containing Vycor bymeans of a microsyringe. Aer this procedure, all the samples were weighed tocheck the water content and immediately closed into a hermetic cell for spec-troscopic measurements. No signicant variation of the sample mass was foundaer the OKE measurements.
The hydration level can be quantify using the Filling Fraction parameter: f ¼H2O (g) / Vycor (g). This is dened as the ratio between the weight of water con-tained into Vycor glass and the weight of the borosilicate glass composing theVycor matrix. Even if the heating temperature of 400 �C is above the temperatureneeded to remove the absorbed physical water, some re-absorption occurs duringthe cooling process and the weighing procedure. Indeed, in the spectrum of theVycor sample recorded aer heating (upper panel of Fig. 2) the absorption band ofwater at 5260 cm�1 has very low intensity. From the area of this band we canestimate the actual amount of physical water le in the Vycor glass. From themolar integrated absorption coefficient, 3H2O ¼ 0.22 (cm mmol�1),59 we estimated
This journal is ª The Royal Society of Chemistry 2013 Faraday Discuss., 2013, 167, 293–308 | 299

Fig. 2 Upper panel: FTIR spectrum of Vycor after heating the sample up to 400 �C for 10 h. Theabsorption bands of silanol and water are indicated. In the inset, we show the variation of the area valueof the water band atz5260 cm�1 as a function of hydration level. This is measured by the filling fraction,f, defined as the ratio between water and silica weights. Lower panel: The absorption band of water onpartially filled Vycor glass at variable hydration levels, f. The absorption band recorded in bulk water47 isalso reported.
Faraday Discussions Paper
that the concentration of water in the sample was equal to f ¼ 0.1%. Thus weobtained a good measure of the mass of the completely dehydrated slab.
In summary, we prepared samples at 6 hydration levels, whose water contentwas accurately determined from their weights: f ¼ 0.10 � 0.02%, f ¼ 3.3 � 0.2%,f ¼ 5.6 � 0.3%, f ¼ 8.5 � 0.4%, f ¼ 10.5 � 0.5% and f ¼ 24.3 � 0.9%. We canconsider the rst sample as substantially “dry” Vycor, in fact at this hydration thenumber of water molecules inside the pores is much less than the number ofsilanol groups present on the pore surface. On account of the porous glassproperties, the hydration of 5.6% ensures enough water inside pores to generatethe “rst layer”, i.e. the full coverage of the pore surface with a mono-molecularwater layer. The sample with 10.5% hydration contains about “two layers”,whereas the sample with 24.3% hydration is in the “full hydration” condition.60
We veried that for the partially hydrated samples the integrated absorption arealinearly increases with the absorbed water concentration (see the inset of Fig. 2).The spectrum of “dry” Vycor also shows a prominent band at 4550 cm�1 due tosilanol absorption. Its integrated area value allowed us to evaluate the OH surfaceconcentration, in accordance with the following relationship:
300 | Faraday Discuss., 2013, 167, 293–308 This journal is ª The Royal Society of Chemistry 2013

Paper Faraday Discussions
nOH ¼ Area
3OHl� 1
r� 1
S� 10�24 �NA (4)
where nOH indicates the number of OH groups per nm2, 3OH is the molar inte-grated absorption coefficient (0.16 cm mmol�1),59 l, r and S are the thickness(0.2 cm), the density (1.5 g cm�3) and the internal surface area (250 m2 g�1),respectively, and NA is Avogadro's number. We obtained a value of 5 OH per nm2,in agreement with the results obtained by Zhuravlev56 on silica surface of amor-phous materials. The determination based on the integrated absorption coeffi-cient of the silanol band has the advantage that it does not signicantly vary in thepresence of H-bonding with surrounding water molecules.
Moreover, the comparison between the absorption spectra of physical water,reported in the lower panel of Fig. 2, clearly indicates that the structure of waterdrastically changes as a function of water content. The bandmaximum is red-shiedwith increasing water concentration, f, while a broad absorption grows below5200 cm�1, gradually approaching the spectral prole of bulk water. The sharp peakat z5260 cm�1 is reasonably assigned to vibrations of monomeric water, theH-bonding interactions can reasonably lead to the broad red-shied absorption. Thelatter band is present even at the lowest water concentration (<5%), showing thatwater aggregation occurs before full surface coverage is attained.
4.2 HD-OKE data
We measured the HD-OKE response at room temperature, 293 K, of the six Vycorsamples at different hydration levels ( f ¼ 0.1%, 3.3%, 5.6%, 8.5%, 10.5% and24.3%) described in the previous section. The experimental results are collectedin Fig. 3. The upper panel shows a log–linear plot of the data in the short timerange; the results for longer delay times are shown in the lower panel in a linear–linear plot. Just a simple look at the data reveals several differences between thewater-in-Vycor and that of bulk water shown in Fig. 1. The data measured atdifferent hydration levels enable disentanglement of the nanoconned watersignal from the contribution of the dry Vycor matrix. As shown in Fig. 3, the signalof dry Vycor ( f ¼ 0.1%) displays a relatively slow oscillation extending in thepicosecond time-scale. According to our t, it corresponds to an oscillatory modecharacterized by a frequency of n z 5 cm�1 and it likely due to an acoustic-likevibration localized on the pore surface.61 The presence of liquid water adds amonotonic decay that becomes the dominant feature at full hydration; thiscontribution is attributed to the relaxation processes of nanoconned water.
The fast vibrational components visible in the upper panel of Fig. 3 are rathercomplex: their characteristic features become clearer when transformed into thefrequency domain. In order to t the HD-OKE signal we use the equation introducedin the previous section, see eqn (2) and (3). The response functionmust be completedto include the dry Vycor matrix response, Rdry(t). So the complete response becomes:
RðtÞ ¼ ARdryðtÞ þ Bd
dtexp �
�ts
�b� �
þXi
Ciexp��g2
i t2sinðuitÞ (5)
We simulated the Rdry(t) response as the sum of a series of damped oscillatorsand exponential functions, whose characteristic parameters were determined bytting of the HD-OKE signal of the dry sample ( f ¼ 0.1%).
This journal is ª The Royal Society of Chemistry 2013 Faraday Discuss., 2013, 167, 293–308 | 301

Fig. 3 HD-OKE data of nanoconfined water at 293 K and at variable hydration levels, from dry condition,f ¼ 0.1%, to full hydration, f ¼ 24.3%. Full circles: experimental data; continuous line: best fit results. In theupper panel the data are reported in a log–linear plot. In the lower panel the signal decays at longer timesare shown in linear–linear plot. The data have been vertically shifted to make all kinetics clearly visible.
Faraday Discussions Paper
The best t procedure enables one to get the structural relaxation times ofnanoconned water and these are reported in Table 1. As expected, the amplitudeof the structural relaxation component decreases with the hydration level, sothat at f ¼ 3.3% it becomes unmeasurable. Moreover, it is impossible toextract a reliable value for the stretching exponent; we then xed it to the bulkvalue b ¼ 0.6. The results collected in Table 1 show that the structural relaxationtime does not vary appreciably on going from hydration f ¼ 5.6% to 10.5%,whereas the f ¼ 24.3% sample is characterized by a faster relaxation process.
302 | Faraday Discuss., 2013, 167, 293–308 This journal is ª The Royal Society of Chemistry 2013

Table 1 Structural relaxation parameters obtained by the best fitting of HD-OKE data. f is the fillingfraction, s the relaxation time and b the stretching parameter
f (%) s (ps) b
5.6 1.6 � 0.3 0.68.5 1.4 � 0.3 0.610.5 1.6 � 0.3 0.624.3 0.45 � 0.10 0.6
Paper Faraday Discussions
The structural relaxation time of nanoconned water at full hydration is indeedcomparable to the bulk water time, s¼ 0.35 ps. On the contrary, when the degree ofhydration is less than two water layers, the structural relaxation experiences a clearslowing down, with an increase of the characteristic time scale of about a factor of 4.In principle, the structural relaxation of fully hydrated Vycor results from thesuperposition of the contributions of the inner water (faster) and of the surfacelayers (slower). Actually, our data analysis is not able to detect any slow decayingcomponent in the OKE results for the f¼ 24.3% sample. The direct measurement ofthe distinct relaxation times of inner and surface water in fully hydrated samples isin fact a very arduous experimental task, which is only viable when the characteristictime constants are very different. The structural relaxation timemeasured in the fullhydrated sample corresponds probably to a weighted average of the interfacial andinner dynamics. We notice also that in weakly hydrated pores the surface water facessilica on one side and air on the other one, while in fully hydrated samples the outerlayers are in contact with silica and with the inner water: their dynamics might notbe the same in the two cases. In this respect, computer simulations are of great help,as they allow disentangling of the structural and dynamical features of the interfacialwater; the differences in the two cases mentioned above are shown to be minor.58
In summary, our results suggest that the collective rearrangements of inter-facial and inner water are characterized by similar structural processes (bothrequire a stretched exponential function to be properly reproduced), but withclearly different characteristic time scales. The dynamics of the inner water doesnot differ noticeably from that of bulk water. These ndings are in agreementwith several computer simulations19,58,62,63 and experiments;64–67 but in partialcontradiction with the results reported by Scodinu and Fourkas30 on the basis ofan OKE investigation of water conned in a similar, but not identical, nanoporousglass. According to this work in fact, the structural relaxation of the inner water infully hydrated samples is slower than that of bulk water.
In Fig. 4 we report the Fourier transform of the measured response functionaer deconvolution from the instrumental response, using the proceduresummarized in the previous section and described in detail in ref. 32. In the mainpanel of Fig. 4 we show the spectra obtained by Fourier transformation of theHD/OKE data of Fig. 3. The dry Vycor sample, f ¼ 0.1%, shows a frequencyspectrum extending up to 500 cm�1 characterized by a broad peak at about100 cm�1. We notice also a narrow peak at about 5 cm�1, hardly visible in thegure, whose nature was previously discussed in connection to the description ofthe time domain HD-OKE data, and a peak at 800 cm�1, not shown in the gure.Apart from the 5 cm�1 band, the dry Vycor spectra resemble closely the spectrumof amorphous SiO2, as measured by depolarized Raman experiments.68 The
This journal is ª The Royal Society of Chemistry 2013 Faraday Discuss., 2013, 167, 293–308 | 303

Fig. 4 Fourier transforms of the HD-OKE data, deconvoluted from the instrumental response, atdifferent filling fractions: from dry condition, f¼ 0.1%, to full hydration, f¼ 24.3%. In the inset we reportthe same data after subtraction of the dry Vycor signal; The spectra give the contribution of nano-confined water.
Faraday Discussions Paper
presence of liquid water inside the Vycor pores causes an evident increase of thevibrational intensity in the frequency range from 20–350 cm�1. In order to extractthe contribution of nanoconned water, we subtract from the data the dry Vycorspectrum, i.e. that for f¼ 0.1%; the result is reported in the inset of Fig. 4. At 3.3%hydration the spectrum of nanoconned water is featureless; there is no signatureof characteristic bending and stretching water peaks. At higher hydration, f ¼5.6%, the spectrum is unchanged in the high frequency part, n > 200 cm�1, whileon the low frequency side a weak signature of the bending peak appears. Thespectra at the two highest levels of hydration show a growing presence of thebending and stretching features. These results are in agreement with a lightscattering investigation of water conned in a similar nanoporous glass.65
The present data suggest the following scenario for the dynamics of nano-conned water.
Up to f¼ 5.6%, corresponding to one water layer, only “interfacial water” existsinside the Vycor pores. This water is in direct contact with the surfaces, it is linkedby the H-bonds formed with the silanol groups present on the surface. The waterH-bonding network of water is strongly modied by the surface interactions,these modications affect the intermolecular vibration spectrum. Our data showthat this spectrum doesn't show any specic signature, suggesting a large networkdistortion characterized by a wide distribution of angles and distances. Moreover,the structural relaxation is much slower than in bulk water suggesting a stronghindrance of the collective rearrangement and/or diffusion process.
Starting from f ¼ 10.5%, i.e. two water layers or pore plugs, some of the watermolecules can form H-bonds with other water molecules without having a directlink to the surface silanol groups. In other words, we have some “inner water”.
304 | Faraday Discuss., 2013, 167, 293–308 This journal is ª The Royal Society of Chemistry 2013

Paper Faraday Discussions
This water presents a liquid structure that resembles bulk water. The vibrationalpart of our data partially supports this point of view, even if the measured spec-trum still presents several differences from that of bulk water. The measuredintermolecular vibrations indicate that an H-bond network of nanoconned wateris characterized by deformations, which are larger and more numerous than infree bulk water. Also, the structural phenomena are strongly affected by thesurface interactions, as proved by the slowing down of the structural relaxation.
Under full hydration conditions, f ¼ 24.3%, both the slow structural processesand the fast vibrational dynamics become similar to those of bulk water. Thissuggests that in this case the inner water shows several dynamic characteristicsreminiscent of the bulk liquid water.
4.3 Comparison of bulk and nano-conned water dynamics
The direct comparison of nanoconned and bulk water spectra, see the upperpanel of Fig. 5, makes differences and similarities immediately evident. Clearly,both spectra display the bending and stretching vibrational bands.
Fig. 5 Upper panel: comparison of the HD-OKE response function in the frequency of bulk water (redline) and nanoconfined water (blue circles). Lower panel: decomposition of the total HD-OKE spectrumof nanoconfined water in the interfacial (red circles) and inner (blue circles) contributions.
This journal is ª The Royal Society of Chemistry 2013 Faraday Discuss., 2013, 167, 293–308 | 305

Faraday Discussions Paper
The low frequency part of the spectra, n < 50 cm�1, is mainly characterized bythe large intensity difference of the band attributed to structural relaxation; thisspectral component is much weaker in nanoconned water, and this causes asteeper rise of the low frequency side of the bending band. At higher frequencies,the bending and stretching vibrational bands appear in both cases, but they areless denite in nanoconned water then in bulk water. This is probably ascribableto a larger inhomogeneous broadening of those modes, due to the contribution ofwater in contact with the silica surfaces. At room temperature the water spectrumabove 300 cm�1 is generally attributed to librational modes;54 in nanoconnedwater we observe a depletion of the librational components in this spectral region.In other words, it seems that nanoconnement hinders the orientational oscil-latory dynamics.
Assuming that progressive hydration simply adds contributions to the HD-OKE signal, we applied a decomposition procedure in order to recover separatelythe contributions of interfacial and inner water dynamics.
The spectra of interfacial water is immediately obtained by subtracting the f ¼0.1% spectrum, assumed to represent that of the dry Vycor matrix, from thespectrum of the f ¼ 5.6% sample. The difference spectrum represents thecontribution of the rst water layer. By subtracting this interfacial water spectrumand that of the dry Vycor matrix from the spectrum measured for the fullyhydrated sample ( f ¼ 24.3%) we nally extracted the spectral contribution of theinner water. The results of this decomposition procedure are reported in the lowerpanel of Fig. 5. The interfacial water shows a very broad spectrum lacking thespectral features characteristic of the bulk phase. This unambiguous evidenceproves that the H-bond network of interfacial water is substantially different fromthat of bulk water. Not surprisingly, the spectrum of inner water is largely similarto that of the bulk; in particular, the bending and stretching bands are presentand well dened. The librational features of the spectrum above 300 cm�1 areweakly present both in interfacial and inner water. In contrast, in the lowfrequency part (n < 50 cm�1) of the inner water spectrum we notice the sameintensity reduction of the structural relaxation component observed in nano-conned water.
As a nal conclusion, we can try to give an answer to the initial question askingto what extent the interaction with the pore surfaces modies the water proper-ties. According to our results for hydration levels f $ 10.5%, part of the nano-conned water presents structural and vibrational properties similar to those ofbulk water. In other words, the liquid water added inside the pores above the f ¼10.5% amount has large similarities with that characterizing the bulk waterstructure. At this level it is not possible to establish whether this is indicative ofthe presence of liquid plugs in the pores, or can be taken as evidence of theexistence of real liquid polls. Nevertheless, we would like to stress that the secondwater layer, even if not in direct contact with silica surface, has dynamic prop-erties differing from those of bulk water. The van der Waals diameter of a watermolecule is of the order of 0.3 nm,47 so the thickness of the rst two water layerscovers about 1.2 nm of the pore diameter. If the pore diameter is 4 nm, as it is inVycor porous glasses, there are about 4–5 layers of inner water; but if the porediameter reduces below 1.5 nm there is no space available for inner water layerand all the water molecules are in the rst or second layer. This suggests thatwhen water is conned in a hydrophilic narrow pore, practically all the water
306 | Faraday Discuss., 2013, 167, 293–308 This journal is ª The Royal Society of Chemistry 2013

Paper Faraday Discussions
molecules interact effectively with the surfaces, either directly (i.e rst interfaciallayer) or indirectly by water–water H-bonds (i.e second layer).
We believe that the ndings reported in this work should be carefully takeninto account when employing pore connement in attempts to approach exper-imentally the putative singularity temperature Ts around 225 K in the supercooledphase of water.
Acknowledgements
The research has been performed at LENS. This work was supported by RegioneToscana POR-CRO-FSE 2007–2013 by EC COST Action MP0902-COINAPO. Weacknowledge M. De Pas and A. Montori for providing their continuous assistancein the set-up of the electronics; R. Ballerini and A. Hajeb for the mechanicalrealizations; M. Pucci for the optical treatments of Vycor glasses.
References
1 I. Brovchenko and A. Oleinikova, Interfacial and Conned Water, Elsevier, 2008.2 P. Debenedetti and H. E. Stanley, Phys. Today, 2003, 56, 40.3 P. Debenedetti, J. Phys.: Condens. Matter, 2003, 15, R1669–R1726.4 P. H. Poole, F. Sciortino, U. Essmann and H. E. Stanley, Nature, 1992, 360, 324–328.5 P. H. Poole, R. K. Bowles, I. Saika-Voivod and F. Sciortino, J. Chem. Phys., 2013, 138,034505.
6 D. T. Limmer and D. Chandler, J. Chem. Phys., 2011, 135, 134503.7 E. B. Moore and V. Molinero, J. Chem. Phys., 2009, 130, 244505.8 E. B. Moore and V. Molinero, Nature, 2011, 479, 506.9 S. Jahnert, F. Vaca Chavez, G. E. Schaumann, A. Schreiber, M. Schonhoff andG. H. Findenegg, Phys. Chem. Chem. Phys., 2008, 10, 6039.
10 M. Oguni, Y. Kanke, A. Nagoe and S. Namba, J. Phys. Chem. B, 2011, 115, 14023–9.11 A. Taschin, R. Cucini, P. Bartolini and R. Torre, Europhys. Lett., 2010, 92, 26005.12 P. Gallo, M. Rovere and S.-H. Chen, J. Phys. Chem. Lett., 2010, 1, 729.13 E. de la Llave, V. Molinero and D. A. Scherlis, J. Chem. Phys., 2010, 133, 034513.14 S. Capaccioli, K. Ngai, S. Ancherbak, P. Rolla and N. Shinyashiki, J. Non-Cryst. Solids,
2011, 357, 641654.15 S. L. Caer, S. Pin, S. Esnouf, Q. Raffy, J. P. Renault, J.-B. Brubach, G. Creff and P. Roy, Phys.
Chem. Chem. Phys., 2011, 13, 17658.16 X. Limei and M. Valeria, J. Phys. Chem. B, 2011, 115, 14210.17 D. Banerjee, S. N. Bhat, S. V. Bhat and D. Leporini, PLoS One, 2012, 7, e44382.18 D. T. Limmer and D. Chandler, J. Chem. Phys., 2012, 137, 044509.19 A. A. Milischuk, V. Krewald and B. M. Ladanyi, J. Chem. Phys., 2012, 136, 224704.20 F. G. Alabarse, J. Haines, O. Cambon, C. Levelut, D. Bourgogne, A. Haidoux, D. Granier
and B. Coasne, Phys. Rev. Lett., 2012, 109, 035701.21 N. Giovambattista, P. Rossky and P. Debenedetti, Annu. Rev. Phys. Chem., 2012, 63,
179.22 C. E. Bertrand, Y. Zhang and S.-H. Chen, Phys. Chem. Chem. Phys., 2013, 15, 721–45.23 R. Torre, Time-Resolved Spectroscopy in Complex Liquids, an experimental perspective,
Springer, New York, 2008.24 R. A. Farrer and J. T. Fourkas, Acc. Chem. Res., 2003, 36, 605–12.25 R. Cucini, A. Taschin, C. Ziparo, P. Bartolini and R. Torre, Eur. Phys. J. Spec. Top., 2007,
141, 133–136.26 A. Taschin, R. Cucini, C. Ziparo and R. Torre, Philos. Mag., 2007, 87, 715–722.27 A. Taschin, R. Cucini, P. Bartolini and R. Torre, Europhys. Lett., 2008, 81, 58003.28 R. Cucini, A. Taschin, P. Bartolini and R. Torre, J. Mech. Phys. Solids, 2010, 58, 1302–
1317.29 R. Cucini, A. Taschin, P. Bartolini and R. Torre, J. Phys.: Conf. Ser., 2010, 214, 012032.30 A. Scodinu and J. T. Fourkas, J. Phys. Chem. B, 2002, 106, 10292–10295.31 P. Bartolini, A. Taschin, R. Eramo, R. Righini and R. Torre, J. Phys.: Conf. Ser., 2009, 177,
012009.32 A. Taschin, P. Bartolini, R. Eramo, R. Righini and R. Torre, Nat. Commun., 2013, 2401,
DOI: 10.1038/ncomms3401.
This journal is ª The Royal Society of Chemistry 2013 Faraday Discuss., 2013, 167, 293–308 | 307

Faraday Discussions Paper
33 N. T. Hunt, A. A. Jaye and S. R. Meech, Phys. Chem. Chem. Phys., 2007, 9, 2167–2180.34 P. Bartolini, A. Taschin, R. Eramo and R. Torre, in Optical Kerr Effect Experiments on
Complex Liquids, A Direct Access to Fast Dynamic Processes, ed. R. Torre, Springer, NewYork, 2008, ch. 2, pp. 73–127.
35 R. Torre, P. Bartolini and R. Pick, Phys. Rev. E: Stat. Phys., Plasmas, Fluids, Relat.Interdiscip. Top., 1998, 57, 1912–1920.
36 R. Torre, P. Bartolini, M. Ricci and R. Pick, Europhys. Lett., 2000, 52, 324–329.37 M. Ricci, P. Bartolini and R. Torre, Philos. Mag. B, 2002, 82, 541–551.38 R. Torre, P. Bartolini and R. Righini, Nature, 2004, 428, 296–298.39 M. Ricci, S. Wiebel, P. Bartolini, A. Taschin and R. Torre, Philos. Mag., 2004, 84, 1491–
1499.40 G. Giraud, C. Gordon, I. Dunkin and K. Wynne, J. Chem. Phys., 2003, 119, 464–477.41 S. Krishnamurthy, R. Bansil and J. Wiafe-Akenten, J. Chem. Phys., 1983, 79, 5863–5870.42 F. Aliotta, C. Vasi, G. Maisano, D. Majolino, F. Mallamace and P. Migliardo, J. Chem.
Phys., 1986, 84, 4731.43 G. Walrafen, M. Fisher, M. Hokmabadi and W.-H. Yang, J. Chem. Phys., 1986, 85, 6970.44 J. L. Rousset, E. Duval and A. Boukenter, J. Chem. Phys., 1990, 92, 2150.45 K. Mizoguchi, Y. Hori and Y. Tominaga, J. Chem. Phys., 1992, 97, 1961.46 A. Sokolov, J. Hurst and D. Quitmann, Phys. Rev. B: Condens. Matter, 1995, 51, 12865.47 M. Chaplin, http://www.lsbu.ac.uk/water/, 2013.48 E. Castner, Y. Chang, Y. Chu and G. Walrafen, J. Chem. Phys., 1995, 102, 653–659.49 S. Palese, S. Mukamel, R. Miller and W. Lotshaw, J. Phys. Chem., 1996, 100, 10380.50 K. Winkler, J. Lindner and P. Vohringer, Phys. Chem. Chem. Phys., 2002, 4, 2144–2155.51 B. Ratajska-Gadomska, B. Biakowski, W. Gadomski and C. Radzewicz, Chem. Phys. Lett.,
2006, 429, 575–580.52 R. W. Hellwarth, Prog. Quantum Electron., 1977, 5, 1–68.53 M. Skaf and M. Sonoda, Phys. Rev. Lett., 2005, 94, 137802.54 A. DeSantis, A. Ercoli and D. Rocca, J. Chem. Phys., 2004, 120, 1657.55 J. A. Padro and J. Martı, J. Chem. Phys., 2004, 120, 1659.56 L. T. Zhuravlev, Colloids Surf., A, 2000, 173, 1–38.57 A. Burneau, J. Lepage and G. Maurice, J. Non-Cryst. Solids, 1997, 217, 1–10.58 P. Gallo, M. Ricci and M. Rovere, J. Chem. Phys., 2002, 116, 342.59 J.-P. Gallas, J.-M. Goupil, A. Vimont, J.-C. Lavalley, B. Gil, J.-P. Gilson and O. Miserque,
Langmuir, 2009, 25, 5825–5834.60 E. Tombari, G. Salvetti, C. Ferrari and G. P. Johari, Phys. Chem. Chem. Phys., 2005, 7,
3407–3411.61 T. Woignier, J. Sauvajol, J. Pelous and R. Vacher, J. Non-Cryst. Solids, 1990, 121, 206–210.62 P. Gallo, M. Rovere and E. Spohr, J. Chem. Phys., 2000, 113, 11324.63 A. a. Milischuk and B. M. Ladanyi, J. Chem. Phys., 2011, 135, 174709.64 J. Zanotti, M. Bellissent-Funel and S. Chen, Phys. Rev. E: Stat. Phys., Plasmas, Fluids, Relat.
Interdiscip. Top., 1999, 59, 3084–3093.65 V. Crupi, A. Dianoux, D. Majolino, P. Migliardo and V. Venuti, Phys. Chem. Chem. Phys.,
2002, 4, 2768–2773.66 V. Crupi, D. Majolino, P. Migliardo, V. Venuti and M. C. Bellissent-Funel, Mol. Phys.,
2003, 101, 3323–3333.67 F. Mallamace, C. Corsaro, S.-H. Chen and H. E. Stanley, in Liquid Polymorphism, ed. H. E.
Stanley, John Wiley & Sons, 2013, vol. 152, ch. 10, p. 203.68 O. Pilla, A. Fontana, S. Caponi, F. Rossi, G. Viliani, M. Gonzalez, E. Fabiani and
C. Varsamis, J. Non-Cryst. Solids, 2003, 322, 53.
308 | Faraday Discuss., 2013, 167, 293–308 This journal is ª The Royal Society of Chemistry 2013