
Baba Chris, Elf Bhajan Book, New improved alphabetical edition
Upload
andhrauniversityCategory
view
0download
0
SUB PIXEL LOCATION IDENTIFICATION USING SUPER RESOLVED MULTILOOKING
CHRIS DATA
aV.Satya Sahithi, bShefali Agrawal.
a Centre for Space Science and Technology Education in Asia and Pacific, IIRS, Dehradun, India.
Email: [email protected] b Indian Institute of Remote Sensing, Dehradun, India.
Email: [email protected]
Commission VIII, WG VIII/8
Keywords: CHRIS multiviewing hyperspectral images, Super Resolution Reconstruction, simple interpolation, classification, accuracy
assessment, sub pixel location identification.
ABSTRACT
CHRIS /Proba is a multiviewing hyperspectral sensor that monitors the earth in five different zenith - -
– 1050 nm in mode 3. These multiviewing images are suitable for
constructing a super resolved high resolution image that can reveal the mixed pixel of the hyperspectral image. In the present work, an
attempt is made to find the location of various features constituted within the 17m mixed pixel of the CHRIS image using various super
resolution reconstruction techniques. Four different super resolution reconstruction techniques namely interpolation, iterative back
projection, projection on to convex sets (POCS) and robust super resolution were tried on the -36, nadir and +36 images to construct a
super resolved high resolution 5.6m image. The results of super resolution reconstruction were compared with the scaled nadir image and
bicubic convoluted image for comparision of the spatial and spectral property preservance. A support vector machine classification of the
best super resolved high resolution image was performed to analyse the location of the sub pixel features. Validation of the obtained
results was performed using the spectral unmixing fraction images and the 5.6m classified LISS IV image.
1. INTRODUCTION
The space borne hyperspectral remote sensing sensors monitor the
earth in moderate to coarse spatial resolution. The moderate
spatial resolution of these hyperspectral sensors leads to mixed
pixels in the image which contain information from more than
one feature on the ground. Many image processing techniques
like image fusion, spectral unmixing, fuzzy classification etc.,
were attempted which helped in revealing the mixed pixel of the
hyperspectral images. However these techniques can only give the
proportion of the features within the pixel but are unable to find
the location of the features within a mixed pixel. A mixed pixel
captured with multiple view angles can help in resolving the
features within the pixel. The multiangle imaging systems have
their applications in the fields of quantification of vegetation
structure, Bidirectional Reflectance Distribution Function
(BRDF) model development and retrieval of geophysical
parameters of agricultural crops etc. One such multi angle
viewing sensor called Compact High Resolution Imaging
Spectrometer (CHRIS) was launched in October, 2001 with
hyperspectral capability.
CHRIS is a hyperspectral sensor of European Space Agency
having multi-viewing capability with a narrow bandwidth and
programmable spectral channels. It has an ability to monitor the
- - , +36°,
+55° with a spatial resolution of 17- 36m and with a spectral
resolution of 18 - 36 bands in the range of 400 - 1050nm. It
monitors the earth in five different modes with varying spatial and
spectral properties. The most commonly used mode3 is meant for
landuse/landcover application having a spectral resolution of 18
bands with a spectral sampling of 2 - 3nm at the blue end of the
spectrum to 12nm at the 1050nm range and a spatial resolution of
17m. These multiangle viewing images can be used for resolving
the mixed pixel as these incorporate additional information
through the multiple views. Hence, the present work aims at
constructing a 5.6m high resolution image from multiangular
CHRIS low resolution images using super resolution
reconstruction techniques which can be used for locating the
position of various features within the 17m mixed pixel.
Super Resolution Reconstruction (SRR) is an image processing
technique used for generating a high resolution image from the
‘ ’ b x low resolution images. These low
resolution images can be multi looking scenes of the same area,
sub pixel shifted, aliased, blurred or decimated images of the
same area or object. SRR techniques are first proposed by Tsang
and Huang in 1984 in frequency domain to construct a high
resolution image (HR) from several observed low resolution
Landsat TM images (LR images) (Zhang et al., 2012) with sub-
pixel displacements (Tsai and Huang, 1984). A closely related
q SRR ‘
q ’
interpolation techniques like nearest neighborhood, bicubic,
cubic, spline etc. But, interpolation techniques do not use any
additional information and hence result in an image with lower
quality. Hence, super resolution reconstruction in spatial domain
can be treated as an improved version of these where the spatial
quality of the image can be improved without losing the spectral
properties. The two important steps for a successful
reconstruction are – 1) a proper registration of the LR images and
2) establishing a proper relation between the LR and HR images.
The International Archives of the Photogrammetry, Remote Sensing and Spatial Information Sciences, Volume XL-8, 2014ISPRS Technical Commission VIII Symposium, 09 – 12 December 2014, Hyderabad, India
This contribution has been peer-reviewed. doi:10.5194/isprsarchives-XL-8-463-2014
463

If X is the HR image, Y is the set of LR images, N is the noise
vector, then the relationship between the HR image and the LR
image sets can be formulated as
Y=HX+N (1)
H = , k = 1,2,3,4…n (2)
Where n is the number of pixels in the image, Dk is the sub
sampling matrix, Ck represents the blur matrix that represents the
blurring effects that occur during the acquisition, Fk is a warp
matrix that represents the shift and rotation of the LR images.
There are various algorithms that are used for super resolution
reconstruction like interpolation based, set theory based
approaches, statistical regularization approaches and many others
including robust super resolution technique, iterative back
projection etc. The IBP technique (Kim and Bose, 1990) starts
with making a rough estimate of the HR image by decimating one
of the available LR images which is again down sampled to
simulate the observed LR images. The difference of the observed
and the simulated LR images is repeatedly back projected to
minimize the initial guess until the difference is minimized.
Robust super resolution (Zomet et al., 2001) is an improved
version of IBP where ‘ ’
is back projected repeatedly along with an additional bias
correction applied at the end.
Jonathan Cheung-Wai Chan et.al., (Chan) made a review on the
performance of various super resolution techniques – bicubic
interpolation, Non-uniform interpolation, Total Variation, POCS
and IBP on CHRIS/ Proba images to obtain a 9m resolution data
set and the SR enhanced data sets have been tested for
classification and unmixing purposes. According to the studies
made by Galbrith et.al., 2005, mul
cannot be used for super resolution rec
q
-
reconstructing the high resolution image.
2. METHODS AND MATERIALS
2.1. Study area
The study area (Fig 1) is a part of Suratgarh area of Sri
Ganganagar district, Rajasthan, India. It falls under the latitude
29 2 ’ ”N 29 2 ’ ”N ’
”E 2’ 2 ”E average elevation of 174m above
the mean sea level. A small part of the study area which is found
to be unchanged in the CHRIS and LISS IV images was
considered for super resolution reconstruction. The considered
area constitutes various types of agricultural crops like wheat,
mustard, gram etc. and hardened sand dunes covered with scrubs.
2.2. Materials used
The CHRIS multiviewing sensor of ESA onboard PROBA
mission is used for SRR. The high resolution LISS IV image is
used for validation.
Sensor Acquisiti
on date
Number
of
bands
Spatial
Resolution
Swath
CHRIS
(Mode
3)
29th
February,
2008
18 17m 14km
LISS 4 1st
March,
2009
3 5m 23km
The methodology adopted is shown in fig 1.
3. RESULTS AND DISCUSSIONS
The CHRIS data was radiometrically corrected for vertical stripes
and unwanted noise using a weighted averaging technique and
then both the CHRIS and LISS IV datasets were atmospherically
corrected using model based atmospheric correction modules. The
atmospherically corrected LISS IV images were geo-corrected
2 GCP’ used for co-registering the CHRIS nadir
and angular images.
Fig 2. Methodology adopted for the present work
Fig 1. Study area and considered subset
Table1. Datasets used for the study
The International Archives of the Photogrammetry, Remote Sensing and Spatial Information Sciences, Volume XL-8, 2014ISPRS Technical Commission VIII Symposium, 09 – 12 December 2014, Hyderabad, India
This contribution has been peer-reviewed. doi:10.5194/isprsarchives-XL-8-463-2014
464
3.1. Scaling and bicubic interpolation
Scaling and bicubic convolution are the most commonly adopted
methods for increasing and reducing the size of the image. Hence,
initially the image was scaled using nearest neighborhood
technique and also using the bicubic interpolation was performed
using the same scale factor (s=3 in this study) the results of which
are presented in fig 4. It was observed that the nearest
neighbourhood (NN) scaling added the same value to the
corresponding new 9 pixels and had crispness at the boundaries of
the linear features like roads and boundaries. On the other hand,
the bicubic convolution process smoothened the image and also a
loss in the spectral information of the features at the boundaries
was noticed due to the averaging of the surrounding 16 pixels.
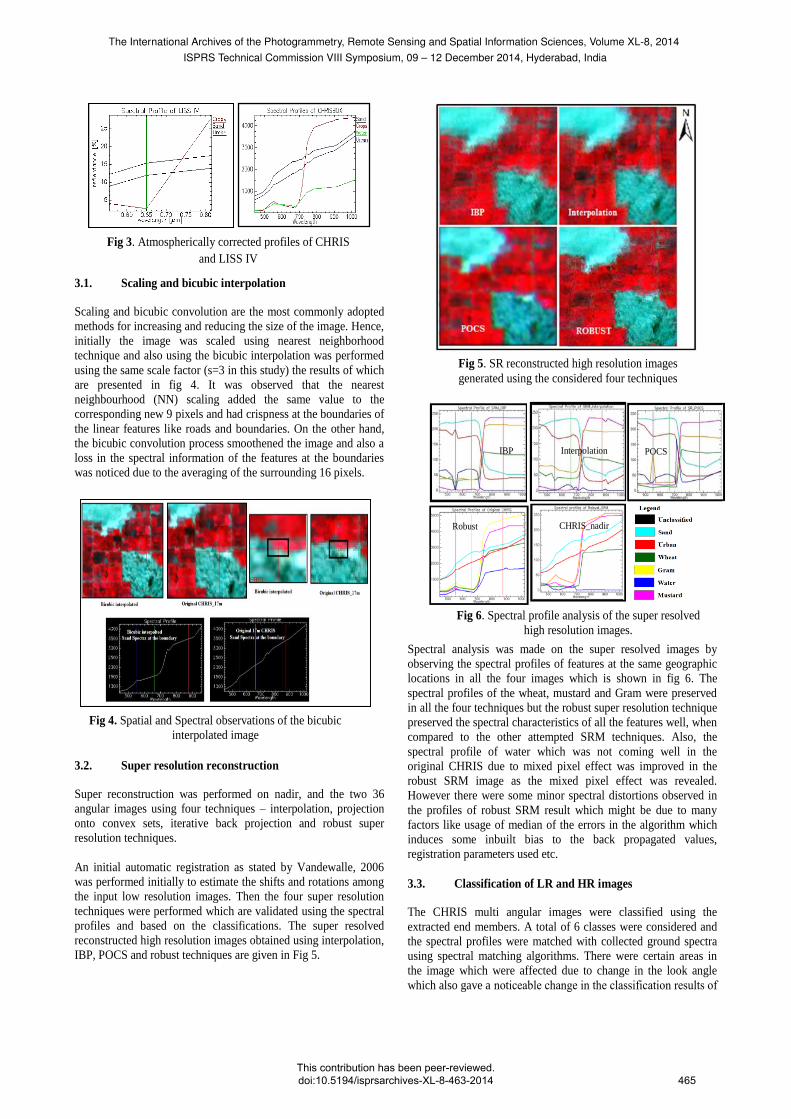
3.2. Super resolution reconstruction
Super reconstruction was performed on nadir, and the two 36
angular images using four techniques – interpolation, projection
onto convex sets, iterative back projection and robust super
resolution techniques.
An initial automatic registration as stated by Vandewalle, 2006
was performed initially to estimate the shifts and rotations among
the input low resolution images. Then the four super resolution
techniques were performed which are validated using the spectral
profiles and based on the classifications. The super resolved
reconstructed high resolution images obtained using interpolation,
IBP, POCS and robust techniques are given in Fig 5.
Spectral analysis was made on the super resolved images by
observing the spectral profiles of features at the same geographic
locations in all the four images which is shown in fig 6. The
spectral profiles of the wheat, mustard and Gram were preserved
in all the four techniques but the robust super resolution technique
preserved the spectral characteristics of all the features well, when
compared to the other attempted SRM techniques. Also, the
spectral profile of water which was not coming well in the
original CHRIS due to mixed pixel effect was improved in the
robust SRM image as the mixed pixel effect was revealed.
However there were some minor spectral distortions observed in
the profiles of robust SRM result which might be due to many
factors like usage of median of the errors in the algorithm which
induces some inbuilt bias to the back propagated values,
registration parameters used etc.
3.3. Classification of LR and HR images
The CHRIS multi angular images were classified using the
extracted end members. A total of 6 classes were considered and
the spectral profiles were matched with collected ground spectra
using spectral matching algorithms. There were certain areas in
the image which were affected due to change in the look angle
which also gave a b
Fig 3. Atmospherically corrected profiles of CHRIS
and LISS IV
Fig 6. Spectral profile analysis of the super resolved
high resolution images.
6b
Fig 4. Spatial and Spectral observations of the bicubic
interpolated image
Fig 5. SR reconstructed high resolution images
generated using the considered four techniques
IBP POCS Interpolation
Robust CHRIS_nadir
The International Archives of the Photogrammetry, Remote Sensing and Spatial Information Sciences, Volume XL-8, 2014ISPRS Technical Commission VIII Symposium, 09 – 12 December 2014, Hyderabad, India
This contribution has been peer-reviewed. doi:10.5194/isprsarchives-XL-8-463-2014
465
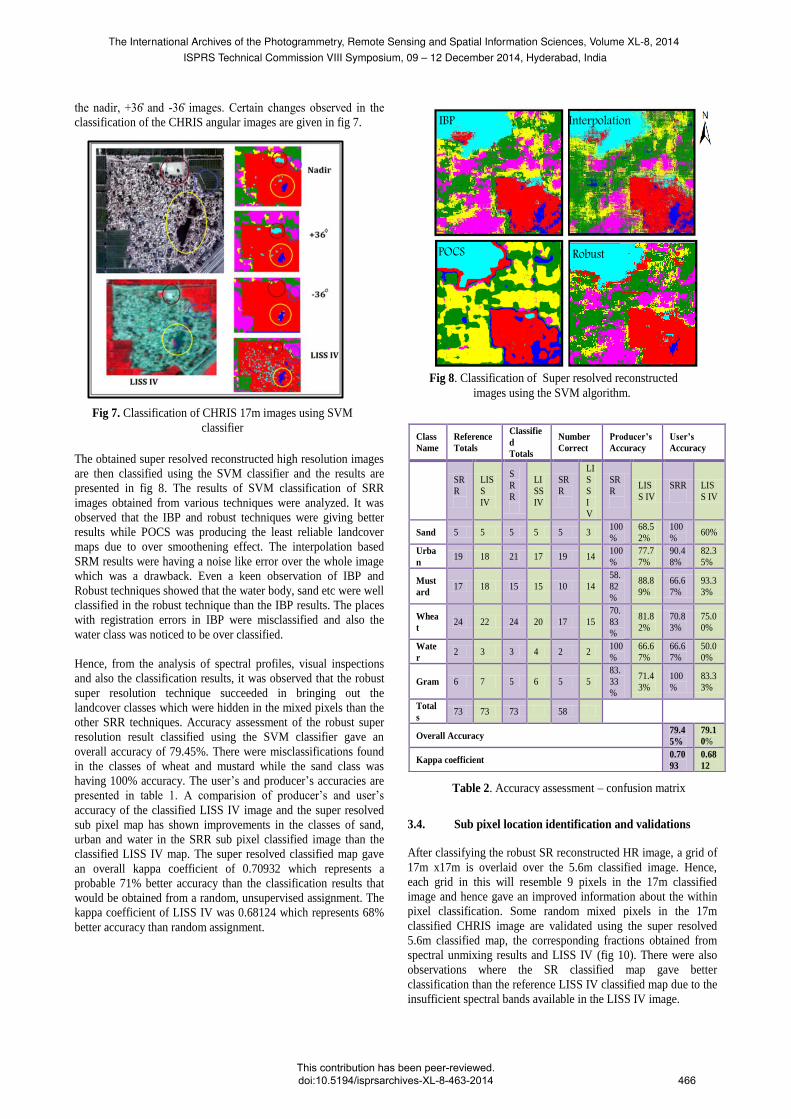
- C b
classification of the CHRIS angular images are given in fig 7.
The obtained super resolved reconstructed high resolution images
are then classified using the SVM classifier and the results are
presented in fig 8. The results of SVM classification of SRR
images obtained from various techniques were analyzed. It was
observed that the IBP and robust techniques were giving better
results while POCS was producing the least reliable landcover
maps due to over smoothening effect. The interpolation based
SRM results were having a noise like error over the whole image
which was a drawback. Even a keen observation of IBP and
Robust techniques showed that the water body, sand etc were well
classified in the robust technique than the IBP results. The places
with registration errors in IBP were misclassified and also the
water class was noticed to be over classified.
Hence, from the analysis of spectral profiles, visual inspections
and also the classification results, it was observed that the robust
super resolution technique succeeded in bringing out the
landcover classes which were hidden in the mixed pixels than the
other SRR techniques. Accuracy assessment of the robust super
resolution result classified using the SVM classifier gave an
overall accuracy of 79.45%. There were misclassifications found
in the classes of wheat and mustard while the sand class was
having 100% accuracy. The user’s and producer’s accuracies are
b A ’ ’
accuracy of the classified LISS IV image and the super resolved
sub pixel map has shown improvements in the classes of sand,
urban and water in the SRR sub pixel classified image than the
classified LISS IV map. The super resolved classified map gave
an overall kappa coefficient of 0.70932 which represents a
probable 71% better accuracy than the classification results that
would be obtained from a random, unsupervised assignment. The
kappa coefficient of LISS IV was 0.68124 which represents 68%
better accuracy than random assignment.
3.4. Sub pixel location identification and validations
After classifying the robust SR reconstructed HR image, a grid of
17m x17m is overlaid over the 5.6m classified image. Hence,
each grid in this will resemble 9 pixels in the 17m classified
image and hence gave an improved information about the within
pixel classification. Some random mixed pixels in the 17m
classified CHRIS image are validated using the super resolved
5.6m classified map, the corresponding fractions obtained from
spectral unmixing results and LISS IV (fig 10). There were also
observations where the SR classified map gave better
classification than the reference LISS IV classified map due to the
insufficient spectral bands available in the LISS IV image.
Class
Name
Reference
Totals
Classifie
d
Totals
Number
Correct
Producer’s
Accuracy
User’s
Accuracy
SR
R
LIS
S
IV
S
R
R
LI
SS
IV
SR
R
LI
S
S
I
V
SR
R
LIS
S IV
SRR
LIS
S IV
Sand 5 5 5 5 5 3 100
%
68.5
2%
100
% 60%
Urba
n 19 18 21 17 19 14
100
%
77.7
7%
90.4
8%
82.3
5%
Must
ard 17 18 15 15 10 14
58.
82
%
88.8
9%
66.6
7%
93.3
3%
Whea
t 24 22 24 20 17 15
70.
83
%
81.8
2%
70.8
3%
75.0
0%
Wate
r 2 3 3 4 2 2
100
%
66.6
7%
66.6
7%
50.0
0%
Gram 6 7 5 6 5 5
83.
33
%
71.4
3%
100
%
83.3
3%
Total
s 73 73 73 58
Overall Accuracy 79.4
5%
79.1
0%
Kappa coefficient 0.70
93
0.68
12
Fig 8. Classification of Super resolved reconstructed
images using the SVM algorithm.
Fig 7. Classification of CHRIS 17m images using SVM
classifier
IBP Interpolation
POCS Robust
Table 2. Accuracy assessment – confusion matrix
The International Archives of the Photogrammetry, Remote Sensing and Spatial Information Sciences, Volume XL-8, 2014ISPRS Technical Commission VIII Symposium, 09 – 12 December 2014, Hyderabad, India
This contribution has been peer-reviewed. doi:10.5194/isprsarchives-XL-8-463-2014
466

The patch of sand dune on the NW side of the study area
appeared different in different angles which were partially
agreeing with the classified LISS IV image (fig 11). The SRM
map generated improved the area coverage of the sandy patch
which when validated with spectral unmixing, LISS IV and
Google earth images was observed to be satisfactory. The field
visit of this area has strengthened the obtained result. The area of the water body was calculated in the CHRIS
nadir image and the super resolved image which was compared
with the area obtained from Google earth image of 4th February,
2012. The area of the water body calculated from the super
resolved image was much closer to the area calculated from
Google earth and LISS IV classified images (fig 12). Some of the
sub pixel features which were not visible in the CHRIS and LISS
IV images like the trees surrounding the water body were
revealed in the sub pixel map which was not observed in the
CHRIS nadir image due to mixed pixel effect. The shape index of
the water body has been calculated using the formula
(P/4 x sqrt(A)). (Antunes et al., 2003) and the calculated area
statistics are shown in table 3.
4. CONCLUSIONS
The study strengthened that super resolution of CHRIS
multiangular datasets can be suitable for sub pixel landcover map
generation. The classification of the high resolution super
resolved reconstructed map helped in identifying the location of
the features within the 17m pixel of the CHRIS image. A
comparative visual, spectral and spatial analysis has shown that
the robust SRR technique outperformed the other three techniques
– POCS, IBP and bilinear interpolation. The scaling technique
was adding the same value to the higher order grid but does not
incorporate any new information which can help in improving the
landcover classification. On the other hand, the bicubic
convolution technique smoothened the image due to averaging of
the surrounding 16 pixels which also lead to distortions in the
spectral profiles of the features at the boundaries. The robust SRR
technique has shown improvement in both spatial and spectral
characteristics and also brought out some new information which
was unavailable in the LR (low resolution) CHRIS images. The
spectral profiles of water which were mixed in the 17m LR
CHRIS images were corrected in the 5.6m super resolved HR
(high resolution) image which resembles the revealing of mixed
pixel. A classification of the robust SRR result gave the location
of the features within the 17m pixel of the CHRIS which was
agreeing with the results obtained from spectral unmixing and
LISS IV classified map.
Image (SVM
classified maps)
Area (A) Perimeter
(P)
Shape
index
CHRIS_NADIR 6,737.373m2
452.3533m 1.577
SRM 7434.050 m2
654.214m 1.8960
LISS IV 7688.347 m2
663.9620m 1.8930
Google Earth 7494 m2
652.517 1.8844
Fig 9. Sub pixel landcover map
Table 3. Validation of shape of the water body and the shape
index
Fig 11. Improvements in the sand patch area
coverage
Fig 12.Validation of shape of the waterbody and certain
subpixel features around the waterbody
Fig 10. Sub pixel validation using fraction images
5.6m classified
SRM
The International Archives of the Photogrammetry, Remote Sensing and Spatial Information Sciences, Volume XL-8, 2014ISPRS Technical Commission VIII Symposium, 09 – 12 December 2014, Hyderabad, India
This contribution has been peer-reviewed. doi:10.5194/isprsarchives-XL-8-463-2014
467

References
Bose, N.K., Kim, H.C., Zhou, B., 1994. Performance
analysis of the TLS algorithm for image reconstruction from
a sequence of undersampled noisy and blurred frames, in:
Image Processing, 1994. Proceedings. ICIP-94., IEEE
International Conference. IEEE, pp. 571–574.
Chan, J.C.-W., Ma, J., Canters, F., 2008. A comparison of
superresolution reconstruction methods for multi-angle
CHRIS/Proba images, in: SPIE Remote Sensing.
International Society for Optics and Photonics, pp. 710904–
710904–11.
Galbraith, A.E., Theiler, J., Thome, K.J., Ziolkowski, R.W.,
2005b. Resolution enhancement of multilook imagery for the
multispectral thermal imager. Geoscience and Remote
Sensing, IEEE Transactions on 43, 1964–1977.
Kim, S.P., Bose, N.K., Valenzuela, H.M., 1990. Recursive
reconstruction of high resolution image from noisy
undersampled multiframes. Acoustics, Speech and Signal
Processing, IEEE Transactions on 38, 1013–1027.
Ma, J., Chan, J.C., Canters, F., 2010. Fully automatic
subpixel image registration of multiangle CHRIS/Proba data.
Geoscience and Remote Sensing, IEEE Transactions on 48,
2829–2839.
Ma, J., Chan, J.C.W., Canters, F., 2009. Automatic image
registration of multi-angle imagery for CHRIS/Proba, in: 6th
EARSeL SIG IS Workshop.
Ng, M.K., Koo, J., Bose, N.K., 2002. Constrained total least‐squares computations for high resolution image
reconstruction with multisensors. International Journal of
Imaging Systems and Technology 12, 35–42.
Tsai, R.Y., Huang, T.S., 1984. Multiframe image restoration
and registration. Advances in computer vision and Image
Processing 1, 317–339.
Vandewalle, P., Su, S., Vetterli, M., 2006. A frequency
domain approach to registration of aliased images with
application to super-resolution. EURASIP Journal on
Advances in Signal Processing 2006.
Wirawan, P.D., Maitre, H., 1999. Multi-channel high
resolution blind image restoration, in: Acoustics, Speech,
and Signal Processing, 1999. Proceedings., 1999 IEEE
International Conference on. IEEE, pp. 3229–3232.
Zhang, H., Zhang, L., Shen, H., 2012. A super-resolution
reconstruction algorithm for hyperspectral images. Signal
Processing 92, 2082–2096.
Zomet, A., Rav-Acha, A., Peleg, S., 2001. Robust super-
resolution, in: Computer Vision and Pattern Recognition,
2001. CVPR 2001. Proceedings of the 2001 IEEE Computer
Society Conference on. IEEE, pp. I–645–I–650 vol. 1.
The International Archives of the Photogrammetry, Remote Sensing and Spatial Information Sciences, Volume XL-8, 2014ISPRS Technical Commission VIII Symposium, 09 – 12 December 2014, Hyderabad, India
This contribution has been peer-reviewed. doi:10.5194/isprsarchives-XL-8-463-2014
468
Copyright © 2022 FDOKUMEN