Feedback control design for Rössler and Chen chaotic systems anti-synchronization
Upload
harriscountytxCategory
view
4download
0
PAPER
ANTHROPOLOGY
Julie M. Fleischman, M.S.
A Comparative Assessment of the Chen et al.and Suchey-Brooks Pubic Aging Methods on aNorth American Sample*,†,‡
ABSTRACT: Accurately estimating the age-at-death of adult human skeletons is fundamental in forensic anthropology. This study evaluatesthe accuracy of two pubic bone age estimation methods—Chen et al. and Suchey-Brooks. Specimens were obtained from a known collectionof modern pubic bones curated at the Maricopa County Forensic Science Center in Phoenix, Arizona. A sample of 296 left male pubic bonesof European ancestry was statistically evaluated via bias, absolute mean error, and intra- and inter-observer error. Results indicate that the twomethods are similar; the Suchey-Brooks method is the most accurate for aging young adults (error c. 7 years), while the Revised Chen et al.method is most accurate for aging middle-age adults (error c. 6 years). Thus, the Chen et al. method is an important contribution to forensicanthropology for aging older adult skeletal remains. There are, however, some limitations such as subjectivity and the intricate scoring systemof Chen et al. method.
KEYWORDS: forensic science, forensic anthropology, pubic symphysis, age estimation, Chen et al. method, Suchey-Brooks method
Accurately estimating the age-at-death of adult human skeletalremains is one of the fundamental aspects in developing a bio-logical profile. Estimating age-at-death, however, is often chal-lenging. The challenge arises due to the variability of geneticand environmental factors which influence skeletal remodelingand degeneration throughout life (1,2).The most frequently used and well accepted techniques for
estimating age in adult skeletal remains involve an analysis ofthe pubic bones (3–5). Numerous methods for age estimation viathe pubic bones are available; two such methods are those ofChen, Zhang, and Tao (6) (subsequently referred to as Chenet al.) and Brooks and Suchey (hereafter Suchey-Brooks) (7).Developed in 2008, the Chen et al. method focuses on nine mor-phological features of the male pubic bone in a Chinese Hanpopulation. These features are: (i) ridges and furrows on thesymphyseal surface; (ii) ridge of pubic tubercle; (iii) lowerextremity; (iv) ventral beveling; (v) ossific nodules; (vi) dorsalmargin; (vii) ventral rampart; (viii) general macroscopic changesof symphyseal surface; and (ix) bone density of the symphyseal
surface (6). Each of the nine features is divided into three-, four-, or five-stage categories and assigned a respective score of 0through 2, 3, or 4.Chen et al. analyzed 262 pairs of pubic bones from which
they deduced four statistical equations for male age estimation:multiple regression analysis (MRA) and gradual regression anal-ysis (GRA) were used to statistically analyze the nine features,while quantification theory model-I (QMI) and GRA wereapplied to compare with the MRA. In addition to developing amethod for adult age-at-death estimation using morphologicalchanges, the aim of the Chen et al. study (6) was to improveupon pubic bone aging methods such as those of Suchey-Brooks(7) and Hanihara and Suzuki (8).Chen et al. state that with the use of their statistical formulae,
evaluating males only, and subdividing each feature, age-at-deathcan be quantitatively estimated with a high degree of accuracyand reliability (6). In fact, their publication notes that in Chinathis method can accurately age males within 1 year, and that anaverage of 98% of the variance in age can be explained by theirnine features. On the basis of the high success rate reported inthe original paper, this study aimed to evaluate the Chen et al.method to determine if its utility was as great in the UnitedStates as it was in China.The purpose of this study, therefore, was to assess the Chen
et al. study and to determine if the method could accurately esti-mate male age-at-death outside of the Chinese Han population.Despite the statements by Chen et al. that their method is highlyaccurate and reliable, their publication does not provide rates oferror (6). In addition, their publication does not discuss accuracyfor different age groups. These weaknesses were addressed bygenerating statistical data regarding errors, significance, andaccuracy, and specifically evaluating accuracy for young, middle,
Department of Anthropology, Michigan State University, 355 Baker Hall,East Lansing, MI 48824.
*Presented, in part, in lecture format at the 63rd Annual Meeting of theAmerican Academy of Forensic Sciences, February 21–26, in Chicago, IL. Pre-sented, in part, in poster format at the 80th Annual Meeting of the AmericanAssociation of Physical Anthropologists, April 12–16, in Minneapolis, MN.
†Funded by the National Institute of Justice and the Forensic ScienceFoundation (Award No. 2008-DN-BX-K216), Michigan State University’sGraduate School, and the Forensic Science Masters Program.
‡The opinions, findings, and conclusions or recommendations expressed inthis article are those of the author and do not necessarily reflect those of theDepartment of Justice.
Received 13 Nov. 2011; and in revised form 18 Feb. 2012; accepted 10Mar. 2012.
© 2013 American Academy of Forensic Sciences 1
J Forensic Sci, 2013doi: 10.1111/1556-4029.12061
Available online at: onlinelibrary.wiley.com
and old individuals. These statistical assessments are significantcontributions to the adult age estimation literature.An additional aspect of this study was to compare the Chen
et al. method to the Suchey-Brooks method, which is currentlythe most accepted technique for estimating adult age from thepubic bones (9). The purpose of this comparison was to test thereported accuracy of the Chen et al. method and to demonstratewhether it was an improved and more accurate method for esti-mating age-at-death using male pubic bones.
Materials
This research was based on a modern pubic bone collectioncurated at the Maricopa County Forensic Science Center (FSC)in Phoenix, Arizona. This skeletal sample was obtained between2005 and 2006 from individuals of known age, ancestry, andgender. The specimens were acquired from autopsies conductedat the FSC and from donated cadavers at Barrow NeurologicalInstitute in Phoenix, Arizona (10,11). This new skeletal sample,as indicated by Hartnett (11), is an important, autopsy-basedsample which is available for independent testing and re-evalua-tion of pubic bone methods. This research has utilized the FSCcollection for just such an evaluation.The collection of 630 individuals comprises 419 males and
211 females between the ages of 18 and 99 years old. The FSCcollection is represented by Asians, African Americans, Euro-pean ancestry (white), and Native Americans. Individuals whoself-identified as Hispanic were included in the European ances-try category according to the FSC protocols (10,11). To replicatethe Chen et al. method, only males of one anthropologicallyderived ancestry (European) were evaluated for this study. It isimportant to note, however, that the broad category of Europeanancestry is more heterogeneous than the Chinese Han sample.While the European ancestry category includes individuals fromnumerous populations and geographic regions, the goal of thisstudy was to control for heterogeneity as much as possible giventhe ancestral categories of the FSC collection.The Chen et al. method has an attenuated age distribution of
14–70 years. Therefore, only individuals between the ages of 18and 70 years (18 being the youngest individuals in the FSC col-lection, and 70 being the oldest age which the Chen et al.method can estimate) from the FSC collection were assessed. Onthe basis of these criteria—males of European ancestry between18 and 70 years of age—296 pubic bones were selected foranalysis.
Methods
All 296 male pubic bones of European ancestry were evalu-ated in accordance with the Chen et al. (6) and Suchey-Brooks(7) methods for age estimation. A decision was made for thisstudy to evaluate the left pubic bone of each individual. In theevent that the left side was damaged or could not be scored theright side was scored. The bones were examined by four observ-ers all with osteological experience: (i) the author, a forensicanthropology graduate student, (ii) a professional forensicanthropologist, (iii) a recent college graduate with a degree inanthropology, and (iv) an undergraduate anthropology student.IRB approval was obtained for the inclusion of additionalobservers. All observers were given tutorials by the author onhow to use and apply the Chen et al. method before scoring thebones. The impetus for incorporating less experienced observerswas to examine the ease-of-use of this aging method. If Observ-
ers 3 and 4 were found to have lower accuracy rates, it wouldbe an indication that the method requires practice and trainingbefore proficiency is achieved—it does not imply that themethod is ineffective for professional anthropologists.On the basis of the age groups established by Buikstra and Ube-
laker (12), the FSC male pubic bones were divided as follows:Young adults (18–34 years), Middle adults (35–49 years), and Oldadults (50 years and above) (Table 1). The sample was divided assuch to gauge accuracy for younger and older individuals. Althoughnot addressed in the Chen et al. (6) study, other researchers haveestablished that older individuals are more difficult to age andproduce more inaccurate age estimates (1,8,9,13–15).Prior to evaluating the accuracy of the Chen et al. (6) and
Suchey-Brooks (7) methods, inter- and intra-observer errors weretested. To measure intra-observer error, a random sample of 100previously scored pubic bones was reassessed by the author; thebones were scored again for both the Chen et al. and theSuchey-Brooks methods. These data were evaluated by calculatingCohen’s kappa measurement of agreement and Pearson’s correla-tion coefficient. For inter-observer error Observer 2 scored 200pubic bones via the Chen et al. method and 75 bones via theSuchey-Brooks method. Observers 3 and 4 scored the same 50pubic bones using both methods. These data were evaluatedusing Pearson’s correlation coefficient.
Statistical Analysis Part 1: Evaluation and Revision of theChen et al. Method
This project generated statistical data concerning the Chenet al. model’s utility for aging male populations of Europeanancestry. The statistical analysis for this project was multifac-eted; the Chen et al. model was tested and then revised on thebasis of the FSC sample, and later the Chen et al. and Suchey-Brooks methods were compared. For statistical analyses of thisstudy, the Chen et al. age estimation equations were abbreviatedas follows: MRA, MRA + GRA, QMI, and QMI + GRA. Allstatistical analyses were performed using SPSS Version 18.0(SPSS Inc., Chicago, IL).Bias and absolute mean error (AME) (also referred to as
“inaccuracy”) were applied to demonstrate the accuracy of theChen et al. method (1,3,4,16–20). AME, or Σ |estimated age –actual age|/N, is the absolute difference between the estimatedand actual ages. Bias, or Σ (estimated age – actual age)/N, is thedifference between the estimated and actual ages. Bias demon-strates the average over- or underaging of the individual’s actualage, while AME demonstrates the average error from the indi-vidual’s actual age (1,3,4,16–20).The first step in the evaluation of the Chen et al. method was
to calculate AME and bias for each pubic bone and for both Ori-ginal (published) Chen et al. statistical models which includeGRA—MRA + GRA and QMI + GRA—because their studyfavors the inclusion of GRA when estimating an individual’s age(6). The second step was to create revised statistical models basedexclusively on the FSC sample. Using the raw data from the 296left male pubic bones of European ancestry, new coefficients
TABLE 1––Age groups for the FSC sample.
Age Groups Age Range n
Young adult (1) 18–34 years 69Middle adult (2) 35–49 years 95Old adult (3) 50+ years 132Total 18–50+ years 296
2 JOURNAL OF FORENSIC SCIENCES

were generated for the nine Chen et al. morphological features.The coefficients were then used to produce Revised statisticalmodels (MRA, MRA + GRA, QMI, and QMI + GRA), whichcould be directly compared to the Original Chen et al. models(see Table 2). The development of the Revised MRA + GRAand QMI + GRA equations required the use of a backward step-wise regression with an F criterion of removal = 0.10 to replicatetheir complementary equations in the Chen et al. publication. Asin step 1, AME and bias were calculated for each pubic bone and
for both Revised statistical models, which include GRA to dem-onstrate accuracy (1,3,4,16–20).For both the Original and Revised Chen et al. models, fre-
quencies of AME were generated. These frequencies, in the formof brackets, demonstrated how closely the estimated ages wereto the actual ages. Frequency brackets were developed ratherthan using standard deviations because the Chen et al. methoddoes not produce standard deviations—it just generates a pointage estimate.
TABLE 2––Evaluation criteria of male pubic symphyses and regression coefficients for Original and Revised Chen et al. multiple regression analysis (MRA),multiple regression analysis with the gradual regression analysis (MRA + GRA), quantification theory model-I (QMI), and quantification theory model-I with
gradual regression analysis (QMI + GRA).
VariableMorphological
Feature Scores and Descriptions
Original Chen et al. Model Revised Chen et al. Model
MRAMRA +GRA QMI
QMI +GRA MRA
MRA +GRA QMI
QMI +GRA
X1 Ridges andfarrows
0: Alternate distinctly 0.42 0 0 0 2.57 2.88 0 01: Furrows fill in, alternateindistinctly
1.43 0 �0.65 0
2: Granular, blunt ridges,shallow furrows
2.22 0.89 3.90 0
3: Flat and fine-textured,may be granular
2.02 0 10.55 5.74
4: Disappearance,pitting and erosion
1.43 0 10.70 7.29
X2 Ridges of pubictubercle
0: Tubercle completed 1.48 1.76 0 0 2.83 0 0 01: Tubercle almost gone 1.72 2.56 0.14 02: Tubercle completelydisappeared
2.87 3.99 4.05 0
X3 Lower extremity 0: No appearance oflower extremity
1.88 1.71 0 0 0.36 0 0 0
1: Appearance of dividing line 1.49 1.32 �0.53 02: Presence of “V” angle 2.99 3.10 3.56 03: Atrophy of “V” angle 5.64 5.75 3.25 0
X4 Ventral rampart 0: No appearance 2.51 2.47 0 0 0.60 0 0 01: Local ventral rampart 1.35 1.44 2.46 02: Fully developed 4.36 4.70 2.56 03: Wider or nodular insuperior portion
8.83 9.18 2.40 0
X5 Ossific nodule 0: No appearance �0.43 0 0 0 �1.59 0 0 01: Appearance 0.48 0 4.25 02: Fusion and disappearance 2.29 1.49 �6.63 0
X6 Dorsal margin 0: No appearance 1.76 1.68 0 0 0.49 3.73 0 01: Edged marginwithout plateau
1.01 1.32 0.79 0
2: Plateau and lipping ofdorsal margin
3.92 4.21 6.97 7.91
3: Middle destruction atrophy 5.46 5.76 9.46 10.61X7 Ventral beveling 0: No appearance 3.25 3.03 0 0 7.78 8.25 0 0
1: Clear edged margin 1.92 2.37 4.25 8.392: Flattening or disappearance 4.40 4.86 11.77 16.22
X8 Macroscopic changes 0: Prominence ofsymphyseal surface
�0.66 0 0 0 0.07 0 0 0
1: Irregular surface �0.34 0 �2.43 02: Flatness or fovea,clear periphery
0.66 0 �5.52 0
X9 Bone density 0: Ridges, or roughwith no ridges
7.31 7.30 0 0 2.04 2.13 0 0
1: Smooth, dense and solid 5.61 5.62 3.55 02: Concavo-convex ordense porosity
9.62 9.62 6.24 2.57
3: Big pits and/orloss of density
19.45 19.45 6.58 0
Original Chen et al. Models’ Constants and Standard Deviations (SD)MRA: Constant = 16.97; SD = 2.13MRA + GRA: Constant = 16.79; SD = 2.14QMI: Constant = 15.93; SD = 1.96QMI + GRA: Constant = 16.45; SD = 1.97
Revised Chen et al. Models’ Constants and Standard Deviations (SD)MRA: Constant = 12.69; SD = 9.54MRA + GRA: Constant = 15.27; SD = 9.52QMI: Constant = 19.93; SD = 9.78QMI + GRA: Constant = 21.27; SD = 9.63
FLEISCHMAN . ASSESSMENT OF CHEN ET AL. AND SUCHEY-BROOKS AGING METHODS 3

The frequencies were evaluated in brackets of 1, 5, 10, and15 years from the actual age values. As these are absolutevalues, they represent 1, 5, 10 or 15 years either above or belowan individual’s actual age. They do not represent a range. Thelevel of accuracy for each model was on the basis of the per-centage (or frequency) within each of the brackets; the frequencyrepresents the number of individuals who were accurately agedwithin that bracket. A high percentage indicates that more indi-viduals fell within that bracket, and thus, is more accurate than alower percentage. For example, if 10% of the sample’s AMEderived from the Original Chen et al. MRA + GRA model fellwithin 1 year of the actual age, while only 7% of the sample’sAME derived from the Revised Chen et al. MRA + GRA modelfell within 1 year of the actual age, the Original Chen et al.MRA + GRA model had a higher level of accuracy for that1-year bracket. The same is true for the 5-, 10-, and 15-yearbrackets.The accuracy of the Original and Revised Chen et al. models
for each of the three age groups was assessed by calculating biasand AME. In addition, analysis of variance (ANOVA) was com-puted for each age group to determine if there was a significantdifference between the mean biases and errors for each of theChen et al. models. These values were derived from the ANO-VA post hoc test. To further evaluate the Revised Chen et al.models a forward stepwise regression was employed to deter-mine which morphological features contributed most to the pre-diction of age.
Statistical Analysis Part 2: Comparison of the Chen et al.and Suchey-Brooks Models
To assess whether the Original and Revised Chen et al. mod-els were more or less accurate than the Suchey-Brooks model,each of the 296 bones were later assigned a phase in accordancewith the Suchey-Brooks method. AME and bias were calculatedfor this model.Accuracy was evaluated by comparing the biases and frequen-
cies of AME for the Original Chen et al. models, the RevisedChen et al. models, and the Suchey-Brooks model. The frequen-cies were again evaluated in brackets of 1, 5, 10, and 15 yearsfrom the actual age values, with the highest percentage of AMEbeing the most accurate. As stated previously, the AME for theChen et al. models is the sum of the absolute difference betweenthe estimated and actual age divided by the sample size. For theSuchey-Brooks model, the AME is the sum of the absolute differ-ence between the mean and actual age divided by the sample size(Σ |mean age – actual age|/N), which is in keeping with the foren-sic and bioarcheological literature (18,20).To support this analysis of accuracy, R2 values were evaluated
for the Chen et al. models and the Suchey-Brooks model, whilePearson’s correlation coefficients were calculated to determine therelationship between the aging models and actual age. The accu-racy of the Suchey-Brooks method was also assessed for each ofthe three age groups. In addition to bias and AME, ANOVA wascalculated to determine if there was a significant differencebetween the mean errors and biases produced by the Suchey-Brooks method and the Original and Revised Chen et al. methods.
Results
The Revised Chen et al. models—with new regressionconstants, coefficients, and standard deviations—were developedas follows (see Table 2):
MRA: Y ¼ 12:69þ 2:57X1 þ 2:83X2 þ 0:36X3þ0:60X4 � 1:59X5 þ 0:49X6 þ 7:78X7þ0:07X8 þ 2:04X9
MRAþ GRA: Y ¼ 15:27þ 2:88X1 þ 3:37X6 þ 8:25X7 þ 2:13X9
QMI: Y ¼ 19:93� 0:65X1�1 þ 3:90X1�2 þ 10:55X1�3þ10:70X1�4 þ 0:14X2�1 þ 4:05X2�2�0:53X3�1 þ 3:56X3�2 þ 3:25X3�3þ2:46X4�1 þ 2:56X4�2 þ 2:40X4�3 � 4:25X5�1�6:63X5�2 þ 0:79X6�1 þ 6:97X6�2 þ 9:46X6�3þ4:25X7�1 þ 11:77X7�2 � 2:43X8�1�5:52X8�2 þ 3:55X9�1 þ 6:24X9�2 þ 6:58X9�3
QMIþGRA: Y ¼ 21:27þ 5:74X1�3 þ 7:29X1�4 þ 7:91X6�2þ10:61X6�3 þ 8:39X7�1þ16:22X7�2 þ 2:57X9�2
Accuracy of the Models
Frequencies of Absolute Mean Error
As previously stated, frequencies of AME were generated forall three models: Original Chen et al., Revised Chen et al., andSuchey-Brooks. The most accurate model varied by frequencybracket, as shown in Table 3 and Figs 1–5. The most accuratemodel for 1 year from actual age was the Original Chen et al.MRA + GRA (10.8%). This percentage indicates that if the Ori-ginal Chen MRA + GRA model is used, almost 11% of individu-als will be assigned an estimated age within 1 year from theiractual age-at-death. Figure 1 provides a visual assessment of thissame information; vertical lines were placed at 1, 5, 10, and15 years from actual age and the percentages were derived fromthe “amount” of the histogram to the left of the lines. In this fig-ure, 10.8% of the histogram value is to the left of the 1 year line.The most accurate model for 5 years from actual age was
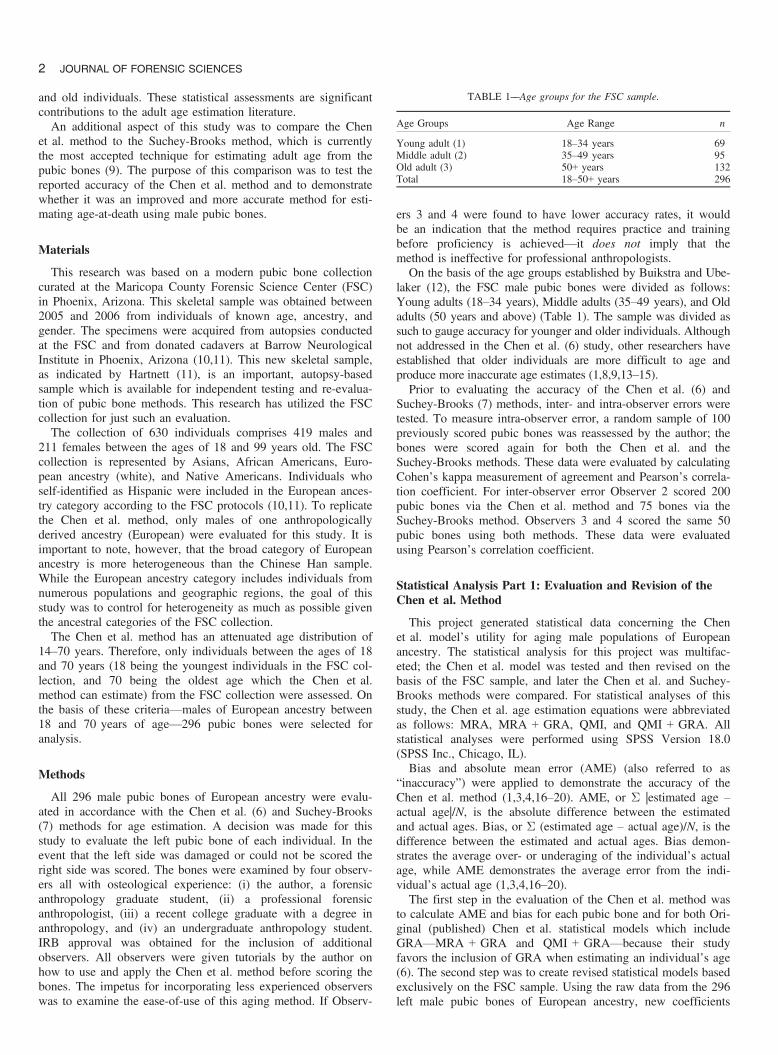
Suchey-Brooks (38.9%) (Fig. 5), and for both 10 and 15 years itwas the Revised MRA + GRA (65.7% and 87.3%) (Fig. 3). AsTable 3 demonstrates, age-at-death can be accurately estimatedwithin 15 years for between 79% and 87% of individualsdepending upon the model used.
Absolute Mean Error for All Models
Table 4 and Fig. 6 represent the overall error for each model.The Original Chen et al. models had low AME, with an averageerror of c. 9 years from the individuals’ actual ages
TABLE 3––Frequencies of absolute mean error (AME).
1 Year* 5 Years* 10 Years* 15 Years*
Revised Chen et al. MRA +GRA Model
7.8 37.3 65.7 87.3
Revised Chen et al. QMI +GRA Model
5.9 38.6 63.4 85.1
Suchey-Brooks Model 9.5 38.9 63.9 78.7Original Chen et al. MRA +GRA Model
10.8 35.3 59.8 85.3
Original Chen et al. QMI +GRA Model
9.8 33.3 62.7 85.3
*Within 1, 5, 10, or 15 year(s) of actual age. All values are percentages (%).
4 JOURNAL OF FORENSIC SCIENCES
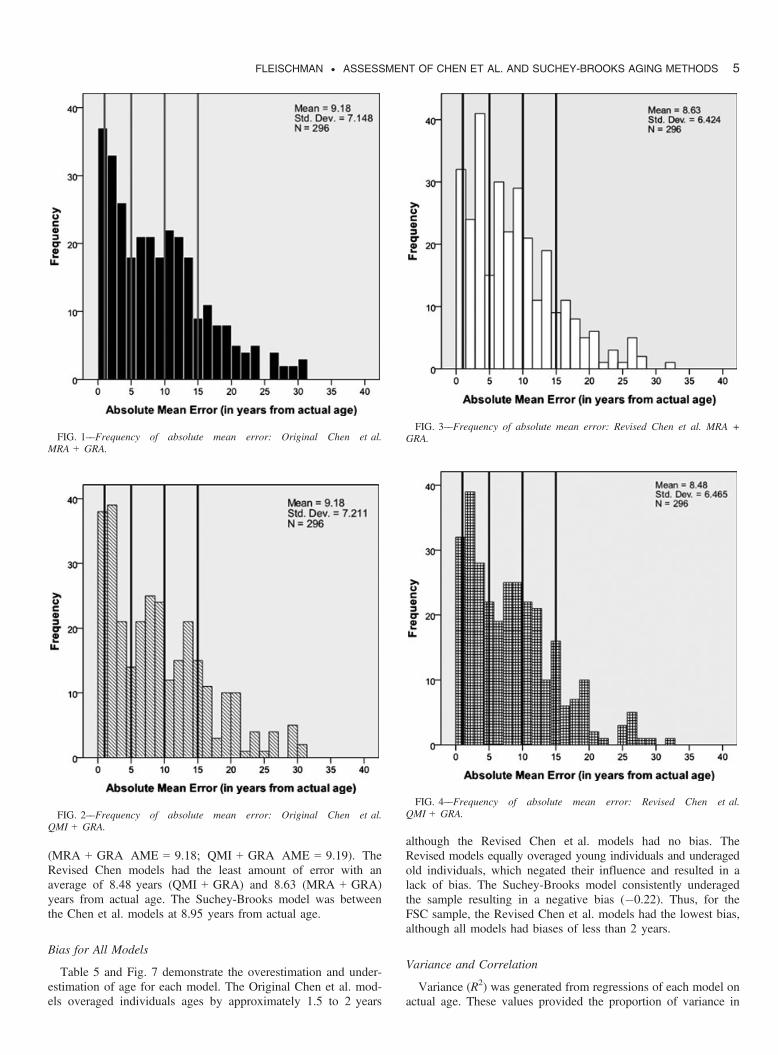
(MRA + GRA AME = 9.18; QMI + GRA AME = 9.19). TheRevised Chen models had the least amount of error with anaverage of 8.48 years (QMI + GRA) and 8.63 (MRA + GRA)years from actual age. The Suchey-Brooks model was betweenthe Chen et al. models at 8.95 years from actual age.
Bias for All Models
Table 5 and Fig. 7 demonstrate the overestimation and under-estimation of age for each model. The Original Chen et al. mod-els overaged individuals ages by approximately 1.5 to 2 years
although the Revised Chen et al. models had no bias. TheRevised models equally overaged young individuals and underagedold individuals, which negated their influence and resulted in alack of bias. The Suchey-Brooks model consistently underagedthe sample resulting in a negative bias (�0.22). Thus, for theFSC sample, the Revised Chen et al. models had the lowest bias,although all models had biases of less than 2 years.
Variance and Correlation
Variance (R2) was generated from regressions of each model onactual age. These values provided the proportion of variance in
FIG. 2––Frequency of absolute mean error: Original Chen et al.QMI + GRA.
FIG. 4––Frequency of absolute mean error: Revised Chen et al.QMI + GRA.
FIG. 1––Frequency of absolute mean error: Original Chen et al.MRA + GRA.
FIG. 3––Frequency of absolute mean error: Revised Chen et al. MRA +GRA.
FLEISCHMAN . ASSESSMENT OF CHEN ET AL. AND SUCHEY-BROOKS AGING METHODS 5

age explained by the aging models (21). The Revised Chen et al.models explained the most variance (MRA + GRA R2 = 0.491;QMI + GRA R2 = 0.487) followed by the Suchey-Brooks model(R2 = 0.454) (Fig. 8). The Original QMI + GRA explained theleast at 42%. Despite the differences between the models, theywere all within a close range of R2 = 0.42–0.49. The remaining50% of the variance is unexplained by the aging models, but couldbe explained by factors not addressed in these regressions (e.g., anindividual’s lifestyle, health, environment, etc.) (21).All correlations between the models and actual age were posi-
tive and statistically significant at the 0.01 level. The strongestcorrelation was derived from the Suchey-Brooks model(r = 0.674). The weakest correlation was the Original Chenet al. QMI + GRA model (r = 0.603), which also explained theleast amount of variance (R2) as discussed above. Collectively,these correlations are fairly strong indicating that there is apositive relationship between the models and actual age.
Morphological Features Most Predictive of Age
A forward stepwise regression (with a criterion of F toenter = 0.05) was calculated to determine which of the nine
FIG. 5––Frequency of absolute mean error: Suchey-Brooks.
TABLE 4––Absolute mean error for each model.
Revised Chen et al. MRA + GRA Model 8.628Revised Chen et al. QMI + GRA Model 8.483Suchey-Brooks Model 8.946Original Chen et al. MRA + GRA Model 9.182Original Chen et al. QMI + GRA Model 9.185
FIG. 6––Absolute mean error for all models.
TABLE 5––Bias for each model.
Revised Chen et al. MRA + GRA Model 0.000Revised Chen et al. QMI + GRA Model 0.000Suchey-Brooks Model �0.217Original Chen et al. MRA + GRA Model 1.824Original Chen et al. QMI + GRA Model 1.516
FIG. 7––Bias for all models.
FIG. 8––Variance explained by all regression models.
6 JOURNAL OF FORENSIC SCIENCES

Chen et al. morphological features were most predictive of anindividual’s age-at-death. On the basis of Observer 1’s scores forall nine morphological features, the following facts explained themost variance: features 7, 1, 6, and 9—ventral beveling, ridges,and furrows of the symphyseal surface, dorsal margin, and bonedensity of the symphyseal surface. As the R2 values in Table 6demonstrate, feature 7 alone explained 35% of the variance inactual age. Only 9% more variance in age was explained whenall four features (7, 1, 6, and 9) were included in the regression(Step 4 R2 = 0.44, or 44%) (22). These R2 values were all sig-nificant at the 0.05 level. All of the coefficients were positive,so as the score for each feature increased, actual age alsoincreased.
Accuracy for Age Groups
Bias and Absolute Mean Error
As stated previously, the FSC sample was divided into threeage groups to gauge accuracy for younger and older individuals.Table 7 provides the summary statistics for each age group.Accuracy was evaluated by measures of bias and AME for eachmodel (Tables 8 and 9). For all models except Suchey-Brooks,AME was lowest for the middle and old adults. For the youngadult group, the Suchey-Brooks model had the least error; forthe middle adult group, the Revised Chen et al. MRA + GRAmodel had the least error; and for the old adult group, the Origi-nal Chen et al. MRA + GRA model had the least error (Fig. 9).Bias was both positive and negative for each model, which
indicates that they underestimate and overestimate actual age(Fig. 10). The highest bias (furthest from an individual’s actualage) was derived from the Original Chen et al. QMI + GRAmodel for the young adult group (overestimated actual age by10.50 years). The Suchey-Brooks model had the least amount ofbias for each of the three age groups, with the lowest bias
derived from the middle adult group (overestimated age by3.38 years). The middle adult group shows the least bias overall,which corresponds to the AME results discussed above.
Analysis of Variance
ANOVA was applied to determine if the differences betweenthe models (Figs 9 and 10) were statistically significant. Signifi-cant F-values were produced for both the young and middleadult groups so a post hoc test was run to directly compare eachof the five models for the three age groups.As Tables 10 and 11 demonstrate, there were significant dif-
ferences between some of the models for the young adult andmiddle adult groups. For both bias and AME only the
TABLE 6––Forward stepwise regression analysis of the Chen et al. morpho-logical features and actual age.
Constant (b0)Standardized
Coefficients (b1) SD R2 SE
Step l 28.77* 0.35 1.53Feature 7 0.59* 0.67 1.01
Step 2 16.83* 0.41 2.66Feature 7 0.46* 1.10Feature 1 0.28* 0.74 1.00
Step 3 13.42* 0.43 2.81Feature 7 0.41* 1.13Feature 1 0.22* 1.05Feature 6 0.17* 0.65 1.16
Step 4 15.27* 0.44 2.92Feature 7 0.38* 1.15Feature 1 0.15** 1.21Feature 6 0.17* 1.16Feature 9 0.13** 0.86 1.00
*P < 0.01, P < 0.05.
TABLE 7––Summary statistics for FSC sample by age group*.
Young Adult Middle Adult Old Adult
N 69 95 132Mean 25.33 43.03 59.03SD 4.87 4.36 6.08
*Young Adult: 18–34 years; Middle Adult: 35–49 years; Older Adult:50+ years.
TABLE 8––Absolute mean error (AME) and bias for each model by agegroup.
Age Group n
Original Chen et al.MRA + GRA
Original Chen et al.QMI + GRA
AME* Bias AME* Bias
Young adult (1) 69 10.862 10.485 10.957 10.500Middle adult (2) 95 8.285 6.998 7.772 6.668Old adult (3) 132 8.949 �6.427 9.275 �6.888
*Absolute Mean Error: Σ |estimated age – actual age|/N.Bias: Σ (estimated age – actual age)/N.
TABLE 9––Absolute mean error (AME) and bias for each model by agegroup
Age Group n
RevisedChen et al.
MRA + GRA
RevisedChen et al.QMI + GRA Suchey-Brooks
AME* Bias AME* Bias AME** Bias
Young adult (1) 69 9.896 9.514 9.609 9.105 7.194 6.168Middle adult (2) 95 6.728 4.546 6.889 4.923 8.768 3.375Old adult (3) 132 9.332 �8.244 9.041 �8.301 9.990 �6.186
*Absolute Mean Error: Σ |estimated age – actual age|/N.**Absolute Mean Error: (Σ |mean age – actual age|/N).Bias: Σ (estimated age – actual age)/N.
FIG. 9––Absolute mean error for all age groups.
FLEISCHMAN . ASSESSMENT OF CHEN ET AL. AND SUCHEY-BROOKS AGING METHODS 7
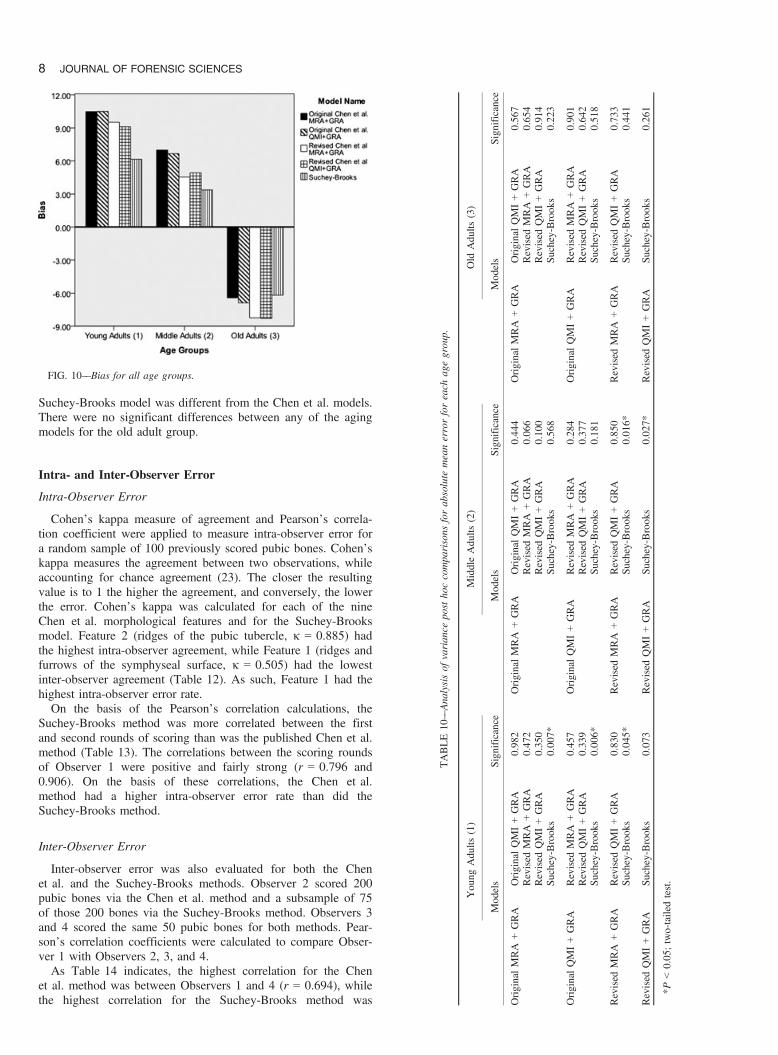
Suchey-Brooks model was different from the Chen et al. models.There were no significant differences between any of the agingmodels for the old adult group.
Intra- and Inter-Observer Error
Intra-Observer Error
Cohen’s kappa measure of agreement and Pearson’s correla-tion coefficient were applied to measure intra-observer error fora random sample of 100 previously scored pubic bones. Cohen’skappa measures the agreement between two observations, whileaccounting for chance agreement (23). The closer the resultingvalue is to 1 the higher the agreement, and conversely, the lowerthe error. Cohen’s kappa was calculated for each of the nineChen et al. morphological features and for the Suchey-Brooksmodel. Feature 2 (ridges of the pubic tubercle, j = 0.885) hadthe highest intra-observer agreement, while Feature 1 (ridges andfurrows of the symphyseal surface, j = 0.505) had the lowestinter-observer agreement (Table 12). As such, Feature 1 had thehighest intra-observer error rate.On the basis of the Pearson’s correlation calculations, the
Suchey-Brooks method was more correlated between the firstand second rounds of scoring than was the published Chen et al.method (Table 13). The correlations between the scoring roundsof Observer 1 were positive and fairly strong (r = 0.796 and0.906). On the basis of these correlations, the Chen et al.method had a higher intra-observer error rate than did theSuchey-Brooks method.
Inter-Observer Error
Inter-observer error was also evaluated for both the Chenet al. and the Suchey-Brooks methods. Observer 2 scored 200pubic bones via the Chen et al. method and a subsample of 75of those 200 bones via the Suchey-Brooks method. Observers 3and 4 scored the same 50 pubic bones for both methods. Pear-son’s correlation coefficients were calculated to compare Obser-ver 1 with Observers 2, 3, and 4.As Table 14 indicates, the highest correlation for the Chen
et al. method was between Observers 1 and 4 (r = 0.694), whilethe highest correlation for the Suchey-Brooks method was
FIG. 10––Bias for all age groups.
TABLE10––Analysisof
varian
cepo
stho
ccomparisons
forab
solute
meanerrorforeach
agegrou
p.
You
ngAdu
lts(1)
MiddleAdu
lts(2)
Old
Adu
lts(3)
Models
Significance
Models
Significance
Mod
els
Sign
ificance
OriginalMRA
+GRA
OriginalQMI+GRA
0.982
OriginalMRA
+GRA
OriginalQMI+GRA
0.444
OriginalMRA
+GRA
OriginalQMI+GRA
0.56
7Revised
MRA
+GRA
0.472
Revised
MRA
+GRA
0.06
6Revised
MRA
+GRA
0.65
4Revised
QMI+GRA
0.350
Revised
QMI+GRA
0.10
0Revised
QMI+GRA
0.91
4Su
chey-Brooks
0.007*
Suchey-Brooks
0.56
8Su
chey-Brook
s0.22
3
OriginalQMI+GRA
Revised
MRA
+GRA
0.457
OriginalQMI+GRA
Revised
MRA
+GRA
0.284
OriginalQMI+GRA
Revised
MRA
+GRA
0.90
1Revised
QMI+GRA
0.339
Revised
QMI+GRA
0.37
7Revised
QMI+GRA
0.64
2Su
chey-Brooks
0.006*
Suchey-Brooks
0.18
1Su
chey-Brook
s0.51
8
Revised
MRA
+GRA
Revised
QMI+GRA
0.830
Revised
MRA
+GRA
Revised
QMI+GRA
0.85
0Revised
MRA
+GRA
Revised
QMI+GRA
0.73
3Su
chey-Brooks
0.045*
Suchey-Brooks
0.01
6*Su
chey-Brook
s0.44
1
Revised
QMI+GRA
Suchey-Brooks
0.073
Revised
QMI+GRA
Suchey-Brooks
0.02
7*Revised
QMI+GRA
Suchey-Brook
s0.26
1
*P<0.05
;two-tailedtest.
8 JOURNAL OF FORENSIC SCIENCES

between Observers 1 and 3 (r = 0.885). All of the correlationswere significant at either the 0.01 level or the 0.05 level. Over-all, the Suchey-Brooks method had lower inter-observer errorrates than the Chen et al. method.
Discussion
This study had three primary goals: (i) to evaluate whether theChen et al. method is capable of accurately estimating age forNorth American males of European ancestry; (ii) to test theclaim by Chen et al.—that their method is accurate within 1 yearof actual age—and compare it with the Suchey-Brooks method;and (iii) to determine if the author’s Revised Chen et al. methodwould be more accurate for estimating age than the Suchey-Brooks method.When the data were evaluated for the whole sample, the
Revised Chen et al. models (both MRA + GRA andQMI + GRA) were more accurate than the Suchey-Brooksmodel. The Revised models were the most accurate for the1-year frequency bracket; had the lowest amounts of error;demonstrated no bias; and explained the highest amount ofvariance in age.When the AME data were considered for the Revised Chen
et al. and Suchey-Brooks models, the Revised models had anaverage error of c. 8 years whereas the Suchey-Brooks modelhad an average error of c. 9 years. Although this does not ini-tially suggest a large difference, it must briefly be consideredthat for the Suchey-Brooks model this only represents the mean
TABLE11––Analysisof
varian
cepo
stho
ccomparisons
forbias
foreach
agegrou
p.
You
ngAdu
lts(1)
MiddleAdu
lts(2)
Old
Adu
lts(3)
Models
Significance
Mod
els
Significance
Models
Sign
ificance
OriginalMRA
+GRA
OriginalQMI+GRA
0.985
OriginalMRA
+GRA
OriginalQMI+GRA
0.444
OriginalMRA
+GRA
OriginalQMI+GRA
0.54
6Revised
MRA
+GRA
0.50
1Revised
MRA
+GRA
0.066
Revised
MRA
+GRA
0.10
5Revised
QMI+GRA
0.33
8Revised
QMI+GRA
0.100
Revised
QMI+GRA
0.09
5Su
chey-Brooks
0.00
3*Su
chey-Brook
s0.568
Suchey-Brooks
0.82
9
OriginalQMI+GRA
Revised
MRA
+GRA
0.489
OriginalQMI+GRA
Revised
MRA
+GRA
0.284
OriginalQMI+GRA
Revised
MRA
+GRA
0.30
8Revised
QMI+GRA
0.32
9Revised
QMI+GRA
0.377
Revised
QMI+GRA
0.28
5Su
chey-Brooks
0.00
3*Su
chey-Brook
s0.181
Suchey-Brooks
0.41
4
Revised
MRA
+GRA
Revised
QMI+GRA
0.77
6Revised
MRA
+GRA
Revised
QMI+GRA
0.850
Revised
MRA
+GRA
Revised
QMI+GRA
0.95
9Su
chey-Brooks
0.02
1*Su
chey-Brook
s0.016*
Suchey-Brooks
0.06
7
Revised
QMI+GRA
Suchey-Brooks
0.04
2*Revised
QMI+GRA
Suchey-Brook
s0.027*
Revised
QMI+GRA
Suchey-Brooks
0.06
0
*P<0.05;two-tailedtest.
TABLE 12––Intra-observer Cohen’s kappa measure of agreement (j) for theChen et al. morphological features and the Suchey-Brooks method.
j SE
Feature 1 vs. Feature 1 0.505 0.073Feature 2 vs. Feature 2 0.885 0.114Feature 3 vs. Feature 3 0.624 0.070Feature 4 vs. Feature 4 0.615 0.073Feature 5 vs. Feature 5 0.858 0.092Feature 6 vs. Feature 6 0.621 0.074Feature 7 vs. Feature 7 0.662 0.070Feature 8 vs. Feature 8 0.666 0.077Feature 9 vs. Feature 9 0.631 0.063Suchey-Brooks Method 0.628 0.061n = 100
TABLE 14––Inter-observer Pearson’s correlations (r) for the Chen et al.and Suchey-Brooks methods.
n Chen et al. MethodSuchey-Brooks
Method
Observer 1 vs. Observer 2* 200 0.640 0.790Observer 1 vs. Observer 3* 50 0.693 0.885Observer 1 vs. Observer 4** 50 0.694 0.746
*P < 0.01; 2-tailed test.**P < 0.05; 2-tailed test.
TABLE 13––Intra-observer Pearson’s correlations (r) for the Chen et al.and Suchey-Brooks methods.
Methods Correlation Coefficients
Chen et al. 0.796Suchey-Brooks 0.906
P < 0.01; 2-tailed test; n = 100.
FLEISCHMAN . ASSESSMENT OF CHEN ET AL. AND SUCHEY-BROOKS AGING METHODS 9

age-at-death. If the full 95% age range is to be considered, theRevised Chen models are in fact much more accurate.However, the results for the Suchey-Brooks model were
interesting. It was the only model whose average bias wasnegative, which resulted in underaging of the specimens by0.20 years. This tendency to underestimate the age of the sam-ple is consistent with previous research on the Suchey-Brooksmethod (5,17,19). Even more interesting is that this model hadthe highest correlation with actual age (r = 0.674). Eventhough the data in this study only represent the mean Suchey-Brooks ages, Fig. 11 indicates that the majority of the sam-ples’ estimated ages did fall within the Suchey-Brooks phaseranges.Analysis of the age group data indicates that the Suchey-
Brooks model was distinct as it had a steady pattern of increas-ing AME. As Fig. 9 shows, the Suchey-Brooks model had thelowest error for the young adults and steadily increased acrossthe middle and old adults. This is consistent with other evalua-tions of the Suchey-Brooks method (5,18,24). This model alsohad the least amount of bias for each age group, which indi-cates that it is more consistent than the Chen et al. models withregard to over- and underestimation of actual age.When variance is compared between the models they are virtu-
ally identical—Suchey-Brooks R2 = 0.454, Revised MRA + GRAR2 = 0.491, and Revised QMI + GRA R2 = 0.487. Therefore,these models all explained almost 50% of the variance in age forthis sample. This measure of model comparison suggests that theSuchey-Brooks and Revised Chen et al. models are equallyaccurate for estimating age for this sample.Review of the intra- and inter-observer error correlation data
indicates that the Suchey-Brooks model was more consistent andreliable within and between observers than the Chen et al. model(Tables 13 and 14). For intra-observer error the Suchey-Brooksmodel demonstrated a 12% higher correlation than the Chenet al. model. For inter-observer error, Suchey-Brooks had a 19%higher correlation than Chen et al. between Observer 1 andObserver 2, and a 22% higher correlation between Observer 1and Observer 3. The Suchey-Brooks model had a 7% higher cor-relation than the Chen et al. model between Observer 1 andObserver 4.
FIG. 11––Comparison of actual age and estimated age using the Suchey-Brooks method with a superimposition of the Suchey-Brooks age phaseranges.
FIG. 12––Feature 1: Ridges and furrows of the symphyseal surface.
FIG. 13––Feature 2: Ridges of the pubic tubercle.
FIG. 14––Feature 3: Lower extremity of the symphyseal surface.
FIG. 15––Feature 4: Ventral rampart.
FIG. 16––Feature 5: Ossific nodule.
10 JOURNAL OF FORENSIC SCIENCES
Most studies have found that pubic aging methods are moreaccurate for younger individuals and are of little value for olderindividuals (7,16,18,19,24,25). In contrast to these previousstudies, this research demonstrated that the middle adult group(ages 35–49 years) was the most accurately aged. All modelsexcept Suchey-Brooks had the lowest AMEs for this group, andall models except for the Original MRA + GRA had the leastamount of bias. This suggests that the Chen et al. method (inparticular the Revised models) is unique among adult pubicbone age estimation techniques as it is most accurate for themiddle adult age category. Further research is required, particu-larly for additional ancestral groups and for females, but the
data from this study indicate that the Chen et al. method canbe used to age adults between 35 and 49 years old.There are a few limitations which should be noted: limitations
of the Chen et al. method and limitations of this study. Theprimary limitation of the Chen et al. method is subjectivity. Theevaluation of the nine morphological features requires an obser-ver to be familiar with the features, their developmental stages,and associated scores. Time and practice are required before anobserver can appropriately assign a score for each feature. Thescoring system is also problematic and challenging due totranslation issues in the published article. This may have influ-enced this study’s raw data scores, and is the reason why theauthor modified the language of the scoring criteria and tooknew photographs (Figs 12–20, Tables 15 and 16). The pubic
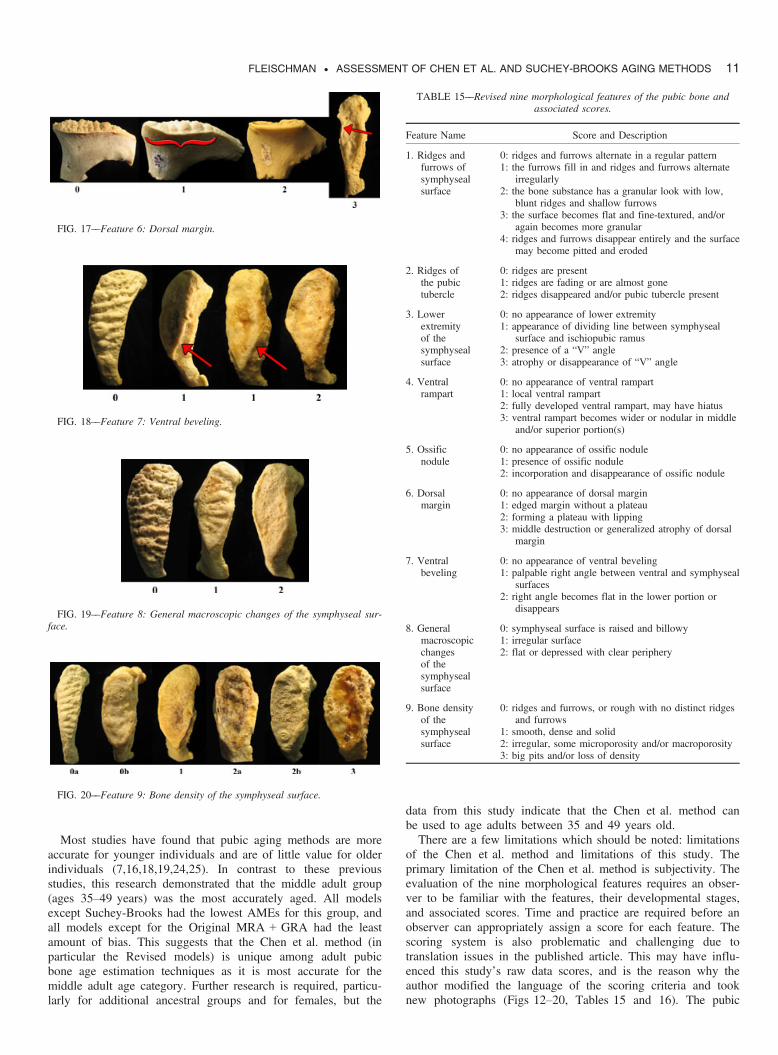
FIG. 17––Feature 6: Dorsal margin.
FIG. 18––Feature 7: Ventral beveling.
FIG. 19––Feature 8: General macroscopic changes of the symphyseal sur-face.
FIG. 20––Feature 9: Bone density of the symphyseal surface.
TABLE 15––Revised nine morphological features of the pubic bone andassociated scores.
Feature Name Score and Description
1. Ridges andfurrows ofsymphysealsurface
0: ridges and furrows alternate in a regular pattern1: the furrows fill in and ridges and furrows alternate
irregularly2: the bone substance has a granular look with low,
blunt ridges and shallow furrows3: the surface becomes flat and fine-textured, and/or
again becomes more granular4: ridges and furrows disappear entirely and the surface
may become pitted and eroded
2. Ridges ofthe pubictubercle
0: ridges are present1: ridges are fading or are almost gone2: ridges disappeared and/or pubic tubercle present
3. Lowerextremityof thesymphysealsurface
0: no appearance of lower extremity1: appearance of dividing line between symphyseal
surface and ischiopubic ramus2: presence of a “V” angle3: atrophy or disappearance of “V” angle
4. Ventralrampart
0: no appearance of ventral rampart1: local ventral rampart2: fully developed ventral rampart, may have hiatus3: ventral rampart becomes wider or nodular in middle
and/or superior portion(s)
5. Ossificnodule
0: no appearance of ossific nodule1: presence of ossific nodule2: incorporation and disappearance of ossific nodule
6. Dorsalmargin
0: no appearance of dorsal margin1: edged margin without a plateau2: forming a plateau with lipping3: middle destruction or generalized atrophy of dorsal
margin
7. Ventralbeveling
0: no appearance of ventral beveling1: palpable right angle between ventral and symphyseal
surfaces2: right angle becomes flat in the lower portion or
disappears
8. Generalmacroscopicchangesof thesymphysealsurface
0: symphyseal surface is raised and billowy1: irregular surface2: flat or depressed with clear periphery
9. Bone densityof thesymphysealsurface
0: ridges and furrows, or rough with no distinct ridgesand furrows
1: smooth, dense and solid2: irregular, some microporosity and/or macroporosity3: big pits and/or loss of density
FLEISCHMAN . ASSESSMENT OF CHEN ET AL. AND SUCHEY-BROOKS AGING METHODS 11
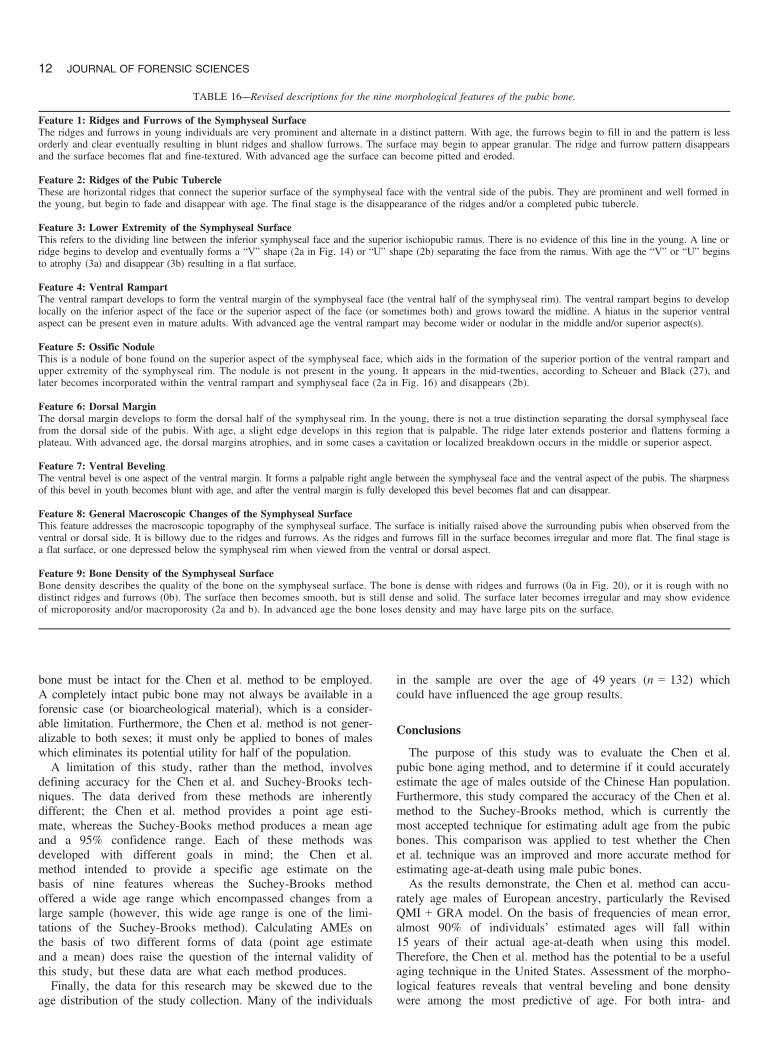
bone must be intact for the Chen et al. method to be employed.A completely intact pubic bone may not always be available in aforensic case (or bioarcheological material), which is a consider-able limitation. Furthermore, the Chen et al. method is not gener-alizable to both sexes; it must only be applied to bones of maleswhich eliminates its potential utility for half of the population.A limitation of this study, rather than the method, involves
defining accuracy for the Chen et al. and Suchey-Brooks tech-niques. The data derived from these methods are inherentlydifferent; the Chen et al. method provides a point age esti-mate, whereas the Suchey-Books method produces a mean ageand a 95% confidence range. Each of these methods wasdeveloped with different goals in mind; the Chen et al.method intended to provide a specific age estimate on thebasis of nine features whereas the Suchey-Brooks methodoffered a wide age range which encompassed changes from alarge sample (however, this wide age range is one of the limi-tations of the Suchey-Brooks method). Calculating AMEs onthe basis of two different forms of data (point age estimateand a mean) does raise the question of the internal validity ofthis study, but these data are what each method produces.Finally, the data for this research may be skewed due to the
age distribution of the study collection. Many of the individuals
in the sample are over the age of 49 years (n = 132) whichcould have influenced the age group results.
Conclusions
The purpose of this study was to evaluate the Chen et al.pubic bone aging method, and to determine if it could accuratelyestimate the age of males outside of the Chinese Han population.Furthermore, this study compared the accuracy of the Chen et al.method to the Suchey-Brooks method, which is currently themost accepted technique for estimating adult age from the pubicbones. This comparison was applied to test whether the Chenet al. technique was an improved and more accurate method forestimating age-at-death using male pubic bones.As the results demonstrate, the Chen et al. method can accu-
rately age males of European ancestry, particularly the RevisedQMI + GRA model. On the basis of frequencies of mean error,almost 90% of individuals’ estimated ages will fall within15 years of their actual age-at-death when using this model.Therefore, the Chen et al. method has the potential to be a usefulaging technique in the United States. Assessment of the morpho-logical features reveals that ventral beveling and bone densitywere among the most predictive of age. For both intra- and
TABLE 16––Revised descriptions for the nine morphological features of the pubic bone.
Feature 1: Ridges and Furrows of the Symphyseal SurfaceThe ridges and furrows in young individuals are very prominent and alternate in a distinct pattern. With age, the furrows begin to fill in and the pattern is lessorderly and clear eventually resulting in blunt ridges and shallow furrows. The surface may begin to appear granular. The ridge and furrow pattern disappearsand the surface becomes flat and fine-textured. With advanced age the surface can become pitted and eroded.
Feature 2: Ridges of the Pubic TubercleThese are horizontal ridges that connect the superior surface of the symphyseal face with the ventral side of the pubis. They are prominent and well formed inthe young, but begin to fade and disappear with age. The final stage is the disappearance of the ridges and/or a completed pubic tubercle.
Feature 3: Lower Extremity of the Symphyseal SurfaceThis refers to the dividing line between the inferior symphyseal face and the superior ischiopubic ramus. There is no evidence of this line in the young. A line orridge begins to develop and eventually forms a “V” shape (2a in Fig. 14) or “U” shape (2b) separating the face from the ramus. With age the “V” or “U” beginsto atrophy (3a) and disappear (3b) resulting in a flat surface.
Feature 4: Ventral RampartThe ventral rampart develops to form the ventral margin of the symphyseal face (the ventral half of the symphyseal rim). The ventral rampart begins to developlocally on the inferior aspect of the face or the superior aspect of the face (or sometimes both) and grows toward the midline. A hiatus in the superior ventralaspect can be present even in mature adults. With advanced age the ventral rampart may become wider or nodular in the middle and/or superior aspect(s).
Feature 5: Ossific NoduleThis is a nodule of bone found on the superior aspect of the symphyseal face, which aids in the formation of the superior portion of the ventral rampart andupper extremity of the symphyseal rim. The nodule is not present in the young. It appears in the mid-twenties, according to Scheuer and Black (27), andlater becomes incorporated within the ventral rampart and symphyseal face (2a in Fig. 16) and disappears (2b).
Feature 6: Dorsal MarginThe dorsal margin develops to form the dorsal half of the symphyseal rim. In the young, there is not a true distinction separating the dorsal symphyseal facefrom the dorsal side of the pubis. With age, a slight edge develops in this region that is palpable. The ridge later extends posterior and flattens forming aplateau. With advanced age, the dorsal margins atrophies, and in some cases a cavitation or localized breakdown occurs in the middle or superior aspect.
Feature 7: Ventral BevelingThe ventral bevel is one aspect of the ventral margin. It forms a palpable right angle between the symphyseal face and the ventral aspect of the pubis. The sharpnessof this bevel in youth becomes blunt with age, and after the ventral margin is fully developed this bevel becomes flat and can disappear.
Feature 8: General Macroscopic Changes of the Symphyseal SurfaceThis feature addresses the macroscopic topography of the symphyseal surface. The surface is initially raised above the surrounding pubis when observed from theventral or dorsal side. It is billowy due to the ridges and furrows. As the ridges and furrows fill in the surface becomes irregular and more flat. The final stage isa flat surface, or one depressed below the symphyseal rim when viewed from the ventral or dorsal aspect.
Feature 9: Bone Density of the Symphyseal SurfaceBone density describes the quality of the bone on the symphyseal surface. The bone is dense with ridges and furrows (0a in Fig. 20), or it is rough with nodistinct ridges and furrows (0b). The surface then becomes smooth, but is still dense and solid. The surface later becomes irregular and may show evidenceof microporosity and/or macroporosity (2a and b). In advanced age the bone loses density and may have large pits on the surface.
12 JOURNAL OF FORENSIC SCIENCES

inter-observer tests the correlations were high indicating low lev-els of error. This signifies that with training and sufficient knowl-edge of pubic bone morphology the Chen et al. method can belearned and applied by individuals with limited osteological expe-rience, as well as by professional anthropologists.Although it has been demonstrated that the Chen et al. method
is accurate, I do have some reservations regarding the technique.When applied to a North American sample, the method is not
nearly as accurate as it was in China. For this sample, ages wererarely (between 5.9% and 10.8%) correctly estimated within1 year of actual age; thus, the claim by Chen et al. that theirmethod can accurately estimate age within 1 year of an individ-ual’s actual age-at-death is not substantiated by a North Americansample. Thus, this reduces the method’s utility in the UnitedStates. This method requires practice prior to implementation andthe original published descriptions and photographs are slightlyambiguous due to translation from Chinese; for example, interpret-ing the scoring criteria for density of the symphyseal surface as“ridged or rough with no ridge” (Feature 9, score 0 from Chenet al. 2008) was challenging. Thus, the author revised the morpho-logical descriptions, scoring, and photographs to reduce ambiguity(Figs 12–20, Tables 15 and 16). On the basis of these limitations,and until more research is conducted to test this aging technique,the Chen et al. method should be applied in conjunction withother, more rigorously studied, adult aging methods.The results of this research do not imply that the Suchey-
Brooks method should be supplanted by the Chen et al. method.This study does, however, suggest that the Chen et al. method iscomparable—with regard to accuracy—to the Suchey-Brooksmethod for estimating age for this North American male sample,and that the Revised Chen et al. models are an improvementover the Suchey-Brooks method for males between the ages of35 and 49 years. As a result, the Chet et al. method can be usedto accurately assess age-at-death for males of European ancestry,especially those of middle age.Aging this older group is often challenging, so the Chen et al.
method is a unique tool for physical anthropologists, and is asignificant contribution to the forensic discipline. In addition, theaccuracy data (error and bias) for the Revised Chen et al.method are scientifically valid and can therefore be employed ina legal setting according to the Daubert ruling (26). If an anthro-pologist is willing to take the time to learn the technique andapply it to complete, modern pubic bones, the Chen et al.method can be used to accurately assess age-at-death for malesof European ancestry.
Acknowledgments
Many thanks to Dr. Todd Fenton, Dr. Laura Fulginiti,Dr. Norman Sauer, Dr. Kristen Hartnett, and Dr. Jennifer Cobbinafor their advice and support. I also want to thank Cheryl Anderson,Jesus Villa, and Paul Curran for their assistance with this project.
References
1. Mulhern DM, Jones EB. Test of revised method of age estimation fromthe auricular surface of the ilium. Am J Phys Anthropol 2005;126:61–5.
2. Buckberry JL, Chamberlain AT. Age estimation from the auricularsurface of the ilium: a revised method. Am J Phys Anthropol2002;119:231–9.
3. Meindl RS, Lovejoy CO, Mensforth RP, Walker RA. A revised methodof age determination using the os pubis, with a review and tests of accu-racy of other current methods of pubic symphyseal aging. Am J PhysAnthropol 1985;68:29–45.
4. Meindl RS, Lovejoy CO. Age changes in the pelvis: implications forpaleodemography. In: _Is�can MY, editor. Age markers in the humanskeleton. Springfield, IL: C. C. Thomas, 1989;137–68.
5. Djuri�c M, Djoni�c D, Nikoli�c S, Popovi�c D, Marinkovi�c J. Evaluation ofthe Suchey-Brooks method for aging skeletons in the Balkans. J ForensicSci 2007;52(1):21–3.
6. Chen X, Zhang Z, Tao L. Determination of male age at death in ChineseHan population: using quantitative variables statistical analysis frompubic bones. Forensic Sci Int 2008;175:36–43.
7. Brooks ST, Suchey JM. Skeletal age determination based on the ospubis: a comparison of the Acs�adi-Nemesk�eri and Suchey-Brooks meth-ods. J Hum Evol 1990;5(3):227–38.
8. Hanihara K, Suzuki T. Estimation of age from the pubic symphysis bymeans of multiple regression analysis. Am J Phys Anthropol1978;48:233–40.
9. Baccino E, Ubelaker DH, Hayek LAC, Zerilli A. Evaluation of sevenmethods of estimating age at death from mature human skeletal remains.J Forensic Sci 1999;44(5):931–6.
10. Hartnett KM. A re-evaluation and revision of pubic symphysis andfourth rib aging techniques [dissertation]. Tempe (AZ): Arizona StateUniversity, 2007.
11. Hartnett KM. Analysis of age-at-death estimation using data from a new,modern autopsy sample part I: pubic bone. J Forensic Sci 2010;55(5):1145–51.
12. Buikstra JE, Ubelaker DH, editors. Standards for data collection fromhuman skeletal remains. Fayetteville, AR: Arkansas ArchaeologicalSurvey, 1994.
13. Todd TW. Age changes in the pubic bone. I. The male white pubis.Am J Phys Anthropol 1920;3(3):285–339.
14. Katz D, Suchey JM. Age determination of the male os pubis. Am J PhysAnthropol 1986;69:427–35.
15. Suchey JM, Katz D. Applications of pubic age determination in a foren-sic setting. In: Reichs KJ, editor. Forensic osteology: advances in theidentification of human remains. 2nd edn. Springfield, IL: C. C. Thomas,1998;204–36.
16. Lovejoy CO, Meindl RS, Mensforth RP, Barton TJ. Multifactorial deter-mination of skeletal age at death: a method of blind tests of its accuracy.Am J Phys Anthropol 1985;68:1–14.
17. Schmitt A. Age-at-death assessment using the os pubis and the auricularsurface of the ilium: a test on an identified Asian sample. Int J Osteoarch2004;14:1–6.
18. Martrille L, Ubelaker DH, Cattaneo C, Seguret F, Tremblay M, BaccinoE. Comparison of four skeletal methods for the estimation of age atdeath on white and black adults. J Forensic Sci 2007;52(2):302–7.
19. Hens M, Rastelli E, Belcastro G. Age estimation from the human oscoxa: a test on a documented Italian collection. J Forensic Sci 2008;53(5):1040–3.
20. Passalacqua NV. The utility of the Samworth and Gowland age-at-death“look-up” tables in forensic anthropology. J Forensic Sci 2010;55(2):482–7.
21. Hamilton LC. Regression with graphics: a second course in appliedstatistics. Belmont, CA: Duxbury Press, 1992.
22. Field A. Discovering statistics using SPSS. 3rd edn. London, UK: SagePublications, 2009.
23. Hefner JT. Cranial nonmetric variation and estimating ancestry. J Foren-sic Sci 2009;54(5):985–95.
24. Suchey JM, Wiseley DV, Katz D. Evaluation of the Todd and McKern-Stewart methods for aging the male os pubis. In: Reichs KJ, editor.Forensic osteology: advances in the identification of human remains.Springfield, IL: C. C. Thomas, 1986;33–67.
25. Komar DA. Lessons from Srebrenica: the contributions and limitationsof physical anthropology in identifying victims of war crimes. J ForensicSci 2003;48(4):713–6.
26. Daubert v. Merrell Dow Pharmaceuticals Inc., 509 U.S. 579, 113 S.Ct.2786, 125 L.Ed.2d 469 (1993).
27. Scheuer L, Black S. The juvenile skeleton. San Diego, CA: AcademicPress, 2004.
Additional information and reprint requests:Julie M. Fleischman, M.S.Michigan State UniversityDepartment of Anthropology355 Baker HallEast Lansing, MI 48824E-mail: [email protected]
FLEISCHMAN . ASSESSMENT OF CHEN ET AL. AND SUCHEY-BROOKS AGING METHODS 13
Copyright © 2022 FDOKUMEN