
A combinatorial auction improves school meals in Chile: a case of OR in developing countries
20
A combinatorial auction improves school meals in Chile: a case of OR in developing countries Rafael Epstein a , Lysette Henrı´quez b,c , Jaime Catala´n a , Gabriel Y. Weintraub a , Cristia´ n Martı´nez d,e and Francisco Espejo b a Department of Industrial Engineering, University of Chile, Repu ´blica 701, Santiago, Chile, b Junta Nacional de Auxilio Escolar y Becas ( JUNAEB), Chile, c United Nations Development Programme (UNDP), Mexico, d Supervision Department, JUNAEB, Chile, e Antonio Varas 153, Providencia, Santiago, Chile E-mail: [email protected] [Epstein]; [email protected] [Henrı´quez]; [email protected] [Catala ´n]; [email protected] [Weintraub]; [email protected] [Martı´nez]; [email protected] [Espejo] Received December 2001; received in revised form January 2004; accepted March 2004 Abstract The Chilean State delivers essential meal services at schools for low-income students. Junta Nacional de Auxilio Escolar y Becas, the institution in charge of covering 1,300,000 children, leases the meal service to private enterprises. We developed an integer linear programming model to assign the meal contracts, in a process known as combinatorial auctions. The resulting model, which is NP-hard, led to significant improvements in efficiency and also contributed to making the process more transparent. The results are apparent in substantial improvements in quality and coverage of the service, and important savings to the country, which are equivalent to feeding 300,000 children in addition. We developed techniques to solve the combinatorial models and also to analyze and compare multiple scenarios to find robust solutions. For the objective function of this problem, we analyzed several options to consider different kinds of social benefits. In this paper, we describe the problem, the methodology and the results. We also present empirical results based on 6 years of experience. Finally, we discuss the relevance and impact of using operations research in these central issues in developing countries. Keywords: Combinatorial auctions; public policy 1 Introduction ‘There is no such thing as a free lunch’, goes a saying beloved by economists. Nothing is free in this life. But Chile’s National Board responsible for school grants and assistance (Junta Nacional Intl. Trans. in Op. Res. 11 (2004) 593–612 INTERNATIONAL TRANSACTIONS IN OPERATIONAL RESEARCH r 2004 International Federation of Operational Research Societies. Published by Blackwell Publishing Ltd.
Transcript of A combinatorial auction improves school meals in Chile: a case of OR in developing countries

A combinatorial auction improves school meals in Chile: acase of OR in developing countries
Rafael Epsteina, Lysette Henrıquezb,c, Jaime Catalana, Gabriel Y. Weintrauba,Cristian Martınezd,e and Francisco Espejob
aDepartment of Industrial Engineering, University of Chile, Republica 701, Santiago, Chile,bJunta Nacional de Auxilio Escolar y Becas ( JUNAEB), Chile,cUnited Nations Development Programme (UNDP), Mexico,
dSupervision Department, JUNAEB, Chile,eAntonio Varas 153, Providencia, Santiago, Chile
E-mail: [email protected] [Epstein]; [email protected] [Henrıquez];
[email protected] [Catalan];
[email protected] [Weintraub]; [email protected] [Martınez]; [email protected] [Espejo]
Received December 2001; received in revised form January 2004; accepted March 2004
Abstract
The Chilean State delivers essential meal services at schools for low-income students. Junta Nacional deAuxilio Escolar y Becas, the institution in charge of covering 1,300,000 children, leases the meal service toprivate enterprises. We developed an integer linear programming model to assign the meal contracts, in aprocess known as combinatorial auctions. The resulting model, which is NP-hard, led to significantimprovements in efficiency and also contributed to making the process more transparent. The results areapparent in substantial improvements in quality and coverage of the service, and important savings to thecountry, which are equivalent to feeding 300,000 children in addition. We developed techniques to solve thecombinatorial models and also to analyze and compare multiple scenarios to find robust solutions. For theobjective function of this problem, we analyzed several options to consider different kinds of social benefits.In this paper, we describe the problem, the methodology and the results. We also present empirical resultsbased on 6 years of experience. Finally, we discuss the relevance and impact of using operations research inthese central issues in developing countries.
Keywords: Combinatorial auctions; public policy
1 Introduction
‘There is no such thing as a free lunch’, goes a saying beloved by economists. Nothing is free inthis life. But Chile’s National Board responsible for school grants and assistance (Junta Nacional
Intl. Trans. in Op. Res. 11 (2004) 593–612
INTERNATIONAL TRANSACTIONS
IN OPERATIONALRESEARCH
r 2004 International Federation of Operational Research Societies.
Published by Blackwell Publishing Ltd.

de Auxilio Escolar y Becas ( JUNAEB)), is an exception that proves the rule, providing dailybreakfasts and lunches for 1,300,000 school children, on a budget of US$180 million.JUNAEB Directors and Academics with the University of Chile’s Department of Industrial
Engineering have developed and applied an operational research tool that has made it possible tosave US$40 million a year, improving ration quality and service coverage. JUNAEB applied thistool for the first time in 1997 and in every auction since.Chile is a developing country with 15 million inhabitants. The average annual economic growth
during the 1990s was 6.3%, which boosted per capita income from US$2,768 in 1990 to US$4,603in 2000. During this same period, poverty fell from 39% to 20%, and from 50% to 30% in thecase of minors under 18 years of age. Primary school coverage (children from 6 to 14 years of age)has reached 97%, while secondary school enrollment (young people from 15 to 18 years) is 84%.Illiteracy in Chile stands at 4.4%. In short, Chile has progressed significantly in the past decadeand this has made it possible to improve the social conditions of the poorest of its people;nonetheless, 30% of children still live in poverty.In this context, the 70% rise in state spending on education during the decade is
understandable. Chile’s development strategy is partly based on improving the education of thepoorest children. The purpose of the JUNAEB, a public agency associated with the educationsector, is to provide children from the lowest income households with meals at school, during theschool day (breakfast, lunch and dinner). This national service, provided at no cost to students,has been crucial in reducing school dropout rates and in improving the academic achievements ofthe children receiving these benefits.The JUNAEB’s annual budget for all social programs is US$150 million (year 2000), with
US$138 million spent on the school food program (Programa de Alimentacion Escolar (PAE)),which benefits 1,200,000 children. The JUNAEB has other programs, for example providingeyeglasses to students, at a cost of US$3 million per year. The JUNAEB is also responsible forauctioning food programs associated with two other agencies, JUNJI and INTEGRA, which areresponsible for child care (infants and children from 4 to 5 years). Together, these two agenciesserve 126,000 children with an annual budget of US$46 million. These auctions are very importantto the country, not only because of the amounts involved but also because of the socialimportance of the service involved: providing food to Chile’s most vulnerable children studying inschools.The JUNAEB has granted concessions to these food services to private companies through
public auctions since 1980. The number of companies bidding has risen from three in 1980 to 35 in2002. The country is divided into 90 territorial units (TUs) and each JUNAEB auctions off serviceto 30 of these, with contracts lasting 3 years.These auctions are very complex. In the first place, different kinds of foods must be provided
according to the children’s age, the school and their economic situation. The different regionalrealities must also be considered, involving school access and food habits. Moreover, theseauctions involve 3-year contracts but the unforeseen does occur. Finally, we must deal with verytight budgets on one hand and the need to maximize service quality on the other.Before 1997, contracts were assigned by a committee applying rather rudimentary and
subjective criteria. Basically, a series of filters based on financial and technical criteria wereapplied, which eliminated some offers. Thus, an iterative method was used to eliminate possibleoptions until a solution, supposedly of good quality, was obtained. Given the complexity of
R. Epstein et al. / Intl. Trans. in Op. Res. 11 (2004) 593–612594

auctions, this solution was obviously not very efficient and, even worse, permitted all kinds ofpressure on the committee. In auctions of this scope, it is essential to have objective, transparentprocedures in place to reduce possible pressures, be they legitimate or otherwise, and forcecompanies to compete in quality and prices (Klemperer, 2002).Every company participating in an auction provides a technical offer and several financial
offers. Each financial offer includes a set of TUs and a set of prices for the services bid on. Eachfinancial offer is accepted or rejected as a whole and companies can provide all the financial offersthey wish. Freedom to offer on different packages of TUs, gives the auction a combinatorialnature.In technical terms, we developed a mixed integer programming model in which the offers to be
selected are the decision variables. This problem is hard to solve. In mathematical terms, itbelongs to the class NP-hard and includes classical combinatorial structures: the set-coveringproblem, the knapsack problem, and the uncapacitated facility-location problem. We usesophisticated optimization techniques to solve real instances and the system runs on a personalcomputer, using the CPLEX optimization program.The methodology consists of analyzing many scenarios, differentiated by cost, quality, price
bands, menus and other operating aspects. Using the mathematical model, we found the optimalsolution for each scenario. The inter-ministerial committee that decides the auction evaluates thedifferent scenarios and, based on the budget available and long-term policies, chooses an optimalsolution and scenario for the auction result. The committee pays special attention to ensure thatthe solution, which is the set of offers selected, is coherent and robust for the country as a whole,that is, promises efficiency in every scenario that could appear during the 3-year contract.The new auction system encourages efficiency, transparency and fairness. For example, the
possibility that companies have to develop suitable territorial offers has allowed them to reflect onthe economies of scale in the prices they offer, and thus make the auction more efficient. Thesesavings occur for many reasons: already depreciated infrastructure, transportation, discounts forhigher volumes, knowledge of the region, and so on. The system, moreover, is efficient becausegiven the assumptions, the mathematical model makes it possible to identify the best combinationof offers.For this process to be transparent, every step of the process must be objective, specifically, the
financial evaluation of companies, performance evaluations, standardization of technical offers,adjudication and other criteria involved. Each step can be audited and the whole processduplicated, which guarantees seriousness, a factor that companies appreciate.Standardizing technical offers involves defining the composition of food rations. Additional
services, such as more frequent fruit, are valued separately in the financial offer. Thus, theadjudication committee can compare products with similar characteristics, and if the budgetpermits, choose enriched rations. In the past, the quality of offers and prices varied, making itdifficult to compare. Today, all the companies offer the same products.Finally, the issue of fairness arises, as a consequence of efficiency and transparency. Companies
must perceive that the process is fair, that is, that everyone had the same chance and that thedecision was made in terms of the common good. To guarantee fairness it is vital to select the bestsolution according to auction rules. For example, if the rules call for choosing the least expensiveoption, it would be unfair to select anything but the least expensive offer. Under the new auctionsystem, the possibilities of exercising undue pressure on staff are virtually non-existent and
R. Epstein et al. / Intl. Trans. in Op. Res. 11 (2004) 593–612 595
companies must concentrate on improving their efficiency to offer the best price and service. Thistransparency favors the entry of new companies into the system, because they can evaluate thisbusiness possibility objectively.Of the savings reported by the JUNAEB, 60% arise due to greater transparency and healthy
competition among companies. The other 40% reflects greater efficiency introduced into theprocess, through territorial flexibility and optimization models.This application has stimulated interest in other developing countries that face very similar
problems. The United Nations’ Food and Agriculture Organization considers the JUNAEB aninternational example of good management and efficiency. The Chilean government considerJUNAEB excellent. Moreover, the ILOG technology firm, owner of the CPLEX optimizationsoftware, is publicizing this experience as a successful case and example for other combinatorialauctions.In Section 2, we review the state of the art of combinatorial auctions, evaluating the main
applications. Section 3 provides a detailed description of the auction process. In Section 4 weformulate and analyze the mathematical programming model. In Section 5, we provide details ofimplementation, and Section 6 offers results and conclusions. Finally, Section 7 shows how thiswork is related to OR in development.
2 Bibliographic review
In the so-called ‘combinatorial’ auctions, bidders are encouraged to present offers for differentproduct combinations, to take advantage of their complementary nature (e.g., rights to a singletransmission frequency for neighboring geographic regions) or substitution (e.g., rights todifferent transmission frequencies in a single geographic region) for different products, oreconomies of scale (e.g., volume discounts, geographic proximity, transport efficiency). This typeof auction generally arises when each resource is just one part of a possible solution and onlyproduct packages have any real value. We now review the applications reported in the literature.Combinatorial auctions have been of increasing interest in the literature in the last 10 years
since the spectrum auction done by the FCC of the United States (McMillan, 1994). Publicationsdone by Vickrey (1961) in the 1960s and Jackson (1976) in the 1970s, for adjudicating radiofrequency rights, are pioneering works in the area.Despite the technical advantages of combinatorial auctions, as Kelly and Steinberg (2000) point
out in practice we see few applications of this sort. The main implementation problems arise fromthe complexity of administering combinatorial auctions. Bidders have to evaluate offercombinations with enormous precision to take full advantage of synergies and economies ofscale. Secondly, there is a large universe of offers that companies can make for subsets of goods tobe auctioned, and this increases the size of the problem exponentially. Typically, the resultingproblem is in theory NP-hard and in practice proves difficult to solve.Andersson et al. (2000) compare the results from recent adjudication heuristics and traditional
heuristics. They also compare these results with those from a mixed integer programmingapproach. In a similar study, Fujishima et al. (1999) compare a mathematical programmingapproach that ensures an optimal solution with a market-based heuristic method. Nisan (2000)
R. Epstein et al. / Intl. Trans. in Op. Res. 11 (2004) 593–612596
studies the problem of representing the offer function. The author formalized multiplerepresentation languages and analyzes strengths and weaknesses.Baird (1984) describes an auction that attempts to reduce the levels of fish catches when the
participants present offers corresponding to the price at which they would be willing to maintaintheir catch levels. Brewer and Plott (1996) study the application of combinatorial type auctions tothe adjudication of railway line segments. Letchford (1996) describes an auction to hire school busoperators, which allows discounts for those bidding on more than one contract. In this case, theinstance was relatively small: 201 individual and three group offers.Progress in combinatorial algorithms and computer-processing capacity has contributed to the
rebirth of combinatorial auctions. The consulting firm, Saitech-INC, offers a software calledSBIDS for auctioning off packages of routes among transportation companies. The OptiBidtsystem, from Logistics.com, has been used for transportation contract auctions for companiesincluding Ford, Wal-Mart and K-Mart, worth US$5 billion through January 2000 (Vries andVohra, forthcoming). As far as we know, there are not many more real world problems where acombinational auction has been successfully used.In our case, companies participating in the JUNAEB auction are encouraged to present offers
for sets of TUs, to take advantage of economies of scale. If the JUNAEB required companies topresent separate offers for each TU, they would run the risk of ‘exposure’ (Rothkopf et al., 1997).If they offer a cheap price for each individual TU, thinking they will adjudicate the whole set, theymay lose money if they adjudicate just one. However, if they offer higher prices for each TU,consistent with adjudicating just one, their chances of winning several bids decline.
3 The auction process
Chile’s educational system consists of more than 14,000 schools grouped into 90 TUs, which inturn fall under the country’s 13 administrative regions (see Fig. 1). Every year, the JUNAEB,JUNJI and INTEGRA auction off the food services for 30 TUs for the 3-year period.The JUNAEB school meals program is divided into five subprograms: pre-school education,
primary education, secondary education, vacations and households. Pre-school and primaryeducation programs are compulsory. Pre-school education lasts 2 years, primary education 8, andsecondary education 4. JUNJI has a subprogram for meals at child-care facilities, whileINTEGRA has a subprogram for meals at infant-care facilities.Each subprogram includes different meals, with different nutritional and caloric contents. For
example, the high-school subprogram involves providing four types of rations, the RM-350(breakfast, 350 cal), the RM-650 (lunch, 650 cal), the RM-800 (lunch, 800 cal) and the RM-1000(dinner, 1000 cal). Each TU has demand for each type of ration in each subprogram during theauction period.Companies also bid on ‘extra’ services, which may be included with regular products for the
JUNAEB programs. Examples of these services include more frequent vegetables, steel trays andglasses made of glass instead of plastic.The auction process involves six main steps that must be strictly followed in terms of order and
timing. The first is registration of firms, followed by their classification. Companies next submittheir bids, including a technical project and financial bids. The process ends with assigning the
R. Epstein et al. / Intl. Trans. in Op. Res. 11 (2004) 593–612 597

winning bids, using the mathematical model to evaluate different scenarios. In Fig. 2, we present achronological chart of the main activities in this new auction process. We describe the first fivesteps in this section.
3.1 Registration of firms
The process begins with a call for expressions of interest and registration of interested firms.JUNAEB then evaluates the interested parties from a managerial, technical, legal and financialpoints of view, eliminates those who do not satisfy minimum standards, and assesses the capacitiesof the remaining.
3.2 Classification of firms
The firms qualifying as reliable are then classified according to two further aspects:
UT 1UT 2
UT 4
UT 3
UT 5
UT 6
UT 7
UT 8
UT 9
Region 1
Region 2
UT 90
Region 13
UT 88
UT 89
UT 87
Chile
Fig. 1. Chile’s regional divisions, which in turn are divided into territorial units (TUs), averaging seven TUs per region.
Registration offirms
Classification of firms
Submission of bids
Technical project
Financial bids
Assignment winning bids
Fig. 2. Chronological chart of the auction process.
R. Epstein et al. / Intl. Trans. in Op. Res. 11 (2004) 593–612598
� Financial and operating capacity: firms are sorted into one of five categories, according to themaximum number of TUs they would be capable of serving, anywhere between one and eightTUs.
� JUNAEB also evaluates the past performance of companies providing food services. Theresult is a performance index based on multiple factors, such as surveys of the children,warehouse infrastructure, the cold chain, and others. This performance index is used in theoptimization model objective function; so companies consider it very important. Thisevaluation is subject to pre-established rules and there is an appeals procedure if the companydisagrees with its evaluation.
3.3 Submission of bids
Following this, a public call to tender is made and the ground rules for the bidding process are puton sale. Potential concession holders (currently numbering about 35) then submit their bids inelectronic format, on CDs. This facilitates company submissions and data input for theassignment model. Each CD receives a code and the bidder’s name code key is deposited with anotary; so evaluators do not know who the winner is until they award the contract. Each firmpresents a technical project for the meals service and different financial bids.
3.4 Technical project
The technical project is based on requirements clearly established by the JUNAEB, which include:
� Nutritional requirements: Different meals must comply with their respective nutritionalspecifications.
� Food structure: Specifies the type of service (lunch, breakfast, etc.) and the frequency (orminimum and maximum presence) of certain foods, and the minimum variety required in themeals provided.
� Inputs: Specifies the minimum quality characteristics.� Operating conditions: Specifies hygiene, supplies, food handling, supervision, etc.� Infrastructure: Specifies furniture, equipment and crockery, etc.
The JUNAEB assesses whether each firm meets the requirements. Firms meeting theserequirements remain in the bidding process, going on to compete on the basis of price andperformance, through their respective financial bids.
3.5 Financial bids
Each financial bid presented by a firm specifies the coverage, from one to eight TUs, depending onthe upper limit permitted by the company’s classification. As mentioned, firms can present asmany bids as they wish.Companies can raise the unit price if demand during contract execution is less than projected by
the JUNAEB, affecting the structure of fixed and variable service costs. The auction includesprices for four demand tranches. The first is projected demand; the second operates if demand is
R. Epstein et al. / Intl. Trans. in Op. Res. 11 (2004) 593–612 599

80% of projections; the third comes into force if demand is 60% of projections. The fourth comesinto effect if demand is more than 4% above projections. The second and third tranches includesurcharges on the unit fee while the fourth tranche involves a discount. Changes in demand canoccur due to natural disasters, strikes or other unpredictable events. This differential price systemmeans that companies do not have to assume risks that have nothing to do with theirmanagement.If the different programs, rations, structures and tranches are considered, we can see that an
offer could include about 200 different prices. The offer is accepted or rejected as a whole. If theoffer is accepted, the JUNAEB can specify the products and services hired, from those included inthe offer, dynamically during the 3-year duration of the contract. Accepting a firm’s bid requiresthat the firm provide all meals services to the corresponding TUs.Given the different services provided, there are 30 meal types, each defined by the calories to be
provided and detailed nutritional requirements. For example, meal B350 is a 350-cal breakfast forprimary school children, while meal M1000 is a 1000-cal lunch for secondary school children. Foreach, nutritionists have specified three food structures using different possible food combinationsto meet the required number of calories. These food structures vary in quality, thereby enablingJUNAEB to price a variety of products, some of which are better than others. For example, for a650-cal lunch structure specifies meat (beef, chicken, turkey, pork or mutton in different forms)ten times a month, while another specifies meat 14 times a month. Thus, each product consists ofmeal fully defined by the JUNAEB nutrition team, which establishes the number of calories,nutritional requirements and the frequency of required foods.To evaluate each offer, we considered the different scenarios that can affect contract
implementation, particularly demand tranches and food structures. Each TU has projecteddemand for the different ration types in each subprogram. Therefore, the number of rations andtheir unit value depends on demand and the food structure that we choose for the scenario.Once these variables are defined we can evaluate, an offer by calculating the unit price for each
service and multiplying it by demand for that scenario in the TUs included in the offer. The sum ofthese values corresponds to the value of the offer in that scenario.Once offers have been evaluated, the adjudication process begins. The selection of winning
offers is done by an adjudication committee formed by the ministries of finance, health care,education and the main executives within the JUNAEB.
4 Combinatorial analysis and model
The concession lasts 3 years and can face different scenarios. The methodology for assigningcontracts consists of choosing robust solutions, that is, those that not only meet the technical andfinancial constraints, but also are among the best in all or in most of the scenarios that may occurduring this period. The factors defining different scenarios are as follows:
(i) Objective function. We can optimize considering only costs and performances for JUNAEB, orconsidering parameters for the three institutions: JUNAEB, JUNJI and INTEGRA (twooptions).
R. Epstein et al. / Intl. Trans. in Op. Res. 11 (2004) 593–612600

(ii) Company performance. We can minimize auction costs or optimize a mixed function thatalso includes the company performance index (two options).
(iii) Food structure. We optimize different food structures, to examine the financial feasibility ofimproving service. Moreover, we consider different combinations of extra services, e.g. morefruit and vegetables (seven options).
(iv) Demand tranches. To evaluate the robustness of a solution, we must consider demandtranches that could affect contract operation for 3 years (four options).
(v) Price bands. Offers that are too cheap may cause companies to go broke and seriousproblems in replacing the service, as has often occurred. Because of this, the JUNAEB isinclined to eliminate the riskiest offers, thus defining two options, one involving theparticipation of the too cheap offers and the other with their elimination, a priori. Toidentify the too cheap offers, regional level statistics are used.
(vi) Limit of companies per region. The JUNAEB considers it appropriate that a minimum numberof firms operate in a single region, to ensure that there are options nearby in case somecompany goes broke. Having too many companies per region is not a good idea either,because the administration becomes more costly to the JUNAEB. Because imposing thislimitation involves a cost, scenarios with and without this restriction are evaluated (twooptions).
(vii) Solution dispersion. To keep companies working for JUNAEB in the long term and togenerate more competition among firms, the board prefers to employ several companies.Because this involves a cost, optimization must consider conditions with and without aminimum number within the scenarios (two options).
We have considered 500–700 scenarios in evaluating auctions, from the maximum of 896 thatwould appear with all the combinations, given that the committee considered some unlikely. Webuilt an integer linear programming model to find the optimal solution for each scenario. First weanalyzed the constraints and then studied the objective function.Let K represent the set of companies participating in the auction, I the set of TUs to auction, J
the set of financial bids, R the set of the country’s regions and S the set of scenarios to beevaluated. Let J be the set of financial bids, Jk the bids from company k, Ji the bids including theTU i, Jkr the bids of company k that include some TUs in region r. We call uj the set of TUsincluded in offer j, nsj the number of rations provided by offer j under contract in scenario s, and csjthe cost of offer j in scenario s. Let cap(k) represent the maximum number of TUs in whichcompany k can obtain the concession, Ns the total number of rations included in the auctionwithin scenario s. Given that the number of rations and the unit price depend on the scenario, wewill call the budget for scenario s, budget(s). For a set A, its cardinality is denoted by |A|. Themain decision variable is Xj which is 1 if bid j is selected and 0 otherwise.
4.1 Constraints
The following equation proposes that all TUs territorial units must be auctioned:Xj2Ji
Xj*1 for all i 2 I : ð1Þ
R. Epstein et al. / Intl. Trans. in Op. Res. 11 (2004) 593–612 601

This is the structure of a classical set-covering problem, where the bids are the coveringelements and the TUs the objects to be covered. Our case is known as a weighted set-coveringproblem because the objective function includes different weights for the decision variables.The set-covering problem belongs to the NP-hard class the most difficult combinatorial
problems. Fulkerson et al. (1974) present a set of difficult instances for the covering problem. Avis(1980) shows that for these instances a branch-and-bound algorithm requires exploring anexponential number of solutions. Is it not efficient to find approximate solutions. Chvatal (1979),based on work of Johnson (1974) and Lovasz (1975), designed a heuristic with guaranteed errorbounded by the harmonic series H(t) equal to
Pti¼1 i
�1, where t is the maximum number ofelements covered by some covering object. Lund and Yannakakis (1993) demonstrated that abetter approximation is unlikely to be found.Chvatal’s heuristic consists of selecting the covering element that satisfies the most constraints,
not previously covered, per cost unit. That is, this is equivalent to the intuitive method of choosingthe offer that covers more TUs per cost unit, after eliminating these TUs from the problem andrepeating the procedure until completing a covering for the problem. Considering the maximumof eight TUs per offer, the theory indicates that this method could provide a solution thatamounts to 2.72 times the optimal solution.In the last auction in 2002, 30 TUs were adjudicated and more than 25,000 offers arrived, for a
covering of 25,000 columns and 30 rows. What could give rise to concern about the algorithmiccomplexity is the number of offers and their constant growth over time, up from 4,500 offers in 1997.However, the number of TUs to be assigned remains 30 and this will not change in the short term.An initial combinatorial analysis indicates that any solution selects at most 30 offers, the
number of TUs. Therefore, the number of solutions is limited by the number of subsets of offersinvolving at most 30 elements, which is a polynomial Oð Jj j30Þ. This observation means thatstrictly speaking our covering problem with a fixed number of TUs is not NP-hard.A more finely tuned combinatorial analysis shows that the limited number of companies, about
35, also simplified our covering problem. Let us consider the simplified problem of assigning aTUs among b companies, with no capacity or other type of restriction. The number of differentsolutions is ba, given that TUs are distinguishable and each can be assigned to any of b companies.This result, where the number of offers does not explicitly appear, is very interesting because it isconsistent with our experience: we went from 4,500 to 25,000 offers, but the complexity did not risesignificantly. In the same period, the number of TUs and companies remained relatively constant.Companies’ financial capacity is reflected by the following constraint,X
j2Jkuj�� �� � Xj)capðkÞ for all k 2 K : ð2Þ
Each of these restrictions corresponds to a knapsack problem, so altogether these are known asmulti-knapsack. A cover for company k is a subset of offers from Jk, (which we call covk) such thatthe TUs included in these offers exceed cap(k) but meets the limit if we eliminate any of its offers.Therefore, the following cover constraint is valid for the multi-knapsack,
Xj2covk
Xj) covkj j � 1 for all k 2 K :
R. Epstein et al. / Intl. Trans. in Op. Res. 11 (2004) 593–612602

The literature reports cover inequalities as an effective way of reinforcing formulation (Crowderet al., 1983). We implement a variant that we call cover-clique inequality, as follows. Let Tk
represent the set of offers from company k that includes a number of TUs greater than half itscapacity. Then, for all j1, j2 in Tk we see that a cover inequality is Xj1 þ Xj2)1. These constraintsform a clique, a complete graph for the maximum stable set problem, which can more strongly beexpressed as:X
j2Tk
Xj)1 for all k 2 K : ð2aÞ
Cover-clique inequalities were very useful for resolving difficult instances within the auction.We note that cover-clique inequalities are better cuts than cover inequalities alone.To apply a minimum and maximum number of companies per region, we have to define the
following variable Ykr that takes the value 1 if company k serves some TU in region r and 0otherwise. Let mnfr(r) be the minimum number of companies in region r required by the JUNAEBand mxfr(r), the maximum. The following equation expresses this constraint:
mnfrðrÞ)Xk2K
Ykr)mxfrðrÞ for all r 2 R: ð3aÞ
We need to relate Y with X variables. In the first place, we must require that the variable Ykr isworth zero when there are no active offers from company k in region r. This equation would be:
Ykr)
Xj2Jkr
Xj for all k 2 K ; for all r 2 R: ð3bÞ
Secondly, it must be required that if an offer from company k including some TU in region r isselected, the respective Y variable is worth one. The following equation imposes this:X
j2JkrXj) Jkrj j � Ykr for all k 2 K ; for all r 2 R: ð3cÞ
Inequality (3c) appears in problems involving the uncapacitated facility location. An equivalentformulation (see Balakrishnan et al., 1989), would be:
Xj)Ykr for all k 2 K ; for all r 2 R; for all j 2 Jkr: ð3dÞWe refer to formulation (3c) as ‘compact’, while formulation (3d) will be considered ‘extended’.
The linear relaxation of the extended formulation is better than that for the compact one, in thesense that it will tend to be more whole. Inequality (3c) amounts to Ykr being more than or equalto the average for the X variables involved, which in general is a small fraction because althoughthere are many of these variables only a few are active in the solution.Moreover, inequality (3d) means that Ykr is greater than or equal to the maximum of X
variables involved, which clearly provides a larger value for Ykr if any of the X variables isactivated. When the upper bound mxfr(r) is active, the compact formulation is very poor andpossible convergence in a branch-and-bound method will be very slow. In this case, it seemsreasonable to use the extended formulation. Similarly, if mxfr(r) is not an active limit, it seemsbetter to use the compact formulation, because the linear relaxation is significantly faster to solveand the reinforcement provided by (3d) is unnecessary.
R. Epstein et al. / Intl. Trans. in Op. Res. 11 (2004) 593–612 603

To impose a minimum number of companies to be assigned through the auction, we need todefine the Zk variable, which is 1 if company k presents a winning offer and 0 otherwise. Let mnfabe the minimum number of companies presenting a winning bid. The constraint imposing thelimit is:
mnfa)Xk2K
Zk: ð4aÞ
To relate Z and Y variables, we impose the following constraint, similar to (3b):
Zk)
Xr2R
Ykr for all k 2 K : ð4bÞ
Finally, we require variables to be binary,
X ; Y ; Z 2 0; 1f g: ð5ÞIn the 2002 auction, 33 companies participated, presenting 25,000 offers for 30 TUs in seven ofChile’s regions. The model had 25,264 binary variables. The compact formulation had 573constraints, considering formulation (3a) as two constraints and without considering cover-cliqueinequalities or budget restrictions, which are added below. The extended formulation contains25,342 constraints of which 25,000 are class (3d), which reveals the difference in size amongformulations. The model contains three known combinatorial structures, each NP-hard. These areset-covering, multi-knapsack and uncapacitated facility location. The resulting model is also NP-hard given that it contains as a special case the set-covering problem, when bounds mnfr(r) andmnfa are 0, and bounds cap(k), mxfr(r) are infinite.
4.2 Objective function
First we minimize the cost of scenario s, which we call f s0 . Therefore,
f s0 ¼ minXj2J
csj � Xj:
Then we seek an objective function that includes companies’ past performance in applyingcontracts, as a powerful long-term sign to encourage companies to ensure they get good serviceevaluations. In this case, we add the budget constraint,X
j2Jcsj � Xj)budgetðsÞ: ð6Þ
Let rk represent the performance index for company k. One possibility is to maximize thearithmetic mean of the ration performance index, which we call f s1 , which would be equal to:
f s1 ¼ 1
Ns�max
Xk2K
Xj2Jk
rk � nsj � Xj:
This function presents a serious problem, which is that it assumes that the lack of quality in oneregion is offset in a linear fashion by excess quality in another. The following example illustratesthat this criterion is not very appropriate in this application. Suppose we hold an auctionincluding regions 1 and 2, involving 100 rations each. Company A’s performance index is 200 and
R. Epstein et al. / Intl. Trans. in Op. Res. 11 (2004) 593–612604

it offers $45 for region 1. Company B’s performance index is 800 and it offers $45 for region 2.Company Q’s performance index is 450 and it offers $92 for regions 1 and 2. The institution’sbudget is $95. If we apply f s1 we would end up selecting companies A and B in regions 1 and 2,respectively. Evidently, region 1 would receive service from a poorer performer and region 2 froma better performing company.Another alternative would be to maximize f s2 , the geometric mean of the rations assigned,
shown as follows:
f s2 ¼ maxYk2K
Yj2Jk
rnsj �Xj
k
! 1Ns
:
If we take the logarithm, we obtain the equivalent problem:
f s2 ¼ 1
Ns�max
Xk2K
Xj2Jk
nsj � log rkð Þ � Xj
If we apply f s2 to the previous example, the solution would be to give regions 1 and 2 tocompany Q. This function, however, presents some practical problems. First, professionals whoare not engineers or mathematicians, such as nutritionists, lawyers, physicians or teachers, find itdifficult to understand this. Another problem is that the cost does not explicitly appear in theobjective function, as we note in the following sections.In search of a balance in this sense, we propose the following objective function: f s3 and present
here:
f s3 ¼ minXk2K
Xj2Jk
csj
rk� Xj:
We implement f s3 for two reasons. First, the cost of the offer, unlike in the previous case, formspart of the objective function. Professionals with no understanding of OR can interpret the cost asunimportant when it does not explicitly appear in the objective function. It can be very difficult forthem to interpret the role of the budget constraint plays on equilibrium. In these cases, we believethere is a chance that companies will underestimate the importance of cost of this process and willtend to raise their prices. Second, it is easy for any professional to interpret the effect of theperformance index on the selection process: if the allocation falls within the budgeted amount, acompany with a performance index that is i% better than another’s may be i% more expensiveand the offers will be equivalent. Obviously, an active budgetary constraint favors the cheapestoffer. Moreover, the function f s3 also tends to exclude very low indices. In the previous example, f s3selects company Q, as does f s2 .
5 Solution and implementation
The process of evaluating offers and adjudication cannot take more than one week, for practicaland legal reasons. The analysis consists of evaluating the offers according to the scenario and thenfinding the optimal solution for each scenario. It is essential to do this in no more than 24 h,because normally during the week unexpected events occur and some evaluation parameters
R. Epstein et al. / Intl. Trans. in Op. Res. 11 (2004) 593–612 605
change, such as the budget or the number of rations. If we consider 700 scenarios, we see that theresolution for each should take 2min on average. The critical element is to find the optimalsolution, given that evaluating offers. Preparing reports and comparison tables are automated andvery quick.To solve these instances efficiently we first apply a simple algorithm with a 1-min time limit.
This consists of resolving the compact formulation with no additional cuts. Several scenarios aresolved on the first step. We used CPLEX with the branch-and-bound method to solve, in itsdifferent version according to the auction year.To solve the remaining scenarios, we use a more sophisticated version of the method, adding
cover-clique inequalities, also with a time limit (2min). For the scenarios that remain unsolved weagain make the algorithm more sophisticated, using the extended formulation and a new timelimit (5min). At this stage, all scenarios may end up solved or a couple may remain pending.Another key to this strategy is that it is possible to parallelize the work on several different
computers. On some occasions, we have worked on four computers at the same time. The two orthree most difficult instances that eventually remain unsolved are dealt with on individualcomputers. We have worked with an optimality tolerance of 0.01%, given the amounts involved.However, assigning a suboptimum solution can involve enormous costs in terms of the processimage. Although the difference in the objective function is limited to 0.01%, companies’participation in alternative solutions may end up very different. One company, for example, mayin the best case adjudicate many rations and in the approximate solution none or very few. Thiswould be unacceptable and unfair, damaging the credibility of the process. Because of this, wesolve to optimality all scenarios with any probability of being chosen.The empirical evidence indicates that it is best to start with the compact formulation because its
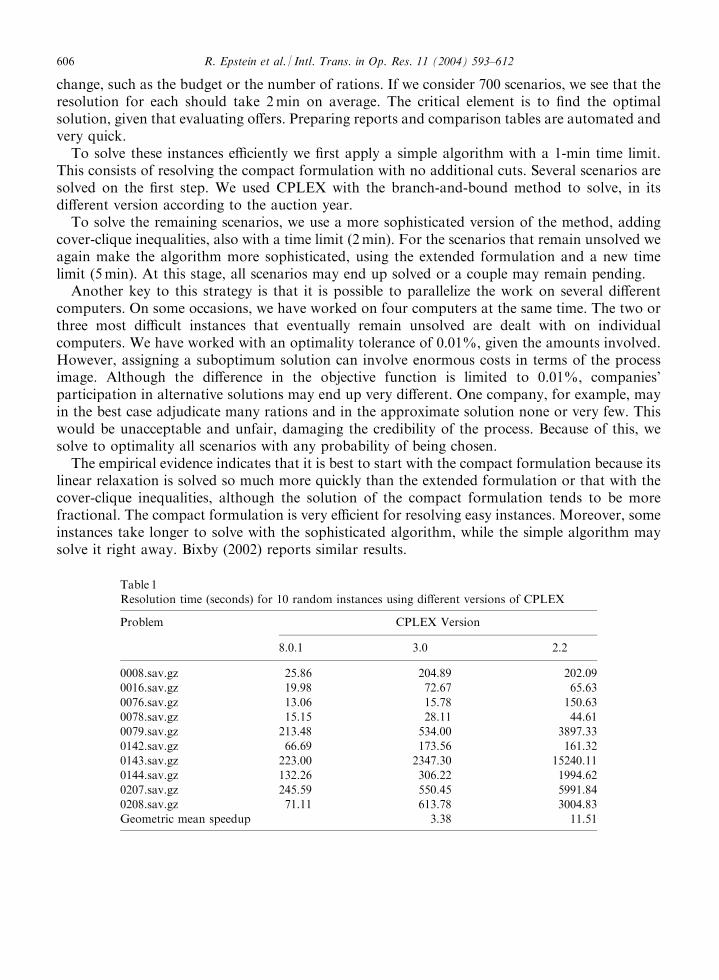
linear relaxation is solved so much more quickly than the extended formulation or that with thecover-clique inequalities, although the solution of the compact formulation tends to be morefractional. The compact formulation is very efficient for resolving easy instances. Moreover, someinstances take longer to solve with the sophisticated algorithm, while the simple algorithm maysolve it right away. Bixby (2002) reports similar results.
Table 1
Resolution time (seconds) for 10 random instances using different versions of CPLEX
Problem CPLEX Version
8.0.1 3.0 2.2
0008.sav.gz 25.86 204.89 202.09
0016.sav.gz 19.98 72.67 65.63
0076.sav.gz 13.06 15.78 150.63
0078.sav.gz 15.15 28.11 44.61
0079.sav.gz 213.48 534.00 3897.33
0142.sav.gz 66.69 173.56 161.32
0143.sav.gz 223.00 2347.30 15240.11
0144.sav.gz 132.26 306.22 1994.62
0207.sav.gz 245.59 550.45 5991.84
0208.sav.gz 71.11 613.78 3004.83
Geometric mean speedup 3.38 11.51
R. Epstein et al. / Intl. Trans. in Op. Res. 11 (2004) 593–612606

One issue to consider is how computers and optimization programs have evolved, in our caseCPLEX, from 1997 to 2002. In 1997, we used CPLEX 2.2 and 3.0 on a 300-MHz PC Pentium II.In 2002, we ran CPLEX 8.0 on a 1.8-GHz Pentium 4 computer.Many techniques that we describe to solve the model have actually been included in the latest
versions of CPLEX. In particular, (3d) constraints, which are an extension of (3c) constraints andcover inequalities. Older versions of CPLEX automatically carried out some of theseimprovements, but very inefficiently and it was better to turn off this feature of the software toachieve better results. Bixby (2002) reports similar experiences when he experimented with 10random instances using new and old CPLEX versions on a 667MHz Alpha station. Resolutiontimes reported in Table 1 clearly show that solution times have improved with the inclusion oftechniques similar to those that we are reporting. As a reference, the most difficult problem in the2002 auction took 20min to solve using CPLEX 8.0 and a 1.8-GHz Pentium 4.
Num. Prob: 1 Instance: as1b0e1
PARAMETERS ---------- 1. Food Structure: Alt. 1 Standard 2. Demand Level: 80-100 % 3. Objective Function: JUNAEB 4. Firm’s Performance Rating: NOT CONSIDERED 5. Predetermined Minimum Price: NO LIMIT 6. Minimum Number of Firms: NO LIMIT 7. Number of Firms per Region: LIMITED
ADDITIONAL FEATURES -------------------- DEFAULT
COSTS ----- Total JUNAEB+JUNJI+INTEGRA= 5785.48 mn (Under Budget: 503.13 mn) Total JUNAEB= 4278.16 mn (Under Budget: 434.31 mn) Total JUNJI = 933.38 mn (Under Budget: 88.42 mn) Total INTEGRA= 573.94 mn (Under Budget: −19.6 mn) Total Accepted bids: 6
Firms per Region
Region Firms LowBnd UpBnd --------------------------- 8 2 1 3 9 3 1 5 10 2 1 5 ---------------------------
OPTIMAL SOLUTION (Managerial Index Average = 652.1)
Firm Bid #TU Total JUNAEB JUNJI INTEGRA TU ChP mn ChP mn ChP mn ChP mn ----------------------------------------------------------------- 765 1090 3 702.03 507.90 89.70 104.43 902 903 904 765 1401 1 1551.43 1245.60 149.40 156.43 906 969 109 3 119.59 78.56 10.50 30.53 1001 1002 1004 673 734 2 282.46 245.46 21.60 15.40 801 802 753 3465 3 2425.10 1636.70 583.75 204.65 905 1004 1005 753 3508 2 704.87 563.94 78.43 62.50 803 804 ----------------------------------------------------------------- Total 5785.48 4278.16 933.38 573.94
Fig. 3. Sample model solution report.
R. Epstein et al. / Intl. Trans. in Op. Res. 11 (2004) 593–612 607

Figure 3 provides an example of how the optimal solution for a given scenario is reported. Thereport includes the parameters that defined the scenario, followed by a cost report and therespective deficits or surpluses in the budgets of the three institutions. Finally, details of theaccepted offers appear, indicating the cost of each institution and the TUs involved. Other usefulinformation that appears is the number of companies per region and the arithmetic average of thecompanies’ performance index for this solution.Table 2 is very useful because it makes it possible to examine the behavior of the optimal
solution for a scenario if we apply it in other related scenarios. Each line indicates the parametersthat define the scenario, which we will refer to as the baseline scenario. A related scenario has thesame parameters as the baseline scenario, but for one. It then indicates how this optimal solutionwould shift if applied to a related scenario. For example, the baseline one includes the plus serviceR1. If we change to a related scenario that considers the plus service R2, the optimal solution ofthe baseline scenario would be 0.4% worse than the value of the optimal solution of the relatedscenario. This way we can evaluate how robust a solution is in different scenarios.
6 Conclusions
This adjudication method has been used from 1997 to 2002, with the exception of 1998, whenthere was no auction. The empirical results point to a significant improvement in this processwhere the OR tool is central to ensuring competence, transparency and fairness.This new auction method overcame initial mistrust and today is accepted and valued by the
JUNAEB and bidding firms, who see a transparent process that allows them to compete fairly.Since the implantation of this methodology, pressures on the adjudication committee have been
Table 2
Robustness of solutions
N
Food
structure
Demand
level
Objective
function Rating
Minimum
price
Total
min.
firms
Min. firm
per
region
T2
(%)
T3
(%)
A1
standard
(%)
A1
plus_4
(%)
A1
plus_2
(%)
A1
plus_3
(%)
1 A1prepr1 T1 F1 D0 C1 E0 R1 0.0 0.0 1.4 1.0 0.4 2.0
2 A1prepr1 T1 F1 D0 C1 E1 R1 0.0 0.0 1.4 1.0 0.4 2.0
3 A1prepr1 T1 F1 D1 C1 E0 R1 0.0 0.0 1.4 1.0 0.4 2.0
4 A1prepr1 T1 F1 D1 C1 E1 R1 0.0 0.0 1.4 1.0 0.4 2.0
5 A1prepr2 T1 F1 D0 C1 E0 R1 3.8 6.1 7.5 8.5 7.0 7.9
6 A1prepr2 T1 F1 D0 C1 E1 R1 3.8 6.1 7.5 8.5 7.0 7.9
7 A1prepr2 T1 F1 D1 C1 E0 R1 0.6 1.2 2.0 2.1 1.1 2.6
8 A1prepr2 T1 F1 D1 C1 E1 R1 0.6 1.2 2.0 2.1 1.1 2.6
9 A2standa T1 F1 D0 C1 E0 R1 0.0 0.0 1.4 1.0 0.4 2.0
10 A2standa T1 F1 D0 C1 E1 R1 0.0 0.0 1.4 1.0 0.4 2.0
11 A2standa T1 F1 D1 C1 E0 R1 0.0 0.0 1.4 1.0 0.4 2.0
12 A2standa T1 F1 D1 C1 E1 R1 0.0 0.0 1.4 1.0 0.4 2.0
13 A2prepr1 T1 F1 D0 C1 E0 R1 0.0 0.0 1.4 1.0 0.4 2.0
For the optimal solution: indicates optimal deviation if applied to another scenario.
R. Epstein et al. / Intl. Trans. in Op. Res. 11 (2004) 593–612608
eliminated. The evaluation is so objective that the main disputes between companies and theJUNAEB focus on objective aspects such as the company’s performance index. Even somecatering firms, which initially opposed the system, have come to understand its benefits and nowsupport the model.As an early result, the JUNAEB reports annual savings of some US$40 million, which have
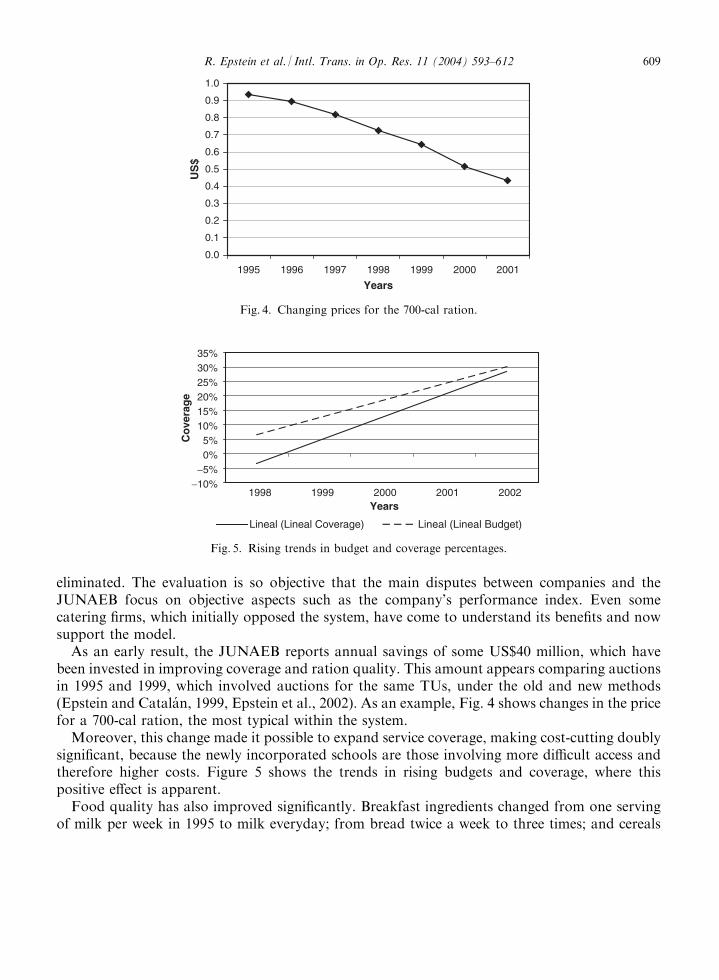
been invested in improving coverage and ration quality. This amount appears comparing auctionsin 1995 and 1999, which involved auctions for the same TUs, under the old and new methods(Epstein and Catalan, 1999, Epstein et al., 2002). As an example, Fig. 4 shows changes in the pricefor a 700-cal ration, the most typical within the system.Moreover, this change made it possible to expand service coverage, making cost-cutting doubly
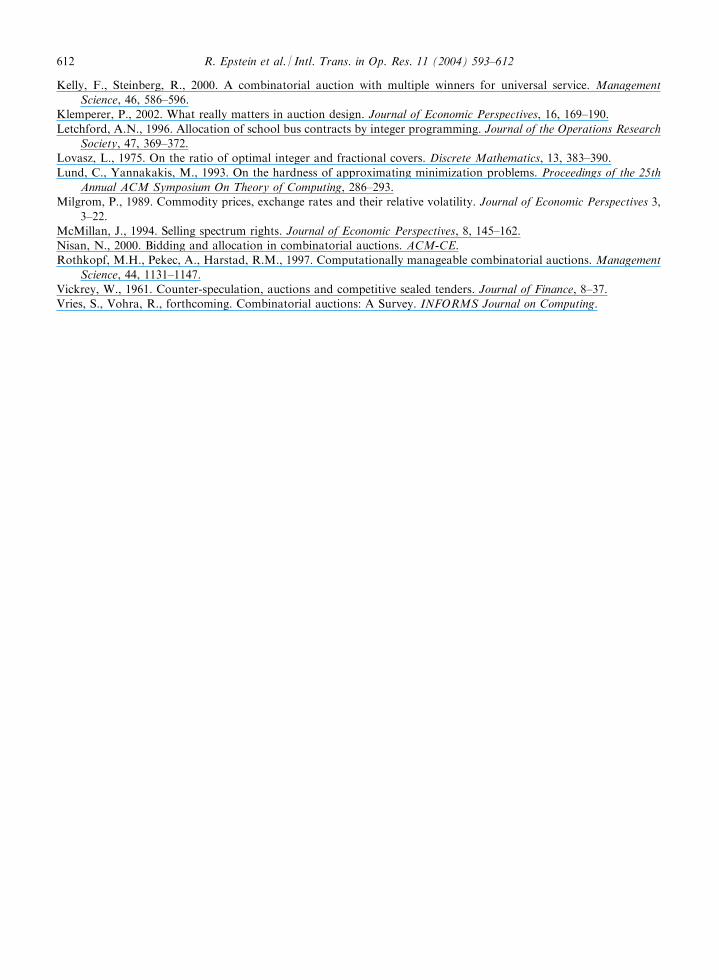
significant, because the newly incorporated schools are those involving more difficult access andtherefore higher costs. Figure 5 shows the trends in rising budgets and coverage, where thispositive effect is apparent.Food quality has also improved significantly. Breakfast ingredients changed from one serving
of milk per week in 1995 to milk everyday; from bread twice a week to three times; and cereals
0.0
0.1
0.2
0.3
0.4
0.5
0.6
0.7
0.8
0.9
1.0
1995 1996 1997 1998 1999 2000 2001
Years
US$
Fig. 4. Changing prices for the 700-cal ration.
−10%−5%0%5%
10%15%20%25%30%35%
1998 1999 2000 2001 2002Years
Cove
rage
Lineal (Lineal Coverage) Lineal (Lineal Budget)
Fig. 5. Rising trends in budget and coverage percentages.
R. Epstein et al. / Intl. Trans. in Op. Res. 11 (2004) 593–612 609

were introduced. Lunch, the main meal also improved significantly, as is widely recognized byMinistry of Health and University authorities. Fresh salads rose from four to 14 every 20 days,meat from four servings to seven, fish remained of the same frequency but changed from cannedto freshly caught. Fresh fruit frequency raised from six times a month to eight times a month. Allthese improvements involved real extra costs, but these were more than offset by savings fromhigher efficiency.A key question deals with children’s perception of the service, as they are the real customers. On
a range of acceptability from one to seven, where one is the worst and seven the best rating,surveys indicate that ratings were between 5.1 and 6.2 in 1997, between 5.5 and 6.7 in 2000, andbetween 6.0 and 6.7 in 2001, a clear sign that companies have made an effort to improve theirperformance indices, a key variable within their management and adjudication of futurecontracts.It is also important to analyze the changes in companies over these years. To improve
productivity, they have invested in infrastructure, including the cold chain, air conditioning,stainless steel utensils, new kitchen utensils, water heaters and others. Employees have seen theirwages rise 45% during this period. Even more surprising, perhaps, is that the return on capitalrose from 28% in 1995 to 38% in 1999. The return on sales rose from 3.2% to 4.9% in the sameperiod. We associate these positive effects with improved productivity.The JUNAEB has received widespread recognition among public institutions for its optimal
distribution of public resources among the poor. Indeed, 91% of these benefits go straight tostudents living below the poverty line.
7 OR in development
The objective of OR in development is to illustrate how the OR community actively participates insolving relevant problems in developing countries, particularly making management of public andprivate institutions more efficient. A scientific and efficient management of our institutions is ourway to improve the quality of life of the people.In developing countries such as ours, the low-income families are not able to educate and feed
their children adequately. The role of the state is to support these children through efficient andfocalized social policies. The school meal program is of crucial importance, probably the mostimportant benefit for low-income family children. Many parents send their children to schoolmotivated by the quality and quantity of the food they receive at school. Hence, the meal programnot only improves the nutrition of these children, but also reduces school absenteeism. However,resources in developing countries are very limited, so it is vital for the state to assign themoptimally. Money saved in this way means more and better nutrition for poor children and alsobetter education.Overall, we can say that this system offers a very good example of how an OR application can
improve social policies. In this case, the system improved both competition and efficiency, andwith them significantly boosted quality without adding costs.We thank IFORS and OR in development for giving the researchers the opportunity to learn
from valuable experiences from other countries, adding a lot of value to our work. The visibilitythat this application has had in our country because of OR in development has helped the whole
R. Epstein et al. / Intl. Trans. in Op. Res. 11 (2004) 593–612610

OR community in Chile to be better understood by public officials of the possibilities that ourscientific approach can make.The JUNAEB and the system today enjoy widespread national confidence and support. In a
letter, then Minister of Education, Mariana Aylwin, wrote: ‘The results from implementing thissystem were dramatic. The new procedure completely changed the character of the auctionprocess.’ The Food and Agriculture Organization is using Chile’s JUNAEB as a model for schoolprograms in other developing countries.Transparency and competence are two master keys to achieving better productivity and more
economic growth. As the JUNAEB experience reveals, the beneficiaries of greater productivity arenot simply a couple of abstract macroeconomic indicators, but people of flesh and blood. Howmany free lunches still remain hidden within other public service or private company operations?
Acknowledgements
The first author thanks grants Fondecyt 104 0813 and Milenio PO1-34.
References
Andersson, A., Tenhunen, M., Ygge, F., 2000. Integer Programming for Combinatorial Auction Winner Deter-
mination. ICMAS.
Avis, D., 1980. A note on some computational difficult set-covering problems. Mathematical Programming, 18,
138–145.
Baird, F.T., 1984. A feasible study of procedures to solve the tender acceptance and payout problem in the allocation/
reduction of fish catches. Report for the New Zealand Fishing Industry Board.
Balakrishnan, A., Magnanti, T.L., Wong, R.T., 1989. A dual-ascent procedure for large-scale uncapacitated network
design. Operations Research, 31, 716–740.
Bixby, R., 2002. Personal communication, October.
Brewer, P.J., Plott, C.R., 1996. A Binary Conflict Ascending Price (BICAP) mechanism for the decentralized allocation
of the right to use railroad tracks. International Journal of Industrial Organization, 14, 857–886.
Chvatal, V., 1979. A greedy heuristic for the set-covering problem. Mathematics of Operations Research, 4, 233–235.
Crowder, H.P., Johnson, E.L., Paldberg, M.W., 1983. Solving large scale 0-1 linear programming problems. Operations
Research, 31, 803–834.
Epstein, R., Catalan, J., 1999. Using mathematical models in negotiation and auction processes. INFORMS Fall
Meeting Philadelphia.
Epstein, R., Henrıquez, L., Catalan, J., Weintraub, G.Y., Martınez, C., 2002. A combinational auction improves school
meals in Chile. Interfaces, 32, 1–14.
Fulkerson, D., Nemhauser, G.L., Trotter, L.E., 1974. Two computationally difficult set-covering problems that arise in
computing the 1-width of incidence matrices of steiner triple systems. Mathematical Programming Study, 2, 72–81.
Fujishima, Y., Leyton-Brown, K., Shoham, Y., 1999. Taming the computational complexity of combinatorial auctions:
optimal and approximate approaches. Proceedings of the Sixteenth International Joint Conference on Artificial
Intelligence IJCAI, 548–533.
Jackson, C., 1976. Technology for Spectrum Markets. Unpublished Ph.D. Thesis, Department of Electrical
Engineering, MIT.
Johnson, D.S., 1974. Approximation algorithms for combinatorial problems. Journal of Computer and System Science,
9, 256–278.
R. Epstein et al. / Intl. Trans. in Op. Res. 11 (2004) 593–612 611
Kelly, F., Steinberg, R., 2000. A combinatorial auction with multiple winners for universal service. Management
Science, 46, 586–596.
Klemperer, P., 2002. What really matters in auction design. Journal of Economic Perspectives, 16, 169–190.
Letchford, A.N., 1996. Allocation of school bus contracts by integer programming. Journal of the Operations Research
Society, 47, 369–372.
Lovasz, L., 1975. On the ratio of optimal integer and fractional covers. Discrete Mathematics, 13, 383–390.
Lund, C., Yannakakis, M., 1993. On the hardness of approximating minimization problems. Proceedings of the 25th
Annual ACM Symposium On Theory of Computing, 286–293.
Milgrom, P., 1989. Commodity prices, exchange rates and their relative volatility. Journal of Economic Perspectives 3,
3–22.
McMillan, J., 1994. Selling spectrum rights. Journal of Economic Perspectives, 8, 145–162.
Nisan, N., 2000. Bidding and allocation in combinatorial auctions. ACM-CE.
Rothkopf, M.H., Pekec, A., Harstad, R.M., 1997. Computationally manageable combinatorial auctions. Management
Science, 44, 1131–1147.
Vickrey, W., 1961. Counter-speculation, auctions and competitive sealed tenders. Journal of Finance, 8–37.
Vries, S., Vohra, R., forthcoming. Combinatorial auctions: A Survey. INFORMS Journal on Computing.
R. Epstein et al. / Intl. Trans. in Op. Res. 11 (2004) 593–612612