A Clustering Approach for the Separation of Touching Edges in Particle Images
12
A Clustering Approach for the Separation of Touching Edges in Particle Images Jose M. Korath*, Ali Abbas*, Jose A. Romagnoli** (Received: 21 May 2007; in revised form: 27 February 2008; accepted: 28 February 2008) DOI: 10.1002/ppsc.200701107 1 Introduction Characterization of particulate systems is achieved in- variably in terms of particle size and shape distribution. Online measurement of particle size and shape para- meters can be of the utmost importance in the monitor- ing and control of many particulate processes in the pharmaceutical and fine chemicals industries, amongst others. However, many techniques of direct measure- ment are not suitable for in situ/online characterization purposes. Direct real-time visual characterization is a promising alternative to complex and expensive particle measurement systems. This method of characterization, which is typically executed via imaging and image analy- sis methods, will continue to benefit from research and development in the field particularly in overcoming the problem of touching particles. There are always particles touching (and overlapping) in images taken for any particulate system where no parti- cle dispersion is applied prior to image capture. Even where particle dispersion is used to avoid the touching of particles, one still expects to observe images exhibit- ing this behavior due simply to the fact that dispersed particles will still flow together or ecliptically, and there- fore, in a dispersed sample, the probability of touching or overlapping events is reduced but not eliminated. Furthermore, there are processes that are not amenable 142 Part. Part. Syst. Charact. 25 (2008) 142–153 * J. M. Korath (on study leave from Tata Steel, India), A. Ab- bas (corresponding author), Senior Lecturer, School of Chemical and Biomolecular Engineering, Building J01, Uni- versity of Sidney, NSW 2006 (Australia). E-mail: [email protected] ** Prof. J. A. Romagnoli, Department of Chemical Engineering, Louisiana State University, Baton Rouge, LA 70803 (USA). Abstract The occurrence of touching objects in images of particu- late systems is very common especially in the absence of dispersion methods during image acquisition. The separation of these touching particles is essential before accurate estimation of particle size and shape can be achieved from these images. In the current work, clus- tering approaches based on the fuzzy C-means algo- rithm are employed to identify the touching particle regions. Firstly, clustering in the multidimensional space of image features, e.g., standard deviation, gradient and range calculated in a certain neighborhood of each pixel, is performed to trap the touching regions. Then, in a novel proposed method, the clustering of pixel intensity itself into two fuzzy clusters is performed and a feature, referred to as the ‘Fuzzy Range’, is calculated for each pixel from its membership values in both clusters and is presented as a distinguishing feature of the touching regions. Both approaches are compared and the super- iority of the latter method in terms of the non-necessity of neighborhood based calculations and minimum dis- figuration is elucidated. The separation methods pre- sented herein do not make any assumption about the shape of the particle as is undertaken in many methods reported elsewhere. The technique is proven to mini- mize greatly the deleterious effects of over-segmenta- tion, as is the case with traditional watershed segmenta- tion techniques, and consequently, it results in a superior performance. Keywords: clustering, image analysis, particle, particle size, touching edges, segmentation http://www.ppsc-journal.com © 2008 WILEY-VCH Verlag GmbH & Co. KGaA,Weinheim
Transcript of A Clustering Approach for the Separation of Touching Edges in Particle Images

AClustering Approach for the Separation of Touching Edgesin Particle Images
Jose M. Korath*, Ali Abbas*, Jose A. Romagnoli**(Received: 21 May 2007; in revised form: 27 February 2008; accepted: 28 February 2008)
DOI: 10.1002/ppsc.200701107
1 Introduction
Characterization of particulate systems is achieved in-variably in terms of particle size and shape distribution.Online measurement of particle size and shape para-meters can be of the utmost importance in the monitor-ing and control of many particulate processes in thepharmaceutical and fine chemicals industries, amongst
others. However, many techniques of direct measure-ment are not suitable for in situ/online characterizationpurposes. Direct real-time visual characterization is apromising alternative to complex and expensive particlemeasurement systems. This method of characterization,which is typically executed via imaging and image analy-sis methods, will continue to benefit from research anddevelopment in the field particularly in overcoming theproblem of touching particles.There are always particles touching (and overlapping) inimages taken for any particulate system where no parti-cle dispersion is applied prior to image capture. Evenwhere particle dispersion is used to avoid the touchingof particles, one still expects to observe images exhibit-ing this behavior due simply to the fact that dispersedparticles will still flow together or ecliptically, and there-fore, in a dispersed sample, the probability of touchingor overlapping events is reduced but not eliminated.Furthermore, there are processes that are not amenable
142 Part. Part. Syst. Charact. 25 (2008) 142–153
* J. M. Korath (on study leave from Tata Steel, India), A. Ab-bas (corresponding author), Senior Lecturer, School ofChemical and Biomolecular Engineering, Building J01, Uni-versity of Sidney, NSW 2006 (Australia).E-mail: [email protected]
** Prof. J. A. Romagnoli, Department of Chemical Engineering,Louisiana State University, Baton Rouge, LA 70803 (USA).
Abstract
The occurrence of touching objects in images of particu-late systems is very common especially in the absence ofdispersion methods during image acquisition. Theseparation of these touching particles is essential beforeaccurate estimation of particle size and shape can beachieved from these images. In the current work, clus-tering approaches based on the fuzzy C-means algo-rithm are employed to identify the touching particleregions. Firstly, clustering in the multidimensional spaceof image features, e.g., standard deviation, gradient andrange calculated in a certain neighborhood of each pixel,is performed to trap the touching regions. Then, in anovel proposed method, the clustering of pixel intensityitself into two fuzzy clusters is performed and a feature,
referred to as the ‘Fuzzy Range’, is calculated for eachpixel from its membership values in both clusters and ispresented as a distinguishing feature of the touchingregions. Both approaches are compared and the super-iority of the latter method in terms of the non-necessityof neighborhood based calculations and minimum dis-figuration is elucidated. The separation methods pre-sented herein do not make any assumption about theshape of the particle as is undertaken in many methodsreported elsewhere. The technique is proven to mini-mize greatly the deleterious effects of over-segmenta-tion, as is the case with traditional watershed segmenta-tion techniques, and consequently, it results in a superiorperformance.
Keywords: clustering, image analysis, particle, particle size, touching edges, segmentation
http://www.ppsc-journal.com © 2008 WILEY-VCH Verlag GmbH & Co. KGaA, Weinheim

Part. Part. Syst. Charact. 25 (2008) 142–153 143
to dispersion, e.g., those of a fragile nature such as flocsand certain crystals. Moreover, it is noted that dispersionin many cases implies the use of dry particle samples.This represents a disadvantage to the particle characteri-zation in processes including crystallization where themonitoring in real-time of crystal particle characteristicsincluding size and shape is essential. Thus, althoughthere is a significant role for imaging and image analysisto play in monitoring particulate systems, there is stillsome way to go towards having robust real-time image-based particle characterization methods. A key compo-nent of a robust characterization technique involveshaving image analysis algorithms that can tackle issuesrelated to touching particles. Such a development is theconcern of the present paper.The region in the image where the particles touch willhave lower intensity than the particle body. Althoughthis region appears similar to the background withrespect to intensity value, on closer examination, it canbe seen that the intensity is not low enough to be takenas background. This means that when one transformsthe image into binary format, i.e., black-white format,these regions are viewed as object regions rather thanbackground. Consequently, and as far as a thresholdingalgorithm is concerned, the two touching particles willappear and be treated as a single object in the image. Inthe case where a single particle touches many others, orone particle touches another, which in turn is touchinganother, etc., the result is one single large object in thebinary image rather than many individual particles. Thisis detrimental to the particle size determination sincethe conglomerate objects will be treated as one singleparticle eventually generating erroneous size distribu-tions.As a consequence, separation of touching particles mustfirst take place to extract accurate size and shape fea-tures of particles from directly acquired images. Therehave been attempts, reported in the literature, to sepa-rate touching particles [1–8] but these methods employassumptions about the shape of the imaged particles,meaning that particle shape properties are needed apriori. Song et al. [1] have tried to measure the size ofparticles from images of coal ash where a significantnumber of overlapping and touching particles were pre-sent. The edge pixels in the image were detected and thecontours were linked by chain coding. These contourswere segmented based on curvature and then segmentsof similar curvature values were clustered so that theywere part of the same circle representing a spherical par-ticle. In a later publication on the same problem, Shenet al. [2] located segments in the contour by findingbreak points instead of curvature calculation. This newmethod identifies a point in the contour as the breakpoint if it is an extreme point in the local neighborhood
(in terms of x and y coordinates) and remains so duringrotations. Portions of a contour between such break-points are then taken as segments and grouped based onsome criteria to determine which of them belong to asingle circle. Pla [3] proposed a somewhat similar algo-rithm for recognizing partially occluded circles. In thatalgorithm, segments are identified based on the deriva-tive of curvature instead of curvature itself and then theclustering of segments occurs using an appropriate cri-terion. All of these methods make the important as-sumption that the particles are spherical in shape, andhence, appear as circles in a given image. Such an as-sumption does not hold for many particulate systemswhere particles deviate significantly from symmetricalfeatures of sphericity, or where there is a need to learnabout the specific particle shape features, e.g., when ana-lyzing crystal growth phenomena.Watershed segmentation is a traditional image analysismethod used for separating touching and overlappingobjects. It was first proposed by Lantuejoul and Beucher[4] and more efficient and accurate variations of it havebeen reported in the literature, the most prominentbeing the algorithm based on immersion simulation byVincent and Soille [5]. In order to reduce the problemof oversegmentation (a disadvantage of the watershedalgorithm for objects of irregular shape), the applicationof pre-flooding is employed to reduce the number of in-significant segments. In processing images of mineralparticles by the watershed algorithm, Sanford et al. [6]tried to reduce oversegmentation by incorporating arule to merge together adjacent segments with sizes lessthan a predefined number of pixels. Nazar et al. [7]applied watershed segmentation on the distance trans-form of thresholded images of zirconia particles forform factor determination by image analysis. However,the applicability of that method is limited to smoothshaped particles. Watano and Miyanami [8] measuredthe size distributions of granules in a fluidized bedgranulation process using online image acquisition andprocessing. An illumination setup was designed to mini-mize the appearance of touching and overlapping ob-jects in the images. The separation of overlapping ob-jects that were still present in the acquired image wasattempted by binarizing the image first and then inscrib-ing best fitting circles inside the conglomerate object. Inboth the above works [7, 8], separation is attempted byutilizing the shape information in the binary imagealone and the information in the gray-scale image wasneglected. Methods based on mathematical morphology,e.g., opening [9], are not suitable for automatic separa-tion of particle images considered here since one willhave to use structuring elements of different sizesdepending on the extent of touching between objects.The arbitrary selection of a very large structuring ele-
© 2008 WILEY-VCH Verlag GmbH & Co. KGaA, Weinheim http://www.ppsc-journal.com

144 Part. Part. Syst. Charact. 25 (2008) 142–153
ment will lead to severe disfigurations of objects andsmaller objects can disappear. These factors make mor-phological opening unsuitable for automatic separationprocesses.In the present work, a novel method based on the clus-tering of image features is presented and shown to bevery effective in separating the touching objects. Clus-tering is an unsupervised learning technique for group-ing data based on some similarity criteria. In image pro-cessing applications, clustering techniques can be usedto group similar features in an image.Since segmentation concerns the grouping of image pix-els that have similar characteristics and identifyingboundaries between such groups, clustering forms thebasis of many techniques for image segmentation. Themost commonly used clustering method is based on theC-means algorithm and its variations. The C-means clus-tering algorithm divides the data into C disjoint sets andits fuzzy variant Fuzzy C-means (FCM) algorithmdivides data into C fuzzy sets. Applications of originalC-means and FCM algorithms in the processing of docu-ment images [10], biomedical images [11–13] and radarimages [14] have been reported.The current work employs Fuzzy C-means clustering toidentify the touching regions in particle images. This isused in conjunction with the binary image to producemore effective results. The present proposition involvesthe selection of a number of features that differentiatetouching regions and subjecting these feature data tofuzzy clustering. The method is detailed in the next sec-tion followed by validation of results in section 3.
2 Methods and Analyses
The reliability of the results obtained by processing andanalyzing the acquired images depends strongly on themethods adopted at the various stages of image proces-sing. The steps involved in the processing of an imagecan be broadly categorized into three sections, i.e., pre-processing, segmentation and feature extraction.Although many methodologies are reported in the lit-erature for each of these stages in image processing,active research is still proceeding in each of these areascovering specific domains and addressing precise needs.The selection of appropriate methods suitable for a par-ticular genre of images is very important for obtainingthe best results. In the next section, details of the stepsand methodologies adopted for preprocessing, segmen-tation, and separation of touching objects for particleimages, are discussed. The improvement resulting fromaccurately segmenting the images by applying the pro-posed separation algorithm is illustrated and a compari-son with results from traditional watershed segmenta-
tion and its variants is undertaken. A flowchart showingthe sequence of steps in the current approach is given inFigure 1.
2.1 Preprocessing
The image acquisition process and associated steps in-troduce noise and disturbances of various types asso-ciated with optical, electrical, thermal and flow phenom-ena leading to the degradation of the quality of theacquired image. Various kinds of filtering in spatial andfrequency domains have to be performed in order toenhance the image quality before one can undertakeproper analysis. Noise removal filters can be broadly ca-tegorized into linear and nonlinear filters [9, 15, 16].While linear filters reduce the effect of noise by smooth-ing, and therefore, cause blurring of the image to someextent, nonlinear filtering processes pixels based ontheir relative value in the local neighborhood. Orderstatistics filters are a good example of nonlinear filters
http://www.ppsc-journal.com © 2008 WILEY-VCH Verlag GmbH & Co. KGaA, Weinheim
Fig. 1: Sequence of steps in different methods for the separation oftouching objects in particle images.
Part. Part. Syst. Charact. 25 (2008) 142–153 145
in a spatial domain where the response of the filter isbased on the ordering (ranking) of pixels in a smallneighborhood around each pixel and replacing the pixelvalue based on the ranking results. In the present case,median filtering which is one of the most popular rank-ing filter methods is executed with a kernel size of[3 × 3] on the image to remove random noise.If one represents g(u,v) as the noisy image and f(x,y) asthe filtered image, where (u,v) and (x,y) are image pixelcoordinates, the median filtering process can be repre-sented by Eq. (1):
f �x� y� � medianu�v� �∈S x�y� �
g u� v� �� � (1)
where S(x,y) is the neighborhood around (x,y).
2.2. Thresholding
Once the image is preprocessed and the image is cor-rected for defects as discussed in section 2.1, identifica-tion of objects has to be performed and this process isgenerally known as segmentation. Segmentation may bedefined after as follows [17]: if F is the set of all pixelsand one defines some uniformity criterion based ongroups of connected pixels, then the segmentation is apartitioning of the set F into a set of n subsets such that:
�n
i�1
Si � F with Si
�Sj � U� i≠j (2)
where Si represents an individual region (segment). Alarge number of segmentation techniques have beenproposed in the literature but there is no single methodthat is equally well suited to all kinds of images. In theimages of particulate systems, the objects (particles) andbackground differ distinctly in terms of their brightnessvalues. Therefore, it is natural to separate the objectsfrom the background using a segmentation criterionbased on pixel intensity value. When segmentation isperformed in this way, it is normally known as thresh-olding since one uses a threshold value to decidewhether a pixel belongs to the object area or the back-ground area. There are several methods reported in theliterature for thresholding and Otsu’s method [18] ofglobal thresholding which has its foundations in discri-minant analysis, is used in the current work. Thismethod is relatively fast and utilizes the histogram ofthe image. Once the threshold value is estimated usingthe above method, the segmentation of the image intoobject and background areas become quite straightfor-ward. The pixels with values equal to and above thethreshold are assigned a value 1 (object) and those withvalues below the threshold are assigned a value zero
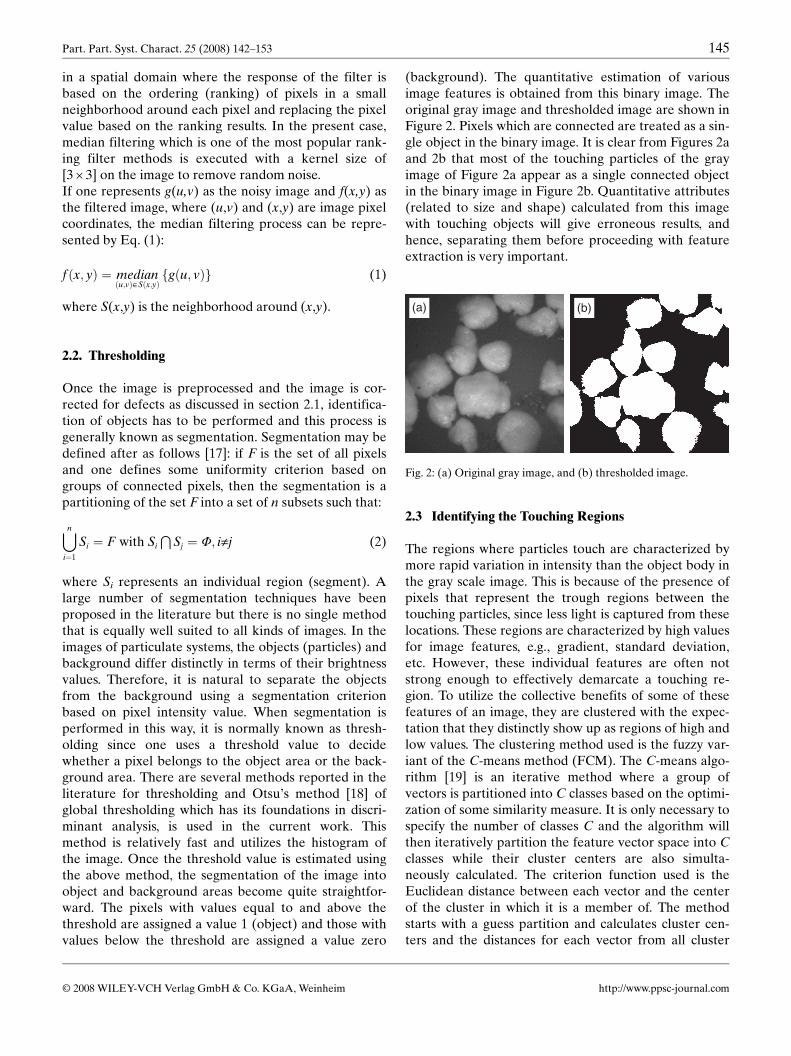
(background). The quantitative estimation of variousimage features is obtained from this binary image. Theoriginal gray image and thresholded image are shown inFigure 2. Pixels which are connected are treated as a sin-gle object in the binary image. It is clear from Figures 2aand 2b that most of the touching particles of the grayimage of Figure 2a appear as a single connected objectin the binary image in Figure 2b. Quantitative attributes(related to size and shape) calculated from this imagewith touching objects will give erroneous results, andhence, separating them before proceeding with featureextraction is very important.
2.3 Identifying the Touching Regions
The regions where particles touch are characterized bymore rapid variation in intensity than the object body inthe gray scale image. This is because of the presence ofpixels that represent the trough regions between thetouching particles, since less light is captured from theselocations. These regions are characterized by high valuesfor image features, e.g., gradient, standard deviation,etc. However, these individual features are often notstrong enough to effectively demarcate a touching re-gion. To utilize the collective benefits of some of thesefeatures of an image, they are clustered with the expec-tation that they distinctly show up as regions of high andlow values. The clustering method used is the fuzzy var-iant of the C-means method (FCM). The C-means algo-rithm [19] is an iterative method where a group ofvectors is partitioned into C classes based on the optimi-zation of some similarity measure. It is only necessary tospecify the number of classes C and the algorithm willthen iteratively partition the feature vector space into Cclasses while their cluster centers are also simulta-neously calculated. The criterion function used is theEuclidean distance between each vector and the centerof the cluster in which it is a member of. The methodstarts with a guess partition and calculates cluster cen-ters and the distances for each vector from all cluster
© 2008 WILEY-VCH Verlag GmbH & Co. KGaA, Weinheim http://www.ppsc-journal.com
(a) (b)
Fig. 2: (a) Original gray image, and (b) thresholded image.
146 Part. Part. Syst. Charact. 25 (2008) 142–153
centers. Then, the distances from each cluster center arecompared for each vector to check whether the vector isincluded in the cluster with the center that is closest tothe vector under consideration. If not, the vector is reas-signed to the closest group and the cluster centers arerecalculated again. This iterative process is continueduntil the cluster centers do not change further.
2.3.1 Fuzzy C-means Clustering Algorithm
For a group of one-dimensional vectors {x1, x2,..., xn}, thecriterion function may be represented as:
J�V� � �n
k�1
�xk∈Ci
xk � vi� �2 (3)
where xk is the vector in class Ci whose center is vi andthis step is performed over all classes. It can be shownthat, at the optimum partition, the cluster center isnothing but the mean of the vectors in that cluster isgiven by Eq. (4):
vi � 1ni
�xk∈Ci
xk (4)
where ni is the number of vectors in class Ci that has xk
as its members. In this method, each vector is assignedto a single cluster. It is either a member of a cluster ornot, and hence, it divides data into C clusters with hard(or crisply defined) boundaries. In other words, themethod divides the data into disjoint partitions, but inmany practical situations, data could be considered asbelonging to one cluster as well as to another. The no-tion of fuzzy sets and related theory is used to handlesuch situations [20]. In the fuzzy variant of the C-meansalgorithm [21], the concept of membership function isintroduced, which allows varying extents of membershipfor a single vector in different clusters. When a vectorbelongs more to one cluster than another, it will have ahigher membership value for the former and a lowermembership value for the latter. Among a group of nvectors, the membership value, uik, of a vector k in thecluster i satisfies the following conditions:
0 ≤ uik ≤ 1 for all i and all k (5)
�uik = 1 for k = 1,2....n for all classes i (6)
0 <�
uik < n (7)
When uik = 1, the vector k has complete membership incluster i and no membership in all other clusters. This isthe case with the original C-means algorithm describedearlier, Eqs. (3 – 4). The objective function, cluster cen-
ter and membership function, respectively, are definedas follows, Eqs. (8 –10):
J�U�V� ��c
i�1
�n
k�1
umik xk � vi� �2 (8)
vi ��n
k�1um
ikxik
�n
k�1um
ik
i = 1,2...,c (9)
uik �1
xk�vi� �2� � 1
m�1
�c
j�1
1
xk�vj� �2
� � 1m�1
i = 1,2,...,c; k = 1,2,...,n (10)
where U = [uik] is a c × n matrix known as the partitionmatrix containing membership values for each vector ineach class and m is the weight factor that determines thedegree of fuzziness of the partition. The calculationmethod is iterative and is subjected to optimization ofthe criterion function as in the case of the originalC-means algorithm, Eqs. (3 – 4). However, here one ob-tains a c × n matrix of membership values for n datapoints and c clusters.
2.3.2 Fuzzy Clustering for Processing of Particle Images
The features of the gray image that are used for cluster-ing are gradient, standard deviation and range. The in-tensity range is the difference between the maximumand minimum values of intensity in a small neighbor-hood around each pixel. For each pixel, these featuresare calculated in a small neighborhood (kernel) of size[3x3] around it. As mentioned before, these features arenot only individually strong enough to completely cap-ture the touching regions but also have random highvalues in the background and object areas.The above mentioned features of the image were sub-jected to the fuzzy C-means clustering described earlierfor two clusters. The touching and boundary regions areexpected to have high values for these features, whereasobject and background areas are expected to have lowvalues. Correspondingly, the membership value for bothclusters should follow a similar trend. To visualize themembership values corresponding to each three-dimen-sional vector (with gradient, standard deviation andrange components), one can represent the membershipvalues as images with pixel intensity values representingmembership values, for example, the membership valuesfor the two fuzzy clusters obtained from fuzzy C-meansclustering are represented as images in Figure 3. It canbe seen that there is a very high membership value ofthe touching and boundary regions in one class and avery low value in the other class. This indicates a strong
http://www.ppsc-journal.com © 2008 WILEY-VCH Verlag GmbH & Co. KGaA, Weinheim

Part. Part. Syst. Charact. 25 (2008) 142–153 147
clustering of features in these regions in the image.Moreover, these high membership values are conti-nuously present in these regions. As one moves awayfrom these regions, the membership value decreases andsuch continuity in membership values is not present,although there are scattered spots of slightly lowervalues present. Hence, one is able to identify the touch-ing regions by this method of clustering.
A decision now needs to be made to decide on a lowerlimit of membership value, below which features are notconsidered significant, i.e., to belong to a touching orboundary region. Instead of fixing a single value arbitra-rily, an optimum value is estimated by following theconcepts used in image thresholding [18]. Consider forexample the image in Figure 3a, if one takes the histo-gram of these intensity value, Figure 4a, one observestwo distributions with peaks at both extremes that arealso overlapping slightly, similar to the histogram of anormal image. The current requirement is to select anintensity value (ultimately a membership value) suchthat values below it can be left out. If one then appliesOstu’s method and determines the threshold value forthis image, one obtains an optimum membership value.Such an approach provides a completely automatedselection process. One is then able to select points thathave strong membership in one cluster. On thresholding
the cluster image, i.e., the one with higher values for thetargeted features, with the obtained threshold, oneobtains the binary image, Figure 4b, which highlights theregions of touching. Some of the touching regions arestill not identified in this clustering result. The featurevariations can be captured more distinctly by performingcalculations over a wider neighborhood. The results ofclustering with features calculated over a bigger neigh-borhood ([5 × 5], [7 × 7]) are discussed in section 3.2.In the second approach, which is still based on clusteringbut not using the traditional features of gradient, stan-dard deviation, etc., a new feature that is referred tohere as the ‘Fuzzy Range’ of each pixel i and is denotedby Ri, is introduced. The intensity values were initiallypartitioned into two fuzzy clusters using the fuzzyC-means algorithm. Since it is one-dimensional data, themembership values can be shown as a graph, Figure 5a.At the same time, one can represent these membershipvalues as images. Figures 5b and 5c show the member-ship values of pixels in an object cluster and a back-ground cluster represented as images.The difference between membership values for bothclasses is now calculated for each pixel i:
Ri = M1i – M2i (11)
© 2008 WILEY-VCH Verlag GmbH & Co. KGaA, Weinheim http://www.ppsc-journal.com
(a) (b)
Fig. 3: Cluster with (a) high, and (b) low membership values fortouching regions.
0 0.1 0.2 0.3 0.4 0.5 0.6 0.7 0.8 0.9 1
0
0.5
1
1.5
2
x 104
(a) (b)
Fig. 4: (a) Histogram of image in Figure 3a, and (b) its binary(thresholded) version.
(c)(b)
(a)
Fig. 5: (a) Cluster membership values versus pixel intensity, and(b, c) membership values of object and background clusters shownas images.

148 Part. Part. Syst. Charact. 25 (2008) 142–153
where M1 and M2 are the membership values for pixel iin fuzzy clusters 1 and 2, respectively. It may be notedthat unlike the normal range that is taken in a certainneighborhood of a pixel, in this method, only the pixelof interest is involved, resulting in the method being in-dependent of the size of the neighborhood. The result,again represented as an image for better visualization, isshown in Figure 6a. As expected, the touching regionsand boundaries show values very close to zero, whereasboth object and background regions show values closeto 1. This occurs due to the fact that both classes havesomewhat equal strength in the touching and boundaryregions, since pixel intensity is located somewhere in themiddle of both class means.This range difference is then binarized following thesame method described earlier and a binary comple-ment is taken to highlight the touching and boundaryregions, Figure 6b. It may be noted that as far as identifi-cation of touching regions is concerned, the clusteringresult based on Fuzzy Range is much sharper and well-defined compared to that based on features includinggradient, standard deviation, etc. The use of these clus-tering results for the separation of touching objects andtheir comparisons are performed in the following sec-tions.
3 Experimental Validations
3.1 Experimental Setup
An experimental imaging setup, Figure 7, is used to cap-ture particle images for the purpose of testing the pro-posed methodology. The method uses polymer particles(PVC) that are circulated using a pump (Watson Mar-low, UK) through a flow cell. Images are acquired usinga digital video camera (Basler A620) coupled with anOptical Zoom system (Thales Optem zoom125C). Thecamera is connected to the computer where data acqui-sition and processing is executed. The image analysis
algorithm is implemented in MATLAB (Mathworks,USA) using Matlab’s Image Processing Toolbox func-tions.
3.2 Results and Discussion
3.2.1 Separation of Touching Objects Using theClustering Result
Once the touching regions have been identified in bi-nary versions of the clustering results, this information isused in conjunction with original thresholded image toachieve the separation of touching objects. Firstly, theresult from the clustering in the feature space of gradi-ent, standard deviation and range shown in Figure 4b isutilized to separate the touching regions. On subtractingFigure 4b from the original binary image in Figure 2band subsequently performing morphological operations,one arrives at the image shown in Figure 8a. The mor-phological operations are necessary in order to fill invery small holes generated as a result of aforementioned
http://www.ppsc-journal.com © 2008 WILEY-VCH Verlag GmbH & Co. KGaA, Weinheim
(a) (b)
Fig. 6: (a) Values of Fuzzy Range represented as image, and (b)binary version of its complement.
Fig. 7: Experimental setting: (A) vessel with particle suspension,(B) circulating pump, (C) optical flow cell, (D) camera, (E) lenssystem, (F) illumination, and (G) computer.
(a) (b)
Fig. 8: Separated image based on multidimensional clustering withkernel sizes (a) [3 × 3], and (b) [9 × 9].

Part. Part. Syst. Charact. 25 (2008) 142–153 149
subtraction. In addition, erosion and dilation using a flatstructuring element of size [3 × 3] were performed. Thisremoves very small spurs and insignificant objects whileleaving objects of interest unaltered. The result demon-strates successful separation of most of the edges butwith a side effect resulting in very serious disfigurationof the objects.The reason for such a poor quality result is the presenceof strong features scattered all over the image. Thesefeatures are more continuous at touching and boundaryregions but they are very much present, though to a min-ute extent, all over the image. The features, i.e., gradi-ent, range, standard deviation, were considered amongstthe nearest neighbors of each pixel in the image. How-ever, the relative magnitudes of these features in closeneighborhoods will be more similar since perceptiblechanges in these features occur over a larger distance.An obvious way out of this situation is to calculate thefeatures over a wider neighborhood. Clustering was per-formed on bigger neighborhoods, e.g., [5 × 5], [7 × 7],[9 × 9], etc. Separation using clustering of range andstandard deviation taken over a kernel size of [9 × 9] areshown in Figure 8b. It is clear that as the kernel size isincreased, one is able to trap the feature variations moredistinctly. However, the area loss and disfiguration ofthe image is still present. The result of the clustering inthe multidimensional feature space of gradient, standarddeviation and local range, is sensitive to the size of theneighborhood in which these features are calculated. Anoptimum kernel size has to be determined depending onthe imaging setup used and the characteristics of theparticular system under consideration.In order to utilize the result from the proposed new‘Fuzzy Range’ feature, the image in Figure 6b is sub-tracted from the original thresholded image and mor-phological operations are performed to remove holesand spurs, to achieve the result shown in Figure 9. Thisimage is not as disfigured as those obtained using theresult of multidimensional clustering described earlier.However, although most of the touching objects areseparated and the boundaries of the objects aresmoothly cut, Figure 9 still suffers from area losses sincethere is considerable overlap between the original bin-ary image and the Fuzzy Range image. In order to mini-mize this area loss, instead of superimposing the entireridge-like objects in the image, morphological thinningof the binary Fuzzy Range image in Figure 6b is per-formed. This operation sheds object pixels off theboundary between an object and the background. Afterseveral repetitions, only a one pixel thick skeleton of theimage remains. Basically, this operation shrinks theridges to the single pixel thick ring-like structure shownin Figure 10a. It will not be a perfect ring since varia-tions in thickness also lead to some spur-like protrusions
on the final thinned structure. This ring like structure isthen subtracted from the original thresholded image andmorphological operations are performed to removespurs and fill holes to obtain the separated image shownin Figure 10b. This gives a finer cut without area loss.Another advantage of the Fuzzy Range method overusing features such as standard deviation and range, isthat a neighborhood based calculation is not involvedand it causes less disfiguration of the objects.
3.2.2 Comparison with Other Methods
The impact of separating the touching joints is most visi-ble in the number of objects identified in each image.This in turn will have an impact on the calculated parti-cle sizes since touching objects in the thresholded imagewill be treated as single connected components and theactual number and size of particles obtained from it willbe erroneous. The use of watershed segmentation forseparating touching and overlapping objects in particleimages has been reported in the literature [6,7,16] and acomparison of the results from the present method ismade against results from the watershed algorithm.However, the watershed algorithm suffers from the dis-advantage of severe oversegmentation, more so whenobjects are of irregular shape and the intensity varia-tions are present within the single object as reported in
© 2008 WILEY-VCH Verlag GmbH & Co. KGaA, Weinheim http://www.ppsc-journal.com
Fig. 9: Separation based on Fuzzy Range.
(a) (b)
Fig. 10: (a) Skeleton of Fuzzy Range image in Figure 6b, and (b)separation using skeleton in (a).

150 Part. Part. Syst. Charact. 25 (2008) 142–153
the literature [9, 16] and shown in Figure 11a.The image is severely oversegmented, and con-sequently, the result is meaningless. Two var-iants of the watershed algorithm, i.e., onebased on distance transform and another usingpre-flooding are normally employed to over-come this deleterious effect. In the first variant,the distance transform of the complement ofthe binary image is taken and watershed algo-rithm is applied to it. The result is shown inFigure 11b. This method is too shape sensitiveand fails when particles are of irregular shape,which is the case for the particle domain of the currentstudy. In the other variant, oversegmentation is pre-vented by pre-flooding very small minima and enforcingminima only at predefined locations by the use of mar-kers. In order to employ this method, markers for objectand background areas have to be identified first. Theobject markers were chosen as those pixels that belongto the peak on the higher side of the threshold value inthe image histogram (see section 2.2). These are the ob-ject pixels with highest frequency, and hence, a goodchoice for marking objects. With such a choice, which isautomatically determined from the image histogram,one obtains markers on each object (brighter pixels ofthe object) but at the same time avoids the relativelylow intensity pixels that could belong to the touching re-gions. Markers for the background are directly obtainedfrom the thresholded image. Using such imposedminima, watershed segmentation was performed andthe result is shown in Figure 11c for the reference image.Although the level of oversegmentation is less than thatin other watershed methods, the result is still signifi-cantly inferior to the result from the Fuzzy Rangemethod proposed in the present work.The application of different methods of separation andtheir relative merits and disadvantages have thus farbeen illustrated using a reference image. Another imageseparated using the Fuzzy Range feature is shown inFigures 12a–12c. It can be seen that the touching objectsin Figure 12a appear as single objects in the thresholdedimage in Figure 12b. The result of the separation usingthe Fuzzy Range feature is shown in Figure 12c.
A comparison of the different methods based on thenumber of particles and the separated joints is furthersubstantiated by applying the algorithm to ten images,the results of which are tabulated in Tables 1 and 2 anddemonstrated in Figure 13. The success rate of the pro-posed method and thresholding (based on Otsu’smethod) in separating the touching joints is compared inTable 1 in terms of the number of touching joints stillremaining after the application of each method. Inwatershed methods, oversegmentation is so severe thatcounting separated joints is meaningless. The actual
http://www.ppsc-journal.com © 2008 WILEY-VCH Verlag GmbH & Co. KGaA, Weinheim
(a) (b) (c)
Fig. 11: Watershed algorithm: (a) on gray image, (b) on distance transform,and (c) with markers.
(a) (b) (c)
Fig. 12: Another sample particle image separated using the Fuzzy Rangefeature: (a) original gray image, (b) thresholded image, and (c) separatedimage.
Table 1: Comparison of the separation of touching joints achievedby Otsu’s thresholding and the proposed method based on fuzzyclustering.
SampleNo.
Number of Touching Joints Present
InputGrayImage
ThresholdedImage
After FuzzyRange
Method
1 12 9 32 16 12 23 4 3 04 5 4 15 3 2 06 13 13 17 9 8 28 5 5 09 6 5 1
10 4 3 1
Total 77 64 11% Separation 17 86

Part. Part. Syst. Charact. 25 (2008) 142–153 151
number of touching joints present (as well as the num-ber of particles) in each of the images was determinedby visual examination of the original gray images. Theadvantage of the proposed Fuzzy Range method is evi-dent from the results in Table 1. It separates 66 of the 77touching joints, i.e., 86 % separation, while the thre-sholded image retains 64 touching joints out of the 77,i.e., only 17 % separation.The reduction of estimated particle size (calculated asequivalent diameter, which is the diameter of the circlehaving the same area) as a result of the separation oftouching joints, is shown in Figure 13. This graph shows,for each sample image, the value of mean equivalentdiameter (in number of pixels) of objects calculatedfrom a thresholded image and after application of theseparation algorithm. As expected, the mean size isreduced when conglomerate objects are broken down.
Another way of comparing the performance of algo-rithms for segmentation is in terms of the number ofparticles in each image as detailed in Table 2. The num-ber of particles in the processed image shows the extentof over/under segmentation. The methods consideredare thresholding, watershed algorithm (3 variants) andthe proposed Fuzzy Range method. The number of par-ticles in segmented images was determined by labelingthe connecting components and obtaining a count oflabeled objects. A value of 100 % indicates completesegmentation, where as values below and above 100 %indicate under and oversegmentation, respectively. Ascan be seen from Table 2, the proposed method per-forms much better compared to the other methods. Itachieves 94 % segmentation compared to 58 % for thethresholded image, while the watershed methods givehigh levels of oversegmentation. Although the overseg-mentation problem is less severe in distance-transformbased and marker based variants of the watershed algo-rithm, these are still not comparable in terms of consis-tency and accuracy to the results of the Fuzzy Rangemethod based on fuzzy C-means clustering described inthis work.
4 Conclusions
An approach based on fuzzy C-means clustering of dif-ferent features of an image was applied to separatetouching objects in the images of particles. The effect ofneighborhood size used for calculating gradient, stan-dard deviation, etc., on distinct identification of thetouching regions was illustrated. A new derived featurereferred to here as Fuzzy Range was introduced, which
© 2008 WILEY-VCH Verlag GmbH & Co. KGaA, Weinheim http://www.ppsc-journal.com
Fig. 13: Comparison of mean value of equivalent diameter beforeand after applying the separation method.
Table 2: Comparison of segmentation achieved in terms of the number of objects in each image after appli-cation of the different methods.
SampleNo.
Number of Particles
GroundTruth
ThresholdedImage
Watershedon GrayImage
Watershedon
DistanceTransform
Watershedon Gray
Image withMarker
FuzzyRange
Method
1 14 8 5731 211 190 122 16 4 5131 750 278 153 10 6 1560 100 27 94 15 11 2227 135 58 145 11 9 302 43 10 116 33 23 928 173 29 337 13 7 1544 118 60 118 12 6 962 65 28 129 8 3 1080 109 102 710 7 4 1244 24 55 6
Total 139 81 20709 1728 837 130% Segmentation 58 14899 1243 602 94

152 Part. Part. Syst. Charact. 25 (2008) 142–153
gave superior performance compared to clustering inthe multidimensional feature space for gradient andstandard deviation. This feature depends only on eachindividual pixel and is hence independent of the kernelsize. The results of the proposed method using FuzzyRange were compared with results of the segmentationmethods by thresholding and the watershed algorithmfor separating touching objects in particle images. Thenumber and size of particles calculated after applyingthe proposed separation algorithm on the images gavemore realistic results than those obtained from the thre-sholded images.
5 Acknowledgments
The authors acknowledge the School of Chemical andBiomedical Engineering at Nanyang Technological Uni-versity (Singapore) for the use of imaging facilities andfor hosting Mr. Korath during his short visit as aresearch scholar.
6 Nomenclature
FCM Fuzzy C-means clusteringg�u� v� noisy image with coordinates represented
by �u� v�f �x� y� filtered image with coordinates represented
by �x� y�F set of total pixels in an imageS individual regions (segments) in an imageU empty setIg
gray scale imageIbw
binary imageL maximum number of gray levels in the imageJ�V� criterion function for optimal partition in the
C-means algorithmCi cluster ic total number of clustersvi center of the cluster in total number of vectors in the data setxk kth vector in the data setni total number of vectors in the cluster iJ�U�V� criterion function in the Fuzzy C-means
algorithmuik membership value of kth vector in the ith classm weight factor deciding the degree of fuzziness
of partitionU c × n matrix of membership valuesM1i membership value of the ith pixel in cluster 1M2i membership value of the ith pixel in cluster 2Ri Fuzzy Range value of the ith pixel, the
difference between M1i and M2i
7 References
[1] X. Song, F. Yamamoto, M. Iguchi, L. Shen, X. Ruan,K. Ishi, A method for measuring particle size in over-lapped particle images. ISIJ Intl. 1998, 38, 971–976.
[2] L. Shen, X. Song, M. Iguchi, F. Yamamoto, A method forrecognizing particle in overlapped particle images. Pat-tern Recogn. Lett. 2000, 21, 21–30.
[3] F. Pla, Recognition of partial circular contours from seg-mented contours. Comput. Vis. Image Understand. 1996,63, 334–343.
[4] C. Lantuejoul, S. Beucher, On the use of geodesic metricin image analysis. J. Microsc. 1981, 121, 39–49.
[5] L. Vincent, P. Soille, Watersheds in digital spaces: an effi-cient algorithm based on immersion simulation. IEEETrans. Pattern Anal. Mach. Intell. 1991, 13, 583–598.
[6] R. L. Sanford, J. Harris, D. Stanley, A conditional wa-tershed technique for mineral particle characterizationfrom images. Conference Record – IAS Annual Meeting(IEEE Industry Applications Society) 1994, 3, 2140–2147.
[7] A. M. Nazar, F. A. Silva, J. J. Amman, Image processingfor particle characterization. Mater. Char. 1996, 36, 165–173.
[8] S. Watano, K. Miyanami, Image processing for onlinemonitoring of granule size distribution and shape in flui-dized bed granulation. Powder Tech. 1995, 83, 55–60.
[9] R. C. Gonzalez, R. E. Woods, Digital Image Processing.Prentice Hall, Upper Saddle River, New Jersey, 2002.
[10] Z. Chi, H. Yan, Image segmentation using fuzzy rulesderived from K-means clusters. J. Electron Imag. 1995, 4,199–206.
[11] S. R. Kannan, Segmentation of MRI using new unsuper-vised Fuzzy C-Means algorithm. ICGST Intl. J. Graph.Vis. Image Process. 2005, 5, 17–23.
[12] L. O. Hall, A. M. Bensaid, L. P. Clarke, R. P. Velthuizen,M. S. Silbiger, J. C. Bezdeck, A comparison of neuralnetwork and fuzzy clustering techniques in segmentingMagnetic Resonance Images of the brain. IEEE Trans.Neural Network 1992, 3, 672–682.
[13] J. C. Bezdeck, L. O. Hall, L. P. Clarke, Review of MRImage segmentation techniques using pattern recogni-tion. Med. Phys. 1993, 20, 1033–1048.
[14] W. Chumsamrong, P. Thitimajshima, Y. Rangasanseri,Synthetic Aperture Radar (SAR) image segmentationusing a new modified Fuzzy C-Means algorithm. Proc.Intl. Geosci. Rem. Sens. Symp. (IGARSS, IEEE ) 2000, 2,624–626.
[15] M. Nachtagael, D. Van der Weken, D. Van De Ville,E. Kerre, W. Phillips, I. Lemahieu, An overview of classi-cal and fuzzy-classical filters for noise reduction. Intl.Fuzzy Syst. Conf. (IEEE) 2001, 1, 3–6.
[16] J. C. Russ, Image Processing Handbook. CRC Press,Florida, 2002.
[17] S. L. Horowitz, T. Pavlidis, Picture segmentation by atree traversal algorithm. J. ACM. 1976, 23, 368–388.
http://www.ppsc-journal.com © 2008 WILEY-VCH Verlag GmbH & Co. KGaA, Weinheim

Part. Part. Syst. Charact. 25 (2008) 142–153 153
[18] N. Otsu, A threshold selection method from gray levelhistogram, IEEE Trans. Syst. Man Cyber. 1979, 9, 62–66.
[19] C. W. Therrien, Decision Estimation and Classification:An Introduction to Pattern Recognition and RelatedTopics. John Wiley & Sons, New York, 1989.
[20] J. C. Bezdek, S. K. Pal, Fuzzy Models for Pattern Recog-nition. IEEE Press, New York, 1992.
[21] J. C. Bezdeck, R. Ehrlich, W. Full, FCM: The fuzzy CMeans clustering algorithm. Comput. Geosci. 1984, 10,191–203.
© 2008 WILEY-VCH Verlag GmbH & Co. KGaA, Weinheim http://www.ppsc-journal.com