A CLOSER LOOK AT THE KEN-BETWA PILOT LINK
178
1 ASSESSMENT OF THE INDIA RIVER LINKING PLAN: A CLOSER LOOK AT THE KEN-BETWA PILOT LINK By Kelli Krueger Frances Segovia Monique Toubia A practicum submitted In partial fulfillment of the requirements For the degree of Master of Science Natural Resources and Environment At the University of Michigan April 2007 Faculty advisor’s: Professor Mike Wiley and Bunyan Bryant Reader: Professor Raymond DeYoung
-
Upload
khangminh22 -
Category
Documents
-
view
1 -
download
0
Transcript of A CLOSER LOOK AT THE KEN-BETWA PILOT LINK

1
ASSESSMENT OF THE INDIA RIVER LINKING PLAN:
A CLOSER LOOK AT THE KEN-BETWA PILOT LINK
By
Kelli Krueger
Frances Segovia
Monique Toubia
A practicum submitted
In partial fulfillment of the requirements
For the degree of
Master of Science
Natural Resources and Environment
At the University of Michigan
April 2007
Faculty advisor’s: Professor Mike Wiley and Bunyan Bryant
Reader: Professor Raymond DeYoung

2
Table of Contents
Abstract…………………………………………….pg. 3
Preface……………………………………………..pg. 4
Acknowledgements………………………………..pg. 7
Chapter 1: Introduction……………………………pg. 8
Chapter 2: Hydrologic Impacts……………………pg. 40
Chapter 3: Wildlife Impacts………………………pg. 79
Chapter 4: Social Impacts…………………………pg. 113
Chapter 5: Conclusion…………………………….pg. 167
APPENDIX I: Is River Linking the Best Way to Address Problems with Public Irrigation Structures? …………………………….pg. 174 APPENDIX II: Methods of water utilization in the KBLP region. ……………………………………………............pg. 176 APPENDIX III: Detailed Statements From Various Feasibility Reports Regarding Potential Negative Impacts to Wildlife ……….....pg. 177

3
Abstract
Properly planned water resource development and management has the ability to alleviate poverty, improve the quality of life, and reduce regional disparities and to maintain the integrity of the natural environment. In an effort to address the threat of water scarcity, the Indian government has proposed an ambitious and costly water resource development project to interlink a majority of the country’s major rivers known as the Inter-River Linking Project (IRL).
The Ken-Betwa Link Project (KBLP) is the pilot component of the national plan. This project involves connecting the Ken and Betwa rivers through the creation of a dam, reservoir, and canal to provide storage for excess rainfall during the monsoon season as a means to divert the water for consumption and irrigation purposes. The KBLP has become a heated point of controversy in India as questions about the motivation behind it and its feasibility stall implementation. The Indian government has released a Feasibility Report discussing the potential impacts of the project on the surrounding environment, but there is much to be desired in the detail of the description and analysis of the project. Due to the general nature of the Feasibility Report there is insufficient evidence to determine if the KBLP is the appropriate management policy for this area.
Using GIS analysis, literature reviews, and focus group interviews, this report addresses three major points of criticism surrounding the KBLP: hydrologic, wildlife, and social impacts. The research in this report provides an interdisciplinary contribution to the discussion on the feasibility of this water management plan. It is hoped that decision-makers, NGOs, and other stakeholders will use the information provided in this report to develop a thoughtful and responsible plan of action for water management of the area through further meaningful research.

4
Preface
The debates among those that support and oppose the river linking plan
demonstrate that the complexities of such a large scale plan go beyond focusing on the
benefits. Although, it is important to recognize that this project has been proposed to
address many of the water issues that India currently faces, it is equally important that
other factors be addressed in an in-depth manner. Taking into account the unprecedented
size of this project, it is not possible to discuss all 30 proposed links. The focus of this
document therefore, is on the Ken-Betwa Link Project (KBLP), which has been
designated as the pilot link whose implementation process is beginning. The information
that has been made available, and in particular the KBLP’s Feasibility Report, has served
to raise numerous issues regarding the potential impacts at various levels. This document
addresses three major impacts that surround the KBLP in an effort to contribute to the
discussion on the appropriateness of this water management plan.
The first section in this document addresses hydrological impacts. This has been
perhaps the most contentious issue surrounding the KBLP debate. As a result of the
designation of the Ken River as a “surplus” basin, it is deemed capable of providing
water for diversion to the Betwa and leading supporters to believe that this ultimately
justifies the construction project. However, opponents of the project are eager to prove
this designation is invalid and suggest that the government has manipulated the data used
to calculate the water balance of the area. Unfortunately, data on water quantity, such as
stream discharge data, has either not been collected in a meaningful manner or is
unavailable to the public. It is therefore unreasonable to attempt to prove or disprove the
designation of the Ken River as a “surplus” river in this document. Instead, this
document characterizes the environmental conditions of the project area as they relate to
the hydrologic conditions of the area. Using Geographic Information Systems (GIS)
analysis, this section on hydrological impacts evaluates the vulnerability of the area to
potential hydrologic impacts that could result from the construction of the KBLP.
Therefore, the impacts of hydrologic change to the Ken River basin can be understood
regardless of a “surplus” designation.
The second section discusses the impacts pertaining to wildlife. The claims that
are being made by the National Water Development Agency (NWDA) in regards to the

5
impacts of the KPLP on wildlife have reason to raise serious concerns, as they do not
adequately cover the potential for long-term damage to the region’s biodiversity. In an
effort to address such concerns, the use of qualitative data and literature is applied to the
analysis of the implication to wildlife. An overview of all the links is considered in the
beginning stages of this analysis in order to gain a better understanding of how wildlife is
being addressed during the planning of these links. This section also serves to identify
current threats to wildlife within the KPLP region and the general impacts of
development on wildlife in India, which has not been addressed in this KBLP FR. In
addition, this section highlights relevant examples of the hydrological alterations impacts
on wildlife in an effort to explore the additional impacts that a project such as the Ken-
Betwa Link may have on wildlife.
The third section is on the potential social-economic impacts that may result if the
KBLP does not provide an adequate analysis in this regard. Although, local populations’
needs and livelihoods impacts have been incorporated into the KBLP FR, concerns about
the long term implications of this plan on project affected persons (PAPs) who that will
have to relocate to make way for the reservoir and even proposed project beneficiaries
remain unclear, as there are still many gaps in the feasibility report’s analysis. In
response to these gaps, local and national activist groups have brought a number of these
concerns to the forefront, claiming to be the voice of the rural poor due to their suspicion
of the relatively nontransparent and non - participatory project planning process
witnessed thus far. Exploration of the social-economic impacts synthesizes activists
claims with perceptions at the local level that have been gathered through focus groups
and existing literature on the subject matter. Using the qualitative data gathered as well
as existing literature, this section identifies gaps in the KBLP’s FR through the lens of
environmental justice and offers suggestions for more effective approaches to increasing
local user perceptions (and those who speak for them) in the next stages of the KBLP
planning process and for general water resource management in the region.
This document therefore explores three major impacts of the KBLP through the
use of both GIS modeling and qualitative examinations of both societal and
environmental data. The intention of addressing these impacts is to gain a better

6
understanding of this pilot link that if successful, will serve to influence the
implementation of this project nationwide.

7
Acknowledgements
We would like to thank the many people who have helped contribute to our research over the past two years. At the University of Michigan’s School of Natural Resources and Environment (SNRE), we had the support of Professor Mike Wiley. He provided guidance and constructive criticism. He had served as the advisor for the 2004 India River Linking masters project, has an established relationship with our client, and has worked in India. Professor Bunyan Bryant provided invaluable support for the social impacts section and during the final editing stages of the entire document. Professor Raymond DeYoung also served as a reader for the wildlife impacts chapter. In the SNRE Environmental Spatial Analysis Lab, Shannon Brines offered assistance during the GIS analysis conducted in the hydrology chapter. Robert Paige from Ducks Unlimited also contributed to the acquisition of GIS data and in the analysis of the hydrology chapter. Finally, Joan Lanning provided editorial assistance for the entire document. In India, we would like to extend our gratitude to the countless people and organizations that assisted in helping us conducted our research. Dr. Ram Boojh at the Center for Environment Education (North) in Lucknow has been essential in organizing our research activities, disseminating our results and providing us with guidance. At the World Wildlife Federation-India, Srabani Das, participated in an interview and provided invaluable information through the research team’s time in India. In addition, we would like to thank numerous partners in India for their help in the field: Himanshu Thakkar (South Asia Network on Dams, Rivers & People), Avani Mohan Singh (Haritika), Sandeep Chaelk (Haritika), Sudhir Vombatkere (National Alliance of People's Movements), Dr. Bharatendu Prakash, Himraj Dang, Ravi Sinha, Fareed Khan, Alok Srivas, Micky Singh, Asif Khan, and Laxkshman Pal.
We are furthermore grateful for the financial support provided by the International Institute, EFA, Rackham Discretionary Funds, the Alumni Incentive Award and the SNRE practicum award.

8
CHAPTER 1: Introduction Need for Water Management in India
India is a country that has enormous biological and cultural diversity. Throughout
the country there exists a wide range of geological conditions that provide ideal
environments for an enormous diversity of ecosystems, supporting some 81,000 recorded
animals and 45,000 plant species.1 The country has 4,635 distinct ethnic communities,
325 languages, six major religions and dozens of smaller independent faiths. Livelihood
sources are equally diverse, ranging from rural agriculture, craft working, industrial
processing, information technology and global business.2
India is one of the fastest developing countries in the world with a Gross
Domestic Product growth of over 6 percent annually since 2000.3 It is the seventh-largest
country by geographical area and the second most populous.4 As the population continues
to grow at a rate of 1.7 percent annually, various concerns will need to be addressed, one
of which is water availability.5
Water is undoubtedly the most important natural resource on the planet, as it
sustains all aspects of life in a way that no other resource can. Due to the importance of
this resource, it is likely that water will be one of the most critical resource issues of the
21st century both in terms of quantity and quality. International institutions such as
various United Nations agencies and the World Bank have claimed that these scarcities
will escalate in the future, creating serious problems for humankind and the
environment.6 This situation is largely due to the present management and development
practices. How societies chose to manage or mismanage water will continue to impact
the quality of health, environment and economic development in every region of the
world.
History: Post Colonial Development
Hosting the world’s second largest population, post-colonial India has been a
major contributor to the increase of large water infrastructure development worldwide.
Along with the touted benefits of such projects, they are also seen in India as symbols of
development, greatness, modernity, and nationality.7 Moreover, post-colonial India’s first

9
generation of leaders considered hydroelectric and irrigation projects as “temples” of
modern India “where man works for the good of mankind” (Pg. 24).8 In 1954, at the
opening of the Nangal Canal in Punjab, the first Prime Minister Pandit Jawaharlal Nehru
summed this combination of symbols perfectly when he laid eyes on the dam and said,
“What a stupendous, magnificent work – a work which that can be taken up only by a
nation which has faith and boldness!.. It has become the symbol of a nation’s will to
march forward with strength, determination and courage…”.9 Today some of India’s
leaders continue to advocate for large infrastructure projects, including the nationwide
river linking plan, in order to meet the requirements for continual development.
For the independent state, modernization has been essential to national
development and is often used to legitimize exploitation.10 Immediately after
independence from British rule in 1947, the government made major policy decisions to
follow a path of a mixed economy, with a greater emphasis on the development of the
countryside. In each five-year plan, rural development was addressed through various
programs, all with the intent to bring overall transformation and modernization to rural
areas to help curb poverty, unemployment and migration to urban centers by those in
search of work.11 Despite these reforms, several evaluation studies have shown that there
have been little qualitative changes in the life of the rural poor. Instead, development
plans seemed to have primarily benefited groups such as the large landowners,
bureaucrats, industrialists, and traders.12 Thus, the construction of large water
infrastructure projects as the means for the development of resources to expand industry
and irrigated agriculture during the past 60 years has yielded mixed results.
As it stands now, there are few alternatives to the development paradigm. Both
before and after independence, India has tried to fit into the world system based on
industrial culture and growth that is dependent on the immediate and extensive use of
resources. In this regard, water as a renewable resource could be a better option for power
generation and irrigation. All industries use water; therefore it is argued that societies
wishing to develop themselves must follow this path. Development has indeed raised
India’s standard of living in general, but not without unequal distribution and unexpected
financial, social and environmental costs. In general, the effects of large infrastructure
projects have exacerbated existing social inequalities in many cases, as the benefits often

10
go to the powerful and privileged few, thus widening the gap between the rich and poor.
In addition, over time the negative impacts to river ecosystems can extend far beyond the
flora and fauna that immediately depend on them. These trends have the potential to
continue if the human and ecological dimensions remain excluded from the development
process.
Current Institutional Water Management Structure
Ultimately, the Indian constitution and subsequent amendments dictate how water
should be managed and allocated. In this regard, it is important to note that while the
constitution enshrines the right to adequate potable water, it does not specify the
quantities.13 As with most countries, the government water management structure in India
allocates various responsibilities at the Central, State and Local levels.
At the Central level, the Ministry of Water Resources is in charge of overall
planning, coordination and guidance in the water resource sector. This Ministry is also
the key central actor involved in the river-linking plan. However, three additional central
agencies also play a large role in the nationwide development and management of water
resources. These agencies are the Ministry of Rural Development, Ministry of
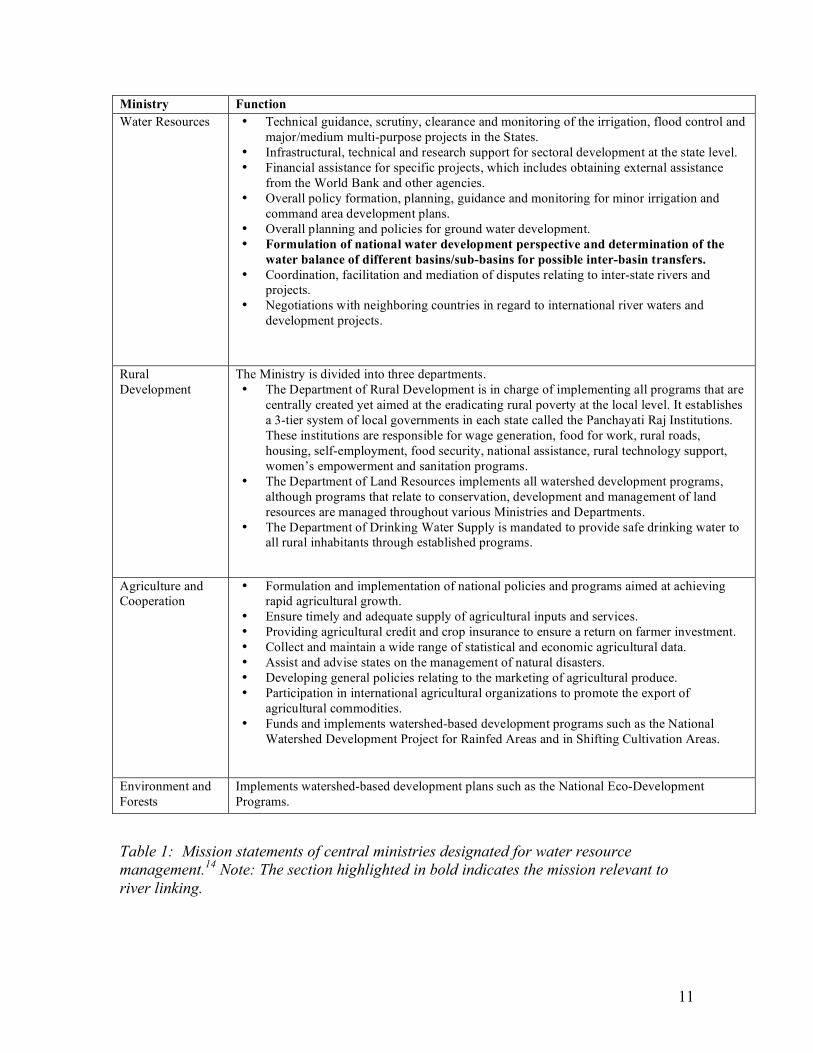
Agriculture and Cooperation and the Ministry of Environment and Forests (Table 1).
11
Ministry Function Water Resources • Technical guidance, scrutiny, clearance and monitoring of the irrigation, flood control and
major/medium multi-purpose projects in the States. • Infrastructural, technical and research support for sectoral development at the state level. • Financial assistance for specific projects, which includes obtaining external assistance
from the World Bank and other agencies. • Overall policy formation, planning, guidance and monitoring for minor irrigation and
command area development plans. • Overall planning and policies for ground water development. • Formulation of national water development perspective and determination of the
water balance of different basins/sub-basins for possible inter-basin transfers. • Coordination, facilitation and mediation of disputes relating to inter-state rivers and
projects. • Negotiations with neighboring countries in regard to international river waters and
development projects.
Rural Development
The Ministry is divided into three departments. • The Department of Rural Development is in charge of implementing all programs that are
centrally created yet aimed at the eradicating rural poverty at the local level. It establishes a 3-tier system of local governments in each state called the Panchayati Raj Institutions. These institutions are responsible for wage generation, food for work, rural roads, housing, self-employment, food security, national assistance, rural technology support, women’s empowerment and sanitation programs.
• The Department of Land Resources implements all watershed development programs, although programs that relate to conservation, development and management of land resources are managed throughout various Ministries and Departments.
• The Department of Drinking Water Supply is mandated to provide safe drinking water to all rural inhabitants through established programs.
Agriculture and Cooperation
• Formulation and implementation of national policies and programs aimed at achieving rapid agricultural growth.
• Ensure timely and adequate supply of agricultural inputs and services. • Providing agricultural credit and crop insurance to ensure a return on farmer investment. • Collect and maintain a wide range of statistical and economic agricultural data. • Assist and advise states on the management of natural disasters. • Developing general policies relating to the marketing of agricultural produce. • Participation in international agricultural organizations to promote the export of
agricultural commodities. • Funds and implements watershed-based development programs such as the National
Watershed Development Project for Rainfed Areas and in Shifting Cultivation Areas.
Environment and Forests
Implements watershed-based development plans such as the National Eco-Development Programs.
Table 1: Mission statements of central ministries designated for water resource management.14 Note: The section highlighted in bold indicates the mission relevant to river linking.
12
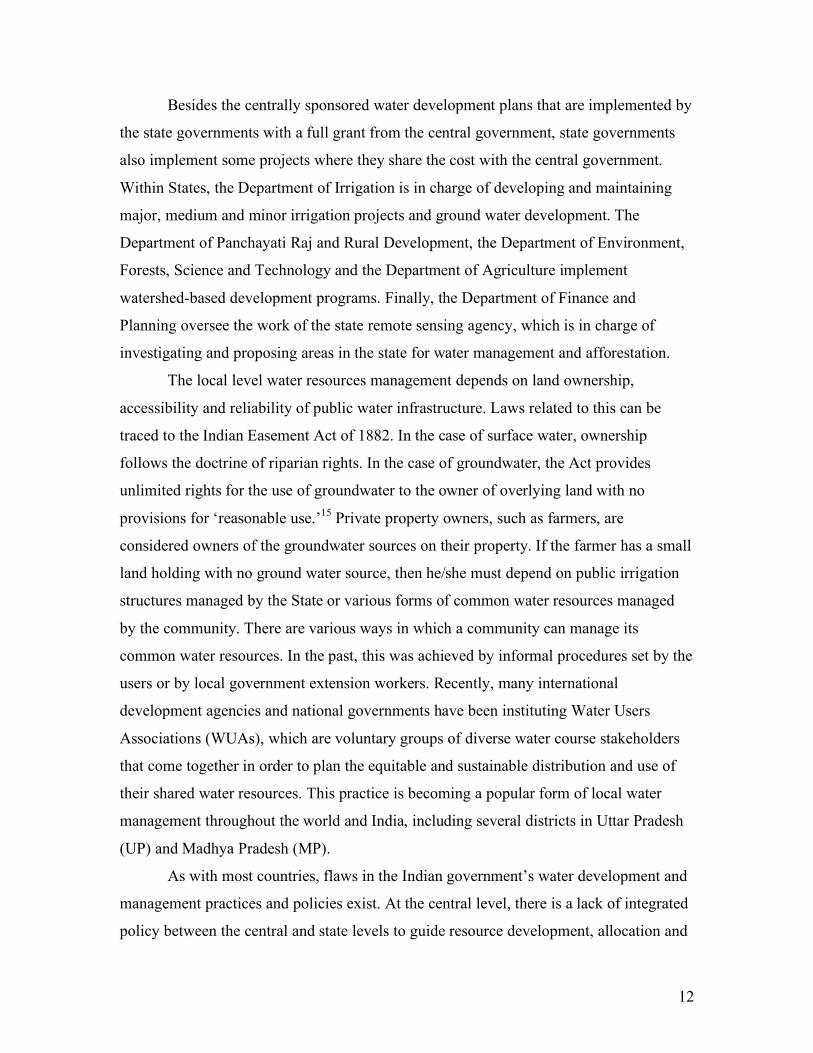
Besides the centrally sponsored water development plans that are implemented by
the state governments with a full grant from the central government, state governments
also implement some projects where they share the cost with the central government.
Within States, the Department of Irrigation is in charge of developing and maintaining
major, medium and minor irrigation projects and ground water development. The
Department of Panchayati Raj and Rural Development, the Department of Environment,
Forests, Science and Technology and the Department of Agriculture implement
watershed-based development programs. Finally, the Department of Finance and
Planning oversee the work of the state remote sensing agency, which is in charge of
investigating and proposing areas in the state for water management and afforestation.
The local level water resources management depends on land ownership,
accessibility and reliability of public water infrastructure. Laws related to this can be
traced to the Indian Easement Act of 1882. In the case of surface water, ownership
follows the doctrine of riparian rights. In the case of groundwater, the Act provides
unlimited rights for the use of groundwater to the owner of overlying land with no
provisions for ‘reasonable use.’15 Private property owners, such as farmers, are
considered owners of the groundwater sources on their property. If the farmer has a small
land holding with no ground water source, then he/she must depend on public irrigation
structures managed by the State or various forms of common water resources managed
by the community. There are various ways in which a community can manage its
common water resources. In the past, this was achieved by informal procedures set by the
users or by local government extension workers. Recently, many international
development agencies and national governments have been instituting Water Users
Associations (WUAs), which are voluntary groups of diverse water course stakeholders
that come together in order to plan the equitable and sustainable distribution and use of
their shared water resources. This practice is becoming a popular form of local water
management throughout the world and India, including several districts in Uttar Pradesh
(UP) and Madhya Pradesh (MP).
As with most countries, flaws in the Indian government’s water development and
management practices and policies exist. At the central level, there is a lack of integrated
policy between the central and state levels to guide resource development, allocation and

13
use.16 This is most evident in regard to water supply and management at the local level.
There is also a lack of coordination between the multiple ministries and departments
directly or indirectly dealing with water. Similar issues of inefficient departmental
coordination and poor connections with local management also exist at the State level. As
a result, legal violations regarding allocation and scheduling of public irrigation water are
not routinely enforced or monitored.17 Local level management practices also suffer from
the lack of coordination between the activities of WUAs and similar State programs. In
addition, WUAs often lack enforcement mechanisms and funding to carry out their
stipulated functions.
What is the Nationwide Interlinking of Rivers Plan?
One of the main issues facing water resources management in India is the
unevenly distributed water supply throughout the country. This is due to the natural
patterns of precipitation, which varies widely in time and space.18 As a result, there are
regions of the country that receive large amounts of precipitation during the monsoon
season, while at the same time, others receive much less and often face the reality of
water scarcity. In an effort to deal with this uneven distribution of water, one of the most
grandiose designs proposed has been the nationwide plan of interlinking the rivers of
India.
This proposal of joining rivers throughout the country is not a new idea. Sir
Arthur Cotton was the first to conceive of a plan to interlink rivers in Southern India for
inland navigation during the nineteenth century.19 The vision that Sir Arthur Cotton had
was to connect the major rivers of India together for the basic purpose of transporting
goods through waterways, which he felt was a far less expensive method then land
transport. Although Cotton’s vision was only partially implemented in areas were he
operated, the idea was later advanced by Dr. K. L. Roa in 1975.20
Dr. Roa, an engineer and former Union Minister for Irrigation in Nehru’s Cabinet,
proposed the idea of a Ganga-Cauvery Link, which came to be known as the National
Water Grid. According to Dr. Roa, there are fourteen major rivers in India, each with a
catchment area of at least 20,000 sq. km; together these rivers yield 85 percent of the total
water in India.21 Therefore, Dr. Roa believed that by interlinking these major rivers,

14
water could be transferred from areas of surplus availability to those areas of deficient
supply. In order to prove the necessity of such a transfer, Roa divided the entire country
into four zones and calculated both the water potential and cultivable area falling in each
zone. His analysis revealed that Zone-1 (the Himalayan Rivers Zone comprising the
Brahmputra and Ganga Basins) had 64 percent of the total water of the country and 44
percent of the total cultivatable area, whereas, Zone-II and Zone-III barely had 9 percent
and 19 percent of the total water but had 19 and 35 percent cultivable area, respectively;
Zone –IV was negligible in water supply and cultivable area.22 As a result of his analysis,
Dr. Roa emphasized the necessity of transferring surplus water from the Himalayan
Rivers to the central and southern parts of the country.
Taking into account the magnitude of this project, the United Nations
Development Program (UNDP) was requested in the 1970’s to examine the National
Water Grid and address three issues: the feasibility of the scheme based on the
preliminary studies done so far; the evaluation of socio-economic benefits of the scheme
on a national basis; and the estimation of further studies, surveys and investigations
needed to be undertaken.23 Although the UNDP recognized the need for addressing the
problem of increasing water scarcity as India’s national economy and population grew,
they offered cautionary advice as they expressed doubts about the funding, electrical
power needs of the plan, and the actual water yields in the zones. While these concerns
resulted in Dr. Roa’s plans not being implemented, his proposal did serve as a key
stepping stone towards the eventual development of the larger scale interlinking river
project.
A few years later, another proposal known as the Garland Canal was advocated by
Capt. Dinshaw J. Dastur. As a pilot, Capt. Dastur flew over the Delhi-Kathmandu route
and observed the Himalayan Rivers.24 His observations lead him to believe that the
waters flowing from the Himalayan Mountains could be diverted by a canal at a high
level and taken down the entire country for irrigation. Studies carried out by the Center
Water Commission in 1979 of Capt. Dastur’s proposal indicated that it was impractical,
technically unsound, and economically unfeasible.25 Ultimately, Dr. Roa’s and Capt.
Dastur’s plans were rejected due to their technical infeasibility and impractical cost.

15
However, the persistent interests by many kept the study of inter-basin water
transfer proposals afloat and eventually lead to the Ministry of Irrigation (now the
Ministry of Water Resources) to formulate a plan known as the National Perspective Plan
in 1980.26 This plan was comprised of two main components, the Himalayan Rivers
Development and Peninsular Rivers Development. The intention of these two
components was the same as that proposed by Dr. Roa, to interlink surplus rivers to those
of water deficient rivers. This proposal led to the establishment of the National Water
Development Agency (NWDA) in 1982. 27 The NWDA was to serve the following
objectives:28
• Promotion of scientific development for optimum utilization of water resources in the country.
• Carrying out detailed surveys and investigations of possible storage reservoir sites and interconnecting links in order to establish feasibility of the proposal of Peninsular Rivers Development and Himalayan Rivers Development Components.
• Carrying out detailed studies about quantum of water in various Peninsular River Systems and Himalayan River Systems and which could be transferred to other basins/States after meeting reasonable needs of basin States in the foreseeable future.
• Preparing feasibility reports of various components of the scheme relating to Peninsular Rivers Development and Himalayan Rivers Development.
• And taking other actions considered necessary, incidental, supplementary or conducive to the attainment of the above objectives.29
The establishment of the NWDA, however, did not exempt the National Perspective Plan
from being subjected to examination and the National Commission for Integrated Water
Resources Development Plan, a commission established by the Government of India-
Ministry of Water, submitted its report in September 1999.30 The commission indicated
that there was no imperative necessity for massive water transfer and recommended to
the NWDA that further studies were needed to determine future possibilities of this
proposed plan.
Even though the proposal of interlinking rivers throughout India has been
continually rejected by technical reviewers, it has unfailingly resurfaced through the
years. On October 31, 2002 the plan to interlink rivers was once again resurrected by the
Supreme Court of India and led by retired Chief Justice BN Kripal through a mandate,
which stated:

16
“pursuant to the notice issued by this Court to all the states and the Union Territories in relation to the inter-linking of the rivers, an affidavit has been filed by the Union of India and also by the State of Tamil Nadu. No other State or Union Territory has filed any affidavit and the presumption, therefore, clearly is that they do not oppose it and it must be regarded that there is a consensus amongst all of them that there should be inter-linking of rivers in India.”31
Factors like failure of monsoons in several parts of India and interstate disputes over
water have been suggested as being the basis for this mandate and the urgency of the
government of India to complete the interlinking project in the next 10 years. 32 The new
proposal appears to emulate the 1980’s plan and consists of two separate components,
which include the Himalayan component and the Peninsular component, which when
combined, cover the entire country (Figure 1 and 2). These two components will connect
37 major rivers via 30 links consisting of dams and canals. The ultimate goal of this
project is to transfer the flood waters of the Himalayan Rivers to the drought prone areas
of the Peninsula. It is estimated to cost Rs. 560,000 crore (about 120,000 billion USD)
and if completed would be the single largest water development project in any sector,
anywhere in the world.33

17
Figure 1. Map of the proposed links in the Himalayan component.34

18
Figure 2. Map of proposed links in the Peninsular component.35

19
National Policies for River Linking
In 1987, the National Water Resources Council approved the first comprehensive
National Water Policy (NWP), which has been guiding the formulation of policies and
programs for water resource development and management in the country. The national
policy came up for review in April 2002 in light of the many challenges that had
remained and the new ones that had emerged in water resource sectors. On April 1, 2002,
a revised NWP was adopted that recognized the importance of ecological and social
components as integral considerations in water management nationwide. The NWP is
now responsible for guiding states in the establishment of standardized information
systems, data collection, basin-wide multidisciplinary organizations, clearance and
implementation of projects, rehabilitation, ground water development, water zooming,
flood and drought management, research and development. It is thus meant to provide a
framework for coordinated water development across states and emphasizes the need for
river basin planning and alternative uses of water.
Despite the move towards sustainable water management, the NWP in its present
form is not supported by explicit legislation and does not have an action plan. It does not
provide any authority or designate parties responsible for its implementation. In addition,
it does not provide the economic cost of water nor any investment scenarios.
Furthermore, it has little operational impact on the coordination and implementation of
water development projects that cross state boundaries. MP and UP are among the few
states that have incorporated this framework into their water management plans.
The NWP does mention the importance of incorporating inter-basin water
transfers in several articles under the Water Resources Planning section.36
Section 3.1: Non-conventional methods for utilization of water such as inter-basin transfers, artificial recharge of ground water and desalination of brackish or sea water as well as traditional water conservation practices like rainwater harvesting, including roof-top harvesting, need to be practiced to further increase the utilizable water resources. Promotion of frontier research and development, in a focused manner, for these techniques is necessary. Section 3.5: Water should be made available to water short area by transfer from other areas, including transfers from one basin to another, based on national perspective, after taking into account the requirements of the areas/basins.

20
Governmental procedures for Interlinking
Procedurally, the NWDA began the interlinking planning process by conducting
pre-feasibility studies that identified the 30 possible links currently being considered in
1982.37 Since this process has been completed, Feasibility Reports (FR) for eight links
have been prepared, while the remaining reports are currently underway. Based on this
information, Detailed Project Reports (DPRs) are prepared for particular links. The first
step of the DPR process is the signing of the Memorandum of Understanding (MOU)
between the central government and the participating state governments. All activities are
then carried out according to the specific MOU, applicable codes and established
practices. The time schedule for the preparation of the DPR is based on the size of the
link project, although the NWDA states that each should take between 20 to 30 months.
The DPR is conducted by a consultant that analyzes the adequacy of the data and
information contained in the FR to identify what needs to be collected as a part of the
DPR. Its scope is broadly classified as covering the technical, environmental and socio-
economic aspects of the project. Specifically, the NWDA highlights 27 main activities
that the DPR will cover but is not limited to: examining consistency of FR data,
collecting additional data, establishing a database, hydrologic modeling, topographic
surveys, Environmental Impact Assessment, Social Impact Analysis, cost/benefit
analysis, etc.38 According to the NWDA, the basic objective of these projects is to
transfer water to deficit basins, while also keeping in mind the needs of the concerned
states in order to ensure, equity, efficiency of water use and cost effectiveness.
The Benefits/Costs of Interlinking on the National Scale
The river linking proposal has claimed various benefits. According to the NWDA
the National Perspective Plan also known as the Interlinking of Rivers (ILR) Plan would
give additional benefits of 25 million hectares of irrigation from surface waters, 10
million hectares by increased use of ground water, totaling 35 million hectares and
34,000 MW of hydro-power generation.39 In addition the likely incidental benefits are:40

21
• drought mitigation • flood control • domestic and industrial water supply • navigational facilities • employment generation • fisheries • salinity control • pollution control • recreation facilities • infrastructural development • socio – economic development
In sum, the national plan is being promoted as the ultimate solution to the droughts and
floods, potable water for rural and urban areas, power generation through hydroelectric
generators, and significant employment opportunities. This type of endorsement touches
on personal issues that the people of India face on a daily basis, which could make
supporting the interlinking rather easy, while also making it difficult to look beyond the
much needed benefits to perceiving the consequences, or cost to themselves, when
construction of the links begin.
Only the obvious “cost” has been explicitly discussed by the NWDA, that of the
financial cost of this project. However, the reality is that the economic aspect is only one
cost; there are several others that need to be taken into consideration, such as social and
environmental costs. For example, according to Rivers for Life, an independent research
action group, it is estimated that the ILR plan will submerge thousands of square
kilometers of land affecting millions of already marginalized people that will be
displaced as a result. The potential for displacement of people is real and around 33
million have already been displaced in India during the last 50 years and most have not
been rehabilitated, ending up destitute.41 Regarding the environmental cost posed by this
project, feasibility reports made available by the NWDA indicate the submergence of
thousands of forest hectares, which have the potential to result in loss of habitat and
increase threats to India’s wildlife. The Rivers for Life group also highlighted that river
systems will be altered catastrophically creating new droughts and deserts, destruction of
fisheries, and increased pollution in rivers as highly polluted rivers spread toxicity to
other rivers.42
22
Proponents and Opponents of Interlinking: A Growing Debate
As the benefits and cost are weighed, discussion of the many issues surrounding
this project has made it a highly controversial national topic. This is in large part due to
the fact that the benefits claimed are not balanced with serious discussion of societal and
environmental costs. It has been said that the national river-linking plan has virtually
polarized the country into ‘supporters’ and ‘opponents’.43
It is important to identify some of the supporters and opponents in order to gain a
better perspective of both sides’ views of the benefits and cost of this plan. As mentioned
earlier, the interlinking of rivers is not a new idea for dealing with water issues in India.
Now with the Supreme Court mandating and supporting the interlinking, other influential
political leaders are rallying in favor of this plan.
The Supreme Court mandate is supported by President Abdul Kalam, who
strongly feels that this project is needed in India and has spoken publicly in support of it.
He addressed the people of India on the eve of the country’s 59th Independence Day, in
which he spoke of the importance of interlinking:
“Rainfall and floods are annual features in many parts of the country. Instead of thinking on interlinking of rivers only at times of flood and drought, it is time that we implement this programme with a great sense of urgency. We need to make an effort to overcome various hurdles in our way to the implementation of this major project. I feel that it has the promise of freeing the country from the endless cycle of floods and droughts.”44
Prime Minister Vajpayee has also been supportive of interlinking. On February 5,
2002 while launching the Freshwater Year 2003 at Vighyan Bhawan, he addressed the
issue of water shortages.45 He spoke of the problem that India faces regarding water and
its relation to the manner in which rainfall occurs throughout the country, which lead to
the dual problems of droughts and floods. The Prime Minister has suggested that the
interlinking of rivers will ameliorate these issues. He has addressed criticism towards the
interlinking by drawing attention to the fact that it is not a new concept. He also indicates
that areas where inter-basin transfers have already occurred the results have been
beneficial for people. He speaks highly of the steps being taken towards the interlinking,
in particular those of the Task Force, which was set up by the Ministry of Water
Resources. The Task Force consists of other political players, engineers and technocrats

23
who support the interlinking. They provide guidance on the following: economic
viability, socio-economic impacts, devising suitable mechanism for bringing about
speedy consensus amongst the states and prioritizing the different project components for
preparation of Detailed Project Reports (DPRs) and implementation.46
In general the opposition acknowledges the urgency needed in addressing the
water problems that many regions face throughout the country. They also agree that
these are issues that require immediate attention. However, those opposing interlinking
are concerned with the lack of information available to the public regarding the proposed
links. This project, if successful, will change large portions of India’s geography and will
inevitably have societal and environmental implications. Recognizing the potential of
such impacts and the need for a careful interdisciplinary approach to interlinking has
been a motivating factor for those in opposition. Many have raised several issues that
they feel the government has overlooked as they push forward.
Some water experts have publicly expressed their concerns regarding the potential
impact of this project. Rmaswamy R Iyler, former Secretary for the Union of Water
Resources Ministry said, “The grand vision of long-distance water transfer from one
basin to another is totally uncalled for, when we cannot even persuade neighboring states
within a basin to agree upon sharing of water”.47 Iyler raises a key issue in regards to this
vital resource. People are aware of its scarcity and are not easily going to share something
that is already limited to them. This could lead to interstate conflicts, conflicts that have
the potential to escalate and make water accessibility to people even more difficult.
Sudhirendra Sharma, water and energy expert at the Ecological Foundation based in New
Delhi believes that linking of rivers is impractical. He has said that attempting to control
nature is dangerous and that it will only lead to increase disputes over water as well as
unimagined levels of displacement.
Numerous environmentalists have also spoken against the interlinking. Ravi Agarwal
an environmentalist from the Srishti environmental organization that is involved with
waste management in India has said:

24
“Linking of rivers is a disastrous idea from the environmental point of view. Interlinking a toxic river with a non-toxic one will have a devastating impact on all our rivers and as a consequence on all human beings and wildlife. How can one even think of linking for instance, mercury contaminated Par river of Gujarat or poisonous water of Yamuna River with any other uncontaminated river”.48 The Centre for Science and Environment, a non-governmental organization that seeks
to increase public awareness about the environment and sustainable development,
believes that scarcity issues need to be addressed at local levels. The need for a more
local focus is due to the fact that regions are different and that water management
practices, such as water harvesting could serve to benefit the people more than such a
large scale project. Grassroots organizations also from diverse regions like Bihar, Andhra
Pradesh, Tamil Nadu, Rajasthan, Maharastra, and Delhi participated in the “Civil Society
Dialogue on the subject of India’s proposed Interlinking of Rivers” organized by the
World Wide Fund-Switzerland in which they shared the view that the country did not
require such a large project, rather it needed a “people - centered local water solution that
can solve the real needs of the people”.49 These organizations want the government not to
overlook other small scale options that have the potential to be less destructive and more
effective.
Organizations such as the World Wildlife Fund-India (WWF-India) have expressed
concern regarding the impacts that this proposed project will have on wildlife. WWF-
India works to address the issues that India’s wildlife currently faces. The organization
realizes that this project will have drastic impacts on fishery ecosystems and protected
areas designated for wildlife, as construction of links will lead to habitat destruction.
Despite the growing debate, plans have been made to begin implementation of the
national plan through a pilot link known as the Ken-Betwa Link Project.
The Ken-Betwa Link Project
The Ken-Betwa Link Project (KBLP) is one of the 30 river links proposed by the
NWDA in the Bundelkhand region of Uttar Pradesh (UP) and Madhya Pradesh (MP).50
While no links have been built to date, the KBLP is being pursued as the pilot project of
the national program to serve as a “litmus test” for the national ILR plan.51 Critics
suggest that the KBLP has been chosen as the premiere project as a result of its remote

25
location, which minimizes opportunity for controversy. Additionally, the physical
construction required for the KBLP is relatively minimal as a result of the close
proximity of the Ken and Betwa rivers to each other.52 The outcome of this pilot link will
set the tone for river interlinking nationwide. Therefore, both supporters and opponents of
the project are eager to use the KBLP as an example to either continue or defeat the
national water management plan.
Currently, the only published information on the KBLP provided by the Indian
Government is the Feasibility Report (FR). The NWDA considers the Feasibility Report
to be a brief description of the project and preface that information in the report is
tentative and likely to change during the Detailed Project Report (DPR) stage.53
Communications with interested parties suggest that development of the DPR has begun,
however it is unknown when the report will be completed or whether an Environmental
Impact Assessment (EIA) will be conducted.54
According to the FR, the main aim of the KBLP is to provide additional water to
the areas of the Upper Betwa sub-basin from the Ken Basin. To do this, a 73.8 m high
dam called the Greater Gangau Dam (GGD), is proposed on Ken River near Daudhan
village, on the border of Chhatarpur and Panna districts in Madhya Pradesh, 2.5 km
upstream from the existing Gangau Weir. The water is to be transferred to the Betwa
River through a 231.45 km long concrete lined link canal which is to drop water upstream
of the existing Barwasagar reservoir in Jhansi district in Uttar Pradesh.

26
Figure 2: Map of the Ken-Betwa Link Project. Illustrates the proposed plan for construction of the dams, reservoirs, and canals.

27
The FR provides a general description of proposed benefits of the KBLP. In some
cases, the FR quantifies the amount of water to be transferred and/or identifies how water
is to be distributed. The following benefits are specified according to the FR:
• 659 Mm3 of water is to be diverted to the Betwa basin upstream of the existing Parichha weir to provide annual irrigation of 1.27 lakh hectares in a drought prone area of the upper Betwa sub basin.55 This irrigation will be provided through four projects to be identified later by the Water Resources Department.
• An additional 47,000 hectares en route of the link canal is proposed to receive annual irrigation benefits from the project.
• 3.23 lakh hectares in the near the project site Ken basin is proposed to receive irrigation benefits.
• 11.75 mm3 of water will be allocated for drinking water supply to villages and towns en route of the link canal. It is suggested that this amount of water will serve the needs of 3.3 lakh people at a consumption rate of 100 liters per capita per day.
The FR also acknowledges costs and impacts that result from the construction of
the KBLP. According to the FR, the total cost of the project is estimated to be Rs.
1988.74 crore or 452 million USD.56 It is also stated that construction of the dam and
reservoir will result in the displacement of 900 families from 10 villages. The total
number displaced is estimated at 8550 people. Additionally, it is estimated that 6400 ha
of the area to be submerged is forested, with 4500 hectares (approximately 70%) of this
area located in Panna National Park and Tiger Reserve, a designated wildlife refuge.
However, the severity of these impacts is minimally discussed throughout the document.
The controversy surrounding river linking is exemplified in the critiques of the
KBLP. Three major points of contention dominate the criticisms of the KBLP. One
prevalent concern is the designation of the Ken River as a “surplus” basin and the Betwa
River as a “deficit” basin, which provides the underlying justification for the transfer of
water. Critics argue this characterization is inaccurate and based on unreliable data,
suggesting the government has purposely manipulated water quantities to justify the
project. Another concern is the impact to wildlife due to the submergence of part of
Panna National Park and Tiger Reserve. Critics argue that the Ken River is one of the
least polluted rivers in India and are concerned about how the construction of a dam and
reservoir will impact the aquatic and terrestrial fauna that reside in the park. Finally,

28
opponents are critical of the need to relocate residents of submerged villages and argue
over fairness and equity of the distribution of the water to local populations. 57
Due to the general nature of the Feasibility Report (FR) there is insufficient
evidence to determine if the KBLP is the appropriate management policy for this area.
Criticisms of the project cannot be justified or disputed based solely on this document.
Therefore, it was necessary to conduct further research to assess the feasibility of the
KBLP. This research addresses the three major points of criticism surrounding the
KBLP in order to contribute to the discussion on the appropriateness of this water
management plan.
Regional Description
The KBLP is located in the Bundelkhand region of central India. This geographic
region is divided into 13 districts between the states of Uttar Pradesh (UP) and Madhya
Pradesh (MP), with the larger portion in MP. Bundelkhand has a rich history of Indian
and Mughal dynasties between the 9th and 17th centuries, later followed by British
colonial rule in most of the region until independence in 1947. Throughout Bundelkhand
unique temples, forts and palaces dot the remote landscape and attract visitors from all
over India and the world. Khajuraho is a small town in MP that hosts the majority of the
regions visitors, as it has the largest group of medieval Hindu temples. This UNESCO
World Heritage site is a prime example of Indian architecture and is especially valuable
to the country’s history, as its remote location has saved it from the massive destruction
by non-Hindu invaders of the past. It is a rapidly developing town, with visitor numbers
and travel accessibility routes steadily increasing. However, the town faces a severe water
crisis as a majority of its ground water has already been depleted and thus has to import
expensive water via trucks from nearby sources.58 Khajuraho is 30 km from the proposed
dam site on the Ken River and has been identified as one of the main accessible locations
for the KBLP in the FR. It is also important to note, that the FR does not address the need
for water in this economically important town or if the KBLP will contribute to it.
The Bundelkhand was historically forested until the late 18th century as a result
of British colonial rule when intensive logging in the region began. The practice was
continued and further accelerated under the post-colonial Indian government. The

29
remaining forests of this region are largely concentrated in the Panna National Park and
Tiger Reserve, which is situated in the Vindhyan hill range and spreads over Panna and
Chhatarpur districts. Created in 1981, the Park has an area of 543 km2 and now
encompasses former nearby wildlife sanctuaries, reserved and protected forests.59 The
Park is dominated by tropical dry deciduous forests that create the northern most
boundaries for the natural distribution of teak, and the eastern limits of mixed forests. The
Ken River, considered the main lifeline, flows for 55 km through the Park. Given the
variety of wildlife species found in the Park, including the tiger, and the close location to
Khajuraho, it is also a popular tourist destination of the region.
The majority of the landscape is otherwise distinguished by barren hilly terrain
with sparse vegetation. The topography of the region is best described as “homogeneous
dissected upland, presenting an old eroded surface, carved out of granite with northern
alluvial plains” (Pg. 10).60 Among it diverse geologic clusters, the region hosts a variety
of economically valuable minerals that have inspired mining activities. Minerals such as
limestone, granites, gneisses, basalt, sandstones, diamond, pyrophylite, diaspore, ochre,
river sands and silica sands are the major types being mined in various locations
throughout Bundelkhand. Such activities have contributed to deforestation, soil erosion,
depleted water tables, and pollution of rivers and streams among other environmentally
degrading impacts.61
The climate of the region is mainly semi-arid to dry sub-humid with hot summers
and moderately cold winters. Approximately 90% of the annual rainfall occurs during the
monsoon season from June to September.62 Erratic rainfall characterizes the remainder of
the year, which causes the local population to depend on surface water collected during
the monsoon season in various receptacles or on personal and communal ground water
sources.
The Ken and Betwa are two of the regions eight principal rivers. Both are
considered interstate rivers between UP and MP and drain into the Yamuna River, which
is the largest tributary to the Ganga. The Ken River is 427 km long, out of which 292 km
lies in MP, 84 km in UP and 51 km form the common boundary between the two states.63
It has a total catchment area of 28, 224 km2, with the majority located in MP. The Ken
has a combination of 7 dams, canals and weirs and is fed by 19 tributaries.64 The Betwa
30
River is 590 km long, out of which 232 km lie in MP and 358 km in UP.65 It has a total
catchment area of 43, 895 km2, also with the majority located in MP. The Betwa has a
combination of 19 dams, canals and lakes and is fed by 11 tributaries that also have many
dams.66 In addition, there is a large hydropower and irrigation multipurpose project
proposed on a portion of the Betwa in MP. A questionnaire for the comparative studies is
currently awaiting response from the MP government. Furthermore, one large dam is
under construction on a major tributary to the Betwa and two additional hydropower
projects have been proposed.
The People of the Bundelkhand Region
Despite its glorious past and current mining, logging and tourism economies, the
Bundelkhand region is economically and industrially one of the most backward areas of
India. The reasons for under-development are based on a variety of factors, but mainly
attributed to the iniquitous distribution of lucrative industry profits, lack of resources,
poor communications, and infertile land. Governmental and non-governmental rural
poverty eradication programs are prevalent in the region as a result. The majority of the
populations in these districts have livelihoods based on the agriculture, as either farm
owners or laborers. The farmers in this region typically have small plots of land that
range between 2 – 5 hectares and rarely have more than one harvest per year.67
The KBLP promises direct drinking water and irrigation benefits to the districts of
Chhatarpur and Tikamgarth in MP and Hamirpur and Jhansi in UP (See Figure 2). In
addition, the KBLP promises to provide water to existing reservoirs on the Betwa that are
currently not reaching capacity. Thus, the Feasibility Report further claims that water
users dependent on these sources in the Raisen and Vidisha districts of MP will also be
indirectly benefited as a result of KBLP water substituting. Table 3, outlines some of
these districts existing agricultural activities.

31
District Area (km2)
Population (2001 census)
Rural Population (%)
Net Area Sown (% of hectares)
Irrigated Area (% net irrigated to net area sown)
Chhatarpur 8587 1,474,633 78 45 44 Tikamgarth 5048 1,203,160 82 52 68 Hamirpur 4094 1,465,401 83 71 29 Jhansi 5024 1,744,931 59 56 31 Raisen 8466 1,120,159 82 51 35 Vidisha 7371 1,214,759 79 73 27 Table 3: Describes the characteristics of the KBLP beneficiaries as defined by each district. 68
UP and MP Water Sharing Agreements
Given that the Ken and Betwa Rivers are considered interstate sources, UP and
MP are experienced in water sharing negotiations. In fact, the two have a long history of
planning water resource projects that are meant to benefit both states. However, water
sharing in a semi-arid region with a heavy dependence on seasonal rain and existing
water infrastructures that often do not meet their original promises has also yielded a
history of disputes. On the Ken, the Gangau Weir and Left Bariyarpur Canal have already
been a point of contention between the two states. The Gangau reservoir serves as a
source for the existing Bariyarpur weir where numerous canals have been constructed to
feed districts in both states. MP has recently begun construction of the Left Bariyarpur
canal to provide additional irrigation water for its districts, despite arguments from UP
claiming that the Bariyarpur weir will face additional shortages. The Rangwan dam has
also caused disputes between the two states due to control issues of the regulation gates,
inspection houses and the link roads.69 As a result, a 1972 bilateral water sharing
agreement between the two states has been violated and has thus far negatively affected
irrigation in UP.
On the Betwa, the Rajghat Dam interstate project has further added to the history
of disputes between the two states. Although the dam is still in the final stages of
completion after decades of negotiation, it is already apparent that it will not reach its
irrigation potential due to discrepancies in the original calculations of the catchment
area.70 This could negatively affect existing downstream dams such as the Matatila,

32
which is already suffering from high siltation rates. The redistribution of water proposed
by the UP government did not receive agreement at the local level and is now in the
hands of the Central Regional Board.
On August 25, 2005 in the presence of the Prime Minister, the UP and MP Chief
Ministers signed a Memorandum of Understanding (MoU) to take up a Detailed Project
Report (DPR) for the KBLP. This agreement came three years after the central
government’s Task Force on Interlinking of Rivers decided that the two states should
finalize and confirm their master plans for the project. Some close observers of the KBLP
are suspicious of this agreement based on the apprehensions that were expressed by the
states key negotiators in the official minutes of the meetings before the MoU was
signed.71 First, there was concern over the power requirements that will be needed for
pumping the canal water from the reservoir.72 Second, the KBLP would require a large-
scale reorganization of existing interstate water sharing agreements as it will increase
water in some areas but possibly decrease water in others. Third, officials from both
states were concerned that large-scale water diversions could lead to conflict in the
Bundelkhand region.73 Finally, there was concern that the KBLP will have adverse
effects on the existing irrigation and power generators on both rivers. Existing
hydropower generators and irrigation facilities such as the Rajghat and Matatila dams on
the Betwa are the most relevant examples in this regard. On the Ken, there was also
concern that the Gangau feeder reservoir downstream from the proposed KBLP dam
would be dry for most of the year if water of the Ken River is diverted.74 Ultimately, the
investments already made on these structures and their original designated benefits could
be severely impacted if not entirely wasted. This would be especially unfortunate for the
thousands of people already relocated and for the river ecosystems altered as a result of
these projects.

33
Outline of the Document
This document was jointly authored by Kelli Krueger, Frances Segovia and
Monique Toubia, although each author took primary responsibility for a specific chapter.
Kelli Krueger analyzed hydrologic impacts in Chapter 2, Frances Segovia focused on
wildlife impacts in Chapter 3, and Monique Toubia assessed the social impacts in
Chapter 4. Chapters 1 and 5 were jointly written by all three authors.

34
1 Kothari et al. (1995). People and Protected Areas: Rethinking Conservation in India.
The Ecologist. 25(5), 188-193.
2 Kothari et al. 1995. 3 Connell, Peter, Shirshore Hagi and Nilufar Jahan. “Indian Agriculture: Trends, Trade and Policy Reform.” Australian Commodities. 11(2004): 611 – 630. 4 Hosting over one billion people, approximately 17 percent of the world’s population is found in India. 5 Connell, 2004. 6 Biswas, Asit K. and Cecilia Tortajada, eds. Appraising Sustainable Development:
Water Management and Environmental Challenges. New Delhi: Oxford University Press, 2005. 7 Clabots, Christine. "Development Induced Displacement: Dams, Indigenous People,
and Democracy." Third Annual Forced Migration Student Conference. Oxford Brooks University, UK, 13-14 May 2005.
8 Khagram, Sanjeev. Dams and Development: Transnational Struggles for Water and Power. Ithaca and London: Cornell University Press, 2004.
9 McCully, P. “Sardar Sarovar Project: An Overview.” 1994. [Online]. Available:
http://www.narmada.org/sardarsarovar.irnoverview940525.html [2006, March 5].
10 Baviskar, Amita. In the Belly of the River: Tribal Conflicts Over Development in the Narmada Valley. Delhi; New York: Oxford University Press, 1995.
11 Katare, P. M. and Barik, B.C. Development, Deprivation, and Human Rights Violation. Jaipur; New Delhi: Rawat Publications, 2000.
12 Singh, Satyajit. Taming the Waters: The Political Economy of Large Dams in India. Delhi: Oxford University Press, 1997.
13 James, A.J. “Institutional Challenges for Water Resource management: India and South Africa.” Water, Households and Rural Livelihoods: July 2003. [Online]. Availabe: http://www.nri.org/WSS-IWRM/Reports/Working_papers/WHIRL%20working%20paper%207_final.pdf [2006, May 1].
14 Government of India. Ministry of Water Resources. Annual Report 2001 – 2002. New Delhi: 2002.

35
Government of India. Ministry of Rural Development. Annual Report 2001 – 2002. New Delhi: 2002. Government of India. Ministry of Agriculture and Cooperation. Annual Report 2001
– 2002. New Delhi: 2002.
Government of India. Ministry of Environment and Forests. Annual Report 2001 – 2002. New Delhi: 2002.
15 Government of India. National Academy of Agricultural Sciences. Emerging Issues
in Water Management- The Question of Ownership. Policy Paper 32. New Delhi: 2005.
16 James, A.J. “Institutional Challenges for Water Resource management: India and
South Africa.” Water, Households and Rural Livelihoods: July 2003. [Online]. Available: http://www.nri.org/WSS- IWRM/Reports/Working_papers/WHIRL%20working%20paper%207_final.pdf [2006, Oct. 21]. 17 Government of India. National Academy of Agricultural Sciences. Emerging Issues in
Water Management- The Question of Ownership. Policy Paper 32. New Delhi: 2005.
18 Bandyopadhyay, J. and Perveen, S.(2006). A Scutiny of the Justifications for the
Proposed Inter-linking of Rivers in India. In Alagh, Y.K., Pangare, G., & Gujja, B. (Eds.), Interlinking of Rivers in India: Overview and Ken-Betwa Link (23-52). New Delhi: Academic Foundation.
19 Shukla, A.C. and Asthana, V.(2005). Anatomy of Interlinking Rivers in India: A
Decisions in Doubt. [Online]. Available: http://www.ideals.uiuc.edu/bitstream/2142/42/1/Shukla-AsthanaOP.pdf [2006, Oct. 13].
20 Shukla et al. 2005. 21Singh, Arun Kumar.(2003) Inter-linking of Rivers in India: A Preliminary Assessment.
New Delhi, India. 22 Singh, 2003. 23 Singh, 2003. 24 Singh, 2003.

36
25 Shukla, A.C. and Asthana, V.(2005). Anatomy of Interlinking Rivers in India: A
Decisions in Doubt. [Online]. Available: http://www.ideals.uiuc.edu/bitstream/2142/42/1/Shukla-AsthanaOP.pdf [2006, Oct. 13].
26 Shukla et al. 2005.
27 National Water Development Agency (NWDA) (2007). National Water Development
Agency. [Online]. Available: http://nwda.gov.in/indexab.asp?langid=1 [2007 March 16].
28 National Water Development Agency (NWDA) (2007). 29 National Water Development Agency (NWDA) (2007). 30 The Government of India, Ministry of Water Resources has considered it necessary that the scientific development of water resources should be taken up considering river basin/ sub-basin as a unit. Maximising the availability of utilisable water may involve transfer of water from surplus basin to water-short basin in the overall interest of the country, to give much needed relief and distribute the benefits more evenly. Integrated development of water resources of both surface and ground water, can optimise benefits resulting in economical use of the available water. 31 Shankari, U (Ed.). (2004). Interlinking Rivers: Contradictions and Confrontations.
New Delhi, India: Systems Visions. 32 Bandyopadhyay, J. and Perveen, S.(2006). A Scutiny of the Justifications for the
Proposed Inter-linking of Rivers in India. In Alagh, Y.K., Pangare, G., & Gujja, B. (Eds.), Interlinking of Rivers in India: Overview and Ken-Betwa Link (23-52). New Delhi: Academic Foundation.
33 Bandyopadhyay et al. 2006. A crore is a unit in the Indian numbering system equal to 100 lakhs or 10 million (107). 34 Navdanya. River Interlinking Plan. [Online]. Available:
http://www.navdanya.org/earthdcracy/water/riverlinking-intro.htm [2007 April 4]. 35 Navdanya. 36 Government of India. Ministry of Water Resources. National Water Policy. New
Delhi: April 2002. 37 Shankari, 2004.

37
38 National Water Development Agency (NWDA) (2006). Terms of Reference for
Preparation of the Detailed Project Report: Interlinking of Rivers. [Online]. Available: http://nwda.gov.in/writereaddata/linkimages/9.pdf [2007 March 15].
39 National Water Development Agency (NWDA) (2006). Benefits of National
Perspective Plan. [Online]. Available: http://nwda.gov.in/index2.asp?sublinkid=49&langid=1 [2007, Jan. 13].
40 NWDA, 2006. 41 Rivers for Life. Interlinking of India’s Rivers: The Story So Far. [Online]. Available:
http://studentorgs.utexas.edu/aidaustin/water/interlinking-rivers.pdf. [2006, Dec. 15]
42 Rivers for Life. 43 Singh, Arun Kumar.(2003) Inter-linking of Rivers in India: A Preliminary Assessment.
New Delhi, India. 44 President Abdul Kalam’s Independence Address (August, 2005). Speech
posted on The Hindu, online edition of India’s National Newspaper. [Online]. Available: http://www.hinduonnet.com/thehindu/nic/presidentiday.htm [2006, Oct. 1].
45 Prime Minister Mr. Atal Bihari Vajpayee (February, 2003). Speech at the ‘Freshwater
Year-2003’ at Vighyan Bhawan posted on the Sustainable Development Networking Programme Bangladesh. [Online]. Available: http://www.sdnpbd.org/river_basin/whatis/pm_india.htm [2006, Oct. 1].
46 Shankari, U (Ed.). (2004). Interlinking Rivers: Contradictions and Confrontations.
New Delhi, India: Systems Visions. 47 Shankari, 2004. 48 Shankari, 2004. 49 Thakkar, H. (2005). Ken Betwa Link: Why it won’t click. New Delhi, India.[Online].
http://www.sandrp.in/riverlinking/knbtwalink.pdf [2005, Nov. 25]. 50 National Water Development Agency. “Ken-Betwa Link Project Feasibility Report.” < http://nwda.gov.in/index3.asp?sublink2id=23?>
“Ken-Betwa Link, the Litmus Test.” The Hindu, Online Edition. August 29, 2005. Editorial Section. December 15, 2006. [Online]. Available:

38
http://www.hindu.com/2005/08/29/ stories/2005082902561000.htm [2006, Nov. 1].
52 Boojh, Ram. Presentation on KBLP. University of Michigan. Ann Arbor, MI. October 25, 2005. 53 National Water Development Agency. “Ken-Betwa Link Project Feasibility Report.”
[Online]. Available: http://nwda.gov.in/index3.asp?sublink2id=23? [2006, Aug. 31].
54 Thakkar, Himanshu. “Re: Questions about the KBLP DPR.” Email to author. 9 January 2007. 55 A lakh is a unit in the Indian numbering system, widely used both in official and other contexts. One lakh is equal to a hundred thousand (105). 56 A crore is a unit in the Indian numbering system equal to 100 lakhs or 10 million (107). 57 Alagh, Yoginder K, Ganesh Pangare and Biksham Gujja, eds. Interlinking Rivers in India: Overview and Ken-Betwa Link. Delhi: Academic Foundation, 2006. 58 Singh, Shyamendra. Personal interview. 25 May 2006. 59 Government of Madhya Pradesh. Conservator of Forests and the Field Director, Panna
Tiger Reserve. Panna Tiger Reserve. New Delhi, 2002. 60 Prakash, Bharatendu et al. Problems and Potentials of Bundelkhand with Special
Reference to Water Resource Base. Delhi: Center for Rural Development and Technology, 1998.
61 National Water Development Agency. “Ken-Betwa Link Project Feasibility Report.”
[Online]. Available: http://nwda.gov.in/index3.asp?sublink2id=23? [2006, Aug. 31].
62 Prakash, Bharatendu et al. Problems and Potentials of Bundelkhand with Special
Reference to Water Resource Base. Delhi: Center for Rural Development and Technology, 1998.
63 National Water Development Agency. “Ken-Betwa Link Project Feasibility Report.”
[Online]. Available: http://nwda.gov.in/index3.asp?sublink2id=23? [2006, Aug. 31].
64 Alagh, Yoginder K, Ganesh Pangare and Biksham Gujja, eds. Interlinking Rivers in
India: Overview and Ken-Betwa Link. Delhi: Academic Foundation, 2006.

39
65 National Water Development Agency. “Ken-Betwa Link Project Feasibility Report.”
[Online]. Available: http://nwda.gov.in/index3.asp?sublink2id=23? [2006, Aug. 31].
66 Alagh, Yoginder K, Ganesh Pangare and Biksham Gujja, eds. Interlinking Rivers in
India: Overview and Ken-Betwa Link. Delhi: Academic Foundation, 2006. 67 Government of Madhya Pradesh. “The Madhya Pradesh Development Report 2002.” [Online].
Available:http://www.mp.nic.in/difmp/MPHDR2002_Book_English.pdf [2006, May 5].
68 Government of Uttar Pradesh. District Statistics. Government of Madhya Pradesh. “The Madhya Pradesh Development Report 2002.” [Online]. Available:
http://www.upgov.nic.in/> [2007, March 3]. Prakash, Bharatendu et al. Problems and Potentials of Bundelkhand with Special
Reference to Water Resource Base. Delhi: Center for Rural Development and Technology, 1998.
69 Dang, Himraj. “River Inter-linking: Robbing Banda to Pay Hamir.” Terragreen 3
(July – September 2006): 60 – 62. 70 Alagh, Yoginder K, Ganesh Pangare and Biksham Gujja, eds. Interlinking Rivers in
India: Overview and Ken-Betwa Link. Delhi: Academic Foundation, 2006. 71 Thakkar, Himanshu. Personal Interview. 6 June 2006. 72 Sabha, Rajya. “Disagreements of River-Linking Project.” Press Information Bureau. Government of India, Ministry of Water Resources. [Online]. Available: http://pib.nic.in/release/release.asp?relid=23488[2006, Dec. 16] 73 Dang, Himraj. “River Inter-linking: Robbing Banda to Pay Hamir.” Terragreen 3
(July – September 2006): 60 – 62. 74 Alagh et al. 2006.
40
CHAPTER 2: Potential Hydrologic Impacts
Introduction
The growing global scarcity of water is fast becoming a major social and
economic crisis and generating resource development projects such as the Ken-Betwa
Link Project (KBLP) in India. The KBLP involves connecting the Ken and Betwa rivers
through the creation of a dam, reservoir, and canal to provide storage for excess rainfall
during the monsoon season in the upper Ken basin and deliver this water for consumption
and irrigation purposes to the upper Betwa basin.1
While the KBLP might provide benefits by developing water resources, it is
equally important to consider the potentially negative environmental impacts, including
those that could have long-term consequences. There are many well documented
examples of such unanticipated environmental consequences associated with dams
including loss of habitat, changes in downstream morphology (increased erosion),
changes in downstream water quality, and the reduction of biodiversity.2 In addition,
potential negative impacts result from the pattern of dam operation including changes in
downstream hydrology such as alterations in total and seasonal flows or extreme high and
low flows. While these impacts might not initially seem serious, elimination or alteration
of natural floods can frequently lead to a reduction in the larger floodplain habitat
diversity.3 Though construction of dams has been a prevalent water management strategy
in India, 4 public opposition to the IRL indicates that large dam projects like the KBLP
will face tougher scrutiny in future water development plans.
In this section of the report we examined the potential environmental impacts of
the KBLP, specifically discussing potential hydrologic impacts using Geographic
Information Systems (GIS) analysis. This study not only attempted to provide meaningful
evaluation of the current state of the KBLP area and its vulnerability to potential
hydrologic impacts, but also examined viable alternative methods of securing water
resources for the area while minimizing the impact to the natural environment.
The struggle to find and access relevant data was a reoccurring experience
throughout this research project. Due to the remote nature of the project area, pertinent
data had either not been collected or was very difficult to acquire. A major component of
this section therefore, includes the development of GIS data used for the basic analysis,

41
and is available for our Indian clients to conduct any further analysis which may be
needed.
The GIS developed in this project was used for further analysis to identify areas
within the Ken and Betwa watersheds that are at risk of being impacted by the KBLP by
assessing environmental factors that indicate vulnerability to hydrologic change. High-
risk areas were identified based on vulnerability and mapped. It is hoped that this
information will enable NGO’s, local communities, and other stakeholders to visualize
and understand in the future how environmental impacts are spatially distributed
throughout the area.
Methods
Description of Project Area
The project area is located in central India in an area known as the Bundelkhand
Region, which lies between 23°10′ and 26°27′N Latitude and 78°4′ and 81°34′E
Longitude and comprises seven districts in the state of Uttar Pradesh and six districts in
the state of Madhya Pradesh.5 The Ken and Betwa watersheds are located primarily in
north-central Madhya Pradesh and also encompass an area of south-central Uttar Pradesh.
(Figure 1)
The majority of construction for the KBLP will take place in the Ken watershed,
in two districts in Madhya Pradesh: the Panna and Chhattarpur districts. In this study, the
extent of GIS analysis was on the area the intersection of the Panna and Chhattarpur
districts and Ken and Betwa watersheds, an area primarily within the Ken River
watershed, approximately 14, 500 square kilometers. (Figure 2)
The Ken River watershed is bounded by the Vindhyan ranges in the south, the
Betwa Basin in the west, free catchment area of the Yamuna River in the east and the
Yamuna River itself to the north. The Ken Basin is characterized by very undulating
terrain with isolated steeply sloping hills and ridges. This can be visualized from the
Digital Elevation Model (DEM) clipped to the extent of the analysis. (Figure 3)

42
The soils of the basin have been broadly grouped into five categories by the
National Bureau of Soil Survey and Land Use Planning (under Indian Council for
Agricultural Reseach).
Category % area in the
Ken sub-basin I Soil on hills and hill ridges (Entisols) 7.3 II Plateau soils (Entisols, Inceptisols, and Alfisols) 44.0 III Pediment soils (Entisols and Alfisols) 2.1 IV Soils of level alluvial plain and undulating flood plain
(Inceptisols and Vertisols) 43.6
V Soils of dissected flood plain (Inceptisols) 3.0
Table 1: Soil Categories of the Ken Basin as reported in the Ken-Betwa Link Feasibility Report.
The climate of the basin is mainly semi-arid to dry sub-humid. The area is mostly dry
except in monsoon season, from June to October, when about 91.5% of the total annual
rainfall occurs.6 Average annual rainfall of the Ken basin up to the proposed dam site is
1174.07 mm. Entire drainage of the area is from south/southwest to north/northeast. The
watershed area of the Ken basin up to the proposed dam site is reported at 19534 km2,
which is 69.62% of the total basin area.7
Approach to Assessing Impacts
The Feasibility Report (FR) for the KBLP released by the Indian government,
provided a very basic description of current hydrological conditions and dedicated only
one chapter to addressing environmental aspects of the project.
The hydrologic conditions considered in designing a dam and canal complex cited
in the report included rainfall, water quantity, sedimentation rates, and sediment
distribution.. In some areas of the report, specifically Chapter 4: Surveys and
Investigations, some data sources were identified. Elsewhere in the report, data collection
was generally completed by other government departments and dates from 1901 to 1994.
There was little explanation of data collection methodology or overall data reliability,
making it difficult to assess the accuracy of the FR’s statements.
The FR cited environmental benefits of long-term flood control measures and
increased production of fish from the creation of the reservoir and addressed some

43
potential environmental impacts to wildlife, seismic, or the regional climate. However,
these impacts were generally dismissed with little to no supportive evidence.
Interestingly, nothing in the report directly addressed impacts on water quality. Instead,
they must be inferred from descriptions on impacts on fish habitats and sedimentation. In
terms of hydrologic impacts, though the FR noted that the ground water table was
expected to rise due to the impoundment and submerged area, it provided no data to
support how this change in water distribution would impact the area. The FR also
described calculations for sedimentation estimations and indicated measures would be
taken to minimize sedimentation, but again provided no detail of what these measures
would be nor from what the sources data for these calculations come.
There were clearly going to be difficulties assessing the appropriateness of the
KBLP based solely on the Feasibility Report, And unfortunately, quantitative data such
as stream flow data, was either unavailable to the public or, like ground water data, did
not exist. Our study therefore, utilized readily available data for use in GIS to
characterize the current environmental conditions of the area and assess the area’s
vulnerability to potential hydrologic impacts resulting from the construction of the
KBLP.
First, topographic characteristics, watershed boundaries, and high flow
accumulation areas were derived from a Digital Elevation Model (DEM). Secondly, land
cover was classified from Landsat 7 ETM+ imagery. Finally, with the inclusion of soils
data obtained for two districts within the project area, this study identified specific
localities that were at risk of being impacted by the KBLP in three potential areas of
vulnerability: erosion, inundation, and surface water quality degradation. Weighted
Linear Combination8 was used to assess vulnerability based on criteria derived from this
data, specifically, proximity to surface water, elevation, slope, proximity to developed
land cover, and erosion and drainage characteristics of soil type. The analysis resulted in
maps illustrating the spatial distribution of vulnerability to the three potential impacts,
and from this assessment, high-risk areas were identified.
Data Development
A Shuttle Radar Topography Mission (SRTM) 90 meter Digital Elevation Model
(DEM) of the project area was obtained from an online data source.9 The DEM was used

44
to provide information about the topographic characteristics of the project site, including
watershed boundaries and high flow accumulation areas. The Hydrology tool in ESRI
ArcGIS software10 aided in filling in elevation pits in the DEM and flow direction and
accumulation were then calculated. Based on this output, pour points were defined at the
confluences of the Ken and Betwa with the Yamuna River, thus resulting in the
delineation of watershed boundaries. (Figure 4)
Secondly, land cover was classified from the Landsat 7 ETM+ imagery that was
downloaded from a data website.11 Using the standard worldwide reference system index
of orbits (P/paths) and scene centers (R/rows), six path/rows for the project area were
identified: P144, R42-44 and P154, R42-44. All steps in the land cover classification
process were completed using ERDAS IMAGINE 8.7 software.12 Imagery bands were
combined using the Stack Layers function. Scenes were merged together based on dates
on the imagery using the Image Mosaic tool (Table 2). Imagery was clipped using the
Modeler tool with the watershed boundaries created in the previous step set as the Area
of Interest (AOI). (Figure 5)
Path/Row Scenes Date of Image
P145, R42-44 10/01/2000
P144, R42 and R43 11/11/2000
P144, R44 12/29/2000
Table 2: Landsat 7 ETM+ Path/Row Scenes and Corresponding Image Dates Identifies imagery scenes located within Ken and Betwa watershed boundaries and the dates those images were captured by Landsat satellites.

45
Following this step, a 50 class unsupervised classification was run on the three
scenes. Each of the 50 classes was evaluated and defined as one of six land cover classes:
water, forested, vegetated, agriculture, bare soil, or developed. Due to its accessibility,
GoogleEarth was used as a resource for validation.
This method of validation had merits and disadvantages. While GoogleEarth
provided an easy to use and cost-effective reference for land cover validation, there was
inconsistency in the sources and resolution of scenes which resulted in some land cover
within the project area to be identified very easily and others very difficult. In areas
where GoogleEarth scenes had a higher resolution it might have made more sense to run
an unsupervised classification with more than 50 classes in an effort to identify land
cover with more detail. However, in areas where there was not high resolution imagery,
this step would make classification more difficult. Accuracy of land cover classification
was therefore somewhat compromised because the Landsat path/rows within the project
area did not correspond with the GoogleEarth scenes in a way that would accommodate a
more detailed classification.
The water land cover class included rivers, lakes, and reservoirs. Due to seasonal
variability in water quantity, some areas that were submerged during monsoon season
may not have been present on the date the images were taken and therefore not identified
as water in the classification. The characteristics of forested areas also changed
dramatically depending on season. Areas that can be identified as forested during other
times of the year may not have been included in this classification. The vegetated
classification represented mixed agriculture, patchy forest, grass, pasture or shrub areas
that could not be identified in more detail. The agriculture classification included crops,
tilled bare soil used for agricultural purposes, or pasture areas for grazing.
Characteristics of the bare soil classification resulted in the inclusion of roads or very
low-density development not otherwise identified in more detail. Additionally, there
were areas of stripped land that were included in the bare soil class. Lastly, the
developed classification was qualified because generally development in the project area
was low density and a s a result, areas of bare soil were also probably included in the
developed class.
46
Finally, a soils layer for the Panna and Chhattarpur districts was acquired from the
Environmental Information Centre (EIC), a department of the Indian Government’s
Ministry of Environment and Forests. The soils layer was clipped to the extent of the
watersheds layer. The DEM and land cover layer were clipped to the new extent of the
soil layer and all further analysis was conducted in this extent. This was done in ArcGIS
using the spatial analyst function, setting an analysis mask to the desired extent layer and
multiplying the grid to be clipped by one in Raster Calculator. The resulting analysis
extent was comprised of the area of the Panna and Chhattarpur districts that fell within
the Ken and Betwa watersheds derived from the DEM in the previous step. (Figure 2)
Data Analysis
The Multi-Criteria Evaluation (MCE) is a method of GIS analysis that can
provide decision support and is commonly used in determining the suitability of sites for
a specific purpose. The weighted linear combination approach was utilized in this
evaluation of the vulnerability of sites to impacts that would result from the KBLP. With
a weighted linear combination, vulnerability to potential impacts was determined by
applying a weight to each of the contributing criteria followed by a summation of the
results to yield a vulnerability map: i.e.,
V=∑wixi
where V is vulnerability, wi is the weight of the criteria, and xi is the criterion score for
impact i. 13 Specific terrain, soil, and land cover characteristics derived from the data
were used as the criteria to create a vulnerability value for three impact factors:
inundation, erosion, and surface water quality degradation.
Eastman et al. established five steps for the weighted linear combination
approach.14
1. Select and map criteria. Table 3 identifies the environmental characteristics that were
used as criteria for mapping the vulnerability of the three impacts and arguments of
justification for these relationships. These criteria were chosen based on literature
reviews of landscape impacts of dams, concerns addressed in published critiques of the
project, and their ability to assessed using available GIS data. While the collection and
creation of necessary data has already been described, the processing of the data for use
in analysis will be explained later is this section.

47
Potential Impact Criteria Inundation Erosion Surface Water
Quality
Justification15,16,17
Distance to surface water
- Negative
-Negative
Determines how much movement is required to get the water into/out of surface water bodies
Distance to developed land cover
- Negative Determines how much movement is required in the transport of runoff pollutants
Elevation - Negative Determines movement of water into/out of surface water bodies
Slope
- Negative +Positive Determines water flow, flooding, erosion, soil depth, travel cost, and geology
Plan Curvature + Positive Determines topographic convergence (high values) and divergence (low values)
Profile Curvature - Negative Determines rate of change of the potential gradient which contributes to flow velocity and sediment transport (negative values indicate accelerated flow)
Drainage characteristics of soil
-Negative -Negative Determines the capacity of water to move through soil. Used as a surrogate for permeability.
Erosion characteristics of soil
+Positive +Positive Determines erodibility of soil surface.
Table 3: Vulnerability Impacts and Criteria. In the table above, the indicator + (Positive) means that as the values of the criteria increase, the vulnerability to a particular impact increases as well. The indicator - (Negative) means that as the value of the criteria increases, vulnerability to a particular impact will decease.

48
2. Standardize criteria scores. This step was necessary to ensure all contributing criteria
are measured in a common unit. All criteria were scored relative to their contribution to
hydrologic vulnerability from lowest to highest using a linear stretch to put them all in
the range of 0-100.
3. Establish weights for each criterion. A variety of techniques exists for establishing
criteria weights. In this study, weights were derived by completing a pair-wise
comparison matrix between the criteria and then calculating the weights in each column
and then averaging over all columns. This procedure gives an approximation of what the
weights should be, but adjustments were made in order to sum the weights to one, which
is required in a weighted linear combination. An example of the continuous rating scale
used for the pair-wise comparison of factors is provided in the table below.
1/9 1/7 1/5 1/3 1 3 5 7 9
extremely very strongly moderately equally moderately strongly very extremely less important more important
Table 4: Rating Scale Used for the Pair-wise Comparison Matrix
4. Evaluate by calculating composite suitability. In this step, the vulnerability equation
above was calculated using Raster Calculator in ArcGIS.
5. Apply choice function or heuristic. After the calculation is complete, the resulting
map had a range of values 0-100, matching that of the standardized criteria used for
input. A high value indicated a high vulnerability to impacts, low values indicated low
vulnerability. Decision makers, NGO’s, and other stakeholders could now determine
how to prioritize areas further if desired.
The land cover layer was reclassified to mask out and create separate layers for
the water, agriculture, and developed land covers. The Euclidean Distance tool in ArcGIS
was used to calculate each cells distance to cells classified as the land cover of interest.
The values of this output were then rescaled to ensure values were within the range of 0-
100 and then inverted so that high values indicated close proximity to the land cover of
interest. This was done to represent the criteria as having a negative relationship to both

49
inundation and surface water quality impacts. For example, distance to surface water
determined how much movement was required to get water into or out of water bodies.
As distance to surface water increased, the vulnerability to an impact such as inundation
decreased. Therefore, it was necessary to invert values to ensure that high values
represented areas close to water bodies, since these areas would be more vulnerable. 18
Elevation, slope, plan curvature, and profile curvature values were extracted from
the DEM using the Surface Analyst tools in ArcGIS and rescaled to the 0-100 range.
DEM values were inverted so that low elevations would have high vulnerability to
inundation. The slope values were used in one application, as scaled, so high values of
slope were contributing criteria to erosion vulnerability. In another application, slope
values were inverted so that low slope was a contributing factor to inundation
vulnerability.
Plan curvature was included as a contributing factor to inundation. Values were
used as scaled because a positive or high value for plan curvature indicated topographic
convergence and therefore high vulnerability to inundation. However, values of profile
curvature were inverted because a negative or low value indicated accelerated flow and
therefore high vulnerability to erosion.19
Erosion characteristics were provided as part of the data attributes in the soil
description field for each soil category. Based on the descriptions, erosion was
designated into three categories: slight, moderate, and severe. In order to incorporate
these values into the weighted average index, these categories were given numerical
values 25, 50, and 75 respectively to ensure they fit into the 0-100 range. A high value
indicates a higher tendency for erosion and therefore higher contribution to vulnerability
of erosion and surface water quality degradation.20
Permeability was determined by drainage characteristics that were provided as
part of the data attributes in the soils description field for each soil category. For
example, one soil type classified as moderately drained was described as “Deep,
moderately drained, calcareous, clayey soils on gently sloping flood plain with moderate
erosion.” Based on the descriptions and corresponding taxonomies, three categories of
drainage were determined: excessively drained, well drained, and moderately drained.
As described, soils were characterized in a descending degree of permeability. However,

50
these categories were given ascending numerical values 25, 50, and 75 respectively. This
ensured a high value would indicate a lower level of permeability and therefore a higher
runoff rate and increased the vulnerability of an area to erosion or surface water quality
degradation.21
It should be noted that high permeability values also indicated higher infiltration
of surface water to groundwater, which can be positive for increasing the water table and
storage of water in the ground for future use.22 With no reliable information on current
groundwater availability, groundwater movement, and the location of aquifers it was
difficult to determine if higher infiltration rates indicated a positive impact to the
hydrologic environment.
Using the Raster Calculator tool in ArcGIS, the criteria were weighted and
combined to create a vulnerability map for each of the three impacts as listed in Table 5.
An example of the pair-wise comparison matrix for inundation is provided in Table 6.
Weights were approximated by calculating the weights with each column in the matrix
and then averaging over all columns. Specifically this is achieved by first dividing each
of the entries in the first column of the matrix by the sum of the first column and then
repeating this for each column and averaging the weights. Because the contributing
criteria were compared similarly for each impact, the same weights were determined and
applied for all impact combinations.
Vulnerability to inundation was a combination of the scaled factors distance to
surface water (inverted), elevation (inverted), slope (inverted), and plan curvature.
Vulnerability to erosion was a combination of the scaled factors slope, profile curvature
(inverted), soil drainage (inverted), and soil erosion. Finally, vulnerability to surface
water quality degradation was a combination of distance to surface water (inverted),
distance to developed land cover (inverted), soil drainage (inverted), and soil erosion.

51
Weight Inundation Erosion Water Quality High = .4 Elevation Soil Erosion Distance to Water Medium = .3 Distance to Water Slope Soil Drainage Medium = .2 Plan Curvature Profile Curvature Distance to Developed Low = .1 Slope Soil Drainage Soil Erosion
Table 5: Criterion Weights Used for Impact Vulnerability Maps Outlines the different weight combinations used in the Weighted Linear Combination. Inundation Elevation DistWat PlanCurv Slop-Neg Elevation 1 DistWat 1/3 1 PlanCurv 1/5 1/3 1 Slope-Neg 1/7 1/5 1/3 1
Table 6: Pair-wise Comparison Matrix Example for Inundation Vulnerability
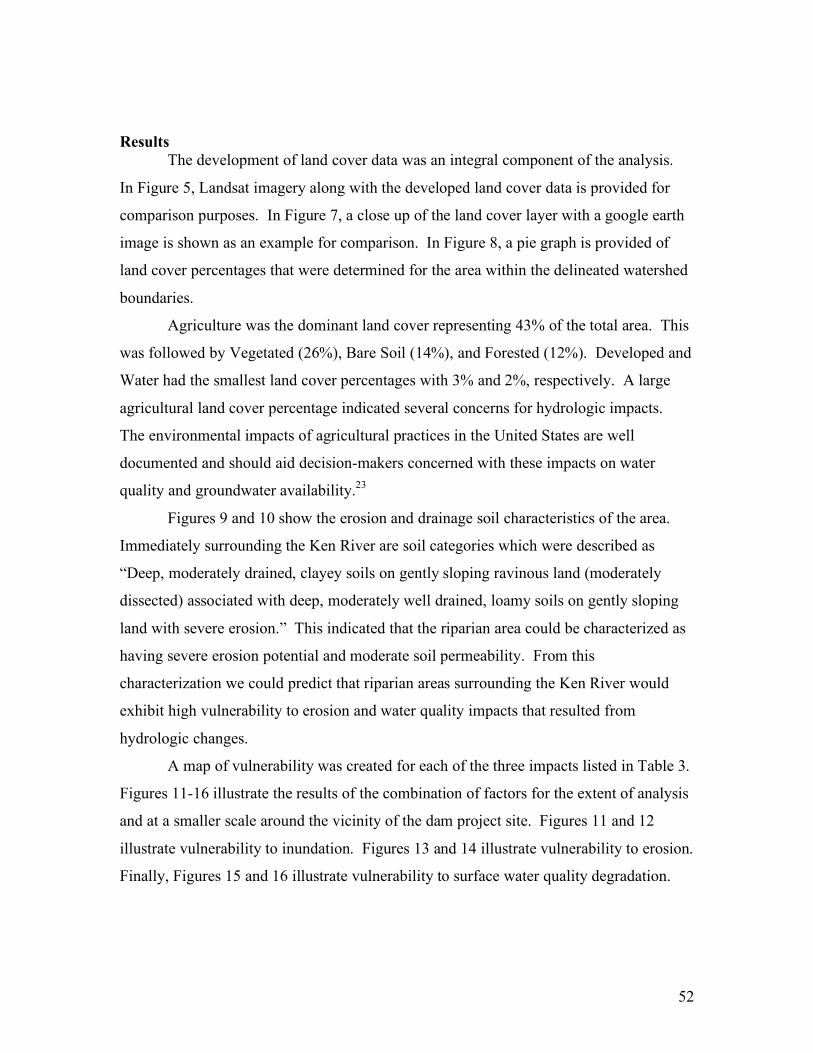
52
Results The development of land cover data was an integral component of the analysis.
In Figure 5, Landsat imagery along with the developed land cover data is provided for
comparison purposes. In Figure 7, a close up of the land cover layer with a google earth
image is shown as an example for comparison. In Figure 8, a pie graph is provided of
land cover percentages that were determined for the area within the delineated watershed
boundaries.
Agriculture was the dominant land cover representing 43% of the total area. This
was followed by Vegetated (26%), Bare Soil (14%), and Forested (12%). Developed and
Water had the smallest land cover percentages with 3% and 2%, respectively. A large
agricultural land cover percentage indicated several concerns for hydrologic impacts.
The environmental impacts of agricultural practices in the United States are well
documented and should aid decision-makers concerned with these impacts on water
quality and groundwater availability.23
Figures 9 and 10 show the erosion and drainage soil characteristics of the area.
Immediately surrounding the Ken River are soil categories which were described as
“Deep, moderately drained, clayey soils on gently sloping ravinous land (moderately
dissected) associated with deep, moderately well drained, loamy soils on gently sloping
land with severe erosion.” This indicated that the riparian area could be characterized as
having severe erosion potential and moderate soil permeability. From this
characterization we could predict that riparian areas surrounding the Ken River would
exhibit high vulnerability to erosion and water quality impacts that resulted from
hydrologic changes.
A map of vulnerability was created for each of the three impacts listed in Table 3.
Figures 11-16 illustrate the results of the combination of factors for the extent of analysis
and at a smaller scale around the vicinity of the dam project site. Figures 11 and 12
illustrate vulnerability to inundation. Figures 13 and 14 illustrate vulnerability to erosion.
Finally, Figures 15 and 16 illustrate vulnerability to surface water quality degradation.

53
Figure 1 Ken and Betwa Watersheds Watershed boundaries were derived from SRTM 90m DEM

54
Figure 2 Analysis Extent The green area indicates the extent of the area used for analysis, specifically the intersection of the Ken and Betwa watersheds (blue) and the Panna and Chhatarpur Districts in Madhya Pradesh (yellow).

55
Figure 3: DEM clip SRTM 90m DEM acquired through an online GIS distributor and clipped to the extent of analysis.

56
Figure 4 Watershed, Streams, and Pour Points Delineated from the DEM
Figure 5 Landsat Mosaic and Clip Landsat Sceenes are mosaiced and clipped to the watershed boundary layer.

57
Figure 6: Land Cover Classification Comparison Side by side comparison of Landsat image and result of the land cover classification.
Figure 7: Land cover with Google Earth Imagery Validation
Side by side comparisons of land cover classification results and Google Earth Imagery
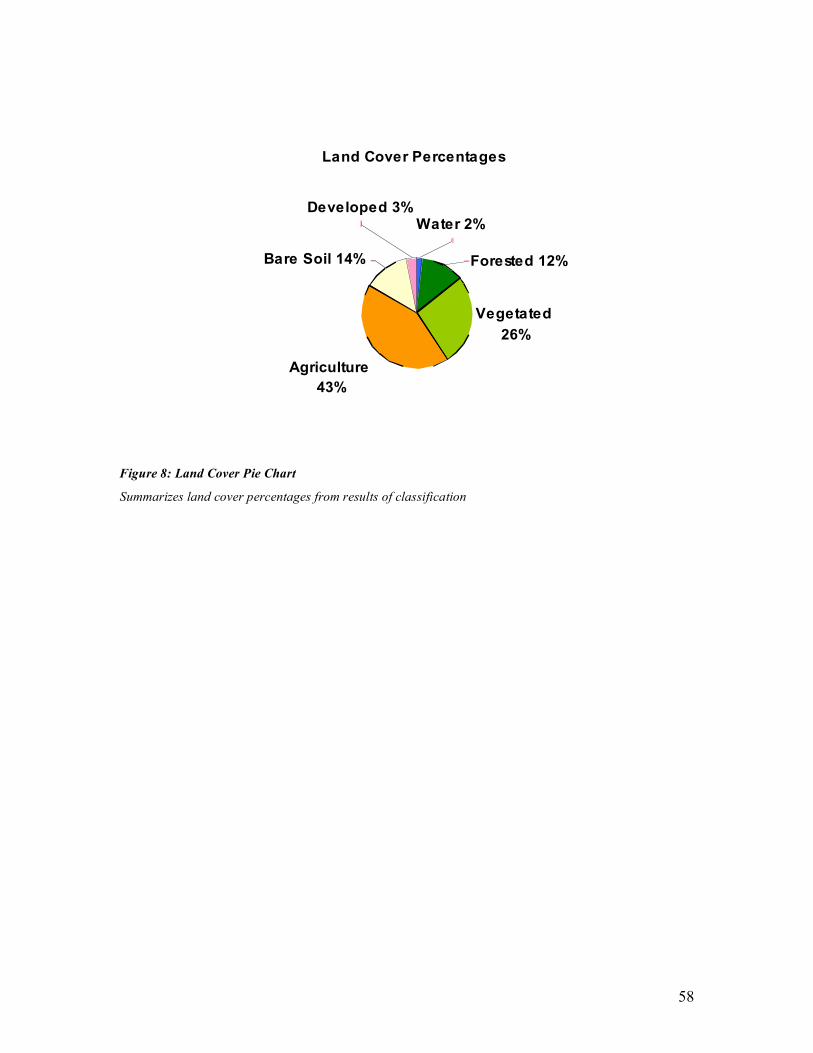
58
Land Cover Percentages
Vegetated
26%
Agriculture
43%
Developed 3%
Bare Soil 14% Forested 12%
Water 2%
Figure 8: Land Cover Pie Chart
Summarizes land cover percentages from results of classification
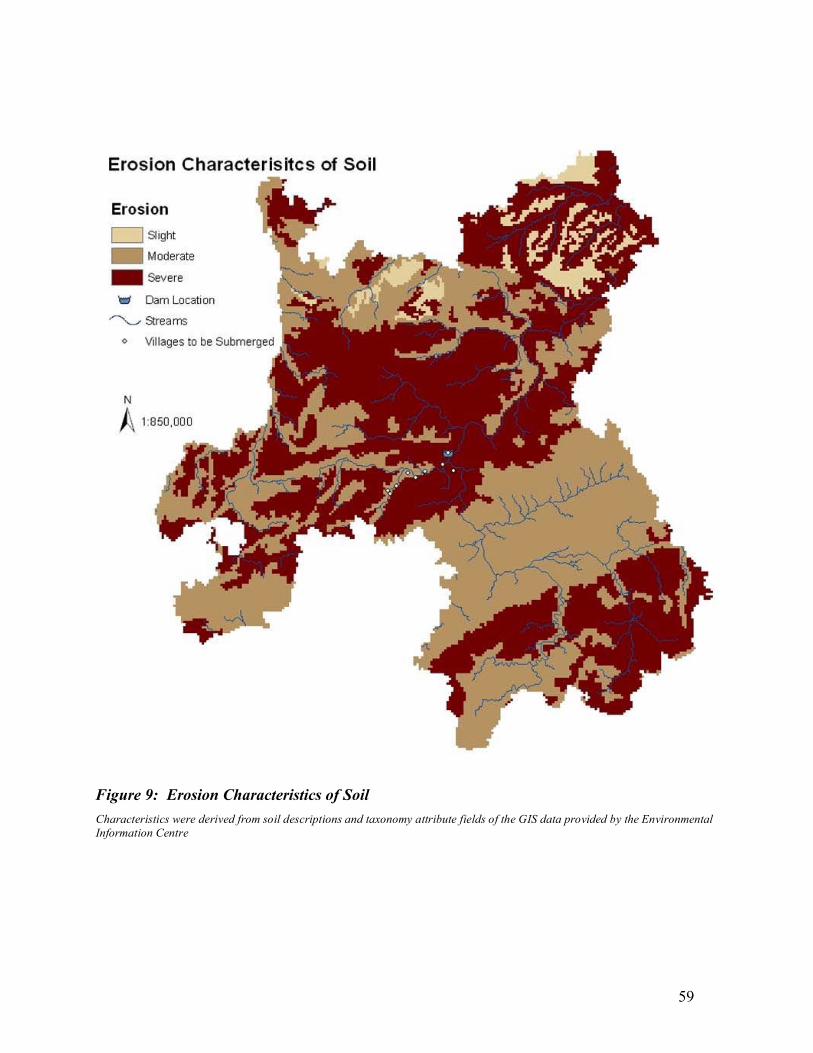
59
Figure 9: Erosion Characteristics of Soil Characteristics were derived from soil descriptions and taxonomy attribute fields of the GIS data provided by the Environmental Information Centre

60
Figure 10: Drainage Characteristics of Soil Characteristics were derived from soil descriptions and taxonomy attribute fields of the GIS data provided by the Environmental Information Centre

61
Figure 11: Results for Inundation Combination

62
Figure 12: Results for Inundation Combination, closer view of project site

63
Figure 13: Results for Erosion Combination

64
Figure 14: Results for Erosion Combination, closer view of project site

65
Figure 15: Results of Water Quality Degradation Combination

66
Figure 16: Results of Water Quality Degradation Combination, a closer view of project site
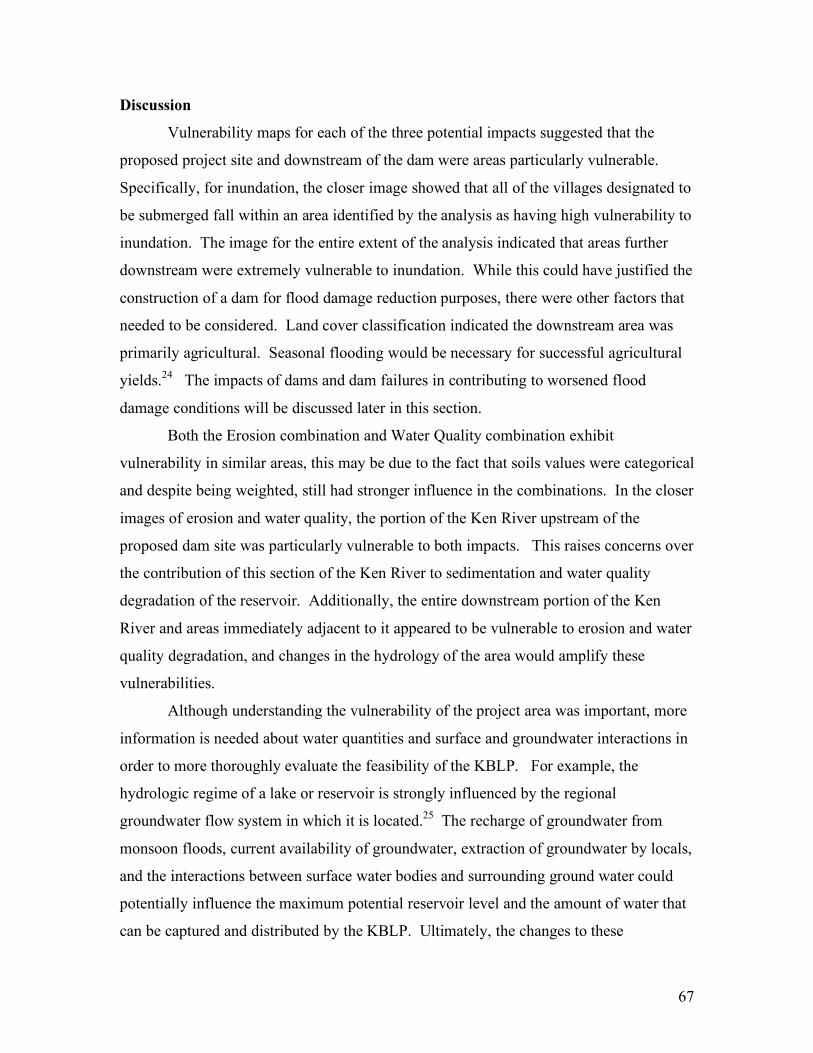
67
Discussion
Vulnerability maps for each of the three potential impacts suggested that the
proposed project site and downstream of the dam were areas particularly vulnerable.
Specifically, for inundation, the closer image showed that all of the villages designated to
be submerged fall within an area identified by the analysis as having high vulnerability to
inundation. The image for the entire extent of the analysis indicated that areas further
downstream were extremely vulnerable to inundation. While this could have justified the
construction of a dam for flood damage reduction purposes, there were other factors that
needed to be considered. Land cover classification indicated the downstream area was
primarily agricultural. Seasonal flooding would be necessary for successful agricultural
yields.24 The impacts of dams and dam failures in contributing to worsened flood
damage conditions will be discussed later in this section.
Both the Erosion combination and Water Quality combination exhibit
vulnerability in similar areas, this may be due to the fact that soils values were categorical
and despite being weighted, still had stronger influence in the combinations. In the closer
images of erosion and water quality, the portion of the Ken River upstream of the
proposed dam site was particularly vulnerable to both impacts. This raises concerns over
the contribution of this section of the Ken River to sedimentation and water quality
degradation of the reservoir. Additionally, the entire downstream portion of the Ken
River and areas immediately adjacent to it appeared to be vulnerable to erosion and water
quality degradation, and changes in the hydrology of the area would amplify these
vulnerabilities.
Although understanding the vulnerability of the project area was important, more
information is needed about water quantities and surface and groundwater interactions in
order to more thoroughly evaluate the feasibility of the KBLP. For example, the
hydrologic regime of a lake or reservoir is strongly influenced by the regional
groundwater flow system in which it is located.25 The recharge of groundwater from
monsoon floods, current availability of groundwater, extraction of groundwater by locals,
and the interactions between surface water bodies and surrounding ground water could
potentially influence the maximum potential reservoir level and the amount of water that
can be captured and distributed by the KBLP. Ultimately, the changes to these

68
interactions by the construction of a dam and reservoir will also impact the
groundwater/surface water interaction in areas upstream and downstream of the dam.
The results indicated that it is important to collect more current data on the
availability, location, and movement of groundwater in the project area in order to take
this analysis further. A thorough understanding of current conditions could help
determine appropriateness of KBLP and could provide more information for anticipating
hydrologic changes that will result from the construction of such a project.
Much research has documented the general environmental impacts of dams, the
effects of which are immediate and obvious. Most obviously, dams obstruct migration
pathways for fish and reservoirs trap sediment. But many effects are more subtle, and the
exact nature, magnitude and timing are often unpredictable. While many dams like the
KBLP, are constructed in part to provide flood protection, ironically, their construction
often makes downstream areas more vulnerable to flood damage. A commonly intended
effect of dams is that the flood peak, and hence frequency of overbank flooding, is
reduced and/or displaced over time.26 The result of these changes to the hydrology and
geomorphology of a watershed, however, is that if and when a major flood event occurs,
the area is less resilient to dramatic changes in water levels and there is a greater
likelihood for property damage and loss of life.27 The consequences from these impacts
can be costly and devastating.
One drawback to surface reservoirs is the loss of water through evaporation, as
large open water areas are exposed, during several months and even years, leading to
water losses sometimes exceeding 20 percent of the average annual runoff.28 Evaporation
losses and water diversions as proposed for the KBLP could significantly reduce
downstream discharge and thus, ground water recharge with the unintended result of a
lowered ground water table, and frequently the reduction of the active floodplain.29
Sedimentation is another well documented drawback of dam projects, and a
concern based on the results of the project analysis. Soil erosion results in siltation in the
reservoir and the reduction of the storage capacity. This is exactly what occurred when a
dam built on the Maujira River in India lost 60% of its storage capacity in 43 years
because of siltation.30 An arid climate and loss of vegetation increase the probability of
sediment accumulation in reservoirs. 31 The water released from a reservoir tends to
69
restore its original load of sediment and nutrients, resulting in increased erosion
downstream of the dam. This erosion could lead to channel simplification and reduced
geomorphologic activity in the river bed. 32
The analysis indicated that areas downstream of the proposed dam site are
particularly vulnerable to the factors that contribute to these hydrologic and
geomorphologic changes. While these impacts should be considered when determining
the appropriateness of the KBLP, more data should also be collected to better assess the
current conditions of the area and alternative methods of water resource management
considered, to better suit local conditions and the more efficient and sustainable use of
water.
Limitations of Study
One major limitation of this analysis was the accuracy of the input data. Relevant
data that could be used in this analysis project was requested from the Environmental
Information Centre (EIC) in March 2006. The EIC is a division of the Indian Ministry of
Environment and Forests, the housing agency for the government’s GIS data.33
Unfortunately, the data requested was not received until nearly a year later in January
2007 after much discussion and modification of the original request. Struggles with
acquiring the necessary data prompted a more resourceful approach to analysis, which
could ultimately serve as a model for other researchers with data limitations.
The struggle for reliable data is certainly not isolated to India alone. For
researchers, NGO’s, or decision makers with little access to available resources, the use
of publicly distributed data, such as Landsat imagery or GoogleEarth, may be the most
viable option. This study collected, created, and used data in a way that had not been
done for KBLP area and could serve as the first step for further analysis on the
hydrologic conditions, potential impacts of the KBLP, and appropriate alternatives
suitable for the specific area.
The use of GIS data and analysis is becoming more prevalent. For example,
Sanyal and Lu illustrated the benefits of GIS data development and sharing, in creating a
spatial database for flood prevention and mitigation programs that have been used as a
support resource in developing countries.34 Their study demonstrated a cost-effective and

70
efficient way to create moderate-resolution for identifying human settlements that are
highly vulnerable to monsoon flooding.35 Improved quantity, quality, and accessibility of
data would improve the effectiveness of such a model. In the case of the KBLP as well,
GIS analysis could provide a more current and relevant characterization of the project site
and foster better understanding of the complexities inherent in such a project.
Alternatives
In their report Dams in India, the World Commission on Dams (WCD) suggested
that not all options for the development of water resources were given an equal
opportunity among the institutional structures in India that regulated such choices, and
that instead, large dams found favor with the Water Resources Department as well as
with financing agencies. The WCD suggested that this situation was fostered by an
environment where academic expertise made little effort to impart knowledge about
alternative techniques.36
Research suggested the construction of large dams could have devastating
consequences to the surrounding environment, and that there were alternatives capable of
providing water for irrigation and consumption while at the same time minimizing the
impact to the environment. Some of these alternatives include alternative size and design
of the dam and canal, the utilization of traditional water harvesting techniques for
irrigation, and implementation of conjunctive-use resource management and will be
discussed in this report.
Alternative Size and Design of Dam/Canal
Because a smaller sized dam would not necessarily reduce the environmental
impacts of a project, emphasis should be placed on t he design to maximize efficiency of
water collection and distribution and to minimize changes in water and soil distribution.
The following case study illustrates a successful example in India of incorporating
alternative sizes and designs into dam construction projects.
The Baliraja Memorial Dam illustrates the potential for successful water
development projects in India that are designed with more consideration paid to local
conditions. In October 1985, a local political organization took the initiative to address
water supply needs in the Krishna River Valley. In an effort to understand and meet local
water demand, they established a citizen based Council for Drought Eradication,

71
comprised of representatives from local villages. The council decided that the local water
shortage could be remedied through the construction of a “peoples dam” that would be
designed and constructed by the local population. Technical aspects of the dam were
designed with the assistance of a team of engineers from the Center for Applied Systems
Analysis in Development (CASAD), who relied on local knowledge of climate and water
flow conditions as a data source for the design of the dam.
They consulted locals about the variability of rainfall in the area and found that
while a minimum outside water source might be necessary to augment local water supply
in a drought prone region, communities had the ability and the best knowledge of and
experience to manage rainfall and groundwater supplies efficiently. For instance, though
the average rainfall of the area was reported at 500mm/yr, information from the locals
helped determined that the dependable level of rainfall was closer to 300 mm/yr. The
design suggestions for the dam were based on how much water each family needed for
subsistence and profit-making activities. In order to determine this, between 1986 and
1991, the organizations and engineers worked with farmers to test a diversity of crops
and watering schedules. They established that diversifying crop production would bolster
food security and increased tree cover would improve soil moisture.
The dam design utilized innovative techniques such as timber gates to filter out
accumulated sediment during monsoon rains, and also included preventative practices
such as planting trees along the river banks to provide erosion control. The plan
suggested one-third of the area is to be designated for reforestation to help increase soil
moisture and soil retention. Since the construction of the dam, villagers have seen a rise
in their local water table and can get drinking water from wells throughout the year.37
The success of the Baliraja Dam rested primarily in the political mobilization
around the need for an alternative approach to traditional dam construction projects.
However, the significance of this project is that the design of the dam was based on
efficient use of water to meet local needs. Data was collected to determine the needs of
locals and realistic availability of water in the area. Supplementary management
practices were then implemented to foster a larger ecological stability for the project area,
with the result that this holistic strategy improved long-term soil fertility and moisture for
agriculture purposes.

72
Water Harvesting
The term water harvesting refers to collection, storage and other activities aimed
at harvesting surface and groundwater, preventing losses through evaporation and
seepage, and conserving and efficiently utilizating the limited water endowment of a
physiographic unit such as a watershed. While there are several variations of this
definition, the common conceptual thread in them is that they describe water
management on a small or micro-scale, as opposed to the larger scale major dam
construction, river diversions and canal networks for irrigation of command area. The
practice of water harvesting is an old tradition in Indian culture, and over time, region
specific water harvesting structures have evolved to adapt to unique environmental
conditions. These range from roof water harvesting structures to diverting streams and
digging ponds.38
Understanding local traditional systems of irrigation could provide information
about both the potential and the limitations of certain techniques in specific locations.
What makes water harvesting an attractive alternative for this project is the smaller scale
of management. The nature of the construction of these water harvesting projects not
only would reduce the impact to the environment, but also due to its small scale, would
not be seen as the sole solution to providing water to all residents of the Ken and Betwa
watershed. Therefore, if the Indian government wished to provide a reliable source of
drinking water at a large scale it would have to incorporate other methods of water
capture.
Conjunctive Use
Though the most common solution to the problem of water capture and
distribution is storing surface water behind dams, storing water in the ground may be a
valuable alternative to surface storage systems, an alternative not always considered
when planning water development. Conjunctive-use is an example of a management
strategy that can take advantage of the natural distribution of water by storing and
utilizing water in an efficient and sustainable way. The National Research Council
defines conjunctive-use management as, “an integrated plan that capitalizes on the
combination of surface and groundwater resources to achieve a greater beneficial use
than if the interaction were ignored.”39 Due to the extreme seasonal weather conditions

73
and prevalent use of groundwater in the KBLP project area, a management practice that
utilized high rainfalls to sustain groundwater could be an attractive alternative.
In the context of conjunctive-use, groundwater resources could provide a back up
water source in years when surface supplies cannot meet demands, and an alternative for
capture and storage of high flows during surplus periods, for later use during times of
drought or high demand. The scale of the project could be intra-basin or inter-basin, with
the connection between surface water and groundwater through infiltration within a
stream channel, injection and extraction in wells, spreading in an infiltration pond, or
indirectly through the use of delivered surface water. Economists and hydrologists have
identified numerous benefits of conjunctive use including storage value (use of
groundwater basin as a reservoir), conveyance value of groundwater basin, reduced
pumping lifts, subsidence control, “non-use” benefits, and insurance (buffer) values. 40
There is evidence that the Ministry of Water Resources has developed up to 13
studies for establishing feasibility of conjunctive use of surface and ground water in
India. According to the Central Ground Water Board, these studies have shown that the
isolated use of surface water while ignoring optimal ground water use in irrigation
command resulted in various environmental problems, and as a result, have
recommended optimal conjunctive use plans to be implemented by the State agencies.41
However, there is no indication that these studies have been considered in the design or
management consideration of the KBLP.
Conclusions
As Roopali Phadke stated in her case study of the Baliraja Dam, “Water scarcity
results from the interplay of both natural and social conditions. Therefore, any analysis
of alternatives requires a serious integration of technical and political solutions.”42 There
is no argument that the development of water resources can provide tremendous benefits
such as minimizing flood damage and providing water for irrigation and consumption
purposes. However, with these benefits come significant risks of severe impacts on the
environment. Ultimately, these impacts could jeopardize even the integrity of the
perceived benefits, as flood damage and the security of future water supplies remain
concerns in spite of the construction of the development project.

74
The GIS analysis conducted in this report suggested that the KBLP project area
included regions of high vulnerability to hydrologic impacts, especially those adjacent to
the Ken River at and downstream of the proposed dam site. Dramatically changing the
hydrologic cycle of the area could have impacts that cannot be further specified without
more transparent and accessible data. For example, specific data should be collected to
determine accurate groundwater and surface water availability as well as the true water
needs of the local population. Further discussion in this report on the wildlife and social
impacts supports the need for water management practices that do not merely rely on
large-scale construction projects but rather consider conservation policies that are more
suitable for the Ken-Betwa region.
As its ultimate goal, water resource management should promote efficient and
sustainable use of water. This is not only done by creating new sources of water, but also
through conservation policies and practices that maximize that utilization of existing
sources. The site-specific conditions of the project area should be considered when
developing a water management plan. Additionally, alternative dam designs, water
harvesting techniques, and conjunctive-use management could be ways to develop a more
appropriate plan for the Ken-Betwa region. The attractiveness of these alternatives is in
the altered management perspective they bring providing a more holistic approach by
considering environmental and social conditions that provide sustainable resource
management.

75
1 National Water Development Agency. “Ken-Betwa Link Project Feasibility Report.” < http://nwda.gov.in/index3.asp?sublink2id=23?> January 31, 2007. 2 Goudie, Andrew. The Human Impact on the Natural Environment. MIT Press
Cambridge, Massachusetts, 2000. 3 International Development Studies Network. “Dams in Development: Perspectives.”
Stephen Bocker. Trent University Ontario, Canada. 1998. <http://www.idsnet.org/Resources/Dams/Development/impact-enviro.html> January 31, 2007.
4 R. Rangachari, Nirmal Sengupta, Ramaswamy R. Iyer, Pranab Banerji and Shekhar
Singh Case Study: Dams in India. Report to the World Commission on Dams. November 2000.
5 Prakash, Bharatendu et al. Problems and Potentials of Bundelkhand with Special
Reference to Water Resource Base. Delhi: Center for Rural Development and Technology, 1998.
6 Prakash et al. 1998. 7 National Water Development Agency. “Ken-Betwa Link Project Feasibility Report.” < http://nwda.gov.in/index3.asp?sublink2id=23?> January 31, 2007. 8 Eastman, J. Ronald; Weigen Jin, Peter Kyem, and James Toledano. Raster Procedures
for Multi-Criteria. Multi-Objective Decisions. Photogrammetric Engineering and Remote Sensing. Vol. 61, No. 5, May 1995, pp. 539-547.
9 DEM data was purchased through <http://www.mapmart.com> 10 ESRI GIS and Mapping Software. 380 New York Street. Redlands, CA 92373-8100 11 Landsat 7 ETM+ is an eight-band multi-spectral scanning radiometer capable of providing high-resolution image information of the Earth's surface. Imagery was downloaded for free through <http://www.landsat.org> 12 Leica Geosystems Geospatial Imaging, LLC. 5051 Peachtree Corners. Circle
Norcross, GA 30092-2500 13 Eastman, J. Ronald; Weigen Jin, Peter Kyem, and James Toledano. “Raster
Procedures for Multi-Criteria Multi-Objective Decisions.” Photogrammetric Engineering and Remote Sensing. Vol. 61, No. 5, May 1995, pp. 539-547.
14 Eastman et al. 1995.

76
15 Gallant, John C. and John Wilson. Terrain Analysis: Principles and Applications. John
Wiley & Sons, Inc. 2000. 16 Goudie, Andrew. The Human Impact on the Natural Environment. The MIT Press,
Cambridge, 2000. 17 Goodchild, M.F., Parks, B.O., and Steyaert, (eds.), Environmental Modeling with
GIS. Oxford University Press, New York, 1993. 18 Prakash Basnyat, L.D. Teeter, B.G. Lockaby and K.M. Flynn. “The Use of Remote
Sensing and GIS in Watershed Level Analysis of Non-Point Source Pollution Problems.” Forest Ecology and Management. Volume 128, Issues 1-2. March 15, 2000. pp 65-73.
19 Gallant, John C. and John Wilson. Terrain Analysis: Principles and Applications. John
Wiley & Sons, Inc. 2000. 20 Prakash Basnyat, L.D. Teeter, B.G. Lockaby and K.M. Flynn. “The Use of Remote
Sensing and GIS in Watershed Level Analysis of Non-Point Source Pollution Problems.” Forest Ecology and Management. Volume 128, Issues 1-2. March 15, 2000. pp 65-73.
21 Evans, RO; Parsons, JE; Stone, K; Wells, WB. “Water Table Management on a
Watershed Scale.” Journal of Soil and Water Conservation JSWCA3, Vol. 47, No. 1, p 58-64, January/February 1992.
22 M. Swartz, B. D. R. Misstear, D. Daly, and E. R. Farrell. “Assessing Subsoil
Permeability for Groundwater Vulnerability.” Quarterly Journal of Engineering Geology and Hydrogeology (May 2003), 36(2):173-184.
23 Plantinga, Andrew J. “The Effect of Agricultural Policies on Land Use and
Environmental Quality”. American Journal of Agricultural Economics, Vol. 78, No. 4. (Nov., 1996), pp. 1082-1091.
24 Adams, W.M. “The Downstream Impacts of Dam Construction: A Case Study from
Nigeria.” Transactions of the Institute of British Geographers, New Series, Vol. 10, No. 3. (1985), pp. 292-302.
25 United States Army Corps of Engineers. “Chapter 6: Interaction Between Surface
Water and Groundwater.” Engineering Manual: Groundwater Hydrology. Feb, 28 1999.
26 Nilsson and Berggren. “Alterations of Riparian Ecosystems Caused by River
Regulation.” BioScience. September 2000. Vol. 50. No. 9.

77
27 Goudie, Andrew. The Human Impact on the Natural Environment. The MIT Press,
Cambridge, 2000. 28 Food and Agriculture Organization of the United Nations. Land and Water
Integration and River Basin Management. <http://www.fao.org/docrep/V5400E/v5400e00.HTM> January 31, 2007.
29 Goudie, Andrew. The Human Impact on the Natural Environment. The MIT Press,
Cambridge, 2000. 30 Nilsson and Berggren. “Alterations of Riparian Ecosystems Caused by River
Regualtion.” BioScience. September 2000. Vol. 50. No. 9. 31 Food and Agriculture Organization of the United Nations. Land and Water
Integration and River Basin Management. <http://www.fao.org/docrep/V5400E/v5400e00.HTM> January 31, 2007.
32 Nilsson and Berggren. “Alterations of Riparian Ecosystems Caused by River
Regualtion.” BioScience. September 2000. Vol. 50. No. 9. 33 More information about this organization can be found at
<http://www.eicinformation.org> 34 Sanyal, Joy and X.X. Lu. “Remote Sensing and GIS-based Flood Vulnerability
Assessment of Human Settlements: A Case Study of Gangetic West Bengal, India.” Hydrologic Processes. August 2005. Vol. 9. pp. 3699-3716.
35 Sanyal, Joy and X.X. Lu. August 2005. 36 Rangachari, R. et al. Large Dams: India’s Experience. Report Prepared for the
World Commission on Dams. November 2000. 37 Phadke, Roopali. “Assessing Water Scarcity and Watershed Development in
Maharashta, India: A Case Study of the Baliraja Memorial Dam.” Science, Technology, and Human Values. Vol 27, No 2. Spring 2002.
38 Athavale, R.N. Water Harvesting and Sustainable Supply in India. 2003 39 National Research Council Committee on USGS Water Resources Research.
Investigating Groundwater Systems on Regional and National Scales. National Academy Press, Washington D.C. 2000.
40 Reichard, Eric and Robert Raucher. “Economics of Conjunctive Use of Ground Water
and Surface Water.” Water: Science, Policy, and Management. American Geophysical Union. Washington, DC; 2003.

78
41 Central Ground Water Board of India. Conjunctive Use Management Projects.
<http://cgwb.gov.in/GroundWater/conjunctive_use.htm#SSIP> August 29, 2006. 42 Phadke, Roopali. “Assessing Water Scarcity and Watershed Development in
Maharashta, India: A Case Study of the Baliraja Memorial Dam.” Science, Technology, and Human Values. Vol 27, No 2. Spring 2002.

79
CHAPTER 3: Impacts to Wildlife
Introduction
Scientists generally agree that the most significant threat to biological diversity is
loss of habitat. Exotic species, pollution, and overexploitation are also important factors.1
Habitat loss, the greatest threat of all, is occurring at an alarming rate as the human
population continues to grow. India is no exception, as it is one of the fastest growing
populations in the world, and its soaring demand for food, timber and housing has
contributed to the destruction of India’s natural habitats and its wildlife heritage.2 In
addition, numerous forest and wilderness areas, which served as vital repositories of
wildlife and biodiversity, have been severely reduced in extent or completely lost to
increasing agricultural and industrial expansion.3 Unfortunately, this has lead to India
having 30 mammalian species on the threatened list in the Red Data Book, ranking India
number one in the world for having the largest number of threatened mammals. 4 The
pressures of human population growth and the need for expansion serve as a clear
example of the constant competition between wildlife and humans for survival in a
limited resource environment. This dilemma is further exacerbated in India as the
government attempts to address the pressing issue of water availability for this growing
population through the Inter-River Linking Program (IRL).5
The plans set forth by the National Water Development Agency (NWDA) to
begin implementation of the IRL through the Ken-Betwa Link Project (KBLP) raised
concerns regarding the impacts on wildlife. These concerns were derived from the claims
made in the NWDA’s feasibility report of the KBLP. According to this report,
construction of the link would require submergence of forested areas that include part of
the Panna National Park and Tiger Reserve, resulting in habitat loss. However, it was
stated in the report that there would be “nil” adverse impacts on wildlife.6 This statement
was made although no publicized wildlife assessments of the area have been reported by
the NWDA nor consideration given to the recorded impacts demonstrated from projects
similar to the KBLP. The report also claimed that wildlife would instinctively know how
to react to the impacts of flooding as a result of the submergence of forest areas. It is not
unrealistic to state that wildlife instinctively moves away from harmful situations, since
many species are able to swim or escape using the forest canopy. Other factors such as

80
the size of the reservoir, extent of habitat fragmentation, impact on territoriality of the
species affected and the fact that some animals move slowly, suggest human intervention
may be necessary to give some species a chance for survival.7 Human intervention was
not proposed. The feasibility report implied a sole reliance on wildlife instincts to move
and did not acknowledge the potential for negative impacts on the regions’ biodiversity.
In an effort to raise awareness and understanding of the situation, this section
provides an overview of the threats to wildlife in the Panna National Park and Tiger
Reserve. An analysis was also conducted of the KBLP feasibility report as well as other
Inter-River Linking reports in order to place the regional impacts on wildlife into a
nation-wide perspective. Finally, this section highlights relevant examples of how
implementations of projects similar to the KBLP have lead to adverse implications for
wildlife. It is hoped that this section will serve as a stepping-stone towards wildlife
protection during construction of the KBLP and other future links.
Methods
This section’s analysis of the potential impacts that the KBLP will have on
wildlife relied on existing literature and qualitative data that was gathered through two
informal interviews in India in May 2006. The first interview took place in New Delhi at
the World Wildlife Federation-India (WWF-India) with a WWF representative and lasted
about an hour and half. The second interview took place inside the Panna National Park
and Tiger Reserve (PNPTR) with a park guide. This interview was conducted during the
tour of the park, lasting about a half day. Both interviews highlighted current threats
facing wildlife and initiated the analysis of the KBLP’s potential role in contributing to
these threats.

81
Analysis
Panna National Park and Tiger Reserve
The Panna National Park and Tiger Reserve is the twenty second tiger reserve of
India and fifth in the state of Madhya Pradesh (Figure 1).8 It is situated in the Vindhya
Ranges and spreads over the districts of Chhatarpur and Panna in the north of the state.
Approximately 55 kilometers of the Ken River, flows through the reserve. The Ken River
is one of the sixteen perennial rivers of Madhya Pradesh and is considered the lifeline of
the reserve.9
Figure 1. Map of the Panna National Park and Tiger River.10

82
Overview of threats to wildlife in the Panna National Park and Tiger Reserve
(PNPTR)
In an attempt to understand the current threats that wildlife faced in the PNPTR a
tour of the park was taken in May of 2006. During this time an informal interview was
conducted with a PNPTR guide. According to the PNPTR guide, wildlife is threaten by
the growing human population, illegal grazing of livestock and collection of forest
resources and direct human-wildlife conflict.11
1. Growing Human Population
The continual increase in population is impacting the PNPTR as it is occurring
both within the reserve as well as in close proximity of it (Table 1 and 2). This growth
brings additional demand for grazing area and forest produce.12
Population District
1971 1981 1991
Panna (8 villages) 1862 2094 1070
Chhatarpur (7 villages) 2114 2243 3042
Total 3976 4337 4112
Table 1. Estimated growth in population for villages found within the PNPTR.13
Population District
1971 1981 1991
Panna (30 villages) 13694 17118 23160
Chhatarpur (16 villages) 6616 9622 13945
Total 20310 26740 37105
Table 2. Estimated population for villages within a 5 km radius of the PNPTR.14

83
2. Grazing
The cattle population of the villages within the PNPTR is estimated to be about
8,658 and 28,897 for the surrounding villages.15 The villagers’ livestock as well as
livestock from other far off villages threaten wildlife as they are left to graze or led
deliberately into the park area, which is considered rich in fodder (Fig. 1). 16 This type of
activity is harmful to wildlife within wilderness parks as grazing results in trampled soil
that causes destruction of vital habitat.17 There is also a threat from the potential of
transmitting livestock diseases such as foot and mouth disease, hemorrhagic septicemia,
Black Quarter, Anthrax, Rabies and Hydrophobia to the wildlife within the park. 18
Fig. 2. Illustrates the impact that cattle have on forest areas, as paths are created and vital coverage for park species is lost through grazing.19

84
3. Collection of Forest Resources
Illegal collection of timber and forest products like the mahua tree, tendu leaves,
fruits of amla and achar, bamboo, grasses and medicinal plants occur throughout the
park.20 This dependency on forest resources has been associated with fires deliberately
being set for the cultivation of these forest resources,21 and has resulted in large hectares
of forest habitat destroyed by fires burning out of control.22
Figure 3. The Forest Department, Madhya Pradesh has stated that most of the man-caused fires are associated with the activities of mahua, tendu, and sal seed collection and the desire to promote better grass growth after the rains. The fires caused by mahua collectors are the commonest in March and April and are the cause of wide spread fire damage to the forest growth.23

85
4. Human-Wildlife Conflict
This conflict is generated from two sources, one internal to the park and one
external. The PNPTR guide acknowledged that locals’ crops and livestock were
periodically raided by wildlife straying from the park.24 This type of activity has shown
to negatively affect villagers’ perception of wildlife and severely handicap
conservation.25 As an example, the guide mentioned the poisoning of a tiger by locals
near the park for destroying a mustard patch.26 Though the guide did not have any
documentation to support his contention, Valmik Thapar, a respected environmentalist
known as "the Indian tiger's best friend," affirmed the existence of this kind of problem
and said, "Villagers kill the tigers by pouring pesticides meant for killing termites on the
carcass of their dead cattle, so that when the tiger comes to feed on the kill again, it gets
poisoned."27 Thapar suggested that "quick [Government] compensation," for the livestock
or crop loss could defuse this volatile situation which threatens the highly endangered
tiger. It is estimated that fewer than 5000 tigers remain in the wild and that 3500 of these
are found in India.28
An in-house report prepared by the Madhya Pradesh Government's Forest and
Wildlife Crime Prevention Cell (FWCPC) revealed that the entire state of Madhya
Pradesh remains affected by the poaching menace and the most sensitive districts on this
count are Balaghat, Mandla, Umaria, Seoni and Panna.29. A senior State Forest
Department officer said that the poachers are active even inside the tiger reserves and
cited a recent case of poaching detected in Seoni district where the carcasses of a tigress
and her cub were found lying in the buffer zone of the Pench National Park.30 In January
2000, police in Uttar Pradesh seized a shipment of claws, bones and skins from 50 tigers
and 1,400 leopards.31. Thapar believes hundreds of tigers are killed in India each year,
perhaps as many as one a day and that within 10 to 15 years, there may be fewer than 500
tigers left in the wild.32 It should be noted that the KBLP encompasses both the Madhya
Pradesh and Uttar Pradesh states, whose wildlife are seriously threatened by poaching.

86
5. Development
Potential threats to wildlife by development corporations occur on a much larger
scale, and this danger was acknowledged by the State Forest and Wildlife Crime
Prevention Cell (FWCPC). In the same report regarding the threat from poaching, the
State FWCPC focused its attention on the problem of logging and mining in forest
areas.33 The following chapter in this report indicates that Shivpuri, Gwalior, Guna,
Vidisha, Panna, Damoh, and all northern districts of Madhya Pradesh are extremely
sensitive to mining.34 Mining presents a particularly significant danger in the PNPTR
since Panna is considered to have the only source for diamonds in India.35 Merchandised
diamond mining is conducted in Kimberlite pipe at Majhagawan by the National Mineral
Development Corporation (NMDC) just outside the boundary of the park, off the Hinouta
range, 36 and has resulted in the following problems:37
1. Release of industrial waste to streams draining into the Ken River, 2. Dumping of unusable debris, such as huge mounds in front of the Reserve’s
Hinouta gate, 3. Blast and heavy machinery noise, and 4. Regular biotic pressure on the reserve for firewood and fodder from about 1,000
NMDC workers.
Valmik Thapar delineated the impact mining activities have had on wildlife’s
habitat in his case study describing the huge diamond mining establishment that was
discovered in the Gaugau sanctuary, which covers 69 sq. km and serves as a vital buffer
for the Panna National Park and Tiger Reserve.38 The entire landscape now lies in four
fragmented pieces, the aftermath of mining white sandstone quarries in the sanctuary.
According to Sanjay Gubbi, an Indian wildlife activist, fragmentation of habitat is a
major threat to the long-term survival of many endangered species because the loss of
contiguous habitats threatens the dietary needs and reproductive needs of species.39
Consideration of the current wildlife threat from development raised the question
of what and whether wildlife protection measures were in place during and after large
construction projects. An interview with the representative from World Wildlife
Federation-India (WWF-India) only heightened concerns regarding this issue, as she
indicated that biodiversity and natural resources were considered a very low priority on

87
government construction projects. She believed the project impact assessments tended to
be inaccurate due to the use of old data and, frequently biased due to the composition of
the in-house “expert” committees conducting the feasibility reports. She also mentioned
that the government evidently provided no funding for outside organizations to conduct
independent assessments of the IRL. The main threat posed by the KBLP according to
the representative, would be to the tigers; as a result of impacting known habitat within
the PNPTR.
KBLP and Wildlife
The feasibility reports that were made available by the National Water
Development Agency (NWDA) and in particular that of the Ken-Betwa Link Project
(KBLP), raised serious concerns about potential impact on wildlife from this nationwide
plan. The KBLP feasibility report did not adequately cover the potential for long-term
damage to the region’s biodiversity, and in fact claimed that there were no real threats to
wildlife from the KBLP.
Of particular relevance in the KBLP feasibility report was the chapter entitled
Environmental and Ecological Aspects of the Project, containing information on the
environment and wildlife found in the proposed area of the link. According to the report,
construction of the KBLP would result in a total submergence area of 8650 ha, of which
6400 ha are forested areas (approximately 74 percent), considered dense to moderate
forests and home to various species.
Table 3 through 5 lists the species of carnivores, herbivores, birds, and reptiles
commonly found in and around the proposed submerged area of the KBLP, and provide
some insight into the rich variety of wildlife on the Reserve.
Table 3. Animals (Mammals)40 (i) Carnivore Tiger, Panther, Jackel, Wild Cat and Leopard
(ii) Herbivore Spotted deer, Neelgai, Wild Boars, Rabbits, Blacked faced Monkeys,
(Langoors), Red faced Monkey

88
Table 4. Birds. According to the report there are about 153 species of birds that are permanent residents of the basin.41 (i) Pheasant and Fowl group Peacock and Wild Fowl (Wild Hen)
(ii) Partidges and Quail group Titar (Francolinus pondicerianus) and Batair
(Coturnix)
(iii) Doves and Pigeon group Harial (Crocopus phoenicopteris) and Fakhta (Streptopelia shinen-is)
(iv) Non-game Crow, Parrot, Myna, Bulbul, Koel, birds Kaikil, Ababil, Owl, Gidh, Baaz, Cheel, Baya, Mokha, and Sat-Bahnin
(v) Aquatic Sarus (Antigone antigone) Duck, birds (Sarkidiornis melanonotas), Cotton teals (Nettopus coromandelianus), the large whistling teal, silhi (Dendrocynga fulva), grey Heron and Bagla (Ardea Cinera)
Table 5. Reptiles42 (i) Reptiles Cobra, Crate, and Dhaman (Zamenis mucosus)
Within the Reserve are a number of endangered species listed in Schedule I of the
Wildlife Protection Act of 1972 (WPA) and include the tiger, leopard, carcal, four-horned
antelope, Indian wolf, Pangolin, Rusty Spotted Cat, Sloth Bear and Gharial.43 As noted in
Table 3 and listed in the WPA 1972, one species found in and around the submergence
area is the tiger. Notably the tiger has been the target of many conservation campaigns
and for good reason, since it is considered one of the most endangered species in the
world. Madhya Pradesh has 19% of India’s and 10% of the world’s tiger population,
with an estimated 710 in Madhya Pradesh and 31 tigers in the PNPTR.44 One of the main
reasons for the drastic decline in the tiger population has been habitat loss (Figure 4). The
tiger requires habitat that consist of moderately dense cover and Panna is already
deficient in this type of forest (Figure 5). Any further loss due to submergence could
prove catastrophic to the Panna tiger.

89
Figure 4. The distribution of tiger habitat in India.45
Madhya Pradesh

90
Figure 5. Forest cover: Central,eastern and southern parts of the Madhya Pradesh are rich, whereas northern and western parts are scarce in forest.46

91
The Panna National Park was created in 1981 and declared a tiger reserve in
1994.47 There are three guiding principles for declaring an area a tiger reserve according
to Project Tiger and they include: (1) eliminating all forms of human exploitation and
biotic disturbance, (2) restricting the habitat management to only repair damages to eco-
systems by human and other interferences, and (3) monitoring the faunal and floral
changes as well as conducting research about wildlife.48 As indicated in the feasibility
report, the park and reserve lie on the north and south sides of the forested area to be
submerged, and the protected forest on the north would not be affected by the project.
However, the southern part of the Panna National Park and Tiger Reserve would be
impacted (about 4500 hectares) as it would be included in the submerged area.49 Though
the submergence of this area would violate the first two principles set forth by Project
Tiger for the creation of a reserve, this issue was not addressed in the feasibility report.
According to the KBLP feasibility report, “impact of the submergence on the
wildlife of the park will be nil, as the area coming under submergence is only about 9%
of the total area of the national park and the wildlife has got its own natural characteristic
of moving to the interior forest.” Similar statements regarding impacts to wildlife were
made in other IRL feasibility reports, fourteen in all, that were made available through
the National Water Development Agency of India’s website. Eleven of the fourteen
reports provided information about wildlife impacts, as summarized in Table 6.
Feasibility reports for the Srisailam Pennar, the Pamba Achankovil Vaippar, and the
Polavaram links did not mention submergence or impact to wildlife and were excluded
from the Table 6.50

92
Links Impacts on Flora and Fauna Proposed Submergence
Ken-Betwa Link “Nil”
8650 ha; 6400 ha of forested area
Parbati Kalisindh Chambal Link
“very little”
17,308 ha; 244.4 ha of forested area
Polavaram Vijayawada Link
No statement made
Number of hectares not reported
Damanganga Pingal Link “No significant impact is expected”
3641 ha; 1,624 ha of forested area
Mahanadi Godavari Link “The reservoir submergence will not effect the habitation of wildlife”
63,000 ha; 4000 ha of forested area
Inchampalli Pulichintala Link
“The proposed dam site is the breeding area for a number of wildlife but at present no information as to whether the area fall under migration routes of wildlife.”
92,555ha; 21,734 ha of forested area
Inchampalli Nagarjuna Sagar Link
Same information as Inchampalli Pulichinatla Link
94,620 ha; 30,170 ha of forested areas
Almatti Pennar Link
“Will partially effect wildlife” Number of hectares not reported
Nagarjunasagar Somasila Link
“No adverse impact are expected”
895 ha
Pennar Palar Cauvery Link
“No adverse impact are expected”
9895 ha; 1025 ha of forested area
Cauvery Vaigai Gundar Link
“No adverse impact are expected”
3174 ha
Par Tapi Narmada Link
“Due to activities in forest, wild animals are likely to migrate to safer places”
7599 ha; 3572 ha of forest area
Table 6. Summary of the statements regarding the individual links impacts to wildlife.51
Several important points arose from a review of these reports, first, that the areas coming
under submergence were recognized as being inhabited by wildlife. Therefore, it could
be inferred that collectively the IRL would accelerate habitat loss throughout India,
exacerbating a serious problem already impacted by development pressures.52 Second,
statements on the potential wildlife impacts continuously ranged from ‘minimum” to
“nil’, with no supporting data from wildlife assessments of the areas.53
In addition to the loss of habitat through submergence, wildlife is threatened by
the lack of preventative measures by the NWDA to assist wildlife in coping with

93
development. The feasibility reports repeatedly note that wildlife would react
instinctively to development effects such as submergence, and a final report prepared for
the World Commission on Dams (WCD) regarding India’s experience with large dams
expressed similar expectations (Table 7).54
Cases Statements Concerning impact to flora and fauna
10 There will be no adverse impact on the flora and fauna, primarily because
there was no “valuable wildlife” in the submergence area.
12 Important forestland will be destroyed and important species or ecosystems
will suffer.
2 The Bisalpur and Hasdeo Bango Dams would serve to created wetlands and
enhance the biodiversity. No information as to how that would be done was
provided.
Table 7: WCD Report included the study of 63 dams, information on the impact on flora and fauna was available in 22 cases.55
According to the WCD report, even where studies had been conducted on the impact of
fauna and flora they were inadequate on many counts,56 and included the following:57
1. Tendency to consider only large mammals as “wildlife”, despite the fact that the Wildlife (Protection) Act of 1972 included all wild fauna and flora in the definition of “wildlife”.
2. Emphasis on “valuable” species, which often meant the more prominent or visible species, though, some of the less visible species might have actually been more important to conserve.
3. Tendency to focus only on endangered species which could result in other species becoming endangered over time.
The WCD report also revealed that although some species had been studied, however
unsatisfactorily, there were rarely any studies of the cumulative impact of a dam on the
ecosystem.58 These findings, combined with some of the mitigative measures presented
in several of the dam studies and noted in some cases to be totally inappropriate, raised
concern for the protection of wildlife (Table 8).

94
Project Location Implied Mitigative Measures for Wildlife Indira (Narmada) Sagar Project
Madhya Pradesh Suggested that wildlife would voluntarily migrate into neighboring forests when impoundments took place.
Tehri Project Tehri district of Uttaranchal
Maintained that the fish would migrate and establish themselves upstream of the dam
Rajghat Project Uttar Pradesh Suggested that “The National Park at Shivpuri is also not far off. It is thus felt that there is ample scope for migration of the wildlife to the adjoining forests and there would be no difficulty on this account.”
Damanganga Pingal Link
Maharashta “As large forest areas are available in the surround region, these animals would migrate”
Par Tapi Narmada Link
Southern Gujarat “Due to activities in forest, wild animals are likely to migrate to safer places.”
Table 8. Examples of several projects that suggest wildlife will know how to react to submergence of forest areas. Those highlighted in red serve as examples of the suggestions currently made in proposed links for the IRL. 59
The suggested mitigative measures noted above are considered to be inappropriate, first,
because the areas these animals would migrate to have their own complement of wildlife
and cannot be considered “vacant habitats”.60 Second, wildlife does not always move
down corridors of forest as the flood waters advance,61 either because they are not aware
of corridors, are rightly wary of leaving their own territory, or become panic stricken
when the waters roll in. In some cases, animals are nocturnal, or roam during the day, or
live underground, in trees, or in caves.62
Another interesting issue raised in the WCD report was that in none of the dams
studied were there any efforts to monitor the status of wildlife after the construction of
the dam, to assess the impact of the mitigative strategies or to check the veracity of the
estimates of impact done prior to construction.63 The WCD report findings also supported
the claim raised in the interview with the WWF-India representative, who mentioned that
the feasibility reports for the KBLP and other proposed links, tend to only state what type
of species exists in the entire region, not what species spawn or use a particular area
designated for submergence.64 While, it is important to identify what types of wildlife

95
exist in the region, other factors such as spawning and breeding areas, can be equally
important to consider in the impact assessment.
The findings of the WCD report mirrored those in the KBLP as well as other
feasibility reports, namely, that there would be “no adverse” impact, and like the KBLP
report, the WCD cited no hard data in support of these claims. Therefore, it was
concluded that there was a need to more closely examine the wildlife impacts of projects
similar to the KBLP.
Relevant Examples of Development Projects’ Impacts on Wildlife
Globally, scientists have established that anthropogenic disruptions of the natural
flow of rivers have affected many aspects of the environment,65 and some recorded
impacts on wildlife include: habitat fragmentation within dammed rivers, which can also
lead to genetic isolation; downstream habitat changes, such as loss of floodplain, riparian
zones, and adjacent wetlands and deterioration of and loss of river deltas and ocean
estuaries; deterioration of irrigated terrestrial environments and associated surface
water.66 Findings from this global review and the discussions which follow in this section
provide insight into how wildlife could be impacted through dam and reservoir
development, the types of development that is proposed for the KBLP.
1. Effects on Biodiversity
The World Wildlife Fund Director General, Claude Martin, expressed his
concerns regarding the plan to interconnect rivers and warned that linking rivers without
properly examining the ecological impacts could lead to serious consequences. He has
noted, “a river is more than just water; there is a lot of biodiversity in it for it sustains the
livelihood of all species living in and around it”.67 Research supports General Claude
Martin’s claim of the immense diversity that exists in rivers and his warning regarding
the consequences on biodiversity, for freshwaters are home to a relatively high proportion
of species, with more per unit area than other environments.68 A global analysis on
terrestrial and freshwater species indicated that 11 to 25% of dominantly terrestrial
vertebrates were generally affected by water alterations, while threat to freshwater
species ranged from 13 to 65%.69

96
The threat to freshwater biodiversity has been associated with numerous impacts
related to dams and their reservoirs (Table 8), and it can be inferred that such species as
the endangered long snouted crocodile-gharial (Gavialis gangeticus), the marsh crocodile
mugger (Crocodylus palustris) and numerous vulnerable/endangered carp species such as
the Catla catla, Labeo rohita, and Cirrhinus mrigala found in the Ken and Betwa rivers
could potentially be threatened by the impacts of the dam and reservoir in the KBLP.70
As highlighted in Table 8, blocking movement of migratory species threatens
biodiversity, as dams block migration to varying degrees. The blockage prevents
migratory fishes such as the anadromous Masheer or Hilsa ilisha found in the Ken and
Betwa Rivers from having access to portions of their native ranges upstream of the dam
for spawning, thus resulting in genetic isolation and declining fish population. The
blockage of fish movements upstream could also negatively impact other functions that
fish provide within the river, such as contribution to the food chain and overall nutrient
content in the river.
Table 8. Dams and their associated reservoirs impact on freshwater biodiversity.71 Blocking movement of migratory species up and down rivers, causing expiration or extinction of genetically distinct stock species. Changing turbidity/sediment levels to which species/ecosystems are adapted in the rivers affects species adapted to natural levels. Trapping silt in reservoirs deprives downstream deltas and estuaries of maintenances materials and nutrients that help make them productive ecosystems. Filtering out of woody debris which provides habitat and sustains a food chain Changing conditions in rivers flooded by reservoirs: running water becomes still, silt is deposited, deepwater zones, temperature and oxygen conditions are created that are unsuitable for riverine species. Possibly fostering exotic species which tend to displace indigenous biodiversity. Flood plains provide vital habitat to diverse river biotas during highwater periods in many river basins. Dam management that diminishes or stops normal river flooding of these plains will impact diversity and fisheries Changing the normal season estuarine discharge which can reduce the supply of entrained nutrients, impacting the food chains that sustain fisheries in inland and estuarine deltas. Modifying water quality and flow patterns downstream.

97
Hydroelectric dams in the Amazon basin halted the long distance upstream
migration of several species of catfishes and interrupted the downstream migration of
their larvae.72 In Brazil’s Araguaia-Tocantins River basin, several species of migrating
catfish populations have been drastically impacted as a result of the dams, thereby
reducing the catches in downstream fisheries by 70%.73 The potential decline in fish
populations could have a catastrophic impact on the Ken Gharial Sanctuary, located
downstream of the proposed KBLP. This sanctuary is home to one of the largest and most
endangered crocodilian species in Asia. A monitoring exercise by the forest departments
of Madhya Pradesh (part of the KBLP area) conducted in 2003 concluded that only 200
reproducing gharials remained in the wild.74 Surveys conducted prior to the 2003
monitoring exercise in the Ken Gharial Sanctuary uncovered 19 gharials in 1994, 22 in
1996 and 15 in 1999.75 The major threats to the gharials’ livelihood stem directly from
human activities such as poaching, competition for the same food base, and trapping and
killing to prevent interfering with fishermen’s nets. In addition, damming rivers
upstream, as proposed in the KBLP, has been demonstrated to not only restrict species’
movements but to also increase competition for declining food sources. If these findings
from other sites apply to the KPLP, then the threats to wildlife from this project could
expand far beyond just the submerged forest area within the Reserve to the surrounding
region.
The projected potential impacts for the gharials have already become a reality for
another specie, the endangered Ganges river dolphins (Platanista gangetica), locally
known as sihu, which inhabit major river systems such as the Ganga and the Brahmaputra
in the Indian subcontinent.76 The type of habitat in which these dolphins tended to
concentrate made them vulnerable to habitat disturbance from water development
projects such as the Ganges-Kobadak Irrigation Project.77 The habitat disturbances
resulted in restricted upstream and downstream movements which created population
subdivisions thus increasing the river dolphins’ vulnerability to environmental,
demographic, genetic, and etiologic threats.

98
2. Habitat Alteration
There are various types of habitat alterations that can act together to impact
biodiversity (Table 9). Blockages prevent migration by fragmenting rivers systems and
restricting the free passage of fauna and its use of various types of habitat.78 Habitat
fragmentation can also potentially lead to species being subdivided into small, isolated
local populations.79 As species are pushed into smaller habitats, increased inbreeding
often leads to a decline in genetic variability. Habitat simplification includes the loss of
habitat quality, diversity and complexity.80 Disrupting the natural discharge regimes can
impact the biodiversity since communities have adapted to particular patterns of river
flow over time.81
Other aspects of development construction such as clearing of vegetation,
submergence, movement of earth and rock, presence of humans, machinery and
construction materials, use of explosives, noise, the reduction or cessation of river flow
and increased turbidity have been shown to result in altered habitats and biodiversity, as
described in Table 9. 82
Type of habitat alteration
Location Effects
Blockage by dam/habitat fragmentation
Tocurai Dam, Tocantins River, Brazil Upper Volga River, Russian Federation
Interrupted upstream, reproductive migrations of long-distance migratory species; populations of these species were negatively affected in lower Tocantins, downstream of dam (Ribeiro et al; 1995) Changes to fish fauna following construction of four major reservoirs; 7 species (mainly anadromous rheophils) disappeared, and none of these 9 are reproducing naturally and will probably disappear when stocking is discontinued (Poddubny and Galat 1995)
Habitat simplification
Upper Volga River, Russian Federation River Rhine, Lower Rhone River, Europe
Limited bioproductivity in reservoirs because of considerable changes in major biotopes after reservoirs construction: “typicial riverine fish habitats… remain only in the upper reaches of tributaries and in the forewaters of dams and account for no more than 1% of the total water surface area” (Poddubny and Galat 1995)
Unnatural discharge regimes
Colorado River, U.S.A Elimination of 2 yr classes of endemic Colorado squawfish from its most productive remaining nursery habitats in the Green River Catch, perhaps because of extreme flow fluctuations and alterations of seasonal flow regimes (Jones and Tyus 1985 as cited in Carlson and Muth 1989)
Table 9. Examples of world-wide biodiversity impacts from habitat alteration resulting from hydrological development.83

99
The KBLP’s dam construction is expected to result in disturbances similar to
those noted above, and submergence without a doubt will occur during the KBLP as the
feasibility reports have indicated.84 Loss of forest almost always equals loss of habitat
and wildlife, as the depletion of wildlife can be attributed largely to deforestation.85 A
study conducted by the Central Water Commission (WCD), Ministry of Water
Resources, Government of India, examining 116 projects, found that the average forest
submergence per project was 2,400 ha.86 From these findings the WCD inferred that the
total submergence of forest due to dams built between 1980 and 2000 would be
4,504,800 ha (roughly 4.5 m ha).87 This is considered a very large loss considering the
fact that only 24% of India at present is forested (only 11% closed forest) and serious
issues surround India’s record for compensatory afforestation.88
There is a legal requirement in India that forest flooded by reservoirs must be
replanted. However, implementing this has posed a problem in India, according to
evidence provided from past projects reviewed in the WCD report.89 First, it is not
possible to literally “replace” a natural forest by plantation. Though there is formal
“compensation” for the forests lost in terms of forested area, the actual ecological and
biodiversity losses cannot be compensated for.90 Second, the compensatory afforestation
usually occurs in areas that are very ecologically different from the lost forested areas.91
For example, the forest submerged for the Tehri Project was the hilly terrain of Tehri
Garhwal, while the compensatory afforestation occurred in the distant districts of Jhansi
and Lalitpur, which are considered plains. The same situation occurred with the
submergence in the Sardar Sarovar Project, which was compensated by plantations in the
distant Kutch grasslands. And last, the record of the state governments in actually
carrying out compensatory afforestation has been considered poor. According to the
Ministry of Environment and Forest, Government of India, the performance of the State
governments in enforcing compensatory afforestation has not been very satisfactory; up
till 1997, only 46% of areas stipulated have been afforested.92
As the forests of India are adversely impacted by development, likewise continues
the impact on wildlife. The Kabini Dam in Karnataka required the submergence of an
extensive forest area which resulted in a substantial size reduction of the corridor
between the present Nagarhole National Park and Bandipur Tiger Reserve.93 This

100
corridor, once considered a crucial pathway for elephants and other wildlife migrating
over large areas, is now completely closed off to any species that cannot swim across the
area.94 A similar situation occurred with the construction of the Haragni Dam, which
alienated the elephant population that crossed over the North and South Kodagu. The
reduction of corridors poses a threat to wildlife as corridors are considered helpful in
reducing or moderating some of the adverse effects of habitat fragmentation by
facilitating dispersal of species.95
Habitat alteration will also impact the tigers that inhabit the Panna Tiger Reserve.
A highly territorial creature, the tiger requires a large habitat in which to roam and search
for food, which appeared to be the crucial issue for the tiger in the Reserve. Intensive
fieldwork carried out in the Reserve indicated that the home range of tigers, especially
those of females, were larger than those of other populations studied in the
subcontinent.96 This was attributed primarily to the low density of suitable prey and biotic
disturbances.97 Thus, habitat loss can be expected to reduce the amount of prey available
to tigers. The thinning of animals available for prey is a colossal threat to one of the basic
survival needs of the tiger. Wild tigers eat as much as forty pounds of meat at a time,
meat that they find over the broad geographic range in which they roam.98
The loss of prey due to habitat loss is not the only impact expected to affect the
tiger population. According to the WWF-India representative, the KBLP will be
impacting known breeding areas for tigers. This was inferred from the fact that the forest
to be submerged was declared by Project Tiger as a reserve due to it being representative
of a region that is ideal for maintaining a viable tiger population in a natural environment.
3. Introduction of exotic species
Reservoirs and dam tailwaters often create habitat better suited for non-native
biota or a subset of the native fauna, than for the native assemblages.99 There is a wide
range of indigenous fishes that are found in the Ken River, including the Rahu, Bhadur,
Mrigal, Tingar, Singahi, Mangur, Pawda, Baam, Sooja, Sinni and Mahasir, which could
be negatively impacted from the altered river flow. Negative effects could also result
from the introduction of other varieties of fish, currently proposed in the KBLP feasibility
report. The report also stated that the “creation of the Daudhan reservoir shall-definitely

101
increase the production rate of all the varieties of fishes found in the area”.100 The
potential adverse effects from such an endeavor should be thoroughly examined prior to
creating such a change in either the makeup or density of a specific biosphere. There are
numerous examples of unintended and unanticipated negative effects resulting from such
alterations, including that of the introduced salmonids in Argentina’s Patagonian region
which resulted in the decimation of indigenous fish species and severe reductions in the
crayfish101.
The effects of projects similar to that of the KBLP have demonstrated the
potential impact to wildlife as it results in habitat alteration/loss. This impact affects the
very survival of species and needs to be addressed in order to avoid devastating
consequences.
Discussion
Wildlife in India is considered one of the most threatened in the world, and the
wildlife in the KBLP in particular, faces many challenges for survival. In the Panna
National Park and Tiger Reserve, threats come from such sources as the growing
population, illegal grazing of domestic livestock and collection of natural resources and
direct human-wildlife interaction. The KBLP has the potential to contribute to these
current challenges through the submergence of forest areas, and further even greater loss
of forested areas is expected with the implementation of the nationwide Interlinking of
Rivers Plan.
The magnitude of the loss of India’s forests and the implications this entails might
not be fully appreciated and understood initially for two reasons. First, only after a
thorough review of the KBLP’s and other links’ feasibility reports, does it become clear
that submergence is the primary method for achieving the interlinking of rivers. This
leads to the second reason, that this focus on method omitted meaningful examination
and analysis of the potential impacts on the surrounding environment and species that
inhabit the area. For example, the KBLP feasibility report indicates that there is 6400 ha
of forest that will be submerged, which might be considered a relatively small area, were
it not for a consideration of the much larger submergence connected with the construction
of the other links. In net, the combined submergence associated with the completion of

102
the IRL could serve to accelerate habitat loss throughout India, and initiate a
unprecedented decline in biological diversity. It is important that the scale of the overall
project be considered when assessing the implications to wildlife, as the amount of
submerged forest increases throughout the country with each link. The loss of habitat that
will result from this project is an issue that should be addressed to help ensure that this
project does not deal with one problem, water management issues, and create another, the
extinction of India’s wildlife.
Hopefully, the analysis presented in this document highlights those serious issues
which could lead to potentially irreversible negative impacts on India’s wildlife if not
taken into consideration during the planning process of this grandiose project.
Options
The statements made in the feasibility reports, especially that of the KBLP which
will serve as the pilot study, should be re-evaluated, since the existing research of
projects similar to the KBLP have demonstrated that river interlinking can have adverse
effects on wildlife. In an effort to contribute to the protection of wildlife in the KBLP
region, the following options, derived from this report’s analysis, are suggested:
1. As has been explicitly stated, the KBLP will be submerging part of the Panna
Tiger Reserve which raises two issues. First that though the Panna Tiger Reserve
was established with the intention to protect tigers, this goal seems to be
disregarded in the plans to submerge a fraction of it. Although, the percentage
might seem insignificant, it threatens habitat, which is one of the major threats to
wildlife. It is vital that forested areas when designated “protected” be preserved
to prevent further loss of vital habitat. As Sanjay Gubbi stated, protected areas
form only four percent of India’s land area. Given that such a small fraction
within the entire land area of India is actually set aside for protection, it is
suggested that coincidence of environmental impacts of dams within these
protected areas be avoided.102 This option implies that development not be
considered near any protected area, in an effort to avoid increasing stresses on
species.

103
2. The second option pertains to conducting an Environmental Impact Assessment
which includes a wildlife assessment before construction of the link. This wildlife
evaluation should go beyond stating what species are found in the area and also
include how species use the surrounding environment. This is important in
evaluating crucial habitat for wildlife. Although every aspect of the forest has a
functional role in providing wildlife with their essential needs for survival,
identification of how wildlife use particular areas, especially near the area
designated for submergence, could identify areas of greater value to wildlife
within the Panna National Park and Tiger Reserve, such as those that could serve
as a corridors or vital foraging areas.
Conclusion
The rivers of India are the life line for not only people to receive one of their most
essential resources for survival, but also for wildlife. The alterations that would most
likely occur to the environment as a result of this project could very well address the need
of one while hastening the demise of the other, as the extinction of species accelerates
through habitat loss. The submergence of even a small fraction of a protected forest area,
though seemingly insignificant when trying to protect wildlife, should be considered as
part of the much larger, national interlinking project. Precautions taken in earlier, pilot
stages to protect wildlife will in all likelihood also be implemented in future, larger
nation wide projects.
Making wildlife an important consideration in future projects does not mean the
needs of people would not be met. Ultimately, the question is not whether a project to
address the many water issues people face should be provided, but whether a less
destructive approach could be applied. There will be instances in which a large scale
project is necessary; nevertheless, there is value in referencing existing projects to
identify potential negative impacts and thus, reduce increasing threats to wildlife. As
mentioned in the beginning of this chapter, the need to provide water for people is
essential, and it serves as a clear example of the constant competition between wildlife

104
and humans for survival in a limited resource environment. A balanced approach is
necessary to ensure the continuation of an essentially symbiotic, coexistence.

105
1 Berg, L.R &. Raven, P.H. (2001). Environmental. New York: Harcourt. 2 Oza, Gunavant M. and Premlata G. Oza (1998). Wildlife Conservation in India. The
Environmentalist. 18. 219-222. 3 Dwivedi, A.P. (2003) Protected Areas of Madhya Pradesh. Bhopal: Government
Printing Press. 4Oza et al. 1998. Asia, south of China, from the western border of Afghanistan and Pakistan eastwards to the Pacific Ocean (including the Phillipines and the Indonesian Islands), comprises the Oriental region to which India belongs. The United States, in the Nearctic zoogeographic region, and China in the Palearctic region, each have 29 mammalian species on the threatened species list in the Red Data Book of species of the Species Survival Commission (SSC). They occupy jointly- second place in the list. (IUCN, 1966; 1972 as cited in Oza et al. 1998) 5 Connell, Peter, Shirshore Hagi and Nilufar Jahan. “Indian Agriculture: Trends, Trade and
Policy Reform.” Australian Commodities 11(2004): 611 – 630. 6National Water Development Agency (NWDA) (2005). Feasibility Report of Ken-Betwa
Link Project. [Online]. Available: http://nwda.gov.in/index3.asp?sublink2id=25&langid=1 [2005, Dec. 16].
7 Vie, Jean-Christophe (1999). Wildlife rescues- the case of the Petit Saut hydrological
dam in French Guiana. Oryx 33(2): 115-126. 8 National Informatics Centre (NIC), Madhya Pradesh. Panna: City of Diamonds.
[Online]. Available: http://panna.nic.in/mpdistrictsroot.htm [2006, Nov. 26]. 9 South Asia Network on Dams, River, and People (SANDRP) (2005). Ken Betwa Link:
Why it won’t click. New Delhi, India. [Online]. Available: http://www.sandrp.in/riverlinking/knbtwalink.pdf [2005, Nov. 25]
10 Panna Tiger Resort. Madhya Pradesh Wildlife. [Online]. Available:
http://www.spectrumtour.com/panna-tiger-resort/panna-Madhya-pradesh.html [2007, March 27].
11 Kaushal. Interview. 2006, May 28. 12 Ministry of Environment and Forest (MoEF). (2001). Project Tiger Status Report.
[Online]. Available: www.sancturaryasisa.com [2006, Dec. 21].

106
13 MoEF, 2001. 14MoEF, 2001. 15 MoEF, 2001. 16 Kaushal. Interview. 2006, May 28. 17 Barve, N., Kiran, M.C., Vanaraj, G., Aravind, N.A., Rao, D., Shaanker, Uma R.,
Ganeshaiah, K.N., and Poulsen, J.G. (2005). Measuring and Mapping Threats to a Wildlife Sanctuary in Southern India. Conservation Biology 19(1): 122-130.
18 Project Tiger (2006). Panna Tiger Reserve. Official Website of Project Tiger, Ministry
of Environment & Forest (Government of India). [Online]. Available: http://projecttiger.nic.in/index.asp [2006, Dec. 1].
19 Forest Department, Madhya Pradesh (2007). Forest Protection.[Online]. Available:
http://www.forest.mp.gov.in/forestprotection.html [2007, Jan. 2] 20 Kashal. Interview. 2006, May 28. 21 Kashal. Interview. 2006, May 28. 22 Forest Department, Madhya Pradesh (2007). 23 Forest Department, Madhya Pradesh (2007). 24 Kashal. Interview. 2006, May 28. 25 Sekhar, N.U. (2003). Local people’s attitudes towards conservation and wildlife
tourism around Sariska Tiger Reserve, India. Journal of Environmental Management. 69, 339-347.
26 Kashal. Interview. 2006, May 28. 27 Smith, Gar. (2006). Save the Tigers. The Edge: Environmental News from the Brink.
[Online].Available:http://www.earthisland.org/project/newsPage2.cfm?newsID=784&pageID=177&subSiteID=44 [2007, Jan. 23].
28 Smith, 2006. 29 Shastri, Laliti (2005). Madhya Pradesh: A Poachers Paradise. The Hindu: Online
edition of India’s National Newpaper. [Online]. Available: http://www.hindu.com/2005/04/10/stories/2005041001950500.htm [2006, Dec. 28].
107
30 Shastri, Laliti (2005). Madhya Pradesh: A Poachers Paradise. The Hindu: Online
edition of India’s National Newpaper. [Online]. Available: http://www.hindu.com/2005/04/10/stories/2005041001950500.htm [2006, Dec. 28].
31 Smith, Gar. (2006). Save the Tigers. The Edge: Environmental News from the Brink.
[Online].Available:http://www.earthisland.org/project/newsPage2.cfm?newsID=784&pageID=177&subSiteID=44 [2007, Jan. 23].
32 Shastri, 2005. 33 Shastri, 2005. 34 Shastri, 2005. 35 National Informatics Centre, Madhya Pradesh. Panna: City of Diamonds. [Online].
Available: http://panna.nic.in/mpdistrictsroot.htm [2006, Nov. 26]. 36 Dwivedi, A.P. (2003) Protected Areas of Madhya Pradesh. Bhopal: Government
Printing Press. The PNPTR has two entrances-Hinouta and Madla, both 20 km from Panna. 37 Dwivedi, 2003. 38 Thapar, Valmik (2000). Violating India’s Natural Resources. Symposium Participant
of the India 1999: A symposium of the year was. [Online]. Available: http://www.india-seminar.com/2000/485/485%20valmik%20valmik%20thapar.htm [2005, Sept. 19].
39 Gubbi, Sanjay (2004). Temples that turned graveyards of wildlife. Deccan Herald.
India. 40 National Water Development Agency (NWDA) (2005). Feasibility Report of Ken-
Betwa Link Project. [Online]. Available: http://nwda.gov.in/index3.asp?sublink2id=25&langid=1 [2005, Dec. 16].
41 NWDA (2005). Feasibility Report of Ken-Betwa Link Project. 42 NWDA (2005). Feasibility Report of Ken-Betwa Link Project.

108
43 National Informatics Centre (NIC) (2006). Panna City of Diamonds: Tiger Reserve.
[Online]. Avaliable: http://panna.nic.in/tiger.htm [2006, Dec. 1]. 44 Forest Department, Madhya Pradesh (2007). Forest Protection.[Online]. Available:
http://www.forest.mp.gov.in/forestprotection.html [2007, Jan. 2] Kashal. Interview. 2006, May 28. Save the Tigers. Save India’s Tigers. [Online]. Available:
http://www.saveindiastigers.co.uk/panthera-tigris-tigris-india.html [2007, April 4] 45 International Year of the Tiger. The Situation in India. [Online]. Available:
www.internatyearofthetiger.org/india.gif [2007, March 28] 46 Forest Department, Madhya Pradesh (2007). Forest Protection.[Online]. Available:
http://www.forest.mp.gov.in/forestprotection.html [2007, Jan. 2] 47 Project Tiger (2006). Panna Tiger Reserve. Official Website of Project Tiger, Ministry
of Environment & Forest (Government of India). [Online]. Available: http://projecttiger.nic.in/index.asp [2006, Dec. 1].
48 Project Tiger, 2006. Project Tiger is an initiative that was launched in India during 1973-74. It’s mission is to promote tiger conservation by designating “tiger reserves”, which are areas representative of various bio-geograhical regions that are ideal for maintaining a viable tiger population in the natural environment. Project Tiger (2006). Panna Tiger Reserve. Official Website of Project Tiger, Ministry of Environment and Forest (Government of India). 49 National Water Development Agency (NWDA) (2005). Feasibility Report of Ken-
Betwa Link Project. [Online]. Available: http://nwda.gov.in/index3.asp?sublink2id=25&langid=1 [2005, Dec. 16].
50 National Water Development Agency, Government of India. (2005) Feasilibity
Studies. [Online]. Available: http://nwda.gov.in/index2.asp?sublinkid=62&langid=1 [2005, Nov. 15].
51 National Water Development Agency, Government of India. (2005) Feasilibity
Studies. 52 Wildlife First. Challenges to Conservation. [Online]. Available:
http://www.wildlifefirst.info/conchal.htm [2007, Jan 25] 53 National Water Development Agency, Government of India. (2005) Feasilibity
Studies.
109
54 Rangachari, R., Sengupta, N., Iyer, R.R., Banerji, P. and Singh, S.(2000). Large Dams:
India’s Experience. World Commission on Dams. 1-246. 55 Rangachari et al. 2000. 56 Rangarchari et al. 2000. 57 Rangachari, R., Sengupta, N., Iyer, R.R., Banerji, P. and Singh, S.(2000). Large Dams:
India’s Experience. World Commission on Dams. 1-246. 58 Rangarchari et al. 2000. 59 Rangarchari et al. 2000. National Water Development Agency, Government of India. (2005). Feasibility Report for Par Tapi Narmada Link. [Online]. Available: http://nwda.gov.in/writereaddata/sublink2images/268.pdf [2005, Nov. 5].
National Water Development Agency, Government of India. (2005). Feasibility Report Damanganga Pingal Link for Link. [Online]. Available: http://nwda.gov.in/writereaddata/sublink2images/84.pdf [2005, Nov. 5]. 60 Rangarchari et al. 2000. 61 Rangarchari et al. 2000. 62 Rangarchari et al. 2000. 63 Rangarchari et al. 2000. 64 Das, Srabani. Interview. May 25, 2006. 65 Rosenberg, D., McCully, P. & C.M. (2000). Global-Scale Environmental Effects of
Hydrological Alterations: Introduction. BioScience. 50(9), 746-751. 66 Rosenberg et al. 2000. 67 South Asia Network on Dams, Rivers, and People (SANDRP)(2003). How Opposition
is Mounting. New Delhi, India. [Online]http://www.sdnpbd.org/river_basin/differntviews/documents/important3.pdf [2005, Nov. 25].
68 McAllister, D. et al (2001). Biodiversity Impacts of Large Dams. International Union

110
for Conservation of Nature and Natural Resources and the United Nations Environmental Programme. [Online] Available: http://intranet.iucn.org/webfiles/doc/archive/2001/IUCN850.PDF [2006, Dec. 1].
69 McAllister et al., 2001. 70 Dwivedi, A.P. (2003) Protected Areas of Madhya Pradesh. Bhopal: Government
Printing Press. Manhanta, P.C. and Kapoor, D. (1994). Endangered, vulnerable and rare carp species of Ganga River System. Nature Conservators. 21-24. Reddy, P.V. G. K. (1999). Genetic Resources of Indian Major Carps. FAO Fisheries
Technical Paper. No. 387. Pgs. 76 71 McAllister, D. et al (2001). Biodiversity Impacts of Large Dams. International Union
for Conservation of Nature and Natural Resources and the United Nations Environmental Programme. [Online] Available: http://intranet.iucn.org/webfiles/doc/archive/2001/IUCN850.PDF [2006, Dec. 1].
72 McAllister et al., 2001. 73 McAllister et al., 2001. 74 International Reptile Conservation Foundation (IRCF) (2006). Conservation History of
the Gharial.[Online]. Available: http://www.ircf.org/gharial/history3.html [2006, Dec. 1]
75 International Reptile Conservation Foundation (IRCF)(2000). Crocodile Specialist
Group Newsletter. WWW edition. 19(1), 7-11. 76 Vaholikar, Neeraj and M. Firoz Ahmed. (2003). Tracking a Hydel Project: The story of
Lower Subansiri. Ecologist Asia. 11(1) Jan-March. 77 Smith, Brian D. (1998). River Dolphins in Bangladesh: Conservation and the Effects of
Water Development. Environmental Management. 22(3) 323-335. Barrages can be described as gated dams that are built across rivers with the purpose of regulating water discharge. During the monsoon season flows which India experiences, the barrages’ gates are left open and progressively lowered as the flood recedes in an effort to divert water into canals for irrigation and sometimes navigation purposes.77
78 Rosenberg, D., Berkes, F., Bodaly, R.A., Hecky, R.E., Kelly, C.A., Rudd, J.W.M.

111
(1997) Large-scale impacts of hydroelectric development. Environmental Reviews. 5:27–54.
79 Rosenberg et al., 1997. 80 Reeves, G.H., Hohler, D. B, Hansen, B.E., Everest, F. H., Sedell, J.R., Hickman, T.L.,
Shively D.(1997) Fish habitat restoration in the Pacific Northwest: Fish Creek of Oregon. Watershed Restoration: Principles and Practices. Pg.335-359.
81 Rosenberg, D., McCully, P. & C.M. (2000). Global-Scale Environmental Effects of
Hydrological Alterations: Introduction. BioScience. 50(9), 746-751. 82 McAllister, D. et al (2001). Biodiversity Impacts of Large Dams. International Union
for Conservation of Nature and Natural Resources and the United Nations Environmental Programme. [Online] Available: http://intranet.iucn.org/webfiles/doc/archive/2001/IUCN850.PDF [2006, Dec. 1].
83 Rosenberg, D., Berkes, F., Bodaly, R.A., Hecky, R.E., Kelly, C.A., Rudd, J.W.M.
(1997) Large-scale impacts of hydroelectric development. Environmental Reviews. 5:27–54.
84 National Water Development Agency (NWDA) (2005). Feasibility Report of Ken-
Betwa Link Project. [Online]. Available: http://nwda.gov.in/index3.asp?sublink2id=25&langid=1 [2005, Dec. 16].
85 Oza, Gunavant M. and Premlata G. Oza (1998). Wildlife Conservation in India. The
Environmentalist. 18. 219-222. 86 Rangachari, R., Sengupta, N., Iyer, R.R., Banerji, P. and Singh, S.(2000). Large Dams:
India’s Experience. World Commission on Dams. 1-246. 87Rangachari et al. 2000. 88 Rangachari et al. 2000. 89 Rangachari et al. 2000. 90 Rangachari et al. 2000. 91 Rangachari et al. 2000. 92 Rangachari et al. 2000.

112
93 Gubbi, Sanjay. (2004). Temples that turned graveyards of wildlife. Decca Herald: India 94 Gubbi, 2004. 95 Bond, Monica (2003). Principles of Wildlife Corridor Design. Center for Biological
Diversity. 1-4. 96 Chundawat, Raghunandan S, Gogate, Neel, and Johnsingh, A.J.T. (1999). Tigers in
Panna: preliminary results from an Indian tropical dry forest. In: John Seidensticker; Sarah Christie; Peter Jackson (Editors). Riding the Tiger: Tiger Conservation in Human-Dominated Landscapes. Cambridge University Press; Cambridge, New York & Melbourne: 123-129.
97 Chundawat et al. 1999. 98 National Fish and Wildlife (NFWF) (2006). Panna City of Diamonds: Tiger Reserve.
[Online]. Available: http://panna.nic.in/tiger.htm [2006, Dec. 1]. 99 Rosenberg, D., McCully, P. & C.M. (2000). Global-Scale Environmental Effects of
Hydrological Alterations: Introduction. BioScience. 50(9), 746-751. 100 National Water Development Agency (NWDA) (2005). Feasibility Report of Ken-
Betwa Link Project. [Online]. Available: http://nwda.gov.in/index3.asp?sublink2id=25&langid=1 [2005, Dec. 16].
101 Rosenberg et al., 2000. 102 Gubbi, Sanjay. (2004). Temples that turned graveyards of wildlife. Decca Herald:
India .

113
CHAPTER 4: Social Assessment Introduction
When identifying the links between water and well being, it is commonly
acknowledged that water problems affect the poor adversely in terms of their livelihoods,
health and vulnerability. The problems of small and marginal farmers in many parts of
the world are exacerbated by the failure of rainfall and successive droughts, leading to the
unsustainable exploitation of ground water. Moreover, the inefficient management of
drinking water supply, sanitation and irrigation infrastructure, and the politicization and
power rivalry in water allocation affects the poor and marginalized segments of society
disproportionately.1 Ongoing water problems tend to keep such populations in a vicious
cycle that further deepens their poverty.
Ensuring the equitable distribution and wise use of water through improved
management plans can be viewed as an example of environmental justice. Bunyan Bryant
defined environmental justice as “cultural norms, values, rules, requisitions, behaviors,
policies, and decisions to support sustainable communities where people can interact with
confidence that their environment is safe, nurturing, and productive” (Pg. 7).2 While this
concept has been applied largely to the unfair distribution of environmental risks in
developed countries’ minority neighborhoods, it also can be easily applied to the concept
of equitable distribution of natural resources in developing countries where marginalized
populations livelihoods are closely associated with the landscape. Nature then becomes
an important component of this source of livelihood for those who rely on direct access to
field, forests, pastures and waters. For these groups, the fate of the ecosystem in the area
they inhabit is a question of vital importance as their subsistence depends to a
considerable extent on the availability of natural resources. Thus, it can be argued that
marginalized and impoverished communities in developing countries are the most
vulnerable to improperly planned and executed water management.
India’s agricultural sector provides an excellent example of the links between
water resource development, scarcity, inequity, poverty and environmental justice in a
rapidly developing country, as it accounts for 80 percent of total water use in India and
employs 60 percent of the nation’s workforce.3 This segment of society is largely made
up of rural small-scale farmers whose livelihoods are closely tied to the availability,

114
affordability and reliability of agricultural inputs. Although 40 percent of India’s
cropping area is irrigated, many Indian farmers still rely on the seasonal monsoon rains
and rapidly depleting groundwater resources.4 In light of the increasing food consumption
patterns of the rising middle class and the threat of global climate change that can
exacerbate issues of water availability and environmental justice, India must continue its
efforts to develop the country’s water resources to meet future demands.
Although there is many water resource development ideas on the planning tables
of relevant central government agencies, river interlinking is center stage, and apparently
the most contentious. Seen as the answer to India’s potential future water crises, the Ken
Betwa Link Project (KBLP) is the pilot for the much larger nationwide plan. It is
important, therefore, to determine if the benefits and burdens of this resource use would
be evenly spread across different social groups as a key question of environmental
justice. Although this is only one of many issues inherent in the river-linking plan, it is a
vitally important one for rural Indian farmers, as they are already vulnerable to a variety
of social and environmental inequities.
While the National Water Development Agency (NWDA) has designated the Ken
River basin as the surplus provider, indicating that it has an adequate amount of water to
supply not only local needs, but also those of another basin and along a canal as well,
there are many reasons to assume that this may not be accurate. Much of the existing data
on the water resources of the region show that the designated surplus and deficit areas
suffer from the same water shortages and have relatively similar socio-economic and
environmental conditions. Moreover, the NWDA apparently overlooked the data from
social and environmental surveys conducted in the region by the both the government and
independent researchers when discussing the socio economic impacts of the KBLP. Data
from these surveys indicated that the people in the affected regions were not in favor of
large water development projects.
Although there is need for development in the economically depressed and
environmentally depredated Bundelkhand region, the KBLP Feasibility Report (FR) has
not provided adequate information on the potential negative impacts to the already
marginalized project affected persons (PAPs) and the ecosystems on which they depend.
Nor has the FR adequately discussed the relocation of PAPs and long-term livelihood

115
impacts on the general population. Given India’s history of low participation levels from
local communities, inadequate rehabilitation programs and negative impacts on fragile
ecosystems as a result of large-scale development projects, there is risk of irreversible
damage to the region’s people and their land. This damage could adversely impact the
most vulnerable groups in the region if socio economic factors are not properly addressed
by the implementing government agency.
In order to address the socio- economic gaps in the FR analysis, this chapter
synthesizes information gathered from existing quantitative information on the water
needs of the surplus region, anecdotal experience in several of the PAP villages and two
interlinking opponent activist meetings. The reasoning for this research approach is
threefold. First, to analyze existing quantitative information on water resource needs in
the surplus area and summarize key findings to determine if the people of the region are
in favor of large water development projects. Second, to use focus groups in several
relevant villages to complement insight learned from local populations by addressing
these issues with direct reference to the KBLP. The purpose here is to provide a human
element to available statistics in attempt to begin a more specific discussion on the
potential impacts to the marginalized populations who depend upon land-based
subsistence for their livelihoods and are threatened by additional land degradation and
relocation. This element is a particularly important addition to the discussion on poverty
alleviation in marginalized segments of Indian society and its connection to
environmental justice, as a majority of the PAPs are Scheduled Tribes (ST’s), Scheduled
Castes (SC’s) and impoverished rural farmers.
Finally, this chapter provides a third party perspective of the social justice
movement that surrounds the controversy of the KBLP and river interlinking in general.
Thus far it appears as though the movements addressing the KBLP and river linking are
emotionally fueled on the activist side and politically motivated on the government side.
This division leads one to ask how effective these movements are in advocating for
environmental justice through participatory water resource planning. The overall aim of
the discussion that follows is an attempt to synthesize existing information on the project
and to bring the activist and local views together in order to identify gaps and highlight
the need for better communication among all concerned parties. Until this point, it

116
appears as though communication has been limited and that participation has been sparse
or not very effective.
Contextual Framework
Several important theories and operating policies concerning participation,
development induced displacement, land acquisition, and marginalized segments of
Indian society comprise the background framework from which potential cultural and
environmental impacts associated with the KBLP can be identified and better understood.
Theory and Practice of Participation in Water Resource Development
Broadly defined by the World Bank’s Participation Learning Group, participation
is “a process through which stakeholders influence and share control over development
initiatives and the decisions and resources which affect them.”5 Effective participation
requires a commitment from both the expert project planners and the PAPs. On the
experts’ side, practitioners should learn about the population with whom they are
working through an extensive consultation period prior to the actual participation process.
This would give project planners insights into potential behavioral changes that could
cause problems during project implementation, and aids in designing projects that have a
greater potential for actual social change. On the PAPs’ side, it is equally important that
stakeholders share and analyze information, help in establishing priorities, objectives, and
tactics throughout the planning process, to identify those changes in practices and which
new institutional arrangements they would be willing to adopt.
The benefits of establishing an effective institutional participatory environment
where PAPs have a direct impact on sustainable management of natural resources is
summarized by Unver et al.6 Participation by local populations in project planning
processes most importantly provides them access to accurate and credible information
otherwise confined to governing bodies. Having this information, in turn, gives such
populations’ incentive for strategic bargaining behavior and enables them to contribute
more effectively. As a result, the individuals’ increased morale and satisfaction
subsequently increases labor productivity. In addition, participation enhances social
justice, as the poor would also have access to the social regulation of their economy.
Moreover, the community or those most affected by environmental injustice, determine
117
the means and ends of this research.7 Finally and perhaps most importantly, participation
increases levels of transparency and accountability on the side of the project planners.
Although this practice of participatory decision-making is more resource intensive and
time consuming, numerous examples from large projects around the world illustrate that
it yields more lasting results.8
A deliberative participatory approach in water resource management would
enable stakeholders directly connected to the landscape to discuss the social valuation of
environmental goods and services. In addition, it encourages the accountability and
transparency of regulatory agencies. In an era of integrated water resource management,
the establishment of a participatory institution provides an effective forum in which to
identify and address conflicting interests, legislative needs, enforcement mechanisms, and
specific regional water resource considerations.
Defining Development Induced Displacement
Involuntary displacement by its very nature is a disruptive and painful process. In
the global development field, those who are victims of displacement are often referred to
in working documents of large projects. The Asian Development Bank has many
guidebooks on the subject and defines the group as ‘affected persons’ because they ‘stand
to lose as a consequence of the project’ and have ‘no option but to reestablish
elsewhere’.9 The World Commission on Dams considers both ‘physical displacement’
and ‘livelihood displacement’ to adversely affect the economy and health of displaced
populations because they are ‘deprived of their means of production and dislocated from
their existing socio-cultural milieu’.10 As a result, this process creates a high risk of
chronic impoverishment that typically occurs along one or several of the following
dimensions: landlessness, joblessness, homelessness, marginalization, food insecurity,
and social disarticulation.11
Many experts on the subject of Development Induced Displacement (DID) agree
that it has become one of the major social processes in contemporary India. Government
officials and project planners often assume that material gains will outweigh the overall
cost to the concerned peoples, who in turn can be sufficiently rehabilitated to reconstruct
their past social space and continue to develop.12 However, in most cases the benefits of
such projects go directly or indirectly to elite segments of society, thereby leaving the

118
affected communities even more disadvantaged by the loss of their livelihoods and
subsistence, and forced to depend on the market economy for survival. In most cases, the
people displaced may not be in a position to gain any benefit out of the process or
development, and therefore, through these acts of displacement, the ideology of
development further strengthens the already inequitable social relationships in Indian
society.13
Despite the large numbers of people affected from DID and the immeasurable
impact it has had on their lives, no government-sponsored system of information exists
that respects the peoples’ right to know, and consequently, people often have little or no
information about dam submergence and displacement.14 In fact, some people in areas
scheduled for submergence still have not been formally notified, which violates basic
human rights to information and procedural justice. 15
The Land Acquisition Act
Further compromising the adequacy of resettlement packages is that the Indian
government does not have a comprehensive rehabilitation policy to date.16 The Land
Acquisition Act (LAA) of 1894, deals exclusively with the subject of acquisition of
private land by the state, and before it was amended in 1984 to include the provision of
alternative land as compensation, had only provided cash to affected persons. The LAA
was created during a time when social welfare was not regarded as an important factor in
development plans, and unfortunately, the sentiment of current decision makers does not
appear to have changed much since.
The chief shortcoming of the LAA is that is does not acknowledge the rights of
the land-less, as it only provides for the payment of cash compensation to those who have
the title to a piece of land.17 Therefore, those who do not have formal land titles such as
laborers in the agricultural and non-agricultural sectors, artisans, forest produce
collectors, or women with user-rights, are not compensated for their loss. Although these
groups form an integral part of the social and economic fabric of the land and will also
struggle to create a new life, they are not eligible for compensation for their lost
livelihoods. Moreover, the LAA does not contain any provision that the alternative land
is of comparable quality to that which had been acquired, nor is it obligatory for the
authority acquiring the land to assume resettlement and rehabilitation.18

119
Scheduled Caste’s and Scheduled Tribes
Scheduled caste’s (SCs) and scheduled tribes (STs) have traditionally occupied
the lowest positions of the Indian social hierarchy due to historical class and behavior
distinctions, and as a result, they are often subjected to a variety of disabilities,
deprivations and oppressions. Development induced displacement from large projects
tends to adversely impact these marginalized minority groups, which has been
exemplified in postcolonial India by the more than 150 million people displaced due to
the construction of large dams.19 About 40 percent of those dislocated were defined as
scheduled caste, tribe or backward.20 This phenomenon demonstrates the need for
environmental justice, as scheduled castes and tribes only make up 16 and 8 percent,
respectively, of the total Indian population per the 2001 census.21
In ancient times, SC’s were designated as the ‘fifth class’ since they were ranked
outside the four caste delineations and otherwise distinguished by their customs,
occupations and socio-religious ceremonies. The term ‘scheduled caste’ was first used by
the British government of India in 1935 as a substitute for other terms used to describe
their ‘untouchable’ status that related to their social, educational and economic
backwardness.22 In 1950, the independent Indian government revised this list, but
continued the history of distinguishing them from other segments of society. Currently,
SCs typically make a living in the lowest occupations in Indian society including
leatherwork, carrion removal, agricultural laborers, servants, messengers and street
sweepers.23
In 1950 the President of India defined ‘scheduled tribe’ as “indication of primitive
traits, distinctive culture, geographic isolation, shyness of contact with the community at
large and backwardness.”24 Historically, ecological and social isolation have been the
principle features of this group, though their modern day occupations vary from forest
food gathers to industrial laborers, with the majority dependent on agriculture with forest
produce as a secondary support.25 Through contact with the general population over time,
some tribal communities have become better assimilated into the Hindu culture while
others continue to remain outside due to religious differences or physical isolation.
Generally these populations are characterized by subsistence livelihoods and
perceive land as a primary source of survival. By comparison, higher-class segments of
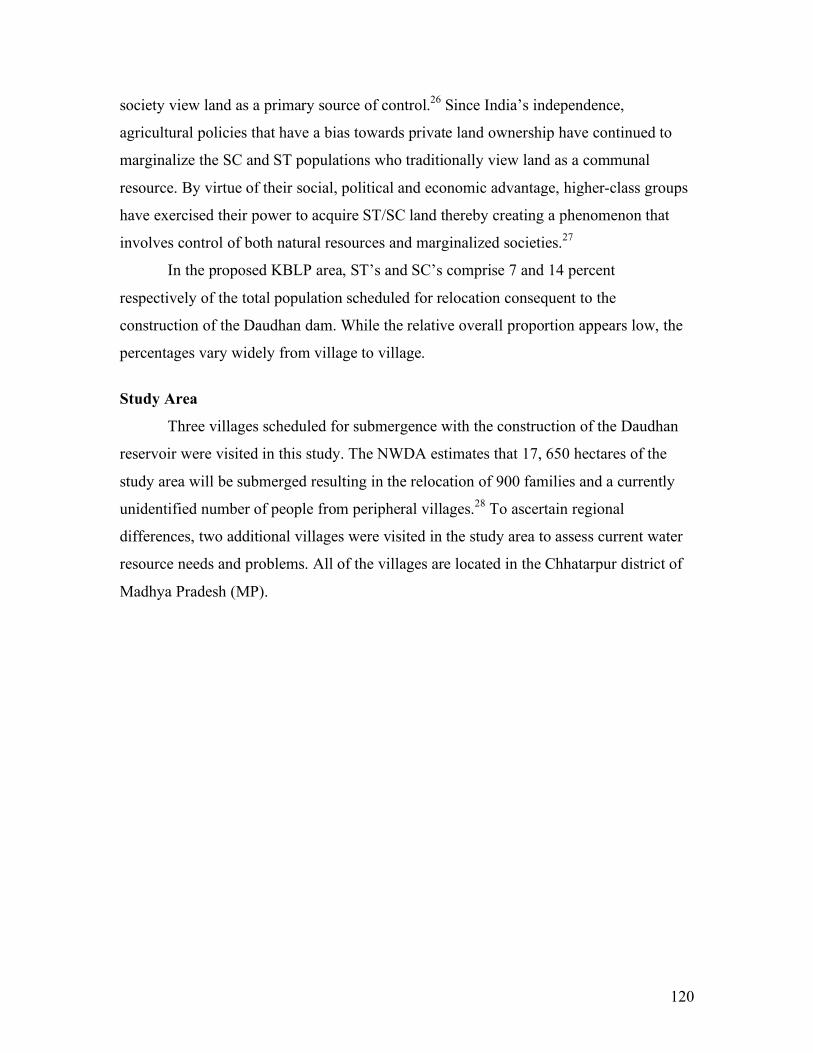
120
society view land as a primary source of control.26 Since India’s independence,
agricultural policies that have a bias towards private land ownership have continued to
marginalize the SC and ST populations who traditionally view land as a communal
resource. By virtue of their social, political and economic advantage, higher-class groups
have exercised their power to acquire ST/SC land thereby creating a phenomenon that
involves control of both natural resources and marginalized societies.27
In the proposed KBLP area, ST’s and SC’s comprise 7 and 14 percent
respectively of the total population scheduled for relocation consequent to the
construction of the Daudhan dam. While the relative overall proportion appears low, the
percentages vary widely from village to village.
Study Area
Three villages scheduled for submergence with the construction of the Daudhan
reservoir were visited in this study. The NWDA estimates that 17, 650 hectares of the
study area will be submerged resulting in the relocation of 900 families and a currently
unidentified number of people from peripheral villages.28 To ascertain regional
differences, two additional villages were visited in the study area to assess current water
resource needs and problems. All of the villages are located in the Chhatarpur district of
Madhya Pradesh (MP).

121
Figure 1: A map of the study area. All of the villages highlighted in red were visited. MP is one of the poorest states in India with a per capita income of only about
$180 in 1998, and about 40 percent of its 60 million people living below the poverty
line.29 In addition, MP ranks extremely low nationwide on all indicators of human
development indices, such as per capita state domestic product, life expectancy,
education levels, literacy, and infant mortality rates.30 More than 80 percent of the poor
live in rural areas, with high concentrations in the study area. One third of the population
belongs to socially and economically disadvantaged groups officially designated as STs
and SCs. Moreover, MP has the largest population of tribals in India, with STs
comprising 23.27% of the states population in 1991.31 The proportion of poor is
substantially higher among the tribal groups with 66 percent living at or below the
poverty line.32

122
India/State Total Population
Scheduled Castes (SC) Population
Scheduled Tribes (ST) Population
Proportion of SC
population
Proportion of ST
population Uttar
Pradesh 166,197,921 35,148,377 107,963
21.1
0.1
Madhya Pradesh
60,348,023 9,155,177 12,233,474 15.2 20.3
India 1,028,610,328 166,635,700 84,326,240 16.2
8.2
Table 1: Proportion of SC’s and ST’s to General Population and KBPL Area Source: Census of India 2001 33
Three out of the nine villages scheduled for submergence as a result of the
Daudhan Reservoir in Chhatarpur District were visited in this study. Chhatarpur district is
elongated from the southwest to the northeast and has an area of 8,687 square
kilometers.34 The district is surrounded by Mahoba district to the north, Damoh district to
the south, Panna district to the east and Tikamgarth district to the west. The remaining
relevant demographics are reported in Table 2.
District Population (2001)
Share of
MP
population
(2001)
Life Expectancy (years) (1991)
Population Density/sq km (2001)
Rural Population (2001)
Rural Poverty Rate (1993 – 94)
Chhatarpur 1,474,633 2.44% 50.4 170 78% 48.9% Table 2: Demographics of Chhatarpur District Source: Government of Madhya Pradesh 35

123
Population Reported in Numbers
General SC ST Literate Workers Cultivators
Total Village Name
M F M F M F M F M F M F
Sukwaha/
Mainari
297 258 36 28 208 194 16 5 208 81 140 n/a 1471
Bhorkhuwa 36 40 n/a n/a 1 3 1 n/a 23 6 8 n/a 118
Kharyani 340 343 39 38 99 128 89 15 206 80 114 2 1493
Palkoha 480 435 138 140 27 19 73 11 282 68 88 31 1792
Daudhan 173 151 n/a n/a 73 75 40 8 79 n/a 28 n/a 627
Kupi 560 506 116 103 154 160 105 17 320 119 173 57 2390
Basudha 51 43 n/a n/a 30 25 3 n/a 28 15 19 n/a 214
Ghughari 25 24 n/a n/a 22 23 1 n/a 15 2 9 n/a 121
Sahpura 82 88 n/a n/a n/a n/a 27 5 53 25 42 1 323
Total 8549
Total Visited 2722
Note: Villages visited by the researcher are in bold italics Source: NWDA Feasibility Report Chapter 7 36
Table 3 has been adapted from the FR to display the population characteristics of these remote villages. It is important to note that the figures presented in this table are from the 1981 census and since then, two Indian census sets have been released. While it is difficult to get the latest census data at the village level, the 1991 census data should have been readily available for the NWDA as the FR was created in the last five years. It is very likely that some of these numbers have increased because population density in the district has increased. For example, nationwide population density in 1991 was reported at 133-persons/sq km and in 2001 it had increased to 170-persons/sq km though in villages significant migration to cities has been reported.37 Furthermore, data in the FR was available for only one of the six proposed dams of the KBLP.

124
Chhatarpur district is characterized by a combination of hill and plateau
landscapes ranging between 100m to 500m above the mean sea level.38 The Panna range,
central plateau and the northern plains are the three main physical divisions that result
from this diversity. Much of the district hosts a variety of rock systems that provide a
good resource for various mining activities, but a challenge for agricultural productivity
due to the rocky soils in most areas. The Ken and Dhasan are the two main rivers that
flow through Chhatarpur and are fed by a multitude of small tributaries. This district as a
whole lies in a Ganga (Ganges) drainage system.
According to the Government of MP, approximately 18% of Chhatarpur’s total
area is covered by forest.39 The type of forest found in the region is southern tropical dry
deciduous, meaning that during the hottest times of the year the trees loose their leaves to
conserve water and facilitate the growth of the underbrush by opening up a new layer.40
Significant tree species such as teak, bamboo, mahua, salai, tendu and neem provide
resources for some subsistence based livelihoods and are commercially important for
timber interests.41 Unfortunately as a result of largely uncontrolled extraction by timber
mafias, government and commercial interests, the district has large areas of degraded
forests. In addition, encroachment, cattle grazing and deliberate forest fires caused by
local populations have further degraded the regions forests. This is especially apparent in
catchment areas and therefore has serious implications for water resources management,
as it causes substantial siltation of reservoirs, watercourse and irrigation canals.42
January is considered the coolest month of the year, with temperatures ranging
between 6 to 23 degrees Celsius. May is the hottest time of year, with temperatures
reaching up to 44 degrees Celsius. The area is classified as semi-arid to dry sub-humid,
with about 90% of the annual rainfall occurring during the regions monsoon season from
June to September.43 At this time soil moisture is rejuvenated, some crops naturally
irrigated and water resources such as tanks, ponds and ground water renewed.
Throughout the rest of the year, rainfall is erratic and does not contribute much to the soil
moisture requirements. July and August 2006 did not receive the usual amount of rainfall
expected at that time of year and existing reservoirs, ponds, rivers and tributaries
remained unusually low according to the locals. Rural and urban residents alike were
concerned about meeting their water needs through out the rest of the year.

125
The majority of the rural population in the study area depends on agriculture and
associated industries for their livelihood. Out of this population, 20 percent work as
agricultural labors.44 This designation indicates they engage in casual wage labor and do
not have any right of lease or contract on the land that they work.
District/State/India Primary Secondary Tertiary Non-Farm
Chhatarpur 90.1 4.4 5.5 10.0
Madhya Pradesh 75.4 9.2 15.4 25.4
India 67.5 12.0 20.5 33.1
Table 4: Percentage of Rural Workers Employed in Various Sectors (1991). The primary sector refers to all work related to agriculture, allied activities, mining, and quarrying. Allied activities refer to people engaged in animal husbandry, grazing, fishing, hunting, plantations and orchards. The secondary sector refers to all activities related to construction and manufacturing activities. The tertiary sector refers to all types of services. The non-farm sector indicates all types of work not related to the primary, secondary and tertiary sectors. Source: Government of Madhya Pradesh45 Wheat, barley, gram, peas, maize, rice, lentils, groundnuts, soybeans and flax
seeds are the most commonly harvested crops in the study area. Most farmers have one
harvest per year and two only when there is adequate water. Despite this, agricultural
production has significantly and steadily increased in the last 30 years in terms of net area
sown and agricultural yields.
The majority of farmers in the study area are considered marginal and small,
which in Indian terms indicates they own between one and five acres of land. Such
groups typically own between two to four acres and on average lease two to three
additional acres, which is uneconomical by any standards.46 As a result, many of these
subsistence farmers have to complement their yield with agricultural labor elsewhere
and/or work in other non-farm sectors such as services, pottery, hair cutting, carpentry,
fishing etc. Fishing is especially important to communities living near bodies of water.
Such income supplements depend on the availability of work and caste delineation.

126
Another important income supplement for farmers and agricultural laborers in the
study area is the collection and sale of non-timber forest products, especially loads of fuel
wood that are sold in nearby markets. Non-timber forest food products include fruits,
tuberous roots, and fodder for livestock. Other examples include the production of
disposable plates using tendu leaves and local wine using mahua flowers. While the
collection of non-timber forest products is popular throughout MP since 40 percent of its
villages are situated near forests, collection of these products is especially apparent in the
communities surrounding the Panna Reserve Forest. SC’s and ST’s typically engage in
these activities, which in many cases lead to exploitative relationships with the dominant
segments of society.47
Given that 90 percent of the study regions’ rainfall occurs four months of the
year, water availability critically depends on the extent of storage of water from surface
water capture or as groundwater. Irrigation accounts for a large portion of the water use
and the net irrigated area in Chhatarpur has significantly increased from 22 percent in
1978 to 44 percent in 1999.48 This has mainly been accomplished by expanding
groundwater irrigation, with modest increases in surface water irrigation. The majority of
farmers in the study area depended on private or communal ground water resources,
displayed in Table 5. Ground water is taken from wells with diesel or electric operated
pumps and applied to the field by large hose. The second most common method of
irrigation comes from the use of canals fed by the local Rangawa dam.
When technical experts were not available or were too expensive to hire, locals in
the region located ground water sources by using traditional methodology, involving
water diviners or men considered holy. They say a mantra and use what is known as a
‘guarava’ stick or a coconut to locate water sources by walking the premises with either
object. When the stick or the hairs of the coconut rise over a certain spot it indicates a
ground water source. The client then begins construction of a well at the designated spot,
which typically takes four months. This service is largely successful and costs between
Rs. 1,000 to 1,500 (US$22 – 34).

127
Source of Irrigation Net Irrigated Area (hectares)
Canals and Tanks 25,365
Lift Irrigation 1,514
Tube wells 466
Masonry Wells 79,400
Stop-dams 340
Other sources 6,000
Total 113,085
Percent of total area sown 48.09
Table 5: Different Sources of Irrigation in 1997 Source: Department of Agriculture, Chhatarpur 49 Methodology
A variety of methods such as focus group interviews, participant observation in
river linking opponent workshops, observation in villages and the consultation of
secondary data were used to collect information for this study. All of these components
were then compared to what was reported in the FR. This multiple research approach
used by social scientists is called triangulation, which analyzes the same phenomenon
from several different vantage points, crosschecking observations to produce a more
accurate picture.50 Since every research methodology has its limitations and advantages,
triangulation reveals the complexities of the situation under examination.51 By combining
multiple methodologies, the intrinsic problems that result from single method studies are
better overcome. The purpose of using triangulation in this study was to increase the
validity and reliability for research outcomes.
Focus group methodology, the largest component of this triangulation method,
was chosen because it is capable of producing not only more richly detained responses,
but also frequently, unanticipated ones. Focus groups are referred to as an interview
technique for small groups in which the researcher aims to promote a spontaneous
exchange of views among participants on a given topic of interest.52 This method is based

128
on natural conversation and excels in revealing not only what participants think, but also
why they do.53 It attempts to tap into the basic values, norms and feelings that underlie
decisions. Furthermore, this insight goes beyond the simplistic categorical answers
generated by survey questions by prompting nuanced, open-ended and sometimes
unexpected responses.54
1. Village level focus groups: Intermediaries from Haritika, a local NGO working with
impoverished populations on water resource development, sanitation and social progress
issues, assisted in the information gathering process during the village focus groups.
Local entrepreneurs from the nearby town of Khajuraho, MP who had previous
experience hosting foreign visitors also assisted in several village visits. Both groups
helped locate the villages, arrange transport, recruited participants and provided
translation services. In July 2006, five focus group sessions were conducted with rural
farmers, ST and SC populations in five villages of Chhatarpur district. Three of these
villages were scheduled for submergence as a result of the KBLP and two were not.
Those scheduled for submergence are Kupi, Bhorkhuwa and Basudha. Focus groups
conducted in Pahari and Bhatpur villages provided insight into some of the existing
interstate water resource conflicts. The objective of this segment of the project was to
learn what people believed was the best method for harvesting water resources in their
area and to examine their level of participation in the water infrastructure planning
process through the lens of environmental justice.
Upon arrival in the villages, a leader figure was located and explained the purpose
of the visit. He in turn gathered members of the village who were interested in discussing
the proposed topic. Large crowds typically gathered and anywhere from 6 to 12 men who
voluntarily participated in the discussion. The appointed translator was given the set of
questions, which he then offered to the group. The questions included their usage of
water, perceptions of surpluses and deficits in the region, floods, droughts, access to
water, and level and type of knowledge of and continuing questions about the KBLP.
After the discussion, there was often a tour of the village with a special focus on the
water resource infrastructure. The average time spent in each village was about three
hours.

129
2. NGO focus group: To complement information collected from the villages, other
segments of the Indian society with a vested interest in the outcome of the KBLP were
also asked for information on their work with local populations in and around the study
area and their opinions of the KBLP. Given their familiarity with centrally planned water
resource development in India, they were also asked to comment on their level of
participation in the planning process. The participants from this group were generally
employed by NGO’s or local government agencies, which are funded by relevant central
and state government or international agencies. Many poverty extension workers are
involved in local watershed management or establishing sustainable agriculture based on
the revitalization of traditional methods. All were educated and held degrees ranging
from undergraduate to doctorate levels.
This event was planned and executed collaboratively by researchers from the
University of Michigan and India’s Center for Environmental Education - North (CEE).
CEE is a national institution engaged in developing programs and material to increase
awareness about the environment in order to promote the wise use of natural resources.
CEE assisted in recruiting participants through existing partnerships, arranging the venue,
moderating discussion and providing translation services when necessary. Out of 25
people invited to the meeting via email, a total of 15 NGO, local government officials,
poverty and agricultural extension workers participated in the daylong focus group. The
moderator from CEE was familiarized with the objectives of the research before hand and
prompted participants to respond accordingly. Each participant took the opportunity to
present their ideas on the interlinking of rivers, extent of action taken on the KBLP, water
resource issues in the area, problems of environmental degradation and their experience
with livelihood issues. The meeting was then opened to group discussions based on the
research questions.
3. Participant Observer: A workshop that was planned and executed by India’s
National Alliance of People’s Movements (NAPM) was observed to help provide insight
of the river linking opponents’ viewpoints and level of participation in the project
process. NAPM is a collection of over two hundred people’s organizations and
movements struggling for equal rights over natural resources, true internationalism and a
sustainable society. While the movement has addressed a multitude of social struggles

130
throughout India, they have considerable experience in development-induced
displacement from large dams and have been very active in discussions on the nationwide
interlinking of rivers. This workshop was held in response to the release of the KBLP
Feasibility Report with the intention of strategizing on further courses of action at all
levels such as publishing scientific arguments against interlinking of rivers for
dissemination at the local and governmental level and engaging the national media on the
issue. The research objectives were presented to the moderators before hand, who
incorporated it into their discussions with 20 – 30 participants each day. NAPM members
and participants provided translation services. The participants in this workshop came
from diverse backgrounds and had professions ranging from business, social activism,
politics, religious services, poverty extension services, military, agriculture and fisheries.
4. Analysis of secondary survey research data: In order to assess the empirical
distributions of attitudes towards the availability, accessibility and quality of water
resource infrastructure, researchers in the study area and throughout India often opted for
survey questionnaires administered to a large probability sample. In fact, two surveys of
this type had been conducted in the study area and were analyzed for this study as a
secondary source of information. The National Council of Applied Economic Research
(NCAER) conducted one in 1994 after they were hired by the NWDA to provide a
benchmark survey of the socio- and agro- economic conditions in the entire KBLP
impacted region. The purpose of this survey was to gather information regarding the local
population’s preferences in water infrastructure and their understanding of the KBLP.
Another survey of the entire Bundelkhand region’s water resources and associated issues
was conducted in the mid – 1990’s by a local scientists and activists. Over 1,000 villages
selected at random through out the region were surveyed to determine the type and extent
of water-resources both for drinking and irrigation, the quality of water (based on peoples
perception), mechanism and maintenance of these resources, agricultural practices, floods
and drought situations, traditional practices, existing problems and government responses
to these problems. Out of the total number surveyed, 143 villages were from Chhatarpur
district.
5. Informal Interviews: During the time spent in the study area, a variety of people
provided additional information that assisted in better understanding the KBLP. The

131
driver was a good source of information in some areas that were unfamiliar to the
research team. During focus group session he would also mingle with the community
members that were not involved and later report additional details to the team. Out side of
the formal research sessions, there was much interaction with the people from local towns
in the Ken Basin that would share their opinions and understanding of the KBLP during
informal conversations in teashops. Discussions with NGO members and anti-linking
activists outside of the formal focus group or workshop setting were also very
informative. It was during these discussions that their level of participation in the project
planning process and relationship with the government was fully understood.
6. Transcription: Focus group interviews and workshops were translated on the scene,
digitally recorded and later analyzed according to themes.
Results of the Study
Submergence villages: Kupi, Bhorkhuwa and Basudha
These villages were located inside a forest reserve accessed by a minimally
protected gate manned by a locally appointed forest guard. The role of the forest guard
was to protect the forest resources and create awareness amongst the villagers about wise
extraction. The main threat reported by the guard was the local ‘timber mafia’, who
routinely illegally extracted timber resources. Such groups were often armed, while the
guard was alone at the gate with only a stick to protect himself and the option to notify
local police if trouble were to arise.
Forests were the primary features of the landscape with few agricultural fields in
between, enclosing the villages and obviously utilized by local populations, as evidenced
by the various stages of re-growth in some sections. Several participants were members
of local forestry committees responsible for protecting the forest by encouraging
sustainable collection methods and establishing plantations. Such groups also engaged in
construction of check dams and ponds or the general maintenance of water infrastructure.
At the time of the research, the agricultural fields were bare since sowing typically
occurred in October after water had been sufficiently collected in the region and later
harvested in March. Table 6 provides the land use break down of the submergence area.
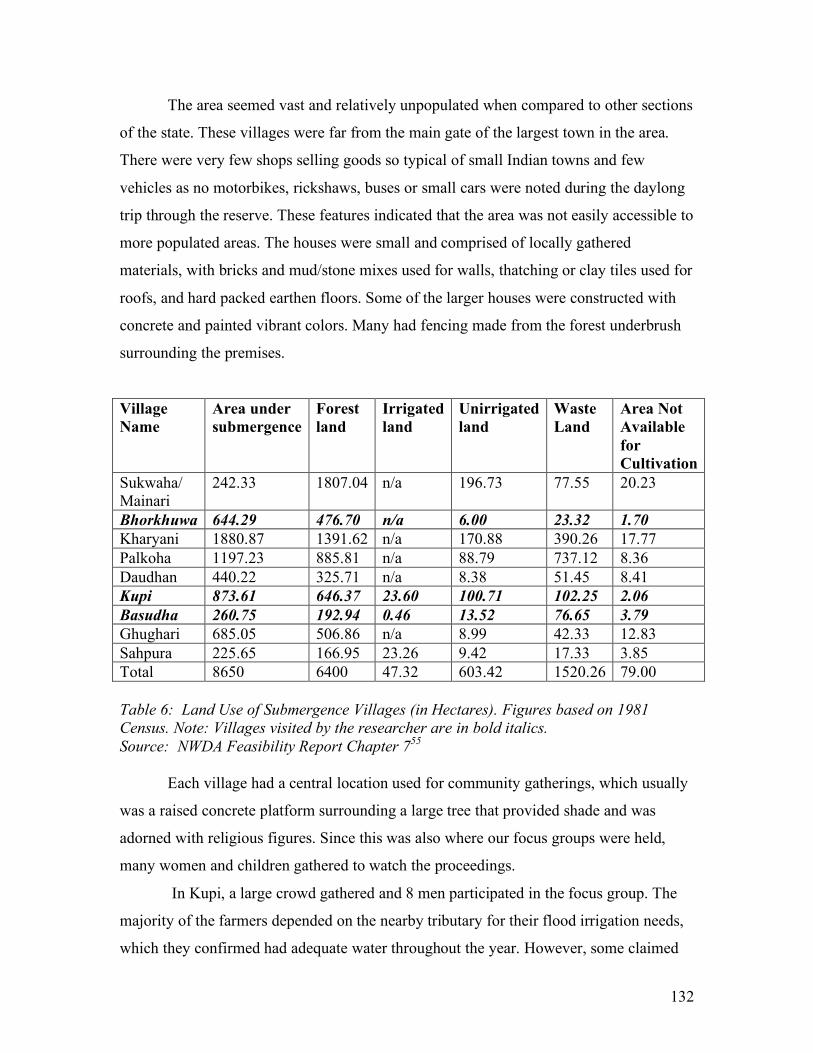
132
The area seemed vast and relatively unpopulated when compared to other sections
of the state. These villages were far from the main gate of the largest town in the area.
There were very few shops selling goods so typical of small Indian towns and few
vehicles as no motorbikes, rickshaws, buses or small cars were noted during the daylong
trip through the reserve. These features indicated that the area was not easily accessible to
more populated areas. The houses were small and comprised of locally gathered
materials, with bricks and mud/stone mixes used for walls, thatching or clay tiles used for
roofs, and hard packed earthen floors. Some of the larger houses were constructed with
concrete and painted vibrant colors. Many had fencing made from the forest underbrush
surrounding the premises.
Village Name
Area under submergence
Forest land
Irrigated land
Unirrigated land
Waste Land
Area Not Available for Cultivation
Sukwaha/ Mainari
242.33 1807.04 n/a 196.73 77.55 20.23
Bhorkhuwa 644.29 476.70 n/a 6.00 23.32 1.70 Kharyani 1880.87 1391.62 n/a 170.88 390.26 17.77 Palkoha 1197.23 885.81 n/a 88.79 737.12 8.36 Daudhan 440.22 325.71 n/a 8.38 51.45 8.41 Kupi 873.61 646.37 23.60 100.71 102.25 2.06 Basudha 260.75 192.94 0.46 13.52 76.65 3.79 Ghughari 685.05 506.86 n/a 8.99 42.33 12.83 Sahpura 225.65 166.95 23.26 9.42 17.33 3.85 Total 8650 6400 47.32 603.42 1520.26 79.00 Table 6: Land Use of Submergence Villages (in Hectares). Figures based on 1981 Census. Note: Villages visited by the researcher are in bold italics. Source: NWDA Feasibility Report Chapter 755 Each village had a central location used for community gatherings, which usually
was a raised concrete platform surrounding a large tree that provided shade and was
adorned with religious figures. Since this was also where our focus groups were held,
many women and children gathered to watch the proceedings.
In Kupi, a large crowd gathered and 8 men participated in the focus group. The
majority of the farmers depended on the nearby tributary for their flood irrigation needs,
which they confirmed had adequate water throughout the year. However, some claimed

133
that the water in the basin has been decreasing over the last two years due to insufficient
rainfall. No one in the group could remember the last serious drought, but mentioned that
flooding was common every 10 – 15 years. The ground water sources were low, but since
they largely depended on the tributary, this was not as much of concern for them. When
asked for suggestions on better irrigation plans, lift irrigation, the construction of check
dams and the expansion of the existing three small lakes in the area were cited.
The majority of the group was knowledgeable about the basic details of the
KBLP, primarily through government newspaper, radio and television ads. In addition,
several participants recalled a government team surveying the area and NGO groups that
came to educate the community about the project. When asked about the potential
benefits from the project, they felt as though none were to be had for their community as
it did not provide additional electricity and they would have to migrate elsewhere.
Regarding this, one participant stated: ‘How could our village benefit from this project at
all if none of our needs are being met and we have to move to places where we are likely
suffer from the same problems?’. Some were also visibly upset about their water going to
another state while they were being forced to migrate. They did not feel as though there
would be any long-term benefits from potential construction jobs, which are generally
short-term low wage positions. They were mostly concerned about the loss of
generational land, which they felt could not be adequately replaced by the government.
Moreover, many were concerned about the loss of forest products since a majority of the
villages’ landless population was dependant on them. None seemed confident that the
government would replace the forest resources. One participant mentioned a story about a
relative in a nearby area that had to be relocated as a result of dam and was still in bad
condition after relocation. All participants were interested in receiving a Hindi copy of
the feasibility report.
In Bhorkhuwa, 6 men participated in the focus group though a man in charge of
the local forestry committee contributed much of the information. The population of this
village was solely dependent on surface water sources for all uses because the lift
irrigation structures put in place by the local government had been destroyed and not
replaced after a flood in 1996. While they did not feel its replacement was likely to
happen, they still claimed that improvements in lift irrigation structures and construction

134
of check dams would improve their water needs. The entire population was dependent on
subsistence agriculture, supplemented by the use of nearby forest products. When asked
about the KBLP, none of the participants knew about it but after a brief description,
indicated that they would like to know more.
Basudha village was located directly outside one of Panna National Park’s gates
and protected by a lone forest guard. This entrance also leads to four of the forest villages
that will be submerged as a result of the Daudhan dam. Due to the threat of bandit
attacks, the research team was not permitted by the forest guard to visit these villages nor
view the site of the proposed dam. The discussion among the 6 participants in this focus
group mainly involved their problems with the bandit groups who lived in the forest, as
many claimed they were not able to farm due to the fear of running into trouble with
these groups. In addition, the participants cited conflicts with other populations who had
come into the area to plant mustard seed crops. This issue has caused many disputes over
land ownership, as there was little cultivatable land available in the area. The dilemma
was best described by a participant who stated: “our lives depend on this land and yet
there is constant fighting over who owns it…a situation that is made worse by the water
problems we face and the bandits who loom in the shadows.”
This village also reported serious issues with low ground water levels as a result
of too many boreholes and the absence of check dams. Thus, during the months before
the first monsoon rains there is no ground water to support their needs and many have to
travel long distances to the Ken River to collect it. In addition, only one small lake was
reported to exist in the area. Not surprisingly, the suggestions for improvement of water
sources were to deepen the existing boreholes, establish additional boreholes, and
construct check dams in order to recharge ground water and expand the lake system.
Participants were convinced that additional water would increase their harvest and thus
the ability to move from subsistence agriculture to profitability.
The participants were aware of the KBLP through government announcements in
the newspaper and a sign on the main road. This sign was in both Hindi and English and
placed along the main road at the turn to where this series of villages was located.56 It
was rather large and explained that the NWDA was planning to build a dam for the
KBLP. In addition, participants mentioned that government surveyor had come to the

135
area. Though the participants believed that they would be a periphery village and not
completely submerged, the loss of arable land concerned them because it would
exacerbate existing conflicts over land ownership.
Villages along the Ken River: Pahari and Bhatpur
These villages were different from those scheduled for submergence in several
ways. First, the locations did not seem as remote, and although there were still very few
vehicles in the area, the main roads appeared more populated with people. Town centers
were not as far apart and there was much activity in between; development such as dams,
roads and train tracks construction were noticeable features of the landscape. There
appeared to be more shops and herds of cattle and goats were seen grazing in many
locations, while they were non-existent in the previous three villages. Perhaps the biggest
difference was the presence of forest. While there were still large swaths of forest in the
region, they were not as accessible to this set of villages. As a result, forests were more
established and showed little sign of community harvesting. Therefore, the majority of
the focus group participants were dependant solely on subsistence agriculture.
Many of the houses were made of the mud/stone combination, with the exception
being the village centers which were made from concrete and painted colorfully. Each
village also had similar locations for community gatherings. These two villages were
largely dependent on ground water sources to meet all of their livelihood needs and large
dams were prevalent in the area.
Pahari village was located near Ken River’s Bariyarpur weir, downstream from
the proposed site of the Daudhan dam. This weir was built in MP by UP in 1905 and
irrigated nearby districts along the border through a canal system. In the late 1970’s, a
large canal was added to the Bariyarpur weir to provide water to the Panna district as
well. However, the residents of the village received the majority of their water from the
Rangwan dam, another interstate irrigation endeavor were disputes over control have
occurred.57 As a result of the interstate disputes and untimely water releases from both
structures, the residents were furious that they were only provided with canal water once
per year when in actuality they needed it three times per year. Moreover, the construction
of the Bariyarpur weir had negatively affected availability of water from a small river that
they had previously depended on. This community was visibly enraged that a weir

136
located in their area was providing more water to the neighboring state, while their local
water sources were being negatively impacted and they were not receiving their share.
The village’s elected leader summed the situation they face well:
“This project was meant to benefit us and the people of MP. But now we see that our powerful neighbors have gained more control over the water that flows though our village. This would not be as much of a problem if our limited water supply was not harmed in the meantime. What’s worse is that no one in the government has heard our cries.”
The 10-person focus group had not heard anything about the KBLP, but was eager to talk
to the research team about their water problems with the hopes that their concerns would
be reported to the appropriate government officials.
In Bhatpur, residents were primarily concerned with a large flood that had
occurred in 2005, when about 150 of the houses had been destroyed and the government
had not provided adequate assistance to cover their losses. As a result, a year after the
flood, many of the poorest residents’ mud/stone houses remained in ruins throughout the
village. The majority of the village relied on groundwater sources and one small pond
that they considered to be sufficient. However, they were upset that they were not
receiving any water from the nearby dam. They also suggested that the construction of
check dams and expansion of nearby ponds would address their water needs. When asked
about the KBLP, several of the 10 participants knew about it through newspaper ads and
a political group who visited their village with the intention of encouraging opposition to
it. While they were not as concerned with the threat of relocation, many were upset about
the issue of sending their water to UP through the KBLP and similar projects.
NGO focus groups
The discussion generally involved a critique of the FR’s analysis and its disregard
for alternative water resource distribution techniques. Contributions from the participants
were based on personal experiences working on social and environmental issues in the
region. The group unanimously agreed that the Ken basin should not be considered a
surplus for several reasons. First, the Ken and Betwa rivers were in the same basin and
experience similar times of drought and flood. Further, both basins have similar soil and
hydrology characteristics. Many argued that the data used to portray the Ken as surplus
basin was largely based on faulty science, and that no river basin in India has been

137
thoroughly assessed in a way that would properly support this claim. To illustrate, one
participant identified sections of the FR where the existing irrigation data for the two
basins had been manipulated to justify the need for transferring water supposedly not
utilized in the surplus basin. All of the participants agreed that drainage patterns, siltation
rates, hydrology issues, existing ecological problems, social impacts and a realistic
economic analysis have not been adequately addressed in the FR.
It was agreed that though the immediate benefits of the KBLP might be obvious,
the long-term more subtle impacts could have disastrous affects on the population and
landscape. This claim was supported by participants who drew from their knowledge of
the two rivers and existing water infrastructure in the area. For instance, since both rivers
flow in a south to north direction, the east to west design of the link will block the natural
drainage in the area. This unnatural diversion could adversely impact the flows of both as
a result. Additionally, because of the rates soil erosion in the area, dam siltation was
much higher than typically reported by the Indian Ministry of Water Resources, and the
participants concluded that this would negatively impact any dams built for the KBLP.
Some participants also questioned the potential impacts on the flora and fauna when
mixing the unfamiliar chemistry of the two rivers, which they believed had also not been
thoroughly assessed in the FR.
When asked about the beneficiaries of this project, one participant stated that
‘politicians, engineers, contractors, and temporary workers would be the only obvious
ones’, alluding to the unequal benefit sharing dynamic that activists had commonly seen
in projects such as these. Regarding the issue of communities scheduled for submergence,
some were doubtful that only 10,000 people would be relocated as a result of the project.
One participant claimed that the number could potentially increase to 60,000 once
impacts from all of the dams were tallied. In addition, some participants were convinced
that the KBLP would only control a small amount of floodwater and could potentially
divert floods to new areas.
Many participants were also suspicious of the sudden agreement between MP and
UP to go through with the project in 2005, when only a few years before an MP
government analysis had openly rejected the plan, with one participant suggesting that
this was due to a Supreme Court decision forcing compromises between relevant states.

138
The majority of the participants cited watershed restoration and traditional water
harvesting as the best way to meet the water needs of area. A participant quoted an old
saying that he felt essential to the discussion, ‘water in farmlands should be captured in
the farm and water of the village should remain in the village’. On this note he mentioned
that only 11 percent of the rainwater is currently captured in the traditional pond systems
while the remainder is wasted due to evaporation and run-off. As a result, many
participants agreed that reviving the ancient tank/pond/lake rainwater capture strategy
had a higher potential for sustainably utilizing water resources. One participant claimed
that with only a quarter of the money being spent on the KBLP, water problems in the
region could be solved through traditional technology. Several participants advocated for
afforestation activities to combat the increasing problems of soil erosion in the area.
At the conclusion of this daylong focus group, the participants were reminded of
the need for action and several suggestions were made. First, it was suggested that all of
the relevant NGOs in the area join together in a follow up meeting to combine their
relevant scientific and social information. To complement the joint document created by
NGO’s, independent environmental, social and financial KBLP impact studies should
also be created with the help of local academic institutions. After this information was
gathered, a large-scale audiovisual awareness campaign for the local populations should
be created and documents sent to relevant government agencies. Public hearings between
all involved parties could then be held to debate the issues, and it was noted that PAPs
and government officials should also be included since both had been largely absent from
these types of discussions. Finally, all participants reaffirmed the importance of
promoting nature-based water resource development such as traditional rainwater
harvesting, water conservation, afforestation and watershed restoration.
Activist Workshop
This two-day meeting was designed to share information and strategize for action.
National and local television and print media were present to document the outcome and
disseminate information to the public.
The discussions from the first day were largely based on sharing descriptions of
impacts from similar projects on marginalized segments of Indian society and the
environment. Examples of past dam projects and current links under construction were
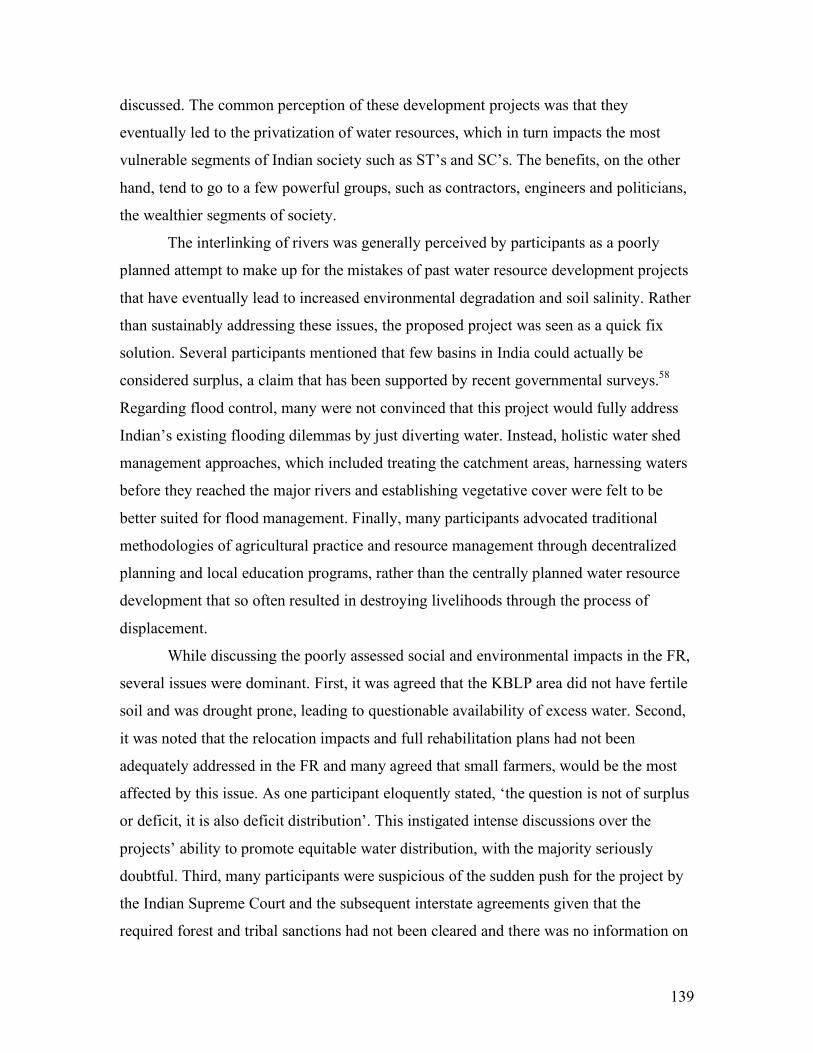
139
discussed. The common perception of these development projects was that they
eventually led to the privatization of water resources, which in turn impacts the most
vulnerable segments of Indian society such as ST’s and SC’s. The benefits, on the other
hand, tend to go to a few powerful groups, such as contractors, engineers and politicians,
the wealthier segments of society.
The interlinking of rivers was generally perceived by participants as a poorly
planned attempt to make up for the mistakes of past water resource development projects
that have eventually lead to increased environmental degradation and soil salinity. Rather
than sustainably addressing these issues, the proposed project was seen as a quick fix
solution. Several participants mentioned that few basins in India could actually be
considered surplus, a claim that has been supported by recent governmental surveys.58
Regarding flood control, many were not convinced that this project would fully address
Indian’s existing flooding dilemmas by just diverting water. Instead, holistic water shed
management approaches, which included treating the catchment areas, harnessing waters
before they reached the major rivers and establishing vegetative cover were felt to be
better suited for flood management. Finally, many participants advocated traditional
methodologies of agricultural practice and resource management through decentralized
planning and local education programs, rather than the centrally planned water resource
development that so often resulted in destroying livelihoods through the process of
displacement.
While discussing the poorly assessed social and environmental impacts in the FR,
several issues were dominant. First, it was agreed that the KBLP area did not have fertile
soil and was drought prone, leading to questionable availability of excess water. Second,
it was noted that the relocation impacts and full rehabilitation plans had not been
adequately addressed in the FR and many agreed that small farmers, would be the most
affected by this issue. As one participant eloquently stated, ‘the question is not of surplus
or deficit, it is also deficit distribution’. This instigated intense discussions over the
projects’ ability to promote equitable water distribution, with the majority seriously
doubtful. Third, many participants were suspicious of the sudden push for the project by
the Indian Supreme Court and the subsequent interstate agreements given that the
required forest and tribal sanctions had not been cleared and there was no information on

140
five of the projects’ dams was not yet available. Some believed this was due to the
intention of certain corporations to privatize water for industrial purposes. One
participant summed up the complexities well by stating that the project ‘is not only about
water, but also land, employment, displacement and livelihood’.
After much deliberation from the first day and into the beginning of the second,
the group agreed that they should reject the contents of the FR and establish plans for
future action to stop the project. Towards this goal, it was agreed first, that a brief
informational document in the local languages should be created and disseminated to
affected populations. Second, it was proposed that river valley protection committees be
formed to disseminate information and form larger social movements among the affected
communities. Third, information exchange programs should be arranged to bring
farmers’ representatives to areas where examples of successful traditional water resource
programs had been implemented. Fourth, political parties and elected representatives
should be approached at all levels with information about the social destruction and non-
viability of interlinking rivers. Fifth, detailed critiques of each of the available
interlinking feasibility reports should be completed after visiting affected areas and
disseminated to the river valley protection committees. Finally, contacts with all forms of
media should be maintained to encourage coverage of successful traditional water
harvesting and events that take place at the camps.
The final step of the meeting was the creation of a group resolution addressed to
the commissioner of Jhansi rejecting the FR. This resolution explained the purpose of the
meeting and stated that there was no justification for the KBLP due to the potential long-
term environmental and social impacts that had not been adequately studied or addressed.
Consequently, the FR and subsequent agreements between the two states involved should
be rejected because the Ken River was not a surplus, downstream communities would be
negatively impacted, an area of Panna National Park would be submerged, and 60,000
people would be displaced. The resolution was delivered to the commissioner’s office by
the entire group of participants via a march through the town after a series of lectures and
debates that were recorded by the media.

141
Discussion
Village Visits
A quick assessment of the study area indicated that it was theoretically the best-
case scenario for relocation as the number of relocates was small compared to other
examples of development induced displacement in India. The submergence area was not
particularly fertile and prospects for agriculture beyond subsistence not apparent.
Furthermore, some of the focus group participants mentioned that many residents were
already migrating to urban centers and the majority of villages scheduled for
submergence located within Panna National Park, were already undergoing relocation
programs unrelated to the KBLP. In fact, a park official reported, ‘several of the villages
had already been relocated as a result of a nationwide program to maintain conservation
values of national parks and wildlife sanctuaries by gradually removing tribal populations
which still utilized its natural resources’.59
Nonetheless, other equally important issues lie beneath the surface and are likely
to arise if the KBLP becomes a reality. First, several critics believed that the
submergence area reported in the FR was an underestimate given that the relocation
numbers were based on a lower dam height than that actually proposed. 60 This
discrepancy could potentially increase the relocation numbers and have a greater impact
on unidentified periphery villages. Second, the FR did not account for the five additional
dams that will be constructed as part of the KBLP. Subsequently, the NCAER socio-
economic survey results also only reflect the Daudhan reservoir submergence area.61 As a
result, no one had any information about the characteristics of the unidentified
relocatees.62 While many KBLP opponents had provided their own estimates of the
exponential increase in relocation numbers, this aspect cannot be assessed realistically
until information on any additional dams is provided by the NWDA. Third, the relocation
plans cited in the FR minimally covered issues such as land compensation, housing
replacements, provision of basic amenities, livelihoods unrelated to agricultural work,
and various resettlement grants. The FR also promised an upfront resettlement grant of
Rs. 10,000 (US$ 222) and Rs. 1,000 (US$ 22) every month for one year after relocation,
although this amount had not been confirmed. How these tasks would be accomplished

142
beyond cash compensation was not addressed, rather deferred to a future reports by
stating:
“The detailed studies in respect of the exact number of families, persons, their occupation, present facilities available and the cost of rehabilitation and resettlement of the persons affected due to the project on the basis of a detailed R&R plan, as per the latest prescribed norms, would be prepared at the time of preparation of the DPR of the project.”
Despite the promise for explicit detail in the DPR, there is still no indication that cultural
sensitivity or legality concerning the majority of SC and ST relocatees is even needed..
The success of relocation programs throughout India and the region have been marginal
at best, with a substantial number from previous dam building in the region yet to be
properly resettled.63
Regarding the level of project awareness, it appeared as though only village
leaders had been informed of the KBLP’s existence although the government had done an
adequate job of advertising the project through visible sign postings, television, radio and
newspaper ads. The question then centered on what their level of understanding of the
project was. It was observed that villagers knew nothing beyond the projects existence,
whether they were potential relocatees or indirectly impacted. It was also clear that their
needs and opinions on water resource development had not been adequately taken into
consideration during the project planning process. This was apparent throughout the FR,
which did not incorporate the NCAER survey results indicating that the majority of the
population was overwhelmingly in favor of expanding locally controlled irrigation
facilities. These opinions were also confirmed by the results of the Prakash et al study
and the research team’s experiences during village visits. Populations throughout the
entire project area as well as those whose existing irrigation facilities would be affected
by the KBLP had also not been surveyed. Moreover, even though the DPR was currently
underway, no public hearings in the project area had been reported. These factors were
especially concerning as the FR most notably lacked detailed social, environmental and
financial analysis. Without this type of input from the impacted communities, there is
reason for concern that these essential aspects of successful project planning will not be
adequately incorporated in to the DPR.

143
Another issue that came up in the village visits was the problem of resource
conflicts, as the study area seemed to be full of antagonist’s such as the timber mafia and
the forest bandits. Submerging forestland is likely to intensify the harassment of the local
populations by armed timber mafia, since already scarce timber resources would be
further impacted by the KBLP. These conflicts, when taken into consideration with the
impacts of relocation, would only exacerbate the vicious cycle of poverty for
marginalized populations. For the similar reasons forest bandits and other land
encroachment conflicts in and around the Basudha village, will also likely be intensified
when that area is submerged and new claims must be staked. Finally, these conflicts
would further increase the challenges to equitable water and forest resource access.
The situation in the Pahari village was another example of the regional water
conflicts likely to be intensified with the completion of the KBLP. The existing interstate
water sharing conflicts over access and control of the Bariyarpur weir was only one of
many in the KBLP impacted region, and if not properly accounted for in the Detailed
Project Report (DPR), the creation of the Daudhan dam could further negatively impact
the amount of water fed into this weir and others connected to it.64 Ultimately, the current
conditions of these existing structures could potentially increase in scope with the full
implementation of the KBLP. The equitable distribution of water resources in the region
would very likely remain an issue and ultimately contribute to the vicious cycle of
poverty already being experienced there.
Flooding was another issue in some of the villages located along the Ken River,
as the situation in Bhatpur village was repeated in areas all along the Ken River’s banks
during the 2005 flood. Therefore, if the KBLP were to provide flood control this would
indeed be a benefit. However, workshop group participants indicated that the KBLP
could divert flooding waters elsewhere and if this were the case, the impacts could be
devastating to communities not usually affected by flooding. The Bhatpur case also
highlighted the inadequate rehabilitation available to remote communities after a
devastating flood, as a large quantity of the village houses remained in ruins a year later.
Again, this phenomenon adversely impacted the poorest segments of the community.
Resentment over water within MP boundaries being sent to UP was also a
common theme among focus group participants. While many of the interstate water

144
sharing structures were designed to distribute water to both sides of the state boundary,
the people from MP had the perception that they were not receiving their fair share. This
issue could be a result of inadequate supply or to differences in infrastructure
maintenance, but the end results were the same. Certain population segments in the
regions who were not monetarily or politically powerful did not receive sufficient water
to meet the needs of their livelihood and improve their impoverished situations. This
dilemma is worth researching further, with particular focus on how the KBLP may
impact interstate water sharing agreements throughout the region.
The visual assessment of the study area and the Ken river basin in general, did not
indicate the presence of surplus water. For instance, many of the regions reservoirs and
tanks remained low well into the monsoon season. While the participants in the
submergence focus groups did not complain about inadequate water levels, they did
mention that the rainfall has not been sufficient in the last few years and throughout the
surplus basin many towns and villages were facing severe water shortages. In many
cases, water trucks brought in water from elsewhere at a high cost to meet the needs of
residents. Perhaps one of the most telling anecdotes came from a town center that had
absolutely no water in nearby rivers or existing wells, and as a result had to have water
trucked in. Apparently the situation remained so critical that a man reportedly had to
escort his mother to the well with a gun. It is hard to imagine what would happen if the
relocatees were forced to migrate to these situations.
NGO/Activist Focus Groups and Workshops
Several notable consensuses emerged from the information gathered in these
sessions. First, that the Ken basin was not a surplus, though this was supported by the
participants’ personal experiences in the region rather than through scientific analysis of
relevant data. Secondly, that implementation of the KBLP would have negative impacts
on the resource-based livelihoods in the region. The people in the KBLP region were
viewed as uninformed and in need of empowerment to advance the practice of bottom up
decision-making. Additionally, many participants felt that the majority of the project’s
benefits were likely to go to the wealthier segments of the local community, with the poor
and marginalized populations adversely impacted by negative externalities. Thirdly,
traditional water resource methodology should be revived. It was very strongly felt that

145
only these methods, in combination with afforestation programs and other holistic
approaches to resource management, would solve the water resource needs of the region.
Finally, common strategies for moving forward were suggested such as, better informing
local communities, independent scientific assessments conducted in rebuttal to the FR,
and dialogue between the various movements and the government are improved. To date,
there has been no indication that these strategies have been pursued.
These participants were clearly passionate about the environmental and social
impacts of large development projects, stemming from numerous past experiences
addressing similar issues connected with development projects throughout the region and
India. They had witnessed the far reaching affects on people and the landscapes on which
they depended. Medha Patkar, one of the most vocal anti-linking opponent’s experienced
in development induced displacement and leader of the NAPM workshop stated:
“Invariably, as seen from our experience in many projects, those displaced by such projects experience a deterioration in their quality of life, economically and socially. Promises of land or replacements of livelihoods are never kept. The people from disadvantaged communities are compelled to struggle for basic human rights. Their social structures, cultures and landscapes are also destroyed.”
They questioned India’s current development paradigm that tends to yield to global
pressures while at the same time, eradicating traditional technology that has sustained
Indian civilization for millennia. These were all experts, trained in renowned institutions
and working in a variety of environments from villages to the office of the Indian
president. But what will their impact actually be on the project planning process?
On the positive side, the public’s accessibility to the FRs was most likely the
result of these experts’ publicized interlinking analysis. Prior to this, activist groups could
only criticize and pressure the government for lacking transparency and accountability in
the interlinking planning process. But now, their arguments were based on official project
documents provided directly by the planners and thus, have more weight in discussion. In
addition, these groups have the power to mobilize local populations easily as they are
better connected and trusted by them than the government agencies. Indeed, several
marches have already occurred in response to the KBLP. In sum, these groups serve as a
watchdog of the current development path India is on and as a voice for the voiceless.

146
But to what degree have they been allowed to participate in the planning process
and do they have an impact on the proposed plans? In many cases they were invited to
participate in meetings with government officials, as in April 2005 when a group of six
well known interlinking opponents were invited to discuss their concerns with India’s
President Kalam, a strong advocate of the plan.65 The group was given 45 minutes, 25 of
which the President used to explain that the idea was necessary and even chided them for
being negative. Nonetheless, the group still had the opportunity to present their
arguments and was asked to answer questions he posed in a formal follow-up letter.
Since this meeting, the President though, has continued to advocate interlinking of rivers
as the only solution to India’s water problems.66 In other instances they have been invited
to participate in national seminars at their own expense, only to have their written work
left out of the proceeding’s publications.67 And regarding the KBLP planning process,
none of the knowledgeable focus group participants were consulted despite their long-
term experience with the local populations and water resource issues in the area.
This interaction to date between activist groups and government agencies could
be viewed as symbolic gestures of participation, but in practice, the two groups remain
polar opposites. Government officials and appointed consultants of development projects
often view the opinions of such groups as ‘anti development’ and unrealistic. While
questioning the activist’s level of expertise, they continue to view past water resource
development projects as the reason India has conquered food scarcity during the past
century.68 Meanwhile, the opponents question the project planners’ ability to incorporate
the complex social and environmental processes of large-scale development. Moreover,
they question the democracy of the entire political process behind project planning and
are continually suspicious of privatization. They also advocate for the return to traditional
methodologies as the solution to India’s water scarcity issues. While this is an important
addition to the water planning process, it is not the only answer and certainly not what the
project planners are taught in Indian institutions. As a result, the ideological debate
continues in a vicious circle as projects get pushed through by those in power without
reference to public concerns, which in turn fuels the activist’s radical viewpoints and
accusations.

147
In sum, this is not a good example of a project planned through the process of
participation. To date, no formal meetings between the government project planners and
civil society have been held to exchange ideas and reach consensuses. As a result, the
polar opposites continue their efforts planning for development in parallel, but parallel
directions. The KBLP presents a unique opportunity for all concerned to finally initiate
the participatory process, which would have the best chance of yielding successful
practical results. If the KBLP is to be the test case for river interlinking in India,
hopefully it can be an example of a democratic and scientifically based project planning
process that includes serious consideration of those marginalized populations and
environments most impacted by such a project.
Conclusion
If approved, implementation of the KBLP will serve as an example for the
national river-interlinking plan. Given this importance, it seems unfortunate that the
project planners have not adequately analyzed the social and environmental implications
to the landscape and people who depend on it in one of India’s largest impoverished
regions. Judging by the quality of the FR, it is not clear whether this project is actually
feasible or that these lingering issues will be covered in the DPR. Population figures
reported in FR were often outdated, in some cases going back as far 25 years, and social
surveys and impacts to SC’s and ST’s were not included. The PAPs remain uninformed
and removed from the project planning process. Regional experts have not been
consulted and were not part of planning meetings among powerful project proponents.
The KBLP project provides a good example of environmental justice as it relates
to the equitable distribution of benefits from a water resource development project in a
relatively impoverished region. The KBLP has the potential to help alleviative poverty,
but unless marginalized populations and their seasoned representatives are properly
included in the project planning and implementation process, there is risk of exacerbating
existing social and environmental dilemmas in the region. This is especially problematic
for the natural resource conflicts that already occur over forest and water resources.
Regarding the equitable distribution of benefits, the KBLP promises additional
irrigation and drinking water to recipients along the canal. However, given that most

148
people in the region depend on groundwater sources for their drinking and household
water needs, it is likely that the KBLP will primarily be utilized for irrigation water.
Therefore it is important to consider historical experiences with public irrigation
programs to gain a better understanding of the KBLP’s potential for long-term
sustainability. Worldwide, most forms of centralized water management have inefficient
and unsuccessful track records primarily because decisions are made far from and
without any interaction with the communities directly affected.69 Post-independence India
pursued this type of development path with the expansion of its national public irrigation
structures and, although the country now has one of the largest irrigation systems in the
world, much of it remains inefficient. Since the 1980s the systems have begun to
deteriorate due to the lack of adequate maintenance and investment in operation, resulting
in smaller irrigated areas than originally planned.70 As a result, there is now a global
consensus among water management planners that the expansion of irrigation structures
is neither needed nor cost effective.71 Rather, money would be better invested in
improving existing structures, promoting water conservation and providing control
measures.
The irrigation situation in the KBLP region reflects the global and national water
resource management dilemma. While there are many regional examples to turn to, the
situation with the current canal system is probably the best indicator of how water will
actually be distributed with the KBLP. According to the Prakash et al study, the surveyed
population stated that the canal management is difficult since there is, “use of excess
water through diversion and unauthorized cuttings at the head reach and inadequate and
untimely availability of water at the tail end” (Pg. 189). In addition, there are recently
constructed dams and several that are planned on both rivers that could suffer as a result
of this project.72 The FR did not address these issues or the impacts to farmers dependent
on these resources. This is especially problematic in a country where farmer suicides are
common when agricultural inputs are negatively impacted over a long period time.73
India also does not have the best reputation for successful rehabilitation and
relocation associated with large development projects. On paper, rehabilitation packages
seem workable and equitable, but it reality this is often not the case. The World
Commission on Dams reported that 75 percent of Indians relocated because of dams have

149
not been properly rehabilitated and remain impoverished.74 Moreover, resettlement
packages, without a comprehensive central government guidelines and public
participation, vary from project to project. But an examination of past experiences as
reported by activists and extensive literature on the topic, makes it clear that
implementation of resettlement packages is one of the least thought out aspects of
development projects’ designs. Often issues such as social interactions between the
oustees and the host community, women’s rights, and occupational shifts have not been
properly understood or addressed during the formulation of packages. The internationally
known and protested Sardar Sarovar dam in the Narmada Valley of Western India, serves
as a troubling example of a large-scale relocation. Numerous studies were conducted on
the displaced from the Sardar Sarovar dam construction and concluded that major
problems occurred because compensation had not been adequately distributed, the same
land is allotted to more than one project affected family or was unsuitable for farming,
major sons were not listed, and government officials demanded bribes to release entitled
compensations.75
It can be assumed that the KBLP will also have problems with relocation for
several reasons. First, as previously noted, only one of six dams had been factored into
the FR, and as a result, the number of relocatees will probably increase when the
remaining five dams are reported in the DPR. Second, as with any case of relocation, it is
not entirely clear how the government will provide compensation when, in 2000 the MP
government reported that it had no land for rehabilitation purposes.76 But given the level
of agricultural productivity, water availability and resource conflicts in the region, the
issue of relocation would be problematic regardless of the availability of land. Third,
there are still project-affected families from previous projects who have not been properly
rehabilitated.77 Finally, the ST’s and SC’s are a significant proportion of those scheduled
for displacement, and considering that such groups comprise one-forth of MP’s
population, it is probable that they will bear a disproportionate share of the project’s
social costs.
In the last decade or so, literature on development has increasingly emphasized
the importance of good governance.78 This includes the importance of public
participation during the planning and implementation process, since ‘beneficiary oriented

150
design’ (or grassroots participation) is an imperative procedural component for any
development program to be successful.79 As this is a relatively new aspect of large-scale
development, the positive outcomes remain varied and few. Unfortunately in India, the
voting process on development projects is not based on majority support, but rather on
decisions by the elite in government to benefit the urban population.80 Certainly there has
been a recent increase in public participation of marginalized people, however it often
comes after the project has already been completed. While this is a step in the right
direction, it is not the best way to achieve equitable and sustainable water resource
development. Joint negotiations with the directly affected peoples are more likely to
result in project provisions that would improve livelihoods, quality of life, and better
ensure that these peoples are also beneficiaries of the project.
Major findings from this research included the need for an in depth analysis of
potential resource conflicts in the region, and lastly, better incorporation of all levels of
society into the project planning process. Since results from the implementation of the
KBLP will be used to determine the feasibility of the nationwide river-interlinking plan
in India, it should certainly undergo adequate environmental, social and financial analysis
before moving forward. In the interim, conducting the analysis necessary to protect the
KBLP’s project affected persons and the landscape on which they depend would help
ensure long lasting and environmentally friendly economic development in the region.
This research was intended to provoke a more specific and meaningful dialogue
on the long-term impacts of the KBLP to marginalized populations and the landscapes on
which they depend. It is hoped that this resulting dialogue will be a meaningful addition
to the discussion on poverty alleviation in the larger Indian society and its connection to
environmental justice.
Recommendations
Based on the results of this study, we suggest that several management measures
be considered to enhance the potential for a sustainable and equitable outcome of the
KBLP.
1. Disseminate information about the project to local populations. While the NWDA
has advertised the project to local populations, it has not taken any measures to explain

151
the details nor has this provision been reported in the FR. Although the FR is available
online, impacted communities do not have access to computers in their remote locations.
Therefore, the government should produce easy to read project pamphlets in the local
language to all communities that will be affected in any way by the KBLP. Regional
experts should be utilized as consultants, as they have already produced such pamphlets,
but due to limited resources have not been able to disseminate them at the large scale. To
complement this process, public hearings should be conducted in the region where locals
can share their thoughts and ideas after being informed.
2. Institute Water User Associations (WUA) in the Ken and Betwa Basins. WUA’s
are fast becoming a popular method of local water management throughout the
developing world. Indeed, both UP and MP has set up these organizations in certain
areas, however, they remain absent from those that will be directly or indirectly impacted
by the KBLP.
3. Create water conservation training and farmer exchange programs. After WUA’s
have been formed, regional water conservation training programs should be developed
for the area so that farmers are given additional information on how to better conserve
water during times of irrigation. In addition, the leaders of the WUA’s should engage in
exchange programs with other semi-arid regions of India where water harvesting
techniques have been mastered by local populations so that they can learn about this
process and train their community.
4. Set up a formal meeting between KBLP project planners and regional experts.
While meetings have taken place at the national level, there have been none between
local KBLP planners. This of particular concern as the KBLP is the first link to be
officially constructed. Therefore, a balanced meeting between these two groups to be
moderated by a neutral third party should be arranged.
5. Conduct an assessment of the regional natural resource conflicts. The severity of
the conflicts over water, forest resources and land ownership is likely to escalate with or
without the KBLP given the rising populations and deteriorating landscape. Therefore, it
would be beneficial for project planners and local communities alike if measures were
taken to understand these conflicts in order to reduce negative impacts from all forms of
large scale development in the region.

152
6. Conduct an assessment of the potential impacts of the KBLP on existing irrigation
infrastructure. The research conducted here cannot conclude how the KBLP will impact
existing irrigation infrastructure; however, it does show that it is possible given what was
reported by regional experts and local populations that are already facing problems with
infrastructure of a similar design. Again, if a proper scientific assessment were
conducted, the benefit of this understanding would go to both project planners and local
farmers as unforeseen costs can be avoided and water equitably distributed.
Limitations
Although any form of research has its limitations, research completed in a country
different from the origin of the researcher posed additional constraints, which are listed
below.
Language: At the village level this was particularly problematic, as the participants did
not speak English. Thus, information gathering was done through translation that
summarized the lengthy discussions of participants. Because translation services were not
the main profession of the appointed translators, it is possible information was lost. In the
workshop settings, the majority of the participants also spoke in Hindi. Again, the result
was a summarized translation of lengthy discussions, provided by people for whom
translating was not their main profession. Fortunately though, participants in the
workshops also spoke good English, thus informal discussions of the topic enhanced the
process of information gathering in these forums.
Time: This was especially problematic for village visits given their remote locations and
the danger to the research team of being in unfamiliar territory after dark. As a result,
little bonding occurred between the research teams and the village participants. If more
time were spent in each village, further information could have been collected through
additional observation time by building trust with the locals and consequently, more open
and casual discussion regarding the research topics.
Safety: Several of the villages visited in this study were located near forest reserves that
were used by local bandits as a place of refuge from the law. As a result, it is not
uncommon for these groups to attack travelers and forest rangers at gunpoint when they
are traveling through such areas. In particular, some of the villages scheduled for

153
submergence near the site of the proposed dam in Panna National Park and Tiger Reserve
were not accessible because of the danger posed by these groups. Subsequently, the
research team was not allowed into some sections of forest by the forest guards.
Gender Inequalities: All of the information gathered from the village visits were the
results of discussions among men only, and these were most often village elders or
leaders of the community. Unfortunately, the research team was not designed to host
separate discussions with women villagers, as the translators were only men as well. A
coed focus group was not appropriate given women’s role at the village level and because
they would not have been comfortable participating in discussions with high level male
figures or men not from their village. This was especially unfortunate, as it was women’s
responsibility to provide water for many livelihood activities and hence, they were often
the most negatively affected by involuntary relocation programs. In the NGO focus group
this was also an issue, since only one female NGO member was a participant. This was
less of an issue in the activist workshop since the female activist Medha Patkar
moderated it, and about 10 percent of the participants were female.
Bias: This was an issue at every stage of the research conducted and reported in this
study, and arose primarily and unintentionally from the researchers who were not from
India. As a result, perceptions were based on experiences and knowledge from the
country of origin since it takes considerable time to understand the cultural nuances of
any country to which one is not native. Some forms of bias was also contributed by the
translators, who sometimes added their own input to the translations provided as a result
of their socio-economic backgrounds and class identifications which differed from the
village population. Finally, the NGO members and activists whose work by definition
was concentrated on the research topic would have introduced an obvious degree of bias.

154
Village Visits
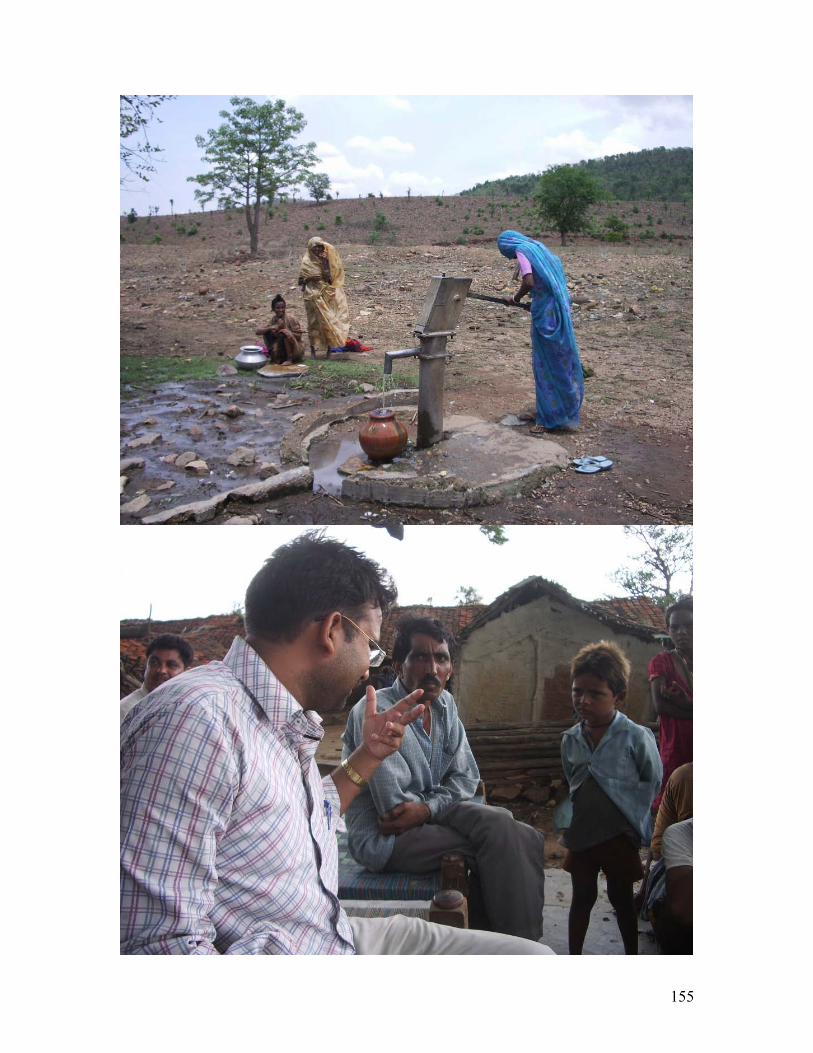
155

156

157
NGO Focus Groups

158
Activist Workshop

159
Project Sign

160
Betwa River
Ken River

161
1 Unver, Olcay I.H., Rajiv K. Gupta and Aysegul Kibaroglu eds. Water Development and Poverty Reduction. Norwell: Kluwer Academic Publishers, 2003. 2 Bryant, Bunyan. Environmental Advocacy: Working for Economic and Environmental Justice. 2004. 3 Government of India. National Academy of Agricultural Sciences. Emerging Issues in Water Management- The Question of Ownership. Policy Paper 32. New Delhi: NAAS, 2005. 4 Alagh, Yoginder K, Ganesh Pangare and Biksham Gujja, eds. Interlinking Rivers in India: Overview and Ken-Betwa Link. Delhi: Academic Foundation, 2006. 5 World Bank Participation Sourcebook. <http://www.worldbank.org/wbi/sourcebook/sbhome.htm> 6 Unver, Olcay et al. 2003. 7 Bryant, Bunyan. 2004. 8 Alagh, Yoginder et a. 2006.
9 Asian Development Bank. Summary of the Handbook on Resettlement: A Guide to Good Practice. Manila: Asian Development Bank, 1998.
10 Sims, Holly. "Moved, Left no Address: Dam Construction, Displacement an Issue Salience." Public Administration and Development 21 (2001): 187-200.
11 Velath, Priyanca Mathur. "Internal Displacement and Other Forms of Forced Migration: Are Refugees and IDPs so Distinct?" Researching Internal Displacement 7-8 (2003): 1-20. 12 Katare, P. M. and Barik, B.C. Development, Deprivation, and Human Rights Violation.
Jaipur; New Delhi: Rawat Publications, 2000.
13 Singh, Satyajit. Taming the Waters: The Political Economy of Large Dams in India. Delhi: Oxford University Press, 1997.
14 Baviskar, Amita. In the Belly of the River: Tribal Conflicts Over Development in the Narmada Valley. Delhi; New York: Oxford University Press, 1995.
15 Dreze, Jean, et al. The Dam and the Nation; Displacement and Resettlement in the Narmada Valley. Delhi; New York: Oxford University Press, 1997.

162
16 Singh, Satyajit. 1997.
17 Thukral, Enakshi Ganguly. Big Dams, Displaced People: Rivers of Sorrow, Rivers of Change. New Delhi; Newbury Park, Calif.: Sage Publications, 1992.
18 Thukral, Enakshi Ganguly. 1992.
19 Katare, P. M. and Barik, B.C. Development, Deprivation, and Human Rights Violation. Jaipur; New Delhi: Rawat Publications, 2000.
20 Mathur, Hari Mohan and Cernea, Michael M. Development, Displacement, and Resettlement: Focus on Asian Experiences. New Delhi: Vikas Pub. House, 1995.
21 Khan, M. Z. and Furquan Qamar. Scheduled Castes: Their Socio-economic Background and Development Aspirations. Delhi: Inter-India Publications, 1996. 22 Sahoo, Khali. Rural Development: Scheduled Castes and Scheduled Tribes. Delhi: Classical Publishing Company, 2005. 23 Srinivas, M.N. The Remembered Village. Berkeley: University of California Press, 1976. 24 Sarkar, Amitabha and Samira Dasgupta. Ethno-Ecology of Indian Tribes: Diversity in Cultural Adaptation. Jaipur: Rawat Publications, 2000. 25 Sahoo, Khali. 2005. 26 Fernandes, Walter ed. National Development and Tribal Deprivation. Delhi: Indian Social Institute, 1992. 27 Fernandes, Walter ed. 1992. 28 National Water Development Agency (NWDA) (2005). Feasibility Report of Ken-
Betwa Link Project. [Online]. Available: <http://nwda.gov.in/index3.asp?sublink2id=25&langid=1> [2005, Dec. 16].
29 Asian Development Bank. “Technical Assistance to India for the Madhya Pradesh Integrated Water Resources management Strategy.” [Online]. Available: < http://www.adb.org/Documents/TARs/IND/tar_ind35045.pdf> [2001, Sept]. - As of December 2005, the Indian poverty line is Rs. 4,416 (US$100) and Rs. 6,708 (US$152) per person/year for rural and urban areas respectively. 30 Government of Madhya Pradesh. “The Madhya Pradesh Development Report 2002.” < http://www.mp.nic.in/difmp/MPHDR2002_Book_English.pdf>

163
31 FAO Investment Centre. “Bihar - Madhya Pradesh Tribal Development Programme: Socio-Economic and Production Systems Study. ” 1998, 19 pages. < http://www.fao.org/docrep/007/ae393e/ae393e00.htm> 32 Shrivastava, Divya. The Development of Scheduled Tribes in Madhya Pradesh. Delhi: Gyan Publishing House, 2000. 33 Census of India 2001. < http://www.censusindia.net/t_00_005.html> [2007, Jan 17]. 34 Prakash, Bharatendu et al. Problems and Potentials of Bundelkhand with Special
Reference to Water Resource Base. Delhi: Center for Rural Development and Technology, 1998.
35 Government of Madhya Pradesh. 2002. 36 National Water Development Agency. 2005. 37 Government of Madhya Pradesh. 2002. 38 Prakash, Bharatendu et al. 1998. 39 Government of Madhya Pradesh. 2002. 40 Wikipedia. “Tropical and Subtropical Dry Broadleaf Forests.” < http://en.wikipedia.org/wiki/Tropical_and_subtropical_dry_broadleaf_forests> 41 National Water Development Agency. 2005 42 Asian Development Bank. 2001. 43 Prakash, Bharatendu et al. 1998. 44 Government of Madhya Pradesh. “The Madhya Pradesh Development Report 2002.” < http://www.mp.nic.in/difmp/MPHDR2002_Book_English.pdf> 45 Government of Madhya Pradesh. 2002. 46 Government of Madhya Pradesh. 2002. 47 Government of Madhya Pradesh. 2002. 48 Government of Madhya Pradesh. 2002. 49 Prakash, Bharatendu et al. 1998.

164
50 Blaikie, Norman W. “A Critique of the Use of Triangulation in Social Research.”
Quality &Quantity 25 (1991): 115 – 136. 51 Lyon-Folch, Evelyn and John F. Trost. “Conducting Focus Group Sessions.” Studies
in Family Planning 12 (1981): 443 – 449. 52 Schearer, Bruce S. “Special Issue: Focus Group Research: The Values of Focus
Group Research for Social Action Programs.” Studies in Family Planning 12 (1981): 407 – 408.
53 Lyon-Folch, Evelyn and John F. Trost. 1981. 54 Bratton, Michael and Beatrice Liatto-Katundu. “A Focus Group Assessment of
Political Attitudes in Zambia.” African Affairs 93 (1994): 535 – 563. 55 National Water Development Agency. 2005. 56 This main road is known as the Chatarpur-Panna state highway and leads to the large city of Varanasi in UP. Many local and long distance buses pass through this area. 57 The Rangwan dam is on a tributary river to the Ken and was designed to add water to the Bariyarpur weir. 58 Selvarajan, S. Sustaining India’s Irrigation Infrastructure. National Center for
Agricultural Economics and Policy Research. Policy Brief 15. New Delhi: December 2001.
59 Many of India’s national parks have tribal villages established within their boundaries. This is a result of the creation of national park’s within the last century where many native tribal populations have inhabited the area long before its establishment. The communities were permitted to stay in some cases, however slowly this pattern is changing as some are being relocated outside of the park. 60 Alagh, Yoginder K, Ganesh Pangare and Biksham Gujja, eds. Interlinking Rivers in
India: Overview and Ken-Betwa Link. Delhi: Academic Foundation, 2006. Dang, Himraj. “River Inter-linking: Robbing Banda to Pay Hamir.” Terragreen 3 (July –
September 2006): 60 – 62. 61 Alagh, Yoginder K et al. 2006. 62 Pandit, Chetan. “Re: [riverlink] Irrigation Efficiency.” Email to Kiran Kumar Vissa.
21 April 2004. 63 Alagh, Yoginder K. 2006.
165
Dang, Himraj. 2006. 64 Alagh, Yoginder K. 2006 65 India Together. “President Kalam, Please Listen.” [5 May, 2005] < http://www.indiatogether.org/2005/may/env-kalamletr.htm#meeting> 66 Vombatkere, Sudhir. “Re: How I Met the President of India.” Email to the author. 20 January 2007. 67 Vombatkere, Sudhir. 20 January 2007. 68 Pandit, Chetan. “Re: [riverlink] Irrigation Efficiency.” Email to Kiran Kumar Vissa. 21 April 2004. 69 Unver, Olcay I.H., Rajiv K. Gupta and Aysegul Kibaroglu eds. Water Development
and Poverty Reduction. Norwell: Kluwer Academic Publishers, 2003. 70 Unver, Olcay I. et al. 2003. 71 Alagh, Yoginder K et al. 2006. 72 Alagh, Yoginder K at al. 2006. 73 IANS. “Harassed Farmer Ends Life Inside Power Company Office.” RxPG News
Online. [23 February 2007]. <http://www.rxpgnews.com/india/Harassed-farmer-ends-life-inside- power-company-office_16821.shtml> Ramachandran, Hari and Biman Mukherji. “ANALYSIS – Budget Farm Friendly, But
Problems Remain.” Reuters India Online. [2 March 2007]. <http://in.today.reuters.com/news/newsArticle.aspx?type=businessNews&storyID=2007- 03-02T155317Z_01_NOOTR_RTRJONC_0_India-289798-1.xml> 74 Sims, Holly. "Moved, Left No Address: Dam Construction, Displacement an Issue
Salience." Public Administration and Development 21 (2001): 187-200.
75 Vombatkere, S.G. “Narmada Valley People Concerned.” Mainstream Magazine. 23 September 2006. < http://59.92.116.99/website/DOCPOST/oct-06-rdc/Formated- October-06/HM51-TS1-H-mns-e21b-Narmada-Valley-People.pdf> 76 Human Rights Features. “Collective Rights in India: A Reeassessment.” 4 May 2001. < http://www.hrdc.net/sahrdc/hrfeatures/HRF36.htm? 77 Dang, Himraj. “River Inter-linking: Robbing Banda to Pay Hamir.” Terragreen 3
(July – September 2006): 60 – 62.

166
78 Sims, Holly. 2001.
79 Lele, Sharachchandra M. “Sustainable Development: A Critical Review.” World Development 19 (1991): 607 – 621.
80 Clabots, Christine. "Development Induced Displacement: Dams, Indigenous People,
and Democracy." Third Annual Forced Migration Student Conference. Oxford Brooks University, UK, 13-14 May 2005.

167
CHAPTER 5: Conclusions
The results from our study raised serious concerns about the suitability of the
proposed KBLP as a water management strategy for the Ken and Betwa region in India.
The Feasibility Report for the KBLP, the only official government document covering
the project, contains outdated, flawed and inadequate data, and failed to address
substantive issues in three critical areas: the potential hydrologic, wildlife, and social
impacts of the project. Finally, this research highlighted several important areas for
future exploration as alternative or complementary approaches to water resource
management, which may provide more efficient and sustainable results for India in the
long run.
Hydrologic Impacts
The construction of a dam and reservoir and diversion of water will undoubtedly
change the natural hydrology of the Ken and Betwa watersheds, though the Feasibility
Report produced by the NWDA did not provide enough data to evaluate these potential
hydrologic impacts. Therefore our research utilized readily available GIS data to
characterize the area’s current environmental conditions and assess its general
vulnerability to negative impacts of hydrologic change that could result from construction
of the KBLP.
Using a Multi-Criteria Evaluation approach, the project area’s terrain, land cover,
and soil characteristics were evaluated to determine vulnerability to inundation, erosion,
and surface water quality degradation. Results from this analysis indicated that the
project site and areas adjacent to the Ken River downstream of the proposed dam site
were particularly vulnerable to changes in inundation rate, erosion, and water quality
degradation, and changes in the hydrology of the area consequent to construction of the
KBLP would only amplify these vulnerabilities.
Difficulties acquiring essential data prompted a resourceful approach to this
analysis, which could ultimately serve as a model for other researchers experiencing data
limitations. This study collected, created, and used data in a way not previously done for
this area. However, the value of any analysis is dependent on the quality of the data used
as input, and one limitation to the current research was that analysis was restricted to the

168
geographic extent of soils data provided by the Indian Government. Consequently, the
Betwa watershed was minimally assessed. One recommendation based on findings from
this research therefore, is to improve the accuracy and accessibility of relevant data.
There is also a need to better understand the site-specific interactions between
surface water and groundwater in both the project area and in the Betwa region, and to
collect current data on the availability, location, and movement of groundwater in order
to continue and expand this research. In future reports, the Government of India should
explicate the current hydrologic conditions of both the Ken and Betwa watersheds and
provide more information on data collection processes.
Although it has been well documented that the construction of large dam projects
like the KBLP can have devastating consequences to the surrounding environment,
alternatives which could also provide water for irrigation and consumption were not
explored in the Feasibility Report, Some possible options include alternative size and
design of the dam and canal, utilization of traditional water harvesting techniques for
irrigation, and implementation of conjunctive-use water management. Decision makers
should evaluate these alternative approaches as part of future assessments of the KBLP,
since utilization could result in the creation of a more efficient and sustainable water
management system.
Impacts to Wildlife
This research on the KBLP also highlighted serious issues related to wildlife
preservation which were neglected in the Feasibility Report, and which if not addressed,
could possibly be catastrophic and irreversible to India’s fragile wildlife.
The KBLP feasibility report and other IRL documents contained only limited
information which was used to make conclusive statements assessing the wildlife impacts
as minimal to nil. These conclusions were drawn without any type of wildlife
assessments being conducted by the NWDA and ignored the growing worldwide
evidence of impacts from hydrological alterations on wildlife.
Second, it should be recognized that India’s wildlife already currently faces many
challenges for survival. In the KBLP region, illegal grazing of domestic livestock and
collection of natural resources as well as direct human-wildlife interaction threaten the

169
Panna National Park and Tiger Reserve. The KBLP has the potential to exacerbate these
current threats through the submergence of forest areas, which are home to many species.
As has been mentioned in every IRL feasibility report, including the KBLP’s, the
construction of the links will require submergence of forested areas. Although the KBLP
feasibility report indicates that “only about 9%” of forest will be submerged, the total loss
of forest habitat due to submergence in the other proposed links is substantial. Therefore,
it is important to consider the nationwide scale of this project when assessing its
implications for wildlife, as the amount of submerged forest increases throughout the
country with the completion of each link. The loss of habitat resulting from this project is
a critical issue which should be addressed to ensure that this project, in solving the
problem of water management, exacerbates another, the gradual extinction of India’s
wildlife.
Social Impacts
There is emerging consensus among water experts world wide that public
participation is an essential ingredient to successful integrated water resource
management. Promotion of ownership in the decision making process often results in less
litigation, fewer delays and generally better project implementation.1 Moreover, if
properly planned and implemented, participatory frameworks for water management also
have the ability to help alleviate poverty, promote social justice and the equitable
distribution of natural resources. Participation thus reflects the level of investment by
local communities in the development process, a key attribute to sustainability.
One of the key findings from this research was that though project affected
persons were indeed aware of the project, their water and livelihood needs and concerns
were not fully assessed in the FR, and therefore not reflected in its overall design. Even
more surprising, participation by activists and local extension workers, often seen as
representatives for underserved populations and well versed in the local environmental
and social conditions, in the project’s planning process was even less apparent. .
Moreover, results indicated that the proposed KBLP might very well exacerbate existing
water conflicts in this impoverished region, given the problems local communities

170
already faced with interstate water sharing, making it very clear that the public was not
integrally involved in the decision making process.
Missing also from this research, and others similar to it, is an analysis of the
Betwa basin beneficiaries and their current water resource management and distribution
practices. Ignoring this important component could undermine the long term viability of
the project by failing to identify those factors and practices which contributed to the
designation of the Betwa basin as a deficit area.
The major recommendation based on findings from this research is to integrate a
working participatory framework into the development plans for the entire KBLP
impacted region. The overall benefit of this approach would be identification of
successful water management practices, with a particular focus on the Betwa basin,
through discussions with the users and local managers themselves. Furthermore, it would
be important to include NGO and activist groups in this participatory planning process.
Not only would government planners benefit from the knowledge such groups have of
the local communities, they would also satisfy concerns about transparency and
accountability in the development process. Subsequent analyses of data collected within
this new participatory framework could assist in identifying any inequities of water
distribution and other factors fueling water conflicts in the region. A holistic approach to
water management plans could then be developed based on clearer understanding of the
needs and practices of the water users. The results from this type of approach could have
far reaching benefits for the KBLP, increasing its efficiency and effectiveness while also
enabling it to provide sustainable and equitable management of water resources in the
area.
Alternative Approaches
A common theme in our report, published critiques of the KBLP, and the
Feasibility Report (FR) itself, is a continual focus on the Ken River and the project
construction area as the scope for arguments over the feasibility of the KBLP. However,
it is important to consider that there are presently over 24 dams in the Betwa basin on the
Betwa River and its tributaries, varying in size and function from small weirs to large
hydropower and irrigation projects.2 It would seem vitally important to determine why

171
these dam and reservoir projects have not met the needs of the Betwa region, since this
could alter significant details and dimensions in the proposed KBLP. If improvements in
water resource management could be shown to increase water availability in both the
Betwa and Ken river watersheds, the KBLP’s size and scope could be considerably
reduced, thus lessening its impacts on the people and environment.
Another theme that emerges from our report is the need for action at a smaller
scale to avoid creating negative impacts on the larger scale. For instance, our report has
already shown in discussions on the impact to wildlife, how actions taken at a local scale
will influence the national scale of ecosystems. If the KBLP is to be used as a “litmus
test” for future national IRL projects a more thorough and responsible approach must be
taken in developing an appropriate strategy for solving the water supply issues of the
area. Therefore, at the local level, data on surface and groundwater availability and true
water use patterns must be obtained and made public in order to determine the accuracy
of statements made in the Feasibility Report and to ensure success of the water
distribution capabilities of the KBLP.
While alternative or complementary water management practices such as water
harvesting, conjunctive use management, participatory management, and educational
programs promoting efficient irrigation have been suggested earlier in this report, there
are also many other innovative approaches being considered by countries and
organizations around the world. Some examples include: commodity water pricing,
benefit sharing, and recycling wastewater. All of these strategies too have related costs
and benefits, it is important to consider the full palate of alternatives to approaching
water management challenges.3
An emerging trend in global research on water resource management stresses
changing the paradigm of management strategies to emphasize efficient and sustainable
use. A perspective gaining popularity among water resource professionals is the notion
of embracing “soft” rather than “hard” paths to meet water needs. The “hard” path relies
almost exclusively on centralized infrastructure and decision-making such as, dams and
reservoirs, pipelines and treatment plants, water departments and agencies. Though the
“soft” path may also rely on centralized infrastructure, it is complemented by the
extensive investment in decentralized facilities, efficient technologies, and human

172
capital.4 Most importantly, the “soft” approach focuses on improving the overall
productivity and efficiency of water use rather than merely seeking new sources of
supply, and on delivering diverse water services based on the users’ needs specific to
local and community levels.5
As a nation with increasingly severe water management issues, it is imperative
that India look to diversify the range of solutions it considers in addressing these issues.
The vision of the Indian Government in water management should extend beyond hard
path solutions and look toward, creative strategies that promote efficient and sustainable
water use and management. The IRL plan is only one of a myriad of possible solutions
available and more innovative and diverse management systems may be better choices to
consider in solving India’s water management challenges.

173
1 Giupponi, Carlo, Anthony J. Jakeman, Derek Karssenberg and Matt P. Hare, eds.
Sustainable Management of Water Resources: An Integrated Approach. Northampton: Edward Elgar Publishing Limited, 2006.
2 Thakkar, Himanshu. “Ken-Betwa Link: Why It Won’t Click.”
<www.sandrp.in/riverlinking/knbtwalink.pdf> SANDERP. December 2003.
3 International Water Management Institute. <http://www.iwmi.cgiar.org/index.htm> March 6, 2007.
4 Gleick, Peter H. and Gary Wolff. The Soft Path for Water. The World's Water 2002-
2003: The Biennial Report on Freshwater Resources. The Pacific Institute. Island Press. July 23, 2002.
5 Gleick, Peter H. “Soft Water Paths.” Nature. Vol. 418. July 25, 2002. Pg 373.

174
APPENDIX I: Is River Linking the Best Way to Address Problems with Public Irrigation Structures? The river-linking plan is one of the main methods proposed by the current central administration to address existing and future water scarcities. As irrigation is one of the largest benefits touted, it is important to take a brief look at how India’s existing irrigation infrastructure is functioning to understand how the river-linking plan will complement the current structure. As a result of the food grain scarcity issues of the 1960’s, the government’s push for self-sufficiency and the green revolution, India now boasts one of largest irrigation networks in the world.1 By current world standards a high proportion of India’s crops are grown with the assistance of irrigation, making it an important component of the country’s agriculture output.2 Despite the large amount of initial investments flushed into the expansion of the irrigation system, existing irrigation infrastructure is not reaching optimal performance in most parts of the country. This is especially problematic, as the projections of future population numbers indicate that India will need to increase its food grain production by over 50 percent in the next two decades.3 Furthermore, six of the country’s 20 major river basin water resources are under stress and depleting. At this rate, it has been predicted that by the year 2050, only three basins in India will remain water sufficient.4 Issues of availability are further exacerbated by the increasing competition from expanding urban populations and manufacturing industries, resulting in water conflicts throughout the country and at all levels of governance. Given the limitations due to rising economic, environmental and social costs associated with infrastructure development and use, it is in India’s best interest to improve existing irrigation infrastructure rather than expand supply via projects such as river linking. The largest challenge irrigation sector managers at all levels face is the vicious cycle created by inadequate funding for operations and management. Poor irrigation system maintenance throughout the country has lead to a deteriorating service that continually fails to meet the increasing demands of farmers. User dissatisfaction coupled with underassessment and low recovery rates puts many systems into downward spirals. The best and most relevant example in this regard is the canal irrigation system. Tail - end farmers often suffer from minimized access to canal water as a result of wasteful use that has created problems of water logging in the head and middle reaches of the canal command areas.5 Despite large investments in annual expansion, the area irrigated by the major, medium and minor irrigation systems has been either stagnating or declining from the 1990’s onwards in many states.6 For instance, from 1985 to 2000 the irrigation canals of UP have decreased in irrigated area despite expansion efforts.7 Expanding irrigation infrastructure also faces several institutional challenges in India. In some instances non-viable infrastructure plans that do not have favorable cost benefit ratios are taken up for implementation based solely on political considerations. Often times the feasibility of such plans have not been explored and relevant departmental clearances (i.e. environmental) have not been fully considered.8 In addition, a large number of sanctioned irrigation projects proceed slowly due to lack of sufficient fund allocation and political conflicts over water rights. Delayed projects hence overshoot their estimated costs due to inflation. This ultimately leads to a continued hardship for expected beneficiaries and populations that must relocate to make way for the project. Furthermore, low quality construction as a result of contractor cartels and political alliances has often lead to dangerous construction and collapsing structures.9

175
1 Alagh, Yoginder K, Ganesh Pangare and Biksham Gujja, eds. Interlinking Rivers in India: Overview and Ken-Betwa Link. Delhi: Academic Foundation, 2006. 2 Connell, Peter, Shirshore Hagi and Nilufar Jahan. “Indian Agriculture: Trends, Trade and Policy Reform.” Australian Commodities 11(2004): 611 – 630. 3 Kumar, P. Food Demand and Supply Projections for India. Indian Agricultural Research Institute. Policy Paper 1998 – 2001. New Delhi: 1998 4 “River Basin Management: Issues and Options.” Indian Water Resources Society, 1997. 5 Government of India. National Academy of Agricultural Sciences. Emerging Issues in Water Management- The Question of Ownership. Policy Paper 32. New Delhi: 2005. 6 Selvarajan, S. Sustaining India’s Irrigation Infrastructure. National Center for Agricultural Economics and Policy Research. Policy Brief 15. New Delhi: December 2001. 7 Selvarajan, S. Sustaining India’s Irrigation Infrastructure. National Center for Agricultural Economics and Policy Research. Policy Brief 15. New Delhi: December 2001. 8 James, A.J. “Institutional Challenges for Water Resource management: India and South Africa.” Water, Households and Rural Livelihoods: July 2003.
<http://www.nri.org/WSS IWRM/Reports/Working_papers/WHIRL%20working%20paper%207_final.pdf>
9 James, A.J. “Institutional Challenges for Water Resource management: India and South Africa.” Water, Households and Rural Livelihoods: July 2003. <http://www.nri.org/WSS- IWRM/Reports/Working_papers/WHIRL%20working%20paper%207_final.pdf>

176
APPENDIX II: Various methods of water utilization in the KBLP region.
Name Use Description Problems Canals Irrigation Man made waterways that connect
reservoir and lake water to agricultural fields.
- Seepage due to poor maintenance that creates water logging situations and thus salinity. - Leaky taps.
Lift Irrigation
Irrigation Provides irrigation to fields at a level higher than the water source by using an electric or diesel pump to remove water from a near by source. It is applied to the field through pipes.
- Cost - Potential for overexploitation of groundwater sources
Tube wells/ Hand pumps
Drinking, bathing, household
Manually powered means to bring water to the surface from an established borehole. Communal resource.
- Exploitation of groundwater through unchecked placement of borings. - Waste
Masonry Wells
Drinking, bathing, household, irrigation
Structure built around a small excavation that taps into an underground aquifer or river. Water removed via bucket, electric or diesel pump.
Exploitation of groundwater
Check-dams Irrigation Small barriers built across the direction of water flow on shallow rivers and streams. Retains excess water flow during rains. Good way to provide water in lean periods. Pressure created in the catchment area assists in ground water recharge by forcing impounded water into ground.
N/A
Tanks/lakes Irrigation, bathing, household
Large excavated areas that form man made lakes by the collection of rainwater over time. Some structures date back 1000 years.
Poor maintenance resulting in reduced storage capacity and contamination
Weir Irrigation Small overflow type dam commonly used to raise the level of a river or stream.
- Reduces upstream water velocity that leads to increases in siltation. - Poses barriers to migrating fish
Dams Irrigation Barrier across flowing water that obstructs directs or retards flow, often creating a reservoir, lake or impoundment.
- Siltation - Poor maintenance - Low cost effectiveness - Short life - Relocation of local populations

177
APPENDIX III: Detailed statements made regarding potential negative impacts to wildlife due to construction of links.1
Continued on next page
Parbati Kalisindh Chambal Link
Total submergence area is 17,308 ha. The total forest area in the submerged area is about 244.4 ha (1.4%). Statement regarding wildlife, “As the forest under submergence is very less, there will be very little impact on the flora and fauna of the region due to creation of the reservoir”.
Polavaram Vijayawada Link
No information is provided regarding impact to wildlife. Although it is mentioned that submergence of forest area will occur, the is no mention of the number of hectares is not reported.
Damanganga
Pingal Link
Total submergence area is 3,461 ha. The total forest area to be submerged is 1,624 ha. Statement regarding wildlife, “The impact of wildlife come from the loss of habitat resulting from the submergence of forests. However, a large area is available in the surrounding region for migration of wildlife from the area coming under submergence. Hence impact will be of minor in nature. Moreover, the creation of permanent waterfront will be beneficial for wildlife existing in the surrounding forest”. In regards to the impacts on Endangered and Rare species, which include the Caracal (Felis caracal), Leopards cats (Felis bengalensis) and Leopard (Pathera pardus) the following statement was made, “As large forest areas are available in the surrounding region, these animals would migrate from the submerged forests. Hence no significant impact is expected.”
Mahanadi
Godavari
Link
Total submergence area is 63,000 ha. The total reserved forest are in the submergence area is 4000 ha. Statement made regarding aquatic life, “There is a Crocodile Project at the Tikapara gorge, which will be affected by the reservoir. To rehabilitate this project in the periphery of this reservoir adequate provision has been made in the estimate”. There is however, no information provided regarding the “adequate provision” that was made. In regards to flora and fauna, “The reservoir submergence will not affect the habitation of wildlife and local birds. The Royal Bengal tigers are found in the area near the proposed reservoir areas. There are no rare species of birds in the area”. *Research has shown that areas near submergence are still greatly impacted.
Inchampalli Pulichintala Link
Total submergence area of the three states involved in this link is 92,555 ha. The total submergence of forest is 21,734 ha. The proposed site for the Inchampalli project contains a number of important wildlife habitats. The Singaram sanctuary will be directly affected as a part of the sanctuary will be inundated following the construction of the dam. In addition, there are a number of important sanctuaries situated in the Adilabad and the Karimnagar district viz., Pranahita and Kawal wildlife sanctuaries which are also likely to be affected by the proposed construction. Further, 65 ha of Indravati National Park in Chhattisgarh falls under the proposed project site. The proposed dam site for Inchampalli project is the breeding area of a number of wild animals but at present no precise information as to whether the area falls under the migration route of any birds or other animals, is available.

178
1 National Water Development Agency, Government of India. (2005) Feasibility Studies.
[Online]. Available: http://nwda.gov.in/index2.asp?sublinkid=62&langid=1 [2005, Nov. 15].
Inchampalli Nagarjuna Sagar Link
The submergence area in the three states is about 94,620 ha. The total submergence of forest land in all the three states is 30,170 ha. The exact same wildlife impact information is provided as that of the Inchampalli Pulichintala link.
Almatti Pennar
Link
The total submergence areas is not provided in this report. However, the following statement regarding wildlife were was made, “Location of proposed link canal will partially affect wildlife due to reduction, disturbance and loss of habitat. The proposed link canal through Daroji Bear Sanctuary will create hindrance in wildlife movement migration path due to canal”. No information as to how such impacts could be reduced were provided.
Nagarjunasagar Somasila Link
The proposed link canal passes through two main reserved forest, which are called the Guttikonda and Udayagiri-Veligonda forests. About 895 ha of forestland is to be acquired for the construction of canal. In regards to wildlife, “No adverse impacts are expected”.
Pennar Palar Cauvery Link
The land acquisition for the link canal involves 9,895 ha, of which 1,025 ha are forest land. Although, it is implicitly stated that there is “no specific information available in respect of fish production in and around the Pennar Palar Cauvery Link command area” it is mentioned that “the formation of the link canal is not likely to cause any impact on the aquatic life.” In regards to wild animals and birds “no adverse impact are expected.”
Cauvery Vaigai Gundar Link
The total submergence area is reported in a fragmented manner. It is stated that 40 ha of forest area will be submerged, 3174 ha consisting of both private and government land is to be acquired for construction of the link and additional area of 470 ha would be submerged due to the construction of proprosed barrage (It is not clear has to where the 470 will be acquired from). In regard to aquatic life, it is stated that there is no specific informational available in respect of fish production in and around the link area. However, “the formation of the link canal is not likely to cause any impact on the aquatic life.” In regards to wild animals and birds, “No adverse impacts are expected.”
Par Tapi
Narmada Link
The total submergence area is 7,599 ha, of which 3,572 ha are forest land. In regard to wild animals and birds, “The wildlife in the area is not very rich. The wild animals reported in the area are blue bull, cheetah, wild bear, wild pig, rabbits and creeper, etc.” “The National park near Vansda and Botantical Garden at Waghai are outside the submergence area at a distance of 8 km and 5 km respectively from the nearest submergence area of the reservoir. However, the main canal of about 3.5 km length and feeder canal from Chikkar weir of approximately 1 km length will pass through the national park” “Due to activities in forest, wild animals are likely to migrate to safer places.”