Alignment Refinement: Jewish Meditations in English | Ken Lane
Upload
khangminh22Category
view
4download
0
Measuring the Digital Economy
Carol CaldwellUS Census Bureau
1
Ken RobertsonUS Bureau of Labor Statistics

Components of the Digital Economy
• E-business infrastructure: the share of total economic infrastructure used to support electronic business processes and conduct electronic commerce.
• E-business: any process that a business organization conducts over computer-mediated networks.
• E-commerce: the value of goods and services sold over computer-mediated networks.
2

US Census Bureau’s E-Commerce Products
• Quarterly Retail E-Commerce Sales• First published in 1999
• Presented as seasonally adjusted and not-seasonally adjusted series
• Annual E-Commerce Statistics• Covers manufacturing, retail, wholesale, and selected service industries
3

4
0.0
2.0
4.0
6.0
8.0
10.0
12.04Q
199
91Q
200
02Q
200
03Q
200
04Q
200
01Q
200
12Q
200
13Q
200
14Q
200
11Q
200
22Q
200
23Q
200
24Q
200
21Q
200
32Q
200
33Q
200
34Q
200
31Q
200
42Q
200
43Q
200
44Q
200
41Q
200
52Q
200
53Q
200
54Q
200
51Q
200
62Q
200
63Q
200
64Q
200
61Q
200
72Q
200
73Q
200
74Q
200
71Q
200
82Q
200
83Q
200
84Q
200
81Q
200
92Q
200
93Q
200
94Q
200
91Q
201
02Q
201
03Q
201
04Q
201
01Q
201
12Q
201
13Q
201
14Q
201
11Q
201
22Q
201
23Q
201
24Q
201
21Q
201
32Q
201
33Q
201
34Q
201
31Q
201
42Q
201
43Q
201
44Q
201
41Q
201
52Q
201
53Q
201
54Q
201
51Q
201
62Q
201
63Q
201
64Q
201
6 p
1Q 2
017
2Q 2
017
3Q 2
017
r4Q
201
7 p
E-Commerce Sales as a Percent of Total Retail Sales
Not Seasonally Adjusted Seasonally Adjusted
Source: Quarterly Retail E-Commerce Report.
5
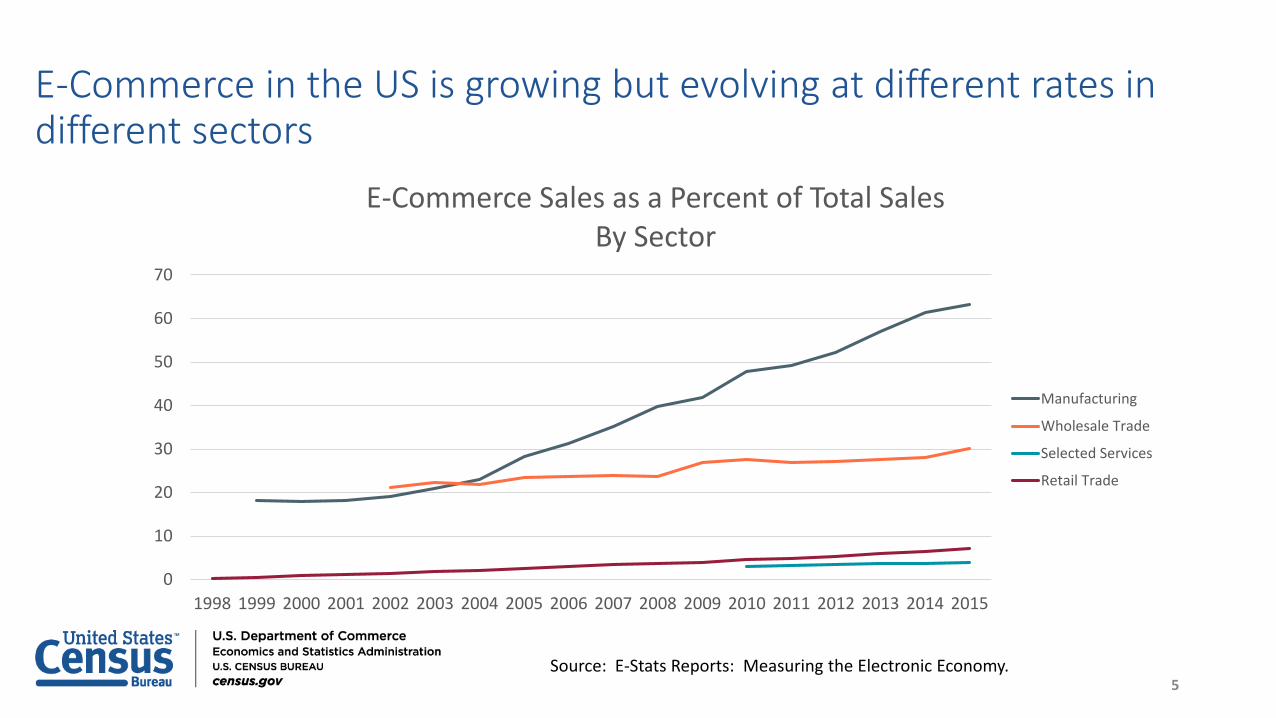
E-Commerce in the US is growing but evolving at different rates in different sectors
0
10
20
30
40
50
60
70
1998 1999 2000 2001 2002 2003 2004 2005 2006 2007 2008 2009 2010 2011 2012 2013 2014 2015
E-Commerce Sales as a Percent of Total SalesBy Sector
Manufacturing
Wholesale Trade
Selected Services
Retail Trade
Source: E-Stats Reports: Measuring the Electronic Economy.

6
$-
$1,000,000
$2,000,000
$3,000,000
$4,000,000
$5,000,000
$6,000,000
$7,000,000
2010 2011 2012 2013 2014 2015
E-Commerce Sales by Sector
Manufacturing Wholesale Trade Selected Services Retail Trade
Millions
Source: E-Stats Reports: Measuring the Electronic Economy.
Retail E-commerce
• The North American Industry Classification System (NAICS) separates retail business operations that conduct all business without a physical store
• NAICS 454110: Electronic Shopping and Mail Order Houses
• Operations with both store and non-store transactions are classified as store retailers No clean measure of total retail e-commerce sales
• Census Bureau developed a supplemental product to begin to address this problem
7

Supplemental Annual Retail E-commerce Table
8
0 100,000 200,000 300,000 400,000 500,000
Total Electronic Shopping and Mail-Order HousesMotor vehicle and parts dealers
Furniture and home furnishings storesElectronics and appliance stores
Building material and garden equipment and suppliesFood and beverage stores
Health and personal care storesGasoline stations
Clothing and clothing accessories storesSporting goods, hobby, book, and music stores
General merchandise storesMiscellaneous store retailers
Nonstore retailers
2015 Electronic Shopping and Mail Sales by Product
E-commerce Sales
Millions of Dollars
Source: Sales for U.S. Electronic Shopping and Mail-Order Houses (NAICS 4541) – Total and E-commerce by Primary Business Activity (2011-2016)

Services E-Commerce: Clarifying questions to reduce suspected under-reporting
9

Services E-Commerce
10

Measurement of the Gig Economy:Nonemployer Statistics Program
11
0
5
10
15
20
25
30
2004 2005 2003 2007 2008 2009 2010 2011 2012 2013 2014 2015
Mill
ions
Number of Nonemployer Businesses
Source: Nonemployer Statistics, American FactFinder

Measurement of the Gig Economy:Nonemployer Statistics Program
12
0
100,000
200,000
300,000
400,000
500,000
600,000
2004 2005 2003 2007 2008 2009 2010 2011 2012 2013 2014 2015
Number of Taxi and Limousine Nonemployers
Source: Nonemployer Statistics, American FactFinder

13 — U.S. BUREAU OF LABOR STATISTICS • bls.gov
US Bureau of Labor StatisticsDigital Economy Data
Quarterly Census of Employment and Wages Current Employment Statistics Producer Price Index

14 — U.S. BUREAU OF LABOR STATISTICS • bls.gov
US Bureau of Labor Statistics
BLS Quarterly Census of Employment and WagesNumber of establishments, employment, and total wages paid for
each county, metropolitan area, state, and the nation by ownership (private and government – federal, state, local) and industry
A census of all unemployment-insurance covered establishments collected each quarter, covering all industries, including:
– Electronic Markets– Electronic shopping– Electronic auctions

15 — U.S. BUREAU OF LABOR STATISTICS • bls.gov
US Bureau of Labor Statistics (BLS)
Current Employment StatisticsMonthly data on employment, hours, and earnings for all
employees and for production/nonsupervisory employees, by industry, for the nation, states, and metropolitan areas.
Industry detail decreases as geographic areas get more local. Industries include:
– Electronic markets and agents and brokers– Electronic shopping

16 — U.S. BUREAU OF LABOR STATISTICS • bls.gov
US Bureau of Labor Statistics (BLS)
Producer Price Index (PPI)A family of monthly price indexesMeasures average change over time in selling prices received by
domestic producers of goods and services. The PPI produces approximately 535 industry price indexes in
combination with over 4,000 product line and product category sub-indexes, including:
– Electronic and mail-order shopping
Copyright © 2022 FDOKUMEN