a case study on academic performance of coaching - uok.ac
290
“MANAGING STRESS TO IMPROVE EFFICIENCY AND MOTIVATION: A CASE STUDY ON ACADEMIC PERFORMANCE OF COACHING FACULTIES IN KOTA CITY” A Thesis Submitted for the Award of Ph.D. degree In Business Administration (Faculty of Commerce and Management) To the University of Kota By Ms. Shruti Sharma Under the Supervision of Dr. Gopal Dhaker Department of Business Administration, Government Girls Commerce College, Kota UNIVERSITY OF KOTA, KOTA (RAJASTHAN) 2019
-
Upload
khangminh22 -
Category
Documents
-
view
0 -
download
0
Transcript of a case study on academic performance of coaching - uok.ac

“MANAGING STRESS TO IMPROVE EFFICIENCY AND
MOTIVATION: A CASE STUDY ON ACADEMIC
PERFORMANCE OF COACHING FACULTIES IN KOTA
CITY”
A
Thesis
Submitted for the Award of Ph.D. degree
In Business Administration(Faculty of Commerce and Management)
To the
University of Kota
By
Ms. Shruti Sharma
Under the Supervision of
Dr. Gopal Dhaker
Department of Business Administration,
Government Girls Commerce College, Kota
UNIVERSITY OF KOTA, KOTA (RAJASTHAN)
2019

CERTIFICATE
I feel great pleasure in certifying that the thesis entitled “MANAGING
STRESS TO IMPROVE EFFICIENCY AND MOTIVATION: A CASE
STUDY ON ACADEMIC PERFORMANCE OF COACHING FACULTIES
IN KOTA CITY” by Ms. Shruti Sharma under my guidance. She has
completed the following requirements as per Ph.D. regulations of the University.
a) Course work as per the university rules.
b) Residential requirements of the university (200 days)
c) Regularly submitted annual progress report.
d) Presented her work in departmental committee.
e) Published /accepted minimum of one research paper in a referred research
journal.
I recommend the submission of thesis.
Date: Dr. Gopal Dhaker
(Research Supervisor)

ANTI-PLAGIARISM CERTIFICATE
It is certified that Ph.D. Thesis Titled “MANAGING STRESS TO
IMPROVE EFFICIENCY AND MOTIVATION: A CASE STUDY ON
ACADEMIC PERFORMANCE OF COACHING FACULTIES IN KOTA
CITY” by Ms. Shruti Sharma has been examined by us with the following anti-
plagiarism tools. We undertake the follows:
a. Thesis has significant new work/knowledge as compared already
published or are under copied verbatim from previous work unless it is
placed under quotation marks and duly referenced.
b. The work presented is original and own work of the author (i.e. there is no
plagiarism). No ideas, processes, results or words of others have been
presented an author’s own work.
c. There is no fabrication of data or results which have been complied and
analyzed.
d. There is no fabrication by manipulating research materials, equipment or
processes, or changing or omitting data or results such that the research is
not accurately represented in the research record.
e. The thesis has been checked using (i) SMALL SAE TOOLS- Plagiarism
checker website (ii) Academic Help Software and found within limits as
per HEC plagiarism policy and instructions issued from time to time.
Ms. Shruti Sharma Dr. Gopal Dhaker
(Research Scholar ) (Research Supervisor)
Place: Kota Place: Kota
Date: Date:

ABSTRACT
The evolution of coaching institutes in KOTA is a modern advancement
due to the impact of globalization, urbanization and speedy technological changes.
The coaching teaching professionals are the promoters for knowledge and skill
through correlative learning methods and have to perform varied duties. The role,
responsibilities and teaching activities of a teaching faculty member at coaching
institutes have sustained a change with the new change in the education method.
Hence they may face stress through common work and non-work stressors. Also,
now the young teaching professionals are encountered with the issue of twin role
dispute i.e. the work role and the family role. In an effort to match both these
roles, the faculty experiences stress.
As teaching is a stressful occupation, seeks need to be made to examine
“stress” in coaching faculty members. There is eminent absence of search on
stressors relevant to specific teacher groups in Indian framework. Therefore, the
current researcher was projected with three main premises viz., the effects of
stress are affected by gender and length of service, different personal, family and
situational factors are responsible for stress and the stress-effects are affiliated
with role stressors and job satisfaction in coaching teaching faculty members.
Descriptive research design was called for the research. A theoretical
framework was made to examine the effects of stress caused by different
antecedent factors in coaching faculty members. Based on the framework
independent and dependent variables were selected. The independent variables
included were individual and job relevant factors. The dependent variables were
the effects of stress.
The aim of the study formulated were to identify stress-effects in coaching
faculty members by gender, to find out the antecedent factors of stress, to scope
the amount of job satisfaction relevant to role stressors, to know the relationship
between stress-effects and job satisfaction and between stress-effects and role
stressors. Five hypotheses were supposed to test the relationship between the
elected independent and dependent variables. The search was limited to teaching
faculty members working at coaching institutes in Kota city. Relevant revision of

literature was gathered from books, journals, research papers and articles and also
from different internet websites.
Certain terms were operationally defined for the measurement of variables.
Questionnaire was used as an instrument for collection data. Three suitable
standardized scales were used for measuring the variables viz., Organisational role
stress (ORS) scale, Stress test and Job satisfaction scale. The total sample
consisted of 255 coaching teaching professionals.
The data analysis was carried out by categorization, coding, scoring,
tabulating and preparing graphs (Graphs represented the various categories as well
as the gender differences based on the data). Data were then analysed employing
descriptive as well as relational statistics.
Descriptive statistics was used to current data in frequencies, percentages,
mean and standard deviation on personal, job and family profile along with role
stressors, stress-effects and job satisfaction. Relational statistics was carried out to
study the relationship between elected variables and to test the null hypotheses
stated.
The major findings of this search ignited upon the findings relevant to the
personal, job and family profile of respondents along with role stressors, stress-
effects and job satisfaction, containing the outcomes of hypotheses tested.
The findings and conclusions accompany a number of implications from
this search. Suggestions were given for researchers, academicians, heads of the
coaching institutions and educational policy makers. Developed from the current
search, certain suggestions were also given which would be useful in planning
future researches. Finally, some interventions were outlined as coping strategies to
combat and curtail stress in coaching teaching professionals at three levels viz.,
personal level, family level and professional level. At the personal level the
recommendations inserted specific techniques to be used by faculty members for
coping with role stressors such as effective self control, cognitive therapy, time
management, innovative teaching methods, and social support, exercise and
leisure time activities.
At the family level, the suggestions inserted sharing of household duties,
family support, and approach coping. At the professional level, the stress coping

strategies suggested, can be devised and implemented by coaching management
authorities to control role stressors and lower job stress in faculty members. The
advised strategies are family supportive work culture, selection and recruitment,
“pre service” and “in service training programmes, collective coping, affective
coping, effective coping, man power planning, stress management training
programs, career-counselling, transparent policies and methods, formation of
faculty members organization, employment benefits and special provisions for
study leave and cultural exchange, resource centre and incentives. The
recommendations at all the three levels are assuring as measures of capacity
raising in coaching teaching proficient’s thereby relieving stress in them.
******

CANDIDATE’S DECLARATION
I, hereby, certify that the work, which is being presented in the thesis,
entitled “Managing Stress To Improve Efficiency And Motivation: A Case
Study On Academic Performance Of Coaching Faculties In Kota City” in
partial fulfillment of the requirement for the award of the Degree of Doctor of
Philosophy, carried under the supervision of Dr. Gopal Dhaker and submitted to
the University of Kota, Kota represents my ideas in my own words and where
others ideas or words have been included. I have adequately cited and referenced
the original sources.
The work presented in this thesis has not been submitted elsewhere for
the award of any other degree or diploma from any Institutions. I also declare that
I have adhered to all principles of academic honesty and integrity and have not
misrepresented or fabricated or falsified any idea/data/fact/source in my
submission. I understand that any violation of the above will cause for
disciplinary action by the University and can also evoke penal action from the
sources which have thus not been properly cited or from whom proper permission
has not been taken when needed.
Date: _________ SHRUTI SHARMA
(Research Scholar)
This is to certify that the above statement made by SHRUTI
SHARMA (Reg. No.: RS-263/13) is correct to the best of my knowledge.
Date: ________ Dr. Gopal Dhaker
(Research Supervisor)

ACKNOWLEDGEMENT
First and foremost, I would like to thank God for keeping me self-
confident and self-motivated to pursue my research goal with utmost passion,
perseverance, and patience during the most difficult times of my life.
There have been many people who have walked alongside me during my
research work. They have guided me, placed opportunities in front of me and
showed me the doors that might be useful to open. I would like to thank each and
every one of them.
I would like to thank our honourable vice chancellor Prof. Neelima Singh
for giving me the opportunity to work on the research topic, Former Dean Prof.
Rajeev Jain, Director Research Dr. O.P Rishi for allowing me to be a part of
University of Kota, Kota. Warm and sincere thanks are also expressed to the
entire staff at the university office.
I owe my deepest gratitude to my supervisor Dr. Gopal Dhaker, This
research would not have been possible but for his encouragement, valuable
guidance, stimulation and constructive suggestions provided from the initial to the
final level which enabled me to develop an understanding of the subject.
Deepest gratitude is owed to Dr. Kapil Dev Sharma for his interest and
advice to start the study and also for his insight, direction and sharing of expertise
from time to time, his unwavering support and inspiration during my years of
study.
Heartfelt gratitude is extended to the Directors and Heads of coaching
institutes at Kota for granting permission and help in coordinating the data
collection process.
Sincere thanks are offered to the respondents especially Dr. Pravesh Soni
and Saurabh Soni for extending their cooperation and willingness to participate in
data collection.
I would like to thank all library media specialists for their participation
who supported my work and helped me to get results of better quality.
I owe my sincere gratitude to my parents, Mr. Om Prakash Sharma and
Mrs. Madhu Sharma without whose best wishes, prayers, and encouragement this

research work would not have been accomplished successfully.
I would like to express my heartiest gratitude to my husband Mr. Harsh
Bhardwaj and In-law’s for their inspiration, moral support, patience and guidance
provided at every stage of this venture.
I wish to express my heart-felt gratitude to my daughter Mishka, for not
letting me get ‘emotionally hijacked’ during the entire course of my research
work.
I would like to thank my closest ones, friends, colleagues and Dr. Chetna
Mangal for helping me in SPSS and their continuous support and always being
there when I needed them the most.
Lastly, I wish to offer regards and blessings to all those who supported in
any respect during the completion of this project.
SHRUTI SHARMA

CONTENTS
Certificate
Anti Plagiarism
Abstract
Declaration
Acknowledgement
Table of Contents
List of Tables
List of Illustrations
List of Abbreviations
S. No. PARTICULARS Pg.
No.
Chapter-1
INTRODUCTION 1
1.1 Background Of The Study
1
1.2 Introduction To Stress
8
1.3 Job Description Of Faculty Members In Coaching Institutes
9
1.4 Rationale For The Study
10
1.5 Conceptual Framework
14
1.6 Statement Of The Problem
15
1.7 Significance Of The Study
16
Chapter-2 REVIEW OF LITERATURE 18
2.1 Stress And Theoretical Background
18
2.2 Antecedents As Correlates Of Stress And Relevant Studies
31
2.3 Stress - Effects And Relevant Studies Some Concerns
39
2.4 Role Stress And Role Stressors
49
2.5 Job Satisfaction And Relevant Studies
59

2.6 Stress Management Coping Strategies And Relevant Studies
66
2.7 Stress In Teaching Professionals And Relevant Studies
76
Chapter-3 RESEARCH METHODOLOGY
83
3.1 Research Design
83
3.2 Objectives Of The Study
84
3.3 Assumptions Of The Study
84
3.4 Hypotheses
84
3.5 Variables Under Study
86
3.6 Delimitations Of The Study
87
3,7 Justification For Selection Of Variables
88
3.8 Operational Definitions Of Variables
92
3.9 Data Collection Procedure
96
3.10 Tools Used For Measurement Of The Variables
99
3.11 Pilot Study
102
3.12 Selection Of The Sample
103
3.13 Analysis Of Data
106
Chapter-4 DATA ANALYSIS AND INTERPRETATION
112
4.1 Introduction
112
4.2 Graphical Presentation Of Demographical Profile
112
4.2.1 Age
113
4.2.2 Gender
114
4.2.3 Marital Status
115
4.2.4 Qualification
116

4.2.5 Area Of Specialization
117
4.2.6 Experience
118
4.2.7 Designation
119
4.2.8 Type Of Family
120
4.2.9 Number Of Dependents
121
4.3 Factors Affecting Stress And Job Satisfaction
122
4.3.1 Personal Factors
122
4.3.2 Family Factors
144
4.3.3 Situational Factors
154
4.4 Correlation Of Respondents’ Performance With Stress And Job Satisfaction
180
4.5 Correlation Between Stress And Job Satisfaction
183
Chapter-5 MAJOR FINDINGS, CONCLUSION & RECOMMENDATIONS
187
5.1 Major Findings 187
5.1.1 Personal Factors Affecting Stress And Job Satisfaction 187
5.1.2 Family Factors Affecting Stress and Job Satisfaction
192
5.1.3 Situational Factors Affecting Stress and Job Satisfaction
194
5.1.4 Correlation of Respondents’ Performance with Stress and Job Satisfaction
203
5.1.5 Correlation between Stress and Job Satisfaction
203
5.2 Conclusion
203
5.3 Implication Of The Study
205
5.4 Suggestions For Future Research
208
5.5 Recommendations
209
5.6 Limitations
214
Chapter-6 SUMMARY 216

BIBLIOGRAPHY 225
Research Papers Published During the Research
Work
ANNEXURE
Questionnaire

LIST OF TABLES
TABLE No.
TITLE PAGE No.
4.1 Distribution Of Respondents By Age 1134.2 Distribution Of Respondents By Gender 1144.3 Distribution Of Respondents By Marital Status 1154.4 Distribution Of Respondents By Educational Qualification 1164.5 Distribution Of Respondents By Area Of Specialization 1174.6 Distribution Of Respondents By Experience 1184.7 Distribution Of Respondents By Designation 1194.8 Distribution Of Respondents By Type Of Family 1204.9 Distribution Of Respondents By Number Of Dependents 1214.10 Comparison Of Mean Stress (ORS) On Basis Of Age
Group122
4.10 (a) Post-Hoc Tukey Test 1234.11 Comparison Of Mean Stress On Basis Of Age Group 123
4.11 (a) Post-Hoc Tukey Test 1244.12 Comparison Of Mean Job Satisfaction On Basis Of Age
Group124
4.12 (a) Post-Hoc Tukey Test 1254.13 Comparison Of Mean Stress (ORS) On Basis Of Gender 1254.14 Comparison Of Mean Stress On Basis Of Gender 1264.15 Comparison Of Mean Job Satisfaction On Basis Of Gender 1264.16 Comparison Of Mean Stress (ORS) On Basis Of
Qualification127
4.16 (a) Post-Hoc Tukey Test 1284.17 Comparison Of Mean Stress On Basis Of Qualification 128
4.17 (a) Post-Hoc Tukey Test 1294.18 Comparison Of Mean Job Satisfaction Score On Basis Of
Qualification129
4.18 (a) Post-Hoc Tukey Test 1304.19 Comparison Of Mean Stress (ORS) On Basis Of
Experience131
4.19 (a) Post-Hoc Tukey Test 1324.20 Comparison Of Mean Stress On Basis Of Experience 132
4.20 (a) Post-Hoc Tukey Test 1334.21 Comparison Of Mean Job Satisfaction Score On Basis Of
Experience133
4.21(a) Post-Hoc Tukey Test 1344.22 Comparison Of Mean Stress (ORS) On Basis Of Area Of
Specialization135
4.22 (a) Post-Hoc Tukey Test 1364.23 Comparison Of Mean Stress On Basis Of Area Of
Specialization136
4.23 (a) Post-Hoc Tukey Test 137

4.24 Comparison Of Mean Job Satisfaction On Basis Of Area Of Specialization
138
4.24 (a) Post-Hoc Tukey Test 1394.25 Comparison Of Mean Stress (ORS) On Basis Of Duration
Of Illness140
4.25 (a) Post-Hoc Tukey Test 1404.26 Comparison Of Mean Stress On Basis Of Area Of
Duration Of Illness141
4.26 (a) Post-Hoc Tukey Test 1424.27 Comparison Of Mean Job Satisfaction On Basis Of
Duration Of Illness142
4.27 (a) Post-Hoc Tukey Test 1434.28 Comparison Of Mean Stress (ORS) On Basis Of Marital
Status144
4.29 Comparison Of Mean Stress On Basis Of Marital Status 1454.30 Comparison Of Mean Job Satisfaction Score On Basis Of
Marital Status145
4.31 Comparison Of Mean Stress (ORS) On Basis Of Type Of Family
146
4.31 (a) Post-Hoc Tukey Test 1464.32 Comparison Of Mean Stress On Basis Of Type Of Family 147
4.32 (a) Post-Hoc Tukey Test 1484.33 Comparison Of Mean Job Satisfaction Score On Basis Of
Type Of Family148
4.33 (a) Post-Hoc Tukey Test 1494.34 Comparison Of Mean Stress (ORS) On Basis Of Number
Of Dependents149
4.34 (a) Post-Hoc Tukey Test 1504.35 Comparison Of Mean Stress On Basis Of Number Of
Dependents151
4.35 (a) Post-Hoc Tukey Test 1524.36 Comparison Of Mean Job Satisfaction Score On Basis Of
Number Of Dependents152
4.36 (a) Post-Hoc Tukey Test 1534.37 Comparison Of Mean Stress (ORS) On Basis Of Faculty
Designation154
4.37 (a) Post-Hoc Tukey Test 1554.38 Comparison Of Mean Stress On Basis Of Faculty
Designation156
4.38 (a) Post-Hoc Tukey Test 1564.39 Comparison Of Mean Job Satisfaction Score On Basis Of
Faculty Designation157
4.39 (a) Post-Hoc Tukey Test 1574.40 Comparison Of Mean Stress (ORS) On Basis Of Working
Hours158
4.40 (a) Post-Hoc Tukey Test 1594.41 Comparison Of Mean Stress On Basis Of Working Hours 159

4.41 (a) Post-Hoc Tukey Test 1604.42 Comparison Of Mean Job Satisfaction Score On Basis Of
Working Hours160
4.42 (a) Post-Hoc Tukey Test 1614.43 Comparison Of Mean Stress (ORS) On Basis Of Income 162
4.43 (a) Post-Hoc Tukey Test 1624.44 Comparison Of Mean Stress On Basis Of Income 163
4.44 (a) Post-Hoc Tukey Test 1634.45 Comparison Of Mean Job Satisfaction Score On Basis Of
Income164
4.45 (a) Post-Hoc Tukey Test 1654.46 Comparison Of Mean Stress (ORS) On Basis Of
Frequency Of Health Check-Ups165
4.46 (a) Post-Hoc Tukey Test 1664.47 Comparison Of Mean Stress On Basis Of Frequency Of
Health Check-Ups166
4.47 (a) Post-Hoc Tukey Test 1674.48 Comparison Of Mean Job Satisfaction Score On Basis Of
Frequency Of Health Check-Ups168
4.48 (a) Post-Hoc Tukey Test 1684.49 Comparison Of Mean Stress (ORS) On Basis Of Health
Status169
4.50 Comparison Of Mean Stress On Basis Of Health Status 1694.51 Comparison Of Mean Job Satisfaction Score On Basis Of
Health Status170
4.52 Comparison Of Mean Stress (ORS) On Basis Of Severity Of Illness
170
4.53 Comparison Of Mean Stress On Basis Of Severity Of Illness
171
4.54 Comparison Of Mean Job Satisfaction Score On Basis Of Severity Of Illness
171
4.55 Comparison Of Mean Stress (ORS) On Basis Of Having Meal On Time
172
4.55 (a) Post-Hoc Tukey Test 1734.56 Comparison Of Mean Stress On Basis Of Having Meal On
Time173
4.56 (a) Post-Hoc Tukey Test 1744.57 Comparison Of Mean Job Satisfaction Score On Basis Of
Having Meal On Time174
4.57 (a) Post-Hoc Tukey Test 1754.58 Comparison Of Mean Stress (ORS) On Basis Of Job
Timings175
4.59 Comparison Of Mean Stress On Basis Of Job Timings 1764.60 Comparison Of Mean Job Satisfaction Score On Basis Of
Job Timings176
4.61 Comparison Of Mean Stress (ORS) On Basis Of Type Of Treatment
177

4.61 (a) Post-Hoc Tukey Test 1784.62 Comparison Of Mean Stress On Basis Of Type Of
Treatment178
4.62 (a) Post-Hoc Tukey Test 1794.63 Comparison Of Mean Job Satisfaction Score On Basis Of
Type Of Treatment179
4.63 (a) Post-Hoc Tukey Test 1804.64 Correlation Of Performance With Stress And JSS 1814.65 Correlation Between ORS, Stress And JSS 1845.1 Hypothesis Testing Results 204

LIST OF ILLUSTRATIONS
FIGURES/CHARTS
TITLE PAGE No.
Fig.1 Schematic representation of the hypothesized relationship amongst the selected variables
15
Fig.2 Outline map of Kota showing the locale of the study 105
Chart 4.1 Distribution Of Respondents By Age 113
Chart 4.2 Distribution Of Respondents By Gender 114
Chart 4.3 Distribution Of Respondents By Marital Status 115
Chart 4.4 Distribution Of Respondents By Educational Qualification
116
Chart 4.5 Distribution Of Respondents By Area Of Specialization 117
Chart 4.6 Distribution Of Respondents By Experience 118
Chart 4.7 Distribution Of Respondents By Designation 119
Chart 4.8 Distribution Of Respondents By Type Of Family 120
Chart 4.9 Distribution Of Respondents By Number Of Dependents 121
Chart4.10 Correlation between Average Performance & Average Stress (ORS)
182
Chart 4.11 Correlation between Average Performance & Average Stress (Stress test)
182
Chart 4.12 Correlation between Average Performance & Average Job Satisfaction score
183
Chart 4.13 Correlation between Average Stress (Stress test) & Average Stress (ORS)
185
Chart 4.14 Correlation between Average Job Satisfaction Score & Average Stress (ORS)
185
Chart 4.15 Correlation between Average Stress (Stress test) & Average Job Satisfaction Score
186

LIST OF ABBREVIATIONS
S. No. ABBEVIATION FULL FORM
1 AIEEE All India Engineering Entrance Examination
2 ANOVA Analysis of Variance
3 CBSE Central Board of Secondary Education
4 JSS Job Satisfaction Scale
5 IRD Inter Role Distance
6 IIT-JEE Indian Institute of Technology-Joint Entrance Examination
7 NEET UG National Eligibility cum Entrance Test
8 NIT National Institute of Technology
9 ORS organisational role stress
10 Ph.D. Doctor of Philosophy
11 PI Personal Inadequacy
12 RI Role Isolation
13 RA Role Ambiguity
14 REC Role Expectation Conflict
15 RIN Resource Inadequacy
16 RS Role Stagnation
17 RE Role Erosion
18 RO Role Overload
19 SRD Self Role Distance
20 STS Stress Test Scale
21 SPSS Statistical Package for Social Sciences
22 Viz. Namely

CHAPTER - 1 INTRODUCTION

1
CHAPTER-1
INTRODUCTION
Flourishing economy and the growing education sector is fast stipulating
India on the universal map. With a speedy progress in all space of business, India is
on its way to fame and contributes to the great void of the well managed education
coaching business.
In recent years, Organized coaching industries has achieved thrust Class-room
contact programs have become a fixture in the urban countryside across the
country. Modern education business can truly be the enzyme in facilitating
consumer spending with utmost value and profit. Thus progress in education
industry has huge potential of creating new jobs within the next few years.
Compassionate these adjustments and challenges, since the past few years, the
demand for IIT-JEE/AIEEE/AIPMT/NEET/AIIMS graduates and postgraduates
with career in education business have developed considerably. Likewise, other
programs such as Teaching methodology, Time management, Course for ambitious
world, Best and Reliable faculty, pre-eminence on education with integrity, State-
Of-The-Art-Technologies, Indiscriminate teaching, Student orientated system,
Platform to anticipation oneself and Positive environment are highly inserted in
addressing the needs of all aurora Education sectors.
1.1 BACKGROUND TO THE STUDY
Coaching/ Classroom contact program education has become the most
prevalent episode in modern times. Different types of organizations such as
industries, financial institutions and banks, health care centers, hospitals and clinics,
public sector undertakings, service centers, social welfare agencies, and educational
institutions are all secure and enforce the information and trained from education to
augment their attainment.
Coaching education in the country has made remarkable progress during the
last two decades. The liberalization of the internet service led Globalization during
the next part of the last decade has stiffed a large number of protest that appeal
leading skills. The boom of coaching institutions presents Pre-Nurture and Career

2
Foundation, Graduate and Post graduate-level programs are the reaction of the huge
demand and supply rift that was created due to the swift extension of the economy.
The numbers of coaching institutions that offer IIT-
JEE/AIEEE/NEET/AIIMS courses have elevated greatly. About Twenty-eight
years ago, there were only a few institutes that provide coaching education
programs. These were renowned institutes that fascinate the brilliant students and
skilled them for high-level positions in private sectors. This progress implies a high
appeal for the coaching education industry.
In India, the role of a faculty has been changing at fast speed. The prediction
of the education sector put strain on the institutes to build a capable workforce with
proficiency of blueprint application. It is expected that faculty members frequently
refine themselves in their learning experiences.
Kota is considered to be “The Hub of Education”.
The coaching capital of India", the small town of in Rajasthan is home to
more than 150 coaching institutes that qualify aspirants for engineering entrance
exams like JEE Main, JEE Advanced and medical entrance exams like NEET-
UG, AIIMS. There is shortage of coaching centers in this sleepy little town whose
economy is now backed purely by the coaching industries. There are more than 1.5
lakh students at any given point of time in Kota, busy preparing for different
entrance exams, some from as young an age as 13 years. Determining a coaching
institute is a great decision that should be taken after giving ample thought to each
alternative and analysing the pros & cons of every coaching center in Kota that you
shortlist.
The coaching industry has developed speedily here. Many educationists have
invested in and picked Kota as the next education hub. Hence a large number of
students and working proficient’s have ended in Kota. The enormous progress in
these sectors has arisen in the requirement of skilled faculties in the industry. The
coaching institutes in Kota have initiate quality education in the aurora sectors in
India. These Institutes work with a motto of a dream, “To Lead” and “To Success”
professionally sound, sophisticated and vigorous leaders with a vision and endeavor
to match the challenges of the new paradise.
The brunt of industrialization, urbanization, globalization and brisk

3
technological changes has to lead to the evolution of coaching institutes in Kota.
The evolution of these institutes is not very old. About thirty-four years back in
(1984), BANSAL CLASSES PRIVATE LIMITED was the first coaching
institute to start in Kota. BCPL was established in 1984 as an 'Adopting methods
that best suit our students to crack the JEE'. Mr.V.K. Bansal, the best educator, in
1984, felt the need to provide the right direction to JEE aspirants for JEE
preparations. With his dedication and positive attitude, Bansal Classes produced
wonderful results each year which challenged themselves to produce even better
results.
ALLEN CAREER INSTITUTE: is a pioneer institute in the field of
coaching for Competitive Exams. Founded on April 18, 1988, and named in the
loving memory of Late Shri Laxmi Narayan Maheshwari, father of four brothers
Shri Govind, Shri Rajesh, Shri Naveen & Shri Brajesh Maheshwari, and ALLEN
has today become a synonym of SUCCESS. In 1988, Shri Rajesh Maheshwari
started with just eight students and after a few months Dr. K.G.Vaishnava, the
eminent professor of Biology also joined him. It was the only institute of its time
which provided coaching for all Science subjects i.e. Physics, Chemistry, Biology
and Mathematics under one roof. This strong association became the foundation
stone of the revolutionary Pre-Medical coaching institute of that time. New heights
of success were scaled year after year. The Institute achieved remarkable Landmark
of 12 selections in Rajasthan PMT in the year 1991.
CAREER POINT LTD: Providing Quality Education since 1993. In May
1993, Career Point was incorporated to impart quality education to students
preparing for various competitive examinations. With the sky-high ideals and
commitment to excellence, now Career Point has taken a shape of vibrant, dynamic,
responsible and one of the most successful coaching institutes of the country.
Career Point is unique for the quality of education that it imparts to students and its
dedication towards their success. Today, Career Point stands apart and well above
the rest on a distinguished platform, as an epitome of success. This could be
achieved simply by virtue of the excellent teaching methodology that Career Point
has evolved, developed and implemented over the years.
RESONANCE: was founded on 11th April, 2001 by Mr. R.K. Verma,

4
B.Tech, Electrical and Electronics from IIT Madras. Coming from an obscure town
to becoming the top educationist in the field of education, enabling students from
all parts of the country to realize their dreams of IIT, Mr. R.K. Verma has indeed
come a long way. The institute is having its own Study Centres which are offering
Classroom Programmes for IIT-JEE at Kota. The institute has also entered into
associations with some of the reputed schools across the country for the Integrated
In-School Classroom Contact Programmes for the preparation of IIT-JEE.
Resonance formally launched its Distance Learning Programmes through its DLP
Division during the Academic Session 2005-06 looking at the need of students who
cannot leave their native places for education. Resonance launched its Pre-
Foundation Career Care Programmes (PCCP) Division in 2006.
MOTION-IIT-JEE: The foundation of MOTION was laid with the
establishment of MOTION IIT-JEE in Dec 2007. MOTION IIT-JEE was the
culmination of a desire to start an entrepreneurial venture in Pre-engineering
examinations coaching in Kota. Motion is one of the top Institutes of Kota for JEE-
MAIN & ADVANCED, NEET, AIIMS, NTSE, KVPY & Olympiads and a well-
known name in the education industry to provide valuable Edu-services to students.
Motion intends to fill the supply side gap in the education sector by providing a
platform to budding edupreneurs to unleash their potential & innovative skills while
remaining committed to the cause of development of human potential.
VIBRANT ACADEMY: is widely known as the experienced institute for
IIT Coaching in India. Vibrant provides training to the students who want to enroll
themselves in the most competitive and challenging course Engineering. For
admission, students have to appear for the IIT Entrance exam and get a better rank
to get selected. Academy would like to introduce us, “VIBRANT ACADEMY”, as
the most proficient and Best IIT JEE Coaching in India for the students who are
looking for their bright future. Academy provides extensive and exhaustive study
material for IIT Entrance to make students eligible for admission in IIT.
AAKASH INSTITUTE: Aakash Institute is one of the well-known
institutions in the country that provides comprehensive test preparatory services to
students for the preparation of medical entrance examinations. The Institute
initially commenced operations in Delhi with a few students but with a vision of

5
Mr. J.C. Chaudhry, a prominent teacher, and an educationist. Some of these
students cracked the medical entrance exam securing top ranks making Aakash one
of the sought after coaching institutes for the preparation of medical entrance
exams. Aakash Institute for Medical offers test preparatory courses for medical
entrance exams such as NEET, AIIMS, and JIPMER. This year, 53 Aakashians
made it to the Top 100 selections in NEET- UG 2018. Ever since its inception
Aakash is known for delivering quality coaching and producing good ranks in
various Medical Entrance Exams across India. Aakash vision is to be the most
admired brand in the education sector, helping the young aspirants to make their
dreams come true through high-quality teaching, technology-enabled systems, and
commitment.
SARVOTTAM CAREER INSTITUTE: The institutes name 'Sarvottam
Career Institute', itself is synonymous with excellence. As a team, Faculty
members of the Sarvottam Career Institute have pledged to revolutionize the
education framework which has existed for years, by simplifying the process of
learning. With a strong faculty team and committed management staff, Sarvottam
Career Institute is undoubtedly the best place to embark on your journey of the
medical entrance exam. Above all, the institute would request every student to talk
to us whenever they feel like especially in moments of self-doubt or anxiety. At
Sarvottam Career Institute, every child gets a fair chance of exploring his/her
abilities. This is achieved by providing the opportunity to study under the flagship
of their 'Favourite Teachers' who have already proved their mettle in the field of
education in their respective subjects.
Institute will foster a positive learning and progressive environment with a
lot of support and aids to ensure student success irrespective of their current
academic merit accomplished so far. The expert teaching and the training
techniques employed by confident and able faculties will not only help them bridge
the knowledge gradient but also equip them with the tricks to crack these medical
entrance exams successfully, thereby making their targets realistic. Institute wants
to reinforce their confidence, boost their morale and leave no stone unturned in
their struggle for their career goals.

6
NUCLEUS EDUCATION: is one of the peerless educational institutions,
acclaimed for its quality education. It is avowed to every student, teacher and city-
related to academics and results. Nucleus education is an extolled, result from an
oriented coaching institute in Kota, Rajasthan. It renders preparation classes for
IIT-JEE examinations. Institute proffers a meritorious learning platform for IIT
aspirants by top-notch intellect, proficient and highly experienced faculties to
provide autonomous education. The highly conducive & competitive atmosphere of
the institute accredits that each little doubt gets resolved.
BTRIX CAREER INSTITUTE is a premier coaching institute for the
preparation of Pre-medical (AIPMT (NEET-UG)/ AIIMS). At Btrix Kota, the
institute focus on building a strong foundation of knowledge and concepts in
students for their success and provides an excellent platform for the preparation of
competitive exams and board level education. The best academic support and
personal care that the institute provides to the students help them meet their career
goals and objectives. The core values of Determination, Honesty, Authenticity,
Integrity, Devotion, Humanism, Holistic Learning, Social Ethics, and concern for
society & environment are all closely interwoven into the fibre of academic
programs. Our highly qualified and most experienced faculties at Kota centre are
dedicated and committed to student complete success and provide assistive
surroundings to contribute to their social, cultural, academic and all-round
development.
These top ten coaching institutes namely BCPL, ACI, CPL, RESONANCE,
MOTION IIT-JEE, VIBRANT ACADEMY, AAKASH INSTITUTE,
SARVOTTAM CAREER INSTITUTE, NUCLEUS EDUCATION, and BTRIX
CAREER INSTITUTE form the landmarks in the documented evolution of
coaching institutes in Kota. Since 1984, many more coaching Institutes budded in
and around Kota city. Today, there are more than 50 Advanced Coaching Institutes
in Kota, mostly private, offering competitive exam courses to students from
different parts of the nation and other countries. Although most of these institutes
have immense neighbouring, big architecture with corporate culture and stylish
luxuries, yet the education or academic quality of some of these institutes are far
from gratifying. Utmost of these institutes do have good foundation, library and

7
laboratory facilities, but they are seriously handicapped in faculty resources. The
teaching faculties are the facilitators for insight and skill through bilateral learning
methods in education.
The swiftly changing educational process in the twenty-first century has
afflicted educational syllabus at all levels and the teachers who have to respond to
both the appeals of insight as well as the needs of society meaningfully, sense and
cope with the trends of societal exclusion of the educational system. Today there is
too much knowledge. The boost in the body of knowledge in each discipline poses
a vital challenge for a faculty member on how to envelop such raise knowledge in a
meaningful manner so that it can be shared and transmitted to students at various
age groups and at distant educational levels. A faculty member thus has to find the
right type of knowledge mix to furnish to the needs of students of the twenty-first
century. Therefore, the role of a teaching proficient’s is in the dispose of reform.
The rush relevant to human life is cropping up in the day to day living and the
social role of a faculty member within the coaching institution is facing a
challenge. As a result, the changes and social push that are taking place have a
direct presence on the teaching faculty’s role, responsibilities and teaching
activities. The faculty members face this protest every day in release their duties
efficiently.
The coaching institutes require highly proficient faculty members having
teaching experience. The faculty members play a number of roles such as blend
research with academics; teach to apply theoretical knowledge as well as the latest
technology and techniques to real world case studies. A faculty member has to
unite skills from a variety of disciplines draft to evolve expertise both in
individuals and in groups to bridge the gap between theoretical knowledge and
practice. They are also needed to handle consultancy and research projects for
corporate houses and thus grow a strong connection with the experts in industry to
have few of experience in the given subject matter. The coaching faculty members
put in long working hours to serve backing to the students for achieving their
career inclination. It is a great protest to the teaching proficient’s of coaching
institutes to live with energy by coming up to people’s expectations to gladly
obtain their status quo. They may face tension, anxiety, fear, pressure, strain, and

8
stress in their day to day life to education. A few other factors such as job
insecurity, increasing overload, accountability without adequate authority,
inadequate facilities and lack of acceptance may also add to stress in these teachers.
Further, coaching teaching professionals might also be subjected to face
common stressors viz.; work overload, time restraints, issues with working
conditions, relationship with colleagues, lack of resources and alarming grow in
physical appeal of teaching. Insufficient money as salary and lack of respect in
society finally reduces the psychological well being of teaching faculty members. It
alter the teaching competencies the other.
1.2 INTRODUCTION TO STRESS
Admitting the fact of stress exists since early times, sensible trial to study
the concept orderly has begun in the latter half of the twentieth century. Social and
biological sciences have found it basic and fruitful to research the holdings of stress
and psychological strain on the physical and mental well being of the people.
Originally, stress was calculated in terms of general adaptation syndrome
concentrating mainly on physiological depth of stress. Now, attention has also
shifted to psychological and behavioral dimensions as stress is more than a simple
cause-effect reaction.
Stress is a common experience of people when many appeals are placed on
them by their work or personal conditions. This is, of course, a surely part of life.
Mild stress proves helpful in overcoming periods of frustration and dull routine.
However, too much stress affects the health and well being, everyday
accomplishment and behaviour unfavourably. Day to day issues, work-related
pressures, battle of interests between home and workplace, unrealistic expectations
of others –all lead to stressors which are the causes of stress. Stressors muddled
physical stressors, environmental stressors, individual stressors, family stressors,
interpersonal stressors, career and job-related stressors. These stressors need to be
trained. Stress management is intrinsic to good management practice. Stress has
both positive and negative aspects. Both need to be educated for upgraded
accomplishment and benefits at work.
Job stress can become a vital topic for the study of understanding

9
organizational behavior since it may negatively affect the physical and mental
health of the employees and their addition to the efficiency and effectiveness of
organizations.
In today’s world, young teaching professors with a issue of battle between
career roles and opting for an evenly pressing role at home. There are stresses
combine with both alternatives and with electing to balance between them.
The dilemma of stress in teachers is a vital aspect of the method of social
variation in India. The ensuring result is that the modern men and women teachers
live in two scheme and need to execute both familial as well as professional roles.
This, in turn, leads to a number of stresses amidst men and women teaching
proficients.
Over the past 25 years, significant resolve in male and female patterns and
roles have been checked. Although a significant ratio of men and women teachers
are still part-time, low-status jobs –opportunities for full time job have raised.
Economic burden and social and psychological needs to develop one’s self-identity
are the motivators to full-time careers in teaching.
As modern life is full of stress, fixed stress experienced at work and at home
may edge to different physiological and psychological issues. As an outcome, the
whole group around them: may it be the family, occupational or organizational
group, it suffers. Organizational roles are demanding in assimilate teaching
employees with their organizations. Investigator working on the increasing
complexity of organisational roles identifies the potential of disturb and stress in
these roles as teaching is a stressful action.
Even so a number of investigator have been borne out covering a wide
cross-section of the population on stress but no investigator has yet made an effort
to learn coaching teaching proficient’s as relevant to stress. The current search is an
effort to examine the relationship between stress-effects as related to both work and
family roles and job satisfaction in coaching teaching professionals.
1.3 JOB DESCRIPTION OF FACULTY MEMBERS IN COACHING
INSTITUTES
Faculty at coaching institutes pass their wisdom and mastery to the next

10
genesis of youth. They lift their students to think mortally as well as imaginatively;
supply practical training lives. As subject experts in their fields, they also set
standards for research, and scholarship.
Teachers work at IIT-JEE/AIEEE/AIIMS/NEET Coaching institutes. Some teach
part-time in the evening and work for continuing study design. Most of the teaching
faculty work in one department and specialize in particular disciplines related to
subject courses. They usually teach courses in each academic session, combining
lecture and consultation. Utmost of their time is spent in lectures, correcting reading
answer papers of student’s of examinations, preparing and advising students. Some
teachers have administrative duties also such as being dean of students, course
coordinators, etc. Some teachers work part-time as consultants to educational
organizations, government agencies, and corporations.
Teachers with high aptitude and settled prestige may work as head of the
departments. Uttermost of the teaching faculty members spend from twelve to
twenty hours in class each day with their rosters changing each session. Work
hours, faculty meetings, advising and class preparation, account for thirty to forty
additional hours per week. Due to these varied duties and responsibilities, a
coaching faculty member is under considerable burden throughout the year.
1.4 RATIONALE FOR THE STUDY
The anomaly of stress is as old as the past of mankind or any other life form.
The ruler causes of stress in the first 50 years post-independence in people were
insecurity, lack of choice and lack of awareness about recourses amidst other
aspects. Today, jovially stress is build by greater awareness and higher choices
creating disturbances in work-life balance and related issues. Stress cuts across
gender, age, profession, location or any other aspects. Reaction to stress is getting
equally inexplicable and unpredictable.
The interest of investigator and scientists in the issue of stress has been rising with
the advancement of the current century which has been termed the “Age of
Anxiety and Stress.”
Stress is exhibited in physiological, psychological, behavioral and
organizational forms. All these certainly put a force on the workplace performance

11
creating organizational effects like absenteeism, job turnover, and poor
organizational situation and lower productivity. Domestic stress is seen in nasty
results like higher divorce rates and broken families. Today, the collision of stress is
felt not only by individuals but by organizations and society at large. Stress
management, thus, is a flashing issue in the current scenario of insecurity and
instability.
In modern years, teacher stress has become an issue of increasing public and
professional concern. Since the teaching profession is rare yet stressful, whether
stress is being meet in teaching professionals of coaching institutes in Kota, needed
to be tested.
Located on the review of literature, although familiar areas loom in
quantitative research as sources of stress for teachers in natural, consideration has
yet to be given to the individual teachers within the relation of specific education
systems and also to the clout which have an bang on these systems.
A hint appears from different models of stress reviewed, it was planned to
study the population sample of teaching professionals and their experience of stress
in reaction to their roles in coaching institutes.
Review on researches points out that very few studies have been conducted
on male and female differences in stress-effects with special reference to teaching
professionals. In this context, this study will be a unique one.
As the evolution of coaching Institutes in Kota is a new development, very
less investigators have made an effort to study these institutes with regard to
psychological behavior of teaching faculty members in terms of “Stress” The
research in the field of teacher stress admit that little effort has been made to define
its causes in normal. Research has supported the view that “Teaching stressful
occupation” (Dworkin, 1990; Jackson, Haney, Schwab and Schuler 1986).
“Teachers” stress has between society and education has become an outcome of
current social reform, the teaching professionals face raised stress due to corporate
and community intentions to implement new curriculum and teaching practices, and
in doing so it is spiked out that work role stress is a common stressor in these
professionals. Research literature revealed that teacher stress was reflected in lower
job satisfaction. As well, the stress was caused not only by the immediate teaching

12
environments but also by the institutional and organizational aspects. Therefore, the
investigator senses that it would be appealing to examine the relationship between
stresses - effects in faculty members, their role stressors and job satisfaction.
A teaching professional’s personal life and has a vocational or professional
life. On both the frontal, a faculty member has to play varied roles as one. While
playing these roles, the faculty members may be experiencing jangle in family life
due to low time management, fetid relationships at the work-place and poor
working conditions at the work place. These outcomes in an inefficiency to cope up
with the twin call of work and family and also to beat a balance between their work
role and family role.
The investigator felt that it will be alluring to conclude whether work role and
family role positions were stressful or not stressful and whether the same position
was responded contrarily by male and female faculty members. In order to know
stress in teaching faculty of coaching institutes, the investigator needed to find the
major causes, the common role stressors, and the stress consequences.
Another logic for researching into teacher stress was that occupational stress
in teaching has been found ending in having a harmful effect on teacher’s 1989;
Fletcher and Payne 1982; French 1988; Galloway et al. 1984; Kyriacou, C. and
Pratt 1985). High stress emanated in threatening of intellectual ability of teaching
professionals irrespective of one’s age,
While recording on more physical stress syndrome, Bradfield and Fones
(1985) in their search on special teacher stress said that the psychosomatic
condition of a teacher exactly influences his personal, social and intellectual
behavior along with the personality attributes. Hence the researcher was excited to
know the alteration in the psychological behavior of coaching faculty members due
to psychosomatic change.
Further some studies on teacher’s “stressful mental conditions of a teacher
exactly afflicted his/her personal, social, classroom and intellectual behavior which
has a direct port on the institution, the students, the system of education, the
community and society at large. Verma” Romesh (1998)
The researcher further argues that the holdings of stress on health and ways of
coping with stress may be a matter of change in the clarification of stressful events.

13
Although geographic variations, coaching teaching urbanites in distinct coaching
institutes may experience nearly akin amounts of stress in their daily living.
Performing like roles in various coaching institutes may have allied characteristics
which need to be identified as contributing to related stress experience.
Yet the popularity and origin of occupational stress amidst teaching
proficient’s, has been an vital field of search (Borg 1990; Coles and Walker 1989;
Dworkin et al.1990; Fimian 1987; Kaiser and Polczynski 1982) and the investigator
have classified stressors for groups of teachers in specific teaching relation but
there is a notable absence of search about coaching teaching professionals in
teaching setting in Indian framework.
The investigator desired to classify the main causes of stress and
conceptualized three basic premises:-
Firstly, the effects of stress on teaching professionals are altered by gender
and service period.
Secondly, numerous personal factors, family factors, and situational factors
are responsible for stress.
Thirdly, the stress-effects are blended with role stressors and job satisfaction
in teaching faculty members.
Therefore, in the shine of the above-stated premises, as well as the formerly
stated backdrop, a number of questions were derived such as what are the effects of
stress in coaching faculty members? What are the causes of such stress experienced
by them? Do work and family roles create stressful situations? What are the varied
stressors at work leading to stress? In what way job satisfaction is related to stress?
Is there a relationship between family role stressors and work role stressors and
various effects of stress experienced?
In order to get reactions to these queries, the implication of the issue under
search was the need of the hour. It was critical to find out the forces which were
liable for depressing the psychological behavior of a faculty member on one side
and the corollary of stress on the other side to avert unwanted stress, for the proceed
of the teaching learning process. As, there are no studies on stress, its causes and,
its relationship to role stressors and job satisfaction in teaching professionals; it
legitimize the direct of the current search with the inclusion of the above said

14
variables.
There is a tearful need for search into the social, behavioral and
psychological forms of teaching Professionals. In this text, the current search very
timely could prove to be helpful in the Indian framework.
The concept of stress though new in origin has reached with amazing
velocity to the apex in acceptance. This new less explored area created enthusiasm
in the mind of the researcher to undertake the search study of the frightful issue.
1.5 CONCEPTUAL FRAMEWORK
Stress is inescapable in human life. Working professionals do face stress at
their workplace. The coaching faculty member experiences various effects of stress
and the extent of stress varies due to many an imaginative factors.
The conceptual framework to search the effects of stress in teaching
professionals induced by various antecedent factors is shown in figure 1.
In order to solicit a deeper and meaningful discerning of the effects of stress
in coaching teaching professionals, an effort was made to identify various possible
variables which have their subscription towards it. The applicable literature and
relevant researches on stress directed the researcher to organize the elected
variables into imaginative relationship. These connections have been illustrated in
the conceptualized framework (figure 1).
The components of the framework are:-
Antecedent factors
1. Individual factors
a) Gender differences
b) Personal factors
c) Family factors.
2. Job related factors
a) Role stressors
b) Job satisfaction
c) Situational factors
d) Service duration.

15
Outcomes
1. Stress-effects.
It is projected that the stress in teaching professionals is provoked by certain
antecedent factors such as personal, family and situational factors. These factors
relevant to the teaching profession will induce various effects of stress in faculty
members which will drive to three outcomes of stress, i.e. physiological effects,
psychological effects, and behavioral effects. It is further planned that the teaching
proficient’s at coaching institutes experience stress raising out of their attainments
of different roles in executing teaching activities and responsibilities which
consequence their level of job satisfaction. It is also hypothesized that coaching
teaching faculty members vary in the amount of stress-effects experienced with
relation to gender and period of service.
Conceptual framework (Figure: 1)
1.6 STATEMENT OF THE PROBLEM
To comprehend the mutual relationship between stress-effects and role
stressors; stress-effects and job satisfaction, this search was designed. The search
should classify gender differences if any, in the stress-effects experienced by
faculty members. Further, the antecedents or original factors of stress should be
searched. Family role stressors and work role stressors should be planned to know

16
the relationship between the stress-effects qualified by coaching teaching faculty
members and the role stressors. Finally, the amount of job satisfaction as relevant
to role stressors should be examined.
Hence it was designed to make “Managing Stress to improve efficiency
and motivation: A case study on academic performance of coaching faculties
in Kota city”.
1.7 SIGNIFICANCE OF THE STUDY
The teaching faculty members may practice role stress because of the various
roles they play in society. The conflict between the crucial demands of work and
strain at home activate issues which attend to stress. The dilemma of match
between an organization and family demands may all put a pressure on the
teaching faculty members at work; similarly, the stress at work may flow over and
have a negative strike on their family and personal life.
Most of the search into this field has fixated on managerial and professional
groups and tends to reject occupations relevant to teaching professionals. Stress-
linked studies related to industrial settings are many and strewed, but very few
pursuits have been made to examine stresses practiced by the job category of a
particular organization; for e.g. teaching professionals or coaching teachers. Efforts
have been made to evidence the particular stresses which are dominant amidst
working/nonworking employees, but no effort has yet been made to exercise stress
amid teaching professionals of coaching institutes.
In this text, the projected work would prove to be helpful. As relevant to
coaching faculty members, no search could be drawn which has checked the
relationship between role stress and job satisfaction in the Indian relation. This
search would also be socially related to the current-day disputes of home and work
role balance and the stresses rising from therein.
The search can accompany forth the significance of stress management in
teaching professionals to abolish the stress-effects practiced by them in regard to
their roles at work and in the family. Gender wise practical data can be attained on
stress-effects viz. physiological, psychological and behavioural and their
relationship to job satisfaction in coaching faculty members through this search.

17
Educational institutions, educational authorities and administrators can be highly
assisted by the findings of the ongoing study. Attempts may be made by them to
avoid stress-effects, role stress and lack of job satisfaction in their employees in
shine of the findings of this research.
The data accessed and interpretations drawn from the current search can be
used by another investigator to elicit guidelines and formulate principles for
strengthening the harmony between work and family roles to some amount. The
search can convey different scales to overcome stress. Such studies are
fundamental to understand the twin role demands of teaching professionals as they
are the knowledge givers to society.
Planted on the findings of this search, the occupational health status of
teaching professionals can be greater forwarded by utilizing different “coping
strategies for stress management” both in government and private sector teaching
institutes.
Keeping in mind, the scientific advancement of knowledge and skills, it is
fundamental that coaching teaching professionals possess static physical, mental
and psychological health with least stress, only then the system of education can
prove to be helpful for the progresses of our society and mankind at large.
******

CHAPTER - 2 REVIEW OF LITERATURE

18
CHAPTER-2
REVIEW OF LITERATURE
The main aim of the ongoing search was to examine stress in coaching faculty
members and its relationship to role stressors and job satisfaction. Relevant
implications from literature and research applications were gathered from books,
research articles and research papers from scientific journals. Different libraries in
Kota city were look up in course of collection of revise and literature. Different
internet websites were also used for recovery of literature.
The literature and reports of investigators relevant to the current search are
given in this chapter under the following heads:-
2.1 Stress and theoretical background.
2.2 Antecedents as correlates of stress and relevant studies.
2.3 Stress-effects and relevant studies.
2.4 Role stress and Role stressors.
a) Family role stressor and relevant studies.
b) Work role stressors and relevant studies.
2.5 Job Satisfaction and relevant studies.
2.6 Stress Management - coping strategies and relevant studies.
2.7 Stress in teaching Professionals and relevant studies.
2.1 STRESS AND THEORETICAL BACKGROUND
Stress has become a charge to modish world. The current stylish world
which is said to be a world of attainments is also a world of stress. Stress is
everywhere, whether it is in the family, business organization, enterprise, institute
or any other social or economic activity. Right from birth till death, an individual
is inferably revealed to different stressful conditions.
Even though terrific promotion in science and technology, and stunning
progress of economy and sources of luxury, people all over the world seem to
practice stress in different globe of their lives. Usually psychosomatic and
psychological disorders are growing; the feelings of frustration and dissatisfaction
with life in general flash the stress being practiced by people.

19
In the prior also, the societies were not totally free from stress. But during
the last two decennary the spread of psychosocial stress has highly elevated. The
main reason being the exchanged physical and socio-cultural environment of the
mod societies and life style of the people. Peoples’ life has become more
appealing, troublesome, mechanical and reliant running by the clock. Ever raising
needs and wants, high competition, strain of meeting deadlines, problems of future
and weak social support system have made the life of people stressful in mod
societies.
The terms ‘Stress’ is argued not only in everyday conversations but has
also become a point to hook extensive media attention. Different people have
different views about it as stress can be acknowledge from a array of causes.
“Dr. Selye Hans said “Without stress, there would be no life’’ Olpin,
Micheal and Helson Margie (2010, 2007)”.
Ancient Indian Concept of Stress
A number of theories were refined by ancient Indian Scholars relevant to
the wonder of stress even though the approach of stress in modern sense is not
easily found in traditional texts of Indian culture and tradition. It is appealing to
note that the body-mind relationship, a characteristic of mod stress studies, is
underline in “Ayurvedic Indian System” of medicine.
“Rao S.K.R.”, (1983) has drawn the base of stress in ancient Indian
thought”. It noticed three types of stresses: personal, situational and
environmental. Personal stresses can again be of two types, viz. physiological and
psychological.
Physiological stresses are born out of disparity between physiologic
constituents. Psychological stresses are induced by different emotional states of
mind. Situational Stresses are induced by ‘unhealthy interpersonal transactions’
which may involve disputes, aggression and competition etc. “Environmental
stresses are occasioned by natural calamities.
The stress functions through various modes of stressors. The model
projected in Yoga Sutra is an inclusive one incorporating cognitive structuring,
affective or emotional stages and adjusting reactions. This time the idea of “Kriya

20
Yoga” which goals at lowering number and intensity of the stressors and
facilitates governing of mental energy devoid of tension entitled as “Samadhi
Bhavana”. The system of Yoga is rational and adds the individual in accepting his
own stresses by leading him to the core origin of these stresses.
Positive role of stress: A new perspective
Today researchers and practitioners visualize the episode of stress in a new
angle. As “Kets de Vries (1979) had traced, each individual needs a moderate
extent of stress to be warning and capable of functioning efficiently in an
organization”. Organizational excellence and individual progress are earned
through well managed stresses.
Indian Litterateur (“Pestonjee, 1987 a, Mathew”, 1985) in their conceptual
papers agreed with these implications. “Pestonjee and Singh (1987) while studying
stress and job satisfaction traced that managers and system analysts in private
organizations scored higher on both stress and satisfaction as compared to their
counterparts in public organizations”.
It may be well at this point to revise the idea and approach of stress and
inspect the stress potential with citation to the creative and non creative roles of a
coaching faculty member through the decapitation of teaching learning activities.
The theory of stress was first made known in life sciences by “Selye
Hans” in his pioneering work in 1936. This idea is rented from natural sciences
and is imitated from the Latin term “Stringere” which means to tie tight. In
psychophysiology, stress hints to some stimulus outcomes in a delicate pressure
that cannot be accommodated by the organism and which eventually ended in
injured health or behaviour. In ordinary idiom, however, the terms ‘Stress’ and
‘Strain’ are used synonymously in a non-scientific way. The popularity of this
theory was established in the physiological area where it was first imported but
the use of stress continues to quirk in psychology and social sciences.
The term stress is used to imply a variety of meanings both by the
average man and the psychologists. Yet, it appears that the important features of
stress practice have not received the consideration they deserve. What has
restricts the enough use of the idea of stress is the reality that various

21
researchers have employed various referents and meanings for the term stress
and therefore have refined different models for it.
Definitions of Stress:
Scrutinize definitions of Stress, “Cox”, (1978) has clarified three classes
of definitions”. Stress can be thought of as a response i.e. the stress response to an
extreme stimulus; as a stimulus i.e. as the stressor itself and as an intervening
variable. As usually understood, it is the disparity between personal resources and
an environmental request that leads to the position termed as ‘Stress’.
One suitable definition of stress is “Stress is a demand made upon the
adaptive capacities of the mind and body”. “David, F.”, (1989)”
The most vital fact about stress is that, like feelings, stress is experienced.
The feeling of stress is an action in which there is a remark, not random relations
to objects that is intended or intentionally present.
In precise, stress is an active condition in which an individual is challenge
with an opportunity, an appeal or resource relevant to what the individual needs
and for which the outcome is seen to be both uncertain and important. Clarifying
the definition of stress for the aim of this search it may not be taken “as an
adjusting reaction to an external situation that ends in physical, psychological, and
or behavioural change for organisational participants.”
Stress Terminology:
A stressor is any act or situation that is felt by an individual as a threat
causing the individual to either comply or initiate the stress reaction. Therefore, a
stressor is a stimulus and stress is a response. Stressor is the cause and stress is the
effect. The effects of stress upon a person are accruing and can cause serious
injury if experienced over a long time.
“Dr. Selye Hans”, (1979b) was the first to learn the effects of stress. He
submitted that stress had four basic variations
1. Good Stress – Eustress
2. Bad Stress – Distress
3. Overstress – Hyperstress
4. Understress – Hypostress

22
1) Good Stress – Eustress
It is the positive, desirable stress that keeps life appealing and helps to
motivate and inspire people. Eustress contains successfully managing stress even
if the individual is dealing with a negative stressor. It means that a certain amount
of stress is useful, beneficial and even good for health. There is raised energy, high
motivation, shared perceptions and the performance improves quantitatively as
well as qualitatively. Moderate doses of Eustress help to boost an individual’s
performance.
2) Bad Stress Distress
It mentions to the negative effects of stress that reduce an individual out of
his energy and goes besides his capacities to cope. This is a status of ‘high stress’
distress showing a severe negative alteration in performance. The possibility of
role overload may push the individual to commit errors, make him uncertain and
cause irritation in him at the slightest pretence.
There may be a case of ‘no stress’ distress also. Role underutilization
creating boredom, decreased motivation, absenteeism and apathy are all signs of
‘no stress’ distress. It is offensive negative stress.
3) Over Stress – Hyperstress
It means too much stress. It can lead to physical and emotional failure. Work
overload can be a main source of over stress.
4) Under Stress - Hypostress
Under stress refers to too little stress leading to boredom, lethargy and
frustration. Work under load and no work at all may lead to Hypostress in some
situations. According to another classification given by “Selye Hans”, stress can
be acute and chronic in its effects.
Acute Stress
It is the event of short-term stressors. It is usually quite intense at first and
then disappears swiftly. It can be interesting and stimulating in small doses, but

23
too much leads to fatigue. People, who experience this stress, tend to be over
aroused, irritable, anxious and tense. Its syndromes inserted tension, headaches,
migraines, digestive disorders, hypertension, chest pain and heart disease.
Chronic stress
It is a long term stress usually results from painful issues. In case of chronic
stress, a person’s physical and mental resources are exhausted. Chronic stress can
lead to suicide, heart attack and violence. Long term chronic stress results in stress
relevant disease and lowering the quality of life.
Taxonomy of Stress:
The stresses of life may be divided into two categories.
1) Isolated catastrophic events: These include natural and manmade troubles
and major life events. The alteration in circumstances may test the powers of
adaptation of an individual.
2) Work stress: It may be caused due to conflicting domestic circumstances,
commuting and various other pressures of city life. Work stress may be
relevant to stress in the office surroundings and nature of job. Work stress
may become pressing to the amount that the individual lacks liberty and feel
of purpose in the tasks he performs along with boredom and monotony.
Models of Stress:
Models are validated theories. They present a holistic picture of the rarity
under study. Therefore, a model of stress shows the image of stress aspects in
totality, the random factors, the syndrome, the process and the end outcomes.
A wide variety of models of stress have been presented over the years by
scientists. Depending upon a particular focus on aspect / aspects of stress, the
researchers adopt these models for analyzing the aspects of stress attempting to
understand the stress circumstances.
A short description of a few relevant models of stress is presented below:-
1) Stimulus-based model of stress, “Beehr and Bhagat”, (1985), “Mc Lean”,
(1979), “Selye”, (1975).
2) Response-based model of stress, “Beehr”, (1984, 1985), “Caplan”, “Cobb”,
French, Harrison and Pinneau”, (1975)
3) Systems model of stress, “Lumsden”, (1975).

24
1. Stimulus – based stress model
Stressful stimuli include highly persistent stimulation, fatigue or boredom. In
this perspective stress has been treated as an independent variable. This model of
stress is an engineering one in which “external stressor gives rise to stress reaction
or strain within the individual” (“Cox”, 1978).
The stress as stimulus has triggered active search on relationship between
stress and somatic illness. “Holmes (1974) and Rahe”, (1968) tested in a series of
studies whether variation in the life of person statistically compared with illness”.
The main characteristics of stressful stimuli are: undesirable, unpleasant,
uncomfortable, threatening and demanding. These stimuli causing stressful
situations may be more suitably called “stressors” instead of “stress”. The actual
amount of stress felt is driven by the stressful situations in merger with other
personal and situational variables.
2. Response – based model of stress
Theorists, who specify stress from a response perspective, see it as an
inequality between the requirements to make an adaptive response and the
repertory of the individual. The higher the perceived inconsistency between
demand and response capacity, the more stress will be felt by the individual. Stress
has been used to quote as the response to stressor by “Beehr (1984, 1985)
“Caplan”, “Cobb”, “French”, and “Harrison and Pinneau”, (1975). The response
based perspective concerns with “response patterns which may be taken as
evidence that the person is under pressure, from a disturbing environment”. The
pattern of response is treated as stress. This approach views stress as the dependent
variable i.e. a response to disturbing stimuli.
The stress response is seen in form of manifesto of stress. The response
based model of stress defines stress response in form of manifesto of stress viz.
psychological, physiological and behavioural.

25
3. Systems model of stress
It was projected by “Lumsden” in (1975). It considers all the arresting
features of various models and calls for a systems analysis of stress. Stress as a
system is thought of open system that is steadily connecting with the environment.
Stressors, appraisal and coping are relevant to each other and occur in cyclical
fame. When the stressor interferes upon the person, the method of appraisal
begins followed by coping process.
Sources of Stress:
Sources of stress come from a variety of fields such as families’ friends and
the work environment broad of the person himself/herself. Stress can emanate
from a blend of these sources. “Pestonjee”, (1992) has finds three valuable sectors
of life from which stress may originate i.e. job and organization, social sector and
intra psychic sector”.
Sources of stress can also be categorized differently. “Brown”, (1984) has
listed five categories as follows:
1) Customary anticipated life events (any major change in life) for example
marriage, divorce, children leaving home, retirement etc.
2) Unexpected life events (any major life event which occurs suddenly) for
example, major accident, sudden loss of job, terminal illness etc.
3) Progressive, accumulating situational events: (any continuously recurring
problems in life’s activities) like daily hassles, job and family stress, school
stress etc.
4) Personality glitches: (any personal traits that create social problems) such as
poor communication, self-esteem, insecurity, lack of confidence, poor
decision making and fear of failure.
5) Value dependent traits: (circumstances generating thought, feeling and
conflict) for instance revolutions, broken homes, moral dilemmas, peer
pressure etc.

26
Sources of Occupational Stress
Even though occupational stress originally rises from constituent
determinant of job and its psycho-physical environment, these aspects are not
inherently stressors. In fact, the personal features of an employee, cognitive
appraisal of the job factors and resources determine, the amount of stress
experienced from a job factor or situation.
Therefore the potency of the job aspects or situations for causing stress can
only be hypothetically asserted but it is difficult to categorize or generalize any
work setting variable as a universal stressor.
However, some job factors or work settings are likely to cause stress to
majority of the workers which may vary from worker to worker. The pressures
caused by the job aspects are interceded by the personal features of the worker.
Hence, all the sources of occupational stress can be broadly classified in two
categories.
1. Individual variables
2. Work setting variables
1) Individual Variables
An employer’s age, sex, health, status, experience and socio cultural back
ground have been found to influence the experience of occupational stress.
“Employees responses to work demands and pressures are largely influenced by
personality characteristics, psychological and behavioural patterns, coping skills,
cognitive patterns” “Jagdish and Singh”, (1997).
The feelings and demotions of employees associated with anxiety can cause
stress, enhancing its severity by influencing their cognitive appraisals. “Srivastava
and Krishna”, (1992) noted that “employees with external locus of control
experience higher degree of occupational stress and lower job satisfaction”.
Employee’s job attributions also determine the extent of stress they
experience in their job life. “Gupta” , (1999) noted that employees attributing their
efforts, to the nature of job activities, work conditions and managerial policy for
their progress or failure in job life experienced higher role stress as compared to

27
those who attributed to chance or karma for their achievements and failures at
work.
2) Work Setting Variables
(a) Work Stresses
i. Job role: It is a main source of satisfaction as well as stress for the
employees. Certain characteristics of job role have been acclaimed as
prominent source of occupational stress. Researchers have applied “role
theory” to know stress issues at work and tested how role pressures contribute
to occupational stress. “Ivancevich and Matteson”, (1980) leading that role
pressure occurs when the employees‟ expectations conflict with appeals of
the organization. “Pareek”, (1981) on the base of theoretical speculation and
statistical analysis has identified ten situations of role stress namely : Inter
role distance (IRD), Role stagnation (RS), Role expectation conflict (REC),
Role erosion (RE), Role overload (RO), Role isolation (RI), Personal
inadequacy (PIN), Self role distance (SRD), Role ambiguity (RA) and
Resource inadequacy (RIN).
ii. Job characteristics and Attributes: Features of the job is a very basic
source of employee’s satisfaction and stress. The essence of job itself such
as repetitive work can become a source of stress to the worker. The other
attributes of job may refer to freedom at work, use of knowledge and
abilities, social interaction and power. If the jobs lack opportunities to
satisfy these needs, they become stressful to their doers.
iii. Physical work conditions and technology: Qualities of physical work
environment and technology as a factor can cause stress in work setting. The
physical qualities of work environment such as noise, lighting, temperature,
crowded work place can cause direct sensory and physical stress and
indirect psychological stress through their potentiality for causing negative
health consecution.
iv. Performance feedback and reward system: This factor improves
employee’s motivation and performance but causes dissatisfaction and
stress if it is inadequate or absent. If the workers feel they are not being
timely rewarded for their performance, they are likely to encounter stress.

28
The rewards include monetary benefits, recognition, appreciation, privilege
and promotion.
v. Interpersonal relations at work: “Kets de Vries”, (1984) noted that at
least three types of interpersonal relationships have been examined, viz,
relationships with: co-workers, within work groups and superiors. Good
relations form the social support and buffer the job stress where as poor
relations at work is a threat for the employees. Relationship with superiors is
equally vital in determining the extent of job stress.
vi. Organization structure and climate: It is mainly noticed that a structure of
organization which allows more decision making power to employees
produces less stress. “Ivancevich and Donnely”, (1975) in their study
defines that employees in non-hierarchical organization noted less job stress
and more job satisfaction.
“Cooper and Marshall”, (1976, 1978) have described the following seven
categories of sources of managerial stress:
1. Factors intrinsic to the job: work load, working conditions, time pressure,
too many decisions to make etc.
2. Career development: promotion, job security, ambition, fear of redundancy
etc.
3. Role in the organization: Stresses out of various roles in the organization
such as role ambiguity role conflict and responsibility for people.
4. Relationships at work: relations with boss, colleagues and subordinates,
trust and support, difficulties in delegating duties and responsibilities.
5. Organizational structure and climate; consultation, communication,
behaviour and participation in decision making.
6. Extra organizational sources: family problems, conflict of personal belief
with that of organization, conflict of work and family demands, marriage
patterns, relocation and mobility.
7. Characteristics of the individual: Type a personality, competitiveness, self
esteem, coping ability to stress situation.

29
“Parasuraman and Alluto”, (1981) noted that job demands, constraints and
job relevant events were not stressful in them but were capable of producing
psychological stress depending on personal attributes and other coexisting factors.
“Srivastava and Singh”, (1981) analyzed twelve factors which caused
occupational stress such as Role overload, Role ambiguity, Role conflict, group
pressures, and low profitability, under participation, low status, and responsibility
for people, intrinsic impoverishment, strenuous work, poor peer relations and
powerlessness.
(b) Non Work Stresses
Likewise the stressors prevailing in work setting, a number of non-work or
off the job factors are the indirect sources of occupational stress. Models of work
and non work stress (“Bhagat”, et al. 1985) posed that “the total amount of stress
and strain experienced by a person is a function of both work and no-work
stresses”. Non-work domain contains family, leisure or recreational, community,
social or religious roles. The non-work stressors are not left behind when we enter
the workplace.
There are three main work and non-work stressors:-
Time based conflicts
Strain based conflicts
Role behaviour based conflicts
Time based conflicts: It is the question of balancing the time demanded by
work, with family and other non work activities. It contains the number of hours
at work (paid employment), amount of travel time, inflexible work calendar and
rotating shift schedule if any. Time based conflict is more acute for women than
men as women have to spend more number of hours at home on household tasks
and child care activities than men.
Strain based conflicts: It happens when stress from one domain spills over
to the other. Death of spouse, financial problems and other non work stressors
produce tension and fatigue that dominance employee’s ability to fulfill work

30
obligations. Likewise, stress at work spills over to an employee’s personal life and
often becomes a foundation for stressful relations with family and friends.
Role behaviour conflicts: It happens when people are expected to enact
various work and non-work roles. People, who action reasonably and
impersonally at work, may have difficulty in playing a more compassionate role
in their personal lives.
Several studies have attempted to identify which jobs have more stressors
than others. Teaching is a medium stress occupation. Task characteristics and job
environments differ considerably for the same job in different organizations and
societies. For example, a teacher’s job may be little stressful in a coaching
institute of a small town than in a large city where hierarchy is more orderly with
corporate culture.
Also a major stressor to one person is irrelevant to another. The faculty
member in one Coaching institute may experience higher stress than the
individual faculty member in another coaching institute. There will be differences
in stress levels practiced by faculty members in their jobs both from work and
non-work activities.
However, in spite of the inclusion of non-work factors as potential stressors,
only a few empirical studies have investigated the relationship of non work
stressors with job stressors (“Cooper and Marshall”, 1976, 1978; “Ivancevich and
Matteson”, 1980).
Investigators have noted that “life stresses were ally with decreased
satisfaction and raised job stress, job alienation and turn over”. (“Bhagat”, et al.
1985 and “Sarason and Johnson”, 1979)
“Hendrix”, et al. (1985), initiated that family relationship had indirect effect
on job stress through their clash on life stress. “Cooper and Davidson” (1987)
reported work-family interface to be a main source of stress for professionals and
females. In a study “Shrivastava and Krishna”, (1991) noticed that females in
“dual career couples” with part time jobs experienced lesser role stress and
retained better health as compared to those who were in full time employment.
Lastly, the sources of stress need to be viewed in shine of the social systems
to which all individuals belong (“Pestonjee”, 1987 ) There is two such systems

31
viz.,: the primary system, such as family and religious, regional and linguistic
groups; and the secondary system which contains neighbourhood, schools,
Colleges, technical institutes and work organizations. “Pestonjee” stated that “As
the functional needs and role expectations from both these systems differ, the
demands made on the individual in one system have their effects on his / her
conduct in the other. More over resources from one system also should be
invested in the other system to take care of the problems arising in it”.
The review relevant stress and theoretical backdrop disclosed that different
authors have noticed out the four variants of stress viz., Eustress, Distress,
Hyperstress and Hypostress. The three models of stress namely stimulus based
response based and systems models of stress seem relevant to the current search.
The effects of stress are the manifesto of stress such as physiological,
psychological and behavioural. Even though stress-effects have become main
concerns of psychological, medical and management researchers, the potential of
understanding stress in teaching professionals has yet not been realised.
Dissimilar authors have categorized various sources of stress. The sources
of occupational stress consisted of individual variables and work setting variables.
The individual variables contained personal profile and the work setting variables
covered work and non-work stressors. Work stressors covered job role, job
characteristics, work environment, and interpersonal relations at work. The non-
work stressors were akin to time, strain and role behaviour based disputes. Since a
teacher’s job is linked to that of a manager, it seems that it would be useful to
explore these variables in the ongoing study.
2.2 ANTECEDENTS AS CORRELATES OF STRESS AND RELEVANT
STUDIES
In this subsection, all such studies have been covered which either effort to
establish ally or seek to find out the causal relationship of the aspects of stress
with other variables.
Studies which apply on person relevant and family – akin variables as
determinants of stress have been contained. The studies which seek to establish
job or organization like variables as determinants of stress and also the studies

32
which deal with the problem of stress from a broader perspective viewed, in
regard to both organization as well as person relevant variables have been noted
here.
Antecedents are the random factors of stress. Even though some of the
factors are revised secretly in the following discussion, the interactive quality
cannot be overlooked.
a) Demographic variables as correlates of stress
“Beehr and Newman”, (1978) covered demographic, physical condition and
life stage characteristics of the individual as moderators of stress reaction. Some
were internal factors as age, sex, race, education and some others were external
such as diet, social setting and climate.
“Bhandarker and Singh”, (1986) tested the entire stress cycle i.e. “the
sources of stress, outcomes and moderators to delineate important contributors of
stress for evolving stress reduction strategies”. They inserted numerous categories
of variables in their study. Amid the independent variables individual demographic
variables such as age, education, family size, parental back ground, marital status
and children were examined. The sample consisted of 300 top, middle and junior
level managers from both private and public sector from the southern region of
India. Multiple regression analysis disclosed that job pressure from private sector
contributes most dominantly to stress followed by belief in chance, drug intake age
and family size at junior management level.
The backdrop variables examined by “Sen”, (1981) in regard to role stress
were age, sex, education, income, family type, marital status, residence, distance
from residence to place of work and previous job experience. Some of the
conclusions drafted by “Sen” were that role stagnation declined as people advance
in age, and age is negatively akin with role stress. Women experience more role
stress as compared to men. Role stress is inversely akin to income; the higher the
income, the less is the level of noted role stress. “Sen” has inferred that “persons
with higher incomes hold correspondingly better assignments with higher status,
esteem and satisfaction of self-actualization needs”. Urban backdrop persons
experience more stress due to fast life of a city dweller as compared to people in
rural fields who have a feeling of self contentment. The difficulties of commuting

33
produce more stress for people who live far away from their workplace as
compared to people who live closer to their place of work. No significant
differences were found with regard to family backdrop and type.
Family size was found to be positively associated with role stagnation and
role isolation and negatively with role erosion. The prior two may be attributed to
“advancing age, growing family size and increasing responsibilities and at the
same time limited promotion prospects leading to a feeling of exclusion and loss
of linkages”.
A report by Political and Economic risk consultancy (PERC), Hongkong
(“The Times of India”, 8 December, 1997) revealed that stress levels in Asia have
been on the rise since the year 1997. Even India is not an exception, ranking only
after Vietnam, South Korea, Thailand, Hongkong, The Philippines, China,
Indonesia, Singapore and Japan. The report further adds that “the single factor
most often cited as being the biggest cause of stress was difficulties balancing
professional life with social and family life”.
In a study by “Cox”, et al. (1978) matched 100 teachers with 100 semi-
professionals for age, sex and marital status and when they were asked to
comment on the major sources of stress in their lives, 79 percent of Teachers
assigned to “work” as compared with 38 percent of non teachers.
“Beena and Poduval”, (1991) examined gender differences in relation to
work stress with age as an independent variable. The sample consisted of 80 first –
level executives of a large industrial organization. The decision of the search
indicated that stress experience of the executives rose with advancing age. Sex was
also found to be a major factor affecting the stress position.
“Pareek Udai”, (1993) relevant age to life stresses by commenting that
“young people between 20 and 30 years of age noted twice as much stress when
compared to older people”.
In other search “Ahmad and Khanna”, (1992) researched the relationship
between job stress, job satisfaction and job involvement amid 50 middle level
Hotel managers aged 22-36 years. The analysis of data disclosed a significant
negative relationship between job stress and job satisfaction irrespective of the
subjects’ sex, marital status, education and experience. Occupational stress was

34
noted to be negatively compared with job involvement. The high job involvement
group was more satisfied with their job than the low job involvement group.
“Pandey”, (1997) attended a search to found the relationship between
personal demographics and organizational role stress. The study was attended on
61 personnel of Indian railways aged between 28-58 years. Role stresses were
measured by ORS scale (“Pareek”, 1983c). The analysis disclosed a positive but
non-significant relationship of age with all dimensions of role stress except role
ambiguity. Education showed positive but non-significant correlation with all
dimensions of role stress. Experience was noted to be positively and significantly
compared all dimensions of role stresses except role overload, resource
inadequacy and role isolation.
“Aditya and Sen”, (1993) conducted to study nature and amount of stressors
faced by male and female executives in their job situation. A group of 160 middle
level executives consisting of 80 male (aged 28-50 years) and 80 female (aged 27-
50 years) were the sample of the search. The data analysis disclosed that male
executives faced greater stress than female executives and the two groups differed
maximally in terms of their roles, future prospects, and human relations at work,
feminists and masculinity dimensions.
“Surti”, (1982) examined the psychological correlates of role stress in 360
working women belonging to different professional groups. An effort was made to
determine the amount to which demographic, personality and organizational
factors contributed to various role stresses. No significant differences were
observed in any type of role stress with age, birth order, educational level, family
relevant variables, promotion, length of service, experience in organization,
distance of workplace and mode of conveyance.
Similar findings were noted in a search by “Srivastava K. and. Srivastava
A.K.”, (1985) on a group of 185 couples.
“Kyriacou and Sutcliffe”, (1978a) clarified teacher stress in form of feelings
of depression which arose from teacher’s job. A random sample of 257 teachers
from 16 medium size mixed comprehensive schools in England was peaked.
Analysis of variance exhibited no significant differences in any of the biographical
categories and self noted stress except a few differences which are as follows:-

35
Males found administrative and paper work more stressful than females.
Females noted greater stress akin to lack of facilities and pupil’s behaviour.
Younger and less experienced teachers found certain jobs more stressful.
Teacher with longer teaching experience noted stress in relation with
administrative work, too much paper work and class size too large.
Teachers found most of the activities stressful as compared to “Heads of
departments” except in respect of administrative and paperwork.
Sex differences were found only in three of stress syndromes viz., Headache,
tearfulness and exhaustion which were more usually indicated to by women
teachers.
b) Service duration
One of the main corollaries of stress akin to teaching is anxiety. It appears to
lessen with raised length of service “Parsons”, (1973). The reason seems to
contrast with the notion that a teacher becomes more anxious as he becomes more
experienced. The teacher stress may not decrease with advancing years but the
types of stressors are very likely to change.
“Gupta and Pratap”, (1987) attended a search to measure the role of service
length on organizational role stress amongst 200 executives of BHEL i.e. “Bharat
Heavy electrical LTD”, a public sector undertaking. The sample was divided into
three categories on the basis of their length of service: those with less than 5 years
of service, with 5 to 10 years of service and with more than 10 years of service.
The findings were as follows:
A linear increase was noticed in the extent of organisational role stress as a
function of service length.
Executives with longer service length (5 to 10 years and 10 or more years)
obtained higher stress scores than the group with service length upto 5 years.
A linear increase was also noticed in role overload as a function of service
length.
c) Travel time
Several individuals are faced with pressures combined with a long journey at
the start and finish of each working day, others engage in travel as a part of their
job. Traffic jams, delays in public transport and need to travel in all weather

36
conditions can be an added strain and challenge to face. If the travel time is long,
the pressured individual is forced to spend less time on family and social activities.
Travel time was a significant stressor noted by mangers in the construction
industry (“Langford”, 1988) “The burden of guilt increases if fatigue and
exhaustion prevent the individual from satisfactory interaction with family and
friends. Therefore, the stress combined with travel akin to the job tends to be
additive in that it exacerbates other stressor sources” (i.e. it is part of the stress
chain) (“Kelly and Cooper”, 1981).
d) Working hours
The effects of long working hours can be copied from backwards during
First World War. In Armament factories the longer working shifts were found to
yield lower hourly output and in some cases, the magnitude of decrement was
sufficiently great to end in an overall reduction in daily output.
The inference to be draft is that “faced with excessive working hours, people
pace themselves to last out the work hours and periodically “go sick” to recuperate
from cumulative states of fatigue”.
e) Health
Currently occupational stress has been seen as a contributory aspect to
health cost of individuals in companies. Studies of stress-relevant illnesses show,
that stress is imposing a high cost on both productivity and health.
Health is more than the absence of disease. “Ahmed”, et al. (1979) submitted
that wellness and illness should take account the roles that the individual is
expected to play i.e. able to function effectively in both familial and occupational
roles. Therefore, health is viewed as a desirable state of well being in order to
fulfill role obligations.
It is preferred that “physical health and mental health are intricately
interwoven and so health is dependent on how people think feel and act”
(“Thoresen and Eagleston”, 1985). Enhanced health status is akin to variation in
personal lifestyle practices that are known as risk factors for disease. As Knowles
(1977) declared; “over 99 percent of people are born healthy and made sick as a

37
outcome of personal misbehaviour and environmental conditions”.
If stress causes illness, psychology therapy should improve the patents
physical condition. For example relaxation techniques seem to produce
improvements in hypertension, headache, and insomnia though not necessarily a
complete cure.
An extensive body of research has found job stress responsible for
psychosomatic health outcomes and other health relevant outcomes such as
tension, anxiety and job dissatisfaction as indicators of personal functioning
(“Quick”, et al. 1992; and “Sagar”, 1994). However these reviews were mainly
confined to western studies and indicate paucity of such empirical studies in real
work organization especially among Indian employees. Hence one comprehensive
Indian context, “Singh and Srivastava”, (1996) found the collision of three role
stresses namely role overload, role ambiguity, role conflict along with overall job
stress on physical health outcomes and pathogenic health habits of 200 male
managers of Diesel, locomotion works, Varanasi. The authors concluded that high
levels of job stress can facilitate tendency to drink excessively, smoke heavily and
do less physical activity. Theses finding clearly indicate that when individuals
perceive their jobs to be physically and psychologically threatening, it is very
likely that their health would be adversely affected.
“Theorell and Rahe”, (1971) examined employees who worked overtime and
spent more time doing work at home. They summarized their search findings by
advising that both quantitative and qualitative work overload produces at least nine
different syndromes viz., psychological and physical strain, job dissatisfaction, job
tension, lower self esteem, threat embarrassment, high cholesterol, raised heart
rate, skin resistance and more smoking.
“Bhandarker and Singh” (1986) noted correlation data and highlighted the
bang of personal health habits on stress reduction. The analysis disclosed that
sports, breathing exercises and belief in external control were negatively and
significantly relevant with stress variables.
In a search on executive stress “Malhotra”, (1996) noted that unreasonable
performance strains and appealing life styles of an executive often causes health
issues such as hypertension, migraine, high blood pressure, insomnia, ulcers and

38
cardiovascular diseases. The author analyzed the brunt of techniques such as
meditation, yoga, aerobics etc for a stress free culture.
Search on work and health examines the brunt of three distinct aspects in
regard to employee health.
i. Physical factors of the working environment.
ii. Sociological considerations detailed by fair measures (e.g. shift work,
working hours), and social factors (e.g. social status, economic security).
iii. Psychological factors (e.g. perceived control, decision attitude),
psychosocial factors (e.g. relationship with colleague’s managers, integration
within the work place).
Most of the search has been carried out within the above categories, but a
more interdisciplinary approach would be useful. Even though prior search has
directed initially upon physical working conditions, more current search has
looked at psychosocial factors and the brunt of such aspects upon health.
In a search, the hit of workplace social support spanned a 24 hour period
encompassing work time, leisure time, and sleep (“Unden”, et al. 1991). This
relationship was apparent amid both men and women across a range of
occupational groups and was independent of physical pressure.
Search indicates that work relevant stress apart from being combined with
raised alcohol, tobacco and drug use, is also combined with inadequate sleep or
exercise, and consumption of a poor diet (“Cohen and Williamson”, 1988). The
authors concluded that “work appeals may prevent individual’s implementation of
their intentions to engage in health enhancing behaviour”. Some authors have also
examined role stresses and their relationship to health outcomes.
Mental health has been examined in relation to the stress generated from role
overload. “Jagdish”, (1983) noticed an inverse relationship between role overload
stress and psychological well being of a sample of technical supervisors.
In a study by “Hendrix”, et al. (1985), it was noted that home and family
relationships afflicted job stress indirectly through their effects on life stress.
“Singh and Srivastava”, (1996) have examined the role of both individual
and situational aspects in stress and health relationship and found significant
outcomes.

39
This piece of review of literature presented an emergence of person relevant
and family relevant variables which may be combined with stress. These were
gender, age, health, family type, family size, paid help, length of service travel
time and hours of work at the workplace. Occupational stress, specifically role
stress seems to have a exact strong tie with the health aspects of employees.
2.3 STRESS - EFFECTS AND RELEVANT STUDIES SOME CONCERNS
While the texts and sources of stress have been examined by various
disciplines at different levels, its analysis remained a main burden of
psychologists. As an end, in the last few decagons, the essence and gestures of
stress and its holdings on health have received considerable attention by
psychologists around the world.
Traditionally, the empirical Study of stress has been undertaken with
biological (physical) and psychological frameworks with little attention for
integration of the two. New analyses of stress sense are gradually moving towards
identification of the mediators and moderators of coping and health relevant
outcomes. It has now become clear that stress cannot be viewed as some
exogenous stimulus or response of the body; rather it is product of kinetic disparity
between the individual and his environment. Many behavioural characteristics
define the structure of any environmental encounter and therefore personal
conditioning variables become important.
The outcomes or manifesto of stress are the stress-effects. A modern
approach to understand the manifesto of stress is the assumption that stress is a
subjective experience and that the outcomes or syndromes of distress (bad stress)
may be physical, psychological, and or behavioural. The holdings of stress need to
be considered in terms of costs to the individual, the work environment and
society. It is the dysfunctional belongings of high levels of stress that should be
and are a major worry for modern society in general and for effective use of
human resource in particular. The issues due to high levels of stress can be
exhibited physically, psychologically and behaviourally by an individual.
This study displays a review of stress-effects identified with occupational
and role relevant stress. The three effects of stress viz. physiological,

40
psychological and behavioural may have a clash on the attainments of tasks by an
individual at the workplace and in the family.
Searches in organisational stress have dominantly directed on emotional
behavioural and health outcomes of stress experienced at work. “Ivancevich and
Matteson”, in (1980) noted that “prolonged severe stress affects the person at
psychological as well as physiological levels. Stress at mid level may arouse the
individual for enhanced performance and problem solving but starts restricting
performance when its intensity reaches a disruptive level which varies with the
characteristics of the person and the task being performed”.
In their 1979 article, on the ground of their search “Beehr and Newman”, in
(1978) stated psychological health outcomes, physical health outcomes and
behavioural outcomes under the heading of “Human outcomes facet”. Since that
time, utmost major reviews have classified outcomes of job relevant stress under
three headings viz. psychological, physiological and behavioural. Just as previous
researchers surveyed for general or more specific reaction to stress, the effects of
work stress have been affects by a stress response that is “being under stress.”
Stress-Effects:
Stress is not cardinally bad for individual employees or their organizational
performance. Stress has both desirable and undesirable effects. It is functional as it
acts as a stimulant, but prolonged stress becomes dysfunctional. Individual
responses to stress situations also differ. The stress-effects in the two genders may
also be distinct. Males are more accessible at an earlier age to fatal health issues
such as cardiovascular disorders, where as women noted more non-fatal but long-
term and hurting health issues. The most serious effects of stress relevant to
performance. It is said that moderate levels of stress stimulate the body and
increase its ability to act thereby enabling the individuals to perform better. But
too much stress places unattainable appeals or constraints on the individual which
ended in reduced performance.
The effects of stress can be divided into three major areas: physiological,
psychological and behavioural. These effects of stress affect an individual and
ultimately impinge upon organizational performance.
41
a. Physiological effects of stress
Most of the early bothers with stress was directed at physiological
symptoms. The specialists in health and medical sciences and the researchers have
concluded that physiological stress could create changes in metabolism, raised
heart and breathing rates, raised blood pressure and bring on headaches and induce
heart attacks. The link between stress and a particular physiological symptom is
not clear.
The physiological stress-effects may outcome in the following symptoms
physical ailments, digestive problems, sleep trouble, erratic breathing, muscular
problems, headaches and other aches, frequent urination, cardiovascular troubles,
severe symptoms including ulcer, heart attacks, arthritis and even cancer,
susceptibility to allergies, fatigue, rapid gain or loss of weight. These illnesses or
symptoms cause serious physiological impairments. In fact, they may also affect
mental health of a person.
b. Psychological effects of stress
Not much attention has been given to the impact of stress on mental health
especially within the medical community. According to “Mishra”,(1994) the state
of psychological equilibrium or balance is termed as psychological well being,
psychological health or mental health. Imbalance in it results into tension and
frustration. The simplest and most obvious psychological effect of job relevant
stress is job dissatisfaction. But stress shows itself in other psychological states
also for instance, tension, anxiety, irritability, boredom and procrastination. These
types of psychological problems from stress in turn are especially relevant to poor
job performance, lower self-esteem, resentment of supervision, inability to
concentrate, make poor decisions and job dissatisfaction. These outcomes of stress
can have a direct cost effect on the organization. This indicates that when people
are placed in jobs that make multiple and conflicting demands in their duties,
authority and responsibilities, both stress and dissatisfaction is raised. These
effects of stress can be very dysfunctional for the organization. A common feeling
of exhaustion can prosper when a person synchronously practices too much strain
to perform and is less satisfied.

42
The psychological symptoms of stress-effects are as follows:-
Chronic anxiety or restlessness, anger, depression, nervousness, irritability,
shouting-high pitch voice, tension, frustration, boredom, no fear of uncertainty,
fussiness, dissatisfaction, worry, fatigue, exhaustion, feeling of failure, insecurity,
inability to cope, feelings of isolation, withdrawal, alienation, self pity, confusion
about roles and duties, inflexibility, moody, impulsiveness, impatience, feeling of
unwanted, inability to concentrate, lack of decision making ability, guilt feeling
and memory lapse.
c. Behavioural effects of stress
Behaviours combined with effects of stress are those specific actions that are
performed in relation to how the individual is feeling. They are extremely useful in
accepting specific behaviours as they relate to stress responses rather than dealing
with behaviour as a total.
alterations in behaviour that accompany exposure to stress contains
“impulsive behaviour, excitability, emotional outburst, excessive eating or loss of
appetite, drug taking, drinking and smoking, absence from work and unstable
employment history”. (Cox 1985 a, b) Some of these behaviours might also have
direct and indirect outcome on the health and well being of the individual.
Distinct the psychological issues resulting from stress, the behavioural
problems are often not attributed to stress by co-workers or supervisors and
generate little sympathy. But also, like the psychological and physical symptoms
of stress, the behavioural problems can be controlled, more effectively managed
and even prevented by individual and the organization. Stress-effects can outcome
in a number of behavioural symptoms which are as follows:-
Forgetfulness, accident proneness, inability to take decision, declined job
performance, raised job dissatisfaction, raised absence, work alcoholism, lack of
trust, lack of concern for organization, refusal to talk or discuss, social isolation,
raised criticism, jealousy, nail biting, hair pulling, lip smacking, teeth grinding,
finger tapping, knee joggling, compulsive eating, compulsive chewing, over eating
or under eating, intake of alcohol, drugs, anger, unprovoked shouting and gossip.
The effects of stress can be grouped into two categories: feelings and body

43
symptoms. Body symptoms indicate the physiological stress-effects. Feelings
denote emotions which lead to psychological stress-effects. Both feelings and
emotions find expression in an individual’s behaviour. Behavioural stress-effects
can be noted through an individual’s specific behaviour, in relation to his present
environment.
An individual under stress may or may not manifest all these stress-effects.
The longer the period over which the person remains stressed, the more extended
would be negative effects of stress.
Stress may also lead to health impairing habits or behaviours. The stress of
illness may cause illness behaviour, which dominance the course of a disease.
Therefore, the way, in which a patient perceives and copes with the stress of
illness, is the mechanism that dominance the disease.
According to “Srivastava”, (1999), the behavioural syndromes of job stress
are classified in two categories:-
1) Syndromes which belong to the employees such as avoidance of work,
intake of alcohol, drugs, over and under eating, aggression towards co
workers or family members and interpersonal problems in general.
2) Syndromes relevant to the organization such as absenteeism, accident
proneness, decrease in work efficiency and leaving the job.
Models:
1. The Bounce Model
“Pestonjee D. M.”, (1983) refined a model to clarify how individuals cope
with stress reactions is called the “bounce model” because behavioural
decomposition taking place due to stress i.e. either Eustress or Distress or
Hypostress or Hyperstress tends to get reflected in interpersonal and other
reactions. “The responses are received and examined in the environment from
where bounce back signals are given to the individual to bring about a change
either at the organism level or at the response level”.
2. The stress-behaviour model
This model was refined by “Farmer, Monahan and Hekeler”, in 1987 the
stress behaviour model can be seen as a cycle of stress-reaction behaviour. Its

44
elements are source, effect, behaviour and health. Positive behaviours yield a
health perspective that will put impact on the entire process itself. Therefore health
behaviours can and will alter both stress sources and effects.
Origins of stress come from a variety of areas including the person, his
Families, friends and work environment. Usually stress comes from a combination
of these factors. This model can be seen as a cycle of stress- reaction behaviour.
Effects of stress mainly involve feelings or emotions that an individual
experiences as a reaction to stress and stressful situations. The feelings are mainly
placed under the category of depression or anxiety. These feelings range from
feeling keyed up to feeling hopeless and frustrated. Once again, the reactions to
stress may be directed towards the individual himself, his family, friends or his
occupation. Even though these often appear in combination, it is helpful to think
about reactions to stress singularly, rather than as a whole. The model mentions
about effects of stress in physical terms, the psychological reactions to them and
the behaviours associated with them.
Not all stress and consequent behaviour need to be negative. Some may be
positive and useful, just as others may be negative or harmful.
Assessment of Stress-Effects:
Researchers have used several tools and instruments for the measurement
and assessment of stress-effects in professionals as well as non professionals from
time to time. Stress has been assessed through presence or absence and frequency
of stressors. These may lead to physiological changes or illness, psychological
health problems and behavioural changes which the individuals express through
their feelings.
Stress is often assessed through its psychological effects. Therefore State
Trait Anxiety Inventory STAI (“Spielberger”, et al., 1983) and Profile of mood
states (“Mc Nair, Lorr and Doppelman” 1971) have been often used as part of
stress. Stress has also been assessed through personality tests, to measure “type-A”
behaviour. (“Friedman and Booth-Kewley”, 1987)
Literature shows that there are general specific instruments to measure the
physical and psychological aspects of stress separately or in combination. But,

45
there are hardly any instruments to part all three aspects of stress-effects namely
physiological, psychological and behavioural together. Very few tests or scales
have been refined or constructed to assess all the three aspects of stress-effects as
experienced by an individual through the use of one single test.
One such “stress test” was refined by “Prabhu G.G.”, in the year 1991-92. It
assesses physiological, behavioural and psychological stresses through various
symptoms for all three stress-effects.
Relevant Studies
Stress-effects on individual’s health may be of short term or long term nature
“Elevation in blood pressure has been observed in cases of anger and anxiety,
stressful interviews, loss of job and natural disasters” (“Kasl and Cobb”, 1970).
The authors further observed that prolonged rise in blood pressure were found in
those who face stress for long periods.
“Frankenhaeuser and Odman”, (1983) in their search aimed at
understanding the causes of stress defining the contributory, work and
organizational factors and identifying factors protecting people from harmful
effects of stress. Another important aspect of this research was the gender relevant
differences in stress levels and stress perception. “Lundberg, Mardberg and
Frankenhaeuser”, in (1994) said that one of the most striking differences in men
and women shown in this research is the ability to relax while coming home from
work. “At about five O’clock in the afternoon, stress hormones and blood pressure
go down in men while they go up in the women”. This is particular true for female
professionals.
“Rahe and his associates”, (1964); “Rahe”, (1968) and “Holmes and Rahe”,
(1967) stated whether changes in individual life, which require them to make
behavioural adjustments, statistically correlate with the onset of illness. The
physiological studies indicate that “naturally occurring and experimentally
induced stress evokes significant alterations in the functioning of most bodily
tissues, organs and systems. These changes in turn lead to lowering of the body’s
resistance to diseases by suppressing the immune system”. “The greater the
magnitude of such life events, the greater is the risk of acquiring illness of a

46
serious nature” which has been noted by a number of investigators (“Rahe”, et al.,
1964; “Holmes and Rahe”, 1967; “Maddi”, et al., 1987 and Lai 1995).
Substantial amount of research has been done by psychologists to examine
health (Somatic) outcomes of occupational stress. Majority of these investigations
have revealed positive relationship between job related stress and a variety of
somatic symptoms and disorders. In view of the severity of stress-outcomes, Holt
(1982) has classified them in two categories:-
i. Physiological strains, relatively minor side effects of occupational stress.
ii. Illness and mortality impairing effects of occupational stress on health
causing illness.
Stress researchers have associated work overload, job dissatisfaction, job
insecurity, role conflict, interpersonal strains and a variety of other work stresses
with classic symptoms of stress such as headaches, heartburn and generalised
fatigue (Quick and Quick, 1984). “Even though genetic, biological and many other
factors influence the appearance and course of these conditions, job stress plays a
role in hardening the appearance of diseases”. “Pestonjee D. M.” and “Pareek
Udai”, (1992) investigated occupational stress in academic and non-academic staff
working at the University of New England in Australia. One of the aims of the
project was to rewording the relationship between occupational stress and non
work stress and physical health, emotional health and job satisfaction. More than
1,000 staff members of the university, responded by completing the
questionnaires. Overall, approximately, 25 percent of staff experienced low job
stress, 60 percent experienced medium job stress and 15 percent of staff
experienced high job stress. Analysis showed that males experienced higher
workload stress than females and females noted more stress due to work politics
than males. In general, younger staff noted more occupational stress than older
staff. Younger staff noted more stress due to job significance, work politics and
work conditions than older staff; older staff however noted more stress due to
work overload and university reorganization than younger staff. In general lower
level staffs were more stressed than those employed at higher levels. Outcomes
revealed that both high job stress and high non work stress were associated with
job dissatisfaction, high psychological distress, high negative effect, high anxiety,

47
and more absence from work, more visits to doctors, poor physical health and
higher incidence of illness. Mainly, the relationship between stress and emotional
health measures was stronger than the relationship between stress and physical
health measures. By and Large, the relationship between job stress and health
measures was maintained even after controlling for the effect of non-work stress.
“Mohan”, (1993) noted out that “maladjustment of a teacher’s behaviour
involves multi dimensional factors viz.; physiological, psychological and
environmental”. The study further noted that in all sorts of maladjustment of
teachers‟ behaviour, there is a common element of abnormality in behaviour. This
element of abnormality of emotional response may be stimulated by bodily
conditions, by current circumstances, by formal events preserved in fantasy that
never corresponded to any external event.
Searches linking psycho-physiology and personality indicated that stress in
one’s life outcomes in the development of psycho-somatic disease viz.
hypertension. Hypertension among the individuals directly affects their behaviour.
It is imperative that a hypertensive teacher would also be affected as a outcome
and may not be able to render effective teaching.
“French and Caplan”, (1970), out of their study, noted that role ambiguity
was significantly compared with the feeling of job relevant threat, and mental and
physical health of the employees. In another study, role conflict was observed to
be positively compared with threat and high anxiety. In a study of working
women, “Hall and Gorden”, (1973) found that role conflict led to the feeling of
unhappiness. Stress caused from role conflict was noted to be positively compared
with threat, anxiety and tension “Short and Aldag”, (1976). In further studies,
“Beehr”, (1976) found that role ambiguity was compared with low self-esteem. In
their study, “Morris and Koch”, (1979) noted that role stresses were associated
with psychiatric complaints. Out of his study in middle managers, “Orpen
Christopher”, (1982) noted a significant positive correlation between role conflict
and physical and psychological strains leading to deterioration in psychological
health.
“Srivastava and Singh”, (1988) noted positive relationship between role
stress and ill-health. The study also revealed that approach coping strategies

48
accentuated the adverse effects of role stress on mental health to a noticeable
extent. “Jagdish and Srivastava”, (1989) noted that stress arising from role conflict
was most intensively compared (negatively) with psychological well being of the
supervisory personnel. In her extensive study, “Benerjee”, (1989) noted a negative
relationship between role stress and mental health of employees in service
organization. The investigation also documented that the stress outcomes from
inter-role distance caused maximum variance in psychological health of the non-
manufacturing employees whereas; the stress arising from self-role distance
predicated maximum variance in psychological well being of the employees
belonging to manufacturing organizations.
Employee’s mental health has also been examined in relation to the stress
generated from role overload. Out of their investigation “French”, “Tuper’, and
Mueller”, (1965) concluded that qualitative work overload experienced by the
university professors was significantly compared with low self-esteem.
“Terryberry”, S.”, in (1968) noted that “overload in most systems leads to
breakdown, whether we deal with single biological cell or individuals in an
organization”. “Martin”, (1984) in his investigation concluded that role overload
predicated acute and chronic mental problems.
Besides the role stress, the effect of stress arising from several other
organizational and occupational variables on employee’s mental health has also
been examined by the stress researchers.
The revision of literature relating stress-effects in teachers and other
professional groups dwelled into main fields of stress-effects viz. physiological,
psychological and behavioural.
Two models contained in the review viz. “the bounce model” and “the stress
behaviour model.” may be helpful in planning the current study. The reports of
research studies directed on work stress, role stress with varied symptoms of
physical and mental health of employees.
Hence it was decided to study all three stress-effects in the current sample of
coaching teaching professionals.

49
2.4 ROLE STRESS AND ROLE STRESSORS
As teaching organizations become more complex, the potential for stress in
teaching faculty member increases. The stressors which are responsible for
inducing stress in terms of physiological, behavioural and psychological stress in
teaching faculty members need to be analyzed and measured.
Role can be defined “as a set of functions which an individual performs in
response to the expectations of the significant members of social system and his
own expectations about the position that he occupies in it”. “Pareek”, (2010)
Poor working relationship among co-workers in an organization is also a
source of stress. “The interpersonal demands and social pressures which arise from
social system relationship at work may be potential sources of stress.” (“Quick and
Quick”, 1984)
“Ivancevich and Matteson”, (1980) stated that “career stress category of
potential stressors include job insecurity, over promotion, under promotion and
thwarted ambition”. Individuals suffering from career stress often show job
dissatisfaction burnout, poor work performance and unsatisfactory interpersonal
relationship at work.
Occupational stress leads to role stress. There are two role systems namely
role space and role set. The concept of role and the two role systems have a built
in potential for stress.
As defined by “Pareek Udai and Purohit, S.”, in (1997, 2002, and 2010) role
space is the dynamic relationship against the various roles occupied by an
individual and his self. Any conflicts amongst the three variables viz. the self, the
role under question and the other roles occupied lead to role space conflicts or
stress. A short description of role space stress which may take the following forms
as given by “Pareek” in (2010) is given below:-
1. Self Role Distance (SRD) When expectations from one’s role go against his concept, he feels this kind
of stress. This is basically a conflict arising out of incongruence between personal
attributes of an employee and the requirement of his job role.
2. Intra - Role Conflict (IRC)
When certain incompatibility is seen between the expectations of a role it
outcomes into intra role conflict. For example a coaching faculty may see

50
incompatibility between expectations of teaching students and of doing research.
Even though the two expectations are not inherently conflicting, but the individual
may perceive these as incompatible.
3. Role Stagnation (RS)
This kind of stress is the outcome of gap between demands outgrow of
previous role to occupy new roles effectively. With the advance of an individual,
his role also grows and changes. With this change in role, the need for taking his
new role becomes crucial. This is the problem of role growth. This becomes an
acute problem especially when an individual enters new role after occupying a role
for a long period.
4. Inter Role Distance (IRD)
Individual occupies more than one role at a time. His occupational role may
come into conflict with family or social roles. These conflicts among different
roles represent Inter-role distance. IRD which is also called as Family Role Factor.
It has the dominant theme of conflict between organizational role and family role.
It can be of two types: IRD (F) and IRD (S) one concerned with conflict with
family roles, and the other with social roles.
Further “Pareek Udai and Purohit, S.”, in (1997, 2002, and 2010) also
defines and clarify various forms of role set stress as follows: The conflicts which
arise as an outcome of incompatibility amidst expectation by self and by the
“significant” others are referred to as role set conflicts or stress. Role sets are the
sub systems is an organization which include seven different role set conflicts as
follows:-
1. Role Ambiguity (RA)
It arises when the individual is not clear about various expectations people
have from his role. Role ambiguity may also be due to lack of information
regarding role and its enactment to the role occupant.
2. Role Expectation Conflict (REC)
This type of stress arises when two or more members of one’s role set
impose opposing expectations on the role occupant and he is ambivalent as to
whom to please. Stress is also created if the same member holds opposing
expectations toward the focal person.

51
3. Role Overload (RO)
When the role occupant feels that there are too many expectations from the
significant members in his role set, he experiences role overload. There are two
aspects of this stress: quantitative and qualitative. The former refers to having “too
much to do” while the latter refers to “to difficult to do”.
4. Role Erosion (RE)
This type of role stress is the function of the role occupant’s feeling that
some functions which would properly be the part of his role are transferred to or
being performed by some other person. This can also happen when the functions
are performed by the role occupant but the credit goes to someone else.
5. Resource Inadequacy (RIN)
This type of role stress is evident when the role occupant feels that he is not
provided with adequate resources for smoothly performing the functions expected
from this role.
6. Personal Inadequacy (PIN)
Role stress also arises when role occupant feels that he does not have the
necessary skills and training for effectively performing the function expected from
his role. This is bound to happen when proper placements are not made and the
organizations do not impart periodic training to enable the employees to cope up
with the fast changes both within and outside the organization.
7. Role Isolation (RI)
This situation of role stress arises from psychological distance between the
occupant’s role and other roles in the same role set. The main criteria of role
isolation are frequency of interaction with other roles in the role set. In the
absence of strong linkage, the stress of role isolation may be high. The gap
between the desired and the existing linkage would indicate the degree of role
isolation.
According to “Pareek”, in regard to the organisational roles, the following
ten role stresses are worth considering:-
i. Inter Role Distance (IRD)
ii. Role Stagnation (RS)
iii. Role Expectation Conflict (REC)

52
iv. Role Erosion (RE)
v. Role Overload (RO)
vi. Role Isolation (RI)
vii. Personal Inadequacy (PIN)
viii. Self Role Distance (SRD)
ix. Role Ambiguity (RA)
x. Resource Inadequacy (RIN)
Both groups of role stress namely role space and role set can cause conflicts
and stress as they are the causal factors of stress or the stressors. Therefore it is
more suitable to call them as stressors for the present research.
Hence all the above ten role stressors broadly fall into two categories
namely work role stressors and family role stressor. Only one role stressor Inter
role distance (IRD) is considered as family role stressor and all the other nine role
stressors are considered as work role stressors. Therefore two types of stressors
can be measured in each of the two major life roles, family and work roles.
The organizational Role Stress Scale (ORS Scale) by “Pareek Udai”,
(1983c) and revised in (1993) can be used to measure these role stressors. The
ORS Scale has high reliability and validity and detailed norms have been worked
out for different types of organizations.
According to “Pareek Udai”, (1983b), the ORS Scale can be used for
several purposes. It can be used to investigate the nature and dynamics of role
stress in various organizations and to develop interventions for the use of
individuals, groups and organizations. This instrument gives data about the
number of different role stresses experienced by a respondent. A detailed analysis
of stresses on which a respondent has high scores can be done and some plans can
be worked out to manage and reduce these stresses.
The ORS Scale by “Pareek Udai”, (1993) is certainly one of the best
instruments available today for measuring a wide variety of role stresses.
a. Family role stressor and relevant studies
This unit brings forward the focus on the nature and management of stress
that crosses work and family roles. For some time researchers and practitioners

53
have recognized the fluid boundaries between work and family life, an idea more
recently expressed in the concept of spill-over. The spill-over concept therefore
contains stress and coping processes flowing across individuals and social roles. It
contains family stressors in daily life and the social contexts in which individuals
find themselves.
Stress occurs within roles, forming natural boundaries. The occurrence of
stress in one role has implications on stress in other roles. At the same time,
stressors may accumulate within a role. Stress in work and family roles derives
from a number of separate and only sometimes overlapping causes.
A model of stress between work and family:
This working model was proposed by “Eckenrode, J. and Gore, S.”, in the
year (1990). “Stress in the workplace affects the family and vice versa, the extent
of which varies as a function of multiple factors relevant to the structure of the
family and workplace, the nature of stressors, and those situational factors that
moderate the stress transmission process”.
Work family boundaries are important because concrete activities are
important to maintain them, for example day care facilities at the work site or use
of phones for family relevant calls.
This model incorporates four sets of variables: (1) Stressors, both ongoing
and eventful; (2) coping resources and strategies; (3) health relevant outcomes;
and (4) Characteristics of the participants that may modify the stress and coping
process e.g. gender.
Three sets of relevant but conceptually distinct processes also are considered:-
1. Transmission process that involves carryover of stressors from one role to
the other or one person to the other.
2. Stress mediating process within the family and the work place where stress
collisions on a family members or worker’s well-being.
3. Stress moderating process reflects the presence of conditions that may
prevent stress from crossing over from one role to the next, from one person
to the next. Stress may flow across work family boundary in both directions
and have positive as well as negative influence in terms of well being of the

54
employee and his/her family. Stress in one role area may increase stress in
the other. On the other hand, low levels of conflict with corresponding high
levels of social support from the spouse may act to buffer the mental health
effects of work stress.
At the level of coping with stress, effective coping behaviour and processes
in one role setting may be dysfunctional in the other and that effects of coping in
one domain may display positive or negative spill-over into another. Work family
stress may vary for men and women but are equally pertinent to both the sexes.
Stressful job conditions, including work overload, job conflict and ambiguity
clearly influence the transmission of stress from work to family, for women as
well as men. Likewise, juggling work and family responsibilities is becoming an
issue for an increasing number of men, even if the role of men assuming
instrumental roles in the family has not kept pace with the increasing rate of
employment among women.
There is evidence that work-job interference is experienced as a greater
problem for women than men (“Voydanoff and Donnelly”, 1985).
Relevant Studies
More efforts are required on part of the researchers to understand the
process that connects work and family settings. More concentration on
psychological concepts such as stress has become a thrust area for research in the
recent times.
“Bidyadhar Shwetaleena and Sahoo Fakir M.”, (1997) examined the
“psychosocial factors of work-family linkage,” 200 professionals inclusive of
male and female participated in the study. Participants were married and working
and were categorized into four quasi-experimental groups. As one group had to be
dropped finally only three groups were examined. Outcomes revealed that clarity
of division of duties were differently utilized. The criteria of harmony were
strongly inter-co relevant and negatively associated with conflict factors. Certain
socio-demographic variables such as person relevant measures, family relevant
measures and organizational relevant measures emerged as significant. Person-
relevant measures contained income, age and educational level of participants.

55
The family-relevant measures considered were family type, age, education and
income of spouse, number of children and total number of earning members in the
family. Organizational variables contained type and size of organization, and
work experience. Significant positive correlations were found between work and
family involvement and child relevant support, emotional support from spouse.
Outcomes indicated that the crossover effect of a spouse’s work-family
conflict was positively relevant to withdrawal behaviours to some extent. About
40 percent of the crossover effects were detected at the correlation level for the
withdrawal outcomes.
“Vodydanoff Patricia”, (2004) examined “the effects of work demands and
resources on work-to-family conflict and facilitation.” The analysis was based on
data from 1938 employed adults living with a family member who were
interviewed for the 1997 national study of the changing workforce. The outcomes
supported that time and strain based work demands show relatively strong positive
relationships to work-to-family conflict, whereas enabling resources and
psychological rewards show relatively strong positive relationships to work-to-
family facilitation. The availability of time based family support policies and
work-family organizational support was negatively relevant to conflict and
positively relevant to facilitation.
“Sekaran”, (1985) in his study on husbands and wives in dual career
families had commented that “the spill-over between work role and family role has
distinct gender commutations. Husbands are more likely to bring work home as
compared to their wives and vice versa”.
“Shahnawaz M. G. and Ali Nasir”, (2007) explored “work family conflict
and its relationship with organizational commitment among dual career women” in
two different organizations. “Time based conflict” was found more in dual career
women of multi-national company than their counter-parts in Government
organizations even though the difference was not significant. “Strain based
conflict” and work family conflict were significantly higher in dual career women
of Government organization than multinational company. The outcome was
surprising because workload and pressure has been found more in multinational
companies.

56
“Shrimali V. and Sen Ruchira”, (2009) investigated the “relative factors of
stress among IT professionals and gender differences of wellness among them.”
Findings indicated that personal and professional stressors exerted cumulative
effect on the individuals.
b. Work role stressors and relevant studies
For the past few decades’ studies on organizational role stress have directed
attention on the causal factors, stress manifestations and coping strategies among
managerial personnel. The other groups of professionals such as teaching
professionals who also play managerial roles at work have not been researched
upon.
“Ahmed, S, Bharadwaj, A and Narula S.”, (1985), conducted a study of
stress among executives from public sector and private sector. The variable
measured was role stress using ORS scale, “Pareek”, (1994). The main findings
revealed that out of 10 dimensions of role stress, significant differences were
obtained in three dimensions namely Role isolation, Role ambiguity and Self-role
distance. Public sector executives experienced slightly higher stress than their
counterparts in the private sector, age; education, income, marital status and
experience of executives were found to be irrelevant with role stress in both the
groups.
It was observed by “Pestonjee”, (1987b) that the Inter-role distance and
Role erosion had contributed significantly to managerial stress. Further, Role
ambiguity and Personal inadequacy were the least contributors to managerial
stress.
“Gupta, N. K. and Pratap S.”, (1987) examined organizational role stress,
trait anxiety and coping strategies in Public Sector executives. Executives were
subdivided into three categories based on their length of service namely: those
with 5 or less than 5 years, with 5 to10 yrs. of service and with more than 10 yrs.
of service. Findings showed a linear increase in role stress as a function of service
length. Role stress and trait anxiety were irrelevant to each other. Role stagnation
and Role overload negatively related to role stress. Doctors experienced more
stress than lecturers. Female doctors and lecturers experienced more stress than

57
male doctors and lecturers. “Self role distance” and “Role stagnation” and “Role
overload” seemed to affect doctor’s needs but not of lecturer’s needs. Role
ambiguity and Resource inadequacy appeared to equally affect the doctor and
lecturer’s needs. Role erosion affected lecturer’s needs more than the doctors.
Both doctors and lecturers experienced least role stress and achieved full
gratification of their needs.
"Rajagopalan M. and Khandelwal P.”, (1988) examined role stress and
coping styles of Public sector managers. The sample consisted of 120 executives
and the variables measured were role stress and coping styles. The main findings
indicated that the total role stress was positively compared with avoidance and
negatively compared with approach coping styles. Role expectation conflict, Role
erosion and Self role distance were not found to be compared with coping styles.
“Kumar Satish”, in (1997) found out the relationship between organizational
role stress and length of service. Data were collected from 252 public sector
executives. The outcomes indicated that role stress is not significantly relevant
with length of service. However, Role stagnation and Role overload and Role
isolation rose with service length. Several other studies have also examined the
relationship between role stress and length of service (“Sen”, 1981; “Surti”, 1982
and “Gupta”, 1988). “Sen” and “Surti” found no significant relationship between
role stress and length of service.
In (1997), “Zafar M Syed and. Rao S. B Nageshwara” examined the impact
of organizational role stress on job involvement of managers in public sector
organizations. The sample consisted of 130 managers from junior, middle and
senior level in the age group of 26 years to 56 years with 5 to 30 years of
experience. Outcomes indicated that all three levels of managers were negatively
influenced by Role stagnation, Role overload and Role isolation. Role stagnation
was found to be maximum amid executives with 5 to 10 years of experience.
Middle level manager experienced high level of Role stagnation and Role
isolation stresses. For senior managers none of the role stresses showed impact on
their job involvement. Overall analysis indicated that Personal inadequacy, Role
stagnation, Role overload and Role isolation were the sources of disturbance to
junior and middle level managers. “Pestonjee”, (1999) defined role of service

58
length effect on organizational role stress and coping strategies. Outcomes
revealed significant and negative relationship between service length and stress
experienced.
“Gupta and Kulkarni”, (2001) tested two concepts: first more dissatisfied
employees experience greater role stress and second lesser job involved
employees experience greater role stress. Analysis confirmed that more
dissatisfied employees and less job involved employees experienced greater role
stress.
“Koteswari”, (2004) examined the influence of gender and length of service
on stress and coping of employees of different organizations and revealed that
stress levels go down as experience on the job increases. No gender difference
was found for the same.
“Khetrapal and Kochar”, (2006) examined role stress in women and found
that 40 percent of the women were under moderately low level of stress followed
by 36 percent, who noted moderately high level of stress. “Bhattacharya Sunetra
and Basu Jayanti”, (2007) examined distress, wellness and organizational role
stress in IT companies. The effect of age and sex as well as the predictability of
various variables from stressful life events and coping resources was also
examined. About 101 professionals inclusive of both men and women were
examined as sample. Outcomes revealed that women experienced greater wellness
and older personnel experienced more distress. Distress could not be predicted
from the life events and coping resources taken together. Wellness and
organizational role stress could be predicated from these two variables.
Organizational role stress and distress were positively relevant and distress and
wellness were negatively relevant.
On the basis of above review, it can be said that role stressors were the
potential sources of stress in various occupational groups especially managers.
The various research studies highlighted on the relationship of work role stress to
personal variables, length of service, coping strategies and styles, health outcomes
and job satisfaction or dissatisfaction. In addition, the family role stress was
examined in relation to work family spill over, work family conflict and
facilitation.

59
2.5 JOB SATISFACTION AND RELEVANT STUDIES
The term job satisfaction describes a positive feeling about a job,
outcompeting from an evaluation of its characteristics. A person with a high level
of job satisfaction holds positive feelings about his or her job, while a dissatisfied
person holds negative feelings. Organizational behaviour researchers have given
high importance to job satisfaction. Through their research in organizational
behaviour “Robbins, Judge and Sanghi”, (2009) revealed that satisfaction levels
vary a lot, depending on which facet of job satisfaction is being talked about.
People are, on an average satisfied with their overall job, with work itself and with
their supervisors and co-workers. However they tend to be less satisfied with their
pay, with promotion opportunities, and job in general.
As job satisfaction is a global concept, similar factors cause and outcome
from job satisfaction across cultures. For example pay is positively but relatively
weakly relevant to job satisfaction. Satisfied employees are more likely to be
satisfied citizens and hold a more positive attitude towards life in general and
therefore create a society of more psychologically healthy people.
However, job satisfaction as relevant to performance does not hold
consistency in various segments of the work force. People differ in terms of
importance that they place on work in their lives. For some, the job is their central
life interest but for others, their primary interest is off their job. Non job oriented
people such as average workers tend not to be emotionally involved with their
work. This indifference allows them to accept even frustrating conditions at work
more willingly. On the other hand job satisfaction might be important to
professionals such as lawyers, surgeons, college lecturers and teachers since their
progress and performance enhancement depends on it.
Sources of Job Satisfaction:
A comprehensive approach requires that many additional factors be
contained before a complete understanding of job satisfaction can be obtained.
Such factors as employee’s age, sex, health, temperament, desires and levels of
aspiration should be considered. Further, the family relationships, social status,
recreational outlets, activity in organizations – labour, political or purely social,

60
contribute ultimately to job satisfaction. In fact, out of the major job satisfaction
facets, enjoying the work are almost always the one most strongly compared with
high levels of overall job satisfaction. “Interesting jobs that provide training,
variety, independence and control, satisfy most employees” (“Barling J., Kelloway
E. K and Iverson R. D.”, 2003). In other terms, most people prefer work that is
challenging and stimulating, over the work that is repetitive and routine.
“Ghanekar Anjali”, (1995), in her book “Organisational behaviour” concepts
and cases, has stated that job satisfaction is derived from and is caused by many
inter-relevant factors which form three basic categories as follows:-
1. Personal factors such as sex, number of dependents, age, time on the job,
intelligence, education and personality.
2. Factors inherent of the job such as type of work, skills required location and
size of organisation.
3. Factors controllable by management: These factors include job security,
adequate pay, fringe benefits, and opportunity for advancement, working
conditions, co-workers, responsibility, supervision, communication and
information. Of these, Job security and timely communication are the most
important factors. In recent years employees have desired much more
information about the job and the company and want permanent steady
work.
Measurement of Job Satisfaction:
There are several techniques for measuring Job satisfaction for instance,
inference prediction from behavioural data, interviews, questionnaires and scales.
Of these techniques, interviews have been usually used to measure job attitudes
and satisfaction. However, since interviews do not have high reliability,
questionnaires and scales have been used either in combination with interviews or
independently to get raised reliability and objectivity. Job satisfaction scales are
the more recent tools to be used in the measurement of job satisfaction, for
instance occupational stress indicator OSI: “Cooper and Williams”, (1987, 1988).
They all tend to involve scales which explore pay, work activities, working

61
conditions, career prospects, relationships with superiors and relationships with
colleagues. These various scales fall into two categories:-
1) Tailor made scales which are constructed for a particular project or setting.
2) Standardised scales which are refined to establish group norms on the scales
and to ensure reliability and validity of the measuring instrument.
One such standardised measure is “Job Satisfaction Scale”. This scale was
constructed and refined by “Dr. Murali D. and Kulkarni M.S.”, in 1997. This scale
was refined with an aim to measure the Job Satisfaction of employees. It was
refined by Professor “Murali” and her co-worker at Marathwada Agricultural
University, Parbhani.
As satisfaction is subjective and cannot be easily measured, Prof. Dr. Murali
felt the need to develop a measuring tool for it. The satisfaction scale was
constructed by applying the Likert’s technique of summated rating method
(Edwards1969). Initially sixty statements were collected based on literature and
after discussion with subject matter specialists. The statements were divided
equally under the categories of work autonomy, occupational status, work
schedule, and work environment as per the classification given by Burgo and
Culver (1989). These statements were approximately half positive and half
negative and were randomly listed. These sets of statements were put on a five
point psychological continuum to indicate level of agreement. It was administered
to a group of 70 randomly selected working women. The subjects were arranged in
ascending order based on the mean score. Top 25 percent of subjects with highest
score (high group) and 25 percent of the subjects with lowest score (low group)
were used as criteria for group formation.
Individual statement‘t’ values were calculated using Edward’s formula
(1969). Statements were then ranked and the ones with largest‘t’ values were
selected for the final scale. The final scale consists of forty statements arranged
under the categories of work autonomy, occupational status, work schedule and
work environment. The statements are not equally distributed under the four
categories as only those statements which have high‘t’ values are contained in the
scale. The statements are approximately half favourable and other half
unfavourable. As the scale items were selected in consultation with experts in the

62
field, the scale is supposed to have content validity. Criterion validity was not
calculated for the scale.
This scale was first used in one of the M.Sc. Thesis in 1998 at “Parbhani”.
The study was on Job Satisfaction of working women. Since then, this scale has
been used several times for M.Sc. and doctoral research work. This scale has been
tested on a large sample of different professions.
Relevant Studies:
The relationship between stress and job satisfaction has been examined in a
variety of professions. In most studies it is described as how people feel about
their jobs and its different aspects. “It is the extent to which people like
(satisfaction) or dislike (dissatisfaction) their jobs” “Spector”, (1997). Studies
conducted in Asia-Pacific region have found compensation and benefits to be a
major source of complaint among employees. In “Watson Wyatt’s”, (2006), first
Work India Survey covering 515 companies across eleven Asian countries, only
30 percent responded favourably to their compensation and benefits. The
workplace criteria were compensation and benefits, supervision, teamwork,
communication, work environment and job satisfaction.
“Caplan”, et al. (1975) submitted that “stress is any characteristic of job
environment”. One study indicated that job stress and job satisfaction are inversely
relevant (“Sullivan and Bhagat”, 1992). “Stress is believed to cause depression,
irritation, anxiety; fatigue and therefore lower self-esteem and lower job
satisfaction” (“Manivannan”, et al. 2007). Job satisfaction or job dissatisfaction is
often contained in stress research as a outcome of stress and a negative
relationship between stress and job satisfaction is usually noted.
There have been studies on different professionals on their experience of job
satisfaction and role stress. “Chandraiah”, et al. (2003) examined the effect of
occupational stress on job satisfaction among 105 managers of different age
groups and found a positive relationship between role stress and job satisfaction
among older managers.
“Pestonjec and Mishra”, (1999), examined role stress and job satisfaction
amongst junior and senior doctors and found that job satisfaction variables
63
compared negatively with all dimensions of role stress in case of both the groups.
As far as teaching profession in concerned, “Singh”, (2007) examined the
effects of stress on job satisfaction and work values among female teachers of
secondary schools and found that stressed and dissatisfied teachers had less
attachment with their institution and less dedication to their profession. In the US
context, “Langford”, (1987) examined the relationship between stress and job
satisfaction amongst boarding academy teachers and found that stress was a
significant of teacher job satisfaction. Similar findings on primary head teachers
were noted by “Chaplain”, (2001).
“Sen Kakoli”, (2008), in her study examined the relationship between job
stress and job satisfaction amongst teachers and managers. Data were collected
from 31 teachers teaching in primary and secondary schools and 34 managers
working in service sector. The respondents were asked to indicate their gender,
age, years of education, years of experience, marital status and number of children.
The outcomes of ‘t’score showed that there was no significant difference in the job
satisfaction score of teachers and managers. The outcomes suggest that there were
more females in teaching profession as compared to managerial positions. The
average age of teachers was slightly higher as compared to managers. Likewise,
average years of education were also higher for teachers than for managers.
However, no significant difference existed with marital status and number of years
of experience of teachers and managers. Outcomes showed that teachers
experience low job satisfaction as they face more job stress while in case of
managers the two did not seem to associate. There were some similarities in the
managers and teachers job in the sense that both managers and teachers need to
plan, direct, supervise and guide their subordinates and students respectively. It
also seems that women take up teaching job more than they take up managerial
jobs.
As far as teachers are concerned the outcomes suggest that the greater the
job satisfaction, lower the stress. Perhaps the variables leading to stress at job for
teachers could be poor outcomes of students, student indiscipline, management
relevant issues which have an adverse relationship with the job satisfaction
experienced. Variables leading to job satisfaction could be ease of job,

64
comfortable working environment, peer relationship and lack of internal
competition. As teachers are responsible for shaping the careers of their students,
it gives them long term satisfaction.
“Kumar”, (1989) examined the relationship between role stress, role
satisfaction role efficacy using a sample of 292 lower and middle level executives
from different functional areas of an oil company. The ORS scale and Role
efficacy scale were administered to respondents. The major findings revealed that
Role stagnation, Personal inadequacy and Self role distance were significantly
higher among lower level executives. Unmarried executives experienced higher
role stress as compared to married executives. Executives married to working
women experienced higher role stress as compared to executives married to
housewives. They also scored higher on Role expectation conflict and Role
overload.
In another study, “Luhadia”, (1991) investigated the relationship between
role stress and job satisfaction. The sample consisted of 100 geological officers
from higher, middle and junior level. The ORS scale and S-D employee’s
inventory were administered as tools to respondents. The findings noted that Role
inadequacy caused maximum role stress in higher level officers whereas Role
erosion caused maximum stress for middle and junior level officers. Job
satisfaction was found to be negatively compared with role stress. Higher, the
stress, lower the job satisfaction among different levels of officers. Role stagnation
caused minimum stress in higher level officers and also influenced job satisfaction
on the whole. Job satisfaction and role stress were compared negatively and
significantly in higher level officers.
A large number of studies have dealt, with the effects of different Personal
as well as Organizational variables on role stress and job satisfaction. During the
1980s much research in the field of organizational stress and job satisfaction
indentified various organizational, extra organizational and individual sources of
stress at work and their relationship to job satisfaction. Every organization has a
different set of stressors. It is clear that there are not many studies, which explore
and establish the relationship of role stress with job satisfaction and other variables
in a particular type of organization.

65
A number of studies were carried out on job satisfaction of women. One
such study by “Lakshmi S.M. Rama and Devi M. Sarada”, on “Relative magnitude
of role satisfaction and role stress of women in different occupations” was carried
out in 2005 at Hyderabad. The author stated that due to dual role performance
working women experience satisfaction and stress at every stage of family life
cycle. “The role stress and role satisfaction of working women both at home and at
workplace are multidimensional and differ from individual to in individual”. The
total sample comprised of 120 working women in which 60 professionals (30
lawyers and 30 engineers) and 60 clerks were contained. The outcomes of the
study revealed that among all the three categories, the relative magnitude of role
stress was higher than role satisfaction. The relativity of satisfaction and stress was
equal in marital life of lawyers. In case of engineers, the relativity of stress was
more than satisfaction. Likewise the relativity of stress was higher than
satisfaction in case of clerks. The relativity of stress was more than satisfaction in
family life of lawyers, engineers and clerks.
The relativity of satisfaction and stress was equal in recreational life of
lawyers as they were able to allot time for recreational activities leading to
satisfaction. In case of engineers and clerks, the relativity of stress was more than
satisfaction as they had less time available for recreational activities. The relativity
of stress and satisfaction in social life of lawyers was equal as they maintained
social contact with friends, relatives and neighbours leading to social life
satisfaction. But the relativity of stress was more in case of engineers and clerks.
Due to role overload, job strain and job responsibilities they could not allot any
time for social activities. The relativity of stress was higher than job satisfaction
with regard to job life of lawyers, engineers and clerks. This was due to perceived
role stress at work or due to their low satisfaction levels in marital, family and
recreational life. These research findings also revealed that satisfaction with family
and social life had positive influence on overall job satisfaction. With regard to
satisfaction, it may be stated that people who experience stress, find job
dissatisfying. Even though low to moderate stress can lead to better performance,
excessively high stress can lower the performance. Stress always has negative
impact on satisfaction.

66
Studies regarding satisfaction of those in jobs and the factors affecting their
satisfaction could be of value in improving the job conditions and hence the job
productivity. (“Saraswati”, 1974)
Job satisfaction is an interesting but complex phenomenon which has
received much attention in the past and deserves to receive more in the future. By
measuring job satisfaction periodically in organizations and institutes, it is possible
to understand better, the extent to which organizations and institutes are meeting
employee’s needs and expectations.
The literature reviewed gave an insight into the meaning, sources, causal
factors, and measurement of job satisfaction in teachers and various other
professions. Most of the studies, reviewed showed a relationship between role
stress and job satisfaction.
2.6 STRESS MANAGEMENT COPING STRATEGIES AND RELEVANT
STUDIES
“Outer Circumstances and events don’t create stress. It is our response
to them which creates stress.” “Nuernberger Phil”, (1990)
Stress is a fact of life and individuals react to stress in different ways. Some
individuals deal with stressors in a positive way with a proper understanding of the
phenomenon and its effect. Taking appropriate action to optimise, reduce or
prevent stress may be beneficial both for the individual and organization.
Stress management is a means to enhance coping with external stressors and
their internal outcomes. Stress management has three broad options – prevent or
control, escape from it, or learn to adapt to it (handle its symptoms). As prevention
is better than cure, steps should be taken to prevent the occurrence of stress rather
than treat its harmful effects or bear a heavy cost when the damage is already
done. Effective stress management can be done at the individual level and at the
organizational level in many different ways. Stress management can be divided

67
into two phases: the first is coping with stress and the second is counteracting the
stress with the help of relaxation response.
“Preventive programmes which emphasize individual training in stress
management are among the most usually offered health promotion services at
work site” (“Donaldson”, 1993 and “Invancavich”, et al. 1990). Such interventions
have been directed towards the development of individual coping strategies
leading to stress management.
Preventive Stress Management has three stages: primary, secondary and tertiary
1. Primary Prevention is intended to reduce, modify or eliminate the
stressors. It is largely an organizational matter as it can change and shape
the demands it places on people at work.
2. Secondary Prevention is intended to modify or alter the individual’s or
organization’s response to stressor. People must learn to manage the
inevitable, unalterable work stressors so as to avert distress and strain while
promoting health and well being.
3. Tertiary Prevention is intended to heal the individual or organizational
symptoms of distress and strain. These Symptoms may range from early
warning symptoms such as headaches or absenteeism to more severe forms
of distress such as hypertension, work stoppages and strikes. Tertiary
prevention is therapeutic aimed at arresting distress and healing the
individual, the organization or both.
A review by “Murphy”, (1984) looked at worksite stress management
programmes utilizing muscle relaxation, biofeedback, meditation, cognitive
restructuring, behavioural skills training and combination of these methods. He
concluded that these techniques offer promise in helping workers cope with stress.
Coping is a core concept in stress literature and a variety of coping measures
have been used. Surprisingly research on stress and coping has ignored gender
relevant differences in the appraisal of stressful events. An analysis of particular
“coping strategies used by men and women across occupations with similar
stressors and context is important because the degree to which stressful events
outcome in distress or negative outcomes is relevant to the coping strategies one
uses” “Sharma and Acharya”, (1989) and “Srivastava and Singh”, (1988).

68
Moreover “an understanding of the personal and work environmental contexts of
coping is required before an attempt is made to modify coping responses” (Long,
1990).
Coping Strategies:
Individuals and Organizations cannot remain in a continuous state of
tension. “The term “Coping” is used to denote the way of dealing with Stress, or
the effort to master the conditions of harm, threat, challenges when a routine or
automatic response is not readily available” (“Lazarus”, 1974a)
These are two approaches by which people cope with stress:-
1) Passive approach: When people either suffer or deny the experienced
stress or put the blame on others it is called passive approach. It is the
reactive strategy or dysfunctional style of coping.
2) Active approach: It occurs when people face the experienced realities of
stress and clarify the problems through negotiations and discussions with
other members. This is proactive strategy or functional style of coping. The
active approaches are more approved by Social Scientists as they are
supposed to be more effective and healthy when compared to passive
approaches or dysfunctional styles (“Pareek”, 1983b)
There are basically two ways to manage stress:-
a) At individual level
b) At Organizational level
At individual level, again there are two ways of dealing with stress
(1) By drug therapy
(2) By non drug treatment
In Drug therapy, individuals use drugs continuously to cope with stress
relevant ailments such as headaches, backaches etc. In non-drug treatment the
coping is more advantageous and much safer, for example exercise, yoga
relaxation response, such as acupuncture, or meditation, hobby, practice relaxation
techniques, rearranges schedules etc.
Beyond all these measures an individual is required to develop a stress
management philosophy for his / her own self through a mental approach which
contains positive attitude and optimistic outlook. Developing a sense of humour is

69
an excellent means of effective stress management. “Aggarwal Rita”, (2001) said
“it is important to listen to your body. Chronic fatigue, tense muscles, depression
and lethargy are some of the symptoms that give the message: It is time to take off
the pressure.”
Various investigators have pursued two different approaches to the study of
coping. Researcher like (“Cohen and Lazarus”, 1973) have preferred to study the
active ongoing strategies in a particular stress situation.
“Maddi and Kobasa”, (1984) talked about two forms of coping-
Transformational and Regressive. Transformational coping involves altering the
events so that they are less stressful. This can be done through interaction with
events, optimistic thinking and acting towards them decisively and change them in
a less stressful direction. Regressive approach contains a strategy where one thinks
about the events pessimistically and acts evasively to avoid contact with them.
The most functional style of coping with stress is one in which the individual
shares stress with another person and jointly finds ways of managing it.
Researchers “Sharma S. and Acharya, T.”, (1989) commented on the paucity of
meaningful research on coping strategies to deal with stress in different
occupational groups.
a. Individual stress coping strategies:-
Some specific techniques that individuals can use for coping with stress include
the following:-
Physical Exercise: Physical exercise is necessary to keep the body healthy both
physically and mentally and is the best antidote for stress. Emotional strength is a
by-product of regular exercise, and self confidence is a natural outcome. Regular
and regulated physical exercise contains walking, jogging, swimming, aerobics,
riding bicycle, playing outdoor games etc. Physical fitness helps the body to cope
better with stress, whereas relaxation techniques are useful for the mind.
Physical exercise is said to offer the best cure to work relevant stress. In
Japan, provisions for physical exercises at the workplace are made compulsory
with every break, in tune with biological rhythms, whereas in India, natural cycles
of activity that is work and rest are completely ignored.

70
Relaxation Practices:
Yoga: Yoga is a holistic science concerned with all aspects of human
functioning. It involves various body postures and breathing exercises.
Relaxation: Relaxation removes fatigue and drives attention away from
work or a stressful situation. It is useful in managing a prolonged stressful
situation more effectively. Different people respond differently to relaxation
activities.
Meditation: “Meditation is of far greater importance than medication for
whatever afflicts mankind today.” (“Bhamgara”, 1997). It is a mental
relaxation technique which has proved to be of immense value to relieve
stress and re-energize the body, reduce psychological problems such as
anxiety and depression and lead to better emotional and physical health.
Practicing meditation outcomes in tranquillity and peace of mind. It helps in
lowering the pulse and heart rate, induces a more objective thinking process
with an unbroken and maintained concentration. The usually practiced
techniques of meditation are yoga and relaxation response.
Biofeedback: Biofeedback is a specific relaxation technique which is now
being used for treating psychosomatic disorders like hypertension, tension,
headaches, migraine headaches, backache, depression etc. Sophisticated
biofeedback instruments have been refined that constantly inform the user
about the changes which are characteristic of stress within his/her body for
example, the intensity of muscle tension, skin temperature, heart rate, blood
pressure etc.
Recreation and Leisure time activities: Recreation provides an opportunity
to let oneself go, become inhibited therefore reducing tension and stress.
There are various forms of recreation like music, entertainment, painting,
movies, parties, gardening, dancing etc. “Recreational pursuits are important
to the prevention of the damaging effects of stress” (“Husain”,1998) .
Leisure time can be used for doing some activities which give pleasure and
help in building connections with others. Hobbies can easily be pursued in
leisure time.

71
Diet: These days’ dietary practices are being used to improve a person’s
overall health making him/her less vulnerable to stress. A proper diet can
prevent stress caused by unhealthy dietary habits.
Sleep: Human errors caused by drowsiness and sleepiness may lead to
accidents and tragedies. A good night sleep helps to restore physical
resources and increases the stress tolerance level. A person with large sleep
debt is more vulnerable to infections and other illnesses. A raised need for
sleep is the body’s mechanism for producing the desired recovery. Adults
require at least 7 to 8 hours of sleep daily even though individual differences
in sleep patterns and sleep needs vary.
Time management: Time management is important for people who
maintain a busy schedule. They need to prioritise their activities to avoid
stress from time pressure and overtime work. Time management helps to
balance work and leisure time activities. Working late may also alleviate
stress. Working professionals who are dedicated to work are often
“overworked‟‟ which has an adverse impact on their mental and physical
wellbeing. Premature ageing is also seen as a outcome of overwork.
Behavioural Self Control: Individuals can manage their own behaviour to
reduce stress and can avoid people and situations that they know will put
them under stress. It is a type of self-cure technique. Even “Cognitive
therapy” may be used to alter an individual’s self-defeating thoughts that
unnecessarily cause a strain by making him conscious of the effects of his
thoughts on his physiological and emotional response.
Networking or Social Support: Social psychology research has indicated
that people benefit from social support. Networking requires forming
associations with trusted, empathetic people who may be family members,
neighbours or co workers and colleagues who are good listeners and
confidence builders. These people provide support whenever needed and
help individual overcome stressful situations.
This kind of socio-emotional support received from personal relationships is
necessary not only outside the work place but also within the workplace.

72
b) Organizational stress coping strategies
Some organizations are low-stress causing whereas other organizations are
high-stress ones that may place their employee’s health at risk. Organizational
stress-coping strategies focus on people’s demands and ways to reduce distress at
work. These strategies are to be designed by management to eliminate or control
organizational level stressors in order to prevent or reduce job stress for individual
employees. The organizational stressors may be in form of overall policies,
structures, physical conditions and processes or functions. In developing
organizational stress coping strategies each of these areas should receive attention
and each of the specific stressor is to be worked on to eliminate or reduce job
stress.
Most organizational stress prevention is primary intervention “Sharma.
R.A.”, (2000) has submitted some preventive strategies such as personnel
selection and placement, skills training, job redesign, role negotiation, raised
participation and personal control, team building and cohesive workgroups,
improved communication and career counselling.
“Pareek”, (1994) has submitted organizational intervention as the
“OCTAPACE” culture. It contains
O - Openness T - Trust
C - Collaboration A - Autonomy
P – Pro-action C - Confrontation
A - Authenticity. E- Efficiency
All these aspects promote the fulfilment of individual needs, improve
problem solving and facilitate change. “Pestonjee D.M.”, (1987a) has submitted
some organizational interventions for counteracting stress such as undertaking
stress audit, use scientific inputs, check with company doctors and spread the
message.
“Murphy”, (1988) has submitted three different forms of stress management
techniques namely stress management training programmes, employee assistance
programme, stress reduction / intervention programmes.

73
“Srivastava A. K.”, (1997) has also submitted some organizational
interventions which can be helpful in preventing the undesirable outcomes of
stress as follows:-
a) Prevention of stress through organizational interventions at management
level such as selection of suitable personnel, job designing and training,
adequate work conditions, effective supervision and incentive system,
effective communication system, participative management etc.
b) Minimizing the frequency and intensity of stressful situation is integral to
the job at the organizational level.
c) Moderating the intensity of integral job stressors and their consequent
strains through the effect of other variables of positive values such as extra
wages, social support, non-financial incentives, generating team feeling,
participative decision making etc.
There might be many other coping strategies which employees may be using
to deal with their job stress in accordance with nature of stress situation, available
physical resources, and their own personal resources and characteristics. But
generalization cannot be made about the extent of effectiveness of various coping
strategies. The effectiveness of the coping strategy depends upon the nature of the
stress situation and several other co-existing situational variables. Nevertheless,
“the absence of a coping strategy may lead to ineffectiveness” (Hall, 1972).
Relevant Studies:
The empirical study of coping with stress has drawn the attention of Indian
researchers only recently. Some of these studies are shortly presented here,
“Srivastava and Singh”, (1988) explored the moderating effect of coping
strategies on the relationship of organizational role stress and mental health. They
noted the positive relationship between role stress and ill health and found that
approach coping strategies accentuates the adverse effects of role stress on mental
health to a noticeable extent.
“Singh and Pandey”, (1985) admitted coping with problems in economic,
family, personal and social aspects of life in a sample of university students.
Using an open ended measure, they identified five dimensions of coping namely
appraisal directed coping, emotion directed coping, problem directed coping,

74
secondary coping and collective coping. The use of coping dimensions varied
with nature of problems faced by the individual.
Another important study of coping has been noted by “Singh”, (1990) in
relation to stressors of executives. This study employed a measure of coping
strategies involving four factors, namely, active problem solving, non - directional
work approach, constructive deferred problem solving, and information seeking.
He found that high level executives experienced lesser stress and strain, utilized
better coping strategies and enjoyed more positive outcomes. Also, a combination
of coping strategies forming a condition of passive coping was relevant to high
stress condition.
“Ganguly”, (1988) explored the stressful experiences in family and work
domains and the ways in which people coped with them. A sample of 120 adult
males was drawn from a large organization located in Bhopal. Forty participants
were selected from each of the three cadres namely manager, supervisor and
artisan. Age and tenure of service were found to be greater in case of supervisors
followed by managers and artisans. Size of the family was negatively compared to
the hierarchal position.
The contribution of different variables in predicting the three coping
strategies namely active behavioural coping, active cognitive coping and
avoidance coping is as follows:-
a) In case of active behavioural coping, tenure emerged as the most important
predictor followed by age, family work spill and family size for artisans.
b) In case of active cognitive coping for the supervisors, tenure emerged as the
most important variable, followed by job stress, work involvement, family
stress, family to work spill, family size and work to family spill.
In case of avoidance coping, perceived control was the most prominent
variable which was negatively relevant to avoidance strategy followed by family
involvement, job stress and tenure in case of managers. For the other two coping
strategies namely active behavioural and active cognitive coping perceived,
control and work involvement were prominent followed by support, control,
appraisal, age, tenure and family to work spill in case of managers.

75
“Gupta and Murthy”, (1984) examined role conflict and coping strategies
among Indian woman. The coping strategy which was most popular amongst the
respondents was “personal role redefinition”. This strategy was significantly
associated with low role conflict and high satisfaction with coping. Reactive role
behaviour methods were associated with high role conflict and low satisfaction
with coping. The findings indicated that “Adjustment” and “Compromise” were
the most usually used and successful methods of coping.
“Kaur and Murthy”, (1986) examined two coping strategies of managerial
personnel at organization levels in public sector. The outcomes indicated a
significant difference in the coping strategies adopted by individuals working at
different organizational levels. Approach strategies at senior level and avoidance
strategies at junior level were predominant. The defensive style was used
maximum by Junior Level management personnel, impunities by middle
management personnel and intro-persistive by top management personnel. There
was a positive and significant relationship between role stress and avoidance
strategies, between role stress and externality, between externality and avoidance
strategies. Organizational role stress was negatively and significantly associated
with approach strategies.
“Pareek”, (1993) distinguished between effective and ineffective coping
strategies. Studies on the subject revealed that approach style had strong
relationship with internality, optimism, role efficacy, job satisfaction and effective
role behaviour in organizations. Two contrasting approaches “avoidance and
“approach” were considered for some of the role stresses. Findings of the study
summarized stated that, effective management of stress involves directing stress
for productive purposes, preparing role occupants to understand the nature of
stress, helping them to understand their strengths and use styles and equipping
them to develop approach strategies for coping with stress.
A number of researches have been conducted on coping strategies as
moderators between organisational role stress and mental health of employees by
“Srivastava A.K. and Singh H. S.”, (1988) and “Srivastava A.K.”, (1991a).
Findings in general revealed that role stresses compared positively and
significantly with mental health dimensions. The approach coping strategies had a

76
buffering effect whereas the avoidance coping strategies extended the intensified
effect on the positive relationship between the variables. According to the authors,
“the different effects of coping strategies may be due to the distinct features
associated with these strategies and the personal characteristics of the individual
adopting these strategies”.
Several studies have been conducted by researchers on relaxation practices
from time to time. Yoga seems to have potentiality to influence health practices.
Yoga practices were examined by “Sachdeva (1994) and Rao P.V.K.”, (1995).
Findings from these studies on Yoga revealed that “long term practitioners of
Yoga had acquired remarkable voluntary control over their autonomic processes
which helped them in coping with psychological stress”.
The review regarding stress management through coping strategies brought
to the realisation that various authors have categorized and discussed coping
strategies from their own view point both at individual level as well as
organisational level. The effectiveness of various coping strategies cannot be
generalised. They need to be adopted as per the nature of stress situation, type of
profession and several other situational variables. Various relaxation practices
seem to have potential to influence the health practices of professionals.
Formulating the base of this review, some of the coping strategies may be
used as interventions to counteract stress in professionals both at individual and
organizational levels in the current search.
2.7 STRESS IN TEACHING PROFESSIONALS AND RELEVANT
STUDIES
The profession of teaching in modern age is not as simple as it was in old
days. The old values to respect the teacher have been replaced by commercial
attitudes, as a outcome of which a teacher has to face varied unexpected
behavioural situations. The priority agenda today is to prepare teachers for
tomorrow enabling them to meet the changes ahead.
In India, even though teachers work with commitment, they do not get the
status they deserve and facilities they require. They work with low salaries, poor
working conditions, heavy class loads, difficult students or clients, repetitive tasks
77
and little opportunity for career advancement. Teachers are required to take
periodic “refresher” courses, seek additional professional qualification for higher
pay or advanced certification. Expert or experienced teachers do the same work
that is performed by a faculty member who is newly appointed or a teaching
faculty member with one or two years or experience. Very rarely do highly
experienced or expert teaching professionals receive special recognition or
honorific titles. Not surprisingly then, “a substantial number of teachers
eventually leave the profession and those who remain are subject to boredom,
stress and burnout” (“Kyriacou and Sutcliffe”, 1977).
Teacher stress is defined by “Kyriacou”, (1987) as “the experience by a
teacher of unpleasant emotions, such as tension, frustration, anxiety, anger and
depression outcompeting from aspects of work as a teacher”.
The phenomenon of work stress of teachers has been receiving raised global
attention and concern in recent years. Teacher stress has become a major problem
not only in India but also overseas which revealed that the phenomenon of stress
(problem of teachers) was widespread and was not restricted to a particular
country.
Role incompatibility is the fundamental source of stress in teaching
professionals. The teacher assumes various roles in exercising this profession.
One set of role conflicts with another set of roles (“Edgerton”, 1977), and these
conflicts are highly responsible for high levels of absenteeism among teachers.
Faced with conflict, the teaching faculty members can either adapt or cope in
order to minimize stress. Unfortunately, many of them adapt a maladaptive role
and experience lack of satisfaction with the job and display symptoms of anxiety,
depression and psychosomatic disorders.
Likewise, stress in teachers can be relevant to the amount of teaching
experience they have had, though it never decreases overtime (Fuller, 1969). It
was noted that stress was a function of teaching experience. Fuller claimed that
the teachers‟ concerns follow a three-stage developmental sequence: younger
teachers are concerned about self, more experienced teachers become concerned
with the problems of the job, while the concerns of the older teachers are with the
students‟ needs.

78
The moderating effects of cognitive failure on the relationship between
work stress and personal strain was examined among nurses and college lecturers
by “Orpen Christopher”, in 1996. The study contained 136 registered nurses and
121 college lecturers, representing persons in “high stress” and “low stress” jobs
respectively “French”, et al. (1982) and “Schuler and Von Sell”, (1981) in their
study measured job stress by 10 items from Role ambiguity and conflict scales by
“House, Rizzo and Lirtzman”, (1970). Two aspects of personal strain furnished
the dependent variable in the study namely work relevant emotional stress and
somatic symptoms of stress. Findings from the earlier above study indicated that,
nurses experienced much more work stress than lecturers without being more
liable to cognitive failure.
Another study on work stress of teachers from primary and secondary
schools in Hong Kong was conducted in 2009 by “Chan Alan H. S.”, “Chen K.”,
and “Chong Elaine Y.L.” The study was refined to investigate the occupational
health problems among teachers of primary and secondary schools in Hong Kong.
A random sample of 6000 teachers was generated from the database of Hong
Kong professional teaching union members. The outcomes indicated that on
comparison between one year and five years ago, 91.6 percent and 97.3 percent of
the responding teachers noted an increase of perceived stress level respectively.
Heavy workload, time pressure, education reforms, external school review,
pursuing further education, managing student’s behaviour and learning were the
most usually noted sources of work stress. The four most usually noted stress
management activities were sleeping, talking to neighbours and friends, self-
relaxing and watching television while the least usually noted activity was doing
more exercises or sports. Both male and female teachers in Hong Kong secured to
experience the same level of perceived stress. The independent variables
contained were gender, age, marital status, number of children, educational level,
teaching training and experience, and working mode. The life style and choice of
stress management activities of male teachers seemed healthier or better than
those of female teachers.
“Vadra P. and Akhtar Sultan” (1989) conducted a study on university
teachers (N = 120) to reterming the stress emanating from home and family

79
situations. “Social family role stress” scale refined by them was used. Male
teachers experienced more social family role stress as compared to female
teachers and married experienced more stress than unmarried teachers. This study
showed that extra organizational stressors were as potent as factors relating to
work situation.
A comparative study of extra organizational stress among women teachers
and nursing staff was also carried out by “Akhtar Sultan” and “Vadra”, “Preeti”,
in (1990). Researchers have pointed out that role stress emanating from social and
family situations dominance the degree of stress experienced at the work place
(“Bhagat”, 1983; “Vadra” and “Akhtar”, 1989). A sample of 60 women teachers
and 50 nursing staff was taken. The outcomes indicated that for women teachers,
job tenure emerged as the significant predictor of social and family stress while
for nurses the number of dependents contributed significantly to the prediction of
social and family role stress.
“Biswas and De”, (1993) examined role of organizational climate on
professional stress experienced by 34 male teachers working in an open climate
and 34 male teachers working in a paternal climate. The data analysis revealed
that teachers working in an open climate experienced less composite professional
stress, powerlessness and social isolation than the teachers working in a paternal
climate. It was also found that the teachers in an open climate had less negative
orientation and affection towards different aspects of their job and professional
lives.
In another study, “Sultana”, (1995) investigated the level of organizational role
stress among male and female teachers of professional and non professional
courses. A group of 50 male and female teachers each from professional and non
professional courses were compared on role stress. The ORS scale (“Pareek”, 1983
c) was used to assess the individual role stress variables as well as the total stress.
The main findings of the study were as follows:-
a) Significant differences were found between professional male and female
teachers on the dimensions of inter Role distance, Role stagnation, Role
expectation conflict, Role erosion, Role overload and Role ambiguity.

80
b) Significant differences were found between non professional male and
female teachers on the dimensions of Role expectation conflict, Role
isolation, Personal adequacy, Self role distance and Role ambiguity.
c) There was significant difference between professional and non professional
male teachers on the role stress dimensions of Role stagnation, Role
expectation conflict and Role isolation.
d) There were also significant differences between professional and non
professional female teachers on the role stress dimensions of Inter role
distance, Role stagnation and Role over load.
Another study relevant to teachers was conducted by “Mishra R.”, in (1996).
The study compared the levels of occupational stress and job satisfaction among
male and female teachers of higher educational institutions. The sample comprised
of 80 (40 males and 40 females) degree college teachers. Two psychometric
instruments namely the stress scale and job satisfaction scale were administered to
the sample population.
The conclusions obtained were:-
a) Significant differences were observed gender wise in the areas of private
life, work overload, under load, role conflict and interpersonal stress. Female
teachers experienced more stress in these areas as compared to male
teachers.
b) No significant differences were found between the two groups in the
environmental structure of institution and personal areas.
c) Gender wise significant differences were observed on overall stress and
overall job satisfaction.
d) Stress was found to be compared negatively and significantly with job
satisfaction in both the groups.
e) Male teachers obtained maximum scores on under load stress whereas
female teachers obtained maximum scores on overload stress.
“Mathur S.”, (1997) examined the psychological and organizational
correlates of role stress in 400 working women from different professional groups
such as doctors, school teachers, college teachers and bank employees. ORS scale
(“Pareek”, 1983c) was one of the five psychometric instruments used in the study.

81
The salient findings showed that college teachers experienced minimum role stress
in comparison to other three groups. Role efficacy was found to be inversely
associated with most of the dimensions of role stress. Job satisfaction was noted to
be negatively and significantly associated with all dimensions of role stress except
Role expectation conflict, Role overload and Role ambiguity.
In another study “Pareek and Mehta”, (1997) compared three groups of
working women namely gazette officers, bank employees and school teachers on
all types of role stresses experienced by them. A total of 150 working women (50
from each group) from Jaipur city constituted the sample. The ORS scale
(“Pareek”, 1983c) was used to measure all types of role stresses. The main
findings pointed out that school teacher’s were found to be lower on all kinds of
role stresses in comparison to both gazette officers and bank employees.
“Surti”, (1982) examined the psychological correlates of role stress in
different professions of working women such as researchers, doctors, nurses,
social workers, school teachers, university and college teachers, gazette officers,
bank employees and women entrepreneurs. The sample comprised of 360 working
women. An attempt was made to rewording the extent to which demographic,
personality and organizational factors contributed to role stresses. The analysis
revealed the typical stress experienced by a particular professional group and a
rationale for this was sought.
Self role distance was experienced mostly by bankers and least by university
and college teachers. Role overload was experienced to a higher extent in more or
less the same intensity by all professional groups except university and college
teachers. University and college teachers experienced least role stress. The
researcher expressed that these jobs are considered socially prestigious, working
hours are short, vacations are frequent and pay scales are reasonable. Due to these
reasons, women in these professions are able to fulfill the demands of various
roles and may not experience conflict because of the multiple roles they play in
society.
From the literature reviewed on stress in teaching professionals, it is clear
that teaching professionals do face role stress at their work place. The literature
reviewed gave an insight into the various correlates of role stress in teachers and

82
other professionals and their association with job satisfaction and psychosomatic
disorders. Job relevant role stress emerged as the potent source of stress followed
by social family role stress. Demographic variables and teaching experience were
some of the other correlates of role stress examined. There is a need to recognise
the multiple roles played by a teaching faculty member at the workplace. No study
could be traced which investigated the stress causes and practices in these
professionals. Also no study was found which directed its attention entirely on the
knowledge of stress-effects and the coping strategies adopted by teachers.
The extensive revision of relevant literature made it bright that the teaching
profession is merely stressful because the working environment in which teachers
work leads to facing tension, stress and strain. It was cognised that extended
occupational stress in teaching professionals outcomes in ill health. There is a need
to protect sound physical and mental health of teaching faculty members. The
sources of occupational stress amid teachers have been a vital field of search.
Exertions are being made to study role stressors and job satisfaction and the
variables impressing it. The assessment and impact of stress-effects in teaching
faculty members is an arising field of research. A very few studies have been
operated in this field in India and in foreign countries.
Since Kota Coaching Institutes are a recent development in the field of
education, stress in teaching faculty members working in coaching institutes
remains a not explored area. Therefore a need was felt to find out stress-effects in
teaching faculty members and the current investigation was carried out.
******

CHAPTER - 3 RESEARCH METHODOLOGY

83
CHAPTER-3
RESEARCH METHODOLOGY
The Present analysis was attempted with the ambition to study effects of
stress in teaching professionals working with coaching institutes in Kota City. The
review of literature was started from January 2015 which backed to conclude on
the direct of the research, questions associated with the stress concepts to be
reviewed and different variables to be inserted in pursuit this research study. The
study’s main attention was on effects of stress as related to family role stressor
and work role stressors and job satisfaction. The study also put upon determines
the antecedent factors of stress in coaching faculty members. Research questions
were chiefly bothered with the relationship between the preferred independent and
dependent variables.
This chapter cope with the methodology steps accept for the present
research. It shows the definite sequential method support for carrying out the
present research under various subsets as given below:
3.1 Research design.
3.2 Objectives.
3.3 Assumptions.
3.4 Hypotheses.
3.5 Variables under study.
3.6 Delimitations.
3.7 Justification for selection of variables.
3.8 Operational Definitions of variables.
3.9 Data collection procedure.
3.10 Tools used for measurement of the variables.
3.11 Pilot study.
3.12 Selection of the sample
3.1 RESEARCH DESIGN
According to Kothari (2004), descriptive research studies are anxious with
describing the characteristics of a particular individual or a group with specific

84
predictions, comparisons and story of facts. Since the present study correlated the
effects of stress as experienced by male and female coaching teaching
professionals define their characteristics in details in line with the objectives of
the study, it can be accordingly introduce to as descriptive research design. It
draws into account various aspects of stress as a fact to be studied.
As the present study direct on a check out into stress arising due to various
personal, family and job related factors amid teaching professionals of coaching
institutes in Kota; the descriptive research design was chosen as the most relevant
one for this study.
3.2 OBJECTIVES OF THE STUDY
The present study was developing with the following objectives:-
1. To identify the effects of stress experienced by male and female coaching
faculty members.
2. To know the causes or antecedent factors of stress among coaching faculty
members.
3. To measure the extent of job satisfaction related to family role stressor and
work role stressors.
4. To understand the relationship between stress-effects and job satisfaction.
5. To study the relationship between stress-effects and role stressors in male
and female faculty members.
3.3 ASSUMPTIONS OF THE STUDY
1. Coaching teaching faculty members experience stress at the workplace.
2. Gender wise difference in the stress experienced by faculty members can be
identified.
3. Service wise variation in the stress experienced by faculty members can be
identified.
3.4 HYPOTHESES
H01: The extent of stress-effects felt by faculty members does not differ by
personal factors.

85
H11: The extent of stress-effects felt by faculty members differs by personal
factors.
There will be difference in the felt stress-effects of faculty members by
personal factors.
i. Age
ii. Duration of illness
H02: The extent of stress-effects felt by faculty members does not differ by
family factors.
H12: The extent of stress-effects felt by faculty members differs by family
factors.
There will be difference in the felt stress-effects of faculty members by
family factors.
i. Family type
ii. Marital status
iii. Number of dependents
H03: The extent of stress-effects felt by faculty members does not differ by
situational factors.
H13: The extent of stress-effects felt by faculty members differs by
situational factors.
There will be difference in the felt stress-effects of faculty members by
situational factor.
i. Hours of work.
ii. Income
iii. Frequency of Health Check-up
iv. Health Status
v. Having Meal on Time
vi. Type of Treatment
vii. Job Timings
H04: There is no significant association between the extent of stress-effects
felt by faculty members and their academic performance.
H14: There is a significant association between the extent of stress-effects felt
by faculty members and their academic performance.

86
H05: There is no significant association between the extent of stress-effects
felt by faculty members and their job satisfaction.
H15: There is a significant association between the extent of stress-effects felt
by faculty members and their job satisfaction.
3.5 VARIABLES UNDER STUDY
The stress rising out of execution of teaching activities and responsibilities
in coaching teaching professionals’ bank on a number of factors which directly or
indirectly influence the extent of stress-effects experienced by faculty members.
Based on the plan, the following two sets of variables were preferred for this
study.
I. Independent Variables: Independent variables were classified into two
categories, namely
A. Individual factors
B. Job related factors
A. Individual factors
1. Gender
2. Personal factors
i. Age
ii. Health status
3. Family factors
i. Family type
ii. Marital Status
iii. Number of dependents
B. Job related factors
1. Situational Factor
i. Hours of Work
ii. Designation
iii. Income
iv. Health Status

87
v. Severity of Illness
vi. Frequency of Health Check-up
vii. Having Meal on Time
viii. Job Timings
ix. Type of Treatment
2. Service Duration
3. Role Stressors
4. Job Satisfaction
II Dependent Variables
A. Effects of Stress
1. Physiological stress-effects
2. Psychological stress-effects
3. Behavioural stress-effects
The extent of stress-effects experienced by male and female coaching
teaching faculty members was studied as dependent variable separately as it was
induced by certain other variables.
Using the basis of “stimulus based stress model” by (Beehr, 1984, 1985;
Beehr and Bhagat 1985; Mclean 1979; Selye, 1975), the various role stresses
endure by teaching professionals at coaching institutes i.e. at their work place,
were treated as independent variables or causal factors of stress and call as “role
stressors” instead of role stresses. These stressors act as stimuli in the work place
situation for teaching faculty.
Keeping in sense, the guidelines of “response based model of stress” by
Beehr (1984, 1985) and Caplan, Cobb, French, Harrison and Pinneau (1975) and
the results from its findings, the present study chose to recognize stress as a
dependent variable which stand for its consequences or demonstration in form of
physiological, psychological and behavioural stresses call as “stress-effects”.
3.6 DELIMITATIONS OF THE STUDY
The research was limited to
1. Teaching professionals working at various Coaching Institutes in Kota city.

88
2. Teaching faculty members who are in service at present broad of part time
visiting faculty.
3.7 JUSTIFICATION FOR SELECTION OF VARIABLES
After carrying out a detailed review of literature on occupational stress and
its sources, it was thought relevant to include the most develop work setting
variables namely work role, family role, job characteristics, organizational
conditions, and interpersonal relations at work and job satisfaction. These may
have a symbolic impact on employee performance and health. Literature review
confess that job satisfaction variable correlated negatively with all role stresses
hence it was determined that the relationship between role stress and job
satisfaction of coaching teaching faculty members also needed to be analyzed.
In the dash of classify sources of stress many studies in review of literature
have reviewed the contact of certain demographic variables on recognized stress
of teachers. Thus the causes of stress or the “stressors” which may influence
coaching faculty members are sum up as below.
1. Individual factors: (a) Personal factors such as gender, age and health status
(b) Family factors inclusive of family type, size and paid help employed. (c)
Situational factors namely working hours and service duration.
2. Job related factors: (a) Role Stressors (b) Job Satisfaction.
1. Gender: It was studied to be an important variable as it may affect the
family role, the work role and the stresses proceeding from these roles. It
may also impact the height of job satisfaction in teaching faculty members
gender-wise.
A few studies have shown that women experience more role stress as
related to men (Sen 1981). It proposed that there may be disparity in the
stress-effects felt by male and female teachers in their role performance at
work and at home. Therefore gender was included as an independent
variable in the present research.
2. Age: Since stress issues and problems are being realist and indicate recently
amidst coaching teaching professionals, it was simulated that young faculty
members may be more face down to stress and may display more concern

89
for the teaching activities and responsibilities in their behavior, than the
older faculty members. Bhandarker and Singh (1986) investigated the
stressor-stress causation with overall forecast of stress as well as agnate
contribution of each independent variable such as age to it. Age was
negatively related to role stress (Sen 1981). Young people between 20 and
30 years of age have been found to report twice as much stress when
correlated to older people. (Pareek Udai 1987). The data on the relationship
of age of coaching teaching faculty members to extent of stress-effects
experienced by them was lacking. Thus, it was thought applicable to study
age as one of the independent variables.
3. Health Status: The relationship between health and stress is one of the most
disputed topics. Stress often attends illness and it is widely admit that stress
may play a part in illness related conditions. There are a variety of
instruments through which stress might influence health (Cohen and
Williamson 1991). Psychological functioning has some direct effect on
physiology, alternatively effects may be indirect, and in that stress may
influence health behaviors (Steptoe and Wardle 1996) which raises or
reduced the chances of illness. Stress may also get decreased due to health
promoting behaviors such as deciding a healthy diet and exercising. Stress
may also get altered by behaviours directly related to medicine and
compliance with treatment regimes. For these assorted reasons, study on
stress and health is difficult, yet determining whether stress is actually a
element of illness in coaching teaching faculty members was required to be
inspected. The researcher wondered whether an offhand link can be settled
between the health status of the faculty members and stress. Hence health
condition was treated as a vital independent variable for this research.
4. Family Type: The type of family might have a definite impact on the
amount of stress experienced by faculty members from the family role
affecting teaching activities and responsibilities at work. Sen (1981) studied
the backdrop variables such as family type in liaison to role stress in
employees.

90
As family type could be a source of cause stress in coaching faculty
members too, it was inserted as an independent variable for this study.
5. Family Size: It was anticipate that the family size may alter the activities of
a teaching professional at home and at work. Larger families may appeal
more time to be spent on carrying out household responsibilities which
might change their work role and performance at the work place leading to
stress. Bhandarker and Singh (1986) tested family size as an independent
variable and its relative addition to overall stress in management employees
of public and private sectors. Family size was constructing to be positively
associated with certain role stressors and negatively with the other stressors.
Sen (1981) stated that “Growing family size and increasing responsibilities
with limited promotion explore might lead to a feeling of refusal and loss of
connection”. Hence family size was inserted as an independent variable.
6. Hours of Work: The only situational factor which was studied decisive as
an independent variable for this research was ‘Hours of Work’ at the
workplace. Some teaching professionals may put in long working hours to
cope up with hard circumstances at work which might bring opportunities
for material success or for personal hike and learning. However, it may be
leading to stress which have adverse importance to a greater or lesser
degree. Mughal, Walsh and Wilding (1996) present that “anxious sales
executives worked longer hours and closed more sales”. In order to build a
relationship between hours of work and stress in coaching teaching
professionals, this factor was treated important for this research.
7. Service Duration: It was simulated that the span of service duration might
impact the stress-effects experienced by teaching faculty members. Also,
there efficacy be gender differences in the stress-effects felt by faculty
members with regard to their service duration. Gupta and Pratap (1987)
resolute the role of service length on organizational role stress amidst
executives of BHEL, a public sector undertaking. “A definite upturn was
noticed in the intensity of organizational role stress as an action of service
length”. Thus it was reflection useful to inquiry, this independent variable
for this survey.

91
8. Role Stressors: Ten role stresses by Pareek Udai (1983c) are described as
role stressors in the present search. They have been considered from time to
time by different researchers on different samples of people. Bhatnagar and
Bose (1985) plotted role stressors among branch managers of a banking
organization. Rajgopalan and Khandelwal (1988) calculated role stressors
with approach coping styles among engineer executives. Srivastava (1991 a)
coordinated various depth of role stress with mental health. As teaching
professionals in coaching institutes also play distinct roles, there may be
stress rising from these roles. In order to find out if the coaching teaching
faculty members contact stress rising from these role stressors both family
role stressor and work role stressors, it was fundamental to add it as one of
the utmost great independent variable.
9. Job Satisfaction: Gladness within the workplace has always been linked
with enhanced health (Karasek and Theorell 1990; Stokols, 1992; Warr,
1994). There is much study to advice that convinced and healthful
employees are likely to be higher dynamic and less stressed than their less
convinced and less healthful correlative. It is therefore in the concern of
coaching institutes as employers to ensure that their job setting is the one in
which employee satisfaction is enhanced. The barricade to job satisfaction
and vigorous surroundings may relate to the role and the individual
reception to them is seen in form of stress.
In order to know the fellowship if any, between job satisfaction and stress-
effects in teaching faculty members, it was taken up as a vital variable.
10. Stress-effects: The platform of stress is studied as the stress-effects. The
three stress-effects i.e. physiological, psychological and behavioural are the
dependent variables in this research.
The comment based on assorted syndrome of stress empowers to discern
between these three stress-effects. These are treated as the corollary of stress.
Bhandarker and Singh (1986) inspected the unified stress cycle counting the
corollary of stress as dependent variables in management personnel from both
public and private sectors from southern regions of India.

92
The result of stress in form of the raised stated three stress-effects have been
calculated from time to time by various researchers especially in the ground of
psychology. Coaching teaching professionals may also wisdom these stress-
effects in distinct modes. In this context, it was essence to research stress and its
holdings as a dependent variable.
3.8 OPERATIONAL DEFINITIONS OF VARIABLES
Certain points which were operationally defined for measurement of
variables of this research are stated below
Stress
Stress refers to an individual’s opinion to an alarming factor in the domain.
It results in physiological, psychological and behavioural diversion for individuals
in an organization. It may show itself in both a positive and a negative way.
Eustress is positive stress and Distress is negative stress. In the present research
stress assign to three effects of stress viz. physiological, psychological and
behavioural stress.
Physiological stress
It cite to the impact that stress has on physical state of a person. The
dilemma due to huge trappings of stress is displayed physically by the individual
such as fatigue, headache, back-ache, stomach-ache, neck-ache and shoulder
stiffness, and increased blood pressure.
Psychological stress
It is the impact of stress on mental state of a person. Psychological
complications rise from stress are in day to day job performance. Stress which
shows psychological syndrome such as worrying, depression, impatience,
frustration, loneliness, powerfulness and inflexibility are covered in the present
research.
Behavioural stress
The stress-effects which may impact the behaviour of a person directly are
examined here. Behaviour akin stress syndrome in faculty members involved
crying, forgetfulness, bossiness, unprovoked shouting, blaming others,
compulsive eating and chewing, agitation, anger, gossip and teeth grinding.

93
All the three effects of stress will be deliberate on a five point nominal scale
to display the density of stress experienced.
Stressors
A stressor is the catalyst that urges stress. Stressors develop from different
sources of stress. In the present research, stressors cite to ‘Individual Stressors’
and ‘Job related Stressors’. Individual stressors abide of personal, family and
situational factors causing stress. Job related stressors indicate role stressors and
job satisfaction.
Role Stressors
Role is a stand that an individual employ in a social system. The notion of
role is chief to that of a teaching organization. Role has created in potential for
conflict and stress.
Role stressors are the element of role based stress. Role stressors as hint to
in the research are the ten role stresses given by Pareek Udai (1983c) viz. Inter
Role Distance (IRD), Self Role Distance (SRD), Role Isolation (RI), Role
ambiguity (RA), Role expectation conflict (REC), Resource inadequacy (RIN),
Personal inadequacy (PIN), Role stagnation (RS), Role erosion (RE) and Role
overload (RO).
Family Role Stressor
It occurs due to clash between organizational role and other roles. The
individual is not able to break the time between work demands and family
demands. For the present research, Inter Role Distance (IRD) is treated to be the
family role stressor, “This factor has a best line of battle between the
organizational role and the family role”. This factor may be thus termed as family
factor. Inter Role Distance (IRD) can be of two types. Family IRD (F) and Social
IRD(S), One is exercised with clash with family roles and the other with social
roles, Pareek Udai (2010). The present research matter itself only with battle
rising out of family roles and hence family IRD (F) alone is taken into discussion.
All the role stressors will be calculated by a standardized scale i.e.
organisational role stress (ORS) scale by Pareek Udai (1983c).

94
Work Role Stressors
These are the origin of role related stress experienced by teaching faculty
members at their work place. All role stressors quoted upon except Inter Role
Distance (IRD) are studied to be the work role stressors for the present research.
Personal factors
These hints to the personal aspect of an individual viz. gender, age, health
status, educational qualification, hobbies, and health practices, sleep hours and
exercise regime. Age, Gender, Qualification, Experience, Area of Specialization
and Duration of illness are the essential personal factors which will be treated in
the present research.
Family factors
These encompass type of family and household, size of family, total family
income, paid help, marital status, spouse’s education and occupation and number
of dependents. The family factors studied necessary and hence included in the
research are family type, marital status, and number of dependents.
Situational factors
The factors which have been studied amidst situational aspect cover
Designation, Hours spent at workplace, Income, Frequency of Health Check-up,
Health Status, Severity of Illness, Having Meal on Time, Job Timings, and Type
of Treatment.
Job Satisfaction
Job satisfaction is illustrated as how people feel about their job and its
different form. It portrays the state of mind of an employee at a particular point of
time i.e. even in the employee is satisfied with his job or not. A person with a
huge aligned of job satisfaction holds positive feelings about his or her job while a
disappointed person holds negative feelings. It is a subjective phrase and cannot
be easily calculated. Hence a mechanism is required to calculate the level of job
satisfaction. For this research job satisfaction is studied from four aspects of job
viz. work autonomy, occupational status, work schedule and work environment.
The job satisfaction will be deliberate on a five point scale ranging from strongly
agree to strongly disagree.

95
Work autonomy
It focal point on type of work, relationships at work and art and proficiency
linked to work in teaching professionals.
Occupational status
It combines positive and negative factors based on personal status, facilities
received, financial security and standard of living fulfilling the economic
requirements.
Work Schedule
It specify to time utilization for family and household authorities. It quote to
the satisfaction as afflicted in the ability or disability to carry out the family and
household authorities.
Work Environment
It subsists of the positive and negative factors as relevant to the type of
work, physical state of the workplace and facilities produce at the workplace. For
the present research, the job satisfactions on all the four forms of job will be
deliberate on a five point scale feeding from strongly agree to strongly disagree.
Service duration
It stands for the number of years of experience of job at the workplace.
Age
It invoke to the age group of respondents for both male and female. Three
age groups namely young, middle and old age are defined for the present research.
Health status
It brings notice on the present health condition of the respondents i.e.
whether the health condition is good, average or poor and the precautions taken to
sustain good health.
Family type
It comprises joint, nuclear, extended and single parent type of families.
Family size
It subsists of respondents along with their spouses (if married), and the
number of dependents. Dependents carry children, parents, in laws, brother,
sisters, grandparents and other relatives.

96
Hours of work
These glance to the number of hours spent at the workplace, specifically it
specify to the number of hours spent by teaching faculty members at the coaching
institutes where they work.
Coaching teaching faculty/ Professionals
Teacher’s who teach coaching courses at the school level (CBSE) Class VI
TO X, I.I.T-JEE, NITs, AIEEE, PRE-MEDICAL NEET UG (AIPMT)/ AIIMS,
PRE-NURTURE & CAREER FOUNDATION in a coaching institute, are called
coaching teaching faculty members or proficient’s for the present research.
Coaching institutes
Private institutes which run courses type of I.I.T-JEE, NITs, AIEEE, PRE-
MEDICAL NEET UG (AIPMT)/ AIIMS, PRE-NURTURE & CAREER
FOUNDATION AND NTSE & OLYMPIADS, are introduce to as institutes in the
coaching study.
3.9 DATA COLLECTION PROCEDURE
A questionnaire study method was taken up to build up data for the present
research. Questionnaire was used as a tool for gathering data so that a large
number of respondents could be contacted within a short period of time and the
respondents could be given enough time to fill it up. Since the present survey tried
to find out effects of stress in faculty members, there were outlook that the
respondents would not give true information in presence of the researcher. Hence
the questionnaire was reflection to be the most convenient instrument for the
present survey. The questionnaire was composing keeping in mind the objectives
of the research. The general set up of the questionnaire was form. The questions
were obvious, specific and predetermined. The questions were in typed plan with
replies in hand written form. Except a few, most of the questions were closed end
type. For some questions especially personal information and family backdrop
questions, fixed alternative questions were given which made the questionnaire
clear to understand and less time exhausting. A comprehensive review of
literature aid and permit the researcher to flourish this questionnaire. The entire

97
questionnaire was soulfully designed so that the teaching professionals had no
doubt in acknowledged on the necessary information. It had four distinct sections.
Section I
It span of questions to evoke backdrop information of the respondents, and
included the personal profile, family profile and the job profile of the faculty
members (appendix A).
The personal profile of the respondents inserted gender and age, educational
qualification, marital status, occupation, sleep time, hobbies, exercise regime,
overall health status, illnesses – their duration and treatment, health checkups and
medical expenses.
The family profile of faculty members encircle type of family and
household, family size, family income, contributors to family income, spouse’s
education and occupation, number of dependents and health practices.
The job profile of the respondents inserted designation at work, service
duration, subjects taught with area of specialization, type of institute, work hours
and travel time.
Section II
It contained of Organisational role stress i.e. (ORS) scale to survey the ten
role stressors as main donor of stress in respondents. The scale contained 50
statements aiming to measure levels of stress rising out of each of the role
stressor.
Section III
It consists of the stress tests which have of a total of 24 statements for
identifying the stress-effects namely physiological, psychological and
behavioural. Each stress effect was finding separately through syndrome recorded
in the statements belonging to each category of stress effect.
Section IV
It abides of Job Satisfaction scale to survey the extent of Job Satisfaction
level in teaching faculty members with regard to their role at work and in family.
It contained 56 statements referring to four aspects of job especially work liberty
occupational status, work schedule and work environment.

98
A systematic method was pursuing to collect data from the faculty
members. Teaching faculty members with teaching experience feeding from less
than 1 year to 15 years or more were chosen for the study. Participants were
teaching in coaching institutes located in Kota limits. The teaching faculty
members were hooked in teaching various courses in these institutes at the school
level (CBSE), I.I.T-JEE, AIEEE, PRE-MEDICAL NEET UG (AIPMT)/ AIIMS,
PRE-NURTURE & CAREER FOUNDATION AND NTSE & OLYMPIADS,.
Four hundred (400) questionnaires were distributed in all Coaching Institutes. A
total of 255 teaching faculty members completed the questionnaires representing a
63.75 percent response rate. Finally in all 10 coaching institutes participated in
data collection. A simplified plan for the step to collect data from the faculty
members was refined in advance. The investigator obtained prior approval from
the Director/Head of each Institute to collect the data. The investigator visit affix
meetings gave her preface to the teachers and inquire them if they would be prone
to spend about 30 minutes in completing a survey questionnaire regarding their
experiences of stress in the organization. The faculty members were request to
read a short description of the survey and give their blessings if they urge to
participate in the survey. The researcher gave a further description of the purpose
of the research and wished them to be a part of this research. It was further told
that they were needed to answer all the questions and the value of their aid for the
successful completion of the survey. They were explained that their participation
was fully free and the info collected from them will be confidential and will be
used only as data for study. Each set of questionnaire was stapled and each section
in the set was given the same casual identification number in case a participant’s
data set was distant.
Participants were asked to outright a short demographic questionnaire as
well as questionnaires respecting their role stress, stress-effects and job
satisfaction within a week. The respondents were again convincing that the
information serve by them will be kept private and they were also inspired to be
open and truthful in subject to information.
As per the time record given by the Institute head and respondents, the
investigator made the pursue calls and checks before the return of the

99
questionnaires. At the given time and day of the week, the investigator import
back the comprise questionnaires after verify them for completeness and
correctness of the data collected. An erratic review was finalized by the
investigator with the respondents in addition to serve push to those who had a
problem in sign up the questionnaire by simplifying recitation and defining of the
question. Once faculty members completed the questionnaires they were praised
for their support and were demand to give a assessment if they will to do so. The
255 valid questionnaires were then ripe for data processing. The data collection
period fell between January, 2016 to May, 2016.
3.10 TOOLS USED FOR MEASUREMENT OF THE VARIABLES
Out of the different uniform methods available for search, three most
suitable scales were treated and used in the present research based on their logical
and voluminous use in search and training.
They are as follows:-
1) Organisational Role Stress (ORS) Scale (appendix A)
2) Stress test (appendix A)
3) Job satisfaction scale (appendix A)
I. Organisational Role Stress (ORS) Scale:-
Pareek Udai (1981) on the basis of theoretical belief and statistical analysis has
identified ten positions of role stress. This scale was developed by Pareek in 1983.
Pareek Udai, (1983 c) gives a basis of individual’s anticipated role stress on the
following ten dimensions:
1) Inter Role Distance (IRD)
2) Role Stagnation (RS)
3) Role Expectation Conflict (REC)
4) Role Erosion (RE)
5) Role Overload (RO)
6) Role Isolation (RI)
7) Personal Inadequacy (PIN)
8) Self Role Distance (SRD)

100
9) Role Ambiguity (RA)
10) Resource Inadequacy (RIN)
The “ORS” Scale quota the raised ten types of role stresses. It is a
psychometric mechanism. ORS is a five point scale (0 to 4) holds five elements
for each of the ten role stresses and a total of 50 statements. Thus the total count
on each role stress ranges from 0 to 20. Responses are to be given on an answer
sheet. The ORS Scale is appended to (appendix A). The “ORS” scale was
obtained from a book. The reference is as follows Pareek Udai and Purohit
Surabhi, (1997, 2002, and 2010) “Training Instruments in HRD and OD, third
edition, Tata McGraw Hill publishing company Limited, New Delhi, and P-544-
551.
Scoring Procedure:
The count sheet was used for scoring. To get the total counts for each role
stress the ratings given by each respondent were totalled horizontally (for 5
items). These scores were then categorised into three levels of role stresses viz.
low, median and high. Based on median and quartile deviations, the standard
norms were proposed for low, median and high levels of the ten role stresses by
Pareek Udai (1982a) and Khanna (1986) for managers and the same were used for
this research. These patterns were recycled for analysing the data on each
respondent’s score on all the ten role stresses. Scoring was done gender-wise to
set up the investigator to observe gender differences if any.
2. Stress test
This test was composed and builds up by Dr. Prabhu G. G. of NIMHANS,
Bangalore. This test was used for the present research to compute the level of
stress-effects in teaching faculty members (appendix A). The test abides of 24
statements on a five point rating scale (1 to 5) as follows.
Frequency of experience Points
Never experience 1
Rarely Experience 2
Sometimes experience 3
Often Experience 4
Always Experience 5

101
This test appraises the physiological, psychological and behavioural extent
of stress. The physiological syndromes also are a pointer of proneness to stress. A
combined measure of physiological, psychological and behavioural note expresses
severity of stress. Scoring operation the accesses responses were deliberate on a
five point rating scale in charge of never experience, rarely experience, sometimes
experience, often experience and always experience. Answers were given scores
as follows:
I Scores on items 1 to 6 were counted and totalled indicating the total score
for physiological stress-effects.
II Scores for items 7 to 17 were counted and totalled announced the total
score for behavioural stress-effects.
III Scores on items 18 to 24 were counted and totalled imply the total score
for psychological stress-effects. Total scores of all the respondents on each of the
statements under each stress effect, were determined. Then Mean (M) and
Standard deviation (SD) were measured for each stress effect class to form a basis
for level of stress effect as follows:
i) Low level: Scores below Mean - 1 SD
ii) Medium level: Scores between Mean - 1 SD and Mean + 1 SD.
iii) High level: Scores above Mean + 1 SD
Low level was marked by ratings of never and rarely experience.
Medium level was marked by ratings of sometimes experience. High level
was marked by ratings of often and always experience, on the five point
psychological continuum.
3. Job Satisfaction Scale
This scale was used in the search to quote the level of job satisfaction in
coaching teaching professionals (Appendix A). This scale was formed by Dr.
Murali D. and Kulkarni M.S., M.A.U. Parbhani. Job satisfaction scale was
attaining from Indian journal of applied psychology, 1997, volume 34, No.2, P
17-21.
The scale dwells of 56 statements. The statements in the scale are rated on
five point psychological continuum feeding as strongly agree, agree, uncertain,
disagree and strongly disagree which were scored from 5 to 1 respectively.

102
Reverse Scoring of 1 to 5 was done for negative statements. The 56 statements are
covered under four heads viz. work liberty, occupational status, work calendar and
work environment as Classified by Burgo and Culver (1989). The scores of all the
subjects on all the statements under each class were added and Mean (M) and
Standard deviation (SD) were measured for each of the four job form. Mean and
standard deviation were worn as the basis to devise levels of job satisfaction as
follows:
i) Low level: Scores below Mean - 1 SD
ii) Moderate level: Scores between Mean - 1 SD and Mean + 1 SD
iii) High level: Scores above Mean + 1 SD
Low level of job satisfaction was marked by ratings of strongly disagree and
disagree. Moderate level of job satisfaction was recorded by ratings of uncertain.
High level of job satisfaction was marked by ratings of strongly agree and agree
on the five point continuum scale.
3.11 PILOT STUDY
Despite all the three scales used for the present research were standardized
ones and have been worn in research before, yet they were vital to be tested in the
plot on the sample group of teaching professionals before their final practice in
the main data assortment. These instruments were pretested along with
demographic questionnaire with an aim to:
Get primary experience with the respondents.
Bring a form about the near time taken to enrol the questionnaire.
Find the most correct action to conduct the questionnaires swiftly with
minimal risk of ruined them. Pinpoint which were the chance of
misinterpretation on part of the investigator and the respondents.
Make mandatory alteration in the demographic questionnaire and settle the
same.
The questionnaire was tested on a sample of 10 coaching teaching
professionals from the coaching institutes namely, Bansal Classes, Motion IIT-
JEE, Allen Institute, Resonance, Vibrant Academy, Career Point Ltd., Aakash
Institute, Sarvottam Career Institute, Nucleus Education and Btrix Career Institute

103
in Rajeev Gandhi Nagar, Kota. The faculty members broad of both male and
female were elect from each of these institutes based on the following norm:
1. Any Coaching institute teaching IIT/AIPMT courses linked to coaching
teaching.
2. The service period of the faculty members should fall into any of the three
following service grade:
i. Less than one year to 7 years. (Short service duration)
ii. 8 years to 14 years. (Medium service duration)
iii. 15 years and above years. (Long service duration)
3. Faculty members who were prone to engage in the survey.
The sample selected for pilot study was not a part of the final sample but
had nature similar to the prime sample of the research. Originally a few questions
were inserted in the questionnaire on the victuals made by the coaching institutes
for “stress management programs” for students and the organizational coping
strategies grant by the institutes. Since no information was obtained from the
respondents on this matter and on oral query, the institute heads said that they did
not have any such victuals for teachers at present and would like to have proposal
for the same. Hence the questions akin to this matter were omitted before
finalising the questionnaire.
A few questions of the questionnaire which were not openly accepted by
respondents were eliminated and regained with smooth altered questions. The data
gathered were scored, coded and subjected to simple statistics in direct to classify
and foretell the factual hardship in the final data processing and analysis. On the
ground of findings earned through pilot study, the questionnaire means was
updated and finalised with petty variation.
3.12 SELECTION OF THE SAMPLE
Locale of the Study
The present research was operating in Kota city. After receiving data from
internet sources, a list of coaching institutes in Kota and around Kota was
planned.

104
These coaching institutes which are based within the edge of Kota limits
only were studied for the present research. Kota comes up as one of cities in India
having the top number of coaching institutes. The attract part of Kota is majorly
fixed with the Coaching institutes such as Kota city, Rajeev Gandhi Nagar, Indra
Vihar, Road no. 1, IPIA, Talwandi, Vigyan Nagar, Jhalawar Road, Baran Road,
and Kunhadi (Landmark City), etc. as related to the periphery of Kota, where
these institutes are profusion out. Thus, in order to get utmost depiction of the
sampling, at fewest one coaching institute from outstanding well known space
was contacted and capped.
An entire of eleven (11) localities in Kota build the locale of the study. In
all, ten (10) coaching institutes located in 11 localities were lastly composed for
data collection. The eleven localities inserted in the present research were Rajeev
Gandhi Nagar, Indra Vihar, Road no. 1, IPIA, Talwandi, Vigyan Nagar, Jhalawar
Road, Baran Road, and Kunhadi (Landmark City), etc. (Figure -2).

105
Figure2
Outline map of Kota showing the locale of the study
Sample Selection

106
The present survey was borne out in Kota city majorly due to the essence of
the dilemma under survey. Since a top number of coaching institutes are placed in
and about Kota city, many students and teaching proficient’s have enter and ended
down in Kota from all over India and alien India to be unite with coaching courses
dash by these institutes. Thus it knew convenient to plan this present research in
Kota city.
Teaching proficient’s employed at coaching institutes in Kota creates the
sample of the survey. The respondents were picked by purposive sampling
technique.
Selection criteria
The sample was preferred on the basis of:
1) Any coaching institute that teaches at the school level Class V-X, I.I.T-JEE,
AIEEE, Pre-Medical NEET UG (AIPMT)/ AIIMS, Pre-Nurture & Career
Foundation and NTSE & Olympiads, courses similar to different types of
proficient coaching.
2) The faculty members were combined from both the genders i.e. male and
female.
3) The service period fell into any of the three service grade as follows:
i. Less than one year to 7 years. (Short service duration)
ii. 8 years to 14 years. (Medium service duration)
iii. 15 years and above years. (Long service duration)
4) The faculty members who were prone to associate and would give factual
remark were picked for the research.
3.13 ANALYSIS OF DATA
Grouping of the data:
For the objective of reasoning, the variables of the survey were classified in
a represent frame. The grade drafted for the various variables are given below:
1. Age group : i. Young : 21 to 40
(in years) ii. Middle : 41 to 60
iii. Old : above 60

107
2. Educational qualification:
i. Bachelor degree with or without Diploma / Certificate. (B.sc/ B-tech)
ii. Master degree with or without Diploma / Certificate. (M.sc/ M-tech)
iii. Ph.D. Degree (Dr.)
3. Designation:
i. Faculty iii. Assistant Faculty
ii. Trainee Faculty iv. Director/Dean/HOD
4. Marital status :
i. Unmarried iii. Divorced
ii. Married iv. Widower / Widow
5. Occupation :
i. Teaching ii. Administrative iii. Counselling
6. Sleep time :
i. Less than 7 hours ii. 7 to 8 hours iii. More than 8 hours
7. Hobbies:
i. Fine arts vi. Travelling
ii. Reading / Writing vii. Watching television
iii. Listening, / Practicing Music viii. Reading with other hobbies.
iv. Sports, Games ix. Entertainment
v. Miscellaneous or combination of 2-3 hobbies.
8. Exercise regime:
i. Walking, running, jogging viii. Yoga, Pranayam
ii. Gymnasium cycling ix. Relaxation activities
iii.Swimming, hydro-therapy x. Swimming, cycling
iv. Walking, running, jogging, relaxation. xi. Yoga and gymnasium.
v. Floor exercise and dance xii. Yoga, walking and relaxation.
vi.Yoga and swimming Gymnasium and meditation
vii. Others - Aerobics, music therapy and laughter club.
9. Overall health status:
i. Good ii. Average iii. Poor

108
10. Illness Suffered: i. Chronic
ii. Mild
iii. No illness
11. Duration of illness (Years) : i. No illness
ii. Less than 1 year
iii. 1 to 10 years
iv. 11 to 20 years
12. Type of treatment of illness : i. Regular : < 1 year
: 1 to 10 years
:11to 20years
ii. Periodical : < 1 year
iii. Special : 1 to 5 years
: > 10 years
iv. Other : 1 to 5 years
v. No treatment
13. Health check-up visits: i. Quarterly
ii. Half yearly
iii. Yearly
14.. Total Family Income : i. 10,000 to 30,000
(Monthly in Rs.) ii. upto 50,000
iii. upto 70,000
iv. > 70,000
15. Number of dependents : i. No dependents
ii. 1-2
iii. 3-4
iv. > 4
16. Number of years of teaching experience or service duration:
i. Less than 1 year to 7 years. (Short)
ii. 8 years to 14 years (Medium)
iii. 15 years and above years (Long)

109
17. Type of experience:
i. Teaching
ii. Administration
iii. Other such as Industry, Research.
18. Hours spent at work per day:
i. 5 to 6 hours
ii. 7 to 8 hours
iii. More than 8 hours.
19. Norms for Role stressors: placed on median and quartile deviation as
implied by (Pareek Udai 1982a, Khanna 1986) for managers were used in
the present research. The coming three grades viz. low, median and high
backed in mapping the level of stress on each of the role stressors in
teaching proficients.
20. Stress-effects: On the ground of review of literature stress was restricted
into three stress-effects viz. physiological, psychological and behavioural
stress-effects based on their syndrome. Mean (M) and standard deviation
(SD) were computed for all three stress-effects which were used as a base
to define the grouping for level of stress-effects namely Low, Medium and
High.
21. Job satisfaction: Job satisfaction scale by Murali D. and Kulkarni M. S.
(1997) inserted four facets of job satisfaction viz. work liberty, occupational
status, and work calendar and work ambiance. As advised in the scale three
levels were codify specially high, moderate and low to assess the amount of
job satisfaction in respondents Mean (M) and Standard deviation (S.D.) were
figured.
Later the data were classified, coding was done and counts were given.
The data were then formulated and charts were framed to serve the different
grades.
Statistical Analysis
The data were fully analysed using SPSS i.e. the statistical package for
social sciences, 22.0 packages. Data were analysed exercise descriptive as well
as relational statistics.

110
Descriptive Statistics
The data were conferred in frequencies, percentages, mean and standard
deviation for analysing the below knowledge:
i. Personal profile of respondents broad of gender, age, educational
qualification, occupational status, sleep time, hobbies, exercise, regime,
overall health status, and illness suffered duration and treatment of illness,
health check up visits and medical expenses.
ii. Job profile of respondents comprehensive of designation at work, number
of years of experience at the present workplace, area of specialization,
subjects educated at the School/IIT/AIPMT level, type of institute, work
time and travel time spent to workplace and back.
iii. Family profile inserted type of family and household, size of family, total
family income, contributors to family income, occupation and number of
dependents and their relationship to respondents and health practices of
respondents.
iv. Data related to amount of stress (level) experienced by respondents on ten
role stressors by gender.
v. Data on three stress-effects experienced by respondents.
vi. Data on job satisfaction of faculty members.
Relational Statistics
Statistical analysis was toted out to test the relationship between chosen
variables and the hypotheses posit for the research. All the independent variables
that were pretended to have any demeanor on the dependent variable i.e. stress-
effects experienced by faculty members, were plotted.
1 (i) ANOVA was figure out to find out the change in male and female faculty
members in kin to the amount of stress-effects i.e. physiological,
psychological and behavioural experienced by them.
(ii) ANOVA was also gauge to know the change in the amount of stress-effects
of teaching faculty members by family factor viz. “number of dependents”.
(iii) ANOVA was further measure to show the change in the bias of family role
stressor and work role stressors on the faculty members by gender.

111
2. Pearson Product Moment Correlations were figure out to find out the
relationship between
(i) Length of service duration and stress-effects in teaching faculty members.
(ii) Amount of stress-effects and job satisfaction of teaching faculty members
on all the four form of job viz. work liberty, occupational status, work
calendar and work ambience.
(iii) Ten role stressors and three stress-effects in teaching faculty members. Ten
role stressors were Family role stressor i.e. Inter role distance (IRD), Work
role stressors were namely Role stagnation (RS), Role expectation conflict
(REC), Role erosion (RE) Role Overload (RO), Role isolation (RI),
Personal inadequacy (Pin) Self role distance (SRD), Role ambiguity (RS)
and Resource inadequacy (RIN). The three stress-effects were physiological
stress-effects, psychological stress-effects and behavioural stress-effects.
3. Analysis of variance were measure to research the changes amidst
(i) The amount of stress-effects felt by teaching faculty members by preferred
antecedent factors viz. personal factors, family factors and situational
factors.
The preferred personal factors covered Age and qualification of
respondents. The family factors covered family type, marital status and
number of dependents. The situational factor inserted was hours of work,
Income, Frequency of Health Check-up, Health Status, Severity of Illness,
Having Meal on Time, Job Timings, and Type of Treatment. Three
identified groups were prepare for each of the factors cited raised to aid the
calculation of ‘F’ values.
(ii) The amount of job satisfaction of teaching faculty members by role
stressors.
(iii) The bias of family role stressor and work role stressors on teaching faculty
members by service period.
Wherever ‘F’ values were form to be significant, Bonferroni, action of
post-Hoc comparisons was enforced.
Thus the pace and practice stipulate in this chapter were pursue in carrying
out the present study.
******

CHAPTER - 4 DATA ANALYSIS AND INTERPRETATION

112
CHAPTER-4
DATA ANALYSIS AND INTERPRETATION
4.1 INTRODUCTION
In the previous chapter, research methodology applied for the present
study was described. This chapter presents the details of demographic profile
of employees and the outcomes of the study that helped to assess the
relationship between the variables under study. The prime objective of the
present research has been to explore how to manage stress to improve
performance with special reference to coaching faculties in Kota city. This
research analyzes the causes of stress and its effects on physiological as well
as psychological health of the respondents. During the research it is observed
that perception of the faculties differ on various aspects pertaining to stress
based on their demographic characteristics. The interpretation of respondents’
profile was done by using charts and graphs. The association between
variables was interpreted using One-way Anova and Correlation to interpret
the rankings of preferences of respondent on various aspects of the study.
The analysis was done to reveal the following:
To compile the profile of respondents and examine its association with
perception towards Stress and Job Satisfaction.
To identify the differences between faculties responses if any on the
idea about various variables under study.
To examine the effects of stress on faculties’ performance and how it is
influential in improving their efficiency and motivation.
4.2 GRAPHICAL PRESENTATION OF DEMOGRAPHICAL PROFILE
In this section the researcher presented the collected demographic data in
tabular manner with respective percentages and displayed them through suitable
graphs.

113
4.2.1 Age
The total data of 255 respondents was distributed on the basis of Age as per
the table shown below. The table and graph show the distribution of respondents
according to their Age Group. Maximum number of faculties i.e. nearly 74 per
cent falls under age group 21-40 years. About 23 per cent belonged to 41-60 years
age group whilst only 3.1 per cent was of more than 60 years of age.
Table 4.1
Age Frequency Percent
21-40 Years 189 74.1
41-60 Years 58 22.7
above 60 Years 8 3.1
Total 255 100.0
Chart 4.1
0.0
10.0
20.0
30.0
40.0
50.0
60.0
70.0
80.0
21-40 Years 41-60 Years above 60 Years
74.1
22.7
3.1
Age Distribution
Percent

114
4.2.2 Gender
The table and graph shown below indicate the distribution of respondents
according to their gender. Majority of respondents i.e. 87.5 per cent were male
while only 12.5 per cent were female.
Table 4.2
Gender Frequency Percent
Male 223 87.5
Female 32 12.5
Total 255 100.0
Chart 4.2
87% 13%13%
Gender DistributionMale Female

115
4.2.3 Marital Status
The respondents were asked to specify their marital status according to the
distribution criteria displayed in the questionnaire. The table and graph mentioned
below show that majority of respondents i.e. 63.1 per cent were married while
36.9 per cent were unmarried.
Table 4.3
Marital Status Frequency Percent
Unmarried 94 36.9
Married 161 63.1
Total 255 100.0
Chart 4.3
Unmarried
Married
36.963.1
Marital StatusPercent

116
4.2.4 Qualification
Respondents indicated their educational qualification as mentioned in the
table and graph shown below. Maximum number of faculties i.e. 52.2 per cent
holds master degree. About 16 per cent completed their degree whilst nearly 32
per cent were having doctorate degree.
Table 4.4
Qualification Frequency Percent
PhD 82 32.2
Post Graduate 133 52.2
Graduate 40 15.7
Total 255 100.0
Chart 4.4
0.0
10.0
20.0
30.0
40.0
50.0
60.0
PhD Post Graduate Graduate
32.2
52.2
15.7
Faculty Qualification Distribution
Percent

117
4.2.5 Area of Specialization
The respondents were asked to indicate their Area of Specialization which
has been displayed in the following table and graph. Maximum number of
faculties i.e. 30.6 per cent was having Biology as their specialization. About 28
per cent belonged to Zoology, 17.6 per cent belonged to Chemistry whilst 14.5 per
cent belonged to Maths and only 9.4 per cent was of Physics specialization.
Table 4.5
Area Frequency Percent
Physics 24 9.4
Chemistry 45 17.6
Biology 78 30.6
Zoology 71 27.8
Maths 37 14.5
Total 255 100.0
Chart 4.5
9%
18%
31%
28%
14%
Area of SpecializationPhysics Chemistry Biology Zoology Maths

118
4.2.6 Experience
The respondents reported their experience as mentioned in the table and
graph shown below. Maximum number of faculties i.e. 58.4 per cent was having
experience of 1-7 years. About 25 per cent respondents were having 8-14 years
experience whilst only 16.5 per cent continued their service in this field for more
than 15 years.
Table 4.6
Experience Frequency Percent
1-7 Years 149 58.4
8-14 Years 64 25.1
15 Years & above 42 16.5
Total 255 100.0
Chart 4.6
0.010.020.030.040.050.060.0
1-7 Years8-14 Years
15 Years & above
58.4
25.116.5
Teaching Experience
Percent

119
4.2.7 Designation
The respondents were asked to indicate their position in their organization.
The table and graph show the distribution of respondents according to their
designation. Maximum number of faculties i.e. 81.2 per cent was having Faculty
position. About 12 per cent belonged to Training Faculty level whilst only 6.3 per
cent was of Assistant Faculty level.
Table 4.7
Designation Frequency Percent
Faculty 207 81.2
Assistant Faculty 16 6.3
Training Faculty 32 12.5
Total 255 100.0
Chart 4.7
0.010.020.030.040.050.060.070.080.090.0
FacultyAssistant Faculty Training
Faculty
81.2
6.312.5
Perc
enta
ge
Designation Distribution
Percent

120
4.2.8 Type of Family
The respondents reported the type of family they belonged to, which has
been displayed in the table and graph shown below. Maximum number of
faculties i.e. 43.9 per cent was having Nuclear family. About 37.6 per cent
belonged to joint family whilst only 18.4 per cent was having Extended family.
Table 4.8
Type of family Frequency Percent
Joint 96 37.6
Nuclear 112 43.9
Extended 47 18.4
Total 255 100.0
Chart 4.8
0.0
5.0
10.0
15.0
20.0
25.0
30.0
35.0
40.0
45.0
Joint Nuclear Extended
37.6
43.9
18.4
Type of Family
Percent

121
4.2.9 Number of Dependents
The respondents reported number of dependents as mentioned in the table
and graph shown below. Maximum number of faculties i.e. 40.8 per cent was
having 3-4 dependents. About 31 per cent respondents were having 1-2
dependents, 25.5 per cent having more than 4, whilst only 3.1 were not having any
dependent.
Table 4.9
Number of
Dependents Frequency Percent
No 8 3.1
1-2 78 30.6
3-4 104 40.8
More than 4 65 25.5
Total 255 100.0
Chart 4.9
0.0
10.0
20.0
30.0
40.0
50.0
No1-2
3-4More than 4
3.1
30.6
40.8
25.5
Number of Dependents
Percent

122
4.3 FACTORS AFFECTING STRESS AND JOB SATISFACTION
An extensive review of literature suggests that there are many factors which
directly or indirectly affect the extent of stress and job satisfaction of an
employee. In this study, the researcher has identified some factors that have been
segregated in three heads, namely, Personal factors, Family factors and Situational
factors. Further, extent of stress effects has also been bifurcated into- effects on
psychological health (measured by ORS scale) and effects on physiological health
(measured by Stress test). Both measurement tools have been mentioned the
Questionnaire, a copy of which is enclosed as annexure.
4.3.1 Personal Factors
The factors which have been considered among personal factors cover Age,
Gender, Qualification, Experience, Area of Specialization and Duration of illness.
4.3.1.1 Association of Stress and Job Satisfaction with Age
Table 4.10
Comparison of Mean Stress (ORS) on Basis of Age Group
Age
Group N Mean
Std.
Deviation F Sig.
21-40 151 3.0130 0.4774
22.7310 0.0000
41-60 83 2.7855 0.4282
Above 60 21 2.3064 0.6321
Total 255 2.8807 0.5156
One-way ANOVA applied, Significant
The above table shows the comparison of mean Stress score (measured by
ORS scale) of faculty members on the basis of their Age groups.
The difference among the three groups was found to be statistically
significant (P<0.05), showing that mean ORS score changes with age group. The

123
mean stress score is higher for age group 21-40 Years and it reduces with increase
in age and shows the lowest value for Above 60 Years age group.
To find out the pair wise comparison the Post hoc Tukey was applied.
Table 4.10 (a)
Post-hoc Tukey test
Pair-wise Comparison
Mean
Difference
(I-J)
Std.
Error P Value Result
21-40 41-60 0.2275 0.0651 0.0016 Significant
21-40 Above 60 0.7066 0.1110 0.0000 Significant
41-60 Above 60 0.4791 0.1164 0.0002 Significant
Based on the test, a statistically significant difference was seen between all
the pairs 21-40 Years & 41-60 Years, 21-40 Years & Above 60 Years and 41-60
Years & Above 60 Years age groups. (P>0.05), showing that mean Stress score
(measured by ORS scale) differs with age of faculty members.
Table 4.11
Comparison of Mean Stress on Basis of Age Group
Age
Group N Mean
Std.
Deviation F Sig.
21-40 151 3.2729 0.3594
11.1100 0.0000
41-60 83 3.1978 0.3562
Above 60 21 2.8631 0.5353
Total 255 3.2147 0.3900
One-way ANOVA applied, Significant
The above table shows the comparison of mean Stress score (measured by
Stress test) of faculty members on the basis of their Age groups.

124
The difference among the three groups was found to be statistically
significant (P>0.05), showing that mean Stress score varies with age group. The
mean stress score is almost equal for age group 21-40 and 41-60 years but it
reduces with increase in age and shows the lowest value for Above 60 Years age
group.
To find out the pair wise comparison the Post hoc Tukey was applied.
Table 4.11 (a)
Post-hoc Tukey test
Pair wise Comparison Mean
Difference
Std.
Error P value Result
21-40 41-60 0.0751 0.0513 0.3098 Non Sig
21-40 Above 60 0.4098 0.0874 0.0000 Significant
41-60 Above 60 0.3347 0.0917 0.0009 Significant
There was statistically non- significant difference between the pairs 21-40
Years & 41-60 Years, but significant difference between 21-40 Years & Above 60
Years and 41-60 Years & Above 60 Years age groups. (P>0.05).
Table 4.12
Comparison of Mean Job Satisfaction on Basis of Age Group
Age
Group N Mean
Std.
Deviation F Sig.
21-40 151 2.2685 0.5223
32.4460 0.0000 41-60 83 2.5377 0.5723
Above 60 21 3.2583 0.5977
Total 255 2.4376 0.6090
One-way ANOVA applied, Significant

125
The above table shows the comparison of mean Job Satisfaction Score of
faculty members on the basis of their Age groups.
The difference among the three groups was found to be statistically
significant (P<0.05), showing that mean Job satisfaction score changes with age
group. The mean job satisfaction score is lower for age group 21-40 years but it
increases with increase in age and shows the highest value for Above 60 Years
age group.
To find out the pair wise comparison the Post hoc Tukey was applied.
Table 4.12 (a)
Post-hoc Tukey test
Pairwise Comparison Mean
Difference
Std.
Error P value Result
21-40 41-60 -0.2691 0.0745 0.0011 Significant
21-40 Above 60 -0.9898 0.1270 0.0000 Significant
41-60 Above 60 -0.7207 0.1332 0.0000 Significant
There was statistically significant difference seen between all the pairs 21-
40 Years & 41-60 Years, 21-40 Years & Above 60 Years and 41-60 Years &
Above 60 Years age groups (P>0.05), showing that mean Job Satisfaction score
varies with the age of faculty members.
4.3.1.2 Association of Stress and Job Satisfaction with Gender
Table 4.13
Comparison of Mean Stress (ORS) on Basis of Gender
Gender N Mean Std. Deviation T Test P value
Male 223 2.8687 0.5393
0.9700
0.3260
Female 32 2.9647 0.2950
Total 255 2.8807 0.5156
One-way ANOVA applied, Non-Significant

126
The above table shows the comparison of mean Stress score (measured by
ORS scale) of faculty members on the basis of their Gender.
The difference between the groups was found to be statistically non-
significant (P>0.05), showing that mean ORS score does not change with gender
of faculty members.
Table 4.14
Comparison of Mean Stress on Basis of Gender
Gender N Mean Std.
Deviation T Test P value
Male 223 3.1900 0.3915
7.2640 0.0070 Female 32 3.3867 0.3370
Total 255 3.2147 0.3900
One-way ANOVA applied, Significant
The above table shows the comparison of mean Stress score (measured by
Stress test) of faculty members on the basis of their Gender.
The difference between the groups was found to be statistically significant
(P˂0.05), showing that mean Stress score of Male faculty members is
significantly lower than that of Female faculty members.
Table 4.15
Comparison of Mean Job Satisfaction on Basis of Gender
Gender N Mean Std.
Deviation T Test P value
Male 223 2.4689 0.6339
4.7640 0.0300 Female 32 2.2195 0.3242
Total 255 2.4376 0.6090
One-way ANOVA applied, Significant

127
The above table shows the comparison of mean Job Satisfaction Score of
faculty members on the basis of their Gender.
The difference between the groups was found to be statistically significant
(P<0.05), showing that mean Job satisfaction score for Male faculty members is
significantly more than that of female faculty members.
4.3.1.3 Association of Stress and Job Satisfaction with Qualification
Table 4.16
Comparison of Mean Stress (ORS) on Basis of Qualification
Qualification N Mean Std.
Deviation F Sig.
PhD 82 2.6291 0.3519
34.0570 0.0000
Post
Graduate 133 2.8920 0.4818
Graduate 40 3.3593 0.5657
Total 255 2.8807 0.5156
One-way ANOVA applied, Significant
The above table shows the comparison of mean Stress score (measured by
ORS scale) of faculty members on the basis of their Qualification.
The difference among the three groups was found to be statistically
significant (P<0.05), showing that mean ORS score changes with their
qualification. The mean stress score is higher for graduate respondents and it
reduces with increase in qualification and shows the lowest value for PhD holders.
To find out the pair wise comparison the Post hoc Tukey was applied.

128
Table 4.16 (a)
Post-hoc Tukey test
Pair wise Comparison Mean
Difference Std. Error P Value Result
PhD Post
Graduate -0.2629 0.0645 0.0002 Significant
PhD Graduate -0.7301 0.0886 0.0000 Significant
Post
Graduate Graduate -0.4673 0.0828 0.0000 Significant
Based on the test, a statistically significant difference was seen between all
the pairs. (P˂0.05), showing that mean Stress score (measured by ORS scale)
differs with qualification of faculty members.
Table 4.17
Comparison of Mean Stress on Basis of Qualification
Qualification N Mean Std.
Deviation F Sig.
PhD 82 3.0899 0.2431
6.4840 0.0020
Post
Graduate 133 3.2779 0.4313
Graduate 40 3.2604 0.4358
Total 255 3.2147 0.3900
One-way ANOVA applied, Significant
The above table shows the comparison of mean Stress score (measured by
Stress test) of faculty members on the basis of their qualification.
The difference among the three groups was found to be statistically
significant (P˂0.05), showing that mean Stress score varies with qualification of

129
faculty members. The mean stress scores of graduate and post graduate
respondents are almost equal but show the lowest value for PhD holders.
To find out the pair wise comparison the Post hoc Tukey was applied.
Table 4.17 (a)
Post-hoc Tukey test
Pair wise
Comparison
Mean
Difference Std. Error P Value Result
PhD Post
Graduate -0.1879 0.0536 0.0016 Significant
PhD Graduate -0.1705 0.0736 0.0556 Not
Significant
Post
Graduate Graduate 0.0175 0.0689 0.9652
Not
Significant
Based on the test, a statistically significant difference was seen between the
pair PhD & Post Graduate. (P>0.05), in case of pairs PhD & Graduate and Post
Graduate & Graduate, showing that Stress scores differ in these pairs.
Table 4.18
Comparison of Mean Job Satisfaction Score on Basis of Qualification
Qualification N Mean Std.
Deviation F Sig.
PhD 82 2.7390 0.5901
21.9660 0.0000
Post
Graduate 133 2.3671 0.5624
Graduate 40 2.0544 0.5133
Total 255 2.4376 0.6090
One-way ANOVA applied, Significant

130
The above table shows the comparison of mean Job Satisfaction Score of
faculty members on the basis of their qualifications.
The difference among the three groups was found to be statistically
significant (P<0.05), showing that mean Job satisfaction score changes with
qualification of faculty members.
To find out the pair wise comparison the Post hoc Tukey was applied.
Table 4.18 (a)
Post-hoc Tukey test
Pair wise
Comparison
Mean
Difference Std. Error P Value Result
PhD Post
Graduate 0.3719 0.0792 0.0000 Significant
PhD Graduate 0.6846 0.1088 0.0000 Significant
Post
Graduate Graduate 0.3127 0.1017 0.0066 Significant
Based on the test, a statistically significant difference was seen between all
the pairs. (P˂0.05), showing that mean Job Satisfaction score differs with faculty
members’ qualifications.
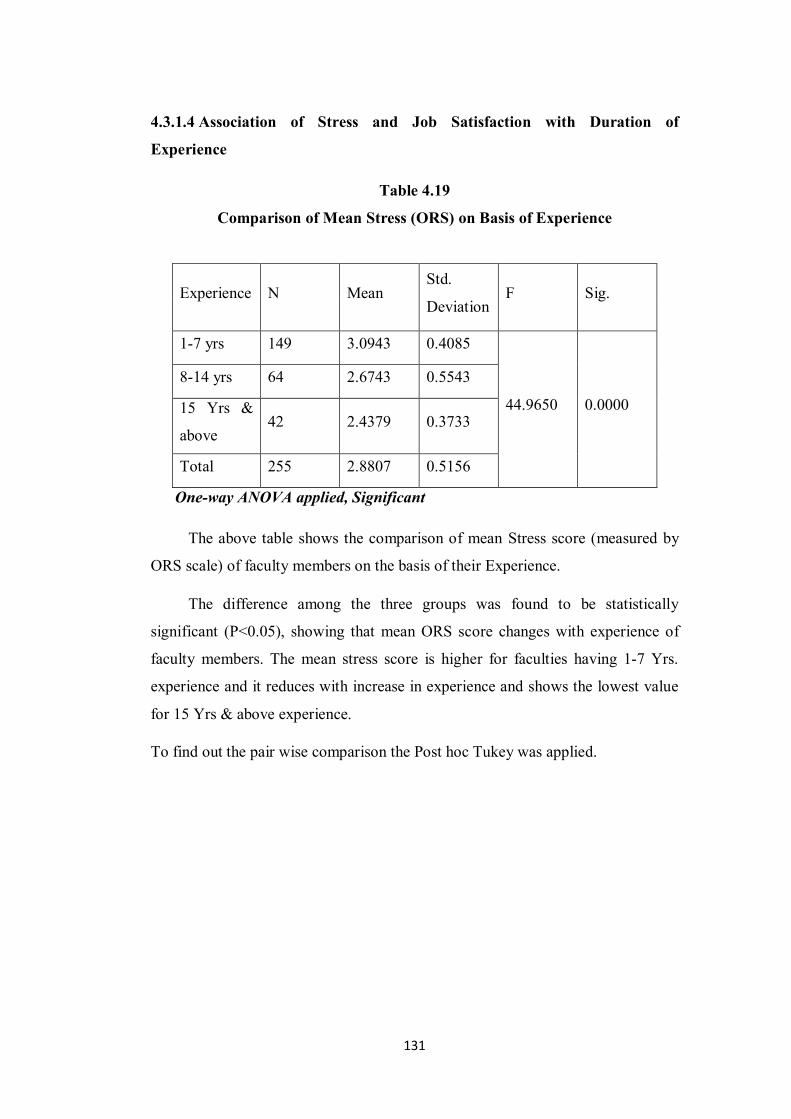
131
4.3.1.4 Association of Stress and Job Satisfaction with Duration of
Experience
Table 4.19
Comparison of Mean Stress (ORS) on Basis of Experience
Experience N Mean Std.
Deviation F Sig.
1-7 yrs 149 3.0943 0.4085
44.9650 0.0000
8-14 yrs 64 2.6743 0.5543
15 Yrs &
above 42 2.4379 0.3733
Total 255 2.8807 0.5156
One-way ANOVA applied, Significant
The above table shows the comparison of mean Stress score (measured by
ORS scale) of faculty members on the basis of their Experience.
The difference among the three groups was found to be statistically
significant (P<0.05), showing that mean ORS score changes with experience of
faculty members. The mean stress score is higher for faculties having 1-7 Yrs.
experience and it reduces with increase in experience and shows the lowest value
for 15 Yrs & above experience.
To find out the pair wise comparison the Post hoc Tukey was applied.

132
Table 4.19 (a)
Post-hoc Tukey test
Pair wise Comparison Mean
Difference
Std.
Error P Value Result
1-7 yrs 8-14 yrs 0.4200 0.0664 0.0000 Significant
1-7 yrs 15 Yrs &
above 0.6564 0.0776 0.0000 Significant
8-14 yrs 15 Yrs &
above 0.2364 0.0882 0.0214 Significant
Based on the test, a statistically significant difference was seen between all
the pairs. (P˂0.05), showing that mean Stress score (measured by ORS scale)
differs with experience of faculty members.
Table 4.20
Comparison of Mean Stress on Basis of Experience
Experience N Mean Std.
Deviation F Sig.
1-7 yrs 149 3.3571 0.2892
38.6630 0.0000
8-14 yrs 64 2.9089 0.4357
15 Yrs &
above 42 3.1756 0.3571
Total 255 3.2147 0.3900
One-way ANOVA applied, Significant
The above table shows the comparison of mean Stress score (measured by
Stress test) of faculty members on the basis of their Experience.
The difference among the three groups was found to be statistically
significant (P˂0.05), showing that mean Stress score varies with Experience. The

133
mean stress score is higher for faculties having 1-7 Yrs. Of experience and shows
the lowest value for 8-14 Yrs. of experience.
To find out the pair wise comparison the Post hoc Tukey was applied.
Table 4.20 (a)
Post-hoc Tukey test
Pair wise Comparison Mean
Difference
Std.
Error P Value Result
1-7 yrs 8-14 yrs 0.4482 0.0512 0.0000 Significant
1-7 yrs 15 Yrs &
above 0.1815 0.0598 0.0075 Significant
8-14 yrs 15 Yrs &
above -0.2668 0.0680 0.0003 Significant
Based on the test, a statistically significant difference was seen between all
the pairs. (P˂0.05), showing that mean Stress score differs with experience of
faculty members.
Table 4.21
Comparison of Mean Job Satisfaction on Basis of Experience
Experience N Mean Std.
Deviation F Sig.
1-7 yrs 149 2.1186 0.3678
97.7290 0.0000
8-14 yrs 64 2.7160 0.5755
15 Yrs &
above 42 3.1452 0.5448
Total 255 2.4376 0.6090
One-way ANOVA applied, Significant
The above table shows the comparison of mean Job Satisfaction Score of
faculty members on the basis of their Experience.

134
The difference among the three groups was found to be statistically
significant (P<0.05), showing that mean Job satisfaction score changes with
experience of faculty members. The mean job satisfaction score is higher for
respondents having experience of 15 Yrs. & above and shows the lowest value for
respondents having 1-7 Yrs. of experience.
To find out the pair wise comparison the Post hoc Tukey was applied.
Table 4.21 (a)
Post-hoc Tukey test
Pair wise Comparison Mean
Difference
Std.
Error P Value Result
1-7 yrs 8-14 yrs -0.5974 0.0686 0.0000 Significant
1-7 yrs 15 Yrs &
above -1.0266 0.0802 0.0000 Significant
8-14 yrs 15 Yrs &
above -0.4292 0.0911 0.0000 Significant
Based on the test, a statistically significant difference was seen between all
the pairs. (P˂0.05), showing that mean job satisfaction score differs with
experience of faculty members.

135
4.3.1.5 Association of Stress and Job Satisfaction with Area of Specialization
Table 4.22
Comparison of Mean Stress (ORS) on Basis of Area of Specialization
Area N Mean Std.
Deviation F Sig.
Physics 24 2.6667 0.4543
2.2870
0.0610
Chemistry 45 2.8304 0.6758
Biology 78 2.9872 0.4844
Zoology 71 2.9091 0.4945
Maths 37 2.8020 0.3769
Total 255 2.8807 0.5156
One-way ANOVA applied, Non- Significant
The above table shows the comparison of mean Stress score (measured by
ORS scale) of faculty members on the basis of their Area of Specialization.
The difference among the five groups was found to be statistically non-
significant (P>0.05), showing that mean ORS score does not change with Area of
Specialization. The mean stress score is higher for Biology faculties and shows
lowest value for Physics faculties.
To find out the pair wise comparison the Post hoc Tukey was applied.

136
Table 4.22 (a)
Post-hoc Tukey test
Pair wise Comparison Mean
Difference
Std.
Error P Value Result
Physics Chemistry -0.1637 0.1290 0.7104 Non Sig
Physics Biology -0.3205 0.1192 0.0583 Non Sig
Physics Zoology -0.2424 0.1205 0.2637 Non Sig
Physics Maths -0.1353 0.1338 0.8500 Non Sig
Chemistry Biology -0.1568 0.0956 0.4730 Non Sig
Chemistry Zoology -0.0786 0.0973 0.9278 Non Sig
Chemistry Maths 0.0284 0.1133 0.9991 Non Sig
Biology Zoology 0.0781 0.0837 0.8839 Non Sig
Biology Maths 0.1852 0.1019 0.3658 Non Sig
Zoology Maths 0.1071 0.1035 0.8391 Non Sig
Based on the test, statistically non-significant difference was seen between
all the pairs of areas of specialization. (P>0.05), showing that mean Stress score
(measured by ORS scale) does not differ with faculty’s area of specialization.
Table 4.23
Comparison of Mean Stress on Basis of Area of Specialization
Area N Mean Std.
Deviation F Sig.
Physics 24 2.9861 0.4113
38.3240 0.0000
Significant
Chemistry 45 3.3472 0.3392
Biology 78 3.5160 0.2817
Zoology 71 3.0264 0.2632
Maths 37 2.9279 0.3349
Total 255 3.2147 0.3900

137
The above table shows the comparison of mean Stress score (measured by
Stress test) of faculty members on the basis of their Area of Specialization.
The difference among the three groups was found to be statistically
significant (P˂0.05), showing that mean Stress score varies with Area of
Specialization. The mean stress score is higher for Biology faculties and shows
the lowest value for Maths faculties.
To find out the pair wise comparison the Post hoc Tukey was applied.
Table 4.23 (a)
Post-hoc Tukey test
Pair wise Comparison Mean
Difference
Std.
Error P Value Result
Physics Chemistry -0.3611 0.0782 0.0001 Significant
Physics Biology -0.5299 0.0723 0.0000 Significant
Physics Zoology -0.0403 0.0731 0.9817 Non Sig
Physics Maths 0.0582 0.0811 0.9524 Non Sig
Chemistry Biology -0.1688 0.0579 0.0317 Significant
Chemistry Zoology 0.3208 0.0590 0.0000 Significant
Chemistry Maths 0.4193 0.0687 0.0000 Significant
Biology Zoology 0.4896 0.0508 0.0000 Significant
Biology Maths 0.5881 0.0618 0.0000 Significant
Zoology Maths 0.0985 0.0628 0.5186 Non Sig
Based on the test, statistically non-significant difference was seen (P>0.05)
between the pairs Physics –Zoology, Physics- Maths & Zoology-Maths. In case of
remaining pairs, a statistical significant difference was found (P˂0.05), showing
that mean Stress score (measured by Stress test) differs between these areas of
specialization.

138
Table 4.24
Comparison of Mean Job Satisfaction on Basis of Area of Specialization
Area N Mean Std.
Deviation F Sig.
Physics 24 2.7000 0.5679
6.1130 0.0000
Significant
Chemistry 45 2.6922 0.8287
Biology 78 2.2436 0.5695
Zoology 71 2.3504 0.4730
Maths 37 2.5345 0.4578
Total 255 2.4376 0.6090
The above table shows the comparison of mean Job Satisfaction Score of
faculty members on the basis of their Areas of Specialization.
The difference among these groups was found to be statistically significant
(P<0.05), showing that mean Job satisfaction score changes with areas of
specialization. The mean job satisfaction score is higher for Physics faculties and
shows lowest value for Biology faculties.
To find out the pair wise comparison the Post hoc Tukey was applied.

139
Table 4.24 (a)
Post-hoc Tukey test
Pair wise Comparison Mean
Difference
Std.
Error P Value Result
Physics Chemistry 0.0078 0.1481 1.0000 Non Sig
Physics Biology 0.4564 0.1368 0.0086 Significant
Physics Zoology 0.3496 0.1383 0.0878 Non Sig
Physics Maths 0.1655 0.1536 0.8177 Non Sig
Chemistry Biology 0.4486 0.1097 0.0006 Significant
Chemistry Zoology 0.3419 0.1116 0.0204 Significant
Chemistry Maths 0.1578 0.1300 0.7436 Non Sig
Biology Zoology -0.1068 0.0961 0.8007 Non Sig
Biology Maths -0.2909 0.1170 0.0968 Non Sig
Zoology Maths -0.1841 0.1188 0.5311 Non Sig
Based on the test, a statistically significant difference was seen (P˂0.05)
between the pairs Physics-Biology, Chemistry-Biology & Chemistry- Zoology. In
case of remaining pairs, statistical non-significant difference (P>0.05) was found,
showing that mean Job Satisfaction score does not differ between these
specialization.

140
4.3.1.6 Association of Stress and Job Satisfaction with Duration of Illness
Table 4.25
Comparison of Mean Stress (ORS) on Basis of Duration of Illness
Duration N Mean Std.
Deviation F Sig.
Less than
1yr 127 2.5149 0.3044
223.2470 0.0000 1-10 yrs 86 3.0554 0.3427
11-20 yrs 42 3.6294 0.2565
Total 255 2.8807 0.5156
One-way ANOVA applied, Significant
The above table shows the comparison of mean Stress score (measured by
ORS scale) of faculty members on the basis of their Duration of Illness.
The difference among the three groups was found to be statistically
significant (P<0.05), showing that mean ORS score changes with their extent of
illness. The mean stress score is higher for respondents having illness for 11-20
Yrs and shows the lowest value for less than 1 year.
To find out the pair wise comparison the Post hoc Tukey was applied.
Table 4.25 (a)
Post-hoc Tukey test
Pair wise Comparison Mean
Difference
Std.
Error P Value Result
Less than
1yr 1-10 yrs -0.2221 0.0499 0.0000 Significant
Less than
1yr 11-20 yrs -0.4265 0.0636 0.0000 Significant
1-10 yrs 11-20 yrs -0.2044 0.0672 0.0073 Significant

141
Based on the test, a statistically significant difference was seen between all
the pairs, showing that mean Stress score (measured by ORS scale) differs with
duration of illness of faculty members.
Table 4.26
Comparison of Mean Stress on Basis of Duration of Illness
Duration N Mean Std.
Deviation F Sig.
Less than
1yr 127 3.0696 0.4271
25.5260 0.0000 1-10 yrs 86 3.2917 0.2941
11-20 yrs 42 3.4960 0.2088
Total 255 3.2147 0.3900
One-way ANOVA applied, Significant
The above table shows the comparison of mean Stress score (measured by
Stress test) of faculty members on the basis of their illness duration.
The difference among the three groups was found to be statistically
significant (P˂0.05), showing that mean Stress score varies with their extent of
illness. The mean stress score is higher for respondents having illness for 11-20
Yrs. and shows the lowest value for less than 1 year.
To find out the pair wise comparison the Post hoc Tukey was applied.

142
Table 4.26 (a)
Post-hoc Tukey test
Pair wise Comparison Mean
Difference
Std.
Error P Value Result
Less than
1yr 1-10 yrs -0.5405 0.0434 0.0000 Significant
Less than
1yr 11-20 yrs -1.1145 0.0553 0.0000 Significant
1-10 yrs 11-20 yrs -0.5740 0.0585 0.0000 Significant
Based on the test, a statistically significant difference was seen between all
the pairs. (P˂0.05), showing that mean Stress score (measured by Stress test)
differs with duration of illness of faculty members.
Table 4.27
Comparison of Mean Job Satisfaction on Basis of Duration of Illness
Duration N Mean Std.
Deviation F Sig.
Less than
1yr 127 2.8724 0.5171
160.1950 0.0000 1-10 yrs 86 2.1430 0.2886
11-20 yrs 42 1.7262 0.1318
Total 255 2.4376 0.6090
One-way ANOVA applied, Significant
The above table shows the comparison of mean Job Satisfaction Score of
faculty members on the basis of their illness duration.
The difference among the three groups was found to be statistically
significant (P<0.05), showing that mean Job satisfaction score changes with extent
of illness of faculty members. The mean job satisfaction score is higher for

143
respondents having illness for less than 1 year and shows the lowest value for 11-
20 years.
To find out the pair wise comparison the Post hoc Tukey was applied.
Table 4.27 (a)
Post-hoc Tukey test
Pair wise Comparison Mean
Difference
Std.
Error P Value Result
Less than
1yr 1-10 yrs 0.7294 0.0567 0.0000 Significant
Less than
1yr 11-20 yrs 1.1463 0.0722 0.0000 Significant
1-10 yrs 11-20 yrs 0.4168 0.0764 0.0000 Significant
Based on the test, a statistically significant difference was seen between all
the pairs. (P˂0.05), showing that mean Job Satisfaction score differs with duration
of illness of faculty members.
Validation of Hypothesis:
H01: The extent of stress-effects felt by faculty members does not differ by
personal factors.
H11: The extent of stress-effects felt by faculty members differs by personal
factors.
The extent of stress-effects (measured by ORS) felt by faculty members was
found to be significantly different due to personal factors including their age,
gender, qualification, experience, duration of illness etc. However, in case of one
factor i.e. Area of Specialization; no significant difference was observed among
the faculty members belonging to different areas of specialization about the
impact of stress on their psychological health.

144
Hence, null hypothesis got rejected and alternate hypothesis stood
accepted that the extent of stress-effects felt by faculty members differs by
personal factors.
4.3.2 Family Factors
The factors which have been considered among family factors include
Marital Status, Type of Family and Number of Dependents.
4.3.2.1 Association of Stress and Job Satisfaction with Marital Status
Table 4.28
Comparison of Mean Stress (ORS) on Basis of Marital Status
Marital
Status N Mean
Std.
Deviation T Test P value
Unmarried 94 2.5634 0.4227
72.2280 0.0000 Married 161 3.0660 0.4738
Total 255 2.8807 0.5156
One-way ANOVA applied, Significant
The above table shows the comparison of mean Stress score (measured by
ORS scale) of faculty members on the basis of their Marital Status.
The difference between the groups was found to be statistically significant
(P˂0.05), showing that mean ORS score varies with marital status of faculty
members. The mean stress score is higher for married respondents as compared to
unmarried respondents.

145
Table 4.29
Comparison of Mean Stress on Basis of Marital Status
Marital
Status N Mean
Std.
Deviation T Test P value
Unmarried 94 3.0971 0.4431
14.2500 0.0000 Married 161 3.2834 0.3384
Total 255 3.2147 0.3900
One-way ANOVA applied, Significant
The above table shows the comparison of mean Stress score (measured by
Stress test) of faculty members on the basis of their Marital Status.
The difference between the groups was found to be statistically significant
(P˂0.05), showing that mean Stress score varies with marital status of faculty
members. The mean stress score is higher for married respondents as compared to
unmarried respondents.
Table 4.30
Comparison of Mean Job satisfaction score on Basis of Marital Status
Marital
Status N Mean
Std.
Deviation T Test P value
Unmarried 94 2.8282 0.6160
80.3500 0.0000 Married 161 2.2096 0.4757
Total 255 2.4376 0.6090
One-way ANOVA applied, Significant
The above table shows the comparison of mean Job Satisfaction Score of
faculty members on the basis of their Marital Status.
The difference between the groups was found to be statistically significant
(P<0.05), showing that mean Job satisfaction score changes with marital status of
faculty members. The mean job satisfaction score is higher for unmarried
respondents as compared to married respondents.

146
4.3.2.2 Association of Stress and Job Satisfaction with Type of Family
Table 4.31
Comparison of Mean Stress (ORS) on Basis of Type of Family
Family
Type N Mean
Std.
Deviation F Sig.
Joint 96 2.4572 0.3255
91.5410 0.0000 Nuclear 112 3.0907 0.3798
Extended 47 3.2456 0.5323
Total 255 2.8807 0.5156
One-way ANOVA applied, Significant
The above table shows the comparison of mean Stress score (measured by
ORS scale) of faculty members on the basis of their Family type.
The difference among the three groups was found to be statistically
significant (P<0.05), showing that mean ORS score changes with their family
type. The mean stress score is higher for respondents having extended family and
shows the lowest value for nuclear family.
To find out the pair wise comparison the Post hoc Tukey was applied.
Table 4.31 (a)
Post-hoc Tukey test
Pair wise Comparison Mean
Difference
Std.
Error P Value Result
Joint Nuclear -0.6335 0.0548 0.0000 Significant
Joint Extended -0.7884 0.0701 0.0000 Significant
Nuclear Extended -0.1550 0.0685 0.0629 Non
Significant

147
Based on the test, a statistically significant difference was seen between the
pairs Joint & Nuclear and Joint & Extended. (P>0.05), in case of the pair Nuclear
& Extended, showing that mean Stress score (measured by ORS scale) differs
within it.
Table 4.32
Comparison of Mean Stress on Basis of Type of Family
Family
Type N Mean
Std.
Deviation F Sig.
Joint 96 3.0898 0.4664
9.5320 0.0000 Nuclear 112 3.2612 0.2914
Extended 47 3.3591 0.3560
Total 255 3.2147 0.3900
One-way ANOVA applied, Significant
The above table shows the comparison of mean Stress score (measured by
Stress test) of faculty members on the basis of their family type.
The difference among the three groups was found to be statistically
significant (P˂0.05), showing that mean Stress score varies with family type of
faculty members. The mean stress score is higher for respondents having extended
family and shows the lowest value for nuclear family.
To find out the pair wise comparison the Post hoc Tukey was applied.

148
Table 4.32 (a)
Post-hoc Tukey test
Pair wise Comparison Mean
Difference
Std.
Error P Value Result
Joint Nuclear -0.1713 0.0525 0.0036 Significant
Joint Extended -0.2692 0.0672 0.0002 Significant
Nuclear Extended -0.0979 0.0656 0.2965 Non
Significant
Based on the test, a statistically significant difference was seen between the
pairs Joint & Nuclear and Joint & Extended. (P>0.05), in case of the pair Nuclear
& Extended, showing that mean Stress score (measured by Stress test) differs
within it.
Table 4.33
Comparison of Mean Job satisfaction on Basis of Type of Family
Family
Type N Mean
Std.
Deviation F Sig.
Joint 96 3.0180 0.4874
154.8110 0.0000 Nuclear 112 2.1025 0.3422
Extended 47 2.0511 0.3819
Total 255 2.4376 0.6090
One-way ANOVA applied, Significant
The above table shows the comparison of mean Job Satisfaction Score of
faculty members on the basis of their family type.
The difference among the three groups was found to be statistically
significant (P<0.05), showing that mean Job satisfaction score changes with
family type of faculty members. The mean job satisfaction score is higher for
respondents having joint family and shows the lowest value for extended family.
To find out the pair wise comparison the Post hoc Tukey was applied.

149
Table 4.33 (a)
Post-hoc Tukey test
Pair wise Comparison Mean
Difference
Std.
Error P Value Result
Joint Nuclear 0.9155 0.0570 0.0000 Significant
Joint Extended 0.9669 0.0729 0.0000 Significant
Nuclear Extended 0.0514 0.0712 0.7507 Non
Significant
Based on the test, a statistically significant difference was seen between the
pairs Joint & Nuclear and Joint & Extended. (P>0.05), in case of the pair Nuclear
& Extended, showing that mean Job Satisfaction score differs within it.
4.3.2.3 Association of Stress and Job Satisfaction with Number of Dependents
Table 4.34
Comparison of Mean Stress (ORS) on Basis of Number of Dependents
Number Of
Dependents N Mean
Std.
Deviation F Sig.
No 8 2.0544 0.2426
85.1730 0.0000
1-2 78 2.4983 0.3334
3-4 104 2.9106 0.3537
more than
4 65 3.3937 0.4258
Total 255 2.8807 0.5156
One-way ANOVA applied, Significant

150
The above table shows the comparison of mean Stress score (measured by
ORS scale) of faculty members on the basis of number of dependents they have.
The difference among the three groups was found to be statistically
significant (P<0.05), showing that mean ORS score changes with number of their
dependents. The mean stress score is higher for respondents having more than 4
dependents and shows the lowest value for respondents having no dependent.
To find out the pair wise comparison the Post hoc Tukey was applied.
Table 4.34 (a)
Post-hoc Tukey test
Pair wise Comparison Mean
Difference
Std.
Error P Value Result
No 1-2 -0.4440 0.1355 0.0066 Significant
No 3-4 -0.8562 0.1340 0.0000 Significant
No more than
4 -1.3393 0.1368 0.0000 Significant
1-2 3-4 -0.4122 0.0547 0.0000 Significant
1-2 more than
4 -0.8953 0.0613 0.0000 Significant
3-4 more than
4 -0.4831 0.0577 0.0000 Significant
Based on the test, a statistically significant difference was seen between all
the pairs. (P˂0.05), showing that mean Stress score (measured by ORS scale)
differs with number of dependents faculty members have.

151
Table 4.35
Comparison of Mean Stress on Basis of Number of Dependents
Number Of
Dependents N Mean
Std.
Deviation F Sig.
No 24 2.6198 0.4344
27.2660 0.0000
1-2 45 3.0897 0.3911
3-4 78 3.1759 0.3143
more than
4 71 3.5000 0.3028
Total 255 3.2147 0.3900
One-way ANOVA applied, Significant
The above table shows the comparison of mean Stress score (measured by
Stress test) of faculty members on the basis of number of their dependents.
The difference among the three groups was found to be statistically
significant (P˂0.05), showing that mean Stress score varies with number of
dependents faculty members have. The mean stress score is higher for respondents
having more than 4 dependents and shows the lowest value for respondents
having no dependent.
To find out the pair wise comparison the Post hoc Tukey was applied.

152
Table 4.35 (a)
Post-hoc Tukey test
Pair wise Comparison Mean
Difference
Std.
Error P Value Result
No 1-2 -0.4700 0.1265 0.0014 Significant
No 3-4 -0.5561 0.1250 0.0001 Significant
No more than
4 -0.8802 0.1277 0.0000 Significant
1-2 3-4 -0.0861 0.0510 0.3324 Non Sig
1-2 more than
4 -0.4103 0.0572 0.0000 Significant
3-4 more than
4 -0.3241 0.0539 0.0000 Significant
Based on the test, a statistically significant difference was seen between all
the pairs except the pair 1-2 & 3-4, showing that Stress score differs in case of all
the pairs except the pair 1-2 & 3-4 where the score does not differ.
Table 4.36
Comparison of Mean Job Satisfaction Score on Basis of Number of
Dependents
Number Of
Dependents N Mean
Std.
Deviation F Sig.
No 24 3.6063 0.0372
103.9250 0.0000
1-2 45 2.9442 0.5246
3-4 78 2.3108 0.3897
more than
4 71 1.8888 0.2845
Total 255 2.4376 0.6090
One-way ANOVA applied, Significant

153
The above table shows the comparison of mean Job Satisfaction Score of
faculty members on the basis of number of dependents they have.
The difference among the three groups was found to be statistically
significant (P<0.05), showing that mean Job satisfaction score changes with
number of dependents they have. The mean job satisfaction score is higher for
respondents having no dependent and shows the lowest value for respondents
having more than 4 dependents.
To find out the pair wise comparison the Post hoc Tukey was applied.
Table 4.36 (a)
Post-hoc Tukey test
Pair wise Comparison Mean
Difference
Std.
Error P Value Result
No 1-2 0.6620 0.1519 0.0001 Significant
No 3-4 1.2954 0.1501 0.0000 Significant
No more than
4 1.7174 0.1533 0.0000 Significant
1-2 3-4 0.6334 0.0613 0.0000 Significant
1-2 more than
4 1.0554 0.0687 0.0000 Significant
3-4 more than
4 0.4220 0.0647 0.0000 Significant
Based on the test, a statistically significant difference was seen between all
the pairs. (P˂0.05), showing that mean Job Satisfaction score differs with faculty
members’ number of dependents.
Validation of Hypothesis:
H02: The extent of stress-effects felt by faculty members does not differ by
family factors.

154
H12: The extent of stress-effects felt by faculty members differs by family
factors.
The extent of stress-effects felt by faculty members was found to be
significantly different due to family factors including their marital status, type of
family, no. of dependents etc.
Hence, null hypothesis got rejected and alternate hypothesis got
accepted that extent of stress-effects felt by faculty members differs by family
factors.
4.3.3 Situational Factors
The factors which have been considered among situational factors cover
Designation, Hours spent at workplace, Income, Frequency of Health Check-up,
Health Status, Severity of Illness, Having Meal on Time, Job Timings, and Type
of Treatment.
4.3.3.1 Association of Stress and Job Satisfaction with Faculty Designation
Table 4.37
Comparison of Mean Stress (ORS) on Basis of Faculty Designation
Designation N Mean Std.
Deviation F Sig.
Faculty 207 2.8632 0.5394
14.2780
0.0000
Assistant
Faculty 16 3.4783 0.1260
Training
faculty 32 2.6956 0.1233
Total 255 2.8807 0.5156
One-way ANOVA applied, Significant
The above table shows the comparison of mean Stress score (measured by
ORS scale) of faculty members on the basis of their Designation.

155
The difference among the three groups was found to be statistically
significant (P<0.05), showing that mean ORS score changes with Faculty
Designation. The mean stress score is higher for Assistant faculties and shows the
lowest value for Training faculties.
To find out the pair wise comparison the Post hoc Tukey was applied.
Table 4.37 (a)
Post-hoc Tukey test
Pair wise Comparison Mean
Difference
Std.
Error
P
Value Result
Faculty Assistant
Faculty -0.6151 0.1273 0.0000 Significant
Faculty Training
Faculty 0.1675 0.0932 0.1724 Non Sig
Assistant
faculty
Training
Faculty 0.7826 0.1502 0.0000 Significant
Based on the test, a statistically significant difference was seen between the
pairs Faculty & Assistant Faculty and Assistant Faculty & Training Faculty. In
case of pair Faculty & Training Faculty, statistically non-significant difference
was found (P>0.05), showing that mean Stress score (measured by ORS scale)
does not differ only within this pair.

156
Table 4.38
Comparison of Mean Stress on Basis of Faculty Designation
Designation N Mean Std.
Deviation F Sig.
Faculty 207 3.2371 0.3849
27.4510
0.0000
Assistant
Faculty 16 3.6328 0.0313
Training
faculty 32 2.8607 0.1965
Total 255 3.2147 0.3900
One-way ANOVA applied, Significant
The above table shows the comparison of mean Stress score (measured by
Stress test) of faculty members on the basis of their Designation.
The difference among the three groups was found to be statistically
significant (P˂0.05), showing that mean Stress score varies with their designation.
The mean stress score is higher for Assistant faculties and shows the lowest value
for training faculties.
To find out the pair wise comparison the Post hoc Tukey was applied.
Table 4.38 (a)
Post-hoc Tukey test
Pair wise Comparison Mean
Difference
Std.
Error
P
Value Result
Faculty Ass. Faculty -0.3957 0.0921 0.0001 Significant
Faculty Training
Faculty 0.3764 0.0674 0.0000 Significant
Assistant
faculty
Training
Faculty 0.7721 0.1086 0.0000 Significant

157
Based on the test, a statistically significant difference was seen between all
the pairs. (P˂0.05), showing that mean Stress score (measured by Stress test)
differs with designation of faculty members.
Table 4.39
Comparison of Mean Job Satisfaction on Basis of Faculty Designation
Designation N Mean Std.
Deviation F Sig.
Faculty 207 2.4614 0.6374
12.6280
0.0000
Assistant
Faculty 16 1.7594 0.1129
Training
faculty 32 2.6234 0.2370
Total 255 2.4376 0.6090
One-way ANOVA applied, Significant
The above table shows the comparison of mean Job Satisfaction Score of
faculty members on the basis of their Designation.
The difference among the three groups was found to be statistically
significant (P<0.05), showing that mean Job satisfaction score changes with their
designation. The mean job satisfaction score is higher for training faculties and
shows the lowest value for Assistant faculties.
To find out the pair wise comparison the Post hoc Tukey was applied.
Table 4.39 (a)
Post-hoc Tukey test
Pair wise Comparison Mean
Difference Std. Error
P
Value Result
Faculty Assistant Faculty 0.7020 0.1513 0.0000 Significant
Faculty Training Faculty -0.1621 0.1107 0.3101 Non Sig
Assistant
faculty Training Faculty -0.8641 0.1785 0.0000 Significant

158
Based on the test, a statistically significant difference was seen between the
pairs Faculty & Assistant Faculty and Assistant Faculty & Training Faculty. In
case of pair Faculty & Training Faculty, statistically non-significant difference
was found (P>0.05), showing that mean Job Satisfaction score does not differ only
within this pair.
4.3.3.2 Association of Stress and Job Satisfaction with Working Hours
Table 4.40
Comparison of Mean Stress (ORS) on Basis of Working Hours
Hours Spent N Mean Std.
Deviation F Sig.
5-6 Hrs 65 2.4562 0.4036
131.8080 0.0000
7-8 Hrs 128 2.8071 0.3241
More than 8
Hrs 62 3.4779 0.3892
Total 255 2.8807 0.5156
One-way ANOVA applied, Significant
The above table shows the comparison of mean Stress score (measured by
ORS scale) of faculty members on the basis of their working hours.
The difference among the three groups was found to be statistically
significant (P<0.05), showing that mean ORS score changes with working hours
of faculty members. The mean stress score is lower for faculties spending 5-6 Hrs
but it increases with increase in number of hours and shows the highest value for
More than 8 Hrs group.
To find out the pair wise comparison the Post hoc Tukey was applied.

159
Table 4.40 (a)
Post-hoc Tukey test
Pair wise Comparison Mean
Difference
Std.
Error P Value Result
5-6 Hrs 7-8 Hrs -0.3509 0.0551 0.0000 Significant
5-6 Hrs More than 8
Hrs -1.0217 0.0642 0.0000 Significant
7-8 Hrs More than 8
Hrs -0.6709 0.0560 0.0000 Significant
Based on the test, a statistically significant difference was seen between all
the pairs. (P˂0.05), showing that mean Stress score (measured by ORS scale)
differs with working hours of faculty members.
Table 4.41
Comparison of Mean Stress on Basis of Working Hours
Hours Spent N Mean Std.
Deviation F Sig.
5-6 Hrs 65 3.1789 0.4582
15.2240 0.0000
7-8 Hrs 128 3.1253 0.3354
More than 8
Hrs 62 3.4368 0.3327
Total 255 3.2147 0.3900
One-way ANOVA applied, Significant
The above table shows the comparison of mean Stress score (measured by
Stress test) of faculty members on the basis of their working hours.
The difference among the three groups was found to be statistically
significant (P˂0.05), showing that mean Stress score varies with number of
working hours by faculty members. The mean stress score is lower for faculties

160
spending 7-8 Hrs but it increases but shows the highest value for More than 8 Hrs
group.
To find out the pair wise comparison the Post hoc Tukey was applied.
Table 4.41 (a)
Post-hoc Tukey test
Pair wise Comparison Mean
Difference
Std.
Error
P
Value Result
5-6 Hrs 7-8 Hrs 0.0535 0.0563 0.6091 Non
Significant
5-6 Hrs More than 8
Hrs -0.2580 0.0657 0.0003 Significant
7-8 Hrs More than 8
Hrs -0.3115 0.0572 0.0000 Significant
Based on the test, a statistically significant difference was seen between the
pairs 5-6 Hrs & More than 8 Hrs and 7-8 Hrs & More than 8 Hrs. (P>0.05), in
case of the pair 5-6 Hrs & 7-8 Hrs, showing that mean Stress score differs only
within it.
Table 4.42
Comparison of Mean Job Satisfaction Score on Basis of Working Hours
Hours Spent N Mean Std.
Deviation F Sig.
5-6 Hrs 65 3.0150 0.5948
107.9270 0.0000
7-8 Hrs 128 2.4316 0.4053
More than 8
Hrs 62 1.8448 0.3445
Total 255 2.4376 0.6090
One-way ANOVA applied, Significant

161
The above table shows the comparison of mean Job Satisfaction Score of
faculty members on the basis of their working hours.
The difference among the three groups was found to be statistically
significant (P<0.05), showing that mean Job satisfaction score changes with
working hours of faculty members. The mean job satisfaction score is lower for
faculties spending More than 8 Hrs but it decreases with increase in number of
hours and shows the highest value for 5-6 Hrs group.
To find out the pair wise comparison the Post hoc Tukey was applied.
Table 4.42 (a)
Post-hoc Tukey test
Pair wise Comparison Mean
Difference
Std.
Error
P
Value Result
5-6 Hrs 7-8 Hrs 0.5834 0.0683 0.0000 Significant
5-6 Hrs More than 8
Hrs 1.1702 0.0797 0.0000 Significant
7-8 Hrs More than 8
Hrs 0.5869 0.0694 0.0000 Significant
Based on the test, a statistically significant difference was seen between all
the pairs. (P>0.05), showing that mean Job Satisfaction score differs with number
of working hours spent by faculty members.

162
4.3.3.3 Association of Stress and Job Satisfaction with Income
Table 4.43
Comparison of Mean Stress (ORS) on Basis of Income
Income N Mean Std.
Deviation F Sig.
30000-50000 14 3.8603 0.2757
66.1620 0.0000 50000-70000 60 3.1602 0.4440
Above 70000 181 2.7124 0.4194
Total 255 2.8807 0.5156
One-way ANOVA applied, Significant
The above table shows the comparison of mean Stress score (measured by
ORS scale) of faculty members on the basis of their Income.
The difference among the three groups was found to be statistically
significant (P<0.05), showing that mean ORS score changes with income of
faculty members. The mean stress score is lower for faculties having income
Above Rs.70000 but it increases with decrease in income and shows the highest
value for Rs. 30000-50000 groups.
To find out the pair wise comparison the Post hoc Tukey was applied.
Table 4.43 (a)
Post-hoc Tukey test
Pair wise Comparison Mean
Difference
Std.
Error P Value Result
30000-50000 50000-70000 0.7001 0.1244 0.0000 Significant
30000-50000 Above 70000 1.1479 0.1163 0.0000 Significant
50000-70000 Above 70000 0.4478 0.0624 0.0000 Significant

163
Based on the test, a statistically significant difference was seen between all
the pairs. (P˂0.05), showing that mean Stress score (measured by ORS scale)
differs with income of faculty members.
Table 4.44
Comparison of Mean Stress on Basis of Income
Income N Mean Std.
Deviation F Sig.
30000-50000 14 3.5119 0.3311
14.9160 0.0000 50000-70000 60 3.3840 0.3872
Above 70000 181 3.1356 0.3673
Total 255 3.2147 0.3900
One-way ANOVA applied, Significant
The above table shows the comparison of mean Stress score (measured by
Stress test) of faculty members on the basis of their Income.
The difference among the three groups was found to be statistically
significant (P˂0.05), showing that mean Stress score varies with income of faculty
members. The mean stress score is lower for faculties having income Above
Rs.70000 but it increases with decrease in income and shows the highest value for
Rs. 30000-50000 groups.
To find out the pair wise comparison the Post hoc Tukey was applied.
Table 4.44 (a)
Post-hoc Tukey test
Pair wise Comparison Mean
Difference
Std.
Error
P
Value Result
30000-50000 50000-70000 0.1279 0.1099 0.4760 Non Significant
30000-50000 Above 70000 0.3763 0.1027 0.0009 Significant
50000-70000 Above 70000 0.2484 0.0552 0.0000 Significant

164
Based on the test, a statistically significant difference was seen between the
pairs 30000-50000 & Above 70000, 50000-70000 & Above 70000. (P>0.05), in
case of the pair 30000-50000 & 50000-70000 showing that mean Stress score
differs only within it.
Table 4.45
Comparison of Mean Job Satisfaction Score on Basis of Income
Income N Mean Std. Deviation F Sig.
30000-50000 14 1.7714 0.1417
35.1790 0.0000
50000-70000 60 2.0579 0.4293
Above
70000 181 2.6151 0.5893
Total 255 2.4376 0.6090
One-way ANOVA applied, Significant
The above table shows the comparison of mean Job Satisfaction Score of
faculty members on the basis of their Income.
The difference among the three groups was found to be statistically
significant (P<0.05), showing that mean Job satisfaction score changes with
income of faculty members. The mean job satisfaction score is the highest for
faculties having income Above Rs.70000 but it decreases with decrease in income
and shows the lowest value for Rs. 30000-50000 group.
To find out the pair wise comparison the Post hoc Tukey was applied.

165
Table 4.45 (a)
Post-hoc Tukey test
Pair wise Comparison Mean
Difference
Std.
Error
P
Value Result
30000-50000 50000-70000 -0.2865 0.1605 0.1765 Non
Significant
30000-50000 Above
70000 -0.8436 0.1500 0.0000 Significant
50000-70000 Above
70000 -0.5571 0.0805 0.0000 Significant
Based on the test, a statistically significant difference was seen between the
pairs 30000-50000 & Above 70000 and 50000-70000 & Above 70000. (P>0.05),
for the pair 30000-50000 & 50000-70000, showing Job Satisfaction score differs
only within it.
4.3.3.4 Association of Stress and Job Satisfaction with Frequency of Health
Check-up
Table 4.46
Comparison of Mean Stress (ORS) on Basis of Frequency of Health Check-
up
Health
Check-up N Mean
Std.
Deviation F Sig.
Quarterly 95 2.4384 0.2766
216.7250 0.0000
Half
Yearly 81 2.8610 0.2321
Yearly 79 3.4329 0.4133
Total 255 2.8807 0.5156
One-way ANOVA applied, Significant

166
The above table shows the comparison of mean Stress score (measured by
ORS scale) of faculty members on the basis of their frequency of health check-
ups.
The difference among the three groups was found to be statistically
significant (P<0.05), showing that mean ORS score changes with frequency of
health check-ups. The mean stress score is lower for faculties having quarterly
check-up but it increases with increase in frequency and shows the highest value
for faculties having Yearly check-up.
To find out the pair wise comparison the Post hoc Tukey was applied.
Table 4.46 (a)
Post-hoc Tukey test
Pair wise Comparison Mean
Difference
Std.
Error
P
Value Result
Quarterly Half Yearly -0.4225 0.0475 0.0000 Significant
Quarterly Yearly -0.9944 0.0478 0.0000 Significant
Half Yearly Yearly -0.5719 0.0496 0.0000 Significant
Based on the test, a statistically significant difference was seen between all
the pairs. (P˂0.05), showing that mean Stress score (measured by ORS scale)
differs with frequency of health check-ups by faculty members.
Table 4.47
Comparison of Mean Stress on Basis of Frequency of Health Check-up
Health
Check-up N Mean Std. Deviation F Sig.
Quarterly 95 3.0298 0.4285
24.6670 0.0000 Half Yearly 81 3.2407 0.2994
Yearly 79 3.4103 0.3180
Total 255 3.2147 0.3900
One-way ANOVA applied, Significant

167
The above table shows the comparison of mean Stress score (measured by
Stress test) of faculty members on the basis of their frequency of health check-
ups.
The difference among the three groups was found to be statistically
significant (P˂0.05), showing that mean Stress score varies with frequency of
health check-ups by faculty members. The mean stress score is lower for faculties
having quarterly check-up but it increases with increase in frequency and shows
the highest value for faculties having Yearly check-up.
To find out the pair wise comparison the Post hoc Tukey was applied.
Table 4.47 (a)
Post-hoc Tukey test
Pair wise Comparison Mean
Difference Std. Error
P
Value Result
Quarterly Half
Yearly -0.2109 0.0542 0.0004 Significant
Quarterly Yearly -0.3805 0.0545 0.0000 Significant
Half Yearly Yearly -0.1696 0.0566 0.0084 Significant
Based on the test, a statistically significant difference was seen between all
the pairs. (P˂0.05), showing that mean Stress score (measured by Stress test)
differs with frequency of health check-ups by faculty members.

168
Table 4.48
Comparison of Mean Job Satisfaction on Basis of Frequency of Health
Check-up
Health
Check-up N Mean
Std.
Deviation F Sig.
Quarterly 95 3.0208 0.4660
203.3460 0.0000 Half Yearly 81 2.2932 0.2902
Yearly 79 1.8845 0.3377
Total 255 2.4376 0.6090
One-way ANOVA applied, Significant
The above table shows the comparison of mean Job Satisfaction Score of
faculty members on the basis of their frequency of health check-ups.
The difference among the three groups was found to be statistically
significant (P<0.05), showing that mean Job satisfaction score changes with
frequency of health check-ups. The mean job satisfaction score is the highest for
faculties having quarterly check-up but it decreases with decrease in frequency
and shows the lowest value for faculties having Yearly check-up.
To find out the pair wise comparison the Post hoc Tukey was applied.
Table 4.48 (a)
Post-hoc Tukey test
Pair wise Comparison Mean
Difference
Std.
Error P Value Result
Quarterly Half Yearly 0.7276 0.0572 0.0000 Significant
Quarterly Yearly 1.1363 0.0576 0.0000 Significant
Half
Yearly Yearly 0.4087 0.0598 0.0000 Significant

169
Based on the test, a statistically significant difference was seen between all
the pairs. (P˂0.05), showing that mean Job Satisfaction score differs with
frequency of health check-ups by faculty members.
4.3.3.5 Association of Stress and Job Satisfaction with Health Status
Table 4.49
Comparison of Mean Stress (ORS) on Basis of Health Status
Health Status N Mean Std. Deviation T Test P value
Good 81 2.4885 0.4797
93.8260 0.0000 Average 174 3.0634 0.4223
Total 255 2.8807 0.5156
One-way ANOVA applied, Significant
The above table shows the comparison of mean Stress score (measured by
ORS scale) of faculty members on the basis of their Health Status.
The difference between the groups was found to be statistically significant
(P˂0.05), showing that mean stress score for faculty members having Average
health is significantly more than that of faculty members having Good health.
Table 4.50
Comparison of Mean Stress on Basis of Health Status
Health Status N Mean Std. Deviation T Test P value
Good 81 3.1512 0.4736
3.1700 0.0760 Average 174 3.2443 0.3418
Total 255 3.2147 0.3900
One-way ANOVA applied, Non- Significant

170
The above table shows the comparison of mean Stress score (measured by
Stress test) of faculty members on the basis of their Health Status.
The difference between the groups was found to be statistically non-
significant (P>0.05), showing that mean stress score for faculty members having
Average health is almost equal to that of faculty members having Good health.
Table 4.51
Comparison of Mean Job Satisfaction Score on Basis of Health Status
Health Status N Mean Std. Deviation T Test P value
Good 81 3.0191 0.6153
187.8060 0.0000 Average 174 2.1670 0.3708
Total 255 2.4376 0.6090
One-way ANOVA applied, Significant
The above table shows the comparison of mean Job Satisfaction Score of
faculty members on the basis of their Health Status.
The difference between the groups was found to be statistically significant
(P<0.05), showing that mean Job satisfaction score for faculty members having
Good health is significantly more than that of faculty members having Average
health..
4.3.3.6 Association of Stress and Job Satisfaction with Severity of Illness
Table 4.52
Comparison of Mean Stress (ORS) on Basis of Severity of Illness
Illness N Mean Std. Deviation T Test P value
Mild 221 2.7760 0.4416
93.1820 0.0000 Chronic 34 3.5614 0.4421
Total 255 2.8807 0.5156
One-way ANOVA applied, Significant

171
The above table shows the comparison of mean Stress score (measured by
ORS scale) of faculty members on the basis of their Severity of Illness.
The difference between the groups was found to be statistically significant
(P˂0.05), showing that mean stress score for faculty members having Chronic
illness is significantly more than that of faculty members having Mild illness.
Table 4.53
Comparison of Mean Stress on Basis of Severity of Illness
Illness N Mean Std. Deviation T Test P value
Mild 221 3.1708 0.3779
22.7920 0.0000 Chronic 34 3.5000 0.3494
Total 255 3.2147 0.3900
One-way ANOVA applied, Significant
The above table shows the comparison of mean Stress score (measured by
Stress test) of faculty members on the basis of their Severity of Illness.
The difference between the groups was found to be statistically significant
(P˂0.05), showing that mean stress score for faculty members having Chronic
illness is significantly more than that of faculty members having Mild illness..
Table 4.54
Comparison of Job Satisfaction Score on Basis of Severity of Illness
Illness N Mean Std. Deviation T Test P value
Mild 221 2.5293 0.5874
43.8740 0.0000 Chronic 34 1.8419 0.3646
Total 255 2.4376 0.6090
One-way ANOVA applied, Significant

172
The above table shows the comparison of mean Job Satisfaction Score of
faculty members on the basis of their Severity of Illness.
The difference between the groups was found to be statistically significant
(P<0.05), showing that mean job satisfaction score for faculty members having
Mild illness is significantly more than that of faculty members having Chronic
illness.
4.3.3.7 Association of Stress and Job Satisfaction with Having Meal on Time
Table 4.55
Comparison of Mean Stress (ORS) on Basis of Having Meal on Time
Meal On
Time N Mean Std. Deviation F Sig.
Yes 80 2.4307 0.3227
315.6380 0.0000 No 122 2.8391 0.2746
Sometimes 53 3.6559 0.1919
Total 255 2.8807 0.5156
One-way ANOVA applied, Significant
The above table shows the comparison of mean Stress score (measured by
ORS scale) of faculty members on the basis of their practice of having meal on
time.
The difference among the three groups was found to be statistically
significant (P<0.05), showing that mean ORS score changes with their practice of
having meals timely. The mean stress score is lower for faculties having meals on
time and shows the highest value for faculties having meals irregularly.
To find out the pair wise comparison the Post hoc Tukey was applied.

173
Table 4.55 (a)
Post-hoc Tukey test
Pair wise Comparison Mean
Difference Std. Error P Value Result
Yes No -0.4084 0.0398 0.0000 Significant
Yes Sometimes -1.2252 0.0490 0.0000 Significant
No Sometimes -0.8168 0.0455 0.0000 Significant
Based on the test, a statistically significant difference was seen between all
the pairs, showing that mean Stress score (measured by ORS scale) differs with
practice of having meal on time of faculty members.
Table 4.56
Comparison of Mean Stress on Basis of Having Meal on Time
Meal On
Time N Mean Std. Deviation F Sig.
Yes 80 3.0875 0.4789
26.7000 0.0000 No 122 3.1629 0.3029
Sometimes 53 3.5259 0.2264
Total 255 3.2147 0.3900
One-way ANOVA applied, Significant
The above table shows the comparison of mean Stress score (measured by
Stress test) of faculty members on the basis of their practice of having meal on
time.
The difference among the three groups was found to be statistically
significant (P˂0.05), showing that mean Stress score varies with practice of
having meal on time of faculty members. The mean stress score is lower for
faculties having meals on time and shows the highest value for faculties having
meals irregularly.

174
To find out the pair wise comparison the Post hoc Tukey was applied.
Table 4.56 (a)
Post-hoc Tukey test
Pair wise Comparison Mean
Difference Std. Error P Value Result
Yes No -0.0754 0.0512 0.3053 Not Significant
Yes Sometimes -0.4384 0.0630 0.0000 Significant
No Sometimes -0.3630 0.0585 0.0000 Significant
Based on the test, a statistically significant difference was seen between the
pairs Yes & Sometimes and No & Sometimes. (P>0.05), in case of the pair Yes &
No, showing that Stress score differs only within it.
Table 4.57
Comparison of Mean Job Satisfaction Score on Basis of Having Meal on
Time
Meal On Time N Mean Std. Deviation F Sig.
Yes 80 3.0388 0.5266
199.5780 0.0000 No 122 2.3598 0.3411
Sometimes 53 1.7094 0.0955
Total 255 2.4376 0.6090
One-way ANOVA applied, Significant
The above table shows the comparison of mean Job Satisfaction Score of
faculty members on the basis of their practice of having meal on time.
The difference among the three groups was found to be statistically
significant (P<0.05), showing that mean Job satisfaction score changes with
practice of having meal on time of faculty members. The mean job satisfaction

175
score is the highest for faculties having meals on time and shows the lowest value
for faculties having meals irregularly.
To find out the pair wise comparison the Post hoc Tukey was applied.
Table 4.57 (a)
Post-hoc Tukey test
Pair wise Comparison Mean
Difference
Std.
Error P Value Result
Yes No 0.6789 0.0547 0.0000 Significant
Yes Sometimes 1.3293 0.0674 0.0000 Significant
No Sometimes 0.6504 0.0626 0.0000 Significant
Based on the test, a statistically significant difference was seen between all
the pairs. (P˂0.05), showing that mean Job Satisfaction score differs with faculty
members’ practice of having meal on time.
4.3.3.8 Association of Stress and Job Satisfaction with Job Timings
Table 4.58
Comparison of Mean Stress (ORS) on Basis of Job Timings
Timings N Mean Std.
Deviation T Test P value
Rigid 113 3.2218 0.5039
136.0120 0.0000 Flexible 142 2.6093 0.3313
Total 255 2.8807 0.5156
One-way ANOVA applied, Significant
The above table shows the comparison of mean Stress score (measured by
ORS scale) of faculty members on the basis of their job timings.

176
The difference between the groups was found to be statistically significant
(P˂0.05), showing that mean stress score for faculty members having Rigid
timing is significantly more than that of faculty members having Flexible timing.
Table 4.59
Comparison of Mean Stress on Basis of Job Timings
Timings N Mean Std. Deviation T Test P value
Rigid 113 3.3466 0.3496
25.4420 0.0000 Flexible 142 3.1097 0.3898
Total 255 3.2147 0.3900
One-way ANOVA applied, Significant
The above table shows the comparison of mean Stress score (measured by
Stress test) of faculty members on the basis of their job timings.
The difference between the groups was found to be statistically significant
(P˂0.05), showing that mean stress score for faculty members having Rigid
timing is significantly more than that of faculty members having Flexible timing..
Table 4.60
Comparison of Mean Job Satisfaction Score on Basis of Job Timings
Timings N Mean Std. Deviation T Test P value
Rigid 113 2.0710 0.4853
103.1010 0.0000 Flexible 142 2.7294 0.5363
Total 255 2.4376 0.6090
One-way ANOVA applied, Significant
The above table shows the comparison of mean Job Satisfaction Score of
faculty members on the basis of their job timings.

177
The difference between the groups was found to be statistically significant
(P<0.05), showing that mean Job satisfaction score for faculty members having
Flexible timing is significantly more than that of faculty members having Rigid
timing.
4.3.3.9 Association of Stress and Job Satisfaction with Type of Treatment
Table 4.61
Comparison of Mean Stress (ORS) on Basis of Type of Treatment
Type of
Treatment N Mean Std. Deviation F Sig.
Regular 86 2.3898 0.2591
237.8100 0.0000 Periodical 101 2.9042 0.2866
Special 68 3.4668 0.3758
Total 255 2.8807 0.5156
One-way ANOVA applied, Significant
The above table shows the comparison of mean Stress score (measured by
ORS scale) of faculty members on the basis of their treatment type.
The difference among the three groups was found to be statistically
significant (P<0.05), showing that mean ORS score changes with their practice of
having treatment. The mean stress score is lower for faculties having treatment of
their illness regularly and shows the highest value for faculties having special
treatment only.
To find out the pair wise comparison the Post hoc Tukey was applied.

178
Table 4.61 (a)
Post-hoc Tukey test
Pair wise Comparison Mean
Difference Std. Error P Value Result
Regular Periodical -0.5144 0.0447 0.0000 Significant
Regular Special -1.0770 0.0494 0.0000 Significant
Periodical Special -0.5625 0.0478 0.0000 Significant
Based on the test, a statistically significant difference was seen between all
the pairs. (P˂0.05), showing that mean Stress score (measured by ORS scale)
differs with type of treatment preferred by faculty members.
Table 4.62
Comparison of Mean Stress on Basis of Type of Treatment
Type of
Treatment N Mean Std. Deviation F Sig.
Regular 86 3.0296 0.4422
23.3330 0.0000 Periodical 101 3.2294 0.3229
Special 68 3.4271 0.2880
Total 255 3.2147 0.3900
One-way ANOVA applied, Significant
The above table shows the comparison of mean Stress score (measured by
Stress test) of faculty members on the basis of type of treatment they have.
The difference among the three groups was found to be statistically
significant (P˂0.05), showing that mean Stress score varies with type of treatment
preferred by faculty members. The mean stress score is lower for faculties having
treatment of their illness regularly and shows the highest value for faculties
having special treatment only.
To find out the pair wise comparison the Post hoc Tukey was applied.

179
Table 4.62 (a)
Post-hoc Tukey test
Pair wise Comparison Mean
Difference Std. Error P Value Result
Regular Periodical -0.1998 0.0528 0.0006 Significant
Regular Special -0.3975 0.0584 0.0000 Significant
Periodical Special -0.1977 0.0564 0.0016 Significant
Based on the test, a statistically significant difference was seen between all
the pairs showing mean stress scores differ within all the pairs.
Table 4.63
Comparison of Mean Job Satisfaction Score on Basis of Type of Treatment
Type of
Treatment N Mean Std. Deviation F Sig.
Regular 86 3.0930 0.4523
252.8080 0.0000 Periodical 101 2.2728 0.3168
Special 68 1.8537 0.2414
Total 255 2.4376 0.6090
One-way ANOVA applied, Significant
The above table shows the comparison of mean Job Satisfaction Score of
faculty members on the basis of type of treatment they have.
The difference among the three groups was found to be statistically
significant (P<0.05), showing that mean Job satisfaction score changes with type
of treatment they prefer. The mean job satisfaction score is higher for faculties
having treatment of their illness regularly and shows the lowest value for faculties
having special treatment only.
To find out the pair wise comparison the Post hoc Tukey was applied.

180
Table 4.63 (a)
Post-hoc Tukey test
Pair wise Comparison Mean
Difference Std. Error P Value Result
Regular Periodical 0.8203 0.0517 0.0000 Significant
Regular Special 1.2393 0.0572 0.0000 Significant
Periodical Special 0.4191 0.0553 0.0000 Significant
Based on the test, a statistically significant difference was seen between all
the pairs. (P˂0.05), showing that mean Job Satisfaction score differs with faculty
members’ preferred type of treatment.
Validation of Hypothesis:
H03: The extent of stress-effects felt by faculty members does not differ by
situational factors.
H13: The extent of stress-effects felt by faculty members differs by
situational factors.
The extent of stress-effects felt by faculty members was found to be significantly
different due to family situational factors including designation, hours spent at
workplace, income, Frequency of Health Check-up, Health Status, Severity of
Illness, Having Meal on Time, Job Timings, and Type of Treatment.
Hence, null hypothesis got rejected and alternate hypothesis got
accepted that the extent of stress-effects felt by faculty members differs by
situational factors.
4.4 Correlation of Respondents’ Performance with Stress and Job
Satisfaction
In order to fulfil one of the objectives of the study, the researcher has
attempted to find out the relationship between stress-effects and job performance
of coaching faculty members. Pearson’s Correlation was used to establish the
relationship between Average Stress measured by ORS and Average performance,

181
Average Stress measured by Stress test and Average performance, and Average
Job Satisfaction and Average performance.
As per the table 4.64, Negative and Significant Correlation was found
between Average Stress (both scale) and Average performance which signifies
that more the Stress, lower would be the Performance.
On the other hand, Positive and Significant Correlation exists between
Average Job Satisfaction and Average performance which indicates that higher
the job satisfaction better would be the performance.
Table 4.64
Correlation of Performance with Stress and JSS
Parameter
Correlation
Coefficient
(r)
P
Value
Result
Average Performance
Vs Average Stress
(ORS)
-0.422 0.000 Negative and Significant
Correlation
Average Performance
Vs Average Stress
(Stress test)
-0.492 0.000 Negative and Significant
Correlation
Average Performance
Vs Average JSS 0.451 0.000
Positive and Significant
Correlation

182
Chart 4.10
Correlation between Average Performance & Average Stress (ORS)
Chart 4.11
Correlation between Average Performance & Average Stress (Stress test)

183
Chart 4.12
Correlation between Average Performance & Average Job Satisfaction score
Validation of Hypothesis:
H04: There is no significant association between the extent of stress-effects
felt by faculty members and their academic performance.
H14: There is a significant association between the extent of stress-effects felt
by faculty members and their academic performance.
A significant association was found between the extent of stress-effects felt
by faculty members and their academic performance. Therefore, null hypothesis
got rejected and alternative hypothesis stood accepted.
4.5 Correlation between Stress and Job Satisfaction
In this section an attempt has been made to find out the relationship between
stress-effects and job satisfaction of coaching faculty members. Pearson’s
Correlation was further used to establish the relationship between Average Stress
measured by ORS and Average Stress measured by Stress test, Average Stress

184
measured by ORS and Average Job Satisfaction, and Average Stress measured by
Stress test and Average Job Satisfaction.
As per the table 4.65, Negative and Significant Correlation was found
between Average Stress (both scale) and Average Job Satisfaction which signifies
that more the Stress, lower would be the Job Satisfaction.
On the other hand, Positive and Significant Correlation exists between
Average Stress measured by ORS and Average Stress measured by Stress test
which indicates that stress effects (psychological and physiological) move in same
direction.
Table 4.65
Correlation between ORS, Stress and JSS
Parameter
Correlation
Coefficient
(r)
P
Value
Result
Average ORS Vs
Average Stress 0.483 0.000
Positive and Significant
correlation
Average ORS Vs
Average JSS -0.898 0.000
Negative and Significant
correlation
Average Stress Vs
Average JSS -0.488 0.000
Negative and Significant
correlation

185
Chart 4.13
Correlation between Average Stress (Stress test) & Average Stress (ORS)
Chart 4.14
Correlation between Average Job Satisfaction Score & Average Stress (ORS)

186
Chart 4.15
Correlation between Average Stress (Stress test) & Average Job Satisfaction
Score
Validation of Hypothesis:
H05: There is no significant association between the extent of stress-effects
felt by faculty members and their job satisfaction.
H15: There is a significant association between the extent of stress-effects felt
by faculty members and their job satisfaction.
A significant association was found between the extent of stress-effects felt
by faculty members and their job satisfaction. Therefore, null hypothesis got
rejected and alternative hypothesis stood accepted.
******

CHAPTER - 5 FINDINGS, CONCLUSION AND
RECOMMENDATIONS

187
CHAPTER-5
MAJOR FINDINGS, CONCLUSION & RECOMMENDATIONS
INTRODUCTION
This chapter provides the major findings of this study. Furthermore, this
chapter also discusses the results of the study, conclusions drawn followed by the
recommendations and propositions for future researches.
5.1 MAJOR FINDINGS
In this section the researcher presents major findings derived from statistical
data analysis. It depicts respondents’ opinions on variables pertaining to the study.
Major findings of the study are as hereunder:
5.1.1 Personal Factors Affecting Stress and Job Satisfaction
Association of Stress and Job Satisfaction with Age
Effect of stress (measured by stress test) experienced by faculties falling
under 21-40 years age group was found more (3.27) followed by faculties falling
under the age group 41-60 years (3.20). Faculties falling above 60 years age group
reported least effects of stress (2.86) comparatively. However, the results found
that the effects of stress were between the ranges sometimes to often.
Therefore, it can be concluded that there was no significant impact of stress
on physiological health of coaching faculty members. However, a significant
difference was found among the extent of stress-effects experienced by faculty
members belonging to different age groups.
The extent of job satisfaction experienced by faculty members falling under
above 60 years age group was found more (3.26) followed by faculties falling
under 41-60 years age group (2.54). Faculties falling under the age group 21-40
years reported having least job satisfaction (2.27) comparatively. A significant
difference was found among the extent of job satisfaction experienced by faculty
members belonging to different age groups.
The results found that the extent of job satisfaction experienced by faculty
members belonging to different age groups was about neutral; however, faculties

188
falling under the age group 21-40 years were disagreed with the job satisfaction in
their current job.
The extent of stress-effects (measured by ORS scale) experienced by faculty
members falling under 21-40 years age group was found more (3.01) followed by
faculty members falling under 41-60 years age group (2.76). Faculties falling
under the age group above 60 years reported least (2.31) effects of stress
comparatively. The results found that the effects of stress were between the ranges
sometimes to frequently. However, in case of faculties falling under 21-40 years
age group it falls between frequently to very frequently.
Therefore, a significant difference was found among the extent of stress-
effects experienced by faculty members belonging to different age groups. It can
be concluded that there was a significant impact of stress on psychological health
of faculties falling under 21-40 years age group.
Association of Stress and Job Satisfaction with Gender
Extent of Stress (measured by stress test) experienced by female faculty
members (3.39) was found more as compared to male faculty members (3.19).
However, the results found that the effect of stress on their physiological health
was between the ranges sometimes to often.
Therefore, it can be concluded that there was no significant impact of stress
on physiological health of coaching faculty members. However, a significant
difference was found between the extent of stress-effects experienced by male and
female faculty members.
Extent of job satisfaction experienced by males (2.47) was found more as
compared to females (2.22). There was a significant difference among their level
of job satisfaction. However, the results found that the extent of job satisfaction
experienced by faculty members was about neutral.
Effect of stress (measured by ORS scale) experienced by females (2.96) was
found more as compared to males (2.87). However, the results found that the
effect of stress on psychological health was between the ranges sometimes to
frequently.

189
Therefore, it can be concluded that there was no significant impact of stress
on physiological health of coaching faculty members. Moreover, no significant
difference was found between the extent of stress-effects experienced by male and
female faculty members.
Association of Stress and Job Satisfaction with Educational
Qualification
Effect of stress (measured by stress test) experienced by faculties securing
PG (3.28) was found more followed by faculties securing Graduation (3.26).
Faculties securing PhD reported least (3.09) effects of stress comparatively.
However, the results found that the effects of stress were between the ranges
sometimes to often.
Therefore, it can be concluded that there was no significant impact of stress
on physiological health of coaching faculty members. However, a significant
difference was found among the extent of stress-effects experienced by faculty
members having varied qualification.
The extent of job satisfaction experienced by faculty members securing PhD
(2.74) was found more followed by faculties securing PG (2.37). Faculties
securing Graduation reported having least (2.05) job satisfaction comparatively. A
significant difference was found among the extent of job satisfaction experienced
by faculty members having varied qualification.
The results found that the extent of job satisfaction experienced by faculty
members was about neutral; however, faculty members securing graduation were
disagreed with the job satisfaction in their current job.
The extent of stress-effects (measured by ORS scale) experienced by faculty
members securing Graduation (3.36) was found more followed by faculties
securing PG (2.89). Faculties securing PhD reported least (2.63) effects of stress
comparatively. The results found that the effect of stress was between the ranges
sometimes to frequently. However, In case of faculties securing only Graduation
it falls between frequently to very frequently.
Therefore, a significant difference was found among the extent of stress-
effects experienced by faculty members having varied qualification. It can be

190
concluded that there was a significant impact of stress on psychological health of
coaching faculty members securing Graduation.
Association of Stress and Job Satisfaction with Work Experience
The extent of stress-effects (measured by stress test) experienced by faculty
members was found more in case of faculties having 1-7 years experience (3.36)
followed by faculties having more than 15 years of experience (3.18). Faculties
having 8-14 years of experience reported least effects of stress (2.91)
comparatively. However, the results found that the effects of stress were between
the ranges sometimes to often.
Therefore, it can be concluded that there was no significant impact of stress
on physiological health of coaching faculty members. However, a significant
difference was found among the extent of stress-effects experienced by faculty
members having varied span of experience.
The extent of job satisfaction experienced by faculty members was found
more in case of faculties having more than 15 years of experience (3.14) followed
by faculties having 8-14 years of experience (2.72). Faculties having 1-7 years of
experience reported having least (2.12) job satisfaction comparatively. A
significant difference was found among the extent of job satisfaction experienced
by faculty members having varied span of experience.
The results found that the extent of job satisfaction experienced by faculty
members was about neutral; however, faculty members having 1-7 years of
experience were disagreed with the job satisfaction in their current job.
The extent of stress-effects (measured by ORS scale) experienced by faculty
members was found more in case of faculties having 1-7 years of experience
(3.09) followed by faculties having 8-14 years of experience (2.67). Faculties
having more than 15 years experience reported least effects of stress
comparatively (2.43). The results found that the effect of stress was between the
ranges sometimes to frequently. However, in case of faculties having 1-7 years of
experience, it falls between frequently to very frequently.
Therefore, a significant difference was found among the extent of stress-
effects experienced by faculty members suffering varied span of experience. It can

191
be concluded that there was a significant impact of stress on psychological health
of faculties having 1-7 years of experience.
Association of Stress and Job Satisfaction with Duration of Illness
Effect of stress (measured by stress test) experienced by faculties suffering
illness from 11-20 years (3.49) was found more followed by faculties suffering
illness from 1-11 years (3.29). Faculties suffering illness from less than 1 year
reported least effects of stress (3.07) comparatively. However, the results found
that the effects of stress were between the ranges sometimes to often.
Therefore, it can be concluded that there was no significant impact of stress
on physiological health of coaching faculty members. However, a significant
difference was found among the extent of stress-effects experienced by faculty
members suffering illness from varied duration.
The extent of job satisfaction experienced by faculty members suffering
illness for less than 1 year (2.87) was found more followed by faculties suffering
illness from 1-11 years (2.14). Faculties suffering illness from 11-20 years
reported having least job satisfaction (1.72) comparatively. A significant
difference was found among the extent of job satisfaction experienced by faculty
members suffering illness from varied duration.
The results found that the extent of job satisfaction experienced by faculty
members suffering illness from varied duration was about neutral; however,
faculties suffering illness from 11-20 years were disagreed with the job
satisfaction in their current job.
The extent of stress-effects (measured by ORS scale) experienced by faculty
members suffering illness from 11-20 years (3.62) was found more followed by
faculty members suffering illness from 1-11 years (3.06). Faculties suffering
illness for less than 1 year reported least (2.5) effects of stress comparatively. The
results found that the effect of stress was between the ranges sometimes to
frequently. However, in case of faculties suffering illness from 11-20 years it falls
between frequently to very frequently.
Therefore, a significant difference was found among the extent of stress-
effects experienced by faculty members suffering illness from varied duration. It

192
can be concluded that there was a significant impact of stress on psychological
health of faculties suffering illness from 11-20 years.
5.1.2 Family Factors Affecting Stress and Job Satisfaction
Association of Stress and Job Satisfaction with Marital Status
Effect of stress (measured by stress test) experienced by married faculties
(3.28) was found more as compared to unmarried (3.10). However, the results
found that the effect of stress on physiological health was between the ranges
sometimes to often.
Therefore, it can be concluded that there was no significant impact of stress
on physiological health of coaching faculty members. However, a significant
difference was found between the extents of stress-effects experienced by
faculties having varied marital status.
Extent of job satisfaction experienced by unmarried faculties (2.83) was
found more as compared to married faculties (2.21). There was a significant
difference among their level of job satisfaction. However, the results found that
the extent of job satisfaction experienced by faculty members was neutral.
Effect of stress (measured by ORS scale) experienced by married faculties
(3.07) was found more as compared to unmarried faculties (2.56). The results
found that the effect of stress on psychological health was between the ranges
sometimes to frequently. However, in case of married faculties it falls between
frequently to very frequently.
Therefore, a significant difference was found among the extent of stress-
effects experienced by faculty members having varied marital status. It can be
concluded that there was a significant impact of stress on psychological health of
married faculty members.
Association of Stress and Job Satisfaction with Number of Dependents
Effect of stress (measured by stress test) experienced by faculties having
more than 4 dependents (3.50) was found more followed by faculties having
dependents 3-4 (3.18). Faculties having 1-2 dependents and faculties having no
dependents reported (3.09) and (2.64) effects of stress respectively. However, the

193
results found that the effects of stress were between the ranges sometimes to
often.
Therefore, it can be concluded that there was no significant impact of stress
on physiological health of coaching faculty members. Moreover, a significant
difference was found among the extent of stress-effects experienced by faculty
members having different number of dependents.
The extent of job satisfaction experienced by faculty members having no
dependents (3.61) was found more followed by faculties having 1-2 dependents
(2.94) and faculties having 3-4 (2.31) respectively. Faculties having more than 4
dependents reported least (1.89) job satisfaction comparatively. A significant
difference was found among the extent of job satisfaction experienced by faculty
members having different number of dependents.
The results found that the extent of job satisfaction experienced by faculty
members was about neutral; however, faculties having more than 4 dependents
were dissatisfied with their jobs.
The extent of stress-effects (measured by ORS scale) experienced by faculty
members having more than 4 dependents (3.39) was found more followed by
faculties having 3-4 dependents (2.91) and faculties having 1-2 dependents (2.50)
respectively. Faculties having no dependents reported least (2.05) effects of stress
comparatively. The results found that the effects of stress were between the ranges
sometimes to frequently. However, in case of faculties having more than 4
dependents it falls between frequently to very frequently.
Therefore, a significant difference was found among the extent of stress-
effects experienced by faculty members having different number of dependents. It
can be concluded that there was a significant impact of stress on psychological
health of coaching faculty members having more than 4 dependents.
Association of Stress and Job Satisfaction with Type of Family
Effect of stress (measured by stress test) experienced by faculties having
extended family (3.36) was found more followed by faculties having joint family
(3.26). Faculties having nuclear family reported least (3.09) effects of stress
194
comparatively. However, the results found that the effects of stress were between
the ranges sometimes to often.
Therefore, it can be concluded that there was no significant impact of stress
on physiological health of coaching faculty members. Moreover, a significant
difference was found among the extent of stress-effects experienced by faculty
members having different type of family.
The extent of job satisfaction experienced by faculty members having
nuclear family (3.21) was found more followed by faculties having joint family
(3.02). Faculties having extended family reported least (2.10) effects of stress
comparatively. A significant difference was found among the extent of job
satisfaction experienced by faculty members having different number of
dependents.
The results found that the extent of job satisfaction experienced by faculty
members was about neutral; however, faculties having extended family were
dissatisfied with their jobs.
The extent of stress-effects (measured by ORS scale) experienced by faculty
members having extended family (3.25) was found more followed by faculties
having joint family (3.09). Faculties having nuclear family reported least (2.46)
effects of stress comparatively. The results found that the effects of stress were
between the ranges sometimes to frequently. However, in case of faculties having
extended family it falls between frequently to very frequently.
Therefore, a significant difference was found among the extent of stress-
effects experienced by faculty members having different type of family. It can be
concluded that there was a significant impact of stress on psychological health of
coaching faculty members having extended family.
5.1.3 Situational Factors Affecting Stress and Job Satisfaction
Association of Stress and Job Satisfaction with Faculty Designation
Effect of stress (measured by stress test) experienced by Assistant faculties
(3.63) was found more followed by Faculties (3.23). Training faculties reported
least (2.86) effects of stress comparatively. However, the results found that the
effects of stress were between the ranges sometimes to often.

195
Therefore, it can be concluded that there was no significant impact of stress
on physiological health of coaching faculty members. However, a significant
difference was found among the extent of stress-effects experienced by faculty
members having varied designation.
The extent of job satisfaction experienced by Training Faculties (2.62) was
found more followed by Faculties (2.46). Assistant Faculties reported having least
(1.76) job satisfaction comparatively. A significant difference was found among
the extent of job satisfaction experienced by faculty members having varied
designation.
The results found that the extent of job satisfaction experienced by faculty
members having varied designation was about neutral; however, Assistant faculty
members were disagreed with the job satisfaction in their current job.
The extent of stress-effects (measured by ORS scale) experienced by
Assistant faculty members was found more (3.47) followed by Faculties (2.86).
Training Faculties reported least (2.70) effects of stress comparatively. The results
found that the effects of stress were between the ranges sometimes to frequently.
However, in case of Assistant faculties it falls between frequently to very
frequently.
Therefore, a significant difference was found among the extent of stress-
effects experienced by faculty members having varied designation. It can be
concluded that there was a significant impact of stress on psychological health of
Assistant Faculty members.
Association of Stress and Job Satisfaction with Number of Working
Hours
Effect of stress (measured by stress test) experienced by faculties spending
more than 8 hrs at workplace (3.44) was found more followed by faculties
spending 5-6 hrs (3.18). Faculties spending 7-8 hrs at workplace reported least
(3.12) effects of stress comparatively. However, the results found that the effects
of stress were between the ranges sometimes to often.
Therefore, it can be concluded that there was no significant impact of stress
on physiological health of coaching faculty members. However, a significant

196
difference was found among the extent of stress-effects experienced by faculty
members spending varied number of hrs at workplace.
The extent of job satisfaction experienced by faculty members spending 5-6
hrs at workplace (3.01) was found more followed by faculties spending 7-8 hrs
(2.43). Faculties spending more than 8 hrs at workplace reported least (1.84)
effects of stress comparatively. A significant difference was found among the
extent of job satisfaction experienced by faculty members spending varied number
of hrs at workplace.
The results found that the extent of job satisfaction experienced by faculty
members was about neutral; however, faculties spending more than 8 hrs were
dissatisfied with their jobs.
The extent of stress-effects (measured by ORS scale) experienced by faculty
members spending more than 8 hrs (3.48) was found more followed by faculties
spending 7-8 hrs (2.81). Faculties spending 5-6 hrs at workplace reported least
2.46) effects of stress comparatively. The results found that the effects of stress
were between the ranges sometimes to frequently. However, in case of faculties
spending more than 8 hrs it falls between frequently to very frequently.
Therefore, a significant difference was found among the extent of stress-
effects experienced by faculty members spending varied number of hrs at
workplace. It can be concluded that there was a significant impact of stress on
psychological health of coaching faculty members spending more than 8 hrs.
Association of Stress and Job Satisfaction with Income
Effect of stress (measured by stress test) experienced by faculties having
income between Rs. 30000-50000 (3.51) was found more followed by faculties
having income between Rs. 50000-70000 (3.38). Faculties reported least (3.14)
effects of stress comparatively who were earning more than Rs. 70000 a month.
However, the results found that the effects of stress were between the ranges
sometimes to often.
Therefore, it can be concluded that there was no significant impact of stress
on physiological health of coaching faculty members. However, a significant

197
difference was found among the extent of stress-effects experienced by faculty
members having varied income.
The extent of job satisfaction experienced by Faculties earning more than
Rs. 70000 (2.62) was found more followed by Faculties having income between
Rs. 50000-70000 (2.06). Faculties earning Rs. 30000-50000 reported least (1.77)
job satisfaction comparatively. A significant difference was found among the
extent of job satisfaction experienced by faculty members having varied
designation.
The results found that the extent of job satisfaction experienced by faculty
members having varied designation was about neutral; however, Assistant faculty
members were disagreed with the job satisfaction in their current job.
The extent of stress-effects (measured by ORS scale) experienced by
faculties having income between Rs. 30000-50000 (3.86) was found more
followed by faculties having income between Rs. 50000-70000 (3.16). Faculties
reported least (2.71) effects of stress comparatively who were earning more than
Rs. 70000 a month. The results found that the effects of stress were between the
ranges sometimes to frequently. However, in case of faculties earning between Rs.
30000-50000, it falls between frequently to very frequently.
Therefore, a significant difference was found among the extent of stress-
effects experienced by faculty members having varied income. It can be
concluded that there was a significant impact of stress on psychological health of
Faculties having income between Rs. 30000-50000.
Association of Stress and Job Satisfaction with Health Status
Effect of stress (measured by stress test) experienced by faculties having
average health (3.24) was found more as compared to faculties having good health
(3.15). However, the results found that the effect of stress on physiological health
was between the sometimes to often.
Therefore, it can be concluded that there was no significant impact of stress
on physiological health of coaching faculty members. Moreover, no significant
difference was found among the extent of stress-effects experienced by faculty
members having different health status.

198
Extent of job satisfaction experienced by faculties having good health (3.02)
was found more as compared to faculties having average health (2.17). There was
a significant difference among their level of job satisfaction. A significant
difference was found among the extent of job satisfaction experienced by faculty
members having varied job timings.
The results found that the extent of job satisfaction experienced by faculty
members was about neutral; however, faculties having average health were
dissatisfied with their jobs.
Effect of stress (measured by ORS scale) experienced by faculties having
average health (3.06) was found more as compared to faculties having good health
(2.49). The results found that the effects of stress were between the ranges
sometimes to frequently. However, in case of faculties having average health it
falls between frequently to very frequently.
Therefore, a significant difference was found among the extent of stress-
effects experienced by faculty members having varied health status. It can be
concluded that there was a significant impact of stress on psychological health of
coaching faculty members having average health.
Association of Stress and Job Satisfaction with Type of Job Timings
Effect of stress (measured by stress test) experienced by faculties having
rigid timings (3.35) was found more as compared to faculties having flexible
timings (3.11). However, the results found that the effect of stress on
physiological health was between the sometimes to often.
Therefore, it can be concluded that there was no significant impact of stress
on physiological health of coaching faculty members. However, a significant
difference was found among the extent of stress-effects experienced by faculty
members having varied job timings.
Extent of job satisfaction experienced by faculties having flexible timings
(2.73) was found more as compared to faculties having rigid timings (2.07). There
was a significant difference among their level of job satisfaction. A significant
difference was found among the extent of job satisfaction experienced by faculty
members having varied job timings.

199
The results found that the extent of job satisfaction experienced by faculty
members was about neutral; however, faculties having rigid timings were
dissatisfied with their jobs.
Effect of stress (measured by ORS scale) experienced by faculties having
rigid timings (3.22) was found more as compared to faculties having flexible
timings (2.61). The results found that the effects of stress were between the ranges
sometimes to frequently. However, in case of faculties having rigid timings it falls
between frequently to very frequently.
Therefore, a significant difference was found among the extent of stress-
effects experienced by faculty members having varied job timings. It can be
concluded that there was a significant impact of stress on psychological health of
coaching faculty members having rigid timings.
Association of Stress and Job Satisfaction with Severity of Illness
Effect of stress (measured by stress test) experienced by faculties suffering
chronic illness (3.50) was found more as compared to faculties suffering mild
illness (3.17). However, the results found that the effects of stress were between
the ranges sometimes to often.
Therefore, it can be concluded that there was no significant impact of stress
on physiological health of coaching faculty members. However, a significant
difference was found among the extent of stress-effects experienced by faculty
members suffering from varied severity of illness.
The extent of job satisfaction experienced by faculty members suffering
mild illness (2.53) was found more as compared to faculties suffering from
chronic illness (1.84). A significant difference was found among the extent of job
satisfaction experienced by faculty members suffering from varied severity of
illness.
The results found that the extent of job satisfaction experienced by faculty
members suffering illness from varied duration was about neutral; however,
faculties suffering from chronic illness were disagreed with the job satisfaction in
their current job.

200
The extent of stress-effects (measured by ORS scale) experienced by faculty
members suffering from chronic illness (3.56) was found more as compared to
faculty members suffering from mild illness (2.78). The results found that the
effects of stress were between the ranges sometimes to frequently. However, in
case of faculties suffering from chronic illness it falls between frequently to very
frequently.
Therefore, a significant difference was found among the extent of stress-
effects experienced by faculty members suffering from varied severity of illness.
It can be concluded that there was a significant impact of stress on psychological
health of faculties suffering from chronic illness.
Association of Stress and Job Satisfaction with Frequency of Health
Checkup
Effect of stress (measured by stress test) experienced by faculties having
yearly check-up (3.41) was found more followed by faculties having half yearly
check-up (3.24). Faculties having quarterly checkup reported least (3.03) effects
of stress comparatively. However, the results found that the effects of stress were
between the ranges sometimes to often.
Therefore, it can be concluded that there was no significant impact of stress
on physiological health of coaching faculty members. However, a significant
difference was found among the extent of stress-effects experienced by faculty
members having health check-up at varied intervals.
The extent of job satisfaction experienced by faculty members having
quarterly check-up (3.02) was found more followed by faculties having half
yearly check-up (2.29). Faculties having yearly checkup reported least (2.29)
effects of stress comparatively. A significant difference was found among the
extent of job satisfaction experienced by faculty members having health check-up
at varied intervals.
The results found that the extent of job satisfaction experienced by faculty
members was about neutral; however, faculties having yearly checkup were
dissatisfied with their jobs.

201
The extent of stress-effects (measured by ORS scale) experienced by faculty
members having yearly check-up (3.43) was found more followed by faculties
having half yearly check-up (2.86). Faculties having quarterly checkup reported
least (2.44) effects of stress comparatively. The results found that the effects of
stress were between the ranges sometimes to frequently. However, in case of
faculties having yearly check-up it falls between frequently to very frequently.
Therefore, a significant difference was found among the extent of stress-
effects experienced by faculty members having health check-up at varied
intervals. It can be concluded that there was a significant impact of stress on
psychological health of coaching faculty members having yearly check-up.
Association of Stress and Job Satisfaction with Having Meal on Time
Effect of stress (measured by stress test) experienced by faculties having
meal on time sometimes (3.52) was found more as compared to faculties don not
have meal on time (3.16). Faculties having timely meals reported least (3.09)
effects of stress comparatively. However, the results found that the effects of
stress were between the ranges sometimes to often.
Therefore, it can be concluded that there was no significant impact of stress
on physiological health of coaching faculty members. However, a significant
difference was found among the extent of stress-effects experienced by faculty
members follow varied pattern of having meals.
The extent of job satisfaction experienced by faculty members having meal
on time (3.04) was found more followed by faculties do not have meal on time
(2.36). Faculties having meal on time sometimes reported least (1.71) job
satisfaction comparatively. A significant difference was found among the extent
of job satisfaction experienced by faculty members having meals at varied pattern.
The results found that the extent of job satisfaction experienced by faculty
members was about neutral; however, faculties having meal on time sometimes
were dissatisfied with their jobs.
The extent of stress-effects (measured by ORS scale) experienced by faculty
members having meal on time sometimes (3.66) was found more as compared to

202
faculties do not have meal on time (2.84). Faculties having timely meals reported
least (2.43) effects of stress comparatively. The results found that the effects of
stress were between the ranges sometimes to frequently. However, in case of
faculties having meal on time sometimes it falls between frequently to very
frequently.
Therefore, a significant difference was found among the extent of stress-
effects experienced by faculty members having meals at varied pattern. It can be
concluded that there was a significant impact of stress on psychological health of
coaching faculty members having meal on time sometimes.
Association of Stress and Job Satisfaction with Type of Treatment
Effect of stress (measured by stress test) experienced by faculties having
special treatment (3.43) was found more as compared to faculties having
periodical treatment of their illness (3.23). Faculties having regular treatment
reported least (3.03) effects of stress comparatively. However, the results found
that the effects of stress were between the ranges sometimes to often.
Therefore, it can be concluded that there was no significant impact of stress
on physiological health of coaching faculty members. However, a significant
difference was found among the extent of stress-effects experienced by faculty
members follow varied pattern of treatment of their illness.
The extent of job satisfaction experienced by faculty members having
regular treatment (3.09) was found more followed by faculties having periodical
treatment (2.27). Faculties having special treatment reported least (1.85) job
satisfaction comparatively. A significant difference was found among the extent
of job satisfaction experienced by faculty members having different type of
treatment.
The results found that the extent of job satisfaction experienced by faculty
members was about neutral; however, faculties having special treatment were
dissatisfied with their jobs.
The extent of stress-effects (measured by ORS scale) experienced by faculty
members having special treatment (3.47) was found more as compared to faculties

203
having periodical treatment of their illness (2.90). Faculties having regular
treatment reported least (2.39) effects of stress comparatively. The results found
that the effects of stress were between the ranges sometimes to frequently.
However, in case of faculties having special treatment it falls between frequently
to very frequently.
Therefore, a significant difference was found among the extent of stress-
effects experienced by faculty members having different type of treatment. It can
be concluded that there was a significant impact of stress on psychological health
of coaching faculty members having special treatment.
5.1.4 Correlation of Respondents’ Performance with Stress and Job
Satisfaction
Negative and Significant Correlation was found between Average Stress
(both scale) and Average performance which signifies that more the Stress, lower
would be the Performance.
On the other hand, Positive and Significant Correlation exists between
Average Job Satisfaction and Average performance which indicates that higher
the job satisfaction better would be the performance.
5.1.5 Correlation between Stress and Job Satisfaction
Negative and Significant Correlation was found between Average Stress
(both scale) and Average Job Satisfaction which signifies that more the Stress,
lower would be the Job Satisfaction.
On the other hand, Positive and Significant Correlation exists between
Average Stress measured by ORS and Average Stress measured by Stress test
which indicates that stress effects (psychological and physiological) move in same
direction.
5.2 CONCLUSION
As per the analysis it is clear that the extent of stress is not high among
coaching faculty members in Kota. It has been observed that the average level of
stress is moderate and having no significant impact on both psychological and

204
physiological health of the respondents. However, there are some factors which
are responsible for causing stress among faculty members that in turn affects their
performance and job satisfaction. The reason may be due to personal factors,
family factors and/ or situational factors that all have been analyzed in this study.
The extent of stress, whether it is measured by ORS or Stress test, varies with the
difference in groups of almost all the factors considered for the study, such as, due
to difference in experience, qualification, marital status, job timings, health status
etc., the level of stress varies and it has impact on job satisfaction and
performance of faculty members working in coaching centers of Kota.
The results of stated hypotheses also support the above mentioned
discussion.
Table 5.1
Hypothesis Testing Results
Hypothesis Result
H1 Null The extent of stress-effects felt by faculty
members does not differ by personal factors.
Reject
Alternate The extent of stress-effects felt by faculty
members differs by personal factors.
Accept
H2 Null The extent of stress-effects felt by faculty
members does not differ by family factors.
Reject
Alternate The extent of stress-effects felt by faculty
members differs by family factors.
Accept
H3 Null The extent of stress-effects felt by faculty
members does not differ by situational
factors.
Reject
Alternate The extent of stress-effects felt by faculty
members differs by situational factors.
Accept
H4 Null There is no significant association between
the extent of stress-effects felt by faculty
members and their academic performance.
Reject
Alternate There is a significant association between the

205
extent of stress-effects felt by faculty
members and their academic performance.
Accept
H5 Null There is no significant association between
the extent of stress-effects felt by faculty
members and their job satisfaction.
Reject
Alternate There is a significant association between the
extent of stress-effects felt by faculty
members and their job satisfaction.
Accept
Hence, it could be concluded that there is a need to put more emphasis on
monetary and non-monetary incentives in order to build motivation among
coaching faculty members. To the least extent, this research finds that the
institution should pay more attention towards how to decrease working hour,
relieve excessive workload, increase income, and promote participation in
organization development and allow faculty members to be heard which will
bring about job satisfaction among them. If they feel insecure in their career and
develop job stress, it will not only adversely affect them but also on the students
to the extent that they may start to view that the institute is not effective anymore.
These are critical for new generation of faculty members to come into the system
that may result in indefinite shortage of professional workforce.
5.3 IMPLICATION OF THE STUDY
As educators, it is crucial to find position that vigor undoes uncertainty and stress among coaching faculty members. Coaching institutes do need to bring hold to the teaching faculty members to relax stress at the work place.
The findings of the research carry out a number of implications which are
self manifest. The research can justify being handy for researchers and
academicians, heads of the institutions and educational policy makers as follows:
1. Head of institutions:
The findings of the present research permit perceptive of the main target i.e.
recognition of stress in coaching teaching proficient’s and its relationship to

206
their work role and job satisfaction. In addition, the class backed to analyze
the health status of faculty members (as reported by them) and the health
practices pursue by them. Facet such as minutiae of spouse and children,
dependents, type of household and family, time schedule added to more
understanding of the target group and their family group. Placed on this
knowledge the working situation may be enhanced.
Knowledge generated from this additional survey of stress has the potential
to raise job satisfaction and to lower the turnover rate for experienced as
well as the new teaching proficient’s.
An accepting of stress in coaching teaching proficient may not only form
the base of stress analysis but may also be fruitful in rationalizing stress
behaviour and defining coping strategies for the unified teaching population.
Gender contrast on stress-effects will grant employers to understand the
change in approach, beliefs and common ethics of faculty members at the
work place. Modules for stress management can be composed on the ground
of lifestyles, beliefs, ethics, and attitudes of coaching faculty members for
various profile groups. It may also aid in establish static overall workplace
blueprint for coaching faculty members.
The top management should assure a study and participatory ambience for
the faculty members for institutional growth.
The findings can also aid to hatch for coaching faculty members permissive
them to strike an improved harmony between work role and family role.
This study bid to hatch an insight about the clue of stress. It advise using
assets of the organization to pacify stress and evolve their own practical
stress coping strategies for their teaching professionals relevant to
physiological, psychological and behavioral stress-effects.
2. Researchers and Academicians
The outcome of this research can add to the education related to stress-
effects in teaching professionals and coping strategies to handle them. Other
than this, the findings and outcomes on role stressors and job satisfaction as
relevant to stress can serve in setting up a theoretical ground for
forthcoming studies.

207
The research reveals relationship between the three variables under study:
Stress-effects, role stressors and job satisfaction. Their relationship urges
that no more of them may be missed for a better quality of coaching
education.
Further this, the findings of this research can aid in commit to the
recommendations for forthcoming studies and add on to the present note. It
will be fruitful for the researchers and academicians to use the conceptual
framework to composed theories. The database of the current research can
form a base for operate further researches in the akin lines. The research can
mold a worthy addition to the education root of stress behaviour of coaching
faculty members in the Indian situation.
As a lead study, it brings many opportunities to learn gender disparity in
stress similar professions for investigators.
3. Educational policy makers
Using the admission from this study that stress-effects and job satisfaction
are contra linked, the government can form the job of teaching profession
full of allure and spirit. This may be set by developing upon the pay packets
and perks so that faculty members may sense dignity in their job and act to
the best of their reach, thereby enhancing job satisfaction and lowering
stress.
Further, the inquiry has activity adequacy. The discovery of the research can
defend its efficacy since knowing the coaching faculty members accurately
and meeting out to them in the efficient way, is the vital to reduce stress.
The data limelight on the dilemma confronts as linked to their health in
general and forms of illness hurt. The wisdom can be suitable to clinical
psychologists, doctors and health Insurance agents to bring about useful
alterations in, Health awareness programmes, insurance policies and stress
release examined thereby reducing stress and growing job satisfaction. The
researches can also candid employers of coaching institutes to derive
malleable work blueprint and brings finer working status which will boost in
conquer stress in faculty members to some amount.

208
The read will be suitable for stress counselors in instruct patients to analyze
themselves.
Educational planners and administrators may be highly benefited by the findings of the current search. They can draft programs to conquer the trouble situation; advancement of sphere of coaching proficient’s and lifts up of coaching education standards.
5.4 SUGGESTIONS FOR FUTURE RESEARCH The following suggestions were derive from the current research for
forthcoming researches:
1. Further study is required with larger samples. This search was limited to
Kota city. Same research can be attend taking a larger geographical area; at
regional or state level.
2. The three variables under inquiry viz. stress-effects, role stressors and job
satisfaction may be test for their cause and effect relationship with other
variables such as personality characteristics, job commitment, leadership
styles, and coping strategies.
3. A same research can also be supervised on other professionals.
4. Role stress can be calculated in coaching faculty members teaching the IIT
and Medical courses.
5. In the current inquiry, the core was on the sample of teaching proficient
working in coaching institutes. In the same light, the teachers working in
other colleges and teaching management courses may also be studied.
6. In depth search may be attempted to indents “at the job” and “off the job”
issue of coaching teaching proficient’s.
7. This inquiry was bothered with inter group gender changes. Likewise, an
inquiry may be designed with intra group correlation.
8. Further study could regulate the effects of application of programs and
practices to pare stress-effects and stress levels of faculty members.
9. The working circumstances and workplace policy may be studied in regard
to stress.
10. Future study may conduct to lean work family conflict in various types of
organizational context.

209
5.5 RECOMMENDATIONS
Stationed on the findings of the current search, and hints backed by review
of literature, some interventions were create by the investigator as coping program
to action and lower stress in coaching teaching proficient to some amount.
These blueprints are basically mainly defending scope and hence cannot
erase stress perfectly. Yet, the investigator wish to form a new beginning by
making the authorities awake about the existence of stress in their faculty
members and the vital of lowering stress at the workplace for coaching teaching
proficient’s.
The recommended coping strategies for stress management are outline at
three levels namely personal level, family level and professional level.
Despite while designing and recommending coping strategies, the leading
core was on professional coping strategies, but some coping strategies were also
recommended at personal and family level. The existence of stress either at
personal or at family level will also dominance the work and conduct of faculty
members at the coaching institutions, which in turn will have an collision on the
field of education and thus society at large. Therefore the coping strategies were
recommended at all the three levels.
The recommendations made by the researcher at the professional level can
be given a due hope by the institutional heads. Then, as per the rightness of the
needs and availability of resources, each coaching institution can compute and
enable these recommendations for reducing stress in their faculty members.
The coping strategies in form of recommendations are given below:
1. Personal Level:
Definite techniques which the coaching faculty members can use for coping
with role stress insert the following:
Effective self control
It is a self cure technique for managing one’s own behavior to lessen stress.
Faculty members can avert people and position that they know will put them
under stress.

210
Cognitive Therapy
It is another self cure method by which a faculty member can easily modify
the self defeating knowing which may needlessly cause stress and lead to
physiological and psychological stress-effects. A personal diary can be
managed by the faculty members to let out the pent up feelings through
writing. ‘Stress talk’ and ‘stress analysis’ can go a long way in guiding an
individual’s behavior and the stress.
Time Management
For balancing work and family roles, cope up better with work overload
(RO), time pressures and Role expectation conflict (REC), the faculty
members can compute and reschedule their work and family activities
accordingly.
Social Support
Social support can be valuable for vitiate stress. The faculty members can
form federation with trusted and sensitive people either at the work place or
in the family or at both the places. These people can admit to the trouble,
and add hold whenever needed by building courage and help the faculty
members overcome stressful locale.
Innovative Teaching Methods
The faculty members can probe and use addition methods of teaching.
These mechanisms can be used to amend knowledge and skills. This will
give a lot of morale and job satisfaction to the faculty members thereby
lowering the stress-effects experienced by them especially the psychological
stress.
Exercise
Stationed on the findings, it is recommended that male faculty members
should employ themselves in Yoga, Gymnasium, and Meditation along with
their other exercise related activities. Alike, women faculty members also
can employ themselves in aerobics, cycling, music therapy and laugher club
activities. Both genders can pursue these activities handy to their age. These
activities can produce outlet to their feelings and emotions and aid in
lowering physiological and psychological stress.

211
Leisure Time
Leisure time can be used by faculty members for doing some activities
which gives them bliss and aid in building network with others. Hobbies
can easily be attempt in leisure time. Recreational activities, hobbies and
connecting with friends can all aid to hamper the damaging effects of stress.
2. Family Level
The techniques suggested here require the involvement of family members
to help individual faculty members cope with stress.
Sharing of Household Duties
Timely sharing of household work and delegation of household duties to the
family members and dependents can help to solve the problem of overwork
at home, fatigue and physiological stress to a large extent in the
management faculty members.
Family Support
Support from family members especially from spouse and other dependents
can help in completion of various running errand jobs, problem solving
through discussions and participative decision making. The collaborative
effort of family members together in dealing with family matters can create
a compromising situation and thus reduce stress levels. It is a collective
coping strategy at family level.
Approach Coping
Through efficient open communication, a faculty member can share and
discuss issues relevant to work, workplace ambience, working situation and
relationships at work either with spouse or any other elder member of the
family if any. Sharing feelings and experiences freely will permit the faculty
members to hold genuine suggestion for dealing with stressful positions.
A good affinity and free communication amidst family members will boost
an easy contact to each other in times of need. Sharing of ideas and feelings
relevant to a stressful position with a family member can surely aid in
creating ways to combat stress in faculty members.

212
3. Professional Level
The following stress coping strategies may be planned and enforced by
management authorities to control work stressors and to lower job stress in
faculty employees.
1) Family Supportive Work Culture
Evolution of family supportive work culture is firmly recommended placed
on the findings of the current search through
a) “Flexible timings” and provision of flexible personal days would be helpful
on occasions when dependents in the family require personal consideration
on medical grounds, aid during exams or any other instant activity that
crops up.
b) Assistance can possibly be allow by financing and setting up a day care for
faculty members with young children. Pay-off can be taken from the faculty
members on a monthly basis.
c) If possible, facilities for exercise to the faculty members may be serve at the
institutes. Yoga being the most popular and efficient relaxation method
acceptable for all age groups may be practiced during the free periods, and
before or after workplace timings.
2) Selection and Recruitment
At the time of hearing and placement a clear insight of job description and
role clarity can go a long way in lowering battle arising from role doubt and
role expectation later on. At this level, more comprehensive introduction
programs may be carried out for efficient release of duties, roles and
functions relevant to teaching learning activities in coaching education.
3) Even though teaching is a solitary activity, “collective coping” is a
preventive scheme which may be boost through “team work”, setting up of
united work groups, expanded assistance and enhanced communication at
the workplace. Multiple activities such as joint and inter-department
research projects, workshops, seminars and other academic meets may be
planned, whenever possible to strengthen collective coping.
4) Effective Coping: It is a leading interference method. Directional and
constructive issue solving should be used by all coaching institutes. Faculty

213
members should be given a chance to come up with original guess, and form
new skills in their field of specialization. Participative and alive outcome
making is the need of the hour.
5) Manpower Planning: Input output ratio matching should be insure by
institution heads. In some institutes, skilled young persons may have to wait
for years composed for assignment whereas in other institutes, skilled
faculty members may not be accessible at all. So, it should be assure that
training programs are planned containing all specializations and covering
utmost geographical region. This would aid in timely appointment of new
applicable faculty members.
6) Transparency in Policies and Procedures: The institutions are necessary
to retain transparency in their rules, policies and procedures, aids, grants and
funds for different activities. This will not only permit the faculty members
to be more clear about the vision and mission of the institutes but also boost
more pledge towards the institute main to more work-rate, raised job
satisfaction and lower stress levels.
7) Employment Benefits and Retirement Plans: Coaching institutes
especially private ones should modify their pay packets and perks such as
medical compensation, leave travel allowances, education allowance for
faculty members and their children and travel allowance from time to time
to keep pace with high cost of living. Retirement perk plans should also be
modify in the elite concern of the faculty members for a harmonious stress
free retired life.
8) Resource Center: Resource center can be entrenched at the institutes for
teaching faculty members under formation and for the counseling of
educators. The institute heads can retain close cooperation and avail
working partnership with the neighboring institutes for transfer of study
resources, sophisticated apparatus and personnel. Retired faculty members
and Alumni can be invited to work as educators to give inputs on teaching
study activities and plan training for practicing faculty members. The stress
relevant to anxiety of teaching in trainees can thus be lower to some extent.

214
5.6 LIMITATIONS
While specify and administer the research survey, the researcher confronts
sure limitations which are as follows:
1. Coaching institutes living recent in root employed only a small number of
faculty members who were well experienced with long service period as
correlated to a large number of faculty members with short service period.
May be, due to less experience, the faculty members were not able to
clearly relate stress-effects with their job.
2. Some coaching institutes were placed on the outer edge of Kota. The study
could not sample from these institutes due to the high cost of resources and
factual difficulties in data collection.
3. Most of the small private coaching institutes conduct their education with
the visiting faculty members and employ less number of permanent faculty
members. Visiting faculty members being cult of the other institutes where
they work full / part time might announce the affect of a different work
culture on their pledge towards teaching duties which might affect their
stress relationships.
4. Since the spotlight of this search was on the role of line elemental the stress-
effects in faculty members and not on the use of advanced statistical
operation, the statistical method of multifarious analysis could not be used
to survey these determinants together.
Thus the present study opened up some other facet of stress experiences in
coaching teaching faculty members which need further research in order to know
more about them.
Even though stress from the footstep of variation in teaching and study
activities are inevitable, the faculty members can avert becoming a victim. By
taking the time essential for stress preventive activities, they can save on time and
resources and expand their performance. Enlighten is half the battle won. They
can hamper or at least underrate the syndrome of stress by acknowledge to stress
in their own exclusive way and get back in command. The coaching institutes
supply them a freedom to shoulder responsibilities, hit new roles, connect with
new people and confront new positions.

215
The efficient performance of these roles can edge them to a higher status,
better income, strengthen their area and achieve a more impartial role distribution
between the two genders at work and in the family. With stress at a slightest level,
off the working hours, they can also engage in socially meaningful and influential
programs and thereby extend their resource base and statue base.
With further information of the exact method inserted in the stress-work
relationship, certain processes (coping strategies) to lowers occupational stress in
coaching teaching faculty members may be used and occupational health
advantages may be perfect. Coping strategies can be used at the workplaces to
excel meet the needs of both employers and the faculty members. The coaching
employers can no longer allow to ignore their role in stimulate healthier stress free
employees with growing levels of job satisfaction, organizational commitment
and motivation. A stress free work culture can promote decreased staff turnover,
absenteeism and higher quality of coaching education.
*****

CHAPTER - 6 SUMMARY

216
CHAPTER-6
SUMMARY
6.1 OVERVIEW OF THE STUDY
The impact of globalization, urbanization and rapid technological changes
have led to the emergence of many coaching institutes in Kota recently. Growth in
the corporate sector has resulted in the requirement of trained and educated
workforce in the industry. The teaching faculty members are the facilitators for
knowledge and skill through interactive learning methods in coaching education.
Fast changing educational process in the present century has influenced the
role of teaching professionals, their responsibilities and teaching activities at
coaching institutes. As a result, through common work and non work stressors,
ultimately lowering down their psychological well being. Along with teaching, a
faculty member has to perform varied other duties such as doing administrative
jobs, attending faculty meetings, advising students, guiding project work,
internship, summer placement of students, conducting exams, doing assessment
and undergoing faculty advancement schemes. In present times, young teaching
professionals are increasingly confronted with a problem of conflict between work
role and an equally demanding role at home. As a result, a teaching faculty
member lives in two systems and needs to perform both professional as well as
familial roles. This in turn leads to stress amongst them.
Therefore a coaching faculty member is under considerable pressure and
stress throughout the year.
6.2 RATIONALE FOR THE STUDY
As the flourishing of coaching institutes in Kota is a new development, very
few efforts have been made to examine stress in faculty members. Search
supports that teach “Dworkin”, “Haney”, “Dworkin” and “Telschow”, (1990),
“Jackson”, “Schwab” and “Schuler”, (1986), and work role stress is a common
stressor in these professionals. “Occupational stress in teaching has physical ill
health, ultimately having injurious effect on the efficiency” “Camp”, (1985),
“Claxton”, (1989), have identified stressors for teacher groups in specific teaching
texts but there is unusual absence of search in Indian circumstances. The

217
researcher was excited to understand effect of stress on health and ways of coping
with stress amid these teachers.
The investigator desired to classify the main causes of stress and
conceptualized three basic premises:-
Firstly, the effects of stress on teaching professionals are altered by gender
and service period.
Secondly, numerous personal factors, family factors, and situational factors
are responsible for stress.
Thirdly, the stress-effects are blended with role stressors and job satisfaction
in teaching faculty members.
In the shine of the above premises and the previous backdrop it was decided
to carry out the current study.
6.3 CONCEPTUAL FRAMEWORK
The conceptual framework was made to examine the reaction of stress
caused by various antecedent factors in coaching teaching professionals.
It was projected that antecedent factors such as personal, family and
situational factors caused stress-effects in faculty members leading to
physiological, psychological and behavioural effects. Also, the stress-effects in
faculty members varied with gender and period of service. Further, teaching
professionals practiced stress rising out of different roles performed in execution
of teaching activities and responsibilities which dominances their job satisfaction
level.
6.4 STATEMENT OF PROBLEM
In order to know the mutual relationship between the three variables viz.
stress-effects, roles stressors and job satisfaction, this research was designed.
The problem was stated as “Managing Stress to Improve Efficiency and
Motivation: A Case Study on Academic Performance of Coaching Faculties
in Kota City”.

218
6.5 SIGNIFICANCE OF THE STUDY
Teaching faculty members may practice role stress because of multiple roles
they play in society. The dispute between work and family appeals may all put a
pressure on the teaching faculty members. Much of the prior researches on stress
have centralized on managerial and professional groups but tend to ignore
occupations relevant to teaching. The placed study would be helpful and socially
relevant to the current issues of work and family role offset and the stresses rising
therein.
6.6 REVIEW OF LITERATURE
Related references from literature and research studies were gathered from
books, journals, research papers and research articles. Some related literature was
also retrieved from different internet websites.
The review of literature was bestowed as under:-
1. Stress, theoretical background and related studies.
2. Antecedents of stress and related studies.
3. Stress-effects and related studies.
4. Role stress and Role stressors
a.) Family role stressor and related studies.
b.) Work role stressors and related studies.
5. Job satisfaction and related studies.
6. Stress management - coping strategies and related studies.
7. Stress in teaching professionals and related studies.
6.7 METHODOLOGY
The study’s main pre-eminence was on reflex stressor and work role
stressors along with job satisfaction. The search also desired to classify the
antecedent factors of stress in coaching faculty members.
6.7.1 Research design
The descriptive research design was preferred as the most appropriate one
for this research. It took into account different features of stress as a sensation to
be studied.

219
6.7.2 Objectives
The current study was formulated with the following objectives:-
1. To determine the effects of stress experienced by male and female coaching
faculty members.
2. To understand the causes or antecedent factors of stress amidst coaching
faculty members.
3. To calculate the amount of job satisfaction relevant to family role stressor
and work role stressors.
4. To know the relationship between stress-effects and job satisfaction.
5. To examine the relationship between stress-effects and role stressors in male
and female faculty members.
6.7.3 Assumptions of the study
1. Coaching teaching faculty members experience stress at the workplace.
2. Gender wise difference in the stress experienced by faculty members can be
identified
3. Service wise variation in the stress experienced by faculty members can be
identified.
6.7.4 Hypotheses
H1: The extent of stress-effects felt by faculty members differs by
personal factors.
H2: The extent of stress-effects felt by faculty members differs by
family factors.
H3: The extent of stress-effects felt by faculty members differs by
situational factors.
H4: There is a significant association between the extent of stress-effects
felt by faculty members and their academic performance.
H5: There is a significant association between the extent of stress-effects
felt by faculty members and their job satisfaction.

220
6.7.5 Variables
Planted on the framework and with elaborate justification two sets of
variables were elected for this search viz. independent and dependent variables.
The independent variables were then again classified into two grades viz.
individual and job related variables. All the variables under search were as
follows:
I. Independent variables A. Individual factors 1. Gender 2. Personal factor 3. Family factors B. Job related factors 1. Situational Factor 2. Service Duration 3. Role Stressors 4. Job Satisfaction II. Dependent variables 1. Effects of Stress
6.7.6 Delimitations of the study
The search was limited to
1) Teaching proficient’s working at various coaching institutes in Kota city.
2) Teaching faculty members who are in service at present inclusive of part
time visiting faculty members.
6.7.7 Data collection procedure
A survey study plan was adopted for the current search. Questionnaire was
used as an instrument for collection of data. It was composed keeping in mind the
objectives of the study. A total of 400 questionnaires were distributed in all
coaching institutes firstly. But only 255 completed questionnaires were returned
from 10 coaching institutes representing a 63.75 percent response rate. The 255
questionnaires were then prepared for data processing. The data collection period
fell between April and August, 2017.

221
6.7.8 Tools used for measurement of the variables
The three most applicable standardized scales used in the current search
were as follows:-
1. Organisational Role Stress (ORS) Scale by “Pareek Udai”, (1983c)
revised in (1997, 2002, 2010) measured the ten types of role stressors.
2. Stress Test It was refined by “Dr. Prabhu G.G.”, “NIMHANS”, Banglore,
in (1991-92). It was used to calculate the level of stress-effects viz.
physiological, psychological and behavioural in teaching faculty members.
3. Job Satisfaction Scale This scale was used to calculate the level of job
satisfaction in coaching teaching professionals. It was refined by “Murali
D.” and “Kulkarni M.S.”, in 1997.
6.7.9 Selection of the sample
A total of localities with 10 coaching institutes located in Kota develop the locale of the Study. The respondents were picked by purposive sampling technique on the footing of certain benchmark. 6.7.10 Analysis of data
The data relevant to numerous variables were graded into groups in a
structured fame for the view of analysis. Standardized rules for role stressors
based on median and quartile deviation were submitted for low, median and high
levels by “Pareek Udai”, (1982a) and “Khanna”, (1986) for managers and the
same were used. For all the three stress-effects Mean (M) and Standard deviation
(SD) were used as a base to formulate the grades of level i.e. low, medium and
high.
Likewise, for job satisfaction also, as implied in the scale, three levels of
job satisfaction viz. low, moderate and high were formulated by using the base of
Mean (M) and standard deviation (SD).
After grading, data were codified and counts were given. The data were
then tabulated and charts were formed to represent the different grades as well as
the male female differences based on the data.

222
6.7.11 Statistical analysis
The data were fully analysed using SPSS package 22.0. Data were analysed
applying descriptive as well as relational statistics.
Descriptive statistics: The data were showed in frequencies, percentages,
mean and standard deviation for the analysis of personal profile, job profile
and family profile of respondents along with data related to ten role
stressors of faculty members by gender, data on three stress-effects
experienced and data on job satisfaction of faculty members.
Relational statistics: Statistical analysis was drifted out to search the
relationship between elected variables and to test the null hypotheses stated.
6.8 HYPOTHESES VIEWED AS PER THE ANALYSIS
H01: The extent of stress-effects felt by faculty members does not differ by
personal factors.
H11: The extent of stress-effects felt by faculty members differs by personal
factors.
The extent of stress-effects felt by faculty members was found to be
significantly different due to personal factors including their age, gender,
qualification, experience, severity of illness, duration of illness etc. Hence, null
hypothesis got rejected and alternate hypothesis stood accepted.
H02: The extent of stress-effects felt by faculty members does not differ by
family factors.
H12: The extent of stress-effects felt by faculty members differs by family
factors.
The extent of stress-effects felt by faculty members was found to be
significantly different due to family factors including their marital status, type of
family, no. of dependents etc. Hence, null hypothesis got rejected and alternate
hypothesis got accepted.

223
H03: The extent of stress-effects felt by faculty members does not differ by
situational factors.
H13: The extent of stress-effects felt by faculty members differs by
situational factors.
The extent of stress-effects felt by faculty members was found to be
significantly different due to family situational factors including designation,
timings at workplace, hrs spent at workplace etc. Hence, null hypothesis got
rejected and alternate hypothesis got accepted.
H04: There is no significant association between the extent of stress-effects
felt by faculty members and their academic performance.
H14: There is a significant association between the extent of stress-effects felt
by faculty members and their academic performance.
A significant association was found between the extent of stress-effects felt
by faculty members and their academic performance. Therefore, null hypothesis
got rejected and alternative hypothesis stood accepted.
H05: There is no significant association between the extent of stress-effects
felt by faculty members and their job satisfaction.
H15: There is a significant association between the extent of stress-effects felt
by faculty members and their job satisfaction.
A significant association was found between the extent of stress-effects felt
by faculty members and their job satisfaction. Therefore, null hypothesis got
rejected and alternative hypothesis stood accepted.
6.9 CONCLUSION
As per the analysis it could be concluded that there is a need to put more
emphasis on monetary and non-monetary incentives in order to build motivation
among coaching faculty members. To the least extent, this research finds that the
institution should pay more attention towards how to decrease working hour,
relieve excessive workload, increase income, and promote participation in
organization development and allow faculty members to be heard which will

224
bring about job satisfaction among them. If they feel insecure in their career and
develop job stress, it will not only adversely affect them but also on the students
to the extent that they may start to view that the institute is not effective anymore.
These are critical for new generation of faculty members to come into the system
that may result in indefinite shortage of professional workforce.
******

BIBLIOGRAPHY

225
BIBLIOGRAPHY
Aditya, S.M. and Sen, A.K. (1993). “Executive under stress: A comparison
between men and women.” Journal of the Indian Academy of Applied
Psycology.19 (1-2). pp. 1-6.
Agarwal, Rita (2001). Stress in life and at work. New Delhi, Sage
Publications India Pvt. Ltd.
Agervold, M. (1985). “Office work and psychological stress.” Journal of
Occupational Behavior. 10. pp.1-29.
Ahmad, S, Bharadwaj, A and Narula, S (1985). “A study of stress among
executives.” Journal of Personality and Clinical studies. 1(2). pp. 47-50.
Ahmad, S. and Khanna, P. (1992). “Job stress and satisfaction of middle
level hotel employees.” Journal of Personality and Clinical Studies. 8(1-2).
pp. 51-56.
Akhtar, Sultan and Vadra, Priti (1990). “A comparative study of extra
organisational stress among women teachers and nursing staff”. Paper
presented at the 27th Annual Conference of IAAP, Aligarh, and Aligarh
Muslim University.
Baneerjee (1989). “Negative relationship between role stress and mental
health of employees in service organisation.” Cited in Pestonjee, D.M.,
(1992), Stress and Coping: The Indian Experience, 2nd Edition, New Delhi,
Sage Publications India Pvt. Ltd
Barling, J., Kellowy, E.K. and Iverson, R.D. (2003). “High Quality work,
job satisfaction and occupational injuries.” Journal of Applied Psychology.
88(2). pp. 276-283.
Beehr, T. and Newman, D. (1978). “Job stress, Employee Health and
organisational effectiveness: A facet analysis, model and literature review”.
Personal Psychology. pp. 665 - 700.
Beehr, Terry A. and Bhagat, Rabi S. (eds.) (1985). Human Stress and
Cognition in Organisations: An Integrated Perspective. New York: Wiley.
Beena, C. and Poduval, P.R. (1991). “Gender differences in work stress of
executives”. Psychological Studies. 37(2-3). pp. 109-113.
226
Bhagat, R.S., Mc Quaid, S.J., Lindholm, H., and Segovis, J. (1985). “Total
life stress: A multi method validation of the construct and its effects on
organisationally valued outcomes and withdrawal behaviors”. Journal of
Applied Psychology.70. pp. 202-214.
Bhandarker, A. and Singh, P. (1986). “Managerial stress: A study in cyclical
perspective”. ASCI, Journal of Management. pp. 25-59
Bhatnagar, D. and Bose, K. (1985). “Organisational role stress and branch
managers”. Prajnan. 14(4). pp. 349-360.
Bhattacharya, Sunetra and Basu, Jayanti (2007). “Distress, wellness and
organizational role stress among IT professionals: Role of life events and
coping resources.” Journal of the Indian Academy of Applied Psychology.
33(2). pp. 169-178.
Bidyadhar, Shwetaleena and Sahoo, Fakir, M. (1997). “Psychological
factors of work- family linkage.” Psychological Studies. 42(2, 3). pp. 49-59.
Biswas, P.C. and De, T. (1993). “Effects of organisational climate of school
secondary teacher’s professional stress: An exploratory study”. Indian
Journal of Psychometry and Education. 24(1). pp. 45-52.
Camp, M.D. (1985, 1986). “Selected stress factors concerning the teacher
faculty as they relate to students and parents, colleagues, administration,
financial security, the job and profession in a selected school district”.
Dissertation Abstracts International.
Caplan, R.D. and Jones, K. W. (1975). “Effects of workload, role
ambiguity, and Type A personality on anxiety, depression, and heart rate”.
Journal of Applied Psychology. 60. pp. 713-719.
Caplan, R.D. (1985). “Subjective past, present and future fit: Effects of
anxiety, depression and other indicators on well being”. Journal of
Personality and Social Psychology. 48(1). pp. 180-197.
Chan, Alan H.S., Chen, K. and Chong, Elaine Y.L. (2009). “Work stress of
teachers from primary and secondary schools in Hong Kong”. International
Multi Conference of Engineers and Computer Scientists (ICMECS), March.
Pp.17-19.

227
Chandraiah, K., Agarwal, S.C., Marimuthu, P. and Manoharan, N. (2003).
“Occupational stress and job satisfaction among managers.” Indian Journal
of Occupational and Environmental Medicine.7 (2). pp. 6-11.
Chaplain, R.P. (2001). “Stress and job satisfaction among primary head
teachers: A question of balance?” Educational Management Administration
and Leadership. 29(2). pp. 197-215.
Cohen, E. and Lazarus, R.S. (1973). “Active coping processes, coping
dispositions and recovery from surgery”. Psychosomatic Medicine. 35. pp.
375-389.
Coles, M. and Walker, S. (eds.) (1989). Teaching and Stress. Milton
Keynes: Open University Press.
Cooper, C. L., and Davidson, M. (1987). “Sources of stress at work and
their relation to stressors in non-working environments”. Cited in Kalimo,
R., El-Batawi, M. A. E. and Cooper, C. L. (eds.) (1987), Psychological
factors at work and their relation to health. Geneva, Switzerland: World
Health Organisation. pp. 99-123.
Cooper, C. L., Sloan, S. J., and Williams, S. (1987, 1988). Occupational
Stress Indicator (OSI). Windsor, England: NFER-Nelson.
Cooper, C. L., Watts, J., Baglioni, A. J., and Kelly, M. (1988).
“Occupational stress amongst general practice dentists.” Journal of
Occupational Psychology. 61(2). pp. 163-174.
Cox, J. (1985a, b). Cited in Travers, Cheryl. J. and Cooper, Cary, L.
“Background to the study of teacher stress.” Teachers under pressure: Stress
in the teaching.1996, Routledge 270 Madison Ave, New York. pp. 26
David, Fontana (1989). Managing Stress. Excel Books. 1st edition, New
Delhi. pp. 1-115.
Devi, Indira, M. (1987). Women education, employment and family living:
A study of emerging Hindu wives in Urban India. Delhi: Gyan Publishing
House.
Donaldson, S.I. (1993). “Effects of lifestyle and stress on the employee and
organisation: Implications for promoting health at work.” Anxiety, stress
and coping. 6. pp.155-177.

228
Dworkin, A. G., Haney, C. A., Dworkin, R. J. and Telschow, R. L. (1990).
“Stress and illness behaviour among urban public school teachers”.
Educational Administration Quarterly. 26 (1). pp. 60-72.
Eckenrode, John and Gore, Susan (1990). “Stress and coping at the
boundary of work and family”, “Where work and family met: Stress across
social roles”, “Role related stress in married couples”, “Stress between work
and family: Summary and conclusion.” Stress between work and family.
New York and London, Plenum Press. PP. 1-13, 100-113, 153-173, 205-
215.
Edgerton, Susan, K. (1977). “Teachers in role conflict.” Phi Delta Kappan.
LIX. pp. 120-122.
French, J. R. P., Jr., and Caplan, R. D. (1970). “Psychological factors in
coronary heart disease”. Industrial Medicine. 39. pp. 31-45.
Frankenhaeuser, M and Odman, M. (1983). Stress – part of life. Stockholm,
Bromberg’s, Sweden.
Ganguly, K. (1988). “Role of perceived control in coping with stress”. Ph.
D. Thesis, Bhopal University, Bhopal.
Ghanekar, Anjali (1995). Organisational behaviour: Concepts and cases,
Pune, Everest Publishing House. Pp.315-335.
Gupta, N.K. and Pratap, S. (1987). Cited in Gupta, N.K., (1988),
“Organisational role stress and coping strategies of public sector
executives”. Ph. D. Thesis. Department of Humanities and Social Sciences,
University of Roorkee, Roorkee.
Hall, D.T. and Gordon, F. (1973). “Career choices of married women:
Effects on conflict, role behaviour, and satisfaction”. Journal of Applied
Psychology. 58. pp. 42-48.
Hendrix, W., Ovalle, N.K. and Troxler, R.G. (1985). “Behavioral and
psychological consequences of stress and its antecedents’ factors.” Journal
of Applied Psychology. 70. pp. 188-201.
Husain, A. (1998). “Management of stress disorders through individual
control techniques.” Cited in Pestonjee, D.M., Pareek, U. and Agarwal, R.
(eds.), (1999) Studies in stress and its management. Delhi, Oxford and IBH.

229
Ivancevich, J.M. and Matteson, M.T. (1980). Stress and work: A managerial
perspective. Glenview, Ill, Scott, Foresman.
Ivancevich, J.M., Matteson, M.T., Feedman, S.M. and Phillips, J.S. (1990).
“Worksite stress management interventions.” American Psychologist. 45.
pp. 252-261.
Jagdish, (1983). “An investigation into the relationship of Perceived
Occupational Stress with Job Satisfaction and Mental Health of First Level
Supervisors”. Ph.D. Thesis. Banaras Hindu University, Varanasi.
Jagdish and Srivastava, A. K. (1989). “Perceived Occupational Stress and
mental health: A case study.”Indian Journal of Industrial Relations. 24(4).
pp. 444-452.
Kahn, R.L., Wolfe, D.M., Quinn, R.P., Snoek, J.D. and Rosenthal, R.A.
(1964). Organisational stress: Studies in role conflict and ambiguity. New
York, Wiley.
Kanner, A.D., Coyne, J.C., Schaefer, C. and Lazarus, R.S. (1981).
“Comparison of two modes of stress measurement: Daily hassles and uplifts
v/s major life event”. Journal of Behavioural Medicine. 4. pp. 1-39.
Kasl, S. V., and Cobb, S. (1970). “Blood pressure changes in men
undergoing job loss: A preliminary report”. Psychosomatic Medicine. 32.
pp. 19-37.
Kaur, G. and Murthy, V.N. (1986). Organisational role stress, coping
strategies and locus of control in major public sector industrial organization.
Unpublished manuscript.
Kelly, M and Cooper, C.L. (1981). “Stress among Blue Collar Workers”.
Employee Relations, 3. pp. 6-9.
Kets de Vries, M.F.R. (1979). “Organisational stress: A call for
management action”. Sloan Management Review. 21(1): pp. 3-14.
Khanna, S. (1986). “Life stress, anxiety and depression in working woman
of India: A study of moderators”. Unpublished Ph. D. Thesis. Shimla,
Himachal Pradesh University.
Khetarpal A. and Kochar G. K. (2006). “Role Stress and Preventive”. The
Internet Journal of World Health and Societal Politics. 3(1).

230
Koteswari B. V. (2004). “Influence of gender and length of service on stress
and coping behavior in organisation.” Ph. D. Thesis. Tirupati, Sri
Venkateshwara University.
Kothari, C.R. (2004). “Testing of Hypothesis”. Research Methodology:
Methods and Techniques. 2nd edition. Mumbai, New Age International.
Pp.184- 313.
Kumar, S. (1989). “A study of role stress, role satisfaction, role efficacy
among public sector executives.” Unpublished Ph. D. Thesis. Rohtak,
Maharshi Dayanand University.
Kumar, Satish (1997). “Relationship between organisational role stress and
length of service”. Journal of Psychological Researches. 41(172). pp. 39-43.
Kyriacou, C. (1987). “Teacher stress and burnout: An international review”.
Educational Research. 29. pp. 89-96.
Kyriacou, C. and Sutcliffe, J. (1979a). “Teacher stress and satisfaction”.
Educational Research. 21(2). pp. 89-96.
Kyriacou, C. and Sutcliffe, J. (1979b). “A note on teacher stress and locus
of control”. Journal of Occupational Psychology. 52. pp. 227-228.
Lakshmi, Siva M. Rama and Devi M. Sarada (2005). “Relative magnitude
of role satisfaction and role stress of women in different occupations”.
Praachi Journal of Psycho-Cultural Dimensions. 21(1). pp. 38-41.
Langford, V. (1988). “Stress, Satisfaction and Managers in the Construction
Industry”. Occupational Psychologist. 6. pp. 30-32
Luhadia, V. (1991). “A study of the relationship between role stress and job
satisfaction of geological officer at three different levels.” Unpublished
M.A. Thesis. Jaipur, University of Rajasthan.
Lundberg, U., Mardberg, B. and Frankenhauser, M. (1994). “The total
workload of male and female white collar workers as related to age,
occupational level, and number of children”. Scandinavian Journal of
Psychology. 35. pp. 315-327.
Maddi, S.R. and Kobasa, S.C. (1984). “The hardy executive: Health under
stress. Homewood, Illinois, Dow Jones-Irwin.
231
Major, Virginia Smith (2002). “Work time, work interference and
psychological distress”. Journal of Applied Psychology, 87(2).
Malhotra, Y. (1996). Organisational learning and learning organizations: An
overview.
Mannivannan, L., Saravanaraj, M.G. and Sumathi, S. (2007). “Managing
stress among the employees.” The ICFAI Journal of Organisational
Behaviour. 6(2). pp.53-9.
Martin, T. N. (1984). “Role stress and inability to leave as predictors of
mental health.” Human Relations. 37(11). pp. 969-983.
Mathur, S. (1997). “Correlated of role stress in working women.” Cited in
Cited in Pestonjee, D.M. and Pareek, U. (eds.), (1997), Studies in
organizational role stress and coping. Jaipur or New Delhi, Rawat
Publications.
Mc Nair, D., Lorr, M, and Droppleman, L. (1971). Profile of mood states
manual. San Diego, Educational and Industrial Testing Service.
Mishra, R. (1996). Gender differences in stress and job satisfaction among
teachers of higher educational institutions. Unpublished M.A. Dissertation.
Department of Psychology, Lucknow University, Lucknow.
Mohan, V. (1993). “Effect of training in human resource development on
leadership styles and effectiveness.” Journal of the Indian Academy of
Applied Psychology. 19(2). pp. 81-84.
Murali, D. and Kulkarni, M.S. (1997). “Scale to measure the level of job
satisfaction of working women”. Indian Journal of Applied Psychology.
34(2). pp. 17-21.
Murphy, L.R. (1984). “Occupational stress management: A review and
appraisal.” Journal of Occupational Psychology. 57. pp. 1-15.
Nomaguchi, Kel M. and Bianchi, Suzanne, M. (2004). “Exercise time:
Gender differences in the effects of marriage, parenthood and employment”.
Journal of marriage and family.66. pp. 413-430.
Nuernberger, Phil (1990). Freedom from stress. Pennsylvania, Himalayan
International Institute of Yoga Science and Philosophy.

232
Orpen, Christopher (1982). “Type A personality as a moderator for the
effects of role conflict, role ambiguity and role overload on individual
strain”. Journal of Human Stress. 8(2). pp. 8-14.
Orpen, Christopher (1996). “Cognitive failure as a moderator of the effect of
work stress on personal strain: An Empirical study”. Psychological Studies.
41 (1, 2). pp. 50-52.
Pandey, A. (1997). “Role stress and role efficacy.” Cited in Pestonjee, D.M.
and Pareek, U. (eds.), (1997), Studies in organisational role stress and
coping. Jaipur or New Delhi, Rawat Publications.
Pareek, A., and Mehta, M. (1997). “Role stress among working women”.
Cited in Pestonjee D.M., and Pareek U. (eds.), (1997), Studies in
Organisational Role Stress and coping. New Delhi: Rawat Publications. pp.
173-181.
Pareek, U. (1983, 1983c). Role stress scale: ORS scale booklet, answer
sheet and manual. Ahmadabad, Navin Publications.
Pareek, Udai and Purohit, Surbhi (1997, 2002, 2010). “Organisational role
stress scale (ORS)”, Training instruments in Human Resource Development
and Organisational Development, 3rd edition. New Delhi, Tata McGraw
Hill Publishing Company Ltd. pp. 489- 553.
Parsons, J.J. (1973). “Assessment of anxiety about teaching using the
Teaching Anxiety Scale: Manual and research report”. The Research and
Development Center for Teacher Education, University of Texas.
Pestonjee, D.M. (1987a). Executive stress: Should it always be avoided?
Vikalpa. 12 (1). pp. 23-30.
Pestonjee, D.M. (1987b). “A study of role stress in relation to Type-A and
Anger”. Working paper no. 670. Indian Institute of Management,
Ahmadabad.
Pestonjee, D.M. and Mishra, P.K. (1999). “Role stress and job satisfaction
amongst doctors.” Journal of Health Management. 1(1). pp. 117-131.
Pestonjee, D.M. and Singh, G.P. (1987). “Organisational behavior issues for
managers and systems analysis”. Working Paper no. 660. Ahmadabad,
Indian Institute of Management.
233
Prabhu, G.G. (1991, 1992). Stress test. Bangalore, NIMHANS. (This test
was obtained personally from Dr. Deshpande, S.W., Head, Department of
Psychology, Pune University in 2009)
Quick, J.C. and Quick, J.D. 1984). Organisational stress and preventive
management. New York, McGraw Hill.
Quick, J.C., Murphy, L.R. and Hurrell, J.J. Jr. (eds.) (1992). Stress and well
being at work: Assessment and interventions for occupational mental health.
Washington DC, American Psychological Association.
Rajagopalan, M. and Khandelwal, P. (1988). “A study of role stress and
coping styles of public sector managers.” Psychological Studies. 33(3): pp.
200-204.
Ramanamma, A. and Bambawale, D. (1987). Women in Indian Industry.
New Delhi. Mittal Publishers.
Ramu, G.N. (1989). “Women and Paid Work”, Women Work and Marriage
in Urban India: A study of dual- and Single-Earner couples. New Delhi,
Sage Publications India Pvt. Ltd. pp. 52-97.
Rao, S.K.R. (1983). “The conception of stress in Indian thought: The
theoretical aspects of stress in samkhya and yoga systems”. NIMHANS
Journal. 2. pp. 115-121.
Robbins, Stephen P., Judge, Timothy A. and Sanghi, Seema (2009).
“Attitudes and Job satisfaction”. Organisational behaviour. New Delhi,
Prentice Hall of India Pvt. Ltd. pp.76-106.
Sachdeva, U. (1994). “The effect of yogic lifestyle in hypertension.”
Homeostasis in health and disease. 35(4-5). pp. 264.
Sagar, J.K. (1994). “A structural model depicting salespeople’s job stress”.
Journal of the Academy of Marketing Science. 22. pp. 74-84.
Sarason, I. G., and Johnson, J. H. (1979). “Life stress, organisational stress
and job satisfaction”. Psychological Reports. 44. pp. 75-79.
Saraswati, L.S. (1974). “Job satisfaction of home scientists employed as
teachers”. Indian Journal of Home Science. 8(2). pp. 84-89.
Savara, Mira (1986). Changing trends in women’s employment: A case
study of textile industry in Bombay. Bombay: Himalaya Publishing House.

234
Sekaran, U. (1985). “The paths to mental health: An exploratory study of
husbands and wives in dual carrier families.” Journal of Occupational
Psychology. 58. pp. 129-137.
Selye, H. (1975). “Confusion and controversy in the stress field.” Journal of
Human Stress. pp. 37-44.
Selye, H. (1979b). The stress of my life: a scientist’s memories. New York,
Van Nostrand Reinhold.
Sen, Kakoli (2008). “Relationship between job satisfaction and job stress
amongst teachers and managers”. Indian Journal of Industrial Relations. pp.
1-5.
Sen, P.C. (1981). “A study of personal and organisational correlates of role
stress and coping strategies in some public- sector banks”. Unpublished Ph.
D. Thesis. Gujarat University, Ahmadabad.
Shahnawaz, M.G. and Ali, Nasir (2007). “Work- family conflict and
organisational commitment among dual career women.” Journal of National
Academy of Psychology, India. 52(3). pp. 248-252.
Sharma, R.A. (2000, 1982). Organisational Theory and Behaviour, 2nd
Edition. New Delhi, Tata McGraw-Hill Publishing Company Ltd.: pp. 484-
485, 487-502.
Sharma, S. and Acharya, T. (1989). “Coping strategies and anger
expression.” Journal of Personality and Clinical Studies. 5. pp. 15-18.
Shrimali, Vijay and Sen Ruchira (2009). “Relative factors of stress among
IT professional and gender differences of wellness among them.” Pacific
Business Review- A Quarterly Journal. pp. 22-31.
Singh, A.P. and Srivastava, U. R. (1996). “Social Support as a Moderator of
Stress-Health Relationship among Indian Managerial Personnel,”
Unpublished manuscript, as cited in Pestonjee, D.M., Stress and
Coping.1999, New Delhi, Sage Publications.
Singh, P. (2007). Effect of stress on job satisfaction and work values
amongst teachers. Allahabad, Adhyayan Publishers and Distributors.

235
Srivastava, A. K. and Krishna, A. (1992). “Employees' Job Involvement and
Mental Health in Public and Private Sector Organisations: A Comparative
Study.” Indian Journal of Industrial Relations. 28(1). pp. 62-70.
Srivastava, A.K (1997). “Dynamics of role stress in an organisation”. Cited
in Pestonjee, D.M. and Pareek, U. (Eds.). (1997), Studies in organisational
role stress and coping. Jaipur or New Delhi, Rawat Publications.
Srivastava, A.K. (1991a). “A study of role of stress mental health
relationship as moderated by adopted coping strategies.” Psychological
Studies. 36 (3). pp. 192-197.
Srivastava, A.K. (1999). “Conceptual perspective”, “Sources of
occupational stress”, “Consequences of occupational stress”, “Coping with
Occupational stress”. Management of Occupational stress: Theories and
Practice. New Delhi, Gyan Publishing House. pp. 9-29, 33-49, 51-84,141-
150.
Sultana (1995). “Gender differences in organisational role stress of
professionals and non professional teachers of high educational
institutions”. M.A. Thesis. Lucknow, Lucknow University.
Surti, K. (1982). “Some Psychological Correlates of Role Stress and Coping
Styles in Working Women”. Unpublished Ph. D. Thesis. Gujarat University,
Ahmadabad
Terryberry, S. (1968). “The Organisation of Environments”. Ph. D. Thesis,
Michigan, University Ann Arbor.
The Times of India (1997). Stress levels rising Asia. 8 December, New
Delhi.
Theorell T. and Rahe R.H. (1971). “Psychosocial factors and myocardial
infarction: An inpatient study in Sweden”. Journal of Psychosomatic
Research. 15. pp. 25-31.
Thoresen, C.E. and Eagleston, J.R. (1985). “Counselling for health”.
Counsel. Psychology. 13. pp. 15-87.
Travers, C., and Cooper, C. (1993). “Mental health, job satisfaction and
occupational stress among UK employees”. Work and Stress. 7. pp. 203-
219.

236
Unden, A.L., Orth-Gomer, K., and Elofsson, S. (1991). “Cardiovascular
effects of social support in the workplace: twenty four hour ECG monitoring
of men and women”. Psychosomatic medicine. 53. pp. 50-60
Vadra, P and Akhtar, S. (1989). “A study of extra- organisational stress”.
Paper presented at the national Seminar on Anxiety, stress and depression in
modern life, Patiala.
Verma, Romesh (1998). “Dynamics of teacher’s behaviour”, Psychology of
teachers: Model Approach for twenty first century, New Delhi, Anmol
Publications Pvt. Ltd. pp. 1-30, 74-77.
Voydanoff, Patrica (2004). “The effect of work demands and resources on
work-to-family conflict and facilitation”. Journal of marriage and family.66.
pp.398-412.
Warr, P. (1994). “A conceptual framework for the study of work and mental
health.” Work and Stress. 8(2). pp.84-97.
Watson Wyatt (2006). Work India Survey. Cited in Sonawane
Pragya.(2008) Non-monetary rewards: employee choices and organizational
practices. Indian Journal of Industrial relations.
Zafer, M. Syed, and Rao, S.B. Nageswara (1997). “Impact of organisational
role stress on job involvement of managers in public sector organisations.”
Indian Journal of Applied Psychology. 34(2). pp. 22-27.

237
LINKS AND WEBSITES
http://angeronmymind.wordpress.com/2008/10/04/the-connections-to-long-
hours-stress-and-anger-and-irritability
http://www.apa.org/monitor/jun02/employees.aspx
http://www.articlesbase.com/college-and-university-articles/management-
teachers-role-in-building-successful-managers-of-tomorrow-2989807.html
http://careers.stateuniversity.com/pages/737/Teacher-College.html.
http://faculty.weber.edu/molpin/healthclasses/1110/Bookchapters/introducti
onchapter/html
http://www.imdr.edu/
http://www.jstor.org/stable/4020300
http://www.jstor.org/stable/20387037
http://www.jstor.org/stable/2509239
http://www.jstor.org/stable/3000368
http://www.managingstressnow.com/2010/06/stress-management-for
teachers/.
http://mentalhealth.about.com/cs/stressmanagement/a/workstress803.htm
http://www.mitcom.edu.in
http://moneyandvalues.blogspot.com/2008/06/work-stress-longhours-and-
your-health.html
http://www.prel.org/products/Products/Coping-teacherStress.PDF
http://www.stress.org/hans.htm
http://www.brint.com/papers/orglrng.htm
http://www.crcnetbase.com/doi/abs/10.1201/9780203301654.bmatt
http://www.relojournal.com/ current%20Issue/toc.htm
www.authorsdesk.com
www.google.com
www.projectparadise.com
*****

RESEARCH PAPER
PUBLISHED


ANNEXURE

238
QUESTIONNAIRE
Title Of The Research Work- “Managing Stress To Improve Efficiency And
Motivation: A Case Study On Academic Performance Of Coaching Faculties In
Kota City”.
Location:- University of Kota, Kota.
Name of Scholar:- Shruti Sharma Research Supervisor:- Dr. Gopal Dhaker
APPENDIX A
Dear Respondent,
I, Shruti Sharma, am a Ph. D. student in the faculty of Commerce/
Management. I am studying “Managing Stress to Improve Efficiency and
Motivation: A Case Study on Academic Performance of Coaching Faculties in
Kota City”.
I have been selected you as one of my respondents as you are a faculty
member of an IIT/PMT Coaching institute of Kota city. I would like your co-
operation in answering the given questionnaire for my Ph.D. research work. All the
information given by you will be kept confidential and will be used only for
research purpose.
Your co-operation in giving genuine answers will be highly appreciated.
Thanking you,
Shruti Sharma
(Research Scholar),
University of Kota, Kota

239
Name of Coaching Institute: ________________________________________ Date: _____________ Code no.: ____________________
Questionnaire: Section I INSTRUCTIONS: Please give information about yourself in the spaces given below. Please do not leave any questions unanswered:
01 Age :
02 Occupation :
03 Designation at work :
04 Educational Qualification :
05 Area of Specialization :
06 Number of years of Teaching : Experience at the Present institution : Administration : Any other :
07 Spouse’s Educational Qualification :
08 Spouse’s Occupation :
09 Number of dependents :
10 Dependent’s relationship to respondent :
11 Total monthly family income (approximately) in Rupees.
12 Number of contributors to family income :
13 Number of hours spent at work place : ____________
14 Number of hours spent on traveling to and fro to workplace: ____________
15 Number of hours you sleep everyday: ____________ 16 Name the illnesses you suffer from: Mild :_______________________________________________________ Chronic :_____________________________________________________
17 Duration of illnesses : Years : __________________________ Months :__________________________
18 Type of treatment of illnesses : Regular treatment : Yrs. Periodical treatment : Yrs.
Special treatment : Yrs.
Any other treatment : Yrs.

240
Please put a tick mark (√) against the answer applicable to you.
19 Timings at the work place : Rigid : __________________________
Flexible :_________________________
20 Gender : Male : ________________________ Female : ______________________
21 Marital Status : Unmarried : ______________________________ Married : ______________________________ Divorced / separated: _______________________
Widow : _______________________________
_
22 Type of family : Joint: ______________________ Nuclear:____________________ Extended : __________________ Single parent : _______________
23 Your health status : Good : ____________ Average : __________ Poor : _____________
24 Is paid help employed for Yes : _______________
sharing household work : No : _______________
25 Are medical expenses taken care of easily : Yes : _________ No
:__________ 26 Do you carry out the following on regular basis : 1.Maintain regular meal timings: Yes : _____ No : ______ Sometimes: ______ 2.Take nutritious and healthy food : Yes : _____ No : ______ Sometimes: ______ 3.Follow health awareness program by obtaining health insurance for : Yourself : Yes : _________ No :_________ Spouse : Yes : _________ No : _________ Children : Yes : _________ No : _________
27 How often do you go for health check- ups : Monthly : __________________
Quarterly : _________________ Half yearly : ________________ Yearly : ____________________
28 Do you practice any of the following : Yoga : ___________________________
Gym : ____________________________ Walking : _________________________ Running : _________________________ Jogging : __________________________ Swimming : _______________________ Cycling : __________________________ Relaxation techniques : _______________ Any other : _________________________

241
Questionnaire: Section II
ORS – SCALE
(Outcome Rating Scale)
Read instructions carefully before responding on this sheet.
People have different feelings about their roles. Statements describing some of
them are given below. Use this answer sheet to write your responses. Read each
statement and indicate, in the space against the corresponding number in the answer
sheet, how often you have the feeling expressed in the statement in relation to your
role in the organization. Use the numbers given below to indicate your feelings.
If you find that the category to be used in answering does not adequately indicate
your own feelings, use the one which is closest to the way you feel. Do not leave any
item unanswered.

242
Score the items in the order given below. 0 if you never or rarely feel this way. 1 if you occasionally (a few times) feel this way. 2 if you sometimes feel this way. 3. if you frequently feel this way. 4. if you very frequently or always feel this way.
Write your answer in the space given on the right of each statement.
No. Statements 0 1 2 3 4
01. My role tends to interfere with my family life.
02. I am afraid I am not learning enough in my present role for taking up higher responsibility.
03. I am not able to satisfy the conflicting demands of various people above me.
04. My role has recently been reduced in importance.
05. My work load is too heavy.
06. Other role occupants do not give enough attention and time to my role.
07. I do not have adequate knowledge to handle the responsibilities in my role.
08. I have to do things in my role that are against my better Judgment.
09. I am not clear on the scope and responsibilities of my role (job).
10. I do not get the information needed to carry out responsibilities assigned to me.
11. I have various other interests (social, religious, etc.) which remain neglected because I do not get time to attend to these.
12. I am too preoccupied with my present role responsibility to be able to prepare for taking up higher responsibilities.
13. I am not able to satisfy the conflicting demands of my peers and juniors.
14. Many functions that should be a part of my role have been assigned to some other role.
15. The amount of work I have to do interferes with the quality I want to maintain.
16. There is not enough interaction between my role and other’s roles.
17. I wish I had more skill to handle the responsibilities of my role.
18. I am not able to use my training and expertise in my role.
19. I do not know what the people I work with expect of me.
20. I do not get enough resources to be effective in my role.
21. My role does not allow me enough time for my family.
22. I do not have time and opportunities to prepare myself for the future challenges of my role.

243
No. Statements 0 1 2 3 4
23. I am not able to satisfy the demands of clients and others Since these are conflicting with one another.
24. I would like to take on more responsibility than I am Handling at present.
25. I have been given too much responsibility.
26. I wish there was more consultation between my role and others’ roles.
27. I have not had the right training for my role.
28. The work I do in the organization is not related to my Interests.
29. Several aspects of my role are vague and unclear.
30. I do not have enough people to work with me in my role.
31. My organizational responsibilities interfere with my extra Organizational roles.
32. There is very little scope for personal growth in my role.
33. The expectation of my seniors conflict with those of Juniors.
34. I can do more than what I have been assigned.
35. There is need to reduce some parts of my role.
36. There is no evidence of several roles (including mine) being involved in joint problem solving or collaboration for planning action.
37. I wish I had prepared myself well for my role.
38. If I had full freedom to define my role, I would be doing Some things differently from the way I do them now.
39. My role has not been defined clearly and in detail.
40. I am rather worried that I lack the necessary facilities needed in my role.
41. My family and friends complain that I do not spend time with them due to the demands of my work.
42. I feel stagnant in my role.
43. I am bothered with the contradictory expectations different people have from my role.
44. I wish I had been given more challenging tasks to do.
45. I feel overburdened in my role.
46. Even when I take the initiative for discussions or help, there is not much response from the other roles.
47. I need more training and preparation to be effective in my work role.
48. I experience a conflict between my values and what I have to do in my role.
49. I am not clear what the priorities are in my role.
50. I wish I had more financial resources for the work assigned to me.

244
Questionnaire: Section III
Stress Test
Do you experience any of the following? Circle the appropriate number for each item.
1. NEVER 2. RARELY 3. SOMETIMES 4. OFTEN 5. ALWAYS
1. Headaches 1 2 3 4 5 2. Stomach aches or tension in the stomach 1 2 3 4 5
3. Backaches 1 2 3 4 5
4. Stiffness in the neck and shoulder 1 2 3 4 5
5. Increased blood pressure 1 2 3 4 5
6. Fatigue 1 2 3 4 5
7. Crying 1 2 3 4 5
8. Forgetfulness 1 2 3 4 5
9. Unprovoked shouting 1 2 3 4 5
10. Blaming others 1 2 3 4 5
11. Bossiness 1 2 3 4 5 12. Compulsive chewing 1 2 3 4 5
13. Compulsive eating 1 2 3 4 5
14. Agitation 1 2 3 4 5
15. Anger 1 2 3 4 5 16. Gossiping 1 2 3 4 5
17. Teeth grinding 1 2 3 4 5
18. Worrying 1 2 3 4 5
19. Depression 1 2 3 4 5
20. Impatience 1 2 3 4 5
21. Frustration 1 2 3 4 5 22. Loneliness 1 2 3 4 5
23. Powerfulness 1 2 3 4 5
24. Inflexibility 1 2 3 4 5
Any other

245
Questionnaire: Section IV
Job Satisfaction Scale
SA–Strongly Agree 5 A-Agree 4 UC–Uncertain 3 DA–Disagree 2 SDA–Strongly Disagree 1
Note : Please tick mark ( √ ) the answer most suited to you for each item.
Please do not leave any item unanswered.
No. Statements SA A UC DA SDA
01 I do not get satisfaction of job because I am always insulted by my boss at work place.
02 I get satisfaction of job because I get opportunity to exhibit my talents / skills.
03 I get satisfaction of job because I am appreciated by my boss.
04 I do not get satisfaction of job because office work keeps me always under stress.
05 I do not get satisfaction of job as I am always discouraged by my boss.
06 I get satisfaction of job because it keeps me away from boredom
07 I get satisfaction of job because job is light in nature.
08 I do not get satisfaction of job because I do not get along well with my colleagues.
09 I get satisfaction of job because I feel that job is of my caliber.
10 I get satisfaction of job because I have good relation with my boss, colleagues, subordinates in work place.
11 I do not get satisfaction of job because it doesn’t help me in raising my personal status
12 I get satisfaction of job because it improves my personal status in society
13 I get satisfaction of job because it helps me in having financial security
14 I get satisfaction of job because job provides good leave facility
15 I get satisfaction of job because it helps me in providing better education to my children
16 I do not get satisfaction of job because it is not financially secured
17 I do not get satisfaction of job because it does not help me in raising my standard of living
18 I get satisfaction of job because it helps me in having financial security
19 I do not get satisfaction of job because I get inadequate salary
20 I get satisfaction of job because it helps in raising the standard of living of my family
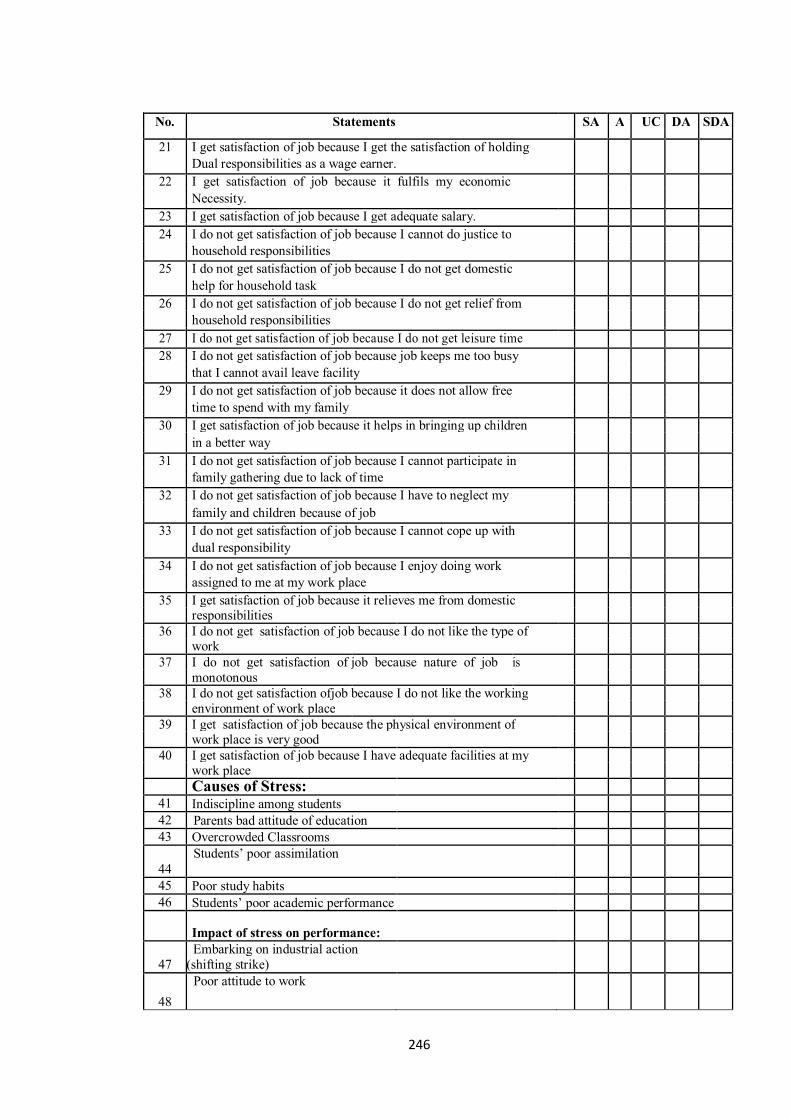
246
No. Statements SA A UC DA SDA
21 I get satisfaction of job because I get the satisfaction of holding Dual responsibilities as a wage earner.
22 I get satisfaction of job because it fulfils my economic Necessity.
23 I get satisfaction of job because I get adequate salary.
24 I do not get satisfaction of job because I cannot do justice to household responsibilities
25 I do not get satisfaction of job because I do not get domestic help for household task
26 I do not get satisfaction of job because I do not get relief from household responsibilities
27 I do not get satisfaction of job because I do not get leisure time
28 I do not get satisfaction of job because job keeps me too busy that I cannot avail leave facility
29 I do not get satisfaction of job because it does not allow free time to spend with my family
30 I get satisfaction of job because it helps in bringing up children in a better way
31 I do not get satisfaction of job because I cannot participate in family gathering due to lack of time
32 I do not get satisfaction of job because I have to neglect my family and children because of job
33 I do not get satisfaction of job because I cannot cope up with dual responsibility
34 I do not get satisfaction of job because I enjoy doing work assigned to me at my work place
35 I get satisfaction of job because it relieves me from domestic responsibilities
36 I do not get satisfaction of job because I do not like the type of work
37 I do not get satisfaction of job because nature of job is monotonous
38 I do not get satisfaction ofjob because I do not like the working environment of work place
39 I get satisfaction of job because the physical environment of work place is very good
40 I get satisfaction of job because I have adequate facilities at my work place
Causes of Stress: 41 Indiscipline among students 42 Parents bad attitude of education 43 Overcrowded Classrooms
44 Students’ poor assimilation
45 Poor study habits 46 Students’ poor academic performance
Impact of stress on performance:
47 Embarking on industrial action (shifting strike)
48 Poor attitude to work

247
49 Transferring of aggression to students
50 Having high blood pressure
No. Statements SA A UC DA SDA
52 Staying out of work
53 Frequently taken excuse from duty
54 Ineffective teaching
55 Lack of commitment to work
56 Not attending to students’ needs
THANK YOU FOR YOUR HELP!