A Case Reflected in Smartphone Business Model Innovators
68
SHIH CHIEN UNIVERSITY Department of International Business Administration Master’s Program Master Thesis A Case Reflected in Smartphone Business Model Innovators Advisor: Prof. Chung Hsing, Hsieh Graduate Student: James Yeh-Fan Pan December 2013
-
Upload
independent -
Category
Documents
-
view
1 -
download
0
Transcript of A Case Reflected in Smartphone Business Model Innovators

SHIH CHIEN UNIVERSITY Department of
International Business Administration Master’s Program
Master Thesis
A Case Reflected in Smartphone Business Model Innovators
Advisor: Prof. Chung Hsing, Hsieh
Graduate Student: James Yeh-Fan Pan
December 2013

II

III
Acknowledgement This work would not have been possible without the support of several people who
contributed with ideas, conversations, guidance, and care. I am especially indebted to my
advisor Prof. Dr. Hsieh Chung Hsing, who made available his support in a number of
ways. He gave me the very precious opportunity to pursue my study and continuously
provided critical thoughts, ideas, and advice, meanwhile offering necessary resources
with patience. I would also like to thank my thesis defense committee members, Prof. Dr.
Lin and Prof. Dr. Chih for conducting very in-depth questions and suggesting practical
strategic insights. In addition, I would like to say thanks to Ms. Tang, who has patiently
proofread this study and fixed those grammatical issues.
Special thanks must go to Dr. Lin, for he has been providing me adequate industrial
information, which has led me to explore the field of technology trends. Furthermore,
internships before and after enrolling in the IMBA program at Shih Chien has triggered
my curiosity of innovative business models and changes of the dynamic market.
I am highly obliged to HTC Corp., Taipei, Taiwan and Platt Electric Supply, Portland,
U.S.A. for selecting me as an intern at sales and marketing department, which broaden
my knowledge from academic research to a real business field.
It is my pleasure to thank my friend from National Taiwan University, Jeffrey C.W. Wang,
who supported me with his critical thoughts and resources from NTU campus. Besides,
my friend from University of Notre Dame Chris Laurent T. Yang assisted me with
analyzing qualitative data, and the IMBA alumnus of Shih Chien University, Jeremy Jens
Firster, who provided my study with very valuable input and adequate resources.
Last but not least, I’d dedicate this thesis to my family, especially my parents Hubert and
Evelyn, who have always been encouraging and supporting me during my graduate study.

IV
ABSTRACT This study investigates how the smartphone innovators have dynamically
responded to uncertain circumstances after the innovative business models redefined the
smartphone industry, referring to:
1. The new business model innovation launched by Apple Inc. that redefined the
industry through the iOS smartphone operating system, and
2. The first smartphones with the Android operating system launched by HTC Corp..
These two innovators have rapidly produced the network effects either by manufacturing
the smartphone handsets or by providing the content along with the platform.
The result of this study indicates that two factors contribute to the value creation
of these innovators: hardware innovation and business model innovation. Based on the
findings and analysis of this study, the innovative business model has added more value
to the smartphone than has the technology space. Overall, the main focus of this study is
to explore strategies that help create additional value to the smartphone by using HTC as
an example through qualitative analyses, observations of the trends, and comparisons of
the previous research findings.
Keywords: Business Model Innovation, Value Creation, Smartphone, Disruptive
Technology, Platform Strategy

V
Table of Contents CHAPTER 1 INTRODUCTION .............................................................................................................. 1 1.1RESEARCH MOTIVATIONS AND PURPOSES .................................................................................................. 1 1.2 RESEARCH FRAMEWORK ................................................................................................................................ 2 1.3 THESIS STRUCTURE ......................................................................................................................................... 3
CHAPTER 2 LITERATURE REVIEW ................................................................................................... 4 2.1 SMARTPHONE LEADING PLAYERS ................................................................................................................ 5 2.2 THE KEY STAGES OF MOBILE INDUSTRY .................................................................................................... 9 2.3 THE SHIFTED MARKET SHARES ................................................................................................................ 11 2.4 TECHNOLOGY OF KNOW-‐HOW ................................................................................................................... 12 2.4.1 Technology Life-‐Cycle Diffusion of Innovation ........................................................................... 12 2.4.2 Disruptive Innovation ........................................................................................................................... 13
2.5 THE DEFINITION OF BUSINESS MODELS ................................................................................................. 14 2.5.1 Smartphone Industry Supply Chain ................................................................................................ 15 2.5.2 Operating System .................................................................................................................................... 16 2.5.3 Platforms .................................................................................................................................................... 16
2.6 BUSINESS MODEL INNOVATION ................................................................................................................. 17 2.7 INNOVATORS AND THE LATE MAJORITY .................................................................................................. 19
CHAPTER 3 BUSINESS MODELS OF THE SMARTPHONE INNOVATORS ............................... 22 3.1 THE ECOSYSTEM OF THE SMARTPHONE INNOVATORS ........................................................................ 22 3.1.1 The Ecosystem of The Innovators-‐Apple ....................................................................................... 24 3.1.2 The Ecosystem of The Innovators-‐ HTC ......................................................................................... 28
3.2 BUSINESS MODEL COMPARISON BETWEEN THE INNOVATORS .......................................................... 33 3.3 THREATS AND THE KEY SUCCESS FACTORS OF INNOVATORS ............................................................. 38
CHAPTER 4 STRATEGIC ANALYSIS .................................................................................................. 40 4.1 RISE OF THE COST-‐EFFICIENT PLAYERS ................................................................................................. 40 4.2 VALUE ADDING ANALYSIS BETWEEN THE LEADING PLAYERS AND HTC ........................................ 45 4.3 VALUE ADDING TO THE END-‐USERS ........................................................................................................ 46
CHAPTER 5 DISCUSSION AND CONCLUSIONS ............................................................................. 52 5.1 FINDINGS ......................................................................................................................................................... 52 5.2 CONCLUSION ................................................................................................................................................... 54 5.3 STRATEGIC IMPLICATIONS .......................................................................................................................... 58 5.3.1 HTC: Possible Strategic Actions and Further Studies .............................................................. 59
5.4 RESEARCH LIMITATIONS .............................................................................................................................. 61
REFERENCES .......................................................................................................................................... 62

1
Chapter 1 Introduction 1.1Research Motivations and Purposes
This study is a case of smartphone innovators reflecting the performance of
strategic actions via innovative feature technology or the innovation of the smartphone
business model, extending service contents to the end-users. Apple and HTC are the first-
mover of smartphone innovators. The findings of MIT Sloan Management (Amit & Zott,
Creating Value Through Business Model Innovation, 2012), indicate that “Apple has
extended the locus of its innovation from product space to business model” compared to
“HTC, a “high-tech company” that broke the record in creating the first smartphone
product market space, and that remained centered at hardware design and product
innovation”. These innovators have disrupted the cell phone industry, developed the
market of smartphone industry, and yet encountered fluctuations over the market’s
growth and its market-position as the smartphone industry developed.
Currently, first-mover HTC is facing a volatile circumstance when competitors
obtain a certain level of technological know-how (learning curve). As new entrants after
HTC were able to produce smartphones with similar features, HTC lost its competitive
advantage in product differentiation. Having worked with HTC for two years, the author
was curious why HTC failed to sustain its market leading position in the smartphone
industry.
This study will focus on how the first-mover failed during the period of increased
competition from the aspects of value creation, end-user needs, and the strategic
responses among competitors to optimize current business model. Therefore, this study
would enable us to acquire the knowledge of how a first-mover in an industry built up
value through new innovations in product features, maintained its competitive advantages
during different stages of technology growth, further to avoid misleading strategic
responses at smartphone sector. From this standpoint, we are able to see the challenges of
correctly making strategic decisions under uncertainty.

2
Questions of this thesis are based on the following points:
What elements composed smartphone innovators’ value activities?
How did the first-mover advantage capture value creation and create competitive
advantages?
Why does the first-mover fail to sustain its market position from current leading players?
What are the implications for HTC in future strategic actions?
1.2 Research Framework
Figure 1.1 Research Framework of This Study (By The Author, 2013)
Strategic action of the smartphone first-mover will affect the value added to the
smartphone end-users, presented as the research framework in figure 1.1. A company’s
operational issues would directly or indirectly effect smartphone value adding to end-
users. Therefore, operational issues are not included in this study in order to focus more

3
on strategic actions, and value adding that succeeds or fails the first-mover’s market
position. This study, due to time constraints, limits the number of competitors to three and
includes Apple, Samsung, and Xiao Mi.
The author defines the variables above as:
Independent Variable (IV): Strategic action of smartphone first mover
Dependent Variable (DV): Value adding to smartphone end-users.
Moderating Variable (MV): Smartphone competitors and technology lifecycle
Confounding Variable (CV): Operational issues
1.3 Thesis Structure
The structure of this thesis consists of the following 5 charts:
Presents the main purposes of this study, and the further applications in commercial business and academic study. Supports the data collection of this thesis, sourced from academic research findings, theories, and contents provided by press and company releases. Provides working definitions for the research study topic. Generalizes the data collection of literature reviews, and develops a theories and evidence link via comparing business models between smartphone innovators. Conducts a theory with evidence from analyzing the business model’s comparison in Chapter 3. Brings out survival issues of smartphone innovators and possible future strategic responses from the analysis above.
!
Chapter 1 Introduction
Chapter 2 Literature Review
Chapter 3 Business Model of The Smartphone Innovators
Chapter 4 Strategies Analysis
Chapter 5 Discussion and Conclusion

4
Chapter 2 Literature Review
The contents of this chapter are based on the data obtained from selected
academic literature, company releases, press releases, and research institutions available
online. Telecommunications is a critical foundation in supporting our daily information
spread on all digital mobile devices through electrical signals and electromagnetic waves.
It allows users to receive information in various interface communicational products.
(Plunkett Research, Ltd., http://www.plunkettresearch.com, 2013)
During the earliest development of the telecommunication industry, companies
were facing a competitive environment competing with cable companies. Telecom
companies had invested and aligned themselves in order to provide better quality wireless
services while also reaching the economy of scale. Meanwhile, the convenience of
wireless services also provided significant competition due to the sufficient numbers of
wireless users in developed countries. However, consumer adoption grew with this
service rapidly with the usage of mobile devices, notebooks, or tablets. Now, there are
over 6 billion wireless service connections existing worldwide. (Plunkett Research, Ltd.,
http://www.plunkettresearch.com, 2013) Figure 2-1 below shows a comparison of the
most commonly used smart connected devices according to the market study released by
IDC (International Data Corporation, 2013).
Figure 2-1 Smart Connected Device Market Share
Source: (Internaitonal Data Corporation, www.idc.com, 2012)

5
According to Figure 2-1, the smartphone sector accounts for the majority of the
smart connected device market with 60% market share, over desktops, portable PCs, and
tablets. One of the breakthrough innovations on mobile devices nowadays is that it has
highly increased the demands of broad bandwidth in daily use by supplying demands like
data transferred, online video streaming and all types of internet-based drive products. Since the beginning of the year 2000, global telecommunication companies
started to install new fiber-optic lines for carrying the increasing load of data. The trends
of telecommunications listed above are significantly reshaping the environment and
business model of the smartphone sector. (Plunkett Research, Ltd., http://www.plunkettresearch.com, 2013)
2.1 Smartphone Leading Players There are various ways of generating smartphone profit: leading players in this
sector generate profit either from sales of its technology (hardware performance) or
applications distributed online. However, the rise of the operating system bridged its
hardware and platform services seamlessly. Currently, the leading operating systems in
the smartphone industry are Apple’s iOS and the open-source platform, Android.
(Internaitonal Data Corporation, www.idc.com, 2012) Each smartphone product in the
market contains the following platform embedded in the operating system. The leading
players’ operating system’s market shares present the following figures:

6
Figure 2-2 IDC Worldwide Smartphone Platforms Market Share Q2
Source: (IDC Media Center, http://www.idc.com/about/press.jsp, 2013)
Figure 2-2 shows the smartphone platform market share. Android and iOS are the
leading smartphone operating systems in the market, although they have shown
significant fluctuations during the period from 2012 Q3 to 2012 Q4. (Internaitonal Data
Corporation, www.idc.com, 2012)
Figure 2-3 shows that from the second quarter of 2012 to 2013, Android
smartphone vendors had a 73% year-over-year increase in sales in the smartphone sector
and took the leading place in smartphone operating system. According to an IDC press
release on August 7, 2013, Android sales have been strongly contributed by Samsung.
(IDC Media Center, http://www.idc.com/about/press.jsp, 2013)

7
Figure 2-3 Top Android Smartphone Shipments
Source: (International Data Corporation, http://www.idc.com/, 2013)
Figure 2-4 presents the top shipments of Windows smartphones as we can see from the
charts; Nokia plays a major role in driving Windows Phone sales. According to an IDC
press release on August 7, 2013, Windows Phone is the largest year-over-year increase
with 77.6% amongst the top five smartphone platforms.
Figure 2-4 Top Windows Smartphone Shipments; Source: (International Data Corporation, http://www.idc.com/, 2013)

8
Table 2-1 shows its operating system market share ranks at number 3 in the smartphone
sector. IDC indicated that Nokia has accounted for 81.6% of all Windows Phone
shipments during Q2, 2013.
Table 2-1. Smartphone Operating System Market Shares 2012/2013
(International Data Corporation, http://www.idc.com/, 2013)
Figure 2-5 shows the portion of the leading smartphone operating systems made up of the
top three leading platforms in the smartphone sector.
Figure 2-5 Worldwide Smartphone Platforms Market Share 2013 Q2
Source: (International Data Corporation, http://www.idc.com/, 2013)
Operating
System
2013 Q2
Unit
Shipments
Market
Share
2012 Q2
Unit
Shipments
Market
Share
Year-over-Year
Change
Android 187.4 79.30% 108 69.10% 73.50%
iOS 31.2 13.2% 26 16.6% 20%
Windows
Phone 8.7 3.7% 4.9 3.10% 77.6%

9
2.2 The Key Stages of Mobile Industry The following Figure 2-6 is categorized into ten sections according to the
telecommunication report released by McKinsey& Company. (McKinsey& Company,
Making Smartphone Brilliant: Ten Trends, 2012) The ten trends of the current
smartphone industry were built by the evolution of the mobile industry since the first
mobile phone was created to provide long-distance voice communication; moving
forward into the stage of being data-centric, mobile phone companies have perceived the
usage of consumers can be boosted with personal text-reading and images. Trends of
voice call and data-centric usage became more convergent than ever with offers of multi-
features by adding both the camera and MP3 music player functions in one device.
Figure 2-6 Mobile Phone Timeline
Source: (McKinsey& Company, Making Smartphone Brilliant: Ten Trends, 2012) (By The Author, 2013)
Thus, the role of the mobile operating system was becoming more important not
just by an integrator but also by offering a user-friendly interface. The main users of

10
convergent phones were positioned to business usages as shown in the timeline above: it
shows the first Windows operating system was launched in 2005 and also defined as a
smartphone by its multi-functional features that offered data storage, web-browsing, and
internet-accessing, most of them included with a stylus for pointing specifically on the
right spot on its screen to process user command.
Figure 2-7 shows the leading majority of smartphone operating systems in 2007
were led by Symbian (an operating system by Nokia). The market share accounted for
more than half with 63%, and the following major competitors accounted for 10%, 12%
and 10% by Linux, Microsoft Windows Mobile, and Research In Motion (an operating
system by BlackBerry), respectively. However, the strategy of attaining market share in
the smartphone OS market still remained at the stage of utilizing the QWERTY keyboard
or pointing at the screen with a stylus.
Figure 2-7 Mobile Operating System Market Share
Source: (Gartner, Inc., http://www.gartner.com, 2007)
At Steve Jobs’ presentation of the first iPhone launched on June 29th, 2007, the
patented technology of a multi-touch feature with the iPhone made it convenient to
manage smartphones. Meanwhile, the iPhone had taken the advantage of its iPod music
player’s multi-sided platform business model for providing downloadable contents like
11
Apps (Applications), and music (Jobs, 2007). Through this innovative business model, it
generated extra profits compared to other competitors and developed a continuous
customer relationship with the online app store. After Apple Inc. launched the iOS X
operating system (a closed operating system which can only be used on the iPhone) and
its online app store, Google started with launching the first opened source operating
system with free apps provided for smartphone users in 2008: Android. It increased
Android’s market share rapidly by the advantage of releasing free apps from smartphone
users.
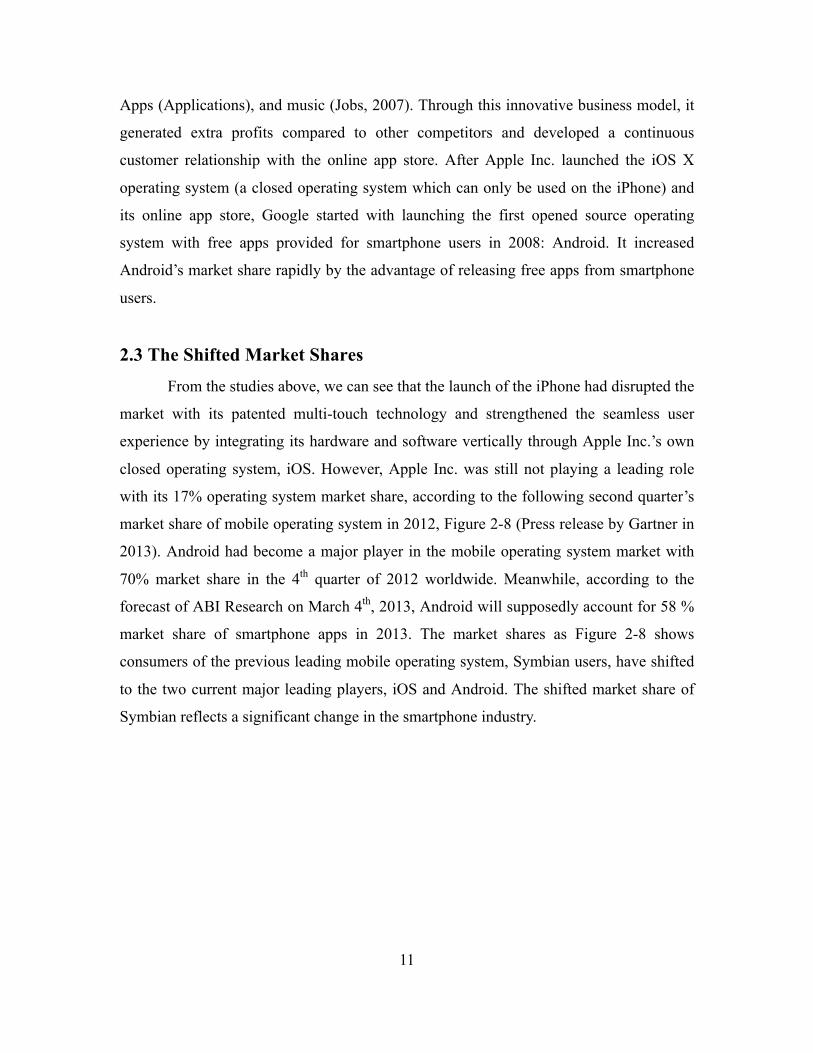
2.3 The Shifted Market Shares
From the studies above, we can see that the launch of the iPhone had disrupted the
market with its patented multi-touch technology and strengthened the seamless user
experience by integrating its hardware and software vertically through Apple Inc.’s own
closed operating system, iOS. However, Apple Inc. was still not playing a leading role
with its 17% operating system market share, according to the following second quarter’s
market share of mobile operating system in 2012, Figure 2-8 (Press release by Gartner in
2013). Android had become a major player in the mobile operating system market with
70% market share in the 4th quarter of 2012 worldwide. Meanwhile, according to the
forecast of ABI Research on March 4th, 2013, Android will supposedly account for 58 %
market share of smartphone apps in 2013. The market shares as Figure 2-8 shows
consumers of the previous leading mobile operating system, Symbian users, have shifted
to the two current major leading players, iOS and Android. The shifted market share of
Symbian reflects a significant change in the smartphone industry.

12
Figure 2-8 2012, Q2 Mobile Operating System Market Share
Source: (Gartner, Inc., http://www.gartner.com, 2012)
2.4 Technology of Know-How
Technology: The original definition of technology is “the application of scientific
knowledge for practical purposes, especially in industry.” However, the meaning of
technology for the purposes of the value chain of this paper will be defined as patents,
design, manufacture efficiencies, and the processes related to developing a smartphone
product. (Oxford University Press, http://www.oxforddictionaries.com)
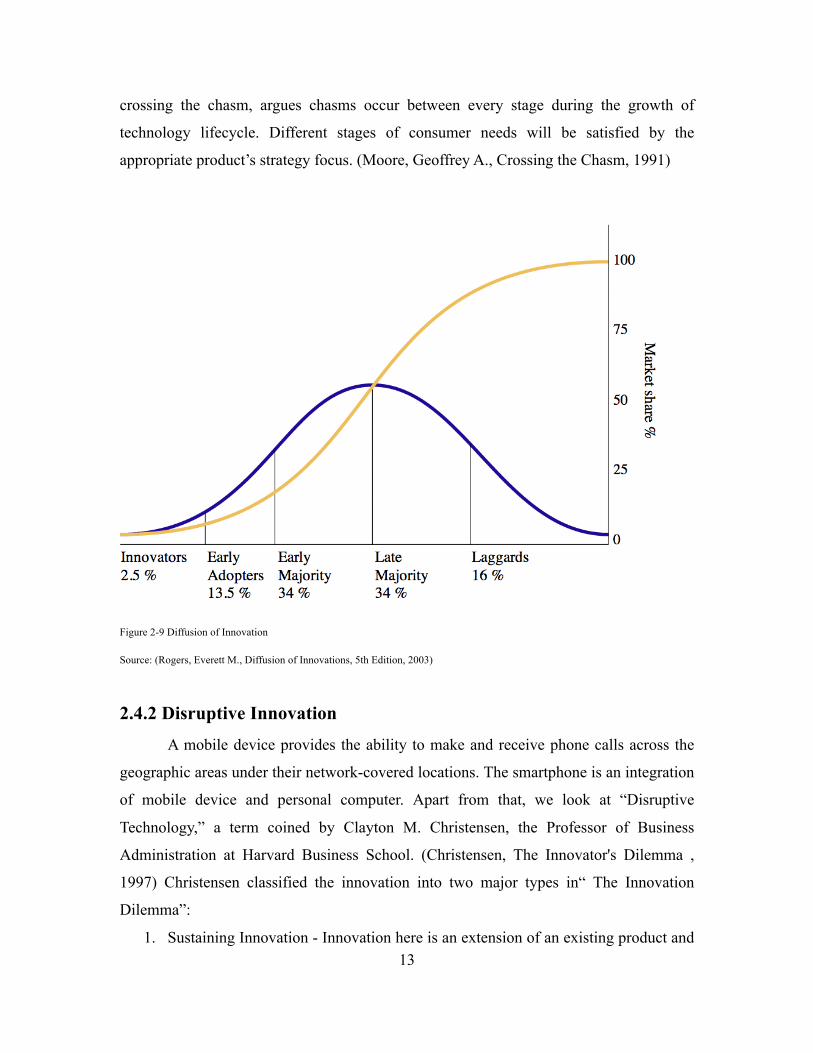
2.4.1 Technology Life-Cycle Diffusion of Innovation
Diffusion of Innovation describes the lifecycle of consumer adoption with new
technology shown in the following Figure 2-9 (blue line), and its market share (yellow
line) The shape of the technology lifecycle is often referred to as an S-curve, existing in
the technology adoption shown in the Diffusion of innovation theory. It was formed by
the level of how customers adopted to a new technology in the market. (Rogers, Everett
M., Diffusion of Innovations, 5th Edition, 2003) However, Geoffrey Moore, author of
13
crossing the chasm, argues chasms occur between every stage during the growth of
technology lifecycle. Different stages of consumer needs will be satisfied by the
appropriate product’s strategy focus. (Moore, Geoffrey A., Crossing the Chasm, 1991)
Figure 2-9 Diffusion of Innovation
Source: (Rogers, Everett M., Diffusion of Innovations, 5th Edition, 2003)
2.4.2 Disruptive Innovation
A mobile device provides the ability to make and receive phone calls across the
geographic areas under their network-covered locations. The smartphone is an integration
of mobile device and personal computer. Apart from that, we look at “Disruptive
Technology,” a term coined by Clayton M. Christensen, the Professor of Business
Administration at Harvard Business School. (Christensen, The Innovator's Dilemma ,
1997) Christensen classified the innovation into two major types in“ The Innovation
Dilemma”:
1. Sustaining Innovation - Innovation here is an extension of an existing product and

14
does not create any new product or value networks. Sustaining innovation is
based on improving the products’ feature and capacity of use against the existing
competitors in the market.
2. Disruptive Innovation- a product or service innovation formed a new market by
various set of values, which became a substitute to the existing market.
2.5 The Definition of Business Models
A business model describes the rationale of how an organization creates, delivers,
and captures (Osterwalder, Business Model Generation, 2010) However, business models
in the smartphone sector can be classified into three major types as seen in Table 2-1
according to A Competitive Analysis of The Smartphone Industry, Chen, Chien –Ting,
2009. Table 2-2 presents own-brand phone makers’ business models, which include
smartphone innovators and the later major market shareholders. The highlight part shows
that Samsung has occupied the largest market share in 2013 even though Apple and HTC
were the innovators of smartphone producers.
Table 2-2 Own Brand Phone Makers Business Model
Companies Branding Only Branding and Design Branding, Design,
and Manufacturing
Nokia
Samsung
Motorola
Sony Ericson
LG
Apple
Rim
HTC
Source: (Chen, Chien –Ting, A Competitive Analysis of The Smartphone Industry, 2009)

15
2.5.1 Smartphone Industry Supply Chain
Chen, Chien –Ting described the industry of the smartphone as being one with
high-degree of specialization and has classified the industry supply chain into 6
categories presents as Figure 2-10 (Chen, Chien –Ting, A Competitive Analysis of The
Smartphone Industry, 2009):
1. Components Provision: Component providers manufacture and supply
smartphone companies with special technology know-how and reliable
components for production.
2. Design: Smartphone functional specs are designed to meet end-user satisfaction
through the high integration of hardware, software, and operating system in all
aspects. Normally this part is accomplished by ODM (Original Design
Manufacture) or In-House design.
3. Production: Producers assemble all the manufactured components of design and
pretesting to endure the product’s quality before distribution.
4. Branding: Own-brand manufacturers plays a bridging role between its product
and its company brand image by launching marketing campaigns to strengthen
customer’s brand royalty and sales.
5. Distribution: Distributors are responsible for the product’s sales channels. A
dichotomy exists between direct distribution channel and indirect distribution
channel. The majority of current smartphone companies prefer to rely on sales
agents, regional wholesalers, dealers, and retailers of in-direct channels, while
only a few of them pave their way with their own channels.
6. Services: Wireless network operators provide an end-user communication
environment to access phone calls, while the Internet plays the role of distributor.
Retailers mostly provide customer services in order to retain a better user
experience. Information services are responsible for gathering or providing
contents to smartphone users.

16
Figure 2-10 Smartphone Industry Supply Chain
Source: (Chen, Chien –Ting, A Competitive Analysis of The Smartphone Industry, 2009)
2.5.2 Operating System
The operating system is a major collection of all software applications that
manages hardware and provides services via embedded platform for the end-users of
smartphone, or all digital related products. (Stallings, Operating Systems: Internals and
Design Principles, 2011)
2.5.3 Platforms
Platforms in a value chain will be defined as a marketplace that provides
smartphone apps (application) to smartphone users and apps content providers. There are
three major platforms, one developed by Apple iOS (closed source), another by Google
Android (opened source), and the other by Microsoft Windows Phone (closed-source) in
the smartphone operating system. The inter-dependent relationships of these platforms
consist of the following 4 players: smartphone manufacturers, mobile operators, digital
contents providers, and application developers (Chia-Yu, A Study on the Co-Opetition
Strategies of Major Operating Systems in the Mobile Internet Industry, 2011).

17
2.6 Business Model Innovation
For most technology companies, product innovation is always the main focus, like
how the smartphone is developed with several innovative features nowadays. However,
innovators of the smartphone were not just producing a disruptive product but whole new
business model. Business model innovation can consist of adding new activities, linking
activities in novel ways or changing which party performs an activity. Figure 2-11 shows
the change of 2000% in stock price after Apple introduced the first iPhone in the market.
(Amit & Zott, Creating Value Through Business Model Innovation, 2012)
Figure 2-11 Apple’s Performance, Before and After Business Model Changes
Source: (Amit & Zott, Creating Value Through Business Model Innovation, 2012)

18
Comparing Apple and HTC, the two smartphone innovators, we can see HTC launched
the first Microsoft Windows 5.0 Platform Phone in 2005, and the first Android device, the
T-Mobile G1 in 2008, according to the official website of HTC Corp. (HTC, www.htc.com, 2013)
According to the following figure, Apple and HTC launched first Microsoft, Android, and
iOS platform in the smartphone sector. The figure indicates that the fluctuation of stock
price rose dramatically when both smartphone innovators had differentiated and disrupted
the other mobile company’s business model. (Amit & Zott, Creating Value Through
Business Model Innovation, 2012)
Figure 2-12. The Stock Price Of HTC VS. Apple
Source: (Amit & Zott, Creating Value Through Business Model Innovation, 2012)

19
There are four major business drivers as the following shows novelty, lock-in,
complementarities, and efficiencies:
1. Novelty: Captures the degree of innovation.
2. Lock-In: Refers to the business activities that create switching cost or enhance
incentive for business model participants to stay.
3. Complementarities: Refers to the value-enhancing effect of the interdependencies
among business model activities.
4. Efficiencies: Refers to cost savings through the interconnection of the activity
system.
“Creating Value Through Business Model Innovation,” published by MIT Sloan
Management Review, 2012, attempts to focus on the part of how companies maintain
novelty, lock-in, complementarities, and efficiencies for differentiation. (Amit & Zott,
Creating Value Through Business Model Innovation, 2012)
2.7 Innovators and The Late Majority Figure 2-13, 2-14 present the leading players of smartphone vendors:
Figure 2-13 Q1 Smartphone Market Share; Source: (Gartner, Inc., http://www.gartner.com, 2012)
2012 Q1 Smartphone Shipment

20
Figure 2-14 Q1 Smartphone Market Share
Source: (Gartner, Inc., http://www.gartner.com, 2013)
According to the Mobile Phone Timeline Figure 2-6, iOS was included with the
launch of the first iPhone by Apple Inc., in 2007. Afterwards, the first smartphone that
ran with the Android operating system was the HTC Dream released in 2008 (HTC,
www.htc.com, 2013)
Apple Inc. and HTC can be recognized as the first-mover, or, we can use the term
“innovator” according to Diffusion of Innovation, a theory that describes the five stages
of how consumers adopting to new technology by Rogers, E in 1962. (Rogers, Everett
M., Diffusion of Innovations, 5th Edition, 2003)
From the market shares in 2013 Figures 2-13, 2-14 we can see that both
innovators, Apple Inc. and HTC, were facing challenges from losing its market share and
differentiation, especially when competing with Samsung, which has rapidly increased its
market share and has risen up to the largest smartphone vendor since 2012. (Internaitonal Data
Corporation, www.idc.com, 2012)
Furthermore, the two current major smartphone vendors (Apple INC., and
Samsung Group.) had similar characteristic-vertical integration. Vertical integration
participates essentially in the business as the following two points (differences of vertical
integration between Apple Inc. and Samsung Electronics) described by Assistant Prof.
2013 Q1 Smartphone Shipment

21
Raymond Allan G. Vergara.
1. Apple Inc., a vertically integrated specialized buyer:
Apple’s vertically integrated specialized buyer structure frees up its resources to
concentrate on its core competency: to design elegant and vertical chains, while at
the same time maintaining control over its design and development process. This
allowed Apple to move from one market (personal computers and portable
multimedia devices) into another (High-growth smartphone market).
(Vergara, A Study in Contrast in Vertical Integration in the 21st Century, 2012)
2. Samsung Electronics, a vertically specialized supplier:
Samsung is able to achieve economies of scale, which allows it to hold on to its
position as being the consumer electronics giant by leveraging on its ability to
produce component parts and assemble its products on a large scale and with a
cost-efficient process.
(Vergara, A Study in Contrast in Vertical Integration in the 21st Century, 2012)
In the smartphone sector, Samsung started from a component producer and now
has become the largest smartphone producer in the market, penetrating competitors’
market share while holding the bargaining power by controlling smartphone component
supply in the a market. The reason why other smartphone vendors are not supplying their
own components, according to Lee Keon Hyok, Samsung’s global head of
communications, is that “A semiconductor fab costs $2 billion to $3 billion a pop, and
you can’t build half a fab.” (Bloomberg Businessweek Technology, How Samsung Became the World's No. 1
Smartphone Maker, 2013)

22
Chapter 3 Business Models of The Smartphone Innovators
This chapter focuses on the business model and the development of smartphone
innovators. Apple, the first company that brought apps (application) into the smartphone,
created a whole new marketplace for both smartphone users and content providers
(application developers). HTC, the first-mover who ran a smartphone with the Android
operating system has successfully turned itself from ODM (Original Design
Manufacture) into OBM (Original Brand Manufacture). (Amit & Zott, Creating Value
Through Business Model Innovation, 2012)
However, value adding of smartphone is not only relying on telecommunication.
Smartphone becomes a new marketplace to the end-users via embedded platform. The
following section describes how business models of smartphone producers innovated
themselves when encountering a dynamic business environment.
3.1 The Ecosystem of The Smartphone Innovators
The current smartphone ecosystem is based on the platform developments of its
operating system. A standard ecosystem of a smartphone includes the partnership with
instrumental components producers, application and services developers, and third party
applications providers, which maintain the profits among all players in the ecosystem.
Currently, the ecosystem of the smartphone has been evolving and has formed into key
stages as shown by Figure 2-10 of this study.
This industry timeline is categorized into ten sections according to the
telecommunication report released by McKinsey& Company in June of 2012. The ten
trends of the current smartphone industry were built by the evolution of mobile industry
since the first mobile phone was functioned to provide a long-distance voice
communicating purpose; moving forward into the stage of being data-centric, mobile
phone companies have perceived that the usage of consumers can be more multi-tasking
with features like web browsing or the MP3 player.
The ecosystems of the mobile device through the stages of Voice Centric to Data
Centric were based on the bargaining power and technology among instrumental

23
components suppliers, feature applications, and service developers in order to satisfy
customers with sustaining innovation. According to the Disruptive Innovation Theory by
Clayton M. Christensen, sustaining innovation improves its product’s feature. However, it
does not create any new value network.
The stage of Convergence was an integration of the previous two stages Voice and
Data Centric. With the launch of the iPhone in 2007, Apple has reinforced those
ecosystems survived under instrumental components by drawing in new developers of
online applications to App Store, and recreated a new market place for smartphone
industry. Before the introduction of iPhone, HTC is one of the ODM (Original Design
Manufacture) companies that produced first Windows operating system phone for Palm
in 2005. In 2007, HTC has decided to launch its own brand by utilizing the technology
know-how of design and manufacture, furthering brought up the first Android phone in
2008.
Therefore, the three major ecosystems of current smartphone industry are defined
as the following sections, shown by Figure 3-1:
1. Instrumental Components Providers (Technology): According to Oxford
Dictionaries, the original definition is the application of scientific knowledge for
practical purposes, especially in the industry. The meaning of technology will be
defined as patents, design, manufacture, and those processes related to develop a
smartphone product.
2. Application and Service Developers (Operating System): The operating system is
the major program that runs on a computer according to the definition of
Wikipedia; the definition here will be defined as an operating system that runs in
mobile device meanwhile mobile operating system provides included application
for users when purchased.
3. The Third Party Application Providers (Platform): Platform will be defined as an
extension of the smartphone operating system and provides marketplace for
trading smartphone apps (application) between smartphone users and apps content
providers.

24
Figure 3-1. iPhone’s Ecosystem
Source: (Vargas, Smartphone Ecosystem, 2012)
3.1.1 The Ecosystem of The Innovators-Apple
Since 2007, Apple launched the first App (Application) store, which has disrupted
the market, either by its multi-touch technology or the ecosystem. Before entering
smartphone market, Apple first started with building a new business model in 2001. The
iPod stores music from various CDs into a device, and this initiates the concept of a
platform. 2003, Apple digitalized the original CD stores so that consumers are allowed to
purchase songs online. Composers receive a 30/70 split with Apple and along with well-
organized patent protection system. With the success of iTunes, Apple duplicates this
business model in to App Store

25
Table 3-1. Apple’s Annual Report, 2012 (USD, Million)
Source: (APPLE INC., ANNUAL REPORT PURSUANT TO SECTION 13 OR 15(d) OF THE SECURITIES EXCHANGE ACT OF
1934, 2012)
The multi-sided platform strategy of third party application has disrupted the market and
increasingly leaded the growth of Apple’s net sales by product. iPhone is the major sales
drive in the company and its net sales has nearly doubled since 2008. (APPLE INC., ANNUAL
REPORT PURSUANT TO SECTION 13 OR 15(d) OF THE SECURITIES EXCHANGE ACT OF 1934, 2012)
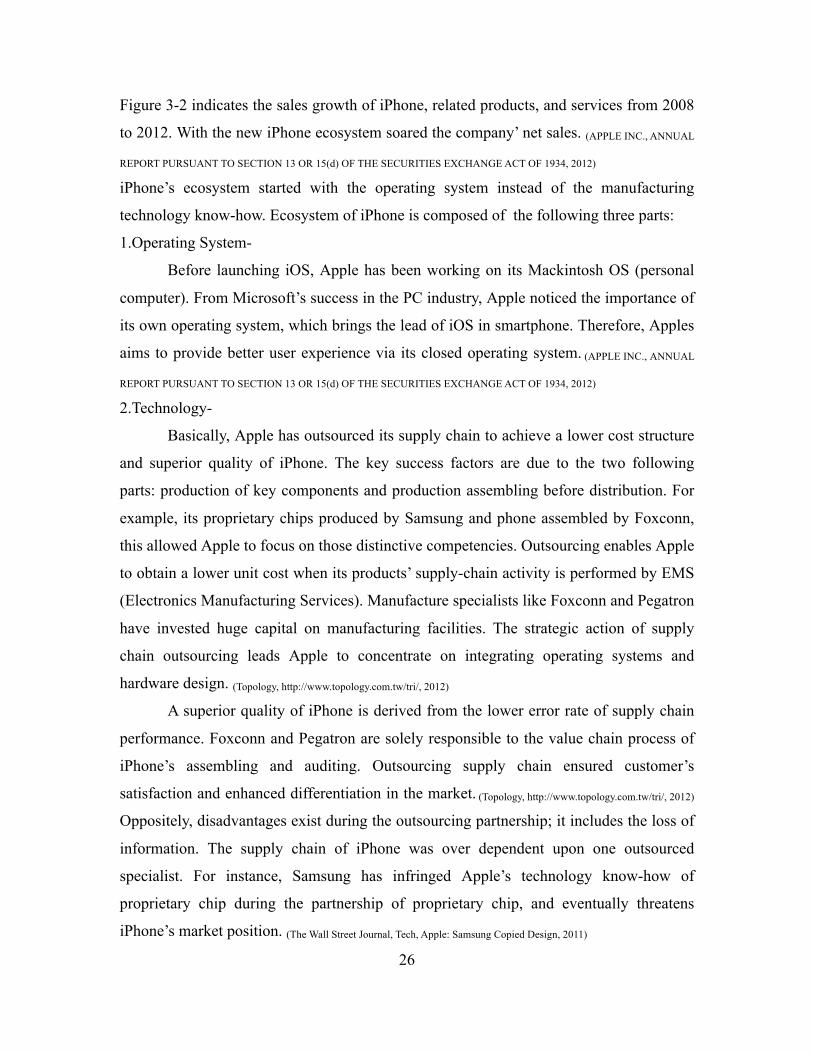
Figure 3-2 iPhone’s Sales Growth, 2008-2012 (In Million USD) (APPLE INC., ANNUAL REPORT PURSUANT TO SECTION 13
OR 15(d) OF THE SECURITIES EXCHANGE ACT OF 1934, 2012)
26
Figure 3-2 indicates the sales growth of iPhone, related products, and services from 2008
to 2012. With the new iPhone ecosystem soared the company’ net sales. (APPLE INC., ANNUAL
REPORT PURSUANT TO SECTION 13 OR 15(d) OF THE SECURITIES EXCHANGE ACT OF 1934, 2012)
iPhone’s ecosystem started with the operating system instead of the manufacturing
technology know-how. Ecosystem of iPhone is composed of the following three parts:
1.Operating System-
Before launching iOS, Apple has been working on its Mackintosh OS (personal
computer). From Microsoft’s success in the PC industry, Apple noticed the importance of
its own operating system, which brings the lead of iOS in smartphone. Therefore, Apples
aims to provide better user experience via its closed operating system. (APPLE INC., ANNUAL
REPORT PURSUANT TO SECTION 13 OR 15(d) OF THE SECURITIES EXCHANGE ACT OF 1934, 2012)
2.Technology-
Basically, Apple has outsourced its supply chain to achieve a lower cost structure
and superior quality of iPhone. The key success factors are due to the two following
parts: production of key components and production assembling before distribution. For
example, its proprietary chips produced by Samsung and phone assembled by Foxconn,
this allowed Apple to focus on those distinctive competencies. Outsourcing enables Apple
to obtain a lower unit cost when its products’ supply-chain activity is performed by EMS
(Electronics Manufacturing Services). Manufacture specialists like Foxconn and Pegatron
have invested huge capital on manufacturing facilities. The strategic action of supply
chain outsourcing leads Apple to concentrate on integrating operating systems and
hardware design. (Topology, http://www.topology.com.tw/tri/, 2012)
A superior quality of iPhone is derived from the lower error rate of supply chain
performance. Foxconn and Pegatron are solely responsible to the value chain process of
iPhone’s assembling and auditing. Outsourcing supply chain ensured customer’s
satisfaction and enhanced differentiation in the market. (Topology, http://www.topology.com.tw/tri/, 2012)
Oppositely, disadvantages exist during the outsourcing partnership; it includes the loss of
information. The supply chain of iPhone was over dependent upon one outsourced
specialist. For instance, Samsung has infringed Apple’s technology know-how of
proprietary chip during the partnership of proprietary chip, and eventually threatens
iPhone’s market position. (The Wall Street Journal, Tech, Apple: Samsung Copied Design, 2011)

27
In spite of that, the over dependency on its outsourced partners, specialist of
iPhone outsourced activity Samsung and Foxconn became a holdup risk to Apple. The
level of risk is proportional to how dependent Apple relies on Samsung and Foxconn.
This strategy reduced the risk of outsourcing to more specialist suppliers as a parallel
sourcing policy. For example, in order to decrease the dependency on the previous
specialist, Apple aligned with Taiwan Semiconductor Manufacture Company (TSMC) to
produce proprietary chips and level up the rivalry pressure to Samsung. Similarly, Apple
applies this strategy to Foxconn by reducing manufacture orders to Pegatron. The rivalry
exists between two specialist allows Apple to obtain premium profit. (Topology,
http://www.topology.com.tw/tri/, 2012)
3.Platform-
Being a first mover of online platform in mobile device, iPhone’s App Store
disrupted the original cell phone market. App Store functions as a new marketplace and
extends the services to smartphone end-users. In the process of value creation, App Store
plays a role of customizing every end-user’s iPhone. For instance, athletes download
sports apps to analyze their daily workout performance; students purchase educational
apps for exam preparation. App Store attracts two groups of people to its platform, either
iPhone end-users or the content providers, and blooms the platform e-commerce rapidly
via a network effect.
At this stage, apps distributing through the platform of iOS has reorganized the
fragmented markets on mobile device and caught the first mover’s advantages. Apple
shortly increased on the consumer’s adoption before others achieved. On the other hand,
position of first-mover allows Apple to accumulate more contents in the market.
Meanwhile, platform connects all Apple’s products and builds up its own
ecosystem. As being the dominator of all content providers, Apple has more bargaining
power to its end-users. Switching cost will exist once iPhone’s end-user shifted to other
platform owing to apps not being able to be used on other devices
Therefore, the combination of iOS closed operating system and App Store has
highly lock-in with the end-users through iPhone, (APPLE INC., ANNUAL REPORT PURSUANT TO
SECTION 13 OR 15(d) OF THE SECURITIES EXCHANGE ACT OF 1934, 2012)

28
3.1.2 The Ecosystem of The Innovators- HTC
Contrary to Apple’s strategy, HTC started ODM (Original Design Manufacture)
before it entered smartphone industry. It worked for Compaq and Microsoft in 1998 and
partnered with network operators in 2002. Since HTC partnered with Microsoft to
develop the Windows operating system on PDA, HTC has acquired the technology know-
how of producing touch-panel device. This let HTC become one of the top choices in
network operator partnership.
With the changing trends of the mobile device, users started using their web
browsing function since the first 256 display mobile device launched in 2000. The data
centric era opened up opportunities for HTC, who has produced the first lightest and
thinnest PDA in 1999. HTC utilized their experiences with technology know-how to
design solution mobile devices for network operators. (HTC, www.htc.com, 2013)
As the 3G-telecommunication environment matured, HTC seized the
opportunities to produce the first mobile device, which was operated with Windows
operating system for Palm in 2005.
When HTC started to own its first brand in 2006, it perceived the changing needs
of cell phone end-users and the expansion of technology standards that had been set for
3G-telecommunications. Thus, HTC officially access the smartphone market by
launching its own brand. (Topology, http://www.topology.com.tw/tri/, 2011)

29
Figure 3-3 HTC’s Value Chain at ODM Stage
Source: (Chen, Chien –Ting, A Competitive Analysis of The Smartphone Industry, 2009) (By The Author, 2013)
1.Technology
HTC captured first-mover advantages from experiencing the technology know-
how of producing PDA’s touch-panel. In the meantime, through cooperating with
network carriers, HTC increased their knowledge of user experience with their mobile
device. These experiences are valuable for an innovator as they can be applied in the
smartphone industry. Manufacturing experiences satisfy the consumer in early adopters
by giving them basic product needs. In the meantime, these experiences helped enhance
HTC’s skills in designing customized handsets.
The demand for smartphones had increased because of the multisided platform
business model of the online app store. With both iOS and Android operating systems
having formed a network phenomenon of consumer adoption, the paradigm shift bloomed
the upstream manufacture suppliers’ business.
As a first-mover of the touch panel, HTC possessed cooperative relationships with
upstream suppliers of smartphones. The business partnership with manufacturing

30
suppliers contributed HTC to owning its brand in the early stage of smartphone industry.
However, the increasing growth of smartphone sales over time and information on
manufacturing know-how spurred on new entrants in the market. The technical standards
at the time allowed for ubiquity of efficient manufacturing skills, attracting more
manufacturers to enter the industry. This phenomenon inferred that the rivalry of
opponents presented suppliers with more choices to be partnered with.
In this condition, the cooperative relationship between upstream suppliers and
HTC are being challenged when competitors perform better at sales than HTC, which
would minimize the bargaining power of HTC to key component suppliers. For instance,
a flagship product of the HTC-One had been delayed after launching in 2013; this caused
untrustworthiness between end users of smartphone and the other key components
suppliers. At that current stage, HTC was losing its market share; one of the reasons was
a result of the low bargaining power they had in maintaining a stable supply chain for the
market demands.
The smartphone’s technology lifecycle was being saturated over time; consumers
no longer remained focused on features or performance, but an image of lifestyle was
needed to differentiate smartphones from their competition.
Facing the technology constraints, HTC recently changed its production strategy from
manufacturing products themselves to an outsource strategy. Outsourcing would be a
strategy that allows HTC to focus on product design and marketing. (Reuters, Exclusive:
HTC scales back production lines as cash flow worsens-sources, 2013)
2.Operating System-
The following two formulas describe how HTC acquired know-how of running their
operating system as innovators of the smartphone:
• HTC + Microsoft Windows= First OS experience applied in touch-panel device
The cooperation existed since 1998 when HTC started to manufacture for
Microsoft Windows’ PDA, benefitting its integration skills between hardware and
software operating systems. During the years 2002 to 2004, HTC had already produced a
touch penal phone run with Windows’ operating system, called the pocket PC, before a
standard smartphone was released in the market.
In its embryonic stage, HTC derived competitive advantages from cooperating

31
with Microsoft, particularly in receiving resources for R&D to develop operating
systems, attracting large amount of capital from investors.
• HTC+ Android= First Android smartphone experience
Before Android occupied the largest market shares of the smartphone operating
system, HTC produced the first smartphone run with Android named the HTC Dream. It
was distributed by T-Mobile as G1 in the U.S. with free apps via Google Play. Actually,
two years before the iPhone launched, HTC had been cooperating with Android to
develop an operating system that ran on touched mobile devices. After Google acquired
Android, a consortium for OHA (Open Handset Alliance) was established and led by
Google on all members of OHA including smartphone manufacturers, apps developers,
network carriers, and semiconductors companies. A share-building strategy successfully
made Android the majority operating system in the market. The rise of Android’s
operating system brought out both a technical standard to the industry through the OHA
and gradually satisfied smartphone users’ needs by running Android operating system.
Oppositely, the rival environment that had existed before all alliances were running same
system gradually faded, and so did differentiation.
(Topology, http://www.topology.com.tw/tri/, 2011)
Under the highly competitive circumstances, HTC no longer maintained their
distinctive competency during their embryonic stage. With the growth of operating
systems, a smartphone innovator without its operating system is losing the power to
differentiate its product’s uniqueness in the market.
Instead of running Android’s operating system, HTC embedded its own software
to optimize its user interface named HTC Sense. HTC Sense differentiated the
smartphone by providing additional features like BlinkFeed, a whole new individual
media content platform that allowed smartphone users to browse channels by their
preferences. (HTC, www.htc.com)
3.Platform
Between HTC’s operating system providers, Android was the first mover to
support HTC with their Google Play app store via their operating system. The existence
of a platform value adding succeeds both to the operating system and to the handsets

32
(hardware), which allowed Android to directly engage with end-users. Afterwards, Apple
successfully applied the iTunes platform strategy to the iPhone in the form of the App
Store. Google Play then strategized to be an open-sourced platform to attract smartphone
users, and app developers took an open-sourced platform strategy to compete with iOS.
A network effect formed proportionally as the growth of Android’s market share
grew through the profit generation of Android; open-sourced platforms do not derive
profits form app sales but from advertising promoted on the platform. When all strategic
alliances adopted Android’s open-sourced platform, consumer adoption resulted in either
entry or exit barriers. An open-sourced platform allowed content providers to retain their
profits from each app sale and directly stimulate the growth of Android’s operating
system market share. At this stage, a greater scale of Android’s OS market share urged
content providers to satisfy different consumer needs.
Figure 3-4 Android Ecosystem
Source: (Vargas, Smartphone Ecosystem, 2012)
Instead of providing third party application, contents of Android’s platform are
now embedded in Google Now, g-mail, YouTube, Google Maps, Google Chrome, and
Google Docs, with all applications under Google’s ecosystem, enhancing the synergy of
users on different devices. For instance, users who are working on Google Docs with a

33
PC are capable of continually running that on any of Android’s devices. Its market share
has proved consumer’s acceptance of Android’s platform, it has over 80% of smartphone
users, are using Android’s platform. (International Data Corporation, http://www.idc.com/, 2013)
The leading platform in market share has fused differentiation between innovators
and other players. In the stage of early adopters, while platforms bloomed in the market
due to its contents and directly end-user engagement, a network effect of increasing
consumer adoption has attracted more smartphone users and app developers to Android’s
platform. The competitive environment has been reshaped by Android, providing a fair
market place for smartphone providers, who are incapable of creating their own operating
system and platform. The high market share eventually effected the first Android
smartphone provider - HTC. It has fostered the sales of HTC during the beginning of the
industry and brought up a certain level of brand awareness as being the top sold
smartphones in the U.S. in 2011. (International Data Corporation, http://www.idc.com/, 2013)
Nevertheless, the environment of smartphone competition now is very dynamic.
Lately, HTC has not been sustaining the competitive advantages of being an innovator:
the current market shares show the decline from 9.3% since 2011 to 2.5%, Q2, 2013,
according to market research firm Gartner. (Gartner, Inc., http://www.gartner.com, 2013)
3.2 Business Model Comparison Between The Innovators
The environment of business models consist of various factors that lead the
market to develop dynamically, in the pursuit of reaching specific satisfaction levels at
different growth stages.

34
Figure 3-5 iPhone’s Value Chain
Source: (Chen, Chien –Ting, A Competitive Analysis of The Smartphone Industry, 2009) (By The Author, 2013)
Internally, we have discussed the value chain of smartphone production, and how
innovators built up the product’s value adding through early perception of consumer
needs. Externally, the market penetration of the smartphone and the embedded platform
in its operating system reflect a higher level of complexity in the competition. Figures
3-5, 3-6 present the value adding process of smartphone innovators; these value-adding
elements lead Apple and HTC to successfully meeting embryonic market demands.

35
Figure 3-6 HTC’s Value Chain at OBM Stage
Source: (Chen, Chien –Ting, A Competitive Analysis of The Smartphone Industry, 2009) (By The Author, 2013)
According to Geoffrey Moore, who argues the diffusion of innovation theory by
Everett Rogers, the chasm normally exists when the market grows from early adopters
into early majorities. Innovators of the smartphone industry may fall into the chasm when
it is not satisfying different customer needs in a technology lifecycle. As the following
figure 22 shows, the chasm exists between the early adopters and early majorities.
Geoffrey Moore recognizes the consumer needs of innovators, and early adopters are
satisfied by the increasing technology performance. According to the changes in
smartphone market share, it has reflected Geoffrey Moore’s argument in diffusion of
innovation theory. (Moore, Crossing the Chasm , 1991)
Innovator of smartphone has encountered similar issues of dropping into chasm
when running business over the developed countries’ market share, like the U.S.’s
market. HTC had ever topped to be the largest smartphone producers in the U.S. during
2011, since then declined. Currently, it maintains at 9.4% in Q2, 2013 in the U.S. market,

36
according to Nielsen’s report. (Nielsen, http://www.nielsen.com/, 2011)
Looking at the innovators value adding process, from the viewpoint that Geoffrey
Moore argued, there are different customer needs that exist during the technology
lifecycle. Figure 3-7 and Table 3-2 show the various customer needs of each stage.
Customer needs in the innovators stage is focused on technology performance rather than
product’s ease of use. During this stage, Apple and HTC are performing with the
distinctive advantages of bringing out the platform to customers from a whole new user
interface experience, instead of competing with others by displaying a high-resolution
picture on the phone or how great their capacity with memory storage is. Needs of the
early adopters stage, requires certain specialized distribution as well as word of mouth to
increase brand awareness and customer loyalty.
Figure 3-7. Technology Life Cycle and The Chasms (Rogers, Everett M., Diffusion of Innovations, 5th Edition, 2003)
Apple has been building the customer relationship since 1976 and was founded
originally as a technology company, who has been developed specialized distribution
through online app store, retail stores and all authorized resellers to customers worldwide.

37
HTC, originally started as a smartphone manufacturer since 1997 in the industry, it does
not derive enough experiences of distributing and marketing strategies to reach the
diversity of customer’s engagement when compared to Apple’s distribution channels. In
spite of being topped as the best sales of 2011 in the U.S., the network-effect was not
performing consistently enough to leverage a further lock-in with smartphone users, one
of the reason conducted by Android’s open-source platform that allows other players
access the market with a low entry barriers as long as they are capable to produce
smartphone.
On the other hand, Apple’s strategy, which utilized the relationship between
content providers and music downloaders of the iTunes platform, served as a cornerstone
to complete the services from contents to distribution channels. Thus, Apple customer’s
loyalty was seamlessly engaged through consumers purchased hardware (iPhone) to the
downloaded apps from iOS App Store. (Osterwalder, Business Model Generation, 2010)
Entering into the early majority, which is supposed to meet certain level of mass-
production skill, meanwhile in order to reach out greater scale of customers, mass-market
distribution facilitates this process. Smartphone demands have been triggered by the
network effect of increasing platform users especially when apps were being downloaded
and shared. Thanks to the free licensing Android open-source platform, it rapidly fostered
the ubiquitous of smartphone.
The rise of efficiency is one of the key factors to supply demands at majority
stage of smartphone. Outsourcing strategy allows Apple to manufacture iPhone
efficiently and focus more resources over innovation and dynamic strategy planning,
instead of supervising how efficient with the in-house production line does. With the
maturity of the market and saturated technology, strategy focus has been scoping down
into dichotic circumstances; either performing cost leadership or being differentiated
from other players, both are the strategies to survive at the stage of majority.
Technology lifecycle of smartphone innovators began losing their competitive
advantages when facing those players that caught up tangible technology performance
and that were capable of manufacturing mass-production in the industry, and sooner filled
up the demands of majority. Intangibly, business model of multi-sided platform directly
engaged to the smartphone end-users, leads the innovators Apple and HTC into different

38
market position.
Table 3-2 Smartphone Technology Lifecycle
Source: (Rogers, Everett M., Diffusion of Innovations, 5th Edition, 2003) (By The Author, 2013)
3.3 Threats and The Key Success Factors of Innovators Throughout the course of smartphone technology lifecycle, the right value adding
enhances the potential of smartphone innovator’s value creation. According to the
research of MIT Sloan Management Review, 2012, there are four major interlined value
drivers of business model, which includes novelty, lock-in, complementarities, and
efficiency. (Amit & Zott, Creating Value Through Business Model Innovation, 2012)
Defining by MIT Sloan Management and further applying in this research:
1. Novelty as a degree of innovative business model that embodies all activities
in value creation. Through my findings, during the value adding process, all
internal value adding is shown in the following Figure 3-8.
2. Lock-in is described as an enhancing power of the incentives that generates
switching cost. I identified the apps service provided by operating system, and
the ecosystem consisted by all peripherals, are engaging smartphone
consumer’s lock-in as well driving certain level of loyalty.
Technology
Lifecycle
Consumer Status Apple HTC
Innovators Tolerance –Basic Needs
(Hardware+ Software + Service+ Complimentary)
Early Adopters Specialized Distribution/Word of Mouth
(Basic-Needs+ Loyalty+ Network Effect)
X
Early Majority Mass-marketing DistributioXdvertising
(Basic Needs+ Loyalty+ Network Effect+ Efficiency)
X
Differentiator
(Basic Needs+ Loyalty+ Network Effect+ Switching Cost+ Differentiation)
Cost Leadership
(Hardware+ Software+ Service+ Complimentary+ Loyalty+ Network Effect+ Efficiency)

39
3. Complementarities are defined as the interdependencies among all value
adding activities and perform the power of enhancement. Service of apps
either maintains a lock-in engagement over the platform, or bridges a long-
term relationship between smartphone end-user and apps content providers.
This intensifies sales growth driven by network effect.
4. Efficiency is referred to cost savings through adding vales interconnecting all
activities leanly. This can be recognized as in-house vertical integration or
outsource manufacturing, both are aimed to succeed all production activities
efficiently.
However, neither of Apple and HTC are involved in-house vertical integration of
manufacturing. Apple adopted outsource manufacturing strategy to manage its resource
to focus on technical innovation, here efficiency is not recognized as an internal value
adding in the figure. Findings applied to the value creation of smartphone innovators are
presented in Figure 3-8.
Figure 3-8 Comparison of Value Creation between iPhone and HTC; Source: (By The Author, 2013)

40
Chapter 4 Strategic Analysis
The comparisons of the value added creation process in Chapter 3 indicated that
HTC’s failure to sustain competitive advantages was that they incorrectly focused only on
product innovation. Based on the theory of technology lifecycle by Geoffrey Moore that
consumer needs are changing and evolving at different stages during periods of
technology refinements (Moore, Crossing the Chasm , 1991), the failure of HTC was
losing its ability to evolve with the industry as other competitors created new services and
applications– innovating the business model for how to compete and meet the needs of
consumers in the smartphone industry. Relationships between HTC and other leading
players, further support this study to discover why early-innovators would fail during
periods of increased competition. The end of this chapter will summarize how different
products/services create value to satisfy smartphone end-users.
4.1 Rise of The Cost-Efficient Players
Refinements of technology contributed to the growth of smartphone shipments,
and increased consumer adoption of platform services. According to Rogers (Rogers,
Everett M., Diffusion of Innovations, 5th Edition, 2003), there are five main stages of
product acceptance to the end-users, however linking those main stages to the current
smartphone market; this study will focus on the front three stages as following Table 4-1:
Table 4-1 shows Innovators redefined the industry, and provided end-users greater
value with basic product needs; end-users at this stage would be more tolerant to accept
the limitation of products ability to perform new functions. End users would have
different needs at different stages as they become more familiar with new product
features, and a greater customer pool allows for economies of scale in the production of
new services or functions. This is in part due to the end user becoming more
knowledgeable of the product and by technology improvements allowing for greater
possibilities for a product. More importantly, greater functional value is derived from
creative solutions and redefining core competencies in the industry and correctly
understanding how to compete in an emerging industry.

41
Table 4-1 Value additions that satisfy needs of early adopters, and early majority
Source: (Rogers, Everett M., Diffusion of Innovations, 5th Edition, 2003) (By The Author, 2013)
According to the diffusion of innovation (Rogers, Everett M., Diffusion of
Innovations, 5th Edition, 2003) and current market circumstances, loyalty, network effect,
and efficiency are the key elements to satisfy end-users needs at the stage of smartphone
early adopters, and early majority. Although HTC had initially performed well in the
smartphone industry, they neglected to satisfy different user needs of early adopters and
early majority. For this reason HTC’ leadership was overtaken by Apple and Samsung.
The current situation of smartphone competition shows that Samsung, who is a
vertically integrated competitor (upstream components and mid-stream phone
production), has done very well in the market. Key product assembling and all in-house
manufacturing has led to low-cost production and fast product rollout to match changes
in end-user demand. Samsung derived the strength of efficiency from its in-house vertical
manufacturing, when technology innovation started to refine better ease of use, for
meeting various scopes of customer segments.
Industry
Stage Description Main Needs Met
Additional
Needs Met
Innovation
Similar needs met with
cosmetic changes to a product.
(Hardware+ Software
+Service
+Complimentary)
Basic
End-User
Needs
Early
Adopters
Specialized Distribution/Word
of Mouth
Loyalty
+
Network
Effect
Early
Majority
Mass-marketing
Distribution/Advertising
Loyalty
+
Network
Effect
+
Efficiency

42
In-house vertical integration enables Samsung to compete with those leading
innovators on a cost-basis, and was able to pass cost savings on to consumers in the form
of lower pricing. In addition, the Samsung brand was a trusted product through related
products including personal computers, televisions, cellphones, cameras, etc.
Figure 4-1: Smartphone Average Selling Price by Market Type, 2012-2017 Forecast
Source: (International Data Corporation, http://www.idc.com/ , 2012)
On the other hand, the rise of Samsung reflects competition has entered the stage
of saturated innovation – where the production of advanced technology became more
cost-efficient for all competitors, reducing the competitive barriers of both cost-advantage
and differentiation. At this stage, it has become harder for a competitor in the smartphone
industry to differentiate themselves strongly enough in the marketplace to earn large
profit margins– the industry began to have greater price competition. Figure 4-1 shows
smartphone price at all types of market, and it is forecasted to decline through 2017. The
different levels of smartphone prices indicate different values based on product
specifications. Samsung, creating multiple products to meet different needs of socio-
economic groups, was quickly able to expand its market share in the industry.

43
Thus, first-movers in the industry would not acquire the same value of profit from
the stage of early adopters and innovation, when new technological features and
processes have just been introduced in the market. No longer was HTC the only
smartphone player to enter the industry with special product features – these became
industry standards. No longer was the iPhone the only competitor with a strong platform
to provide online services.
As other competitors including Samsung had time to learn these processes,
substitutes to the iPhone were formed. However these new services were different than
those provided by early entrants, and the industry became divided into generation-1
smartphones and generation-2 smartphones, which were focused on developing greater
services beyond basic product innovations. Further, as the industry continued to develop,
localized content companies began to build market share after learning from Apple and
Samsung. In all areas, the smartphone industry has increased competition and profits
have become harder to make.
In summary, Samsung’s vertical integration allows them to position as a broad
differentiator to increase product-mix variety. Smartphone first-mover Apple and HTC,
both were focusing innovation over two different types. Apple’s innovative business
model redefined the industry by launching the first smartphone’s app store. This strength
has been accumulated by the consumer adoption; once users are familiar with operating
the iOS platform, it highly established the engagement between the end-users and content
providers. This ecosystem created strong product switching costs for consumers, and
further leveraged customer loyalty. Open-channel platform, Android and the largest
smartphone vendor, Samsung, are challenging Apple’s innovative position. This is
another demonstration of time reducing the competitive advantage of product
specifications. Large platforms as a service had become a standard for second-generation
smartphones. The greater market share of Android and Samsung became a greater
confronting power for Apple to differentiate iPhone from other competitors as presented
in Figure 31. Although the iPhone remained as the premium quality provider, not all
customers were willing to pay for premium quality, as some were used to the Android
platform which creates a barrier to the expansion of Apple’s market share.

44
Figure 4-2 Smartphone Generic Business Model and Value Creation
Source: (Michael E. Porter, Performance, Competitive Advantage: Creating and Sustaining Superior, 1998) (By The Author, 2013)
Competition has increased when competitors, mainly Samsung and HTC are
competing in similar ways as shown in Figure 4-2. However, HTC is considered a
generation-1 provider while Samsung is a generation-2 provider.
To explore why Apple does not license its operating system to other smartphone
manufacture from a strategic perspective, for taking a greater market share and better
competing against the Android system is an interesting topic. Not licensing the iPhone
operating system could be recognized as a strategy, to maintain iPhone’s market
differentiation via in-house operating system and platform content services. Although
other competitors copied its basic values, the iPhone still remains as the premium
provider in the smartphone industry. The iPhone maintains its market position from
Differentiation (Higher cost/ Higher prices)
Cost leadership (Lower cost/ Lower prices)

45
directly providing service to its end-users via the embedded platform. Its focused market
approach has been able to satisfy the needs of the premium market segment better than all
other competitors.
Although its competitors have taken its market share, the iPhone is still able to be
profitable through maintaining higher average selling prices than competitors (i.e.
Samsung who has lower profit margins).
For HTC, the major effect of not bringing the right value proposition to customers
is the loss of its market share and operating cash flow. The loss of capital has put HTC in
a difficult situation since it lacks the resources to duplicate the business model of iPhone,
Samsung, and other competitors.
4.2 Value adding Analysis Between The Leading Players and HTC
Figures 31 and 32 above allow us to realize the major smartphone competition
business models. It remains unclear as to what values each competitor is fulfilling in the
market place. Understanding clearly how HTC is losing market share to late-entries is the
key for the needed changes in the management for survival.
Below is a comparison of the premium player, iPhone, and HTC on what their business
model is and what values each part of their business model is fulfilling. Three questions
are asked:
1. How do they compete?
2. What values are they trying to meet?
3. What intangible values do they have?
Based on the three questions above, Figure 4-3 describes the value adding relationships
and advantages among Samsung (broad differentiator), Apple (differentiator), Chinese
Local Brands (focus cost leadership), and HTC (broad differentiator)

46
Figure 4-3 Value Creation of Smartphone Vendors
Source: (By The Author, 2013)
4.3 Value adding to The End-Users
Satisfying smartphone end-users in the value adding creation process is the
mainstream of the industry; instead of being one of the smartphone’s value-adding, brand
value represents the whole value adding of a company. Therefore, through the recognition
above, following 8 elements, separately described how the 8 elements provide value
among the leading players and HTC.
1. Hardware:
During the competition, HTC was the beginner to possess the capability of
manufacturing know-how. New hardware surpassed HTC’s simple product enhancements
during the early majority stage. As time passed, other smartphone vendors have picked up
the experience curve of manufacturing skills. Low-entry barrier of technology know-how
allows more players to enter the market. Additionally, as the market became saturated by
time, consumer needs shifted from high innovation to ease of use product when they
became more acceptable of using the first smartphone. This period was market by a large

47
expansion of the smartphone market, which was being captured by HTC competitors.
Figure 4-3 shows that the iPhone outsourced their manufacture part to maintain its
focus on either its seamless deign of iOS platform or satisfied customers by extra
capacity with lowest market price. Internally, they were continuing to produce its own
core-business, which led its core competitive-advantage resistant to learning effects and
time. Vertical integration enables Samsung’s capability of mass-production, which leads
to achieve greater scale and scope of the market. On the other hand, it spared more
resources to satisfy various customers in the market when launching broad differentiation
strategy. This strategy is hard to duplicate due to the large capital and training
requirements to establish such operations. In addition, economy of scale is needed for this
strategy to be viable.
2. Software:
Among the four players in Figure 4-3, Apple is the only smartphone vendor
providing end-users software vertical integration from in-house designing operating
system to the online platform (App Store) and contents distribution. This highly
differentiated the iPhone from other players. Through the services under iOS ecosystem,
it seamlessly enhanced the revenue from handsets, peripherals, contents, to all apple
related products in order to reach certain level of consumer adoption. Rest of the
operating system’s market share is occupied by Android, as over 80% in total.
Therefore, it limits Samsung, Chinese local brands and HTC to obtain
differentiation through operating system. The benefit from using the Android operating
system is that it is cheaper, and enables competitors to upgrade their abilities to a
generation-2 level.
In addition, the lower cost yields a lower price, allowing for the market for
smartphones to expand to different socio-economic classes and expand market share.
Software has the ability of localization, which is the core competitive advantage for Xiao
Mi in China’s smartphone marketplace. Although services and ability can be an
advantage, the applications of these features are vital for many smartphone end users.
Much contents provided on smartphones were first tailored to developed western markets
and lacked nation-specific services. Xiao Mi correctly identified this niche market and
quickly expanded market shares in China with providing relevant software to that region.

48
3. Service:
Apple dominates the service of platform and effected the consumer adoption
increased by time past. For the reason that most players in the market are relying on
services provided by Android Smartphone features, and localized functions have become
the value adding to satisfy customers’ needs. As all competitors can mimic iPhone, they
cannot mimic the high quality of use, which creates customer loyalty for the iPhone.
However, saturation of technology lifecycle limited innovation products features;
smartphone value creation in Figure 4-3 shows that Samsung provides the service of
content sharing via different devices. Services provided by Chinese local brands are
bundled with local online business platform (Alibaba).
HTC’s blinkfeed provides individual media hub that collect contents from social
media websites, international and local news in personal preferences to smartphone users.
The examples of HTC and Samsung are service innovations, which are trying to disrupt
the iPhone’s performance. These new services are not considered to be a core-factor for
end-users, given the stable sales of iPhones. Some services, however, do create customer
stickiness.
4. Related Products:
Related products conducted the value adding of service to end-users through
different devices and established certain level of network effects, and customer royalty.
Related products of players basically provide in the four-screen concept, the notebook,
the tablet, and the wearables (the digital watch). Further, many of the related products are
technically incapable of being used with a competitor’s device (Android vs. iPhone),
which creates more customer loyalty. Additionally, app related products increased the
value adding through user experience of combining smartphone and apps to other
activities. Table 4-2 shows that Samsung dominates all related hardware products without
contents (apps).
Oppositely, advantages of in-house operating system have enabled iPhone’s
related products to differentiate itself from others. On the other hand, Chinese Local
brands Xiao Mi tries to develop its ecosystem by producing their first Smart TV
embedded with Chinese local media contents through its handsets to TV. More than ever,

49
smartphone companies are leveraging their technical know-how to produce related
products – except for HTC, the only company that remains focused on the smartphone.
Table 4-2. Four-Screen Related Products of Smartphone Players
Source:
(APPLE INC., ANNUAL REPORT PURSUANT TO SECTION 13 OR 15(d) OF THE SECURITIES EXCHANGE ACT OF 1934,
2012), (HTC, www.htc.com), (Samsung Group, www.samsung.com), (Xiao Mi, www.xiaomi.com, 2013) (By The Author, 2013)
5. Network Effect:
According to the book” Web 2.0: A Strategy Guide”, Amy Shuen described
“Positive network effects increase the value of a good or services as more people use or
adopt it.” The simplest network effects are direct: increase in usage leads to direct
increases in the value of the system. ”iPhone ‘s App Store in an example, the more
smartphone users are adopting app contents, it attracts more content providers to develop
various contents over the platform. This is also a low-cost strategy to generate sales as
apps have economies of scale in production. Meanwhile, related products of iOS
ecosystem strengthen the loyalty of Apple products users, loyal customers consider the
convenience of data sharing and decide to purchase other Apple’s products. Consumer
adoptions of iMessage and Facetime drive the network effect, and directly influence other
end-users, when friend are communicating through this function. Therefore, the iPhone
was designed to engage customers through three aspects: iOS content, related products,
and embedded features.
Related Products/ Contents iPhone HTC Samsung Xiao Mi Note Book X X
Tablets X X
Wearable X* X X
Smart TV X
Related App Products X X X
* iPhone to release iWatch in 2014

50
On the other hand, Samsung utilized its related four-screen products to build up
the ecosystem of hardware, further leads its network effect through the conveniences
among cross-devices’ data sharing and production.
Chinese local brand, Xiao Mi attracts local users by competitive pricing, localized
contents further to after-sales services and social events. In the meantime, local contents
and Smart TV retained the local network effect between cross-devices. Network effect of
HTC has been diminished as the technology know-how became mature in the industry.
However, the feature BlinkFeed embedded in 2012, an individual media contents, would
generate certain level of network effect when sales reached grater scales in the market.
Yet this is not a core-value to consumers and has not generated a positive result.
6. Loyalty:
Smartphone end-user’s loyalty is based on how valuable products quality is and the
services delivered through the product itself. Contents, related products, and the network
effect from the market all create synergies to command customer loyalty. Apple’s
outsourced manufacturing and strategic-focus to design better user experience from
services and its iOS platform leveraged a strong network effect and loyalty in the market.
Samsung’s vertical integration allows them to widen the product scope and
specifically designed products for various consumer needs. Being the largest smartphone
producer, it strengthens the loyalty of Samsung and the after-sales services and related
products to fulfill different consumer lifestyle. Additionally, Samsung creates customer
loyalty by having several models based on cost and function. As smartphone users
increase their experience with a smartphone and want to have a better experience via
greater functions, they are able to upgrade with a better Samsung product (customer
loyalty via brand effect). Xiao Mi performed localized media content, and smart TV to
retain its network effect focus in China.
The diminishing market of HTC limits the network-effect of end users and
meanwhile it decreases confidence of suppliers to provide HTC with sufficient
components for production. The reason of unwillingness is that low sales would chain
effectively decrease the ecosystem of suppliers. As time passes, it is becoming
increasingly difficult for the company to continue production as their market share
continues to shrink.

51
In 2012, New HTC One was delayed for launch in time, which eventually affected the
loyalty when it was not capable of producing new products timely. The HTC One is an
example of how HTC has tried to show its customers that they have produced a premier
smartphone in the marketplace, with the highest quality for the basic component needs.
However, basic components are not the core-competitive advantage in the industry and
sales of HTC failed to greatly improve.
7. Switching Cost:
Smartphone cost of switching is derived from operating system, services and
contents. Apple engaged the end-users by providing its own operating system, service app
contents, connecting to music, movies, etc. The iPhone continues to provide services,
which operate differently than the Android system (similar to communication in Chinese
and English). As iPhone users were curious about the Android system, they found that the
user experience with an Android smartphone was different than the iPhone. It created
product’s switching-costs due to learning effects required by customers. Other switching
costs include phone accessories including phone covers and chargers, which have
technical product specifications and represent an increased investment for end-users.
Comparing with Apple, Samsung’s switching cost exists with the convenience
brought by related products like cross-devices content sharing among notebook, smart
TV, wearable, and smartphone instead of engaging end-users by in-house operating
system. Media environment in China was being governed, which limits the access of
foreign social media contents. Xaio Mi satisfies end-users needs by embedded localized
Chinese media contents and allows end-users to share contents on Xiao Mi smart TV,
switching cost incurred when end-users are adopted activities above.
Currently, HTC produced smartphone and innovative features without related
products; contents are provided by Android operating system, and none of the activities
above incurred switching cost.
8. Differentiation:
Apple differentiated iPhone through the ecosystem consisted of closed operating
system iOS, contents distributed in App Store and the extension of all related products
which built up the ecosystem from software contents to hardware related products.
Samsung utilized the largest market share of smartphone and its related products to

52
satisfy end-users needs, through the ecosystem of hardware. This differentiated Samsung
from those who are not producing smartphone related products.
Differentiation of Xiao Mi is based on the convenience from the ecosystem of
related products and local media contents. However, without related products or localized
contents, differentiation of HTC is diminishing since competitors started to enhance
customer ease-of-use by developing, closed operating system, localized contents, related
products to strengthen product’s value adding and differentiation in the market.
Chapter 5 Discussion and Conclusions
5.1 Findings
Through the value adding analysis in Chapter 4, the current leaders in the
smartphone industry has created new value in the industry from expanded product
capabilities, greater ease of use for consumers, and following/creating end-user lifestyle
trends. Shown in Figure 5-1 below, the shared values from HTC, iPhone, Samsung, and
Xiao Mi are displayed.
The smartphone ecosystem has developed into two zones; ease-of-use and
lifestyle. The completeness of a company’s smartphone ecosystem has become a major
factor in determining demand by end-users. Zone1 (ease-of-use) includes the value
properties of hardware, software (operating systems), additional services, and related
products.
End-users in Zone 1 are mostly satisfied by the physical quality of the smartphone
product, an enjoyable direct experience with the smartphone, convenience in creating and
storing content, cross-device data sharing (i.e. personal computer to smartphone), and all
other tangible benefits given to the end-users.)
Zone 2 represents the power to build customer loyalty through the lifestyle
approach. Values in this zone come from the synergy among the four values at zone 1.
Essentially, not all competitors perform each activity in Zone 1, for those that increase the
ability to create customer loyalty by offering a product which shapes consumer behavior
into having constant daily usage – developing the end-users lifestyle in using the product.
Zone 2 includes the network effect, loyalty, switching costs, and product differentiation

53
that is able to be maintained over both time and learning curve effects from competitors.
Figure 5-1 Smartphone Values Distribution Zones
Source: (By The Author, 2013)
For example, Apple achieves each of Zone 1’s values by offering end-users an operating
system to control all service activities, contents distribution, and then reaches certain
level of products switching cost and differentiation.
Samsung’s vertical integration allows them to mass-produce smartphones
efficiently and diversify product offering for a broad differentiation strategy. That allows
Samsung to produce various sizes, capacities, and prices to penetrate the market,
eventually bringing up the value of network effect. Xiao Mi satisfies Zone 1 users by
providing them with a high capacity smartphone at competitive prices in order to access
the services of localized contents through smartphone and smart TV; localized contents
services raised end-users loyalty and differentiated Xiao Mi from other competitors in
China. Switching cost and network effect comes after Chinese nationals could identify
their lifestyle easier to localized content.

54
Smartphone value adding achievement in Table 5-1 shows HTC lacks related products to
achieve intangible value network effect at Zone 2.
Therefore, HTC’s end-user would receive value from products ease of use rather
than end-user’s lifestyle.
Table 5-1 Smartphone Value Zones Achievement Core-Value Fulfillment
iPhone HTC Samsung Xiao Mi
Zone 1 Ease-of-Use
1. Hardware 2. Software 3. Service 4. Related Products X Zone 2 Lifestyle
5. Network Effect X 6. Loyalty 7. Switching Cost X 8. Differentiation X
Source: (By The Author, 2013)
5.2 Conclusion
Smartphone innovators, Apple and HTC had differently performed value creation
to the end-users by product features or contents of platform service. HTC quickly gained
market share in the smartphone industry by introducing new product features including
the touch screen panel, and the Android operating system. The use of a new touch screen
product featured by HTC created the first touch screen smartphone in the industry. This
increased HTC’s popularity was due to the ease of use by end users. The Android
operating system was first used on HTC devices, and was jointly created by Android and
HTC.
However, as the Android operating system was openly available for competitors
to use, it was not a competitive advantage for HTC. Thus, HTC smartphones can be
classified as a first-generation smartphone – increasing the quality of end users
experience on use of a smartphone to make calls, listen to music, and at the time set the
premium product quality level with a touch screen. The touch screen was also not a

55
licensed technology, so this is not considered to be a competitive advantage for the
company. HTC’s main competitive advantage was based on their first-mover advantage
in the market for smartphones – which was non-sustainable.
When the Apple iPhone was released, this became a second-generation
smartphone, developing an eco-system of both hardware and software. The iPhone had its
own operating system, which is owned by Apple. With this operating system, the iPhone
has the ability to create synergy between other Apple products, which created a new
demand for smartphones as a central device to manage your personal lifestyle. To extend
services and software, Apple developed different online services, which can be used on a
smartphone, as applications (apps). These apps enabled iPhone users to enhance their
experience with the use of a smartphone, creating value, by using the smartphone to
connect with multimedia products including iTunes, a music platform that was used to
download and manage songs on a smartphone.
With the developments of a smartphone ecosystem and online applications, the
iPhone can be defined as a second-generation smartphone. The iPhone may not have been
able to match the HTC phone in terms of listening to music quality and other single
features including taking pictures. However, Apple considered these features to be “basic
features” on generation 1 smartphones. The iPhone had a competitive advantage in
providing services to the end users via iOS Platform and applications. By extending more
options to the end user for how they can operate a smartphone, the Apple iPhone quickly
gained market share. The iOS systems as a product is known as a competitive advantage,
because when a consumer purchased an iPhone, they were able use the services and
applications, which were also operated by Apple.
As the smartphone industry began to develop, the iPhone has begun to lose
market share as the cost efficiency and serviceability of competitors increased. The
Android operating system as an open-system, had eventually built an eco-system of its
own, which was freely used by other competitors including Samsung, Xiao Mi, HTC, and
many others. However, Samsung improved their learning curve by vertical integration
from upstream manufacturing of key smartphone components and downstream
production of smartphones targeted at different income groups (quality levels). As the
product acceptance curve in the smartphone industry developed to the late majority, many

56
people in this stage were migrating from regular cellphones and generation 1
smartphones to generation 2 smartphones. The iPhone, recognized as the premium
quality leader, maintains the highest price tag. Samsung gained market share through
providing low-cost value to new entrants via product differentiation. As competitors like
Samsung built brand awareness, they were able to provide high-quality products targeting
high-end customers (same group as the iPhone). Eventually, the competitive advantages
that the iPhone had were largely removed due to strong competition from Samsung and
the extended use of the open source Android operating system.
However, market share is not a measurement of profitability, as the Apple iPhone
continues to maintain its premium level of service quality, creating values for its end
users. Although there are many applications provided on the Android system, the iOS
platform has applications, which must first pass a quality check, and are mostly exclusive
to iPhone users. Hence, there is a service quality differentiation still between the iPhone
and competitors such as Samsung. In the battle between large rivals, Samsung and Apple,
both have developed ecosystems, which enhance the end users value for the smartphone.
The Apple iPhone has very high switching costs, due to the ownership and sole
use of the iOS platform and services such as iTunes, which create value and add quality
to the services provided. In summary, the Apple iPhone maintains its premium-quality
leadership, which always has a market segment around the world. For smartphone users,
who wish to have a high quality personal lifestyle use the iPhone for its premium quality.
Those end users, who want to experience the smartphone lifestyle, mostly use Samsung
or other competitors.
Xiao Mi has created market share in China through localization of the smartphone
experience in the Chinese market. Although both the Apple iPhone and Samsung
smartphones on the Android operating system were introduced to the market first, they
did not have relative services which were in demand on the Chinese market. Xiao Mi
created demand and built market share in China by focusing on a Smartphone ecosystem,
which is more accepted to the taste and preferences of Chinese people. Although Xiao Mi
is not the leader in quality or cost, the company leads the Chinese market in terms of
differentiation by end user serviceability. Xiao Mi is able to do this through support of
third-parties including the Chinese government. However, the iPhone is considered the

57
highest quality and is still in demand by the smartphone users who want to have a high
quality lifestyle in China.
So far in the discussion we have seen how the industry has expanded by greater
demands for serviceability by smartphone users. HTC has seemingly been unable to
develop a generation 2 smartphone as it lacks an ecosystem and other intangible values
that add to the industry including 1) switching costs and 2) low brand loyalty to HTC
products. HTC is maintaining a premium edge in basic features, but there is no synergy
with related products. HTC was a top selling smartphone in 2011. However the market
share for HTC is now only 2% worldwide. The market has decided that high-quality
basic features are not the relevant factors for the end users. End users in the smartphone
industry place greater focus on serviceability and synergy with related products.
Theories and evidence of this study proves that with the growth of technology
lifecycle, consumer needs will be reshaped during the stage between innovators and the
majority.
Platform first-mover delivers value through the ecosystem of its operating system,
the iPhone consistently lock-in to the end-users by all media contents, apps and related
products; hardware first-mover focused its effort to deliver value through hardware and
features innovation. HTC, timely innovate smartphone features to satisfy consumer ease-
of-use.
Currently, vertical integration enabled Samsung to perform broad differentiation
in the market, and gradually substituted hardware first-mover HTC’s position. In the
meantime, Xiao mi, a focus cost leadership smartphone producer, fulfills the end-user
needs by localized social media contents in China. According to the circumstances listed
above, the major traits influencing smartphone’s values to end-users are as follows:
• Technology Lifecycle: Smartphone values will be acquired by the end-users at the
right stage of technology lifecycle.
• Consistency: Smartphone values lock-in to end-user through services of platform
contents, and related products that are consistent with the differentiated business
model.
• Intangibles: Smartphone’s value of network effect, loyalty, switching cost, and
differentiation lock-in end-users by lifestyle.

58
5.3 Strategic Implications
The value trait of intangibles is considered to be the strongest before the launch of
the first smartphone. Feature phone’s product mix existed in various types to satisfy
different consumer needs in the market. HTC captured first-mover advantages from
hardware innovation of the smartphone, and those values of hardware satisfied different
end-user needs by broad differentiation strategy. HTC implemented different product
enhancements to better meet the needs of consumers, including the full touch screen
panel.
The HTC smartphone can be defined as a generation 1 smartphone. After the
iPhone redefined the smartphone industry, it extends the values from smartphone features
and hardware to the service of contents. The Apple iPhone and other smartphones like
Samsung and Xiao Mi can be classified as Generation 2 smartphones for their increased
ability to satisfy end-user needs. The strategic implications for the smartphone industry is
to prioritize product offerings based on the core-competencies of industry demand /
industry competition. The failure of HTC is that they incorrectly chose how to compete:
focusing on basic product features which overtime became an industry standard and not a
distinctive competitive advantage.
As a learning point for the technology sector, what is new today can easily
become a standard tomorrow. The smartphone industry is characterized by a high-degree
of evolution and expansion of end-user needs.
For competitors to successfully compete, they must have an accurate understanding of the
underlying demand for their products. For smartphones, the core-demand had developed
from product features to product services as the majority of end-users demanded more
usages from their smartphone. Core-competencies have developed from basic features
into the creation of mobile-networks and integration with services. In order to survive in
the smartphone industry, the companies must continue creating and providing for existing
needs for end-users, in addition to creating switching-cost barriers to maintain customer
loyalty.
From this research, the Apple iPhone, Samsung, and Xiao Mi, have all developed
tangible and intangible values beyond basic smartphone needs, which have created a
sustainable business model and path for future development. When examining the past

59
strategic movements of HTC, we see how the company has lost its global market share –
HTC has failed to create value-enhancement activities, which the end-user considers as a
major consideration for their smartphone purchase (please see Figure 5-1, 28).
5.3.1 HTC: Possible Strategic Actions and Further Studies
Although the current situation for HTC is critical, there are many possible actions
the company can take to improve sales and increase customer loyalty (market share
increases as a result).
Currently, HTC performs no “Zone 2” activities, which would develop its
smartphone product line into a Generation 2 Smartphone. Below are some possible
actions the company may take. These actions are considered given the current limit on
available resources for HTC.
1. Improved Focused Differentiation:
(Improved Product Diversification – Consistent with market segments values)
Reduction of products will reduce operational costs and allow the company to focus on
investing in Zone 1 values. This is an area of possible further study.
2. Network Effect:
HTC has a need to further increase end-user performance through increased
service channels. Social Messaging Apps and the development of free to use over internet
messaging services for HTC users. This is a proven business model by many companies
including Blackberry, Naver (Line), What’s App, and We Chat. Social Messaging is a
low-cost service which can be easily applied to all HTC users and be a paid for service
available for other companies. In addition, HTC could re-partner with Android to create
an Android messaging system which would be a pay-for service with the revenue going
to HTC for certain product streams.
A further study could be the development of HTC characters to use in social messaging.
3. Related Products – A high cost strategy:
More HTC devices will benefit from the HTC brand (creating brand value) and
could be used in connection with HTC smartphones. HTC could consider Strategic Joint
Ventures with Taiwanese automakers and Taiwanese computer/laptop makers for
ecosystem development. Example A: HTC and Luxgen: HTC could outsource central
communication systems (i.e. phone calls, music, social media, navigation, etc.). Example

60
B: HTC and Asus: Development of a new Tablet with the HTC interface.
4. Enhance Customer Loyalty Through Related Products (Lifestyle Trends):
The HTC brand can be linked to different services and companies in joint product
development. HTC Video Games: HTC video games embedded in smartphone, which
will unlock special features as levels in video games are completed. Incentives could be
HTC dollars, which could be used at the on-line HTC store or Amazon. This would
increase the network effect for HTC. All possible examples above are ways that HTC
could possibly disrupt the smartphone industry and is a possible field of study for further
research.
5. Complimentary Services:
Healthcare/ Fitness apps provided personal measurements taken on a daily/weekly basis.
Greater basic component specifications: Different modes of audio settings (music
listening mode, movie listening mode, speech listening mode, etc.).
It is possible that HTC may not need to consider a change in its business model as the
smartphone ecosystem evolves and the Android operating system continues to improve.
Through this aim, HTC could become the premier competitor for basic features,
which would return market share to the company. This is also an area for further research.
Product Efficiency
A further study could be conducted on outsource management for non-core
competitive functions that HTC internally performs. Assembling could be outsourced to
focus on design of services.
6. Second Brand Strategy:
HTC could launch key products on the emerging markets to gain more market
share. By meeting the basic needs of new customers with a basic smartphone, and
extending the new software services including free messaging. HTC could become a
partner for global software companies including Microsoft and Lenovo.

61
5.4 Research Limitations
Since the author has worked as an intern for two years with HTC, he has gained
very valuable insights into the smartphone industry. Limitations of this research include
time, availability of first-hand management views from HTC, and analysis of key
competitors. These limitations have been mitigated by the focus on strategic decision
making which is made available to public knowledge.

62
References A Study in Contrast in Vertical Integration in the 21st Century2012 II9
APPLE INC., ANNUAL REPORT PURSUANT TO SECTION 13 OR 15(d) OF THE
SECURITIES EXCHANGE ACT OF 19342012ANNUAL REPORT PURSUANT TO
SECTION 13 OR 15(d) OF THE SECURITIES EXCHANGE ACT OF 1934Cupertino,
CA
Bloomberg Businessweek Technology, How Samsung Became the World's No. 1
Smartphone Maker, 2013
Osterwalder, Yves Pigneur, Alan Smith, Business Model Generation,2010
Chen, Chien –Ting, A Competitive Analysis of The Smartphone Industry, 2009,
National Taiwan University
Michael E. Porter, Competitive Advantage: Creating and Sustaining Superior
Performance, 1998
Amit, Raphael; Zott, Christoph, Creating Value Through Business Model
Innovation2012MIT Sloan Management Review 5341-49, 2012
Moore, Geoffrey A., Crossing the Chasm, Harper Business Essentials, 1991
Diffusion of Innovations, 5th Edition, Free Press, 2003
Gartner, Inc., http://www.gartner.com2007Gartner, Inc.
Gartner, Inc., http://www.gartner.com2012Gartner, Inc.
Gartner, Inc., http://www.gartner.com2013Gartner, Inc.
HTC, www.htc.com, 2013
IDC Media Center, http://www.idc.com/about/press.jspIDC Media Center, 2013
Internaitonal Data Corporation, www.idc.com2012
International Data Corporation, http://www.idc.com/2013
McKinsey& Company, Making Smartphone Brilliant: Ten Trends, 2012
Michael E. Porter, Performance, Competitive Advantage: Creating and Sustaining
Superior Performance, 1998
Nielsen, Who Is Winning The U.S. Smartphone Battle?, 2011,
http://www.nielsen.com/us/en/newswire/2011/who-is-winning-the-u-s-smartphone-
battle.html

63
Operating Systems: Internals and Design Principles2011Prentice Hall
Oxford University Press, http://www.oxforddictionaries.com
Plunkett Research, Ltd., http://www.plunkettresearch.com2013Plunkett Research,
Ltd.
Raymond Allan G. Vergara2012A Study in Contrast in Vertical Integration in the 21st
CenturyAmerican International Journal Contemporary Research II9
Reuters, Exclusive: HTC scales back production lines as cash flow worsens sources
10, 23, 2013
Rogers, Everett M., Diffusion of Innovations, 5th Edition2003Diffusion of
Innovations, 5th Edition
Samsung Group, www.samsung.com
Smartphone EcosystemCali, Colombia
Steve Jobs, iPhone Introduction in 2007
The Innovator's Dilemma 1997Harvard Business School Press
The Wall Street Journal, Tech, Apple: Samsung Copied Design2011
Topology, http://www.topology.com.tw/tri/2011
Topology, http://www.topology.com.tw/tri/2012
Topology, http://www.topology.com.tw/tri/2013
Xiao Mi, www.xiaomi.com2013