
A-Brief-Overview-on-the-Road-Safety-Approach-in-Singapore ...
90
A Brief Overview of the Road Safety Approach in Singapore October, 2019 Public Disclosure Authorized Public Disclosure Authorized Public Disclosure Authorized Public Disclosure Authorized
-
Upload
khangminh22 -
Category
Documents
-
view
1 -
download
0
Transcript of A-Brief-Overview-on-the-Road-Safety-Approach-in-Singapore ...
A Brief Overview of the Road Safety Approach in Singapore
October, 2019
Pub
lic D
iscl
osur
e A
utho
rized
Pub
lic D
iscl
osur
e A
utho
rized
Pub
lic D
iscl
osur
e A
utho
rized
Pub
lic D
iscl
osur
e A
utho
rized

© 2019 The World Bank 1818 H Street NW, Washington DC 20433 Telephone: 202-473-1000; Internet: www.worldbank.org Some rights reserved This work is a product of the staff of The World Bank. The findings, interpretations, and conclusions expressed in this work do not necessarily reflect the views of the Executive Directors of The World Bank or the governments they represent. The World Bank does not guarantee the accuracy of the data included in this work. The boundaries, colors, denominations, and other information shown on any map in this work do not imply any judgment on the part of The World Bank concerning the legal status of any territory or the endorsement or acceptance of such boundaries. Rights and Permissions The material in this work is subject to copyright. Because The World Bank encourages dissemination of its knowledge, this work may be reproduced, in whole or in part, for noncommercial purposes as long as full attribution to this work is given. Attribution—Please cite the work as follows: “World Bank. 2019. A Brief Overview on the Road Safety Approach in Singapore. © World Bank.”
All queries on rights and licenses, including subsidiary rights, should be addressed to World Bank Publications, The World Bank Group, 1818 H Street NW, Washington, DC 20433, USA; fax: 202-522-2625; e-mail: [email protected].
2
Table of Contents
List of Figures ............................................................................................................................. 4
List of Photos .............................................................................................................................. 4
List of Tables .............................................................................................................................. 5
Acknowledgments...................................................................................................................... 6
Executive Summary .................................................................................................................... 7
Abbreviations ............................................................................................................................. 9
1. Introduction ..................................................................................................................... 10
1.1. The Safe System Approach ........................................................................................ 12
1.2. Evidence-based measures ......................................................................................... 14
1.3. Road safety in the ASEAN context ............................................................................ 15
1.4. Overview of road safety status in Singapore ............................................................ 16
2. Road Safety Management ............................................................................................... 18
2.1. Road traffic collision classification in Singapore ....................................................... 18
2.2. Vehicle safety ............................................................................................................ 19
2.3. Awareness and education ......................................................................................... 20
2.4. Red-light camera system ........................................................................................... 24
2.5. Road infrastructure ................................................................................................... 26
2.5.1. Road safety audits .............................................................................................. 26
2.5.2. LTA road maintenance program ........................................................................ 30
3. Speed Management ......................................................................................................... 31
3.1. Setting speed limits ................................................................................................... 31
3.2. Enforcement of speed limits ..................................................................................... 32
3.3. Speed cameras .......................................................................................................... 35
3.4. Traffic-calming measures .......................................................................................... 38
4. Road Infrastructure .......................................................................................................... 42
4.1. Road parameters ....................................................................................................... 42
4.2. Safer roadsides for forgiving roads ........................................................................... 44
4.2.1. Vehicle impact guardrail .................................................................................... 44
4.2.2. Rumble strips ..................................................................................................... 45
3
4.2.3. Raised profile marking ....................................................................................... 45
4.2.4. Crash cushions ................................................................................................... 46
4.3. Self-explaining roads ................................................................................................. 47
4.4. Pedestrian footbridges .............................................................................................. 47
5. Dangerous Infrastructure................................................................................................. 49
5.1. Identifying dangerous existing streets ...................................................................... 49
5.2. Dangerous road designs ............................................................................................ 51
5.3. Dangerous Pedestrian and Cyclist Infrastructure ..................................................... 52
6. Safer Design Principles: Before-and-After Study on Sustainable Cycling and Pedestrian Infrastructure ........................................................................................................................... 56
7. Conclusions ...................................................................................................................... 58
References ............................................................................................................................... 59
Appendix A – Pedestrian Infrastructure Design Guidance ...................................................... 62
Appendix B – Guardrail Design Guidance ................................................................................ 63

4
List of Figures
Figure 1.1. BIGRS (2015–19) Cities and Countries ................................................................... 11 Figure 1.2. Conceptualization of the Safe System Approach................................................... 13 Figure 1.3. Estimated Fatalities per 100,000 Population, ASEAN ............................................ 15 Figure 1.4. Fatalities per 100,000 Population, Singapore ........................................................ 16 Figure 1.5. Collisions per 10,000 Vehicles, Singapore ............................................................. 17 Figure 2.1. Singapore Road Safety Campaign Poster in Public Transport Vehicles ................. 21 Figure 2.2. Singapore Road Safety Poster for Cyclists’ Safety ................................................. 22 Figure 2.3 Road Safety Poster for speeding ............................................................................. 23 Figure 2.4. Red-Light Camera Locations, Singapore ................................................................ 24 Figure 3.1. Speed Camera Locations, Singapore ...................................................................... 35 Figure 3.2. Speeding Violations 2010–18, Singapore .............................................................. 38 Figure 4.1. Sight Stopping Distance ......................................................................................... 43 Figure 4.2. Raised Profile Marking ........................................................................................... 46 Figure 4.3. Raised Profile Marking, Side Profile View .............................................................. 46
List of Photos
Photo 2.1. Red-Light Camera, Singapore ................................................................................. 25 Photo 2.2. PCSR Hazard, Singapore ......................................................................................... 30 Photo 3.1. Two-Stage Crossing ................................................................................................ 33 Photo 3.2. Silver Zone Sign and Rumble Strips, Bukit Merah View ......................................... 34 Photo 3.3. Chicanes, Bukit Merah View ................................................................................... 34 Photo 3.4. Fixed Speed Camera, Singapore ............................................................................. 36 Photo 3.5. Mobile Speed Camera, Singapore .......................................................................... 36 Photo 3.6. Police Speed Laser Camera .................................................................................... 37 Photo 3.7. Average-Speed Camera, Singapore ........................................................................ 37 Photo 3.8. Centre Refuge Island, Singapore ............................................................................ 39 Photo 3.9. Centre Divider, Singapore ...................................................................................... 40 Photo 3.10. Chevron Markings, Singapore .............................................................................. 40 Photo 3.11. Road Hump, Singapore ......................................................................................... 41 Photo 3.12. Hatching Marking, Oldham Lane, Singapore ........................................................ 41 Photo 4.1. Crash Cushion, Singapore ....................................................................................... 46 Photo 4.2. Examples of Self-Explaining Roads in Singapore .................................................... 47 Photo 4.3. Examples of Frequently Used Footbridges in Singapore ....................................... 48 Photo 5.1. Fully Controlled Right Turn (red-amber-green arrows) ......................................... 50 Photo 5.2. Signal box located unsafely on the edge of the carriageway, Singapore .............. 51
5
Photo 5.3. Inadequate Visibility Along Vertical Curve, Singapore ........................................... 52 Photo 5.4. Unremoved Crossing, Singapore ............................................................................ 53 Photo 5.5. Inadequate Crossing, Singapore ............................................................................. 54 Photo 5.6. Hazardous Footpath, Singapore ............................................................................. 54 Photo 5.7. Inadequate Crossing ............................................................................................... 55 Photo 6.1. Previous Street Configuration, Bencoolen Street, Singapore ................................ 56 Photo 6.2. New Street Configuration, Bencoolen Street, Singapore .................................. 57 Photo 6.3. Improved Pedestrian Facilities, Bencoolen Street, Singapore ............................... 57
List of Tables
Table 2.1. Vehicle Safety Items (LTA 2017a) ............................................................................ 20 Table 2.2. PSR Stages ............................................................................................................... 27 Table 2.3. Collision Frequency and Severity ............................................................................ 28 Table 2.4. Definition of Risk Category ...................................................................................... 28 Table 2.5. Guide on Accident Frequency Index ....................................................................... 28 Table 2.6. Guide on Accident Severity Index ........................................................................... 29 Table 2.7. Definition of Practicability Category ....................................................................... 29 Table 3.1. Singapore Speed Limits (kilometers per hour) ....................................................... 32 Table 4.1. Main Principles for Forgiving Roads ........................................................................ 44
6
Acknowledgments
This work was undertaken by the World Bank road safety focal point for the Bloomberg Philanthropies’ Initiative for Global Road Safety (BIGRS) in Southeast Asia and the Pacific, Alina F. Burlacu (Transport Specialist), together with Emily Tan (Consultant). The entire work was funded by the Bloomberg Philanthropies under the BIGRS.
The report benefited from extremely useful advice from the Global Road Safety Facility specialists: Soames Job (Global Lead Road Safety), Dipan Bose (Senior Transport Specialist and Task Team Leader for BIGRS), Juan Miguel Velasquez (Transport Specialist, BIGRS focal point for Latin America and the Caribbean region), and Sudeshna Mitra (Transport Specialist), as well as international road safety expert Daniel Mustata (Australia).

7
Executive Summary
This report introduces how the Safe System Approach works, with a focus on road infrastructure and road safety engineering best practices from one of the best performing countries in Southeast Asia and the Pacific, Singapore.
Singapore roads are not only considered the safest in the region, they rank among the safest globally. Road safety management rules and regulations implemented in the country have resulted in significant strides in managing the effects of collision factors related to roadway design, human behavior, and vehicle attributes. As a result, road safety statistics have shown that fatalities on the Singapore road network have been steadily declining over the past decade. This is leading to a desire on the part of neighboring countries to follow Singapore’s example and learn from its experience.
In order to mitigate collisions attributed to vehicle inadequacies or defects, one of the measures taken in Singapore was to enforce a strict vehicle import policy. Vehicle imports are permissible from countries that have adopted and comply with recognized high vehicle safety standards. Vehicle safety compliance is particularly focused on 52 items specified by the Land Transport Authority (LTA). In addition to strict vehicle import standards, Singapore enforces a strict vehicle quota system, which regulates the number of vehicles on the road network. Additionally, vehicles are required to undergo frequent inspections. Cars between 3 and 10 years old are required to have a biennial inspection, and cars older than 10 years are required to undergo annual inspections. Furthermore, taxis are required to undergo inspections every six months.
Road safety education and driver education are core tenants of Singapore’s roads safety strategy. Road safety education is predominately undertaken by the Singapore Traffic Police, but nongovernmental organizations such as the National Security Coordination Secretariat contribute significantly to road safety education in Singapore.
Ensuring that roads are safe and adequate for road users is vital, and Singapore implements a range of road safety management measures to ensure this is the case. Road safety audits, also known as Project Safety Reviews (PSR), have been implemented in Singapore since 1998. LTA guidelines specify that PSRs are required to be undertaken at the planning, design, construction, and completion stage of a project. PSRs are essential components of Singapore’s road safety strategy.
Another key road safety measure used in Singapore is speed cameras. A network of 87 speed cameras is strategically positioned along the road network. Singapore uses four different types of speed cameras: fixed speed camera, police speed laser camera, mobile speed camera, and average speed camera. Data obtained from the Singapore Traffic Police show
8
that the number of speeding violations is in decline. The data have shown that the introduction of 20 speed cameras at 11 locations in 2014 has resulted in a steep decline in the number of violations. Further investigation would be required to know whether this decline is attributed solely to the speed cameras or to various contributing factors.
Speed management is essential, particularly in areas where vehicles and vulnerable road users come into contact. Traffic-calming measures can be a low cost and effective way of managing speeds in areas with a presence of vulnerable road users and can include physical measures such as road dividers or visual measures such as road markings. Certain areas in Singapore have been designated as “special zones”: Silver Zones and School Zones. Speed management techniques have been implemented in these areas because of the presence of vulnerable pedestrians such as elderly people and school children. Speed management and traffic-calming measures in School Zones and Silver Zones include lower speeds (40 kilometers per hour in school zones and 40 kilometers per hour when possible in silver zones), appropriate signage, assisted crossings and road safety features such as rumble strips.
At the same time, in order to prevent collisions at junctions due to vehicles running red lights, Singapore implements a red-light camera (RLC) system. Research has shown RLCs can be an effective way of preventing or reducing the impact of collisions. Singapore has a total of 240 RLCs across its road network.
As previously stated, Singapore roads are among the safest globally, but there is still room for improvement, particularly when it comes to pedestrian infrastructure. Pedestrians and cyclists account for approximately 16 percent of all road deaths in Southeast Asia. The number of collisions involving pedestrians in Singapore in 2018 was 1,036, and 25 percent were elderly pedestrians (who actually account for 62.5 percent of pedestrian fatalities). Although the pedestrian infrastructure in Singapore is considered good, there are plenty of examples of subpar pedestrian infrastructure across the country that could benefit from improvements.
Additionally, there have been recent strides by local authorities in Singapore to improve sustainability and accessibility by promoting sustainable modes of transport. Several improvement schemes have been implemented, and many more are planned to improve pedestrian and cyclist accessibility.
9
Abbreviations
BIGRS Bloomberg Philanthropies’ Initiative for Global Road Safety COE Certificate of Entitlement GRSF Global Road Safety Facility LTA Land Transport Authority PSR Project Safety Review RLC red-light camera SRSC Singapore Road Safety Council TP Singapore Traffic Police WHO World Health Organization VIG vehicle impact guardrail

10
1. Introduction
The World Health Organization (WHO) estimates that road injuries accounted for approximately 1.35 million deaths in 2016, ranking it 8th in the top 10 global causes of death (WHO 2018a). This global epidemic is not only fatal but comes with great economic consequences. Road collisions are estimated to cost around US$518 billion, costing countries 1–2 percent of their annual GDP. If no intervention is taken, road traffic injuries are expected to become the fifth leading cause of death globally by 2030.
The World Bank gives road safety a critical consideration in its transport investment projects. Through its Global Road Safety Facility (GRSF), a partnership under the Bloomberg Philanthropies’ leadership was formed with another nine international institutions, creating the Bloomberg Philanthropies’ Initiative for Global Road Safety (BIGRS).
A World Bank (2017) study on the economic impact of road traffic injuries, undertaken under BIGRS, shows that over time, sharply reducing the number of road traffic injuries and deaths would enable the study’s five selected countries to attain substantial increases in economic growth and national income, leading simultaneously to clear welfare gains. Reducing road traffic mortality and morbidity by 50 percent and sustaining it over a period of 24 years could, for example, generate an additional flow of income equivalent to 22.2 percent of 2014 GDP in Thailand and a 7.2 percent increase in the Philippines. This puts into perspective the magnitude of economic benefits that the countries may realize with sustained action if they were to achieve the United Nations Sustainable Development Goal targets on road safety.
The Bloomberg Philanthropies’ BIGRS (2015–19) is the second phase of a $125 million partnership program focused on reduction of road deaths and serious injuries in 10 selected cities and 5 countries in the developing world (figure 1.1). The following cities were selected through a competitive process: Accra, Addis Ababa, Bandung, Bangkok, Bogota, Fortaleza, Ho Chi Minh City, Mumbai, Sao Paulo, and Shanghai. Under the program, cities have been receiving funding support for full-time staff embedded in city agencies, comprehensive technical assistance from the collaborating organizations, training and capacity building for enforcement agency, and media and social awareness campaigns.
In addition, five countries were selected (China, India, Philippines, Tanzania, and Thailand) to receive support for national-level activities including legislative and policy implementation activities. Bloomberg has also requested the World Bank to carry out financial costing studies and assessment of high-risk roads in the five selected countries.
Figure 1.1 shows the locations of the BIGRS activities:

11
Figure 1.1. BIGRS (2015–19) Cities and Countries
Under BIGRS, the objective for the World Bank engagement is to:
• build road safety management capacity; • improve road infrastructure safety; and • leverage related road safety investment in countries where significant impact on lives
saved can be achieved.
Working together with other BIGRS Safer Streets and Safer Mobility partners, EMBARQ - the World Resources Institute, Ross Centre for Sustainable Cities, and the National Association of City Transportation Official's Global Designing Cities Initiative, the World Bank complements efforts in improving road infrastructure and mobility safety for the selected cities.
This report introduces how the Safe System Approach works, with a focus on road infrastructure and road safety engineering best practices from one of best performing countries in Southeast Asia and the Pacific, Singapore.
12
1.1. The Safe System Approach
The Safe System Approach advocates for a safe road system, better adapted to the physical tolerance of its users (Well et al. 2018; ITF 2016). The core principles of this approach are in line with well-known mid-1990s national strategies such as Sweden’s Vision Zero and the Netherlands’ Sustainable Safety approach (PIARC 2015). It was officially endorsed by the Australian Transport Council in 2004 and adopted by all Australian state and territory road authorities. The history of how the Safe System Approach was adopted and some of the rationale behind it is presented by Grzebieta, Mooren, and Job (2013).
The main highlight of the Safe System Approach is that while it recognizes the need for responsible road user behavior, it also accepts that human error is inevitable. It therefore aims to create a road transport system that makes allowance for errors and minimizes the consequences—in particular, the risk of death or serious injury.
Obviously, the Safe System Approach does not absolve road users from complying with road laws. On the contrary, the Safe System Approach works at its optimum when road users comply with road laws. In other words, the Safe System Approach should be considered as a holistic graded safety system. For fully compliant road users, the Safe System Approach should guarantee maximum protection against death and serious injury. Road users should not expect to die or be seriously injured if, through no fault of their own, they find themselves involved in a crash or collision. However, the system should also assist with reducing the risk of a fatality or serious injury for a noncompliant road user who is involved in a crash.
In a nutshell, by taking a total view of the combined factors involved in road safety, the Safe System Approach encourages a better understanding of the interaction between the key elements of the road system: road users, roads and roadsides, vehicles and travel speeds (see Figure 1.2). It has three core components:
1. Safe roads and roadsides: a transport system designed to make a collision survivable through a combination of design and maintenance of roads and roadsides
2. Safe vehicles: the design of vehicles and their safety equipment to include protective systems including electronic stability control, air cushions, and so forth
3. Safe speeds: a speed limit reflecting the road safety risk to the road users and sending them the right messages

13
Figure 1.2. Conceptualization of the Safe System Approach
Source: ITF 2016.
It is essential that vehicles travel at speeds that suit the function and the level of safety of the road to ensure that crash forces are kept below the limits that cause death or serious injury. This requires the setting of appropriate speed limits supplemented by effective enforcement and education, together with self-explaining infrastructure that would send all road users the right signals on how to use the road.
14
1.2. Evidence-based measures
Evidence-based measures involve looking at a crash, casualty, and any other available data to be sure what road safety issue needs to be addressed. It further involves research and evaluation reports to check whether the type of intervention being considered is likely to be effective. Evidence-based practice originated in medicine, but it has been translated to several policy areas, including road safety.
Evidence-based practice can help to ensure that both new and existing interventions are successful, as they have been proven to work in a similar context, and also maximize efficiency in times of budget cuts.
The main evidence-based interventions in road safety can be divided into four main groups:
1. Safer road users: informing and educating users about safe use of the road, and taking action against those who do not comply with the rules
2. Safer roads: designing, constructing, and maintaining roads and roadsides to reduce the risk of crashes and minimize the severity of injury if a crash occurs
3. Safer vehicles: designing and maintaining vehicles to minimize the risk of crashes and the severity of injury to motor vehicle occupants, pedestrians, and cyclists if a crash occurs
4. Safer speeds: setting speed limits taking into account the level of risk on the road network and the benefits of lower speeds in minimizing the incidence and severity of injury in the event of a crash, together with the corresponding self-explaining infrastructure and enforcement
According to Wegman et al. (2017), three subjects are key in this new approach of evidence-based and data-driven road safety management: ex post and ex ante evaluation of both individual interventions and intervention packages in road safety strategies, and transferability (external validity) of the research results.

15
1.3. Road safety in the ASEAN context
It is estimated that vulnerable road users such as pedestrians, cyclists, and motorcyclists account for approximately 50 to 75 percent of all road traffic fatalities in Asia and the Pacific.
According to WHO (2018b), the Southeast Asia region accounts for the second highest road fatality rate globally, surpassed only by Africa. In 2016 there were approximately 20.7 road traffic fatalities per 100,000 people in the Southeast Asia region.
WHO also estimates the number of road traffic fatalities globally in 2016 at 18.2 per 100,000 people. The road traffic fatality rate in the Southeast Asia region was approximately 13 percent greater than the overall global road traffic fatality rate in 2016.
WHO road traffic fatality data show that several ASEAN nations have particularly high road traffic fatality rates. ASEAN nations such as Malaysia, Thailand, and Vietnam have road traffic fatality rates of 23.6, 32.7, and 26.4 deaths per 100,000 people respectively (figure 1.3). This is significantly greater than the global road traffic fatality rate.
Figure 1.3. Estimated Fatalities per 100,000 Population, ASEAN
Source: WHO 2018a.
0
5
10
15
20
25
30
35
40
45
Singapore Indonesia Philippines Lao PDR Cambodia Myanmar Malaysia Vietnam Thailand
2010 2013 2016
16
1.4. Overview of road safety status in Singapore
Singapore is located in Southeast Asia and consists of islands between Malaysia and Indonesia. It is the focal point for Southeast Asian sea routes. The land area is less than seven hundred square kilometers, with a coastline of 193 kilometers. The island is relatively flat in the lowlands and its highest point is 166 meters. The climate is tropical: hot, humid, and rainy with two distinct monsoon seasons.
Singapore is a highly developed and successful free market economy, enjoying a remarkably open and corruption-free environment, stable prices, and one of the highest per capita GDPs in the world. The population of Singapore is over 5 million people, with an average life expectancy of 83.2 years.
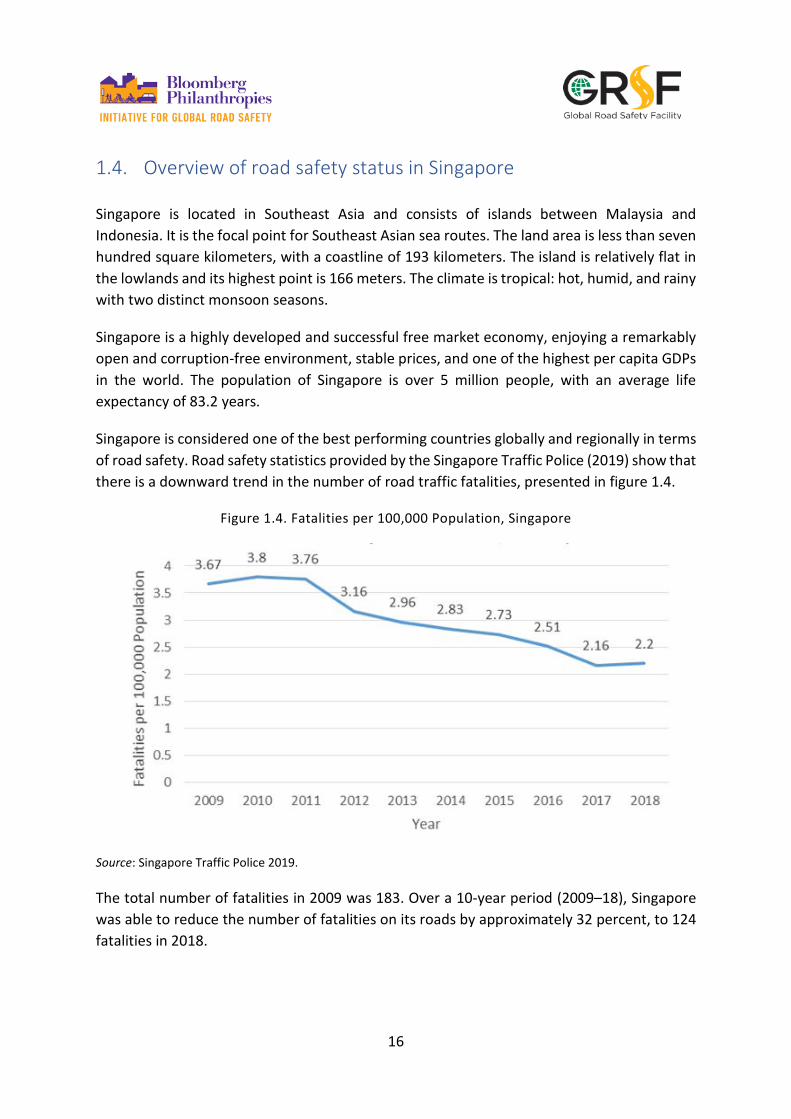
Singapore is considered one of the best performing countries globally and regionally in terms of road safety. Road safety statistics provided by the Singapore Traffic Police (2019) show that there is a downward trend in the number of road traffic fatalities, presented in figure 1.4.
Figure 1.4. Fatalities per 100,000 Population, Singapore
Source: Singapore Traffic Police 2019.
The total number of fatalities in 2009 was 183. Over a 10-year period (2009–18), Singapore was able to reduce the number of fatalities on its roads by approximately 32 percent, to 124 fatalities in 2018.
17
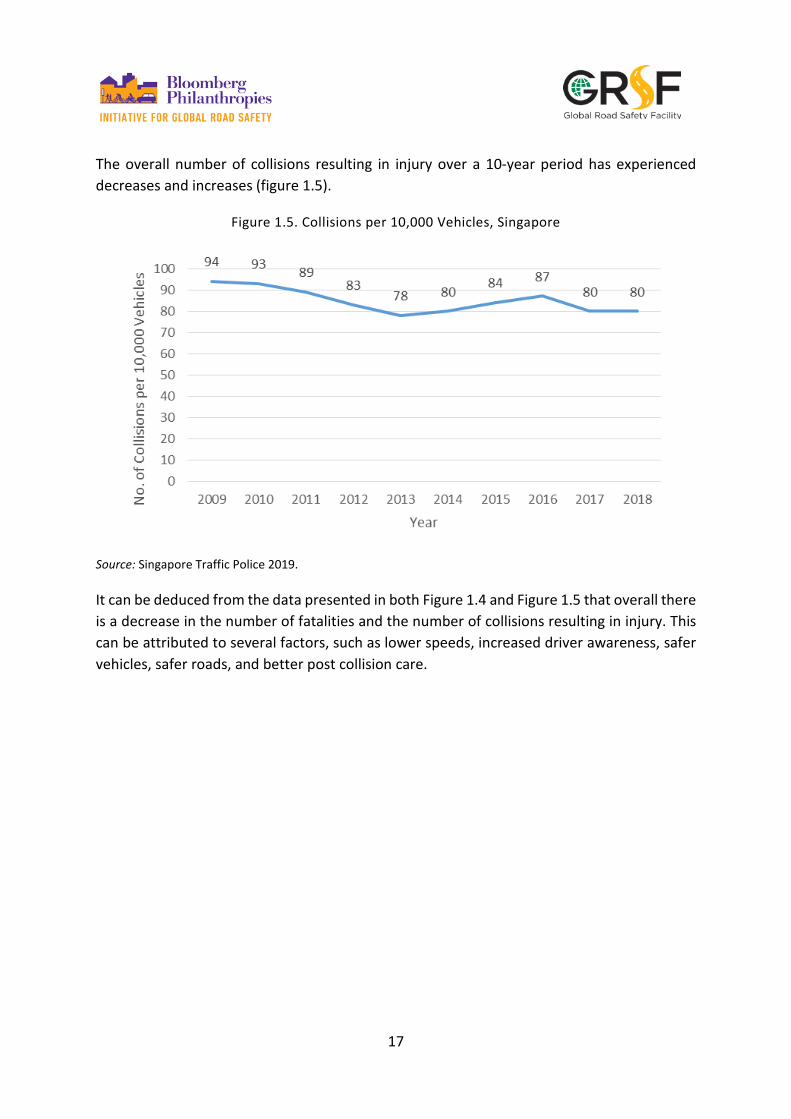
The overall number of collisions resulting in injury over a 10-year period has experienced decreases and increases (figure 1.5).
Figure 1.5. Collisions per 10,000 Vehicles, Singapore
Source: Singapore Traffic Police 2019.
It can be deduced from the data presented in both Figure 1.4 and Figure 1.5 that overall there is a decrease in the number of fatalities and the number of collisions resulting in injury. This can be attributed to several factors, such as lower speeds, increased driver awareness, safer vehicles, safer roads, and better post collision care.

18
2. Road Safety Management
The first and fundamental pillar of WHO’s Global Plan for the Decade of Action for Road Safety is road safety management (WHO 2011). The World Report on Road Traffic Injury Prevention (Peden 2004) and the Global Plan highlight that a systematic and planned approach is required to improve road safety performance. The most effective way countries and organizations can improve road safety performance is by establishing an effective road safety management system.
In Singapore, the responsibility of road management is held by the Land Transport Authority (LTA) and the Singapore Traffic Police (TP). The LTA is responsible for the provision and maintenance of road facilities and vehicle safety, whereas the TP are entrusted with the responsibility of enforcing traffic regulations and providing publicity and education.
2.1. Road traffic collision classification in Singapore
A road traffic collision is an incident involving one or more vehicles, occurring on the public highway and resulting in personal injury that is recorded by the police. A road traffic collision is a rare, random, multifactor event always preceded by a situation in which one or more road users have failed to cope with the road environment.
In Singapore, road traffic collisions are classified into four categories of severity: (i) fatality, (ii) serious injury, (iii) slight injury, and (iv) property damage. A fatal casualty in a road traffic collision is one in which the victim dies within 30 days of the collision.
A seriously injured casualty is one who has suffered injuries such as a fracture, concussion, internal lesions, crushing, severe cuts and laceration, or severe general shock requiring medical treatment or hospitalization, such that the person is unable to perform his ordinary pursuits for at least seven days. A slightly injured casualty is one who is conveyed to the hospital from the scene in an ambulance or otherwise, one who requires subsequent medical treatment entailing hospitalization, and one who takes medical leave of up to three days.
Collisions are assigned the severity group according to the most seriously affected casualty in the collision. All reported collisions not involving injuries are classified as property-damage-only collisions.
A road traffic collision can be attributed to several factors. These include road factors, human factors, vehicle factors, and environmental factors.

19
2.2. Vehicle safety
As previously stated, vehicle factors can also contribute to a collision. The provision of safety features such as airbags and antilock braking systems can decrease the likelihood of a collision or the severity of a collision. Singapore allows the importation of new vehicles directly from the manufacturer or from countries with higher or equivalent safety and exhaust emission standards to Singapore’s. The importation of used cars less than three years old and classic or vintage cars is allowed (LTA 2017a).
Imported vehicles are required to comply with the Road Traffic Act and its subsidiary legislations. Vehicles imported from EU countries, Japan, and the United States are deemed acceptable, as the LTA recognizes that these have adopted an internationally recognized high vehicle-safety standard.
Stringent regulation of the importation of vehicles prevents the use of unsafe vehicles on the roads of Singapore.
At the same time, in order to maintain a steady rate of vehicle growth with the development of transport infrastructure, vehicle quotas are enforced in Singapore. In order to own and operate a vehicle in Singapore, a Certificate of Entitlement (COE) is required. The COE allows the vehicle owner the right to own a vehicle for a period of 10 years.
The vehicle quota is determined by several conditions:
• The total number of deregistered vehicles • The allowable growth in vehicle growth, that is, capacity for new vehicles • Adjustments to account for changes in taxi population, replacements under the Early
Turnover Scheme, past over projections, and expired or cancelled temporary COEs
The quota for the number of COE’s available is updated every three months (LTA, 2019).
In addition, according to the Singapore Land Transport Master Plan 2040, 67 percent of all peak-period journeys are now undertaken on public transport, compared to 63 percent in 2012. This has a considerable impact on road safety, since public transport is considered the safest means of transportation on the road.
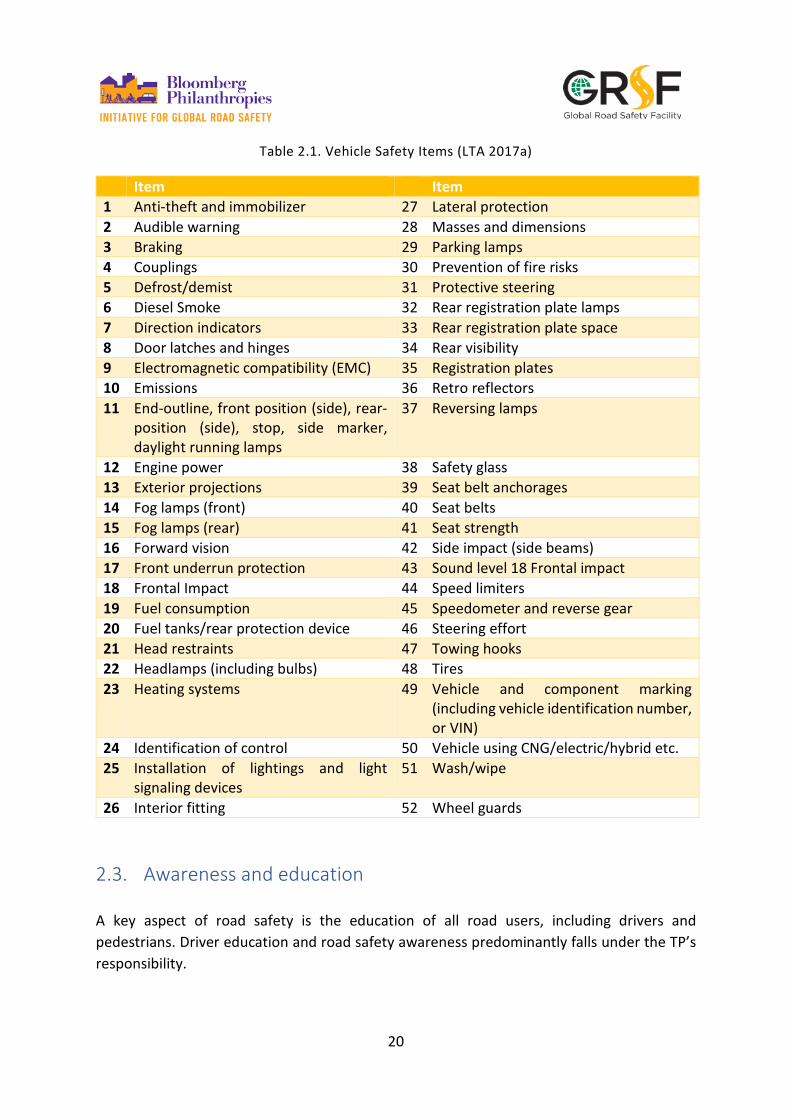
Table 2.1. outlines 52 items that are required for a vehicle to comply with in terms of vehicle safety standards.
20
Table 2.1. Vehicle Safety Items (LTA 2017a)
Item Item 1 Anti-theft and immobilizer 27 Lateral protection 2 Audible warning 28 Masses and dimensions 3 Braking 29 Parking lamps 4 Couplings 30 Prevention of fire risks 5 Defrost/demist 31 Protective steering 6 Diesel Smoke 32 Rear registration plate lamps 7 Direction indicators 33 Rear registration plate space 8 Door latches and hinges 34 Rear visibility 9 Electromagnetic compatibility (EMC) 35 Registration plates 10 Emissions 36 Retro reflectors 11 End-outline, front position (side), rear-
position (side), stop, side marker, daylight running lamps
37 Reversing lamps
12 Engine power 38 Safety glass 13 Exterior projections 39 Seat belt anchorages 14 Fog lamps (front) 40 Seat belts 15 Fog lamps (rear) 41 Seat strength 16 Forward vision 42 Side impact (side beams) 17 Front underrun protection 43 Sound level 18 Frontal impact 18 Frontal Impact 44 Speed limiters 19 Fuel consumption 45 Speedometer and reverse gear 20 Fuel tanks/rear protection device 46 Steering effort 21 Head restraints 47 Towing hooks 22 Headlamps (including bulbs) 48 Tires 23 Heating systems 49 Vehicle and component marking
(including vehicle identification number, or VIN)
24 Identification of control 50 Vehicle using CNG/electric/hybrid etc. 25 Installation of lightings and light
signaling devices 51 Wash/wipe
26 Interior fitting 52 Wheel guards
2.3. Awareness and education
A key aspect of road safety is the education of all road users, including drivers and pedestrians. Driver education and road safety awareness predominantly falls under the TP’s responsibility.
21
The TP frequently organize road safety campaigns extended to all road users, including pedestrians and cyclists. There are three driver training centers in Singapore:
• Bukit Batok Driving Centre Ltd • ComfortDelGro Driving Centre Pte Ltd • Singapore Safety Driving Centre Ltd
The driving centers are responsible for the training of new drivers as well as conducting retraining courses for the suspended drivers. The driving centers are also responsible for testing drivers in collaboration with the TP.
The driving instructors at the driving centers are of a high standard and are closely monitored by the TP. The centers make use of structured theory and practical course as well as driving and riding simulators in their teaching program.
The Road Safety Division of the TP holds the responsibility of delivering road safety education to the public. They work hand in hand with various community groups to promote road safety for all road users. The TP reach the population using the following communication avenues:
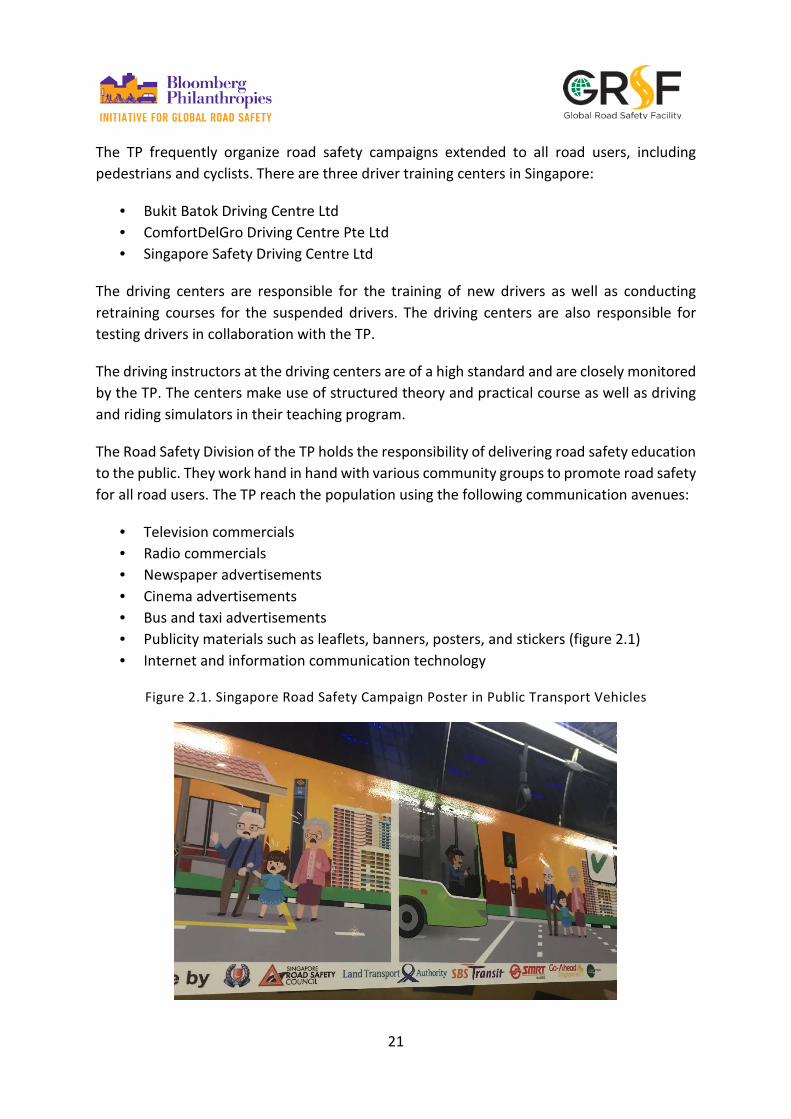
• Television commercials • Radio commercials • Newspaper advertisements • Cinema advertisements • Bus and taxi advertisements • Publicity materials such as leaflets, banners, posters, and stickers (figure 2.1) • Internet and information communication technology
Figure 2.1. Singapore Road Safety Campaign Poster in Public Transport Vehicles
22
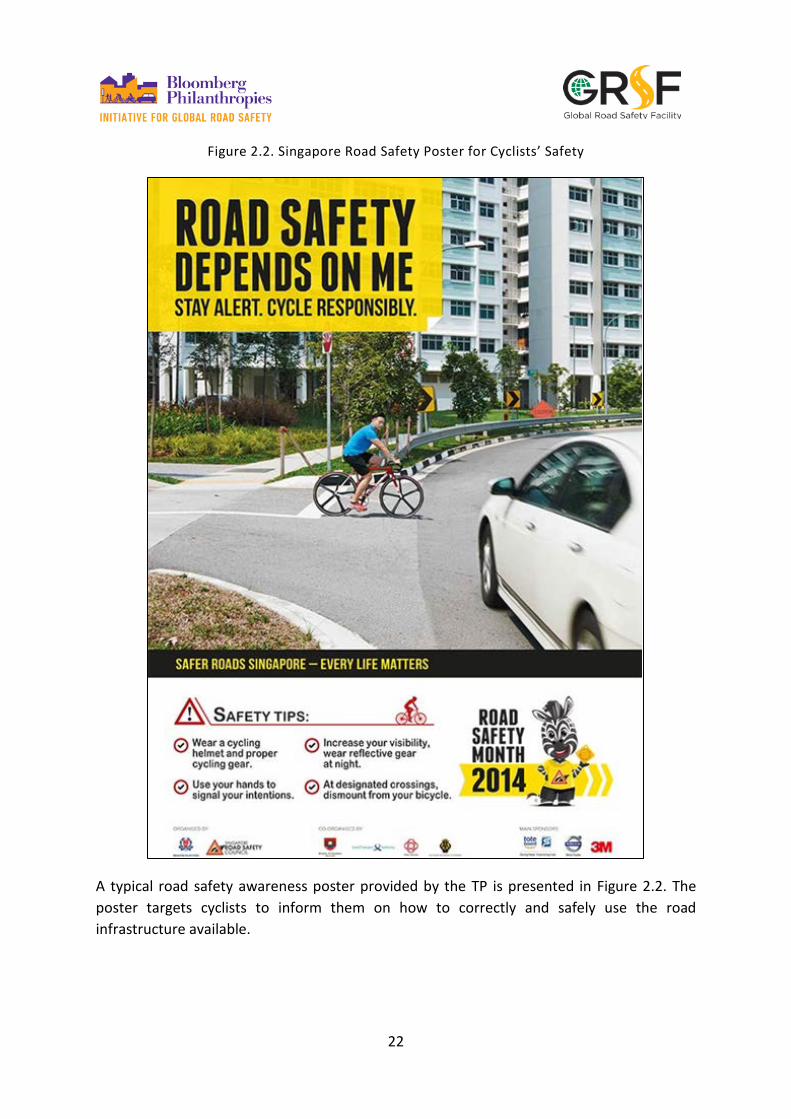
Figure 2.2. Singapore Road Safety Poster for Cyclists’ Safety
A typical road safety awareness poster provided by the TP is presented in Figure 2.2. The poster targets cyclists to inform them on how to correctly and safely use the road infrastructure available.
23
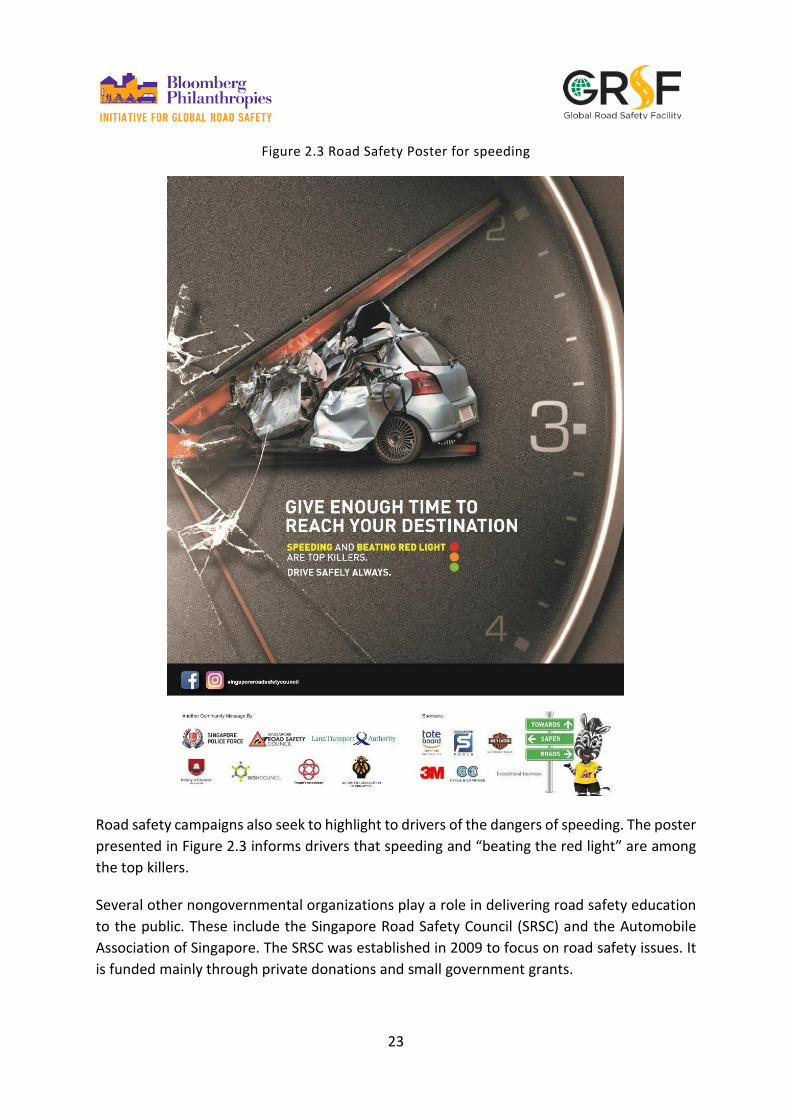
Figure 2.3 Road Safety Poster for speeding
Road safety campaigns also seek to highlight to drivers of the dangers of speeding. The poster presented in Figure 2.3 informs drivers that speeding and “beating the red light” are among the top killers.
Several other nongovernmental organizations play a role in delivering road safety education to the public. These include the Singapore Road Safety Council (SRSC) and the Automobile Association of Singapore. The SRSC was established in 2009 to focus on road safety issues. It is funded mainly through private donations and small government grants.
24
2.4. Red-light camera system
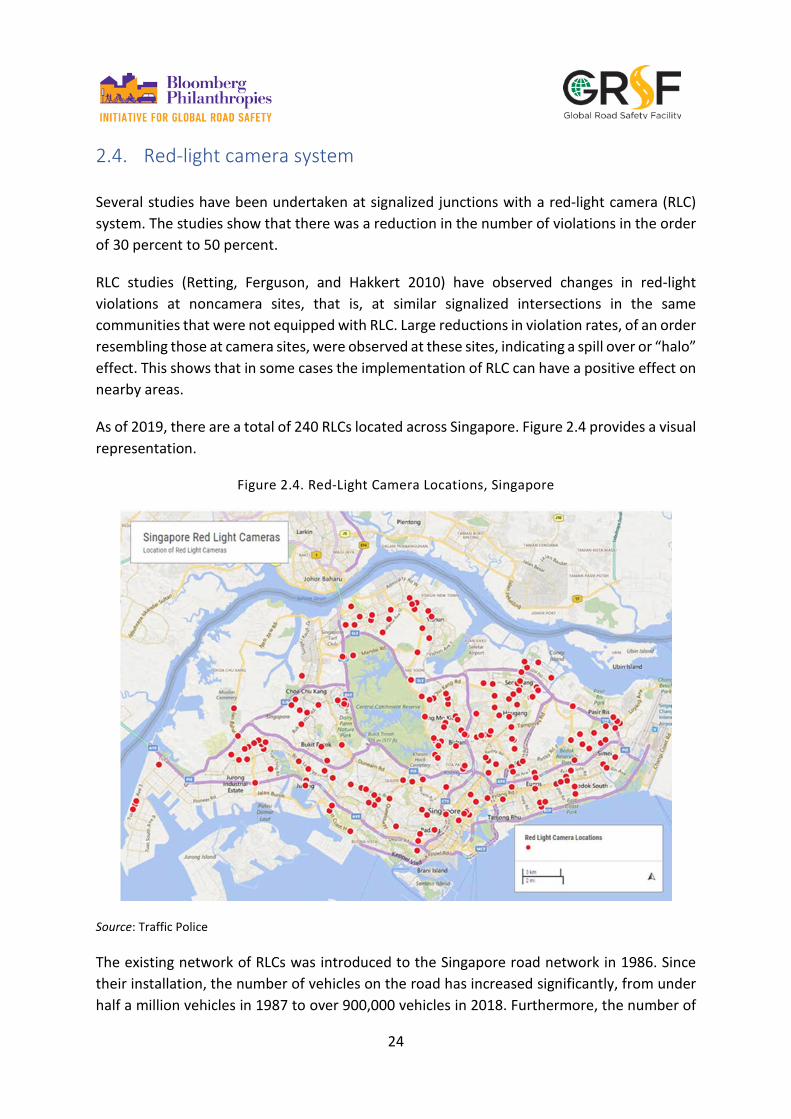
Several studies have been undertaken at signalized junctions with a red-light camera (RLC) system. The studies show that there was a reduction in the number of violations in the order of 30 percent to 50 percent.
RLC studies (Retting, Ferguson, and Hakkert 2010) have observed changes in red-light violations at noncamera sites, that is, at similar signalized intersections in the same communities that were not equipped with RLC. Large reductions in violation rates, of an order resembling those at camera sites, were observed at these sites, indicating a spill over or “halo” effect. This shows that in some cases the implementation of RLC can have a positive effect on nearby areas.
As of 2019, there are a total of 240 RLCs located across Singapore. Figure 2.4 provides a visual representation.
Figure 2.4. Red-Light Camera Locations, Singapore
Source: Traffic Police
The existing network of RLCs was introduced to the Singapore road network in 1986. Since their installation, the number of vehicles on the road has increased significantly, from under half a million vehicles in 1987 to over 900,000 vehicles in 2018. Furthermore, the number of
25
driving license holders has increased considerably, from 735,480 holders in 1987 to over two million in 2018.
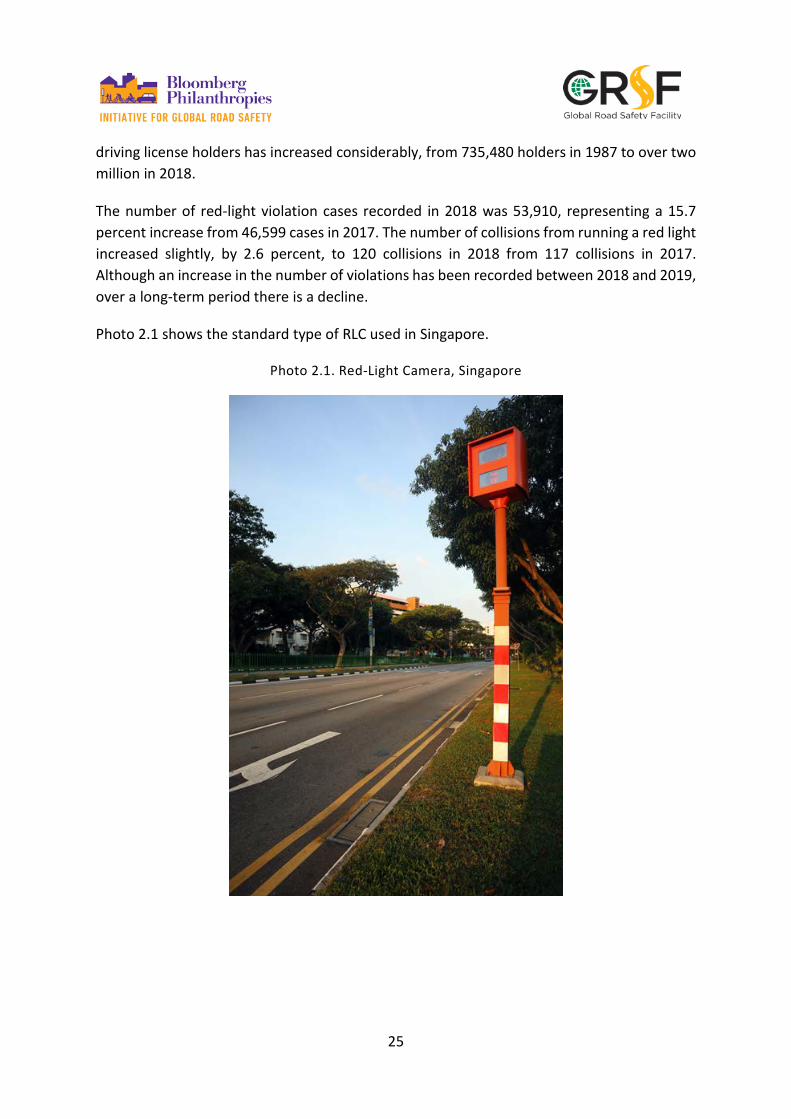
The number of red-light violation cases recorded in 2018 was 53,910, representing a 15.7 percent increase from 46,599 cases in 2017. The number of collisions from running a red light increased slightly, by 2.6 percent, to 120 collisions in 2018 from 117 collisions in 2017. Although an increase in the number of violations has been recorded between 2018 and 2019, over a long-term period there is a decline.
Photo 2.1 shows the standard type of RLC used in Singapore.
Photo 2.1. Red-Light Camera, Singapore

26
2.5. Road infrastructure
2.5.1. Road safety audits
Safer roads are one of the core components of the Safe System Approach, as well-designed road infrastructure can reduce the likelihood and the severity of a collision. The LTA in Singapore is responsible for the planning, design, construction, operation, maintenance, and regulation of roads in Singapore. Roads are designed in accordance with design standards set out by LTA. This entails several design specifications documents including the “Code of Practice—Street Work Proposals Relating to Development Works.” The Code of Practice outlines the essential submission procedures and technical requirements pertaining to the design and construction of street work (LTA 2019b).
The Austroads guidelines define a road safety audit as a “formal examination of a future road or traffic project, an existing road, or any project which interacts with road users, in which an independent, qualified team assesses the crash potential and safety performance.” (Austroads 2019).
The aims of a road safety audit are (i) to ensure roads operate as safely as practical, (ii) to minimize the number of collisions and severity, (iii) to consider the safety of all road users, and (iv) to improve the awareness of safety design practices by design, construction, and maintenance staff. Road safety audits can lead to safe roads by removing or treating safety hazards and promoting the incorporation of safety or collision-reduction features; they can reduce the risk, severity, and likelihood of a crash to occur. In addition, road safety audits can reduce costly remedial works.
Road safety audits comprise two complementary approaches: collision reduction and collision prevention. A road safety audit is required for developing remedial measures for sites where collisions are frequent and also for modifying existing roads or designing safer ones to prevent crashes (Austroads 2019).
Road safety audits were introduced to Singapore in 1998 by the LTA as a requirement for new road projects as well as for temporary traffic schemes. The LTA offers road and transport professionals the opportunity to become a certified road safety reviewer by attending a four-day training course. Road safety audits are also known as a Project Safety Reviews (PSRs) in Singapore. The PSR is not a design check, it is a review of the safety and adequacy of the design. The PSR is an independent review and assessment of the project team’s assertion that the proposed road system is safe to use (LTA 2019c).
The PSR process in Singapore consists of four stages through which an audit of a road scheme must pass:
27
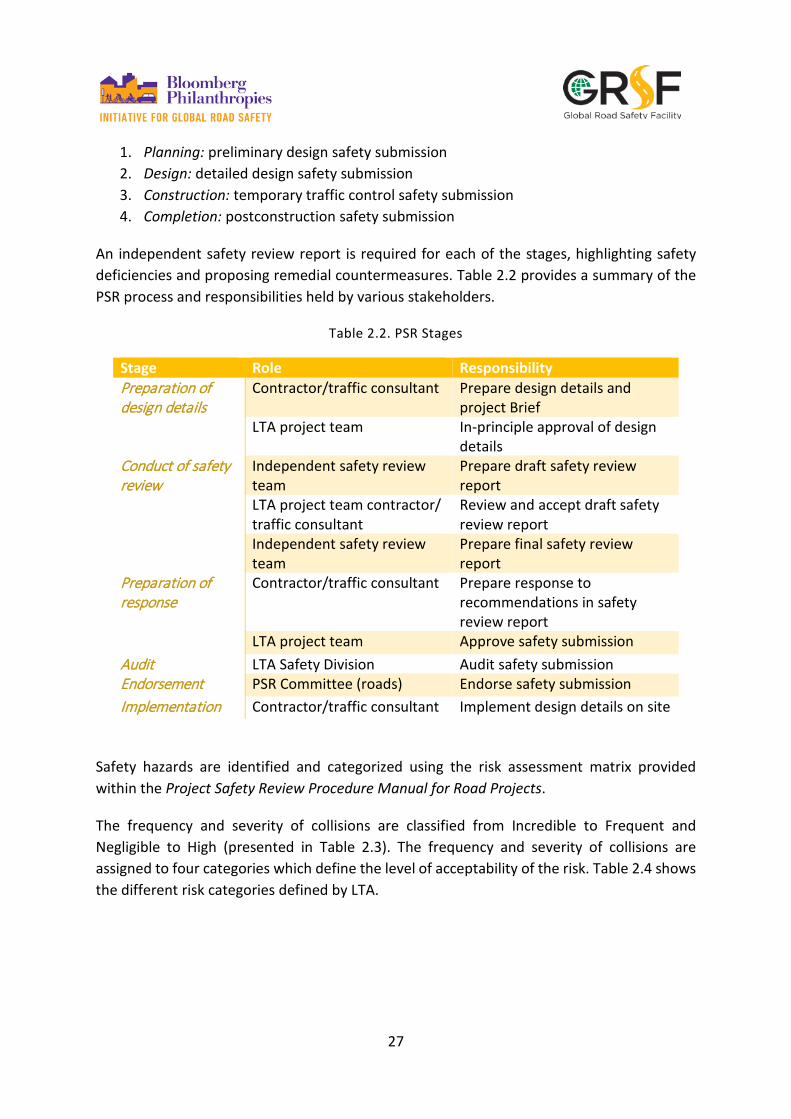
1. Planning: preliminary design safety submission 2. Design: detailed design safety submission 3. Construction: temporary traffic control safety submission 4. Completion: postconstruction safety submission
An independent safety review report is required for each of the stages, highlighting safety deficiencies and proposing remedial countermeasures. Table 2.2 provides a summary of the PSR process and responsibilities held by various stakeholders.
Table 2.2. PSR Stages
Stage Role Responsibility Preparation of design details
Contractor/traffic consultant Prepare design details and project Brief
LTA project team In-principle approval of design details
Conduct of safety review
Independent safety review team
Prepare draft safety review report
LTA project team contractor/ traffic consultant
Review and accept draft safety review report
Independent safety review team
Prepare final safety review report
Preparation of response
Contractor/traffic consultant Prepare response to recommendations in safety review report
LTA project team Approve safety submission Audit LTA Safety Division Audit safety submission Endorsement PSR Committee (roads) Endorse safety submission Implementation Contractor/traffic consultant Implement design details on site
Safety hazards are identified and categorized using the risk assessment matrix provided within the Project Safety Review Procedure Manual for Road Projects.
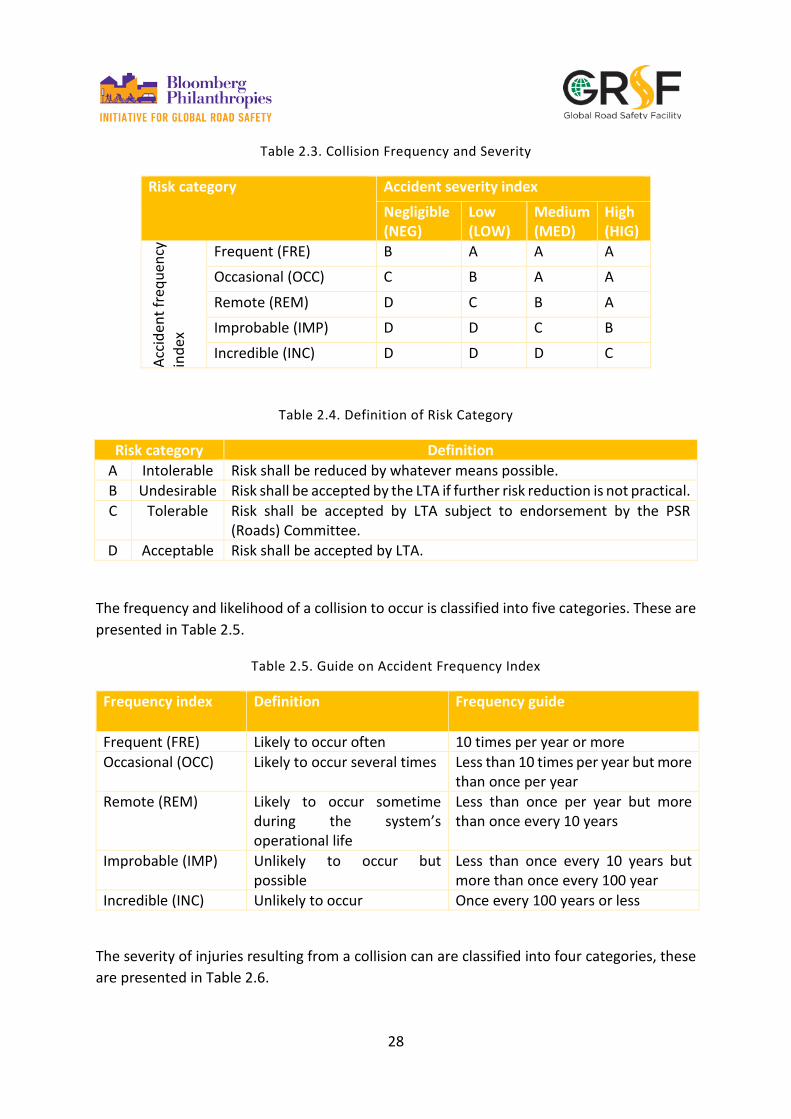
The frequency and severity of collisions are classified from Incredible to Frequent and Negligible to High (presented in Table 2.3). The frequency and severity of collisions are assigned to four categories which define the level of acceptability of the risk. Table 2.4 shows the different risk categories defined by LTA.
28
Table 2.3. Collision Frequency and Severity
Risk category Accident severity index Negligible (NEG)
Low (LOW)
Medium (MED)
High (HIG)
Acci
dent
freq
uenc
y in
dex
Frequent (FRE) B A A A
Occasional (OCC) C B A A
Remote (REM) D C B A
Improbable (IMP) D D C B
Incredible (INC) D D D C
Table 2.4. Definition of Risk Category
Risk category Definition A Intolerable Risk shall be reduced by whatever means possible. B Undesirable Risk shall be accepted by the LTA if further risk reduction is not practical. C Tolerable Risk shall be accepted by LTA subject to endorsement by the PSR
(Roads) Committee. D Acceptable Risk shall be accepted by LTA.
The frequency and likelihood of a collision to occur is classified into five categories. These are presented in Table 2.5.
Table 2.5. Guide on Accident Frequency Index
Frequency index Definition Frequency guide
Frequent (FRE) Likely to occur often 10 times per year or more Occasional (OCC) Likely to occur several times Less than 10 times per year but more
than once per year Remote (REM) Likely to occur sometime
during the system’s operational life
Less than once per year but more than once every 10 years
Improbable (IMP) Unlikely to occur but possible
Less than once every 10 years but more than once every 100 year
Incredible (INC) Unlikely to occur Once every 100 years or less
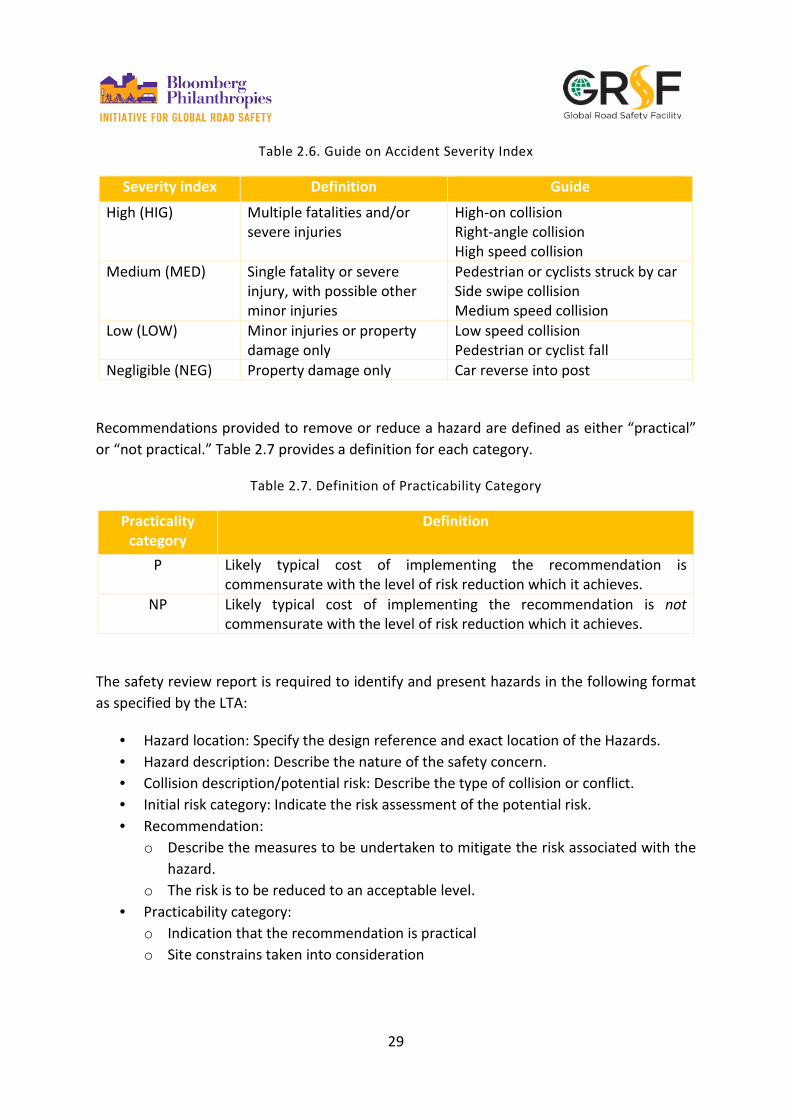
The severity of injuries resulting from a collision can are classified into four categories, these are presented in Table 2.6.
29
Table 2.6. Guide on Accident Severity Index
Severity index Definition Guide
High (HIG) Multiple fatalities and/or severe injuries
High-on collision Right-angle collision High speed collision
Medium (MED) Single fatality or severe injury, with possible other minor injuries
Pedestrian or cyclists struck by car Side swipe collision Medium speed collision
Low (LOW) Minor injuries or property damage only
Low speed collision Pedestrian or cyclist fall
Negligible (NEG) Property damage only Car reverse into post
Recommendations provided to remove or reduce a hazard are defined as either “practical” or “not practical.” Table 2.7 provides a definition for each category.
Table 2.7. Definition of Practicability Category
Practicality category
Definition
P Likely typical cost of implementing the recommendation is commensurate with the level of risk reduction which it achieves.
NP Likely typical cost of implementing the recommendation is not commensurate with the level of risk reduction which it achieves.
The safety review report is required to identify and present hazards in the following format as specified by the LTA:
• Hazard location: Specify the design reference and exact location of the Hazards. • Hazard description: Describe the nature of the safety concern. • Collision description/potential risk: Describe the type of collision or conflict. • Initial risk category: Indicate the risk assessment of the potential risk. • Recommendation:
o Describe the measures to be undertaken to mitigate the risk associated with the hazard.
o The risk is to be reduced to an acceptable level. • Practicability category:
o Indication that the recommendation is practical o Site constrains taken into consideration

30
As presented in Table 2.3, hazards vary in the level of severity. Photo 2.2 presents an example of a hazard identified during a Postconstruction Safety Review (PCSR).
Photo 2.2. PCSR Hazard, Singapore
Photo 2.2 shows an exposed vehicle impact guardrail (VIG), which poses a high threat to vehicles. VIGs are designed to prevent vehicles from running off the roadway, but they can pose as a hazard when the termination is not properly anchored or ramped down into the ground.
2.5.2. LTA road maintenance program
Road maintenance is vital for the preservation of a road’s safety and quality. The frequent maintenance of a road can lead to a reduction in the probability a collision will occur due to hazards located on the road. Furthermore, regular maintenance ensures that the level of safety is adequate for all road users.
In Singapore, the LTA operates a comprehensive road maintenance program, which encompasses the maintenance of roads, roadside features and pedestrian facilities. The maintenance program covers several facilities, including carriageways, footpaths, streetlights, signage, pedestrian overhead bridges, and other structures. Identified defects are treated promptly and potholes are fixed within an average of 24 hours of being reported (LTA 2019d). Additionally, the LTA implemented the Black Stop Program to identify, monitor, and treat locations with a high number of collisions.
Public roads and road facilities are checked and maintained regularly. The frequency of checks and maintenance of a road is as follows:
• Expressways: daily • Major roads: every two weeks • Minor roads: once every two months
31
3. Speed Management
Speed is considered a key risk factor in collision severity and causation of collisions. Speed accounts for approximately 30 percent of road deaths in high-income countries, and it is estimated that speed is the main contributing factor for half of all road collisions occurring in low- and middle-income countries (WHO 2018).
The number of speeding violations detected in Singapore was 156,157 in 2018. This represents a 5 percent decrease from 164,319 violations in 2017. Speed-related collisions amounted to 719 cases in 2018, a 5.6 percent decrease from 762 cases in 2017 (Singapore Traffic Police 2019).
Roads in Singapore are classified in five categories based on their function:
1. Expressways form the primary network where all long-distance traffic movements should be directed. They are planned to optimize long-distance mobility from one part of the island to another.
2. Major arterial roads predominantly carry through traffic from one region to another, forming principle avenues of communication for urban traffic movements. They connect expressways with minor arterial and other major arterial roads.
3. Minor arterial roads distribute traffic within the major residential and industrial areas. They are planned to optimize circulation within the area and facilitate through traffic between adjacent towns.
4. Primary access roads form the link between local accesses and arterial roads. They provide access to developments, and through-traffic is discouraged. However, where a development is also accessible by a local access road, the access shall be located at the local access road.
5. Local access roads give direct access to buildings and other developments and should connect only with primary access (LTA 2019b).
3.1. Setting speed limits
Speed limits should be set by evidence and should be self-explaining, seeking to reinforce the driver’s assessment of what is a safe speed to travel. Speed limits should encourage drivers to be self-compliant. Drivers should view the speed limit as the maximum speed and not a target speed.
There is a strong correlation between the probability of a collision—as well as the severity of injuries sustained due to a collision—and speed. Research has shown that the probability of a collision can be reduced by 5 percent with every 1 mile-per-hour (1.6 kilometers per hour) reduction in average speeds (Taylor, Lynam, and Baruya 2000).

32
When setting an appropriate speed limit for a road, several essential factors are taken into consideration:
• History of collisions: including the frequency, severity, types and causes • Road geometry and engineering: including width, sightlines, bends, junctions,
accesses and safety barriers • Road function: strategic, including through-traffic and local access • Composition of road users: including existing and potential levels of vulnerable road
users • Existing traffic speeds • Road environment: including level of road-side development
There are several approaches used when setting appropriate speed limits:
• Engineering approach: the base speed limit of a road is set according to several factors, including the 85th percentile speed, the design speed of the road, and other conditions.
• Expert system approach: speed limits are determined by the use of computer programs that take into consideration several factors relating to road conditions.
• Safety systems approach: speed limits are based on the type of collision that can occur, the likely severity of the collisions, and the human body’s tolerances to the forces of the collision.
3.2. Enforcement of speed limits
The enforcement of traffic regulations falls under the responsibility of the Singapore Traffic Police. The Road Traffic Act states that the speed limit for vehicles travelling along roads in Singapore is limited to 50 kilometers per hour unless stated otherwise (Statutes of The Republic of Singapore 2004). The LTA bears the responsibility of determining the speed limit for roads in Singapore. Table 3.1 presents the speed limit for different vehicles travelling on roads and expressways and in tunnels in Singapore.
Table 3.1. Singapore Speed Limits (kilometers per hour)
Type of vehicle Roads Expressways Tunnels Cars and motorcycles 50 70–90 50–80 Buses and coaches 50 60 50–60 Light commercial vehicles (includes light goods vehicles and small buses not exceeding 3.5 tones and seating capacity of up to 15 passengers)
50 60–70 50–70
33
Exceptions to speed limits stated in Table 3.1 do apply to fire emergency vehicles, ambulances, and government vehicles used by the Singapore Police Force or the Singapore Civil Defence Force.
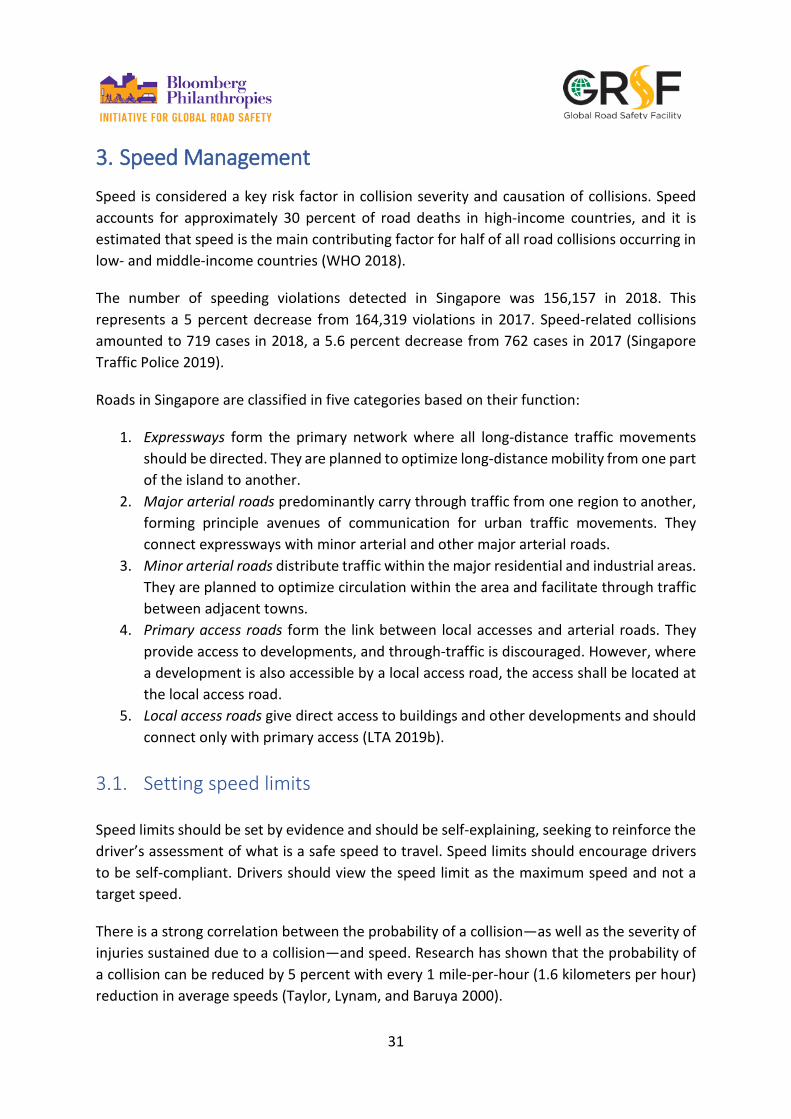
Lower speed limits are enforced in designated zones. These include School Zones and Silver Zones where speed limits are set at 40 kilometers per hour. School Zones are roads in close proximity to a school or roads located between School Zone signs. Silver Zones are located in residential neighborhoods. In addition to lower speed limits (when possible), several safety features are implemented in order to enhance road safety for elderly pedestrians. Silver Zone features are the following:
• Rest points are created on the road divider, to assist elder pedestrians crossing in two stages (Photo 3.1).
Photo 3.1. Two-Stage Crossing
Source: LTA 2017b.
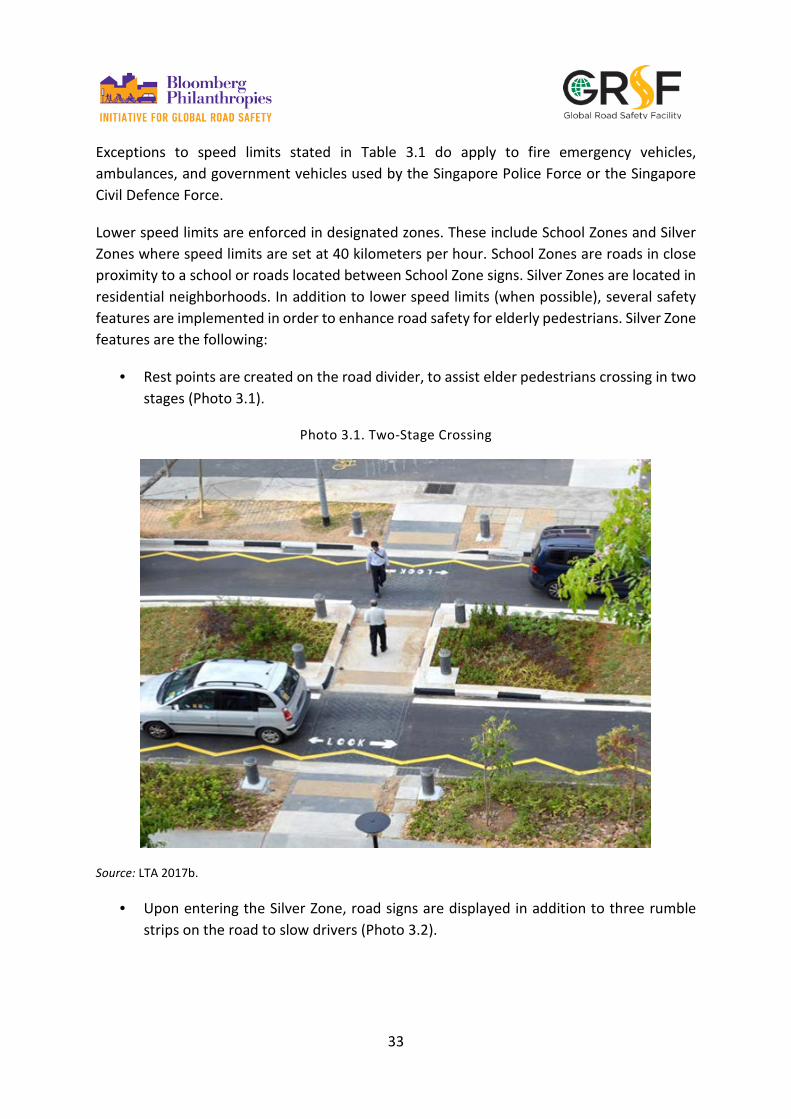
• Upon entering the Silver Zone, road signs are displayed in addition to three rumble strips on the road to slow drivers (Photo 3.2).
34
Photo 3.2. Silver Zone Sign and Rumble Strips, Bukit Merah View
Source: LTA 2017b.
• Other traffic features, including chicanes, reduced lane widths and gentle curves along sections of the road (Photo 3.3).
Photo 3.3. Chicanes, Bukit Merah View
Source: LTA 2017b.

35
3.3. Speed cameras
Speed cameras have long been used as an effective method of reducing traffic speeds and thus reducing casualties and collisions. Several speed camera studies have shown that speed cameras can lead to a reduction in the number of collisions. In some cases, collisions can be reduced by as much as 27 percent (Pérez et al. 2007).
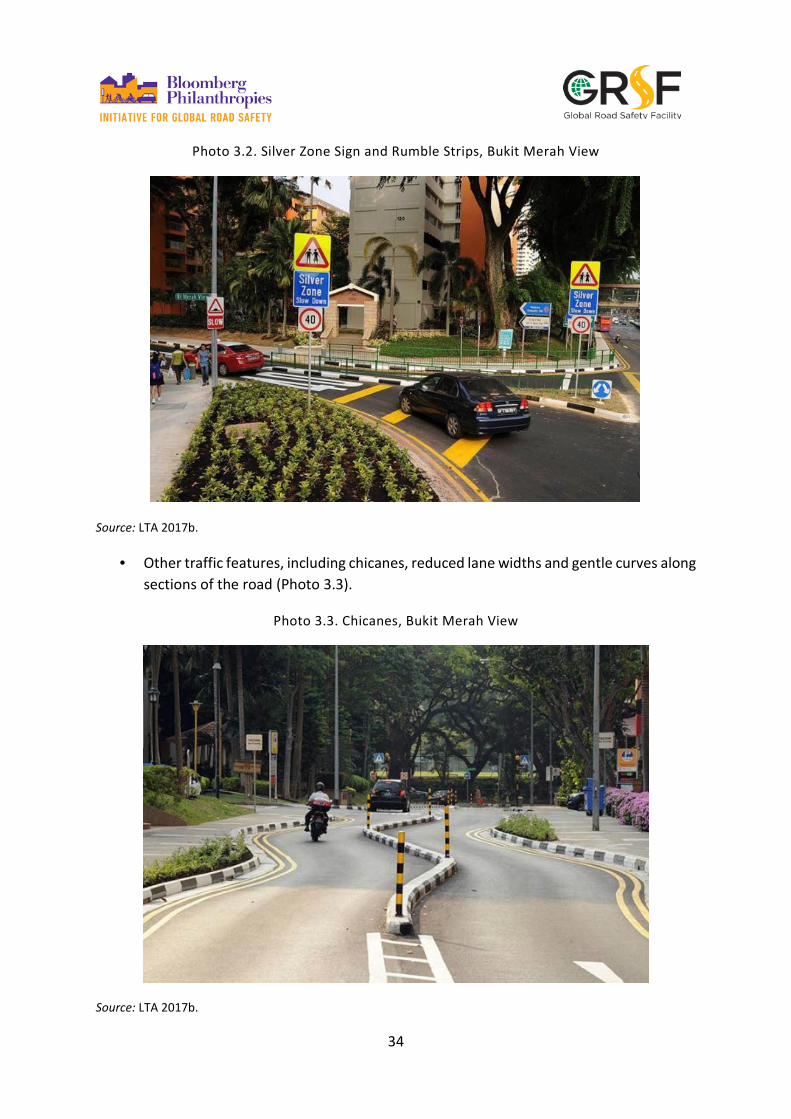
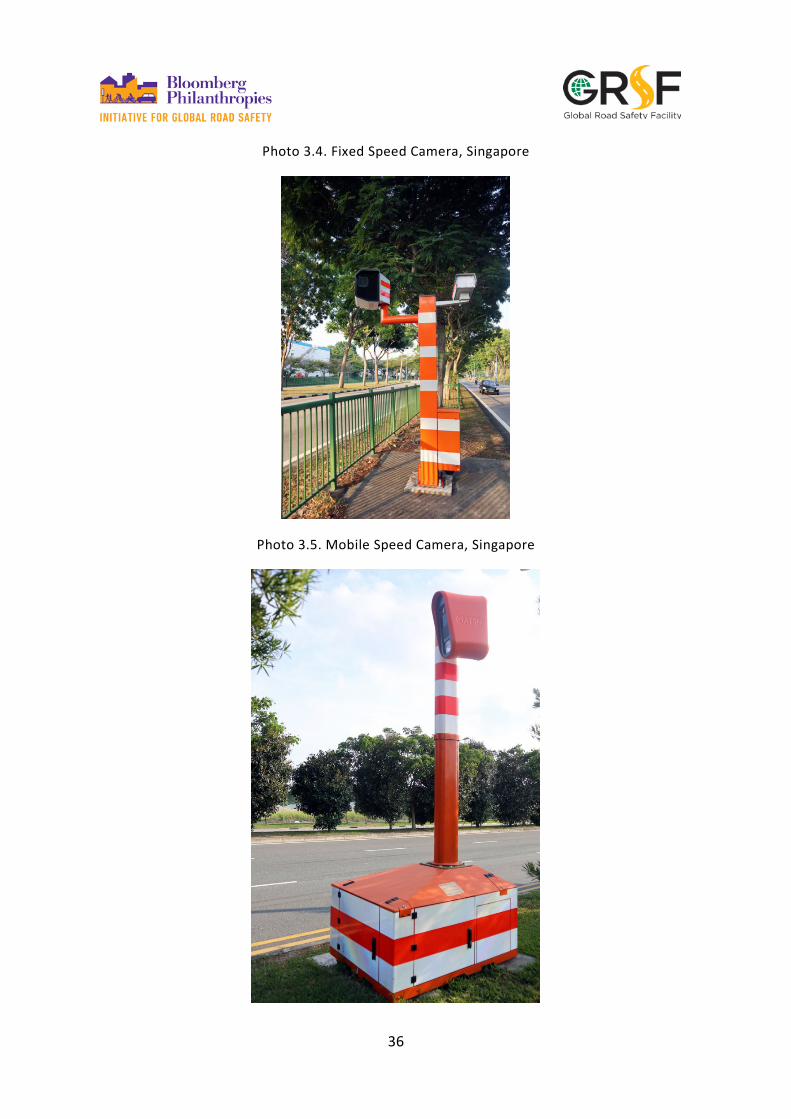
Speed cameras are one of the speed enforcement measures utilized in Singapore. Four different types are used: fixed speed camera, mobile speed camera, police speed laser camera, and average-speed camera.
There are a total of 87 speed camera locations across Singapore. The location of the speed cameras is presented in Figure 3.1.
Figure 3.1. Speed Camera Locations, Singapore
Source: Traffic Police
The different types of speed cameras used in Singapore are presented in Photo 3.4, Photo 3.5, Photo 3.6, and Photo 3.7.
36
Photo 3.4. Fixed Speed Camera, Singapore
Photo 3.5. Mobile Speed Camera, Singapore
37
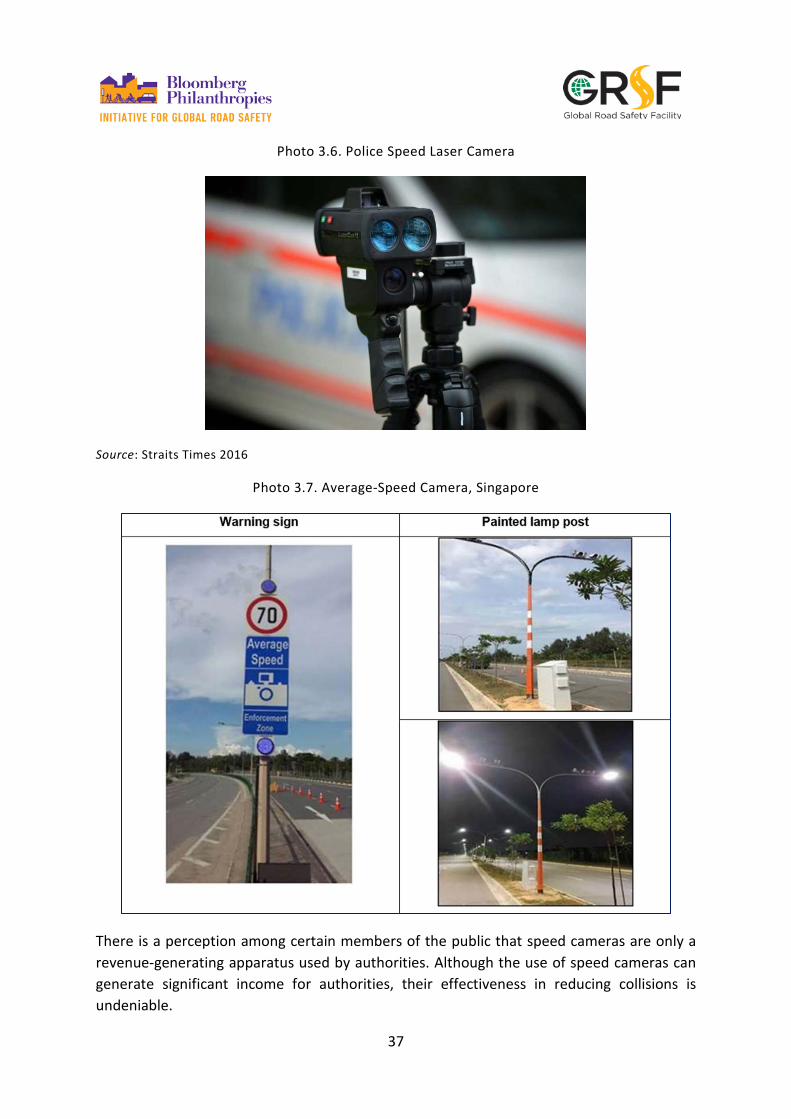
Photo 3.6. Police Speed Laser Camera
Source: Straits Times 2016
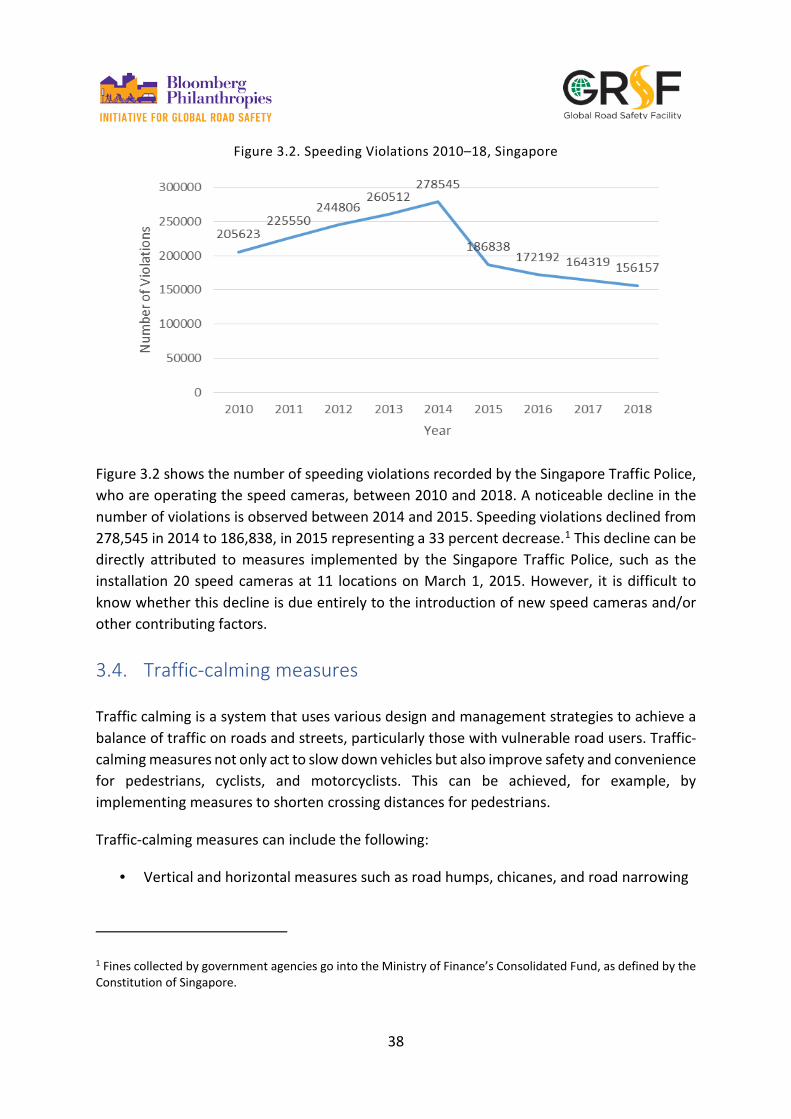
Photo 3.7. Average-Speed Camera, Singapore
There is a perception among certain members of the public that speed cameras are only a revenue-generating apparatus used by authorities. Although the use of speed cameras can generate significant income for authorities, their effectiveness in reducing collisions is undeniable.
38
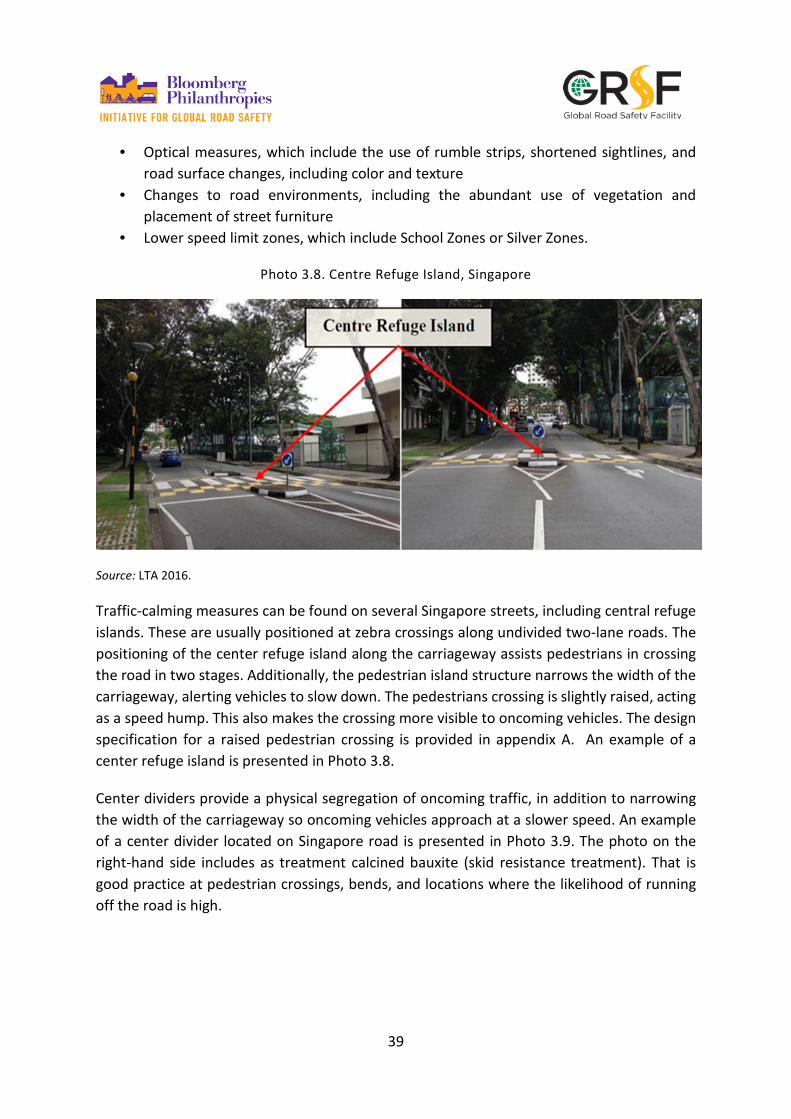
Figure 3.2. Speeding Violations 2010–18, Singapore
Figure 3.2 shows the number of speeding violations recorded by the Singapore Traffic Police, who are operating the speed cameras, between 2010 and 2018. A noticeable decline in the number of violations is observed between 2014 and 2015. Speeding violations declined from 278,545 in 2014 to 186,838, in 2015 representing a 33 percent decrease.1 This decline can be directly attributed to measures implemented by the Singapore Traffic Police, such as the installation 20 speed cameras at 11 locations on March 1, 2015. However, it is difficult to know whether this decline is due entirely to the introduction of new speed cameras and/or other contributing factors.
3.4. Traffic-calming measures
Traffic calming is a system that uses various design and management strategies to achieve a balance of traffic on roads and streets, particularly those with vulnerable road users. Traffic-calming measures not only act to slow down vehicles but also improve safety and convenience for pedestrians, cyclists, and motorcyclists. This can be achieved, for example, by implementing measures to shorten crossing distances for pedestrians.
Traffic-calming measures can include the following:
• Vertical and horizontal measures such as road humps, chicanes, and road narrowing
1 Fines collected by government agencies go into the Ministry of Finance’s Consolidated Fund, as defined by the Constitution of Singapore.
39
• Optical measures, which include the use of rumble strips, shortened sightlines, and road surface changes, including color and texture
• Changes to road environments, including the abundant use of vegetation and placement of street furniture
• Lower speed limit zones, which include School Zones or Silver Zones.
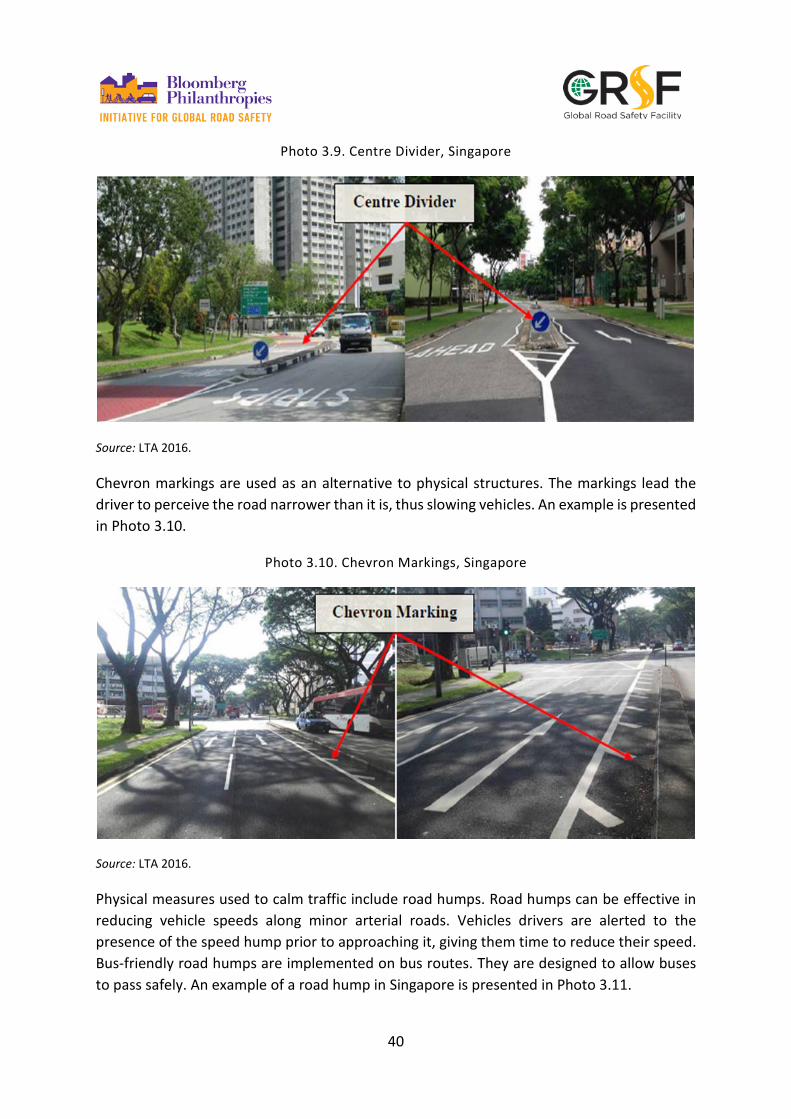
Photo 3.8. Centre Refuge Island, Singapore
Source: LTA 2016.
Traffic-calming measures can be found on several Singapore streets, including central refuge islands. These are usually positioned at zebra crossings along undivided two-lane roads. The positioning of the center refuge island along the carriageway assists pedestrians in crossing the road in two stages. Additionally, the pedestrian island structure narrows the width of the carriageway, alerting vehicles to slow down. The pedestrians crossing is slightly raised, acting as a speed hump. This also makes the crossing more visible to oncoming vehicles. The design specification for a raised pedestrian crossing is provided in appendix A. An example of a center refuge island is presented in Photo 3.8.
Center dividers provide a physical segregation of oncoming traffic, in addition to narrowing the width of the carriageway so oncoming vehicles approach at a slower speed. An example of a center divider located on Singapore road is presented in Photo 3.9. The photo on the right-hand side includes as treatment calcined bauxite (skid resistance treatment). That is good practice at pedestrian crossings, bends, and locations where the likelihood of running off the road is high.
40
Photo 3.9. Centre Divider, Singapore
Source: LTA 2016.
Chevron markings are used as an alternative to physical structures. The markings lead the driver to perceive the road narrower than it is, thus slowing vehicles. An example is presented in Photo 3.10.
Photo 3.10. Chevron Markings, Singapore
Source: LTA 2016.
Physical measures used to calm traffic include road humps. Road humps can be effective in reducing vehicle speeds along minor arterial roads. Vehicles drivers are alerted to the presence of the speed hump prior to approaching it, giving them time to reduce their speed. Bus-friendly road humps are implemented on bus routes. They are designed to allow buses to pass safely. An example of a road hump in Singapore is presented in Photo 3.11.
41
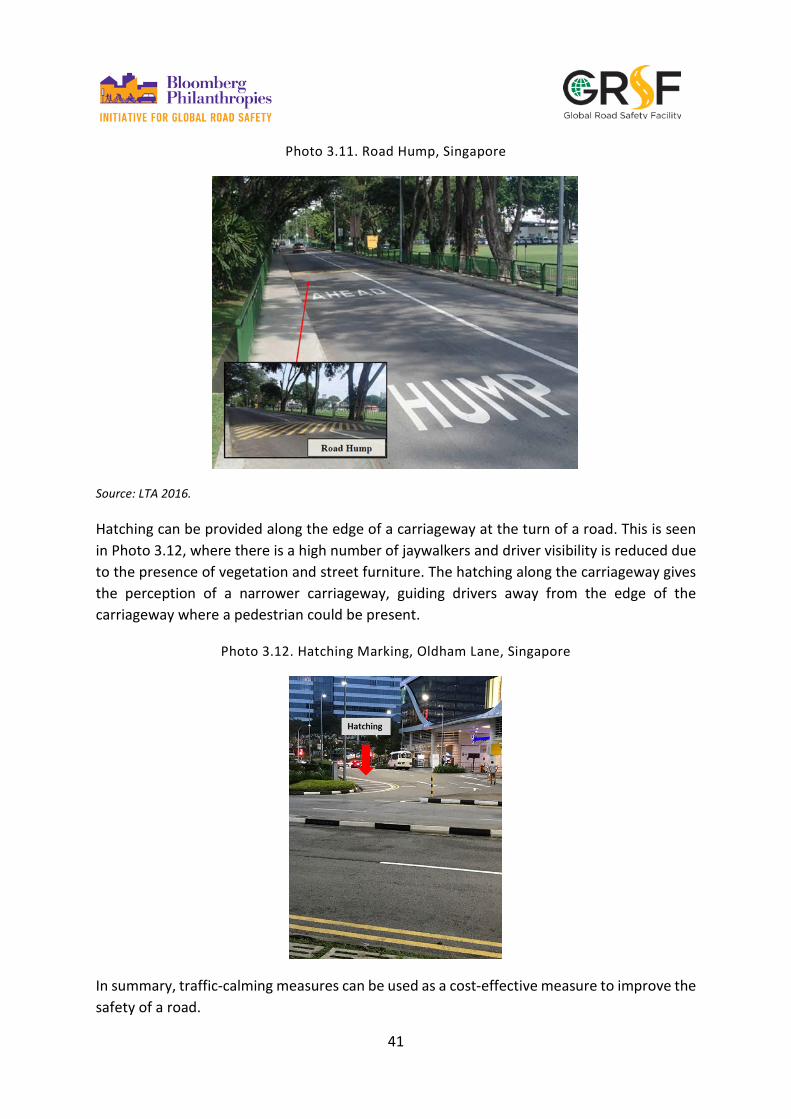
Photo 3.11. Road Hump, Singapore
Source: LTA 2016.
Hatching can be provided along the edge of a carriageway at the turn of a road. This is seen in Photo 3.12, where there is a high number of jaywalkers and driver visibility is reduced due to the presence of vegetation and street furniture. The hatching along the carriageway gives the perception of a narrower carriageway, guiding drivers away from the edge of the carriageway where a pedestrian could be present.
Photo 3.12. Hatching Marking, Oldham Lane, Singapore
In summary, traffic-calming measures can be used as a cost-effective measure to improve the safety of a road.
42
4. Road Infrastructure
“Safer roads and safer mobility” is the second pillar of the UN Global Plan for the Decade of Action for Road Safety 2011–2020. The necessity to increase the safety and quality of road networks for all road users, especially the most vulnerable, is highly emphasized in this pillar. In order to achieve this, measures such as improved safety-conscious planning, design, construction, and operation of roads need to be adopted.
Road infrastructure, which includes roadway and roadside design elements, can have a significant role in determining the risk of a traffic collision. A collision can be caused directly due to a defect on the road, or in some cases misleading elements of the road environment can lead to human error. Road safety design concepts such as “forgiving” and “self-explaining” roads are significant and should be adopted in the design of roads in order to reduce and minimize the risk of traffic collisions.
There is a strong correlation between poor road design and a higher risk of a collision. Roads should be self-explaining, providing guidance to roads users on what they should be doing. Collisions can be triggered by negative road engineering factors or misleading road environments which lead to collisions through human error.
4.1. Road parameters
The inadequate design of a road can be a leading causation factor for a collision. Several road design parameters are considered to have a significant impact on the safety of a road.
The cross-section of a road can have a significant impact on the frequency of collisions. Research has shown that there is a correlation between carriageway width and the collision rate of a road. There is a direct tendency for the collision rate to increase with increased lane widths (Othman, Thomson, and Lannér 2009). This can be attributed to lane change maneuvers and higher speeds experienced on wider carriageways.
Road surface conditions contribute significantly to the usability and safety of a road. Several studies have looked at the relationship between collisions and road surface parameters such as pavement roughness and friction. The studies have shown that pavement conditions expressed in terms of the International Roughness Index have significant impact on the collision rate of a road (Tighe et al. 2000).
Road marking and road signs are significant road features that guide and inform drivers about their surroundings. Inadequate signage or inconsistent signage can misinform or confuse drivers this can likely lead to a collision. Therefore, it is essential that road signs be consistent,
43
conspicuous, and comprehensible. Road markings and road signs usually complement one another by providing guidance to the road user.
Roadside conditions can have a great impact on the safety of a road. Obstructions and inadequate roadside safety measures such as crash barriers can contribute to collisions. Obstructions located on roadsides include sign posts, traffic signal boxes, and other street furniture. When designing safe roads, adequate lateral offset to vertical obstructions such as sign posts is required in order to reduce likelihood of crashes.
Road curvature and speed are connected parameters in road design that reduce the probability of a collision. A vehicle navigating around the curved section of road experiences centrifugal forces. These forces try to deviate the vehicle from the desired line of movement. Super elevation is provided at the curved sections of roads in order to prevent vehicles from deviating from the desired line. The curvature of a road is designed to accommodate vehicles travelling at a certain speed. Therefore, vehicles travelling at speeds above the design speed of the curve will lose control.
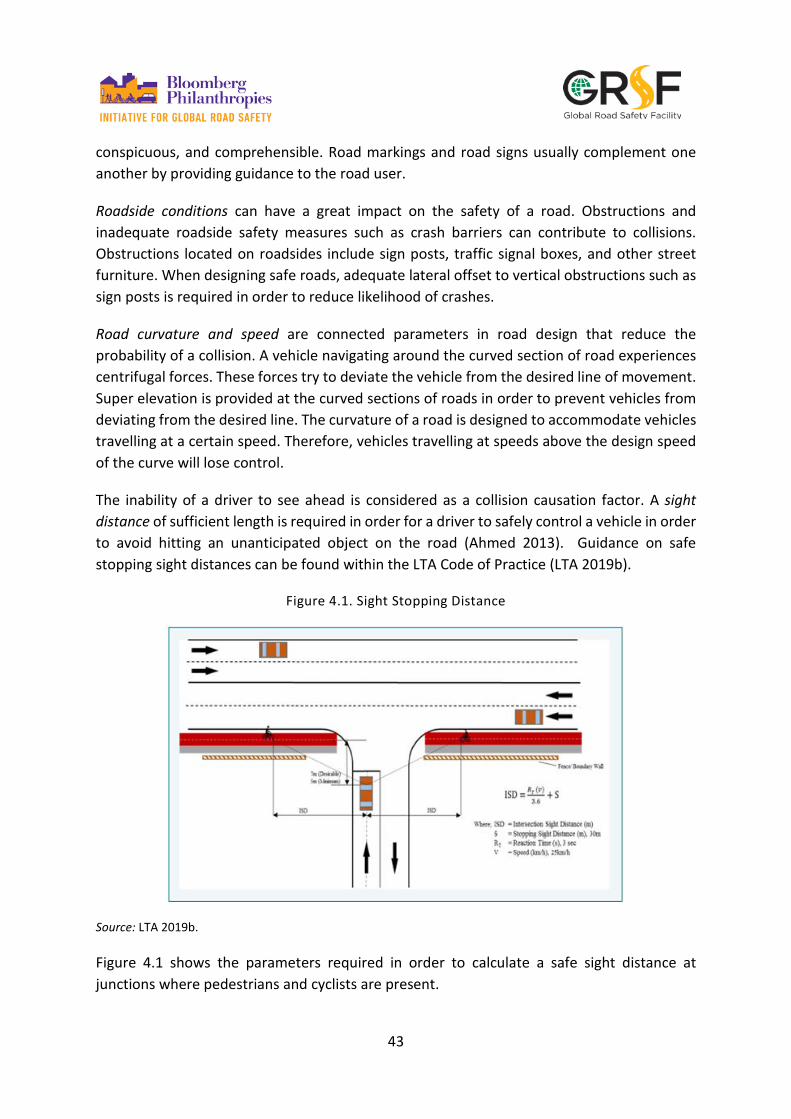
The inability of a driver to see ahead is considered as a collision causation factor. A sight distance of sufficient length is required in order for a driver to safely control a vehicle in order to avoid hitting an unanticipated object on the road (Ahmed 2013). Guidance on safe stopping sight distances can be found within the LTA Code of Practice (LTA 2019b).
Figure 4.1. Sight Stopping Distance
Source: LTA 2019b.
Figure 4.1 shows the parameters required in order to calculate a safe sight distance at junctions where pedestrians and cyclists are present.

44
4.2. Safer roadsides for forgiving roads
A large number of research studies have been conducted in the past years, studies which contributed to the development of the road design standards for improving roadside design. They suggest that the stages in any strategy for improving the siting and design of street equipment can be further developed and extended (ETSC 1998), as shown in table 4.1.
Table 4.1. Main Principles for Forgiving Roads
Existing roads Designed roads
Eliminating unnecessary obstacles
Designing roads free of obstacles
Moving obstacles further away from the roadside
Designing a clear zone at the side of the road
Modifying the structure of the obstacles
Designing street equipment to be more forgiving
Isolating certain obstacles with new and improved types
of safety devices
Protecting street equipment with a barrier to absorb some
of the energy of the impact
To develop a forgiving road environment, certain characteristics must be included, and standard road safety measures should be taken, such as the assessment of the effectiveness of a roadside treatment. The aim of the forgiving roads approach to road design is not only to prevent collisions from occurring but also to reduce the damage inflicted on the driver if a collision does happen due to human error. A forgiving road is largely based on how the roadside is designed and equipped, taking into consideration how several inadequately designed roadside elements pose a risk to drivers. A series of measures can be implemented to create forgiving roads. They are presented in the following subsections.
4.2.1. Vehicle impact guardrail
Vehicle impact guardrails (VIGs) or safety barriers are a form of forgiving roadside treatment, designed to prevent vehicles from running off the carriageway. However, VIGs can also act as a hazard in circumstances where installation is incorrect or the wrong type of VIG is used. The VIG ends are considered hazardous when the end is not properly anchored to the ground, or when it does not flare away from the carriageway (La Torre 2012). Collisions with an “unforgiving” VIG end can result in fatal consequences.

45
VIGs can be classified as energy-absorbing and non-energy-absorbing, dependent on whether it is a tangent terminal or a flared terminal. Tangent terminals are aligned parallel to the carriageway edge and are energy absorbent; they are designed to stop a vehicle. Flared terminals deviate from the alignment of the carriageway edge; typically they are not designed to dissipate significant amounts of energy when a head on collision occurs.
Design specifications for guardrails can be found within the LTA Standard Details of Road Elements document. A copy of a good practice guardrail design specification is provided within appendix B.
4.2.2. Rumble strips
Rumble strips are a road safety feature designed to alert drivers to potential hazards. When a vehicle comes into contact with the rumble strips a rumbling sound is transmitted in addition to a vibrating effect.
In Singapore, rumble strips are typically used in pedestrian priority areas such as Silver Zones. Three yellow rumble strips are installed in order to alert vehicle drivers of pedestrians.
4.2.3. Raised profile marking
Raised profile markings function similarly to rumble strips. They can be installed along a carriageway in order to prevent vehicles from deviating. This road safety feature is particularly useful in preventing drowsy or distracted drivers from causing a potential collision; drivers are alerted by the vibration and sound emitted from the strips.
The LTA provides guidance on where raised profile markings should be provided. Raised profile markings are to be provided for the following (LTA 2017b):
• From the start of the shoulder marking at the exit road to 10 meters behind the gore area
• From the start of chevron to 10 meters after the gore area • From the start of the deceleration lane along the expressway next to pave shoulder • Continuously along the expressway shoulder lane next to slow lane
Design specification for raised profile markings provided by within the LTA SDRA are presented in Figure 4.2 and Figure 4.3.
46
Figure 4.2. Raised Profile Marking
Figure 4.3. Raised Profile Marking, Side Profile View
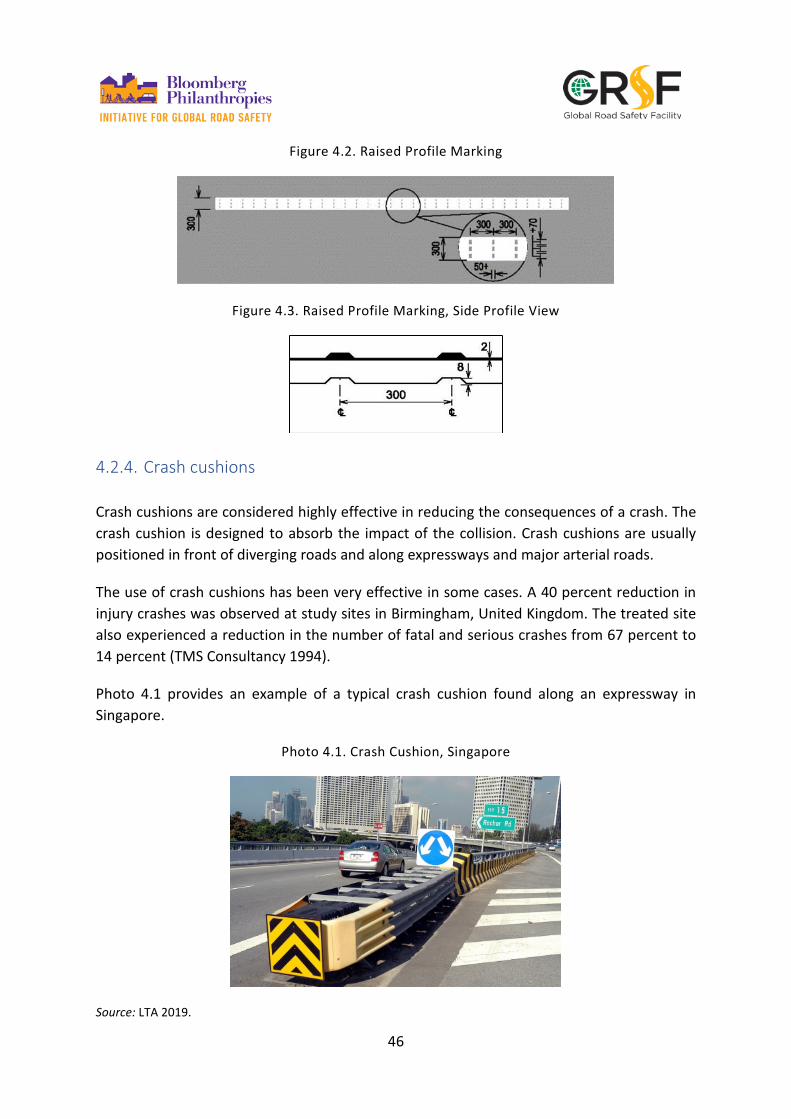
4.2.4. Crash cushions
Crash cushions are considered highly effective in reducing the consequences of a crash. The crash cushion is designed to absorb the impact of the collision. Crash cushions are usually positioned in front of diverging roads and along expressways and major arterial roads.
The use of crash cushions has been very effective in some cases. A 40 percent reduction in injury crashes was observed at study sites in Birmingham, United Kingdom. The treated site also experienced a reduction in the number of fatal and serious crashes from 67 percent to 14 percent (TMS Consultancy 1994).
Photo 4.1 provides an example of a typical crash cushion found along an expressway in Singapore.
Photo 4.1. Crash Cushion, Singapore
Source: LTA 2019.

47
4.3. Self-explaining roads
Self-explaining roads are designed so that the appropriate speed and driving behavior required on the road is self-evident to drivers. Self-explaining roads can be implemented through the implementation of several measures such as appropriate road markings and roadside features (photo 4.2).
Photo 4.2. Examples of Self-Explaining Roads in Singapore
Self-explaining roads have been successfully implemented in several urban areas around the world. According to a study undertaken by Charlton et al. (2010), the implementation of self-explaining roads resulted in a significant reduction in vehicle speeds. The study area was segregated into two sections, one receiving treatment measures such as increased landscaping and limiting forward visibility and the other receiving no treatment. The results of the study showed a significant reduction in vehicles speeds for the section that had received the treatments.
4.4. Pedestrian footbridges
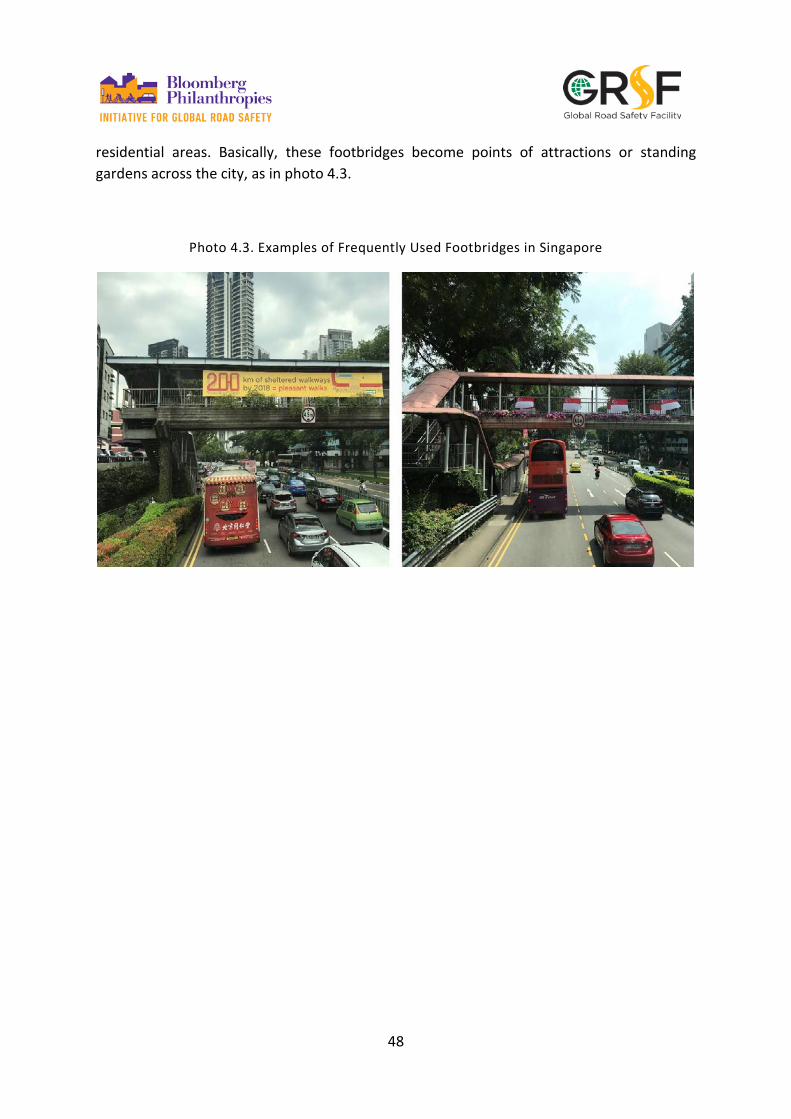
Separation of different traffic flows depending on types of road users is very important to ensure increased safety, especially for the most vulnerable users. Based on this principle, Singapore is hosting a high number of user-friendly and attractive footbridges. These are positioned near bus stations and mass-rapid transit stations, are accessorized with elevators for the elderly and the disabled, and linked to sheltered footpaths going to and from
48
residential areas. Basically, these footbridges become points of attractions or standing gardens across the city, as in photo 4.3.
Photo 4.3. Examples of Frequently Used Footbridges in Singapore
49
5. Dangerous Infrastructure
5.1. Identifying dangerous existing streets
Several methods can be utilized to assess the safety of a street or road. This includes road safety audits and collision hotspot schemes. A road safety audit can be undertaken for an existing road or route on the road network. The aim of a road safety audit of an existing road is to identify hazards that may cause a collision in the future. Remedial measures can be applied to hazards identified during the safety audit.
Collision data are an important factor in identifying and treating collision hotspots. However, collision data are prone to confounding factors of regression toward the mean and general collision trends. A confounding factor is any factor other than the measure whose effects the study is designed to evaluate (Elvik 2002).
Regression to the mean is the tendency for unusually high or low counts to be followed by values closer to the underlying mean. General trends in collisions can be observed due to several factors such as changes in vehicle safety and driver education. (Thorpe 2018).
Collision data should be comprehensive and inclusive of the following information:
• General collision information: date, location, road features, speed limit, junction features, weather and lighting conditions, and road surfaces
• Vehicles involved: type, maneuvers, location, skidding and overturning, striking objects, points of impact, age, gender and address of driver, alcohol test, vehicle registration, and journey purpose
• Casualties involved: type of casualty (for example, driver, pedestrian), gender, age and severity of causality, location and movement direction, front versus rear passenger, and address
• Contributory factors: road environments, vehicle defects, injudicious actions, driver and/or rider error or reaction, impairment or distraction, behavior or inexperience (Thorpe 2018)
Collision hotspots can be identified by looking at a baseline period, which is usually three to five years. Clusters are identified by defining a minimum threshold in a defined radius. A collision hotspot can then be defined as an area in which the number of collisions exceeds the predetermined threshold during the baseline period.
As previously stated, collision data is prone to confounding factors, which can be misleading. Confounding factors can lead to false positives, which in turn can result in a non-hotspot area

50
being treated. Additionally, there is a risk of false negatives, which can result in a genuinely unsafe site being left untreated.
Since 2005, the LTA has implemented a road safety initiative known as the Black Spot Programme. The key objective of the Black Spot Programme is to identify, monitor, and treat locations with a high number of traffic collisions. The Black Spot Programme has proven to be a success with an average of 5 to 10 locations being removed per year due to the collision rate falling below the defined threshold level. The program has resulted in a 75 percent drop in collisions over a three-year period in some cases (LTA 2014). A range of interventions have been used, included the provision of signalized pedestrian crossings. One success case of the Black Spot Programme is the Moulmein Road–Newton Road—Thomson Road junction. The junction was monitored for 36 months; prior to treatment a total of 19 collisions were recorded compared to 7 after treatment. The treatment at the junction comprised of the provision of a fully controlled right turn (red-amber-green arrows). This is presented in Photo 5.1.
Photo 5.1. Fully Controlled Right Turn (red-amber-green arrows)
Additional methods utilized in Singapore for identification of dangerous roads or streets include the LTA road maintenance program discussed in previous sections.
The LTA frequently checks and maintains roads and road facilities on the road network. Expressways are checked and maintained on a daily basis, major roads are checked and maintained every two weeks, and minor roads are checked and maintained every two months.
Identified defects are treated promptly, and potholes are fixed within an average of 24 hours of being reported (LTA 2014).

51
5.2. Dangerous road designs
Badly designed roads can be a major contributing factor leading to a collision. Faults can include road defects and misleading road infrastructure.
Several different road elements such as markings, signs, road geometry, lighting, road surface, and traffic and speed management are essential to maintain the safety of a road. Roads are considered one of the key causation factors of collisions, together with human and vehicle factors.
Road alignment has a significant influence on the safety of a road, which includes the dimension of radii, ratio of consecutive curves, dimensions of vertical curves, and sight distance conditions. (Mohammed 2013)
Road design standards in Singapore are set and regulated by the LTA. Road designers follow guidelines and standards included within several LTA publications, such as the LTA Code of Practice and the LTA Standard Details of Road Element. Examples of standard design elements can be found in the appendixes of this report.
The guidance and standards provided do promote safe design, but without comprehensive audits, significant safety hazards can be neglected.
Photo 5.2. Signal box located unsafely on the edge of the carriageway, Singapore
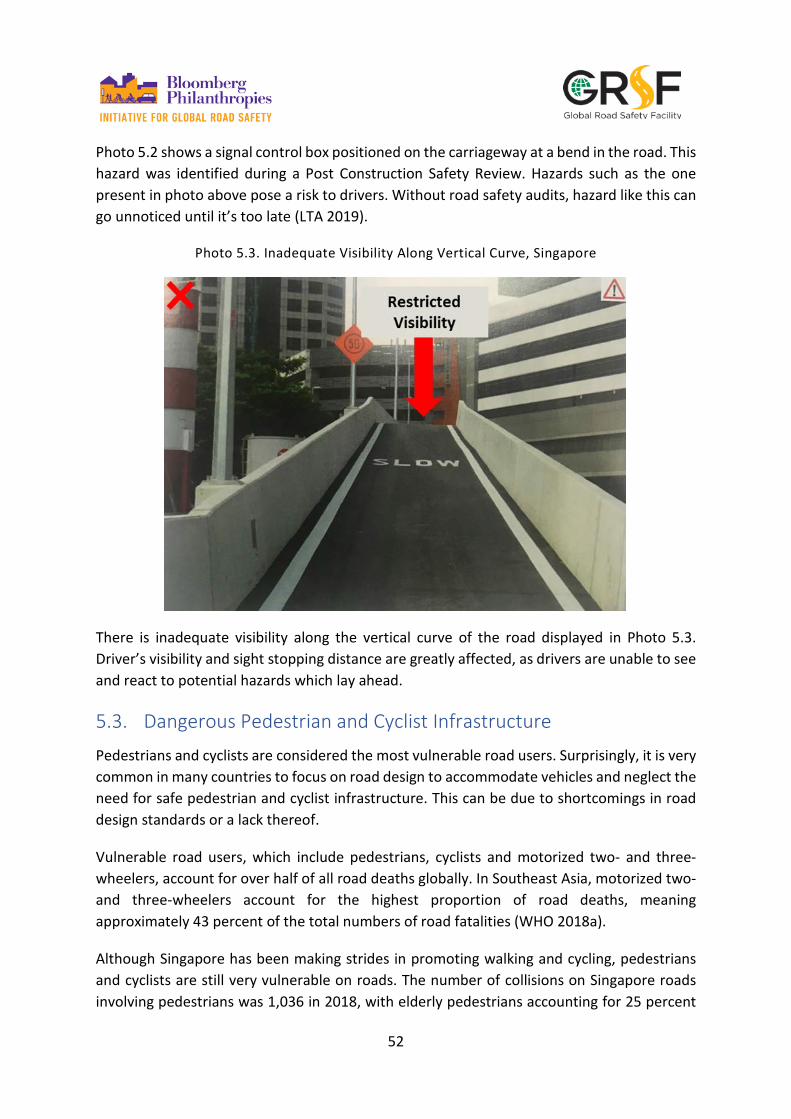
52
Photo 5.2 shows a signal control box positioned on the carriageway at a bend in the road. This hazard was identified during a Post Construction Safety Review. Hazards such as the one present in photo above pose a risk to drivers. Without road safety audits, hazard like this can go unnoticed until it’s too late (LTA 2019).
Photo 5.3. Inadequate Visibility Along Vertical Curve, Singapore
There is inadequate visibility along the vertical curve of the road displayed in Photo 5.3. Driver’s visibility and sight stopping distance are greatly affected, as drivers are unable to see and react to potential hazards which lay ahead.
5.3. Dangerous Pedestrian and Cyclist Infrastructure
Pedestrians and cyclists are considered the most vulnerable road users. Surprisingly, it is very common in many countries to focus on road design to accommodate vehicles and neglect the need for safe pedestrian and cyclist infrastructure. This can be due to shortcomings in road design standards or a lack thereof.
Vulnerable road users, which include pedestrians, cyclists and motorized two- and three-wheelers, account for over half of all road deaths globally. In Southeast Asia, motorized two- and three-wheelers account for the highest proportion of road deaths, meaning approximately 43 percent of the total numbers of road fatalities (WHO 2018a).
Although Singapore has been making strides in promoting walking and cycling, pedestrians and cyclists are still very vulnerable on roads. The number of collisions on Singapore roads involving pedestrians was 1,036 in 2018, with elderly pedestrians accounting for 25 percent
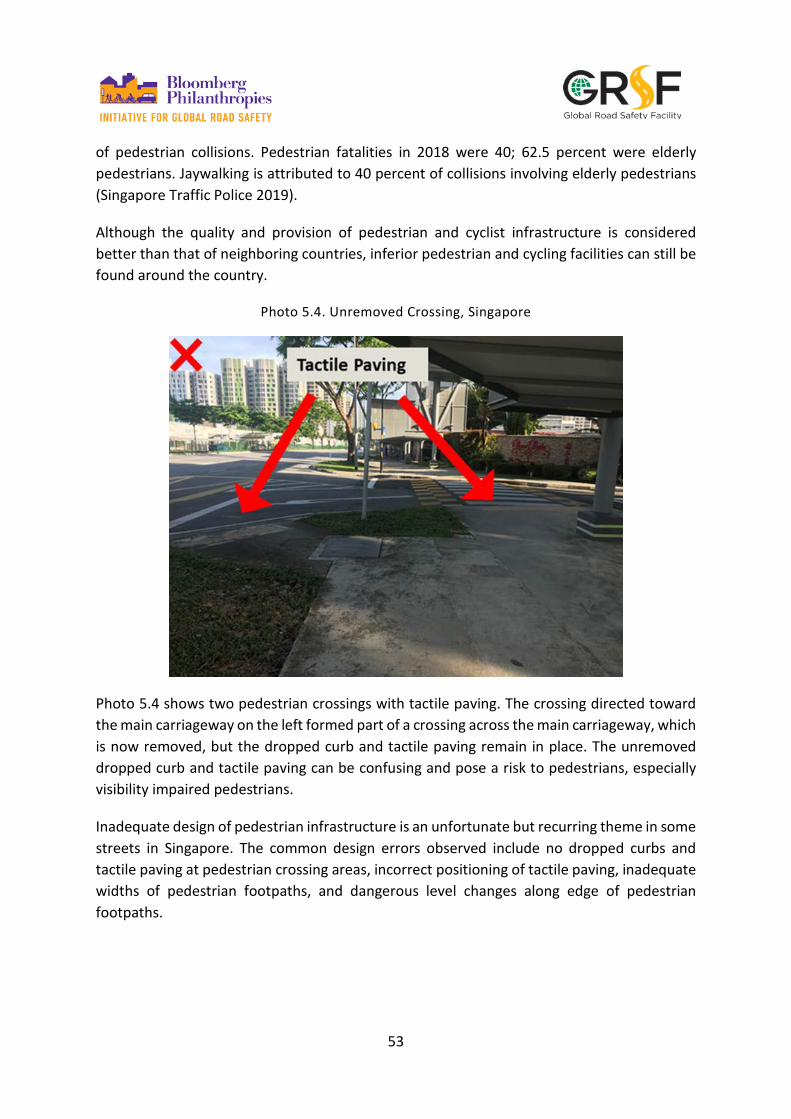
53
of pedestrian collisions. Pedestrian fatalities in 2018 were 40; 62.5 percent were elderly pedestrians. Jaywalking is attributed to 40 percent of collisions involving elderly pedestrians (Singapore Traffic Police 2019).
Although the quality and provision of pedestrian and cyclist infrastructure is considered better than that of neighboring countries, inferior pedestrian and cycling facilities can still be found around the country.
Photo 5.4. Unremoved Crossing, Singapore
Photo 5.4 shows two pedestrian crossings with tactile paving. The crossing directed toward the main carriageway on the left formed part of a crossing across the main carriageway, which is now removed, but the dropped curb and tactile paving remain in place. The unremoved dropped curb and tactile paving can be confusing and pose a risk to pedestrians, especially visibility impaired pedestrians.
Inadequate design of pedestrian infrastructure is an unfortunate but recurring theme in some streets in Singapore. The common design errors observed include no dropped curbs and tactile paving at pedestrian crossing areas, incorrect positioning of tactile paving, inadequate widths of pedestrian footpaths, and dangerous level changes along edge of pedestrian footpaths.
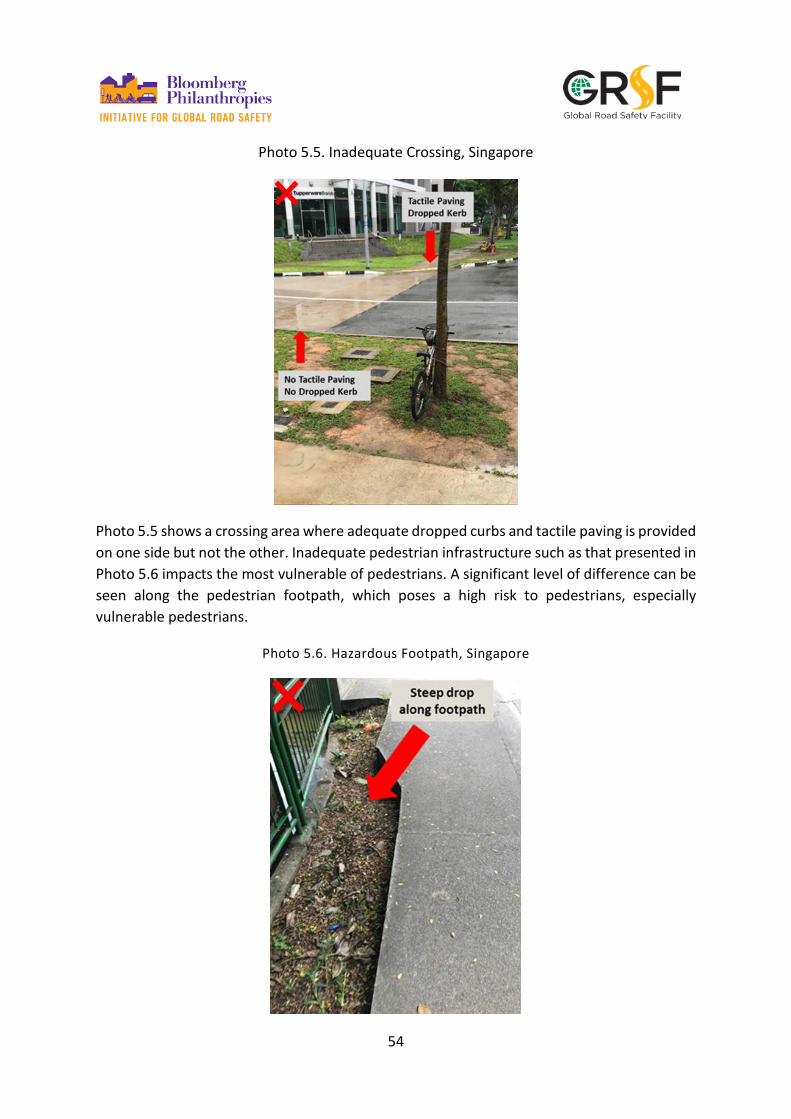
54
Photo 5.5. Inadequate Crossing, Singapore
Photo 5.5 shows a crossing area where adequate dropped curbs and tactile paving is provided on one side but not the other. Inadequate pedestrian infrastructure such as that presented in Photo 5.6 impacts the most vulnerable of pedestrians. A significant level of difference can be seen along the pedestrian footpath, which poses a high risk to pedestrians, especially vulnerable pedestrians.
Photo 5.6. Hazardous Footpath, Singapore

55
Dangerous designs can also be found in temporary road works, where inadequate or unsafe pedestrian infrastructure is sometimes provided (LTA 2019).
Photo 5.7. Inadequate Crossing
The location and positioning of the plastic barricades in Photo 5.7 forced pedestrians onto a live carriageway, putting them in potential danger.
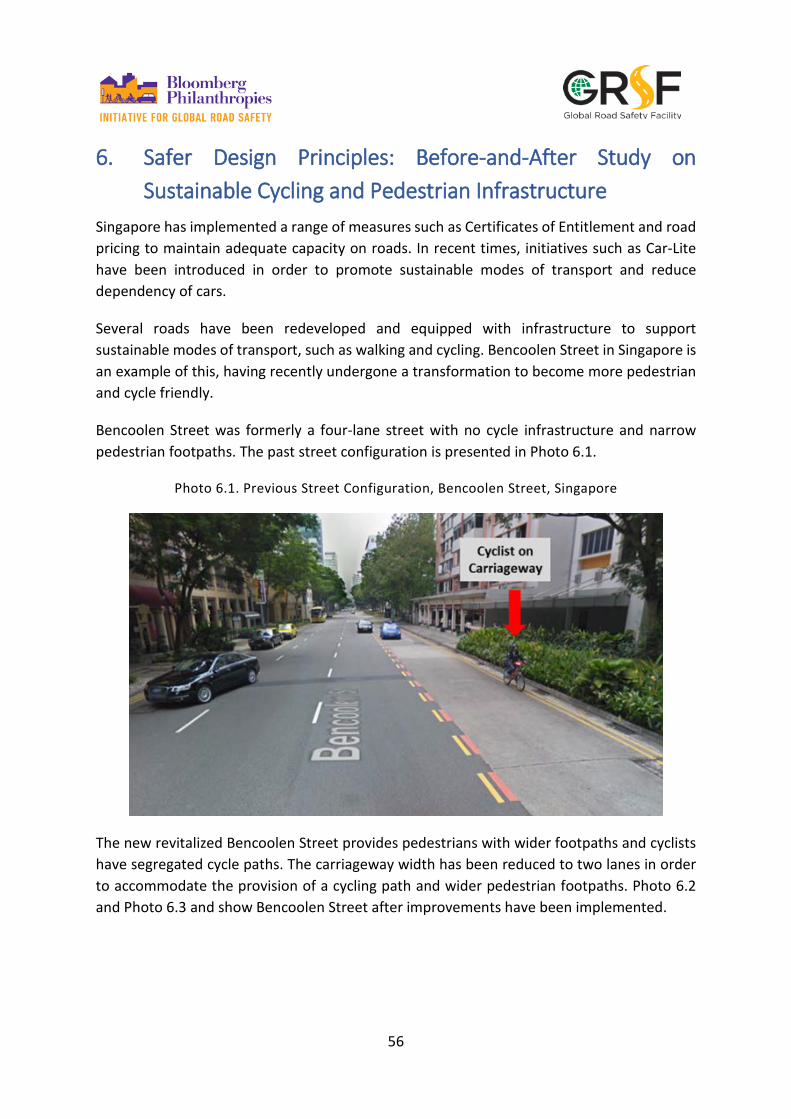
56
6. Safer Design Principles: Before-and-After Study on Sustainable Cycling and Pedestrian Infrastructure
Singapore has implemented a range of measures such as Certificates of Entitlement and road pricing to maintain adequate capacity on roads. In recent times, initiatives such as Car-Lite have been introduced in order to promote sustainable modes of transport and reduce dependency of cars.
Several roads have been redeveloped and equipped with infrastructure to support sustainable modes of transport, such as walking and cycling. Bencoolen Street in Singapore is an example of this, having recently undergone a transformation to become more pedestrian and cycle friendly.
Bencoolen Street was formerly a four-lane street with no cycle infrastructure and narrow pedestrian footpaths. The past street configuration is presented in Photo 6.1.
Photo 6.1. Previous Street Configuration, Bencoolen Street, Singapore
The new revitalized Bencoolen Street provides pedestrians with wider footpaths and cyclists have segregated cycle paths. The carriageway width has been reduced to two lanes in order to accommodate the provision of a cycling path and wider pedestrian footpaths. Photo 6.2 and Photo 6.3 and show Bencoolen Street after improvements have been implemented.
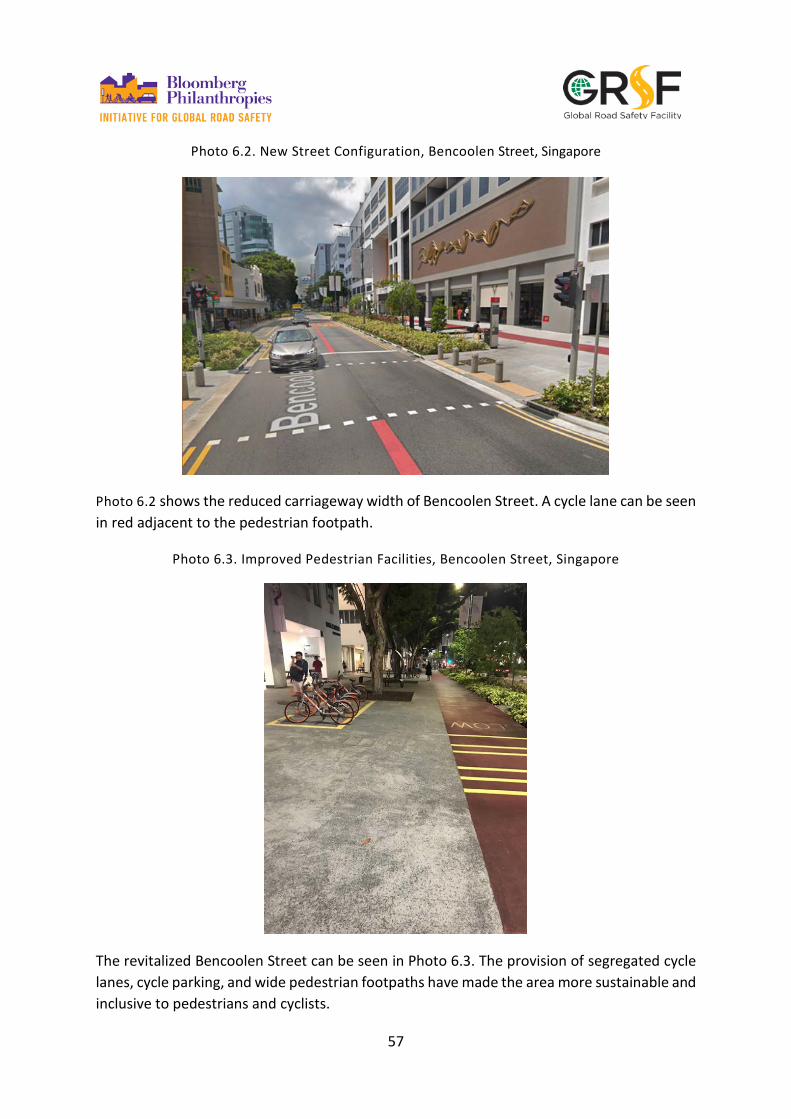
57
Photo 6.2. New Street Configuration, Bencoolen Street, Singapore
Photo 6.2 shows the reduced carriageway width of Bencoolen Street. A cycle lane can be seen in red adjacent to the pedestrian footpath.
Photo 6.3. Improved Pedestrian Facilities, Bencoolen Street, Singapore
The revitalized Bencoolen Street can be seen in Photo 6.3. The provision of segregated cycle lanes, cycle parking, and wide pedestrian footpaths have made the area more sustainable and inclusive to pedestrians and cyclists.
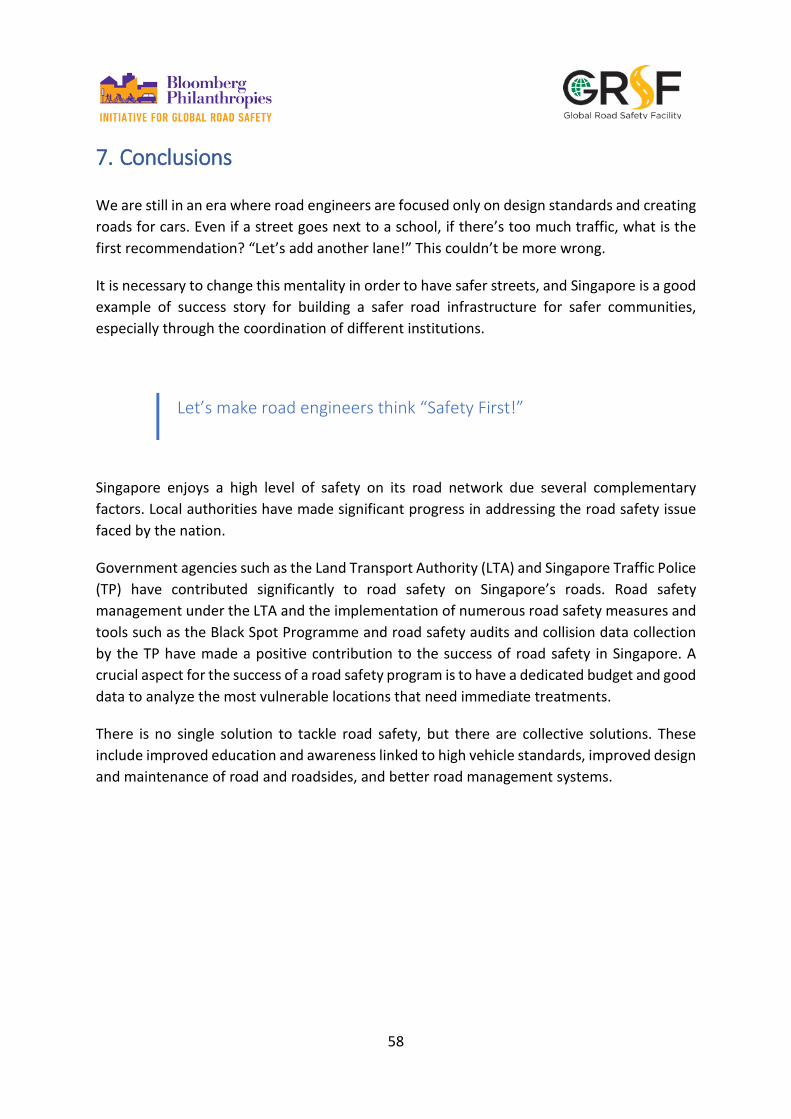
58
7. Conclusions
We are still in an era where road engineers are focused only on design standards and creating roads for cars. Even if a street goes next to a school, if there’s too much traffic, what is the first recommendation? “Let’s add another lane!” This couldn’t be more wrong.
It is necessary to change this mentality in order to have safer streets, and Singapore is a good example of success story for building a safer road infrastructure for safer communities, especially through the coordination of different institutions.
Let’s make road engineers think “Safety First!”
Singapore enjoys a high level of safety on its road network due several complementary factors. Local authorities have made significant progress in addressing the road safety issue faced by the nation.
Government agencies such as the Land Transport Authority (LTA) and Singapore Traffic Police (TP) have contributed significantly to road safety on Singapore’s roads. Road safety management under the LTA and the implementation of numerous road safety measures and tools such as the Black Spot Programme and road safety audits and collision data collection by the TP have made a positive contribution to the success of road safety in Singapore. A crucial aspect for the success of a road safety program is to have a dedicated budget and good data to analyze the most vulnerable locations that need immediate treatments.
There is no single solution to tackle road safety, but there are collective solutions. These include improved education and awareness linked to high vehicle standards, improved design and maintenance of road and roadsides, and better road management systems.
59
References
Ahmed, I. 2013. “Road Infrastructure and Road Safety.” Transport and Communications Bulletin for Asia and the Pacific 83: 19–25.
Austroads. 2019a. Guide to Road Safety, part 6, “Managing Road Safety Audits.” Sydney: Austroads.
Austroads. 2019b. Guide to Road Safety, part 6A, “Implementing Road Safety Audits.” Sydney: Austroads.
Charlton, S. G., H. W. Mackie, P. H. Baas, K. Hay, M. Menezes, and C. Dixon. 2010. “Using Endemic Road Features to Create Self-Explaining Roads and Reduce Vehicle Speeds.” Accident Analysis and Prevention 426: 1989–1998.
Elvik, R. 2002. “The Importance of Confounding in observational before-and-after Studies of Road Safety Measures.” Accident Analysis and Prevention 345: 631–5.
ETSC (European Transport Safety Council). 1998. Forgiving Roadsides.
Grzebieta R. H., L. Mooren, and S. Job. 2013. Introduction (or Reintroduction) to the Safe System Approach, “Roadside Safety Design and Devices,” in R. Troutbeck, editor, Transportation Research Circular no. E-C172. Milan, Italy: Transportation Research Board of the National academies. http://onlinepubs.trb.org/onlinepubs/circulars/ec172.pdf.
ITF (International Transport Forum). 2016. Zero Road Deaths and Serious Injuries: Leading a Paradigm Shift to a Safe System. Paris: OECD Publishing. https://www.oecd.org/publications/zero-road-deaths-and-serious-injuries-9789282108055-en.htm.
La Torre, F. 2012. Forgiving roadsides design guide no. 2013/09.
LTA (Land Transport Authority). 2014. “Factsheet: Enhancing Safety on Our Roads for All Road Users.” Singapore: LTA. https://www.lta.gov.sg/apps/news/page.aspx?c=2&id=91de65eb-fea5-48f6-b101-5573dc68face.
LTA. 2016. “Factsheet on Completion of New Road Safety Measures at 10 Pilot Primary Schools.” Singapore: LTA. https://www.lta.gov.sg/apps/news/page.aspx?c=2&id=59d4005d-c2e3-4c17-9ee6-06daab5cfc44.
LTA. 2017a. “Procedures on Importation and Registration of a Car in Singapore.” Singapore: LTA.
60
LTA. 2017b. “Silver Zones.” Singapore: LTA. https://www.lta.gov.sg/content/ltaweb/en/roads-and-motoring/projects/road-and-commuter-facilities/silver-zones.html.
LTA. 2019a. “Certificate of Entitlement COE | Vehicle Quota System | Owning a Vehicle | Roads & Motoring.” Singapore: LTA. https://www.lta.gov.sg/content/ltaweb/en/roads-and-motoring/owning-a-vehicle/vehicle-quota-system/certificate-of-entitlement-coe.html.
LTA. 2019b. “Code of Practice—Street Work Proposals Relating to Development Works.” Singapore: LTA.
LTA. 2019c. “PSR Roads Process.” Singapore: LTA.
LTA. 2019d. “Road Maintenance Programme | Maintaining Our Roads & Facilities | Road Safety & Regulations | Roads & Motoring.” https://www.lta.gov.sg/content/ltaweb/en/roads-and-motoring/road-safety-and-regulations/maintaining-our-roads-and-facilities/road-maintenance-programme.html.
LTA. 2019e. Road Safety Guide Book: Temporary Road Works for LTA Projects. Singapore: LTA.
Mohammed, Hameed. 2013. “The Influence of Road Geometric Design Elements on Highway Safety.” International Journal of Civil Engineering and Technology 4: 146–62.
Othman, S., R. Thomson, and G. Lannér. 2009. “Identifying Critical Road Geometry Parameters Affecting Crash Rate and Crash Type.” Annals of Advances in Automotive Medicine. Association for the Advancement of Automotive Medicine. Annual Scientific Conference 53, 155–165.
Peden, M. 2004. World Report on Road Traffic Injury Prevention.
Pérez, K., M. Marí-Dell’Olmo, A. Tobias, and C Borrell. 2007. “Reducing Road Traffic Injuries: Effectiveness of Speed Cameras in an Urban Setting.” American Journal of Public Health 979: 1632–1637.
Retting, R. A., S. A. Ferguson, and A. S. Hakkert. 2003. “Effects of Red-Light Cameras on Violations and Crashes: A Review of the International Literature.” Traffic Injury Prevention 41: 17–23.
Singapore Traffic Police. 2019. “Statistics.” https://www.police.gov.sg/news-and-publications/statistics?category=Road Traffic Situation#content.
Statutes of the Republic of Singapore. 2004. Road Traffic Act. https://sso.agc.gov.sg/.
61
Straits Times. 2016. “Traffic Police's New Portable Speed Laser Cameras: Where Can You Find Them.” Straits Times, May 20. https://www.straitstimes.com/singapore/transport/traffic-polices-new-portable-speed-laser-cameras-where-can-you-find-them.
Taylor, M. C., D. A. Lynam, and A. Baruya. 2000. The Effects of Drivers' Speed on the Frequency of Road Accidents. TRL report 421. Crowthorne, UK: TRL.
Thorpe, N. 2018. “Identifying Collision Hotspots and Evaluating Road Safety Schemes: A Case Study of Road Safety Cameras in the UK and Practitioner Software.” UK: Newcastle University.
Tighe, S., N. Li, L. C. Falls, and R. Haas. 2000. “Incorporating Road Safety into Pavement Management.” Transportation Research Record 16991: 1–10.
TMS Consultancy. 1994. Research on Loss of Control Accidents on Warwickshire Motorways and Dual Carriageways. Coventry, UK: TMS Consultancy.
Wegman, Fred, Hans-Yngve Berg, Iain Cameron, Claire Thompson, Stefan Siegrist, and Wendy Weijermars. 2017. “Evidence-Based and Data-Driven Road Safety Management.” IATSS Research 39 (1).
Welle, B., A. B. Sharpin, C. Adriazola-Steil, S. Job, M. Shotten, D. Bose, A. Bhatt, S. Alveano, M. Obelheiro, and T. Imamoglu. 2018. Sustainable and Safe: A Vision and Guidance for zero Road Deaths. Washington, DC: World Resources Institute. https://www.wri.org/publication/sustainable-and-safe-vision-and-guidance-zero-road-deaths.
WHO (World Health Organization). 2011. Global Plan for the Decade of Action for Road Safety 2011–2020. Geneva: WHO. https://www.who.int/roadsafety/decade_of_action/plan/global_plan_decade.pdf
WHO. 2018a. Global Status Report on Road Safety 2018. Geneva: WHO.
WHO. 2018b. “The Top 10 Causes of Death.” Geneva: WHO. https://www.who.int/news-room/fact-sheets/detail/the-top-10-causes-of-death.
World Bank. 2017. The High Toll of Traffic Injuries: Unacceptable and Preventable. Washington, DC: World Bank.
PIARC (World Road Association). 2015. Road Safety Manual. New York: United Nations. https://roadsafety.piarc.org/en/road-safety-management-safe-system-approach/safe-system-elements.

62
Appendix A – Pedestrian Infrastructure Design Guidance
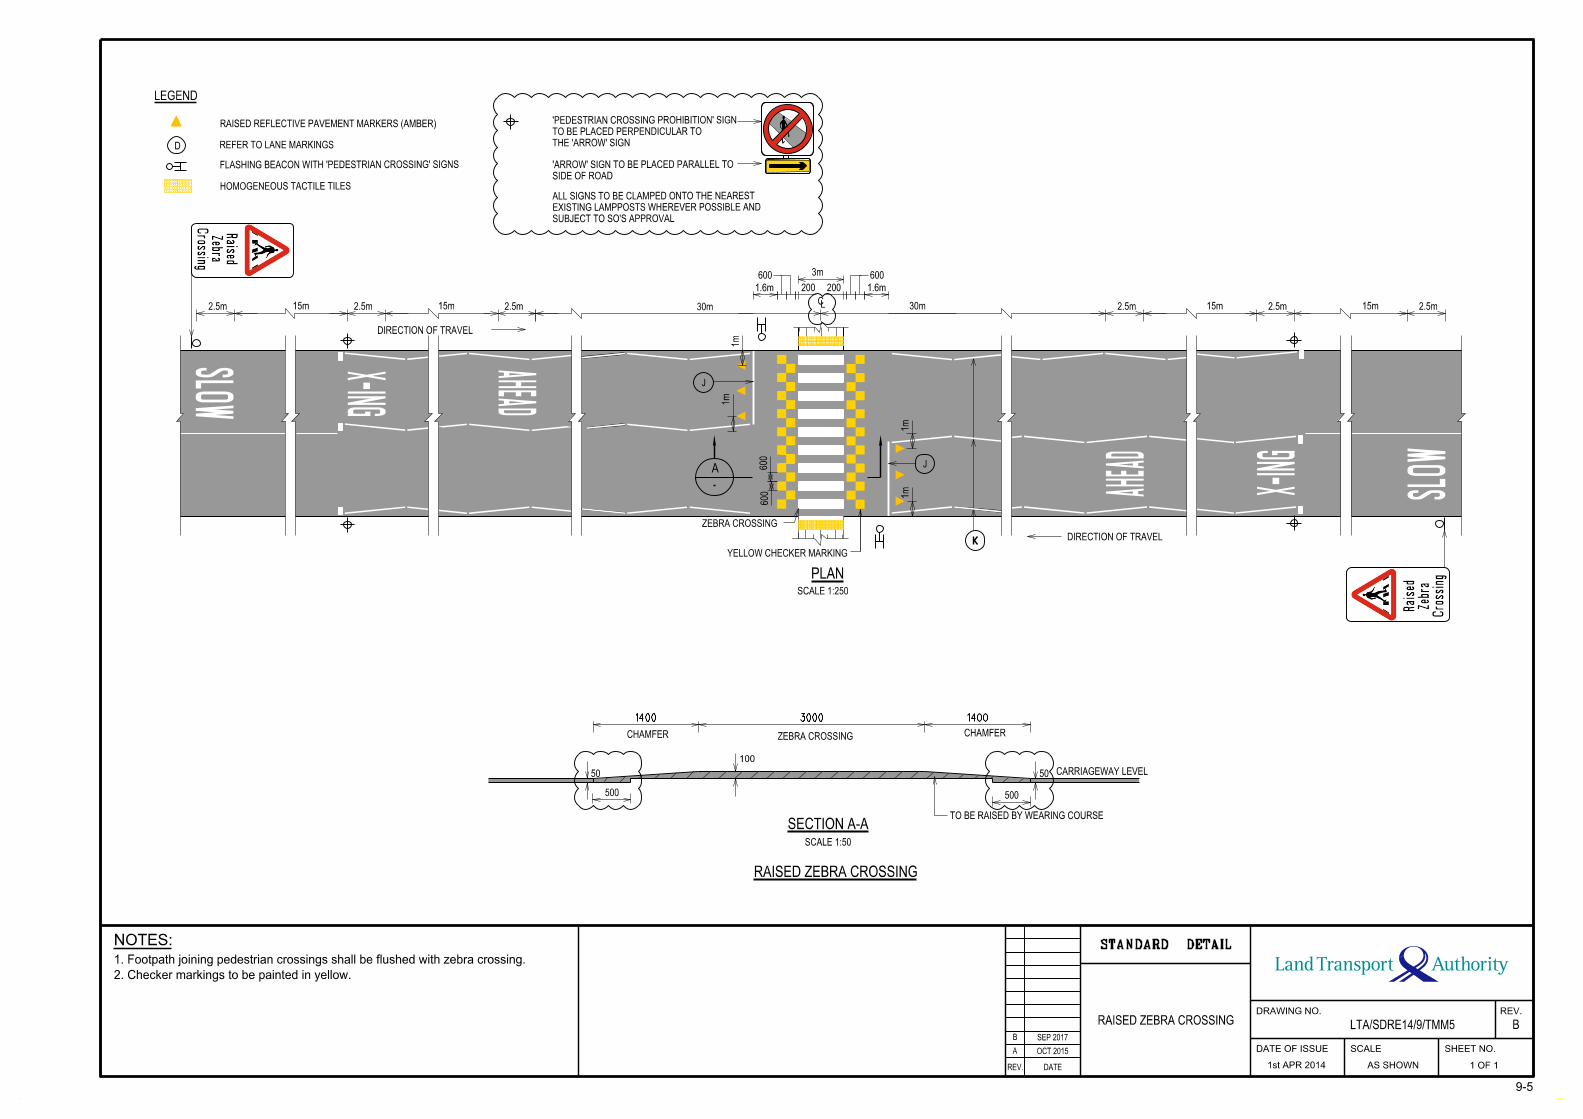
LEGEND
REFER TO LANE MARKINGS
FLASHING BEACON WITH 'PEDESTRIAN CROSSING' SIGNS
RAISED REFLECTIVE PAVEMENT MARKERS (AMBER)
HOMOGENEOUS TACTILE TILES
RAISED ZEBRA CROSSING LTA/SDRE14/9/TMM5
A OCT 2015
AS SHOWN 1 OF 1
9-5
D THE 'ARROW' SIGN
TO BE PLACED PERPENDICULAR TO
'PEDESTRIAN CROSSING PROHIBITION' SIGN
SIDE OF ROAD
'ARROW' SIGN TO BE PLACED PARALLEL TO
SUBJECT TO SO'S APPROVAL
EXISTING LAMPPOSTS WHEREVER POSSIBLE AND
ALL SIGNS TO BE CLAMPED ONTO THE NEAREST
B SEP 2017
2. Checker markings to be painted in yellow.
1. Footpath joining pedestrian crossings shall be flushed with zebra crossing.
STANDARD DETAIL
REV. DATE
DRAWING NO.
DATE OF ISSUE
1st APR 2014
SCALE SHEET NO.
REV.
B
NOTES:
600
600
K
-
SLOW
X-ING
AHEAD
AHEA
D
X-IN
G
SLO
W
DIRECTION OF TRAVEL
ZEBRA CROSSING
YELLOW CHECKER MARKING
DIRECTION OF TRAVEL
SCALE 1:250
PLAN
15m 15m 30m 30m 15m 15m
600
200
600
200
2.5m 2.5m 2.5m
1.6m 1.6m
3m
2.5m 2.5m 2.5m
1m
1m
1m
1m
J
A J
CL
140030001400
100
SCALE 1:50
CARRIAGEWAY LEVEL
TO BE RAISED BY WEARING COURSE
CHAMFERZEBRA CROSSINGCHAMFER
RAISED ZEBRA CROSSING
SECTION A-A
500
50
500
50
LTA_CORIASQD
Text Box
CHAPTER 9 - MAIN PAGE
LTA_CORIASQD
Text Box
NEXT
LTA_CORIASQD
Text Box
PREVIOUS
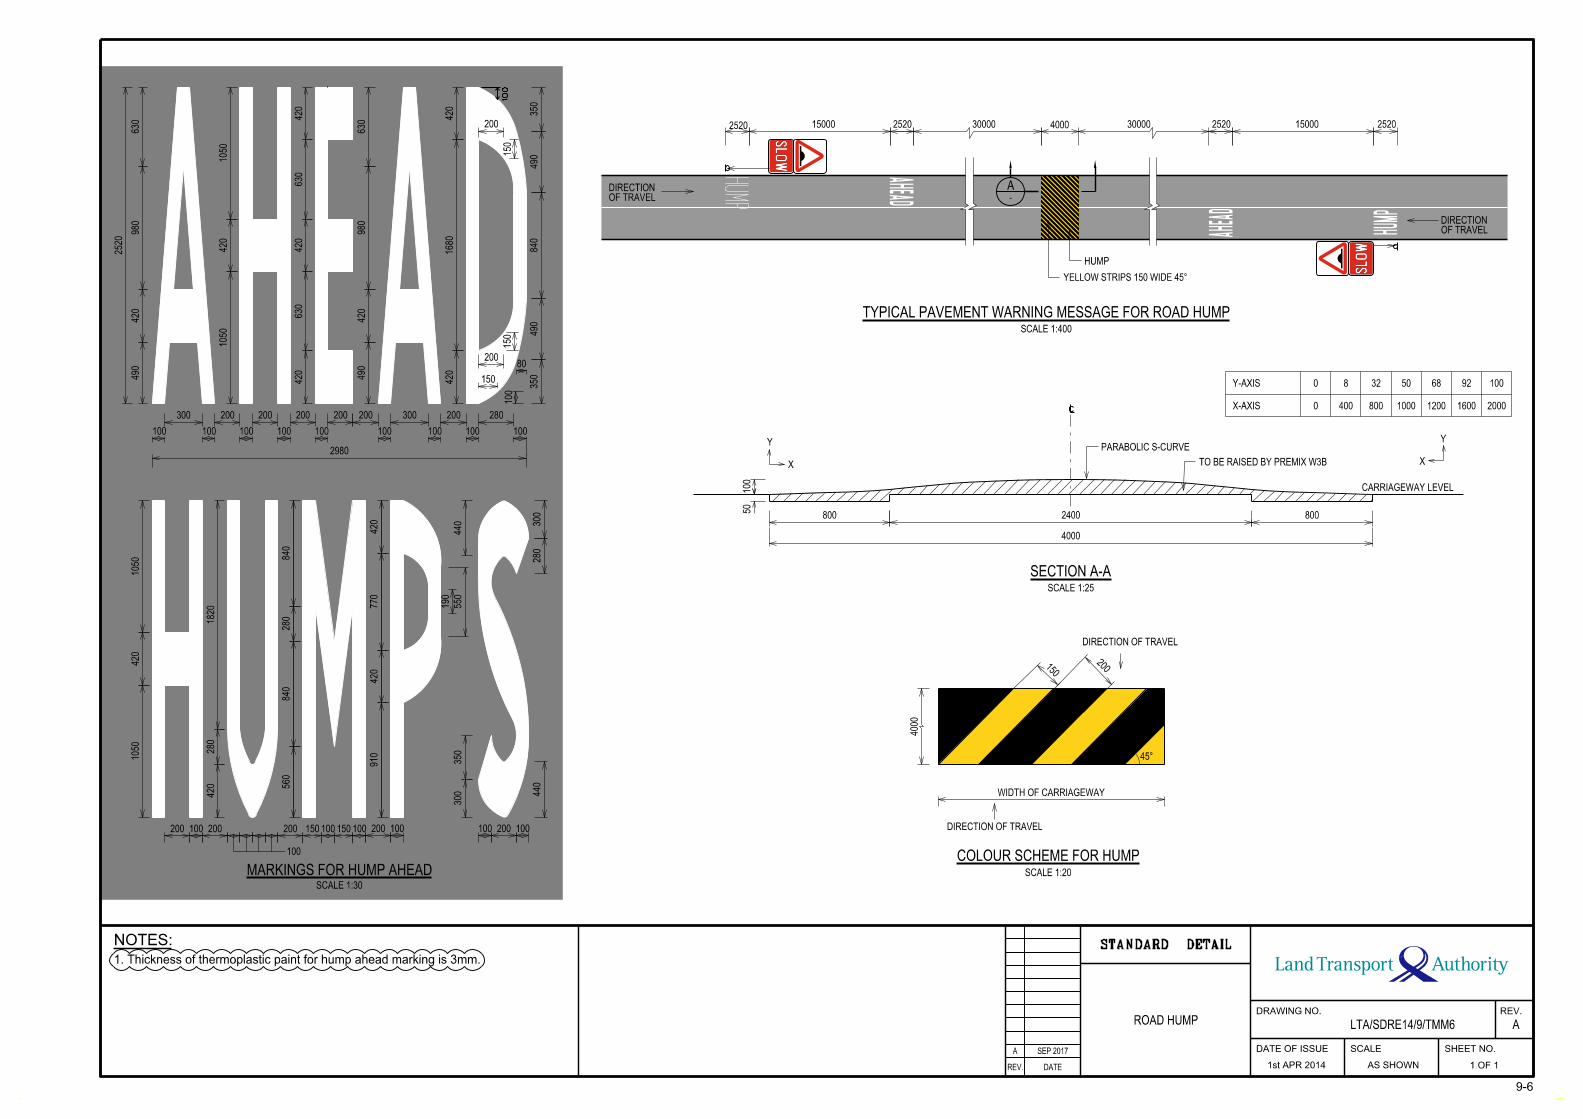
LTA/SDRE14/9/TMM6
AS SHOWN 1 OF 1
9-6
OF TRAVELDIRECTION
SCALE 1:20
COLOUR SCHEME FOR HUMP
DIRECTION OF TRAVEL
DIRECTION OF TRAVEL
150
200
45°
4000
WIDTH OF CARRIAGEWAY
1. Thickness of thermoplastic paint for hump ahead marking is 3mm.
ROAD HUMP
A SEP 2017
STANDARD DETAIL
REV. DATE
DRAWING NO. REV.
A
DATE OF ISSUE
1st APR 2014
SCALE SHEET NO.
NOTES:
SCALE 1:30
MARKINGS FOR HUMP AHEAD
100
300 200 200 200 200 200 300 200 280
2980
490
420
980
630
2520
1050
420
1050
420
630
420
630
420
630
980
420
490
420
1680
420
350
490
840
490
350
200
150
100
150
200
150
80
200100 100
1050
420
1050
420
280
1820
840
280
840
560
420
770
420
910
550
190
440
280
300
300
350
440
100100100100100 100100100100
200 200 200 150 150 200100
100
100 100 100
SCALE 1:25
SECTION A-A
PARABOLIC S-CURVE
TO BE RAISED BY PREMIX W3B
CARRIAGEWAY LEVEL
0 8 32 50 68 92 100
400 800 1000 1200 1600 20000
Y-AXIS
X-AXIS
X
Y
X
Y
50
100
800 2400
4000
800
HU
MP
HUMP
AHEAD
AHEA
D
OF TRAVELDIRECTION A
-
YELLOW STRIPS 150 WIDE 45°
HUMP
TYPICAL PAVEMENT WARNING MESSAGE FOR ROAD HUMPSCALE 1:400
2520 15000 2520 30000 4000 30000 2520 15000 2520
cL
LTA_CORIASQD
Text Box
CHAPTER 9 - MAIN PAGE
LTA_CORIASQD
Text Box
NEXT
LTA_CORIASQD
Text Box
PREVIOUS
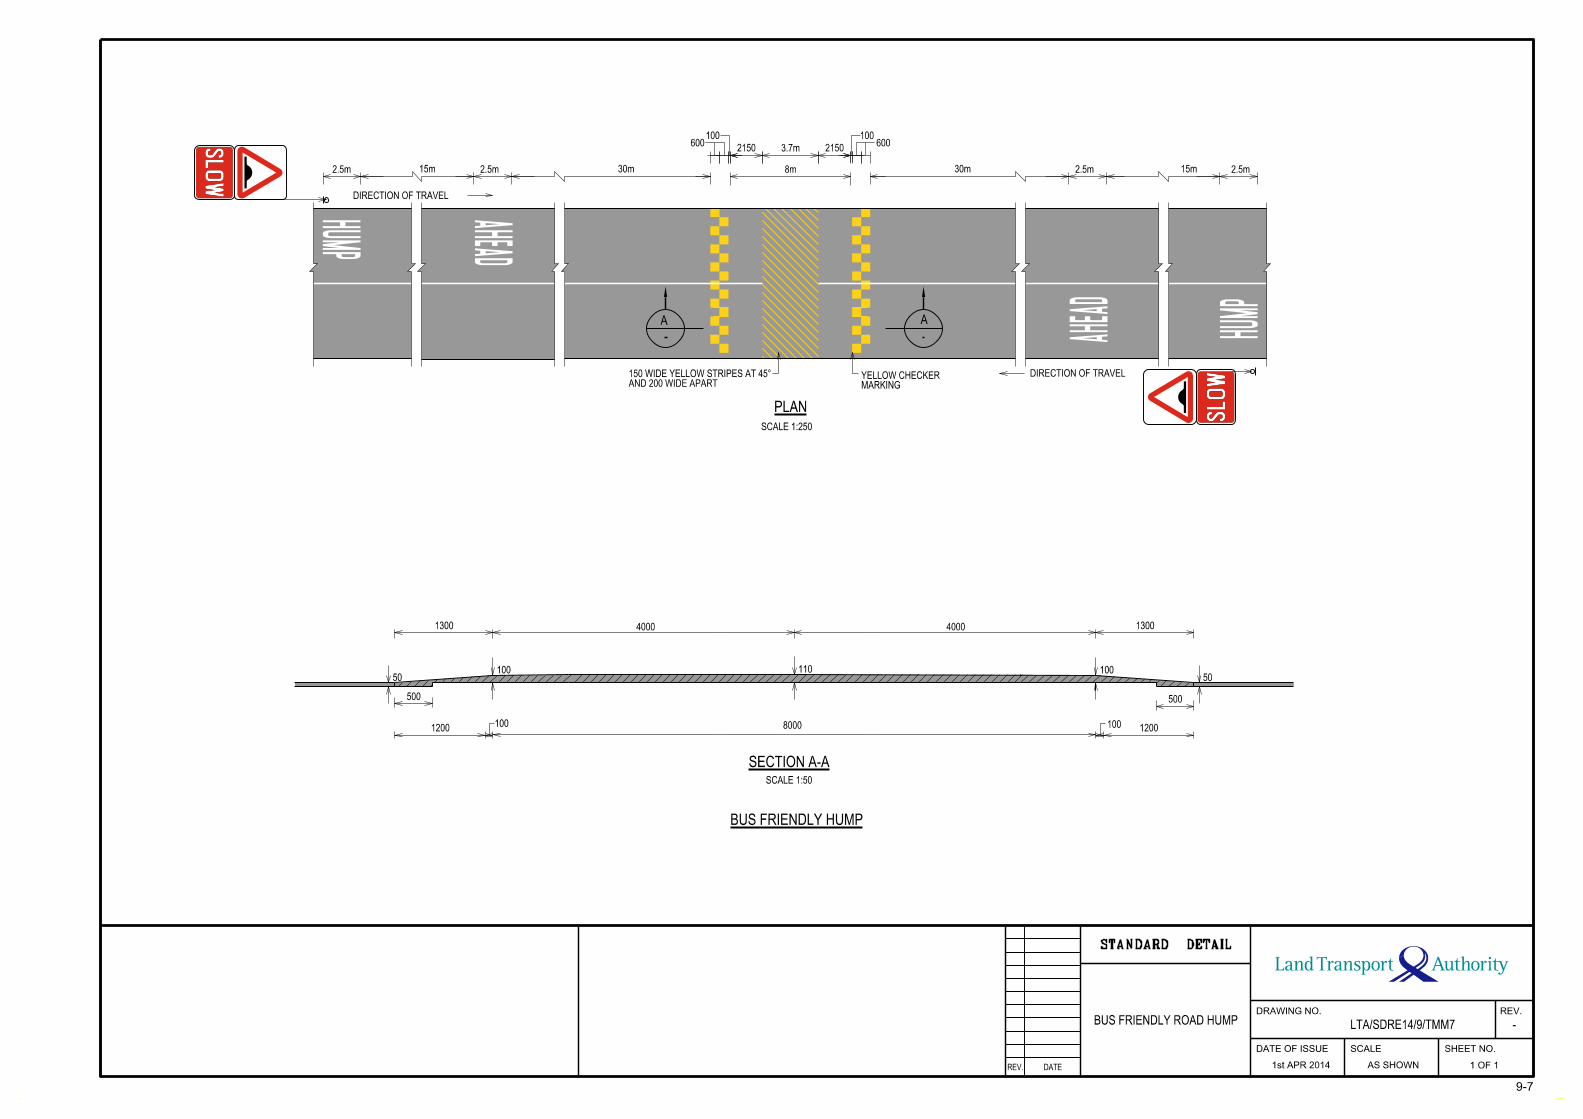
BUS FRIENDLY ROAD HUMP LTA/SDRE14/9/TMM7
AS SHOWN 1 OF 1
9-7
STANDARD DETAIL
REV.
-
REV. DATE
DRAWING NO.
DATE OF ISSUE SCALE SHEET NO.
1st APR 2014
HUMP
2150
HU
MP
--
AHEADA
HEA
D
DIRECTION OF TRAVEL
A A
AND 200 WIDE APART150 WIDE YELLOW STRIPES AT 45°
MARKINGYELLOW CHECKER
SCALE 1:250
PLAN
DIRECTION OF TRAVEL
30m 30m15m 15m
6002150
100
100
600
2.5m 2.5m
3.7m
2.5m 2.5m8m
SCALE 1:50
BUS FRIENDLY HUMP
SECTION A-A
4000 4000
8000
1001105050
100
1300
500
1001200 100 1200
500
1300
LTA_CORIASQD
Text Box
CHAPTER 9 - MAIN PAGE
LTA_CORIASQD
Text Box
NEXT
LTA_CORIASQD
Text Box
PREVIOUS

LTA/SDRE14/9/TMM8CROSSING
CUM RAISED ZEBRA
BUS FRIENDLY HUMP
A OCT 2015
AS SHOWN 1 OF 1
9-8
REFER TO LANE MARKINGS
FLASHING BEACON WITH 'PEDESTRIAN CROSSING' SIGNS
RAISED REFLECTIVE PAVEMENT MARKERS (AMBER)
HOMOGENEOUS TACTILE TILES
LEGEND
D THE 'ARROW' SIGN
TO BE PLACED PERPENDICULAR TO
'PEDESTRIAN CROSSING PROHIBITION' SIGN
SIDE OF ROAD
'ARROW' SIGN TO BE PLACED PARALLEL TO
SUBJECT TO SO'S APPROVAL
EXISTING LAMPPOSTS WHEREVER POSSIBLE AND
ALL SIGNS TO BE CLAMPED ONTO THE NEAREST
B SEP 2017
3. Floodlight to be provided if necessary.
2. Center refuge island shall terminate near a lamp pole.
1. Footpath joining pedestrian crossings shall be flushed with zebra crossing.
K
-
SLOW
X-ING
AHEAD
AHEA
D
X-IN
G
SLO
W
DIRECTION OF TRAVEL
DIRECTION OF TRAVEL
YELLOW CHECKER MARKING
SCALE 1:250
PLAN
A
100100
15m 15m 30m 30m 15m 15m
8m
600
600
(MINIMUM) (MINIMUM) (MINIMUM) (MINIMUM)
5005m3m 3m5m
500
2.5m 2.5m 2.5m
2m4m2m1m 1m
2.5m 2.5m 2.5m
1m
1.2
m600
1m
1m
1m
J
CL
1m
1m
STANDARD DETAIL
REV. DATE
DRAWING NO.
DATE OF ISSUE
1st APR 2014
SCALE SHEET NO.
REV.
B
NOTES:
SCALE 1:50
BUS FRIENDLY HUMP CUM RAISED ZEBRA CROSSING
SECTION A-A
SEPARATOR SEPARATOR
100 100110
4000
8000
Lc
13002200
500
1000
5001500
200
200 200
500 1500 500
22001300
4000
1000
200
LTA_CORIASQD
Text Box
CHAPTER 9 - MAIN PAGE
LTA_CORIASQD
Text Box
NEXT
LTA_CORIASQD
Text Box
PREVIOUS
USER
Text Box
4. The use of skid resistant pavement before the zebra crossing is recommended, particularly in wet environments.

980
980
ISOMETRIC VIEW
KERB HEIGHT TRANSITION FROM 150mm TO 125mm
SCALE 1:30
CARRIAGEWAY
CEMENT MORTAR
MAXIMUM
20 THK
125
150
B
A OCT 2015
(SHEET 1 OF 2)
BUS BAY
LTA/SDRE14/11/BUS1
AS SHOWN 1 OF 2
11-1
SEPT 2017
minimum of 3m subject to approval from LTA.
4. Where there is site constraints, width of bus bay can be reduced to an absolute
movements and the view of the approaching buses.
3. Location of advertising panel and bus stop sign shall not obstruct pedestrian
limit.
2. Safety bollards shall be provided at all bus stops, according to the posted speed
1. Size and type of bus shelter shall be subject to approval from LTA.
spacing of pedestrian grating.
8. Refer to the table in DWG No: LTA/SDRE14/4/GRA1 for the type and
7. Safety bollards shall not be erected on scupper pipes.
absolute minimum of 3m subject to approval from LTA.
6. Where there is site ocnstraints, width of bus bay can be reduced to an
located in a curve / bend.
5. The kerb line (L) shall always be a straight line even when the bus stop is STANDARD DETAIL
REV. DATE
DRAWING NO.
DATE OF ISSUE
1st APR 2014
SCALE SHEET NO.
REV.
B
NOTES:
3000
10000
5000
1800
5000
3000
980 980
AT 3m C/C APPROXIMATE250 DIA UPVC PIPE (HEAVY DUTY)
L
FOOTPATH CUM DRAINSAFETY BOLLARDS AT 3m C/C
(REF DWG NO: SDRE14/14/BOL3 & 4)REINFORCEMENT DETAILSSLAB THICKNESS AND
WITH CHEQUER PLATEPEDESTRIAN GRATING
CARRIAGEWAY
EDGE OF
(ON PAVED AREA ONLY)BE DRAWN 125mm FROM KERB LINETHERMOPLASTIC PAINT TO200 X 1.5 THK YELLOW BAND
OF 125mmKERB HEIGHT
TRANSITIONKERB HEIGHT
KERB HEIGHT OF 150mm
TRANSITIONKERB HEIGHT OF 125mm
KERB HEIGHT
DIRECTION OF TRAVEL600
RIGID PAVEMENT
YELLOW LINE
BUS STOP WITHOUT BUS BAY
SCALE 1:250
SDRE14/11/BUS2
3
100
600
CHECKLIST FOR DETAILS)COMMUTER FACILITIESBUS STOP (REFER TO
1500
POLEBUS STOP
POINTTANGENT
DETAIL 2SCALE 1:100
POINTTANGENT
2000m
INTERSECTIONPOINT OF
POINTTANGENT
DETAIL 1SCALE 1:100
POINT
TANGENT
CATCH BASIN
2000m
2000m
INTERSECTION
POINT OF
2000m
10000 5000
3000
3800
1800
3700
1800
AT 3m C/C APPROXIMATE250 DIA UPVC PIPE (HEAVY DUTY)
980 980
WITH CHEQUER PLATEPEDESTRIAN GRATING
FOOTPATH CUM DRAIN
FOOTPATH
DROP-INLET CHAMBER
DIRECTION OF TRAVEL
EXPANSION JOINT
CATCH BASIN2
SAFETY BOLLARDS AT 3m C/C (REF DWG NO: SDRE14/14/BOL3 & 4)SLAB THICKNESS AND REINFORCEMENT DETAILS
(REF DWG NO: SDRE14/11/BUS3)
EXPANSION JOINT
TRIPLE BUS BAY)(FOR DOUBLE ANDEXPANSION JOINT
600
(ON PAVED AREA ONLY)BE DRAWN 125mm FROM KERB LINETHERMOPLASTIC PAINT TO200 X 1.5 THK YELLOW BAND
SDRE14/11/BUS2
3-
1
20000L25000
OF 125mmKERB HEIGHT
TRANSITIONKERB HEIGHT
KERB HEIGHT OF 150mm
TRANSITIONKERB HEIGHT OF 125mm
KERB HEIGHT
TYPICAL SECTION OF BUS BAY
SCALE 1:250
TYPE
1
2
3 TRIPLE BUS BAY
DOUBLE BUS BAY
SINGLE BUS BAY
DESCRIPTION L
18m
46m
32m 3
JOINT
EXPANSION
NO. OF
2
4
-
FACILITIES CHECKLIST FOR DETAILS)BUS STOP (REFER TO COMMUTER
1500
BUS - STOP POLE
A
F
LTA_CORIASQD
Text Box
CHAPTER 11 - MAIN PAGE
LTA_CORIASQD
Text Box
NEXT
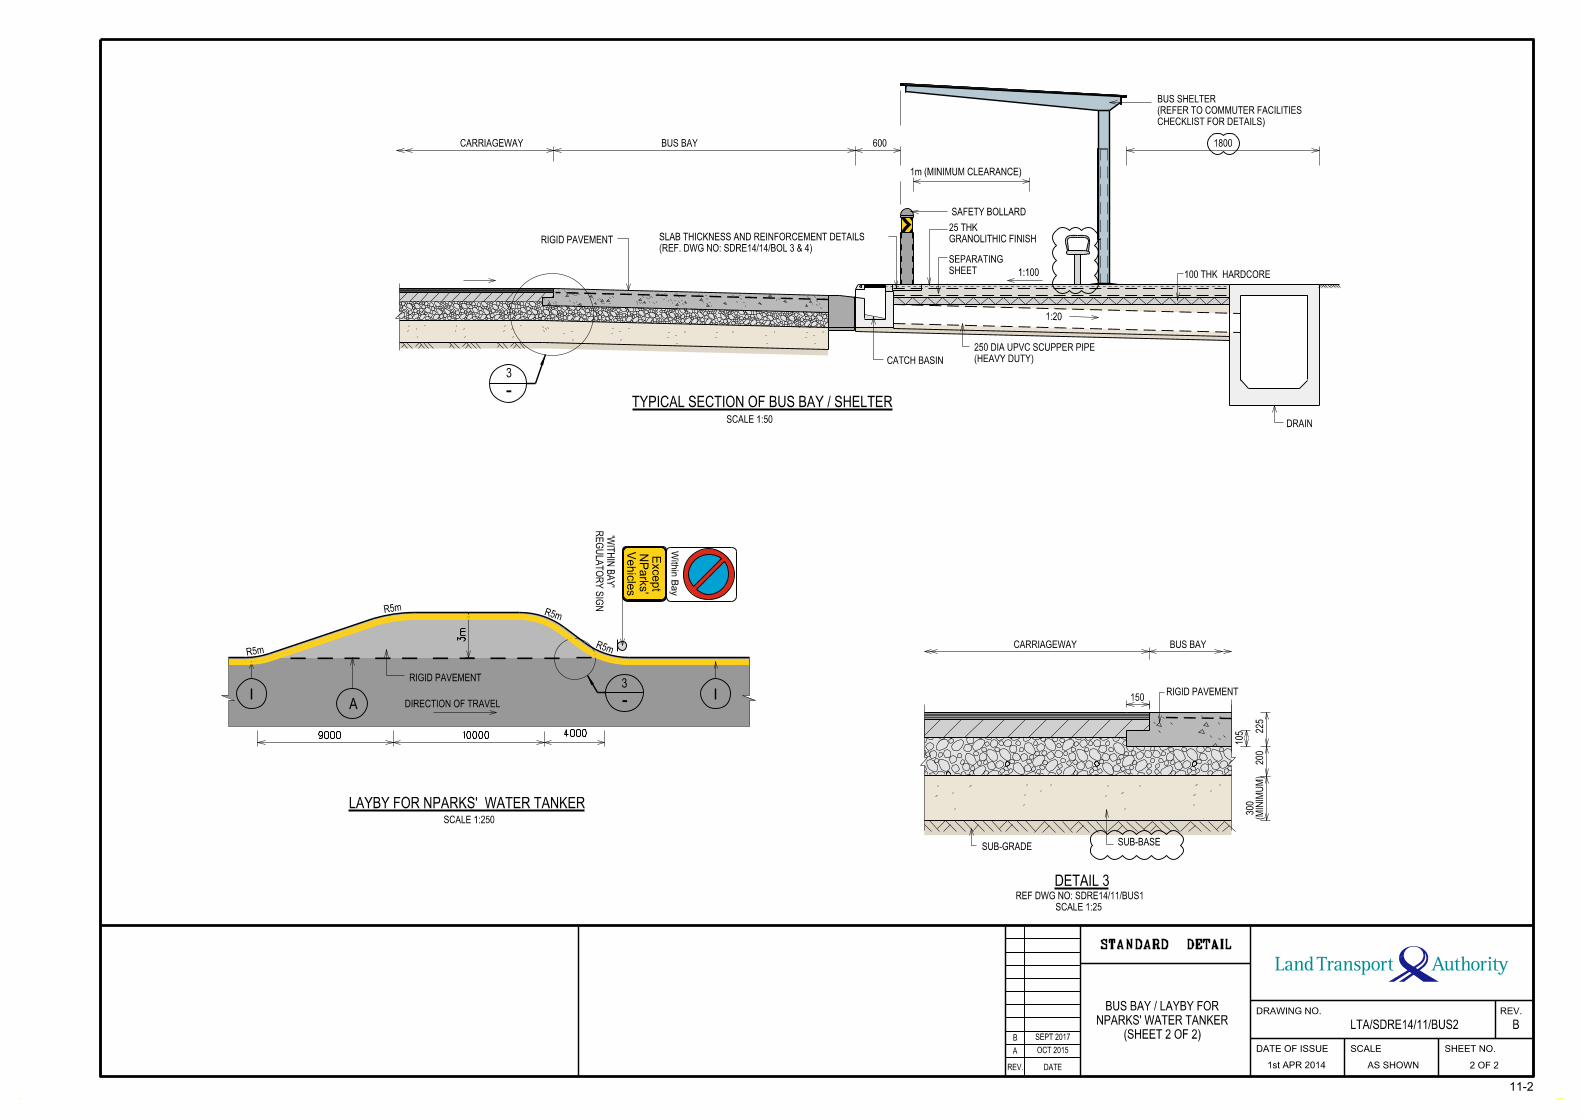
B SEPT 2017
OCT 2015A
(SHEET 2 OF 2)
NPARKS' WATER TANKER
BUS BAY / LAYBY FOR
LTA/SDRE14/11/BUS2
AS SHOWN 2 OF 2
11-2
STANDARD DETAIL
REV. DATE
DRAWING NO.
DATE OF ISSUE
1st APR 2014
SCALE SHEET NO.
REV.
B
SCALE 1:50
SHEET
SEPARATING
SAFETY BOLLARD
CATCH BASIN
1:100
DRAIN
RIGID PAVEMENT
CHECKLIST FOR DETAILS)
(REFER TO COMMUTER FACILITIES
BUS SHELTER
100 THK HARDCORE
TYPICAL SECTION OF BUS BAY / SHELTER
(HEAVY DUTY)
250 DIA UPVC SCUPPER PIPE
GRANOLITHIC FINISH
25 THK
3
(REF. DWG NO: SDRE14/14/BOL 3 & 4)
SLAB THICKNESS AND REINFORCEMENT DETAILS
CARRIAGEWAY BUS BAY 600
1:20
1m (MINIMUM CLEARANCE)
1800
(MINIM
UM)
300
200
225
SUB-GRADE
DETAIL 3
RIGID PAVEMENT
BUS BAYCARRIAGEWAY
SCALE 1:25
REF DWG NO: SDRE14/11/BUS1
SUB-BASE
150
105
II
3m
4000100009000
SCALE 1:250
Vehicles
NParks'
Except
Within B
ay
A
RIGID PAVEMENT
R5m R5m
R5m
RE
GULATO
RY SIG
N
'WIT
HIN B
AY'
R5m
DIRECTION OF TRAVEL
LAYBY FOR NPARKS' WATER TANKER
3
LTA_CORIASQD
Text Box
CHAPTER 11 - MAIN PAGE
LTA_CORIASQD
Text Box
NEXT
LTA_CORIASQD
Text Box
PREVIOUS
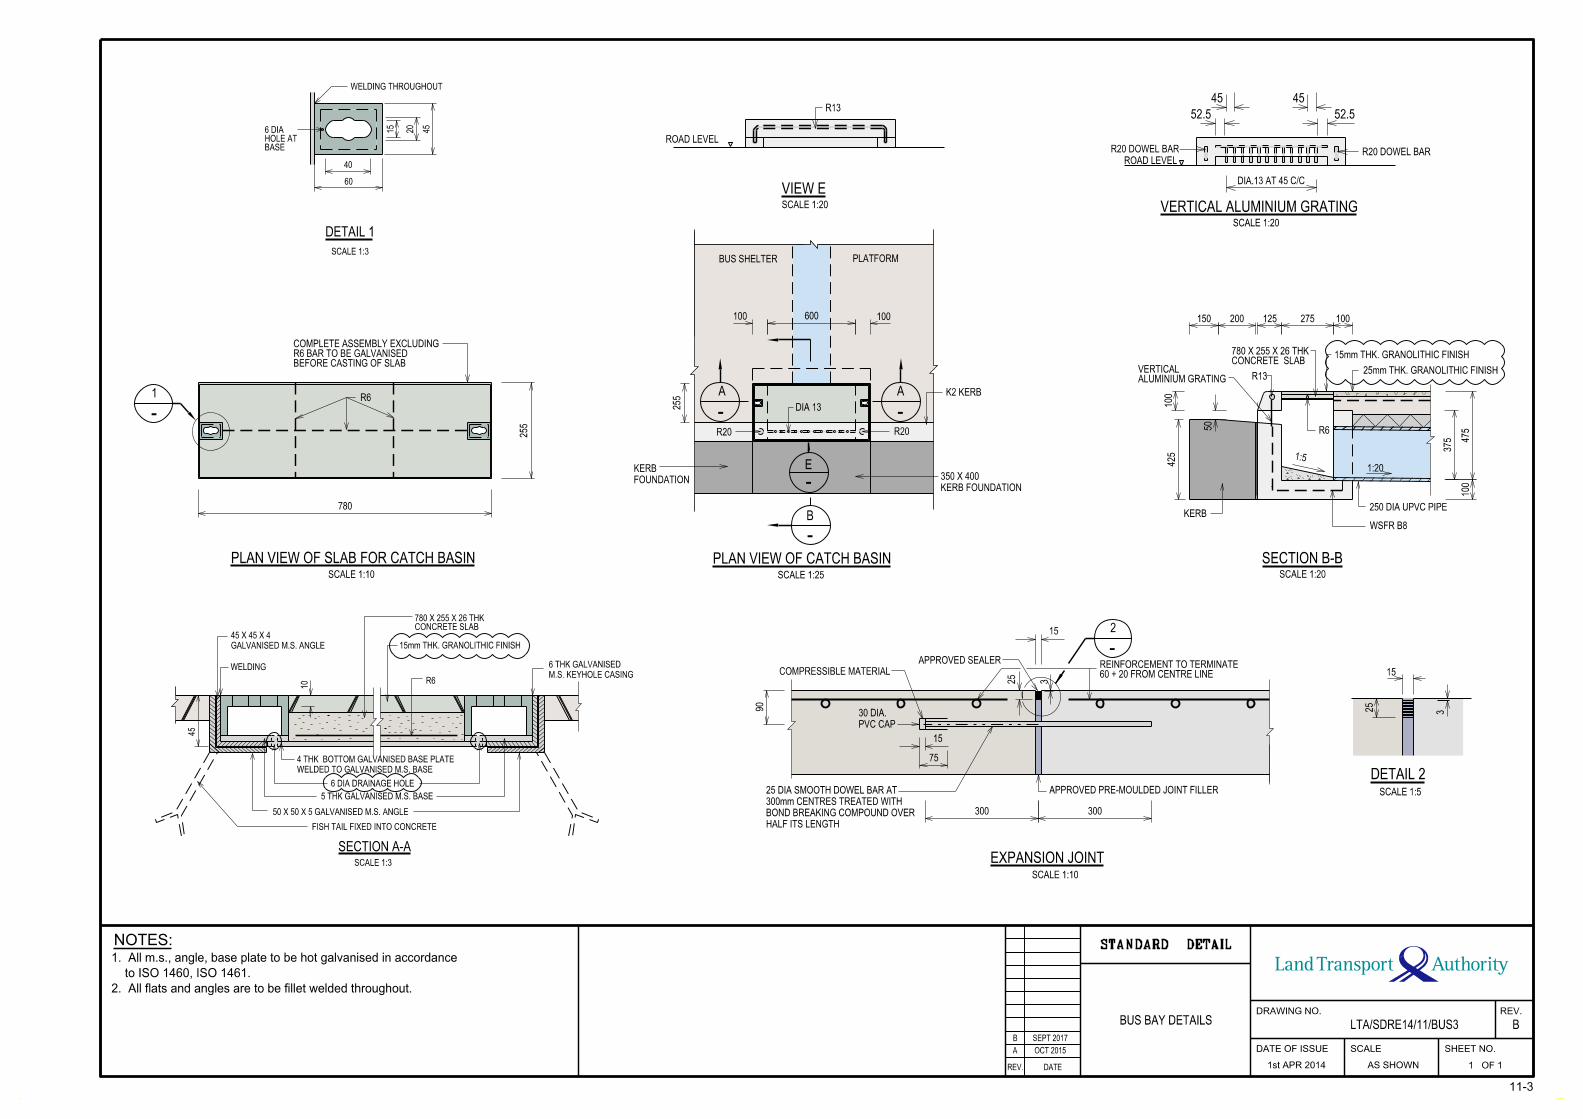
BUS BAY DETAILS
B SEPT 2017
OCT 2015A
AS SHOWN 1 OF 1
LTA/SDRE14/11/BUS3
11-3
2. All flats and angles are to be fillet welded throughout.
to ISO 1460, ISO 1461.
1. All m.s., angle, base plate to be hot galvanised in accordance
STANDARD DETAIL
REV. DATE
DRAWING NO.
DATE OF ISSUE
1st APR 2014
SCALE SHEET NO.
REV.
B
NOTES:
BEFORE CASTING OF SLABR6 BAR TO BE GALVANISEDCOMPLETE ASSEMBLY EXCLUDING
PLAN VIEW OF SLAB FOR CATCH BASINSCALE 1:10
R61
255
780
255
FOUNDATION
KERB
PLAN VIEW OF CATCH BASINSCALE 1:25
R20 R20
K2 KERB
BUS SHELTER PLATFORM
100 100
KERB FOUNDATION
350 X 400
A A
B
E
DIA 13
600
R13
ROAD LEVEL
VIEW ESCALE 1:20
25
3
15
DETAIL 2
SCALE 1:5
15
15
25
3
SCALE 1:10
APPROVED SEALER
COMPRESSIBLE MATERIAL
APPROVED PRE-MOULDED JOINT FILLER
EXPANSION JOINT
PVC CAP
30 DIA.
60 + 20 FROM CENTRE LINEREINFORCEMENT TO TERMINATE
HALF ITS LENGTH
BOND BREAKING COMPOUND OVER
300mm CENTRES TREATED WITH
25 DIA SMOOTH DOWEL BAR AT
2
90
300300
75
WELDING THROUGHOUT
DETAIL 1
SCALE 1:3
BASEHOLE AT6 DIA 4
5
20
15
40
60
WELDING
FISH TAIL FIXED INTO CONCRETE
10
SCALE 1:3
GALVANISED M.S. ANGLE
45 X 45 X 4
WELDED TO GALVANISED M.S. BASE
4 THK BOTTOM GALVANISED BASE PLATE
50 X 50 X 5 GALVANISED M.S. ANGLE
CONCRETE SLAB780 X 255 X 26 THK
5 THK GALVANISED M.S. BASE
M.S. KEYHOLE CASING
6 THK GALVANISED
SECTION A-A
R6
15mm THK. GRANOLITHIC FINISH
45
6 DIA DRAINAGE HOLE
WSFR B8
KERB
R650
100
SECTION B-BSCALE 1:20
1:5
250 DIA UPVC PIPE
CONCRETE SLAB780 X 255 X 26 THK
1:20
R13ALUMINIUM GRATINGVERTICAL
15mm THK. GRANOLITHIC FINISH
25mm THK. GRANOLITHIC FINISH
100275125200150
375 475
100
425
ROAD LEVEL
SCALE 1:20
VERTICAL ALUMINIUM GRATING
DIA.13 AT 45 C/C
R20 DOWEL BARR20 DOWEL BAR
45 45
52.552.5
LTA_CORIASQD
Text Box
CHAPTER 11 - MAIN PAGE
LTA_CORIASQD
Text Box
NEXT
LTA_CORIASQD
Text Box
PREVIOUS

OCT 2015A
B
TEMPORARY USE ONLYBUS SHELTER - TYPE A
LTA/SDRE14/11/BUS4
AS SHOWN 1 OF 1
11-4
specified by the S.O.
and 2 layers of finishing paint of approved quality and colour
3. All exposed metal surface to be coated with a layer of red lead undercoat
2. All pipes to be class medium (B) in accordance with SS EN 10255:2013
(with 2 units unless otherwise specified).
1. Type A bus shelter shall be used for temporary shelter use.
SEPT 2017
STANDARD DETAIL
REV. DATE
DRAWING NO.
DATE OF ISSUE
1st APR 2014
SCALE SHEET NO.
REV.
B
NOTES:
(MINIMUM) 1m
FRONT ELEVATIONSCALE 1:50
GLASS SEATING3 THK FIBRE
9000
3000 150 2850 (END UNIT)30002850
A
GLASS ROOFING3 THK FIBRE
WELD ALL ROUND6 FILLET
80 DIA M.S. PIPE
40 DIA M.S. PIPE
SAFETY BOLLARD
KERB & FLOOR LEVEL
ROAD LEVEL500
500
225
2100
A
10 DIA HOLE
SAFETY BOLLARDS AT 3m SPACING
PLANSCALE 1:50
EDGE OF CARRIAGEWAY
KERB
ROOF LINE
80 DIA M.S. PIPE
40 DIA M.S. PIPE
2
CONCRETE FOOTING800mm^2 X 300mm
600
2202
1840
750 1425 1500 1500 1425
25°
25 X 50 X 3 THK RHS
5°
25 X 50 X 3 THK RHS
GLASS ROOFING
3 THK FIBRE
SAFETY BOLLARD
WSFR A5
WSFR A8
300 THK CONCRETE FOOTING
200 THK HARDCORE
WATERPROOFING MEMBRANE
SECTION A-ASCALE 1:50
600
450
450
420
125
300
(ON PAVED AREA ONLY)
BE DRAWN 125mm FROM THE KERB LINE
200 x 1.5 THK YELLOW BAND THERMOPLASTIC PAINT TO
C
B
(4 THK)80 DIA M.S. PIPE
M.S. PLATE150 X 150 X 6 THK
50 X 25 KAPOR TIMBER STRIP
6 THK M.S. SEAT PLATE
GLASS SEATINGOUTLINE OF FIBRE
LAYOUT DETAIL OF FIBRE GLASS SEATINGSCALE 1:20
340
240
250
500
600
450
600
OF FIBRE GLASS REINFORCED PLASTIC50 X 25 KAPOR TIMBER STRIP WITH 2 LAYERS
20mm WOOD SCREW
6 THK M.S. SEAT PLATE
3 THK FIBRE GLASS SEATING
80 DIA M.S. PIPE ( 4 THK )
IN CONCRETE IF USED AS TEMPORARY SHELTER )100 X 12 DIA BOLT & NUT ( NOT TO BE ENCASED
150 X 150 X 6 THK M.S. BASE PLATE
SECTION B-BSCALE 1:20
SECTION C-CSCALE 1:20
130
50
100
50
300 300
450
170
8585
15
10001000
DETAIL OF FIBRE GLASS ROOFINGSCALE 1:10
200 X 12 DIA BOLT & NUT
75 X 75 X 8 FLANGE PLATE
250 X 250 X 10 THK M.S. PLATE
80 DIA M.S. PIPE (4 THK)
WHEN USED AS TEMPORARY SHELTER )
CONCRETE HAUNCHING ( NOT REQUIRED
DETAIL OF POST CONNECTED
TO CONCRETE FOOTINGSCALE 1:25
400 400
8585
4040
250
500
550
LTA_CORIASQD
Text Box
CHAPTER 11 - MAIN PAGE
LTA_CORIASQD
Text Box
NEXT
LTA_CORIASQD
Text Box
PREVIOUS
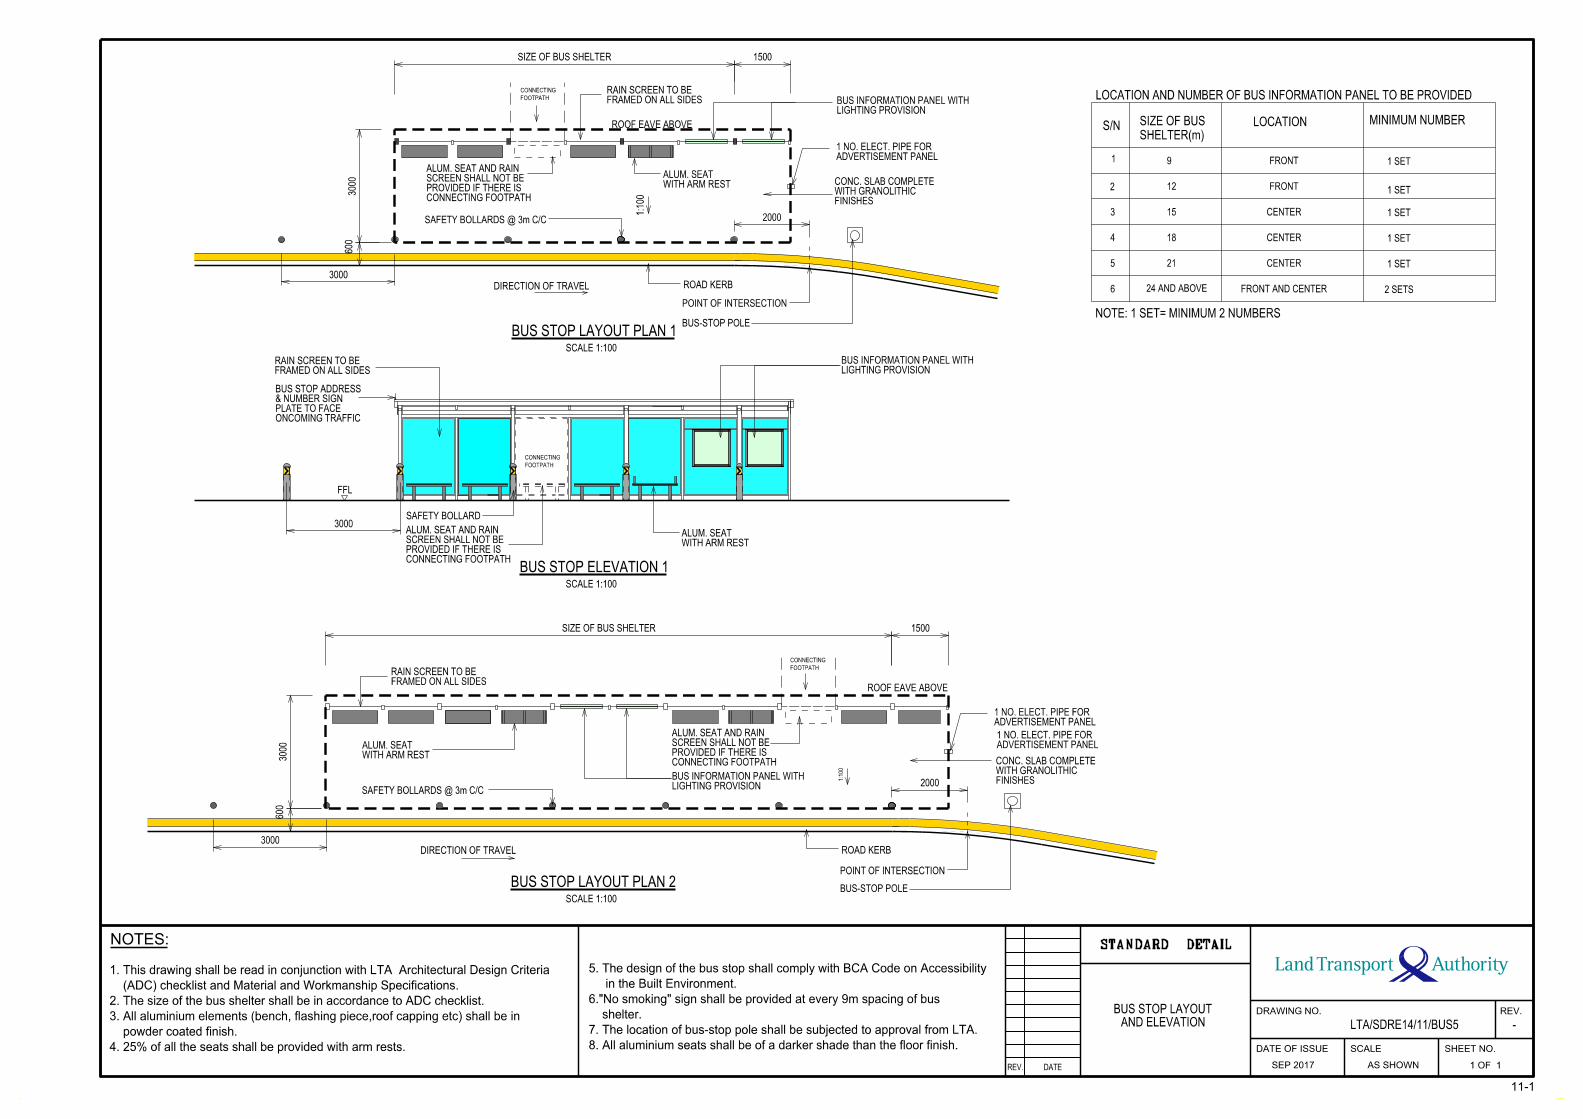
LTA/SDRE14/11/BUS5
AS SHOWN 1 OF 1
11-1
AND ELEVATION
BUS STOP LAYOUT
4. 25% of all the seats shall be provided with arm rests.
powder coated finish.
3. All aluminium elements (bench, flashing piece,roof capping etc) shall be in
2. The size of the bus shelter shall be in accordance to ADC checklist.
(ADC) checklist and Material and Workmanship Specifications.
1. This drawing shall be read in conjunction with LTA Architectural Design Criteria
8. All aluminium seats shall be of a darker shade than the floor finish.
7. The location of bus-stop pole shall be subjected to approval from LTA.
shelter.
6."No smoking" sign shall be provided at every 9m spacing of bus
in the Built Environment.
5. The design of the bus stop shall comply with BCA Code on Accessibility
ADVERTISEMENT PANEL 1 NO. ELECT. PIPE FOR
ROAD KERB
ROOF EAVE ABOVE
DIRECTION OF TRAVEL
3000
3000
SAFETY BOLLARDS @ 3m C/C
1500SIZE OF BUS SHELTER
FINISHESWITH GRANOLITHIC CONC. SLAB COMPLETE WITH ARM REST
ALUM. SEAT
FRAMED ON ALL SIDESRAIN SCREEN TO BE
LIGHTING PROVISION BUS INFORMATION PANEL WITH
CONNECTING FOOTPATHPROVIDED IF THERE IS SCREEN SHALL NOT BE ALUM. SEAT AND RAIN
600
BUS-STOP POLE
POINT OF INTERSECTION
1:1
00
SCALE 1:100
BUS STOP LAYOUT PLAN 1
FOOTPATH
CONNECTING
ROOF EAVE ABOVE
3000 ADVERTISEMENT PANEL
1 NO. ELECT. PIPE FOR
DIRECTION OF TRAVEL ROAD KERB3000
SAFETY BOLLARDS @ 3m C/C
1500SIZE OF BUS SHELTER
FOOTPATH
CONNECTING
FINISHESWITH GRANOLITHIC CONC. SLAB COMPLETE
WITH ARM RESTALUM. SEAT
FRAMED ON ALL SIDESRAIN SCREEN TO BE
LIGHTING PROVISION BUS INFORMATION PANEL WITH
CONNECTING FOOTPATHPROVIDED IF THERE IS SCREEN SHALL NOT BE ALUM. SEAT AND RAIN
600
BUS-STOP POLE
POINT OF INTERSECTION
ADVERTISEMENT PANEL 1 NO. ELECT. PIPE FOR
1:1
00
SCALE 1:100
BUS STOP LAYOUT PLAN 2
SAFETY BOLLARD3000
LIGHTING PROVISION BUS INFORMATION PANEL WITH
FRAMED ON ALL SIDESRAIN SCREEN TO BE
ONCOMING TRAFFIC PLATE TO FACE & NUMBER SIGN BUS STOP ADDRESS
WITH ARM RESTALUM. SEAT
CONNECTING FOOTPATHPROVIDED IF THERE IS SCREEN SHALL NOT BE ALUM. SEAT AND RAIN
SCALE 1:100
BUS STOP ELEVATION 1
FFL
FOOTPATH
CONNECTING
STANDARD DETAIL
REV.
-
REV. DATE
DRAWING NO.
DATE OF ISSUE SCALE SHEET NO.
SEP 2017
NOTES:
2000
2000
S/N
1
2
3
LOCATION
9
12
15
FRONT
FRONT
1 SET
4 18
5 21
6 24 AND ABOVE
CENTER
CENTER
CENTER
FRONT AND CENTER
1 SET
1 SET
1 SET
1 SET
2 SETS
NOTE: 1 SET= MINIMUM 2 NUMBERS
SHELTER(m)
SIZE OF BUS
LOCATION AND NUMBER OF BUS INFORMATION PANEL TO BE PROVIDED
MINIMUM NUMBER
LTA_CORIASQD
Text Box
CHAPTER 11 - MAIN PAGE
LTA_CORIASQD
Text Box
PREVIOUS
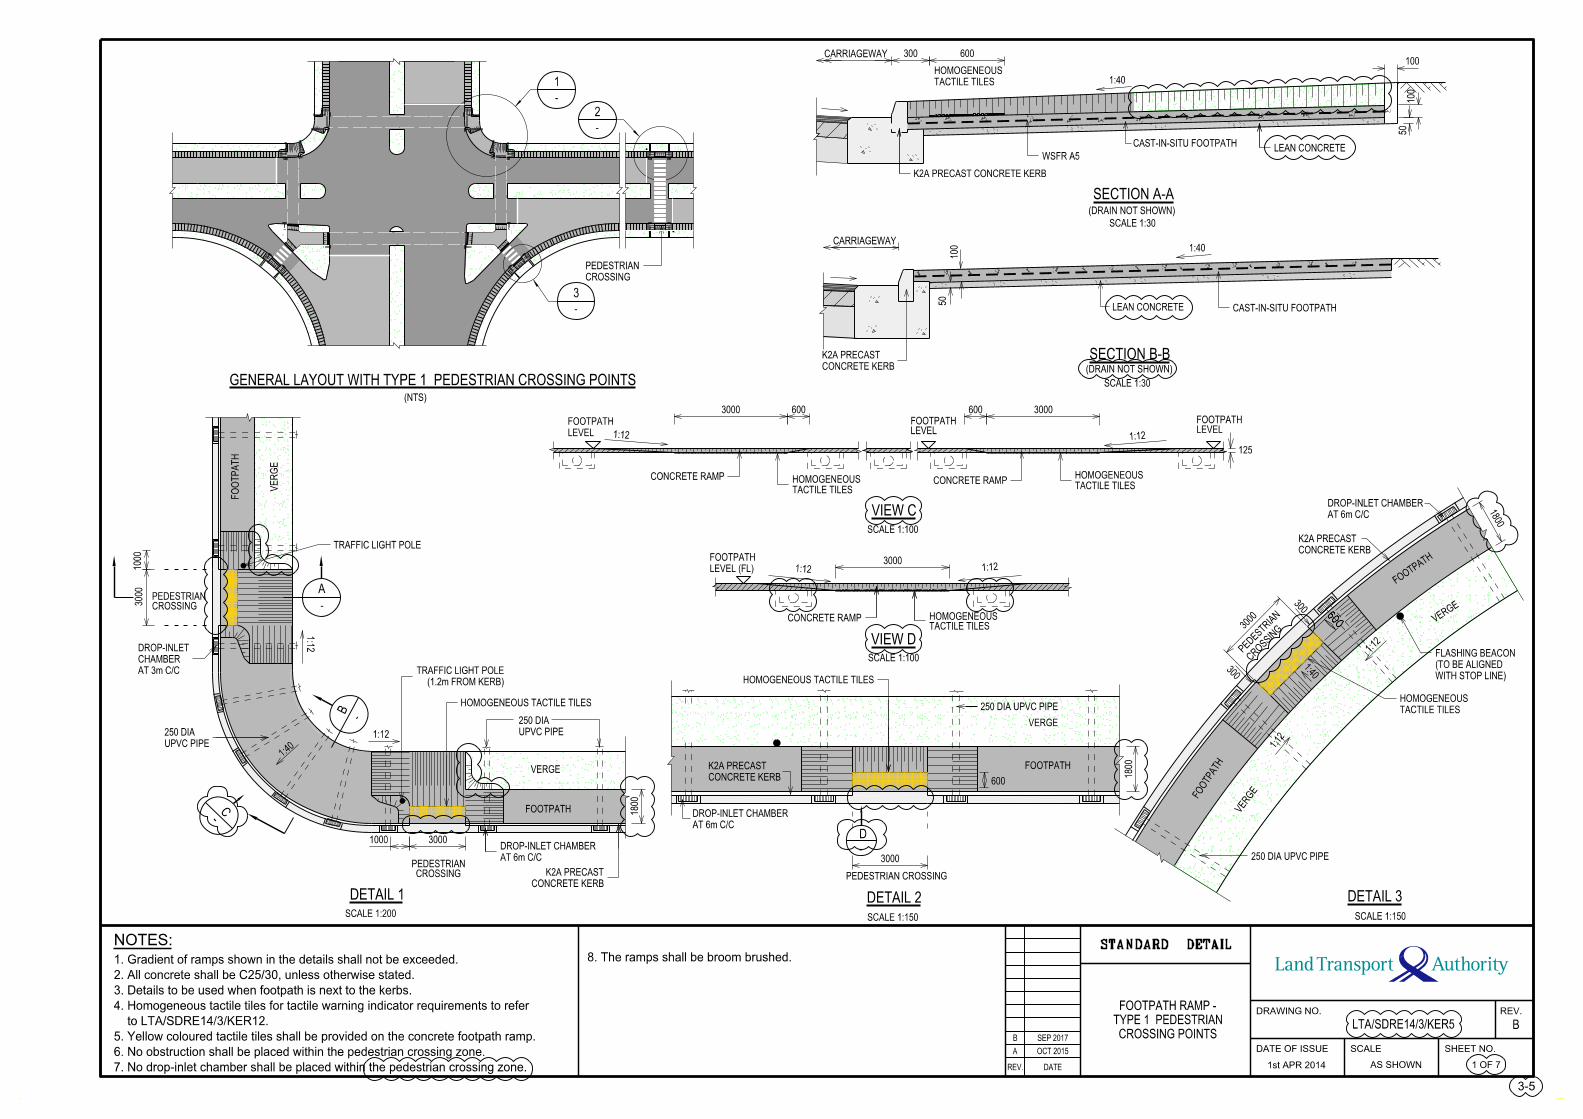
SCALE 1:100
LEVEL (FL)
FOOTPATH1:121:12
VIEW DTACTILE TILESHOMOGENEOUSCONCRETE RAMP
3000
SCALE 1:150
PEDESTRIAN CROSSING
1:121:12
HOMOGENEOUS TACTILE TILES
FOOTPATH
VERGEWITH STOP LINE)
(TO BE ALIGNED
FLASHING BEACON
CONCRETE KERB
K2A PRECAST
3000
1800
AT 6m C/C
DROP-INLET CHAMBER
250 DIA UPVC PIPE
600
DETAIL 3
SCALE 1:150
CROSSIN
G
PEDES
TRIA
N
300
1:12
1:12
300
AT 6m C/C
DROP-INLET CHAMBER
TACTILE TILES
HOMOGENEOUS
CONCRETE KERB
K2A PRECAST
WITH STOP LINE)
(TO BE ALIGNED
FLASHING BEACON
FO
OTPATH
VERGE
FOOTPATH
VERGE
1:40
1800
3000
STANDARD DETAIL
REV. DATE
DRAWING NO.
DATE OF ISSUE
1st APR 2014
SCALE SHEET NO.
REV.
B
NOTES:100
LEAN CONCRETE
50
CARRIAGEWAY
SCALE 1:30
SECTION B-B
CAST-IN-SITU FOOTPATH
CONCRETE KERB
K2A PRECAST
1:40
(DRAIN NOT SHOWN)
1000
1800
CROSSINGPEDESTRIAN
CROSSINGPEDESTRIAN
TRAFFIC LIGHT POLE
1:12
DETAIL 1
SCALE 1:200
1:12
1:40
C
-
UPVC PIPE
250 DIA
A
-
B
-
(1.2m FROM KERB)
TRAFFIC LIGHT POLE
HOMOGENEOUS TACTILE TILES
CONCRETE KERB
K2A PRECAST
FO
OTP
AT
H
VE
RG
E
VERGE
FOOTPATH
3000
30001000
AT 3m C/C
CHAMBER
DROP-INLET
UPVC PIPE
250 DIA
AT 6m C/C
DROP-INLET CHAMBER
VIEW C
SCALE 1:100
TACTILE TILES
HOMOGENEOUS
1:12LEVEL
FOOTPATHLEVELFOOTPATH
1:12LEVELFOOTPATH
125
TACTILE TILES
HOMOGENEOUSCONCRETE RAMP CONCRETE RAMP
600 600 30003000
D
-
DETAIL 2
600
250 DIA UPVC PIPE
TACTILE TILES
HOMOGENEOUS
CARRIAGEWAY
SCALE 1:30
CAST-IN-SITU FOOTPATH
SECTION A-A(DRAIN NOT SHOWN)
K2A PRECAST CONCRETE KERB
1:40
WSFR A5LEAN CONCRETE
300 600
50
100
100
CROSSING
PEDESTRIAN
GENERAL LAYOUT WITH TYPE 1 PEDESTRIAN CROSSING POINTS
-
1
-
2
-
3
(NTS)
LTA/SDRE14/3/KER5CROSSING POINTS
TYPE 1 PEDESTRIAN
FOOTPATH RAMP -
A OCT 2015
B SEP 2017
1 OF 7
3-5
AS SHOWN 7. No drop-inlet chamber shall be placed within the pedestrian crossing zone.
6. No obstruction shall be placed within the pedestrian crossing zone.
5. Yellow coloured tactile tiles shall be provided on the concrete footpath ramp.
to LTA/SDRE14/3/KER12.
4. Homogeneous tactile tiles for tactile warning indicator requirements to refer
3. Details to be used when footpath is next to the kerbs.
2. All concrete shall be C25/30, unless otherwise stated.
1. Gradient of ramps shown in the details shall not be exceeded. 8. The ramps shall be broom brushed.
LTA_CORIASQD
Text Box
CHAPTER 3 - MAIN PAGE
LTA_CORIASQD
Text Box
NEXT
LTA_CORIASQD
Text Box
PREVIOUS
USER
Text Box
9. Zebra crossings to be 'raised crossings' when necessary, particularly in areas with high pedestrian volumes. 10. Pedestrian refuge island dimensions can be adapted as necessary.
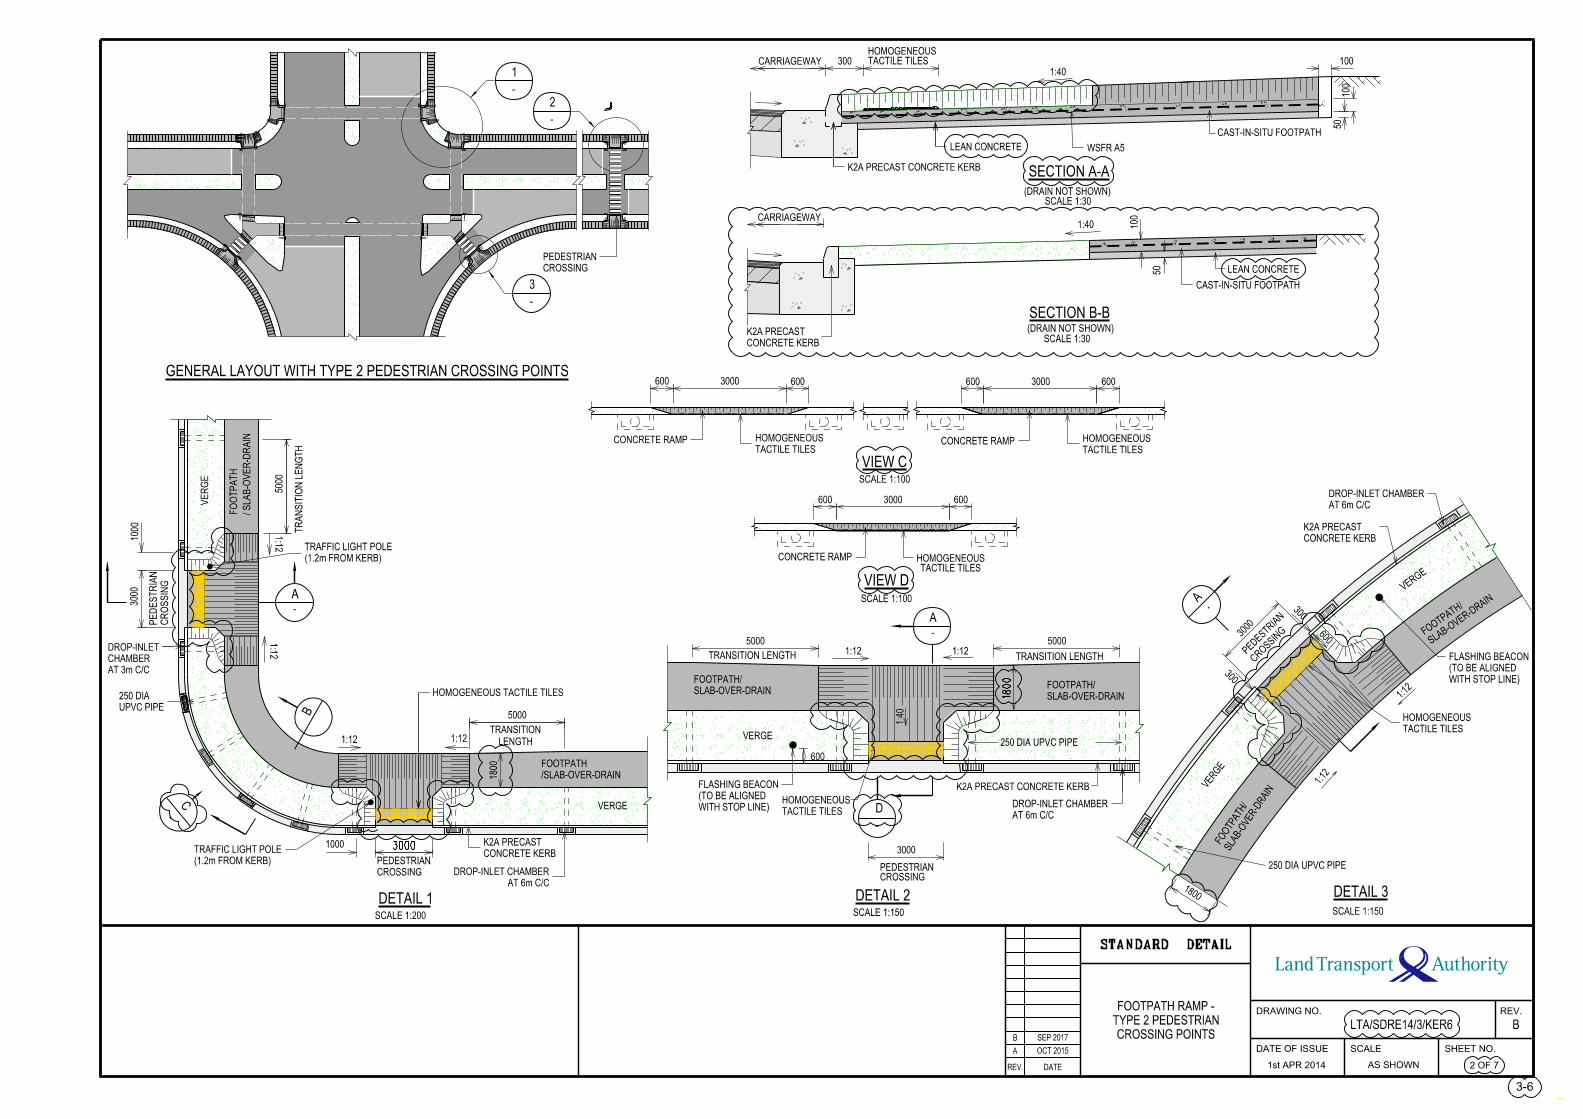
C
-
600
1800
CONCRETE RAMP CONCRETE RAMP
SCALE 1:100
VIEW CTACTILE TILES
HOMOGENEOUS
TACTILE TILES
HOMOGENEOUS
600 3000600 6003000600
STANDARD DETAIL
REV. DATE
DRAWING NO.
DATE OF ISSUE
1st APR 2014
SCALE SHEET NO.
REV.
B
100
LEAN CONCRETE50
CARRIAGEWAY
SCALE 1:30
SECTION B-B
CAST-IN-SITU FOOTPATH
CONCRETE KERB
K2A PRECAST
1:40
(DRAIN NOT SHOWN)
3000
TRANSITION
LENGTH
1:12
1:12 1:12
1:12
1000
1000
/SLAB-OVER-DRAIN
FOOTPATH
CROSSING
PEDESTRIAN
CR
OS
SIN
G
PE
DE
ST
RIA
N
SCALE 1:200
DETAIL 1
TR
AN
SITIO
N L
EN
GT
H
/ S
LA
B-O
VE
R-D
RAIN
AT 6m C/C
DROP-INLET CHAMBER
(1.2m FROM KERB)
TRAFFIC LIGHT POLE
A
B
(1.2m FROM KERB)
TRAFFIC LIGHT POLE
-
CONCRETE KERB
K2A PRECAST
HOMOGENEOUS TACTILE TILES
VE
RG
E
FO
OTP
AT
H
VERGE
1:40
5000
3000
5000
1800
AT 3m C/C
CHAMBER
DROP-INLET
UPVC PIPE
250 DIA
(NOT TO SCALE)
CROSSING
PEDESTRIAN
GENERAL LAYOUT WITH TYPE 2 PEDESTRIAN CROSSING POINTS
-
1
-
2
-
3
CARRIAGEWAY
SCALE 1:30
CAST-IN-SITU FOOTPATH
SECTION A-A
(DRAIN NOT SHOWN)
WSFR A5LEAN CONCRETE
300 TACTILE TILESHOMOGENEOUS
K2A PRECAST CONCRETE KERB
1:40
100
100
50
1800
DETAIL 2SCALE 1:150
SLAB-OVER-DRAIN
FOOTPATH/
VERGE
SLAB-OVER-DRAIN
FOOTPATH/
TRANSITION LENGTH
1:4
0
1:12 1:12TRANSITION LENGTH
CROSSINGPEDESTRIAN
TACTILE TILES
HOMOGENEOUSD
-
A
-
WITH STOP LINE)
(TO BE ALIGNED
FLASHING BEACON K2A PRECAST CONCRETE KERB
250 DIA UPVC PIPE
5000 5000
3000
AT 6m C/C
DROP-INLET CHAMBER
DETAIL 3
SCALE 1:150
SLA
B-O
VER-D
RAIN
FO
OTPATH/
VERGE
CROSSIN
G
PEDES
TRIA
N
SLAB-
OVER-DRAI
N
FOOTPATH/
VERGE
1:12
1:12
300
300
3000
250 DIA UPVC PIPE
AT 6m C/C
DROP-INLET CHAMBER
WITH STOP LINE)
(TO BE ALIGNED
FLASHING BEACON
600
CONCRETE KERB
K2A PRECAST
TACTILE TILES
HOMOGENEOUS
CROSSING POINTS
TYPE 2 PEDESTRIAN
FOOTPATH RAMP -
LTA/SDRE14/3/KER6
AS SHOWN 2 OF 7
3-6
A OCT 2015
B SEP 2017
A-
SCALE 1:100
VIEW D
CONCRETE RAMP
TACTILE TILESHOMOGENEOUS
3000 600600
LTA_CORIASQD
Text Box
CHAPTER 3 - MAIN PAGE
LTA_CORIASQD
Text Box
NEXT
LTA_CORIASQD
Text Box
PREVIOUS
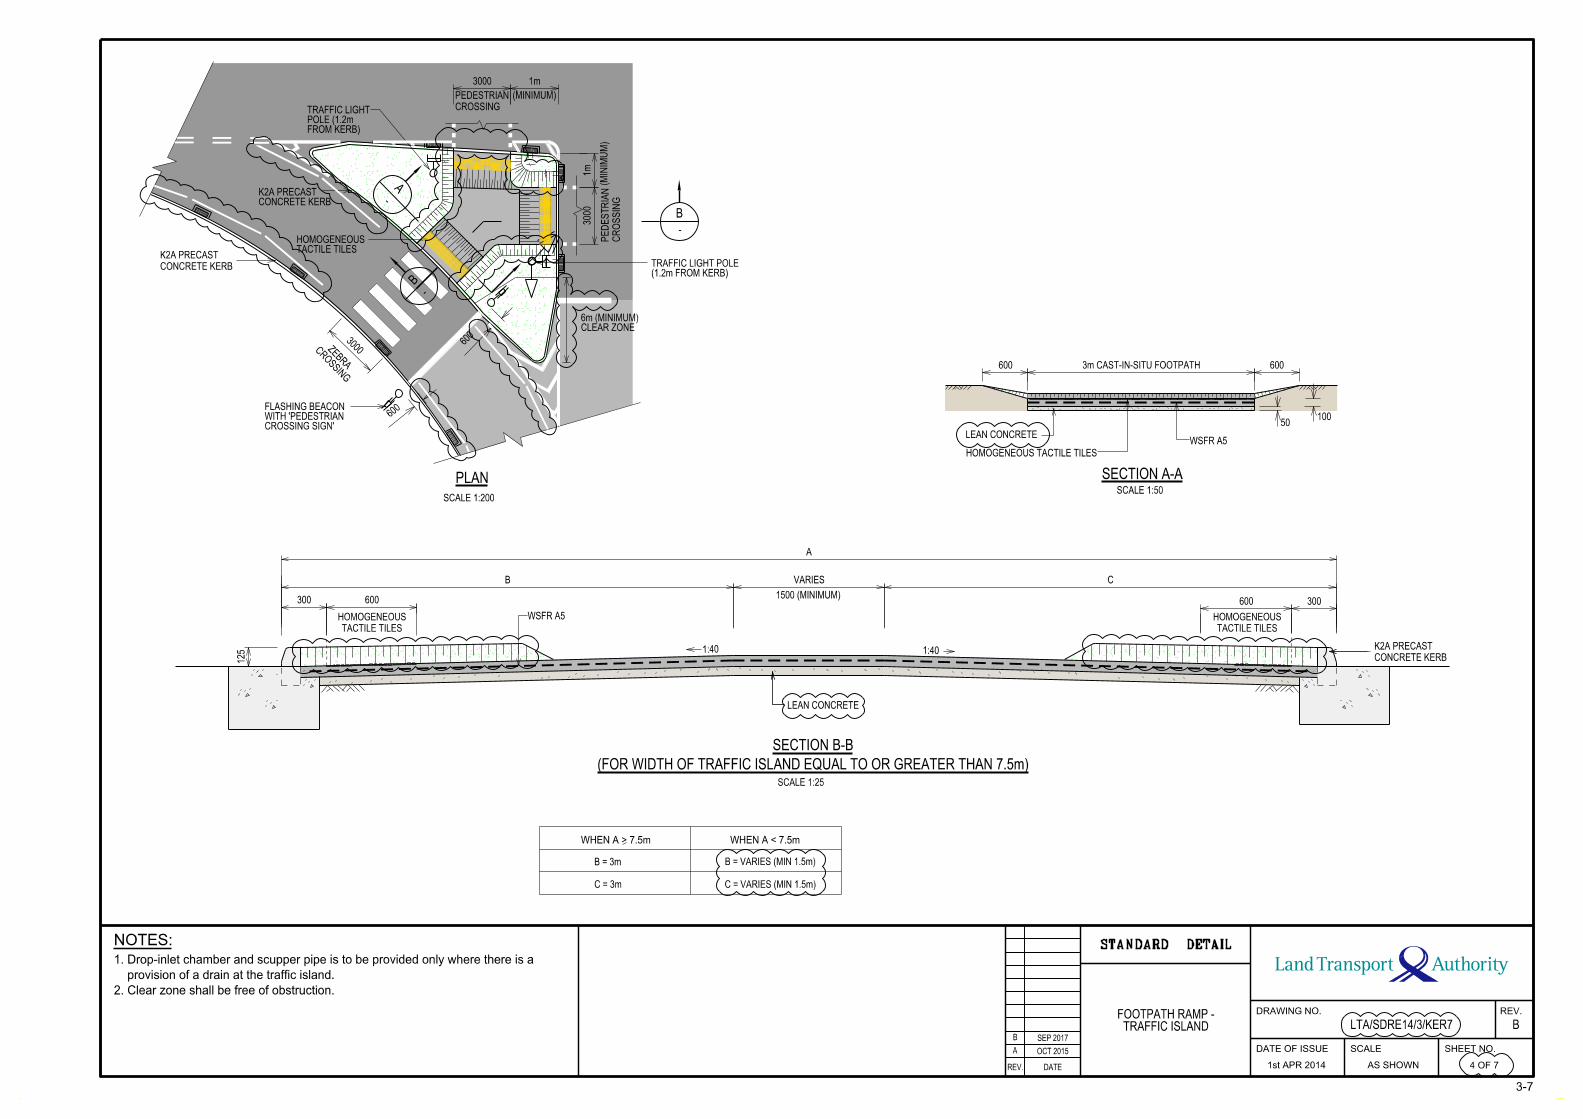
STANDARD DETAIL
REV. DATE
DRAWING NO.
DATE OF ISSUE
1st APR 2014
SCALE SHEET NO.
REV.
B
NOTES:
TACTILE TILES
HOMOGENEOUS
TACTILE TILES
HOMOGENEOUS
WHEN A < 7.5m
LEAN CONCRETE
SCALE 1:25
1500 (MINIMUM)
B = 3m
C = 3m
(FOR WIDTH OF TRAFFIC ISLAND EQUAL TO OR GREATER THAN 7.5m)
SECTION B-B
CONCRETE KERB
K2A PRECAST1:401:40
B
300 600 600 300
A
C
125
VARIES
WSFR A5
WHEN A > 7.5m
B = VARIES (MIN 1.5m)
C = VARIES (MIN 1.5m)
3000
CR
OS
SIN
G
PE
DE
ST
RIA
N
CROSSIN
G
ZEBRA
600
600
SCALE 1:200
TACTILE TILESHOMOGENEOUS
(MINIM
UM)
(MINIMUM)
CLEAR ZONE6m (MINIMUM)
FROM KERB)POLE (1.2mTRAFFIC LIGHT
CROSSING SIGN'WITH 'PEDESTRIANFLASHING BEACON
CROSSING
PEDESTRIAN
PLAN
-A
-
B
(1.2m FROM KERB)TRAFFIC LIGHT POLE
CONCRETE KERBK2A PRECAST
CONCRETE KERB
K2A PRECAST
B
-
VERGE
VERGE
3000
3000
1m
1m
10050
WSFR A5
HOMOGENEOUS TACTILE TILES
SECTION A-ASCALE 1:50
3m CAST-IN-SITU FOOTPATH600 600
LEAN CONCRETE
A OCT 2015
B SEP 2017
TRAFFIC ISLANDFOOTPATH RAMP -
LTA/SDRE14/3/KER7
4 OF 7
3-7
AS SHOWN
2. Clear zone shall be free of obstruction.
provision of a drain at the traffic island.
1. Drop-inlet chamber and scupper pipe is to be provided only where there is a
LTA_CORIASQD
Text Box
CHAPTER 3 - MAIN PAGE
LTA_CORIASQD
Text Box
NEXT
LTA_CORIASQD
Text Box
PREVIOUS

SIDE ROAD
FOOTPATH RAMP -LTA/SDRE14/3/KER8
A OCT 2015
B SEP 2017
5 OF 7
3-8
AS SHOWN
STANDARD DETAIL
REV. DATE
DRAWING NO.
DATE OF ISSUE
1st APR 2014
SCALE SHEET NO.
REV.
B
AT SIDE ROAD
(NTS)
VERGE
1:40
SIDE ROAD
TACTILE TILES
HOMOGENEOUS
VERGE
1:121:1
2
FOOTPATH
DRAIN/
VERGE
FOOTPATHDRAIN/
600
600
300
600
AT 6m C/C
DROP-INLET CHAMBER
E
-
1:40
1800
MAIN R
OAD
VIEW E
1 : 40
CONCRETE RAMP
TACTILE TILES
HOMOGENEOUS
SCALE 1:25
VERGE
FALL
MAINVERGE FOOTPATH ROAD
LTA_CORIASQD
Text Box
CHAPTER 3 - MAIN PAGE
LTA_CORIASQD
Text Box
NEXT
LTA_CORIASQD
Text Box
PREVIOUS

DRIVEWAY
FOOTPATH RAMP -LTA/SDRE14/3/KER9
A OCT 2015
B SEP 2017
6 OF 7
3-9
AS SHOWN
STANDARD DETAIL
REV. DATE
DRAWING NO.
DATE OF ISSUE
1st APR 2014
SCALE SHEET NO.
REV.
B
600
DRIVEWAY 600
300
300
DRAIN / FOOTPATH
VERGE
AT 6m C/C
DROP-INLET CHAMBER
AT DRIVEWAY
(NTS)
1:12
1:40
1:40
ABUTTING DEVELOPMENT FENCE / WALL
F
-
1800
TACTILE TILES
HOMOGENEOUS
MAIN R
OAD
FALL
VIEW FSCALE 1:25
TACTILE TILES
HOMOGENEOUS
VERGE
1 : 40ABUTTING DEVELOPMENT FENCE / WALL
FOOTPATH MAIN ROAD
LTA_CORIASQD
Text Box
CHAPTER 3 - MAIN PAGE
LTA_CORIASQD
Text Box
NEXT
LTA_CORIASQD
Text Box
PREVIOUS

LTA/SDRE14/3/KER10OPEN DRAIN
FOOTPATH BESIDE
FOOTPATH RAMP -
A OCT 2015
B SEP 2017
1. Railings are to be provided next to open drain.
7 OF 7
3-10
AS SHOWN
STANDARD DETAIL
REV. DATE
DRAWING NO.
DATE OF ISSUE
1st APR 2014
SCALE SHEET NO.
REV.
B
NOTES:
OPEN DRAIN
DRIVEWAY 600
300
300
600
VERGE
(NTS)
AT DRIVEWAY
1:12
1:40
FOOTPATH
AT 6m C/C
DROP-INLET CHAMBER
TYPE 'B' RAILING
1800
TACTILE TILES
HOMOGENEOUS
MAIN R
OAD
VERGE
VIEW GSCALE 1:25
1 : 40
TACTILE TILES
HOMOGENEOUS
VARIES
FALL
DRAIN
600
125
FOOTPATH MAIN ROAD
G
-
TYPE 'B' RAILING
LTA_CORIASQD
Text Box
CHAPTER 3 - MAIN PAGE
LTA_CORIASQD
Text Box
NEXT
LTA_CORIASQD
Text Box
PREVIOUS

SCALE 1:5
TACTILE TILES
HOMOGENEOUS
HOMOGENEOUS TACTILE TILES
PLAN SECTION A-A
35
25 15
50
300
25
15
300
5 12
A
-
KERB CUT RAMP
SCALE 1:100
CROSSING
PEDESTRIAN
CR
OS
SIN
G
PE
DE
ST
RIA
N
TACTILE TILE
TACTILE TILE
Minimum 2 set of tactile tiles to be laid for both side of type e ramp
NOTE:
(CURVE KERB CUT RAMP)
TYPE E - ARRANGEMENT OF TACTILE TILES
300
300
300
MIN 1m
MIN. 1 m
300
KERB
BERAIS
ED
WILL
TACTILE TILE600mm
TACTILE TILE600mm
SCALE 1:100 SCALE 1:100
KERB CUT RAMPCARRIAGEWAY
KERB CUT RAMP PEDESTRIAN CROSSING
SCALE 1:100
KERB CUT RAMP
CARRIAGEWAY
SCALE 1:100
KERB CUT RAMPTACTILE TILE
(CURVE KERB CUT RAMP)
TYPE C - ARRANGEMENT OF TACTILE TILES
(CURVE KERB CUT RAMP)
TYPE D - ARRANGEMENT OF TACTILE TILES
(CURVE KERB CUT RAMP)
TYPE B - ARRANGEMENT OF TACTILE TILES
(STRAIGHT KERB CUT RAMP)
TYPE A - ARRANGEMENT OF TACTILE TILES
< 900 > 900
600mm TACTILE TILE
300
300300
300
CARRIAGEWAY
300
300
LTA/SDRE14/3/KER12OF TACTILE TILES
TILES AND ARRANGEMENT
HOMOGENEOUS TACTILE
A OCT 2015
B SEP 2017
3-12
AS SHOWN 1 OF 1
3. All homogeneous unglazed ceramic tiles shall comply to ISO 13006:2012.
- Compressive strength : 131 MN/m² per ASTM 0170
- Modules of rupture : 10.34 MN/m² per ASTM C99
- Water absorption : 0.4% maximum per ASTM C72
2. All homogeneous tiles shall comply with the following:
footpath ramp.
1. The tactile tiles shall have a minimum of 30% luminance contrast with the
footpath is to be flushed.
by a green verge or kerb, and with footpath length less than 10m, the whole
6. For closely-spaced driveways with footpath separated from the carriageway
is to be provided without any tactile tiles.
5. For driveways leading to two or less individual house units, a flushed kerb
pendulum test (Classification V).
4. Tactile tiles shall comply to SS485:2011 for skid resistance based on wet STANDARD DETAIL
REV. DATE
DRAWING NO.
DATE OF ISSUE
1st APR 2014
SCALE SHEET NO.
REV.
B
NOTES:
LTA_CORIASQD
Text Box
CHAPTER 3 - MAIN PAGE
LTA_CORIASQD
Text Box
NEXT
LTA_CORIASQD
Text Box
PREVIOUS
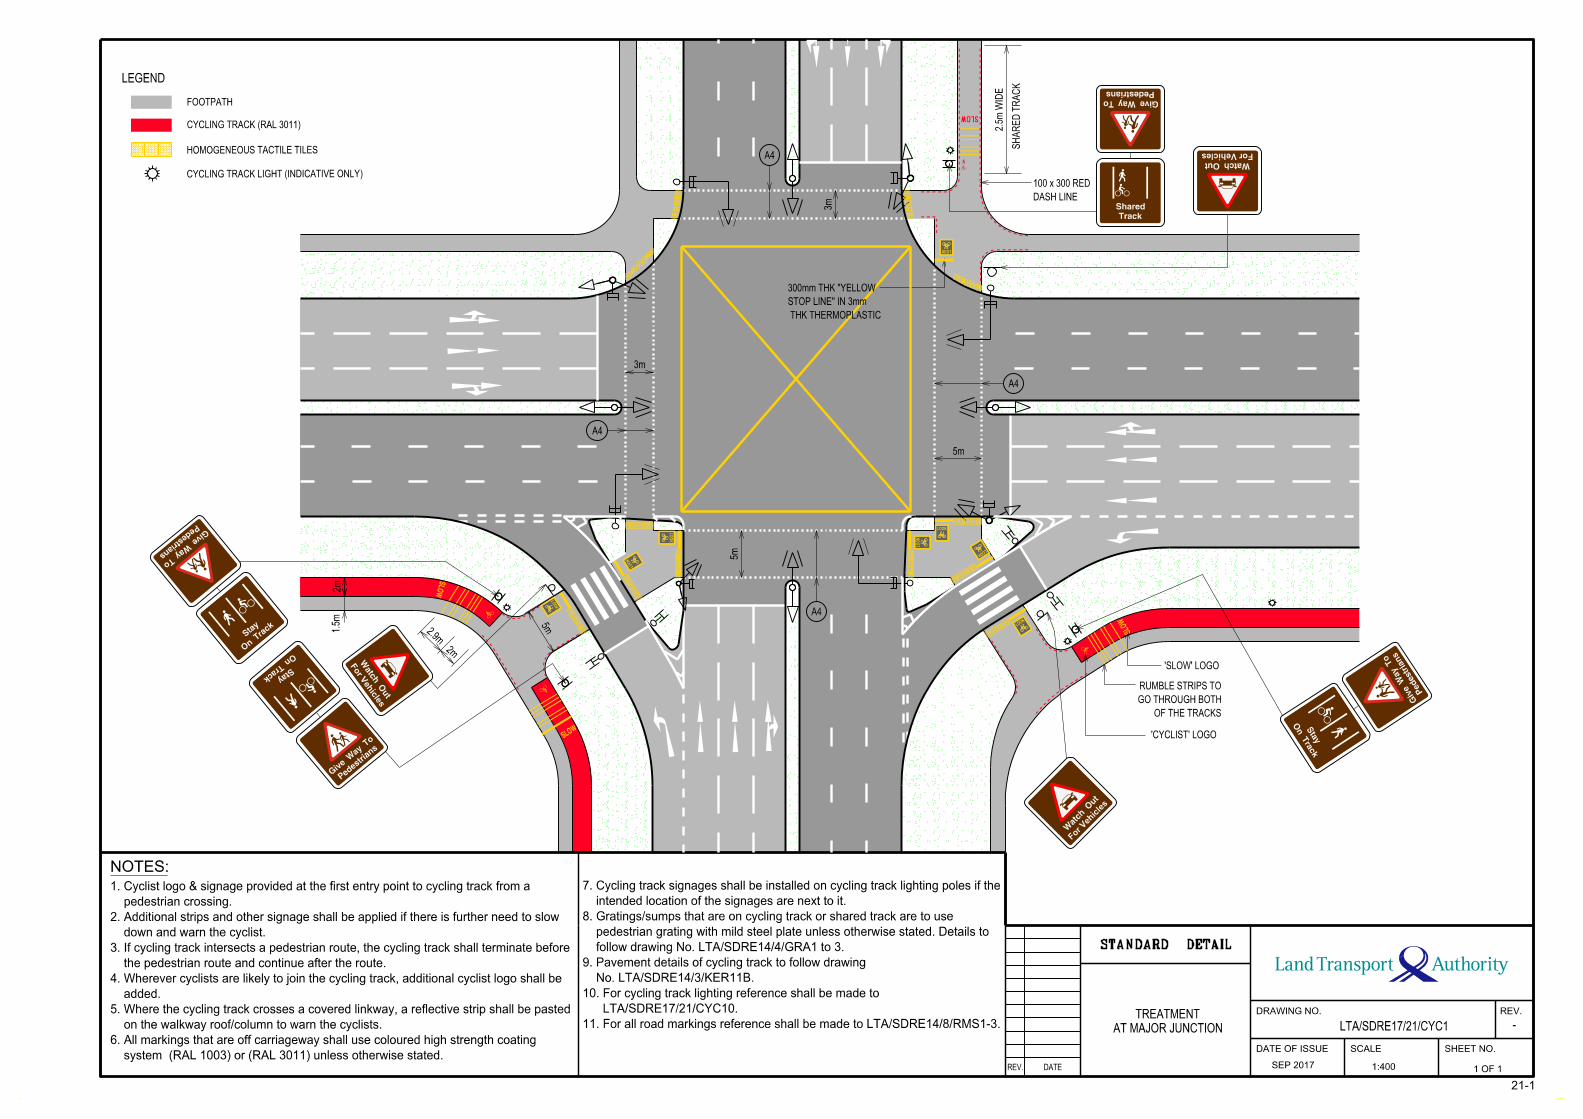
HOMOGENEOUS TACTILE TILES
FOOTPATH
CYCLING TRACK LIGHT (INDICATIVE ONLY)
LEGEND
LTA/SDRE17/21/CYC1
1:400 1 OF 1
21-1
CYCLING TRACK (RAL 3011)
AT MAJOR JUNCTION
TREATMENT
NOTES:
system (RAL 1003) or (RAL 3011) unless otherwise stated.
6. All markings that are off carriageway shall use coloured high strength coating
on the walkway roof/column to warn the cyclists.
5. Where the cycling track crosses a covered linkway, a reflective strip shall be pasted
added.
4. Wherever cyclists are likely to join the cycling track, additional cyclist logo shall be
the pedestrian route and continue after the route.
3. If cycling track intersects a pedestrian route, the cycling track shall terminate before
down and warn the cyclist.
2. Additional strips and other signage shall be applied if there is further need to slow
pedestrian crossing.
1. Cyclist logo & signage provided at the first entry point to cycling track from a
11. For all road markings reference shall be made to LTA/SDRE14/8/RMS1-3.
LTA/SDRE17/21/CYC10.
10. For cycling track lighting reference shall be made to
No. LTA/SDRE14/3/KER11B.
9. Pavement details of cycling track to follow drawing
follow drawing No. LTA/SDRE14/4/GRA1 to 3.
pedestrian grating with mild steel plate unless otherwise stated. Details to
8. Gratings/sumps that are on cycling track or shared track are to use
intended location of the signages are next to it.
7. Cycling track signages shall be installed on cycling track lighting poles if the
STANDARD DETAIL
REV.
-
REV. DATE
DRAWING NO.
DATE OF ISSUE SCALE SHEET NO.
SEP 2017
SLOW
Give W
ay To
Pedestrians
Stay
On
Trac
k
Stay
On Track
Give
Way T
o
Ped
estrians
Sta
y
On Track
Give
Way To
Pedestrians
Give Way To
Pedestrians
SLOW
SLO
W
SLO
W
5m
2m
2.9m
1.5
m2
m
5m
3m
3m
5m
SH
AR
ED T
RA
CK
2.5
m W
IDE
THK THERMOPLASTIC
STOP LINE" IN 3mm
300mm THK "YELLOW
'CYCLIST' LOGO
OF THE TRACKS
GO THROUGH BOTH
RUMBLE STRIPS TO
'SLOW' LOGO
DASH LINE
100 x 300 RED
LOOK
Shared
Track
LOOK
LOOK
LOOK
LO
OK
LOOK
LOOK
LO
OK
A4
A4
A4
A4
Watch Out
Watch Out
Watch O
ut
LTA_CORIASQD
Text Box
CHAPTER 21 - MAIN PAGE
LTA_CORIASQD
Text Box
NEXT
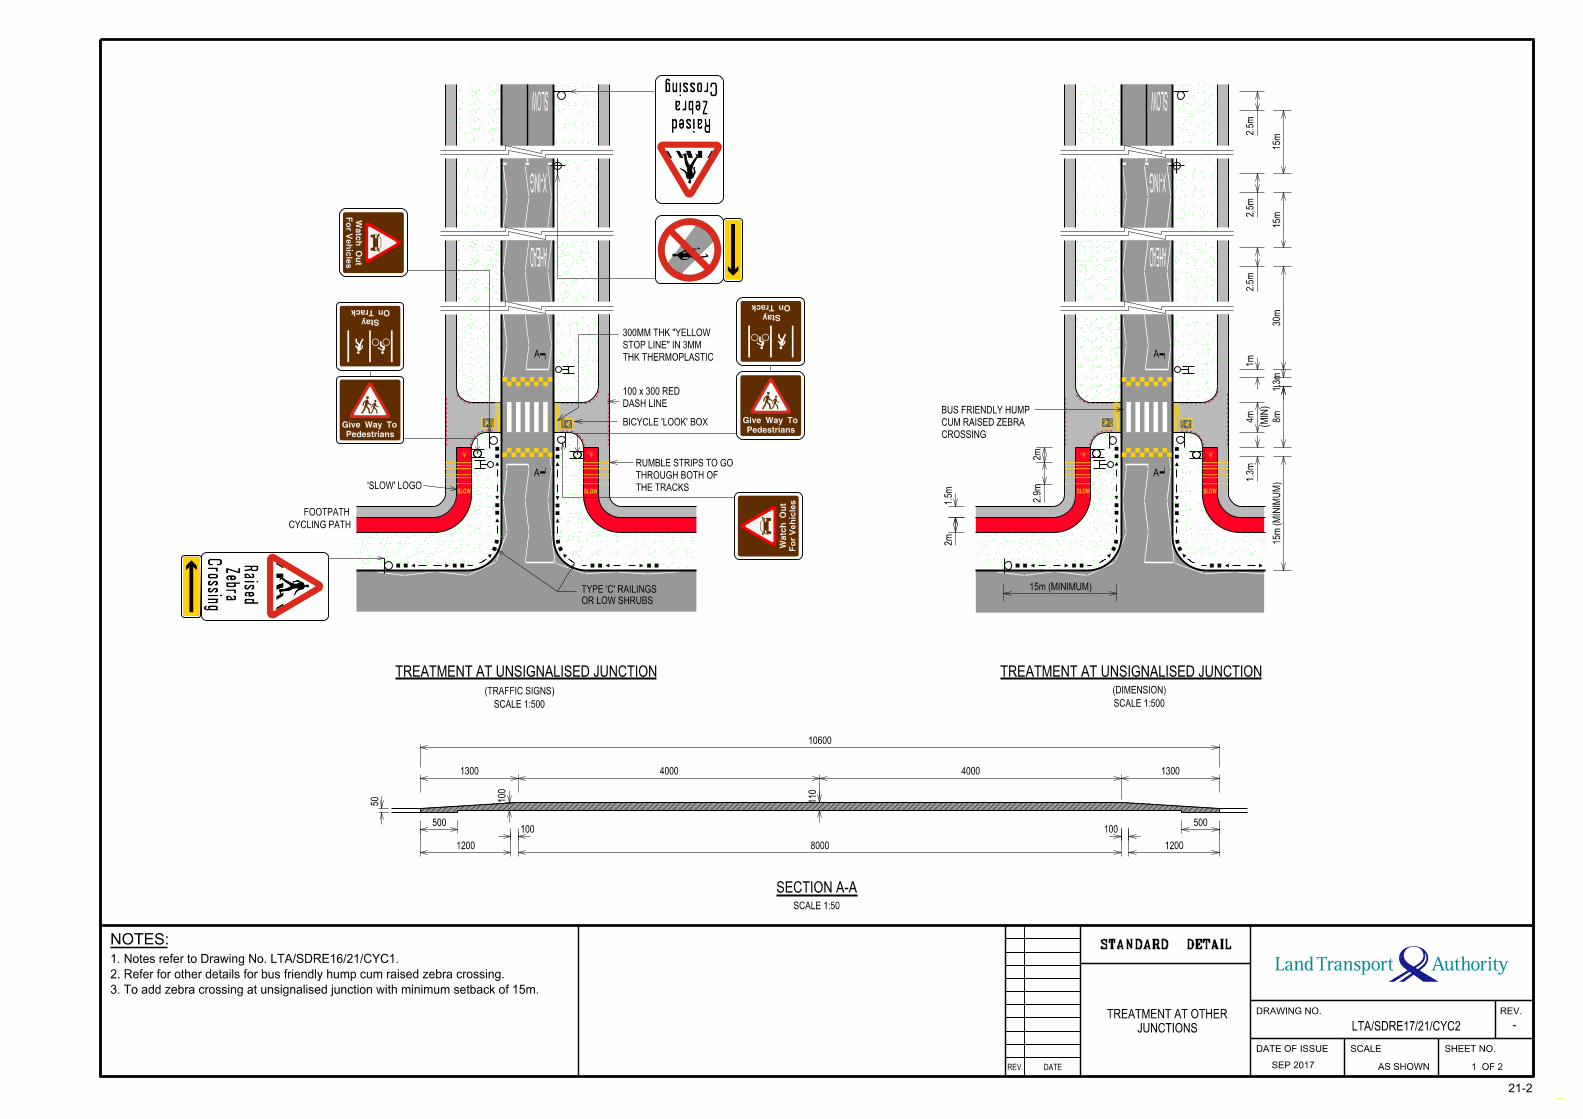
LO
OK
LO
OK
AHEAD
X-ING
SLOW
SLOW SLOW
A
A
LO
OK
LO
OK
LTA/SDRE17/21/CYC2
AS SHOWN
21-2
JUNCTIONS
TREATMENT AT OTHER
1 OF 2
3. To add zebra crossing at unsignalised junction with minimum setback of 15m.
2. Refer for other details for bus friendly hump cum raised zebra crossing.
1. Notes refer to Drawing No. LTA/SDRE16/21/CYC1.
STANDARD DETAIL
REV.
-
REV. DATE
DRAWING NO.
DATE OF ISSUE SCALE SHEET NO.
SEP 2017
NOTES:
AHEAD
X-ING
SLOW
SLOW SLOW
FOOTPATH
CYCLING PATH
A
A
SCALE 1:500
TREATMENT AT UNSIGNALISED JUNCTION
(TRAFFIC SIGNS)
'SLOW' LOGO
OR LOW SHRUBS
TYPE 'C' RAILINGS
BICYCLE 'LOOK' BOX
THE TRACKS
THROUGH BOTH OF
RUMBLE STRIPS TO GO
Give Way To
Pedestrians
Stay
On Track
THK THERMOPLASTIC
STOP LINE" IN 3MM
300MM THK "YELLOW
Give Way To
Pedestrians
Stay
On Track
DASH LINE
100 x 300 RED
Watc
h
Out
Watc
h
Out
SCALE 1:500
TREATMENT AT UNSIGNALISED JUNCTION
(DIMENSION)
CROSSING
CUM RAISED ZEBRA
BUS FRIENDLY HUMP
2.9
m2
m
1.5
m2
m
15m (MINIMUM)
8m
4m
(MIN)
1.3
m
30
m15
m15
m1.3
m
1m
2.5
m2.5
m2.5
m
15
m (
MINIM
UM)
SCALE 1:50
SECTION A-A
50
500
1200
1300400040001300
10600
8000 1200
500100
100
110
100
LTA_CORIASQD
Text Box
CHAPTER 21 - MAIN PAGE
LTA_CORIASQD
Text Box
NEXT
LTA_CORIASQD
Text Box
PREVIOUS
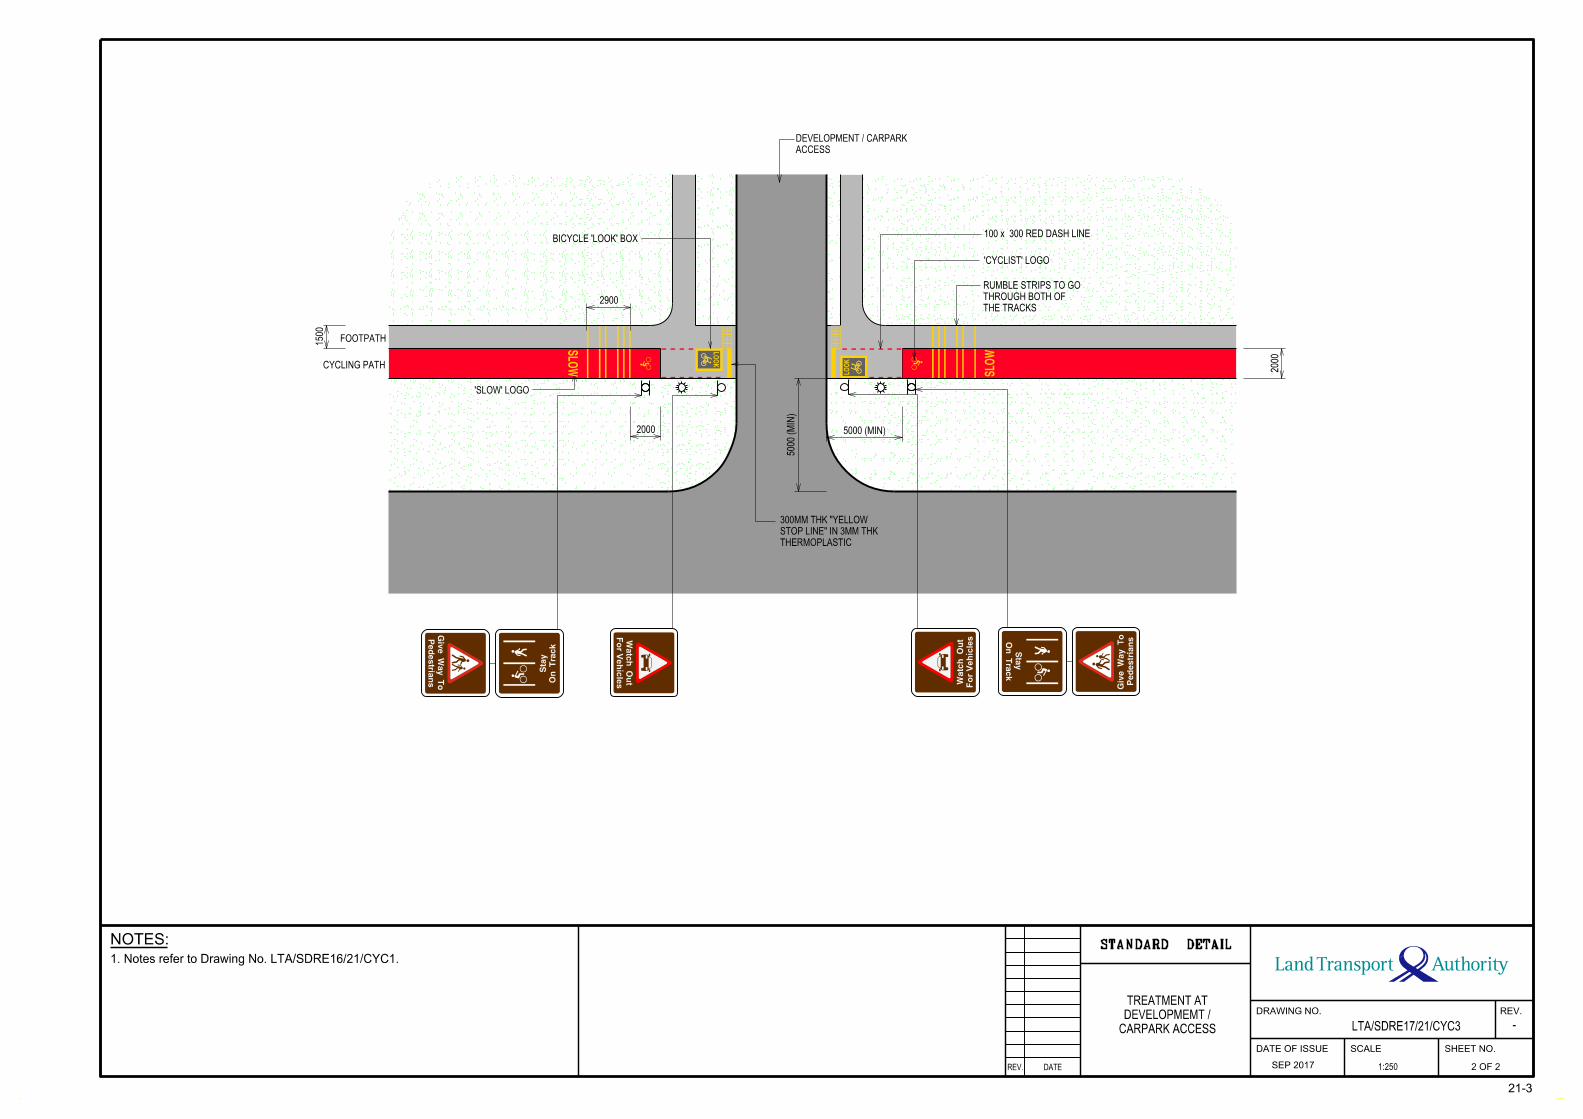
Watc
h
Out
LTA/SDRE17/21/CYC3
21-3
CARPARK ACCESS
DEVELOPMEMT /
TREATMENT AT
2 OF 21:250
1. Notes refer to Drawing No. LTA/SDRE16/21/CYC1.
STANDARD DETAIL
REV.
-
REV. DATE
DRAWING NO.
DATE OF ISSUE SCALE SHEET NO.
SEP 2017
NOTES:
SLO
W
SL
OW
LO
OK
LO
OK
Giv
e
Way To
Pedestria
ns
Sta
y
On Tra
ck S
tay
On Tra
ck
Giv
e
Way To
Pedestria
ns
'SLOW' LOGO
CYCLING PATH
FOOTPATH
THE TRACKS
THROUGH BOTH OF
RUMBLE STRIPS TO GO
'CYCLIST' LOGO
100 x 300 RED DASH LINEBICYCLE 'LOOK' BOX
THERMOPLASTIC
STOP LINE" IN 3MM THK
300MM THK "YELLOW
1500
2900
2000
5000 (
MIN)
5000 (MIN)
2000
ACCESS
DEVELOPMENT / CARPARK
Watc
h
Out
LTA_CORIASQD
Text Box
CHAPTER 21 - MAIN PAGE
LTA_CORIASQD
Text Box
NEXT
LTA_CORIASQD
Text Box
PREVIOUS
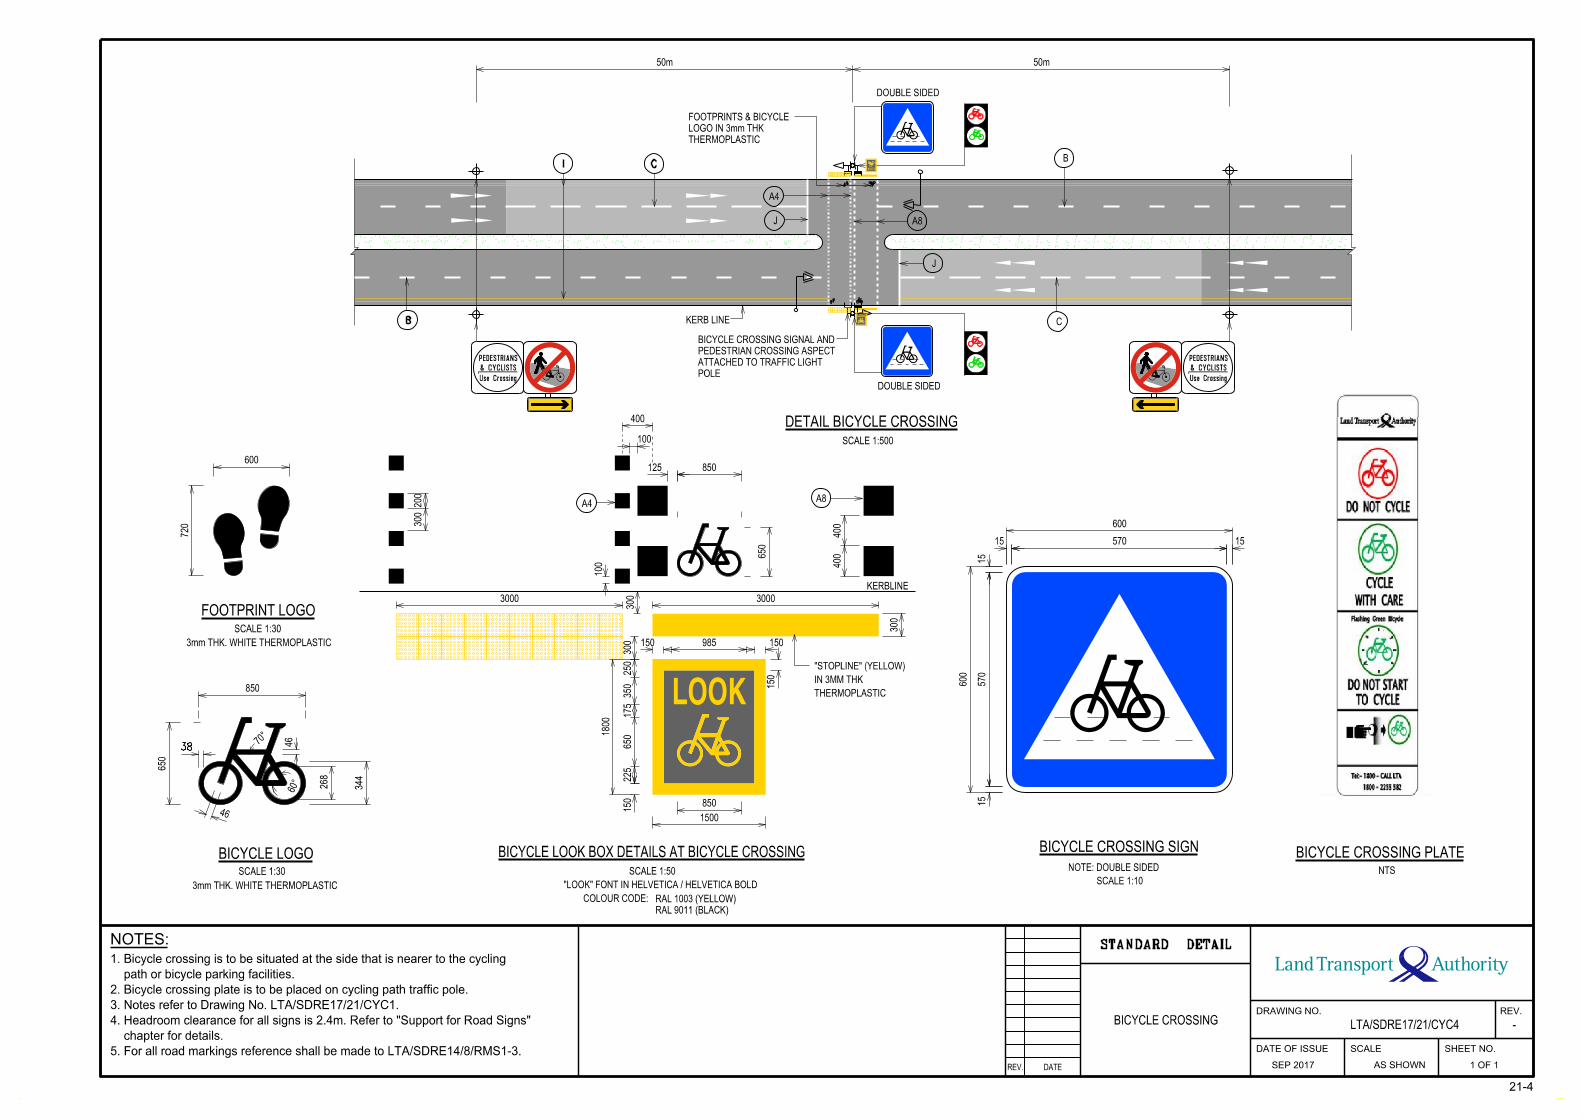
BICYCLE CROSSING PLATE
NTS
LTA/SDRE17/21/CYC4
21-4
1 OF 1
BICYCLE CROSSING
AS SHOWN
5. For all road markings reference shall be made to LTA/SDRE14/8/RMS1-3.
chapter for details.
4. Headroom clearance for all signs is 2.4m. Refer to "Support for Road Signs"
3. Notes refer to Drawing No. LTA/SDRE17/21/CYC1.
2. Bicycle crossing plate is to be placed on cycling path traffic pole.
path or bicycle parking facilities.
1. Bicycle crossing is to be situated at the side that is nearer to the cycling
STANDARD DETAIL
REV.
-
REV. DATE
DRAWING NO.
DATE OF ISSUE SCALE SHEET NO.
SEP 2017
NOTES:
B
I C LOOK
LOOK
50m50m
THERMOPLASTIC
LOGO IN 3mm THK
FOOTPRINTS & BICYCLE
DOUBLE SIDED
A4
J A8
J
KERB LINE
POLE
ATTACHED TO TRAFFIC LIGHT
PEDESTRIAN CROSSING ASPECT
BICYCLE CROSSING SIGNAL AND
DETAIL BICYCLE CROSSING
SCALE 1:500
DOUBLE SIDED
C
B
850
985
3000
LOOK
225
650
175
350
250
RAL 9011 (BLACK)
RAL 1003 (YELLOW)COLOUR CODE:
"LOOK" FONT IN HELVETICA / HELVETICA BOLD
SCALE 1:50
BICYCLE LOOK BOX DETAILS AT BICYCLE CROSSING
KERBLINE
A8A4
1500
300
150
650
300
850
150 150
150
100
125
100
300
3000
400
THERMOPLASTIC
IN 3MM THK
"STOPLINE" (YELLOW)
1800
300
200
400
400
268
344
38
FOOTPRINT LOGO
SCALE 1:30
3mm THK. WHITE THERMOPLASTIC
BICYCLE LOGO
SCALE 1:30
3mm THK. WHITE THERMOPLASTIC
600
720
850
650
70°
46
46
60°
BICYCLE CROSSING SIGN
NOTE: DOUBLE SIDED
SCALE 1:10
600
570
600
57015
15
15
15
LTA_CORIASQD
Text Box
CHAPTER 21 - MAIN PAGE
LTA_CORIASQD
Text Box
NEXT
LTA_CORIASQD
Text Box
PREVIOUS

21-5
LTA/SDRE17/21/CYC5
1:250 1 OF 1
SHARED TRACK
2. Notes refer to Drawing No. LTA/SDRE16/21/CYC1.
approval.
1. Only applicable when there are site constraint and subject to authorities
STANDARD DETAIL
REV.
-
REV. DATE
DRAWING NO.
DATE OF ISSUE SCALE SHEET NO.
SEP 2017
NOTES:
2000
Sta
y
On Tra
ckS
hare
d
Tra
ck
Share
d
Tra
ck
SLO
W
SL
OW
Sta
y
On Tra
ck
PATH SWAPS SIDES WITH THE PEDESTRIAN PATH
TRANSITION AREAS WHERE THE CYCLE
CYCLIST LOGO
PEDESTRIAN &
LOGO
'CYCLIST'
LOGO
'SLOW'
2900
2000
1500
THE TRACKS
THROUGH BOTH OF
RUMBLE STRIPS TO GO
DASH LINE
100 x 300 RED
5000 2000 2900
Share
d
Tra
ckS
tay
On Tra
ck
Sta
y
On Tra
ckS
hare
d
Tra
ck
SL
OW
SLO
W
2000
1500
SHARED TRACK
MIN 2500
'SLOW' LOGO
OF THE TRACKS
GO THROUGH BOTH
RUMBLE STRIPS TO
'CYCLIST' LOGO
CYCLIST LOGO
PEDESTRIAN &
SHARED TRACK TREATMENT
DASH LINE
100 x 300 RED
LTA_CORIASQD
Text Box
CHAPTER 21 - MAIN PAGE
LTA_CORIASQD
Text Box
NEXT
LTA_CORIASQD
Text Box
PREVIOUS
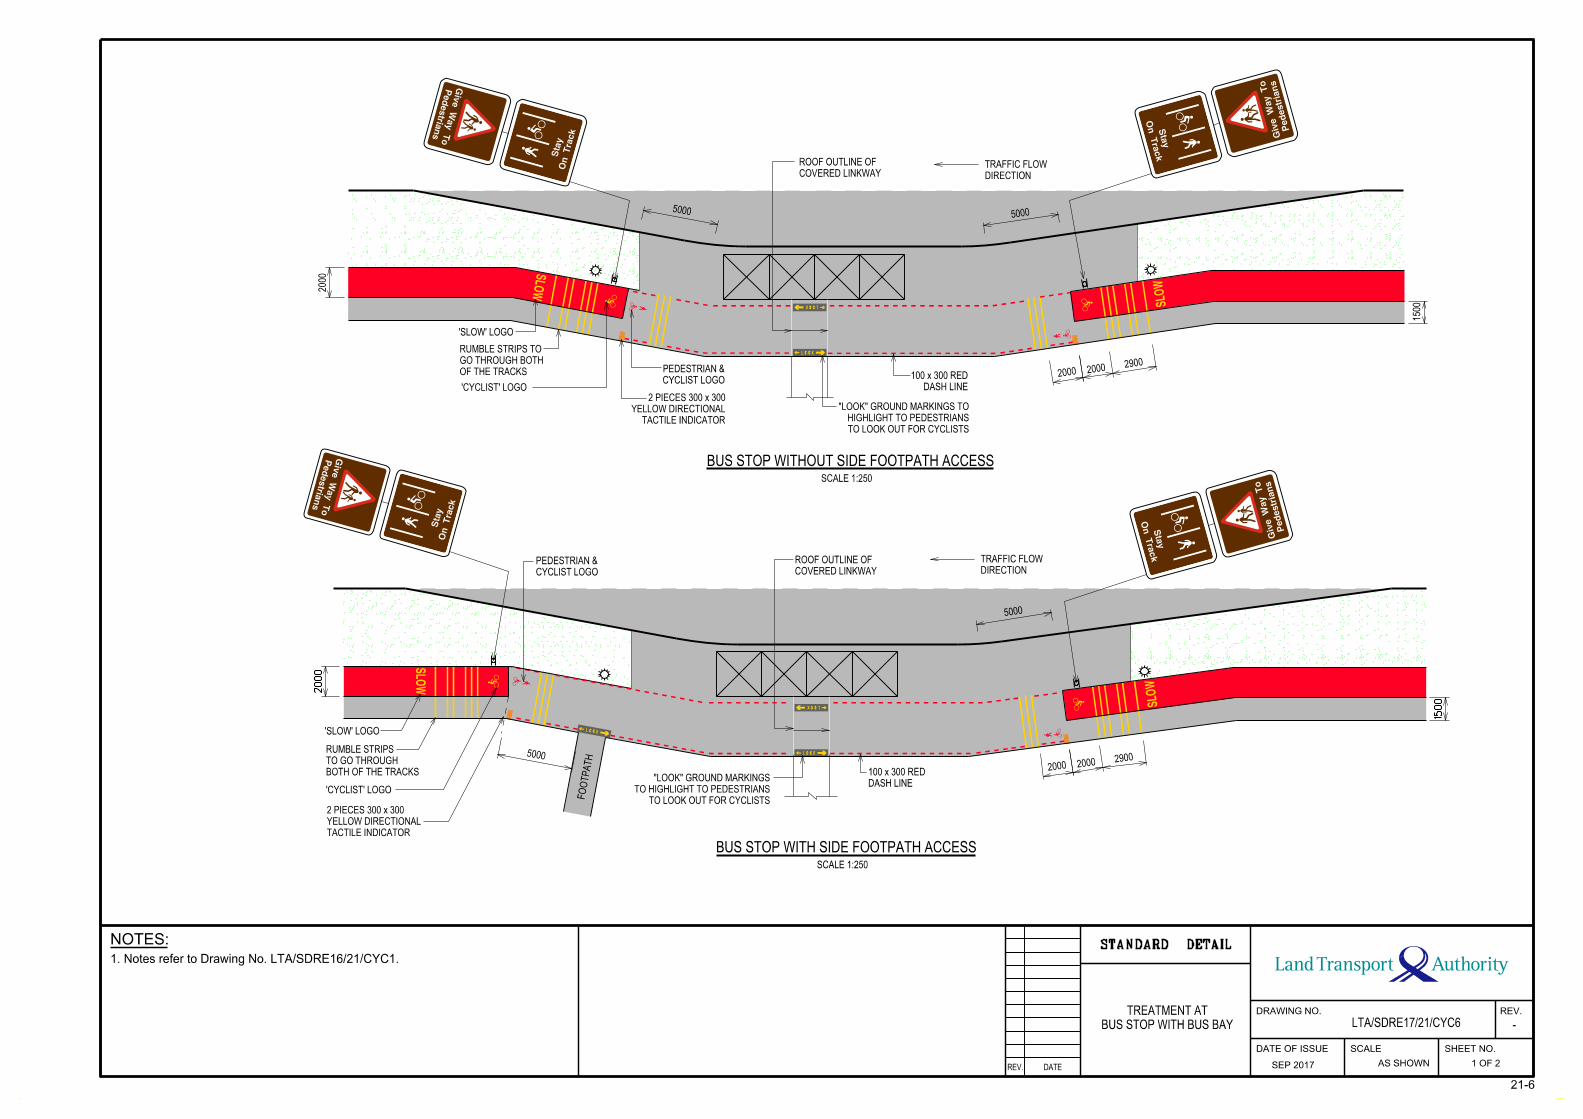
LTA/SDRE17/21/CYC6
21-6
AS SHOWN 1 OF 2
BUS STOP WITH BUS BAY
TREATMENT AT
1. Notes refer to Drawing No. LTA/SDRE16/21/CYC1.
STANDARD DETAIL
REV.
-
REV. DATE
DRAWING NO.
DATE OF ISSUE SCALE SHEET NO.
SEP 2017
NOTES:
SLO
W
SLO
W
Give
Way To
Pedestria
ns
Sta
yO
n Tra
ck
Sta
y
On Tra
ck
Give
Way To
Pedestria
ns
5000
COVERED LINKWAY
ROOF OUTLINE OF
DIRECTION
TRAFFIC FLOW
TO LOOK OUT FOR CYCLISTS
HIGHLIGHT TO PEDESTRIANS
"LOOK" GROUND MARKINGS TO
TACTILE INDICATOR
YELLOW DIRECTIONAL
2 PIECES 300 x 300
CYCLIST LOGO
PEDESTRIAN &OF THE TRACKS
GO THROUGH BOTH
RUMBLE STRIPS TO
'SLOW' LOGO
BUS STOP WITHOUT SIDE FOOTPATH ACCESS
SCALE 1:250
5000
2000
1500
20002900
2000
DASH LINE
100 x 300 RED
2000
1500
SLO
WSLO
W
Give
Way To
Pedestria
ns
Sta
yO
n Tra
ck
Sta
y
On Tra
ck
Give
Way To
Pedestria
ns
5000
5000
BUS STOP WITH SIDE FOOTPATH ACCESS
SCALE 1:250
TO LOOK OUT FOR CYCLISTS
TO HIGHLIGHT TO PEDESTRIANS
"LOOK" GROUND MARKINGS
TACTILE INDICATOR
YELLOW DIRECTIONAL
2 PIECES 300 x 300
'CYCLIST' LOGO
BOTH OF THE TRACKS
TO GO THROUGH
RUMBLE STRIPS
'SLOW' LOGO
FO
OTP
ATH
CYCLIST LOGO
PEDESTRIAN &COVERED LINKWAY
ROOF OUTLINE OFDIRECTION
TRAFFIC FLOW
20002900
2000
DASH LINE
100 x 300 RED
'CYCLIST' LOGO
LTA_CORIASQD
Text Box
CHAPTER 21 - MAIN PAGE
LTA_CORIASQD
Text Box
NEXT
LTA_CORIASQD
Text Box
PREVIOUS
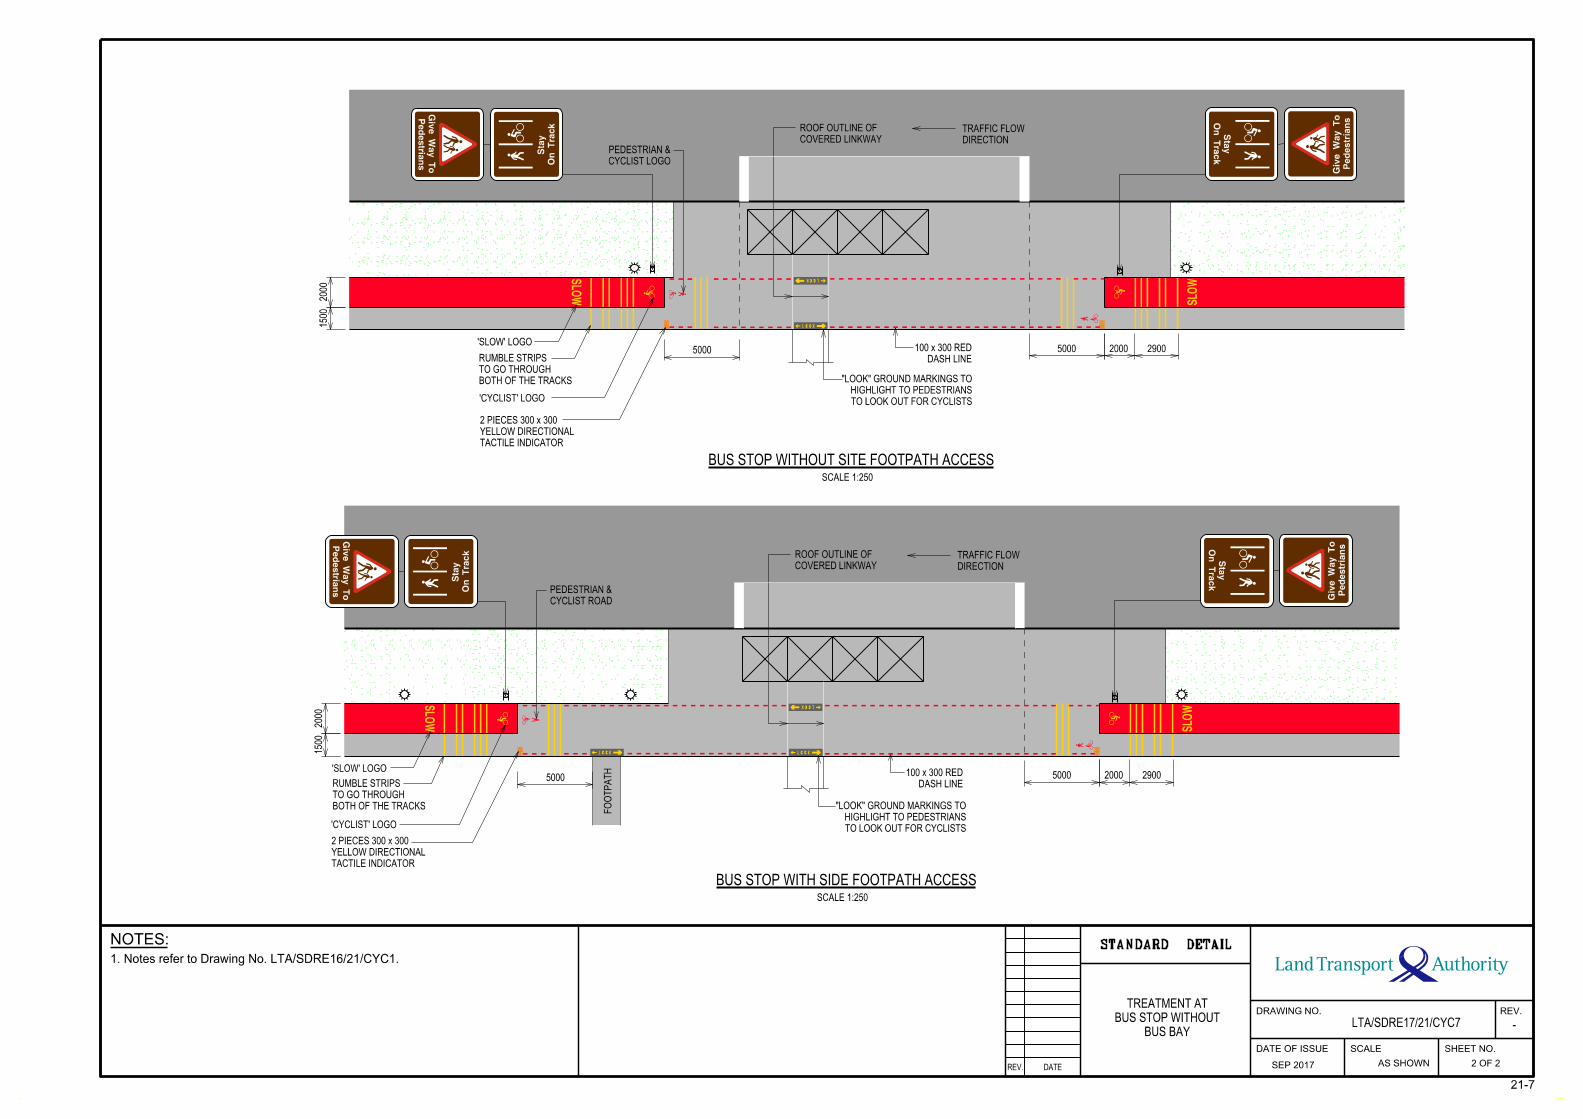
LTA/SDRE17/21/CYC7
21-7
AS SHOWN
BUS BAY
BUS STOP WITHOUT
TREATMENT AT
2 OF 2
1. Notes refer to Drawing No. LTA/SDRE16/21/CYC1.
STANDARD DETAIL
REV.
-
REV. DATE
DRAWING NO.
DATE OF ISSUE SCALE SHEET NO.
SEP 2017
NOTES:
SLO
W
SL
OW
Giv
e
Way To
Pedestria
ns
Sta
y
On Tra
ck
Sta
y
On Tra
ck
Giv
e
Way To
Pedestria
ns
COVERED LINKWAY
ROOF OUTLINE OF
DIRECTION
TRAFFIC FLOW
TO LOOK OUT FOR CYCLISTS
HIGHLIGHT TO PEDESTRIANS
"LOOK" GROUND MARKINGS TO
TACTILE INDICATOR
YELLOW DIRECTIONAL
2 PIECES 300 x 300
'CYCLIST' LOGO
BOTH OF THE TRACKS
TO GO THROUGH
RUMBLE STRIPS
'SLOW' LOGO
BUS STOP WITHOUT SITE FOOTPATH ACCESS
SCALE 1:250
5000 5000 29002000
2000
1500
DASH LINE
100 x 300 RED
SLO
W
SL
OW
Giv
e
Way To
Pedestria
ns
Sta
y
On Tra
ck
Sta
y
On Tra
ck
Giv
e
Way To
Pedestria
ns
5000
2000
1500
5000 29002000'SLOW' LOGO
BOTH OF THE TRACKS
TO GO THROUGH
RUMBLE STRIPS
'CYCLIST' LOGO
TACTILE INDICATOR
YELLOW DIRECTIONAL
2 PIECES 300 x 300
FO
OTP
ATH
BUS STOP WITH SIDE FOOTPATH ACCESS
SCALE 1:250
TO LOOK OUT FOR CYCLISTS
HIGHLIGHT TO PEDESTRIANS
"LOOK" GROUND MARKINGS TO
DIRECTION
TRAFFIC FLOW
COVERED LINKWAY
ROOF OUTLINE OF
DASH LINE
100 x 300 RED
CYCLIST LOGO
PEDESTRIAN &
CYCLIST ROAD
PEDESTRIAN &
LTA_CORIASQD
Text Box
CHAPTER 21 - MAIN PAGE
LTA_CORIASQD
Text Box
NEXT
LTA_CORIASQD
Text Box
PREVIOUS
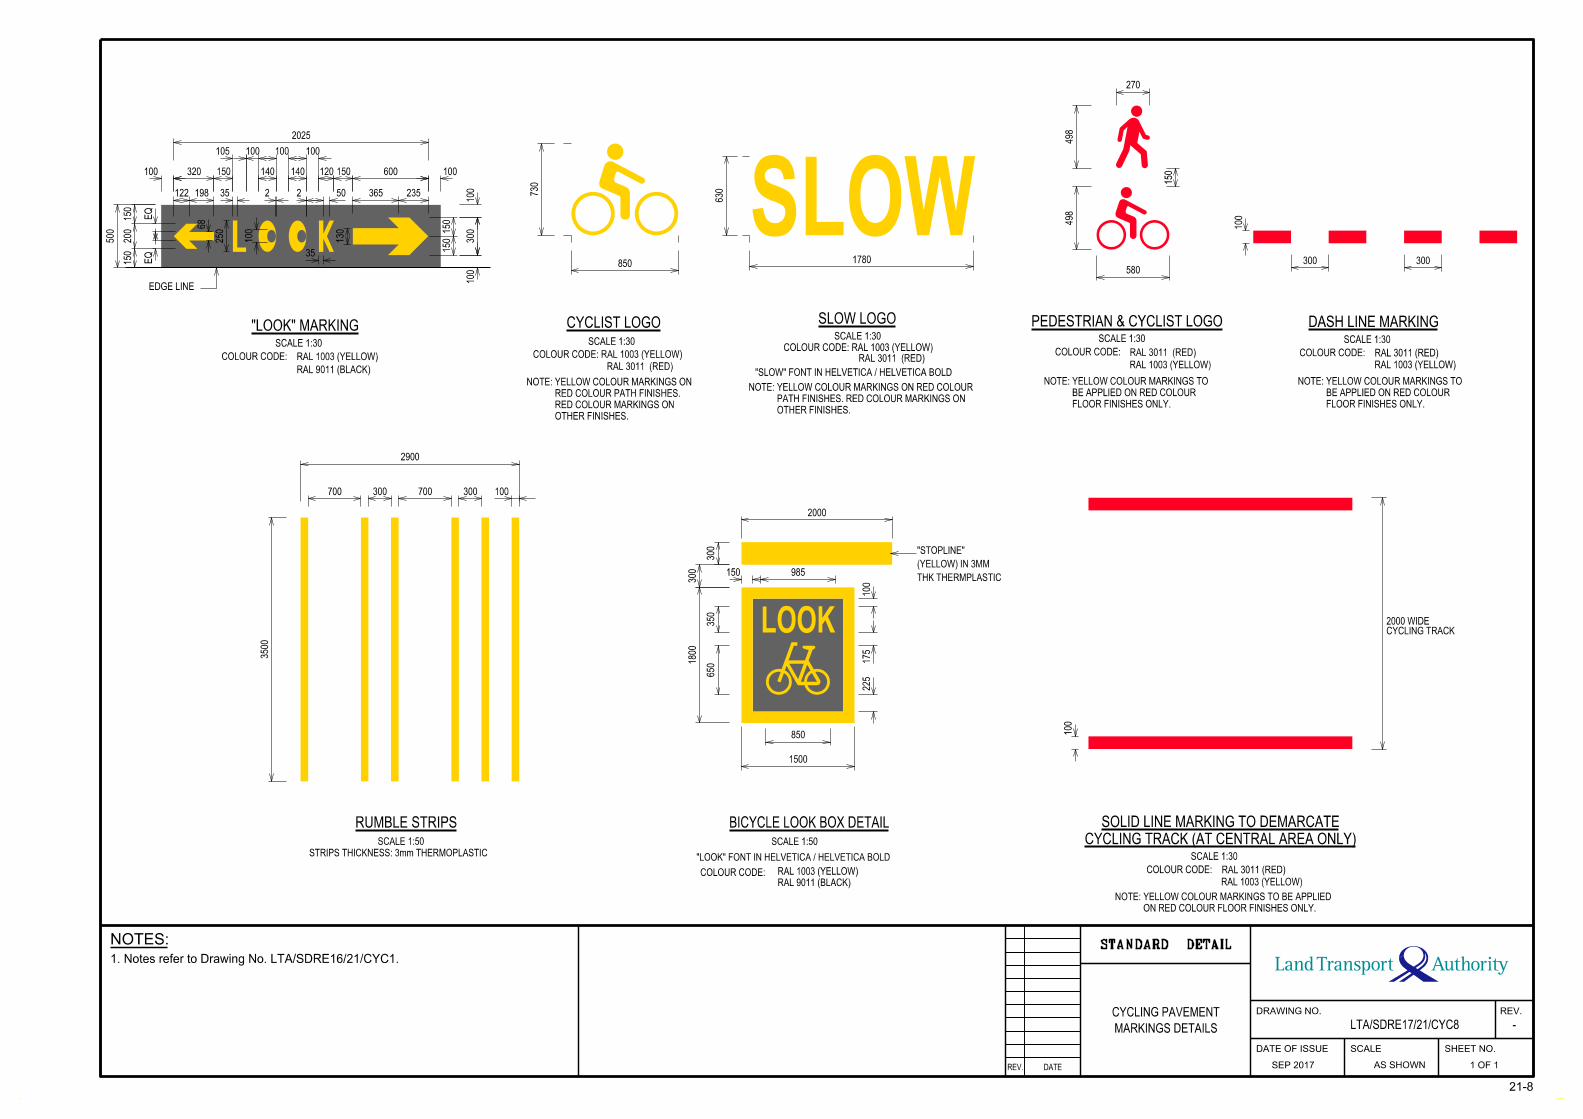
LTA/SDRE17/21/CYC8
21-8
MARKINGS DETAILS
CYCLING PAVEMENT
1 OF 1
1. Notes refer to Drawing No. LTA/SDRE16/21/CYC1.
AS SHOWN
STANDARD DETAIL
REV.
-
REV. DATE
DRAWING NO.
DATE OF ISSUE SCALE SHEET NO.
SEP 2017
NOTES:
SLOW
CYCLING TRACK2000 WIDE
SCALE 1:30
EDGE LINE
CYCLIST LOGO SLOW LOGOSCALE 1:30 SCALE 1:30
SCALE 1:30
"LOOK" MARKING
COLOUR CODE: RAL 1003 (YELLOW)
RAL 9011 (BLACK)
SCALE 1:30
COLOUR CODE:
PEDESTRIAN & CYCLIST LOGO
COLOUR CODE: RAL 1003 (YELLOW)
RAL 3011 (RED)COLOUR CODE: RAL 1003 (YELLOW) RAL 3011 (RED)
"SLOW" FONT IN HELVETICA / HELVETICA BOLDRAL 3011 (RED) RAL 1003 (YELLOW)
RAL 3011 (RED)COLOUR CODE:
SCALE 1:30
COLOUR CODE: RAL 3011 (RED)
DASH LINE MARKING
RAL 1003 (YELLOW)
CYCLING TRACK (AT CENTRAL AREA ONLY)
SOLID LINE MARKING TO DEMARCATE
RAL 1003 (YELLOW)
OTHER FINISHES.
RED COLOUR MARKINGS ON
RED COLOUR PATH FINISHES.
NOTE: YELLOW COLOUR MARKINGS ON
OTHER FINISHES.
PATH FINISHES. RED COLOUR MARKINGS ON
NOTE: YELLOW COLOUR MARKINGS ON RED COLOUR
FLOOR FINISHES ONLY.
BE APPLIED ON RED COLOUR
NOTE: YELLOW COLOUR MARKINGS TO
FLOOR FINISHES ONLY.
BE APPLIED ON RED COLOUR
NOTE: YELLOW COLOUR MARKINGS TO
ON RED COLOUR FLOOR FINISHES ONLY.
NOTE: YELLOW COLOUR MARKINGS TO BE APPLIED
730
850
630
1780580
498
498
270
150
300300
100
100
500
150
200
150
198122
320 150
2025
140 140 120 150 600
235365
150
150
300
EQ
EQ
100
35 2 2
100100100105
50
100
100
100
68
250
100
35
130
3500
700 300 700 300
2900
LOOK
150
100
175
225
100
SCALE 1:50
RUMBLE STRIPS
STRIPS THICKNESS: 3mm THERMOPLASTIC
SCALE 1:50
RAL 9011 (BLACK)
RAL 1003 (YELLOW)COLOUR CODE:
"LOOK" FONT IN HELVETICA / HELVETICA BOLD
BICYCLE LOOK BOX DETAIL
THK THERMPLASTIC
(YELLOW) IN 3MM
"STOPLINE"
650
1800
350
300
300
2000
985
850
1500
LTA_CORIASQD
Text Box
CHAPTER 21 - MAIN PAGE
LTA_CORIASQD
Text Box
NEXT
LTA_CORIASQD
Text Box
PREVIOUS

LTA/SDRE17/21/CYC9CYCLING SIGNS
21-9
1 OF 1 with white lettering, line & border unless otherwise stated.
All signs are colour brown background (RAL 8011, Nut Brown), red triangle
amendments.
Fixture: Refer to SDRE (2014 Edition) including all other subsequent
(Revision A1, June 2010 Edition)
Material: Refer to M&W Specification For Civil And Structural Works
Text: Helvetica / Helvetica Bold
1. Design details:
1:10
chapter for details.
2. Headroom clearance for all signs is 2.4m. Refer to "Support for Road Signs" STANDARD DETAIL
REV.
-
REV. DATE
DRAWING NO.
DATE OF ISSUE SCALE SHEET NO.
SEP 2017
NOTES:
127285127113314113
600
40
111
111
55
55
40
600 600
600
43
55
Push Your
Bicycle
281
600
Shared
Track
7040070
136
600
55
40
281
40
39
55
Stay
On Track
7040070
136
600
55
40
281
40
39
55
Stay
On Track
9135891
600
600
55
30
316
25
30
55
9135891
600
600
55
30
316
25
30
55
Watch Out
375
364
175450
645
25
130
60
90
65
180
9335393
600
300
77.5
85
77.5
SLOWCAUTIONLOW HEADROOM
SHARED TRACK STAY ON TRACK
TRACK. USUALLY PLACED AT THE START OF THE TRACK.
THESE SIGNS ARE USED TO INDICATE A SEGREGATED
PUSH YOUR BICYCLE
55
42
260
55
600
30
30
30
30
GIVE WAY TO PEDESTRIANS WATCH OUT FOR VEHICLES CAUTION LOW HEADROOM
LOW HEADROOM AHEAD.
THIS SIGN WARNS CYCLISTS OF THE
SLOW (SUPPLEMENTARY)
COLOUR CODE:
RAL 9011 (BLACK)
RAL 1018 (YELLOW)
NOTE: FOR CLEAR HEIGHT LESS THAN 2.4m
10
10
1010
30 3
0
30
THIS SIGN INFORMS CYCLISTS TO PUSH YOUR BICYCLE
(ONLY TO BE USED WHEN INSTRUCTED BY LTA)USUALLY PLACED AT THE START OF THE TRACK.
THIS SIGN IS USED TO INDICATE A SHARED TRACK.
THE CYCLING TRACK.
AS STAIRCASES, RAMPS, BUS-STOPS, FOOTPATH ETC INTERSECTS
ESPECIALLY AT AREAS WHERE THE PEDESTRIANS PATH SUCH
THIS SIGN INFORMS CYCLISTS TO GIVE WAY TO PEDESTRIANS TO BE PLACED BELOW STANDARD SIGNAGE, WHERE NECESSARY.
WITH ROADS.
OTHER AREAS WHERE CYCLING PATHS INTERFERE
CROSSINGS. THIS SIGN MAY ALSO BE USED FOR
UNSIGNALISED JUNCTIONS/ SIGNALISED JUNCTIONS/
APPROACHING VEHICLES AT CARPARK ACCESSES/
THIS SIGN INFORMS CYCLISTS TO LOOKOUT FOR
LTA_CORIASQD
Text Box
CHAPTER 21 - MAIN PAGE
LTA_CORIASQD
Text Box
NEXT
LTA_CORIASQD
Text Box
PREVIOUS

63
Appendix B – Guardrail Design Guidance