
A brief overview of Australian water policy refroms and water markets
51
A brief overview of Australian water policy and water markets Jason Alexandra
Transcript of A brief overview of Australian water policy refroms and water markets

A brief overview of Australian water policy
and water markets
Jason Alexandra

CONTEXTAustralia is:• a federation - a country in a continent• highly urbanized• the driest inhabited continent with the highest per capita water resources• operating in a highly variable climate
Australia recent policies are focused on• natural resources sustainability• Pro –market economic reforms

Outline:1.Context and climate2.A brief history of water policy 3.Australian water markets4.Characteristics and lessons5.Related NRM policy challenges6. Some conclusions

Context - A country in a continent
Energy rich and water poor – learn to live like Australians
Accept the nature of the place, what it is, not what it is not.
Water is a strategic resource and lack of it a key limitation. Improving water policy and governance is a strategic opportunity.

Australian rainfall and the lie of averages. Less than 300mm/year in the west and centre to over 1000mm/year in the south, east and north

1.0%
1.7%
0.4%
20.3%23.3%
1.9%
0%6.1%
0.3%
21.1%
10.6%
13.3%
1.0%
1.7%
0.4%
20.3%23.3%
1.9%
0%6.1%
0.3%
21.1%
10.6%
13.3%
Average rainfall and runoff

Extreme variability in rainfall and runoff
June 20082,220 GL

2. A brief historyThe Murray - a nation’s changing
relationships with nature
1.Dreamtime and the next 60000 years2.Occupation and colonisation3.Navigation4.Federation5.Nation building6.Irrigation and economic development7.Integrated water resources policy8.Ecological restoration and care of
nature9.International Obligations

In 1836 Charles Darwin …. concluded that Australia could never become another America - its soil was too poor, its rains too unpredictable.
Instead it must depend on becoming "the centre of commerce for the southern hemisphere and perhaps on her future manufactories”

copy
headline“dreams of taming the rivers, greening the desert, and making land productive, run deep in the national psyche” (Lines
1994)
Successive Governments sponsored closer settlement and
intensive irrigation development, notwithstanding,
punishing droughts and misconceptions about the severity of the natural
constraints to settlement and production (Taylor 1940).

A brief history of Australian water policy
1890’s – 1980’s Water infrastructure development
– “drought, royal commission, new dam” then desal and water markets
1992 Industry Commission – TWE 1994 COAG reforms – environmental
flows, water markets, corporatisation and cost recovery
National Water Initiative 2004 – reaffirms commitments to reform, environmental flows and markets’ role in reallocating water
2008 – Water Act Reforms – Murray Darling Basin Authority – Basin Planning
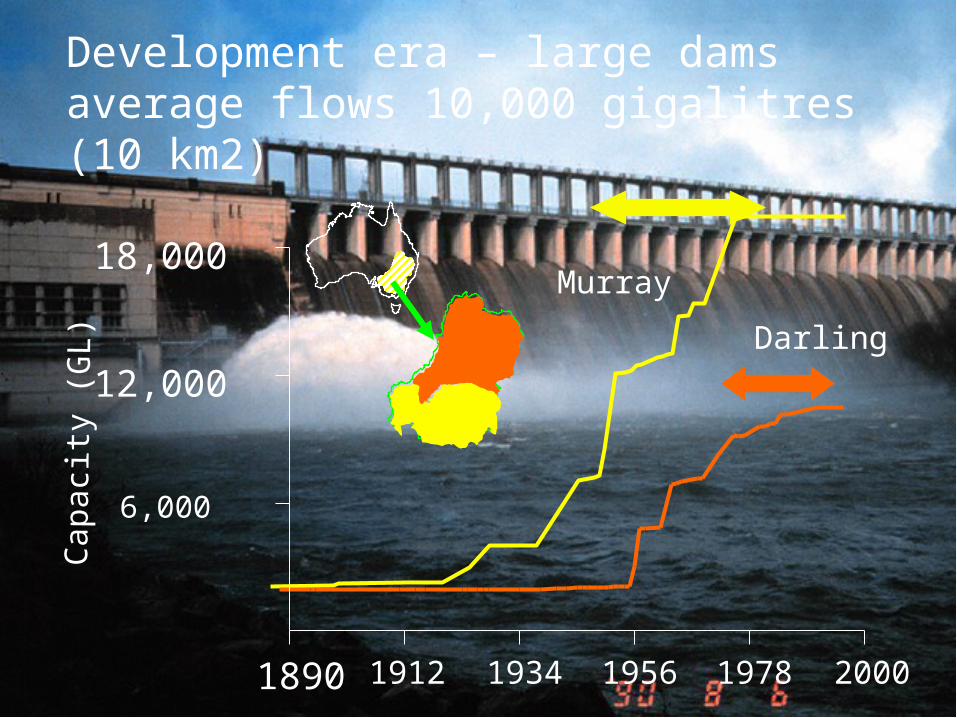
1890 1912 1934 1956 1978 2000
6,000
12,000
18,000
Capacity (GL)
Development era – large dams average flows 10,000 gigalitres (10 km2)
MurrayDarling

Major Water Storages on almost all tributaries in the MDB
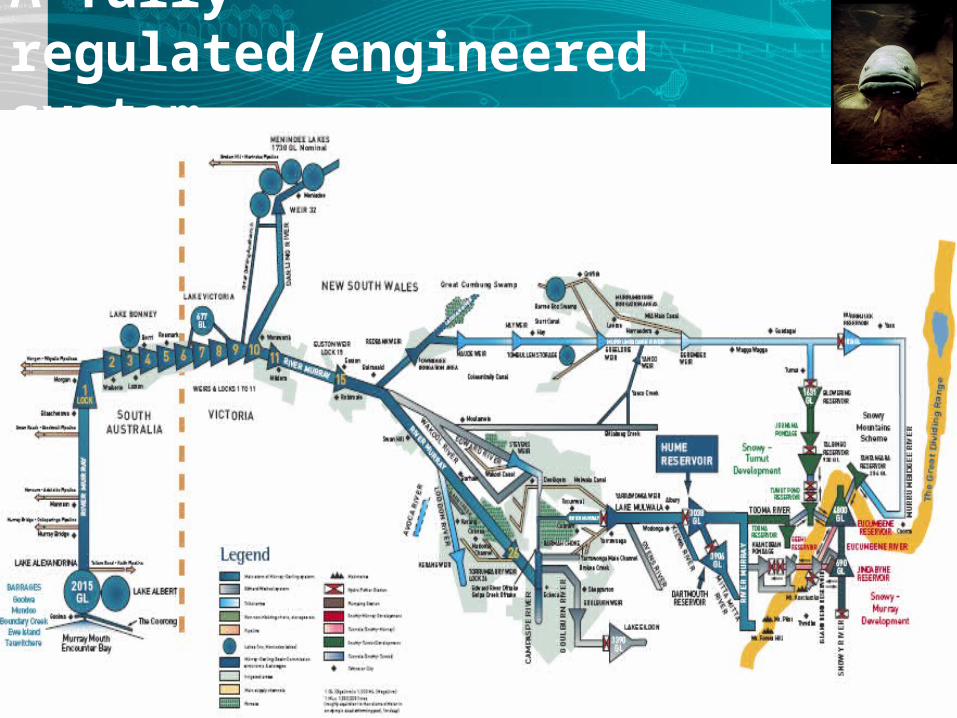
A fully regulated/engineered system

Irrigation – 70% of water use - Irrigation – 70% of water use - most in MDBmost in MDB
Produces more than half the profit in Produces more than half the profit in Australian Agriculture & Horticulture, from Australian Agriculture & Horticulture, from 0.5% of land (NLWRA 2002)0.5% of land (NLWRA 2002)
0
200
400
600
800
1000
1920 1940 1960 1980 2000
Area (x
1000 ha
)
N SWVicQuSAW ATas

Large dams construction era 1950-1980’s –
nation building and response to climate variability
1990’s new policy directions –focus on improved management,
innovative water policy, integrated catchment management
and local landcare

3.Water market frameworkCap and trade system
Entitlement (notional permanent right to a share of a defined water resource)
Allocation (annual share – variable depends on supply)
Both allocation and entitlement can be traded
Depends on hydrological linkages
Rules continue to evolve

In times of scarcity - water moves from lower value to higher value uses
Markets assist communities & industry through drought
Enables water to move between uses and users
Recent seasons demonstrate that “market theory” works
Flexibility achieved due to pro-market policy reforms started in early 1990’s
Water markets experience

Over 5000 allocation transactions –total of 235GL
Interstate allocation transfers of over 40% of water used in Southern Connected Basin
More than 50% in 2008-09 Allocation water traded at average of
$650 ML – up to $1200 ML – much higher then gross margins of many crops
Assumed therefore that: - majority of water moved from pasture and annual crops to permanent crops
Entitlements (up to $2500) also bought Governments for environment and
corporates for new irrigation developments
2007-08 – a severe drought water market

Intra and inter-state trade

Water Productivity in MDB 2005/06 (ABS, 2008)
Water Use (%)
Pasture (hay & silage)Cereals (grain & seed)
Pasture (grazing)
Rice
Cotton
GrapevinesFruit, nuts &
berriesVegetables
0.3
0.2
0.6
0.91.51.8
$M/GL

Urban water trade
Inter-sectoral and inter-basin transfers
Water also moving to urban areas Eg Goldfields super pipe – 33 GL Australian Capital Territory
(ACT) NE Water

Water markets• Rely on Government systems and
regulations• Supports changes in irrigation
practices and location• Allows for “Green-fields” new
development• Allows for government buy backs -
purchases of environmental water• Used as risk management for both
drought and/or climate change• Suffers from administrative complexity

Markets support adoption of improved practice and technologyWater use efficiency through technology, and knowledge of crop demands

Markets supported new “greenfield” developments
New horticulture up to 14 kilometres from the rivers
Estimates of up 32000 hectares since trade started
Nearly all outside “historic irrigation districts”

Water for the environment
Commonwealth- $3 billion for purchases
Focused on entitlements Allocations bought “wet water” – eg
Narran lakes

Aim to– reduce barriers to trade– minimise transaction costs– protect environmental requirements
27
Basin plan water trading rules

Separation of bundled water rights:Entitlement (ownership}Allocation (renting type)Land Use rights (location and landuse constraints –eg salinity often has CMA involved) Channel capacity shareInfrastructure shares
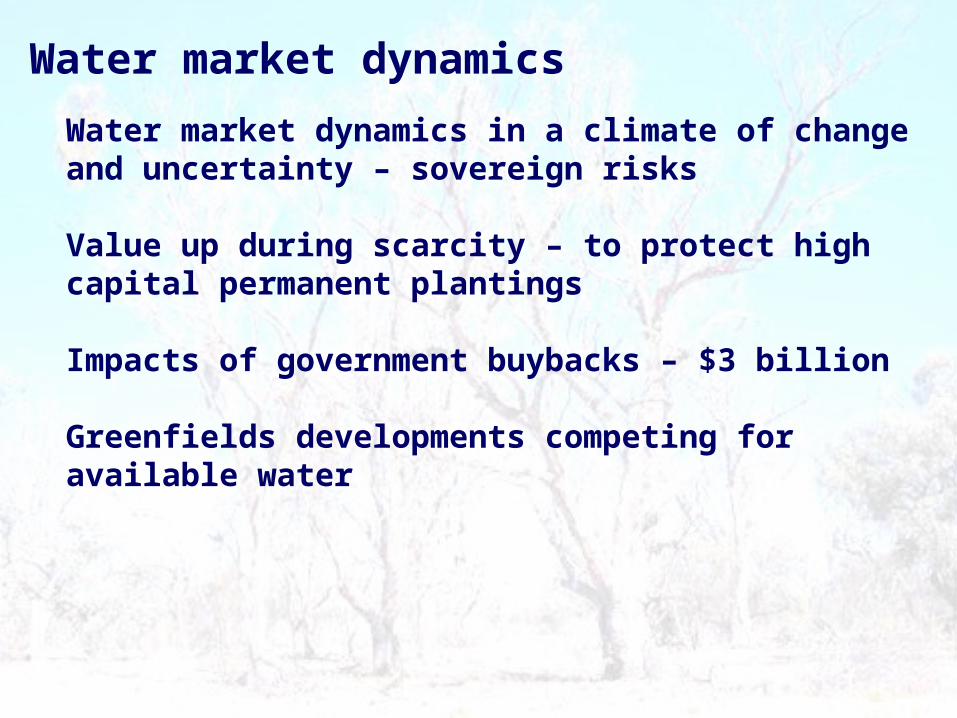
Water market dynamics in a climate of change and uncertainty – sovereign risks
Value up during scarcity – to protect high capital permanent plantings
Impacts of government buybacks – $3 billion
Greenfields developments competing for available water
Water market dynamics

Only one unreliable supplier – nature/rain gods – delivers too much or too little
Supply not responsive to demand increases
Always “local” geographically constrained – water can’t be traded internationally except as virtual water
Volatility due to multiple demand types – many markets
No alternatives or subsitutes
Water market characteristics

Water markets support:
Risk and drought responses – rural and urban
Irrigation technology and structural adjustment
New investments in horticultural and viticultural developments
A way of rebalancing extractions and environmental water
Australian experience
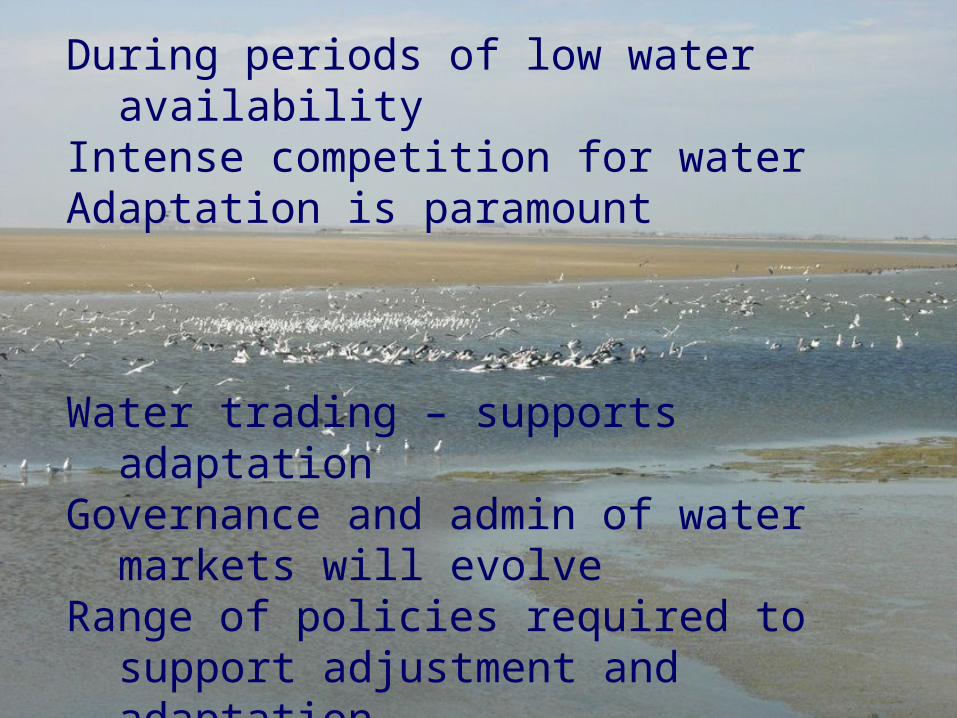
During periods of low water availability
Intense competition for waterAdaptation is paramount
Water trading – supports adaptation
Governance and admin of water markets will evolve
Range of policies required to support adjustment and adaptation

33
Water markets water trading allowed water to move between users and uses – important in droughts

Water markets sit as part of Australian water and natural resources reforms – complex governance and institutions

Why did Australia adopt NWI and Water Act reform:
• To optimise economic outcomes (economic reform)
• To implement ecologically sustainable development
• To overcome ecological degradation – e.g. water quality, species loss, wetlands conservation etc
• To achieve integrated catchment management• To reinforce emerging water markets 35
36
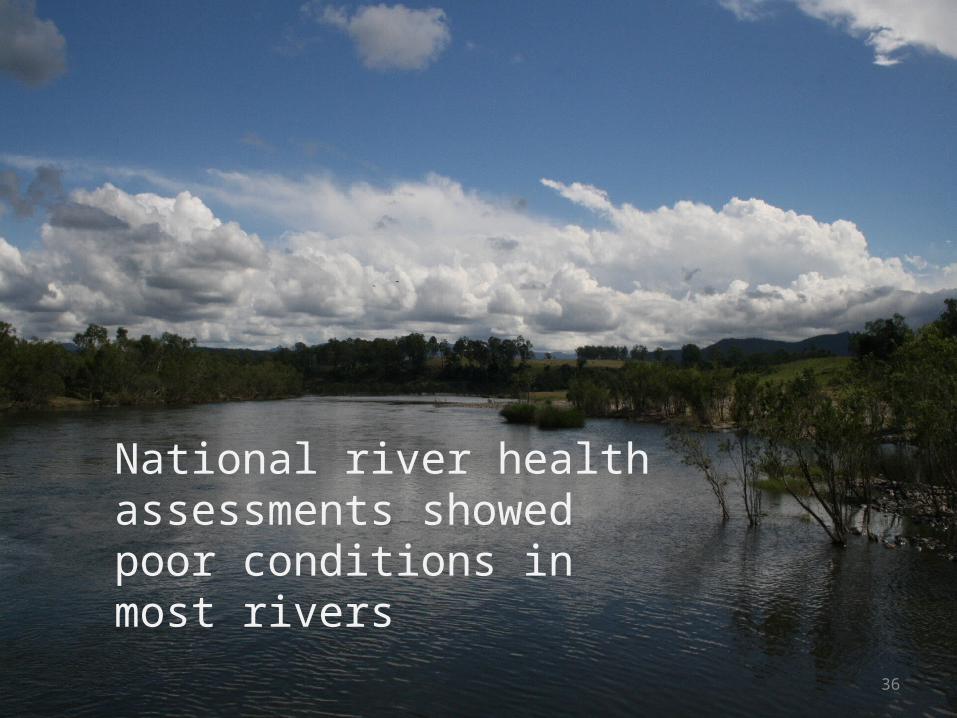
National river health assessments showed poor conditions in most rivers

Strategies for water quality management – diffuse source pollution, algal blooms etc
37

Modified catchments, nutrient and
suspended sediment loads and habitat
Very high nutrient and suspended sediment loads
Largely unmodified
River health and catchment Condition

Major erosion and sedimentation problems
4M tonnes of sediment pa and phosphorus exports - about 13,000 tonnes pa
Most agricultural lands have erosion 5-50 times greater than pre-European settlement.

Biodiversity conservation Responsibility for 60 million years of separate evolution
International obligations to protect biodiversity

Increased protection of wetlands and aquatic ecosystems
- National and international obligations
41
•MDB – •16 RAMSAR •28,000 wetlands • 6 million ha• 98% floodplains• ~3% protected

Chowillafloodplain Barmah-Millewa
Forest
Macquarie Marshes
Gwydir wetlands
Lowbidgee floodplain
Narran Lakes
Coorong
Kulkyne Lakes

Challenges ahead - The approaching storm? climate chaos!!! And its impacts!!! Adaptation imperative
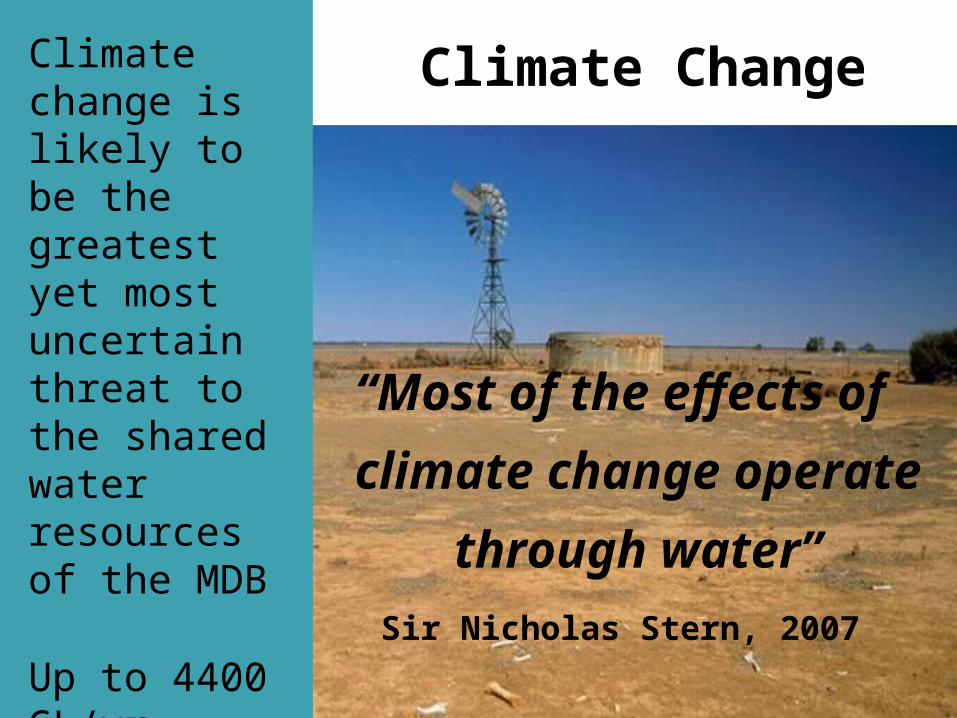
Climate Change Climate change is likely to be the greatest yet most uncertain threat to the shared water resources of the MDB
Up to 4400 GL/yr reduction in flows in 20 years
“Most of the effects of climate change operate
through water”Sir Nicholas Stern, 2007

Climate is hotter and drier
Global average temperature
Australian average temperature
Satellite estimate of soil moisture

Modeled Projections• Majority of models project predict reduced runoff for SE Australia, including Murray system headwaters
• Up to 40% reduction in runoff and stream flow
Projected changes in run-off at 2030 under scenario A1B, showing the number of climate models (out of 15) yielding an increase or decease in run-off; from F. Chiew.

Actual Decreases in Runoff

ChallengesWater policy and planning under uncertainty – “stationarity is dead”.
Climate impact and risk management

Directions 1: Develop capacity for robust water policy under uncertainty Use scenarios - plan for extremes - low water availability and deeper drought/unseasonal rains, climate change impacts
Accept a future of intense competition for water
Institutional and policy innovation required Build diverse, local adaptive capacity - use
markets for risk management and allocation

Directions 2: institutions and capacity for adaptive governance:
Adaptive governance systemsPolicy and institutional design – evolution
Build robust adaptive institutionsPolicy reform as experimentMarkets sit within planning and regulatory frameworks
50

CONCLUSION - POLICY EVOLUTION
1.Institutional and policy innovation by design
2.Policies to support adjustment and adaptation eg water market reforms supports risk management and local adaptation
3.Community involvement in integrated catchment management
4.Basin scale water planning5.Steering with rigorous monitoring and
evaluation