
A BIM BASED-TOOL FOR FORMWORK MANAGEMENT IN ...
145
A BIM BASED-TOOL FOR FORMWORK MANAGEMENT IN BUILDING PROJECTS by Jorge Alfredo Rojas Rondan A Thesis Submitted to the Faculty of Purdue University In Partial Fulfillment of the Requirements for the degree of Master of Science in Civil Engineering Lyles School of Civil Engineering West Lafayette, Indiana May 2021
-
Upload
khangminh22 -
Category
Documents
-
view
2 -
download
0
Transcript of A BIM BASED-TOOL FOR FORMWORK MANAGEMENT IN ...

A BIM BASED-TOOL FOR FORMWORK MANAGEMENT IN BUILDING
PROJECTS
by
Jorge Alfredo Rojas Rondan
A Thesis
Submitted to the Faculty of Purdue University
In Partial Fulfillment of the Requirements for the degree of
Master of Science in Civil Engineering
Lyles School of Civil Engineering
West Lafayette, Indiana
May 2021
2
THE PURDUE UNIVERSITY GRADUATE SCHOOL
STATEMENT OF COMMITTEE APPROVAL
Dr. Dulcy M. Abraham, Chair
Lyles School of Civil Engineering
Dr. Hubo Cai
Lyles School of Civil Engineering
Dr. Bobby G. McCullouch
Lyles School of Civil Engineering
Approved by:
Dr. Dulcy M. Abraham

3
Dedicated to the Fulbright Commission from Peru for giving me this once-in-a-lifetime
experience of studying abroad, at Purdue University and for funding my studies, to the National
University of Engineering of Peru for giving me the opportunity to become an engineer, and to
all my family members who fueled me every day for being a better person.

4
ACKNOWLEDGMENTS
I would like to express my endless gratitude and admiration to my advisor Professor Dulcy M.
Abraham, Professor and Graduate Chair, Burke Graduate Program, Lyles School of Civil
Engineering, for her patience, dedication, and guidance through the entire program and specially
during the development of this thesis. This thesis would not have been possible without her support
and constant motivation for improving myself and encouraging me to always seek excellence and
have an impact in the industry.
Also, I would like to thank Professor Bobby McCullouch for always having an open door and
sharing all his knowledge in construction engineering, but most important for sharing his valuable
time even outside of the classroom. I want to express my gratitude and admiration for his incredible
quality as a professor, as an engineer but even more as a generous and kind person who is always
willing to help others.
I would like to thank Professor Hubo Cai for developing my interest in using digital technologies
applied for construction, and for always been willing to answer my doubts to continue getting me
more involved in the use of BIM and GIS in my professional career.
I thank all the AEC practitioners who participated in the survey conducted for this research,
especially Santiago Hidalgo, Alexis Romero, Javier Luna, Alex Roy, Karin Concha, Carlos
Vizurraga, and Milton Valer who kindly accepted the invitation to participate in the interviews and
provide insight as formwork experts. My deepest sympathy to the family of my friend and
formwork expert Francisco Carrillo who participated in the interviews, and passed away earlier
this year, before the culmination of this research study.

5
TABLE OF CONTENTS
LIST OF TABLES .......................................................................................................................... 7
LIST OF FIGURES ........................................................................................................................ 8
ABSTRACT .................................................................................................................................. 12
INTRODUCTION ................................................................................................................. 14
1.1. Background and Research Motivation ........................................................................... 15
1.2. Problem Statement .......................................................................................................... 18
1.3. Research Questions ........................................................................................................ 20
1.4. Research Objective ......................................................................................................... 20
1.5. Research Framework ...................................................................................................... 21
1.6. Research Methodology ................................................................................................... 22
1.7. Thesis Organization ........................................................................................................ 23
REVIEW OF THE STATE OF THE ART AND STATE OF PRACTICE IN FORMWORK
MANAGEMENT .......................................................................................................................... 25
2.1 Formwork management in building projects .................................................................... 25
2.1.1 Formwork layout planning and work zones planning ............................................... 26
2.1.2 Formwork systems ..................................................................................................... 33
2.1.3 Formwork rental options. ........................................................................................... 35
2.1.4 Formwork demand profile ......................................................................................... 38
2.1.5 Cost analysis of formwork ......................................................................................... 40
2.1.6 Formwork control with KPIs ..................................................................................... 41
2.2 Previous research studies related to formwork management. ........................................... 43
2.3 Developments in formwork management ......................................................................... 47
2.3.1 Formwork management using CAD. ......................................................................... 48
2.3.2 Formwork management using BIM. .......................................................................... 49
2.4 Needs assessment. ............................................................................................................. 50
2.5 Summary ........................................................................................................................... 56
RESEARCH METHODOLOGY .......................................................................................... 57
3.1. BIM workflow automation ............................................................................................. 57
3.2. Road map for developing the framework for formwork management using BIM. ........ 60

6
3.3. BIM parameters management ......................................................................................... 62
3.4. Auditing the BIM model for formwork management .................................................... 74
3.5. Work zoning process using BIM. ................................................................................... 78
3.6. Formwork modeling automation .................................................................................... 81
3.7. Populating parameters using Dynamo ............................................................................ 84
EVALUATION OF THE FORMWORK MANAGEMENT TOOL .................................... 96
4.2. Roadmap for using the BIM-based formwork management tool. .................................. 96
4.3. Generation of schedules and quantities .......................................................................... 99
4.4. Formwork cost analysis & KPIs ................................................................................... 101
4.4.1. Quantities takeoff summary for RC structure components ................................... 101
4.4.2. Quantities takeoff summary for formwork solution systems ................................ 103
4.4.3. Maximum formwork set size by formwork solution system. ................................ 104
4.4.4. Formwork management KPIs ................................................................................ 108
4.5. Formwork demand profile ............................................................................................ 112
4.6. 4D and 5D simulations ................................................................................................. 115
4.7. Generation of layout color mapping views and plans. ................................................. 117
4.8. Description of case studies ........................................................................................... 117
4.9. Comparison of results of case studies .......................................................................... 119
4.10. Summary .................................................................................................................... 120
CONCLUSIONS ................................................................................................................. 123
5.1. Summary of the Research Process ............................................................................... 123
5.2. Research Conclusions ................................................................................................... 124
5.3. Limitations of the Research .......................................................................................... 126
5.4. Contribution to the Body of Knowledge ...................................................................... 127
5.5. Contribution to the Body of Practice ............................................................................ 128
5.6. Recommendations for Future Research ........................................................................ 128
REFERENCES ........................................................................................................................... 130
APPENDIX A. INSTITUTIONAL REVIEW BOARD EXEMPTION ..................................... 135
APPENDIX B. SURVEY QUESTIONNAIRE .......................................................................... 137

7
LIST OF TABLES
Table 2.1. Labor productivity values ............................................................................................ 33
Table 2.2. QTO ratios per square construction area. .................................................................... 33
Table 2.3. Typical formwork bid proposal. .................................................................................. 36
Table 2.4. Previous research studies related to formworks. ......................................................... 45
Table 3.1. Dynamo and Add-Ins trade-off .................................................................................... 59
Table 3.2. Parameters' groups ....................................................................................................... 62
Table 3.3. MOD Parameters - Group: MODEL ........................................................................... 64
Table 3.4. Productivity Parameters ............................................................................................... 68
Table 3.5. Time parameters .......................................................................................................... 68
Table 3.6. Formwork parameters .................................................................................................. 69
Table 3.7. Cost parameters............................................................................................................ 70
Table 3.8. Default steel ratios ....................................................................................................... 86
Table 3.9. Weight ratios for formwork solutions .......................................................................... 89
Table 3.10. Productivity indexes references ................................................................................. 90
Table 3.11. Referential ratios of cost for estimating consumables. .............................................. 91
Table 3.12. Rates for renting formwork solution systems ............................................................ 93
Table 3.13. Rates for renting beam lateral formwork solution systems ....................................... 93
Table 4.1. Main features of two sample buildings ...................................................................... 118

8
LIST OF FIGURES
Figure 1.1. Formwork management map (PRES) ......................................................................... 19
Figure 1.2. BIM Framework Methodology for formwork Management ...................................... 23
Figure 2.1. Formwork layout and work zones planning. .............................................................. 26
Figure 2.2. Lookahead schedule for 1st story of 10-story building .............................................. 28
Figure 2.3. Lookahead for 10-story building ................................................................................ 29
Figure 2.4. Program chart and objective chart for 10-story building............................................ 29
Figure 2.5. Elevation view and 3D view of typical parts and stories of a building to define main
layout plans. .................................................................................................................................. 31
Figure 2.6. Formwork Systems Map. Adapted from (Jimenez, 2020) ......................................... 34
Figure 2.7. Formwork rental options map. ................................................................................... 37
Figure 2.8. Formwork demand profiles ........................................................................................ 38
Figure 2.9. Formwork element used as a work platform .............................................................. 39
Figure 2.10. Surplus formwork partially buried on site ................................................................ 39
Figure 2.11. Cause effect of formwork extra cost ........................................................................ 41
Figure 2.12. Formwork management KPIs for building projects ................................................. 43
Figure 2.13. ELPOS from Peri ...................................................................................................... 49
Figure 2.14. Doka CAD 9 from Doka........................................................................................... 49
Figure 2.15. Integration of PERI CAD in the BIM process.......................................................... 49
Figure 2.16. Doka CAD for Revit ................................................................................................. 50
Figure 2.17. Country of respondents............................................................................................. 52
Figure 2.18. Years of experience of respondents .......................................................................... 52
Figure 2.19. Professional profile of respondents .......................................................................... 52
Figure 2.20. Level of Development (LOD) for a column formwork ............................................ 53
Figure 2.21. LOD preference of general contractors and formwork providers ............................ 54
Figure 2.22. Formwork rental option preference. ......................................................................... 55
Figure 2.23. Computational tools preferred by general contractors for formwork management. 55
Figure 2.24. Level of automation preference by contractors and formwork companies .............. 56
Figure 3.1. Dynamo workflow for reshoring cost sum for all horizontal elements ...................... 58

9
Figure 3.2. BIM-based tool for formwork management ............................................................... 60
Figure 3.3. Road map for generating a BIM model for formwork management. ......................... 61
Figure 3.4. Hierarchy of Category, Family, Type, and Instance .................................................. 63
Figure 3.5. Parameter properties ................................................................................................... 63
Figure 3.6. Renaming of levels for formwork analysis ................................................................ 65
Figure 3.7. Joint element type parameter ...................................................................................... 65
Figure 3.8. Column poured until beam bottom ............................................................................. 66
Figure 3.9. Wall poured until slab bottom .................................................................................... 66
Figure 3.10. Doka beam lateral formwork with ties ..................................................................... 67
Figure 3.11. Doka beam lateral formwork with bracing squares .................................................. 67
Figure 3.12 Formwork consumables............................................................................................. 71
Figure 3.13. Shared Parameters txt file. ........................................................................................ 72
Figure 3.14. Dynamo Script for creating shared parameters from an Excel file. ......................... 72
Figure 3.15. Results of running Dynamo Script for creating shared parameters .......................... 73
Figure 3.16. Result of running script for creating project parameters .......................................... 74
Figure 3.17. Floor priority over beams and columns .................................................................... 74
Figure 3.18. Column priority over the floor and beams ............................................................... 74
Figure 3.19. Results of running Dynamo script to switch element priorities ............................... 75
Figure 3.20. RC column and steel beam connection .................................................................... 76
Figure 3.21. Monolithic structure with tunnel formwork ............................................................. 76
Figure 3.22. Results of Dynamo script for splitting columns ....................................................... 76
Figure 3.23. Results of Dynamo script for splitting walls. ........................................................... 77
Figure 3.24. Dynamo Script for splitting all columns in the BIM model. .................................... 78
Figure 3.25. Work zone leveling using Parts and multicategory schedules ................................. 79
Figure 3.26. Results of running Dynamo script for work zoning ................................................. 80
Figure 3.27. Dynamo Script for work zoning elements ................................................................ 81
Figure 3.28. Dynamo script for creating materials. ...................................................................... 82
Figure 3.29. Results of running Dynamo script for creating materials ......................................... 82
Figure 3.30. Dynamo script for modeling and calculating the formwork area of a foundation. .. 83
Figure 3.31. Dynamo view of the surfaces that represent the formwork for a foundation. .......... 83

10
Figure 3.32. Results of running Dynamo script for modeling formworks.................................... 84
Figure 3.33. Dynamo script for populating MOD parameters ...................................................... 85
Figure 3.34. Results of running Dynamo script for populating MOD parameters ....................... 85
Figure 3.35. Results of running MOD, TIME, and STEEL Dynamos scripts .............................. 86
Figure 3.36. Schedule generated in MS Project to estimate stripping dates. ................................ 87
Figure 3.37. VBA Excel Macro for creating Schedule Structure of activities to generate MS project
schedule......................................................................................................................................... 87
Figure 3.38 Result of running Dynamo Script for populating dates and time .............................. 88
Figure 3.39. Dynamo Script for getting dates and durations. ....................................................... 88
Figure 3.40. Results of running "Weight ratios" script ................................................................. 89
Figure 3.41. Dynamo script for estimating formwork weight for foundations. ............................ 89
Figure 3.42. Results of running Dynamo script for filling up PROD parameters ........................ 90
Figure 3.43.Dynamo Script for estimating labor hours. ............................................................... 91
Figure 3.44. Dynamo script for estimating consumable cost. ....................................................... 92
Figure 3.45. Results of running script for estimating formwork consumables cost ..................... 92
Figure 3.46. Dynamo Script for estimating renting cost of column formwork. ........................... 94
Figure 3.47. Results of running script for estimating formworks renting costs ........................... 94
Figure 3.48. Flowchart for using Dynamo Scripts and Excel files ............................................... 95
Figure 4.1. Roadmap for the second phase of the BIM-based formwork management tool ........ 98
Figure 4.2. Multi-Category option for creating a new quantities list/schedule .......................... 100
Figure 4.3. Result of creating a Multi-Category schedule .......................................................... 100
Figure 4.4. Creating a New Material Takeoff schedule .............................................................. 101
Figure 4.5. Results of creating a New Material Takeoff schedule .............................................. 101
Figure 4.6. Dynamo script for computing quantities summary for entire project ...................... 102
Figure 4.7. Results of running Dynamo script for computing quantities summary. ................... 103
Figure 4.8. Dynamo script for generating formwork summary. ................................................. 104
Figure 4.9. Results of running Dynamo script for formwork summary. .................................... 104
Figure 4.10. Analysis for computing foundations maximum formwork set size........................ 106
Figure 4.11. Dynamo script for computing the maximum formwork set size for foundations. . 106
Figure 4.12. Maximum formwork set size for foundations ........................................................ 107

11
Figure 4.13. Results of running Dynamo script for computing maximum formwork set size. .. 108
Figure 4.14. Dynamo script for computing KPIs report ............................................................. 111
Figure 4.15. Results of running Dynamo script for computing KPIs. ........................................ 112
Figure 4.16. Workflow for interoperability of information between Revit - Excel and Project for
generating formwork profile. ...................................................................................................... 112
Figure 4.17. Dynamo script for exporting formwork rental cost grouped by work zone code. . 113
Figure 4.18. Results of running Dynamo script for exporting formwork and reshoring rental cost
grouped by work zone into an Excel file. ................................................................................... 113
Figure 4.19. Excel table reorganizing the cost column based on the "activity sequence structure"
of the schedule template.............................................................................................................. 114
Figure 4.20. MS Project schedule with the cost column filled in with the excel values. ........... 114
Figure 4.21. Task Usage view for the cash flow of the formwork renting cost.......................... 114
Figure 4.22. Formwork demand profile ...................................................................................... 115
Figure 4.23. Dynamo Script for generating XML file for generating Sets in Navisworks......... 116
Figure 4.24. 4D and 5D simulation process ................................................................................ 116
Figure 4.25. 3D view filtered by work zone. .............................................................................. 117
Figure 4.26. 3D view filtered by element type ........................................................................... 117
Figure 4.27. 3D filtered view for tracking stripping dates .......................................................... 117
Figure 4.28. Layout plan view for two sample buildings ........................................................... 118
Figure 4.29. BIM Process Phase 1 for 20-story building and 5-story building .......................... 119
Figure 4.30. Results of running Dynamo script for calculating KPIs ......................................... 120
Figure 4.31. BIM-based formwork management Phase 2: Tools’ workflow ............................. 122

12
ABSTRACT
Formwork represents between 35% and 60% of the total cost of the structural framing of a concrete
building and is always part of the critical path of a project. Worldwide, Building Information
Modeling (BIM) has been growing rapidly for building projects. However, modeling temporary
structures using BIM is not a common practice. Current formwork management practices rely on
the use of traditional tools like CAD, PDF editors and spreadsheets. A BIM formwork model
during the preconstruction stage can provide a powerful tool for decision-making in formwork
management (i.e., selecting formwork system and formwork supplier, and defining quantities to
procure formwork systems). Relying only on rough cost estimates and field experience related to
formwork can lead to overestimating formwork budgets, renting surplus formwork, and paying for
additional formwork elements/systems that are in jeopardy of being lost, damaged or even stolen.
A review of the state of art, the state of practice and the results of survey used to gather data from
AEC practitioners regarding formwork management preferences indicated that: (1) BIM formwork
modeling with level of development (LOD) 100 and 200 is the preferred approach by practitioners,
(2) renting formwork is the preferred mode, considering the contact area of the system instead of
renting pieces of formwork, and (3) the use of traditional tools like CAD, PDF editors and
spreadsheets involving minimum level of automation is the general practice in formwork
management. Based on these findings the thesis focuses on the design, development, and testing
of a BIM-based formwork management tool.
The BIM-based tool has two phases: Phase 1 the automation of BIM formwork modeling based
on the contact surface of building elements and populating BIM parameters related to formwork
(formwork types, formwork weight, productivity, and timing) in the input BIM model, and Phase
2 the use of the resulting BIM model developed in Phase 1 for formwork management tasks (i.e.,
quantity takeoffs, formwork demand profiles, cost analysis, estimation of Key Performance
Indicators (KPIs) such as the reuse factor and formwork efficiency, and tracking formwork
removal). The tool was tested on two case studies (a 20-story building and a 5-story building) both
with 80 work zones and 46,650 m2 of floor-built area. As expected, the KPI values for both case
studies were similar since both buildings have similar modular architectures. The BIM-based tool

13
for formwork management presented in this thesis provides the following advantages: (1)
Implemented independently of the formwork systems or formwork provider selected, (2) Time
savings attributed to automation of repetitive tasks in Revit and focusing on modeling formwork
surface contact area (instead of modeling all formwork components), and (3) Reduction in human
error since the BIM processes (formwork modeling, parameters management, and exchange of
data between different platforms) are automated, reducing or eliminating the need of manual entry
of parameter values or manual 3D modeling.

14
INTRODUCTION
One of the main structural materials used for the construction of buildings is Reinforced Concrete
(RC). In the case of tall buildings (more than 75 ft height according to NFPA (2011)), the global
percentage of usage of concrete in tall buildings increased from 9% in 1970 to 44% in 2012. This
increased use of RC in tall buildings is even more dominant in developing countries, where there
is greater expertise using reinforced concrete rather than using steel (Wood & Parker, 2013).
According to Ko, Wang, & Kuo (2011) the primary materials involved in RC buildings are:
reinforcing steel (rebar), formwork, rough-in conduits, and concrete. In a traditional project
delivery system, the quantities of concrete, conduits and rebar are defined by the designer, with
little room for improvement by the contractor, but formwork is still a responsibility of and defined
by the contractor (Peurifoy & Oberleder, 2011). Formwork is a key consideration for contractors
since it is a labor-intensive activity, and the efficiency of the process depends on the selection of
the appropriate reuse schedule (rotation) of forms (Huang, Chen, & Sun, 2004).
Formwork management involves preparing an accurate estimate of quantities that will be used for
measuring the formwork installation performance and comparing this performance with the project
baseline (schedule, cost, and scope). Proper estimation of formwork quantities improves the
production on site, reduces the amount of waste, and ensures that equipment and tools used for the
installation and removal are appropriate and used efficiently at different locations. The proper
estimation of quantities is used for preparing the optimum formwork reuse schedule to minimize
idle material (reduce waste) and improve the construction flow (add value) of the building structure,
which is commonly on the critical path of the project.
Traditionally, the estimation of formwork quantities was done using tools such as spreadsheets,
CAD tools or PDF editors. The use of these tools is time consuming, and the manual process is
often prone to human error. The advent of Building Information Modeling (BIM) provides
opportunities for determining quantities of every component of a building (if it is included as part
of the BIM model), in a fraction of time. Since formwork is a temporary structure, formwork
elements are rarely included in the BIM model, and direct determination of formwork quantities

15
from current BIM models is difficult. Hence, a detailed formwork breakdown is required for
formwork management. Current BIM tools can be integrated with Lean principles like create flow
and establish pull to develop strategies for more reliable formwork management, leading to more
reliable and automated process for determination of formwork quantities and installation strategies.
1.1. Background and Research Motivation
According to Wood & Parker (2013) RC is the preferred building material for tall buildings in
developing regions. As an example, in Taiwan, 87% of the total building floors were built with
RC in the past five decades (Huang, Chen, & Sun, 2004). Formwork by itself is the largest cost
component of the RC structure, often ranging in values between 35% and 60% of the total cost of
the structural frame (Johnston, 2014).
There is a large variety of formwork alternatives considering materials, suppliers, types of
elements to cast in or crane dependency, and the selection will depend on multiple criteria. The
two types of formwork based on the place where the forms are prepared are: (1) prefabricated
modular formwork, that is prepared off site, and (2) tailor-made formworks, which are prepared
onsite. The common practice nowadays is to use prefabricated modular formwork systems. There
are multiple advantages for using such prefabricated systems : (1) less labor activity on the jobsite,
(2) easy access to engineering and technical support from the supplier, (3) quicker initiation of the
work with a readily available system, (4) European certifications such as AFNOR, GSV and BS
of many formwork manufacturers, (5) greater durability of materials due to more stringent quality
control offsite, (6) fewer pieces systems, and (7) better productivity with less skilled labor (Huang,
Chen, & Sun, 2004) .
There are several options for procuring pre-manufactured formwork for a project: (1) using the
contractor’s own formwork, (2) renting formwork from a manufacturer, supplier or renting
company, (3) leasing the equipment, and at the end of the lease owning the formwork, or (4) hiring
the services for tailor-made formwork based on special requirements. The rental option is often
considered to be the most attractive alternative in building projects since: (1) it involves minor
initial investment, (2) there is reduced risk for the investment in case of fluctuation in the market,
(3) outsourcing of the engineering and shop drawings ensures that the contractor is not tasked with

16
these activities, (4) there is greater flexibility for increasing or decreasing production capacity, (5)
there is economy of scale in case formwork assemblies/systems are depreciated, (6) only required
materials are brought to the construction site, reducing waste, (7) there is opportunity to obtain
the latest technology, and (8) there is access to technical support from the supplier (Johnston, 2014).
According to Krawczynska (2016), less than 6% of contractors own enough formwork to perform
their projects without renting extra formwork, and more than the 40% of contractors rent all the
formwork they require for projects.
According to Mansuri, Chakraborty, Elzarka, & Deshpande (2017), BIM can be used during the
construction phase for quantity take-off, cost estimation, early identification of design errors
through clash detection, construction planning, 4D and 5D simulation, tracking construction
progress, automation of shop drawings for prefabrication and modularization, and safety planning.
Despite of these advantages of using BIM, in current projects it is not common to include
temporary structures (including formwork) as part of the BIM models. Not including formwork
elements as part of the BIM model creates difficulty in implementing BIM for formwork
management (Gambatese & Jin, 2019). To address some of the challenges in the current formwork
management practices, this thesis focuses on the conceptualization, design, development, and
testing (with two case studies) of a BIM-based tool for formwork management in building projects
without the need to model a specific formwork system with all its components. This research only
considers the use of prefabricated modular formwork under the rental option since it is the
preferred practice in the industry.
Importance of formwork for building projects
According to Huang, Chen, & Sun (2004), formwork is considered a critical activity for every RC
building, and will have a great impact in terms of cost, time, quality, and safety. Formwork is the
largest cost component of a RC structure, and even in some cases, could be even larger than the
combined cost of concrete and rebar. Proper consideration to formwork design, planning and
management could lead to savings greater than the 25% of the structural frame cost (Peurifoy &
Oberleder, 2011). The time for stripping, preparing for the next use, hauling to the next work zone,
and erecting the formwork, is considerably greater than concrete placement or steel erection.
Typically, formwork activity is part of the critical path of a building project, so any reduction in

17
the time of this activity will have direct impact on the total duration of the project (Peurifoy &
Oberleder, 2011). The proper selection of formwork surface grade will have direct impact in the
concrete surface quality, and any premature removal of forms or shoring could generate excessive
cracking or deflections that will affect project’s quality (ACI Committee 347, 2014). According to
Sohoni, Mittal, Matsagar, & Jha (2020), most of the construction failures are related with
inadequate shoring procedures and related to formwork, commonly because of excessive
construction loads.
State of practice: Formwork management
There are multiple ways to improve formwork efficiency: (1) considering the standardization of
the dimensions of concrete elements to avoid formwork disassembly, (2) selecting the best reuse
scheme in order to use less formwork and utilize higher rotation of formwork, (3) selecting the
best formwork option considering the balance between formwork surface grade and the posterior
surface preparation of the concrete element, (4) selecting materials with better durability, (5) and
selecting the formwork system with less amount of pieces that requires less labor work (Huang,
Chen, & Sun, 2004). Project designers address standardization while considering not just the
optimization of materials’ quantities but also reducing the variability of element dimensions, to
increase productivity during construction. Selecting formwork systems based on concrete surface
preparation, productivity of formwork installation crews, and durability of materials used for
formwork components has been extensively studied in the literature. However, there is not much
literature related to the selection of the best formwork reuse scheme, and the industry practice is
reliance on contractor experience often without the support of tools for automating formwork
planning and management tasks (Biruk & Jaskowsk, 2016).
State of practice: BIM for formworks
Designers and contractors pay more attention to permanent elements of a building, and since BIM
modeling is a time-consuming process, typically temporary structures are not included as part of
BIM models (Hyun, Jin, Shen, & Kim, 2018). According to McGraw Hill Construction (2014),
across developed regions (i.e., USA, Canada, Germany, France, UK, Japan, Australia, etc.), 60%
of contractors operate at light or medium BIM implementation (i.e., 30% or fewer of their projects
involve using BIM). In these developed regions, only 23% of the concrete subcontractors were

18
rated by their general contractors as having high or very high proficiency in the use of BIM.
According to Jung & Lee (2015), in developing regions like South America, 71.4% of BIM users
evaluated themselves as “advanced” or “expert”. Focusing on developing regions where RC is the
preferred structural material for buildings, some studies like the one developed by Murguía (2018)
in Peru, 60% of building projects do not implement BIM or implement BIM model elements that
have a minimum Level of Development (LOD), and 93% of buildings that use BIM only model
the concrete structure as a volumetric 3D model, and formwork or rebar are not included in such
models. According to Mansuri, Chakraborty, Elzarka, & Deshpande (2017) some challenges found
during the implementation of BIM models for formworks in USA are as follows: (1) BIM models
for formwork are prepared after the BIM model of the structure is completed and after the
formwork supplier is defined, (2) updating the formwork BIM model is challenging since design
changes occur very frequently in building projects, and (3) formwork modeling and layout
generations are not completely finished before concrete activities begin.
1.2. Problem Statement
Four themes can be explored when considering formwork optimization (Productivity - Reuse -
Economy - Standardization (PRES)): (1) selecting the best formwork option that maximizes labor
productivity by reducing the number of pieces needed, speeding up the erection and stripping
processes, and reducing the number of workers required for handling formwork pieces, (2)
maximizing the reuse of formwork with minimal use of equipment, (3) selecting the best option
of formwork equipment that maximizes the economy of the assembly, and (4) defining the
structure with the sufficient standardization to minimize the number of typologies of formwork
systems considering constructability (Johnston, 2014).
Most formwork companies view “Productivity” (P) as “making more with less”, which in
formwork management implies increasing load capacities with fewer pieces and using light-weight
formwork for easier transportation and assembly. In case of the formwork “Reuse” (R) contractors
understand that by using Lean principles it is possible to reduce the quantities of “idle” material
through workload leveling and using BIM can assist in to increasing the reliability and speed of
computations for formwork scheduling and management. The “Economy” (E) theme is addressed
with formwork design and selection, typically using modular prefabricated formwork systems and

19
the renting option that provides flexibility along with low initial investment cost and access to the
latest formwork technology. Finally, the “Standardization” (S) theme regarding the
“constructability” is related to the involvement of the contractor experience during the design
phase. In “Design Bid Build” (DBB) projects the contractor is not involved or has very little
involvement with the design definition. These days, project delivery methods such as Integrated
Project Delivery (IPD), Construction Management at Risk (CM@R) or Design Built (DB) include
more input from contractors during the design phase, and as result, expertise related to formwork
management can be considered during the definition and design of structural framing. Figure 1.1
summarizes the problem statement described in this section, showing the main challenges related
to productivity, formwork reuse, formwork economy, and construction standardization. Also, a
solution is proposed for each challenge.
FORMWORK MANAGEMENT MAP
Productivity Reuse Economy Standardization
PR
OB
LE
MS
OL
UT
ION
ST
AT
US
`
Formwork is labor
intensive.
Consider formwork
systems with fewer
pieces.
Industry oriented to
develop industrialized
systems.
Manual and time-
consuming planning
process.
Use of Lean principles
(maximize value &
reduce waste) and BIM
methodology
Lack of
methodologies
available in literature
for formwork
management
Find best load capacity
with less formwork
components.
Renting modular
prefabricated formwork
with latest technology
available.
Formwork companies
oriented to develop best
engineering solutions
and systems.
DBB does not involve
contractor experience.
Collaborative delivery
systems like IPD
ensure better
standardization and
constructability.
Practitioners
understands better the
importance of
standardization in
construction.
Figure 1.1. Formwork management map (PRES)

20
1.3. Research Questions
The review of the state of art and the state of practice related to formwork indicates that prior
research has focused on design, constructability, and selection criteria for formwork, but not on
formwork planning and management. Formwork management involves complex tasks such as: (1)
workload leveling for reducing idle time of crews, (2) computing formwork quantities, (3) defining
formwork schedules, and (4) defining the best formwork reuse scheme for getting best formwork
efficiency. All these tasks have challenges such as: (1) high probability of human errors since most
of the tasks are manually done using CAD or PDF software with spreadsheets, (2) BIM tools are
not commonly used for formwork since modeling of temporary structures is time- consuming and
associated with additional investment, and (3) traditional tools like CAD and PDF editors require
engineers to invest considerable time for selecting formwork reuse schemes, formwork systems or
suppliers. Considering the challenges, the thesis addressees the following research questions:
1. What is the most appropriate Level of Development (LOD) for formwork management using
BIM tools considering current practitioners’ preferences in building projects?
2. What is the appropriate rental option for managing formwork through different project phases
(initiation, planning, execution, control, and closure) considering current practitioners’
preferences in building projects?
3. Based on current practices, how can formwork management tasks (e.g., workload leveling,
quantity takeoff computation, defining reuse scheme and schedules) be more automated?
1.4. Research Objective
Based on the research questions listed in Section 1.3, the research objective of this study is to
design, develop, and test a BIM-based tool for formwork management in building projects. The
design of the BIM-based tool involves assessing practitioners’ preference related to LOD for
formwork modeling, rental options, and level of automation for formwork management tasks, and
then uses practitioners’ preferences (regarding LOD, rental option and automation) for defining
BIM parameters to store data for future analyses related to formwork management. The
development of the BIM-based tool is a two-phase process. The first phase is the automation of
the modeling process of a formwork BIM model enriched with data necessary for performing
formwork management. The second phase is focused on using the BIM model from the first phase

21
for automating formwork management tasks such as: (1) creating a formwork schedule, (2)
performing formwork cost analysis, and (3) computing three formwork Key Performance Indices
(KPIs) (formwork total cost rate (USD$/m2), reuse factor (number of uses/number of formwork
sets) and formwork efficiency (formwork quantity/formwork rented). The BIM-based tool is tested
on two case studies (twenty-story building and five-story-building with the same constructed area),
and the KPIs for formwork management on these projects are compared.
1.5. Research Framework
Based on a synthesis of prior studies in formwork management and review of current practices in
building projects, the proposed tool uses Lean principles (create flow and establish pull) and BIM
methodology for the automation of formwork scheduling, cost analysis, and determination of KPIs.
The BIM-based tool is executed in Revit 2020, the most popular BIM software package currently
used in the AEC industry. Dynamo 2.1.0 is used to implement automation scripts using visual
programming. The BIM-based tool is implemented using the following components.
1. Work Zones Leveling with Revit:
a. Listing of BIM parameters to implement leveling process.
b. Development of template view with filters based on BIM parameters.
c. Development of quantity takeoff schedules to balance labor hours in each work
zone after defining the work zone layout.
2. Formwork BIM modeling with Revit and Dynamo:
A set of tools designed in Dynamo for Revit are developed for automating: (1) the auditing process
of an existing BIM model, (2) modeling formwork considering practitioners’ preferences
regarding LOD, and (3) populating data necessary in the BIM model for formwork management.
3. Formwork Management with Revit and Dynamo:
A set of tools designed in Dynamo for Revit are developed for automating: (1) the computation of
formwork quantities, (2) defining the formwork demand, (3) preparing a formwork cost analysis,
(4) computing formwork KPIs, and creating 4D and 5D simulations.

22
1.6. Research Methodology
Lean principles and BIM tools are used to address the gaps found in the literature review related
to work zone leveling and formwork management. There are six phases in the research
methodology.
1. Review of the state of the art and state of practice. A survey instrument was developed, tested,
and then deployed to AEC practitioners (contractors, BIM specialists and consultants,
formwork experts (manufacturers, providers, renting companies), and academics to determine
common practices and preferences related to BIM modeling for formwork management, BIM
automation, and formwork renting options.
2. BIM modeling. A BIM-based tool using Revit is developed for formwork modeling based on
building structural elements considering practitioners’ preferences based on survey results. A
list of BIM shared parameters is also created to enhance work zone leveling and formwork
analysis. Multiple Dynamo Scripts are implemented to automate various processes for BIM
modeling.
3. Development of work zones layout. A BIM process using Lean principles (create flow and
establish pull) is then developed to facilitate the implementation of this BIM based tool for
planning of projects.
4. Formwork management. A BIM-based tool using Revit and Navisworks is created for
performing a cost analysis that considers the average total cost for a building project. Multiple
Dynamo Scripts are implemented to automate various processes for formwork management
tasks.
5. Testing using two case studies. The BIM-based tool for formwork modeling and management
is tested using examples of a 20-story building (46,650 m2 high-rise office building) and a 5-
story building (46,650 m2 mall Structure)
6. Analysis of results. The formwork schedules, cost analyses, and KPIs like cost rate, reuse
factor and formwork efficiency are compared when the BIM-based tool is applied for
formwork management for the two projects (the 20-story building and the 5-story building).
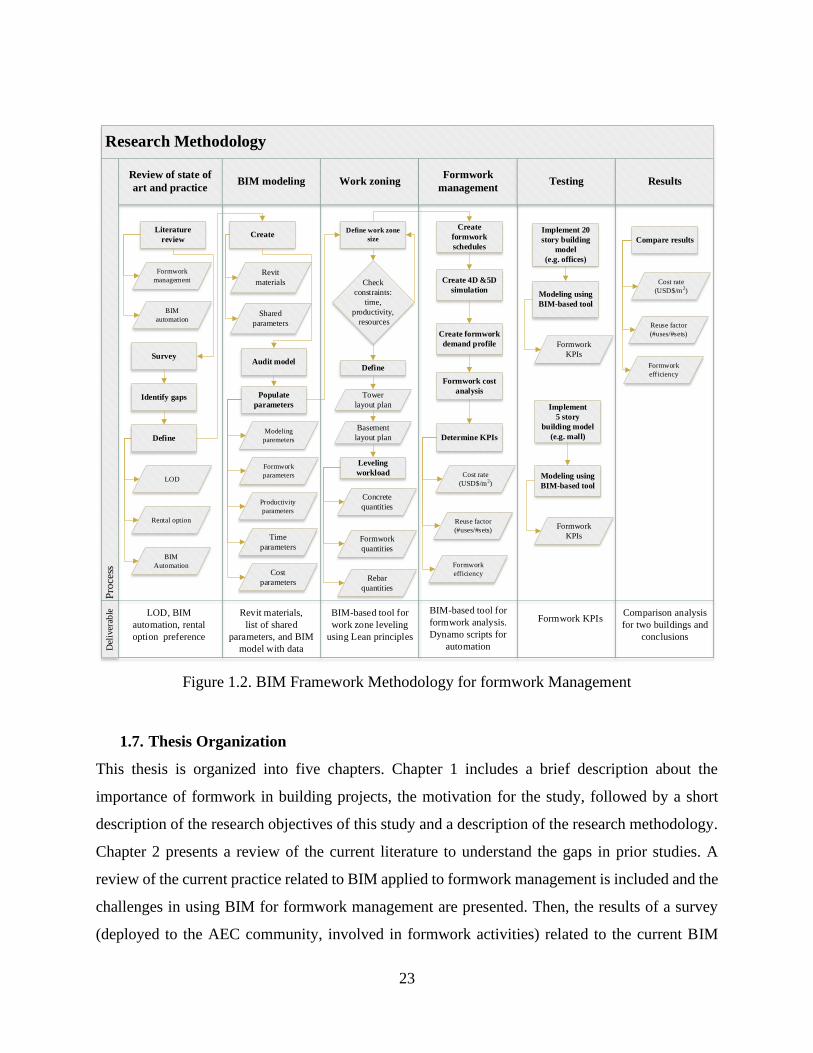
Figure 1.2 shows a flowchart of the research methodology. Each column groups the process
flowchart for each of the phases described previously in this section. At the bottom of each column
a brief description of the expected deliverables for each phase is presented.
23
Research Methodology
Review of state of
art and practiceBIM modeling Work zoning
Formwork
managementTesting Results
Pro
cess
Del
iver
able
Literature
review
Formwork
management
Survey
Identify gaps
Define
BIM
automation
LOD
Rental option
Create
Revit
materials
Shared
parameters
Populate
parameters
Modeling
paremeters
Formwork
parameters
Define work zone
size
Check
constraints:
time,
productivity,
resources
Define
Tower
layout plan
Basement
layout plan
Leveling
workload
Concrete
quantities
Formwork
quantities
Rebar
quantities
Create
formwork
schedules
Create 4D &5D
simulation
Create formwork
demand profile
Formwork cost
analysis
Determine KPIs
Cost rate
(USD$/m2)
Reuse factor
(#uses/#sets)
Formwork
efficiency
Implement 20
story building
model
(e.g. offices)
Implement
5 story
building model
(e.g. mall)
Modeling using
BIM-based tool
Formwork
KPIs
Modeling using
BIM-based tool
Formwork
KPIs
Compare results
LOD, BIM
automation, rental
option preference
Revit materials,
list of shared
parameters, and BIM
model with data
BIM-based tool for
work zone leveling
using Lean principles
BIM-based tool for
formwork analysis.
Dynamo scripts for
automation
Formwork KPIs Comparison analysis
for two buildings and
conclusions
Productivity
parameters
Time
parameters
Cost
parameters
Audit model
Cost rate
(USD$/m2)
Reuse factor
(#uses/#sets)
Formwork
efficiency
BIM
Automation
Figure 1.2. BIM Framework Methodology for formwork Management
1.7. Thesis Organization
This thesis is organized into five chapters. Chapter 1 includes a brief description about the
importance of formwork in building projects, the motivation for the study, followed by a short
description of the research objectives of this study and a description of the research methodology.
Chapter 2 presents a review of the current literature to understand the gaps in prior studies. A
review of the current practice related to BIM applied to formwork management is included and the
challenges in using BIM for formwork management are presented. Then, the results of a survey
(deployed to the AEC community, involved in formwork activities) related to the current BIM

24
preferences and formwork renting options are presented. Chapter 3 provides a detailed description
of the functionality of the BIM-based tool developed for automating the processes related to: (1)
creating parameters and materials, (2) auditing a BIM model for formwork management, (3)
formwork modeling, and (4) populating BIM parameters. Chapter 4 describes the functionality of
the BIM-based tool developed for automating formwork management tasks such as: (1) computing
formwork quantities takeoffs, (2) determining the formwork demand, (3) performing a formwork
cost analysis, (4) computing formwork management KPIs, (5) preparing 4D and 5D simulations,
and (6) creating layouts with color-coded mapping for tracking formwork. Two case studies are
also presented in Chapter 4 to evaluate the BIM-based tool for formwork modeling and formwork
management. The results of the KPIs obtained for both buildings are compared and analyzed. The
two case studies are: (1) a 20-story building that represent a typical office building, and (2) a 5-
story building that represents a mall. Both buildings have the same built area but different
footprints and heights to analyze different cases of formwork analysis and work zone leveling.
Chapter 5 summarizes the results obtained, the conclusion based on the analyses, the key
contributions of the new BIM framework, limitations of the current work, as well as
recommendations for future research.

25
REVIEW OF THE STATE OF THE ART AND STATE OF PRACTICE
IN FORMWORK MANAGEMENT
This chapter provides a synthesis of prior research in formwork management. Prior research
related to the use of BIM technologies to improve the efficiency of formwork is reviewed to
determine: (1) the current needs of the industry for managing formwork as well as the adoption of
BIM for this purpose, and (2) the gaps in the current research related to formwork modeling,
planning and management using BIM. To complement the literature reviewed, a review of
developments by some well-known formwork companies is conducted to understand the current
use of BIM. Finally, the aggregated results of a survey deployed to a group of Architecture,
Engineering, and Construction (AEC) practitioners involved with formwork management on
building projects, are presented to gauge the needs about: (1) Level of Development (LOD) for
BIM formwork modeling, (2) the preferences about formwork rental options, and (3) the level of
automation of the current practice for formwork management processes.
2.1 Formwork management in building projects
Formwork management includes five main phases in a reinforced concrete building project
(initiation, planning, execution, monitor and control, and closing). The initiation phase deals with
the formwork needs on the project. The planning phase involves defining the formwork system
needed, formwork supplier, most efficient formwork reuse scheme, and formwork set size required
for the execution. The execution phase includes all tasks related to performing the project activities
that entail formwork (procuring, erecting, stripping, handling, maintaining, and cleaning). The
monitoring and control phase includes tracking the scope, cost, and time for formwork activities
and accomplishing the objectives regarding these three aspects. The closing phase is the formwork
demobilization based on a formwork schedule, and processing of lien release documents issued by
the formwork supplier since there are multiple costs that are claimed at the end of the rental period
(penalties for formwork damages, replacement of lost formwork, final cleaning, and maintenance
of formwork system, and preparation for transportation). The most significant aspect of formwork
management is concentrated in the planning phase and in the monitoring and control phase. The
next subsections are focused on these two phases (planning, monitor and control).
26
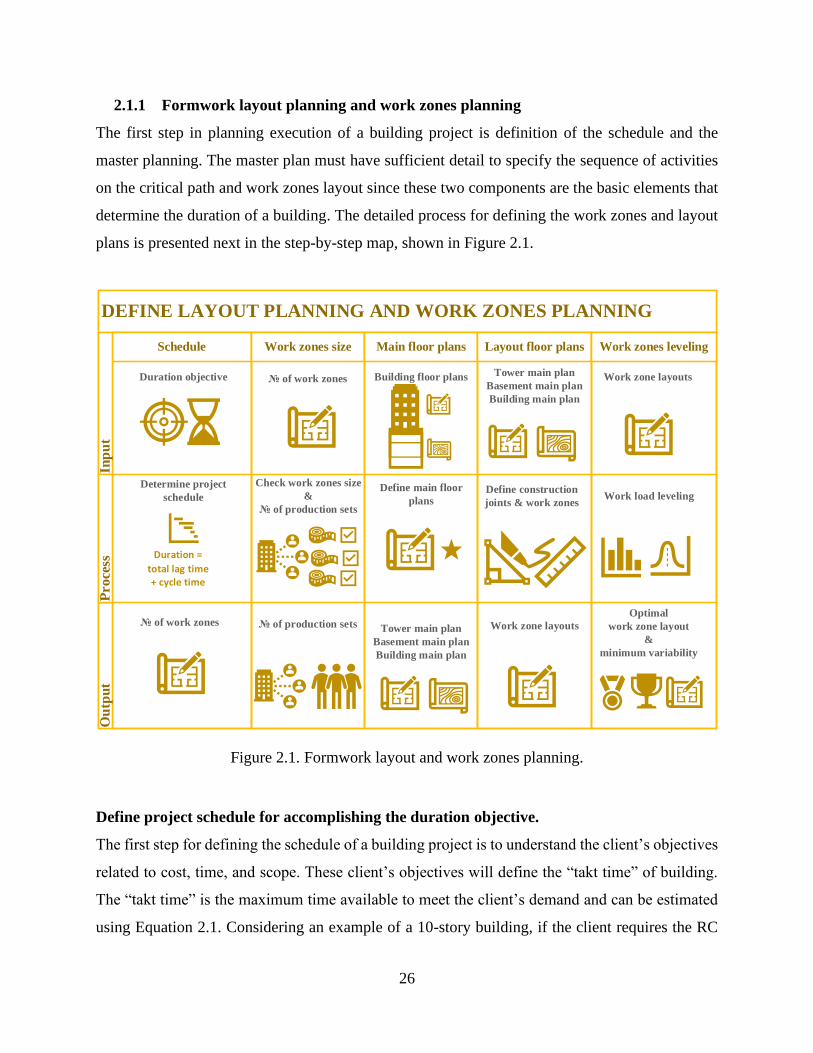
2.1.1 Formwork layout planning and work zones planning
The first step in planning execution of a building project is definition of the schedule and the
master planning. The master plan must have sufficient detail to specify the sequence of activities
on the critical path and work zones layout since these two components are the basic elements that
determine the duration of a building. The detailed process for defining the work zones and layout
plans is presented next in the step-by-step map, shown in Figure 2.1.
DEFINE LAYOUT PLANNING AND WORK ZONES PLANNING
Schedule Work zones size Main floor plans Layout floor plans Work zones leveling
Ou
tpu
tIn
pu
tP
roce
ss
Duration objective
Determine project
schedule
of work zones
of work zones
Check work zones size
&
of production sets
of production sets
Building floor plans
Define main floor
plans
Tower main plan
Basement main plan
Building main plan
Tower main plan
Basement main plan
Building main plan
Work zone layouts
Define construction
joints & work zones
Work zone layouts
Work load leveling
Optimal
work zone layout
&
minimum variability
Duration = total lag time + cycle time
Figure 2.1. Formwork layout and work zones planning.
Define project schedule for accomplishing the duration objective.
The first step for defining the schedule of a building project is to understand the client’s objectives
related to cost, time, and scope. These client’s objectives will define the “takt time” of building.
The “takt time” is the maximum time available to meet the client’s demand and can be estimated
using Equation 2.1. Considering an example of a 10-story building, if the client requires the RC

27
framing of the building to be completed in 65 working days, then applying Equation 2.1 the “takt
time” for a single story of the building will be equal to 6.5 days/story.
𝑇𝑎𝑘𝑡 𝑡𝑖𝑚𝑒 =𝑃𝑟𝑜𝑑𝑢𝑐𝑡𝑖𝑜𝑛 𝑡𝑖𝑚𝑒 𝑎𝑣𝑎𝑖𝑙𝑎𝑏𝑙𝑒
𝑅𝑒𝑞𝑢𝑖𝑟𝑒𝑑 𝑢𝑛𝑖𝑡𝑠 𝑜𝑓 𝑝𝑟𝑜𝑑𝑢𝑐𝑡𝑖𝑜𝑛 (𝑐𝑙𝑖𝑒𝑛𝑡 𝑑𝑒𝑚𝑎𝑛𝑑)(2.1)
𝑇𝑎𝑘𝑡 𝑡𝑖𝑚𝑒 =65 𝑑𝑎𝑦𝑠
10 𝑠𝑡𝑜𝑟𝑖𝑒𝑠= 6.5 𝑑𝑎𝑦𝑠/𝑠𝑡𝑜𝑟𝑦
According to the “theory of constraints” of Goldratt (2014), a production system should be
subordinated and synchronized to the process constraint (bottleneck activity). Based on criterion,
in a linear scheduling like the case of high-rise buildings, all the activities should be synchronized
to the same “cycle time”. The “cycle time” is the actual time a product is in process. Since “cycle
time” only considers the time a product is in progress (net production time), then it must be lesser
than the “takt time”. Equation 2.2 shows the mathematical expression of the “cycle time.” In the
case of the 10-story building, the maximum “cycle time” for every story of the building will be 6
days/story. Hence, the floor “cycle time” will be 6 days/story since we are considering full days in
a construction schedule.
𝐶𝑦𝑐𝑙𝑒 𝑡𝑖𝑚𝑒 =𝑁𝑒𝑡 𝑝𝑟𝑜𝑑𝑢𝑐𝑡𝑖𝑜𝑛 𝑡𝑖𝑚𝑒
𝑁𝑢𝑚𝑏𝑒𝑟 𝑜𝑓 𝑢𝑛𝑖𝑡𝑠 𝑝𝑟𝑜𝑑𝑢𝑐𝑒𝑑 < 𝑇𝑎𝑘𝑡 𝑡𝑖𝑚𝑒 (2.2)
The third Lean metric is the “lead time”, which is the time considered since the first production
process starts until the product is finished. The difference between the “lead time” and the “cycle
time” is the “total lag time” between activities. The “lead time” is represented by Equation 2.3.
𝐿𝑒𝑎𝑑 𝑡𝑖𝑚𝑒 = 𝐶𝑦𝑐𝑙𝑒 𝑡𝑖𝑚𝑒 + 𝑇𝑜𝑡𝑎𝑙 𝑙𝑎𝑔 𝑡𝑖𝑚𝑒 (2.3)
In the example of the 10-story building, the “cycle time” and the “lead time” are graphically
represented in the lookahead schedule (without considering weekends and holidays) in Figure 2.2
for the first work zone and for the first story of the building. The “lead time” for a work zone in
the lookahead schedule represented in Figure 2.2 is 6 days (cycle time of 1 day + total lag time of

28
5 days). Similarly, the “lead time” for a story in 10-story building is 11 days (cycle time of 6 days
+ total lag time of 5 days) shown in Figure 2.2.
Figure 2.2. Lookahead schedule for 1st story of 10-story building
Since each story has 6 work zones (because of the cycle time selected) the total number of work
zones in the building will be 60 work zones (for the 10-story building). The duration of the RC
framing structure of building is defined by Equation 2.4 and is 65 days (total lag time of 5 days +
cycle time of 1 day/work zone multiply by the 60 work zones)
𝐷𝑢𝑟𝑎𝑡𝑖𝑜𝑛 = 𝑇𝑜𝑡𝑎𝑙 𝑙𝑎𝑔 𝑡𝑖𝑚𝑒 + 𝑊𝑜𝑟𝑘 𝑧𝑜𝑛𝑒 𝑐𝑦𝑐𝑙𝑒 𝑡𝑖𝑚𝑒 𝑥 𝑁𝑢𝑚𝑏𝑒𝑟 𝑜𝑓 𝑤𝑜𝑟𝑘 𝑧𝑜𝑛𝑒𝑠 (2.4)
Figure 2.3 shows the lookahead schedule of the last story (level 10), and Figure 2.4 show the
relationship between the program chart and the objective chart of the 10-story building example.
Figure 2.3 shows the activities of the day 60 in the lookahead, and Figure 2.4 shows the activities
graphically represented in a 3D view of the building. Each work zone is represented with a
different color, showing the activities executed each day on each work zone and each level. The
lead time for the first story (11 days) is also shown on the program chart (for a story) and the
objective chart in Figure 2.4. The total duration of the building (65 days) is represented in the
lookahead schedule of Figure 2.3 and the objective chart of Figure 2.4.
ACTIVITY Day 1 Day 2 Day 3 Day 4 Day 5 Day 6 Day 7 Day 8 Day 9 Day 10 Day 11
Verticals rebar installation WZ-1 WZ-2 WZ-3 WZ-4 WZ-5 WZ-6
Verticals formwork installation WZ-1 WZ-2 WZ-3 WZ-4 WZ-5 WZ-6
Verticals concrete placing WZ-1 WZ-2 WZ-3 WZ-4 WZ-5 WZ-6
Beam formwork support WZ-1 WZ-2 WZ-3 WZ-4 WZ-5
Beam steel reinforcement WZ-1 WZ-2 WZ-3 WZ-4 WZ-5 WZ-6
Beam formwork sides WZ-1 WZ-2 WZ-3 WZ-4 WZ-5 WZ-6
Precast slab support WZ-1 WZ-2 WZ-3 WZ-4 WZ-5 WZ-6
Precast slab placing WZ-1 WZ-2 WZ-3 WZ-4 WZ-5 WZ-6
Slab steel reinforcement WZ-1 WZ-2 WZ-3 WZ-4 WZ-5 WZ-6
MEP conduit rough in WZ-1 WZ-2 WZ-3 WZ-4 WZ-5 WZ-6
Horizontal concrete placing WZ-1 WZ-2 WZ-3 WZ-4 WZ-5 WZ-6
Story cycle timeWork zone lead time
Story lead time
Work zone cycle time
Total lag time

29
Figure 2.3. Lookahead for 10-story building
Figure 2.4. Program chart and objective chart for 10-story building
Verify work zones size and number of productions sets.
Once the number of work zones required to reach the duration objective is determined, there are
two main verification steps that are undertaken. The first verification step is the determination of
the size of each work zone which is directly related to the “concrete placement rate”, defined as
Lookahead story level 10
ACTIVITY Day 55 Day 56 Day 57 Day 58 Day 59 Day 60 Day 61 Day 62 Day 63 Day 64 Day 65
Verticals rebar installation WZ-55 WZ-56 WZ-57 WZ-58 WZ-59 WZ-60
Verticals formwork installation WZ-55 WZ-56 WZ-57 WZ-58 WZ-59 WZ-60
Verticals concrete placing WZ-55 WZ-56 WZ-57 WZ-58 WZ-59 WZ-60
Beam formwork support WZ-55 WZ-56 WZ-57 WZ-58 WZ-59 WZ-60
Beam steel reinforcement WZ-55 WZ-56 WZ-57 WZ-58 WZ-59 WZ-60
Beam formwork sides WZ-55 WZ-56 WZ-57 WZ-58 WZ-59 WZ-60
Precast slab support WZ-55 WZ-56 WZ-57 WZ-58 WZ-59 WZ-60
Precast slab placing WZ-55 WZ-56 WZ-57 WZ-58 WZ-59 WZ-60
Slab steel reinforcement WZ-55 WZ-56 WZ-57 WZ-58 WZ-59 WZ-60
MEP conduit rough in WZ-55 WZ-56 WZ-57 WZ-58 WZ-59 WZ-60
Horizontal concrete placing WZ-55 WZ-56 WZ-57 WZ-58 WZ-59 WZ-60
Program Chart (Lead Time)WZ-6 WZ-5 WZ-5 WZ-4 WZ-3 WZ-3 WZ-3 WZ-2 WZ-2 WZ-2 WZ-1
12 11 10 9 8 7 6 5 4 3 2 1
Verticals
rebar
installation
Vertical
formwork
installation
Verticals
concrete
placing
Beam
formwork
support
Beam steel
reinforcement
Beam
formwork
sides
Precast slab
support
Precast slab
placing
Slab steel
reinforcement
MEP conduit
rough in
Horizontal
concrete
placing
11 10 9 8 7 6 5 4 3 2 1 0
1 day 1 day 1 day 1 day 1 day 1 day 1 day 1 day 1 day 1 day 1 day
0
1
2
3
4
5
6
7
8
9
10
0
10
20
30
40
50
60
0 11 17 23 29 35 41 47 53 59 65
Flo
ors
Wo
rk z
on
es
Working days
Objective Chart
Activities day 60Work zonning
30
the volume of concrete that the “production team” can place each working day considering project
constraints (easy access of concrete mixers, equipment used for placing concrete, frequency of
concrete delivery, lateral pressure capacity of forms, etc.). For example, if the production team
uses a concrete pump, and the frequency of concrete delivery is 28 m3/hour over an 8-hour shift,
then the daily concrete placement rate will be between 100 to 150 m3 to cover 200 or 250 m2 of
building area.
The second verification step involves checking the number of “production teams” or “production
sets”. A “production set” is the group of resources necessary for producing the daily work. A
production set in a building project is composed of the crews of each trade and the equipment
allocated to these crews (crane, concrete pump, fleet of mixers, etc.). The definition of the number
of production sets will affect the schedule and budget of a project, such leading to a tradeoff
between the time and cost objectives. Typically, time will overrule in this tradeoff since reduction
of time will be associated with reduction in overhead costs and rental costs. Since each
“production set” should have an independent set of resources, to ensure the production flow, each
production set should be able to build the work zone size defined in the previous step (200 to 250
m2 of building area).
Define building main floor plans.
The “work zoning” process starts identifying the typical floor plans for the. High-rise buildings
typically have a one layout for the floor plans underground and another layout for the above ground
floor plans. For example, Figure 2.5 shows a building where all the floor plans underground have
a similar area, distribution of elements, and probably similar quantities of work. Similarly, Figure
2.5 shows that the floor plans of the tower are the same or might be slightly different. In the case
of the example shown in Figure 2.5, there are two different layout floor plans: one that represents
all the stories underground, and another that represents all the stories above ground. In other high-
rise buildings there may be different floor plans, depending on the variability of the shapes, areas,
and distribution of vertical elements (columns and walls) between different stories.

31
Figure 2.5. Elevation view and 3D view of typical parts and stories of a building to define main
layout plans.
Define the main layout floor plan of the building.
In the previous step, the main floor plans of the building were identified. For the example shown
(see Figure 2.5) the building only has two main floor plans (one for the tower and one for the
basement). Once the main floor plans are identified the next step is to select which plan will be the
“main layout floor plan”, that will be used to “trace” the boundaries of the work zones, and to
project these imaginary lines (boundaries of work zones) to the rest of floor plans. These work
zone boundaries will be the “construction joints” in the horizontal elements (slabs and beams)
during concrete placement for floors. For the example shown in Figure 2.5, the “main layout floor
plan” of the building will be the “main floor plan” of the tower (above ground portion of the
building), because is representative of the floor plans of all/majority of the floors in the building.
Layout floor plans and work zones leveling
Ideally the work zones should have similar amount of work, both in term of work zone balance,
and in terms of labor requirements. The algorithm for optimizing the work zones leveling can be
described as shown in Equation 2.5.

32
min𝑖,𝑗
(𝛿𝐶 + 𝛿𝐹 + 𝛿𝑅) (2.5)
Where:
"𝛿𝐶" 𝑖𝑠 𝑡ℎ𝑒 𝑣𝑎𝑟𝑖𝑎𝑡𝑖𝑜𝑛 𝑜𝑓 𝑙𝑎𝑏𝑜𝑟 ℎ𝑜𝑢𝑟𝑠 𝑏𝑒𝑡𝑤𝑒𝑒𝑛 𝑡𝑤𝑜 𝑐𝑜𝑛𝑠𝑒𝑐𝑢𝑡𝑖𝑣𝑒 𝑤𝑜𝑟𝑘 𝑧𝑜𝑛𝑒𝑠 𝑓𝑜𝑟 𝑡ℎ𝑒 𝑐𝑜𝑛𝑐𝑟𝑒𝑡𝑒 𝑡𝑟𝑎𝑑𝑒
"𝛿𝐹" 𝑖𝑠 𝑡ℎ𝑒 𝑣𝑎𝑟𝑖𝑎𝑡𝑖𝑜𝑛 𝑜𝑓 𝑙𝑎𝑏𝑜𝑟 ℎ𝑜𝑢𝑟𝑠 𝑏𝑒𝑡𝑤𝑒𝑒𝑛 𝑡𝑤𝑜 𝑐𝑜𝑛𝑠𝑒𝑐𝑢𝑡𝑖𝑣𝑒 𝑤𝑜𝑟𝑘 𝑧𝑜𝑛𝑒𝑠 𝑓𝑜𝑟 𝑡ℎ𝑒 𝑓𝑜𝑟𝑚𝑤𝑜𝑟𝑘 𝑡𝑟𝑎𝑑𝑒
"𝛿𝑅" 𝑖𝑠 𝑡ℎ𝑒 𝑣𝑎𝑟𝑖𝑎𝑡𝑖𝑜𝑛 𝑜𝑓 𝑙𝑎𝑏𝑜𝑟 ℎ𝑜𝑢𝑟𝑠 𝑏𝑒𝑡𝑤𝑒𝑒𝑛 𝑡𝑤𝑜 𝑐𝑜𝑛𝑠𝑒𝑐𝑢𝑡𝑖𝑣𝑒 𝑤𝑜𝑟𝑘 𝑧𝑜𝑛𝑒𝑠 𝑓𝑜𝑟 𝑡ℎ𝑒 𝑟𝑒𝑏𝑎𝑟 𝑡𝑟𝑎𝑑𝑒
𝛿𝐶 = ∑ (∑ (𝑄𝑇𝑂𝐶𝑖 𝑗. 𝑃𝐶 )
𝑛
𝑖=1
− ∑ (𝑄𝑇𝑂𝐶𝑖 𝑗−1. 𝑃𝐶)
𝑛
𝑖=1
)
𝑚
𝑗=2
(2.6)
𝛿𝐹 = ∑ (∑ (𝑄𝑇𝑂𝐹𝑖 𝑗. 𝑃𝐹 )
𝑛
𝑖=1
− ∑ (𝑄𝑇𝑂𝐹𝑖 𝑗−1. 𝑃𝐹)
𝑛
𝑖=1
)
𝑚
𝑗=2
(2.7)
𝛿𝑅 = ∑ (∑ (𝑄𝑇𝑂𝑅𝑖 𝑗. 𝜌. 𝑃𝑅 )
𝑛
𝑖=1
− ∑ (𝑄𝑇𝑂𝑅𝑖 𝑗−1. 𝜌. 𝑃𝑅)
𝑛
𝑖=1
)
𝑚
𝑗=2
(2.8)
Subject to:
𝐻1: 𝑄𝑇𝑂𝐶𝑖 𝑗= 𝐶𝑜𝑛𝑐𝑟𝑒𝑡𝑒 𝑣𝑜𝑙𝑢𝑚𝑒 𝑜𝑓 𝑒𝑙𝑒𝑚𝑒𝑛𝑡 𝑡𝑦𝑝𝑒 "𝑖" 𝑖𝑛 𝑤𝑜𝑟𝑘 𝑧𝑜𝑛𝑒 "𝑗"
𝐻2: 𝑄𝑇𝑂𝐹𝑖 𝑗= 𝐹𝑜𝑟𝑚𝑤𝑜𝑟𝑘 𝑐𝑜𝑛𝑡𝑎𝑐𝑡 𝑎𝑟𝑒𝑎 𝑜𝑓 𝑒𝑙𝑒𝑚𝑒𝑛𝑡 𝑡𝑦𝑝𝑒 "𝑖" 𝑖𝑛 𝑤𝑜𝑟𝑘 𝑧𝑜𝑛𝑒 "𝑗"
𝐻3 : ∑ (𝑄𝑇𝑂𝐶𝑗)
𝑚
𝑗=1
= 𝑇𝑜𝑡𝑎𝑙 𝑐𝑎𝑠𝑡 𝑖𝑛 𝑝𝑙𝑎𝑐𝑒 𝑐𝑜𝑛𝑐𝑟𝑒𝑡𝑒 𝑣𝑜𝑙𝑢𝑚𝑒 𝑖𝑛 𝑡ℎ𝑒 𝑒𝑛𝑡𝑖𝑟𝑒 𝑏𝑢𝑖𝑙𝑑𝑖𝑛𝑔
𝐻4 : ∑ (𝑄𝑇𝑂𝐹𝑗)
𝑚
𝑗=1
= 𝑇𝑜𝑡𝑎𝑙 𝑐𝑜𝑛𝑡𝑎𝑐𝑡 𝑎𝑟𝑒𝑎 𝑜𝑓 𝑓𝑜𝑟𝑚𝑤𝑜𝑟𝑘 𝑖𝑛 𝑡ℎ𝑒 𝑒𝑛𝑡𝑖𝑟𝑒 𝑏𝑢𝑖𝑙𝑑𝑖𝑛𝑔
𝐻5: Columns, Shear walls cannot be split
𝐻6: 𝐶𝑜𝑛𝑠𝑡𝑟𝑢𝑐𝑡𝑖𝑜𝑛 𝑗𝑜𝑖𝑛𝑡𝑠 𝑓𝑜𝑟 ℎ𝑜𝑟𝑖𝑧𝑜𝑛𝑡𝑎𝑙 𝑒𝑙𝑒𝑚𝑒𝑛𝑡𝑠 𝑤𝑖𝑡ℎ𝑖𝑛 𝑚𝑖𝑑𝑑𝑙𝑒 𝑡ℎ𝑖𝑟𝑑 𝑜𝑓 𝑠𝑝𝑎𝑛
Where:
𝑄𝑇𝑂𝐶𝑖𝑗= 𝐶𝑜𝑛𝑐𝑟𝑒𝑡𝑒 𝑣𝑜𝑙𝑢𝑚𝑒 𝑜𝑓 𝑒𝑙𝑒𝑚𝑒𝑛𝑡 𝑡𝑦𝑝𝑒 "𝑖" 𝑜𝑓 𝑤𝑜𝑟𝑘 𝑧𝑜𝑛𝑒 "𝑗" (𝑚3)
𝑄𝑇𝑂𝐹𝑖𝑗= 𝐹𝑜𝑟𝑚𝑤𝑜𝑟𝑘 𝑐𝑜𝑛𝑡𝑎𝑐𝑡 𝑎𝑟𝑒𝑎 𝑜𝑓 𝑒𝑙𝑒𝑚𝑒𝑛𝑡 𝑡𝑦𝑝𝑒 "𝑖" 𝑜𝑓 𝑤𝑜𝑟𝑘 𝑧𝑜𝑛𝑒 "𝑗" (𝑚2)
𝑃𝐶 = 𝐿𝑎𝑏𝑜𝑟 𝑝𝑟𝑜𝑑𝑢𝑐𝑡𝑖𝑣𝑖𝑡𝑦 𝑓𝑜𝑟 𝑐𝑜𝑛𝑐𝑟𝑒𝑡𝑒 𝑝𝑙𝑎𝑐𝑖𝑛𝑔 (𝑙𝑎𝑏𝑜𝑟 ℎ𝑜𝑢𝑟𝑠/𝑚3)
𝑃𝐹 = 𝐿𝑎𝑏𝑜𝑟 𝑝𝑟𝑜𝑑𝑢𝑐𝑡𝑖𝑣𝑖𝑡𝑦 𝑓𝑜𝑟 𝑓𝑜𝑟𝑚𝑤𝑜𝑟𝑘 𝑒𝑟𝑒𝑐𝑡𝑖𝑜𝑛 (𝑙𝑎𝑏𝑜𝑟 ℎ𝑜𝑢𝑟𝑠/𝑚2)
𝑃𝑅 = 𝐿𝑎𝑏𝑜𝑟 𝑝𝑟𝑜𝑑𝑢𝑐𝑡𝑖𝑣𝑖𝑡𝑦 𝑓𝑜𝑟 𝑟𝑒𝑏𝑎𝑟 𝑝𝑟𝑒𝑝𝑎𝑟𝑎𝑡𝑖𝑜𝑛 𝑎𝑛𝑑 𝑖𝑛𝑠𝑡𝑎𝑙𝑙𝑎𝑡𝑖𝑜𝑛 (𝑙𝑎𝑏𝑜𝑟 ℎ𝑜𝑢𝑟𝑠/𝑘𝑔)
𝜌𝑖 = 𝑅𝑒𝑖𝑛𝑓𝑜𝑟𝑐𝑒𝑚𝑒𝑛𝑡 𝑟𝑎𝑡𝑖𝑜 𝑜𝑓 𝑒𝑙𝑒𝑚𝑒𝑛𝑡 𝑡𝑦𝑝𝑒 "𝑖" (𝑘𝑔/𝑚3)

33
For the “labor productivity” values (PC, PF, PR) ideally each contractor would use historical data
from previous projects. An example of these values based on multiple building projects (data from
34 RC buildings in Peru) are shown in Table 2.1. The buildings shown in the Table 2.1 are RC
mixed structures of columns, shear walls, beams, and flat slabs.
Table 2.1. Labor productivity values
Office Education Hospitality Housing Overall
Description Unit LH/unit LH/unit LH/unit LH/unit LH/unit
Concrete m3 1.40 1.73 1.55 1.44 1.45
Formwork m2 1.56 1.68 1.65 1.60 1.61
Rebar Kg 0.044 0.048 0.044 0.049 0.045
A practical way to estimate the quantity of work in each work zone based on the area is using ratios
of concrete, formwork, and rebar quantities. An example of these ratios based on multiple building
projects are shown in Table 2.2 but there are several references for obtaining these values
(including historical data, or RS Means).
Table 2.2. QTO ratios per square construction area.
AVERAGE RATIOS PER M2
m3/m2 m2/m2 Kg/m2
DESCRIPTION CONCRETE FORMWORK REBAR
Foundations 0.03 0.02 1.55
Vertical Elements 0.10 0.56 17.99
Horizontal Elements 0.20 1.03 29.47
Total 0.33 1.62 49.01
Steel reinforcement ratio: Rebar/concrete kg/m3 149.93
2.1.2 Formwork systems
A formwork system is the assembly of components that together are designed for forming or
shoring a specific concrete element newly placed. The omission of one component of the formwork
system during the assembly may cause an unsafety condition or even an accident, since the design
of these systems is only guaranteed if all the components are working together. There are two
groups of formwork systems: (1) modular prefabricated formwork systems, and (2) jobsite-built
formwork systems. The use of modular prefabricated formwork systems is gaining momentum in

34
construction, and conventional methods like using jobsite-built formworks are becoming less
popular in the industry. Typically, modular prefabricated formwork is made of materials with
better durability for several uses, and prefabricated formwork manufacturers provide their
customers with technical, logistic, and training support. In contrast, job-site formwork is prepared
with materials that fewer number of uses, and all the design, logistics and training is entirely the
responsibility of the contractor. Typically prefabricated modular formwork is rented by contractors.
Modular formwork is available in standard sizes, and the use of a specific formwork system will
depend on the features of the building project (shapes, dimensions, lateral form pressure, etc.).
Also, renting prefabricated modular formwork instead of owning it, provides of other advantages
like: (1) low initial investment, (2) low risk of the investment in case of fluctuation in the market,
(3) capacity to reduce or increase the demand of equipment at any time of the project, and (4)
capacity to obtain the latest technology. Figure 2.6 shows a map of the most common formwork
systems available for building projects.
Formwork Systems
Walls Decking Support Beams
Climbing
Handset
Lightweight
Frame
Heavyweight
Frame
Girder Wall
Aluminum
Tunnel
Voided
Flat Slab
Precast
Lattice Girder
Prestressed
Posttensioned
Composite
Metal Deck
Short Height
Tall Height
Steel Prop
Aluminum Prop
& Braces
Scaffolding
Frames & Braces
Metal forms
& Ties
Squares &
Girders
Slip form
Jump Form
Self Climbing
Hardy Slab
Waffle
Hollow Core
Half Slab
Rib & Block
Wales for alignment: Yes
Weight: 25-35 kg/m2
Pressure: 3.5 – ton/m2
Only Crane Independent
Wales for alignment: No
Weight: 35-45 kg/m2
Pressure: 4.5 – ton/m2
Crane Independent
Wales for alignment: No
Weight: 45-65 kg/m2
Pressure: 6.5 – ton/m2
Only Crane dependent
Wales for alignment: Yes
Weight: 55 - 85 kg/m2
Pressure: > 8.5 ton/m2
Only Crane dependent
Wales for alignment: Yes
Weight: 12 - 18 kg/m2
Pressure: 4.5 – ton/m2
Only Crane Independent
Stringer & Joist
Joist & Props
Only Props
Figure 2.6. Formwork Systems Map. Adapted from (Jimenez, 2020)

35
From the perspective of the concrete contractor perspective who self-performs formwork
installation and considers renting formwork, the Request for Proposal (RFP) for selection of
formwork provider must consider technical specifications (lateral form pressure, headroom height,
working loads, concrete placement rate, etc.), and specific instructions to bidder about formwork
system scope. When doing a comparative analysis of proposals, the concrete contractor should
verify that all bids from bidders (in this case, formwork providers) are comparable, i.e., all
proposals must consider the same technical specifications, and similar/same complementary
accessories required for the project (crane accessories, railings, ladders, access gates, platforms,
hauling systems, etc.)
If technical proposals across formwork providers are similar, then factors such as cost, productivity,
and surface grade quality may be used to determine the low bidder though the “equivalent lump
sum” method. Generally, contractors are more cost conscious and will use a “cost analysis” to
compare options but there are techniques like “Choosing by Advantages” (CBA), “Analytical
Hierarchical Process” (AHP), and “Linear Scoring” that are able to consider multiple criteria even
when criteria are not easy to express in terms of cost.
2.1.3 Formwork rental options.
In the building industry there are two primary rental options for formwork systems: (1) renting by
pieces or components of the system for a specific duration (commonly in $/piece-month), and (2)
renting by solution for a specific use and for a specific duration (commonly expressed in $/m2-
month). The second option is more popular specially during the bidding process since it is easier
to estimate areas rather than a specific number of formwork pieces/components. Also, doing the
comparison between bids is easier if all proposals use the same measurement unit (m2 or m), since
formwork suppliers may have different components in their formwork systems. In addition, all
bidders should incorporate safety components like working decks and railings, as well as the
accessories required for handling by the cranes or forklifts. Figure 2.7 shows the most common
formwork solutions used in building projects. Formwork bidders commonly present their
proposals as unit prices for each system (as shown in Table 2.3).

36
Table 2.3. Typical formwork bid proposal.
Description of Solution Unit. Unit Price
($/month) System
Columns
Formwork Column h<3.60m m2
Formwork Column 3.60<h<6.70m m2
Formwork Column h>6.70m m2
Formwork Column circular m2
Walls
Formwork Wall h<3.60m m2
Formwork Wall 3.60<h<6.70m m2
Formwork Wall h>6.70m m2
Beams
Beam shoring h<3.60m ml
Beam shoring 3.60<h<6.70m ml
Beam shoring h>6.70m ml
Beam sides, Depth P<0.40m m2
Beam sides, Depth 0.40<P<0.70m m2
Beam sides, Depth 0.70<P<1.00m m2
Beam sides, Depth P>1.00m m2
Beam bottom (metal) m2
Beam bottom (plywood) m2
Slabs
Slab shoring h < 3.60 m. m2
Slab shoring h= 3.60 <h< 6.70 m. m2
Slab shoring= 3.60 <h< 6.70 m. m2
Slab shoring h> 6.70 m. m2

37
Formwork System Solutions
Vertical Element Horizontal Element
Column Shear Wall Beam Slab
Circular
Rectangular
m2
m2
S
D
T
S
D
T
One Side
Two Side
Water Tank
m2
m2
m2
S
D
T
S
D
T
S
D
T
Side m2
S
D
T
Bottom m2
Shoring &
Bracingm
S
D
T
Reshoring m
S
D
T
Shoring &
Bracingm
2
D
T
S
Cast In Place
Other D
T
S
Reshoring m2
D
T
S
Sheathing m2
S
D
T
Simple Headroom
Double Headroom
Triple Headroom
Figure 2.7. Formwork rental options map.

38
2.1.4 Formwork demand profile
Since work zones have different quantities of forming contact area, an ideal “contact area profile”
or “Formwork Used” profile (FU) could be plotted as shown in Figure 2.8. “Formwork used” (FU)
profile represents the sum of contact area of the formwork required for performing three phases:
(1) forming or shoring a new work zone, (2) holding concrete of a work zone newly placed, and
(3) holding concrete of all the previous work zones while concrete gains adequate compressive
strength to self-support its own weight and the construction loads.
Figure 2.8. Formwork demand profiles
The number of formwork sets will depend on how many days each formwork phase will take
(assembly, holding concrete newly placed, and holding concrete until it is able to self-support).
Equation 2.9 shows how the total number of formwork sets can be determined. FU is the total
contact area covered by all formwork sets on the project. Since work zones have different
formwork contact areas, the profile will increase until the “maximum formwork set size” is reached,
and then the profile will remain uniform until the concrete placement schedule is completed. The
profile will decrease during the formwork demobilization schedule.
№ of formwork sets = T1 + T2 + T3 (2.9)
Where:

39
T1: Days required for disassembling a formwork set and reusing it for assembling a new work
zone.
T2: Days required for placing concrete in a new work zone.
T3: Days required for supporting a work zone until concrete is self-supported.
Typically, formwork companies typically rent out their formwork systems for a minimum period
of one month. The “Formwork Demand” (FD) profile (shown in Figure 2.8) represents the
formwork needed on the job, with the realization it is not economically feasible to return to the
formwork contractor, demobilized formwork that may be used again on the same job. The third
profile represented in Figure 2.8 is the “Formwork Requirement” (FR) which is represented by a
red shaded histogram. The FR profile is greater than the FD profile since contractors always
consider additional formwork elements/formwork systems to account for contingencies.
Overestimating FR will generate problems such as: (1) additional costs for renting formwork that
may not be used, and (2) additional costs for penalties if the surplus formwork is damaged or lost.
Figure 2.9 and Figure 2.10 show typical misuses of formwork. In the Figure 2.9, the form is used
as a platform and in Figure 2.10, the surplus forms are partially buried during the placement of the
foundation.
Figure 2.9. Formwork element used as a work
platform
Figure 2.10. Surplus formwork partially
buried on site

40
2.1.5 Cost analysis of formwork
A formwork cost analysis is the estimation of all the cost components that must be considered by
decision makers when selecting a formwork system based on cost. The cost components to be
considered in the formwork cost analysis can be grouped into labor, materials, and subcontracts.
Labor cost is the first cost component that might be directly affected by the selection of a formwork
system. Since each formwork system can have different features for the assembly, reuse, and
disassembly, productivity related to formwork installation will be affected. A formwork system
with fewer pieces is often linked with better productivity. For example, a handset formwork
typically requires disassembly after each use, unlike a gang formwork which can be used
repeatedly once it has been assembled. Equation 2.10 shows the mathematical expression for
estimating the labor cost.
𝐿𝑎𝑏𝑜𝑟 𝑐𝑜𝑠𝑡($) = 𝑃𝑟𝑜𝑑𝑢𝑐𝑡𝑖𝑣𝑖𝑡𝑦 (ℎ𝑟/𝑚2) 𝑥 𝐿𝑎𝑏𝑜𝑟 𝑟𝑎𝑡𝑒($/ℎ𝑟) 𝑥 𝐶𝑜𝑛𝑡𝑎𝑐𝑡 𝑎𝑟𝑒𝑎 (𝑚2) (2.10)
The next cost component is the materials cost used for forming. Materials that might differ
depending on the formwork solution selected are: (1) timber for complementary items (chamfers,
block outs, grade strips, reveals, etc.), (2) plywood for sheathing, and (3) accessories or
consumables. Other items such as nails and screws are likely to be very similar across different
formwork solution systems, so they are not considered in cost analysis. The subcontracts’ cost
component may include: (1) the formwork system rental cost, (2) the provider fees for maintenance
and cleaning, (3) provider penalties for damaged or lost formwork components, and (4) the freight
required for transporting formwork systems to the jobsite and returning them to the provider’s
warehouse at the end of the project. Equation 2.11 consolidates all the cost components:
𝐹𝑜𝑟𝑚𝑤𝑜𝑟𝑘 𝐵𝑎𝑠𝑒𝑙𝑖𝑛𝑒 𝐶𝑜𝑠𝑡 = 𝐶1 + 𝐶2 + 𝐶3 + 𝐶4 + 𝐶5 + 𝐶6 + 𝐶7 (2.11)
Where:
C1 = Formwork rental cost
C2 = Formwork consumables cost
C3 = Timber cost
C4 = Plywood cost
C5 = Formwork maintenance and cleaning cost

41
C6 = Penalties for lost or damaged formwork components
C7 = Freight cost
Figure 2.11 shows a “cause effect diagram” to analyze why formwork budgets in building projects
may experience additional costs. Each branch represents a cost component in formwork cost
analysis. “Surplus formwork” on the jobsite and the “poor work zone leveling”, are root causes for
additional costs in formwork budgets.
Formwork extra cost
Low productivity
Timber & plywood consumption
Figure 2.11. Cause effect of formwork extra cost
2.1.6 Formwork control with KPIs
A “Key Performance Indicator” (KPI) for formwork management is a measurable value that
demonstrates the effectiveness of the use of formwork systems on a project. The key performance
indices used for formwork management include the “Cost Ratio” (CR), the “Reuse Factor” (RF),
and the “Formwork Efficiency” (FE).
As shown in Equation 2.12, the cost ratio (CR) is the ratio of the total formwork cost ($) to the
total contact area that needs forming or shoring expressed in terms of square meters. This unit cost
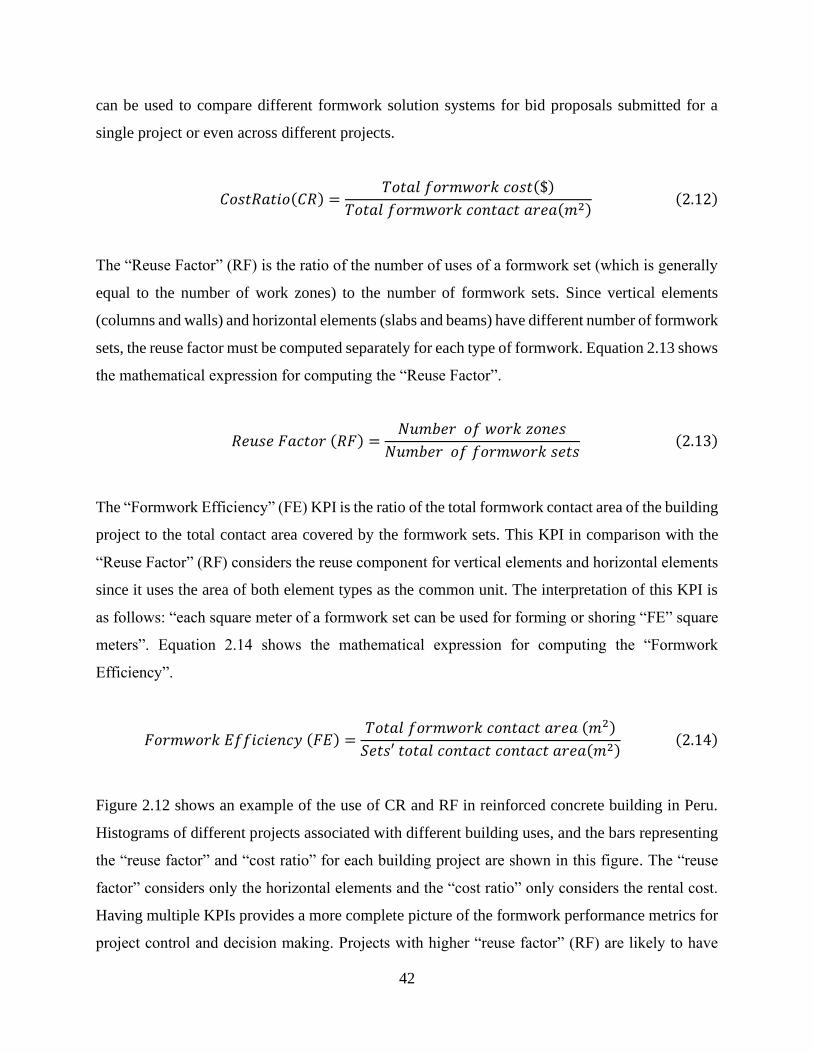
42
can be used to compare different formwork solution systems for bid proposals submitted for a
single project or even across different projects.
𝐶𝑜𝑠𝑡𝑅𝑎𝑡𝑖𝑜(𝐶𝑅) =𝑇𝑜𝑡𝑎𝑙 𝑓𝑜𝑟𝑚𝑤𝑜𝑟𝑘 𝑐𝑜𝑠𝑡($)
𝑇𝑜𝑡𝑎𝑙 𝑓𝑜𝑟𝑚𝑤𝑜𝑟𝑘 𝑐𝑜𝑛𝑡𝑎𝑐𝑡 𝑎𝑟𝑒𝑎(𝑚2)(2.12)
The “Reuse Factor” (RF) is the ratio of the number of uses of a formwork set (which is generally
equal to the number of work zones) to the number of formwork sets. Since vertical elements
(columns and walls) and horizontal elements (slabs and beams) have different number of formwork
sets, the reuse factor must be computed separately for each type of formwork. Equation 2.13 shows
the mathematical expression for computing the “Reuse Factor”.
𝑅𝑒𝑢𝑠𝑒 𝐹𝑎𝑐𝑡𝑜𝑟 (𝑅𝐹) =𝑁𝑢𝑚𝑏𝑒𝑟 𝑜𝑓 𝑤𝑜𝑟𝑘 𝑧𝑜𝑛𝑒𝑠
𝑁𝑢𝑚𝑏𝑒𝑟 𝑜𝑓 𝑓𝑜𝑟𝑚𝑤𝑜𝑟𝑘 𝑠𝑒𝑡𝑠(2.13)
The “Formwork Efficiency” (FE) KPI is the ratio of the total formwork contact area of the building
project to the total contact area covered by the formwork sets. This KPI in comparison with the
“Reuse Factor” (RF) considers the reuse component for vertical elements and horizontal elements
since it uses the area of both element types as the common unit. The interpretation of this KPI is
as follows: “each square meter of a formwork set can be used for forming or shoring “FE” square
meters”. Equation 2.14 shows the mathematical expression for computing the “Formwork
Efficiency”.
𝐹𝑜𝑟𝑚𝑤𝑜𝑟𝑘 𝐸𝑓𝑓𝑖𝑐𝑖𝑒𝑛𝑐𝑦 (𝐹𝐸) =𝑇𝑜𝑡𝑎𝑙 𝑓𝑜𝑟𝑚𝑤𝑜𝑟𝑘 𝑐𝑜𝑛𝑡𝑎𝑐𝑡 𝑎𝑟𝑒𝑎 (𝑚2)
𝑆𝑒𝑡𝑠′ 𝑡𝑜𝑡𝑎𝑙 𝑐𝑜𝑛𝑡𝑎𝑐𝑡 𝑐𝑜𝑛𝑡𝑎𝑐𝑡 𝑎𝑟𝑒𝑎(𝑚2) (2.14)
Figure 2.12 shows an example of the use of CR and RF in reinforced concrete building in Peru.
Histograms of different projects associated with different building uses, and the bars representing
the “reuse factor” and “cost ratio” for each building project are shown in this figure. The “reuse
factor” considers only the horizontal elements and the “cost ratio” only considers the rental cost.
Having multiple KPIs provides a more complete picture of the formwork performance metrics for
project control and decision making. Projects with higher “reuse factor” (RF) are likely to have

43
lower “cost ratios” (CR), but as Figure 2.12 shows this is not always true. For example, malls
(labeled as RETAIL in Figure 2.12) have greater CRs than housing projects (labeled as HOUS in
Figure 2.12), no matter if the RF of malls is greater (bar in red) or lower (bar in green) than the RF
for housing projects (bar in blue). The formwork systems for malls have a higher rental cost since
shoring with higher headroom heights (as is the case of malls) are more expensive than short
headroom heights (like the case of housing projects).
Figure 2.12. Formwork management KPIs for building projects
2.2 Previous research studies related to formwork management.
Previous research related to formwork has addressed different topics such as: (1) formwork design,
(2) formwork inventory management, (3) formwork layout planning, (4) formwork selection, (5)
formwork productivity, and (6) formwork safety. Table 2.4 lists several references related to these
topics, and the tools used for implementing these studies. A review of this table indicates that BIM
has been used as a common tool in formwork related research, and that most studies in this domain
OFFICE OFFICE RETAIL RETAIL RETAIL RETAIL RETAIL EDU EDU EDU HEALTH HOTEL HOUS
REUSE FACTOR 5.92 16.25 7.00 16.33 11.40 8.60 13.00 6.00 13.50 8.00 13.14 17.40 14.00
COST RATIO ($/m2) 4.67 8.83 9.72 5.92 5.38 5.77 6.28 4.35 4.95 4.49 4.76 5.51 3.40
-
2
4
6
8
10
12
14
16
18

44
focus primarily on specific formwork elements (vertical or horizontal element) or specific
formwork systems (climbing formwork, handset), and do not integrate different formwork systems
of a project. This thesis focuses on addressing these gaps, developing a tool that considers
horizontal and vertical formwork systems of a building project, and is applicable for climbing,
gang and handset formwork systems.

45
Table 2.4. Previous research studies related to formworks.
Topics Tools Element Formwork
System References
Formwork
Design
BIM Vertical elements
Modular handset (Singh, Sawhney, & Sharma, 2017)
Timber formwork
(Romanovskyia, Mejia, & Azar, 2019)
(Hyun, Jin, Shen, & Kim, 2018)
Horizontal elements (Gambatese & Jin, 2019)
Computer-Aided tool NA NA (Tah & Price, 1991)
Formwork
Inventory
Management
BIM NA NA (Mansuri, Chakraborty, Elzarka, &
Deshpande, 2017)
Cost analysis NA NA (Krajnak,, 2013)
Formwork
Layout
Planning
BIM NA NA (Kannan.Ma & Santhi.Ma, 2013)
(Lee, Lee, & Ham, 2009)
CAD Horizontal elements Flexible Table
Form (Kim, et al., 2012)
Mixed Integer LP Vertical elements Modular Handset (Biruk & Jaskowsk, 2016)
Formwork
Selection
Adaboost Algorithm
NA NA
(Shin, Formwork system selection
model for tall building construction
using the Adaboost algorithm., 2011)
(Shin Y. , Kim, Yang, Cho, & Kang,
2008)
BIM (Meadati, Irizarry, & Aknoukh, 2011)
Boosted Decision Tree (Shin Y. , Kim, Cho, & Kang, 2012)
CYCLONE (Kersting & Girmscheid, 2011)
Vertical elements Gang Formwork (Huang, Chen, & Sun, 2004)
Fuzzy Logic
Horizontal elements NA
(Elbeltagi E. , Hosny , Elhakeem, Abd-
Elrazek, & Abdullah , 2011)
(Razek, 1999)
Vertical elements Modular Handset (Elbeltagi E. , Hosny, Elhakeem,
Abdelrazek, & El-Abbasy, 2012)
Computer-Aided tool
Horizontal elements
NA
(Hanna & Sanvido, 1991)
NA
(Hanna, Willenbrock, & Sanvido,
1992)
Neural Networks
(Elazouni, Ali, & Abdel-Razek, 2005)
(Tam, Tong, Lau, & Chan, 2005)
(Hanna & Senouci, 1995)
Vertical elements (Kamarthi, Sanvido, & Kumara, 1992)
Practitioners’
experience NA Timber formwork (Proverbs, Holt, & Olomolaiye, 1999)
Productivity
BIM
NA NA (Lee, Parkb, & Choib, 2017)
Vertical elements Climbing
Formwork (Kannan.Ma & Santhi.Ma, 2013)
Constructability NA NA (Jarkas, 2010)
(Smith & Hanna, 1993)
Lean (VSM) Vertical elements Timber formwork (Ko, Wang, & Kuo, 2011)
Safety BIM NA
NA (Kim & Ahn, 2011)
Railings
(Zhang, et al., 2015)
(Zhang, Lee, Venugopal, Teizer, &
Eastman, 2011)
Scaffolding (Kim, Cho, & Kim, 2018)
(Chi, Hampson, & Biggs, 2012)
Stairs (Kim & Cho, 2015)

46
Before the advent of BIM tools in the AEC industry, formwork management was based primarily
on contractor experience, and the process for designing, modeling, planning, and scheduling was
a time-consuming manual process. The rising use of BIM, has addressed some of the limitations
of using 2D drawings, leading to better opportunities for improving formwork management.
Multiple research studies have used BIM to improve formwork design, modeling, and planning
(Biruk & Jaskowsk, 2016). In previous research related to formwork design (i.e., (Tah & Price,
1991), (Singh, Sawhney, & Sharma, 2017), (Gambatese & Jin, 2019)), BIM families or CAD
drawings were used for the automation of modeling formwork components of RC walls or flat
slabs separately, but not for all the formwork systems in a building. Formwork selection is
probably the most extensive topic analyzed in prior research, and studies (i.e., (Hanna & Sanvido,
1991), (Tam, Tong, Lau, & Chan, 2005), (Shin Y. , Kim, Cho, & Kang, 2012), (Elbeltagi E. ,
Hosny, Elhakeem, Abdelrazek, & El-Abbasy, 2012)) have focused on the use of CAD tools and
methods such as neural networks, decision trees or fuzzy logic to develop decision-making
methods for selecting formwork. On the contrary BIM has been used for studying formwork
productivity, formwork safety and for automating the generation of formwork layout plans
(Kannan.Ma & Santhi.Ma, 2013).
From the literature review related with the use of BIM for formwork management, some challenges
found in formwork management are as follows: (1) using BIM modeling for formwork
management is a time-consuming process, and often BIM modeling is not completed before the
concrete placement begins, and (2) in projects with design changes during construction makes it
difficult to update a formwork BIM model. According to Aslam, Baffoe-Twum, & Saleem (2019)
design changes in building projects around the world generate cost overrun between 5% and 40%
of the project cost. An important contribution of BIM for formwork management is controlling
formwork inventory, but with the requirement that all formwork components must be included in
the BIM model before formwork installation commences. (Mansuri, Chakraborty, Elzarka, &
Deshpande, 2017).

47
2.3 Developments in formwork management
Typically, technical support from the formwork provider involves designing the formwork system,
defining the best formwork elements for that solution, preparing layout plans in 2D drawings, and
based on this layout determining a packing list of elements required for the project execution.
Companies like Peri and Doka currently provide BIM and CAD tools to support formwork
management and formwork inventory management. The main drawback of these tools and support
services is that they are oriented to the formwork provider’s business objectives and are only
available for specific brands and products produced by the formwork provider (Biruk & Jaskowsk,
2016). Additionally, most contractors are not willing to use these tools for formwork management.
In some cases, the object libraries in these BIM and CAD tools are not updated with the real stock
of the formwork provider. In other cases, medium contractors (those having 50 to 250 employees)
and small contractors (those having fewer than 50 employees) are reluctant to invest in acquiring
these BIM and CAD tools and the associated support services.
According to McGraw Hill Construction (2014), in developed regions such as North America and
Europe, 60% of contractors implement fewer than 30% of their projects using BIM. Also, in same
developed areas only 23% of concrete contractors rate their BIM skills as high or very high. The
use of cast-in-place concrete construction (for building projects) is more popular in developing
regions such as Latin America and the Caribbean, the Middle East, and East Asia. According to
Jung & Lee (2015) in an international study of BIM adoption, 46,3 % of practitioners from Asia
and 71.4% of practitioners from South America assess their proficiency using BIM as "advance"
or "expert", which were the two lowest rates over all regions globally. This may imply that in
developing regions where cast-in-place concrete is more popular, the level of BIM proficiency is
the lowest, which describes the incipient industrialization of construction in these regions. As
example, a research study related to BIM adoption in Peru (Murguía, 2018), stated that 91% of
building projects executed by large contractors (having more than 250 employees) implemented
BIM, but small companies (having fewer than 50 employees) implemented BIM only in 22% of
their projects. Also, 93% of the projects only implemented a volumetric representation of the
reinforced concrete structures in the BIM model (not formwork or steel reinforcement). Another
important result of Murguia’s study is that almost 60% of the projects received very little or no
BIM services from formwork providers.

48
2.3.1 Formwork management using CAD.
Most contractors and formwork companies use in-house CAD tools or “Plug-ins” to design, draw
formwork layout plans, schedule list of elements and manage inventories. This section will present
the tools used by two of the top formwork companies in the world, Peri and Doka. According to
Peri (2020), Peri has more than 9,500 employees worldwide, presence in more than 60 countries,
and has more than 160 logistics centers. Similarly, according to Doka (2020), Doka has more than
7,400 employees worldwide, presence in more than 70 countries, and has more than 160 locations
worldwide.
Peri ELPOS (Figure 2.13) is an AutoCAD “Plug-in” tool for planning Peri’s formwork systems
and scaffolding systems. ELPOS can generate formwork layout drawings in AutoCAD as well as
the list requirement of formwork components that can be also exported to MS Excel. ELPOS
matches both the total list of elements/components required and the list of owner-owned
elements/components and generates a new list with only the additional components necessary for
renting. Peri CAD is another AutoCAD “Plug-in” tool used by more experienced CAD users to
design formwork and scaffolding, and that allows 3D modeling for obtaining layout drawings and
materials list in a fraction of time.
Doka Formwork Design software (DFDS) 9 is a package for designing formwork that includes
“Tipos 9” for automatic formwork planning with generation of plans and parts lists, “Piece List
Editor 9” for editing the formwork parts lists, and “Beam Static 9” for calculating continuous load
bearing beams. The advantage of this package is that it does not need a CAD platform for
implementation. Doka CAD 9 (Figure 2.14) is a “plug-in” for AutoCAD for planning formwork
layout plans and generating parts’ lists. Doka CAD has country versions only for Austria, Germany,
UK, USA, and France that provides access to updated libraries and the database of the components
available in stock in local warehouses. In other countries, Doka CAD is available only for Doka
staff who have a user account. Also, Doka CAD installation needs authorization from Doka, and
is typically available only to Doka customers.
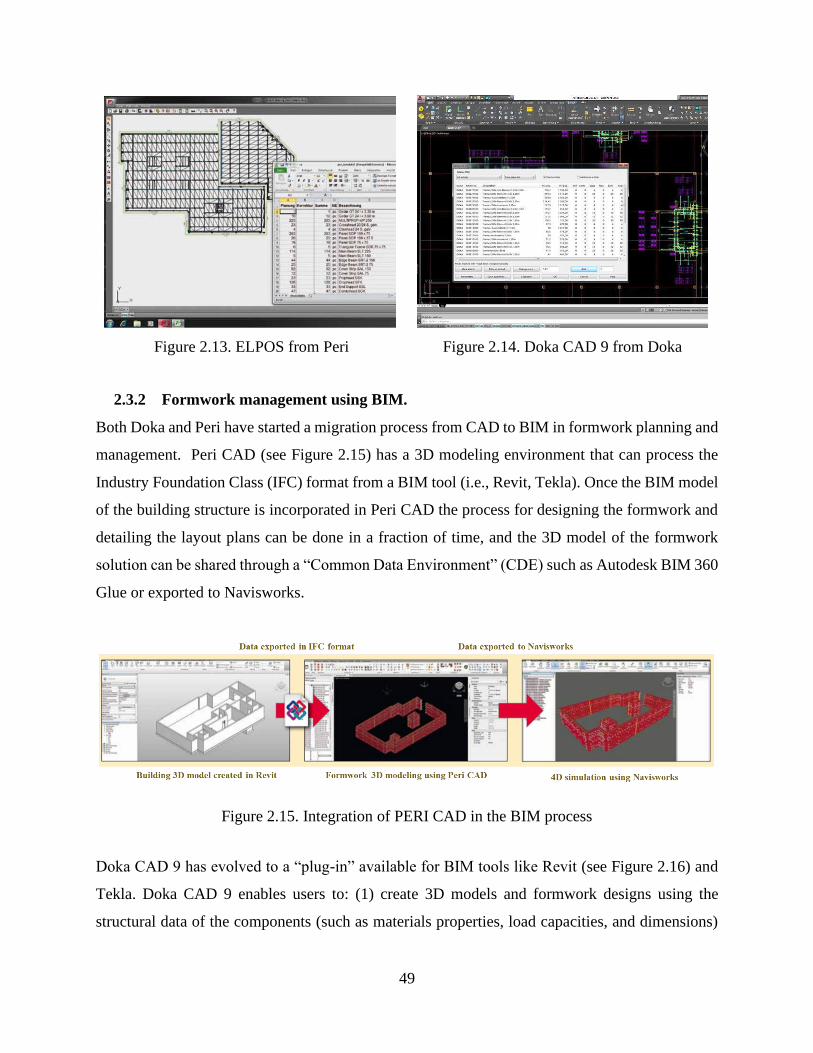
49
Figure 2.13. ELPOS from Peri
Figure 2.14. Doka CAD 9 from Doka
2.3.2 Formwork management using BIM.
Both Doka and Peri have started a migration process from CAD to BIM in formwork planning and
management. Peri CAD (see Figure 2.15) has a 3D modeling environment that can process the
Industry Foundation Class (IFC) format from a BIM tool (i.e., Revit, Tekla). Once the BIM model
of the building structure is incorporated in Peri CAD the process for designing the formwork and
detailing the layout plans can be done in a fraction of time, and the 3D model of the formwork
solution can be shared through a “Common Data Environment” (CDE) such as Autodesk BIM 360
Glue or exported to Navisworks.
Figure 2.15. Integration of PERI CAD in the BIM process
Doka CAD 9 has evolved to a “plug-in” available for BIM tools like Revit (see Figure 2.16) and
Tekla. Doka CAD 9 enables users to: (1) create 3D models and formwork designs using the
structural data of the components (such as materials properties, load capacities, and dimensions)

50
that enrich the BIM model, (2) detail 2D layout drawings, (3) create lists of formwork pieces
required, and (4) implement 4D simulations. Doka also provides an extensive library of the 3D
components of their formwork systems (available on Doka’s website) for use in Revit and Tekla.
Figure 2.16. Doka CAD for Revit
2.4 Needs assessment.
Cast in place concrete for building projects is the preferred construction method in developing
regions like South America, in contrast to developed regions like North America and Europe where
the use of modular construction and prefabrication are the preferred construction methods for
buildings. The main reasons for the preference of developing countries for using cast in place
concrete are: (1) the lack of expertise using other materials like structural steel, (2) the incipient
production of prefabricated elements like steel members, and (3) the low labor cost in comparison
with developed countries. Since this thesis focuses on the use of formwork, a survey was deployed
to professionals in the AEC community with experience in building projects but with a higher
representation of countries from South America where the use of formwork is the preferred
construction system. According to Peters (2020), the three countries from South America that are
included in the top 5 of Latin American countries with largest revenue of construction projects are:
Brazil (that represents 28.1 %), Chile (that represents 25.6%), and Peru (that represent 8.9%).

51
To measure the preferences of the AEC community related to formworks and BIM, a survey
request was distributed to professionals from USA and countries in Latin America (Bolivia, Chile,
Mexico, Panama, and Peru). Professionals chosen to participate were classified into three groups
depending on their professional background (contractors, BIM specialists, and formwork
providers). The survey questionnaire was categorized into four sections. The first section collected
demographic information of survey respondents. The second section include questions for the
group of contractors. The third section include questions for contractors and BIM specialists to
gauge their experience using BIM. The final section includes questions for professional
categorized as formwork providers. The Purdue University Human Research Protection Program
(HRPP) determined on January 6, 2021 that the research project identified with the Institutional
Review Board (IRB) number IRB 2020-1766 was exempt from IRB review. Qualtrics, a web-
based survey software program, was used to distribute the survey from January 8, 2021 until
January 31, 2021.The survey was delivered to 526 AEC professionals, 141 started the survey, and
136 respondents completed the survey before the deadline. Only the 136 responses that were
completed before the deadline were taken into consideration for the analysis. Appendix A shows
the IRB 2020-1766 exemption form and Appendix B shows the survey questionnaire.
Figure 2.17 shows the proportion of the respondents, where Peru has the majority with 79%, then
USA with 12% and the remaining from different countries from Latin America. Almost half of
respondents are employees of medium companies (between 50 and 250 employees), and large
companies (more than 250 employees). The survey includes questions related to: LOD preference
for modeling formwork systems, formwork rental option preference, and level of automation in
formwork management tasks.
Figure 2.18 shows that 68% of survey respondents have between 5 and 20 years of experience on
construction projects. Figure 2.19 shows the classification of respondents into four groups: (1)
formwork clients which are represented in majority by general contractor practitioners (49% of
respondents), (2) BIM experts that represent 32% of respondents, (3) the academia representing
7%, and (4) formwork providers which are represented by managers and sales representative of
the most representative formwork companies like Doka, Peri, Ulma, Alsina, EFCO, Unispan,
Forsa, and MFE (represent 12% of respondents to the survey).

52
Figure 2.17. Country of
respondents
Figure 2.18. Years of
experience of respondents
Figure 2.19. Professional
profile of respondents
Level of Development (LOD) preference
According to BIMForum (2015), Level of Development is the degree to which the user of the BIM
model can rely on the information provided by the model. In a LOD 100 specification, the model
is represented as a generic representation. In LOD 200, the object is represented as a generic system
with approximate quantities, size, shape, location, and orientation. In a LOD 300 the element
model is represented as a specific system in terms of quantity, size, location, and orientation. In
LOD 350, the object is also specific in terms of interfaces with other building systems. In LOD
400, the object also provides information for fabrication, assembly, and installation. In LOD 500,
the object is a field verified representation. A representation of each LOD specification for a
column formwork is presented in Figure 2.20.
Peru79%
USA12%
Other9%
10 - 20 36%
5-1032%
< 522%
> 2010% BIM
32%
GC49%
Academia7%
Formwork12%

53
LEVEL OF DEVELOPMENT (LOD)
LOD 100 LOD 200 LOD 300 LOD 350 LOD 400 LOD 500
RE
PR
ES
EN
TA
TIO
ND
ES
CR
IPT
ION
Cost is a
numeric
parameter
Column
formwork,
generic/
approximate size/
shape/location
Design specified
handset, specific
size/shape/
location
Actual formwork
system from a
specific provider,
specific size/
shape/ location
As 350, plus
special mounting
details, as
hardware and ties
Field verified,
model as-built
Figure 2.20. Level of Development (LOD) for a column formwork
Figure 2.21 shows that 64% of formwork companies can provide BIM models at LOD 400 or
greater. In contrast 62% of the general contractors prefer modeling formwork systems at LOD 200
or lower, indicating that although companies such as Doka and Peri provide BIM services, these
services are not normally used by general contractors in their building projects.

54
Figure 2.21. LOD preference of general contractors and formwork providers
Formwork rental option preference.
There are two main formwork rental options (price by solution system and price by component).
The survey results indicated that renting by a formwork solution system measured in contact area,
is the preferred option (see Figure 2.22). Although formwork companies provide both rental
options, contractors and suppliers prefer to rent formwork by solution, since it is easier to compare
different proposals in the same unit (m2) instead of comparing different formwork components,
where the type of components from one formwork brand could be completely different from
another brand. Another advantage of renting formwork system considering the contact area, is that
controlling the amount of formwork required at any time of the project is easier to express in terms
of variation of the contact area of formwork required instead of computing the number of
formwork components of each type in the solution system. An important consideration is that even
when renting formwork by contact area of the solution system, it is recommended that keep the
track of the inventory of components, since it will be necessary on some occasions to return pieces
of one system or require additional pieces that were not considered in the initial requirement (for
example, when a structural designer changes the depth of a beam).
31
36
19
13
7
23
2
6
3
0
5
10
15
20
25
30
35
40
LOD 100 LOD 200 LOD 300 LOD 350 LOD 400 LOD 500
General Contractor Formwork Supplier

55
Figure 2.22. Formwork rental option preference.
Formwork level automation
Figure 2.23 shows that 31% of general contractors prefer using CAD for work zoning and
managing formworks (quantity takeoffs, formwork layout plans, progress control, etc.). Also, 33%
of the general contractors complement CAD with spreadsheets in Excel for computing quantities
for work zoning and formwork management. Only 17% of contractors use BIM for work zoning
or formwork management, indicating there is room to implement BIM methodologies for
automating tasks related to work zoning and formwork management.
Figure 2.23. Computational tools preferred by general contractors for formwork management.
19%
36%
81%
64%
0% 10% 20% 30% 40% 50% 60% 70% 80% 90% 100%
General Contractor
Formwork Supplier
Components (unit) System (m²)
31%
31%
17%
17%
10%
6%
12%
13%
28%
33%
1%
1%
0% 10% 20% 30% 40% 50% 60% 70% 80% 90% 100%
Work Zoning %
Management %
CAD BIM PDF Paper Excel Other

56
Defining a scale of level of automation from “Level 0” to “Level 4”, where zero is none and four
is completely automated using a Graphical User Interface (GUI), the survey results shown that 58%
of formwork companies do not have any formwork management process automated although 29%
of companies use BIM technologies. Also, 70% of contractors do not automate any process related
to formwork management using BIM tools (see Figure 2.24).
Figure 2.24. Level of automation preference by contractors and formwork companies
2.5 Summary
Many studies have investigated formwork design and selection, but few have focused on formwork
management. Review of the state of practice as well as the results of the survey undertaken as part
of this study, indicate that contractors prefer using simple BIM models (LOD 200 or lower) for
formwork management even when formwork suppliers have BIM services to model formwork
systems considering all components (LOD 400 or higher) and to use higher LOD models for
planning and managing formwork. A new alternative is required to avoid modeling each
component of a formwork system since the modeling and updating process of a formwork BIM
model (considering all the components in a LOD 400 or higher) is time consuming. Since
contractors and suppliers are more likely to use formwork rental options per solution measured in
contact area, a new BIM approach could be used to develop an easy-to-implement tool that is
automated and is more efficient than the current practice of using only CAD and spreadsheets.
19%
22%
29%
51%
50%
29%
26%
22%
43%
3%
4%
2%
2%
0% 20% 40% 60% 80% 100% 120%
GC Work Zoning %
GC Management %
FW Work Zoning %
Level 0 Level 1 Level 2 Level 3 Level 4

57
RESEARCH METHODOLOGY
A BIM formwork model should: (1) communicate the information regarding formwork locations
and areas considered for forming and shoring, (2) assist in the visualization of the characteristics
of the construction process using multiple views, color mapping and 4D simulations, and (3)
determine formwork-related information such as the total forming cost, the total shoring cost,
determination of the quantities of plywood and consumables required, or determine the
transportation requirements for delivery of formwork.
This chapter describes the first phase in the development of a BIM-based tool for formwork
management. This phase focuses on the automation of formwork modeling and model enrichment
with data related to formwork. The input for the BIM-based tool is a structural BIM model of a
building. The BIM-based tool is developed using visual programing in Dynamo for Revit. The
output of the BIM-based tool is a BIM model enriched with formwork related data that can be used
for: (1) a geometric representation of the formwork contact area of each element type using a 3D
model, (2) 4D simulation that helps in better understanding of the construction sequence and reuse
schema, and (3) a 5D simulation for formwork cost management.
3.1. BIM workflow automation
The automation of BIM processes refers to the use of programming to recreate a workflow in a
BIM tool without the necessity of the user, for performing repetitive tasks, ensuring the quality of
the process through the reduction of human error during the streamlining of BIM processes.
Common uses of BIM automation may include auditing of BIM models, modeling from references,
quantity take-off generation, documentation, exchange of information to different software
packages, exploring multiple alternatives of design, and project collaboration.
There are two main alternatives for developing BIM automation tools: (1) visual programming
using packages like Dynamo for Revit that may include the use of programing languages such as
Python for specific cases, and (2) use of an “Add-In” which is a software program (customized
developed by user/programmer) that expands the capabilities of a host software program (like
Revit). These “Add-ins” are solely based on the use of object-oriented programming and

58
programing languages like Python and C# in combination with an “Application Programing
Interface” (API). API is a communication mechanism that a programmer uses to interact with the
host software program.
Dynamo for Revit is an open-source graphical programming tool that is based on the use of nodes
that are interconnected to recreate a BIM workflow, as shown in Figure 3.1. In Dynamo each node
represents a process in Revit and nodes are interconnected through “wires” or links with other
nodes. The output of one process or node is sent as an input to the next interconnected nodes
downstream through the “wires”.
Figure 3.1. Dynamo workflow for reshoring cost sum for all horizontal elements
Both options Dynamo and Add-ins have advantages depending on the needs of the user/developer
(what the tool should do) and the user/developer requirements (how the tool should work).
Dynamo is user friendly, and could be implemented faster than a Revit Add-in, but it sacrifices the
potential for creating Graphical User Interfaces (GUI), and compromises on speed for running the
algorithms. Table 3.1 presents a trade-off for deciding which tool should be used depending on the
requirements of the user and developer. Since the objective of the thesis is to develop and evaluate
a prototype formwork management tool using BIM, all the automation processes presented in this
thesis will be based on Dynamo. The processes will also be enhanced with Python custom nodes
specially for the loop structures that are not very efficient with the built-in nodes included by
Dynamo.

59
Table 3.1. Dynamo and Add-Ins trade-off
Criterion Dynamo Add-Ins
Coding source Open script Closed coding
Programing languages Visual programming Python or C#
Popularity
Users increasing rapidly.
Dynamo BIM Forum around
29,200 users in 2018 and
around 39,800 in 2020
(Dynamo BIM, 2021)
Fewer developers since strong
programming skills, and
knowledge of programing
languages are required.
Data processing
Processing speed is affected
by size of geometry data
that is processed.
Processing speed will depend
primarily on the computing
resources (memory and CPU)
Cost of scripts and
Add-ins in market
Are available for free in
“Packages Manager
website”.
Free and paid options in
Autodesk App Store.
Versioning updating Depends on Revit updates Depends on the developer.
Programming skills
Knowledge of specific
programming language is
not required
Need of programing languages
like Python, C#, and programing
skills. Knowledge of Revit API
is required.
Developing time
Depends on number of
nodes in script. Generally, a
single node can replace
multiple lines of coding.
Depends on number of coding
lines. Multiple lines are needed
to represent one single node.
Customization
Task manager of Dynamo
only provides a standard
user interface, and is
amenable to customization
of user interfaces
The Graphical Use Interface
(GUI) can be designed
according to the requirements of
the user/developer.
Data security Minimum since a Dynamo
script cannot be compiled. High once coding is compiled
Implementation stage For prototyping stage of a
new tool
For developing tools that are
ready to be released into the
market
Use frequency of tool
(Dynamo script or
Add-in)
Fewer uses
(just to try an idea)
High use
(common process in a BIM
workflow)

60
3.2. Road map for developing the framework for formwork management using BIM.
The development of the BIM-based formwork management tool consists of two phases: Phase 1
for generating the formwork BIM model and Phase 2 for using this BIM model to deploy formwork
management. There are five steps in Phase 1, for obtaining a BIM model with enriched data. Phase
2 consists of six steps towards the determination of formwork cost and time analyses for formwork
management. Chapter 3 describes Phase 1, which includes: (1) BIM parameters management, (2)
audit of BIM model according to construction process, (3) work zoning, (4) formwork modeling
as LOD 200, and (5) populating information into the BIM model. Chapter 4 describes Phase 2 for
using the BIM model enriched with data for multiple formwork analyses. Figure 3.2 summarizes
the two-phase BIM based formwork management tool development.
Figure 3.2. BIM-based tool for formwork management
Figure 3.3 presents the roadmap for the first phase of the BIM-based formwork management tool.
Each step in Phase 1 is represented by a column that mentions in the header the specific section in
Chapter 3 which contains a detailed description of that phase. An image of the logo of the tool
(Excel, Revit, Navisworks, etc.) used in each step is next to the corresponding box (that represents
an input, process, or output) for better understanding of what tools are required for each process.
The dashed border of process boxes in Step 2 indicates that this is an optional step depending on
the characteristics of the BIM model used as an input. For instance, if the BIM model elements
that represent columns, walls, beams, and slabs were modeled considering the audit modeling
criteria required for using this BIM-based tool (columns should be split at the bottom of the deepest
adjacent beam, walls should be split at the bottom of the deepest adjacent slab and slabs should be
modeled considering a boundary due to surrounding walls and beams), then this step it is not
required.

61
Figure 3.3. Road map for generating a BIM model for formwork management.
ROADMAP FOR GENERATING A BIM MODEL FOR FORMWORK MANAGEMENT: Phase 1
INP
UT
PR
OC
ES
SO
UT
PU
TS5: Section 3.8S1: Section 3.4 S2: Section 3.5 S3: Section 3.6 S4: Section 3.7S5: Section3.8
List of BIM
parameters
Create
shared or
project
parameters
Model with
parameters
enabled
Model with
parameters
enabled
Adapt
elements
joint
priority
Model
adapted
with
column >
beam >
floor
priority
Model adapted
with Column >
Beam > Floor
Priority
Split
Columns &
Walls
Model
adapted
with split
columns &
walls
Model with
MOD
parameters
enabled
Populate
MOD
parameters
Model
enriched
with
MOD
parameters
List of
materials
Create
materials
Model
enriched
with
materials
Model with
PROD
TIME
and
COST
parameters
enabled,
Populate
PROD
TIME
COST
parameters
Model
enriched
with
PROD
TIME
COST
parameters
Model with
FORM
parameters
enabled and
materials
Model with
Work zone
parameter
enabled
Populate
work
zoning
parameters
Populate
FORM
parameters
Model
enriched
with
FORM
parameters
Model
enriched
with work
zones
`
Revit Dynamo Python Excel MaterialsShared/Project
Parameters Switch joint priority Split element

62
3.3. BIM parameters management
According to Autodesk Help (2021) a “parameter” is a container of information that could be
assigned to any “category” of element created in Revit. Parameters are used to define and modify
elements and their values can be inserted in schedules (or tables of quantities) to enable the user
to obtain relevant information for multiple analyses. There are four types of parameters (project
parameter, shared parameters, family parameters and global parameters). In this research study,
only project and shared parameters will be necessary for storing the information required for
formwork management. Table 3.2 provides a brief description of each parameter group.
Table 3.2. Parameters' groups
Parameters'
Groups Description
Model
Collects basic characteristics of the structural elements regarding typology
(element type, pouring phase), geometry (height, depth), quantity take-off
regarding steel reinforcement, and location (level, work set, work zone).
Concrete volume is a built-in parameter in Revit and formwork area is part of
the next group of parameters.
Formwork Collects basic information regarding the formwork area (lateral, bottom, and
total area) and formwork weight rates for each type of solution system.
Time Collects basic data regarding the stripping date and the timing for removing
formwork and removing reshoring systems.
Productivity
Collects information regarding productivity indexes for placement of concrete,
formwork, and steel reinforcement. Also, the total quantity of labor hours
required for each structural element are considered in this group
Cost
Collects information regarding rental rates for each formwork solution system,
and the total rental cost for forming and shoring a structural system. Also, the
parameters related to the cost of consumables for vertical elements are
considered in this group.
Revit elements follow a hierarchy where “Category” is the highest level (for example, Structural
Columns), then the second level is for the “Families” (for example, M_Concrete-Rectangular
Column), the third level is for the “Type” (for example, 450x600mm) and finally the “Instance”
which is the specific element that is included in the model with a specific id (for example, 420307).
Figure 3.4 shows this hierarchy level example where the element instance “420307” represents a
column type “450x600mm”, that is a typology of the “Family Type” named “M_Concrete-
Rectangular Column”, which is available for all the elements classified as “Structural Columns”

63
category. The “Categories” to be considered in this thesis are: “Structural Foundations”,
“Structural Columns”, “Walls”, “Structural Framing”, “Floors”, and “Stairs”.
Figure 3.4. Hierarchy of Category, Family, Type, and Instance
The following questions must be considered when working with parameters for the BIM-based
formwork management tool: (1) which parameters will be necessary for formwork management?
(2) in what format (text, number, area, length) would the parameters store the data? (3) are the
values stored by the parameters assigned for each instance or for the family type? and (4) what are
the categories of elements that will be enabled with these parameters? In general, all the parameters
in this research project are assigned independent values for each instance. Figure 3.5 lists the
properties of the parameters.
Figure 3.5. Parameter properties

64
Model parameters (MOD)
Model (MOD) parameters store information about elements related to type, geometry, rebar
quantities, and location. Table 3.3 shows the list of MOD parameters.
Table 3.3. MOD Parameters - Group: MODEL
Parameter Name Description Data
Type Category List
MOD_Element Type of element (Column, Beam, ...)
Text
Structural
Foundations,
Structural
Columns,
Walls,
Structural
Framing,
Floors, Stairs
MOD_Height Type of height (S, D, T)
MOD_S_Level Level of the element (L1, L2, ...)
MOD_S_WorkSet Work Set, default value is WS1
MOD_S_WorkZone Work Zone name (WZ1, WZ2, …)
MOD_S_F/V/H Phase (Vertical, Horizontal, Foundation)
MOD_S_Code Construction sequence code
MOD_Steel_Ratio Steel ratio in kg/m3 Number
MOD_Steel Steel quantity by element in kg
MOD_Beam_Depth Type of beam depth Text
Structural
Framing
MOD_Element: Elements needs are renamed based on the category with one of the following
types: Foundation, Column, Wall, Beam, Slab, Stair and Joint. “Joint” is the part of the column
that is at the intersection with the beams that they support. The “Joint” is separated from the
“Column” because concrete placement of the column is typically done until the bottom of the beam.
During the slab pour the remainder of the column is placed. Figure 3.7 shows an example of the
corresponding parameter value for each element.
MOD_Height: Formwork height is an important consideration for formwork design since will be
related in case of vertical elements (like columns and walls) with the lateral pressure on the forms,
and in case of horizontal elements with the bracing required to avoid buckling of props. To simplify
the analysis, the formwork solutions are classified as “Simple Height S” (height < 3.60m), “Double
Height D” (3.6m < height < 6.7m), or “Triple Height T” (height > 6.70m). These ranges could be
customized according to user preferences.
MOD_Level: A standard name is used for identifying the levels starting from “Level 1” up to the
top level of the building. By default, Revit considers Level 1 as the ground level. Figure 3.6 shows

65
the renamed labels in red to substitute for the original names created by default in Revit. The
“MOD_Level” will store text values like “L1”, “L2”, and so on.
Figure 3.6. Renaming of levels for formwork
analysis
Figure 3.7. Joint element type parameter
MOD_S_WorkSet: This parameter stores the corresponding work set label for each BIM element.
A work set is the work team responsible for the execution of a portion of the building project.
Work sets common work simultaneously, and each work set has access to its own resources (tower
crane, crews for each trade, superintendent, etc.). In this thesis, it is assumed every BIM model is
executed by only one work set. It is possible for large projects multiple work sets can work
simultaneously to compress the project duration (crashing).
MOD_S_WorkZone: The work zone is the portion of the building that is considered as a unit of
work or a production batch.
MOD_S_F/V/H: This parameter stores data related to the concrete placement phase of the element.
Typically, concrete placement is performed in two phases. In the first phase, concrete for vertical
elements in a work zone is placed, and in the second phase concrete for horizontal elements in the
same work zone is placed. Figure 3.7 shows an example for assigning the “MOD_S_F/V/H”
parameter values. Figure 3.8 shows this first phase where concrete for columns is placed having
as top level of the columns the bottom level of the adjacent beams. Figure 3.9 shows the first phase

66
where concrete for walls is placed having as top level the bottom level of the adjacent slabs.
Foundations are represented by (F). Columns and walls are considered as vertical elements and
presented by (V) and they are placed until the bottom of the beams and slabs, respectively. Slabs,
joints, beams, and stairs are considered as horizontal elements and represented by (H).
Figure 3.8. Column poured until beam bottom
Figure 3.9. Wall poured until slab bottom
MOD_S_Code: This parameter represents a unique code to identify each work zone. The code
must consider work set, level, work zone, and concrete placement phase. For example, a unique
label for a work zone would be: WS1-WZ1-L1-V which refers to the vertical elements of the work
zone 1 of level 1 of work set 1.
MOD_Steel_Ratio: Although it is not a common practice to model rebar in BIM models, it is
important to include the working hours required for rebar installation. The “MOD_Steel”
parameter is the ratio of rebar (in kgs) to the volume of concrete placed (in m3). This ratio will
vary based on the type of concrete element placed (concrete walls, beams, columns, slabs,
foundations).
MOD_Steel: This parameter stores the total quantity of rebar used as reinforcement in a concrete
element expressed in kg.
MOD_Beam_Depth: The main consideration for designing beams’ lateral formwork is the depth
of the beam. If beam’s depth is over 70cm, then ties, (Figure 3.10) rather than bracing squares
(Figure 3.11) may be required to hold the side sheathings of the beam. Hence, for classifying

67
beam formwork solutions for the beam formwork sides, the following classification of beam
depths is proposed: depth Type 1 – T1 (beam depth < 0.40m), Type 2 – T2 (0.40m < beam depth
< 0.70m), Type 3 – T3 (0.70m < beam depth < 1.00m), and Type 4 – T4 (beam depth > 1.00m).
These ranges could be customized based on the user preferences and formwork features.
Figure 3.10. Doka beam lateral formwork with
ties
Figure 3.11. Doka beam lateral formwork
with bracing squares
Productivity parameters (PROD)
Productivity parameters store the productivity indexes for the placement of concrete, formwork,
and steel reinforcement. A parameter is reserved for the estimation of the total quantity of labor
hours required for building each concrete element considering: (1) the steel reinforcement
preparation and installation, (2) erection, stripping and preparation of formwork (including
reshoring), and (3) concrete placing. Productivity indexes could be determined in terms of the
construction trade and by the element type. For instance, the productivity for placing concrete in
columns will be different from productivity for placing concrete in a slab, but it is common to
determine productivity without differentiating elements and just focusing on the trade. In this
thesis, the productivity index will be specified by trades and not by element type. Table 3.4 shows
the three productivity indexes considered (Rebar, formwork, concrete). The number of labor hours
will be based on the product of the quantity takeoff for each trade and the corresponding
productivity index.

68
Table 3.4. Productivity Parameters
Parameter Name Description Data
Type
Category
List
PROD_PI_Conc Productivity index for concrete placement
(labor hours/m3 and labor hours by m3.
Number
Structural
Foundations,
Structural
Columns,
Walls,
Structural
Framing,
Floors, Stairs
PROD_PI_Form Productivity index for formwork in labor hours
by m2.
PROD_PI_Steel Productivity index for rebar in labor hours by
kg.
PROD_Labor
Labor hours for placement of a concrete
element considering concrete placement,
formwork erection and striping, and rebar
preparation and erection.
Time parameters (TIME)
As shown in Table 3.5, Time parameters store the formwork stripping date for each element, the
number of days when formwork should remain in place, and the number of days reshoring system
is required to stay in place for a horizontal element.
Table 3.5. Time parameters
Parameter Name Description Data
Type Category List
TIME_Date_Strip Formwork stripping date.
Number
Structural
Foundations,
Structural
Columns, Walls,
Structural
Framing, Floors,
Stairs
TIME_Form The number of days formwork should
remain in place
TIME_Shore The number of days that reshoring
should remain in place
Structural
Framing, Floors,
Stairs
Formwork parameters (FORM)
Formwork parameters stores information related to the contact area for vertical elements, contact
area for horizontal elements, weight ratios for formwork solution systems, and total weight of the
formwork used for forming and shoring concrete elements. These parameters are shown in Table
3.6.

69
Table 3.6. Formwork parameters
Parameter Name Description Data
Type
Category
List
FORM_Dim_Lateral
Calculated area of the lateral faces of
a concrete element that are in contact
with forms.
Area
Structural
Foundations,
Structural
Columns,
Walls,
Structural
Framing,
Floors, Stairs
FORM_Dim_Bottom
Calculated area of the bottom faces
of a concrete element that are in
contact with forms.
FORM_Dim_Total
Calculated area of all the faces of a
concrete element that are in contact
with forms.
FORM_Wt_Form_Lateral
Weight ratio (kg/m2) of lateral forms
for elements like walls, columns,
beams, and foundations.
Number
Structural
Foundations,
Structural
Columns,
Walls
FORM_Wt_Form_Bottom Weight ratio (kg/m2) of a support
formwork for horizontal elements. Floors, Stairs
FORM_Wt_Form_Linear Weight ratio in kg/m of a beam
support. Structural
Framing FORM_Wt_Shore_Linear
Weight ratio in kg/m of a beam re-
shore system.
FORM_Wt_Shore_Bottom Weight ratio in kg/m2 of a re-shore
system for horizontal elements. Floors, Stairs
FORM_Wt_Form_Total
Weight of formwork for a concrete
element. It includes stringers, joists,
props, braces, wales, studs and other
accessories or hardware.
Structural
Foundations,
Structural
Columns,
Walls,
Structural
Framing,
Floors, Stairs
FORM_Wt_Shores_Total
Total weight of a re-shore system for
a horizontal concrete element. It
includes the props, braces,
accessories, and other hardware.
Structural
Framing,
Floors, Stairs
Cost parameters (COST)
Cost parameters stores the rental rates for forming and shoring solutions. The total rental cost for
the forming or shoring solutions is estimated using Equation 3.1. Consumables like PVC tubes and
cones (see Figure 3.12) for vertical elements are separately calculated using Equation 3.2. Table
3.7 show the cost parameters implemented in the formwork BIM model.

70
𝑅𝑒𝑛𝑡𝑎𝑙 𝑐𝑜𝑠𝑡 = 𝐶𝑜𝑛𝑡𝑎𝑐𝑡 𝑎𝑟𝑒𝑎 𝑥 𝑅𝑒𝑛𝑡𝑎𝑙 𝑝𝑒𝑟𝑖𝑜𝑑 𝑥 𝑅𝑒𝑛𝑡𝑎𝑙 𝑟𝑎𝑡𝑒 (3.1)
𝐶𝑜𝑛𝑠𝑢𝑚𝑎𝑏𝑙𝑒𝑠 𝑐𝑜𝑠𝑡 = 𝐶𝑜𝑛𝑡𝑎𝑐𝑡 𝑎𝑟𝑒𝑎 𝑥 𝐶𝑜𝑛𝑠𝑢𝑚𝑎𝑏𝑙𝑒𝑠 𝑐𝑜𝑠𝑡 𝑟𝑎𝑡𝑒 (3.2)
Table 3.7. Cost parameters
Parameter Name Description Data
Type Category List
COST_Rate_Lateral
Rental rates for lateral forms
including wales, studs, and hardware.
($/m2-day)
Number
Structural
Foundations,
Structural
Columns, Walls,
Structural
Framing, Stairs
COST_Rate_Bottom
Rental rates for horizontal support
including stringers, joists, props, and
bracing ($/m2-day). Sheathing not
included. Floors, Stairs
COST_Rate_Bottom_Shore Rental rates for horizontal re-shoring
system. ($/m2-day)
COST_Rate_Linear Rental rates for beams support. ($/m-
day). Structural
Framing COST_Rate_Linear_Shore
Rental rates for beams re-shore.
($/m-day).
COST_Rate_Consumable
Cost ratio ($/m2) for consumable
materials like PVC cones and tubes.
Only for vertical elements.
Structural
Columns,
Structural
Framing, Walls
COST_Formwork Total rental cost for formwork
systems based on Equation 3.1
Structural
Foundations,
Structural
Columns, Walls,
Structural
Framing, Floors,
Stairs
COST_Shoring
Total rental cost for reshoring system
based on Equation 3.1. Only
applicable for horizontal elements
(beams and slabs)
Structural
Framing, Floors,
Stairs
COST_Consumable
Total cost of consumables based on
Equation 3.2. Only applicable for
vertical elements (columns and
walls).
Structural
Foundations,
Structural
Columns, Walls

71
Figure 3.12 Formwork consumables
Automated creation of shared parameters.
Shared parameters can be used in multiple Revit families or Revit projects. Creating a shared
parameter manually in Revit involves the following steps: (1) create an empty file with “.txt”
extension, (2) create a group parameter, and (3) create a shared parameter assigning name,
discipline, and parameter type. For the BIM-based formwork management tool, 36 shared
parameters are needed, so the process must be repeated 36 times the first time the list of shared
parameters is created. The advantage of shared parameters is that once the list is created and
populated in the “.txt” file (see figure 3.13), this file can be shared with future projects and the
parameters do not have to be created again.

72
Figure 3.13. Shared Parameters txt file.
Automating the process for creating the 36 shared parameters reduces the probability of mistakenly
naming or assigning data type for the parameters. Any error at this stage could create conflicts
when using the Dynamo scripts downstream in the workflow of the BIM-based tool. Using
Dynamo, all the shared parameters can be created and assigned to the respective element category,
eliminating the need to recreate the parameters each time. Figure 3.14 shows the Dynamo script
for this task and Figure 3.15 shows the results when this script is executed.
Figure 3.14. Dynamo Script for creating shared parameters from an Excel file.

73
Figure 3.15. Results of running Dynamo Script for creating shared parameters
Automation for creating project parameters.
A project parameter in Revit is a container of information that is defined by the user and then
added to multiple categories of elements in a specific project in Revit. Project parameters can be
created one by one or can be massively loaded using a shared parameter file to avoid creating all
the parameters again for each project in Revit. Project parameters are assigned to a list of elements’
categories using the following steps: (1) create or select shared parameter (if the parameter is
created, then assign name, discipline, type of parameter, and parameter group), (2) define if the
parameter is specific for every instance and not for a Revit family, and (3) select all the categories
that have this parameter. This process could be time consuming considering the 36 project
parameters that are required. Also, any human error in assigning the categories for each parameter
can impede the workflow of the BIM-based formwork management tool. Figure 3.16 shows the
empty list of project parameters before running the Dynamo Script for automating project
parameter creation and the results of using this script.
Empty list of
shared parameters
Populated list of
shared parameters
Selecting sheet
from the XLS file
Selecting XLS file

74
Figure 3.16. Result of running script for creating project parameters
3.4. Auditing the BIM model for formwork management
In Revit, structural elements have joint priorities, this joint priority is related to the placement of
one element over others, based on the location of the joints. In Figure 3.17 the placement of the
floor element has priority over the placement of the beams and the column, and in Figure 3.18 the
placement of the column has the priority over the placement of the floor and the beams.
Figure 3.17. Floor priority over beams and
columns
Figure 3.18. Column priority over the floor
and beams
Since a BIM model can be generated without considering that columns have the greater joint
priority placement, over the beams, and the beams over the slabs, the first step is aligning the
model to the priority hierarchy of joint placement before running the Dynamo scripts. Changing
joint placement priorities can be done manually in Revit with “switch priority” tool but since
project has many “joints’, this process should be automated. Figure 3.19 shows the results of
Empty list of
project parameters
Populated
list of project
parameters
Selecting sheet from the
XLS file
Selecting XLS file

75
running the Dynamo script developed for changing the priority of the placement of structural
elements. The inputs are the category of elements that will “switch” the order of priorities.
Figure 3.19. Results of running Dynamo script to switch element priorities
Vertical elements such as columns and walls are commonly built in two phases: in the first phase
the vertical concrete element is poured only until the bottom of the horizontal element that
intersects with it, and in the second phase the placement of the remaining vertical concrete element
is completed once the horizontal elements are placed. If the columns and walls are modeled without
this consideration (two phases of concrete placement), the BIM model can be edited using the
“Split element” tool of Revit to divide all vertical element in two pieces, one for each concrete
placement phase. If the BIM model was already modeled having this consideration, then there is
no need to use the “split element” tool. Also, there may be cases as shown in Figure 3.20, where
the columns are poured in one single phase since the columns are adjacent to steel beams, and
hence, there is no need to “split” columns. Similarly, Figure 3.21 shows a monolithic wall -slab
system, where there is no need to split walls into two phases.
“Category priority 1” will have joint priority
placement over “Catergory priority 2”

76
Figure 3.20. RC column and steel beam
connection
Figure 3.21. Monolithic structure with tunnel
formwork
The process of “splitting” vertical elements could be time consuming if it is done manually using
“split element” tool in Revit. To address this challenge, a set of tools for “splitting columns and
walls” was prepared using Dynamo. This tool set considers the options to split vertical elements
by selecting one single element, by selecting multiple elements, by selecting all elements in a
specific level or selecting all elements in the model. Figure 3.22 shows the results of the Dynamo
script for splitting columns and Figure 3.23 shows the results of running the script for splitting
walls.
Figure 3.22. Results of Dynamo script for splitting columns
Tools set of Dynamo
scripts for splitting
columns

77
Figure 3.23. Results of Dynamo script for splitting walls.
The logic of the Dynamo script for splitting columns is: (1) select all columns, (2) for each column
find the adjacent beam with the lowest bottom level, and (3) use the “Z” coordinate of this beam
bottom level to “split” the column. Columns are created in Revit using the vertical axis that passes
through the centroid of the column solid. In Revit, this vertical axis is named “curve”, and defines
the height, start point and end point of the solid for 3D modeling the column. For “splitting” a
column the process is: (1) generate two new “curves” to define the two new “columns” (one for
each concrete placement phase), (2) generate the new two columns using these “curves” as
generating path, and (3) delete the original column from the Revit model. A similar process is
followed for the walls. However, since the “wall curve” is only the horizontal axis or path of the
wall, instead of splitting the wall “curve”, a new wall for the “joint” element (wall and slab
intersection) can be created in which the height will be defined by the slap depth. The “top offset”
of the original wall is then adjusted to the bottom of the adjacent slab. Figure 3.24 shows a high-
level view of the nodes and workflow for splitting all columns in a BIM model using Dynamo.
Tools set of Dynamo
scripts for splitting
walls

78
Figure 3.24. Dynamo Script for splitting all columns in the BIM model.
3.5. Work zoning process using BIM.
The objective of the work zoning process is balancing the workload between the work zones to
reduce the variability of labor hours across different work zones. For this task, Revit has available
the “schedules/quantities” tool. Since the BIM model is enriched with parameters related to steel
reinforcement quantity ratios (kg/m3), it possible to compute the quantity takeoffs for steel
reinforcement using Equation 3.3 or using Equation 3.4 in terms of the “MOD parameters”.
𝑆𝑡𝑒𝑒𝑙 𝑟𝑒𝑖𝑛𝑓𝑜𝑟𝑐𝑒𝑚𝑒𝑛𝑡 𝑞𝑢𝑎𝑛𝑡𝑖𝑡𝑦 𝑡𝑎𝑘𝑒𝑜𝑓𝑓 = 𝑆𝑡𝑒𝑒𝑙 𝑟𝑎𝑡𝑖𝑜 (𝑘𝑔/𝑚3) 𝑥 𝐶𝑜𝑛𝑐𝑟𝑒𝑡𝑒 𝑉𝑜𝑙𝑢𝑚𝑒 (𝑚3)(3.3)
MOD_Steel = MOD_Steel_Ratio 𝑥 𝑉𝑜𝑙𝑢𝑚𝑒 (3.4)
Since the BIM model is enriched with parameters related to productivity, it is possible to estimate
the total number of labor hours for installation of each element, based on the quantity takeoffs and
productivity index parameters of each element in Revit. Equation 3.5 is used for estimating the
total quantity of labor hours for installation of each element, or the equation 3.6 in terms of the
“PROD parameters”.
𝑇𝑜𝑡𝑎𝑙 𝑙𝑎𝑏𝑜𝑟 ℎ𝑜𝑢𝑟𝑠 = 𝑃1𝑥𝑄1 + 𝑃2𝑥𝑄2 + 𝑃3𝑥𝑄3 (3.5)
Where:
P1 = Concrete productivity index in terms of (hours/m3)
P2 = Formwork productivity index in terms of (hours/m2)
P3 = Rebar productivity index in terms of (hours/kg)
Q1 = Concrete volume in terms of (m3)
Q2 = Formwork area in terms of (m2)
Q3 = Rebar in terms of (kg)

79
PROD_Labor = 𝑃1𝑥𝑄1 + 𝑃2𝑥𝑄2 + 𝑃3𝑥𝑄3 (3.6)
P1 = “PROD_PI_Conc”
P2 = “PROD_PI_Form”
P3 = “PROD_PI_Steel”
Q1 = “Volume”
Q2 = “FORM_Dim_Total”
Q3 = “MOD_Steel”
A quantity takeoff summary for each work zone could be generated converting all the BIM
elements into “Parts”. A “Part” element inherits the parameters of the parent elements from which
it was generated. Revit cannot combine in a “Schedules/Quantities” table elements type “host”
(“Walls” and “Floors”) with elements “Family Type” (“Structural Foundations”, “Structural
Columns”, “Structural Framing”), but converting all the elements as “Parts” then a
“Schedules/Quantities” table can be generated as shown in Figure 3.25.
Figure 3.25. Work zone leveling using Parts and multicategory schedules
When concrete placement is planned, work zones are delimited by construction joints. However,
when formwork installation is considered, each horizontal element should only be assigned a
single work zone parameter value. Even though the construction joints are not used to “split”
elements for formwork work zoning, these imaginary lines can be used for projecting them to the
rest of the building floor plans and assigning work zones for every element. Using a Dynamo

80
script, the work zoning process is automated using the following steps: (1) identifying to which
work zone each element pertains, and (2) assigning the work zone name to the parameter
“MOD_WorkZone” for each element. The results of using this Dynamo script for work zoning are
shown in Figure 3.26.
Figure 3.26. Results of running Dynamo script for work zoning
The workflow of the Dynamo Script for classifying each element in its respective work zone
consists of creating a solid boundary for each work zone, collecting all the elements that are
contained by each solid boundary and assigning to all these elements the corresponding work zone
value (“WZ1”, “WZ2”, WZ3”, “WZ4”). Figure 3.27 shows a general view of the Dynamo script
design for work zoning a BIM model.
Green lines are inputs
drawn by user Select the green line boundary
Select the green lines that
represent “construction joints”

81
Figure 3.27. Dynamo Script for work zoning elements
3.6. Formwork modeling automation
As shown in Figure 3.28, an input for the formwork modeling script is the “Revit materials” that
will be used to represent each formwork solution type and each “material” type is coded in a
different color. Figure 3.28 shows the Dynamo script for creating a list of “Revit materials” and
Figure 3.29 shows the results of running the script. This script needs as inputs a file path for an
Excel file as well as the sheet name of the Excel file for reading the information. Using this
information, the characteristics of the materials (name, appearance, and color) are generated. For
instance, “Formwork_Beam” is blue, “Formwork_Column” is red, etc. (see Figure 3.29 and 3.32).

82
Figure 3.28. Dynamo script for creating materials.
Figure 3.29. Results of running Dynamo script for creating materials
For a LOD 200 formwork modeling, the use of the “Generic Models” category could be sufficient
for obtaining a general idea of the shape and location of formwork as well as the formwork area
for each element in the BIM model (columns, beams, etc.) In Revit there is no tool available for
computing formwork areas, so the computation must be done manually for each element. A
common practice to use Revit for computing formwork surface area is using the “Paint” tool to
apply a “material” coat to every surface that need to be formed. This process could be time
consuming since a building has many surfaces that need to be formed.

83
A part of the Dynamo script for estimating the formwork area of each element is shown in the
Figure 3.30. The general idea of the script is to create a solid with the union of all the elements
that comprise the concrete frame of the building, and then isolate the faces that should be covered
by forms from the ones that should not. Then the areas of theses faces are obtained and stored in
the parameter “FORM_Dim_Lateral” if the faces represent the lateral formwork, and in the
parameter “FORM_Dim_Bottom” if the faces represent the formwork for the bottom side of the
element.
Figure 3.30. Dynamo script for modeling and calculating the formwork area of a foundation.
Figure 3.31 shows an example of a foundation in Dynamo where the blue faces are identified by
the Dynamo script as the faces that need to be formed and the black dots are the center point of
each face. In Figure 3.32 are shown the results of running the script for modeling formwork
surfaces and calculating the formwork area of each element and storing this value it in the
corresponding formwork area parameters.
Figure 3.31. Dynamo view of the surfaces that represent the formwork for a foundation.

84
Figure 3.32. Results of running Dynamo script for modeling formworks.
3.7. Populating parameters using Dynamo
Section 3.4 described the process for creating all the “project parameters” in Revit. This section
describes the process to enrich these parameters fields with values.
Populating MOD parameters
The MOD parameters do not need any external input, since all the data necessary for populating
these parameters is already present in the BIM model as Revit built-in parameters. Figure 3.33
shows the Dynamo script for populating the “MOD parameters” and Figure 3.34 shows the results
of running the Dynamo Script.
BIM model before formwork
modeling
Formowork modeling with concrete
elements turned off. view.

85
Figure 3.33. Dynamo script for populating MOD parameters
Figure 3.34. Results of running Dynamo script for populating MOD parameters
As shown in Figure 3.34 not all the MOD parameters are populated since the “MOD_S_WorkZone”
parameter is filled in using the “JRR_Work_Zoning_Horzontals.dyn”, the “MOD_S_Code”
parameter is populated using the “JRR_Import-Dates-from-Excel.dyn” and the
“MOD_Steel_Ratio” and “MOD_Steel” paratmers are completed using the
“JRR_Rates&Ratios_01_Steel.dyn”. Figure 3.35 shows the results after running the scripts for
“MOD”, for “TIME” and for “Steel Ratios”. The default reinforcement steel ratios used for this
application are shown in Table 3.8, but these values can be customized according to user
preferences.
Empty
values of
project
parameters
MOD
parameters
populated
after running
Dynamo
Dynamo script to
populate MOD
parameters

86
Figure 3.35. Results of running MOD, TIME, and STEEL Dynamos scripts
Table 3.8. Default steel ratios
Code Description Ratio Unit
MOD_Steel_Ratio Foundation 60 kg/m3
MOD_Steel_Ratio Column 210 kg/m3
MOD_Steel_Ratio Wall 190 kg/m3
MOD_Steel_Ratio Beam 160 kg/m3
MOD_Steel_Ratio Slab 120 kg/m3
Populating TIME parameters
The input for running the Dynamo Script that populates “TIME” parameters is an Excel file that
contains all the TIME parameter values and the name of the Excel sheet in this file. Figure 3.36
shows the schedule prepared as an input for calculating the stripping dates for each work zone.
These dates can be exported to an Excel file that will be used as an input for the Dynamo script
that stores the data in the corresponding “TIME” parameter to enrich the BIM formwork model.
Figure 3.37 shows an VBA Excel Macro that is used to automate the generation of the schedule
structure. This VBA Excel Macro uses the following data as input: (1) number of stories in the
building, (2) number of work zones per level, (3) duration to assemble vertical and horizontal
formwork, and (4) durations for concrete elements to gain sufficient strength before forms are
stripped.
The VBA Excel Macro will generate the structure of activities that will be used to “copy” and
“paste” the values from the Excel Sheet to the MS Project schedule and generate the dates for each
work zones as shown in Figure 3.36. Figure 3.36 and Figure 3.37 match perfectly, as can be seen

87
in the first 9 activity lines (first 9 rows in Excel and MS Project), since the VBA Excel Macro
creates the field values for “Task Name”, “Duration”, “Task Calendar”, and “Predecessors”
necessary for the MS Project schedule. In the MS Project file, two “calendars” were implemented:
(1) “Standard” calendar that only considers working days from Monday to Friday, with exception
of holidays, and (2) “Formwork” calendar that considers each day of the calendar as a working
day. The reason for having two calendars is that the “Standard” calendar will be assigned for the
formwork assembly activities, and the “Formwork” calendar will be assigned for the time concrete
needs to gain strength.
Figure 3.36. Schedule generated in MS Project to estimate stripping dates.
Figure 3.37. VBA Excel Macro for creating Schedule Structure of activities to generate MS
project schedule.
Figure 3.38 shows the results of importing the data of the excel file into the Revit “TIME” field
parameters. Since Revit does not have a data type for dates, a numeric format is used. For example,
in Excel the value “0” is represented as the date “1/1/1900”. So, then the value “44279” shown in
Figure 3.38, is equivalent to the date “03/24/2021”. Figure 3.39 shows the Dynamo script for
populating “TIME” parameters.

88
Figure 3.38 Result of running Dynamo Script for populating dates and time
Figure 3.39. Dynamo Script for getting dates and durations.
Populating FORM parameters
FORM parameters are completed using two Dynamo scripts. The first script was described in the
section titled “Formwork modeling” section. The second script is used for obtaining the formwork
weight ratio (kg/m2) for each formwork solution from an Excel file source. The results of the
Dynamo script for obtaining the formwork weight ratios are shown in Figure 3.40and the default
values for weight ratios of formwork solutions are shown in Table 3.9. Figure 3.41 shows a general
view of the Dynamo script for populating the “FORM_Wt” parameters.
Task Name Formwork Shoring Strip Date
WS1-L1-WZ1-V 2 0 44257.00
WS1-L1-WZ1-H 11 7 44267.00
WS1-L1-WZ2-V 2 0 44258.00
WS1-L1-WZ2-H 13 7 44270.00
WS1-L1-WZ3-V 2 0 44259.00
WS1-L1-WZ3-H 13 7 44271.00
WS1-L1-WZ4-V 2 0 44260.00
WS1-L1-WZ4-H 13 7 44272.00
WS1-L2-WZ1-V 2 0 44261.00
WS1-L2-WZ1-H 10 7 44272.00
WS1-L2-WZ2-V 2 0 44264.00

89
Figure 3.40. Results of running "Weight ratios" script
The “FORM_Wt_Form_Total” is computed using Equation 3.7:
𝐹𝑂𝑅𝑀_𝑊𝑡_𝐹𝑜𝑟𝑚_𝑇𝑜𝑡𝑎𝑙 = 𝐴 + 𝐵 (3.7)
Where:
A = (FORM_Dim_Lateral) x (FORM_Wt_Form_Lateral)
B = (FORM_Dim_Bottom) x (FORM_Wt_Form_bottom)
Table 3.9. Weight ratios for formwork solutions
CODE ELEMENT WEIGHT
FORM_Wt_Form_Lateral Foundation 100 kg/m2
FORM_Wt_Form_Lateral Wall 100 kg/m2
FORM_Wt_Form_Lateral Column 65 kg/m2
FORM_Wt_Form_Bottom Floor 45 kg/m2
FORM_Wt_Shore_Bottom Floor reshoring 10 kg/m2
FORM_Wt_Form_Lateral Beam side 70 kg/m2
FORM_Wt_Form_Linear Beam support 100 kg/m
FORM_Wt_Shore_Linear Beam reshoring 50 kg/m
Figure 3.41. Dynamo script for estimating formwork weight for foundations.

90
Populating PROD parameters
The PROD parameters are populated using an Excel file where all the data of the productivity
indexes are stored. The results of running the Dynamo script for filling up the PROD parameters
are shown in Figure 3.42. Figure 3.43 shows a general view of the Dynamo script for populating
“PROD” parameters.
Figure 3.42. Results of running Dynamo script for filling up PROD parameters
The parameter “PROD_Labor” is computed using the Equation 3.8.
𝑃𝑅𝑂𝐷_𝐿𝑎𝑏𝑜𝑟 = 𝐴 + 𝐵 + 𝐶 (3.8)
Where:
A = Volume x PI_Conc x PROD_PI_Conc
B = FORM_Dim_Total x PI_Form x PROD_PI_Form
C = MOD_Steel xPI_Steel = PROD_PI_Steel
The default productivity indexes used for this application are shown in Table 3.10. These values
could be customized upon user preferences.
Table 3.10. Productivity indexes references
CODE Description Unit LH/unit
PROD_PI_Conc Concrete productivity index m3 1.50
PROD_PI_Form Formwork productivity index m2 1.65
PROD_PI_Steel Rebar productivity index Kg 0.045
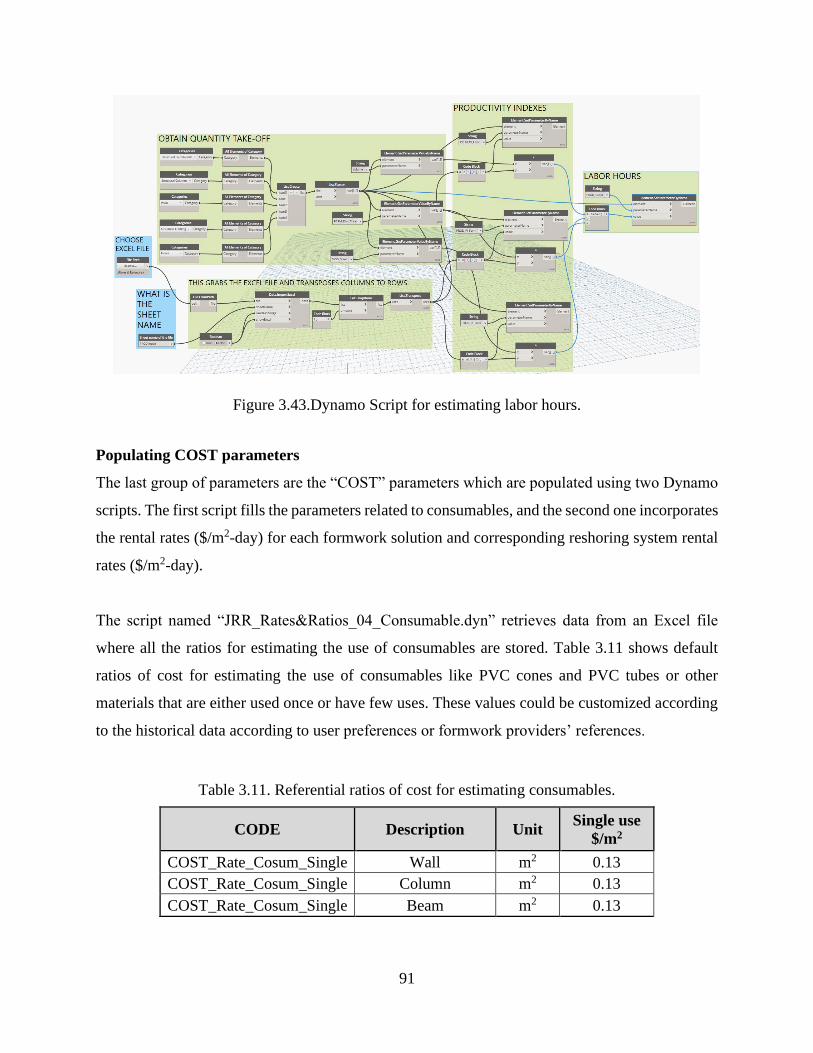
91
Figure 3.43.Dynamo Script for estimating labor hours.
Populating COST parameters
The last group of parameters are the “COST” parameters which are populated using two Dynamo
scripts. The first script fills the parameters related to consumables, and the second one incorporates
the rental rates ($/m2-day) for each formwork solution and corresponding reshoring system rental
rates ($/m2-day).
The script named “JRR_Rates&Ratios_04_Consumable.dyn” retrieves data from an Excel file
where all the ratios for estimating the use of consumables are stored. Table 3.11 shows default
ratios of cost for estimating the use of consumables like PVC cones and PVC tubes or other
materials that are either used once or have few uses. These values could be customized according
to the historical data according to user preferences or formwork providers’ references.
Table 3.11. Referential ratios of cost for estimating consumables.
CODE Description Unit Single use
$/m2
COST_Rate_Cosum_Single Wall m2 0.13
COST_Rate_Cosum_Single Column m2 0.13
COST_Rate_Cosum_Single Beam m2 0.13

92
Using the cost ratios and the lateral area, the cost of consumables can be estimated using the
Equation 3.9. Figure 3.44 shows the Dynamo Script for estimating formwork consumables cost,
and Figure 3.45 the results of using the script for estimating consumables cost.
𝐶𝑂𝑆𝑇_𝐶𝑜𝑛𝑠𝑢𝑚𝑎𝑏𝑙𝑒 = 𝐶𝑂𝑆𝑇_𝑅𝑎𝑡𝑒_𝐶𝑜𝑛𝑠𝑢𝑚𝑎𝑏𝑙𝑒 𝑥 𝐹𝑂𝑅𝑀_𝐷𝑖𝑚_𝐿𝑎𝑡𝑒𝑟𝑎𝑙 (3.9)
Figure 3.44. Dynamo script for estimating consumable cost.
Figure 3.45. Results of running script for estimating formwork consumables cost
The script named “JRR_Rates&Ratios_05_Cost.dyn” retrieves the information regarding the
rental cost for different solutions of formwork systems. The coding of rental costs is based on
common bidding practices of formwork providers. Table 3.12 and Table 3.13 show the formwork
rental costs for several formwork solution systems. In Table 3.13 the beam side formwork system
classification is based on the beam’s depth.
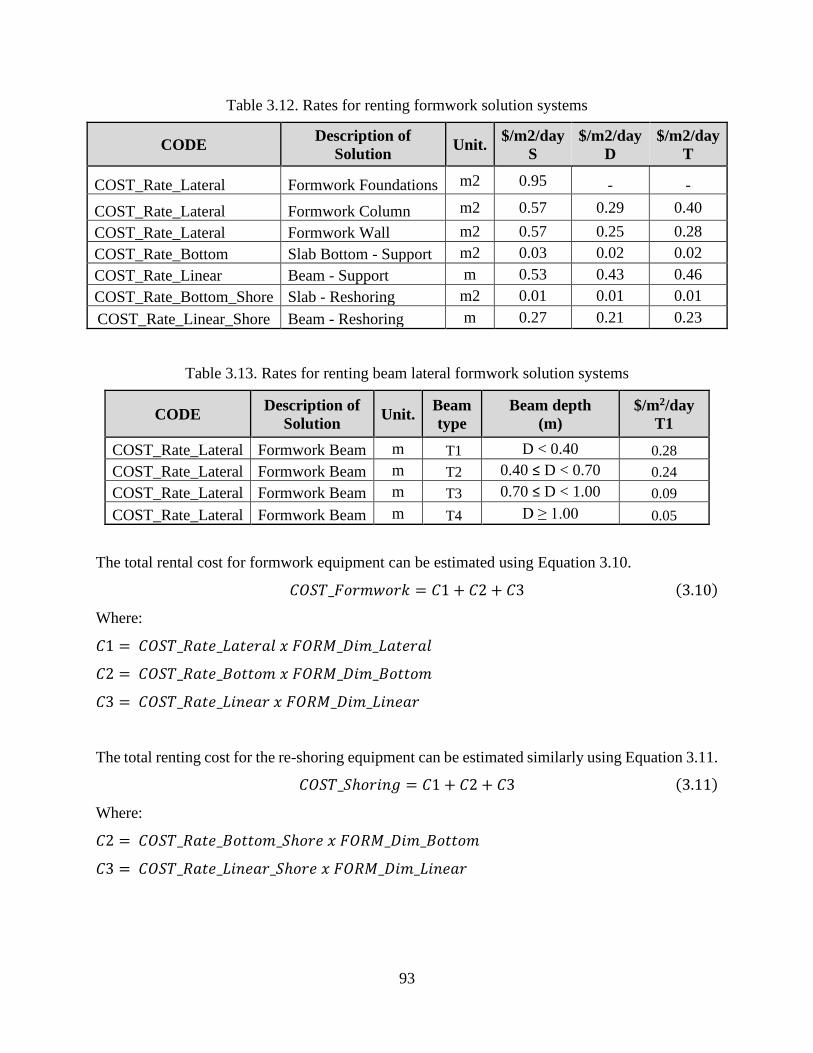
93
Table 3.12. Rates for renting formwork solution systems
CODE Description of
Solution Unit.
$/m2/day
S
$/m2/day
D
$/m2/day
T
COST_Rate_Lateral Formwork Foundations m2 0.95 - -
COST_Rate_Lateral Formwork Column m2 0.57 0.29 0.40
COST_Rate_Lateral Formwork Wall m2 0.57 0.25 0.28
COST_Rate_Bottom Slab Bottom - Support m2 0.03 0.02 0.02
COST_Rate_Linear Beam - Support m 0.53 0.43 0.46
COST_Rate_Bottom_Shore Slab - Reshoring m2 0.01 0.01 0.01
COST_Rate_Linear_Shore Beam - Reshoring m 0.27 0.21 0.23
Table 3.13. Rates for renting beam lateral formwork solution systems
CODE Description of
Solution Unit.
Beam
type
Beam depth
(m)
$/m2/day
T1
COST_Rate_Lateral Formwork Beam m T1 D < 0.40 0.28
COST_Rate_Lateral Formwork Beam m T2 0.40 ≤ D < 0.70 0.24
COST_Rate_Lateral Formwork Beam m T3 0.70 ≤ D < 1.00 0.09
COST_Rate_Lateral Formwork Beam m T4 D ≥ 1.00 0.05
The total rental cost for formwork equipment can be estimated using Equation 3.10.
𝐶𝑂𝑆𝑇_𝐹𝑜𝑟𝑚𝑤𝑜𝑟𝑘 = 𝐶1 + 𝐶2 + 𝐶3 (3.10)
Where:
𝐶1 = 𝐶𝑂𝑆𝑇_𝑅𝑎𝑡𝑒_𝐿𝑎𝑡𝑒𝑟𝑎𝑙 𝑥 𝐹𝑂𝑅𝑀_𝐷𝑖𝑚_𝐿𝑎𝑡𝑒𝑟𝑎𝑙
𝐶2 = 𝐶𝑂𝑆𝑇_𝑅𝑎𝑡𝑒_𝐵𝑜𝑡𝑡𝑜𝑚 𝑥 𝐹𝑂𝑅𝑀_𝐷𝑖𝑚_𝐵𝑜𝑡𝑡𝑜𝑚
𝐶3 = 𝐶𝑂𝑆𝑇_𝑅𝑎𝑡𝑒_𝐿𝑖𝑛𝑒𝑎𝑟 𝑥 𝐹𝑂𝑅𝑀_𝐷𝑖𝑚_𝐿𝑖𝑛𝑒𝑎𝑟
The total renting cost for the re-shoring equipment can be estimated similarly using Equation 3.11.
𝐶𝑂𝑆𝑇_𝑆ℎ𝑜𝑟𝑖𝑛𝑔 = 𝐶1 + 𝐶2 + 𝐶3 (3.11)
Where:
𝐶2 = 𝐶𝑂𝑆𝑇_𝑅𝑎𝑡𝑒_𝐵𝑜𝑡𝑡𝑜𝑚_𝑆ℎ𝑜𝑟𝑒 𝑥 𝐹𝑂𝑅𝑀_𝐷𝑖𝑚_𝐵𝑜𝑡𝑡𝑜𝑚
𝐶3 = 𝐶𝑂𝑆𝑇_𝑅𝑎𝑡𝑒_𝐿𝑖𝑛𝑒𝑎𝑟_𝑆ℎ𝑜𝑟𝑒 𝑥 𝐹𝑂𝑅𝑀_𝐷𝑖𝑚_𝐿𝑖𝑛𝑒𝑎𝑟

94
Figure 3.46. Dynamo Script for estimating renting cost of column formwork.
The results of running the Dynamo Script named “JRR_Rates&Ratios_05_Cost.dyn” are shown
in Figure 3.47.
Figure 3.47. Results of running script for estimating formworks renting costs
Summary
A summary workflow is presented in Figure 3.48 to highlight the sequence of using different
Dynamo scripts, Excel files and MS Project files developed for this thesis. Each box groups a set
of tools with a common process. These boxes represent processes in the BIM-based tool that have
been described in this chapter. An image of the result using a 3-story building sample is shown at
the end of the workflow. All blocks are interconnected with arrows that represent the flow in
which each tool must be executed.

95
CREATE PARAMETERS
AUDITING MODEL
CREATE MATERIALS
FORM PARAMETERSMOD PARAMETERS
TIME PARAMETERSPROD PARAMETERS
COST PARAMETERS RESULTS
Figure 3.48. Flowchart for using Dynamo Scripts and Excel files

96
EVALUATION OF THE FORMWORK MANAGEMENT TOOL
Chapter 3 described the first phase of the BIM-based formwork management tool, and focused on
BIM formwork modeling and enrichment with formwork related data of the BIM model. Chapter
4 describes the second phase for the use of the BIM-based formwork management tool, which is
the utilization of the BIM model generated during first phase, for multiple cost and time analyses.
The cost and time analyses include: (1) the computation of quantities of rebar, formwork, and
concrete, (2) the formwork cost analysis which involve the estimation of the average formwork
unit cost including cost of labor, formwork rental, plywood, consumables, and freights, (3) the
computation of other formwork KPIs like rotation factor and formwork efficiency, (4) the
formwork demand profile that will allow the user to estimate how much formwork should be
delivered to the jobsite, and (5) the generation of color coded layouts for multiple purposes like
tracking formwork removal dates and work zoning. At the end of this chapter, two case studies
are presented and the results of using the two-phase implementation BIM tool are explained.
4.2. Roadmap for using the BIM-based formwork management tool.
Chapter 3 focused on the first phase of the BIM-based formwork management tool, which involves
the development of a BIM model that is enriched with geometric (height, depth, volume, area, etc.)
and non-geometric (weight, cost, productivity, installation time, etc.) data related to formwork.
Chapter 4 covers the second phase of this tool and focuses on how the BIM model developed in
the first phase can be used for formwork management. Figure 4.1 shows a roadmap for the
implementation of the six steps used in phase 2. Each column in this figure represents one step that
could be implemented using the BIM model as the unique input. Each process has a different
output and not necessarily every process needs to be implemented, also every column is
independent of the others, so their sequence does not represent the order for application.
Implementation of each of the processes will depend on the user’s requirements. At bottom of each
column of the roadmap the main purpose for each process (controlling, planning, benchmarking,
procurement, preconstruction, and tracking) is defined. The heading of each column in the
roadmap is related to a specific section in this chapter where the process is fully detailed. For

97
implementation of the second phase of the BIM-based formwork management tool, different
software packages and specific tools are required. These software packages and tools are
represented with an icon next to box that represent each input, process, or output in the roadmap.
For better understanding a legend describes the icons at the bottom of Figure 4.1.

98
ROADMAP FOR BIM-BASED FORMWORK MANAGEMENT TOOL: Phase 2
INP
UT
PR
OC
ES
SO
UT
PU
TP
UR
PO
SE
S6: Section 4.6S1: Section 4.2 S3: Section 4.3 S4: Section 4.4S2: Section4.3 S5: Section 4.5
BIM Model
(Phase 1 Output)
Generation of
quantities
schedules
Quantities/ schedules:
Steel reinforcement,
Formwork,
Concrete
Controlling:
Invoices quantities,
Billing quantitates,
Progress reports
BIM Model
(Phase 1 Output)
BIM Model
(Phase 1 Output)
BIM Model
(Phase 1 Output)
BIM Model
(Phase 1 Output)
BIM Model
(Phase 1 Output)
Formwork cost
analysis
Summary reports:
RC quantities,
Formwork systems
quantities,
Formwork maximum set
Planning:
Provider selection,
Cost estimation,
Plywood demand,
Round trips demand,
Generation of
formwork KPIs
Formwork KPIs:
Average unit cost,
Rotation factor,
Formwork efficiency
Benchmarking:
Past projects,
Future projects,
Competitors
Generation of
formwork
demand profiles
Formwork profiles:
Formwork demand,
Formwork requirement
Procurement:
Formwork supply,
Formwork devolution
Generation of 4D
& 5D simulations
Simulations:
4D & 5D
Preconstruction:
Construction sequence,
Constructability,
Execution planning
Generation of
color code layouts
Color mapping layouts:
Element types,
Work zoning,
Striping dates,
Tracking:
Formwork removal,
Physical progress,
Planning progress
Revit Python Dynamo Project Excel Navisworks Manage Audio Video Interleave
Schedule/ Quantities Task Dialog 2-D Column Chart3D View New Sheet
Figure 4.1. Roadmap for the second phase of the BIM-based formwork management tool

99
4.3. Generation of schedules and quantities
According to Autodesk Help (2021), a schedule in Revit is a tabular representation that displays
any type of element in a BIM model and list all the instances of the type of element selected or
grouped instances based on a designated criterion. Two types of schedules are commonly used for
preparing a quantity takeoff summary: “quantities schedule”, and “material takeoff schedule”.
Quantities schedules and material takeoff schedules for formwork systems can be used for
reviewing the quantities of the invoices presented by a subcontractor or by the formwork supplier.
Also, these schedules can be used for preparing the billing quantities that will be presented to the
owner, and for generating progress reports related to formwork.
Quantities schedule
This type of schedule is recommended when there is no need to consolidate all element types in a
single table. In this type of schedules, the user can select multiple categories (“Multi-Category”)
for a single table, but only if the category is a “family type” component. Of all the structural
elements, “Structural Foundations”, “Structural Columns”, and “Structural Framing” are
considered “family type” components. In contrast, “Walls” and “Floors” are considered “host”
components and cannot be combined with “family type” components in the same table. Figure 4.2
shows the “Multi-Category” selection option for a new schedule, and Figure 4.3 shows the results
of applying this “Multi-Category” selection option. The quantities schedule for “Floors” and
“Walls” must be generated separately. An alternative option is converting all the elements (family
and host components) into “Parts” like the process described in Section 3.5 for work zone leveling.

100
Figure 4.2. Multi-Category option for creating a
new quantities list/schedule
Figure 4.3. Result of creating a Multi-
Category schedule
Materials takeoff schedule
An option for creating a single summary table that contains all formwork solution systems (family
components and host components) is using the “materials takeoff schedule” option. Figure 4.4
shows how to create a “New Material Takeoff” schedule using the category “Generic Models”.
Formwork were modeled using a Dynamo Script in Chapter 3, using the category “Generic Models”
for “direct modeling” by thickening the faces of the solid that represent a formwork contact area.
To differentiate between formwork solution system in the “materials takeoff schedule”, each
formwork solution system has a different “material” property in Revit. Since each formwork
solution system was modeled considering a different “material” property, a summary breakdown
table can be generated using the “material takeoff schedule” tool. Figure 4.5 shows the results of
generating a “material takeoff schedule” considering as fields for the table the “Material: name”
and the “Material: area”.

101
Figure 4.4. Creating a New Material
Takeoff schedule
Figure 4.5. Results of creating a New Material
Takeoff schedule
4.4.Formwork cost analysis & KPIs
Formwork planning may include: (1) selecting the formwork provider, (2) estimating the
formwork cost for bidding, (3) estimating the quantity of plywood sheets that will be required for
executing the project, (4) estimating the number of trucks that will be necessary for transporting
all the formwork components to the jobsite and back to the supplier warehouse, and (5) computing
formwork KPIs for benchmarking. Since the BIM model is available from the first phase of the
BIM-based formwork management tool, the following summaries can be generated automatically
using Dynamo scripts: (1) quantities takeoff summary, (2) quantities takeoff summary for every
formwork solution system, (3) maximum set size for every formwork solution system, and (4)
formwork management KPIs (rotation factor and formwork efficiency).
4.4.1. Quantities takeoff summary for RC structure components
RC structures have three main components: (1) steel reinforcement, (2) formwork, and (3) concrete.
Since steel reinforcement is not modeled in the BIM model, the approximate quantity of steel
reinforcement can be determined by using ratios based on the concrete volume. The steel
reinforcement quantity was included as a numeric parameter named “MOD_Steel” in the BIM
model, so the total quantity of rebar can be computed by adding the value of every element for the
“MOD Steel” parameter. Similarly, the total formwork area can be determined by adding the value
of every element for the parameter named “FORM_Dim_Total”. Likewise, the overall sum of the

102
values of the parameter “Volume” for all the elements in the model will represent the total concrete
volume in the project, and the total amount of labor hours can be computed using the overall sum
of the value of the parameter “PROD_Labor” for every element in the model.
A Dynamo script named “JRR_01_QTO_Summary.dyn” was developed for automating the
computation of this summary of quantities for the entire project. Figure 4.6 shows the workflow
of this Dynamo script. The script is used to select all RC elements, create a list with these elements,
obtain the parameter values of the elements in the list regarding three parameters (Volume,
FORM_Dim_Total, and MOD_Steel), then separate all these values into three sub lists (one list
for Volume, one for FORM_Dim_total, and one for MOD_Steel), and then add the values in each
sub list. The results are then presented in a “Task Dialog” window using a python script node.
Figure 4.7 presents the results of running the Dynamo script for determining the quantities takeoff
summary for the entire project.
Figure 4.6. Dynamo script for computing quantities summary for entire project

103
Figure 4.7. Results of running Dynamo script for computing quantities summary.
4.4.2. Quantities takeoff summary for formwork solution systems
A quantity takeoff summary requires a breakdown structure to differentiate the formwork
quantities by formwork solution system (column formwork, beam support, beam formwork sides,
etc.) that are considered in the project. The summary discussed in Section 4.3.1 considers
formwork area as a single value, so a new summary is required to consider a quantity takeoff
breakdown structure that differentiates formwork areas by solution system: foundations area,
columns area, walls area, beam lateral sides area, beam bottom area, beam support length, and
slabs bottom area.
A Dynamo script named “JRR_02_Formwork_Summary.dyn” was developed for automating the
generation of the summary of formwork quantities considering the breakdown by formwork
solution system types. The Dynamo script also computes: (1) the total formwork area, (2) the total
formwork rental cost, (3) the total reshoring system rental cost, and (4) the total cost of
consumables, and the total labor cost required for forming and reshoring the entire project. Figure
4.8 shows the Dynamo script for creating the formwork areas in a breakdown summary. The
general workflow of this script consists of getting the overall sum for each value desired and then
use a task dialog for presenting all the results computed. Figure 4.9 shows the results of running
the Dynamo script for computing the formwork summary. The summary appears in a “Task Dialog”
window but with few changes in the Dynamo script, the result could be instead exported to an
Excel file for better presentation and more easily access of the data for other calculations that the
user may require.

104
Figure 4.8. Dynamo script for generating formwork summary.
Figure 4.9. Results of running Dynamo script for formwork summary.
4.4.3. Maximum formwork set size by formwork solution system.
The maximum formwork set represents the total formwork required for executing a project
considering a reuse scheme. The maximum formwork set size depends on the number of sets

105
required for forming or shoring the structure and the area that each set can cover. The number of
sets is defined by the number of days that a set is used for forming or shoring a single work zone
before being used in the next work zone available. A simple example of this process would be the
case of a perimeter concrete wall of 100m length and 3m height, that is planned to be executed in
10 equal work zones of 10m length each one. If the time for setting the formwork is 0.5 days, the
time for supporting the placed concrete until the formwork is stripped is 1 day and the time for
striping the forms is 0.5 days, then the total time that a formwork set will be used for one single
work zone will be 2 days. If we consider a single production set, and a single forming crew then
the total number of sets that are required to maintain the construction flow is 2 sets. Since each
work zone is 10m in length, the formwork area of each work zone will be 60m2, if both faces of
the wall are formed. Equation 4.1 is used to compute the maximum formwork set size for the
example described.
𝑀𝑎𝑥𝑖𝑚𝑢𝑚𝑓𝑜𝑟𝑚𝑤𝑜𝑟𝑘𝑠𝑒𝑡𝑠𝑖𝑧𝑒 = (𝑊𝑜𝑟𝑘𝑧𝑜𝑛𝑒𝑓𝑜𝑟𝑚𝑤𝑜𝑟𝑘𝑎𝑟𝑒𝑎)𝑥(𝑁𝑢𝑚𝑏𝑒𝑟𝑜𝑓𝑆𝑒𝑡𝑠) (4.1)
𝑀𝑎𝑥𝑖𝑚𝑢𝑚 𝑓𝑜𝑟𝑚𝑤𝑜𝑟𝑘 𝑠𝑒𝑡 𝑠𝑖𝑧𝑒 = (60𝑚2) 𝑥 (2) = 120𝑚2
In construction projects it is common to have different formwork areas for each work zone. In such
cases, Eqn. 4.1 no longer provides an accurate way to estimate the maximum formwork set size.
Figure 4.10 presents an example for building foundations of different sizes where each work zone
has a different total formwork area. The right side of Figure 4.1 shows the total formwork area
required for each work zone, and the left side shows the plan view and a 3D view of the foundations
color coded with a different color for each work zone. In this example, 15 work zones are
considered, and the number of foundations is variable for each work zone. The construction
sequence is established according to the labeling of the work zones. If all forms used in a work
zone will be reused every two days (one day for assembly and one day that the form stays in place
while the placed concrete gains adequate strength), then the maximum formwork set size will be
established by the maximum sum of the formwork area of the two largest consecutives work zones.
In the example, pairing the work zones in groups of two consecutives work zones, the maximum
formwork area is reached in the pair comprising WZ7 and WZ8, so then the maximum formwork
set size would be 57 m2.

106
Figure 4.10. Analysis for computing foundations maximum formwork set size.
A Dynamo script named “JRR_03_Maximum_Formwork_Set.dyn” was developed for calculating
the maximum formwork set size for every formwork solution system. Figure 4.11 shows a blow-
up detail for the maximum set workflow for the formwork foundation from the Dynamo script
previously mentioned. The first step in the Dynamo workflow consists of determining the total
number of work zones (N_Zones) in the project, the number of sets (N_Sets) for the specific
formwork type, and the formwork area for each foundation in each work zone across the entire
building. The second step of the Dynamo Script uses these values as inputs to run a Python Script
node to calculate the maximum formwork set for this formwork type.
Figure 4.11. Dynamo script for computing the maximum formwork set size for foundations.

107
Figure 4.12 shows an example of how the estimation of maximum set size of formwork can be
done manually using Revit. In the example, the formwork area for WZ1 and WZ2 added together
provide the maximum formwork area required for building the foundations considering the reuse
scheme described earlier in this section.
Figure 4.12. Maximum formwork set size for foundations
Figure 4.13 shows the results of running the script “JRR_03_Maximum_Formwork_Set.dyn”. The
Dynamo script computes the maximum formwork set size for every solution system (Foundation,
Column, Wall, Beam bottom, Beam side, Beam support, Beam re-shore, Slab, and Slab re-shore).
The script also computes the total amount of plywood required as sheathing faces in slabs and
beams. An additional feature of this Dynamo tool is that the script can compute the total weight of
formwork equipment which provides the input for estimating the number of trucks required for
transporting all the formwork sets.
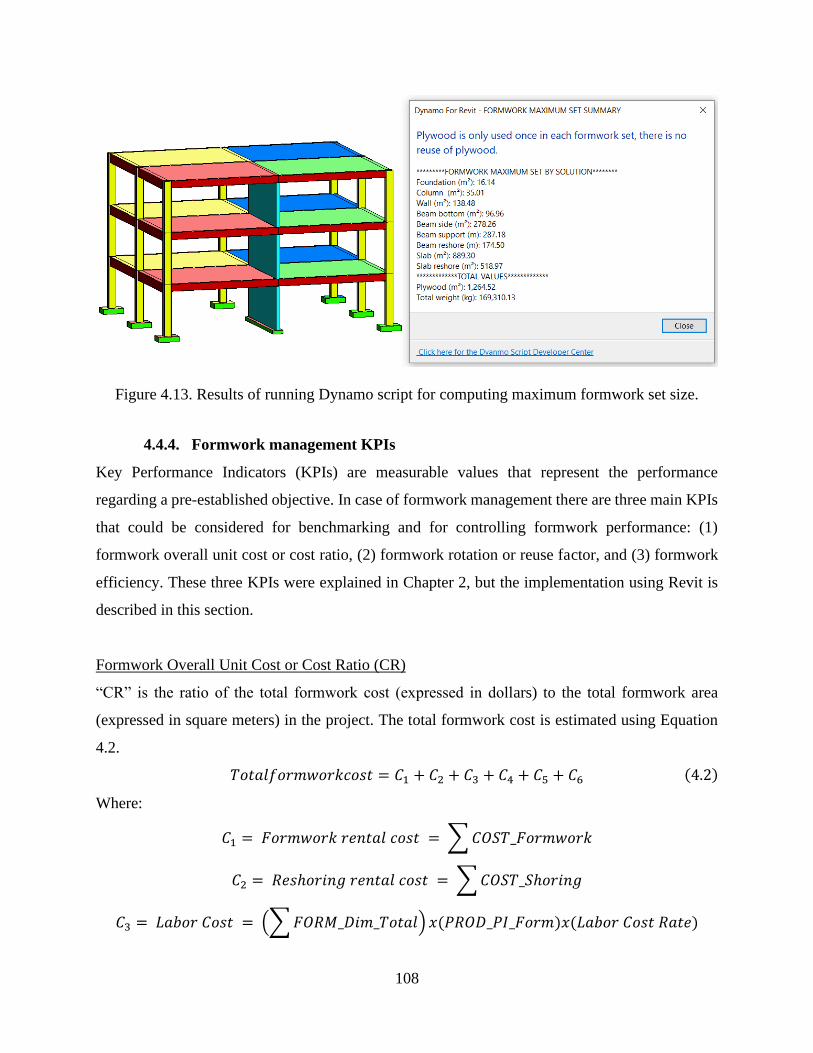
108
Figure 4.13. Results of running Dynamo script for computing maximum formwork set size.
4.4.4. Formwork management KPIs
Key Performance Indicators (KPIs) are measurable values that represent the performance
regarding a pre-established objective. In case of formwork management there are three main KPIs
that could be considered for benchmarking and for controlling formwork performance: (1)
formwork overall unit cost or cost ratio, (2) formwork rotation or reuse factor, and (3) formwork
efficiency. These three KPIs were explained in Chapter 2, but the implementation using Revit is
described in this section.
Formwork Overall Unit Cost or Cost Ratio (CR)
“CR” is the ratio of the total formwork cost (expressed in dollars) to the total formwork area
(expressed in square meters) in the project. The total formwork cost is estimated using Equation
4.2.
𝑇𝑜𝑡𝑎𝑙𝑓𝑜𝑟𝑚𝑤𝑜𝑟𝑘𝑐𝑜𝑠𝑡 = 𝐶1 + 𝐶2 + 𝐶3 + 𝐶4 + 𝐶5 + 𝐶6 (4.2)
Where:
𝐶1 = 𝐹𝑜𝑟𝑚𝑤𝑜𝑟𝑘 𝑟𝑒𝑛𝑡𝑎𝑙 𝑐𝑜𝑠𝑡 = ∑ 𝐶𝑂𝑆𝑇_𝐹𝑜𝑟𝑚𝑤𝑜𝑟𝑘
𝐶2 = 𝑅𝑒𝑠ℎ𝑜𝑟𝑖𝑛𝑔 𝑟𝑒𝑛𝑡𝑎𝑙 𝑐𝑜𝑠𝑡 = ∑ 𝐶𝑂𝑆𝑇_𝑆ℎ𝑜𝑟𝑖𝑛𝑔
𝐶3 = 𝐿𝑎𝑏𝑜𝑟 𝐶𝑜𝑠𝑡 = (∑ 𝐹𝑂𝑅𝑀_𝐷𝑖𝑚_𝑇𝑜𝑡𝑎𝑙) 𝑥(𝑃𝑅𝑂𝐷_𝑃𝐼_𝐹𝑜𝑟𝑚)𝑥(𝐿𝑎𝑏𝑜𝑟 𝐶𝑜𝑠𝑡 𝑅𝑎𝑡𝑒)

109
𝐶4 = 𝐶𝑜𝑛𝑠𝑢𝑚𝑎𝑏𝑙𝑒𝑠 𝐶𝑜𝑠𝑡 = ∑ 𝐶𝑂𝑆𝑇_𝐶𝑜𝑛𝑠𝑢𝑚𝑎𝑏𝑙𝑒
𝐶5 = 𝑃𝑙𝑦𝑤𝑜𝑜𝑑 𝐶𝑜𝑠𝑡 = (𝐹𝑟𝑒𝑖𝑔ℎ𝑡 𝑅𝑎𝑡𝑒)𝑥(∑ 𝑊𝑖
8
𝑖=1)/𝑇𝑟𝑢𝑐𝑘 𝑝𝑎𝑦𝑙𝑜𝑎𝑑 𝑐𝑎𝑝𝑎𝑐𝑖𝑡𝑦 (𝑘𝑔)
𝑊1 = 𝑀𝑎𝑥𝑖𝑚𝑢𝑚 𝐹𝑜𝑟𝑚𝑤𝑜𝑟𝑘 𝑆𝑒𝑡 𝑊𝑒𝑖𝑔ℎ𝑡 𝑓𝑜𝑟 𝑓𝑜𝑢𝑛𝑑𝑎𝑡𝑖𝑜𝑛𝑠
𝑊2 = 𝑀𝑎𝑥𝑖𝑚𝑢𝑚 𝐹𝑜𝑟𝑚𝑤𝑜𝑟𝑘 𝑆𝑒𝑡 𝑊𝑒𝑖𝑔ℎ𝑡 𝑓𝑜𝑟 𝑐𝑜𝑙𝑢𝑚𝑛𝑠
𝑊3 = 𝑀𝑎𝑥𝑖𝑚𝑢𝑚 𝐹𝑜𝑟𝑚𝑤𝑜𝑟𝑘 𝑆𝑒𝑡 𝑊𝑒𝑖𝑔ℎ𝑡 𝑓𝑜𝑟 𝑤𝑎𝑙𝑙𝑠
𝑊4 = 𝑀𝑎𝑥𝑖𝑚𝑢𝑚 𝐹𝑜𝑟𝑚𝑤𝑜𝑟𝑘 𝑆𝑒𝑡 𝑊𝑒𝑖𝑔ℎ𝑡 𝑓𝑜𝑟 𝑏𝑒𝑎𝑚 𝑠𝑖𝑑𝑒
𝑊5 = 𝑀𝑎𝑥𝑖𝑚𝑢𝑚 𝐹𝑜𝑟𝑚𝑤𝑜𝑟𝑘 𝑆𝑒𝑡 𝑊𝑒𝑖𝑔ℎ𝑡 𝑓𝑜𝑟 𝑏𝑒𝑎𝑚 𝑠𝑢𝑝𝑝𝑜𝑟𝑡
𝑊6 = 𝑀𝑎𝑥𝑖𝑚𝑢𝑚 𝐹𝑜𝑟𝑚𝑤𝑜𝑟𝑘 𝑆𝑒𝑡 𝑊𝑒𝑖𝑔ℎ𝑡 𝑓𝑜𝑟 𝑏𝑒𝑎𝑚 𝑟𝑒 − 𝑠ℎ𝑜𝑟𝑒
𝑊7 = 𝑀𝑎𝑥𝑖𝑚𝑢𝑚 𝐹𝑜𝑟𝑚𝑤𝑜𝑟𝑘 𝑆𝑒𝑡 𝑊𝑒𝑖𝑔ℎ𝑡 𝑓𝑜𝑟 𝑠𝑙𝑎𝑏 𝑠𝑢𝑝𝑝𝑜𝑟𝑡
𝑊8 = 𝑀𝑎𝑥𝑖𝑚𝑢𝑚 𝐹𝑜𝑟𝑚𝑤𝑜𝑟𝑘 𝑆𝑒𝑡 𝑊𝑒𝑖𝑔ℎ𝑡 𝑓𝑜𝑟 𝑠𝑙𝑎𝑏 𝑟𝑒 − 𝑠ℎ𝑜𝑟𝑒
𝐶6 = 𝑃𝑙𝑦𝑤𝑜𝑜𝑑 𝐶𝑜𝑠𝑡 = (𝑃𝑙𝑦𝑤𝑜𝑜𝑑 𝑢𝑛𝑖𝑡 𝑐𝑜𝑠𝑡)𝑥(𝑀1 + 𝑀2 + 𝑀3 + 𝑀4 + 𝑀5)
𝑀1 = 𝑀𝑎𝑥𝑖𝑚𝑢𝑚 𝐹𝑜𝑟𝑚𝑤𝑜𝑟𝑘 𝑆𝑒𝑡 − 𝑆𝑙𝑎𝑏
𝑀2 = 𝑀𝑎𝑥𝑖𝑚𝑢𝑚 𝐹𝑜𝑟𝑚𝑤𝑜𝑟𝑘 𝑆𝑒𝑡 − 𝐵𝑒𝑎𝑚 𝑠𝑖𝑑𝑒
𝑀3 = 𝑀𝑎𝑥𝑖𝑚𝑢𝑚 𝐹𝑜𝑟𝑚𝑤𝑜𝑟𝑘 𝑆𝑒𝑡 − 𝐵𝑒𝑎𝑚 𝑏𝑜𝑡𝑡𝑜𝑚
𝑀4 = 𝑀𝑎𝑥𝑖𝑚𝑢𝑚 𝐹𝑜𝑟𝑚𝑤𝑜𝑟𝑘 𝑆𝑒𝑡 − 𝐶𝑜𝑙𝑢𝑚𝑛 𝐽𝑜𝑖𝑛𝑡
𝑀5 = 𝑀𝑎𝑥𝑖𝑚𝑢𝑚 𝐹𝑜𝑟𝑚𝑤𝑜𝑟𝑘 𝑆𝑒𝑡 − 𝑊𝑎𝑙𝑙 𝐽𝑜𝑖𝑛𝑡
“CR” has two inputs: (1) the “Total Formwork Cost” value as numerator, and (2) the “Total
Formwork Area” value as denominator and can be computed using Equation 4.3.
𝐶𝑅 = 𝑇𝑜𝑡𝑎𝑙 𝐹𝑜𝑟𝑚𝑤𝑜𝑟𝑘 𝐶𝑜𝑠𝑡 (𝑈𝑆𝐷$)
𝑇𝑜𝑡𝑎𝑙 𝐹𝑜𝑟𝑚𝑤𝑜𝑟𝑘 𝐴𝑟𝑒𝑎 (𝑚2) (4.3)
Reuse Factor (RF)
In general, formwork for vertical elements like columns and walls have a higher “Reuse Factor”
RF than the Reuse Factor for formwork horizontal elements since vertical formwork are attached
to concrete for very short time (commonly between one and two days). Formwork for horizontal
elements like slabs and beams normally stays in place for longer times (commonly between 4 and
7 days). Then “Reuse Factor” must be computed separately for vertical elements and for horizontal
elements. Formwork “Reuse Factor” (RF) for vertical and horizontal elements can be computed

110
using Revit since all the data necessary for computation is already in the BIM model. In this case
the Dynamo script developed is only computing the RF for horizontal elements since is these
elements have lower rotation. RF in general for vertical or horizontal elements can be estimated
using Equation 4.4.
𝑅𝐹 =𝑇𝑜𝑡𝑎𝑙 𝑁𝑢𝑚𝑏𝑒𝑟 𝑜𝑓 𝑊𝑜𝑟𝑘 𝑍𝑜𝑛𝑒𝑠
𝑇𝑜𝑡𝑎𝑙 𝑁𝑢𝑚𝑏𝑒𝑟 𝑜𝑓 𝐻𝑜𝑟𝑖𝑧𝑜𝑛𝑡𝑎𝑙 𝐹𝑜𝑟𝑚𝑤𝑜𝑟𝑘 𝑆𝑒𝑡𝑠≥ 1 (4.4)
If the RF value is close to “1” it implies that formwork is not adequately reused and indicates either
that better planning of formwork use is required, or the features of the building do not facilitate
formwork reuse.
Formwork Efficiency (FE)
Since the “Reuse Factor” RF does not consider the vertical elements in the assessment of formwork
management, another approach to estimate the formwork performance is “Formwork Efficiency”
(FE). FE can be computed using Equation 4.5, that has as input values the “Formwork Maximum
Set Size” expressed in square meters and the “Total Formwork Area” also expressed in square
meters.
𝐹𝐸 =𝑇𝑜𝑡𝑎𝑙 𝑓𝑜𝑟𝑚𝑤𝑜𝑟𝑘 𝑎𝑟𝑒𝑎
𝑇𝑜𝑡𝑎𝑙 𝑎𝑟𝑒𝑎 𝑜𝑓 𝑡ℎ𝑒 𝑓𝑜𝑟𝑚𝑤𝑜𝑟𝑘 𝑚𝑎𝑥𝑖𝑚𝑢𝑚 𝑠𝑒𝑡≥ 1 (4.5)
The greater the value of this KPI, the better the formwork management practice. If the FE value is
close to “1” it implies that formwork is not adequately reused and indicates either that better
planning of formwork use is required, or the features of the building do not facilitate formwork
reuse. “Formwork Efficiency” (FE) will be always greater than the “Rotation Factor” (RF) of
formwork for horizontal elements, since FE considers the formwork efficiency contribution of
vertical elements, in comparison that RF that in this case is only considering horizontal elements.
A Dynamo Script named “JRR_04_KPI_Summary.dyn” was developed for computing these KPIs
automatically. Figure 4.14 shows a blow-up detail of the workflow for computing these KPIs and
then show the results using a “Task Dialog” window. Most of the information for estimating the
“Formwork Total Cost” is already in the BIM model, but there are three values that need to be

111
assumed or given as an input: (1) the plywood cost as material for a square meter, (2) the labor
rate cost per hour, and (3) the rate cost for a round trip truck of 28 tons capacity.
Figure 4.14. Dynamo script for computing KPIs report
Figure 4.15 shows the results of running the script “JRR_04_KPI_Summary.dyn” for three-story
building and 12 work zones, the “Cost Rate” (CR) in this case may be higher than the CR of other
buildings with similar features but with a greater total built area, since the cost contribution of
plywood materials, consumables, and transportation will increase the cost ratio. As expected, the
“Reuse Factor” (RF) is equal to one since the horizontal formwork is never reused. Also, the
“Formwork Efficiency” (FE) close to 1 for the same reason but always at least greater than the
“Rotation Factor” because of the influence of the rotation factor of vertical elements.

112
Figure 4.15. Results of running Dynamo script for computing KPIs.
4.5.Formwork demand profile
The “Formwork maximum set size” value that was described in Section 4.3 is only the peak point
of the “formwork demand profile” of the entire project. The formwork demand can be represented
by a profile that starts from zero and continue growing until reaching the “Formwork maximum
set size”, oscillates around this value until the end of concrete placing activities, and then tapers to
zero. To prepare this “formwork demand profile” a workflow was designed for extracting
information from the BIM model into an Excel file, using the extracted information to a MS Project
schedule for generating the cash flow. Finally, using the values from this cash flow, a 2-D bar
graph was generated to represent the formwork demand profile in Excel. Figure 4.16 shows the
workflow process for the information exchange between the three software packages used to
generate the “Formwork demand profile”.
Export Formwork Renting Cost for each
Work zoneCopy and Paste Cost Column to Schedule
Export Task Usage Cash Flow
Figure 4.16. Workflow for interoperability of information between Revit - Excel and Project for
generating formwork profile.

113
A Dynamo script was developed for exporting the “formwork rental cost” and the “reshoring rental
cost” data form the BIM model into an Excel file. Figure 4.17 shows a blow-up view of the
workflow for extracting the “formwork rental cost” for the “Structural Foundations” Category
grouped by the parameter “MOD_S_Code” which represents the work zone code.
Figure 4.17. Dynamo script for exporting formwork rental cost grouped by work zone code.
This workflow process is repeated for all the Categories (Structural Columns, Structural Framing,
Walls, Floors, and Stairs) that represent RC elements. Then all the “COST_Formwork” values and
the “COST_Shoring” values are collected into a single list grouped by the parameter
“MOD_S_Code” and exported into an Excel file. Figure 4.18 shows a blow-up view of the first
set of rows of the result of running the Dynamo Script for exporting the “COST_Formwork” values
and the “COST_Shoring” values grouped by work zone code.
Figure 4.18. Results of running Dynamo script for exporting formwork and reshoring rental cost
grouped by work zone into an Excel file.
Once all the values for “COST_Formwork” and “COST_Shoring” are consolidated and grouped
by the work zone code, the information can be resorted following the “Activity Sequence structure”
of a previously created MS Project schedule during the Phase 1 of the BIM based tool described
in Section 3.7. This “Cost ($)” column can be copied from the Excel file and pasted into a “Cost

114
column” in the MS Project Schedule to generate a cash flow distribution. Figure 4.19 shows the
first set of rows of the Excel table that organize the “total rental cost” following the “Activity
sequence structure” used in the MS Project Schedule. Figure 4.20 shows the schedule with the cost
values column filled in with the values obtained from the Excel table and Figure 4.21 shows the
“Task Usage” view from MS Project with the cost distribution on a daily basis.
Figure 4.19. Excel table reorganizing the cost column based on the "activity sequence structure"
of the schedule template.
Figure 4.20. MS Project schedule with the cost column filled in with the excel values.
Figure 4.21. Task Usage view for the cash flow of the formwork renting cost.
The cost distribution can be used to plot a 2-D bar chart in excel to represent the “Formwork
demand profile” represented in terms of cost. Figure 4.22 shows the final result of generating the
“Formwork demand profile” in terms of cost.
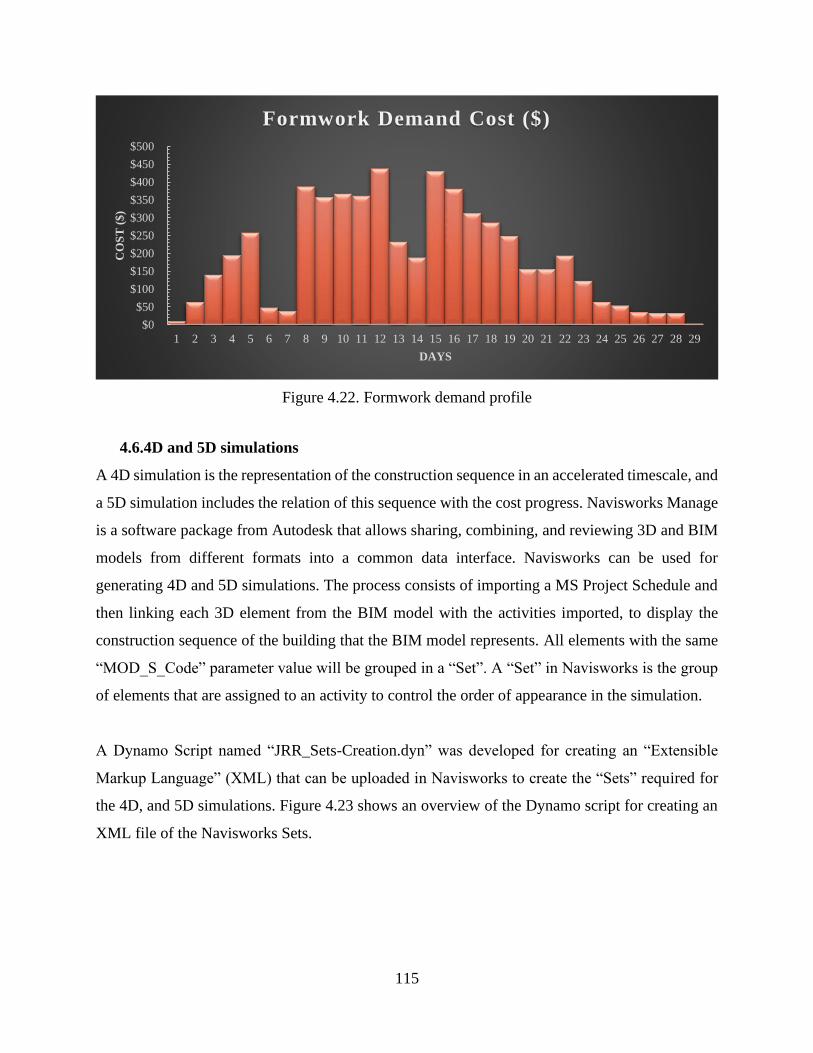
115
Figure 4.22. Formwork demand profile
4.6.4D and 5D simulations
A 4D simulation is the representation of the construction sequence in an accelerated timescale, and
a 5D simulation includes the relation of this sequence with the cost progress. Navisworks Manage
is a software package from Autodesk that allows sharing, combining, and reviewing 3D and BIM
models from different formats into a common data interface. Navisworks can be used for
generating 4D and 5D simulations. The process consists of importing a MS Project Schedule and
then linking each 3D element from the BIM model with the activities imported, to display the
construction sequence of the building that the BIM model represents. All elements with the same
“MOD_S_Code” parameter value will be grouped in a “Set”. A “Set” in Navisworks is the group
of elements that are assigned to an activity to control the order of appearance in the simulation.
A Dynamo Script named “JRR_Sets-Creation.dyn” was developed for creating an “Extensible
Markup Language” (XML) that can be uploaded in Navisworks to create the “Sets” required for
the 4D, and 5D simulations. Figure 4.23 shows an overview of the Dynamo script for creating an
XML file of the Navisworks Sets.
$0
$50
$100
$150
$200
$250
$300
$350
$400
$450
$500
1 2 3 4 5 6 7 8 9 10 11 12 13 14 15 16 17 18 19 20 21 22 23 24 25 26 27 28 29
CO
ST
($
)
DAYS
Formwork Demand Cost ($)

116
Figure 4.23. Dynamo Script for generating XML file for generating Sets in Navisworks.
Once the XML file is imported to Navisworks, 4D and 5D simulations can be generated and
exported to a video format. Figure 4.24 shows a scene of the 4D-5D simulation. A caption in the
left upper corner of the video simulation displays: (1) date, day, and week of the project, (2) cost
(in dollars) of the formwork (3) total cumulative physical progress (expressed as a percentage),
and (4) activities in progress.
Figure 4.24. 4D and 5D simulation process

117
4.7. Generation of layout color mapping views and plans.
Good formwork management ensures that the formwork is reused according to a prescribed plan.
Hence, a tool that helps to tracking the expected stripping date of a RC element, will improve the
formwork installation efficiency. Towards the development of such a tool, a series of 3D views
and 2D plan views were developed using the “Visibility Filters” tool from Revit. Figure 4.25 shows
a sample of the BIM model 3D View with a color representation of the different work zones, Figure
4.26 shows a 3D View with a color differentiation by element type, and Figure 4.27 shows in red
all the RC elements that should be already stripped (strip date < “Today date”) and in green all the
elements that will be stripped in the future (strip date > “Today date”). These 3D color maps could
be used by a supervisor to identify elements in the field with the forms attached but should have
been already stripped of formwork, and to take appropriate actions.
Figure 4.25. 3D view filtered
by work zone.
Figure 4.26. 3D view filtered
by element type
Figure 4.27. 3D filtered view
for tracking stripping dates
4.8.Description of case studies
Two case studies were selected to test the BIM-based formwork management tool developed for
this thesis: (1) a twenty-story building with a total constructed area of 46,650 m2, and (2) a five-
story building with the same built area. The twenty-story building represents a typical office
building, and the five-story building represents a typical mall. The main criterion for modeling
both buildings is to use a “modular unit” that represent a portion of the building and then use this
unit to ‘build’ the model of the building by ‘joining’ multiple instances of the unit. As shown in
Figure 4.28, both buildings were modeled as considering the “work zone” as the “modular unit”.
In case of the 20-story building, 4 instances of the “modular unit” are used to create each story, for

118
a total of 80 work zones for the entire building. And in case of the 5-story building, 16 instances
of the “modular unit” are used per story, for a total of 80 work zones for the entire building.
Figure 4.28. Layout plan view for two sample buildings
Since both buildings have the same area, the total formwork contact area will be very similar, and
the expected values for the KPIs are likely to be similar. Table 4.1 summarizes the main features
of each building sample. Figure 4.29 shows the steps in phase 1 for developing the BIM-based
formwork models for the twenty-story building and the five-story building.
Table 4.1. Main features of two sample buildings
Feature Twenty-Story
Building Five-Story Building
Number of stories 20 5
Built area 46,650 m2 46,650 m2
Work zones/level 4 16
Total № of work zones 80 80
One story cycle time 4 days 16 days
Horizontal strip time 7 days 7 days
№ of sets 12 12
Head room height 4.5 m 4.5 m
Total height 90 m 22.5 m
“Work Zone Unit”
“Layout plan of 5-story building”
“Layout plan of 20 -story building”

119
Figure 4.29. BIM Process Phase 1 for 20-story building and 5-story building
4.9.Comparison of results of case studies
Once the Phase 1 of the BIM-based tool is completed, all the KPIs can be computed automatically
using the Dynamo script discussed in Section 4.3.4. Figure 4.30 shows the results of running the
Dynamo workflow. As expected, the KPIs are very similar or even the same for both buildings
(formwork for both buildings have the same KPI value).

120
Figure 4.30. Results of running Dynamo script for calculating KPIs
The “Cost Ratio” (CR) or “Formwork Overall unit cost” is slightly higher for the 20-story building
due to two reasons: (1) the 20-story building needs a re-shoring system for the horizontal elements
to redistribute the construction loads between multiple stories, and (2) the incidence of foundations
(which have a lower cost) is lower in the taller building since the footprint of the building is shorter.
The “Rotation Factor” (RF) is the same for both buildings as expected since both building have
the same number of formwork horizontal sets and the same total number of work zones. The
interpretation of the RF is: “each formwork set has 6.15 reuses the building”. The “Formwork
Efficiency” (FE) is slightly higher for the 20-story building because the 20-story building has
higher quantities of formwork due to the larger façade. As expected, the FE value is higher than
the RF due to higher rotation of vertical formwork elements. Since the maximum formwork set
size is almost the same for both buildings, but the façade is larger for the tall building the FE will
be slightly higher for the 20-story building. The interpretation of the 20-story building FE is: “for
every square meter of a formwork set rented, 8.61 square meters of contact area are formed”.
4.10. Summary
Chapter 4 focuses on phase two of the BIM-based formwork management tool. The objective of
this phase is to use the BIM model generated in phase one for: controlling, planning, benchmarking,
procuring, preconstruction and tracking formwork. Tools (Dynamo scripts, spreadsheets, and
project schedules) used for implementing the workflow of the phase 2 are summarized in Figure

121
4.31. The use of the BIM model (created in Phase 1) was demonstrated in the context of
developing schedules, performing costs analysis, calculating KPIs, tracking project progress via
4D simulation. Two examples (one of twenty stories and another of five stories) were used to
demonstrate the use of the two-phase BIM-based formwork management tool. The two buildings
have the same build area, very similar layouts, and quantities of formwork. As expected, due to
the similarities of the buildings, the KPIs of both buildings are very similar. The differences in
cost ratio can be explained by the reshoring cost associated with the cycle time of the 20-story
building (only 4 work zones vs 16 work zones of 5-story building. The differences in formwork
efficiency is due to the increase in formwork area (because of the increase in the façade area) in
case of the 20-story building.

122
Export Formwork Renting Cost for each
Work zoneCopy and Paste Cost Column to Schedule
Export Task Usage Cash Flow
FORMWORK COST ANALYSIS & KPIs
(SECTION 4.3)
FORMWORK DEMAND CURVE
(SECTION 4.4)
FORMWORK SCHEDULES
(SECTION 4.2)
FORMWORK LAYOUTS COLOR MAPPING
(SECTION 4.6)
4D & 5D SIMULATION
(SECTION 4.5)
Figure 4.31. BIM-based formwork management Phase 2: Tools’ workflow

123
CONCLUSIONS
This thesis focuses on the design of a BIM-based formwork management tool that is implemented
in two phases: Phase 1 which involves the creation of a BIM model enriched with geometric and
non-geometric data related to formwork, and Phase 2 - where the BIM model is used for
implementing formwork management tasks. The BIM-based tool was designed for filling the gaps
identified through literature review and review of the state of practice. To inform the design
process, data was also collected through a survey to identify the preferences of general contractors,
BIM specialists and formwork providers on issues related to: (1) formwork rental options, (2)
Level of Development (LOD) for formwork modeling, and (3) level of automation for formwork
management. Also, the designed BIM-based formwork management tool was tested on two sample
buildings (a 20-story building and a 5-story building).
5.1. Summary of the Research Process
Prior research related with formwork focused on issues related to selecting formwork, formwork
design, and preparation of formwork layouts, and few studies were oriented towards developing
strategies for formwork management. BIM tools are becoming a common practice in the
construction industry. However, modeling of temporary structures (including formwork) as part
of the BIM model is not a common practice yet, making it difficult to implement strategies that
involve managing formwork components as independent pieces. Based on these findings of a
survey that was deployed in January of 2021 among AEC practitioners in the USA, and Latin
America (most of respondents hailed from Peru) to gain better understanding of the industry
preferences, a BIM-based tool for formwork management was designed and evaluated to automate
BIM formwork modeling and used for performing formwork management tasks (quantity takeoffs,
cost analyses, 4D-5D simulations, and assessment of formwork KPIs). The results of the survey
showed that contractors prefer not to rent formwork by pieces, but instead to rent “formwork
solution systems” based on a pricing model for a set of components for forming or shoring a
specific area during a specific duration (USD$/m2-month). The survey also indicated that although
formwork providers have the capability to offer BIM modeling services at LOD 400 or 500,
typically, contractors do not use these services and prefer to work with self-prepared LOD 100 or

124
LOD 200 models. Based on the findings of the review of the state of art and state of practice, a
BIM-based tool for formwork management was designed in two phases.
1. Phase 1 focuses on the process for enriching the BIM model of a building with data related
to formwork cost, productivity, formwork weight, and the formwork assembly and removal
timing. The process involves a set of tools using Dynamo scripts to: (1) audit the BIM
model input, (2) create material lists in Revit that will represent each formwork solution,
(3) create and assign parameter fields to each category type in the model, (4) populate the
parameter fields with data, (5) perform formwork modeling in a LOD 200, (6) develop
work zoning patterns, (7) import dates and times related to forming and shoring for each
structural element, and (8) import parameter values related to cost rates and ratios of
productivity, and formwork weight.
2. Phase 2 involves the use of the enriched BIM model, created in Phase 1, to perform
common formwork management tasks. The process includes different sets of Dynamo
scripts and BIM processes for: (1) estimating quantities and preparing schedules, (2)
performing a cost analysis and estimation of the “formwork overall average unit cost” or
“cost rate” of the project, (3) computing formwork KPIs (rotation factor and formwork
efficiency), (4) preparing a formwork demand profile expressed in terms of cost, (5)
generating a 4D & 5D simulation for forming and shoring, and (6) preparing color mapped
layouts for tracking formwork stripping dates.
Two case studies were used to test the two-phase BIM-base tool and to compute the KPIs for
formwork management. The two BIM models are based on a modular unit which also is the work
zone for both buildings. One of the buildings is a 20-story building and the other a 5-story building,
both with the same constructed area and the same number of work zones. As expected, the KPIs
(cost rate, rotation factor and formwork efficiency) values are very similar since the only variation
is the construction cycle time for each story.
5.2. Research Conclusions
Three main research questions were posed in Chapter 1 as follows: (1) What are the AEC
practitioners’ preferences regarding the Level of Development (LOD) used for BIM formwork
modeling? (2) What are the AEC practitioners’ preferences regarding formwork rental options in

125
building projects? (3) How can formwork management tasks be more automated? Based on the
literature reviewed, the review of tools provided by formwork providers, the survey conducted
among practitioners, a BIM-based tool for formwork management was developed for this thesis.
Based on these research activities, the following conclusions can be drawn from this study. The
most appropriate LOD for formwork management is LOD 200 based on the current preferences of
practitioners. The reasons for preferring a LOD 200 for modeling formwork are as follows: (1)
contractors do not want to wait until the formwork provider is selected for implementing a BIM
model to assist in decision making and planning, (2) not all the formwork companies provide BIM
modeling services, and (3) formwork BIM modeling could be time consuming and involve an
additional cost that contractors are not willing to undertake. The BIM-based formwork
management tool proposed in this thesis is useful in cases when BIM modeling of formwork
systems with a LOD higher than 300 is not feasible, when formwork provider has not implemented
its products in a BIM- objects library, when the formwork provider has not been selected for the
project yet, or when budget or schedule cannot provide personnel resources or time for developing
a higher LOD BIM model.
Analysis of the survey responses indicates that practitioners prefer renting formwork based on a
rental cost by solution system for a specific area during a specific time duration. This method is
preferred since: (1) each formwork provider may have different components in their systems, and
the only way to evaluate different components on a uniform basis is considering the area that will
be formed/covered by the solution system, and (2) it is easier to control the cost based on a rate by
area rather a complex list of formwork pieces. Even when practitioners tend to use a cost rate by
area, practitioners still prefer to pay and manage the invoices in terms of a list of pieces. This
pricing mode is preferred because (1) some formwork pieces may be released and send back to
provider earlier that the return of complete formwork system, (2) some pieces will be part of more
than one formwork system, and (3) some formwork pieces might be damaged during the
construction process and the replacement of a new piece will be associated to only the extra piece
price, and not the entire formwork system.
Automated formwork management is beneficial for many formwork related tasks such: (1)
formwork modeling, (2) BIM auditing of models, (3) estimating quantities to develop detailed

126
breakdown list of formwork solution systems, (4) performing cost analysis to estimate the overall
average unit cost for formwork, (5) computing KPIs like formwork rotation and formwork
efficiency, (6) generating a formwork demand profile, (7) preparing 4D & 5D simulations for
formwork operations, and (8) preparing color coded layouts for formwork management.
5.3. Limitations of the Research
This research study used Dynamo for automating processes (such as formwork modeling, BIM
parameters management, exchange of information with Excel tables, 4D-5D simulation and
computation of formwork KPIs) but the next step for improving this BIM-based tool is move to
an Add-In using C# or Python with Revit API, to improve the interface of the application and
expedite processing of algorithms. The limitations of this study can be listed in three categories:
1. Modeling limitations:
• Since the formwork modeling is based on a LOD 200, the following formwork
management tasks cannot be implemented in this BIM-based tool: (1) preparing formwork
layouts plans with details of the pieces (hardware, studs, wales, props, stringers, joists,
etc.), (2) preparing packing lists with all the pieces required for delivery to the jobsite, (3)
performing inventory management based on the pieces that are required in each work zone,
and (4) establishing formwork reuse based on reducing the number of formwork pieces
required on the project.
• A limited number of formwork solutions were addressed for the automation of formwork
modeling. For example, some foundations might be poured against the ground so
formwork will not be required, but the default version of the BIM-based tool developed
in this research study assumes that formwork will be required for foundations. Similarly,
some walls will only have one side of formwork because the other side will be ground
supported and will not need formwork. Hence, this tool needs modification before being
used for formwork management of retention walls or ground-supported foundations.
2. Even though the current version of BIM-based tool is not expected to be fully automated, the
next set of improvements can be considered in order to address some limitations of the tool:
• The work zoning process involves two steps: (1) the definition of the “construction joints”
in the layout of the main floor plan of the building, and (2) the projection of the
“construction joints” to the rest of floor plans in the building for assigning the work zone

127
parameter values for each element in the model. The second step is fully automated, but
the automation of the first step was not addressed in the thesis. A future improvement of
the BIM-based tool might include the automation of the work zone leveling based on the
number of work zones as the input target.
• The timing for forming and shoring are inputs that are taken from a MS project that is
developed by the user, but ideally the BIM process should be able to consider the timing
of these activities without the assistance of the user. Based on parameters like concrete
maturity-strength curve, and the design loads of the horizontal element; the BIM process
for defining the “Time” parameters could be populated without user’s assistance. This
feature was not developed as part of the thesis but could be a future improvement in this
tool.
3. User experience limitations:
• In general, Dynamo is slower in processing geometric data than using an Add-In to Revit.
For scripts presented in this thesis that involve geometric computation, like modeling
formwork, or splitting elements, the “Central Processing Unit” (CPU) usage could be over
the 65%, and memory usage could exceed 60%. So, for complicated designs and for large
volumes of geometric data (buildings with large areas) the computation process could take
more time than when using a similar tool developed as an Add-in to Revit.
• Unlike applications that use Revit API programing, Dynamo scripts cannot readily
implement a “Graphical User Interface” (GUI). Dynamo uses the Dynamo Player, hence,
scripts are very limited for improving the GUI, and for presentation of outputs.
• Some steps of the formwork management workflow include the use of multiple software
packages such as Excel, MS Project, Revit and Navisworks. The exchange of data across
these software packages is not fully automated since assistance in continuing the workflow
must be provided by the user. Users not familiar with all the software packages
implemented in this study may find this to be a challenge in implementing the BIM-based
tool.
5.4.Contribution to the Body of Knowledge
There is a dearth of published work related to formwork management in general, and specially to
the use of BIM and automation for formwork management. This thesis identified practitioners’
128
preferences about: (1) LOD for formwork modeling, (2) formwork rental option, and (3) level of
automation for tasks related to formwork management.
The use of KPIs for formwork management is not common in the construction industry, and there
was no published work related to the use of KPIs in formwork management. The thesis has
presented three KPIs that are easy to compute using the BIM-based formwork management tools
developed in this study. The significance and interpretation of these values could be very powerful
for decision making and benchmarking. The “Cost Rate” (CR) is a common value used in projects,
but the “Rotation factor” (RF) and “Formwork efficiency” (FE) are new indexes that were not used
previously. Once these KPIs are assessed regularly on formwork operations in construction
projects, the formwork management performance may be gauged in a more systematic manner.
5.5.Contribution to the Body of Practice
The thesis focuses on the design, development, and testing of a BIM-based tool for formwork
management, and the results of this study have a direct impact on the industry. Practitioners can
use this BIM-based tool as a starting point for analyzing the workflows and implement formwork
management tools using a LOD 200 BIM model of the formwork, which reduces the time and cost
associated with preparing a BIM model for formwork systems that includes all formwork
components. A set of tools using Dynamo scripts were developed for automating the repetitive and
time-consuming tasks of formwork management. The automation of BIM processes can lead to (1)
lower probability of human error since manual entry of data is not required, and (2) time savings
due to automation of repetitive tasks, which in turn translates into cost saving in projects, enabling
project engineers to focus their planning strategies for better performance in construction.
5.6.Recommendations for Future Research
One of the uses of Dynamo that is gaining momentum is “generative design”, which is an iterative
design process to generate a certain number of alternatives that meet specified constraints
established by the designer. Using the concept of “generative design” in formwork management,
multiple alternatives can be generated in an iterative way for selecting the optimal work zoning
without user assistance, and then using this work zoning for computing the formwork KPIs and
deciding the best option based on formwork efficiency.

129
Defining the optimum work zoning layout in this thesis was based on a single objective
optimization process, where the objective function minimized the variation of labor hours across
all the work zones, in order to reduce idle time of labor and improve reliability of workflow plan
(not overstressing resources). However, labor cost optimization is not the only objective in work
zoning. Other objectives such as maximization of the reuse factor (RF) and maximization of
formwork efficiency (FE) can be included in the optimization process. According to Johnston
(2014), labor represents 50% of the formwork cost and the other 50% is the rental cost and
materials. Hence a multi-objective optimization model can be implemented for minimizing labor
hour variability and maximizing formwork KPIs.
The current BIM-enhanced formwork management model does not automatically compute the
time when each formwork system must remain in place, since the formwork removal time is
currently defined by the user and then imported to the BIM-enhanced formwork model. Future
research could focus on defining parameters (like design loads, construction loads, concrete
compressive strength, concrete placement date) and developing algorithms for estimating
formwork removal time based on these parameters. By combining the parameters and new
algorithms with generative design, optimal formwork stripping sequences and re-shoring
sequences of horizontal elements, can be developed.
Finally, formwork management tasks automation can be combined with use of new technologies
like “Radio Frequency Identification” (RFID) for detecting formwork pieces and alerting field
supervisors if these pieces are outside the planned work zone during the time when these pieces
were scheduled to be in place. Such strategies allow better control of movement of formwork
pieces and prevent expenses due to theft or loss of formwork pieces. Also, the use of “remote
concrete monitoring” with embedded sensors in concrete elements, could be implemented to
automatically populate information related to concrete curing into a BIM model and provide real
time information about stripping and reuse of formwork.

130
REFERENCES
ACI Committee 347. (2014). 347R-14 Guide to Formwork for Concrete. American Concrete
Institute.
Aslam, M., Baffoe-Twum, E., & Saleem, F. (2019). Design Changes in Construction Projects –
Causes and Impact on the Cost. Civil Engineering Journal. Vol. 5, No. 7, July, 2019, 1647-
1655.
Autodesk Help. (2021, January 22). Parameters. Retrieved from Knowledge Network:
https://knowledge.autodesk.com/support/revit-products/learn-
explore/caas/CloudHelp/cloudhelp/2019/ENU/Revit-Model/files/GUID-D927E0DC-
F720-4F7D-AACD-8B06787793CB-htm.html
Autodesk Help. (2021, March 9). Revit Products. Support for learning. Retrieved from About
Schedules: https://knowledge.autodesk.com/support/revit-products/learn-
explore/caas/CloudHelp/cloudhelp/2019/ENU/Revit-DocumentPresent/files/GUID-
73090B70-8A13-4E12-909C-F25D724D5BA7-
htm.html#:~:text=A%20schedule%20is%20a%20tabular,on%20the%20schedule's%20gr
ouping%2
BIMForum. (2015). Level of DEvelopment Specification Version 2015. BIMForum.
Biruk, S., & Jaskowsk, P. (2016). Optimization of Vertical Formwork Layout Plans Using Mixed
Integer Linear Programming. International Journal of Civil Engineering , 125–133.
Chi, S., Hampson, K., & Biggs, H. (2012). Using BIM for smarter and safer scaffolding and
formwork construction: a preliminary methodology. Modelling and building health and
safety.
DOKA. (2020). About Doka. Retrieved from Doka Official Website:
https://www.doka.com/us/about/About_Doka
Dynamo BIM. (2021, March 25). Forum Statistic. Retrieved from Dynamo BIM Forum:
https://forum.dynamobim.com/t/forum-statistics/21373
Elazouni, A., Ali, A., & Abdel-Razek, R. (2005). Estimating the acceptability of new formwork
systems using neural networks. J Const Eng Manag 131(1), (pp. 33–41).
Elbeltagi, E., Hosny , O., Elhakeem, A., Abd-Elrazek, M., & Abdullah , A. (2011). Selection of
slab formwork system using fuzzy logic. Constr Manag Econ 29:, (pp. 659–670).

131
Elbeltagi, E., Hosny, O., Elhakeem, A., Abdelrazek, M., & El-Abbasy, M. (2012). Fuzzy logic
model for selection of vertical formwork systems. J. Constr. Eng. Manag. 138, (pp. 832–
840).
Gambatese, J., & Jin, Z. (2019). BIM for temporary structures: Development of a Revit API plug-
In for concrete formwork. CSCE Annual Conference. Laval: ResearchGate.
Goldratt, E. (2014). The Goal. 4th Edition. North River Press.
Hanna, A., & Sanvido, V. (1991). Interactive horizontal formwork selection system. Concr Int
13(8), (pp. 50–56).
Hanna, A., & Senouci, A. (1995). NEUROSLAB-neural network system for horizonta formwork
selection. Can. J. Civ. Eng. 22 (4), (pp. 785–792).
Hanna, A., Willenbrock, J., & Sanvido, V. (1992). Knowledge acquisition and development for
formwork selection system. Journal Construction, Engineering and Management, 179-198.
Huang, R.-y., Chen, J.-J., & Sun, K.-S. (2004). Planning gang formwork operations for building
construction using simulations. Automation in Construction, 765– 779.
Hyun, C., Jin, C., Shen, Z., & Kim, H. (2018). Automated optimization of formwork design
through spatial analysis in building information modeling. Automation in Construction,
193-205.
Jarkas, A. (2010). Buildability factors affecting formwork labor productivity of building floors.
Canadian Journal of Civil Engieering, 1383-1394.
Jimenez, A. (2020). Encofrados y Andamios para Obras Civiles y Edificaciones. Lima, Peru:
Costos.
Johnston, D. W. (2014). Formwork for Concrete. 8th Edition. Chelsea, Michigan: American
Concrete Institute.
Jung, W., & Lee, G. (2015). The Status of BIM Adoption on Six Continents. World Academy of
Science, Engineering and Technology. International Journal of Civil and Environmental
Engineering. Vol:9, No:5, 512-516.
Kamarthi, S., Sanvido, V., & Kumara, S. (1992). Neuroform—neural network system for vertical
formwork selection. J. Comput. Civ. Eng. 6 (2), (pp. 178–199).
Kannan.Ma, R., & Santhi.Ma, H. (2013). Constructability Assessment of Climbing Formwork
Systems Using Building Information Modeling. Procedia Engineering, 1129 – 1138.

132
Kersting, M., & Girmscheid, G. (2011). Process-oriented analysis of the interactions among
formwork related teams with a modified Cyclone. Proceedings of the 6th international
structural engineering and construction conference (ISEC-6) model modern methods and
advances in structural engineering and construction,, (pp. 167–173). Zu¨rich, Switzerland.
Kim, H., & Ahn, H. (2011). Temporary facility planning of a construction project using BIM.
Computing in Civil Engineering (2011).
Kim, K., Cho, Y., & Kim, K. (2018). BIM-Driven Automated Decision Support System for Safety
Planning of Temporary Structures. Journal of Construction Engineering and Management,
144.
Kim, T., Lim, H., Lee, U.-K., Cha, M., Cho, H., & Kang, K.-I. (2012). Advanced formwork method
integrated with a layout planning model for tall building construction. Canadian Journal
of Civil Engineering, Vol. 39, Issue 11.
Kim, Y., & Cho, Y. (2015). BIM-based planning of temporary structures for construction safety.
Computing in Civil Engineering 2015.
Ko, C.-H., Wang, W.-C., & Kuo, J.-D. (2011). Improving Formwork Engineering Using the
Toyota Way. Journal of Engineering, Project, and Production Management, 13-27.
Krajnak,, M. (2013). An analytical approach to optimization of the costs for construction formwork.
International Multidisciplinary Scientific GeoConference: SGEM: Surveying Geology &
Mining Ecology Management, vol. 2, (pp. 35-40). Albena, Bulgaria.
Krawczynska-Piechna, A. (2016). An Analysis of the decesive criteria in formwork selection
problem. Archives of Civil Engineering , 185-196.
Lee, C., Lee, G., & Ham, S. (2009). The development of automatic module for formwork layout
using the BIM. Proceedings of the international conference on construction engineering
and management/project management (pp. 1266–1271). Jeju, Korea: ICCEM/ICCPM .
Lee, J., Parkb, Y.-J., & Choib, C.-H. (2017). BIM-assisted labor productivity measurement method
for structural formwork. Automation in Construction, 121-132.
Mansuri, D., Chakraborty, D., Elzarka, H., & Deshpande, A. (2017). Building Information
Modeling enabled Cascading Formwork Management Tool. Automation in Construction,
259-272.
McGraw Hill Construction. (2014). SmartMarket Report. Bedford, MA: McGraw Hill.

133
Meadati, P., Irizarry, J., & Aknoukh, A. (2011). BIM and concrete formwork repository.
Proceedings 47th ASC annual international conference, associated schools of construction.
Omaha, US.
Murguía, D. (2018). Primer estudio de adopcion BIM en Proyectos de Edificacion en Lima y
Callao 2017. Lima, Peru: Pontificia Universidad Catolica del Peru.
NFPA. (2011). High-Rise Building fires. Quincy, MA: National Fire Protection Association.
PERI. (2020). PERI Company Profile. Retrieved from PERI Official Website:
https://www.peri.com/en/company/profile.html
Peters, C. (2020). Las 50 principales. Construccion Latinoamericana, 32-36.
Peurifoy, R., & Oberleder, G. (2011). Formwork for Concrete Structures . New York: McGraw-
Hill Companies, Inc.
Proverbs, D., Holt, G., & Olomolaiye, P. (1999). Factors in formwork selection: a comparative
investigation. Build Res Inf 27(2), (pp. 109–119).
Razek, A. (1999). Formwork selection systems in building construction. J Eng Appl Sci 46(4), (pp.
629–644).
Romanovskyia, R., Mejia, L., & Azar, E. (2019). BIM-based Decision Support System for
Concrete Formwork Design. International Symposium on Automation and Robotics in
Construction, (pp. 1129-1135).
Shin, Y. (2011). Formwork system selection model for tall building construction using the
Adaboost algorithm. J Korea Inst Build Constr 11(5):, (pp. 523–529). Korea.
Shin, Y., Kim, D., Yang, S., Cho, H., & Kang, K. (2008). Decision support model using the
AdaBoost algorithm to select formwork systems in high-rise building construction.
Proceedings of the 25th international symposium on automation and robotics in
construction (pp. 644–649). Vilnius, Lithuania: Gediminas Technical University
Publishing House ‘‘Technika’’.
Shin, Y., Kim, T., Cho, H., & Kang, K. (2012). A formwork method selection model based on
boosted decision trees in tall building construction. Automation Construction Volume23,
(pp. 47–54).
Singh, M., Sawhney, A., & Sharma, V. (2017). Utilising Building Component Data from BIM.
Construction Economics and Building, 20-36.

134
Smith, G., & Hanna, A. (1993). Factors influencing formwork productivity. Can. J. Civ. Eng. 20
(1), (pp. 144–153).
Sohoni, P., Mittal, B., Matsagar, V., & Jha, K. (2020). Speedy Construction of Reinforced Cement
Concrete Work in High-Rise Buildings by Optimizing Shoring and Reshoring Levels
Using Genetic Algorithm. American Society of Civil Engineers.
Tah, ,. J., & Price, A. (1991). Interactive computer-aided formwork design. Computer P&
Structures, Volume 41, Issue 6 (pp. 1157–1167). Elsevier.
Tam, C., Tong, T., Lau, T., & Chan, K. (2005). Selection of vertical formwork system by
probabilistic neural networks models,. Constr. Manag. Econ. 23 (3), (pp. 245–254).
Wood , A., & Parker, D. J. (2013). The Tall Buildings Reference Book. New York: CRC Press
LLC.
Zhang, S., Lee, J.-K., Venugopal, M., Teizer, J., & Eastman, C. (2011). Integrating BIM and safety:
An automated rule-based checking system for safety planning and simulation. Proceedings
of CIB W099, 99, (pp. 24-26).
Zhang, S., Sulankivi, K., Kiviniemi, M., Romo, I., Eastman, C., & Teizer, J. (2015). BIM-based
fall hazard identification and prevention in construction safety planning. Safety science, 72,
(pp. 31-45).

135
APPENDIX A. INSTITUTIONAL REVIEW BOARD EXEMPTION

136

137
APPENDIX B. SURVEY QUESTIONNAIRE

138

139

140

141

142

143

144

145