9693 AICE Marine Science Paper 2 Specimen Answers.pdf
33
Version 1 Specimen Paper Answers Paper 2 Cambridge International AS & A Level Marine Science 9693 For examination from 2022
-
Upload
khangminh22 -
Category
Documents
-
view
1 -
download
0
Transcript of 9693 AICE Marine Science Paper 2 Specimen Answers.pdf

Version 1
Specimen Paper Answers Paper 2
Cambridge International AS & A Level Marine Science 9693
For examination from 2022

In order to help us develop the highest quality resources, we are undertaking a continuous programme of review; not only to measure the success of our resources but also to highlight areas for improvement and to identify new development needs. We invite you to complete our survey by visiting the website below. Your comments on the quality and relevance of our resources are very important to us. www.surveymonkey.co.uk/r/GL6ZNJB
Would you like to become a Cambridge International consultant and help us develop support materials? Please follow the link below to register your interest. www.cambridgeinternational.org/cambridge-for/teachers/teacherconsultants/
Copyright © UCLES March 2020 Cambridge Assessment International Education is part of the Cambridge Assessment Group. Cambridge Assessment is the brand name of the University of Cambridge Local Examinations Syndicate (UCLES), which itself is a department of the University of Cambridge. UCLES retains the copyright on all its publications. Registered Centres are permitted to copy material from this booklet for their own internal use. However, we cannot give permission to Centres to photocopy any material that is acknowledged to a third party, even for internal use within a Centre.

Contents Introduction ........................................................................................................................................................ 4
Assessment overview ........................................................................................................................................ 5
Paper 2 – Question 1 ......................................................................................................................................... 6
Paper 2 – Question 4 ....................................................................................................................................... 11
Paper 2 – Question 6 ....................................................................................................................................... 29

Specimen Paper Answers – Paper 2
4
Introduction The main aim of this booklet is to exemplify standards for those teaching Cambridge International AS & A Level Marine Science 9693, and to show examples of very good answers. We have selected questions from Specimen Paper 2 for examination from 2022. This is the AS Level Data-handling and Investigative Skills paper which assesses candidates’ abilities to describe and evaluate experimental techniques; manipulate, interpret and analyse data; and reach conclusions giving reasoned explanations. In this booklet, we have provided answers for questions 1, 4 and 6 along with examiner comments, so that a range of question types are covered, including drawing a specimen and describing a practical method. Each question is followed by an example of a high grade answer with an examiner comment on performance. Comments are given to indicate where and why marks were awarded, and how additional marks could have been obtained. In this way, it is possible to understand what candidates have done to gain their marks and how they could improve. The mark schemes for the Specimen Papers are available to download from the School Support Hub at www.cambridgeinternational.org/support.
2022 Specimen Paper 2 Mark Scheme Past exam resources and other teacher support materials are available on the School Support Hub www.cambridgeinternational.org/support

Specimen Paper Answers – Paper 2
5
Assessment overview
Paper 2 – AS Level Data-handling and investigative skills Written paper, 1 hour 45 minutes, 75 marks
Candidates may use a calculator.
The question paper is composed of structured questions. Questions on this paper vary in style ranging from short answers (awarding just 1 or 2 marks), to longer free prose responses when describing experimental methods (awarding up to 6 marks).
The paper is an externally set assessment, marked by Cambridge.
Assessment AO1 Knowledge and understanding – weighting 20%
AO2 Handling and applying information – weighting 47%
AO3 Experimental skills and investigations – weighting 33%

Specimen Paper Answers – Paper 2
6
Paper 2 – Question 1
Question 1(a)
Examiner comment The candidate has correctly labelled the position of all four structures so gains four marks. The label lines have been drawn using ruled lines which touch each structure and are therefore all correct. Arrowheads should not be used.
Total marks awarded = 4 out of 4
mouth
nematocysts
stomach
tentacle

Specimen Paper Answers – Paper 2
7
Question 1(b)(i)
Examiner comment Both suggestions are correct, so two marks are awarded. The incorrect spelling of symmetry would be ignored in this instance as it does not change the phonetic sound of the word or meaning of the term. Candidates should take care to spell scientific terms correctly.
Total marks awarded = 2 out of 2
Tube feet
Pentaradial symetry

Specimen Paper Answers – Paper 2
8
Question 1(b)(ii)
Examiner comment Drawings are a new skill to be tested on this paper. Marks are awarded for the following criteria:
Quality of outline – this should be thin and continuous. There are one or two tiny gaps, and the right-hand side of the top arm is a little unclear (sketch-like drawing is not appropriate), therefore the mark would not be awarded. Note that there is no attempt at shading in areas of different tone - drawings should be clear outlines only.
Suitable size – the drawing should be large enough to fill at least two-thirds of the available space, so this mark would be awarded.

Specimen Paper Answers – Paper 2
9
Drawing in proportion – the structures in the drawing should be well proportioned and to scale. This can be difficult to achieve for some specimens. On this drawing each arm is drawn longer than it is wide, and relative widths / lengths are about right so this mark would be awarded. To be critical, the pentagon in the middle is drawn larger and more centrally than in the image, but the majority of the specimen is correct.
Detail – it can be difficult to judge how much detail to include. Candidates are not expected to recreate all minor details such as the intricate pattern shown here. The candidate however should follow the instructions given and in this case, the markings on only one of the arms should have been included. Whilst not perfectly accurate, this drawing has a sufficient level of correct detail so the mark is awarded. Total marks awarded = 3 out of 4
Question 1(b)(ii)
Examiner comment This answer is correct, and the mark is awarded.
Using keys is also a new skill on this paper. The question has intentionally been designed so that the candidate must use the key properly to arrive at the correct answer by carefully considering each question in turn. If a candidate just looked at one obvious feature, such as the dark lines across the body, they may arrive at the wrong answer.
The question is also testing that candidates are familiar with the names of the fins on the fish.
C. trifascialis
Specimen Paper Answers – Paper 2
10
Total marks awarded = 1 out of 1
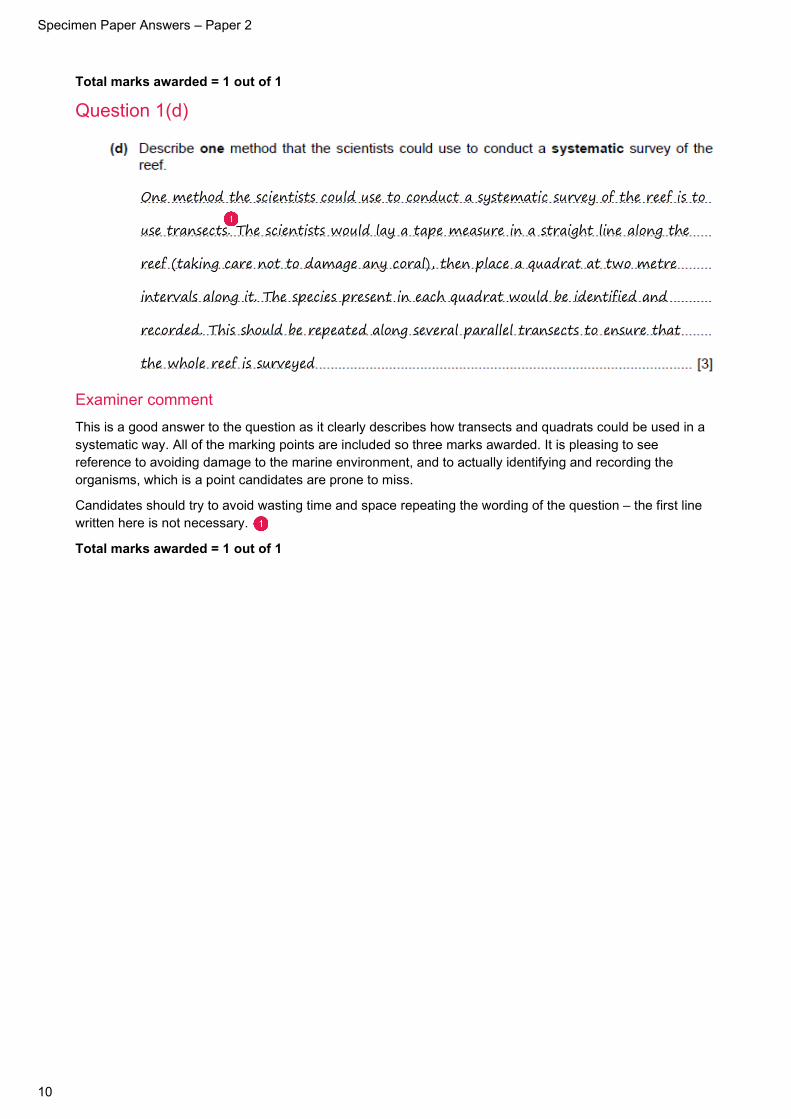
Question 1(d)
Examiner comment This is a good answer to the question as it clearly describes how transects and quadrats could be used in a systematic way. All of the marking points are included so three marks awarded. It is pleasing to see reference to avoiding damage to the marine environment, and to actually identifying and recording the organisms, which is a point candidates are prone to miss.
Candidates should try to avoid wasting time and space repeating the wording of the question – the first line written here is not necessary.
Total marks awarded = 1 out of 1
One method the scientists could use to conduct a systematic survey of the reef is to
use transects. The scientists would lay a tape measure in a straight line along the
reef (taking care not to damage any coral), then place a quadrat at two metre
intervals along it. The species present in each quadrat would be identified and
recorded. This should be repeated along several parallel transects to ensure that
the whole reef is surveyed

Specimen Paper Answers – Paper 2
11
Paper 2 – Question 2
Question 2(a)(i)
Examiner comment For questions requiring candidates to plot a graph, marks are usually allocated as follows:
• Suitable scales for axes: the scale chosen should ensure that the plotted graph covers at least half of the grid provided. The scales must be even across the range of values. The scale does not need to start at 0 if this is appropriate. This candidate has chosen suitable scales and the plotted graph fills more than half of the grid, so this mark is awarded. If the candidate had placed a 0 at the bottom
density / kg m-3
temperature of water / ˚C
985
990
995
1000
0 10 20 30 40 50
x x
x
x
x
x
980
Specimen Paper Answers – Paper 2
12
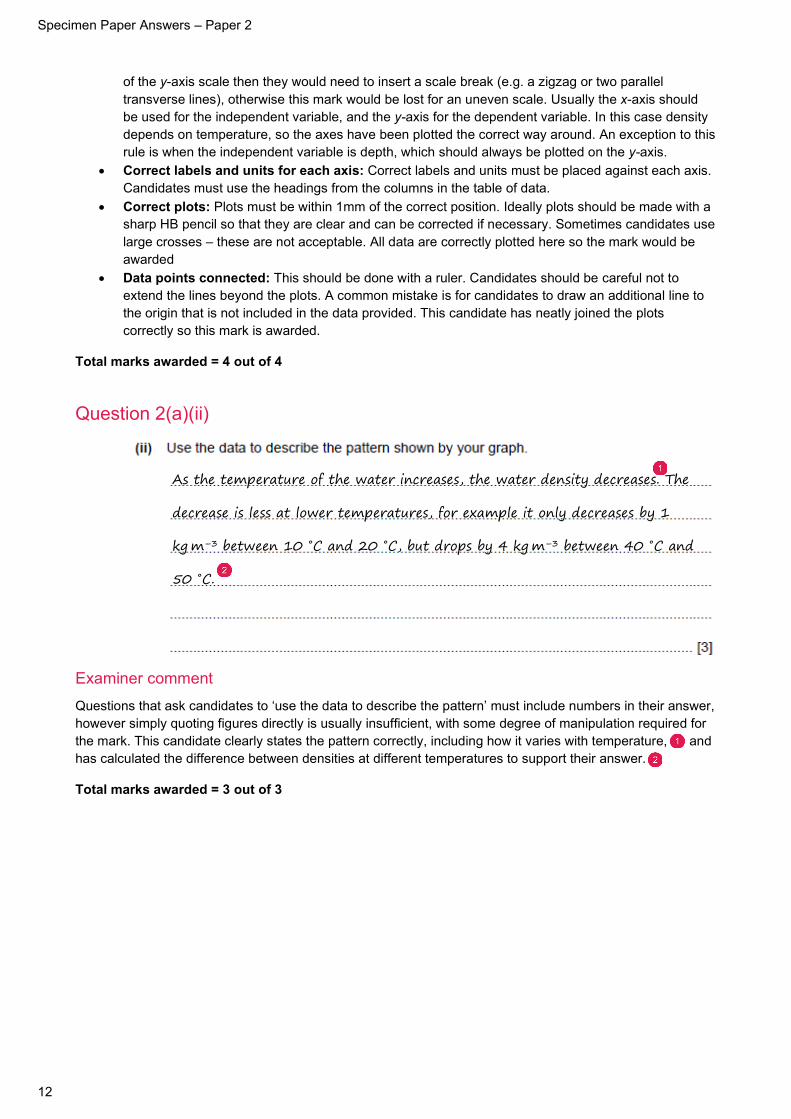
of the y-axis scale then they would need to insert a scale break (e.g. a zigzag or two parallel transverse lines), otherwise this mark would be lost for an uneven scale. Usually the x-axis should be used for the independent variable, and the y-axis for the dependent variable. In this case density depends on temperature, so the axes have been plotted the correct way around. An exception to this rule is when the independent variable is depth, which should always be plotted on the y-axis.
• Correct labels and units for each axis: Correct labels and units must be placed against each axis. Candidates must use the headings from the columns in the table of data.
• Correct plots: Plots must be within 1mm of the correct position. Ideally plots should be made with a sharp HB pencil so that they are clear and can be corrected if necessary. Sometimes candidates use large crosses – these are not acceptable. All data are correctly plotted here so the mark would be awarded
• Data points connected: This should be done with a ruler. Candidates should be careful not to extend the lines beyond the plots. A common mistake is for candidates to draw an additional line to the origin that is not included in the data provided. This candidate has neatly joined the plots correctly so this mark is awarded.
Total marks awarded = 4 out of 4
Question 2(a)(ii)
Examiner comment Questions that ask candidates to ‘use the data to describe the pattern’ must include numbers in their answer, however simply quoting figures directly is usually insufficient, with some degree of manipulation required for the mark. This candidate clearly states the pattern correctly, including how it varies with temperature, and has calculated the difference between densities at different temperatures to support their answer.
Total marks awarded = 3 out of 3
As the temperature of the water increases, the water density decreases. The
decrease is less at lower temperatures, for example it only decreases by 1
kg m–3 between 10 ˚C and 20 ˚C, but drops by 4 kg m–3 between 40 ˚C and
50 ˚C.

Specimen Paper Answers – Paper 2
13
Question 2(b)
Examiner comment This would usually be correct science, as density and temperature usually have an inverse relationship. However, water is unusual in that when it freezes density is reduced, due to the change in bonding between the water molecules, so the candidate is incorrect.
Total marks awarded = 0 out of 2
Question 2(c)
Examiner comment The candidate has got the right idea here gaining the first mark, but their explanation needs more detail to include reference to mass per unit volume. Total marks awarded = 1 out of 2
The density would increase as the water molecules have less energy and so sit
closer together.
The density values for seawater would be higher as the salt will add mass to the
water.

Specimen Paper Answers – Paper 2
14
Question 2(d)
Examiner comment This answer is correct, easily gaining the second marking point, but there is no explanation of water being warmed at the surface which was required for the first marking point. Total marks awarded = 1 out of 2
Warmer water is less dense and so rises above colder, denser water, which tends
to sink. This leads to warmer layers forming above colder layers.

Specimen Paper Answers – Paper 2
15
Paper 2 – Question 3
Question 3(a)(i)

Specimen Paper Answers – Paper 2
16
Examiner comment This candidate scores both marks as the correct answer has been provided on the answer line. They have shown the correct calculation, which would gain them a mark if their final answer had not been stated correctly to three significant figures. Candidates should always show their full workings in the space provided. Candidates sometimes confuse significant figures with decimal places, or incorrectly round figures up/down, so care should be taken to ensure they know the correct process involved. Total marks awarded = 2 out of 2
Question 3(a)(ii)
Examiner comment This is a very good answer that clearly states the first three marking points and has also given a valid description for the final marking point. Time of day and the tidal cycle would ideally both need to coincide, but for this question candidates still gain credit for having considered either variable alone, or both in isolation. Total marks awarded = 3 out of 3
52 × 4112 =177.67
178
The scientists should ensure that exactly the same procedure is carried out
during each catch, taking samples for the same length of time at the same
time of day, in exactly the same location on the reef. It is also important to
ensure the tags are properly attached as if any fall off then fewer tagged
individuals may be recorded in the second catch, and inaccurate data would
be collected.

Specimen Paper Answers – Paper 2
17
Question 3(a)(iii)
Examiner comment The first sentence in this response is ample to gain both marking points, even suggesting the impact on the final population estimate. The second sentence is also correct but is not needed and adding additional suggestions like this is risky, as the list rule applies here and incorrect answers will negate correct ones. Total marks awarded = 2 out of 2
The tags may fall off if not securely attached, so the number tagged in the
second catch could be smaller than it should be, leading to an overestimation
of the population size. Additionally some fish may die or move to another reef.

Specimen Paper Answers – Paper 2
18
Question 3(a)(iii)
Examiner comment This is a tricky graph to interpret, as lower values for health index indicate better health. When a question asks whether a hypothesis is supported, it is important that candidates clearly state whether it is indeed supported or not, and provide evidence from the data to justify their answer. Some candidates will merely state patterns in the data. In this answer there is a clear statement that the hypothesis is largely supported
Overall the data here supports this hypothesis, as when the numbers of
parasites A and B are low in 2001, 2004 and 2008, the health index is also
low, indicating healthier fish. However, it is only to some extent as the lowest
numbers of parasite B are in 2007, which does not coincide with the highest
health index.

Specimen Paper Answers – Paper 2
19
for both parasites, but there also an example identified where it is not. This is enough to gain all three marks.
Ideally candidates are expected to be aware that a correlation between two variables does not necessarily mean that variation of one causes the variation in the other.
Total marks awarded = 3 out of 3

Specimen Paper Answers – Paper 2
20
Paper 2 – Question 4
Question 4(a)(i)
Examiner comment This response would gain two marks, one for the correct reactants and one for the correct products. Each pair can be stated either way round. Candidates should be encouraged to use words in word equations; however, correct symbol formulae would be acceptable so long as they conform to correct scientific notation, e.g. CO2 not CO2.
The photosynthesis equation in the syllabus is shown with light energy and chlorophyll above and below the arrow. Omitting one or both of these would still leave a correct word equation, so they are not required in the answer. Candidates including them would not be penalised and hence these elements are listed as ‘I’ (ignore) in the additional guidance of the mark scheme.
Total marks awarded = 2 out of 2
water + carbon dioxide → glucose + oxygen

Specimen Paper Answers – Paper 2
21
Question 4(a)(ii)
The rate of photosynthesis can be found by measuring the amount of
oxygen produced by the seagrass over time. A sample of seagrass can be
placed in a large beaker beneath an inverted funnel in seawater. A lamp
can be shone onto the seagrass so that it photosynthesises. The funnel is
connected to a gas syringe that will collect the oxygen as it is produced to
measure its volume. A timer can be used to time how much oxygen is
produced in one hour. The rate of oxygen produced can then be
determined in cm3 per hour. The light intensity can be varied by changing
the distance between the lamp and the beaker containing the seagrass. This
could be done at 10cm intervals from 10 to 50 cm. The procedure should
be repeated three times at each distance and a mean rate calculated for
each distance. A graph could then be plotted to show the relationship
between light intensity and rate of photosynthesis. In order to gain reliable
results some variables will need to be controlled, such as the same
temperature of the water in the beaker and the same mass of seagrass
used.

Specimen Paper Answers – Paper 2
22
Examiner comment This is a comprehensive answer that would gain full marks.
There is a clear description of the apparatus and method that will be used to carry out the investigation. Note that the candidate correctly describes using seawater, not just water.
The relevant variables are discussed in detail; candidates are advised to ensure that they describe how different variables will be manipulated or controlled to include:
• the variable to be investigated (the independent variable, in this case light intensity),there should be mention of the range of values to be used;
• the variable to be measured in the results (the dependent variable, in this case the volume of oxygen produced);
• the variables to be kept constant (control variables that would avoid the production of unreliable results), this could involve a number of factors and candidates are usually expected to suggest at least two.
Candidates should ensure equipment needed to measure these variables is described.
Ideally, this response could describe further how some variables would be controlled, e.g. the temperature of the water by eliminating the heating effect of the lamp, and/or by ensuring carbon dioxide does not become a limiting factor.
The candidate also refers to repeating the procedure and calculating a mean. This part of the response would be improved if there was reference to ignoring any anomalous results when calculating this.
It is not necessary to describe the plotting of graphs or other ways of displaying results.
This response would benefit from some reference to performing the procedure safely, e.g. ensuring water does not come into contact with electrical equipment or avoiding burns from the lamp.
Clearly labelled diagrams are acceptable if they help clarify a candidate’s response.
Bullet points are also acceptable.
Mark schemes for this type of question usually contains a number of marking points so candidates do not have to include every last detail to gain full marks.
Total marks awarded = 5 out of 5

Specimen Paper Answers – Paper 2
23
Question 4(a)(iii)
Distance of lamp from
seagrass / cm
Volume of oxygen produced
per hour / cm3
10
20
30
40
50
Examiner comment This response would gain both marks as both the independent and dependent variables are clearly stated , including appropriate units (missing units is a common error made by candidates). It is not necessary to fill in individual values as this candidate has done – marks are awarded for the correct column headings and units.
Total marks awarded = 2 out of 2

Specimen Paper Answers – Paper 2
24
Question 4(a)(iv)
Examiner comment This response would gain both marks as the line drawn correctly shows the expected relationship, and the axes are labelled correctly. Candidates are encouraged to practise their ability to draw a line freehand, but slight variations in the line are acceptable on a sketch graph. This line could also have been shown levelling off at higher light intensity, as there may have been other limiting factors.
When deciding which way round to label the axes, candidates should place the independent variable (the one they change, in this case light intensity) on the x-axis (horizontal), and the dependent variable (the one they measure) on the y-axis (vertical).
Total marks awarded = 2 out of 2
Question 4(a)(iv)
Examiner comment This is a good example of when candidates need to understand the command word used in the question. In this case the question asks candidates to explain the relationship. This response would only gain one mark as it only describes the relationship.
Rate of photosynthesis
Light intensity
Increasing the light intensity increases the rate of photosynthesis – at lower
light intensities the rate of photosynthesis is lower.

Specimen Paper Answers – Paper 2
25
The second marking point requires the candidates to use their scientific knowledge to give the reason for the relationship shown; in this case the rate increases due to more energy being available at higher light intensities.
Total marks awarded = 1 out of 2
Question 4(b)
Examiner comment Both of these answers fit nicely with the mark scheme. However, the candidate gives two reasons for the second marking point – ‘obtain and keep’. They would lose this mark if one of their two suggestions were incorrect as the ‘list’ rule in the examination guidelines applies here. In this case, both suggestions are acceptable so the mark can be awarded, but in questions like this candidates are advised not to give multiple suggestions for one marking point, as an incorrect answer will negate a correct one.
Total marks awarded = 2 out of 2
It will be easier to control the mass of phytoplankton used in the Investigation.
Phytoplankton will be easier to obtain and keep than seagrass.

Specimen Paper Answers – Paper 2
26
Paper 2 – Question 5
Question 5(a)(i)
Examiner comment This is the correct answer – candidates were expected to link the sudden increases at 32cm and decreases back to original values at 72cm, to the passage of the sensor through the vent plume.
There is often a degree of tolerance for reading values off a graph if the lines are not clearly crossing the lines on the grid.
The second mark is for the unit (cm) which is correctly stated.
Total marks awarded = 2 out of 2
40cm

Specimen Paper Answers – Paper 2
27
Question 5(a)(ii)
Examiner comment This is an excellent description of the correlation, but the question stem also asks for an explanation (the lower solubility of gases in higher water temperature). Candidates should take care to ensure they have addressed the command words in the question stem correctly.
Total marks awarded = 1 out of 2
Question 5(b)
Examiner comment This answer covers the first 4 marking points on the mark scheme well. It does not mention that high temperature/pressure increases the solubility of the minerals, but still gains full marks.
Total marks awarded = 3 out of 3
The higher the temperature the lower the dissolved oxygen concentration. As
the probe enters the vent plume water temperature increases and the
dissolved oxygen concentration decreases. The opposite happens as the probe
leaves the vent plume.
At a hydrothermal vent seawater moves into the cracks in the rocks that make up
the Earth’s crust, and comes into contact with molten rock (magma). This causes
minerals in the molten rock such as sulfide to dissolve in the seawater, which is
then ejected into the vent plume.

Specimen Paper Answers – Paper 2
28
Question 5(c)
Examiner comment This is a brief answer that does not contain enough detail to gain full marks. One mark is awarded for the cooling of the water as it re-enters the ocean, but there is no reference to precipitation, or the accumulation to form chimneys.
Total marks awarded = 1 out of 2
Minerals that are dissolved are deposited around the vent as the water will cool
when it leaves in the vent plume.

Specimen Paper Answers – Paper 2
29
Paper 2 – Question 6
Question 6(a)

Specimen Paper Answers – Paper 2
30
Examiner comment The candidate’s answer correctly describes the overall pattern and identifies the lack of increase in the first 40m. However thereafter there is a lack of detail regarding the rest of the graph so two out of three marks would be awarded.
The line on the graph has three phases; very little increase in nitrate ion concentration down to 40m, a rapid increase between 40m and 56m, and a diminishing rate of increase below 56m.
Some questions of this type specifically ask candidates to use the data presented, and candidates would be expected to extract numbers from the graph to support their answer. This question does not ask for this, but it is good exam technique for candidates to routinely pick data from the graph to support their answer, for example ‘between 40m and 150m depth the concentration of nitrate ions increases by 2.3 mmol m-3’
Candidates sometimes struggle with their language regarding depth, for example describing ‘decreasing depth’ to mean getting deeper, so care should be taken to ensure the correct language is used.
Total marks awarded = 2 out of 3
Question 6(b)(i)
Examiner comment The candidate would be awarded 3 marks as they have the correct answer on the answer line. Candidates should always show their working as marks can be gained for both extracting the correct data from the graph and, even if these numbers are incorrect, for attempting the correct calculation. This candidate has extracted the data correctly from the graph and used the correct calculation. Percentage increase and decrease calculations often prove problematic for candidates. Common errors include subtracting the data the wrong way round when calculating the change, and dividing this by the final value rather than the initial value.
Total marks awarded = 3 out of 3
Overall there is an increase in the concentration of nitrate ions as depth
increases. Initially there is very little change in the first 40 metres. After 40
metres the concentration of nitrate ions decreases much more rapidly
conc. at 40m = 0.2 mmol m–3 conc. at 80m = 2.0 mmol m–3
% increase = 2.0 – 0.2
0.2 X100
=900

Specimen Paper Answers – Paper 2
31
Question 6(b)(ii)
Examiner comment The candidate correctly refers to a lack of light as depth increases, resulting in lower productivity and so would be awarded the first two marking points. They also refer to nitrate being used up by organisms, but they do not specify by phytoplankton/photosynthetic organisms, so would not gain the third marking point. It is a common mistake to suggest that zooplankton or animals uptake nitrates. It is also preferable to refer to the availability of light in terms of light intensity.
Total marks awarded = 2 out of 3
Question 6(c)
Examiner comment The candidate would be awarded 3 marks as they have the correctly described the expected impact, (an increase in nitrate concentration in surface waters), and have then explained how strong winds will cause this through upwelling. Their last sentence is true but is not relevant as the question asks for differences in the data. Candidates should take care to ensure they are answering what the question asks – it can be helpful if candidates underline key words in the question stem as they read it.
Total marks awarded = 3 out of 3
Nitrate is used as a nutrient by organisms living in the surface waters, so
the concentration remains low here. However below 40m depth there are
fewer living organisms due to the lack of light. Producers are unable to
perform as much photosynthesis so productivity is lower, which affects the
whole food web, so the nitrate concentration increases as depth increases.
The concentration of nitrates in the surface waters may increase because strong
winds cause increased movement of water in the ocean, which in turn could lead
to upwelling, bringing nitrates up from greater depths. This will potentially cause
greater productivity in the surface waters.

Specimen Paper Answers – Paper 2
32
Question 6(d)
Examiner comment The candidate would gain 2 marks for correctly suggesting and explaining a possible effect. It would have been better to refer to an increased rate of photosynthesis rather than ‘more photosynthesis’. This question is an example of one where there is more than one acceptable alternative – candidates could also have suggested that the numbers of consumers will increase, thus increasing the rate of respiration, or that both processes would increase in rate resulting in no net change in oxygen concentration.
Total marks awarded = 2 out of 2
The increase in nitrate ions will cause an increase in productivity in
surface waters and so producers will perform more photosynthesis. Photosynthesis
produces oxygen therefore the concentration of oxygen in the surface water should
increase.

Cambridge Assessment International Education The Triangle Building, Shaftesbury Road, Cambridge, CB2 8EA, United Kingdom t: +44 1223 553554 e: [email protected] www.cambridgeinternational.org Copyright © UCLES June 2020