8711 Pohan 2019 E.docx - IJICC
19
International Journal of Innovation, Creativity and Change. www.ijicc.net Volume 8, Issue 7, 2019 116 Application of Simulation of Queue Relationships that Occur and the Timing of Traffic Lights on Road Crossings using fuzzy logic method Amir Hamzah Pohan a , L.A.Latiff Razak b , Rudzidatul Akmam Dziyauddin c , a Teknik Elektro Fakultas Teknik, UniversitasTama Jagakarsa, Jakarta Indonesia, b Engineering Advanced Technology, Universiti Teknologi Malaysia Kuala Lumpur, Malaysia, c Razak school of Engineering Advanced Technology, Universiti Teknologi Malaysia Kuala Lumpur, Malaysia, Email: a [email protected], b [email protected], c [email protected] The behaviour of motorists at intersections is determined by the road and vehicle density studies. Changes in behaviour are also determined by the time for the green light to be crossed. Therefore, the aim of this project is to see the behaviour of motorists and be able to control traffic by controlling traffic lights at an intersection. This project will also get the right width of the road to reduce congestion, with software applications that are capable of engineering wide roads at every intersection. To determine the time of the green light, the number of vehicles must be determined in advance. The fuzzy logic method and the standard green time value (NWHS) will determine the green light time on the road. The development method is divided into four settings namely vehicle counting, line counting, the calculation process and road signals. This vehicle calculation method is further strengthened by determining the width of the road that will be available to reduce congestion. However, in producing high accuracy in the green time interval (MH), the Fuzzy Logic method is included as an additional parameter based on the solid ratio of the vehicle from each side of the road and the width of the road. Overall results show that vehicle drivers are based on vehicle density and road width, the denser the vehicle, the longer the green light is turned on, the more positive the driver's behaviour. Key words: Rider behaviour, green time, road width, many vehicles.
-
Upload
khangminh22 -
Category
Documents
-
view
0 -
download
0
Transcript of 8711 Pohan 2019 E.docx - IJICC

International Journal of Innovation, Creativity and Change. www.ijicc.net Volume 8, Issue 7, 2019
116
Application of Simulation of Queue Relationships that Occur and the Timing of Traffic Lights on Road Crossings using fuzzy logic method
Amir Hamzah Pohana, L.A.Latiff Razakb, Rudzidatul Akmam Dziyauddinc, aTeknik Elektro Fakultas Teknik, UniversitasTama Jagakarsa, Jakarta Indonesia, bEngineering Advanced Technology, Universiti Teknologi Malaysia Kuala Lumpur, Malaysia, cRazak school of Engineering Advanced Technology, Universiti Teknologi Malaysia Kuala Lumpur, Malaysia, Email: [email protected], [email protected], [email protected]
The behaviour of motorists at intersections is determined by the road and vehicle density studies. Changes in behaviour are also determined by the time for the green light to be crossed. Therefore, the aim of this project is to see the behaviour of motorists and be able to control traffic by controlling traffic lights at an intersection. This project will also get the right width of the road to reduce congestion, with software applications that are capable of engineering wide roads at every intersection. To determine the time of the green light, the number of vehicles must be determined in advance. The fuzzy logic method and the standard green time value (NWHS) will determine the green light time on the road. The development method is divided into four settings namely vehicle counting, line counting, the calculation process and road signals. This vehicle calculation method is further strengthened by determining the width of the road that will be available to reduce congestion. However, in producing high accuracy in the green time interval (MH), the Fuzzy Logic method is included as an additional parameter based on the solid ratio of the vehicle from each side of the road and the width of the road. Overall results show that vehicle drivers are based on vehicle density and road width, the denser the vehicle, the longer the green light is turned on, the more positive the driver's behaviour.
Key words: Rider behaviour, green time, road width, many vehicles.

International Journal of Innovation, Creativity and Change. www.ijicc.net Volume 8, Issue 7, 2019
117
Introduction Monitoring and controlling city traffic is a big problem in many countries. With the increasing number of vehicles on the road, the Traffic Control Board or the Department of Transportation as the leading authority in Indonesia needs to find new ways or steps to solve this problem. Steps are being taken by the construction of new roads and bridges in the city centre, the construction of several rings as inner ring roads, middle lanes and outer ring roads and the development of sophisticated traffic monitoring and control systems. But at present the existing traffic management is inefficient. With the latest technology, intelligent transportation system (ITS) solutions detect vehicles to get complete and integrated information (video image information and traffic volume). If necessary, the number of cameras controlling a certain area can be increased to produce more detailed information. Image processing is a better technique for controlling traffic density in real-time systems. This shows that it can reduce traffic jams and avoid bad driver behaviour. It is also more reliable in predicting the presence of vehicles for traffic using actual images. The number of vehicles that produce traffic density at certain intervals is achieved through morphological and open expansion operations. Automatic traffic monitoring is very important for motorists and their behaviour on the road. Traffic parameters have become an active research area for the development of intelligent transportation systems. Various sensors have been used to estimate traffic parameters to update traffic information. Magnetic loop detectors have become the most widely used technology, but installation and maintenance are given more attention and may not be compatible with future intelligent transportation infrastructure systems. It is also recognised that the camera system is based on a more flexible view of traffic estimation parameters. In addition to the qualitative description of highway congestion, it can see highways and intersections such as road width and lane measurement measurements can also measure the status of light vehicles including speed, the number of vehicles and so on. In addition, quantitative traffic parameters can provide a complete flow of information, which meets the needs of traffic management theory and makes driver behaviour positive. Detection of moving vehicle images can provide a quantitative description of traffic flow. In this study, the system designed with the steps taken is the development of new roads and bridges in the city centre such as inner ring roads, intersections and highways, blocking large city vehicles during peak hours and traffic light crossing lights. It is important to understand that before deciding on the traffic light green time, we need the concept of traffic flow units called passenger car units. This concept carries light vehicles including passenger cars as a standard value to determine the value of other types of vehicles. Light vehicles / passenger cars in this set have one passenger car unit (smp).

International Journal of Innovation, Creativity and Change. www.ijicc.net Volume 8, Issue 7, 2019
118
The Directorate General of Bina Marga, in The Directorate of Urban Roads in Indonesia has conducted surveys in 275 cities in Indonesia and has a standard passenger car (emp) value with traffic conditions at the time. The resulting analysis value parameters cannot provide absolute figures (MKJI), but may change from time to time and other types of facilities. In order for the factors to form the parameters of the MKJI model formulation analysis will be greatly influenced by the situation at that time. Vehicle ownership, motorcycle parts, and road length Vehicle ownership at that time was around 135 million registered vehicles with an average motorcycle composition of 39.57% and the length of existing roads, especially national roads of no more than 327,000 km (1995 data). Traffic flow has increased significantly, vehicle ownership data has reached more than 430 million vehicles registered with about 70% of the composition of motorbikes (estimated by the Directorate of Transportation Safety, 2007) and national road length reached 430,000 km. Statistics and visual visibility of urban public roads is a composition motorcycle, often dominating the flow of traffic on the various problems that cause it. At present, the volume of ownership of vehicles both motorbikes, cars and trucks has increased very rapidly and an increasing number of vehicles will require sufficient space to operate on roads and intersections, because operations are not the same as truck and motorcycle cars. These differences include the ability to start movement and driving distance between vehicles. In addition, the driver's behaviour matches his interests in each city on a different highway. This study aims to propose additional signal lamp components of the smart monitoring system to improve the signal lamp configuration and make the driver behaviour better. This will be in a smart signal system using long traffic jams in front of traffic lights and road width at the intersection as input. In general, signal lights are used for one or more of the following reasons - To avoid traffic disruptions by traffic flow conflicts to ensure that certain capacities are maintained, even during peak traffic conditions; - To allow motorists and / or pedestrians from (small) intersections to / from the main road; - To reduce the behaviour of motorists on the road due to collisions between vehicles from the opposite direction. For most road facilities, traffic capability and behaviour are primarily a function of the traffic demand and geometric conditions. Using signal lights can be distributed to various cover capacities by allocating green time for each adapter. Therefore, to calculate the capabilities and behaviour of traffic, it is necessary to determine the phase and time of the green light to best suit the situation being reviewed.

International Journal of Innovation, Creativity and Change. www.ijicc.net Volume 8, Issue 7, 2019
119
Methodology A. Traffic System On most roads, traffic and its main ability are in terms of geometric functions and traffic behaviour. The use of signal lights can be distributed to various intersections by allocating green time at each intersection. Therefore, to calculate the green light time, the junction conditions are needed including the junction type, capacity and number of vehicles. The use of the three-color interchange signals is used to determine the signal for each colour in the time dimension. In this study, simulation of traffic lights based on field traffic videos is a major part of the research methodology for designing new concepts to adjust light signals based on dynamic equations that are processed from Fuzzy Logic calculations. This model is mainly related to the development of the concept of static traffic lights with dynamic traffic lights at intersections. The parameters in determining the intersection signal are done by capturing the vehicle via video and determining the width of the road with a web design application. The effect of taking pictures of vehicles and intersections at each time the sample is done by testing using Fuzzy Logic. In testing using this Fuzzy Logic, the step-by-step method is chosen to determine the dynamic equation of green time. So the dynamic equation of green time is divided into two parts, namely the density of vehicles with the width of the road. Data collection was also carried out mainly on video recordings at the intersection of Bogor Semplak and Sala Benda conducted by previous video recordings. Video data is needed in connection with case studies in reducing traffic congestion and driver behaviour. Although the simulation data from the dynamic equation test is very useful in making traffic lights so that driver behaviour becomes positive and can reduce congestion. In conducting research in accordance with the objectives of the study, a study and flow chart is conducted, in which the study is carried out systematically. In the flow chart, it is also possible to test other tests carried out by analysing various methods chosen for research purposes that are useful in future traffic light engineering. B. Design Study At the beginning of the study, the preparation and identification of studies on the nature and behaviour of motorists at intersections in determining the green light as something specifically explored through a literature review. One location at the intersection of Semplak and Sala Benda Bogor. The object was chosen as the location of the sample study. Samples were taken from the study site for some initial tests of traffic light simulations. In addition,

International Journal of Innovation, Creativity and Change. www.ijicc.net Volume 8, Issue 7, 2019
120
simulations to determine vehicle density and road width were carried out to get the best results for analysis after capturing video images in Semplak and Sala Benda Bogor. Data analysis and data validation were carried out to get a change in the number of vehicles coming out of the green light, as well as their relationship to the number of vehicles in other lanes. Reduction of congestion data in video shooting compared to background analysis uses a Visual Studio simulation program to evaluate and recommend parameters determining the number of vehicles and the appropriate road width for design requirements that determine the traffic light green time. 1. Determination of the number of vehicles: (i) For road vehicle data; (ii) Vehicle sampling using a 13 MP camera and auto focus video; (iii) The process of extracting binary information gathering that contains pixel intensity; (iv) Perform tests in detecting systems capable of counting objects; (v) Vehicle counters test with examples of vehicles that have program accuracy in counting the number of vehicles. 2. Topography Topographic measurements are needed to get an intersection mapping to show the shape of the road in the analysis of the road width. Determining the width of the road (LJ) used at the intersection is to develop a highway program which is a PHP-based Web Application Program. With the help of a computer program, the intersection performance analysis process becomes more flexible so you can change the width of the road regularly to get the desired width. Use software to determine the width of the path used with PHP programs. - Load Google library maps, label.js and ruler.js in PHP scripts - Create latitude and longitude functions and position markers - Create a script that determines the width of the road by calculating the formula distance / distance as follows

International Journal of Innovation, Creativity and Change. www.ijicc.net Volume 8, Issue 7, 2019
121
Figure 1. Determine the width of the road in two red colours
3. Sampling Methods to Determine the Number of Vehicles Samples to determine the number of vehicles were obtained from video shooting at an intersection of approximately 450 angles, ensuring that the vehicle was clearly captured with 13 MP, f / 1.9, auto focus and a 1080p 30pps camera. Samples that determine the number of vehicles obtained in the field by capturing a video shot using the Camera. The sample determines the number of vehicles acquired by four- and two-wheel drive vehicles. The sampling method for determining the number of vehicles is shown in Figure 2 and Figure 3 below. Figure 2. Capture video of vehicle number 450
.

International Journal of Innovation, Creativity and Change. www.ijicc.net Volume 8, Issue 7, 2019
122
Figure 3. Block Diagram Program
Field Video Capture Test All video shooting is done with a 13 MP, f / 1.9 camera, autofocus and 1080p 30 fps camera and testing via Visual Studio software and held at the junction of Junction and Sala in Jakarta. Blob Tracking Testing The test is said to be successful if every passing vehicle is detected by the program as an object. Another possibility is that an object is tracked to more than one object. Vehicle Counter Test In this test it is calculated that the vehicle is passed using the vehicle calculation program and with manual calculation. The results obtained are compared with the accuracy of the program in calculating the number of vehicles. The test is run using one video. The first video is the result of taking 45o degrees. The results of the Vehicle Counter Testing Program with Corner 45o show that as many as 90 vehicles are counted from 120 vehicles passing the route. Program success in computing is 75%. Blobtracking test results In the process of making a film there is one object that is detected as two objects. This could be due to a reduction decision; background that forms two parts in the foreground. The second batch is separate because the process of erosion and fusion is applied to objects, where the initial purpose of erosion and fusion is to separate one object from another object. The success of the program in determining the foreground is also influenced by the speed of the object being processed. The faster the object, the longer the front and will be divided into two objects fast. This is possible because the foreground formed is fragmented and not mixed

International Journal of Innovation, Creativity and Change. www.ijicc.net Volume 8, Issue 7, 2019
123
until it is detected as a different blob. At low speeds Clots can be easily detected precisely because the foreground is intact. The intact form cannot be separated by the process of corrosion and melting used for objects Vehicle Calculation Results In videos taken at an angle of 45o the percentage of calculation accuracy is greater. This is because the area captured by the camera is much larger, the number of frames processed is easier to detect. The size of the capture angle also affects the number of clumps obtained. If the shooting is done vertically then the object will appear larger. Objects that are too large in the image will not be detected as blobs because when the object is larger than the frame area it will not form this object. The concept of traffic lights The concept of counting the number of times the traffic lights of each intersection are done using fuzzy logic. Fuzzy logic is one way to map the input space to the output space. Between input and output there is a black box that maps inputs to output. (i) System design, assumptions, structure and system processes The following details are required: 1. System Design In the calculation of the green time signal that is used the input is the length of the vehicle in the lane you want to adjust and the width of the road on the road to the length of the vehicle on the road at the intersection, and the output is to change the length of the street lamp that turns green. 2. Assumptions a. This system does not care about the type, length and type of vehicle b. There is only one lane on each road and the vehicle will be left turn left to continue the journey without relying on traffic lights c. Intersections are used to have a sequence that matches the phase of the light signal. 3. System Structure and Process In making fuzzy method for green light is a. Long and wide reads with the camera sensor b. Fuzzification c. Processing rules match d. Defuzzification.
International Journal of Innovation, Creativity and Change. www.ijicc.net Volume 8, Issue 7, 2019
124
(ii) Fuzzy Association This fuzzy logic has been chosen on a curve that shows the mapping of data input points with membership values or referenced to the membership level. The green light switch has been set as follows: a. Amount of vehicles Determining the number of vehicles with Fuzzy, mapping inputs to degrees of membership is described as a straight line. There are 2 linear Fuzzy set states. If the number of vehicles is small, then the Fuzzy set created is a linear membership function down as carried:
..(1) If the number of vehicles is moderate then the Fuzzy set created is a linear membership function down as below:
(2) If the number of vehicles is large, then the Fuzzy set created is as below:
(3) The linear membership function goes down as carried this: Information: a = value of output at the highest degree of membership b = value of output at the lowest degree of membership x = output value at the desired membership degree \ μLittle [x] = Value of degree of membership Based on the Fuzzy set prediction, the number of vehicles will be obtained in the field testing is done by capturing video images and image processing with changes in output from the background subtraction that separates image blobs and distinguished by different identities; then vehicle counting is done by setting the calculation method and the calculation process. Vehicle calculation is obtained by the number of vehicles on one road. Getting the number of vehicles is done to get a model of the green light period by determining the width of the intersection.

International Journal of Innovation, Creativity and Change. www.ijicc.net Volume 8, Issue 7, 2019
125
b. Determine the width of the road
Determination of road width is determined by Fuzzy set with the corresponding road output width. Then it is only determined if the Green light switches, the input of which consists of the number of vehicles on a highway with a certain road width. c. Green Time With its Fuzzy set of green times are defined as follows:
The Fuzzy set was tested by including the number of vehicles and road widths repeatedly tested in the discussion below: Dynamic equations have been set with two parameters, namely, the number of vehicles and road widths conducted with multiple experiments to determine the green time, data obtained from the intersection of the Sala Objects intersection and the Bogor intersection, and the

International Journal of Innovation, Creativity and Change. www.ijicc.net Volume 8, Issue 7, 2019
126
sample data with the widths determined separately, 3, 6 , 8, 12, 15, 24 meters and the number of vehicles according to vehicle data at intersections and objects in Bogor. In Table 3.8, the sample table with road width as well as the number of actual and road data vehicles is determined by the number of actual vehicles. Figure 4. The block diagram determines the green light.
The dynamic equation for determining green time is determined by the ratio of the number of vehicles to the width of the road and the determination of the standard green time from the intersection location to the green time: WH = JK / LJ * NWHS WH = Green Time JK = Number of vehicles NWHS = Standard Green Time Valuer Experimental Results In this study, before the process of determining the green time obtained from the intersection of Bogor West Java and Bogor West Java intersection, the topographic data intersection was the width of the road at two intersections. Topographic data is needed from the Bogor intersection, which is at the Sala Benda Bogor intersection and from the Bogor Interval intersection. Topographical data is needed for the calculation of green time, especially in carrying out road width parameters at an intersection with the number of vehicles that occur in a green space. Crossing data is a geological map to determine the distribution of intersection types and intersection formations. IV. Preliminary test data in the field and personal data are also carried out to obtain physical and mechanical properties. Field tests include green field tests conducted with a vehicle volume test (JK) as well as a description of the width of the road obtained. Video capture of the number of vehicles is also done to ensure that the number of vehicles at the intersection will be included in the simulation to be compared with the vehicle. Samples from each road crossed by Sala Benda and at Semplak Bogor intersection are stored and tested to

International Journal of Innovation, Creativity and Change. www.ijicc.net Volume 8, Issue 7, 2019
127
test the number of vehicles with the width of the road. Green time test is done by knowing the dynamic equation that has been created is called TC rather than Fuzzy set. Comparative tests are also carried out by knowing detailed diagrams from the field and simulations. A. A. Preliminary test on a traffic light simulation Data is taken from field data and from simulations. Existing data is processed based on the need for input and system testing. The number of vehicles and the width of the road set is then used as input data or input while for the output itself is the second duration of the green light (see Table 1 below): Table 1: Types of preliminary tests in the simulation of the Sala Benda and Semplak Bogor.
Type Test Sala Benda Semplak
Number of Vehicle First Way Ѵ Second Way Ѵ Third way Ѵ First Way - Ѵ Second Way - Ѵ Third way - Ѵ Fourth Way - Ѵ Width First Way V Second Way V Third way V First Way Ѵ Second Way Ѵ Third way Ѵ Fourth Way V Green Time First Way Ѵ Second Way Ѵ Third way Ѵ First Way Ѵ Second Way Ѵ Third way Ѵ Fourth Way Ѵ Analysis With MKJI 1997 dan AI
Ѵ Ѵ

International Journal of Innovation, Creativity and Change. www.ijicc.net Volume 8, Issue 7, 2019
128
B. Determine the vehicle number
The relationship between parameter properties can be seen in the sequel process after capturing the video as follows: while (capVideo.isOpened() && chCheckForEscKey != 27) (4.1) Background Subtraction (4.2) !capVideo.isOpened() Serching Blob (4.4) Vehicle Kaunter.
The results of the Video Capture cross-border crossing take place between 6:30 am and 9:30 am with an average number of vehicles 55 vehicles per intersection. The width of the road (w) ranges from 6 to 7 meters with a straight road between intersections. Video capture and vehicle counting were around 80% successful. The original width of the road (w) ranges from 6 to 7 meters with a small standard value of 3-6 meters is 5 seconds / phase, 6-9 meters is 6 seconds / phase, Large> 9 meters is 7 seconds / phase. The average yield unit bulk weight (γ) explosion (junction 4) is greater than the average unit weight bulk (γ) Object (junction 3). This is because the location differences are quite far from each other, so different intersection times are formed Figure 5. Number of vehicles on the morning of road 1 at the Sala Benda crossing.
Comparison with TC Simulation
Ѵ Ѵ
International Journal of Innovation, Creativity and Change. www.ijicc.net Volume 8, Issue 7, 2019
129
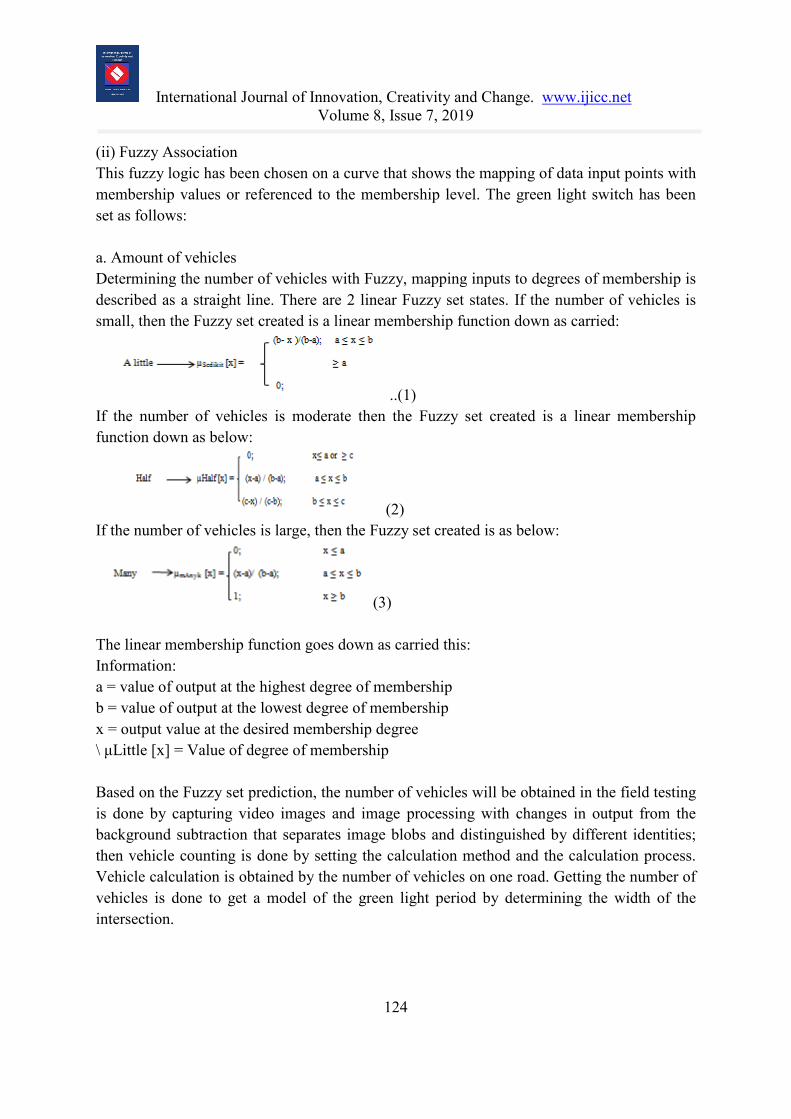
Figure 6. Number of vehicles on the morning of road 2 at the intersection of Sala Benda.
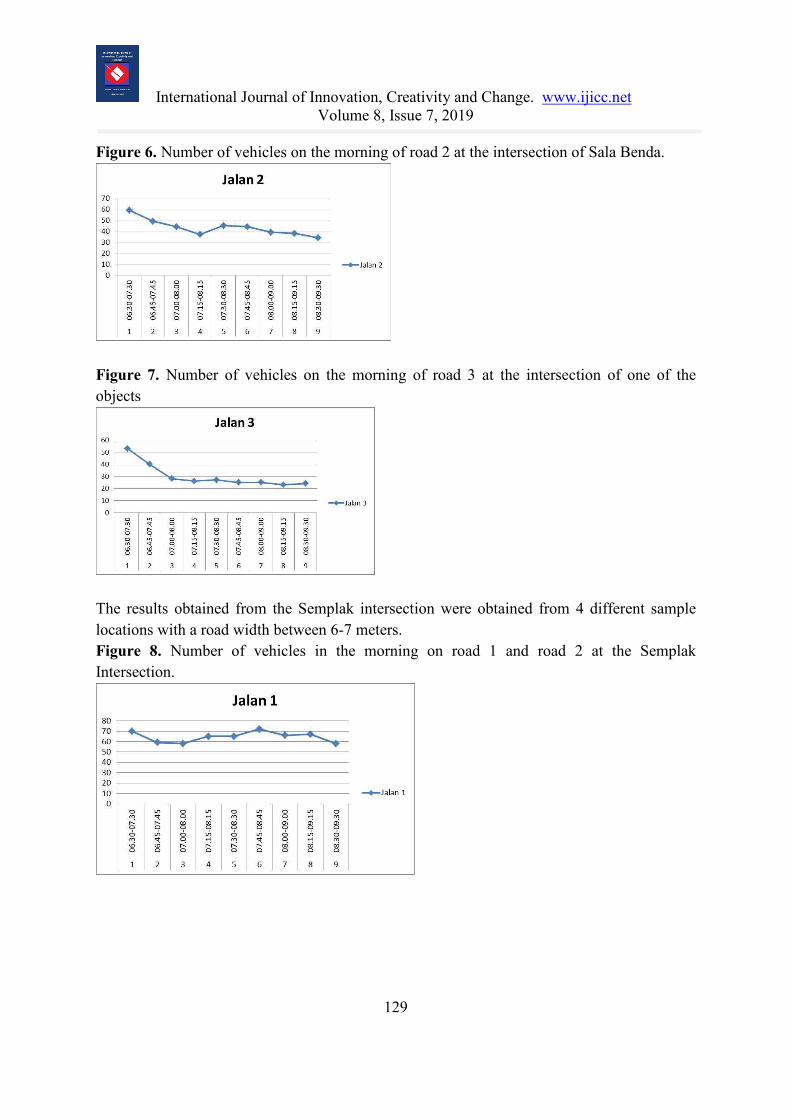
Figure 7. Number of vehicles on the morning of road 3 at the intersection of one of the objects
The results obtained from the Semplak intersection were obtained from 4 different sample locations with a road width between 6-7 meters. Figure 8. Number of vehicles in the morning on road 1 and road 2 at the Semplak Intersection.

International Journal of Innovation, Creativity and Change. www.ijicc.net Volume 8, Issue 7, 2019
130
Figure 9. Number of vehicles in the morning on road 3 and road 4 at the Semplak intersection

International Journal of Innovation, Creativity and Change. www.ijicc.net Volume 8, Issue 7, 2019
131
Table 2: Simulation results of the number of vehicles with the width of the road in Sala Benda and Semplak.
From the table above, it can be seen that the traffic layout in this problem is: 1. There are 3 and 4 intersections. Each intersection can always turn away from the intersection and can only advance alternately. 2. When traffic from north to south lights up, then traffic from west to east must stop and vice versa. Traffic north and south is synchronous and west and east, which means the colour of the lights at the intersection is synchronous. 3. Fuzzy logic controller in this case only determines whether to speed up or slow down the green light from the direction. For example, if the one in the north, then the input used is only the northern sensor and the southern sensor. Then it is determined whether to extend the time of the green light or not. 4. There is a minimum time for the green light to turn on and a maximum time for the green light to turn on. This constant is obtained from specialists in traffic police cases. If the limit is met, for example, it exceeds the maximum time the green light is on, so the light is no longer green. Test results from the Sala Benda crossing and the Semplak intersection are at the Sala Benda crossing to widen the road at the intersection and at the Semplak junction it is necessary to adjust the green time of the number of vehicles. from the two intersections of SalaBenda and Semplak that produce different values. The test results can be seen in Table 4.3 below.

International Journal of Innovation, Creativity and Change. www.ijicc.net Volume 8, Issue 7, 2019
132
Table 3: Results of the SalaBenda and Semplak intersection study
No Crossing Location
Average Vehicle
Average Green Time
Standard Green Time value
1 Sala Benda 36,81 32,67 6 2 Semplak 61,74 57,44 6
Summary and Conclusion Based on the results of the research and discussion on the implementation of optimising traffic lights can be concluded by implementing the TC traffic light optimisation system by entering the number of vehicles in each direction, and having two inputs that will be implemented into the Fuzzy logic of the number of vehicles and road widths, and then taken from the intersection means that the system not only considers the number of vehicles on each road but also considers the road width and output in terms of the maximum duration of the green light on the specified path and that the driver behaves positively. 1. Average green time on SalaBenda first street is 25.76%, second road is 27.03% and third
street is 13.7%. For the first intersection is 43.47%, second road is 45.07%, third road is 22.96 and fourth is 20.67%. The highest delays were at the intersection of 43.47% and the lowest at Sala 25.76%
2. From the TC test results, testers drop 30% more cars than conventional controllers. Also, the average wait time is 5% shorter than conventional controllers. Compared to AI (Artificial), it was found that Fuzzy controllers jump over 14% of cars and wait times are 14%. This means that traffic control systems with TC systems are much better than conventional methods and with comparable AI or need to change lanes when using AI
3. From the results of the comprehensive analysis it is shown that the intersection of the Sala Objects is necessary to implement the dynamic trajectory system. In this case the change is made by changing the shape of the intersection at the Sala Benda intersection.
4. An alternative solution to congestion problems is the use of dynamic system traffic intersection, a traffic control system used to control traffic flow at intersections.
5. Also, the main advantage of this TC system is its flexibility. It can be seen that all inputs using Fuzzy logic are very flexible, adjustable according to the regional traffic environment and its own opinion of the environment.
6. Fuzzy logic is also simple and easy to implement because "fuzzy" has the same language as humans. This is where the authors conclude that TC systems with Fuzzy logic are a great new way of solving the traffic behaviour with the best output traffic lights.

International Journal of Innovation, Creativity and Change. www.ijicc.net Volume 8, Issue 7, 2019
133
REFERENCES [1] Dr. Bhavin Pate, Dr. Pravin Bhathawala.Queuing Theory Applied To Traffic Lights In
Ahmedabad. ASIO Journal of Chemistry, Physics, Mathematics & Applied Sciences (ASIO-JCPMAS) Volume 1, Issue 1, 2016, 04-08. lists available at http://www.albertscience.com
[2] Roy K and Hlynka M. Queuing Theory Applied to a Traffic Light Problem, WMSR #95-14 August, 1995.
[3] Nicholas B.Taylor, Benjamin G. Heydecker. The effect of green time on stochastic queues at traffic signals. Pages 3-19 | Received 10 Mar 2013, Accepted 25 Jul 2013, Published online: 18 Oct 2013. Journal Transportation Planning and Technology Volume 37, 2014 - Issue 1: Universities' Transport Study Group UK Annual Conference 2013
[4] Kendall, D. G. 1951. “Some Problems in the Theory of Queues.” Journal of Royal Statistical Society B (Methodological) 13(2): 151–183.[Web of Science ®], , [Google Scholar]
[5] Chhaya Aher, Shakil Shaikh.Adaptive Traffic Control and Traffic Density Monitoring System using an Image Processing. International Journal of Advanced Research in Electrical,Electronics and Instrumentation Engineering. Vol. 4, Issue 11, November 2015. (references)
[6] Ms.Pallavi Choudekar, Ms. Sayanti Banerjee, Prof .M.K.Muju from Ajay Kumar Garg "Real Time Traffic Light Control Using Image Processing" 978-1-4244-8679-3/11/$26.00 ©2011 IEEE.
[7] Ms.Pallavi Choudekar,Ms. Sayanti Banerjee,Prof .M.K.Muju. Implementation of Image Processing in Real Time Traffic Light Control. 978-1-4244-8679-3/11/$26.00 ©2011 IEEE.
[8] Umar Farooq, Hafiz Muhammad Atiq, Muhammad Usman Asad, Asim Iqbal, Zeeshan Azmat .Design and Development of an Image Processing Based Adaptive Traffic Control System with GSM Interface. 2009 Second International Conference on Machine Vision.
[9] Direktorat Jenderal Bina Marga. Manual Kapasitas Jalan Indonesia (MKJI)/Indonesian Highways Capacity Manual (IHCM). Jakarta,Indonesia.
[10] Rahishet,Aparajita Sahoo, Aparna Indore, Vaibhavdeshmukh, Puspha U S. Intelligent Traffic control Light Control Using Image Processing. Proceedings of 21st IRF International Conference, 8thMarch 2015, Pune, India, ISBN: 978-93-82702-75-7.
[5] Jaywant Kamble, Pratik Kothawade, Abhijeet Kumbhar, Prof. Rajani P.K.. Traffic Control System Using Image Processing. International Journal of Emerging Trends in Electrical and Electronics (IJETEE – ISSN: 2320-9569) Vol. 3, Issue. 3, May-2013.
[6] Chhaya Aher, Shakil Shaikh. Adaptive Traffic Control and Traffic Density Monitoring System using an Image Processing. International Journal of Advanced Research in
International Journal of Innovation, Creativity and Change. www.ijicc.net Volume 8, Issue 7, 2019
134
Electrical, Electronics and Instrumentation Engineering (An ISO 3297: 2007 Certified Organization) Vol. 4, Issue 11, November 2015.
[7] Rahishet, Aparajita Sahoo, Aparna Indore, Vaibhavdeshmukh, Puspha U S. Intelligent Traffic Light Control Using Image Processing. Proceedings of 21st IRF International Conference, 8thMarch 2015, Pune, India, ISBN: 978-93-82702-75-7.
[8] V. Parthasarathi, M. Surya, B. Akshay, K. Murali Siva and Shriram K. Vasudevan. Smart Control of Traffic Signal System using Image Processing. Indian Journal of Science and Technology, Vol 8(16), 64622, July 2015 ISSN (Online) : 0974-5645.
[9] Cai Yingfeng ,Zhang Weigong,Wang Hai. Measurement of Vehicle Queue Length Based on Video Processing in Intelligent Traffic Signal Control System. 2010 International Conference on Measuring Technology and Mechatronics Automation 978-0-7695-3962-1/10 $26.00 © 2010 IEEE.