7 Charting Tools for Spread Betting - Harriman House
39
1 xxxxxxxxxxxxxxxx
-
Upload
khangminh22 -
Category
Documents
-
view
0 -
download
0
Transcript of 7 Charting Tools for Spread Betting - Harriman House

1
xxxxxxxxxxxxxxxx

• • • • Sample • • • •

7 Charting Tools for Spread Betting
A practical guide to making money from spread betting withtechnical analysis
by Malcolm Pryor

HARRIMAN HOUSE LTD
3A Penns Road
Petersfield
Hampshire
GU32 2EW
GREAT BRITAIN
Tel: +44 (0)1730 233870
Fax: +44 (0)1730 233880
Email: [email protected]
Website: www.harriman-house.com
First published in Great Britain in 2009 by Harriman House.
Copyright © Harriman House Ltd
The right of Malcolm Pryor to be identified as the author has been asserted
in accordance with the Copyright, Design and Patents Act 1988.
978-1-905641-84-0
British Library Cataloguing in Publication DataA CIP catalogue record for this book can be obtained from the British Library.
All rights reserved; no part of this publication may be reproduced, stored in a retrieval
system, or transmitted in any form or by any means, electronic, mechanical,
photocopying, recording, or otherwise without the prior written permission of the
Publisher. This book may not be lent, resold, hired out or otherwise disposed of by
way of trade in any form of binding or cover other than that in which it is published
without the prior written consent of the Publisher.
Printed in the UK by CPI William Clowes, Beccles NR34 7TL
No responsibility for loss occasioned to any person or corporate body acting or
refraining to act as a result of reading material in this book can be accepted by the
Publisher, by the Author, or by the employer of the Author.
Designated trademarks and brands are the property of their respective owners.

For Karen


Contents
About the author viiPreface ixAcknowledgements xiRisk warning xiii
Introduction 1
The Seven Tools 7
Tool 1 – ATR 9 Tool 2 – Directional Movement 23 Tool 3 – Moving Averages 37 Tool 4 – Support and Resistance 51 Tool 5 – Oscillators 69 Tool 6 – Relative Strength 85 Tool 7 – Momentum 97
Case Studies 111
Appendices 137
Further Notes on ATR, ADX and Moving Averages 139 Resources 143
Index 147
v


About the author
Malcolm Pryor is an active spread bettor and investor, a trading coach, and the author of twoprevious books on spread betting, The Financial Spread Betting Handbook and WinningSpread Betting Strategies. He is also the author and presenter of the DVD Malcolm Pryor onShort Term Spread Betting.
He comments regularly on spread betting issues and on the markets atwww.spreadbettingcentral.co.uk, and runs training seminars on spread betting (details atwww.sparkdales.co.uk).
He is a member of the Society of Technical Analysts in the UK and has been designated aCertified Financial Technician by the International Federation of Technical Analysts.
He is an expert at several games, including bridge where he has held the rank of Grandmasteror higher for over a decade.
vii

Preface
What this book coversIn this book I explain seven technical analysis tools which can really make a difference tospread betting performance. The seven tools covered are:
1. ATR
2. Directional movement
3. Moving averages
4. Support and resistance
5. Oscillators
6. Relative strength
7. Momentum
The focus is on practical use rather than academic theory. So I show how each tool can helpimprove performance and how to use it to best effect. There are many charts in this bookillustrating each tool. Each tool has its own individual role to play in the trader’smethodology, either on its own or in combination with some of the other tools.
Who this book is forThe book is for people with any level of technical analysis skills, from virtual beginners toadvanced users. The beginner may want to supplement their reading by reading various freeonline resources referred to in the text. All readers are also referred to further research by wayof a recommended reading list.
Although the book is primarily for spread bettors it is not necessary for the reader to haveany previous spread betting experience, the concepts discussed are of potential interest to alltraders.
The focus of the book is mostly on daily charts, and as such will be of interest to traderswhose trades last from a couple of days to say 30 days. However the tools can be applied toall time frames. So the day trader can use the basic principles on, say, a 10 minute chart, whilethe longer-term investor can use the basic principles on weekly charts.
How this book is structuredAfter this preface there is a short introduction – the main purpose of which is to explain thereasons for writing this book.
ix

Then we get to the heart of the book. Each of the seven charting tools is explained in aseparate chapter, all of which have the same structure:
1. Background and construction. Each chapter starts with a brief introduction, followed
by a first look at the tool in action, illustrated most of the time with an annotated
chart of the FTSE 100. This leads on to a detailed look at how the tool in constructed.
In a number of cases the more complicated arithmetic can be found in the Appendices.
2. Overview of tool. In this section we look at the main purpose of the tool, its strengths
and its weaknesses.
3. Settings. For each tool where the user has a choice of settings we look at both the
standard settings and the ones used in this book.
4. How to use this tool. This section focuses on how the tool is used in this book.
5. Example. Each chapter contains a detailed worked example of the tool in action.
6. Alternatives. In some cases the user can get similar benefits from other tools, which
are discussed here.
7. Conclusion. Each chapter finishes with a very brief final comment on the tool.
Following this there is a chapter on how the tools can be combined to build, or complement,a trading methodology.
Finally, the Appendix lists books and internet resources that I recommend as useful for spreadbettors, and also provides further notes on the detailed calculations of the indicators.
x
7 Charting Tools for Spread Betting

Acknowledgements
I have many people to thank for providing support advice and encouragement while writingthis book. I shall not be able to name them all – but many thanks everyone!
I would like to thank Harriman House for their help in publishing this book; a really greatteam. In particular, Stephen Eckett, who provides unique editorial wisdom with a light touch.
I would like to take this opportunity to thank Martin Stamp, the creator of the ShareScopesoftware, and the entire ShareScope team, both for creating the software and for allowing meto reproduce charts from it in this book.
I would like to thank Dr Van Tharp, friend and mentor.
I would like to thank my parents, Maurice, who passed away in 2008, and Marjorie.
And most of all I would like to thank Karen, to whom this book is dedicated.
xi


Risk warning
No responsibility for loss incurred by any person or corporate body acting or refraining to actas a result of reading material in this book can be accepted by the Publisher or the Author.
The information provided by the Author is not offered as, nor should it be inferred to be,advice or recommendation to readers, since the financial circumstances of readers will varygreatly and investment or trading behaviour which may be appropriate for one reader isunlikely to be appropriate for others.
xiii


INTRODUCTION


Introduction
Spread betting using a structured approach
My first book looked at the differences between people who win at spread betting andthose that don’t. One of the big differences is that the winners use a structured
approach. They plan their trades and use systems and techniques that in the long run givethem an edge. They also keep their bet size at a level which will give their longer-term edgea chance to play out while still keeping them in the game during the inevitable shorter-termvolatility.
In the winner’s enclosure you find a surprisingly large number of diverse approaches. Somepeople perform detailed analysis of company results, poring over balance sheets, profit andloss statements, cash flow schedules and the like. Others have expertise in strategic planning,marketing and sales, and can spot a company that seems to be going places. Others havecorporate finance skills and try to make money by guessing the next takeover target.
The technical analysis community believe that the study of price action alone can provide anedge – that certain patterns of price movement have predictive value which can be exploited.
In my view technical analysis is ideally suited for spread betting, where one can bet on short-term price movements with leverage, and where part of the game is identifying logical placesto enter and exit a bet.
Which technical analysis tools to select?
The difficulty facing many spread bettors is that there is a vast array of technical analysistools available, many of which are now easily accessible either via the spread betting firmsthemselves or through third party trading and investment software, including many freeonline services. For most spread bettors the process of selecting which technical analysis toolsto use is largely a matter of trial and (expensive) error.
So many parameters…
Even after selecting potentially useful tools, the spread bettor is then faced with a multitudeof choices about which parameters to use on the selected tools. Once again this often involvesfurther research, time and money.
The reason for this book
I like to focus on a relatively small number of technical analysis tools which I have learnthow to use in a way that helps me. I get so many questions on this that I thought it mighthelp others if I documented how I use various tools. This book is about the technical analysistools which I believe give me an edge and the parameters I use for them.
3

Background informationBefore we start I want to talk briefly about:
• charting software, and
• technical analysis concepts.
1. Charting software
This book uses ShareScope software to illustrate the tools we look at. I have used the softwarefor many years and all my books have featured it. I like it.
If you don’t have ShareScope you will find that you can get access to many of the tools inthis book through free sites on the internet. I personally don’t find this route as convenient(and so I am prepared to pay both for the convenience and for the full functionality of theShareScope software), but the free sites may work for you. Try the following:
www.uk.finance.yahoo.com
www.money.uk.msn.com
www.advfn.com
www.digitallook.com
Alternative suppliers of software you have to pay for include:
www.equis.com (Metastock)
www.esignal.com
www.simplychart.com
www.trackdata.com
This is far from an exhaustive list. If you search the internet for investment software ortrading software you will find more suppliers.
The spread betting firms themselves also supply technical analysis functionality, but thequality varies quite a bit, and often the data is based on the firms’ own prices rather than theunderlying market.
2. Technical analysis concepts
I have written this book so that it can be read both by people with very little prior knowledgeof technical analysis and by seasoned technical analysis practitioners. I try to explain thevarious concepts in each chapter but there are one or two which deserve a comment up front.
4
7 Charting Tools for Spread Betting

User defined
You will come across the expression “user defined” quite a bit in the text. For example, in“user defined number of periods”. What this means is that typically there are a number ofdifferent settings which traders favour when using the tool, and that typically the softwareallows the user of the software to alter these parameters according to preference.
Take for instance the indicator RSI which we will be having a look at: the standard settingfor this indicator is 14 days, but you should be able to change this on your software toanother number.
What number?
Well, that’s for later…
Fractals
A nice name for quite a simple phenomenon. A three bar pattern, which comprises either:
• a bar with a low that is lower than the bar on either side of it, or
• a bar with a high that is higher than the bar on either side of it.
In the first case that low represents the point at which the bears were no longer able to pushprices lower, and if price comes back to that point again, maybe they will fail to push priceslower again.
In the second case that high represents the point at which the bulls were no longer able topush prices higher, and if price comes back to that point again, maybe they will fail again atthat point to push prices higher.
I explain this some more in the text, but I mention it up front because for me it is one of themost powerful trading concepts I know.
In the literature these points are often named differently (e.g. pivot points) but I like fractal.
Further research
Various online resources are recommended if you want to research the topics in this bookfurther and an extensive reading list is in the Appendix.
There is a great site, www.stockcharts.com, which has a good, free instructional area.
And you can consult with the user community of www.spreadbettingcentral.co.uk by postingon the forum there.
5
Introduction


THE SEVEN TOOLS


TOOL 1: ATR


Background and construction
ATR is one of a number of indicators which measure volatility. Volatility can be describedas a measure of the state of instability. In trading, volatility is a measure of the instability
of the price of a financial instrument. Traders need some volatility in the financialinstruments they trade, for without it there would be no price movement to take advantageof. Having a tool to measure volatility allows the trader to adapt to varying volatility, forinstance by having wider stops when volatility increases and tighter stops when volatilitydecreases.
ATR is short for Average True Range, a concept described by Welles Wilder in his ground-breaking book New Concepts in Technical Trading Systems.
Here is a chart of the FTSE 100, with ATR added. It is a great example of high volatility, inthis case associated with uncertainty as the market direction changed from down to up,moving to lower volatility, as the new trend up became more established. (You can see myinterpretation of this transition in the notes I have put on to the chart.)
ATR – FTSE 100
11
Market in volatiledowntrend, withaverage true rangewell over 100
Market still volatileas trend turns fromdown to up, withaverage true rangestill over 100
As traders become more confidentin the new up trend, volatilitybegins to fall, with average truerange falling steadily
Average true range isnow around 75,compared with 135 atone point in January

Here is a much simplified example of calculating the average range over the last 10 days ofthe period covered by this chart.
Total of differences = 627, divided by 10 = 63.
Actually the calculation is more complicated than this, for two main reasons:
1. Adjustments are made for gaps. A gap occurs if for instance the low of today is higher
than the high of yesterday. In this case the size of the gap is also factored in to the
calculation. The adjusted figure is called the “true range”.
2. To get the average true range from a set of true ranges is not just a matter of adding
them all up and dividing by the number in the set, there is a unique averaging process
which takes the previous average true range and then adjusts it based on the most
recent true range.
The average true range for the last day in the chart was actually 71, rather than the 63produced by our simple calculation of the differences between the highs and the lows.
That’s probably as far as many readers will want to go on the arithmetic front, but for thosethat are interested there is some more detail in the Appendix.
12
7 Charting Tools for Spread Betting
High Low Difference
4859 4737 122
4911 4869 42
4923 4864 59
4927 4872 55
4906 4855 51
4944 4891 53
4921 4820 101
4822 4777 45
4842 4789 53
4874 4828 46
Total: 627

Overview of toolUnlike some tools which measure volatility the concepts behind ATR are fairly easy tounderstand. In essence, if the range of price movement within each period increases then ATRwill increase, if the range of price movement within each period decreases, then ATR willdecrease. Over time the volatility of each instrument thus measured will vary.
One benefit of this particular tool is that it provides an objective measure of current volatilityfor an instrument which can be compared to volatility for the same instrument in otherperiods. In addition, by dividing the volatility measure by the price of the instrument it is alsopossible to compare volatility across instruments.
When using ATR we have to decide how many periods to include in the averaging process.Do we want the average of the true range of 5 periods, or of 10 periods or of 14 periods, etc?Most, though not all, trading software packages let the user choose the number of periods.
The strengths of ATR as a volatility measuring tool are:
• simplicity of concept
• objectivity of measurement
• ease of use
• easily programmed and therefore available in most investment/trading software
• applicable on all time frames
• well established and accepted as an analysis tool
A minor weakness of ATR is that because it takes an average over a number of periods, incommon with all moving averages it is a lagging indicator. However, this tends not to be aproblem in practice, particularly if the user takes care not to select too large a number ofperiods.
SettingsPartly based on Welles Wilder’s book, a commonly used setting for ATR is 14 periods. Otherfavoured settings include 20 periods, 10 periods and 5 periods. I tend to use a 10 period settingon a daily chart, not only for trades which last from days to weeks but also for day trades.For day trading I like to look at the 10 day ATR, and then use some percentage of it, ratherthan using for instance the 10 period ATR of a ten minute chart, which is an alternative andperfectly valid approach.
13
Tool 1 – ATR

How to use this toolThis tool can help spread bettors as ATR works on two key trading concepts:
1. where to place stops, and
2. how much to bet on a specific trade.
1. Placing stops
There are many techniques to assist stop placement. Here are a selection of places that traderslike to put stops:
• below support if long or above resistance if short
• below a moving average if long, or above it if short
• below the low of the last X periods if long, or above the high of the last X periods if
short
• using specialist techniques such as Welles Wilders Parabolic
If using ATR for stop placement, the technique is this:
• if long the stop goes a multiple of ATR below a selected point in the last period
• if short the stop goes a multiple of ATR above a selected point in the last period
There are two obvious questions to raise here, and one less obvious one.
First of all, which point in the last period should be chosen?
There are at least three options:
1. the close of the last period
2. the high of the last period (for shorts) or the low of the last period (for longs)
3. the typical price of the last period (typical price is calculated as the average of the
high the low and the close)
Secondly, what multiple of ATR should be used?
Here there is no simple one-fits-all solution; it will depend on the length of trades beingconsidered, which point in the last period is selected, the type of system, user preferences and
14
7 Charting Tools for Spread Betting

the risk profile and objectives of the trader. Here are some options to consider, all based on a10 day ATR:
• trades expected to last up to an hour: 0.1 to 0.2 ATR.
• trades expected to last up to a day: 0.2 to 0.5 ATR
• trades expected to last a few days: 0.5 to 1.25 ATR
• trades expected to last a few weeks: 1.25 to 2.0 ATR
• trades expected to last several months at least: 2.0 to 3.5 ATR
Some additional comments need to be made on these options:
1. Stops on trades lasting a few weeks should not be so close to the price that they get
hit by normal daily price movement up and down. By definition this daily price
movement up and down will average 1 ATR. So for such trades a stop say 1.0 ATR
from the close or the typical price is likely to be too close.
2. For a trade lasting a few days the target is usually one move in the right direction
with little retracement, so a tight stop (less than 1.0 ATR) can work.
3. When using ATR for stop placement on a day trade it is common to use the entry
price as the start point for the calculation.
4. Different ATR figures can be used during the lifetime of a trade; initially quite wide
stops can be used, then as the trade comes to its conclusion much closer stops can be
used. For instance, on a trade lasting several months the initial stop might be 3.0
ATR from the close, giving the trade room to develop; but then after a large profit
has already been obtained the trader might move the stop to say 1.25 ATR away, still
allowing the trade to continue if more profit is available, but giving up less profit if
the trend reverses.
5. Stop placement should be reviewed on a regular basis – if the trader finds for instance
that trades have been getting stopped out too quickly, then a larger ATR multiple
should be considered.
15
Tool 1 – ATR

6. It is a good idea to use ATR to compare risk to reward – for instance on a trade lasting
about a day one might be aiming to capture a 0.5 ATR move with 0.25 ATR risk; or
with a trade lasting a few weeks, a 2.5 ATR move with a 1.25 ATR risk. With many
successful systems the target reward is at least double the risk.
Thirdly – and this is the less obvious point – the trader has to make a decision whether tomove the stop once the trade moves favourably. There are two main techniques here:
1. The initial stop is left at its original spot and if the stop has not been hit the trader
picks from a range of exit techniques at the appropriate point in time, for example
exiting at a target, exiting at support or resistance, exiting after a certain period of
time, to quote just three.
2. The stop is moved during the life of the trade – this is known as a trailing stop. The
key technique here is never to move a stop further away from price than it was
previously; the stop can only be moved in the direction of the intended trade (i.e up
if long, down if short). Each time the stop is moved risk is reduced and, once in profit,
more and more of the profit is locked in.
2. Determining bet size
Bet size should be a function of two variables:
1. the distance from the entry point and the initial stop,
2. the percentage of speculative funds the trader wishes to risk on the bet.
We have already seen how the trader can use ATR to determine initial stop placement.
The percentage of speculative funds to be risked on any given bet should be predetermined,taking into account the objectives and risk preferences of the trader, and the profile of thesystem being used. I have commented in my earlier book, The Financial Spread BettingHandbook, on the tendency of spread bettors to risk significantly too high a percentage oftheir speculative funds on each trade, and this is a common cause of account closure. A wellknown quote from a US trader suggests that any trader who risks 3% (or more) per trade is“gunslinging”.
16
7 Charting Tools for Spread Betting

With these two variables determined, bet size should be calculated automatically. Forexample:
A skilled spread bettor should know this methodology inside out.
ExampleWe are going to look now at a setup for a short trade in First Group.
ATR charts
Each of the following three charts shows six months of daily price data ending on 10 February2009. The first chart includes a 5 day ATR, the second chart a 10 day ATR and the third charta 14 day ATR.
17
Tool 1 – ATR
Variable Value
Entry 100
Stop 90
Distance from the entry point andthe initial stop
10
Speculative funds £4000
Predetermined risk per spread bet 1% (i.e. £40)
Bet size £4 per point (£40 divided by 10)

18
7 Charting Tools for Spread Betting
11/8/08 10/2/09'09Sep Oct Nov Dec Feb
FirstGroup PLCPence 1 day bars Ord
650 650
600 600
550 550
500 500
450 450
400 400
350 350
300 300
40 4035 3530 3025 2520 20
18 26 8 15 22 29 13 20 27 10 17 24 8 15 22 29 12 19 26
5 Avg. True Range (Daily)
ScopeShareChart (c) www.sharescope.co.uk
11/8/08 10/2/09'09Sep Oct Nov Dec Feb
FirstGroup PLCPence 1 day bars Ord
650 650
600 600
550 550
500 500
450 450
400 400
350 350
300 300
36 36
32 32
28 28
24 24
20 20
18 26 8 15 22 29 13 20 27 10 17 24 8 15 22 29 12 19 26
10 Avg. True Range (Daily)
ScopeShareChart (c) www.sharescope.co.uk
First Group – with 5 Day ATR
First Group – with 10 Day ATR

First of all note the difference in range of each ATR indicator across the six months:
• 5 day ATR range: 16.2 to 42.5
• 10 day ATR range: 18.3 to 37.5
• 14 day ATR range: 19.2 to 35.5
The smaller the ATR range the wider the fluctuations in its value since it is more sensitive todaily changes in volatility.
Note however that the three ranges are not very different.
Note finally that across the six months the difference within each range between the lowestand the highest value is wide; with both the 5 and the 10 ATR the highest value is more thandouble the lowest value, with the 14 day ATR it is not far off double. It makes sense to adjustone’s bet size and stop placement to reflect this, so that in times of greatest volatility stopsare further away, and bet size is correspondingly smaller.
The trade
Moving on to the short trade, this was a classic pullback setup. Visual inspection shows thestock had been in a powerful downtrend for several months. Over the last five days on thechart the stock had retraced some of that downtrend, with a series of higher highs each day.
19
Tool 1 – ATR
11/8/08 10/2/09'09Sep Oct Nov Dec Feb
FirstGroup PLCPence 1 day bars Ord
650 650
600 600
550 550
500 500
450 450
400 400
350 350
300 300
36 36
32 32
28 28
24 24
20 20
18 26 8 15 22 29 13 20 27 10 17 24 8 15 22 29 12 19 26
14 Avg. True Range (Daily)
ScopeShareChart (c) www.sharescope.co.uk
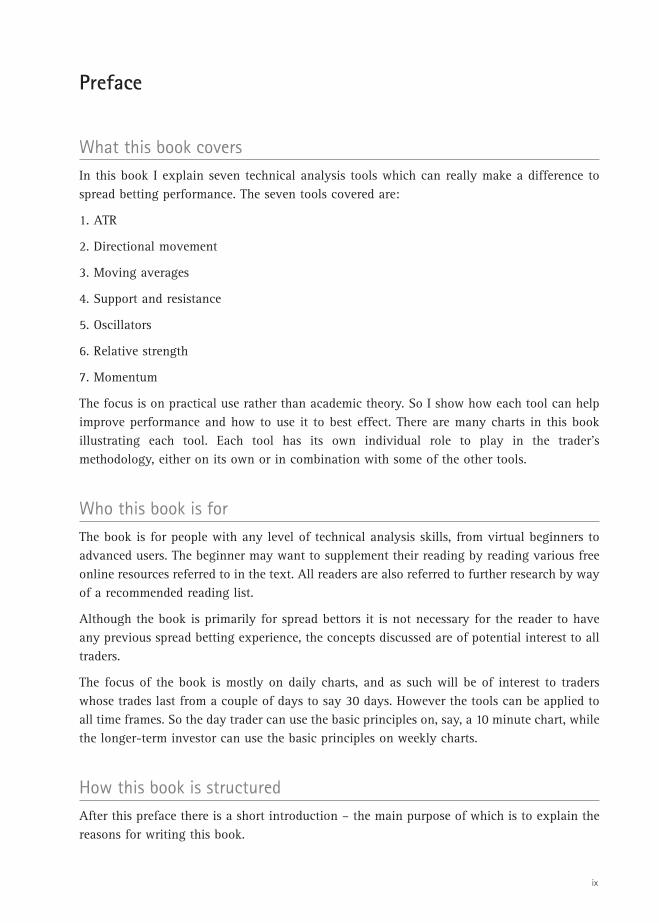
First Group – with 14 Day ATR

At this stage the trader was looking for a sign that the downtrend was reasserting itself, totrigger the short trade. One such trigger was if the stock moved below the low of the previousday.
The low of 10 February 2009 was 288.25, so on this occasion the trader went short when onthe next day the price hit 288.0.
This was a short-term trade expected to last just a few days and the initial target was to ridethe price down to the most recent low. The trader decided to use an ATR stop, and given thetime frame and objectives of the trade selected a stop of 1 ATR from the entry price. The traderdecided not to trail the stop until the initial target was hit.
The trader had £20,000 speculative funds dedicated to spread betting and consistently risked1% of those funds on each trade (i.e. £200).
Let us now see how the 1 ATR stop should have been implemented with each value of ATR,and the impact that had on bet size.
5 day ATR
With the 5 day ATR, 1 ATR (at the time the trade was made) was 17.0, so the stop should havebeen at 305.0 (288 + 17). The trader should have bet £12 per point, which means if the stophad been hit the loss would have been (305 – 288) times 12 (i.e. £204, in line with thepredetermined risk per trade).
10 day ATR
With the 10 day ATR, 1 ATR was 18.3 (price for this stock moved in 0.25p increments, so thiswas rounded up to 18.5). So the stop should have been at 306.5 (288 + 18.5). The tradershould have bet £11 per point, which means if the stop had been hit the loss would have been(306.5 – 288) times 11 (i.e. £203.50), again in line with the predetermined risk per trade.
14 day ATR
With the 14 day ATR, 1 ATR was 19.2, which was rounded up to 19.25. So the stop shouldhave been at 307.25 (288 + 19.25). The trader should have bet £10 per point, which means ifthe stop had been hit the loss would have been (307.25 – 288) times 10 (i.e. £192.50). Sometraders might take a view that they would have been comfortable with £11 per point, givinga loss of £211.75 if the stop was hit. For me personally that would be a little too much overthe £200 predetermined risk per trade.
20
7 Charting Tools for Spread Betting
At some point in the future, the spread betting firms will allow fractions of a pound perpoint for bets, and then we will be able to risk exactly the amount we want to risk pertrade.

Summary of trade calculation for different ATRs
So stop placement and bet size will vary slightly depending on which (period) parameter forATR is used, but not hugely. I am happy to use the 10 period ATR all the time.
Stop placement – reality check
One final point. One should always do a reality check on where that ATR stop will be. Witheach ATR value selected above, the stop was above the highest point of the retracement,which was 303p. So that is realistic and consistent with the basic idea behind the trade. If theATR stop was hit this would also mean that the high of the retracement had been exceeded,which in turn would be a warning sign that perhaps the retracement was not yet over, or eventhat the downtrend itself was stopping.
For those that want to know the end of the story: the trade was a success, but took longerthan originally anticipated. The previous low of the move was hit on the 15th day of the trade,at which point the trader had to make a decision whether to exit the trade, or to move thestop much closer to the latest price.
Alternatives If you like the idea of ATR, but your software package doesn’t have it, here is a simple workaround to get a proxy figure. It’s not perfect, but workable.
To get a rough equivalent of the 5 period ATR, just calculate the difference between the highand the low for each of the last 5 periods, and average the differences. For the 10 period ATRdo a similar calculation for the last 10 periods. You will recall that is exactly what we did
21
Tool 1 – ATR
5 day ATR 10 day ATR 14 day ATR
Trade entry price 288 288 288
ATR (at trade entry) 17.0 18.5 19.25
Stop 305 (208+17) 306.5 (288+18.5) 307.25 (288+19.25)
Bet size (£ per point) 12 11 10
Potential loss (£) 204 (12 x 17) 203.5 (11 x 18.5) £192.5 (10 x 19.25)

earlier in this chapter for the last ten days of the FTSE 100 chart we looked at. If you havespreadsheet facilities on your computer it should be a simple task to build a spreadsheet todo the calculations for you; all you will need to do then is input the highs and the lows foreach period.
ConclusionATR is:
1. simple and easy to use,
2. can help with stop placement and bet size determination.
22
7 Charting Tools for Spread Betting

7 Charting Tools forSpread Betting
A practical guide to making money from spreadbetting with technical analysis
Malcolm Pryor
www.harriman-house.com/chartingtoolsforspreadbetting
Paperback: 9781905641840eBook: 9781906659806
Available direct from Harriman House and all good booksellers. To ordera copy of the print or ebook edition go to: