
60250100 SITA EIS Cover A4V - Volume 2.cdr - Major Projects
332
-
Upload
khangminh22 -
Category
Documents
-
view
2 -
download
0
Transcript of 60250100 SITA EIS Cover A4V - Volume 2.cdr - Major Projects


GO\,ÊFìü,CNT
Contact: Christine ChapmanPhone: (02)92286537Fax: (02)92286466Email:
Mr EmmanuelVivantSITA Australia Pty Ltd70 Anzac StreetCHULLORA NSW 2190
Dear Mr Vivant,
State Significant Development - Director-General's RequirementsSITA Kemps Greek AWT Facility Expansion Project, Elizabeth Drive, Kemps Greek (SSD-5275)
I have attached a copy of the Director-General's environnÍental assessment requirements (DGRs) for thepreparation of an Environmental lmpact Statement (ElS) for the SITA Kemps Creek AWT Facility ExpansionProject.
Theses requirements are based on the information you have provided to date and have been prepared inconsultation with relevant government agencies and Penrith City Council. Their comments, which you shouldaddress appropriately in preparing the EIS are also attached (see Attachment 2). Please note that theDepartment may alter these requirements at any time, and that ¡¿ou must consult further with the Department ifyou do not lodge a development application and EIS for the project within two years of the date of issue of theseDGRs. The Department will review the EIS for the project carefully before putting it on public exhibition, and willrequire you to submit an amended EIS if it does not adequately address the DGRs.
I wish to emphasise the importance of effective and genuine community consultation and the need for proposalsto proactively respond to the community's concerns. Accordingly a comprehensive, detailed and genuinecommunity consultation and engagement process must be undertaken during preparation of the ElS. Thisprocess must ensure that the community, including key special interest, is both informed of the proposal and isactively engaged in issues of concern to them. Sufficient information must be provided to the community so that ithas a good understanding of what is being proposed and of the potential impacts.
Your project may require separate approval under the Environment Protection and Biodiversity Conservation Actf 999 (EPBC Act). The Department encourages you to confirm whether such an approval will be required as soonas possible. lf an EPBC Act approval is required, I would appreciate it if you would advise the Departmentaccordingly, as the Commonwealth approval process may be integrated into the NSW approval process, andsupplementary DGRs may need to be issued.
I would appreciate it if you would contact the Department at least two weeks before you propose to submit thedevelopment application and EIS for your project. This will enable the Department to:o confirm the applicable fee (see Division 1AA, Part 15 of the Environmental Planning and Assessmenf
Regulation 2000); ando determine the number of copies (hard-copy and CD-ROM) of the EIS required for review.
lf you have enquiries about these requirements, please contact Christine Chapman on g22B 6537 or
16, €. tl
Executive DirectorMajor Project AssessmentsAs deleoate for the Director-General

2
Director General’s Environmental Assessment Requirements Section 78A(8A) of the Environmental Planning and Assessment Act 1979 State Significant Development
Application Number SSD 5275
Development The SITA Kemps Creek AWT Facility Expansion Project includes: • an increase in the processing capacity from 134,400 to 220,000 tpa of waste -
including biosolids, mixed waste and garden waste; • the construction of supporting infrastructure (ie. 27 composting tunnels,
maturation pads, bunded leachate system and additional biofilter capacity); and • an extension of the operating hours.
Location Lot 1, DP 542395 and Lot 740, DP 810111, Elizabeth Drive, Kemps Creek, Penrith local government area
Proponent SITA Australia Pty Ltd
Date of Issue May 2012
General Requirements The Environmental Impact Statement (EIS) for the development must meet the form and content requirements in Clauses 6 and 7 of Schedule 2 of the Environmental Planning and Assessment Regulation 2000. In addition, the EIS must include a: • detailed description of the site, and existing and approved operations; • detailed description of the development, including:
− need for the proposed development having particular regard to the aims, objectives, and guidance in the NSW Waste Avoidance and Resource Recovery Strategy 2007, DECC’s Guidelines for Solid Waste Landfills and Composting and Related Organics Processing Facilities;
− alternatives considered; − justification for the proposed development taking into consideration its
location, any environmental impacts of the development, the suitability of the site and whether the development is in the public interest;
− likely staging of the development - including construction, operational stage/s and rehabilitation;
− likely interactions between the development and existing, approved and proposed operations in the vicinity of the site;
− plans of any proposed building works; • consideration of all relevant environmental planning instruments, including
identification and justification of any inconsistencies with these instruments; ie. the aims, objectives, and guidance in the NSW Waste Avoidance and Resource Recovery Strategy 2007, DECC’s Guidelines for Solid Waste Landfills and Composting and Related Organics Processing Facilities;
• risk assessment of the potential environmental impacts of the development, identifying the key issues for further assessment;
• detailed assessment of the key issues specified below, and any other significant issues identified in this risk assessment, which includes: − a description of the existing environment, using sufficient baseline data; − an assessment of the potential impacts of all stages of the development,
including any cumulative impacts, taking into consideration relevant guidelines, policies, plans and statutes; and
− a description of the measures that would be implemented to avoid, minimise and if necessary, offset the potential impacts of the development, including proposals for adaptive management and/or contingency plans to manage any significant risks to the environment; and
• consolidated summary of all the proposed environmental management and monitoring measures, highlighting commitments included in the EIS.

3
Key Issues The EIS must address the following specific issues: • Strategic Landuse Planning – including:
- demonstrate that the proposal is generally consistent with the relevant transport and infrastructure objectives of Metropolitan Plan for Sydney 2036, NSW 2021 and the draft Northwest Subregional Strategy; and
- justify any inconsistencies between the proposed development and these plans.
• Waste Management – including: - identify, classify and quantify the likely waste streams that would be
handled/stored/disposed of at the facility; - describe how this waste would be stored and handled on site, and
transported to and from the site; - describe the AWT technology and outputs, and the quality control measures
that would be implemented; and - detail the potential impacts associated with treating, storing, using and
disposing of this waste and waste products. • Air Quality and Odour – including:
- a quantitative assessment of the potential air quality and odour impacts of the project and the effectiveness of the proposed air quality /odour control measures;
- details of management and monitoring mmeasures for preventing and/or minimising both point and fugitive emissions;
- detailed specifications of the odour scrubbing technology and associated equipment to be installed, including performance, location, height and dimensions;
- details of how potential odour from any runoff (leachate & stormwater) would be mitigated;
- details of how negative pressure would be maintained in the processing buildings (ie. quick shut roller doors etc) to minimise odour emissions and evidence of contingency plans if negative pressure cannot be maintained (ie. roller doors break etc);
- details of any waste that is proposed to be stored outside of a negatively pressured building (including pre-stabilised or stabilised garden waste, food waste, dry recyclables etc); proposed locations for storage of that waste, the quantities of that waste, the period of time that waste is stored outside and any mitigation measures to ensure the waste does not generate dust or odour emissions; and
- details of proposed length of time that the municipal solid waste and the source separated food waste would undergo “maturation” with consideration to odour generation.
• Greenhouse Gas – including: - a quantitative assessment of the potential scope 1, 2 and 3 greenhouse gas
emissions of the project, and a qualitative assessment of the potential impacts of these emissions on the environment; and
- a detailed description of the measure that would be implemented on site to ensure that the project is energy efficient.
• Traffic and Transport –including: - a detailed traffic impact study of the project on the safety and performance of
the surrounding road network; including impact on the nearby intersections; - a description of the measures that would be implemented to upgrade and/or
maintain this network over time; and - detailed plans of the proposed layout of the internal road network and
parking on site in accordance with the relevant Australian standards. • Soil & Water – including:
- a detailed water balance for the project, outlining the measures that would be implemented to minimise the use of water on site;
- wastewater predictions, and the measures that would be implemented to treat, reuse and/or dispose of this water;
- the proposed erosion and sediment controls during construction; - the proposed stormwater management system; and - consideration of the potential salinity, contamination, flooding and acid
sulfate soil impacts of the project.

4
• Noise – including a quantitative assessment of the potential: - construction, operational and transport noise impacts; - offsite road noise impacts; and - details of the proposed management and monitoring measures.
• Hazards – including a Preliminary Hazard Analysis (PHA) of the project, and an assessment of the potential fire risks of the project.
• Visual – including; - an assessment of the potential visual impacts of the project on the amenity of
the surrounding area; and - a detailed description of the measures that would be implemented to minimise
the visual impacts of the project, including the design features, landscaping and measures to minimise the lighting and signage impacts of the project.
• Heritage – including the potential Aboriginal and non-Aboriginal heritage impacts of the project;
• Flora and Fauna – including an assessment of the potential impacts of the project on threatened species and endangered ecological communities; and
• Socio-Economic – including a comprehensive assessment of the economic and social impacts of the project, demonstrating that it would have a net benefit for the community, paying particular attention to the potential impacts of the project on waste minimisation and resource recovery in the region.
Plans and Documents The EIS must include all relevant plans, architectural drawings, diagrams and relevant documentation required under Schedule 1 of the Environmental Planning and Assessment Regulation 2000. These documents should be included as part of the EIS rather than as separate documents.
Consultation During the preparation of the Environmental Impact Statement, you should consult with the relevant local, State or Commonwealth Government authorities, service providers, community groups or affected landowners. In particular you must consult with the: • Commonwealth Department of Sustainability, Environment, Water, Population
and Communities; • Environmental Protection Authority; • Office of Environment and Heritage (including the Heritage Branch); • NSW Office of Water; • NSW Roads and Maritime Service; • Penrith Council; • Liverpool Council; and • the local community and stakeholders. The EIS must describe the consultation process and the issues raised, and identify where the design of the development has been amended in response to these issues. Where amendments have not been made to address an issue, a short explanation should be provided.
Further consultation after 2 years
If you do not lodge an EIS for the development within 2 years of the issue date of these DGRs, you must consult with the Director-General in relation to the requirements for lodgement.
References The assessment of the key issues listed above must take into account relevant guidelines, policies, and plans as identified. While not exhaustive, Attachment 1 contains a list of some of the guidelines, policies, and plans that may be relevant to the environmental assessment of this development.

5
ATTACHMENT 1 Technical and Policy Guidelines
The following guidelines may assist in the preparation of the Environmental Impact Statement. This list is not exhaustive and not all of these guidelines may be relevant to your proposal. Many of these documents can be found on the following websites: http://www.planning.nsw.gov.au, http://www.bookshop.nsw.gov.au, http://www.publications.gov.au
Policies, Guidelines & Plans Aspect Policy /Methodology
Risk Assessment
AS/NZS 4360:2004 Risk Management (Standards Australia) HB 203: 203:2006 Environmental Risk Management – Principles & Process
(Standards Australia)
Waste
Waste Avoidance and Resource Recovery Strategy 2007 (DECC)
Waste Classification Guidelines (DECC) Environmental Guidelines: Assessment Classification and Management of Non-Liquid and Liquid Waste (NSW EPA) Environmental guidelines: Composting and Related Organics Processing Facilities (DEC) Environmental guidelines: Use and Disposal of Biosolid Products (NSW EPA)
Composts, soil conditioners and mulches (Standards Australia, AS 4454) Soil and Water
Australian and New Zealand Guidelines for the Assessment and Management of Contaminated Sites (ANZECC & NHMRC) National Environment Protection (Assessment of Site Contamination) Measure 1999 (NEPC) Draft Guidelines for the Assessment & Management if Groundwater Contamination (DECC) State Environmental Planning Policy No. 55 – Remediation of Land
Soil
Managing Land Contamination – Planning Guidelines SEPP 55 – Remediation of Land (DOP) National Water Quality Management Strategy: Water quality management - an outline of the policies (ANZECC/ARMCANZ) National Water Quality Management Strategy: Policies and principles - a reference document (ANZECC/ARMCANZ) National Water Quality Management Strategy: Implementation guidelines (ANZECC/ARMCANZ) National Water Quality Management Strategy: Australian Guidelines for Fresh and Marine Water Quality (ANZECC/ARMCANZ) National Water Quality Management Strategy: Australian Guidelines for Water Quality Monitoring and Reporting (ANZECC/ARMCANZ) Using the ANZECC Guideline and Water Quality Objectives in NSW (DEC) State Water Management Outcomes Plan NSW Government Water Quality and River Flow Environmental Objectives (DECC) Approved Methods for the Sampling and Analysis of Water Pollutants in NSW (DEC)
Surface Water
Greater Metropolitan Regional Environmental Plan No. 2 – Georges River
6
Catchment Managing Urban Stormwater: Soils & Construction (Landcom) Managing Urban Stormwater: Treatment Techniques (DECC) Managing Urban Stormwater: Source Control (DECC) Technical Guidelines: Bunding & Spill Management (DECC) National Water Quality Management Strategy Guidelines for Groundwater Protection in Australia (ARMCANZ/ANZECC)
NSW State Groundwater Policy Framework Document (DLWC)
NSW State Groundwater Quality Protection Policy (DLWC)
Groundwater
NSW State Groundwater Quantity Management Policy (DLWC) Draft
Guidelines for the Assessment and Management of Groundwater Contamination (DECC)
Air Quality
Protection of the Environment Operations (Clean Air) Regulation 2002 Approved Methods for the Modelling and Assessment of Air Pollutants in NSW (DEC) Approved Methods for the Sampling and Analysis of Air Pollutants in NSW (DEC)
Odour Technical Framework: Assessment and Management of Odour from Stationary Sources in NSW (DEC) Technical Notes: Assessment and Management of Odour from Stationary Sources in NSW (DEC)
Greenhouse Gas
AGO Factors and Methods Workbook (AGO)
Guidelines for Energy Savings Action Plans (DEUS, 2005)
Transport
Guide to Traffic Generating Development (RTA)
Road Design Guide (RTA)
Noise
NSW Industrial Noise Policy (DECC)
Environmental Criteria for Road Traffic Noise (NSW EPA)
Environmental Noise Control Manual (DECC) Hazards
State Environmental Planning Policy No. 33 – Hazardous and Offensive Development Applying SEPP 33 – Hazardous and Offensive Development Application Guidelines (DUAP)
Hazardous Industry Planning Advisory Paper No. 6 – Guidelines for Hazard Analysis
Visual Control of Obtrusive Effects of Outdoor Lighting (Standards Australia, AS 4282) State Environmental Planning Policy No 64 - Advertising and Signage
Heritage
Aboriginal Draft Guidelines for Aboriginal Cultural Heritage Impact Assessment and Community Consultation (DEC) NSW Heritage Manual (NSW Heritage Office & DUAP)
Non- Aboriginal The Burra Charter (The Australia ICOMOS charter for places of cultural significance)
Social & Economic
Draft Economic Evaluation in Environmental Impact Assessment (DOP) Techniques for Effective Social Impact Assessment: A Practical Guide
(Office of Social Policy, NSW Government Social Policy Directorate)

7
ATTACHMENT 2
Agency Submissions


Our Ref: ECM 3465500 Your Ref: S04/00385 Contact: Karl Berzins Telephone: (02) 4732 8078
4th May 2012 NSW Planning & Infrastructure GPO Box39 SYDNEY NSW 2001 ATTENTION: Christine Chapman ,
Kemps Creek SAWT Expansion Project (SSD5275) .
Thank you for consulting with Penrith City Council in regard to a proposed EIS for the expansion of SITA’s existing advanced waste treatment facility at Kemps Creek. The draft Director General’s Environmental Assessment Requirements (DGEARs) that you e-mailed to Council are satisfactory however there are a few issues that Council recommends be added to these requirements. Firstly, it is not clear from the proponent’s application whether the 24 hour operation will result in extended hours of operation on the landfill site. It is suggested that the DGEARs be amended to include the requirement of a full description of the inter-relationship between the operation of the SAWT facility and the landfill/extractive industry operation to the immediate east of the SAWT facility, especially in regard to hours of operation and the movement of trucks/vehicles between the two areas mentioned above. Secondly, the applicant’s statement refers to an increase in operating hours for indoor operations to 24 hours per day, seven days a week. There needs to be information provided as to what activities will occur outside existing and proposed buildings, especially night time activities, including an assessment of the impact of these outdoor activities. Thirdly, the proposed EIS should contain an analysis of how the increased volume of waste processed by the SAWT facility will result in an increased waste stream to the adjoining landfill operation. Such an analysis should provide information as to any changes that may be required to staging or operation of the landfill operation as well as an estimate of the time taken to complete land filling and finalise site rehabilitation. Fourthly, there is no mention of light spillage issues in the proposed EIS. Increasing night time activities on the site has the potential to decrease the amenity of the rural locality through noise and lighting impacts. These aspects need to be addressed. Lastly, the applicant has indicated that they will be seeking to lift the current sunset clause on the development. Council does not support such an initiative in that the proposed land use has the potential to cause a land use conflict with adjoining rural land uses for many years. Such conflict should be minimised and a sunset clause on the development is an important means of minimising impact on the local community.
Should you wish to discuss any aspect of the application, please contact Karl Berzins on 4732 8078. Yours faithfully, Karl Berzins Senior Environmental Planner


SITA Australia Pty Ltd
28 March 2013
Expansion of the Advanced Waste Treatment Facility, Kemps Creek Resource Recovery Precinct Air Quality Impact Assessment
AECOM Expansion of the Advanced Waste Treatment Facility, Kemps Creek Resource Recovery Precinct - Air Quality Impact Assessment
28 March 2013
Expansion of the Advanced Waste Treatment Facility, Kemps Creek Resource Recovery Precinct Air Quality Impact Assessment
Prepared for
SITA Australia Pty Ltd
Prepared by
AECOM Australia Pty Ltd 17 Warabrook Boulevarde, Warabrook NSW 2304, PO Box 73, Hunter Region MC NSW 2310, Australia T +61 2 4911 4900 F +61 2 4911 4999 www.aecom.com ABN 20 093 846 925
28 March 2013
60250100
AECOM in Australia and New Zealand is certified to the latest version of ISO9001 and ISO14001.
© AECOM Australia Pty Ltd (AECOM).All rights reserved.
AECOM has prepared this document for the sole use of the Client and for a specific purpose, each as expressly stated in the document. No other party should rely on this document without the prior written consent of AECOM. AECOM undertakes no duty, nor accepts any responsibility, to any third party who may rely upon or use this document. This document has been prepared based on the Client’s description of its requirements and AECOM’s experience, having regard to assumptions that AECOM can reasonably be expected to make in accordance with sound professional principles. AECOM may also have relied upon information provided by the Client and other third parties to prepare this document, some of which may not have been verified. Subject to the above conditions, this document may be transmitted, reproduced or disseminated only in its entirety.

AECOM Expansion of the Advanced Waste Treatment Facility, Kemps Creek Resource Recovery Precinct - Air Quality Impact Assessment
28 March 2013
Quality Information
Document Expansion of the Advanced Waste Treatment Facility, Kemps Creek Resource Recovery Precinct – Air Quality Impact Assessment
Ref 60250100
Date 28 March 2013
Prepared by Adam Plant and Holly Marlin
Reviewed by David Rollings and Scott Jeffries
Revision History
Revision Revision Date
Details Authorised
Name/Position Signature
A 30-Oct-12 Draft for internal review David Rollings
B 18-Jan-13 Final for Adequacy Review David Rollings
C 23-Apr-2013 Final Dave Rollings

AECOM Expansion of the Advanced Waste Treatment Facility, Kemps Creek Resource Recovery Precinct - Air Quality Impact Assessment
28 March 2013
Table of Contents 1.0 Introduction 1
1.1 Scope of the Assessment 1 2.0 Development Description 3
2.1 Development Location 3 2.2 Existing Operations 3 2.3 Proposed Development 3
2.3.1 Construction 3 2.3.2 Operation 4
3.0 Pollutants of Interest and Assessment Criteria 7 3.1 Pollutants of Interest and Potential Sources 7
3.1.1 Odour 7 3.1.2 Particulate Matter 7
3.2 Assessment Criteria 7 3.2.1 Odour 8 3.2.2 Particulates 8
4.0 Existing Air Quality 9 4.1 Ambient Air Quality 9
4.1.1 Odour 9 4.1.2 Particulates 10
4.2 Regional Climate 15 5.0 Methodology 17
5.1 Introduction 17 5.2 Dispersion Model Overview 17 5.3 Model Inputs 18
5.3.1 Meteorology 18 5.3.2 Terrain Effects 23 5.3.3 Building Wake Effects 23 5.3.4 Modelling Scenarios 23 5.3.5 Source Characteristics and Emissions Inventory 23
6.0 Sensitive Receptors 31 7.0 Modelling Results 35
7.1 Odour 35 7.2 Particulates 37
8.0 Mitigation 49 9.0 Conclusion 51 10.0 References 53
Appendix A GHD Methane Flare Report A
Appendix B Meteorological Review B
Appendix C Emissions Inventory C

AECOM Expansion of the Advanced Waste Treatment Facility, Kemps Creek Resource Recovery Precinct - Air Quality Impact Assessment
28 March 2013
List of Tables Table 1 NSW EPA (DEC 2005) Impact Assessment Criteria for Complex Mixtures of Odorous
Pollutants (Nose-response Time Average, 99th Percentile) 8 Table 2 NSW EPA (DEC 2005) Impact Assessment Criteria for Particulates 8 Table 3 Ambient PM10 Data at Bringelly and St Marys Monitoring Stations, 2010 and 2011 10 Table 4 Annual Average Dust Deposition Rate at SITA Monitoring Locations, 2007 to 2011 12 Table 5 Climate Summary, BoM Monitoring Station at Badgerys Creek, 1995 to 2012 15 Table 6 CALPUFF Input Parameters 18 Table 7 Sample Locations and Number of Samples to be Collected 24 Table 8 Factors for Estimating Peak Odour Concentrations in Flat Terrain 26 Table 9 Odour Area Sources 27 Table 10 Odour Point Sources 28 Table 11 Particulate Emission Sources 29 Table 12 Sensitive Receptor Locations 31 Table 13 Odour Ground Level Concentrations (OU) at Discrete Receptors 35 Table 14 Predicted Maximum Receptor Development and Cumulative Ground Level Particulate
Concentrations 37 Table 15 Predicted Particulate Concentrations from the Development as a Percentage of the
Criteria, Background and Cumulative Concentrations 37
List of Figures Figure 1 Maximum Ambient 24 Hour PM10 Concentrations at Bringelly and St Marys Monitoring
Stations, 2010 11 Figure 2 Maximum Ambient 24 Hour PM10 Concentrations at Bringelly and St Marys Monitoring
Stations, 2011 11 Figure 3 Dust Deposition Gauge Locations 13 Figure 4 Wind Rose Comparison 21 Figure 5 Sensitive Receptor Locations 33 Figure 6 Predicted Odour Concentrations (99th Percentile), Development Only. 39 Figure 7 Predicted Odour Concentrations (99th Percentile), Development and Landfill. 41 Figure 8 Maximum Predicted 24 Hour PM10, Development Only 43 Figure 9 Predicted Annual Average PM10 Concentrations, Development Only 45 Figure 10 Predicted Annual Average TSP Concentrations, Development Only 47 Figure 11 Frequency Distribution of Wind Speed; SITA CALMET Data, 2011 B-1 Figure 12 Wind Speed by Hour of Day; SITA CALMET Data, 2011 B-2 Figure 13 Frequency Distribution of Stability Class; SITA CALMET Data; 2011 B-2 Figure 14 Hourly Mixing Height; SITA CALMET Data; 2011 B-3

AECOM Expansion of the Advanced Waste Treatment Facility, Kemps Creek Resource Recovery Precinct - Air Quality Impact Assessment
28 March 2013
This page has been left blank intentionally.

AECOM Expansion of the Advanced Waste Treatment Facility, Kemps Creek Resource Recovery Precinct - Air Quality Impact Assessment
28 March 2013
1
1.0 Introduction SITA Australia (SITA) operates an Advanced Waste Treatment (AWT) facility within its Resource Recovery Precinct at Kemps Creek in Western Sydney. The existing SITA AWT (SAWT) facility manages two separate waste streams: source-separated organic (SSO) material received from the Penrith City Council Local Government Area and mixed solid waste (MSW) from a number of Councils within the Sydney Metropolitan Area.
SITA proposes to expand operations at the existing SAWT facility. The existing SAWT facility currently accepts up to 134,400 tonnes per annum (tpa) of waste material, which includes 120,000 tpa of SSO and MSW and up to14,400 tpa of biosolids. This material is processed using a combination of mechanical separation, manual sorting, and biological composting technologies to produce compost, which is used predominantly by the mining sector for land rehabilitation, but is also suitable for broadacre agricultural applications. High quality compost derived from SSO material is returned to Penrith Council where appropriate, for application to local sporting fields.
The proposed expansion of the existing SAWT facility (referred to herein as the Development) would result in the following key changes:
- an increase in capacity of the facility to 220,000 tpa of input material
- modifications to the current layout of operations on the existing SAWT site (herein referred to as the Site) and enhancements to the management of composted material, including the use of internal composting (composting within an enclosure)
- an increase in operating hours for indoor operations from 7 am to 11 pm Monday through Saturday to 24 hours per day, seven days a week.
Construction of the Development is proposed to occur between mid 2013 and mid 2015. The Development would not immediately accept 220,000 tpa but would accept a gradual increase in volume of material over time as new contracts become available. It is anticipated that the Development would be at full operational capacity sometime in 2016.
This Air Quality Impact Assessment (AQIA) was prepared by AECOM to accompany the Environmental Impact Statement (EIS) for the proposed Development. This AQIA assesses the potential air quality impacts associated with the proposed Development.
1.1 Scope of the Assessment
This AQIA estimates ground level pollutant concentrations associated with the Development. Construction works are considered qualitatively while the operation of the proposed Development is considered quantitatively. The assessment investigated levels of:
- odour
- particulate matter with an aerodynamic diameter of less than 10 micrometres(PM10)
- total suspended particulates (TSP)
- deposited dust.
Odour emission rates were determined from the results of sampling undertaken at the Kemps Creek Facility, SITA’s Mindarie Composting Facility in Perth, and from published values used in previous assessments. Emission rates for PM10, TSP and deposited dust were estimated using operational data supplied by SITA and emission factors developed by the Australian Government for the National Pollutant Inventory.
Emissions of odour and particulate matter from operation of the Development were assessed quantitatively at the identified sensitive receptors in the vicinity of the Site. Pollutant concentrations at sensitive receptor locations were estimated using the CALPUFF dispersion model. The potential impacts of the Development were determined through comparison with ambient pollutant concentrations and the impact assessment criteria published in the NSW Environment Protection Authority (EPA) document Approved Methods for the Modelling and Assessment of Air Pollutants in NSW(DEC, 2005).

AECOM Expansion of the Advanced Waste Treatment Facility, Kemps Creek Resource Recovery Precinct - Air Quality Impact Assessment
28 March 2013
2
The works would be undertaken with standard construction equipment and the emissions would be managed using best practice construction management and mitigation processes. As such, while construction works associated with the proposed Development have the potential to generate dust emissions, the emissions were not assessed quantitatively.
Mitigation measures for construction and operation of the proposed Development are recommended.

AECOM Expansion of the Advanced Waste Treatment Facility, Kemps Creek Resource Recovery Precinct - Air Quality Impact Assessment
28 March 2013
3
2.0 Development Description A full description of the existing SAWT facility and proposed Development is provided in Chapter 5 of the EIS. The following sections summarise the key components of the Development relevant to the air quality assessment.
2.1 Development Location
The existing SAWT facility is located in the north-western corner of the Resource Recovery Precinct at Kemps Creek, approximately 41 kilometres west of the Sydney Central Business District. The surrounding land comprises agricultural, research and rural residential properties on gently undulating terrain, intersected by a number of creeks. The closest residence is located approximately 100 metres from the eastern boundary of the Resource Recovery Precinct and approximately 700 metres from the existing SAWT facility. The Resource Recovery Precinct is bounded by Badgerys Creek and the McGarvie-Smith Farm to the west; residential holdings and South Creek to the east; rural and residential land to the south; and rural land to the north.
2.2 Existing Operations
Much of the Resource Recovery Precinct is currently used as a solid waste landfill. The existing SAWT facility commenced operations in 2009. The facility receives MSW and SSO from local councils. The facility can process up to120,000 tpa of municipal solid waste, commercial and industrial and organic waste as well as 14,400 tpa of biosolids from sewage treatment plants. Organic and recyclable materials are separated through a mechanical process. The organic material is initially composted aerobically within a fully enclosed environment. The aerobic composting and mechanical separation processes are serviced by four biofilters, which are semi-enclosed and vent freely to atmosphere.
The partially composted MSW and the SSO are matured for a minimum of eight weeks on separate open-air composting pads, with leachate collected in ponds located adjacent to the stockpiles for recirculation into the composting process and if necessary for off-site treatment. Non-putrescible waste from pre treatment and refining is disposed of at the adjoining landfill.
Matured compost is stored on-site, prior to despatch to market.
The major potential odour sources at the existing SAWT facility are as follows:
- MSW composting pad
- MSW compost stockpile pad
- SSO composting pad
- SSO compost stockpile pad
- MSW leachate ponds
- SSO leachate pond
- biofilter (emitted as a semi-covered area source i.e. not stacked)
- specific operations on the composting pads (e.g. windrow turning, refining through mobile trommels).
2.3 Proposed Development
2.3.1 Construction
SITA proposes to undertake construction works for the proposed Development between mid 2013 and early 2015, with full operational capacity of the Development achieved sometime during 2016. Construction works would include:
- site establishment and erection of temporary facilities
- earthworks and civil infrastructure
- site access road upgrades
- construction of footings and buildings
- plant and services Installation
AECOM Expansion of the Advanced Waste Treatment Facility, Kemps Creek Resource Recovery Precinct - Air Quality Impact Assessment
28 March 2013
4
- internal fit-out
- commissioning.
The construction works would be undertaken using typical construction plant and equipment. The proposed hours of construction works are:
- Monday – Friday: 6 am to 6 pm (or up to 10 pm in extraneous circumstances, if approved)
- Saturday: 7 am to 4 pm
- Sundays/public holidays: no work.
During construction, the potential major emissions to air include by-products of fuel combustion from vehicles & equipment used in construction and transportation activities and dust from earth works. Potential pollution from construction of the development will be short term and localised to the area surrounding the construction and is not expected to have long term adverse impacts on the surrounding area.
Emissions from fuel combustion from vehicles and equipment would largely be diesel engine based and depend on the grade and composition of the fuel and the status of equipment maintenance. The fuel combustion emission of concern is particulate matter (primarily PM10).
As with any construction site, dust may be generated as a result of earthworks including earth moving and materials handling operations. Internal site traffic moving on unmade roads within the proposed development site may cause sufficient mechanical disturbance of loose surface materials to generate dust. Significant atmospheric dust arises from the mechanical disturbance of granular material exposed to the air. Dust generated from these open sources is termed "fugitive" because it is not discharged to the atmosphere in a confined flow stream. Common sources of fugitive dust include unpaved roads, aggregate storage stockpiles, and heavy construction operations.
The dust-generation process is caused by two basic physical phenomena:
- pulverization and abrasion of surface materials by application of mechanical force through implements (wheels, blades, etc.)
- entrainment of dust particles by the action of turbulent air currents, such as wind erosion of an exposed surface, for example by wind speeds over 19 km/hr (~5.3 m/s).
During the construction stages of the project odour can be generated from earthworks, disturbance of potentially anoxic or contaminated material, construction of primary and ancillary infrastructure and vehicle exhaust emissions.
A Construction Environmental Management Plan (CEMP) would be prepared prior to the commencement of construction works, which would detail measures to mitigate emissions of dust and other pollutants. Section 8 outlines some of the construction period mitigation measures to consider in the CEMP.
2.3.2 Operation
The proposed Development would enable the SAWT facility to process up to 220,000 tpa of input waste material, including MSW, SSO waste streams, waste from the commercial and industrial sector as well as biosolids.In order to increase the capacity of the facility, modifications and enhancements to the current layout of the facility are required.
In late 2011 and early 2012, SITA commenced development of the concept design for the expansion of the existing SAWT facility. Following the extremely wet summer in 2011/12, one of the major issues identified with the existing development was the weather dependence of the final part of the composting process which is conducted externally. In case of persistent wet weather conditions the high moisture content of the product prior to refining makes it impossible to refine and can lead to stockpiling of product on the compost pad. Furthermore, heavy rain produces significant quantities of leachate that are not necessary to the process, given the high moisture content of the material. These events can lead to degraded operating conditions with potential odour impacts on the community.
The initial concept design primarily consisted of the expansion of the original compost and refining building to accommodate a composting and maturation hall, the addition of a two hectare compost storage area in the north-east corner of the Resource Recovery Precinct, and a 9,000 square metre (m2) expansion of the SSO maturation pad for storage of SSO compost. The concept design also included a number of design elements
AECOM Expansion of the Advanced Waste Treatment Facility, Kemps Creek Resource Recovery Precinct - Air Quality Impact Assessment
28 March 2013
5
specifically intended to improve the environmental performance of the facility. Those design elements were as follows:
- internal composting of MSW material would be undertaken within a negatively pressurised building (fully removing the weather dependence for the MSW processing)
- enclosure of the feeding of refining operations within a designated building
- the addition of biofilters to treat the odour collected from the additional compost and refining buildings
- the venting of currently exposed biofilters and future biofilters through vertical 15-metre-tall stacks to increase dispersion into the atmosphere
- collection of MSW compost leachate into enclosed storage tanks, removing the need for external MSW compost storage ponds.
As detailed in Section 5.5.3 of this AQIA, AECOM commenced work on the AQIA by collecting site-specific odour samples from potential odour sources at the existing SAWT facility so as to determine the odour emission rates required for modelling the potential impacts of the Development. The odour emission rates determined through sampling were applied to the concept design and used in the dispersion model to estimate the likely odour contribution from each of the sources and identify those sources that had a higher potential than others to create an odour nuisance. The preliminary results of the odour modelling indicated that the concept design would have a higher than desired potential to generate odour. In response to the findings of the preliminary odour modelling, SITA reviewed and made modifications to the original concept design in order to mitigate odour impact from sources with the highest potential odour emissions and, subsequently, reduce the Development’s potential total odour impact.
After several internal reviews, SITA decided to further improve the design of the Development with the following changes:
- composting of the SSO inside a building
- refining of the SSO inside a building
- storage of leachate produced from the SSO in storage tanks
- limited storage pads for the MSW and SSO composts, respectively 10,000 m2 and 3,400 m2
- only external ponds to manage the run off waste water from the final compost storage pads
- external operations are limited to storage of final product, significantly reducing the risk of odour generation.
In summary, the final design is the outcome of an iterative process by SITA to obtain the best environmental outcome. SITA considered feedback from the commissioning period and initial operations of the existing SAWT facility to ensure all potential issues could be addressed in the current design.
The main modifications which minimise odour emissions are:
- undertaking all composting operations within a fully enclosed environment for both SSO and MSW derived material
- all refining to be undertaken internally
- construction of three new biofilters to service the additional composting activities, which, with the existing biofilters, would be fully enclosed and vented to atmosphere via 15-metre-tall stacks to improve odour dispersion
- the reduction in the size and storage capacity of the MSW and SSO compost storage areas
- collection of composting leachate in enclosed storage tanks prior to reuse within the processing system.
The design for the Development is assessed in detail in this AQIA.

AECOM Expansion of the Advanced Waste Treatment Facility, Kemps Creek Resource Recovery Precinct - Air Quality Impact Assessment
28 March 2013
6
This page has been left blank intentionally.
AECOM Expansion of the Advanced Waste Treatment Facility, Kemps Creek Resource Recovery Precinct - Air Quality Impact Assessment
28 March 2013
7
3.0 Pollutants of Interest and Assessment Criteria
3.1 Pollutants of Interest and Potential Sources
For a proposed development of this type, odour and particulate matter are the primary pollutants of interest.
3.1.1 Odour
The perception of odour is highly individual and varies between individuals based on their sensitivity, the acuteness of their sense of smell, and their prior history with different odours. The characteristics of odour also affects people’s perception of it; some odours are pleasant, while others are offensive. Offensive odours can adversely affect people’s quality of life, and exposure can result in stress and other physical symptoms.
Organic compost material has the potential to generate odour through the biological breakdown of the constituent material. This breakdown can release chemicals such as hydrogen sulphide and ammonia, particularly if the material lacks oxygen and becomes anaerobic or has a high level of nitrogen-rich material. As detailed in Section 2.3.2 of this assessment, the concept design for the Development was modified to minimise potential odour emissions from the organic processing operations. As a result, the primary potential sources of odour from the proposed Development would be the biofilters and the compost storage pads.
As described in Section 5 of this assessment, a cumulative odour impact assessment was conducted for the proposed Development and adjacent landfill. The main sources of odour associated with the adjacent landfill are the tipping faces for general and restricted waste. General waste is non putrescible material predominantly from the commercial and industrial sector as well as appropriate material from the local government sector. As other areas of the landfill are capped and fitted with a biogas capture system (currently flared), the capped areas of the landfill are not expected to be a major source of odour.
3.1.2 Particulate Matter
Airborne particulate matter is commonly differentiated according to size based on their equivalent aerodynamic diameter. Deposited dust refers to any dust that falls out of suspension in the atmosphere. Particles with a diameter of less than or equal to 50 micrometres (m) are collectively referred to as total suspended particulates (TSP). TSP primarily cause aesthetic impacts associated with coarse particles settling on surfaces, which also causes soiling and discolouration. These large particles, however, can cause some irritation of mucosal membranes and can increase health risks from ingestion if contaminated. Particles with diameters less than or equal to 10 m (known as PM10 or fine particles) tend to remain suspended in the air for longer periods than larger particles, and can penetrate into human lungs.
Exposure to particulate matter has been linked to a variety of health effects, such as respiratory problems (such as coughing, aggravated asthma, chronic bronchitis) and non-fatal heart attacks. Furthermore, if the particles contain toxic materials (such as lead, cadmium, zinc) or live organisms (such as bacteria or fungi), toxic effects or infection can occur from inhalation of the dust.
Particulate matter can be emitted from natural sources (bushfires, dust storms, pollens and sea spray) or as a result of human activities such as excavation works, bulk material handling, crushing operations, vehicles moving over unpaved roads, wood heaters and combustion activities (motor vehicle emissions, power generation and incineration).
Bulk material handling associated with the proposed Development has the potential to generate airborne particulate matter. It is anticipated, however, that the Development would not generate significant emissions of particulate matter as most of the operations and materials handling would be undertaken within an enclosed building. The compost produced from the input waste materials would be stored outside in limited quantities and managed to limit dust generation (with watering when required).
3.2 Assessment Criteria
The EPA specifies impact assessment criteria for pollutants in the NSW EPA Approved Methods for the Modelling and Assessment of Air Pollutants in NSW (DEC, 2005). The impact assessment criteria for odour and particulate matter, as the primary pollutants of concern for the proposed Development, are described in the following sections.

AECOM Expansion of the Advanced Waste Treatment Facility, Kemps Creek Resource Recovery Precinct - Air Quality Impact Assessment
28 March 2013
8
3.2.1 Odour
The perception of odour is based on an individual’s response to chemical exposure. The odour threshold is the theoretical minimum concentration of a chemical that produces an olfactory response, which, in practice, is used to indicate whether an odour is detectable; the odour threshold defines 1 odour unit (1 OU) for each chemical. The threshold relates to odour detection and does not consider the recognition of an odours character.
The impact assessment criteria for complex mixtures of odours were designed to take into account the ranges of individual sensitivity to odours based on a statistical approach relating to population size. As population density increases, the proportion of sensitive individuals is also likely to increase; as such, more stringent criteria apply to areas of high populations compared to low populations. Table 1 provides a summary of appropriate impact assessment criteria for various population densities.
Table 1 NSW EPA (DEC 2005) Impact Assessment Criteria for Complex Mixtures of Odorous Pollutants (Nose-response Time Average, 99th Percentile)
Population Criteria (OU)
Urban (>~2000) and/or schools and hospitals 2
~ 500 3
~ 125 4
~ 30 5
~ 10 6
Single rural residence (< ~ 2) 7
The above criteria are to be applied at the nearest existing or likely future off-site sensitive receptor, as defined and described in Section 6.0. The incremental impact (that is, the predicted concentration due to the pollutant source alone) must be reported in odour units as peak concentrations (approximately 1 second average) as the 99th percentile for impact assessments using site-specific data, such as this assessment.
As shown in Table 1, the impact assessment criteria ranges from 2 OU to 7 OU, whereby 7 OU is considered the maximum level of odour to which a residence should be exposed. The area immediately surrounding the Site of the proposed Development is sparsely populated, with large population centres located approximately one to two kilometres from the Site. It is estimated that the population potentially affected by odour emissions from the proposed Development is approximately 100. As such, a criterion of 4 OU was adopted for this assessment.
3.2.2 Particulates
Impact assessment criteria are provided for various particulate sizes as previously discussed. Assessment criteria for the different types of particulates are summarised in Table 2.
Table 2 NSW EPA (DEC 2005) Impact Assessment Criteria for Particulates
Pollutant Averaging Period Criteria
Particulate matter (PM10) 24 hours 50 g/m3
Annual 30 g/m3
Total suspended particulate (TSP) Annual 90 g/m3
Deposited dust Monthly 2 g/m2.month (max. increase) 4 g/m2.month (max. total)
AECOM Expansion of the Advanced Waste Treatment Facility, Kemps Creek Resource Recovery Precinct - Air Quality Impact Assessment
28 March 2013
9
4.0 Existing Air Quality
4.1 Ambient Air Quality
The land use in the area around the Development is predominantly rural residential. Industrial and recreational uses include a golf course, piggeries, poultry farms, the ANL composting facility and a brick making facility, all of which are potential sources of odour and/or dust. The closest residential property is located approximately 100 metres east of the Site. Ambient air quality, in terms of dust and odour, in the area around the Site are described in the following sections.
4.1.1 Odour
The area contains a number of potential odour-producing sources, including the existing SAWT facility, piggeries, poultry farms and the ANL composing facility. It should be noted, however, that, unlike particulates or other pollutants, odour impacts from different sources are not typically additive; that is, the odours from different sources have different characteristics and do not typically combine to create a larger odour impact.
Odours with different characteristics may be perceived differently by the receptor. Odours from different sources can combine in different ways – while similar odours may add synergistically, other odours may cancel each other out, or one odour may mask another odour.
The only local odour source considered to be of a similar character to that likely to be emanated from the proposed Development is the ANL composting facility at Badgerys Creek, which is located approximately 2.2 kilometres south of the Development. As most of the sensitive receptors are located between the two facilities, and the sources are located approximately two kilometres apart, it is unlikely that the receptors would be affected by odours from both sources at the same time. As such, existing ambient odour concentrations from the ANL composting facility or other facilities were not included in the assessment.
Complaints from the community relating to ambient odours have been received by SITA over the past few years – with the majority complaints occurring in 2011 and 2012. The complaints have primarily been received by residential properties to the south of the site located off Elizabeth Drive. The character of the odours are generally described as a raw composting or rotten/putrid waste smell.
After each odour complaint the operations of the facility during the time of the complaint were determined and any non-typical activities identified. Meteorological conditions on the site, including wind speed and direction, are also reviewed for the time of the complaint. A register of the complaint together with the collected information is completed and potential sources identified.
The source of the odour was generally not directly linked back to a specific activity on the site, however, the compost stockpiles and leachate ponds were discussed as possible sources. It is acknowledged that operations over the past three years at existing SAWT facility have been impacted by the ramping up to full capacity with related commissioning of the facility. The last extremely wet summer has also impacted external operations on-site, resulting in stockpiling of product on the composting pad for part of 2012 and several months to bring the composting pads back to normal operating conditions. The rainfall during the short operational life of the facility is highlighted in Section 4.2 against mean rainfall expected in the Kemps Creek area.
All tons delivered to the facility have been successfully processed to date with the production of good quality compost. However degraded operating conditions linked to an extended commissioning period and unfavourable weather conditions have probably lead to generation of odours with an impact on the local community. This has been highlighted by a number of complaints received during these three years of operations and by the work undertaken by The Odour Unit Pty Ltd (TOU) on behalf of the EPA in September 2012 when the Site was still catching up from the wet season.
TOU was engaged by the EPA in August 2012 to conduct a baseline regional odour assessment covering the Eastern Creek, Erskine Park and Kemps Creek precincts of Western Sydney. The request for this assessment was in response to community odour complaints and concerns in recent times regarding the level of odours originating from the activities undertaken at ten waste management and composting facilities (the facilities) within these precincts, including the existing SAWT facility. The objective of the surveys was to develop a baseline assessment and evaluate the extent of odour detectable beyond the site boundary of the facilities that have the potential to adversely impact on sensitive receptors. The techniques employed in the surveys were able to quantify and/or qualify the odour intensity, odour character, extent of odour plume and the likely source of odours detected near and far-field from the facilities.
AECOM Expansion of the Advanced Waste Treatment Facility, Kemps Creek Resource Recovery Precinct - Air Quality Impact Assessment
28 March 2013
10
During the surveys there were multiple occasions where the existing SAWT facility’s odours were detected beyond the boundary. These impacts were generally near the site, with one occasion extending to the Erskine Park Precinct. The odours detected were generally classified as weak to distinct with MSW/garbage/cheesy, green waste/herbaceous and organic growth medium/dry compost odour characters.
4.1.2 Particulates
Ambient particulate data are measured by the EPA and SITA, as described in the following sections.
PM10
The EPA operates a network of monitoring stations around the Site that measures various ambient pollutant levels, including particulates as PM10. The closest stations to the Site are those located at Bringelly (approximately 5 kilometres south of the Site) and St Marys (approximately 7 kilometres north of the Site).
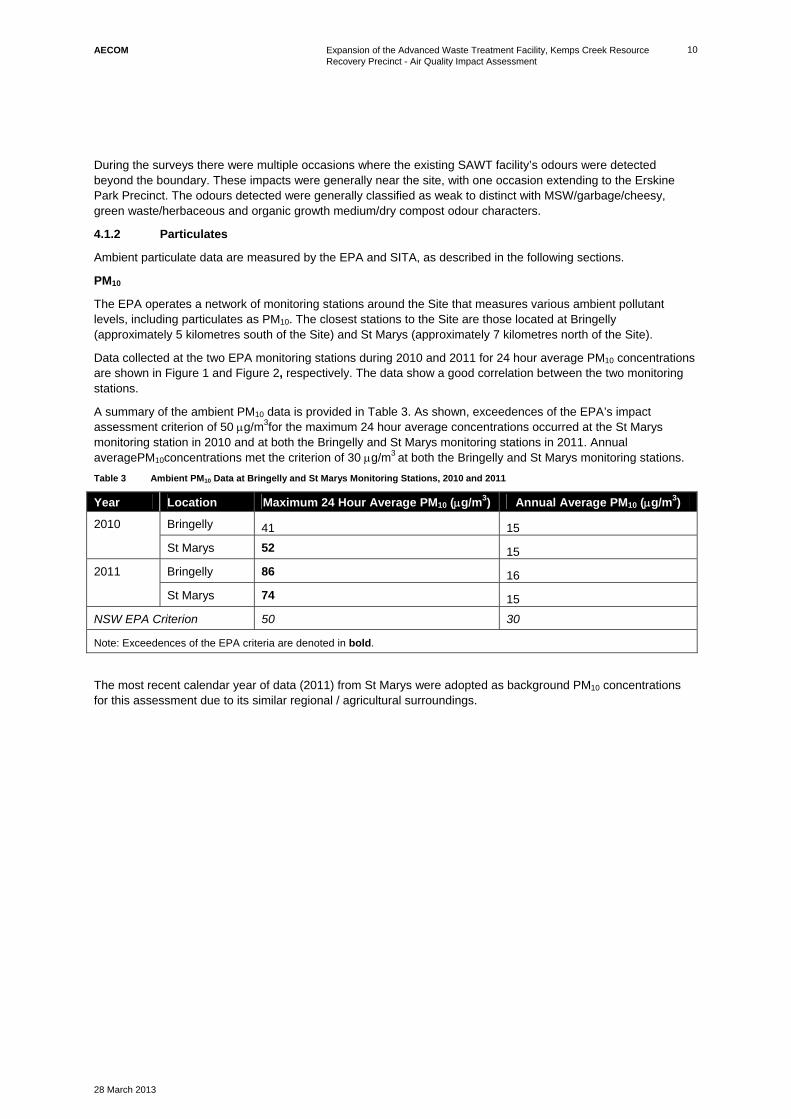
Data collected at the two EPA monitoring stations during 2010 and 2011 for 24 hour average PM10 concentrations are shown in Figure 1 and Figure 2, respectively. The data show a good correlation between the two monitoring stations.
A summary of the ambient PM10 data is provided in Table 3. As shown, exceedences of the EPA’s impact assessment criterion of 50 g/m3for the maximum 24 hour average concentrations occurred at the St Marys monitoring station in 2010 and at both the Bringelly and St Marys monitoring stations in 2011. Annual averagePM10concentrations met the criterion of 30 g/m3 at both the Bringelly and St Marys monitoring stations.
Table 3 Ambient PM10 Data at Bringelly and St Marys Monitoring Stations, 2010 and 2011
Year Location Maximum 24 Hour Average PM10 (g/m3) Annual Average PM10 (g/m3)
2010 Bringelly 41 15
St Marys 52 15
2011 Bringelly 86 16
St Marys 74 15
NSW EPA Criterion 50 30
Note: Exceedences of the EPA criteria are denoted in bold.
The most recent calendar year of data (2011) from St Marys were adopted as background PM10 concentrations for this assessment due to its similar regional / agricultural surroundings.

AECOM Expansion of the Advanced Waste Treatment Facility, Kemps Creek Resource Recovery Precinct - Air Quality Impact Assessment
28 March 2013
11
Figure 1 Maximum Ambient 24 Hour PM10 Concentrations at Bringelly and St Marys Monitoring Stations, 2010
Figure 2 Maximum Ambient 24 Hour PM10 Concentrations at Bringelly and St Marys Monitoring Stations, 2011

AECOM Expansion of the Advanced Waste Treatment Facility, Kemps Creek Resource Recovery Precinct - Air Quality Impact Assessment
28 March 2013
12
TSP
Ambient TSP concentrations are not measured by the EPA in the area around the Site. The closest station to measure ambient TSP concentrations is the NSW EPA Earlwood monitoring station which is located approximately 35 kilometres east of the Site. TSP concentrations were last measured at the Earlwood monitoring station in 2004. The ratio of PM10 to TSP recorded at the Earlwood monitoring station in 2004 was calculated to be 43 percent (i.e. 43 percent of the TSP was PM10).
The ratio of PM10 to TSP at the Earlwood monitoring station in 2004 was applied to the annual average PM10 concentration of 15 g/m3 measured at the St Marys monitoring station in 2011. The annual average TSP concentration from the St Marys data was calculated to be 34g/m3, which was adopted as the ambient TSP concentration at the Site for the purpose of this assessment.
Deposited Dust
SITA measures deposited dust at seven monitoring locations along the boundary of the Resource Recovery Precinct. A summary of the annual average dust recorded at each of the monitoring locations between 2007 and 2011 is provided in Table 4. The EPA’s impact assessment criterion for deposited dust is 4 g/m2.month, which is an annual average of the monthly average deposition rates. This criterion was exceeded at most monitoring locations during the past five years. The highest deposition levels were recorded at monitoring location D8 (EPA Monitoring Point 6), which is located on the northern boundary of the Resource Recovery Precinct as shown in Figure 3.
Table 4 Annual Average Dust Deposition Rate at SITA Monitoring Locations, 2007 to 2011
Location Deposited Dust Rate (g/m2.month)
2011 2010 2009 2008 2007 Annual Average
D5 (EPA Monitoring Point 4)
2.8 4.7 3.6 3.8 2.3 3.4
D6 (EPA Monitoring Point 5)
6.7 5.6 4.3 3.2 3.9 4.7
D8 (EPA Monitoring Point 6)
5.3 10.3 6.4 8.1 5.3 7.1
D10 (EPA Monitoring Point 7)
3.3 4.0 4.9 4.7 5.6 4.5
D17 (EPA Monitoring Point 8)
5.5 4.7 5.0 5.7 5.3 5.2
D20 (EPA Monitoring Point 9)
2.2 4.8 3.8 4.4 3.6 3.8
D21 (EPA Monitoring Point 10)
2.9 2.6 2.9 2.8 2.2 2.7
Site Annual Average 4.1 5.2 4.4 4.7 4.0 4.5
NSW EPA Criterion 4 4 4 4 4 4
Note: Exceedences of the EPA criterion are denoted in bold.
The deposition results presented may have been impacted by a few extraordinary events occurring during the monitoring period. During 2008, the construction of the existing SAWT facility was at its peak. During 2010 the excavation of landfill cell C5 was occurring, and there was also some limited transportation of fill to an adjacent property.
Efforts have been made to aid in the reduction of dust emissions from the site in recent years. This includes the capping of eight hectares of land in the last 12 months, incorporation of moisture in the compost windrows during turning and the reduction of stock kept on-site.
To estimate the cumulative impact of dust deposition, the predicted maximum deposition rate at the sensitive receptors assessed was added to the 2011 deposition rate measured at the nearest dust gauge. For example, if the sensitive receptor was located near dust gauge D17, then the deposition value 5.5 g/m2.month would be applied as the background concentration to the predicted modelled ground level concentration.

Badger
ysC
reek
Badger
ysC
reek
Badgerys
Creek
Badgerys
Creek
DUST DEPOSITION GAUGE LOCATIONS
FIGURE 3
Environmental Impact Statement - Upgrade of Kemps Creek AWT Facility
Kemps Creek, New South Wales
G:\P
roje
cts
\602
Pro
jects
\60250100
Kem
ps
Cre
ek\F
IGU
RE
S\E
IS\A
irQ
ualit
yIm
pactA
ssessm
ent\
60250100
F3
Dust
Depositio
nG
auge
Locations
18
09
2012
TO
KEY
Site Boundary
Resource Recovery Precinct
Watercourse
Dust deposition gauge location
0 200m
D10
D8
D20
D6
D21
D5
D10
D17
Elizabeth Drive Landfill Site
Existing SAWT Facility
Kemps Creek Advanced
Resource Recovery Precinct
Resource Recovery Precinct
access road

AECOM Expansion of the Advanced Waste Treatment Facility, Kemps Creek Resource Recovery Precinct - Air Quality Impact Assessment
28 March 2013
14
This page has been left blank intentionally.

AECOM Expansion of the Advanced Waste Treatment Facility, Kemps Creek Resource Recovery Precinct - Air Quality Impact Assessment
28 March 2013
15
4.2 Regional Climate
The Bureau of Meteorology (BoM) operates a network of meteorological monitoring stations around the country. These stations record long-term meteorological parameters and are an excellent resource for assessing other localised data for their correlation to regional parameters. The NSW EPA also monitors meteorological conditions however are generally for a more limited time period than the BoM data.
The closest BoM station to the Site is located at Badgerys Creek, approximately four kilometres southwest of the Resource Recovery Precinct. A summary of the long-term data recorded at this station between 1995 and 2010 is shown in Table 6.The data provide an indication of the regional climate of the area surrounding the Development. As described in Section 5.3.1, the BoM data were used to verify that the meteorological data used in this assessment are representative of the local climate.
Table 5 Climate Summary, BoM Monitoring Station at Badgerys Creek, 1995 to 2012
Statistics Jan Feb Mar Apr May Jun Jul Aug Sep Oct Nov Dec Annual
Temperature
Mean maximum temperature (°C)
30 29 27 24 21 18 17 19 23 25 26 28 24
Mean minimum temperature (°C)
17 17 15 11 8 5 4 5 8 10 13 15 11
Rainfall
Mean rainfall (mm)
73 102 68 34 43 45 26 34 36 56 73 64 654.4
Total Rainfall 2011
38.2 27.6 83 27 52.2 64.2 47 44.6 68.4 42.6 139.6 99.6 734
Total Rainfall 2012
119.8 193.2 198 129.4 13.0 86.2 17.8 3.2 14.8 42.8 48.6 36.6 903.4
Mean number of days of rain ≥ 1 mm
7.8 8.3 7.3 5.2 4.2 5.3 4.4 3.4 4.9 5.8 7.0 7.1 70.7
9 am conditions
Mean 9am temperature (°C)
22 21 19 17 14 11 9.8 12 16 18 19 21 17
Mean 9am relative humidity (%)
73 80 83 76 80 84 81 72 66 62 69 69 75
Mean 9am wind speed (km/h)
9 9 8 10 10 9 10 11 12 12 11 9.8 10
3 pm conditions
Mean 3pm temperature (°C)
28 26.9 25 22 19 17 16 18 21 23 24 27 22
Mean 3pm relative humidity (%)
49 55 55 52 53 56 50 44 44 45 50 48 50
Mean 3pm wind speed (km/h)
18 16 15 14 14 14 15 18 19 20 19 19 17
As shown in Table 6, the warmest temperatures occur during the summer months, with the highest average maximum temperature (30oC) occurring in January. July is the coldest month, with a recorded average minimum

AECOM Expansion of the Advanced Waste Treatment Facility, Kemps Creek Resource Recovery Precinct - Air Quality Impact Assessment
28 March 2013
16
temperature of 4oC. February is the wettest month, with an average rainfall of 102 millimetres, while the winter months are typically the driest. Humidity follows a diurnal cycle, with higher humidity in the morning compared to the afternoon. Wind speeds are higher in the afternoon compared to the morning, with the highest average wind speeds occurring in October (20 kilometres per hour).

AECOM Expansion of the Advanced Waste Treatment Facility, Kemps Creek Resource Recovery Precinct - Air Quality Impact Assessment
28 March 2013
17
5.0 Methodology
5.1 Introduction
Dispersion modelling was undertaken to predict the potential air quality impacts from the proposed Development (expected to be completed and fully operational in 2016). The scope of work undertaken by AECOM to assess the potential air quality impacts from the proposed Development is as follows:
- Development of an Emissions Inventory. The inventory contains all emissions information required to undertake dispersion modelling. The inventory was generated using operational information supplied by SITA and emission factors developed through site-specific sampling.
- Dispersion Modelling. The TAPM (The Air Pollution Model) and CALMET meteorological processers and the CALPUFF dispersion model was used in the assessment. CALPUFF dispersion model inputs include meteorology, source characteristics, modelling scenarios and pollutant emissions data.
The assessment was conducted in accordance with the following guideline:
- Approved Methods for the Modelling and Assessment of Air Pollutants in New South Wales, Department of Environment and Conservation New South Wales (DEC 2005).
The Approved Methods outlines the requirements for developing air dispersion modelling methodology, analysing meteorological data, and the criteria applicable when considering the potential impacts as a result of a site’s operation. The document prescribes calculation modes for accounting for terrain effects, building wake effects, horizontal and vertical dispersion curves, buoyancy effects, surface roughness, plume rise, wind speed categories and wind profile exponents.
The methodology for the assessment was developed in consultation with the EPA. On 20 June 2012, AECOM and SITA representatives met with EPA and OEH staff at the OEH Goulburn Street Office. The meeting was undertaken to discuss the proposed air quality methodology for the air quality assessment to be included in the EIS and to gain any feedback from the EPA with respect to the methodology. Key issues raised by the EPA during the meeting are as follows:
- It was agreed that a cumulative quantitative odour impact assessment (proposed Development and landfill) was appropriate as the most conservative approach.
- AECOM discussed its approach of collecting odour samples from the existing SAWT and landfill in order to generate a model from measurements of real operating conditions. The EPA agreed with this approach.
- EPA commented that the EIS must assess the full capacity of the expanded facility i.e. all of the storage pads being used to their designed capacity.
- The use of the CALPUFF dispersion model in the assessment was discussed, specifically in regards to its capability for handling calm conditions, and was agreed as appropriate by all parties.
5.2 Dispersion Model Overview
The TAPM (The Air Pollution Model) and CALMET meteorological processers and the CALPUFF dispersion model were used in the assessment. A brief description of each model is provided below.
TAPM predicts three-dimensional meteorology, including terrain-induced circulations. TAPM is a PC-based interface that is connected to databases of terrain, vegetation and soil type, leaf area index, sea-surface temperature, and synoptic-scale meteorological analyses for various regions around the world. The TAPM model was used to predict meteorological parameters that were not available from the meteorological data obtained from the St Marys monitoring station (such as upper air parameters) which are required by the CALMET meteorological processer.
CALMET is a meteorological model that develops hourly wind and temperature fields on a three-dimensional gridded modelling domain. Associated two-dimensional fields such as mixing height, surface characteristics and dispersion properties are also included in the file produced by CALMET. CALMET produces a meteorological file that is used within the CALPUFF model to predict the movement of air pollution.
AECOM Expansion of the Advanced Waste Treatment Facility, Kemps Creek Resource Recovery Precinct - Air Quality Impact Assessment
28 March 2013
18
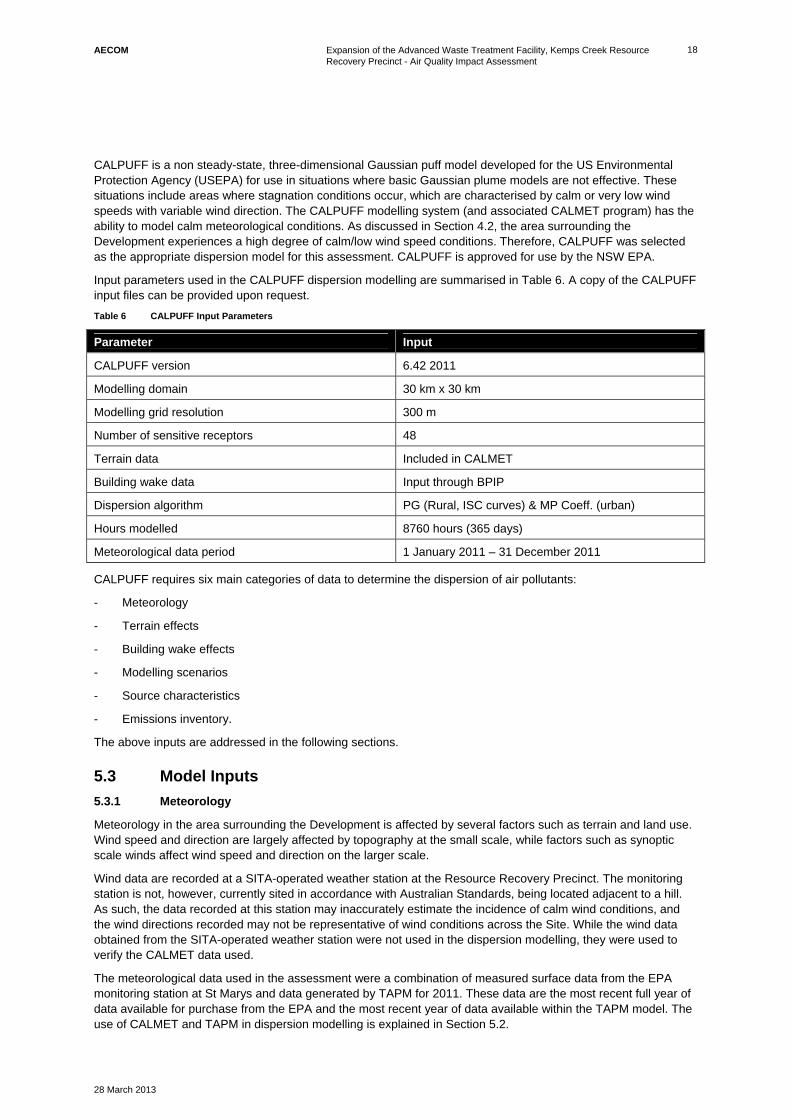
CALPUFF is a non steady-state, three-dimensional Gaussian puff model developed for the US Environmental Protection Agency (USEPA) for use in situations where basic Gaussian plume models are not effective. These situations include areas where stagnation conditions occur, which are characterised by calm or very low wind speeds with variable wind direction. The CALPUFF modelling system (and associated CALMET program) has the ability to model calm meteorological conditions. As discussed in Section 4.2, the area surrounding the Development experiences a high degree of calm/low wind speed conditions. Therefore, CALPUFF was selected as the appropriate dispersion model for this assessment. CALPUFF is approved for use by the NSW EPA.
Input parameters used in the CALPUFF dispersion modelling are summarised in Table 6. A copy of the CALPUFF input files can be provided upon request.
Table 6 CALPUFF Input Parameters
Parameter Input
CALPUFF version 6.42 2011
Modelling domain 30 km x 30 km
Modelling grid resolution 300 m
Number of sensitive receptors 48
Terrain data Included in CALMET
Building wake data Input through BPIP
Dispersion algorithm PG (Rural, ISC curves) & MP Coeff. (urban)
Hours modelled 8760 hours (365 days)
Meteorological data period 1 January 2011 – 31 December 2011
CALPUFF requires six main categories of data to determine the dispersion of air pollutants:
- Meteorology
- Terrain effects
- Building wake effects
- Modelling scenarios
- Source characteristics
- Emissions inventory.
The above inputs are addressed in the following sections.
5.3 Model Inputs
5.3.1 Meteorology
Meteorology in the area surrounding the Development is affected by several factors such as terrain and land use. Wind speed and direction are largely affected by topography at the small scale, while factors such as synoptic scale winds affect wind speed and direction on the larger scale.
Wind data are recorded at a SITA-operated weather station at the Resource Recovery Precinct. The monitoring station is not, however, currently sited in accordance with Australian Standards, being located adjacent to a hill. As such, the data recorded at this station may inaccurately estimate the incidence of calm wind conditions, and the wind directions recorded may not be representative of wind conditions across the Site. While the wind data obtained from the SITA-operated weather station were not used in the dispersion modelling, they were used to verify the CALMET data used.
The meteorological data used in the assessment were a combination of measured surface data from the EPA monitoring station at St Marys and data generated by TAPM for 2011. These data are the most recent full year of data available for purchase from the EPA and the most recent year of data available within the TAPM model. The use of CALMET and TAPM in dispersion modelling is explained in Section 5.2.

AECOM Expansion of the Advanced Waste Treatment Facility, Kemps Creek Resource Recovery Precinct - Air Quality Impact Assessment
28 March 2013
19
Wind speed and direction are important variables in dispersion modelling, as they dictate the direction and distance air pollutant plumes travel. A comparison of the wind roses from the BoM monitoring station at Badgerys Creek (which are indicative of long-term climatic wind patterns), the SITA-operated weather station (for which data was only available for 2011 and 2012) and the CALMET data is shown in Figure 4.
The Badgerys Creek BoM data indicate that the predominant wind direction in the morning is southwest, which correlates well with the data measured by the SITA-operated weather station at the Resource Recovery Precinct and in CALMET. The wind roses from the BoM, Resource Recovery Precinct and CALMET data sets correlate well and indicate that winds occur from all directions in the afternoon, with a predominant direction clockwise from the north east to south east. Calm conditions are very common during the morning hours: 12 percent, 24 percent and 13 percent from the BoM, Resource Recovery Precinct and CALMET data, respectively. Calm conditions are less common during the afternoon hours: one percent, four percent and five percent from the BoM, Resource Recovery Precinct and CALMET data, respectively.
The CALMET dataset was used in the dispersion modelling. The CALMET wind roses provided in Figure 4 were generated for a point located at the centre of the Site of the proposed Development and are indicative of the larger data set used in the dispersion modelling. As previously discussed, the data provide a good representation of morning and afternoon wind conditions seen at the BoM and Resource Recovery Precinct meteorological stations. The CALMET data set contains13 percent calm conditions at 9 am and five percent calms at 3 pm, which are slightly higher percentages than recorded in the BoM data set. As calm conditions typically result in worse dispersion conditions, the dispersion modelling may overestimate the effects of calm conditions on the pollutant levels at sensitive receptor locations. Further analysis of the CALMET data is provided in Appendix B.

AECOM Expansion of the Advanced Waste Treatment Facility, Kemps Creek Resource Recovery Precinct - Air Quality Impact Assessment
28 March 2013
20
This page has been left blank intentionally.

N
S
EW 30%
3pm Wind Rose (1995-2010) Badgerys Creek9am Wind Rose (1995-2010) Badgerys Creek
20%10%
10%
20%
30%
N
S
EW
3pm Wind Rose, SITA (2011/2012)9am Wind Rose, SITA (2011/2012)
15%
12%
9%
6%
3%
15%
12%
9%
6%
3%
N
S
EW
N
S
EW
3pm Wind Rose, CALMET (SAWT, 2011)9am Wind Rose, CALMET (SAWT, 2011)
20%
16%
12%
8%
4%
20%
16%
12%
8%
4%
WIND ROSE COMPARISON: BOM BADGERYS CREEK, SITA AND CALMET
FIGURE 4
Expansion of the Advanced Waste Treatment Facility,
Kemps Creek Resource Recovery Precinct
G:\P
roje
cts
\602
Pro
jects
\60250100
Kem
ps
Cre
ek\F
IGU
RE
S\E
IS\A
irQ
ualit
yIm
pactA
ssessm
ent\
60250100
F4
Win
dR
ose
Com
aprison
20
09
2012
TO
Wind Speed (m/s)
>=10
8.0 - 10.0
4.0 - 8.0
2.0 - 4.0
1.0 - 2.0
0.5 - 1.0
Calms: 23.53% Calms: 3.94%
Wind Speed (m/s)
>=10
8.0 - 10.0
4.0 - 8.0
2.0 - 4.0
1.0 - 2.0
0.5 - 1.0
Calms: 13.39% Calms: 4.64%

AECOM Expansion of the Advanced Waste Treatment Facility, Kemps Creek Resource Recovery Precinct - Air Quality Impact Assessment
28 March 2013
22
This page has been left blank intentionally.

AECOM Expansion of the Advanced Waste Treatment Facility, Kemps Creek Resource Recovery Precinct - Air Quality Impact Assessment
28 March 2013
23
5.3.2 Terrain Effects
The terrain data were obtained from the NASA Shuttle Radar Topographic Mission (SRTM) at a resolution of approximately 90 metres. These were incorporated into the CALPUFF input files via TAPM.
5.3.3 Building Wake Effects
The dispersion of air pollutants around the Site is likely to be affected by aerodynamic wakes generated by winds having to flow around the existing and proposed structures. Building wakes generally decrease the distance downwind at which the plumes come into contact with the ground. This may result in higher ground level pollutant concentrations closer to the source of emission.
PRIME is the USEPA’s preferred building wake algorithm, and was applied in the assessment. CALPUFF includes the PRIME building wake algorithm and uses the Building Profile Input Program (BPIP) for entering the location and dimension of buildings. The location and dimensions of buildings located within a distance of 5L (where L is the lesser of the height or width of the building) from each release point for buildings with a height greater than 0.4 times the stack height were entered in the BPIP.
5.3.4 Modelling Scenarios
One modelling scenario was included in the assessment: operation of the proposed Development at full capacity in 2016. Modelling was undertaken for the following air pollutants:
- odour
- PM10
- TSP
- deposited dust.
Dispersion modelling was undertaken for odour sources associated with the proposed Development and also for operation of the proposed Development and the landfill cumulatively. The landfill sources were included to provide a measure of background odour concentrations in the absence of monitoring data. This method is considered the best approach to gain the most accurate prediction of the likely cumulative odour impacts of the Development. As odour is the primary issue of concern for the Development, odour emissions from the landfill were included in the assessment to estimate cumulative odour impacts associated with the Resource Recovery Precinct.
Dust emissions from the proposed Development are not expected to be a significant contributor to the local ambient dust levels as all composting activities and refining is proposed to occur indoors and the final product stockpiles have a moisture content of 35 percent. As such, only sources associated with the proposed Development were modelled. Ambient dust levels, however, were assessed cumulatively by adding the maximum EPA monitoring data from the St Marys monitoring station to the maximum predicted ground level impacts from operation of the Development. This approach is recommended within the Approved Methods (DEC 2005).
Construction emissions were not modelled due to the short duration and intermittent nature of the construction works. Activities that have the potential to result in airborne dust during the construction phase include earthmoving during site preparation, excavation of stormwater ponds and building foundations, and handling and stockpiling of excavated material. Dust emissions during construction works can be minimised and mitigated through the application of a CEMP.
5.3.5 Source Characteristics and Emissions Inventory
A detailed emissions inventory is provided in Appendix C. The inventory provides the data inputs used to calculate the emission rates from the proposed Development, as well as the physical characteristics of specific sources. A summary of the emissions inventory listing the pertinent details for the modelling is provided in the following sections.

AECOM Expansion of the Advanced Waste Treatment Facility, Kemps Creek Resource Recovery Precinct - Air Quality Impact Assessment
28 March 2013
24
Site-specific Odour Sampling
AECOM undertook site-specific odour sampling to develop the odour emission rates required for dispersion modelling. The Approved Methods (DEC, 2005) provides two levels of assessment: Level 1 – screening; and Level 2 – refined. A level 1 assessment uses worst-case input data to estimate conservative and less specific impacts. Such inputs include theoretical worst-case meteorological data sets and emission rates based on default factors and literature values. A level 2 assessment uses site-specific meteorological and emissions data (i.e. collected from the site operations) to provide a more accurate reflection of actual impacts. Further, the Approved Methods states that “the EPA’s preferred methods are direct measurement for existing sources and manufacturers’ design specifications for proposed sources” when preparing an emissions inventory.
Based on the complaint history of the site, AECOM determined that a Level 2 - refined assessment using site-specific data (i.e. source measurements from the site) was appropriate for the assessment in order to gain the best representation of the potential impacts of the proposed Development.
Extensive odour sampling was conducted at the Site of the proposed Development and the landfill during July and August 2012. A list of the locations sampled is provided in Table 7. The source location, number of locations per source (i.e. the number of different physical locations on the same type of source) and the total number of samples taken is provided in the table. The number of locations and samples were chosen based on the homogeneity of the sources and the likely odour impact the sources may have.
Table 7 Sample Locations and Number of Samples to be Collected
Source Number of Locations
Number of Samples
Sample Reference ID
SAWT
MSW compost pad 2 4 1
MSW final product stockpile1 0 0 2
SSO compost pad 2 4 3
SSO final product stockpile1 0 0 4
MSW leachate pond 1 2 5
SSO leachate pond 1 2 6
Biofilter surface 2 4 7
Landfill
General waste active tip face 3 6 8
General waste daily cover 2 4 9
General waste intermediate cover 1 2 10
Restricted waste active tip face 3 6 11
Restricted waste daily cover 2 4 12
Restricted waste intermediate cover 1 2 13
Capped cells2 0 0 14 1 Odour samples could not be collected from the MSW final product stockpile and the SSO final product stockpile due to
insufficient appropriate material on-site at the time sampling was conducted. Facility at Mindarie used for MSW, SITA Organics
used for SSO values were used as an alternative.
2 Representative odour samples were not collected from the capped or virgin areas as fertiliser had been spread over the
area prior to the sampling campaign. Literature values were used as an alternative.

AECOM Expansion of the Advanced Waste Treatment Facility, Kemps Creek Resource Recovery Precinct - Air Quality Impact Assessment
28 March 2013
25
Odour samples could not be collected from the MSW derived compost final product stockpile and the SSO derived compost final product stockpile during the sampling campaign due to insufficient appropriate material on-site. As an alternative, odour samples representing the MSW derived compost final stockpile were collected from SITA’s Mindarie Composting Facility in Perth which provides a similar processing system and therefore a similar compost properties to that of the proposed Development. The SSO derived compost odour emission rate was gained from the Office of Environment and Heritage report Odour emissions and mitigation study - Camden Soil Mix Mount Annan, NSW (2012). All odour emission rates are presented in Table 9.
Representative odour samples from the capped or virgin areas of the landfill were not collected as fertiliser was applied over the capping area during rehabilitation activities conducted immediately prior to the sampling campaign. As an alternative, the capping emission rate was derived from previously published literature values in the report ‘Air Quality – Odour and Dust: Light Horse Business Centre Development Application’ (Holmes Air Sciences 2008). The document references odour emission rates from a class 2 landfill facility that landfilled both organic and inorganic material, calculating an average odour emission rate of 0.051 OU/s/m2. The document provides a method for the estimation of capping emission rates based on the percentage of organic material in the fill. At the landfill it is expected that a high percentage of the delivered organic and biodegradable material would be recovered or recycled, with an estimated five percent of the organic and biodegradable material coming to the site to be landfilled. The likely odour emissions from the capping are is therefore considered to be five percent of the average odour emission rate from a class 2 landfill provided in the literature, equating to 0.003 OU/s/m2. This value has been conservatively increased to 0.004 OU/s/m2 due to the varying nature and capping ages of the facility.
The odour samples were collected in accordance with Australian Standard (AS) 4323.4; 2009 and AS 4323.3; 2001. AS 4323.4; 2009 specifies a method for the determination of atmospheric contaminant emission rates from area sources using a flux chamber (EPA Approved Method OM-8). The monitoring consisted of the collection of two samples per source location as recommended in AS4323.3;2001. One equipment blank sample was collected per sampling day for quality assurance and control purposes.
The odour samples were analysed by a NATA-certified olfactometry laboratory in accordance with AS 4323.3; 2001. The standard specifies a method for the measurement of odour concentration using dynamic olfactometry with a panel of human assessors.
Peak to Mean Ratios
Odours generate a physiological response within approximately one second of exposure, known as the nose response time. Existing dispersion models are not capable of modelling pollutant concentrations over such a short timescale. As such, factors known as peak to mean ratios are applied to odour emission rates to convert one hour averages to one second averages (nose response time). Peak to mean ratios (referred to as P/M60) vary according to the type of source (point, area etc.), whether the source is wake affected (i.e. located such that the dispersion pattern would be influenced by surrounding buildings and other structures), and the meteorological conditions, specifically stability class (atmospheric turbulence level ranging from stable to unstable). The distance of receptors from the source is also an important variable. The EPA’s recommended peak to mean ratios for the calculation of odour emission rates are shown Table 8.
The predicted source odour emission rates were multiplied by the appropriate peak to mean ratio, with the resultant emission rate entered into the dispersion model. As such, the hourly modelling predictions in effect represent the one second average (peak nose response time) concentrations. Far-field concentrations are lower than near-field concentrations; this assessment conservatively applied near-field ratios to all sources.

AECOM Expansion of the Advanced Waste Treatment Facility, Kemps Creek Resource Recovery Precinct - Air Quality Impact Assessment
28 March 2013
26
Table 8 Factors for Estimating Peak Odour Concentrations in Flat Terrain
Source Type Pasquill-Gifford Stability
Class Near-field P/M601 Far-field P/M601
Area A - D 2.5 2.3
E,F 2.3 1.9
Line A - F 6 6
Surface wake-free point A - C 12 4
D - F 25 7
Tall wake-free point A - C 17 3
D - F 35 6
Wake-affected point A - F 2.3 2.3
Volume A - F 2.3 2.3 1 Ratio of peak 1 second average concentrations to mean 1 hour average concentrations.
Odour Sources and Emissions Inventory
Details of the odour sources assessed for both the proposed Development and the landfill are provided in Table 9 (area sources) and Table 10 (point sources).

AECOM Expansion of the Advanced Waste Treatment Facility, Kemps Creek Resource Recovery Precinct - Air Quality Impact Assessment
28 March 2013
27
Table 9 Odour Area Sources
Source CALPUFF ID
Source Reference from Table 8
Odour Concentration (OU/m3)
Source Area (m2)
Emission Rate (OU/s/m2)
OUV/s Stability Class A - D Stability Class E,F
Near-field P/M60
Far-field P/M60
Near-field P/M60
Far-field P/M60
SAWT
SSO leachate pond FLP2 6 261 1,000 1 0.41 0.38 0.38 0.31 164
MSW leachate pond MLP 5 452 700 1 0.69 0.64 0.64 0.52 193
Compost Storage Pad (MSW) MFS 2 187 10,017 2 0.41 0.37 0.37 0.31 1,623
Compost Storage Pad (SSO) FFS 4 362 3,360 2 0.55 0.51 0.51 0.42 739
Landfill
General waste - active tip face (daytime) GWAD 8 14,960 700 22.99 21.15 21.15 17.47 6,437
General waste - daily cover (night time) GWAN 9 1,427 1,500 2.24 2.06 2.06 1.70 1,345
General waste - intermediate cover GWIC (1+2) 10 22 113,000 0.03 0.03 0.03 0.03 1,547
Restricted waste - active tip face (daytime) RWA 11 256 100 0.39 0.36 0.36 0.30 16
Restricted waste - daily cover (night time) RWA 12 138 100 0.22 0.20 0.20 0.16 9
Restricted waste - intermediate cover RWIC 13 65 57,000 0.10 0.09 0.09 0.07 2,249
Capped area (Cells C1, C2 + D1) CA1 14 NA 120,000 0.01 0.01 0.01 0.01 480
Capped area (Cells E1 + D1) CA2 14 NA 40,000 0.01 0.01 0.01 0.01 160
Capped area (Cells A1 - A3) CA3 14 NA 20,000 0.01 0.01 0.01 0.01 80 1 This value represents the typical fill height of the pond. The maximum fill height may vary from this value.
2 This value represents the surface are of the exposed compost on the storage pad. It does not represent the storage pad size as the pad floor itself is not an odour source. The exposed surface area
is calculated from the stockpiles height, width, length and shape, multiplied by the number of stockpiles.
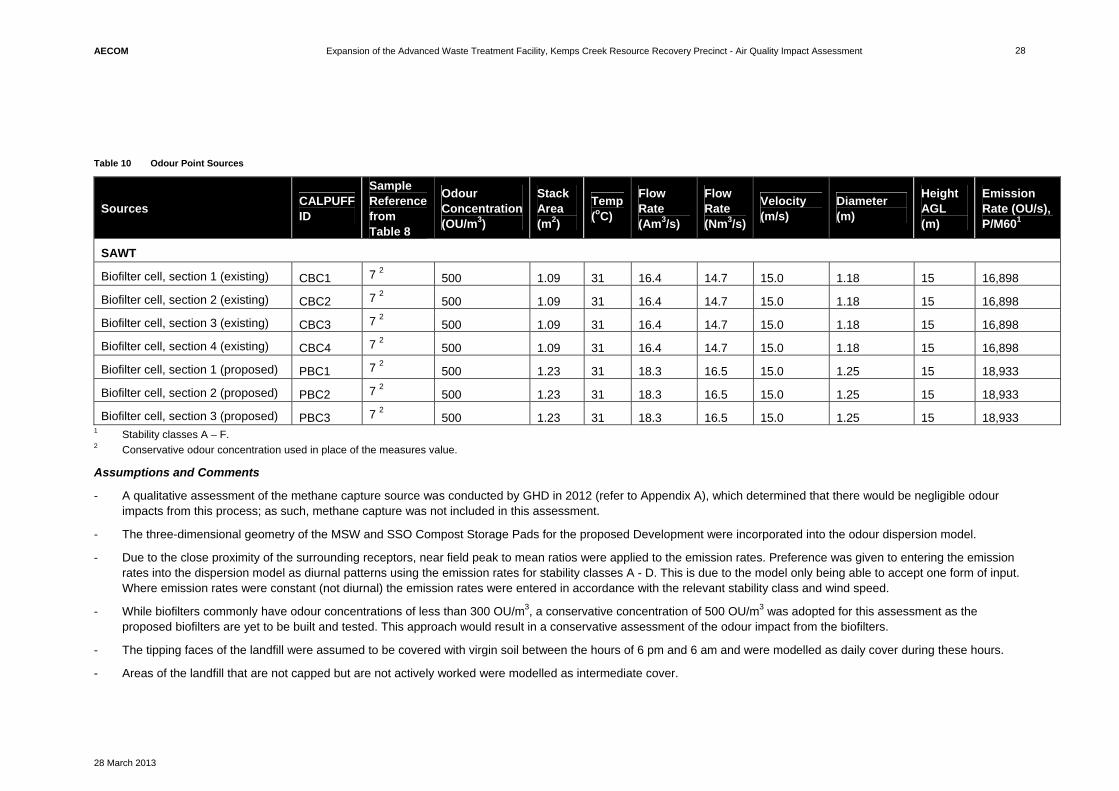
AECOM Expansion of the Advanced Waste Treatment Facility, Kemps Creek Resource Recovery Precinct - Air Quality Impact Assessment
28 March 2013
28
Table 10 Odour Point Sources
Sources CALPUFF ID
Sample Reference from Table 8
Odour Concentration (OU/m3)
Stack Area (m2)
Temp (oC)
Flow Rate (Am3/s)
Flow Rate (Nm3/s)
Velocity (m/s)
Diameter (m)
Height AGL (m)
Emission Rate (OU/s), P/M601
SAWT
Biofilter cell, section 1 (existing) CBC1 7 2 500 1.09 31 16.4 14.7 15.0 1.18 15 16,898
Biofilter cell, section 2 (existing) CBC2 7 2 500 1.09 31 16.4 14.7 15.0 1.18 15 16,898
Biofilter cell, section 3 (existing) CBC3 7 2 500 1.09 31 16.4 14.7 15.0 1.18 15 16,898
Biofilter cell, section 4 (existing) CBC4 7 2 500 1.09 31 16.4 14.7 15.0 1.18 15 16,898
Biofilter cell, section 1 (proposed) PBC1 7 2 500 1.23 31 18.3 16.5 15.0 1.25 15 18,933
Biofilter cell, section 2 (proposed) PBC2 7 2 500 1.23 31 18.3 16.5 15.0 1.25 15 18,933
Biofilter cell, section 3 (proposed) PBC3 7 2 500 1.23 31 18.3 16.5 15.0 1.25 15 18,933 1 Stability classes A – F. 2 Conservative odour concentration used in place of the measures value.
Assumptions and Comments
- A qualitative assessment of the methane capture source was conducted by GHD in 2012 (refer to Appendix A), which determined that there would be negligible odour impacts from this process; as such, methane capture was not included in this assessment.
- The three-dimensional geometry of the MSW and SSO Compost Storage Pads for the proposed Development were incorporated into the odour dispersion model.
- Due to the close proximity of the surrounding receptors, near field peak to mean ratios were applied to the emission rates. Preference was given to entering the emission rates into the dispersion model as diurnal patterns using the emission rates for stability classes A - D. This is due to the model only being able to accept one form of input. Where emission rates were constant (not diurnal) the emission rates were entered in accordance with the relevant stability class and wind speed.
- While biofilters commonly have odour concentrations of less than 300 OU/m3, a conservative concentration of 500 OU/m3 was adopted for this assessment as the proposed biofilters are yet to be built and tested. This approach would result in a conservative assessment of the odour impact from the biofilters.
- The tipping faces of the landfill were assumed to be covered with virgin soil between the hours of 6 pm and 6 am and were modelled as daily cover during these hours.
- Areas of the landfill that are not capped but are not actively worked were modelled as intermediate cover.

AECOM Expansion of the Advanced Waste Treatment Facility, Kemps Creek Resource Recovery Precinct - Air Quality Impact Assessment
28 March 2013
29
- The odour emissions from the current MSW and SSO leachate ponds were used in the model as indicative odour concentrations from the leachate ponds proposed as part of the Development. It should be noted, however, that the existing ponds collect leachate from maturing compost material whereas the proposed leachate ponds would only collect leachate from a fully processed compost product. As this final product is much less odorous than the maturing material, the use of these emissions is considered conservative and as such odour impacts from these sources may be overestimated.
Particulates
Details of the particulate sources assessed are provided in Table 11.
Table 11 Particulate Emission Sources
Source Source Type CALPUFF ID
Mitigation Measures Number of Modelled Sources1
Emissions per Source (g/s) Operating Hours
TSP PM10
Trucks unloading to stockpile Volume MT N/A 3 0.00001 0.000004 6 am – 10 pm
FELs tending stockpiles Volume FFEL2 N/A 3 0.095 0.034 6 am – 10 pm
FELs loading trucks Volume N/A
FELs driving on unsealed roads on the Compost Storage Pad
Volume Level 1 watering
Compost Storage Pad wind erosion
Area SWE Wind breaks, water sprays 1 0.0000017 0.0000008
24 hours
1 These data are a modelling reference, relating to the number of sources entered into the dispersion model to spread emissions over various locations and paths for the sources. The data does not
relate to the number of equipment or any other physical/operational information. 2All emissions associated with front end loaders were combined together and entered into the dispersion model as a single source.
Assumptions and Comments
- Wind erosion from the MSW and SSO Compost Storage Pads were included in the dispersion model while all other areas within the Site were assumed to be sealed.
- The biofilters were assumed to not emit dust.
- Wind breaks and water sprays were assumed to be used to mitigate dust emissions (wind erosion) from the MSW and SSO Compost Storage Pad.
- SITA indicated that the moisture content of the compost material stored on the MSW and SSO Compost Storage Pad is 35 – 45 percent. A value of 35 percent was adopted for the purpose of this assessment.
- While odour fences and other measures may be used on-site, associated dust and odour reductions could not be quantified for dispersion modelling and therefore were not included in the model.

AECOM Expansion of the Advanced Waste Treatment Facility, Kemps Creek Resource Recovery Precinct - Air Quality Impact Assessment
28 March 2013
30
This page has been left blank intentionally.

AECOM Expansion of the Advanced Waste Treatment Facility, Kemps Creek Resource Recovery Precinct - Air Quality Impact Assessment
28 March 2013
31
6.0 Sensitive Receptors Sensitive receptors are identified by the EPA in the Approved Methods(DEC, 2005) as anywhere someone works or resides or may work or reside, including residential areas, hospitals, hotels, shopping centres, play grounds, recreational centres, and the like. The primary sensitive receptors associated with the proposed Development are residences located in close proximity to the Site. The EPA have specified in writing (attached to the DGRs) additional areas that should also be considered [residences to the north-east such as Mt Vernon, residences along Mamre Road, the Erskine Park Industrial Area, Erskine Park, St Clair and Twin Creeks residential estate (to the north of the Site)].
Receptors included in the assessment are listed in Table 12 and shown in Figure 5. Residential premises are prefixed with an ‘R’, while commercial/industrial premises are prefixed with a ‘C’. The chosen receptors are expected to be within the zone of affectation of the proposed Development. Some of the receptors identified by the EPA are considered to be beyond this zone and were not specifically included in the dispersion model, however, potential impacts can be assessed by reviewing the pollutant contours provided in Section 7.0.
Table 12 Sensitive Receptor Locations
Receptor ID Latitude (m)
Longitude (m)
Base Elevation (m)
Description
R_1 293145 6250516 48 SITA Resource Recovery Precinct Access Road; Lakes Residence
R_2 294065 6250508 41 Weston Road
R_3 294788 6250113 56 Weston Road
R_4 294450 6249316 45 Elizabeth Drive
R_5 294142 6249197 46 Elizabeth Drive
R_6 293696 6249073 46 Overett Avenue
R_7 293401 6249322 52 Elizabeth Drive
R_8 292991 6248829 59 Martin Road
R_9 292745 6249446 60 Elizabeth Drive
R_10 292648 6248937 52 Lawson Road
R_11 292220 6249460 50 Elizabeth Drive
R_12 292437 6249648 51 Elizabeth Drive
R_13 291666 6249565 52 Elizabeth Drive
R_14 291536 6248839 61 Gardiner Road
R_15 291348 6249588 57 Elizabeth Drive
R_16 290931 6249672 66 Elizabeth Drive
R_17 291438 6250216 61 Private Road off Elizabeth Drive
R_18 290722 6250226 66 Private Road off Elizabeth Drive
R_19 291275 6250627 63 Private Road off Elizabeth Drive
R_20 291464 6250680 62 Private Road off Elizabeth Drive
R_21 292772 6249676 58 Private Road off Elizabeth Drive
R_22 293007 6249420 63 Elizabeth Drive
R_23 291377 6251026 67 Private Road off Elizabeth Drive
R_24 294689 6250969 47 Cliffton Avenue
R_25 294710 6251968 43 Mamre Road

AECOM Expansion of the Advanced Waste Treatment Facility, Kemps Creek Resource Recovery Precinct - Air Quality Impact Assessment
28 March 2013
32
Receptor ID Latitude (m)
Longitude (m)
Base Elevation (m)
Description
R_26 292610 6251976 46 Humewood Place; Twin Creeks Golf Estate
R_27 292669 6252477 52 Twin Creeks Drive; Twin Creeks Golf Estate
R_28 292448 6252775 46 Twin Creeks Drive; Twin Creeks Golf Estate
R_29 296584 6249553 52 Mamre Road
R_30 296045 6250325 46 Mamre Road
R_31 295513 6251565 44 Mamre Road
R_32 294654 6253357 42 Mamre Road
R_33 289476 6250718 59 Luddenham Road
R_34 290050 6251586 58 Luddenham Road
R_35 290740 6252294 52 Luddenham Road
R_36 291964 6253285 43 Portus Crescent; Twin Creeks Golf Estate
R_37 293150 6250188 50 SITA RRP Access Road; Caretakers Cottage
C_02 294615 6250033 52 Western Road
C_03 294159 6249419 45 Elizabeth Drive
C_04 294005 6249262 45 Elizabeth Drive
C_05 293190 6249253 60 Martin Road
C_08 292911 6249399 63 Elizabeth Drive
C_09 291955 6249515 49 Elizabeth Drive
C_10 291366 6250782 63 Private Road off Elizabeth Drive
C_11 291234 6251389 59 Private Road off Elizabeth Drive
C_12 294123 6251201 40 Private Road off Western Road
C_13 294560 6251923 40 Mamre Road
C_14 294426 6254982 38 Mamre Road
R = Residential Receptor
C = Commercial Receptor

R_8
R_6 R_5
R_4
R_29
R_30
R_31
R_24
R_37
R_3
R_2R_1
C_02
C_12
R_25C_13
R_32
C_14
R_36
R_28
R_27
R_26
R_35
R_34
R_33
C_11
C_10
R_23
R_18 R_17
R_16
R_14 R_10
R_20
R_19
R_15
R_13
C_03
C_04
R_23 R_21
C_09
R_11 R_9
R_7
C_05
R_22
C_08
Mulgoa
ErskinePark
KempsCreekKempsCreek
BadgerysCreek
BadgerysCreek
MountVernonMountVernon
Abbotsbury
Bossley Park
Greenfield Park
Bonnyrigg
Bonnyrigg Heights
Greendale
HeckenbergBusby
SadleirMiller
Cartwright
Lurnea
Cecil Hills
Green Valley
Austral
Hinchinbrook
Hoxton Park
Carnes Hill
CecilPark
West Hoxton
Middleton Grange
Rossmore
Elizabeth DriveElizabeth Drive
Ludden
ham
Road
Ludden
ham
Road
Mam
reR
oad
Mam
reR
oad
Weste
rnR
oad
ad
Devo
nsh
ire
Ro
ad
Ro
ad
Derw
en
tR
oad
Fifteenth Avenue
Gurner Avenue
WE
STLIN
KM
7
Twin CreeksGolf Club and
Residential Estate
Twin CreeksGolf Club and
Residential Estate
Kemps CreekKemps Creek
Kemps CreekKemps Creek
South CreekSouth Creek
South Creek
Badgerys Creek
Badgerys CreekBadgerys Creek
Cosgrove CreekCosgrove Creek
South CreekSouth Creek
Badgerys Creek Park
100ANL
Kemps Creek Resource
Recovery Precinct
The Development
Elizabeth Drive
Landfill
SENSITIVE RECEIVERS FOR AIR QUALITY
FIGURE 5
Environmental Impact Statement - Expansion of the Advanced Waste Treatment Facility,
Kemps Creek Resource Recovery Precinct
G:\
Pro
jects
\602
Pro
jects
\60250100
Kem
ps
Cre
ek\F
IGU
RE
S\E
IS\6
0250100
F5
Receiv
ers
for
Air
Qualit
y20
12
2012
TO
Re
vB
KEY
Resource Recovery Precinct Boundary
Site Boundary
Road
Watercourse
Sensitive receiver
0 2.5km

AECOM Expansion of the Advanced Waste Treatment Facility, Kemps Creek Resource Recovery Precinct - Air Quality Impact Assessment
28 March 2013
34
This page has been left blank intentionally.

AECOM Expansion of the Advanced Waste Treatment Facility, Kemps Creek Resource Recovery Precinct - Air Quality Impact Assessment
28 March 2013
35
7.0 Modelling Results
7.1 Odour
The maximum 99th percentile odour concentrations predicted at the sensitive receptor locations as a result of operation of the proposed Development(i.e. the landfill not included) are shown in Figure 6.Tabulated data is provided in Table 13 and presented as the impacts of the Development alone and the cumulative impacts of the development and the landfill. As shown, the highest predicted concentration at a sensitive receptor was 1.6 OU, which is well below the 4 OU odour criterion adopted for this assessment.
Cumulative odour emissions from operation of the proposed Development and the landfill were also assessed and are shown in Figure 7. As shown, the maximum 99th percentile odour concentrations at most sensitive receptors were below the criterion of 4 OU. Odour concentrations between 4.5 and 5.1 OU were predicted at two receptors located adjacent to the eastern boundary of the Resource Recovery Precinct, receptors R1 and R37 located off the SITA Resource Recovery Precinct access road.
Mitigation measures to minimise potential odour impacts from operation of the Development are discussed in Section 8.
Table 13 Odour Ground Level Concentrations (OU) at Discrete Receptors
Receptor ID
Coordinates (km) Odour Ground Level Concentration (OU)
X Y Development alone Development and landfill
R_1 293.145 6250.516 1.6 5.1
R_2 294.065 6250.508 0.4 0.9
R_3 294.788 6250.113 0.3 0.6
R_4 294.45 6249.316 0.2 0.4
R_5 294.142 6249.197 0.2 0.5
R_6 293.696 6249.073 0.3 0.5
R_7 293.401 6249.322 0.4 0.9
R_8 292.991 6248.829 0.3 0.7
R_9 292.745 6249.446 0.6 1.7
R_10 292.648 6248.937 0.4 0.9
R_11 292.22 6249.46 0.6 1.3
R_12 292.437 6249.648 0.8 2.2
R_13 291.666 6249.565 0.5 1.2
R_14 291.536 6248.839 0.3 0.6
R_15 291.348 6249.588 0.4 0.9
R_16 290.931 6249.672 0.3 0.6
R_17 291.438 6250.216 0.8 1.7
R_18 290.722 6250.226 0.4 0.7
R_19 291.275 6250.627 0.9 1.6
R_20 291.464 6250.68 1.3 2.2
R_21 292.772 6249.676 0.8 2.5
R_22 293.007 6249.42 0.6 1.4
R_23 291.377 6251.026 1.2 2.0
R_24 294.689 6250.969 0.3 0.7
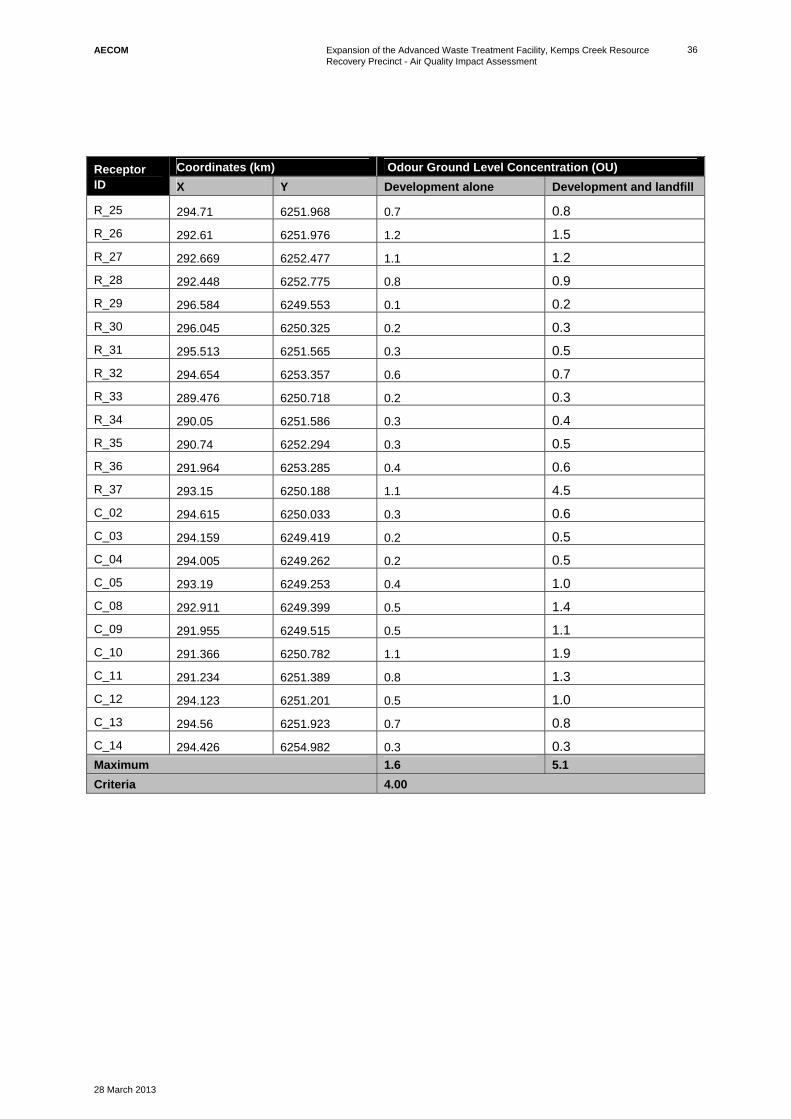
AECOM Expansion of the Advanced Waste Treatment Facility, Kemps Creek Resource Recovery Precinct - Air Quality Impact Assessment
28 March 2013
36
Receptor ID
Coordinates (km) Odour Ground Level Concentration (OU)
X Y Development alone Development and landfill
R_25 294.71 6251.968 0.7 0.8
R_26 292.61 6251.976 1.2 1.5
R_27 292.669 6252.477 1.1 1.2
R_28 292.448 6252.775 0.8 0.9
R_29 296.584 6249.553 0.1 0.2
R_30 296.045 6250.325 0.2 0.3
R_31 295.513 6251.565 0.3 0.5
R_32 294.654 6253.357 0.6 0.7
R_33 289.476 6250.718 0.2 0.3
R_34 290.05 6251.586 0.3 0.4
R_35 290.74 6252.294 0.3 0.5
R_36 291.964 6253.285 0.4 0.6
R_37 293.15 6250.188 1.1 4.5
C_02 294.615 6250.033 0.3 0.6
C_03 294.159 6249.419 0.2 0.5
C_04 294.005 6249.262 0.2 0.5
C_05 293.19 6249.253 0.4 1.0
C_08 292.911 6249.399 0.5 1.4
C_09 291.955 6249.515 0.5 1.1
C_10 291.366 6250.782 1.1 1.9
C_11 291.234 6251.389 0.8 1.3
C_12 294.123 6251.201 0.5 1.0
C_13 294.56 6251.923 0.7 0.8
C_14 294.426 6254.982 0.3 0.3
Maximum 1.6 5.1
Criteria 4.00

AECOM Expansion of the Advanced Waste Treatment Facility, Kemps Creek Resource Recovery Precinct - Air Quality Impact Assessment
28 March 2013
37
7.2 Particulates
Predicted emissions of particulates from operation of the proposed Development and cumulative concentrations of particulates [i.e. maximum dispersion model prediction for the Development plus existing background concentrations (refer to Section 4.1)] are presented in Table 14. The table presents the maximum result at any of the modelled receptors.
Table 14 Predicted Maximum Receptor Development and Cumulative Ground Level Particulate Concentrations
Pollutant Averaging Period
Ground Level Concentration/Deposition Rate Criteria Units
Development Background Cumulative
PM10 24 hour 5.3 73.9 79.2 50 g/m3
Annual 0.5 14.7 15.2 30 g/m3
TSP Annual 0.3 34 34.3 90 g/m3
Deposited Dust Annual 0.045 5.5 5.55 4 g/m2.month
Note: Exceedences of the EPA criteria are denoted in bold.
As shown in Table 14, the predicted levels of particulate emissions at surrounding receptors from operation of the proposed Development are well below the EPA impact assessment criteria for each pollutant and the averaging period assessed. The cumulative concentrations of annual PM10 and TSP at sensitive receptors are also below the impact assessment criteria. Both the existing background and predicted cumulative emissions of 24 hour PM10 and deposited dust exceed the impact assessment criteria.
The major contributor to the cumulative results for both 24 hour PM10 and deposited dust is the background value. For both 24 hour PM10 and deposited dust the additional maximum increases at any receptor of 5.3 g/m3and 0.045 g/m2.month, respectively as a result of the proposed Development are not considered to represent substantial increases over the existing background levels.
The distribution of PM10and TPS are shown in Figure 8 through 10. Deposited dust is not shown on a figure because of to the minor concentrations predicted. The results show that the highest impacts occur on-site, with concentrations reducing as the dust moves off-site.
Further analysis of the results was conducted to determine the percentage of the proposed Development’s potential impacts compared to the criteria, background concentrations and cumulative impacts. As shown in Table 15, the Development is likely to be a minor contributor to the cumulative impacts, specifically for annual PM10, TSP and dust deposition, with contributions of less than two percent of the criteria and four percent of the cumulative value. While the 24 hour PM10 shows a greater contribution, representing just less than 11 percent of the criteria and a little less than seven percent of the cumulative value, it is still not considered a substantial increase over the existing background levels.
Table 15 Predicted Particulate Concentrations from the Development as a Percentage of the Criteria, Background and Cumulative Concentrations
Pollutant Averaging Period
Predicted Concentration as Percentage
Of Criterion Of Background Concentration
Of Cumulative Concentration
PM10 24 hour 10.6% 7.2% 6.7%
Annual 1.7% 3.4% 3.3%
TSP Annual 0.3% 0.9% 0.9%
Dust deposition Annual 1.1% 0.8% 0.8%
Mitigation measures to minimise emissions of particulates from the proposed Development are discussed in Section 8.

AECOM Expansion of the Advanced Waste Treatment Facility, Kemps Creek Resource Recovery Precinct - Air Quality Impact Assessment
28 March 2013
38
This page has been left blank intentionally.

Badgerys Creek
Badgerys Creek
R_20
C_10
R_19
R_23
R_26
R_1
R_37
R_21
R_22
R_7
R_9
R_12
R_11
R_13R_15
C_09
C_05
R_10
R_8
C_08
R_6
Elizabeth DriveElizabeth Drive
Mam
reR
oad
Law
so
nR
oad
Law
so
nR
oad
Mart
inR
oad
Mart
inR
oad
Overett Avenue
Weste
rnR
oad
LuddenhamRoad
Access
Ro
ad
Access
Ro
ad
BadgerysCreek
BadgerysCreek
KempsCreek
BoralBadgerys Creek
Twin CreeksGolf Club and
Residential Estate Sou
thC
reek
Bad
gery
sC
reek
Cosgroves Creek
ANL
South Creek
South
South
Cre
ek
Fleurs RadioObservatoryField Station
FlOFi
Access Road
Elizabeth Drive
Landfill
The Development
Kemps Creek Resource
Recovery Precinct
PREDICTED ODOUR CONCENTRATIONS (99th PERCENTILE) - DEVELOPMENT ONLY
FIGURE 6
Environmental Impact Statement - Expansion of the Advanced Waste Treatment Facility,
Kemps Creek Resource Recovery Precinct
G:\P
roje
cts
\602
Pro
jects
\60250100
Kem
ps
Cre
ek\F
IGU
RE
S\E
IS\6
0250100
6P
redic
ted
Odour
Conto
urs
-99th
Perc
entile
-D
evelo
pm
ent
Only
19
12
2012
TO
Rev
D
KEYResource Recovery Precinct Boundary
Site boundary
Main road
Minor road
Watercourse
2
3
4
5
6
Sensitive Receptor
0 500m
Nose-Response-Time-Concentration - OU (Criteria 4OU)

AECOM Expansion of the Advanced Waste Treatment Facility, Kemps Creek Resource Recovery Precinct - Air Quality Impact Assessment
28 March 2013
40
This page has been left blank intentionally.

Badgerys Creek
Badgerys Creek
R_20
C_10
R_19
R_23
R_26
R_1
R_37
R_21
R_22
R_7
R_9
R_12
R_11
R_13R_15
C_09
C_05
R_10
R_8
C_08
R_6
Elizabeth DriveElizabeth Drive
Mam
reR
oad
Law
so
nR
oad
Law
so
nR
oad
Mart
inR
oad
Mart
inR
oad
Overett Avenue
Weste
rnR
oad
LuddenhamRoad
Access
Ro
ad
Access
Ro
ad
BadgerysCreek
BadgerysCreek
KempsCreek
BoralBadgerys Creek
Twin CreeksGolf Club and
Residential Estate Sou
thC
reek
Bad
gery
sC
reek
Cosgroves Creek
ANL
South Creek
South
South
Cre
ek
Fleurs RadioObservatoryField Station
FlOFi
Access Road
Elizabeth Drive
Landfill
The Development
Kemps Creek Resource
Recovery Precinct
PREDICTED ODOUR CONCENTRATIONS (99th PERCENTILE) - DEVELOPMENT AND LANDFILL
FIGURE 7
Environmental Impact Statement - Expansion of the Advanced Waste Treatment Facility,
Kemps Creek Resource Recovery Precinct
G:\P
roje
cts
\602
Pro
jects
\60250100
Kem
ps
Cre
ek\F
IGU
RE
S\E
IS\6
0250100
F7
Pre
dic
ted
Odour
Conto
urs
-99th
Perc
entile
-D
evelo
pm
ent
and
Landfill
20
12
2012
TO
Rev
D
KEYResource Recovery Precinct Boundary
Site boundary
Main road
Minor road
Watercourse
2
3
4
5
6
Sensitive Receptor
0 500m
Nose-Response-Time-Concentration - OU (Criteria 4OU)

AECOM Expansion of the Advanced Waste Treatment Facility, Kemps Creek Resource Recovery Precinct - Air Quality Impact Assessment
28 March 2013
42
This page has been left blank intentionally.

Badgerys Creek
Badgerys Creek
R_20
C_10
R_19
R_23
R_26
R_1
R_37
R_21
R_22
R_7
R_9
R_12
R_11
R_13R_15
C_09
C_05
R_10
R_8
C_08
R_6
Elizabeth DriveElizabeth Drive
Mam
reR
oad
Law
so
nR
oad
Law
so
nR
oad
Mart
inR
oad
Mart
inR
oad
Overett Avenue
Weste
rnR
oad
LuddenhamRoad
Access
Ro
ad
Access
Ro
ad
BadgerysCreek
BadgerysCreek
KempsCreek
BoralBadgerys Creek
Twin CreeksGolf Club and
Residential Estate Sou
thC
reek
Bad
gery
sC
reek
Cosgroves Creek
ANL
South Creek
South
South
Cre
ek
Fleurs RadioObservatoryField Station
FlOFi
Access Road
Elizabeth Drive
Landfill
The Development
Kemps Creek Resource
Recovery Precinct
MAXIMUM PREDICTED 24 HOUR PM - DEVELOPMENT ONLY
FIGURE 8
Environmental Impact Statement - Expansion of the Advanced Waste Treatment Facility,
Kemps Creek Resource Recovery Precinct
G:\P
roje
cts
\602
Pro
jects
\60250100
Kem
ps
Cre
ek\F
IGU
RE
S\E
IS\6
0250100
F8
Maxim
um
Pre
dic
ted
24hour
Pm
1019
12
2012
TO
Rev
C
10
KEYResource Recovery Precinct Boundary
Site boundary
Main road
Minor road
Watercourse
5
10
15
20
Sensitive Receptor
0 500m
24hr Average Concentration - ug/m (Criteria 50ug/m )3 3

AECOM Expansion of the Advanced Waste Treatment Facility, Kemps Creek Resource Recovery Precinct - Air Quality Impact Assessment
28 March 2013
44
This page has been left blank intentionally.
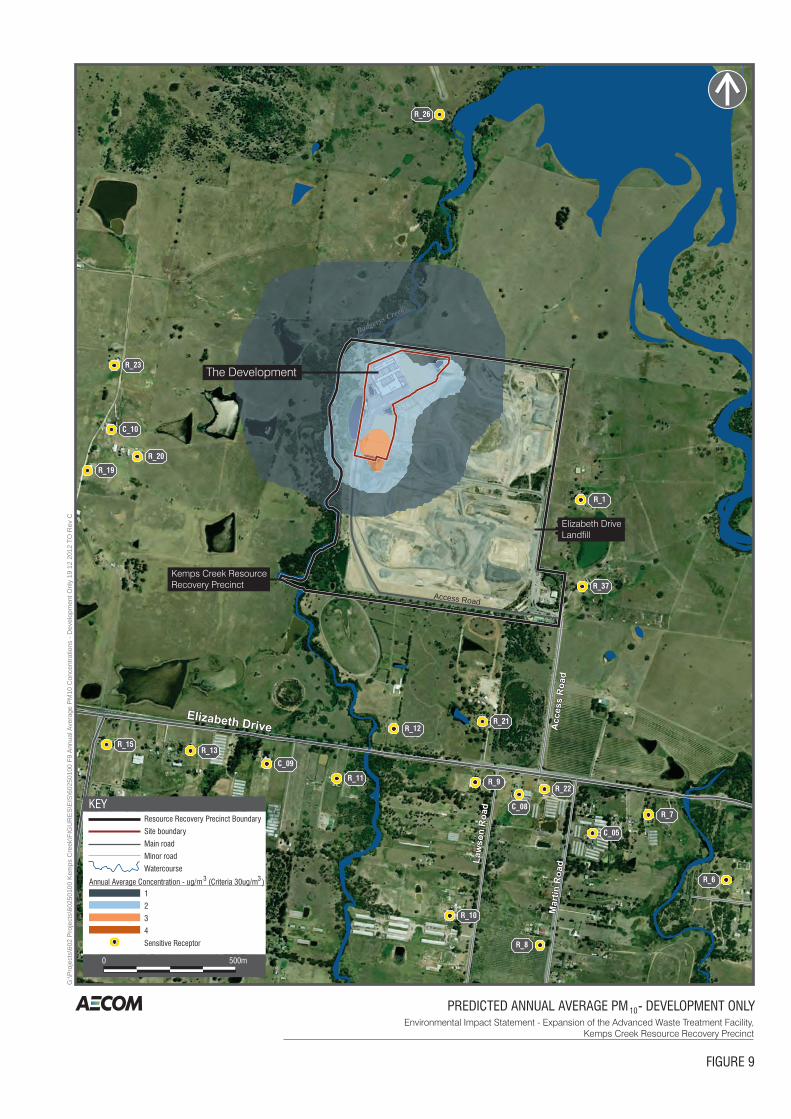
Badgerys Creek
Badgerys Creek
R_20
C_10
R_19
R_23
R_26
R_1
R_37
R_21
R_22
R_7
R_9
R_12
R_11
R_13R_15
C_09
C_05
R_10
R_8
C_08
R_6
Elizabeth DriveElizabeth Drive
Mam
reR
oad
Law
so
nR
oad
Law
so
nR
oad
Mart
inR
oad
Mart
inR
oad
Overett Avenue
Weste
rnR
oad
LuddenhamRoad
Access
Ro
ad
Access
Ro
ad
BadgerysCreek
BadgerysCreek
KempsCreek
BoralBadgerys Creek
Twin CreeksGolf Club and
Residential Estate Sou
thC
reek
Bad
gery
sC
reek
Cosgroves Creek
ANL
South Creek
South
South
Cre
ek
Fleurs RadioObservatoryField Station
FlOFi
Access Road
Elizabeth Drive
Landfill
The Development
Kemps Creek Resource
Recovery Precinct
PREDICTED ANNUAL AVERAGE PM - DEVELOPMENT ONLY
FIGURE 9
G:\P
roje
cts
\602
Pro
jects
\60250100
Kem
ps
Cre
ek\F
IGU
RE
S\E
IS\6
0250100
F9
Annual A
vera
ge
PM
10
Concentr
ations
-D
evelo
pm
ent
Only
19
12
2012
TO
Rev
C
10
Environmental Impact Statement - Expansion of the Advanced Waste Treatment Facility,
Kemps Creek Resource Recovery Precinct
KEYResource Recovery Precinct Boundary
Site boundary
Main road
Minor road
Watercourse
1
2
3
4
Sensitive Receptor
0 500m
Annual Average Concentration - ug/m (Criteria 30ug/m )3 3

AECOM Expansion of the Advanced Waste Treatment Facility, Kemps Creek Resource Recovery Precinct - Air Quality Impact Assessment
28 March 2013
46
This page has been left blank intentionally.

Badgerys Creek
Badgerys Creek
R_20
C_10
R_19
R_23
R_26
R_1
R_37
R_21
R_22
R_7
R_9
R_12
R_11
R_13R_15
C_09
C_05
R_10
R_8
C_08
R_6
Elizabeth DriveElizabeth Drive
Mam
reR
oad
Law
so
nR
oad
Law
so
nR
oad
Mart
inR
oad
Mart
inR
oad
Overett Avenue
Weste
rnR
oad
LuddenhamRoad
Access
Ro
ad
Access
Ro
ad
BadgerysCreek
BadgerysCreek
KempsCreek
BoralBadgerys Creek
Twin CreeksGolf Club and
Residential Estate Sou
thC
reek
Bad
gery
sC
reek
Cosgroves Creek
ANL
South Creek
South
South
Cre
ek
Fleurs RadioObservatoryField Station
FlOFi
Access Road
Kemps Creek Resource
Recovery Precinct
Elizabeth Drive
Landfill
The Development
PREDICTED ANNUAL AVERAGE TSP CONCENTRATIONS - DEVELOPMENT ONLY
FIGURE 10
G:\P
roje
cts
\602
Pro
jects
\60250100
Kem
ps
Cre
ek\F
IGU
RE
S\E
IS\6
0250100
F10
Annual A
vera
ge
TS
PC
oncentr
ations
-D
evelo
pm
ent
Only
20
2012
TO
Rev
D
Environmental Impact Statement - Expansion of the Advanced Waste Treatment Facility,
Kemps Creek Resource Recovery Precinct
KEYResource Recovery Precinct Boundary
Site boundary
Main road
Minor road
Watercourse
1
2
3
4
Sensitive Receptor
0 500m
Annual Average Concentration - ug/m (Criteria 90ug/m )3 3

AECOM Expansion of the Advanced Waste Treatment Facility, Kemps Creek Resource Recovery Precinct - Air Quality Impact Assessment
28 March 2013
48
This page has been left blank intentionally.

AECOM Expansion of the Advanced Waste Treatment Facility, Kemps Creek Resource Recovery Precinct - Air Quality Impact Assessment
28 March 2013
49
8.0 Mitigation The key objectives of any environmental management program are to protect human health and the environment. Best practice management should be employed at all times and should be clearly outlined within any documentation relating to construction or operational work practices. The following sections provide discussion of mitigation measures appropriate for the construction and operational phases of the Development.
Mitigation of impacts relating to construction works is essentially a management exercise. For a long term construction activity, the focus should be on implementing a strict dust management regime supplemented by the use of ambient pollutant monitoring where appropriate. Monitoring enables the assessment (in particular) of health impacts and the effectiveness of management measures.
From an operational perspective, dust mitigation measures from the site activities should be focused on the internal processing of compost, loading and unloading on the final product stockpile, wind erosion from the stockpile and wheel generated dust on the pad and other unsealed road areas. Internal operations would be mitigated by ensuring the negative pressure of the building is maintained and having all collected air filtered through a biofilter prior to release to the atmosphere though a vertical stack. Leachate from composting operations would be collected and re-used in the process, avoiding any exposure to the external atmosphere. The emissions inventory used in the modelling assessment was developed on the assumption that water sprays would be applied on the stockpile pad to supress emissions from wheel generated dust and material handling, and wind breaks would be installed to help reduce the wind blown dust and limit the movement of particulates off-site.
The below points summarise the primary management measures to address emissions of dust and odour from the construction and operational activities from the Development:
- measures to modify or suspend dust-generating activities during periods of high wind speeds or whenever dust plumes from the works are visible
- sealing regularly trafficked surfaces as soon as possible after construction and limiting speed limits
- vehicular access confined to designated sealed access roads and minimising haul road lengths
- equipment, plant and machinery regularly tuned, modified or maintained to minimise visible smoke and emissions
- ensuring the SAWT facility roller doors are closed whenever practicable
- continuation of dust deposition monitoring at the Site boundary
- complaints management system in place.
These measures can be evaluated at any time during a project life and reviewed accordingly. It should be noted that the list is not comprehensive and would need to be supplemented with additional site-specific measures that are identified as appropriate during construction and operation. It should also be noted that an odour fence was not considered a necessary mitigation measure for the operational phase of the Development as odour exceedances measured were associated with the landfill.
In addition to those mitigation measures stated, targeted receptor-based consultation and mitigation is required, specifically for potential odour impacts. SITA is currently in discussion with the affected landowner potentially impacted by odour above EPA criteria with the aim of reaching agreement regarding suitable mitigation.

AECOM Expansion of the Advanced Waste Treatment Facility, Kemps Creek Resource Recovery Precinct - Air Quality Impact Assessment
28 March 2013
50
This page has been left blank intentionally.

AECOM Expansion of the Advanced Waste Treatment Facility, Kemps Creek Resource Recovery Precinct - Air Quality Impact Assessment
28 March 2013
51
9.0 Conclusion Odour is the prime air quality issue of concern for the existing SAWT and landfill. This assessment analysed the impact on local air quality associated with the proposed Development. Emissions of odour and particulate matter from the Development were assessed using the CALPUFF dispersion model.
In an effort to establish the odour generation potential of the expanded developments original concept design, AECOM was requested to undertake preliminary odour dispersion modelling. The concept design details were used in the dispersion model to estimate the likely odour contribution from each of the sources and identify those sources that had a higher potential than others to create an odour nuisance. The process positively informed the Development’s design, considerably decreasing the Development’s odour generating potential.
The results of the modelling undertaken for the modified Development design indicate that the maximum 99th percentile odour concentrations at all sensitive receptors were below the criterion of 4 OU.
When the cumulative assessment was undertaken for the proposed Development and the adjacent landfill, odour concentrations between 4.5 and 5.1 OU were predicted at two receptors located adjacent to the eastern boundary of the Resource Recovery Precinct (receptors R1 and R37 which are located off the SITA Resource Recovery Precinct access road).. Mitigation measures beyond that assumed in the modelling are discussed in Section 8; implementation of the measures is required to limit the exposure of the two receptors where odour concentrations above 4 OU may occur.
The proposed modifications that form part of the Development would essentially remove a substantial amount of particulate sources associated with the Development operations. The dispersion modelling suggests that the predicted levels of particulate emissions at surrounding receptors from operation of the proposed Development are well below the EPA impact assessment criteria for each pollutant. The cumulative concentrations (proposed Development plus the background) of annual PM10 and TSP at sensitive receptors are also below the impact assessment criteria. Both the existing background and predicted cumulative emissions of 24 hour PM10 and deposited dust exceed the impact assessment criteria. The major contributor to the cumulative results for both 24 hour PM10 and deposited dust is the background value. For both 24 hour PM10 and deposited dust the additional maximum increases at any receptor of 5.3 g/m3 and 0.045 g/m2.month, respectively as a result of the proposed Development are not considered to represent substantial increases over the existing background levels.
Provided that the Development is operated in accordance with the assumptions made in this assessment, and that all reasonable measures are taken to limit the odour and dust emissions associated with the Development’s operations, the Development is not expected to adversely affect the air quality at the sensitive receptor locations assessed.

AECOM Expansion of the Advanced Waste Treatment Facility, Kemps Creek Resource Recovery Precinct - Air Quality Impact Assessment
28 March 2013
52
This page has been left blank intentionally.

AECOM Expansion of the Advanced Waste Treatment Facility, Kemps Creek Resource Recovery Precinct - Air Quality Impact Assessment
28 March 2013
53
10.0 References AECOM, 2012, Upgrade of Kemps Creek SAWT Facility - EIS Scoping Document.
Australian Standard (AS) 4323.4; 2009, Stationary source emissions; Method 4: Area source sampling – Flux chamber technique.
Australian Standard AS 4323.3; 2001, Stationary source emissions; Method 3: Determination of odour by dynamic olfactometry.
DEC, 2005, Approved Methods for the Modelling and Assessment of Air Pollutants in New South Wales.
Holmes Air Sciences, 2008, Air Quality – odour and dust: light horse business centre development application.
OEH, 2012, Odour emissions and mitigation study - Camden Soil Mix Mount Annan, NSW.

AECOM Expansion of the Advanced Waste Treatment Facility, Kemps Creek Resource Recovery Precinct - Air Quality Impact Assessment
28 March 2013
54
This page has been left blank intentionally.

AECOM Expansion of the Advanced Waste Treatment Facility, Kemps Creek Resource Recovery Precinct - Air Quality Impact Assessment
28 March 2013
A
Appendix A
GHD Methane Flare Report

21/19947/98089
30 April 2012
To Matt Welsh
Copy to Anthony Dixon, Barry Cook
From Tristan Gribble Tel 02 4979 9999
Subject SITA Australia - Odour Assessment for Elizabeth Drive Landfill
Job no. 21/19947
Matt,
It is our understanding that SITA Australia (SITA) wish to submit a Development Application (DA) to
Penrith City Council for a landfill gas fuelled power station and flare at the Elizabeth Drive Landfill site, located in Kemps Creek, NSW.
As part of this DA, an assessment of odour impacts is required from the power station and flare only. A
quantitative assessment of odour emissions from the landfill cells or other activities on site is excluded from this assessment.
1 Process Overview and Methodology
Landfill gas (LFG) is a product of the decomposition of organic waste under anaerobic conditions (as
typically found within a landfill site). LFG typically consists of approximately 50% v/v methane (which is odourless), 50% v/v carbon dioxide (which is odourless) and approximately 1% v/v of a complex mixture of “trace gases” (i.e. other chemical compounds, some of which can be odorous). Both methane and
carbon dioxide are considered to be greenhouse gases. However, according to the NSW government Landfill gas emission management fact sheet1 methane is a 22 - 25 times more potent greenhouse gas
than carbon dioxide.
The large methane content of typical LFG means it is a valuable fuel source. This fuel can be collected and burnt to produce electricity, or alternatively used as a direct fuel for gas-powered facilities.
The combustion of LFG in power generation (or by flaring) prevents the direct release of raw LFG (and
the chemical compounds it contains) into the atmosphere. The major products of this combustion process will be carbon dioxide and water (both of which are odourless). However, the combustion of LFG in power generation or flaring may also release small quantities of other products, such as particulate
matter, carbon monoxide, nitrogen oxides and sulphur dioxides. The major advantages of the thermal destruction of LFG are the removal of the more potent greenhouse gas component (methane) and trace amounts of odorous gases (e.g. Hydrogen Sulphide) typically contained within LFG.
Requirements in relation to LFG management in NSW are generally expressed in terms of minimising emissions. The NSW Environmental Protection Authority (EPA)2 recommends that LFG be ‘sustainably utilised’.
1 Newcastle City Council, Landfill Gas, May 2011. 2 NSW EPA, Environmental Guidelines: Solid Waste Landfills, 1996.

2
21/19947/98089
There has been no written guidance provided by Penrith City Council regarding the level of detail
required for this odour assessment. Therefore, based on previous experience, GHD has undertaken a semi-quantitative assessment of (i) the reduction in odorous emissions from the landfill cells due to the capture and combustion of LFG through the power station and flare, and (ii) the potential for odorous
emissions from the operation of the power station and flare. Section L7.1 of the site’s Environmental Protection Licence (NSW EPA Licence number 4068) states that the ‘licensee must not cause or permit the emission of any offensive odour from the premises’.
2 Assessment
The proposed power station and flare are located within the Elizabeth Drive Landfill site, approximately 600 metres from the nearest sensitive receptors. The power station will consist of three LFG fuelled
engines and a flare. Each LFG fuelled engine will have the capacity to combust approximately 600 m3/hr of LFG (i.e. each engine will have the capacity to generate 1.4 MW of electricity), whilst the flare will have the capacity to combust approximately 2000 m3/hour of LFG. Essentially this means that the LFG fuelled
engines (in combination) and the flare (on its own) will have approximately equivalent capacities for LFG combustion. Currently it is anticipated that the majority of the LFG collected at the site will be combusted by the LFG fuelled engines, with the flare only operating when additional LFG destruction is required
(e.g. during periods of engine maintenance).
The collection and combustion of LFG (either via LFG fuelled engines or a flare) reduces its trace gas and methane content before it is released to the atmosphere. This significantly reduces both potential
odour and greenhouse gas emissions to the atmosphere. Both LFG fuelled engines and flares have a typical destruction efficiency between 95 and 99.5% for volatile organic compounds (some of which are odorous) contained in the incoming LFG stream.
Periods when both the LFG fuelled engines and the flare are non-operational (e.g. due to a failure of the electricity supply) are likely to be rare and relatively short-lived (i.e. a matter of hours rather than days or weeks). No emissions of LFG or combustion products would be likely to occur at the power station or
flare during these periods (the likely system design will prevent any emissions occurring).
As previously discussed, emissions to air from the operation of the LFG fuelled engines and / or the flare will be primarily carbon dioxide and water (although small quantities of other products such as particulate
matter, carbon monoxide, nitrogen oxides and sulphur dioxides are also likely to occur). Assuming the engines and / or flare are operating efficiently and in accordance with the manufacturers specifications, odorous emissions from the operation of the LFG fuelled engines and / or flare will be minimal and are
likely to be confined to the area immediately surrounding the power station. Maximum ground level concentrations of the particulates and combustion products released by the LFG fuelled engines and / or flare will typically occur at about ten times the respective stack height downwind of the point source of
emission. It is understood that the flare stack will be the highest point source of emission at circa 9 metres high. Therefore, the maximum ground level concentrations of any potentially odorous emission released due to the LFG combustion process will be located at circa 90 metres from the LFG flare (i.e.
still within the site boundary). As such, it is considered that any potentially odorous emissions due to the LFG combustion process are likely to be confined within the landfill site boundary.

3
21/19947/98089
In summary, it is considered that the proposed development will significantly decrease the risk of off-site
emissions of potentially odorous compounds from the landfill operations at the site. It is widely accepted within the worldwide waste management industry that it is generally better to combust LFG rather than to release it directly into the atmosphere as a potentially odorous greenhouse gas. Any potential odour
impacts from the operation of the power station and / or flare are expected to be confined within the landfill site boundary and therefore to be unlikely to have any adverse impacts upon the nearest sensitive receptors (which are circa 600 metres from the power station’s proposed location).
3 Recommendations
In reference to the NSW Government Protection of the Environment Operation (Clean Air) Regulation (2010) (POEO), any flare operated for the treatment of air impurities must be operated at all times while
the air impurities need to be treated. The flare should have a destruction efficiency of at least 98% or higher.
Schedule 2 of the POEO outlines the ‘Standards of concentration for schedules premises: afterburners, flares and vapour recovery units’ that would apply to the project. The operator of the power station
should ensure that air emissions from the LFG fuelled engines and flare meet the requirements of the POEO. This could potentially be confirmed by on-going stack emissions testing once the power station
and flare have been commissioned.
It is also recommended that the LFG is directed to the power station engines as far as practicable and that the flare is only used when LFG cannot be combusted by these engines (e.g. during maintenance
periods).
4 Conclusions
The development of a LFG power station and flare at the Elizabeth Drive Landfill will assist in minimising both potential odorous emissions and greenhouse gas emissions from the landfill site. The collection and
combustion of LFG is expected to destroy approximately 95 to 99.5% of odorous organic gases contained within the incoming LFG stream. The primary emissions to air from the power station and / or flare will be carbon dioxide and water (both of which are odourless) although there are likely to be small
emissions of other products such as particulate matter and gaseous products of combustion. Potential impacts from possible odorous emissions released from the power station and / or flare are expected to be confined within the landfill site boundary. Given the 600 metre separation distance between the power
station and the nearest off-site sensitive receptors, any odorous emissions from the power station are likely to have negligible impact off site.
Regards
Tristan Gribble Engineer - Air, Noise and Vibration

AECOM Expansion of the Advanced Waste Treatment Facility, Kemps Creek Resource Recovery Precinct - Air Quality Impact Assessment
28 March 2013
B
Appendix B
Meteorological Review

AECOM Expansion of the Advanced Waste Treatment Facility, Kemps Creek Resource Recovery Precinct - Air Quality Impact Assessment
28 March 2013
B-1
Appendix B Meteorological Review The following appendix discusses the meteorological data used for the SAWT Development dispersion modelling, in terms of wind speed, stability class and mixing height.
Wind Speed
The frequency distribution of hourly averaged wind speed values from the CALMET data generated for the assessment is shown below in Figure 11. As shown, wind speeds in the area are relatively low, with speeds less than 2 m/s occurring for nearly 80 percent of the time. Medium to strong winds (> 4 m/s) occurring approximately six percent of the time.
Figure 11 Frequency Distribution of Wind Speed; SITA CALMET Data, 2011
Figure 12 shows the distribution of wind speeds by hour of day. As shown, there is little variation in the average wind speeds throughout the day. Peak wind speeds, however, tend to occur between 9 am and 1 pm.
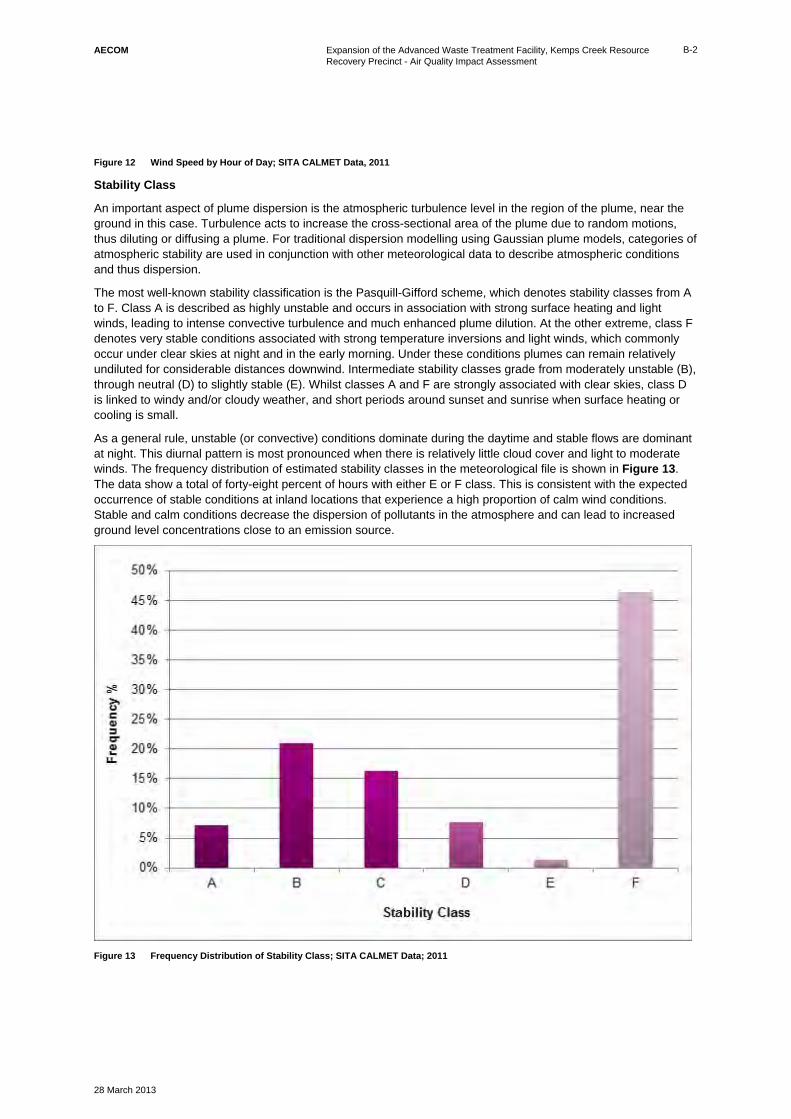
AECOM Expansion of the Advanced Waste Treatment Facility, Kemps Creek Resource Recovery Precinct - Air Quality Impact Assessment
28 March 2013
B-2
Figure 12 Wind Speed by Hour of Day; SITA CALMET Data, 2011
Stability Class
An important aspect of plume dispersion is the atmospheric turbulence level in the region of the plume, near the ground in this case. Turbulence acts to increase the cross-sectional area of the plume due to random motions, thus diluting or diffusing a plume. For traditional dispersion modelling using Gaussian plume models, categories of atmospheric stability are used in conjunction with other meteorological data to describe atmospheric conditions and thus dispersion.
The most well-known stability classification is the Pasquill-Gifford scheme, which denotes stability classes from A to F. Class A is described as highly unstable and occurs in association with strong surface heating and light winds, leading to intense convective turbulence and much enhanced plume dilution. At the other extreme, class F denotes very stable conditions associated with strong temperature inversions and light winds, which commonly occur under clear skies at night and in the early morning. Under these conditions plumes can remain relatively undiluted for considerable distances downwind. Intermediate stability classes grade from moderately unstable (B), through neutral (D) to slightly stable (E). Whilst classes A and F are strongly associated with clear skies, class D is linked to windy and/or cloudy weather, and short periods around sunset and sunrise when surface heating or cooling is small.
As a general rule, unstable (or convective) conditions dominate during the daytime and stable flows are dominant at night. This diurnal pattern is most pronounced when there is relatively little cloud cover and light to moderate winds. The frequency distribution of estimated stability classes in the meteorological file is shown in Figure 13. The data show a total of forty-eight percent of hours with either E or F class. This is consistent with the expected occurrence of stable conditions at inland locations that experience a high proportion of calm wind conditions. Stable and calm conditions decrease the dispersion of pollutants in the atmosphere and can lead to increased ground level concentrations close to an emission source.
Figure 13 Frequency Distribution of Stability Class; SITA CALMET Data; 2011

AECOM Expansion of the Advanced Waste Treatment Facility, Kemps Creek Resource Recovery Precinct - Air Quality Impact Assessment
28 March 2013
B-3
Mixing Height
Mixing height is the depth of the atmospheric surface layer beneath an elevated temperature inversion. It is an important parameter within air pollution meteorology. Vertical diffusion or mixing of a plume is generally considered to be limited by the mixing height, as the air above this layer tends to be stable, with restricted vertical motions.
CALMET was used to calculate mixing heights in the assessment. The diurnal variation of mixing height is summarised in Figure 14. Mixing heights are lower during the night and early morning hours (< 500 m), increasing after sunrise to a maximum of 2800 metres by mid-afternoon. This pattern of a marked diurnal cycle is consistent with the Development’s inland location.
Figure 14 Hourly Mixing Height; SITA CALMET Data; 2011

AECOM Expansion of the Advanced Waste Treatment Facility, Kemps Creek Resource Recovery Precinct - Air Quality Impact Assessment
28 March 2013
C
Appendix C
Emissions Inventory

AECOM Expansion of the Advanced Waste Treatment Facility, Kemps Creek Resource Recovery Precinct - Air Quality Impact Assessment
28 March 2013
C-1
Appendix C Emissions Inventory
Dust Emissions Inventory

AECOM Expansion of the Advanced Waste Treatment Facility, Kemps Creek Resource Recovery Precinct - Air Quality Impact Assessment
28 March 2013
C-1
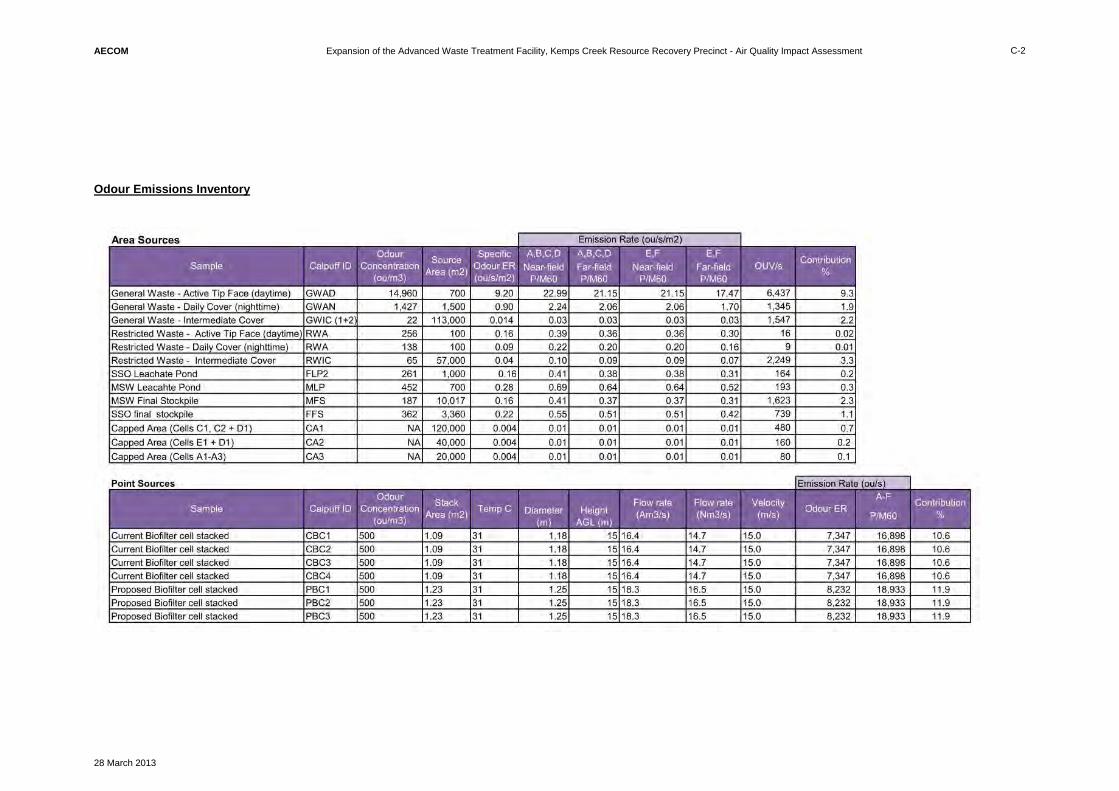
AECOM Expansion of the Advanced Waste Treatment Facility, Kemps Creek Resource Recovery Precinct - Air Quality Impact Assessment
28 March 2013
C-2
Odour Emissions Inventory


SAWT EXPANSION SITA ELIZABETH DRIVE
NOISE ASSESSMENT
REPORT NO. 04092-R VERSION A
MARCH 2013
PREPARED FOR
SITA ENVIRONMENTAL SOLUTIONS C/- AECOM
LEVEL 21, 420 GEORGE STREET SYDNEY NSW 2000

SAWT Expansion SITA Elizabeth Drive Noise Assessment Report No. 04092-R Version A
DOCUMENT CONTROL
Version Status Date Prepared By Reviewed By
A Draft 31 December 2012 Roman Haverkamp John Wassermann A Final 7 March 2013 Roman Haverkamp John Wassermann A Final 27 March 2013 Roman Haverkamp -
Note All materials specified by Wilkinson Murray Pty Limited have been selected solely on the basis of acoustic performance. Any other properties of these materials, such as fire rating, chemical properties etc. should be checked with the suppliers or other specialised bodies for fitness for a given purpose. The information contained in this document produced by Wilkinson Murray is solely for the use of the client identified on the front page of this report. Our client becomes the owner of this document upon full payment of our Tax Invoice for its provision. This document must not be used for any purposes other than those of the document’s owner. Wilkinson Murray undertakes no duty to or accepts any responsibility to any third party who may rely upon this document.
Quality Assurance We are committed to and have implemented AS/NZS ISO 9001:2008 “Quality Management Systems – Requirements”. This management system has been externally certified and Licence No. QEC 13457 has been issued.
AAAC This firm is a member firm of the Association of Australian Acoustical Consultants and the work here reported has been carried out in accordance with the terms of that membership.
Celebrating 50 Years in 2012 Wilkinson Murray is an independent firm established 50 years ago originally as Carr & Wilkinson. In 1976 Barry Murray joined founding partner Roger Wilkinson and the firm adopted the name which remains today. From a successful operation in Australia, Wilkinson Murray expanded its reach into Asia by opening a Hong Kong office early in 2006. 2010 saw the introduction of our Queensland office and 2011 the introduction of our Orange office to service a growing client base in these regions. From these offices, Wilkinson Murray services the entire Asia-Pacific region.
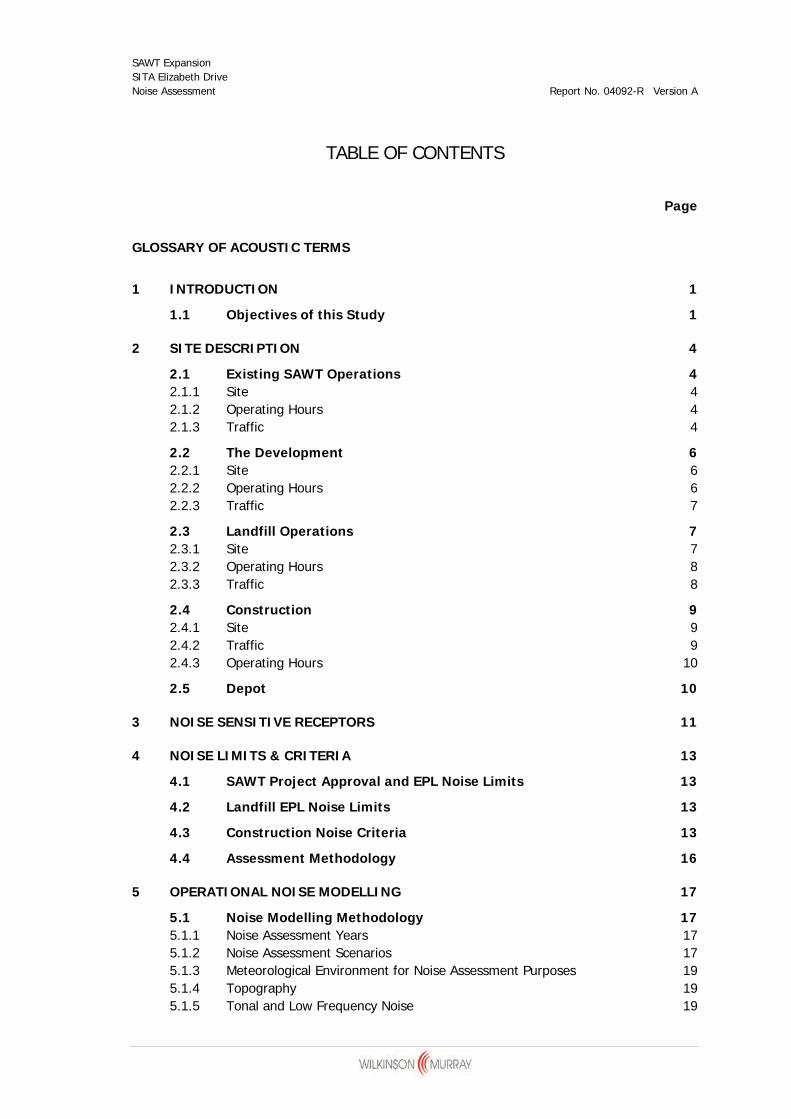
SAWT Expansion SITA Elizabeth Drive Noise Assessment Report No. 04092-R Version A
TABLE OF CONTENTS
Page
GLOSSARY OF ACOUSTIC TERMS
1 INTRODUCTION 1
1.1 Objectives of this Study 1
2 SITE DESCRIPTION 4
2.1 Existing SAWT Operations 4 2.1.1 Site 4 2.1.2 Operating Hours 4 2.1.3 Traffic 4
2.2 The Development 6 2.2.1 Site 6 2.2.2 Operating Hours 6 2.2.3 Traffic 7
2.3 Landfill Operations 7 2.3.1 Site 7 2.3.2 Operating Hours 8 2.3.3 Traffic 8
2.4 Construction 9 2.4.1 Site 9 2.4.2 Traffic 9 2.4.3 Operating Hours 10
2.5 Depot 10
3 NOISE SENSITIVE RECEPTORS 11
4 NOISE LIMITS & CRITERIA 13
4.1 SAWT Project Approval and EPL Noise Limits 13
4.2 Landfill EPL Noise Limits 13
4.3 Construction Noise Criteria 13
4.4 Assessment Methodology 16
5 OPERATIONAL NOISE MODELLING 17
5.1 Noise Modelling Methodology 17 5.1.1 Noise Assessment Years 17 5.1.2 Noise Assessment Scenarios 17 5.1.3 Meteorological Environment for Noise Assessment Purposes 19 5.1.4 Topography 19 5.1.5 Tonal and Low Frequency Noise 19

SAWT Expansion SITA Elizabeth Drive Noise Assessment Report No. 04092-R Version A
5.2 On-Site Industrial Noise Sources 20 5.2.1 SAWT On-Site Industrial Noise Sources 20 5.2.2 Landfill On-Site Noise Sources 25 5.2.3 Construction On-Site Noise Sources 25
5.3 Transportation Noise Sources 26 5.3.1 SAWT Transportation Noise Sources 26 5.3.2 Landfill Transportation Noise Sources 28 5.3.3 Construction Transportation Noise Sources 29
5.4 Sound Power Levels 30 5.4.1 SAWT Sound Power Levels 30 5.4.2 Landfill Sound Power Levels 31 5.4.3 Transportation Sound Power Levels 32 5.4.4 Construction Sound Power Levels 32
6 MODEL VALIDATION 33
7 PRELIMINARY ASSESSMENT OF OPERATIONAL NOISE 34
8 NOISE ASSESSMENT OF SAWT OPERATIONS 35
8.1 Current Noise Levels (2012) 35
8.2 Noise Levels during Construction (2014) 37
8.3 Noise Levels after SAWT Expansion Development (2016) 38
9 NOISE ASSESSMENT OF CUMULATIVE OPERATIONS 40
10 NOISE ASSESSMENT ACCORDING TO INP 43
10.1 Noise Survey 43 10.1.1 Monitoring Locations 43 10.1.2 Equipment 45 10.1.3 Measured Background Noise Levels 45
10.2 Industrial Noise Criteria 47 10.2.1 Description of Criteria 47 Intrusiveness Criterion 47 Amenity Criterion 47 10.2.2 Determination of Project-Specific Industrial Noise Criteria 47 Intrusiveness Criteria 47 Amenity Noise Levels 49 Sleep Disturbance Criteria 49
10.3 Assessment of Predicted Noise Levels 50 10.3.1 Intrusiveness Noise Assessment 50 10.3.2 Amenity Noise Assessment 54
10.4 Discussion & Recommendations 55
10.5 Identification of Adverse Weather Conditions 56
11 SLEEP AROUSAL ASSESSMENT 59
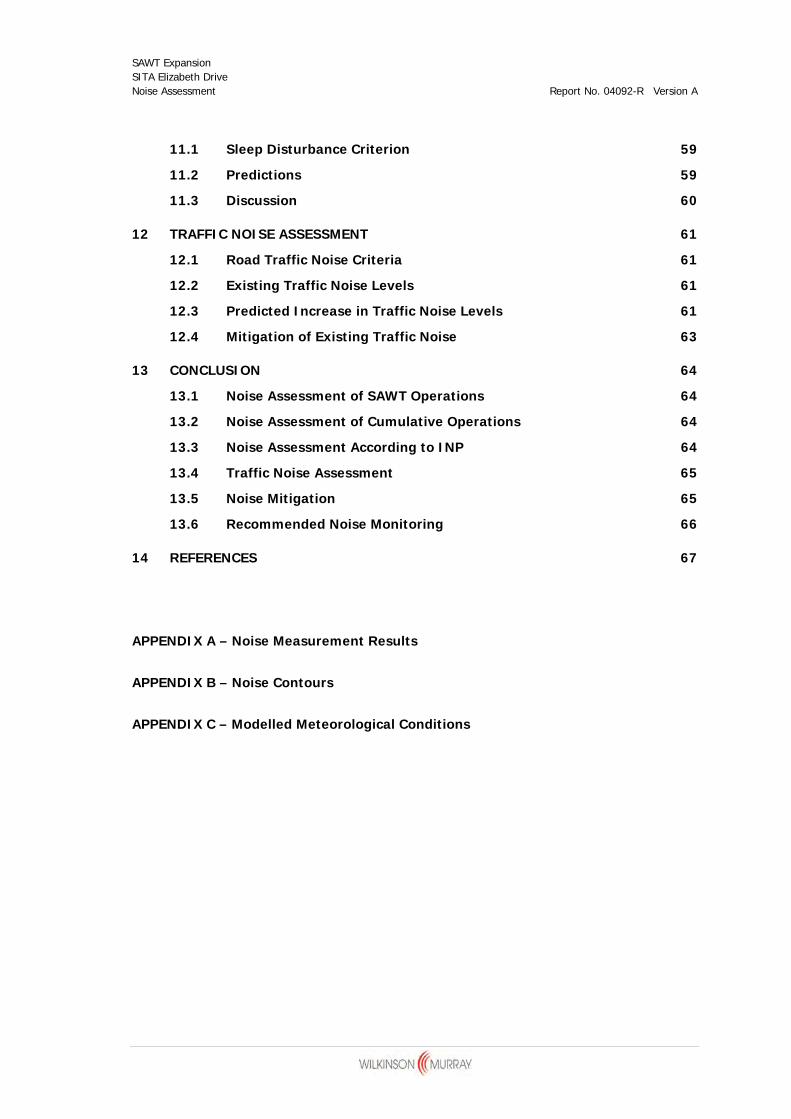
SAWT Expansion SITA Elizabeth Drive Noise Assessment Report No. 04092-R Version A
11.1 Sleep Disturbance Criterion 59
11.2 Predictions 59
11.3 Discussion 60
12 TRAFFIC NOISE ASSESSMENT 61
12.1 Road Traffic Noise Criteria 61
12.2 Existing Traffic Noise Levels 61
12.3 Predicted Increase in Traffic Noise Levels 61
12.4 Mitigation of Existing Traffic Noise 63
13 CONCLUSION 64
13.1 Noise Assessment of SAWT Operations 64
13.2 Noise Assessment of Cumulative Operations 64
13.3 Noise Assessment According to INP 64
13.4 Traffic Noise Assessment 65
13.5 Noise Mitigation 65
13.6 Recommended Noise Monitoring 66
14 REFERENCES 67
APPENDIX A – Noise Measurement Results
APPENDIX B – Noise Contours
APPENDIX C – Modelled Meteorological Conditions
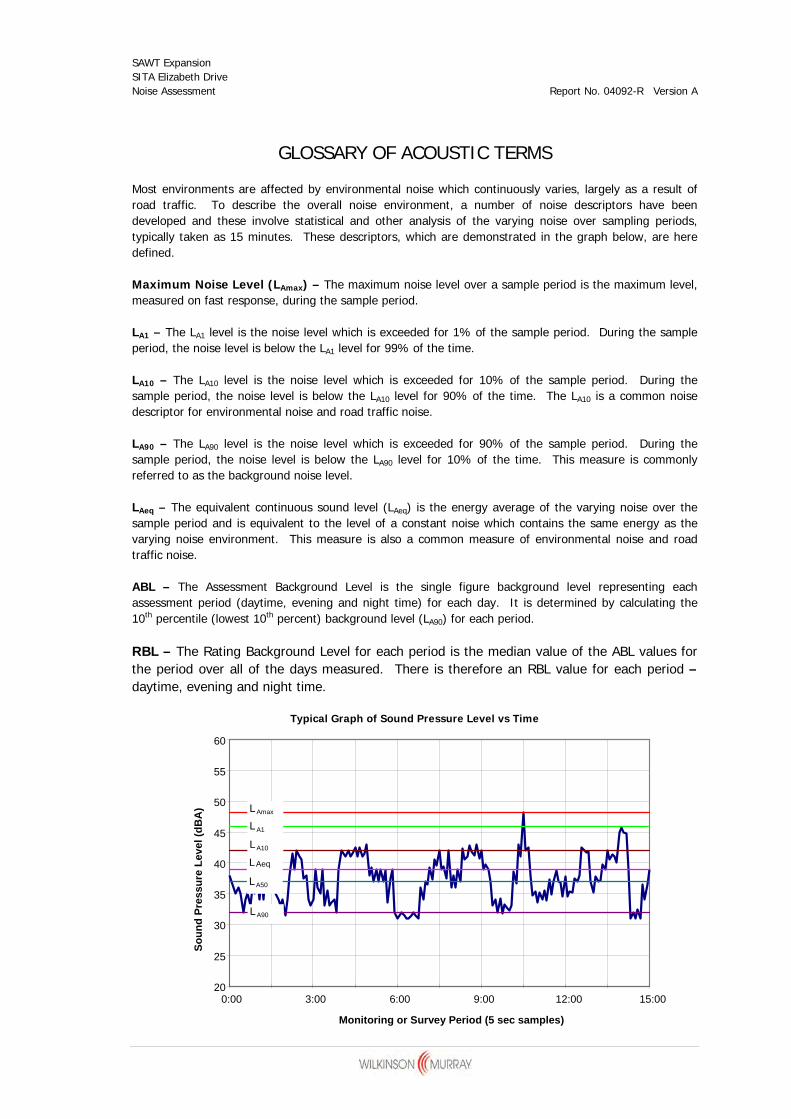
SAWT Expansion SITA Elizabeth Drive Noise Assessment Report No. 04092-R Version A
GLOSSARY OF ACOUSTIC TERMS
Most environments are affected by environmental noise which continuously varies, largely as a result of road traffic. To describe the overall noise environment, a number of noise descriptors have been developed and these involve statistical and other analysis of the varying noise over sampling periods, typically taken as 15 minutes. These descriptors, which are demonstrated in the graph below, are here defined.
Maximum Noise Level (LAmax) – The maximum noise level over a sample period is the maximum level, measured on fast response, during the sample period.
LA1 – The LA1 level is the noise level which is exceeded for 1% of the sample period. During the sample period, the noise level is below the LA1 level for 99% of the time.
LA10 – The LA10 level is the noise level which is exceeded for 10% of the sample period. During the sample period, the noise level is below the LA10 level for 90% of the time. The LA10 is a common noise descriptor for environmental noise and road traffic noise.
LA90 – The LA90 level is the noise level which is exceeded for 90% of the sample period. During the sample period, the noise level is below the LA90 level for 10% of the time. This measure is commonly referred to as the background noise level.
LAeq – The equivalent continuous sound level (LAeq) is the energy average of the varying noise over the sample period and is equivalent to the level of a constant noise which contains the same energy as the varying noise environment. This measure is also a common measure of environmental noise and road traffic noise.
ABL – The Assessment Background Level is the single figure background level representing each assessment period (daytime, evening and night time) for each day. It is determined by calculating the 10th percentile (lowest 10th percent) background level (LA90) for each period.
RBL – The Rating Background Level for each period is the median value of the ABL values for the period over all of the days measured. There is therefore an RBL value for each period – daytime, evening and night time.
Typical Graph of Sound Pressure Level vs Time
20
25
30
35
40
45
50
55
60
0:00 3:00 6:00 9:00 12:00 15:00
Monitoring or Survey Period (5 sec samples)
So
un
d P
ress
ure
Lev
el (
dB
A) LAmax
LA1
LA10
LAeq LA50
LA90

SAWT Expansion SITA Elizabeth Drive Page 1 Noise Assessment Report No. 04092-R Version A
1 INTRODUCTION
SITA proposes to expand the SITA Advanced Waste Treatment (SAWT) facility located at its Kemps Creek Resource Recovery Precinct (the Precinct) (See Figures 1-1 and 1-2 for regional context and site location within the Precinct, respectively).
The Precinct includes the following facilities:
SAWT;
Landfill; and
Depot for Garbage trucks for Penrith Council.
Wilkinson Murray Pty Ltd (WMPL) was engaged to undertake an environmental noise and vibration assessment associated with the expansion of the existing SAWT facility located at its Kemps Creek Resource Recovery Precinct (the ‘Development’).
The existing SAWT facility Project Application 06_0185 was approved on 15 April 2008, and limits the facility to processing approximately 134,400 tonnes per annum (tpa) of input waste, 120,000 tpa of mixed solid waste and 14,400 tpa of biosolids. SITA proposes to increase the SAWT receival capacity to 220,000 tpa of input waste.
1.1 Objectives of this Study
The primary objective of this study is to assess the potential noise impacts associated with the Development by addressing the Director-General’s Environmental Assessment Requirements issued by the NSW Department of Planning and Infrastructure (DP&I) on 16 May 2012 and outlined as follows:
Noise – including a quantitative assessment of the potential:
construction, operational and transport noise impacts;
offsite road noise impacts; and
details of the proposed management and monitoring.
Specific noise requirements from the NSW Environment Protection Authority (EPA) were not provided initially. Additional consultation was conducted by AECOM where EPA requested that in addition to the typical requirement of assessing noise from SAWT facility to its existing Approval and EPL noise limits, a noise assessment of the combined SAWT and Landfill be conducted considering the Landfill EPL limits and Industrial Noise Policy (INP) noise criteria. The reason for this being the close proximity between the Landfill and the SAWT facility which may potentially impact on the same receptors and the fact that both operations are managed by the same operator. A cumulative noise assessment considering the EPL limits and INP criteria has been conducted to provide an understanding of the impacts consistent with contemporary guidelines. Despite the decision to assess the SAWT and Landfill operations cumulatively it is important to note that both sites work independently of each other as different commercial entities.
Table 1-1 shows DP&I’s assessment requirements and the sections they are addressed in.

SAWT Expansion SITA Elizabeth Drive Page 2 Noise Assessment Report No. 04092-R Version A
Table 1-1 Agency Comments
Comment Agency Section
construction, operational and transport noise impacts DP&I Section 8
offsite road noise impacts; DP&I Section 12
details of the proposed management and monitoring; DP&I Section 7
Section 13
Cumulative assessment of the Kemps Creek Resource Recovery Precinct
EPA Section 9
Industrial Noise Policy (INP) noise criteria EPA Section 10
Figure 1-1 Regional Context

SAWT Expansion SITA Elizabeth Drive Page 3 Noise Assessment Report No. 04092-R Version A
Figure 1-2 Site Location within Kemps Creek Resource Recovery Precinct
SAWT Expansion SITA Elizabeth Drive Page 4 Noise Assessment Report No. 04092-R Version A
2 SITE DESCRIPTION
The proposed layout for the Development is shown in Figure 2-1.
2.1 Existing SAWT Operations
The existing SAWT facility has a two-shift operation design with the capacity of processing approximately 134,400 tpa of input waste.
2.1.1 Site
The existing SAWT facility is almost all contained in a large building including receival, resource recovery, refining and initial composting.
Mixed solid waste is received in the receival area where it is delivered onto a tipping floor and shifted by a wheel loader into the pre treatment system. Waste is processed in a series of mechanical steps to recover the organic fraction for composting and also recyclables. The inorganic residual fraction is sent to the adjacent landfill.
The organic fraction of the waste is converted into compost using a series of composting tunnels. After composting, the material is transported by conveyor to maturation in stockpiles. The material undergoes further refining prior to being transported for use offsite. Exhaust air is treated through biofilters prior to release into the atmosphere.
2.1.2 Operating Hours
The current Conditions of Approval (CoA) permits indoor activities 7.00am to 11.00pm Monday to Saturday. Waste receipt and product dispatch are permissible between 6.00am and 6.00pm Monday to Friday, 8.00am-5.00pm on Saturdays, and 8.00am-4.00pm on Sundays. Outdoor operations are allowed between 6.00am and 10.00pm Monday to Friday (subject to conditions relating to number of mobile plant movements) and 7.00am-4.00pm on Public Holidays.
Fans associated with the biofilters and tunnels are operate 24-hours.
2.1.3 Traffic
Vehicles enter and leave the Precinct via the existing access road from Elizabeth Drive. Within the Site the vehicles use a new sealed access road that follows the southern and western boundaries, linking the entrance gate (located at the southeast corner of the landfill site) to the SAWT facility, which is located in the northwest corner of the site. It should be noted that the southern access road already has an existing 4m bund along its southern edge, which mitigates vehicle noise to the residences to the south.
Approximately 80 percent of SAWT traffic currently leaves the Site in an easterly direction, with the remaining travelling west.
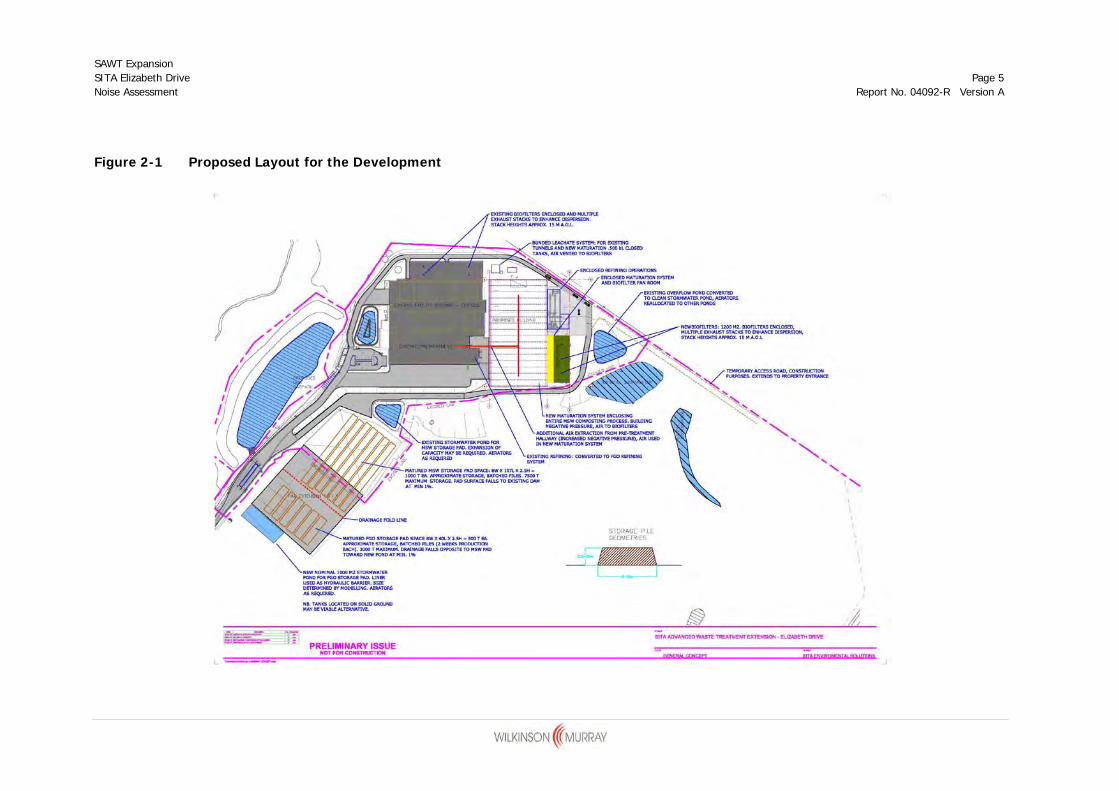
SAWT Expansion SITA Elizabeth Drive Page 5 Noise Assessment Report No. 04092-R Version A
Figure 2-1 Proposed Layout for the Development
SAWT Expansion SITA Elizabeth Drive Page 6 Noise Assessment Report No. 04092-R Version A
The existing SAWT facility currently accepts an average of 51 truck deliveries per day. As a daily average, four trucks transport material from the SAWT facility out of the Precinct, three trucks transport material from the SAWT facility to the food and garden organics (FGO) maturation pad, nine trucks transport material from the SAWT facility to the compost stockpiling area and 35 vehicles transport material from the SAWT facility to the landfill. Actual vehicle numbers depend upon collection vehicle routing and traffic conditions and therefore vary from day to day.
2.2 The Development
The Development would be capable of processing up to 220,000 tpa of input waste, which could include source separated organics as well as biosolids from time to time. It should be noted that this capacity will be ramped up over a period of time.
The Development would include adjustments to the existing SAWT facility, an extension of the hours of operation for indoor activities and an increase in truck movements delivering and dispatching material.
2.2.1 Site
The proposed modifications to the SAWT site involve:
an upgrade to the Resource Recovery Building plant;
a new enclosed composting hall adjacent to the existing SAWT facility building (this addition would result in most mobile plant operations being moved indoors therefore reducing noise impacts to surrounding receptors);
a reconfiguration of the existing biofilters, and the addition of four 15m-high stacks (AGL);
the installation of new biofilters with three 15m-high stacks;
the extension of the existing compost pad for additional storage space; and
an upgrade to the access road, car parking, water storage and reuse infrastructure.
2.2.2 Operating Hours
Indoor operations are proposed 24 hours a day, seven days per week (including Public Holidays). Outdoor operations are proposed between 6.00am and 10.00pm Monday to Friday (with no restriction on vehicle movements).
The proposed operating hours for truck movements are summarised in Table 2-1.
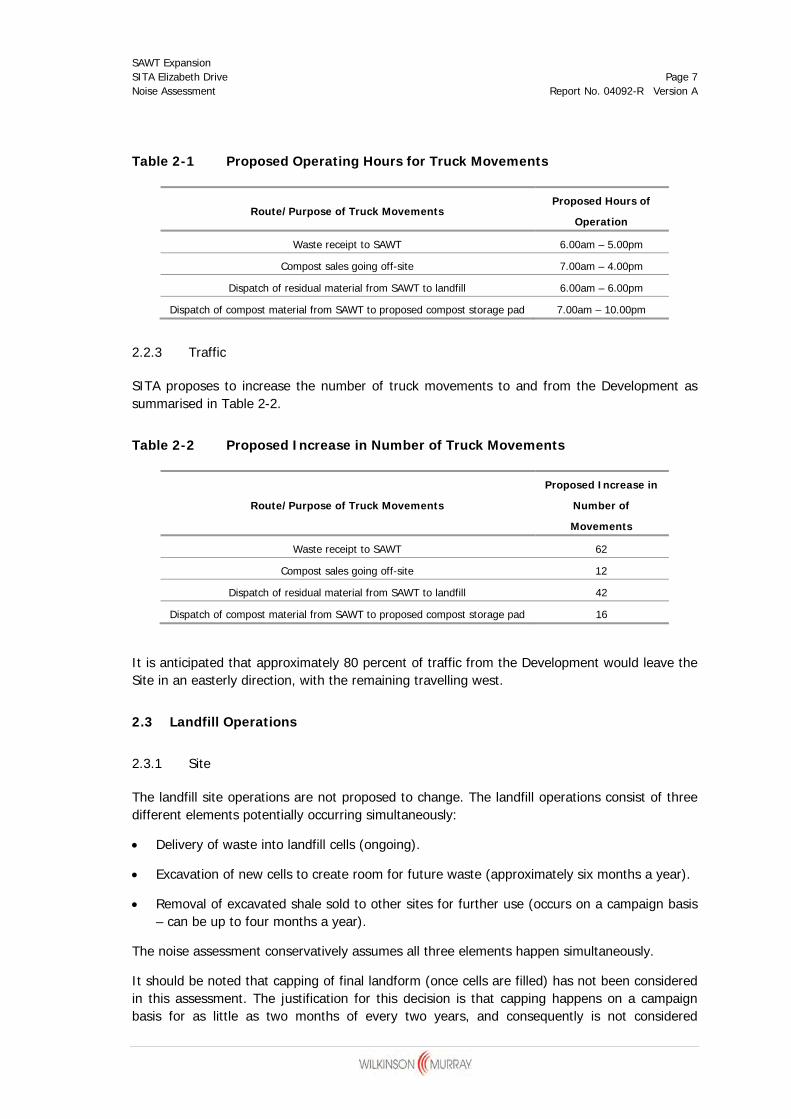
SAWT Expansion SITA Elizabeth Drive Page 7 Noise Assessment Report No. 04092-R Version A
Table 2-1 Proposed Operating Hours for Truck Movements
Route/Purpose of Truck Movements Proposed Hours of
Operation
Waste receipt to SAWT 6.00am – 5.00pm
Compost sales going off-site 7.00am – 4.00pm
Dispatch of residual material from SAWT to landfill 6.00am – 6.00pm
Dispatch of compost material from SAWT to proposed compost storage pad 7.00am – 10.00pm
2.2.3 Traffic
SITA proposes to increase the number of truck movements to and from the Development as summarised in Table 2-2.
Table 2-2 Proposed Increase in Number of Truck Movements
Route/Purpose of Truck Movements
Proposed Increase in
Number of
Movements
Waste receipt to SAWT 62
Compost sales going off-site 12
Dispatch of residual material from SAWT to landfill 42
Dispatch of compost material from SAWT to proposed compost storage pad 16
It is anticipated that approximately 80 percent of traffic from the Development would leave the Site in an easterly direction, with the remaining travelling west.
2.3 Landfill Operations
2.3.1 Site
The landfill site operations are not proposed to change. The landfill operations consist of three different elements potentially occurring simultaneously:
Delivery of waste into landfill cells (ongoing).
Excavation of new cells to create room for future waste (approximately six months a year).
Removal of excavated shale sold to other sites for further use (occurs on a campaign basis – can be up to four months a year).
The noise assessment conservatively assumes all three elements happen simultaneously.
It should be noted that capping of final landform (once cells are filled) has not been considered in this assessment. The justification for this decision is that capping happens on a campaign basis for as little as two months of every two years, and consequently is not considered
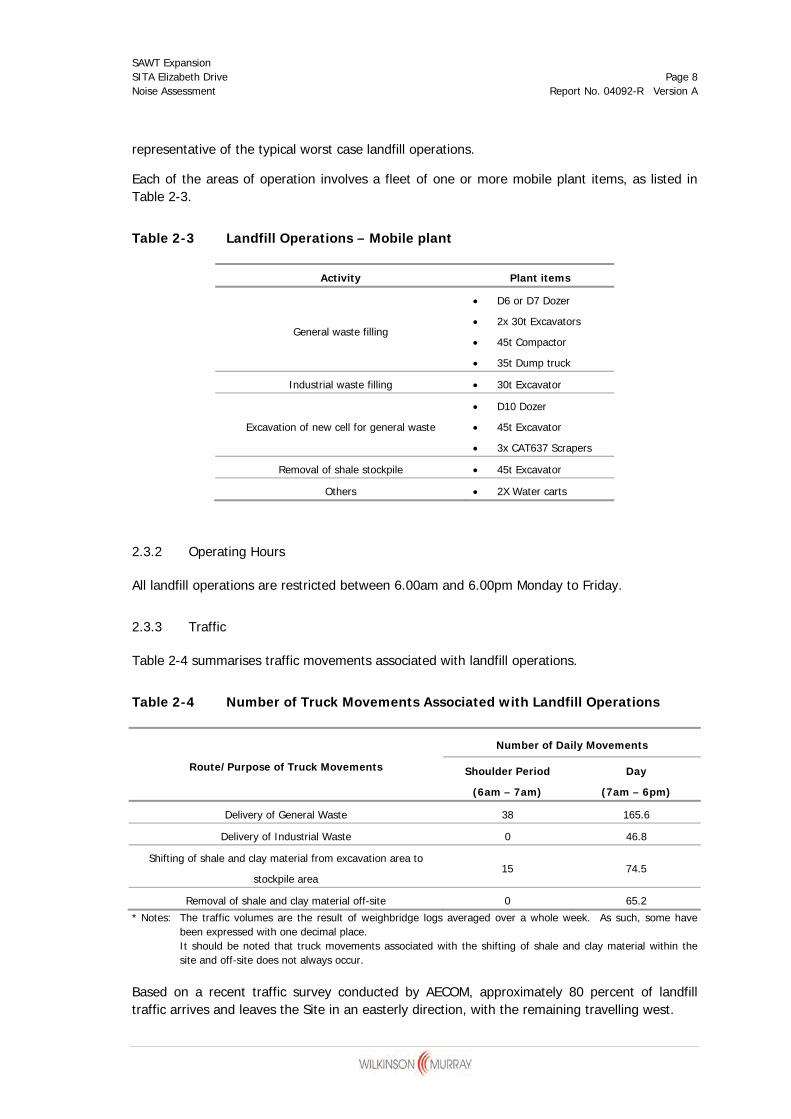
SAWT Expansion SITA Elizabeth Drive Page 8 Noise Assessment Report No. 04092-R Version A
representative of the typical worst case landfill operations.
Each of the areas of operation involves a fleet of one or more mobile plant items, as listed in Table 2-3.
Table 2-3 Landfill Operations – Mobile plant
Activity Plant items
General waste filling
D6 or D7 Dozer
2x 30t Excavators
45t Compactor
35t Dump truck
Industrial waste filling 30t Excavator
Excavation of new cell for general waste
D10 Dozer
45t Excavator
3x CAT637 Scrapers
Removal of shale stockpile 45t Excavator
Others 2X Water carts
2.3.2 Operating Hours
All landfill operations are restricted between 6.00am and 6.00pm Monday to Friday.
2.3.3 Traffic
Table 2-4 summarises traffic movements associated with landfill operations.
Table 2-4 Number of Truck Movements Associated with Landfill Operations
Route/Purpose of Truck Movements
Number of Daily Movements
Shoulder Period
(6am – 7am)
Day
(7am – 6pm)
Delivery of General Waste 38 165.6
Delivery of Industrial Waste 0 46.8
Shifting of shale and clay material from excavation area to
stockpile area 15 74.5
Removal of shale and clay material off-site 0 65.2
* Notes: The traffic volumes are the result of weighbridge logs averaged over a whole week. As such, some have been expressed with one decimal place.
It should be noted that truck movements associated with the shifting of shale and clay material within the site and off-site does not always occur.
Based on a recent traffic survey conducted by AECOM, approximately 80 percent of landfill traffic arrives and leaves the Site in an easterly direction, with the remaining travelling west.
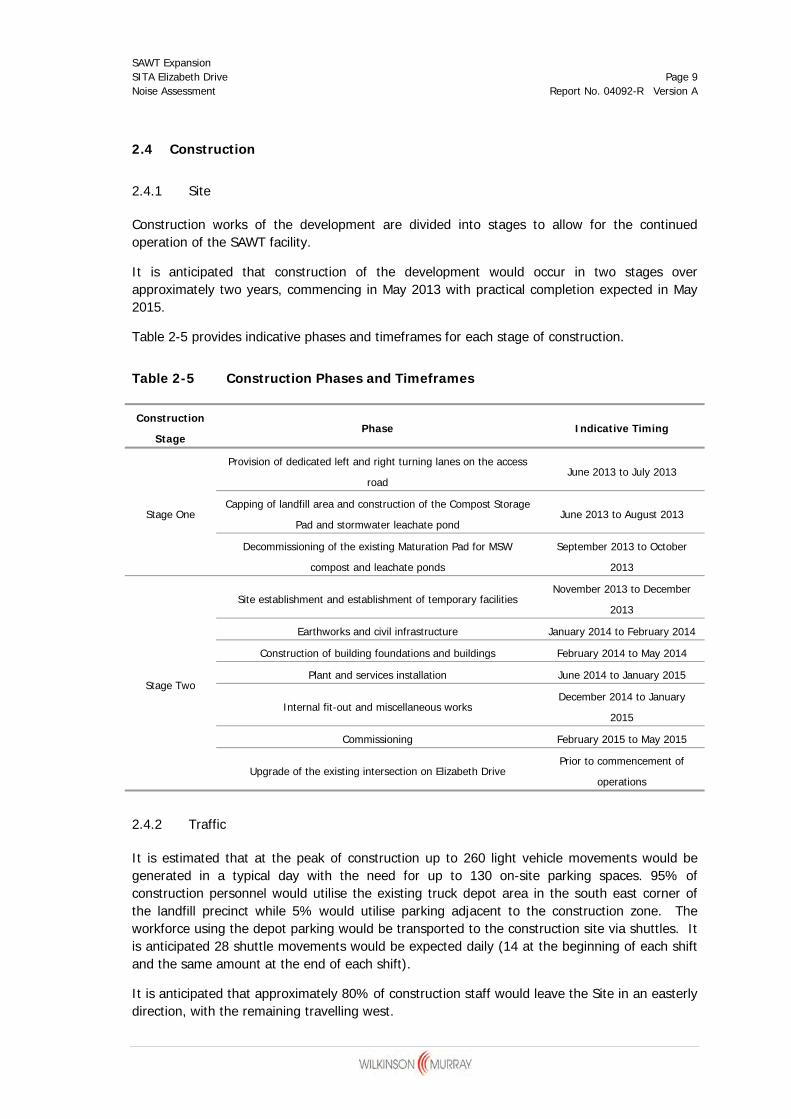
SAWT Expansion SITA Elizabeth Drive Page 9 Noise Assessment Report No. 04092-R Version A
2.4 Construction
2.4.1 Site
Construction works of the development are divided into stages to allow for the continued operation of the SAWT facility.
It is anticipated that construction of the development would occur in two stages over approximately two years, commencing in May 2013 with practical completion expected in May 2015.
Table 2-5 provides indicative phases and timeframes for each stage of construction.
Table 2-5 Construction Phases and Timeframes
Construction
Stage Phase Indicative Timing
Stage One
Provision of dedicated left and right turning lanes on the access
road June 2013 to July 2013
Capping of landfill area and construction of the Compost Storage
Pad and stormwater leachate pond June 2013 to August 2013
Decommissioning of the existing Maturation Pad for MSW
compost and leachate ponds
September 2013 to October
2013
Stage Two
Site establishment and establishment of temporary facilities November 2013 to December
2013
Earthworks and civil infrastructure January 2014 to February 2014
Construction of building foundations and buildings February 2014 to May 2014
Plant and services installation June 2014 to January 2015
Internal fit-out and miscellaneous works December 2014 to January
2015
Commissioning February 2015 to May 2015
Upgrade of the existing intersection on Elizabeth Drive Prior to commencement of
operations
2.4.2 Traffic
It is estimated that at the peak of construction up to 260 light vehicle movements would be generated in a typical day with the need for up to 130 on-site parking spaces. 95% of construction personnel would utilise the existing truck depot area in the south east corner of the landfill precinct while 5% would utilise parking adjacent to the construction zone. The workforce using the depot parking would be transported to the construction site via shuttles. It is anticipated 28 shuttle movements would be expected daily (14 at the beginning of each shift and the same amount at the end of each shift).
It is anticipated that approximately 80% of construction staff would leave the Site in an easterly direction, with the remaining travelling west.

SAWT Expansion SITA Elizabeth Drive Page 10 Noise Assessment Report No. 04092-R Version A
It is anticipated that in a typical day at the peak of construction, there would be up to 60 heavy vehicle movements (from 30 heavy vehicles). Around 80% of these heavy vehicles are expected to originate from the Liverpool area, with the remaining accessing the Site from the west.
All heavy vehicle movements associated with the construction works are anticipated to use the eastern route running alongside the eastern and northern boundaries of the landfill precinct. All staff movements including shuttles would use the existing route running alongside the southern and western moundaries.
2.4.3 Operating Hours
Consistent with the operation of the site construction of the development would be carried out over a single 10-hour shift per day. Construction hours would be between:
6.00am-6.00pm Monday to Friday (extended to 10.00pm in extraneous circumstances for testing and commissioning);
7.00am-4.00pm on Saturday; and
No construction work would be carried out on Sundays or public holidays.
It is anticipated that most construction personnel would generally arrive at the Site between 5.30am-6.00am and exit the Site between 4.00pm-5.00pm on weekdays. On Saturdays, construction personnel entry and exit times would be between 6.30am-7.00am and 3.00pm-4.00pm, respectively.
Heavy construction traffic movements would commence only after 7.00am.
2.5 Depot
SITA currently parks waste collection trucks overnight on site near the maintenance workshop in the southeast corner of the landfill site for Penrith Council. Those trucks depart from the depot between 5.00am-5.30am and return between 1.00pm-4.00pm Monday to Friday.
The depot is moving off-site in 2013.

SAWT Expansion SITA Elizabeth Drive Page 11 Noise Assessment Report No. 04092-R Version A
3 NOISE SENSITIVE RECEPTORS
There are a number of residential receptors surrounding the site. The receptors considered in this assessment are shown on Figure 3-1 and listed in Table 3-1. Eastings and Northings are in MGA 84 coordinates, Zone 56. Those receptors were selected to be consistent with the air quality assessment for this EIS.
Figure 3-1 Receptors Considered in the Noise Assessment
R36
R36
R28
R27
R26
R32
R25
R24
R31
R3
R35
R34
R33
R23
R20 R19
R17R18
R16 R15 R13
R14 R10R8
R11
R12 R21
R9 R22R7
R6 R4
R5
R2
R37
R1LANDFILL SITE
SAWT SITE

SAWT Expansion SITA Elizabeth Drive Page 12 Noise Assessment Report No. 04092-R Version A
Table 3-1 Receptors Considered in this Assessment
Rec ID Description Easting Northing
R1 SITA Resource Recovery Precinct Access Road; Lakes Residence 293145 6250516
R2 Weston Road 294065 6250508
R3 Weston Road 294788 6250113
R4 Elizabeth Drive 294450 6249316
R5 Elizabeth Drive 294142 6249197
R6 Overett Avenue 293696 6249073
R7 Elizabeth Drive 293401 6249322
R8 Martin Road 292990.6 6248829
R9 Elizabeth Drive 292745 6249446
R10 Lawson Road 292648.5 6248937
R11 Elizabeth Drive 292220 6249460
R12 Elizabeth Drive 292437 6249648
R13 Elizabeth Drive 291666 6249565
R14 Gardiner Road 291536.1 6248839
R15 Elizabeth Drive 291348 6249588
R16 Elizabeth Drive 290931 6249672
R17 Private Road off Elizabeth Drive 291438 6250216
R18 Private Road off Elizabeth Drive 290722 6250226
R19 Private Road off Elizabeth Drive 291275 6250627
R20 Private Road off Elizabeth Drive 291464 6250680
R21 Private Road off Elizabeth Drive 292772 6249676
R22 Elizabeth Drive 293007 6249420
R23 Private Road off Elizabeth Drive 291377 6251026
R24 Cliffton Avenue 294689 6250969
R25 Mamre Road 294710 6251968
R26 Humewood Place; Twin Creeks Golf Estate 292610 6251976
R27 Twin Creeks Drive; Twin Creeks Golf Estate 292669 6252477
R28 Twin Creeks Drive; Twin Creeks Golf Estate 292448 6252775
R31 Mamre Road 295513 6251565
R32 Mamre Road 294654 6253357
R33 Luddenham Road 289476 6250718
R34 Luddenham Road 290050 6251586
R35 Luddenham Road 290740 6252294
R36 Portus Crescent; Twin Creeks Golf Estate 291964 6253285
R37 SITA RRP Access Road; Caretakers Cottage 293150 6250188

SAWT Expansion SITA Elizabeth Drive Page 13 Noise Assessment Report No. 04092-R Version A
4 NOISE LIMITS & CRITERIA
The existing SAWT facility operations are currently subject to noise limits as presented in the DP&I Project Approval (Application no. 06_0185, 2008) and EPA’s Environment Protection Licence (#12889).
The Landfill is subject to noise limits from EPA’s Environment Protection Licence (#4068). The Depot has consent from Penrith City Council and does not have any noise limits.
4.1 SAWT Project Approval and EPL Noise Limits
The noise limits set in the Project Approval and EPL are summarised in table 4-1. For ease of reference, Table 4-1 also provides the corresponding receiver ID numbers relevant to this assessment.
Table 4-1 Noise Limits in current Project Approval (dBA)
Rec
ID Location
Day
(7am–6pm)
Evening
(6pm–10pm)
LAeq,15min
Night Time
(10pm–7am)
Morning
Shoulder
(6am-7am)
LAeq,15min LAeq,15min LAeq,15min Lmax LAeq,15min
R20 McGarvie Smith Farm 42 39 35 n/a 39
R21 1745 Elizabeth Drive 41 40 37 47 40
R1 1669A Elizabeth Drive 38 38 35 n/a 38
R37 Caretakers Residence
1669A Elizabeth Drive 42 42 38 53 42
4.2 Landfill EPL Noise Limits
The landfill EPL states the following noise limits:
“Noise from the premises must not exceed:
a) an LA10(15 minute) noise emission criterion of 50 dB(A) during the day (7am to 10pm);
b) an LA10(15 minute) noise emission criterion of 45 dB(A) during the night (10pm to 7am);
except as expressly provided by this licence.”
For the purpose of this assessment, it is assumed that industrial LAeq,15min noise levels are directly comparable to LA10,15min criteria presented above.
4.3 Construction Noise Criteria
The proposed expansion of the SAWT facility would involve the construction of additional processing areas and for this reason construction noise needs to be addressed.

SAWT Expansion SITA Elizabeth Drive Page 14 Noise Assessment Report No. 04092-R Version A
As mentioned above, the combined noise generated by both SAWT operations and construction activities is assessed against the noise limits set in the Project Approval. However, for completeness and to provide a better understanding of the noise impact, the Interim Construction Noise Guideline (ICNG) is also used for comparison purposes.
The ICNG presents the process to assess construction in NSW. The ICNG was developed by the EPA taking into consideration that construction is temporary, noisy and difficult to ameliorate. As such, the ICNG was developed to focus on applying a range of work practices most suited to minimising construction noise impacts, rather than focusing only on achieving a numeric noise level.
The ICNG recommends that standard construction work hours should typically be as follows:
Monday to Friday 7.00am to 6.00pm;
Saturday 8.00am to 1.00pm; and
No work on Sundays or public holiday.
Additionally, it recommends quantitative management noise criteria at residences as presented in Table 4-2.
Table 4-2 Construction Noise at Residences using Quantitative Assessment
Time of Day Management Level
LAeq (15 min) How to Apply
Recommended
standard hours:
Monday to Friday
7am to 6pm
Saturday 8am to 1pm
No work on Sundays or
public holidays
Noise affected
RBL + 10dBA
The noise affected level represents the point above which there
may be some community reaction to noise.
Where the predicted or measured LAeq (15 min) is greater than the
noise affected level, the proponent should apply all feasible and
reasonable work practices to minimise noise.
The proponent should also inform all potentially impacted
residents of the nature of works to be carried out, the expected
noise levels and duration, as well as contact details.
Highly noise affected
75dBA
The highly noise affected level represents the point above
which there may be strong community reaction to noise.
Where noise is above this level, the proponent should consider
very carefully if there is any other feasible and reasonable way
to reduce noise to below this level.
If no quieter work method is feasible and reasonable, and the
works proceed, the proponent should communicate with the
impacted residents by clearly explaining the duration and noise
level of the works, and by describing any respite periods that
will be provided.

SAWT Expansion SITA Elizabeth Drive Page 15 Noise Assessment Report No. 04092-R Version A
Time of Day Management Level
LAeq (15 min) How to Apply
Outside recommended
standard hours
Noise affected
RBL + 5dBA
A strong justification would typically be required for works
outside the recommended standard hours. The proponent
should apply all feasible and reasonable work practices to meet
the noise affected level. Where all feasible and reasonable
practices have been applied and noise is more than 5dBA
above the noise affected level, the proponent should negotiate
with the community.
Table 4-3 presents the Project-specific construction noise criteria.
Table 4-3 Project-Specific Criteria for Construction Noise
Location
LAeq,15min Noise Affected Level (dBA) LAeq,15min
Highly Noise
Affected Level
(dBA)
During
Recommended
Standard
Hours
Outside Recommended Standard Hours
Day
(Weekend)
(7am–6pm)
Eve
(6pm–10pm)
Night
(10pm–7am)
R1 47 42 41 38 75
R2 47 42 41 38 75
R3 47 42 41 38 75
R4 52 47 44 38 75
R5 52 47 44 38 75
R6 52 47 44 38 75
R7 52 47 44 38 75
R8 47 42 41 38 75
R9 52 47 44 38 75
R10 47 42 41 38 75
R11 52 47 44 38 75
R12 52 47 44 38 75
R13 52 47 44 38 75
R14 47 42 41 38 75
R15 52 47 44 38 75
R16 52 47 44 38 75
R17 47 42 41 38 75
R18 47 42 41 38 75
R19 47 42 41 38 75
R20 47 42 41 38 75

SAWT Expansion SITA Elizabeth Drive Page 16 Noise Assessment Report No. 04092-R Version A
Location
LAeq,15min Noise Affected Level (dBA) LAeq,15min
Highly Noise
Affected Level
(dBA)
During
Recommended
Standard
Hours
Outside Recommended Standard Hours
Day
(Weekend)
(7am–6pm)
Eve
(6pm–10pm)
Night
(10pm–7am)
R21 52 47 44 38 75
R22 52 47 44 38 75
R23 47 42 41 38 75
R24 43 38 38 35 75
R25 43 38 38 35 75
R26 43 38 38 35 75
R27 43 38 38 35 75
R28 43 38 38 35 75
R31 43 38 38 35 75
R32 43 38 38 35 75
R33 47 42 41 38 75
R34 43 38 38 35 75
R35 43 38 38 35 75
R36 43 38 38 35 75
R37 47 42 41 38 75
4.4 Assessment Methodology
The approved noise limits are used to assess the existing SAWT operations (2012), the existing SAWT operations and construction activities combined (2014), and the proposed SAWT expansion Development at full capacity (2016).
The rationale behind using the Project Approval’s noise limits during the construction period is that construction is anticipated to last a considerable amount of time (approximately two years) and potentially impacted receptors might not be able to distinguish noise generated by operations and construction. For completeness and to provide a better understanding of the noise impact, the Interim Construction Noise Guideline (ICNG) has also been provided for comparison purposes.
As stated above, a consultation process with EPA highlighted the close proximity between both operations which may potentially be impacting on the same receptors and the fact that both operations are managed by the same operator, namely SITA. As such, it has been decided to also include an assessment addressing the combined noise levels from both landfill and the Development.
As mentioned in the introduction the cumulative noise levels generated by the SAWT and the Landfill have been assessed against the Landfill EPL noise limits (#4068) as the Landfill represents the industrial noise source with potentially the most noise impact on the identified receptors.

SAWT Expansion SITA Elizabeth Drive Page 17 Noise Assessment Report No. 04092-R Version A
5 OPERATIONAL NOISE MODELLING
5.1 Noise Modelling Methodology
Operational noise levels at nearby receptors have been calculated using the Environmental Noise Model (ENM). The ENM modelling software is accepted by the EPA for use in environmental noise assessments. The assessment models the total noise at each receiver from the operation of the Development. Total predicted operational noise levels are then compared with the relevant noise limits.
5.1.1 Noise Assessment Years
Noise modelling was undertaken for the day, evening and night operating scenarios for 2012, 2014 and 2016. Table 5-1 summarises the pertinent information relevant to each assessment year.
Table 5-1 Description of Assessment Years
Assessment Assessment
Year Operations Assessed Assessment Methodology
SAWT
Current SAWT
Operations (2012)
Current SAWT operations
(excl. landfill and depot
activities)
Worst typical 15 minute period assessed against
SAWT EPL noise limits
Construction
Phase
(2014)
Current SAWT operations and
construction activities combined
(excl. landfill activities)
Worst typical 15 minute period assessed against
SAWT EPL noise limits
Proposed SAWT
Operations (2016)
Expanded SAWT operations
(excl. landfill activities)
Worst typical 15 minute period assessed against
SAWT EPL noise limits
Cumulative Proposed SAWT
Operations (2016)
Expanded SAWT operations and
landfill operations combined
Worst typical 15 minute period assessed against
Landfill EPL noise limits
It should be noted that the 2012 assessment year also enables the calibration of the noise model.
5.1.2 Noise Assessment Scenarios
Based on traffic numbers and mobile plant activities, the worst typical 15 minute periods associated with SAWT operations within each assessment period, namely daytime (7.00am-6.00pm), evening (6.00pm-10.00pm) and night time (10.00pm-7.00am), were established and are summarised in Table 5-2. Note that the intrusive assessment also addresses the morning shoulder period (6.00am-7.00am) since distinct CoA noise limits are applicable for that period.
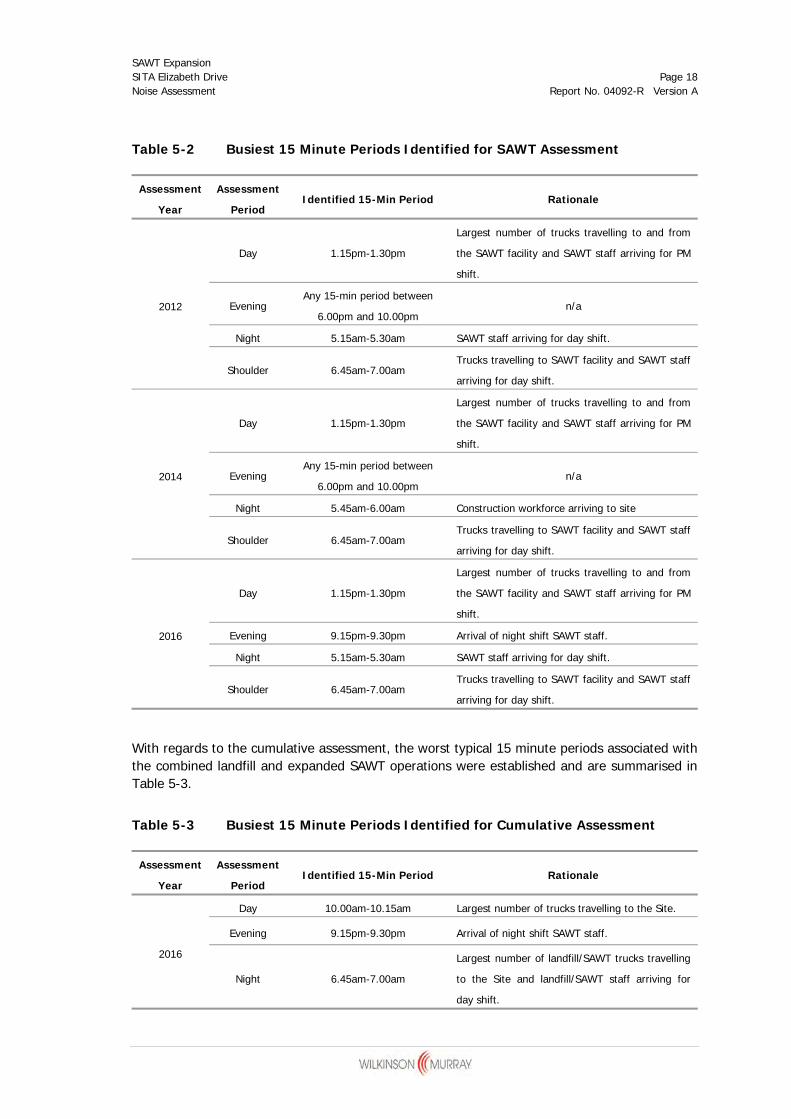
SAWT Expansion SITA Elizabeth Drive Page 18 Noise Assessment Report No. 04092-R Version A
Table 5-2 Busiest 15 Minute Periods Identified for SAWT Assessment
Assessment
Year
Assessment
Period Identified 15-Min Period Rationale
2012
Day 1.15pm-1.30pm
Largest number of trucks travelling to and from
the SAWT facility and SAWT staff arriving for PM
shift.
Evening Any 15-min period between
6.00pm and 10.00pm n/a
Night 5.15am-5.30am SAWT staff arriving for day shift.
Shoulder 6.45am-7.00am Trucks travelling to SAWT facility and SAWT staff
arriving for day shift.
2014
Day 1.15pm-1.30pm
Largest number of trucks travelling to and from
the SAWT facility and SAWT staff arriving for PM
shift.
Evening Any 15-min period between
6.00pm and 10.00pm n/a
Night 5.45am-6.00am Construction workforce arriving to site
Shoulder 6.45am-7.00am Trucks travelling to SAWT facility and SAWT staff
arriving for day shift.
2016
Day 1.15pm-1.30pm
Largest number of trucks travelling to and from
the SAWT facility and SAWT staff arriving for PM
shift.
Evening 9.15pm-9.30pm Arrival of night shift SAWT staff.
Night 5.15am-5.30am SAWT staff arriving for day shift.
Shoulder 6.45am-7.00am Trucks travelling to SAWT facility and SAWT staff
arriving for day shift.
With regards to the cumulative assessment, the worst typical 15 minute periods associated with the combined landfill and expanded SAWT operations were established and are summarised in Table 5-3.
Table 5-3 Busiest 15 Minute Periods Identified for Cumulative Assessment
Assessment
Year
Assessment
Period Identified 15-Min Period Rationale
2016
Day 10.00am-10.15am Largest number of trucks travelling to the Site.
Evening 9.15pm-9.30pm Arrival of night shift SAWT staff.
Night 6.45am-7.00am
Largest number of landfill/SAWT trucks travelling
to the Site and landfill/SAWT staff arriving for
day shift.

SAWT Expansion SITA Elizabeth Drive Page 19 Noise Assessment Report No. 04092-R Version A
5.1.3 Meteorological Environment for Noise Assessment Purposes
The INP generally directs the use of a single set of adverse meteorological data in the assessment of noise impacts (EPA, 2000). However, for noise modelling in this and other projects, WMPL has adopted the more rigorous approach of predicting noise levels at nearby receptors for a range of meteorological conditions based on meteorological data obtained from the site. The noise modelling presented in this assessment is based on data provided by AECOM (2012) from their CALMET model at a location indicative of the Development area for the period from 1 January 2011 to 31 December 2011. CALMET data developed for the Development includes a contiguous dataset of wind speed, direction and Pasquil-Gifford stability classes from which temperature inversions can be deducted. Statistical occurrences of meteorological conditions are used to calculate a 10th percentile exceedance noise level (i.e. the level that is exceeded 10% of the time), which is then compared with relevant intrusiveness criteria.
This alternative assessment procedure involves significantly greater computational complexity than the use of a single set of meteorological conditions. However, WMPL believes it provides a more rigorous method of assessing noise exposure, and one that is more easily understood by the community. The approach of using the 10th percentile calculated noise level as a measure of noise impacts has been considered acceptable by the DP&I and the EPA for other project assessments.
The data for wind direction and wind speed are classified into eight directional intervals and five speed intervals (between 0.5 m/s and 3 m/s – with all other instances of wind speed described as “calm”) in accordance with the INP. (Appendix C presents all the metrological conditions modelled to calculate the 10th percentile noise levels.)
It is important to note that the conditions which determine the 10th percentile noise level are expected to differ between receptors.
In accordance with the INP Application Notes, noise levels at the identified receptors were also predicted for calm isothermal meteorological conditions (referred to as ‘calm’ in this report).
5.1.4 Topography
Prior to site closure, SITA will shape the landfill topography per the ‘Final Approved Landform’.
The existing landform which is based on a ground survey was provided by SITA and used for 2012. The 2014 and 2016 landforms were manually formed by synthesising projected contour maps based on the site’s filling plan.
Topographical information for the areas surrounding the site was provided by SITA.
5.1.5 Tonal and Low Frequency Noise
A tonality and low frequency noise assessment was carried out using the noise model to determine whether a modifying factor correction is needed in accordance with the INP. The model indicated that none of the receivers would be exposed to tonal or low frequency noise and therefore no correction is needed. This assumes that the new fans be specified to ensure that they are not tonal.

SAWT Expansion SITA Elizabeth Drive Page 20 Noise Assessment Report No. 04092-R Version A
5.2 On-Site Industrial Noise Sources
This section only describes the on-site noise sources considered in the assessment and does not include transportation noise sources on public roads which are addressed in Section 11.
5.2.1 SAWT On-Site Industrial Noise Sources
A description of the SAWT noise sources included for the 2012/2014 and 2016 noise model is provided in Tables 5-4 and 5-5, respectively. Note that only the sources with a relatively significant contribution to the overall noise levels have been considered. Mobile plant locations for years 2012, 2014 and 2016 are shown in Figures 5-1, 5-2 and 5-3, respectively.

SAWT Expansion SITA Elizabeth Drive Page 21 Noise Assessment Report No. 04092-R Version A
Figure 5-1 Mobile Plant Locations for 2012
Forklift (when
outside)
Shared Wheel Loader
Shared Excavator
Windrow Turner
Mobile Refining
Line
Hooklift Truck
Shared Wheel Loader
Shared Excavator
Wheel Loader

SAWT Expansion SITA Elizabeth Drive Page 22 Noise Assessment Report No. 04092-R Version A
Figure 5-2 Mobile Plant Locations for 2014
Forklift (when
outside)
Shared Wheel Loader
Shared Excavator
Windrow Turner
Mobile Refining
Line
Hooklift Truck
Shared Wheel Loader
Shared Excavator
Wheel Loader
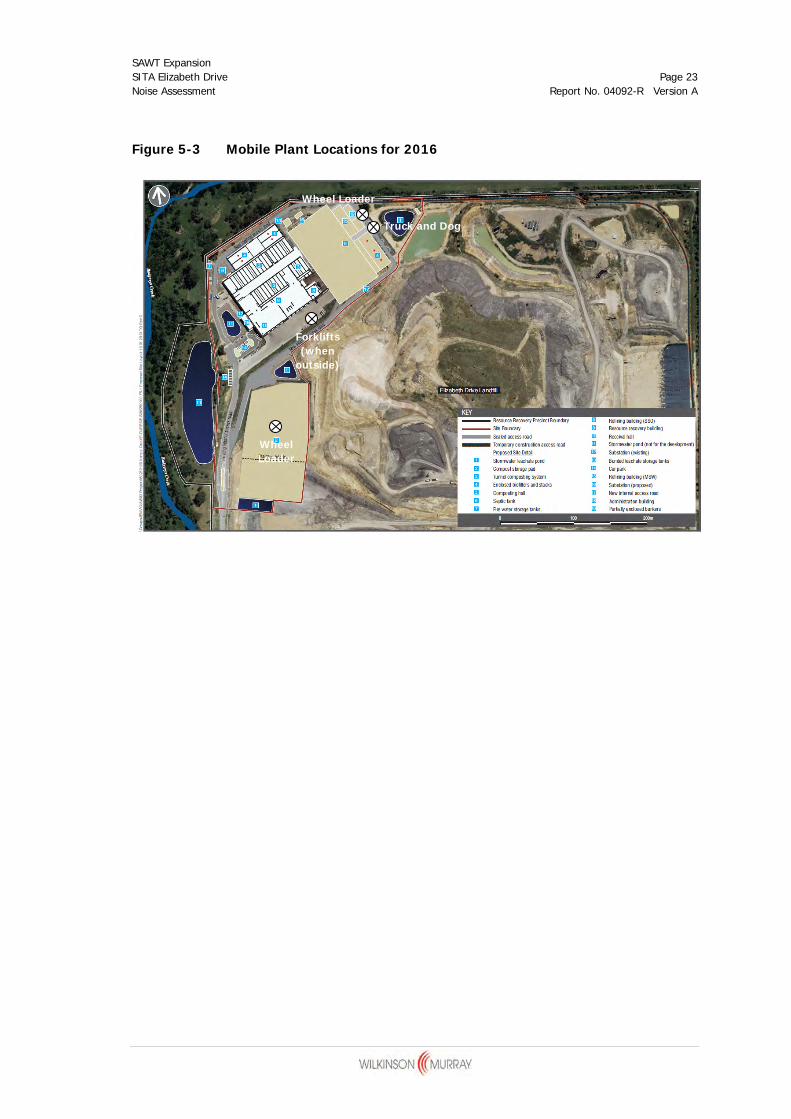
SAWT Expansion SITA Elizabeth Drive Page 23 Noise Assessment Report No. 04092-R Version A
Figure 5-3 Mobile Plant Locations for 2016
Forklifts (when
outside)
Wheel Loader
Truck and Dog
Wheel Loader

SAWT Expansion SITA Elizabeth Drive Page 24 Noise Assessment Report No. 04092-R Version A
Table 5-4 SAWT On-Site Industrial Noise Sources for 2012 and 2014
Plant Item Time of Operation
Percentage
of Time
when in
Operation
Percentage of
Time when
Operating
Outside
Outdoor Mobile Plant
Forklift 6.00am-10.00pm 80% 5%
Wheel loader (maturation pad) 6.00am-10.00pm 80% 100%
Wheel loader (shared between FGO maturation
pad and storage pad) 6.00am-10.00pm 80% 100%
Excavator (shared between maturation pad and
storage pad) 6.00am-6.00pm 50% 100%
Windrow turner (maturation pad) 9.00am-5.00pm 50% 100%
Mobile refining line (FGO maturation pad) 6.00am-10.00pm 80% 100%
Hooklift truck 6.00am-10.00pm 80% 100%
Processing Building
Biofilter room 24hr 100% n/a
Pre-refine outdoor trommel 6.00am-10.00pm 70% n/a
Receival area 6.00am-6.00pm 100% n/a
Refining area 7.00am-10.00pm 100% n/a
Pre-refining area 7.00am-10.00pm 100% n/a
Table 5-5 SAWT On-Site Industrial Noise Sources for 2016
Plant Item Time of Operation
Percentage
of Time
when in
Operation
Percentage of
Time when
Operating
Outside
Outdoor Mobile Plant
2X forklifts 6.00am-10.00pm 100% 10%
Wheel loader (new refining area) 6.00am-10.00pm 80% 100%
Wheel loader (new storage pad) 6.00am-10.00pm 80% 100%
Truck and dog (replacing existing hooklift truck) 6.00am-10.00pm 80% 100%
Processing Building
Existing biofilter room 24hr n/a n/a
Proposed biofilter room 24hr n/a n/a
Existing receival area 6.00am-6.00pm n/a n/a
Proposed refining area 6.00am-12.00am n/a n/a
Existing refining area 6.00am-12.00am n/a n/a

SAWT Expansion SITA Elizabeth Drive Page 25 Noise Assessment Report No. 04092-R Version A
5.2.2 Landfill On-Site Noise Sources
A description of the landfill noise sources included in the cumulative noise model is provided in Table 5-6.
Table 5-6 Landfill On-Site Noise Sources for 2016
Activity Plant items Time of
Operation
Percentage of Time
when in Operation
Mobile Plant
General waste Filling
D6 or D7 dozer
2 X 30t excavators
45t compactor
35t dump truck
7.00am-6.00pm 100% (7.00am-3.00pm) and
50% (3.00pm-6.00pm)
Industrial waste Filling 30t excavator 7.00am-6.00pm 60% (7.00am-4.00pm)
General waste Excavation
D10 dozer
3x CAT637 scrapers
45t excavator
7.00am-6.00pm 100% (7.00am-3.00pm)
Shale Removal 45t excavator 7.00am-6.00pm 100% (7.00am-4.00pm)
General (Watercarts) 2x Watercarts 7.00am-6.00pm 75% (7.00am-4.00pm)
Gas Engines
Gas engines 3x Gas engines
3x Hasse blowers 24hr 100%
5.2.3 Construction On-Site Noise Sources
Bulk earthworks were conservatively assumed when modelling year 2014. Bulk earthworks are anticipated to represent the construction phase generating the most noise impact on the surrounding receptors as it potentially involves the largest number of plant items operating simultaneously. These are likely to include:
two 30t excavators;
four trucks (truck and dog or 30t dump truck);
water cart;
10t roller; and
D6 dozer.
It should be noted that a -5dB correction was applied to noise levels generated by the construction works to account for the fact that not all plant items present on site are likely to be at their loudest during the same 15-minute period.

SAWT Expansion SITA Elizabeth Drive Page 26 Noise Assessment Report No. 04092-R Version A
5.3 Transportation Noise Sources
This section summarises the traffic numbers used in the intrusiveness and amenity noise assessments. As such, numbers have been provided to enable calculation of LAeq noise levels over whole assessment periods, i.e. day (7.00am-6.00pm), evening (6.00pm-10.00pm) and night time (10.00pm-7.00am), and over the identified busiest 15 minutes in each assessment period. It is important to note that all traffic numbers are expressed as movements (i.e. not vehicles).
5.3.1 SAWT Transportation Noise Sources
Traffic numbers associated with deliveries to the SAWT facility and dispatch of material from the facility to various areas within the landfill precinct and off-site are summarised in Table 5-7.

SAWT Expansion SITA Elizabeth Drive Page 27 Noise Assessment Report No. 04092-R Version A
Table 5-7 SAWT Heavy Vehicles – SAWT & Cumulative Assessment
Purpose of Movements
Hourly Number of Movements Representative of Identified Busiest 15 Minutes in each Assessment Period
2012 2014 2016
Day Eve Night Shoulder Day Eve Night Shoulder Day Eve Night Shoulder
Deliveries going to SAWT 1 10.4 0 0 4 10.4 0 0 4 15.6 0 0 8
Material leaving SAWT 1 1.2 0 0 0 1.2 0 0 0 2.4 0 0 0
Dispatch of Residual Material from SAWT to Landfill 1 9.6 0 0 0 9.6 0 0 0 12 0 0 6
Dispatch of Material from SAWT to FGO Maturation 1 2.4 0 0 0 2.4 0 0 0 n/a n/a n/a n/a
Dispatch of Material from SAWT to Stockpiling Area 1 0.8 0 0 0 0.8 0 0 0 n/a n/a n/a n/a
Dispatch of Material from SAWT to Compost Storage
Pad 1 n/a n/a n/a n/a n/a n/a n/a n/a 4.4 1.2 0 0
Note: 1) Hourly traffic volumes were derived from estimated numbers over various time periods. As such, they have been expressed with one decimal place. This is considered appropriate for the purpose of the noise assessment.

SAWT Expansion SITA Elizabeth Drive Page 28 Noise Assessment Report No. 04092-R Version A
Light vehicle numbers associated with SAWT staff commuting to and from the facility are summarised in Tables 5-8 and 5-9.
Table 5-8 SAWT Light Vehicles – SAWT Assessment
Purpose of
Mvts
Total Number of Movements
during Identified Busiest 15 Minutes in each Assessment Period
2012 2014 2016
Day Eve Night Shoulder Day Eve Night Shoulder Day Eve Night Shoulder
SAWT Staff
Commuting
to and from
the Facility
12 0 10 14 12 0 0 14 23 5 24 6
Table 5-9 SAWT Light Vehicles – Cumulative Assessment
Purpose of Movements
Total Number of Movements
during Identified Busiest 15 Minutes in
each Assessment Period
2016
Day Eve Night
SAWT Staff Commuting to and from the Facility 0 5 6
5.3.2 Landfill Transportation Noise Sources
Traffic numbers associated with deliveries to the landfill and dispatch of material off-site and within the landfill are summarised in Table 5-10.
Table 5-10 Landfill Heavy Vehicles
Purpose of Movements
Hourly Number of Movements
Representative of Identified Busiest 15
Minutes in each Assessment Period
2016
Day Eve Night
Deliveries of General Waste 1 11.6 0 19.2
Deliveries of Industrial Waste 1 3.6 0 0
Shale Removal going Off-Site 1 7.6 0 7.6
Shale Transportation to Stockpile (Internal) 1 0 0 0
Note: 1) Traffic volumes are the result of weighbridge logs averaged over a whole week. As such, they have been expressed with one decimal place. This is considered appropriate for the purpose of the noise assessment.

SAWT Expansion SITA Elizabeth Drive Page 29 Noise Assessment Report No. 04092-R Version A
Light vehicle numbers associated with landfill staff commuting to and from the Precinct are summarised in Table 5-11.
Table 5-11 Landfill Light Vehicles
Purpose of Movements
Total Number of Movements during
Identified Busiest 15 Minutes in each
Assessment Period
2016
Day Eve Night
Landfill Staff Commuting to and from the Precinct 0 0 14
5.3.3 Construction Transportation Noise Sources
Heavy traffic numbers associated with the delivery of material to the construction site are summarised in Table 5-12.
Table 5-12 Construction Heavy Vehicles
Purpose of Movements
Hourly Number of Movements Representative of Identified
Busiest 15 Minutes in each Assessment Period
2014
Day Eve Night Shoulder
Trucks Delivering Material to
Construction Site 6.8 0 0 0
* Note: Hourly traffic volumes were derived from estimated numbers over various time periods. As such, they have been expressed with one decimal place. This is considered appropriate for the purpose of the noise assessment.
Light vehicle numbers associated with construction staff commuting to and from the construction site are summarised in Table 5-13.
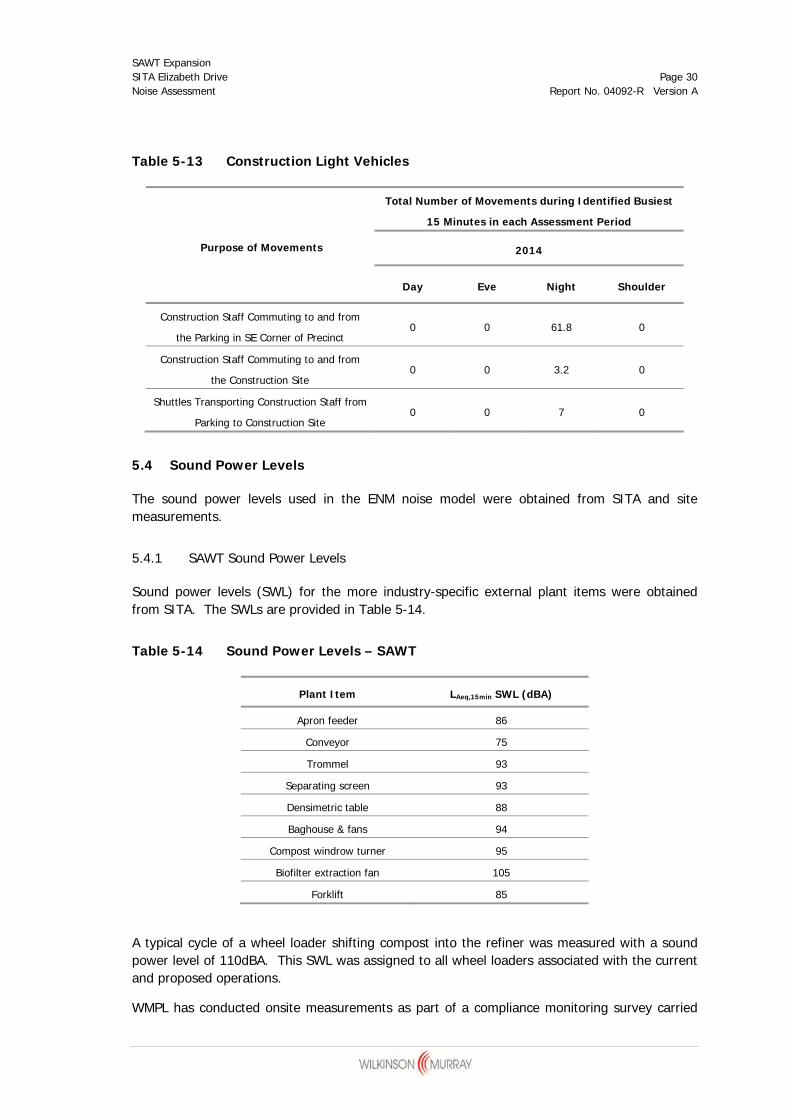
SAWT Expansion SITA Elizabeth Drive Page 30 Noise Assessment Report No. 04092-R Version A
Table 5-13 Construction Light Vehicles
Purpose of Movements
Total Number of Movements during Identified Busiest
15 Minutes in each Assessment Period
2014
Day Eve Night Shoulder
Construction Staff Commuting to and from
the Parking in SE Corner of Precinct 0 0 61.8 0
Construction Staff Commuting to and from
the Construction Site 0 0 3.2 0
Shuttles Transporting Construction Staff from
Parking to Construction Site 0 0 7 0
5.4 Sound Power Levels
The sound power levels used in the ENM noise model were obtained from SITA and site measurements.
5.4.1 SAWT Sound Power Levels
Sound power levels (SWL) for the more industry-specific external plant items were obtained from SITA. The SWLs are provided in Table 5-14.
Table 5-14 Sound Power Levels – SAWT
Plant Item LAeq,15min SWL (dBA)
Apron feeder 86
Conveyor 75
Trommel 93
Separating screen 93
Densimetric table 88
Baghouse & fans 94
Compost windrow turner 95
Biofilter extraction fan 105
Forklift 85
A typical cycle of a wheel loader shifting compost into the refiner was measured with a sound power level of 110dBA. This SWL was assigned to all wheel loaders associated with the current and proposed operations.
WMPL has conducted onsite measurements as part of a compliance monitoring survey carried
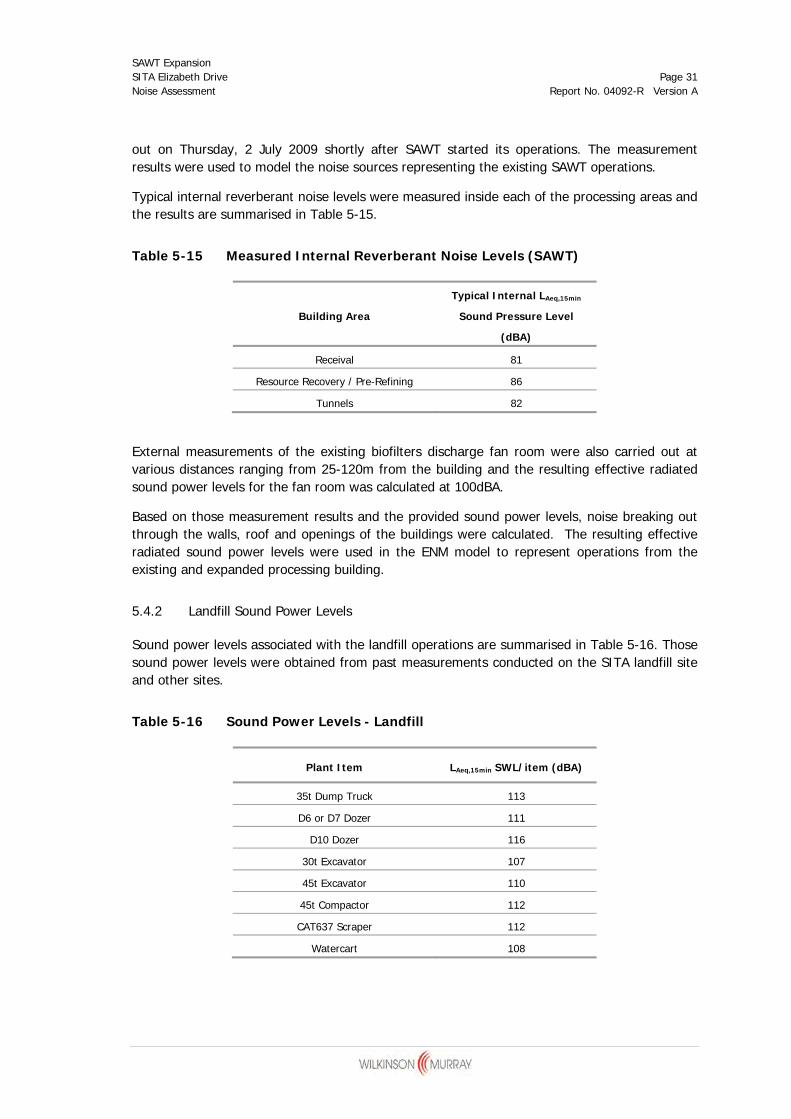
SAWT Expansion SITA Elizabeth Drive Page 31 Noise Assessment Report No. 04092-R Version A
out on Thursday, 2 July 2009 shortly after SAWT started its operations. The measurement results were used to model the noise sources representing the existing SAWT operations.
Typical internal reverberant noise levels were measured inside each of the processing areas and the results are summarised in Table 5-15.
Table 5-15 Measured Internal Reverberant Noise Levels (SAWT)
Building Area
Typical Internal LAeq,15min
Sound Pressure Level
(dBA)
Receival 81
Resource Recovery / Pre-Refining 86
Tunnels 82
External measurements of the existing biofilters discharge fan room were also carried out at various distances ranging from 25-120m from the building and the resulting effective radiated sound power levels for the fan room was calculated at 100dBA.
Based on those measurement results and the provided sound power levels, noise breaking out through the walls, roof and openings of the buildings were calculated. The resulting effective radiated sound power levels were used in the ENM model to represent operations from the existing and expanded processing building.
5.4.2 Landfill Sound Power Levels
Sound power levels associated with the landfill operations are summarised in Table 5-16. Those sound power levels were obtained from past measurements conducted on the SITA landfill site and other sites.
Table 5-16 Sound Power Levels - Landfill
Plant Item LAeq,15min SWL/item (dBA)
35t Dump Truck 113
D6 or D7 Dozer 111
D10 Dozer 116
30t Excavator 107
45t Excavator 110
45t Compactor 112
CAT637 Scraper 112
Watercart 108

SAWT Expansion SITA Elizabeth Drive Page 32 Noise Assessment Report No. 04092-R Version A
5.4.3 Transportation Sound Power Levels
Truck deliveries on the adjacent landfill have been established with an average sound power level of 104dBA. This level was assumed typical of all trucks going to the landfill, SAWT facility, or the depot in the south-east corner of the landfill precinct.
A SWL of 90dBA was assumed for all light vehicles.
5.4.4 Construction Sound Power Levels
Sound power levels associated with bulk earthworks are summarised in Table 5-17. Those sound power levels were obtained from past measurements conducted across a wide variety of construction sites.
Table 5-17 Sound Power Levels - Construction
Plant Item LAeq,15min SWL/item (dBA)
30t Excavator 107
Dump Truck 104
Watercart 108
10t Roller 108
D6 111
Shuttles transporting construction staff from the parking area to the construction site have been modelled with a sound power level of 100dBA.

SAWT Expansion SITA Elizabeth Drive Page 33 Noise Assessment Report No. 04092-R Version A
6 MODEL VALIDATION
On-site measurements were conducted around the SAWT facility on Thursday, 2 July 2009. The measurements were focused on noise radiated from the SAWT facility and noise generated by wheel loaders. Those measurement results were then extrapolated to predict noise levels and assess compliance at the potentially most affected western residential receiver i.e. the McGarvie Smith Farm (R20).
Considering ground absorption, air absorption and distance attenuation daytime noise levels from the SAWT facility were predicted between 30-41dBA at R20.
A comparison of the predicted daytime noise levels based on the site measurements and those predicted using ENM is summarised in Table 6-1.
Table 6-1 Comparison of Levels based on Measurements and Levels Generated using ENM
Rec ID Location
Daytime LAeq,15min
based on
Measurements
(dBA)
Daytime LAeq,15min
based on Noise
Model
(dBA)
R20 McGarvie Smith Farm 30-41 42
The daytime noise level predicted using ENM is consistent with the higher end of the range of levels established based on site measurements.
It is important to note that site measurements only accounted for on-site wheel loaders and noise radiated from the facility and as such did not consider noise generated by trucks using the facility and on-site excavators which were not operating during the measurements. Furthermore, the predicted level using ENM represents a 10th percentile predicted LAeq,15min noise level. Those factors explain why the measurement-based levels are at times lower than the ENM-based predicted level.
WMPL therefore considers that the ENM site model calibrates well with the measurements, possibly marginally over predicting the noise levels.
SAWT Expansion SITA Elizabeth Drive Page 34 Noise Assessment Report No. 04092-R Version A
7 PRELIMINARY ASSESSMENT OF OPERATIONAL NOISE
A preliminary model was constructed with typical noise source SWLs to determine if the baseline operational concept meets the noise criteria. For the model it was assumed that no noise mitigation measures were in place. Some exceedances of the criteria were found. An iterative process involving interaction with SITA was undertaken to determine the necessary noise mitigation measures so as to meet the criteria. It was determined that the following controls would reduce the operational noise to meet the criteria relevant to the Development:
Introduction of noise mitigation to the wheel loaders to ensure maximum SWL of 108dBA or introducing new loaders with a SWL less than 108dBA.
Attenuation of all seven biofilter extraction fan ducting systems such that noise emanated from top of each stack is reduced by 10dBA. The most appropriate and effective noise mitigation for controlling the noise generated by the fans would be to introduce a silencer between the biofilter extraction fans and the stack outlets.
The cessation of wheel loader outdoor operations after 10.00pm.
The erection of an 8.5m high and 30m long wall of sufficient density along the northern side of the external refining bunkers to reduce noise generated by mobile plant at the northern receptors. The bunkers area will also be roofed at the same height as the refining building.
The seven biofilter extraction fans should be specified to ensure that they are not tonal.
It should also be noted that SITA has committed to using quackers (broadband reversing alarms) instead of tonal reversing alarms on all mobile plant.
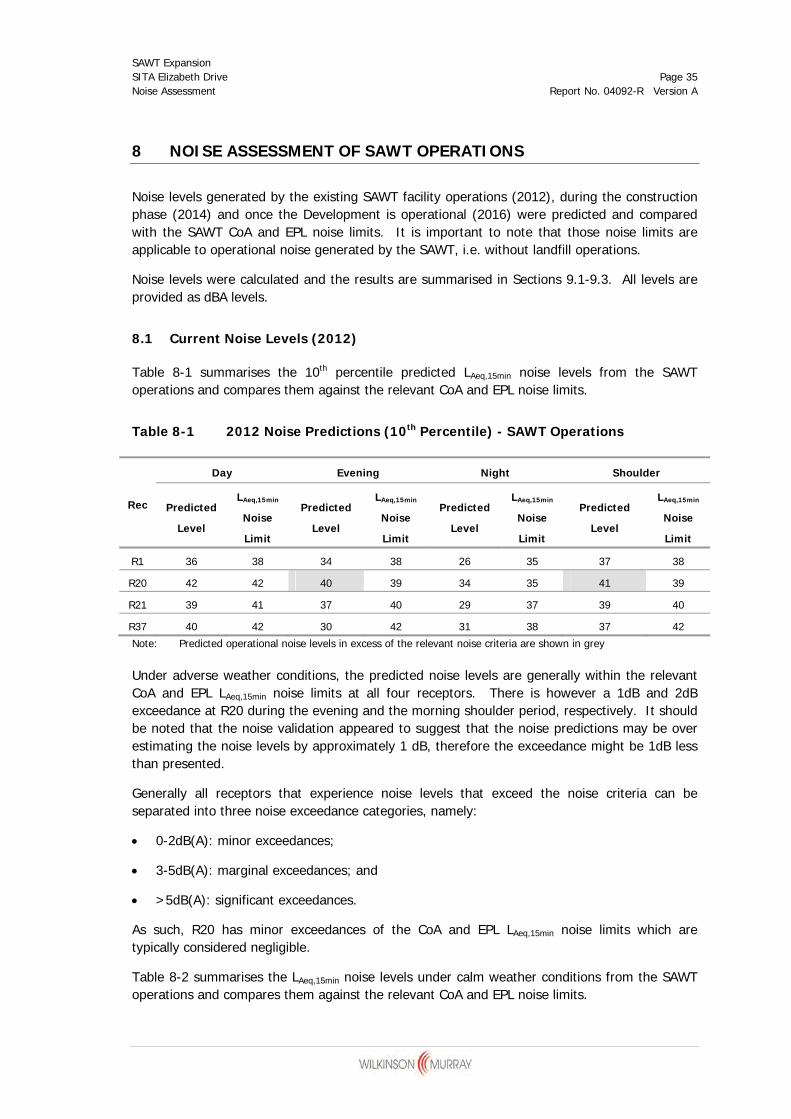
SAWT Expansion SITA Elizabeth Drive Page 35 Noise Assessment Report No. 04092-R Version A
8 NOISE ASSESSMENT OF SAWT OPERATIONS
Noise levels generated by the existing SAWT facility operations (2012), during the construction phase (2014) and once the Development is operational (2016) were predicted and compared with the SAWT CoA and EPL noise limits. It is important to note that those noise limits are applicable to operational noise generated by the SAWT, i.e. without landfill operations.
Noise levels were calculated and the results are summarised in Sections 9.1-9.3. All levels are provided as dBA levels.
8.1 Current Noise Levels (2012)
Table 8-1 summarises the 10th percentile predicted LAeq,15min noise levels from the SAWT operations and compares them against the relevant CoA and EPL noise limits.
Table 8-1 2012 Noise Predictions (10th Percentile) - SAWT Operations
Rec
Day Evening Night Shoulder
Predicted
Level
LAeq,15min
Noise
Limit
Predicted
Level
LAeq,15min
Noise
Limit
Predicted
Level
LAeq,15min
Noise
Limit
Predicted
Level
LAeq,15min
Noise
Limit
R1 36 38 34 38 26 35 37 38
R20 42 42 40 39 34 35 41 39
R21 39 41 37 40 29 37 39 40
R37 40 42 30 42 31 38 37 42
Note: Predicted operational noise levels in excess of the relevant noise criteria are shown in grey
Under adverse weather conditions, the predicted noise levels are generally within the relevant CoA and EPL LAeq,15min noise limits at all four receptors. There is however a 1dB and 2dB exceedance at R20 during the evening and the morning shoulder period, respectively. It should be noted that the noise validation appeared to suggest that the noise predictions may be over estimating the noise levels by approximately 1 dB, therefore the exceedance might be 1dB less than presented.
Generally all receptors that experience noise levels that exceed the noise criteria can be separated into three noise exceedance categories, namely:
0-2dB(A): minor exceedances;
3-5dB(A): marginal exceedances; and
>5dB(A): significant exceedances.
As such, R20 has minor exceedances of the CoA and EPL LAeq,15min noise limits which are typically considered negligible.
Table 8-2 summarises the LAeq,15min noise levels under calm weather conditions from the SAWT operations and compares them against the relevant CoA and EPL noise limits.
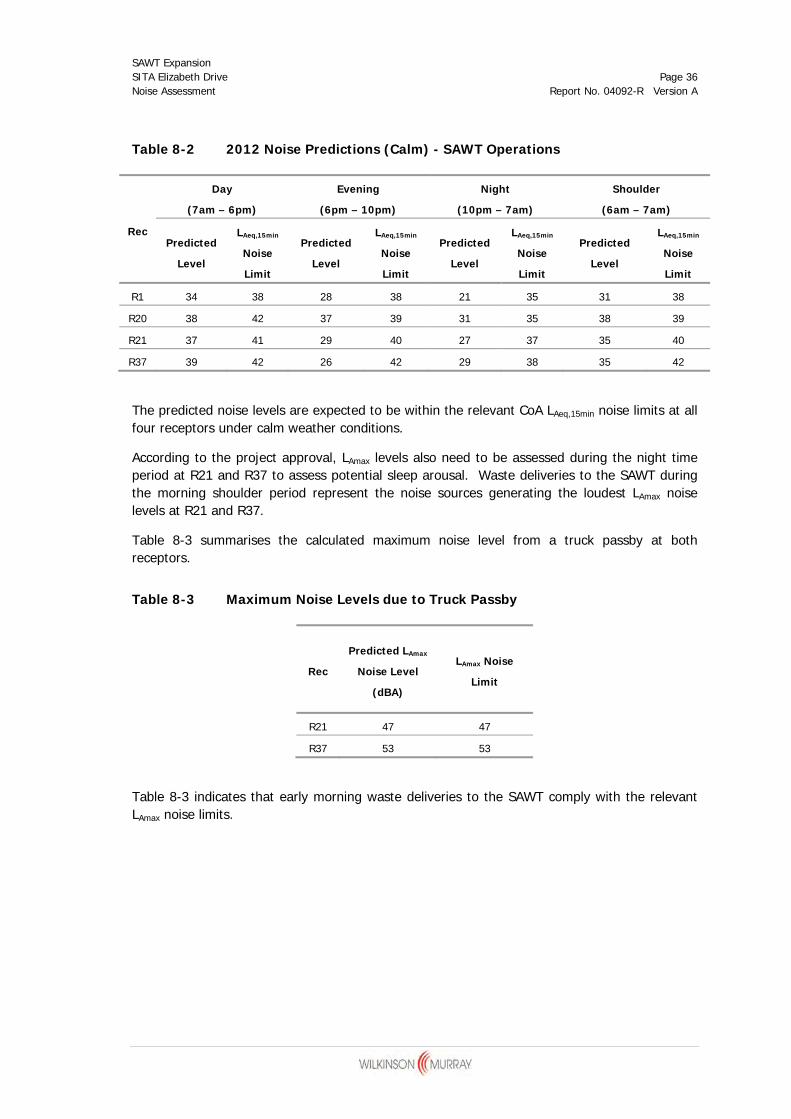
SAWT Expansion SITA Elizabeth Drive Page 36 Noise Assessment Report No. 04092-R Version A
Table 8-2 2012 Noise Predictions (Calm) - SAWT Operations
Rec
Day
(7am – 6pm)
Evening
(6pm – 10pm)
Night
(10pm – 7am)
Shoulder
(6am – 7am)
Predicted
Level
LAeq,15min
Noise
Limit
Predicted
Level
LAeq,15min
Noise
Limit
Predicted
Level
LAeq,15min
Noise
Limit
Predicted
Level
LAeq,15min
Noise
Limit
R1 34 38 28 38 21 35 31 38
R20 38 42 37 39 31 35 38 39
R21 37 41 29 40 27 37 35 40
R37 39 42 26 42 29 38 35 42
The predicted noise levels are expected to be within the relevant CoA LAeq,15min noise limits at all four receptors under calm weather conditions.
According to the project approval, LAmax levels also need to be assessed during the night time period at R21 and R37 to assess potential sleep arousal. Waste deliveries to the SAWT during the morning shoulder period represent the noise sources generating the loudest LAmax noise levels at R21 and R37.
Table 8-3 summarises the calculated maximum noise level from a truck passby at both receptors.
Table 8-3 Maximum Noise Levels due to Truck Passby
Rec
Predicted LAmax
Noise Level
(dBA)
LAmax Noise
Limit
R21 47 47
R37 53 53
Table 8-3 indicates that early morning waste deliveries to the SAWT comply with the relevant LAmax noise limits.

SAWT Expansion SITA Elizabeth Drive Page 37 Noise Assessment Report No. 04092-R Version A
8.2 Noise Levels during Construction (2014)
Table 8-4 summarises the 10th percentile predicted LAeq,15min noise levels from the combined SAWT operations and construction activities and compares them against the relevant CoA and EPL noise limits.
Table 8-4 2014 Noise Predictions (10th Percentile) – SAWT Operations with Construction
Rec
Day
(7am – 6pm)
Evening
(6pm – 10pm)
Night
(10pm – 7am)
Shoulder
(6am – 7am)
Predicted
Level
LAeq,15min
Noise
Limit
Predicted
Level
LAeq,15min
Noise
Limit
Predicted
Level
LAeq,15min
Noise
Limit
Predicted
Level
LAeq,15min
Noise
Limit
R1 39 38 34 38 33 35 36 38
R20 43 42 40 39 35 35 42 39
R21 40 41 37 40 37 37 40 40
R37 41 42 30 42 39 38 37 42
Note: Predicted operational noise levels in excess of the relevant noise criteria are shown in grey
During the day, the addition of construction activities is expected to increase noise levels on the surrounding receptors with a 1dB exceedance anticipated at R1 and R20. Such a small exceedance is considered negligible.
In the evening, no changes are noted when compared with the 2012 predictions and therefore R20 is still expected to exceed by 1dB. Again, this is generally considered negligible.
With regards to construction staff arrivals at night, one 1dB exceedance is expected at R37. Such small exceedance is generally considered negligible.
During the morning shoulder period, a 3dB exceedance is expected at R20.
Table 8-5 summarises the predicted LAeq,15min noise levels under calm weather conditions from the combined SAWT operations and construction activities and compares them against the relevant CoA and EPL noise limits.

SAWT Expansion SITA Elizabeth Drive Page 38 Noise Assessment Report No. 04092-R Version A
Table 8-5 2014 Noise Predictions (Calm) - SAWT Operations with Construction
Rec
Day
(7am – 6pm)
Evening
(6pm – 10pm)
Night
(10pm – 7am)
Shoulder
(6am – 7am)
Predicted
Level
LAeq,15min
Noise
Limit
Predicted
Level
LAeq,15min
Noise
Limit
Predicted
Level
LAeq,15min
Noise
Limit
Predicted
Level
LAeq,15min
Noise
Limit
R1 38 38 28 38 28 35 32 38
R20 41 42 37 39 32 35 41 39
R21 39 41 29 40 35 37 36 40
R37 40 42 26 42 37 38 35 42
Note: Predicted operational noise levels in excess of the relevant noise criteria are shown in grey
Under calm weather conditions, the addition of construction activities is expected to impact on the surrounding receptors with a 2dB exceedance expected at R20 in the morning shoulder period. The 2dB exceedance is generally considered negligible.
LAmax levels at R21 and R37 are not anticipated to change between 2012 and 2014 and therefore compliance with the relevant LAmax noise limits can be assumed in 2014.
8.3 Noise Levels after SAWT Expansion Development (2016)
Table 8-6 summarises the 10th percentile predicted LAeq,15min noise levels from the expanded SAWT operations and compares them against the relevant CoA and EPL noise limits.
Table 8-6 2016 Noise Predictions (10th Percentile) – SAWT Operations
Rec
Day
(7am – 6pm)
Evening
(6pm – 10pm)
Night
(10pm – 7am)
Shoulder
(6am – 7am)
Predicted
Level
LAeq,15min
Noise
Limit
Predicted
Level
LAeq,15min
Noise
Limit
Predicted
Level
LAeq,15min
Noise
Limit
Predicted
Level
LAeq,15min
Noise
Limit
R1 37 38 30 38 25 35 36 38
R20 37 42 35 39 27 35 35 39
R21 38 41 28 40 28 37 36 40
R37 41 42 29 42 31 38 39 42
The predicted noise levels are expected to be within the relevant CoA and EPL LAeq,15min noise limits at all four receptors under adverse weather conditions.
Table 8-7 summarises the predicted LAeq,15min noise levels under calm weather conditions from the expanded SAWT operations and compares them against the relevant CoA and EPL noise limits.

SAWT Expansion SITA Elizabeth Drive Page 39 Noise Assessment Report No. 04092-R Version A
Table 8-7 2016 Noise Predictions (Calm) - SAWT Operations
Rec
Day
(7am – 6pm)
Evening
(6pm – 10pm)
Night
(10pm – 7am)
Shoulder
(6am – 7am)
Predicted
Level
LAeq,15min
Noise
Limit
Predicted
Level
LAeq,15min
Noise
Limit
Predicted
Level
LAeq,15min
Noise
Limit
Predicted
Level
LAeq,15min
Noise
Limit
R1 34 38 25 38 31 35 20 38
R20 34 42 32 39 33 35 25 39
R21 38 41 25 40 35 37 27 40
R37 40 42 27 42 37 38 29 42
The predicted noise levels are expected to be within the relevant CoA LAeq,15min noise limits at all four receptors under calm weather conditions.
LAmax levels at R21 and R37 are not anticipated to change between 2012, 2014 and 2016 and therefore compliance with the relevant LAmax noise limits can be assumed in 2016.

SAWT Expansion SITA Elizabeth Drive Page 40 Noise Assessment Report No. 04092-R Version A
9 NOISE ASSESSMENT OF CUMULATIVE OPERATIONS
Table 9-1 summarises the 10th percentile predicted LAeq,15min noise levels for the combined expanded SAWT operations (2016) and landfill operations and compares them against the landfill EPL noise limits. Table 9-2 summarises the predicted LAeq,15min noise levels under calm weather conditions.
Table 9-1 Cumulative Noise Predictions (10th Percentile)
Rec
Day
(7am – 6pm)
Evening
(6pm – 10pm)
Night
(10pm – 7am)
SAWT &
Landfill
EPL Noise
Limit
SAWT &
Landfill
EPL Noise
Limit
SAWT &
Landfill
EPL Noise
Limit
R1 50 50 30 50 41 45
R2 40 50 33 50 35 45
R3 40 50 30 50 31 45
R4 32 50 27 50 30 45
R5 32 50 27 50 31 45
R6 33 50 24 50 31 45
R7 38 50 27 50 38 45
R8 27 50 15 50 25 45
R9 39 50 30 50 39 45
R10 28 50 19 50 28 45
R11 36 50 33 50 35 45
R12 38 50 34 50 38 45
R13 36 50 33 50 35 45
R14 26 50 20 50 25 45
R15 35 50 32 50 33 45
R16 33 50 27 50 29 45
R17 39 50 34 50 35 45
R18 34 50 26 50 28 45
R19 42 50 34 50 34 45
R20 43 50 35 50 35 45
R21 42 50 28 50 41 45
R22 45 50 30 50 45 45
R23 44 50 38 50 38 45
R24 39 50 30 50 32 45
R25 38 50 29 50 30 45
R26 40 50 37 50 37 45

SAWT Expansion SITA Elizabeth Drive Page 41 Noise Assessment Report No. 04092-R Version A
Rec
Day
(7am – 6pm)
Evening
(6pm – 10pm)
Night
(10pm – 7am)
SAWT &
Landfill
EPL Noise
Limit
SAWT &
Landfill
EPL Noise
Limit
SAWT &
Landfill
EPL Noise
Limit
R27 36 50 33 50 34 45
R28 34 50 29 50 30 45
R31 35 50 26 50 28 45
R32 29 50 24 50 25 45
R33 30 50 22 50 22 45
R34 32 50 27 50 27 45
R35 34 50 29 50 29 45
R36 30 50 22 50 23 45
R37 45 50 29 50 45 45
The predicted noise levels are expected to be within the relevant landfill EPL LAeq,15min noise limits at all the identified receptors under adverse weather conditions.
Table 9-2 Cumulative Noise Predictions (Calm)
Rec
Day
(7am – 6pm)
Evening
(6pm – 10pm)
Night
(10pm – 7am)
SAWT &
Landfill
EPL Noise
Limit
SAWT &
Landfill
EPL Noise
Limit
SAWT &
Landfill
EPL Noise
Limit
R1 48 50 25 50 37 45
R2 33 50 21 50 27 45
R3 29 50 16 50 21 45
R4 26 50 11 50 21 45
R5 27 50 12 50 23 45
R6 27 50 13 50 24 45
R7 33 50 17 50 31 45
R8 25 50 11 50 22 45
R9 38 50 23 50 37 45
R10 27 50 15 50 24 45
R11 32 50 24 50 29 45
R12 35 50 24 50 32 45
R13 33 50 27 50 30 45
R14 23 50 14 50 19 45
R15 32 50 25 50 27 45
R16 30 50 23 50 25 45

SAWT Expansion SITA Elizabeth Drive Page 42 Noise Assessment Report No. 04092-R Version A
Rec
Day
(7am – 6pm)
Evening
(6pm – 10pm)
Night
(10pm – 7am)
SAWT &
Landfill
EPL Noise
Limit
SAWT &
Landfill
EPL Noise
Limit
SAWT &
Landfill
EPL Noise
Limit
R17 37 50 31 50 33 45
R18 30 50 21 50 23 45
R19 36 50 30 50 31 45
R20 38 50 32 50 33 45
R21 42 50 25 50 41 45
R22 45 50 28 50 45 45
R23 38 50 33 50 33 45
R24 30 50 20 50 22 45
R25 29 50 18 50 20 45
R26 34 50 29 50 29 45
R27 31 50 23 50 24 45
R28 28 50 20 50 21 45
R31 26 50 14 50 16 45
R32 23 50 13 50 15 45
R33 23 50 10 50 13 45
R34 24 50 13 50 15 45
R35 25 50 15 50 16 45
R36 24 50 13 50 15 45
R37 44 50 27 50 43 45
The predicted noise levels are expected to be within the relevant landfill EPL LAeq,15min noise limits at all the identified receptors under calm weather conditions.

SAWT Expansion SITA Elizabeth Drive Page 43 Noise Assessment Report No. 04092-R Version A
10 NOISE ASSESSMENT ACCORDING TO INP
As mentioned in the introduction a cumulative noise assessment considering INP criteria has been conducted to provide an understanding of the impacts consistent with contemporary guidelines. As such background noise levels have been measured without noise from either the SAWT or the Landfill to establish INP noise criteria.
10.1 Noise Survey
Since traffic volumes on the surrounding road network continue to grow, background noise levels continue to increase. As such, a new noise survey is considered necessary to provide an adequate up-to-date baseline for this assessment. The noise survey was conducted in accordance with the INP.
10.1.1 Monitoring Locations
Background noise levels were measured between Friday, 20 July and Monday, 30 July 2012 using environmental noise loggers set up at three residential receptors around the Site. Each logger location was selected to represent receptors at various distances to Elizabeth Drive.
It is important to note that care was taken to ensure industrial noise associated with the Site (including both SAWT and landfill operations) did not affect the acoustic environment at the logger locations during the day and at night. This was done by means of daytime and night time attended noise measurements along Elizabeth Drive, Badgerys Creek Road, Mamre Road, Luddenham Road, Twin Creeks Drive and Humewood Place. Night time measurements were conducted in the early hours of Tuesday, 17 July 2012 to establish the areas in which SAWT operations are contributing to the overall background noise levels. Similarly, daytime attended measurements were conducted on Friday, 20 July to establish the areas in which SAWT operations and/or landfill operations are contributing to the overall background noise levels. Those areas already impacted by noise from the site were strictly avoided when installing the noise loggers to ensure industrial noise associated with the site did not affect the acoustic environment at the various logger locations.
One should also consider that no other industrial noise sources were noted during the attended noise measurements.
The three logger locations are described in Table 10-1 and shown in Figure 10-1.
Table 10-1 Logger Locations
Logger Location ID Residential Address
L1 55 Taylors Road, Badgerys Creek
L2 35 Overett Avenue, Kemps Creek
L3 28 Twins Creek Drive, Badgerys Creek

SAWT Expansion SITA Elizabeth Drive Page 44 Noise Assessment Report No. 04092-R Version A
Figure 10-1 Logger Locations
L3
L1
L2

SAWT Expansion SITA Elizabeth Drive Page 45 Noise Assessment Report No. 04092-R Version A
10.1.2 Equipment
The noise monitoring equipment used for this measurement consisted of Acoustic Research Laboratories Environmental Noise Loggers set to A-Weighted, fast response continuously monitoring over 15-minute sampling periods. This equipment is capable of remotely monitoring and storing noise level descriptors for later detailed analysis. The equipment calibration was checked before and after the survey to ensure the equipment stayed calibrated throughout the survey.
The loggers determine LA1, LA10, LA90 and LAeq levels of the ambient noise. The LA1, LA10 and LA90 levels are the levels exceeded for 1%, 10% and 90% of the sample time respectively. The LA1 is indicative of maximum noise levels due to individual noise events such as the occasional passby of a heavy vehicle. This is used for the noise assessment of potential sleep disturbance. The LA90 level is normally taken as the background noise level during the relevant period. The LAeq level is the Equivalent Continuous Sound Level and has the same sound energy over the sampling period as the actual noise environment with its fluctuating sound levels. The LAeq is used for the assessment of operational noise and traffic noise. The noise descriptors are further explained in the Glossary of Acoustic Terms.
10.1.3 Measured Background Noise Levels
The monitored noise levels are shown in graphical format in Appendix A.
Periods of adverse meteorological conditions were excluded from the results before calculating RBLs. Those periods of adverse meteorological conditions were minimal during the noise survey and are shown as greyed out in the graphs. Meteorological data was obtained from the weather station located on the landfill site. As a precaution, this data was also compared with data obtained from the Badgerys Creek Bureau of Meteorological (BoM) station and no inconsistencies were found.
Table 10-2 summarises the background noise levels that were measured, expressed as Rating Background Levels (RBL). The RBL represents the background noise in the area, and is determined from measurement of LA90 noise levels, in the absence of noise from the source. The method for calculating RBL values from measured LA90 levels is presented in the INP.
Table 10-2 Measured Rating Background Levels
Location
Measured RBL (dBA)
Day
(7am–6pm)
Evening
(6pm–10pm)
Night Time
(10pm–7am)
L1 37 36 33
L2 42 39 33
L3 33 33 30
Background noise levels measured at L1, L2 and L3 were assigned to the identified receptors addressed in this assessment based on their location relative to Elizabeth Drive. This is shown in Table 10-3.

SAWT Expansion SITA Elizabeth Drive Page 46 Noise Assessment Report No. 04092-R Version A
Table 10-3 Representative Logger Location and RBLs for Identified Receptors
Rec
ID
Representative
Logger Location
Measured RBL (dBA)
Day
(7am–6pm)
Evening
(6pm–10pm)
Night Time
(10pm–7am)
R1 L1 37 36 33
R2 L1 37 36 33
R3 L1 37 36 33
R4 L2 42 39 33
R5 L2 42 39 33
R6 L2 42 39 33
R7 L2 42 39 33
R8 L1 37 36 33
R9 L2 42 39 33
R10 L1 37 36 33
R11 L2 42 39 33
R12 L2 42 39 33
R13 L2 42 39 33
R14 L1 37 36 33
R15 L2 42 39 33
R16 L2 42 39 33
R17 L1 37 36 33
R18 L1 37 36 33
R19 L1 37 36 33
R20 L1 37 36 33
R21 L2 42 39 33
R22 L2 42 39 33
R23 L1 37 36 33
R24 L3 33 33 30
R25 L3 33 33 30
R26 L3 33 33 30
R27 L3 33 33 30
R28 L3 33 33 30
R31 L3 33 33 30
R32 L3 33 33 30
R33 L1 37 36 33
R34 L3 33 33 30
R35 L3 33 33 30
R36 L3 33 33 30
R37 L1 37 36 33

SAWT Expansion SITA Elizabeth Drive Page 47 Noise Assessment Report No. 04092-R Version A
10.2 Industrial Noise Criteria
10.2.1 Description of Criteria
The INP recommends two criteria, “Intrusiveness” and “Amenity”, both of which are relevant for the assessment of noise. In most situations, one of these is more stringent than the other and dominates the noise assessment. The criteria are based on the LAeq descriptor, which is explained in the Glossary of Terms section above.
Intrusiveness Criterion
Where noise levels are currently low, noise levels from the proposed operation are limited by the intrusiveness criterion. In general, the LAeq noise level from such sources should not exceed the Rating Background Level (RBL) by more than 5dBA. This is assessed over a typical worst case period of 15 minutes.
Amenity Criterion
The amenity criterion sets an upper limit to control the total LAeq noise level from all industrial sources.
The amenity criterion sets a limit on the total noise level from all industrial noise sources affecting a receiver. Different criteria apply for different types of receiver (e.g. residence, school classroom); different areas (e.g. rural, suburban); and different time periods, namely daytime (7.00am-6.00pm), evening (6.00pm-10.00pm) and night time (10.00pm-7.00am).
The noise level to be compared with this criterion is the LAeq noise level, measured over the time period in question, due to all industrial noise sources, but excluding non-industrial sources such as transportation.
Where a new noise source is proposed in an area with negligible existing industrial noise, the amenity criterion for that source may be taken as being equal to the overall amenity criterion. However, where noise levels from industrial sources are close to or above the acceptable levels then the amenity criterion, which incorporates a sliding scale to set limits, would apply. The sliding scale prevents the overall noise level exceeding the acceptable level due to the addition of a new noise source. Amenity criterion also needs to consider the possibility of other developments which may affect noise levels.
10.2.2 Determination of Project-Specific Industrial Noise Criteria
Intrusiveness Criteria
Based on Table 10-3, Table 10-4 summarises the noise criteria that are set for the Site.
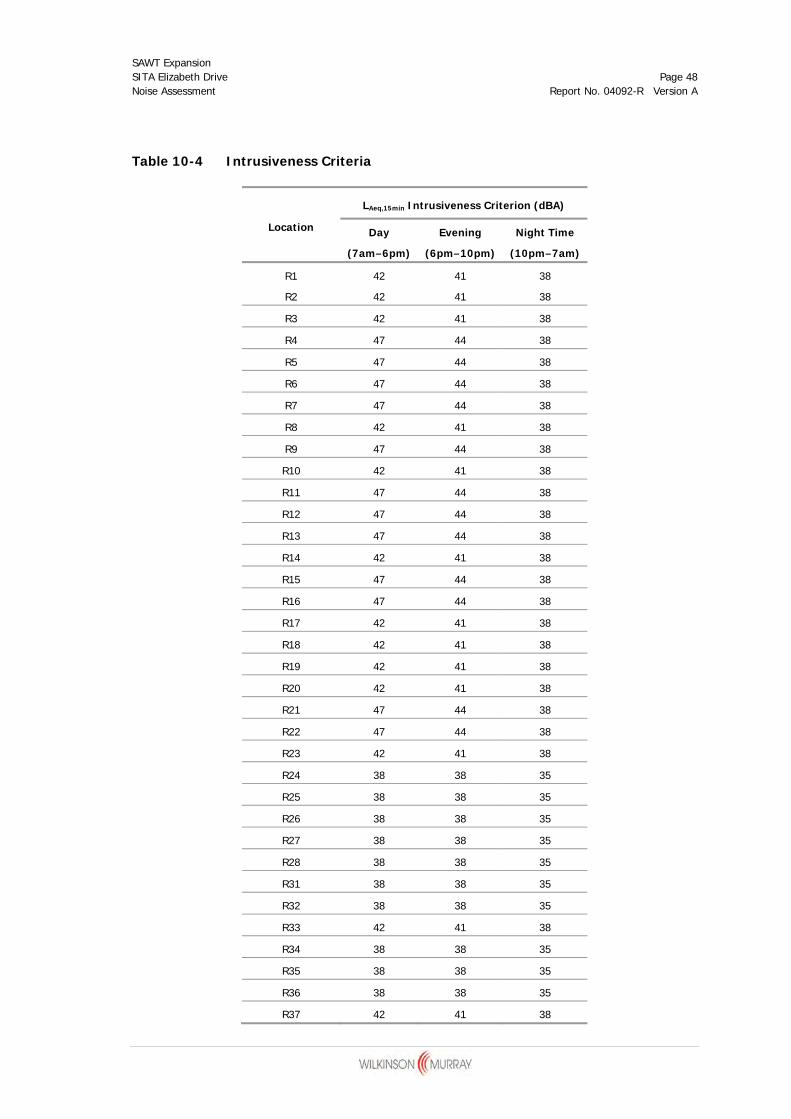
SAWT Expansion SITA Elizabeth Drive Page 48 Noise Assessment Report No. 04092-R Version A
Table 10-4 Intrusiveness Criteria
Location
LAeq,15min Intrusiveness Criterion (dBA)
Day
(7am–6pm)
Evening
(6pm–10pm)
Night Time
(10pm–7am)
R1 42 41 38
R2 42 41 38
R3 42 41 38
R4 47 44 38
R5 47 44 38
R6 47 44 38
R7 47 44 38
R8 42 41 38
R9 47 44 38
R10 42 41 38
R11 47 44 38
R12 47 44 38
R13 47 44 38
R14 42 41 38
R15 47 44 38
R16 47 44 38
R17 42 41 38
R18 42 41 38
R19 42 41 38
R20 42 41 38
R21 47 44 38
R22 47 44 38
R23 42 41 38
R24 38 38 35
R25 38 38 35
R26 38 38 35
R27 38 38 35
R28 38 38 35
R31 38 38 35
R32 38 38 35
R33 42 41 38
R34 38 38 35
R35 38 38 35
R36 38 38 35
R37 42 41 38

SAWT Expansion SITA Elizabeth Drive Page 49 Noise Assessment Report No. 04092-R Version A
Amenity Noise Levels
The area surrounding the SITA Site is currently rural. Furthermore, no other industrial noise sources potentially impacting on the identified receptors have been noted during the attended measurements. Therefore under the INP the amenity criteria are 50dBA, 45dBA and 40dBA LAeq,period for daytime, evening and night time periods, respectively.
Sleep Disturbance Criteria
The INP Application Notes specify sleep disturbance criteria as the RBL plus 15dBA. Table 10-5 summarises the noise criteria that are set for the Site.
Table 10-5 Sleep Disturbance Criteria
Location
Night Time (10pm–7am)
RBL (dBA) Sleep Disturbance Criteria (dBA)
R1 33 48
R2 33 48
R3 33 48
R4 33 48
R5 33 48
R6 33 48
R7 33 48
R8 33 48
R9 33 48
R10 33 48
R11 33 48
R12 33 48
R13 33 48
R14 33 48
R15 33 48
R16 33 48
R17 33 48
R18 33 48
R19 33 48
R20 33 48
R21 33 48
R22 33 48
R23 33 48
R24 30 45
R25 30 45

SAWT Expansion SITA Elizabeth Drive Page 50 Noise Assessment Report No. 04092-R Version A
Location
Night Time (10pm–7am)
RBL (dBA) Sleep Disturbance Criteria (dBA)
R26 30 45
R27 30 45
R28 30 45
R31 30 45
R32 30 45
R33 33 48
R34 30 45
R35 30 45
R36 30 45
R37 33 48
10.3 Assessment of Predicted Noise Levels
10.3.1 Intrusiveness Noise Assessment
Table 10-6 summarises the 10th percentile predicted LAeq,15min noise levels for the expanded SAWT operations alone and when combined with landfill operations and assesses them against the newly developed intrusiveness noise criteria. Table 10-7 summarises the predicted LAeq,15min noise levels under calm weather conditions.
Figures showing indicative noise contours representing the 10th percentile predicted noise levels of the combined SAWT/Landfill operations and SAWT only operations for the day, evening and night time periods are presented in Appendix B.
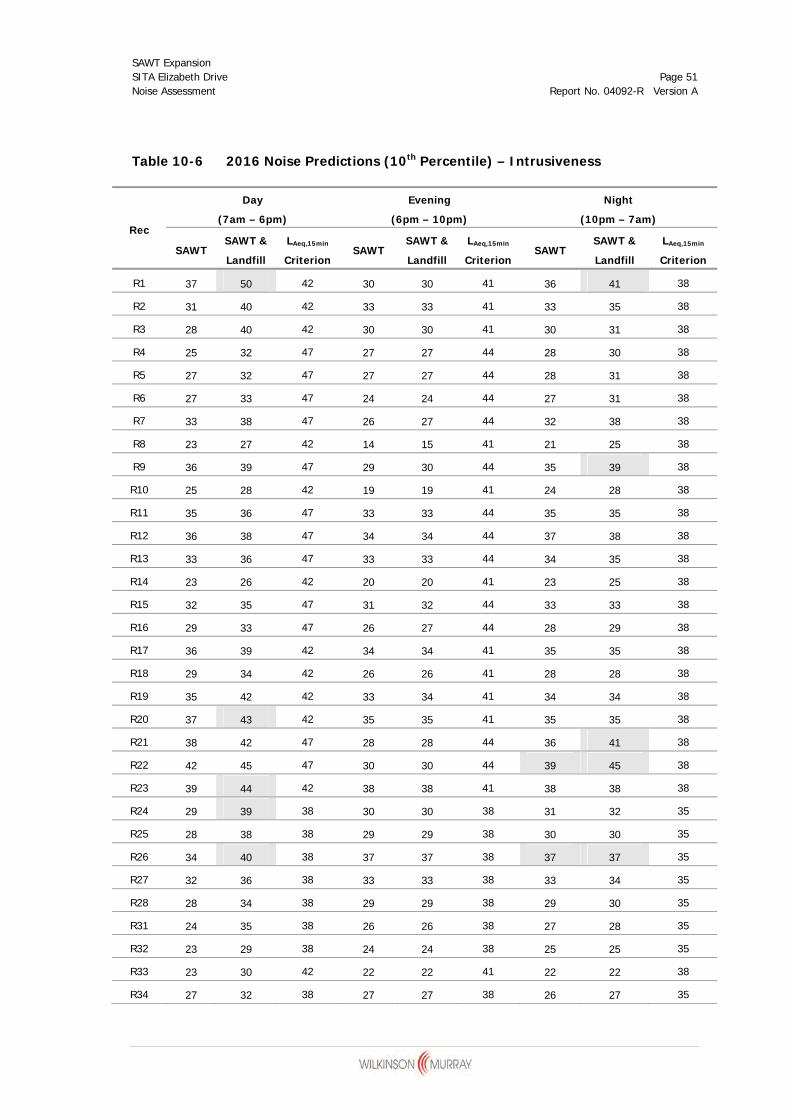
SAWT Expansion SITA Elizabeth Drive Page 51 Noise Assessment Report No. 04092-R Version A
Table 10-6 2016 Noise Predictions (10th Percentile) – Intrusiveness
Rec
Day
(7am – 6pm)
Evening
(6pm – 10pm)
Night
(10pm – 7am)
SAWT SAWT &
Landfill
LAeq,15min
Criterion SAWT
SAWT &
Landfill
LAeq,15min
Criterion SAWT
SAWT &
Landfill
LAeq,15min
Criterion
R1 37 50 42 30 30 41 36 41 38
R2 31 40 42 33 33 41 33 35 38
R3 28 40 42 30 30 41 30 31 38
R4 25 32 47 27 27 44 28 30 38
R5 27 32 47 27 27 44 28 31 38
R6 27 33 47 24 24 44 27 31 38
R7 33 38 47 26 27 44 32 38 38
R8 23 27 42 14 15 41 21 25 38
R9 36 39 47 29 30 44 35 39 38
R10 25 28 42 19 19 41 24 28 38
R11 35 36 47 33 33 44 35 35 38
R12 36 38 47 34 34 44 37 38 38
R13 33 36 47 33 33 44 34 35 38
R14 23 26 42 20 20 41 23 25 38
R15 32 35 47 31 32 44 33 33 38
R16 29 33 47 26 27 44 28 29 38
R17 36 39 42 34 34 41 35 35 38
R18 29 34 42 26 26 41 28 28 38
R19 35 42 42 33 34 41 34 34 38
R20 37 43 42 35 35 41 35 35 38
R21 38 42 47 28 28 44 36 41 38
R22 42 45 47 30 30 44 39 45 38
R23 39 44 42 38 38 41 38 38 38
R24 29 39 38 30 30 38 31 32 35
R25 28 38 38 29 29 38 30 30 35
R26 34 40 38 37 37 38 37 37 35
R27 32 36 38 33 33 38 33 34 35
R28 28 34 38 29 29 38 29 30 35
R31 24 35 38 26 26 38 27 28 35
R32 23 29 38 24 24 38 25 25 35
R33 23 30 42 22 22 41 22 22 38
R34 27 32 38 27 27 38 26 27 35

SAWT Expansion SITA Elizabeth Drive Page 52 Noise Assessment Report No. 04092-R Version A
Rec
Day
(7am – 6pm)
Evening
(6pm – 10pm)
Night
(10pm – 7am)
SAWT SAWT &
Landfill
LAeq,15min
Criterion SAWT
SAWT &
Landfill
LAeq,15min
Criterion SAWT
SAWT &
Landfill
LAeq,15min
Criterion
R35 29 34 38 29 29 38 29 29 35
R36 23 30 38 22 22 38 23 23 35
R37 41 45 42 29 29 41 39 45 38
Note: Predicted operational noise levels in excess of the relevant noise criteria are shown in grey.
Table 10-7 2016 Noise Predictions (Calm) – Intrusiveness
Rec
Day
(7am – 6pm)
Evening
(6pm – 10pm)
Night
(10pm – 7am)
SAWT SAWT &
Landfill
LAeq,15min
Criterion SAWT
SAWT &
Landfill
LAeq,15min
Criterion SAWT
SAWT &
Landfill
LAeq,15min
Criterion
R1 34 48 42 25 25 41 31 37 38
R2 25 33 42 21 21 41 24 27 38
R3 20 29 42 16 16 41 18 21 38
R4 19 26 47 11 11 44 16 21 38
R5 20 27 47 12 12 44 18 23 38
R6 22 27 47 12 13 44 19 24 38
R7 29 33 47 17 17 44 26 31 38
R8 21 25 42 11 11 41 18 22 38
R9 35 38 47 23 23 44 32 37 38
R10 23 27 42 15 15 41 21 24 38
R11 29 32 47 24 24 44 27 29 38
R12 32 35 47 24 24 44 30 32 38
R13 30 33 47 27 27 44 29 30 38
R14 19 23 42 14 14 41 17 19 38
R15 28 32 47 25 25 44 27 27 38
R16 25 30 47 23 23 44 24 25 38
R17 34 37 42 30 31 41 33 33 38
R18 23 30 42 20 21 41 22 23 38
R19 31 36 42 30 30 41 31 31 38
R20 34 38 42 32 32 41 33 33 38
R21 38 42 47 25 25 44 35 41 38
R22 42 45 47 28 28 44 39 45 38
R23 33 38 42 32 33 41 33 33 38
R24 21 30 38 20 20 38 21 22 35
R25 19 29 38 18 18 38 19 20 35

SAWT Expansion SITA Elizabeth Drive Page 53 Noise Assessment Report No. 04092-R Version A
Rec
Day
(7am – 6pm)
Evening
(6pm – 10pm)
Night
(10pm – 7am)
SAWT SAWT &
Landfill
LAeq,15min
Criterion SAWT
SAWT &
Landfill
LAeq,15min
Criterion SAWT
SAWT &
Landfill
LAeq,15min
Criterion
R26 29 34 38 28 29 38 29 29 35
R27 24 31 38 23 23 38 23 24 35
R28 21 28 38 20 20 38 21 21 35
R31 16 26 38 14 14 38 15 16 35
R32 14 23 38 13 13 38 14 15 35
R33 13 23 42 9 10 41 12 13 38
R34 16 24 38 13 13 38 14 15 35
R35 16 25 38 14 15 38 15 16 35
R36 15 24 38 13 13 38 14 15 35
R37 40 44 42 27 27 41 37 43 38
Note: Predicted operational noise levels in excess of the relevant noise criteria are shown in grey.
Based on results summarised in Tables 10-6 and 10-7, the following observations can be made:
Under calm and adverse weather conditions, predicted noise levels associated with the SAWT operations (i.e. excluding landfill operations) are expected to comply with the INP intrusiveness LAeq,15min criterion at all the identified receptors during the day and evening periods.
Under adverse weather conditions, predicted noise levels associated with the SAWT operations (i.e. excluding landfill operations) are expected to comply with the INP intrusiveness LAeq,15min criterion at all the identified receptors during the night time period except R22, R26 and R37 where 1-2dB exceedances are anticipated.
During calm weather conditions, predicted noise levels associated with the SAWT operations (i.e. excluding landfill operations) are expected to comply with the INP intrusiveness LAeq,15min criterion at all the identified receptors during the night time period except R22 where a 1dB exceedance is anticipated.
Under adverse weather conditions, predicted noise levels generated by the SAWT and landfill operations combined are expected to exceed at up to six receptors (R1, R20, R23, R24, R26 and R37) during daytime. Exceedances are found to range 1-8dB above the INP intrusiveness LAeq,15min criteria.
Under calm weather conditions, predicted noise levels generated by the SAWT and landfill operations combined are expected to exceed at only two receptors (R1 and R37) during daytime. Exceedances are found to range 2-6dB above the relevant intrusiveness LAeq,15min criteria.
Under calm and adverse weather conditions, predicted noise levels generated by the SAWT and landfill operations combined are expected to comply at all the identified receptors during the evening period.

SAWT Expansion SITA Elizabeth Drive Page 54 Noise Assessment Report No. 04092-R Version A
Under adverse weather conditions, predicted noise levels generated by the SAWT and landfill operations combined are expected to exceed at up to six receptors (R1, R9, R21, R22, R26 and R37) during night time. Exceedances are found to range 1-7dB above the relevant intrusiveness LAeq,15min criteria.
Under calm weather conditions, predicted noise levels generated by the SAWT and landfill operations combined are expected to exceed at up to three receptors (R21, R22 and R37) during night time. Exceedances are found to range 3-7dB above the relevant intrusiveness LAeq,15min criteria.
10.3.2 Amenity Noise Assessment
Table 10-8 summarises the predicted LAeq,period noise levels for the expanded SAWT operations alone and when combined with landfill operations and assesses them against the newly developed amenity noise criteria.
Table 10-8 2016 Noise Predictions – Amenity
Rec
Day
(7am – 6pm)
Evening
(6pm – 10pm)
Night
(10pm – 7am)
SAWT SAWT &
Landfill
LAeq,period
Criterion SAWT
SAWT &
Landfill
LAeq,period
Criterion SAWT
SAWT &
Landfill
LAeq,period
Criterion
R1 35 48 50 27 27 45 26 33 40
R2 28 36 50 30 30 45 24 27 40
R3 24 35 50 27 27 45 20 22 40
R4 22 29 50 23 23 45 17 22 40
R5 23 29 50 22 22 45 17 23 40
R6 23 29 50 19 19 45 17 23 40
R7 30 34 50 21 21 45 22 29 40
R8 20 25 50 12 12 45 12 17 40
R9 34 39 50 27 27 45 25 31 40
R10 23 27 50 16 17 45 15 19 40
R11 31 33 50 29 29 45 24 26 40
R12 33 36 50 30 30 45 25 29 40
R13 30 33 50 29 29 45 24 26 40
R14 20 24 50 17 17 45 15 17 40
R15 29 33 50 26 26 45 22 24 40
R16 26 31 50 22 23 45 19 22 40
R17 34 37 50 32 32 45 26 28 40
R18 25 31 50 23 24 45 19 20 40
R19 32 38 50 32 32 45 25 26 40
R20 34 39 50 33 33 45 27 28 40
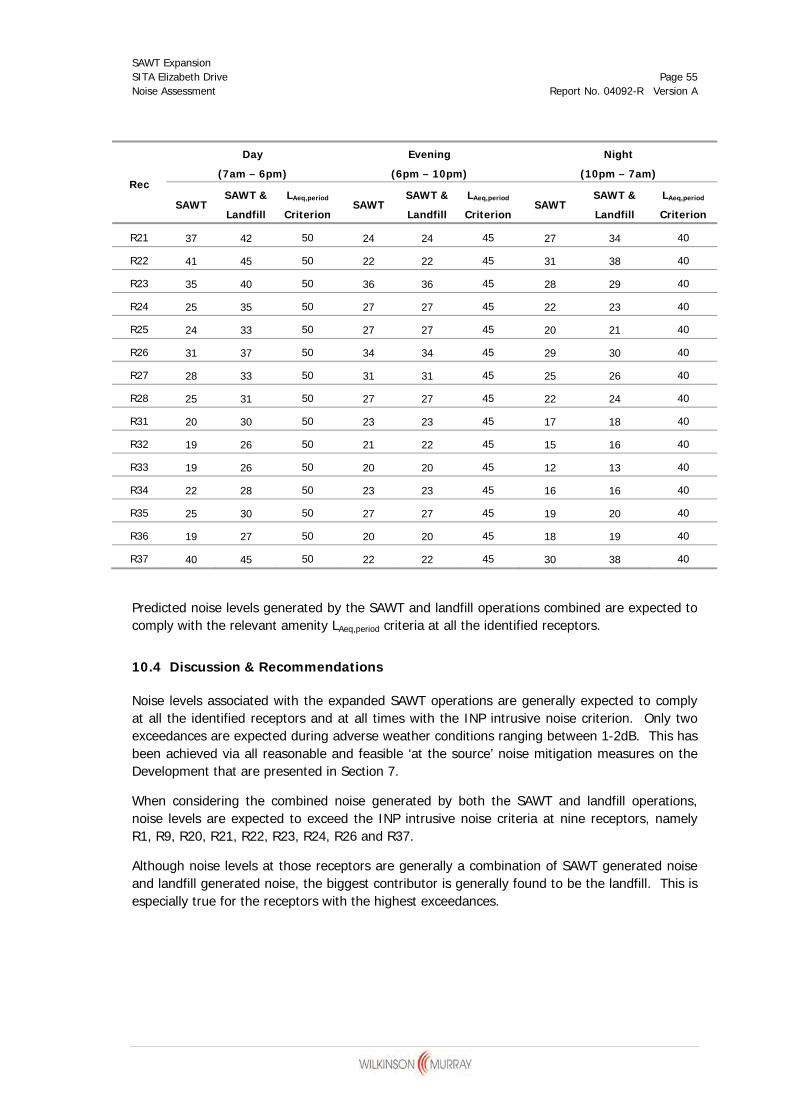
SAWT Expansion SITA Elizabeth Drive Page 55 Noise Assessment Report No. 04092-R Version A
Rec
Day
(7am – 6pm)
Evening
(6pm – 10pm)
Night
(10pm – 7am)
SAWT SAWT &
Landfill
LAeq,period
Criterion SAWT
SAWT &
Landfill
LAeq,period
Criterion SAWT
SAWT &
Landfill
LAeq,period
Criterion
R21 37 42 50 24 24 45 27 34 40
R22 41 45 50 22 22 45 31 38 40
R23 35 40 50 36 36 45 28 29 40
R24 25 35 50 27 27 45 22 23 40
R25 24 33 50 27 27 45 20 21 40
R26 31 37 50 34 34 45 29 30 40
R27 28 33 50 31 31 45 25 26 40
R28 25 31 50 27 27 45 22 24 40
R31 20 30 50 23 23 45 17 18 40
R32 19 26 50 21 22 45 15 16 40
R33 19 26 50 20 20 45 12 13 40
R34 22 28 50 23 23 45 16 16 40
R35 25 30 50 27 27 45 19 20 40
R36 19 27 50 20 20 45 18 19 40
R37 40 45 50 22 22 45 30 38 40
Predicted noise levels generated by the SAWT and landfill operations combined are expected to comply with the relevant amenity LAeq,period criteria at all the identified receptors.
10.4 Discussion & Recommendations
Noise levels associated with the expanded SAWT operations are generally expected to comply at all the identified receptors and at all times with the INP intrusive noise criterion. Only two exceedances are expected during adverse weather conditions ranging between 1-2dB. This has been achieved via all reasonable and feasible ‘at the source’ noise mitigation measures on the Development that are presented in Section 7.
When considering the combined noise generated by both the SAWT and landfill operations, noise levels are expected to exceed the INP intrusive noise criteria at nine receptors, namely R1, R9, R20, R21, R22, R23, R24, R26 and R37.
Although noise levels at those receptors are generally a combination of SAWT generated noise and landfill generated noise, the biggest contributor is generally found to be the landfill. This is especially true for the receptors with the highest exceedances.

SAWT Expansion SITA Elizabeth Drive Page 56 Noise Assessment Report No. 04092-R Version A
It is recommended that a noise pollution reduction program be prepared and implemented to address noise generated by the landfill operations and ensure all reasonable and feasible noise mitigation is implemented when considering the INP criteria. The noise pollution reduction program would gradually implement noise controls on mobile plant (eg. compactors, excavators, etc). The SWL of plant mitigated with noise controls are expected to reduce by 4 to 5dB.
10.5 Identification of Adverse Weather Conditions
As described above, the 10th percentile predicted LAeq,15min noise levels assume that there are meteorological conditions under which noise levels exceed the presented noise levels due to adverse weather conditions that are likely to occur for less than 10 percent of the time. The meteorological conditions that would exceed the predicted 10th percentile levels are summarised in Tables 10-9 and 10-10 for the combined SAWT/Landfill and SAWT only, respectively. Each condition consists of a combination of wind speed, wind direction and temperature inversion.
Table 10-9 Adverse Weather Conditions Triggering Exceedances (Combined SAWT and Landfill)
Time
Period Rec Wind Direction Wind Speed Temperature Inversion
Day
R1
225 degrees (i.e. SW winds) All wind speeds >2.5 m/s and <=3 m/s No temperature inversion
270 degrees (i.e. W winds) All wind speeds >1.5 m/s and <=3 m/s No temperature inversion
315 degrees (i.e. NW winds) All wind speeds >1.5 m/s and <=3 m/s No temperature inversion
R20
45 degrees (i.e. NE winds) All wind speeds >2 m/s and <=3 m/s No temperature inversion
90 degrees (i.e. E winds) All wind speeds >2 m/s and <=3 m/s No temperature inversion
135 degrees (i.e. SE winds) All wind speeds >2 m/s and <=3 m/s No temperature inversion
R23 90 degrees (i.e. E winds) All wind speeds >2 m/s and <=3 m/s No temperature inversion
135 degrees (i.e. SE winds) All wind speeds >2 m/s and <=3 m/s No temperature inversion
R24 225 degrees (i.e. SW winds) All wind speeds >2 m/s and <=3 m/s No temperature inversion
270 degrees (i.e. W winds) All wind speeds >2 m/s and <=3 m/s No temperature inversion
R26
135 degrees (i.e. SE winds) All wind speeds >2.5 m/s and <=3 m/s No temperature inversion
180 degrees (i.e. S winds) All wind speeds >2 m/s and <=3 m/s No temperature inversion
225 degrees (i.e. SW winds) All wind speeds >2.5 m/s and <=3 m/s No temperature inversion
R37 225 degrees (i.e. SW winds) All wind speeds >2 m/s and <=3 m/s No temperature inversion
270 degrees (i.e. W winds) All wind speeds >2.5 m/s and <=3 m/s No temperature inversion
Night
R1 180 degrees (i.e. S winds) All wind speeds >2 m/s and <=3 m/s 3°C/100 m
225 degrees (i.e. SW winds) All wind speeds >2 m/s and <=3 m/s 3°C/100 m
R9
0 degrees (i.e. N winds) All wind speeds >1.5 m/s and <=3 m/s No temperature inversion
45 degrees (i.e. NE winds) All wind speeds >1.5 m/s and <=3 m/s No temperature inversion
315 degrees (i.e. NW winds) All wind speeds >2.5 m/s and <=3 m/s No temperature inversion
0 degrees (i.e. N winds) All wind speeds >0.5 m/s and <=3 m/s 3°C/100 m
45 degrees (i.e. NE winds) All wind speeds >0.5 m/s and <=3 m/s 3°C/100 m
90 degrees (i.e. E winds) All wind speeds >0.5 m/s and <=3 m/s 3°C/100 m

SAWT Expansion SITA Elizabeth Drive Page 57 Noise Assessment Report No. 04092-R Version A
Time
Period Rec Wind Direction Wind Speed Temperature Inversion
315 degrees (i.e. NW winds) All wind speeds >0.5 m/s and <=3 m/s 3°C/100 m
R21
0 degrees (i.e. N winds) All wind speeds >1.5 m/s and <=3 m/s No temperature inversion
45 degrees (i.e. NE winds) All wind speeds >1 m/s and <=3 m/s No temperature inversion
90 degrees (i.e. E winds) All wind speeds >1.5 m/s and <=3 m/s No temperature inversion
n/a Calm 3°C/100 m
0 degrees (i.e. N winds) All wind speeds >0.5 m/s and <=3 m/s 3°C/100 m
45 degrees (i.e. NE winds) All wind speeds >0.5 m/s and <=3 m/s 3°C/100 m
90 degrees (i.e. E winds) All wind speeds >0.5 m/s and <=3 m/s 3°C/100 m
135 degrees (i.e. SE winds) All wind speeds >0.5 m/s and <=3 m/s 3°C/100 m
270 degrees (i.e. W winds) All wind speeds >0.5 m/s and <=3 m/s 3°C/100 m
315 degrees (i.e. NW winds) All wind speeds >0.5 m/s and <=3 m/s 3°C/100 m
R22
0 degrees (i.e. N winds) All wind speeds >1 m/s and <=3 m/s No temperature inversion
45 degrees (i.e. NE winds) All wind speeds >2 m/s and <=3 m/s No temperature inversion
315 degrees (i.e. NW winds) All wind speeds >1.5 m/s and <=3 m/s No temperature inversion
n/a Calm 3°C/100 m
0 degrees (i.e. N winds) All wind speeds >0.5 m/s and <=3 m/s 3°C/100 m
45 degrees (i.e. NE winds) All wind speeds >0.5 m/s and <=3 m/s 3°C/100 m
270 degrees (i.e. W winds) All wind speeds >0.5 m/s and <=3 m/s 3°C/100 m
315 degrees (i.e. NW winds) All wind speeds >0.5 m/s and <=3 m/s 3°C/100 m
R26
180 degrees (i.e. S winds) All wind speeds >2.5 m/s and <=3 m/s No temperature inversion
135 degrees (i.e. SE winds) All wind speeds >2.5 m/s and <=3 m/s 3°C/100 m
180 degrees (i.e. S winds) All wind speeds >1.5 m/s and <=3 m/s 3°C/100 m
225 degrees (i.e. SW winds) All wind speeds >1.5 m/s and <=3 m/s 3°C/100 m
R37
180 degrees (i.e. S winds) All wind speeds >2 m/s and <=3 m/s 3°C/100 m
225 degrees (i.e. SW winds) All wind speeds >2 m/s and <=3 m/s 3°C/100 m
270 degrees (i.e. W winds) All wind speeds >2.5 m/s and <=3 m/s 3°C/100 m
Notes: Evening: the period from 6.00 pm to 10.00 pm. Night: the period from 10.00 pm to 7.00 am. Wind direction of 0 degrees refers to all directions >=337.5 degrees and <22.5 degrees. Wind direction of 45 degrees refers to all directions >=22.5 degrees and <67.5 degrees. Wind direction of 90 degrees refers to all directions >=67.5 degrees and <112.5 degrees. Wind direction of 135 degrees refers to all directions >=112.5 degrees and <157.5 degrees. Wind direction of 315 degrees refers to all directions >=292.5 degrees and <337.5 degrees.
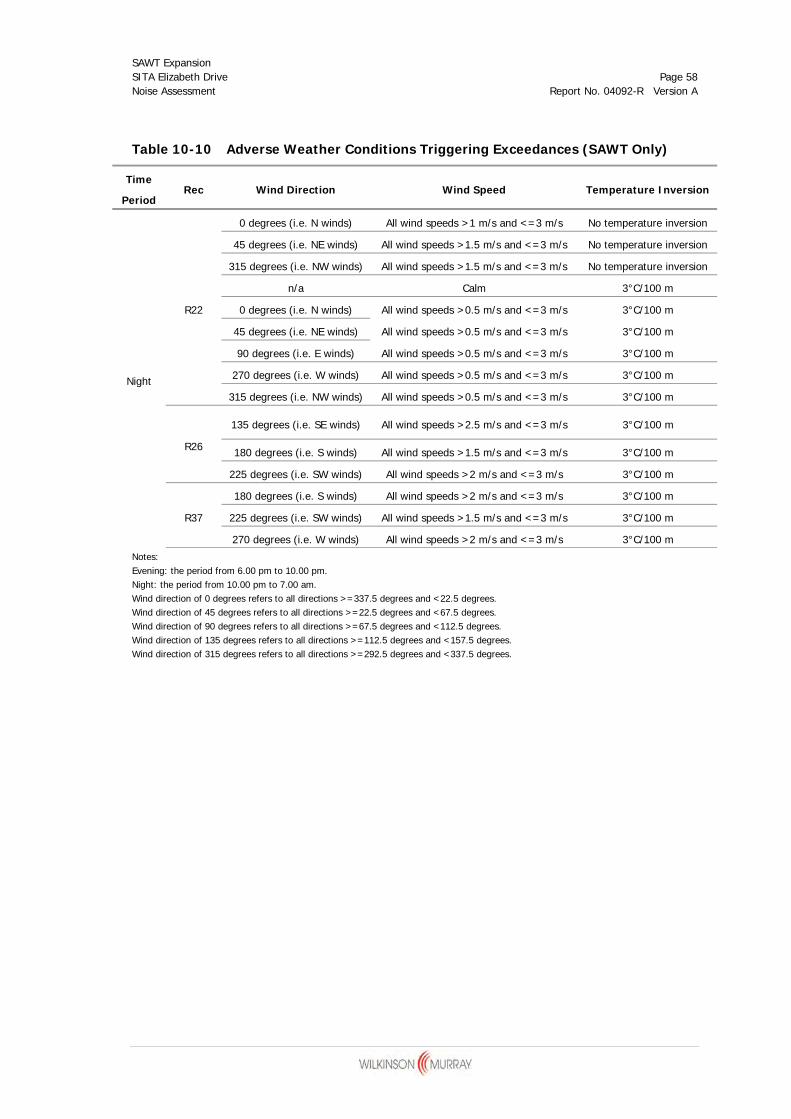
SAWT Expansion SITA Elizabeth Drive Page 58 Noise Assessment Report No. 04092-R Version A
Table 10-10 Adverse Weather Conditions Triggering Exceedances (SAWT Only)
Time
Period Rec Wind Direction Wind Speed Temperature Inversion
Night
R22
0 degrees (i.e. N winds) All wind speeds >1 m/s and <=3 m/s No temperature inversion
45 degrees (i.e. NE winds) All wind speeds >1.5 m/s and <=3 m/s No temperature inversion
315 degrees (i.e. NW winds) All wind speeds >1.5 m/s and <=3 m/s No temperature inversion
n/a Calm 3°C/100 m
0 degrees (i.e. N winds) All wind speeds >0.5 m/s and <=3 m/s 3°C/100 m
45 degrees (i.e. NE winds) All wind speeds >0.5 m/s and <=3 m/s 3°C/100 m
90 degrees (i.e. E winds) All wind speeds >0.5 m/s and <=3 m/s 3°C/100 m
270 degrees (i.e. W winds) All wind speeds >0.5 m/s and <=3 m/s 3°C/100 m
315 degrees (i.e. NW winds) All wind speeds >0.5 m/s and <=3 m/s 3°C/100 m
R26
135 degrees (i.e. SE winds) All wind speeds >2.5 m/s and <=3 m/s 3°C/100 m
180 degrees (i.e. S winds) All wind speeds >1.5 m/s and <=3 m/s 3°C/100 m
225 degrees (i.e. SW winds) All wind speeds >2 m/s and <=3 m/s 3°C/100 m
R37
180 degrees (i.e. S winds) All wind speeds >2 m/s and <=3 m/s 3°C/100 m
225 degrees (i.e. SW winds) All wind speeds >1.5 m/s and <=3 m/s 3°C/100 m
270 degrees (i.e. W winds) All wind speeds >2 m/s and <=3 m/s 3°C/100 m
Notes: Evening: the period from 6.00 pm to 10.00 pm. Night: the period from 10.00 pm to 7.00 am. Wind direction of 0 degrees refers to all directions >=337.5 degrees and <22.5 degrees. Wind direction of 45 degrees refers to all directions >=22.5 degrees and <67.5 degrees. Wind direction of 90 degrees refers to all directions >=67.5 degrees and <112.5 degrees. Wind direction of 135 degrees refers to all directions >=112.5 degrees and <157.5 degrees. Wind direction of 315 degrees refers to all directions >=292.5 degrees and <337.5 degrees.
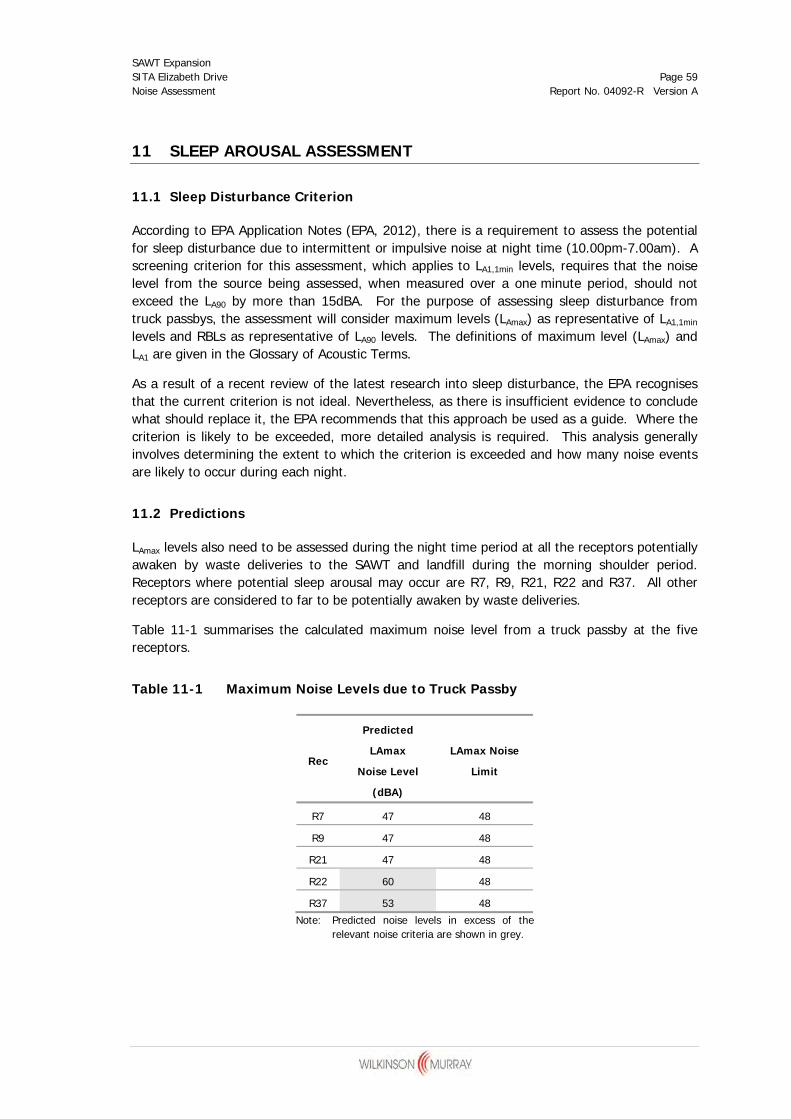
SAWT Expansion SITA Elizabeth Drive Page 59 Noise Assessment Report No. 04092-R Version A
11 SLEEP AROUSAL ASSESSMENT
11.1 Sleep Disturbance Criterion
According to EPA Application Notes (EPA, 2012), there is a requirement to assess the potential for sleep disturbance due to intermittent or impulsive noise at night time (10.00pm-7.00am). A screening criterion for this assessment, which applies to LA1,1min levels, requires that the noise level from the source being assessed, when measured over a one minute period, should not exceed the LA90 by more than 15dBA. For the purpose of assessing sleep disturbance from truck passbys, the assessment will consider maximum levels (LAmax) as representative of LA1,1min
levels and RBLs as representative of LA90 levels. The definitions of maximum level (LAmax) and LA1 are given in the Glossary of Acoustic Terms.
As a result of a recent review of the latest research into sleep disturbance, the EPA recognises that the current criterion is not ideal. Nevertheless, as there is insufficient evidence to conclude what should replace it, the EPA recommends that this approach be used as a guide. Where the criterion is likely to be exceeded, more detailed analysis is required. This analysis generally involves determining the extent to which the criterion is exceeded and how many noise events are likely to occur during each night.
11.2 Predictions
LAmax levels also need to be assessed during the night time period at all the receptors potentially awaken by waste deliveries to the SAWT and landfill during the morning shoulder period. Receptors where potential sleep arousal may occur are R7, R9, R21, R22 and R37. All other receptors are considered to far to be potentially awaken by waste deliveries.
Table 11-1 summarises the calculated maximum noise level from a truck passby at the five receptors.
Table 11-1 Maximum Noise Levels due to Truck Passby
Rec
Predicted
LAmax
Noise Level
(dBA)
LAmax Noise
Limit
R7 47 48
R9 47 48
R21 47 48
R22 60 48
R37 53 48
Note: Predicted noise levels in excess of the relevant noise criteria are shown in grey.

SAWT Expansion SITA Elizabeth Drive Page 60 Noise Assessment Report No. 04092-R Version A
11.3 Discussion
Table 10-9 indicates that early morning waste deliveries comply with the relevant LAmax noise limits at R7, R9 and R21. However, exceedances ranging 12dB and 5dB are expected at R22 and R37, respectively.
EPA recognises that current sleep disturbance criterion of an LA1,1min not exceeding the LA90,15min by more than 15dBA is not ideal. Nevertheless, as there is insufficient evidence to determine what should replace it, EPA will continue to use it as a guide to identify the likelihood of sleep disturbance. This means that where the criterion is met, sleep disturbance is not likely, but where it is not met, a more detailed analysis is required.
According to the RNP, research on sleep disturbance to date has shown that maximum internal noise levels below 50-55dBA are unlikely to awaken people from sleep. Based on this, noise impacts from waste deliveries from the access road are unlikely to awake people from sleep as internal noise levels with windows open are expected to be approximately 50dBA at R22 and 43dBA at R37. One should consider that R22 is exposed to non-Project related traffic on Elizabeth Drive and that no noise complaints have been lodged in the past from R22 or R37.
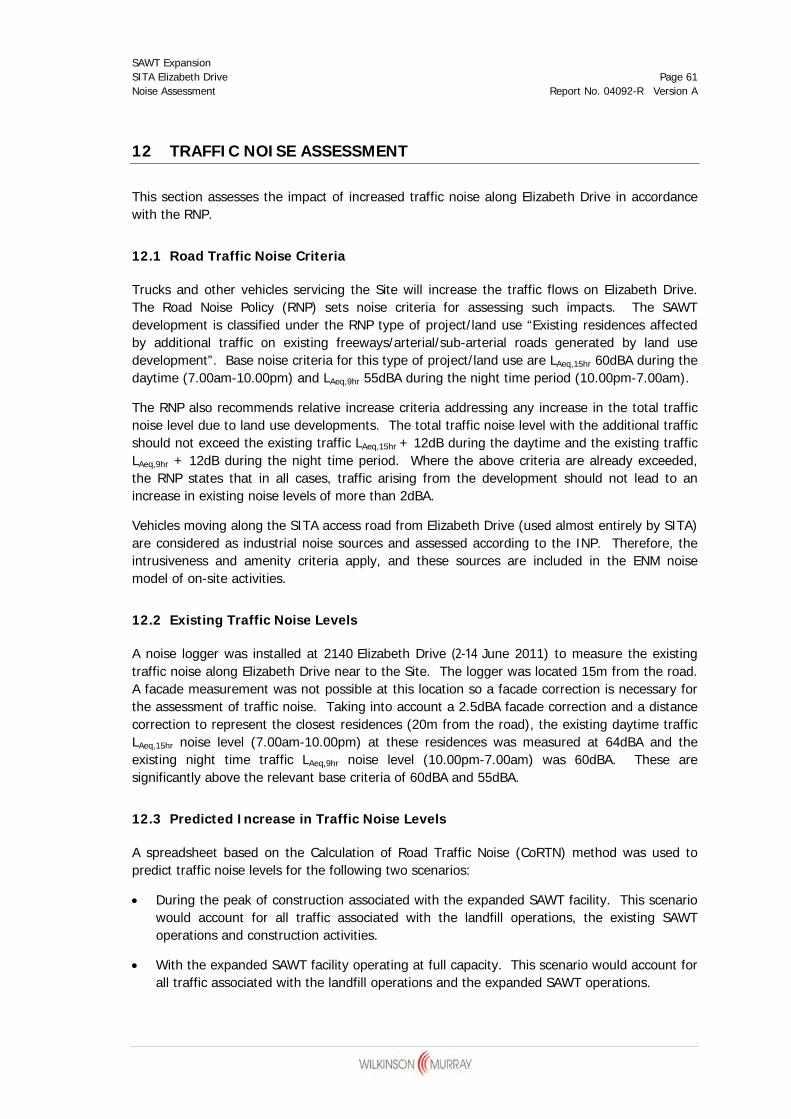
SAWT Expansion SITA Elizabeth Drive Page 61 Noise Assessment Report No. 04092-R Version A
12 TRAFFIC NOISE ASSESSMENT
This section assesses the impact of increased traffic noise along Elizabeth Drive in accordance with the RNP.
12.1 Road Traffic Noise Criteria
Trucks and other vehicles servicing the Site will increase the traffic flows on Elizabeth Drive. The Road Noise Policy (RNP) sets noise criteria for assessing such impacts. The SAWT development is classified under the RNP type of project/land use “Existing residences affected by additional traffic on existing freeways/arterial/sub-arterial roads generated by land use development”. Base noise criteria for this type of project/land use are LAeq,15hr 60dBA during the daytime (7.00am-10.00pm) and LAeq,9hr 55dBA during the night time period (10.00pm-7.00am).
The RNP also recommends relative increase criteria addressing any increase in the total traffic noise level due to land use developments. The total traffic noise level with the additional traffic should not exceed the existing traffic LAeq,15hr + 12dB during the daytime and the existing traffic LAeq,9hr + 12dB during the night time period. Where the above criteria are already exceeded, the RNP states that in all cases, traffic arising from the development should not lead to an increase in existing noise levels of more than 2dBA.
Vehicles moving along the SITA access road from Elizabeth Drive (used almost entirely by SITA) are considered as industrial noise sources and assessed according to the INP. Therefore, the intrusiveness and amenity criteria apply, and these sources are included in the ENM noise model of on-site activities.
12.2 Existing Traffic Noise Levels
A noise logger was installed at 2140 Elizabeth Drive (2-14 June 2011) to measure the existing traffic noise along Elizabeth Drive near to the Site. The logger was located 15m from the road. A facade measurement was not possible at this location so a facade correction is necessary for the assessment of traffic noise. Taking into account a 2.5dBA facade correction and a distance correction to represent the closest residences (20m from the road), the existing daytime traffic LAeq,15hr noise level (7.00am-10.00pm) at these residences was measured at 64dBA and the existing night time traffic LAeq,9hr noise level (10.00pm-7.00am) was 60dBA. These are significantly above the relevant base criteria of 60dBA and 55dBA.
12.3 Predicted Increase in Traffic Noise Levels
A spreadsheet based on the Calculation of Road Traffic Noise (CoRTN) method was used to predict traffic noise levels for the following two scenarios:
During the peak of construction associated with the expanded SAWT facility. This scenario would account for all traffic associated with the landfill operations, the existing SAWT operations and construction activities.
With the expanded SAWT facility operating at full capacity. This scenario would account for all traffic associated with the landfill operations and the expanded SAWT operations.
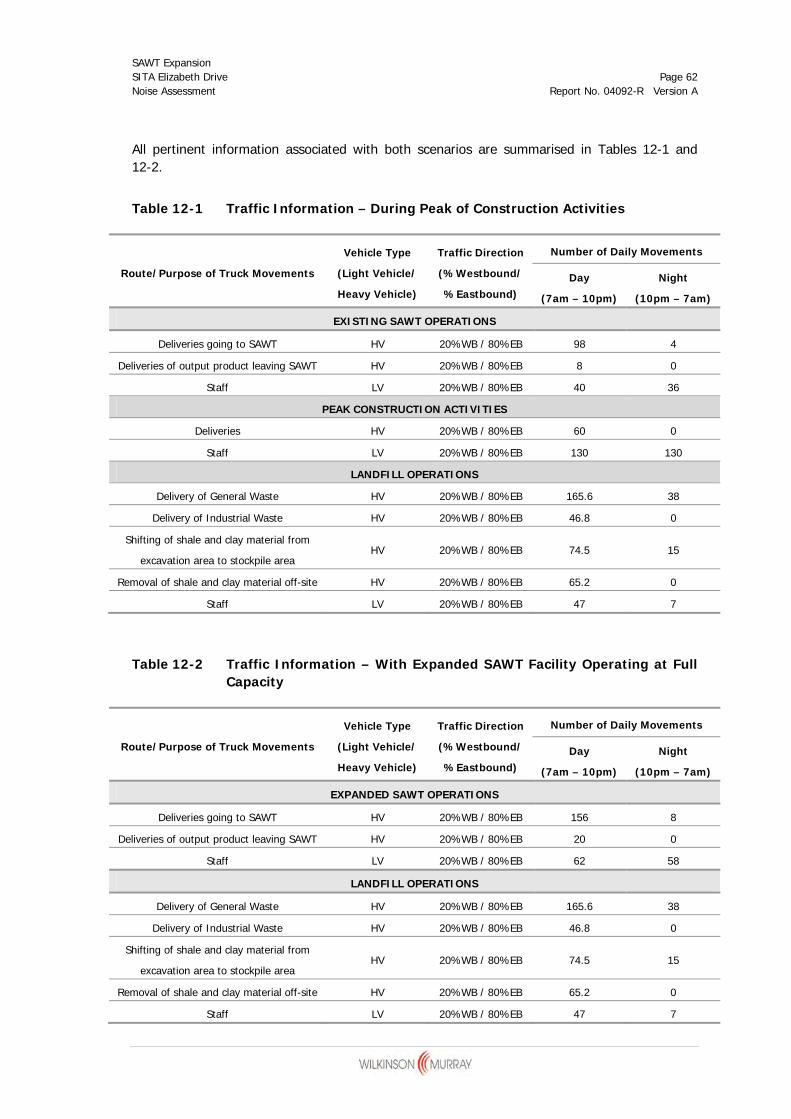
SAWT Expansion SITA Elizabeth Drive Page 62 Noise Assessment Report No. 04092-R Version A
All pertinent information associated with both scenarios are summarised in Tables 12-1 and 12-2.
Table 12-1 Traffic Information – During Peak of Construction Activities
Route/Purpose of Truck Movements
Vehicle Type
(Light Vehicle/
Heavy Vehicle)
Traffic Direction
(%Westbound/
%Eastbound)
Number of Daily Movements
Day
(7am – 10pm)
Night
(10pm – 7am)
EXISTING SAWT OPERATIONS
Deliveries going to SAWT HV 20%WB / 80%EB 98 4
Deliveries of output product leaving SAWT HV 20%WB / 80%EB 8 0
Staff LV 20%WB / 80%EB 40 36
PEAK CONSTRUCTION ACTIVITIES
Deliveries HV 20%WB / 80%EB 60 0
Staff LV 20%WB / 80%EB 130 130
LANDFILL OPERATIONS
Delivery of General Waste HV 20%WB / 80%EB 165.6 38
Delivery of Industrial Waste HV 20%WB / 80%EB 46.8 0
Shifting of shale and clay material from
excavation area to stockpile area HV 20%WB / 80%EB 74.5 15
Removal of shale and clay material off-site HV 20%WB / 80%EB 65.2 0
Staff LV 20%WB / 80%EB 47 7
Table 12-2 Traffic Information – With Expanded SAWT Facility Operating at Full Capacity
Route/Purpose of Truck Movements
Vehicle Type
(Light Vehicle/
Heavy Vehicle)
Traffic Direction
(%Westbound/
%Eastbound)
Number of Daily Movements
Day
(7am – 10pm)
Night
(10pm – 7am)
EXPANDED SAWT OPERATIONS
Deliveries going to SAWT HV 20%WB / 80%EB 156 8
Deliveries of output product leaving SAWT HV 20%WB / 80%EB 20 0
Staff LV 20%WB / 80%EB 62 58
LANDFILL OPERATIONS
Delivery of General Waste HV 20%WB / 80%EB 165.6 38
Delivery of Industrial Waste HV 20%WB / 80%EB 46.8 0
Shifting of shale and clay material from
excavation area to stockpile area HV 20%WB / 80%EB 74.5 15
Removal of shale and clay material off-site HV 20%WB / 80%EB 65.2 0
Staff LV 20%WB / 80%EB 47 7
SAWT Expansion SITA Elizabeth Drive Page 63 Noise Assessment Report No. 04092-R Version A
During the peak of construction activities, the LAeq,15hr traffic noise level at the closest residences on Elizabeth Drive is predicted at 59dBA which would increase the existing LAeq,15hr traffic noise level of 64dBA by 1dBA. The LAeq,9hr traffic noise level is predicted at 53dBA which is expected to increase the existing LAeq,9hr traffic noise level of 60dBA by 1dBA.
With the expanded SAWT facility operating at full capacity, the LAeq,15hr traffic noise level at the closest residences on Elizabeth Drive is predicted at 62dBA which would increase the existing LAeq,15hr traffic noise level of 64dBA by 2dBA. The LAeq,9hr traffic noise level is predicted at 55dBA which is expected to increase the existing LAeq,9hr traffic noise level of 60dBA by 1dBA.
The RNP states that in all cases, traffic arising from the development should not lead to an increase in existing noise levels of more than 2dBA. This criterion has been shown to be met in both cases.
The predicted increase in total traffic noise level is also expected to meet the RNP relative increase criteria.
12.4 Mitigation of Existing Traffic Noise
Since the existing traffic noise level exceeds the RNP daytime and night time base criteria, the RNP indicates that where reasonable (feasible and practicable), noise levels should be mitigated to reduce noise levels to achieve the base criteria. The mitigation measures should be implemented in the following order of priority:
(i) Road design and traffic management.
(ii) Quieter pavement surfaces
(iii) In-corridor noise barriers/mounds.
(iv) At-property treatments or localised barriers/mounds.
Road design and traffic management measures are not considered reasonable for this Development as they do not relate to reducing existing noise levels and only deal with the proposed additional noise source.
Since the SAWT facility will generate a very small proportion of the total traffic noise on Elizabeth Drive, the provision of architectural treatment or noise barriers on land which is not owned by SITA is unlikely to be practicable or necessary.

SAWT Expansion SITA Elizabeth Drive Page 64 Noise Assessment Report No. 04092-R Version A
13 CONCLUSION
SITA proposes to expand the SITA Advanced Waste Treatment (SAWT) facility located at its existing landfill site in Kemps Creek.
The current existing SAWT facility Project Application 06_0185, approved on 15 April 2008, limits the facility to processing approximately 134,400 tonnes per annum (tpa) of input waste; 120,000 tpa of mixed solid waste and 14,400 tpa of biosolids. SITA proposes to increase the SAWT receival capacity to 220,000 tpa.
Wilkinson Murray has prepared a noise assessment intended to cover all environmental noise aspects related to construction, operation and traffic of the proposed new facility and maturation areas.
13.1 Noise Assessment of SAWT Operations
The SAWT generated noise levels for 2016 meet all CoA and EPL noise limits. For 2014 where the SAWT and construction occur simultaneously negligible exceedances of the CoA and EPL noise limits where found which would only occur for approximately a year.
13.2 Noise Assessment of Cumulative Operations
The predicted noise levels are expected to be within the relevant landfill EPL LAeq,15min noise limits at all the identified receptors.
13.3 Noise Assessment According to INP
As mentioned in the introduction a cumulative noise assessment considering INP criteria has been conducted to provide an understanding of the impacts consistent with contemporary guidelines. The INP noise assessment stemmed from the consultation process between AECOM and EPA and supplements the requirements of meeting the SAWT current Approval and EPL noise Limits.
Noise levels associated with the expanded SAWT operations are generally expected to comply at all the identified receptors and at all times with the INP intrusive noise criterion. Only two exceedances are expected during adverse weather conditions ranging between 1-2dB. This has been achieved via all reasonable and feasible ‘at the source’ noise mitigation measures that are presented in Section 7.
When considering the combined noise generated by both the SAWT and landfill operations, noise levels are expected to exceed the INP intrusive noise criteria at nine receptors, namely R1, R9, R20, R21, R22, R23, R24, R26 and R37.
Although noise levels at those receptors are generally a combination of SAWT generated noise and landfill generated noise, the biggest contributor is generally found to be the landfill. This is especially true for the receptors with the highest exceedances.
When considering the INP criteria, it is recommended that a noise pollution reduction program be prepared and implemented to address noise generated by the landfill operations and ensure all reasonable and feasible noise mitigation is implemented.

SAWT Expansion SITA Elizabeth Drive Page 65 Noise Assessment Report No. 04092-R Version A
13.4 Traffic Noise Assessment
Traffic arising from the development complies with the relevant RNP noise criteria.
13.5 Noise Mitigation
The following noise mitigation is proposed for the SAWT. It is important to note that those noise mitigation measures have been included in the noise predictions presented in this noise assessment.
Introduction of noise mitigation to the wheel loaders to ensure maximum SWL of 108dBA or introducing new loaders with a SWL less than 108dBA.
Attenuation of all seven biofilter extraction fan ducting systems such that noise emanated from top of each stack is reduced by 10dBA. The most appropriate and effective noise mitigation for controlling the noise generated by the fans would be to introduce a silencer between the biofilter extraction fans and the stack outlets.
The cessation of wheel loader outdoor operations after 10.00pm.
The erection of an 8.5m high and 30m long wall of sufficient density along the northern side of the external refining bunkers to reduce noise generated by mobile plant at the northern receptors. The bunkers area will also be roofed at the same height as the refining building.
The use of quackers (broadband reversing alarms) instead of tonal reversing alarms on all mobile plant.
The seven proposed biofilter extraction fans should be specified to ensure that they are not tonal.
Other noise mitigation measures should include the following:
Regularly train truck drivers and other contractors to minimise noise generated by truck accessing the site (i.e. minimise the use of engine brakes and no extended periods of engine idling).
Provide notification to community of noisy construction works. Notification should be provided reasonably ahead of time and include information such as total building time, what works are expected to be noisy, their duration and what is being done to minimise noise.
Appoint a community liaison officer during the noise construction works.
Provide a toll free contact phone number for enquiries during construction.
Early installation of the noise wall along the northern side of the external refining bunkers to make use of it during the construction works.
Provide quick response to noise complaints.
SAWT Expansion SITA Elizabeth Drive Page 66 Noise Assessment Report No. 04092-R Version A
13.6 Recommended Noise Monitoring
It is proposed to implement a quarterly attended noise monitoring regime for both the SAWT and the Landfill. On-site operational observations would be also need to be carried out by SITA personnel in order to support the noise monitoring program and enable the distinction between noise levels generated by the SAWT and those generated by the Landfill. Noise monitoring would be conducted at 12 locations, namely:
R1; R2; R9; R12; R17; R20; R21; R22; R23; R24; R26; and R37.
To assess compliance with the proposed noise limits presented, attended noise monitoring would be undertaken during a day, evening and night period as defined in the NSW Industrial Noise Policy for a period two consecutive operating days.
SAWT Expansion SITA Elizabeth Drive Page 67 Noise Assessment Report No. 04092-R Version A
14 REFERENCES
Environment Protection Authority (2000) NSW Industrial Noise Policy (INP)
Environment Protection Authority (2011) NSW Road Traffic Noise Policy (RNP)
Environment Protection Authority (2012) Application Notes – NSW Industrial Noise Policy Website: http://www.environment.nsw.gov.au/noise/applicnotesindustnoise.htm
Department of Environment & Climate Change (2009) Interim Construction Noise Guideline (ICNG)

APPENDIX A NOISE MEASUREMENT RESULTS

SAWT Expansion SITA Elizabeth Drive Appendix A-1 Noise Assessment Report No. 04092-R Version A
Project: SAWT EIS Location: 55 Taylors Road

SAWT Expansion SITA Elizabeth Drive Appendix A-2 Noise Assessment Report No. 04092-R Version A
Project: SAWT EIS Location: 55 Taylors Road

SAWT Expansion SITA Elizabeth Drive Appendix A-3 Noise Assessment Report No. 04092-R Version A
Project: SAWT EIS Location: 55 Taylors Road
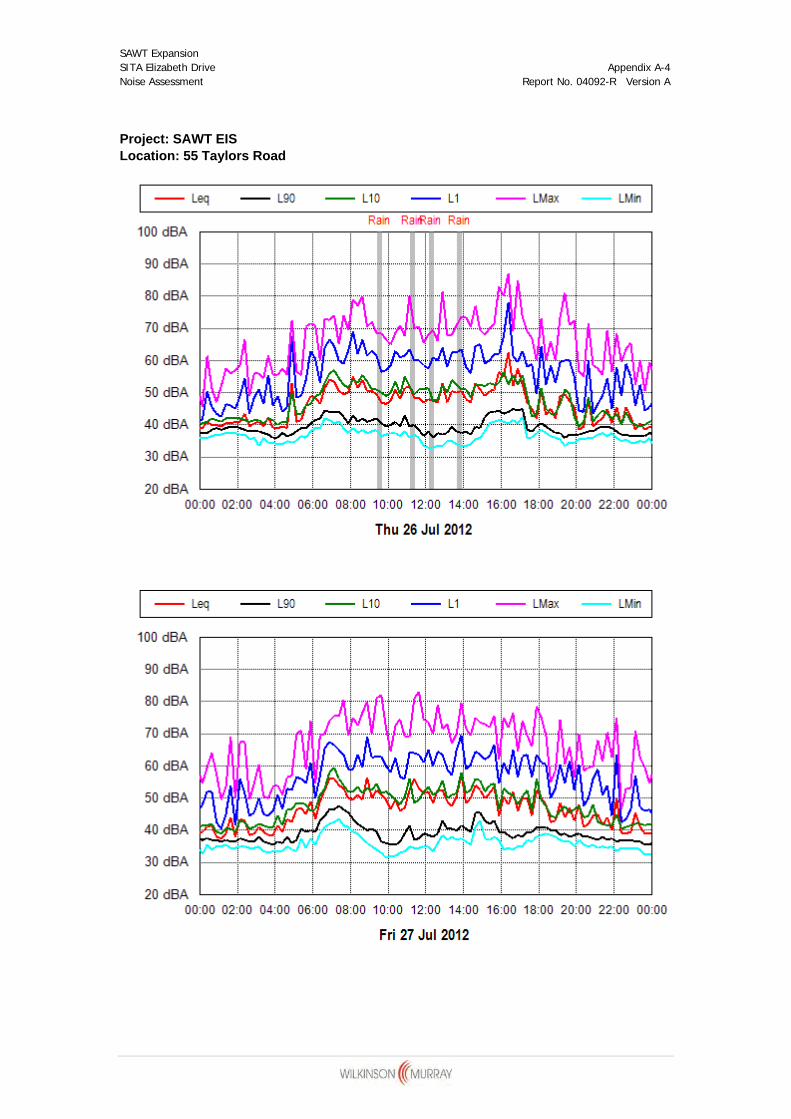
SAWT Expansion SITA Elizabeth Drive Appendix A-4 Noise Assessment Report No. 04092-R Version A
Project: SAWT EIS Location: 55 Taylors Road
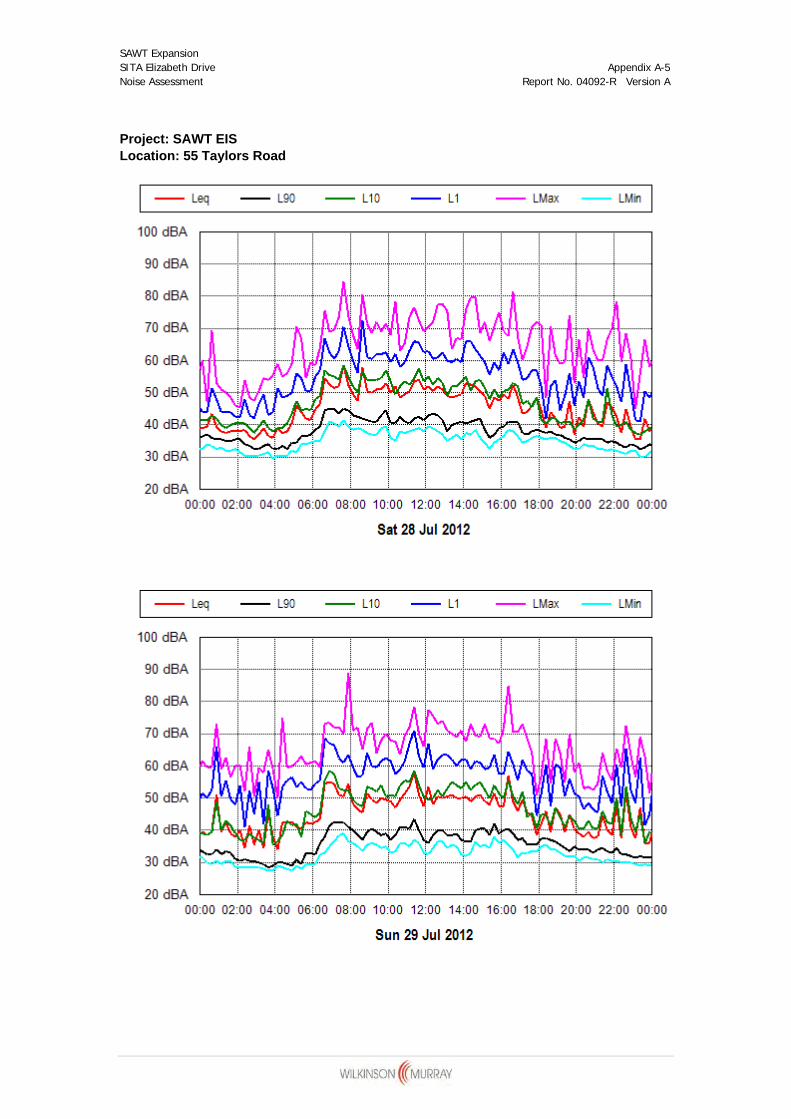
SAWT Expansion SITA Elizabeth Drive Appendix A-5 Noise Assessment Report No. 04092-R Version A
Project: SAWT EIS Location: 55 Taylors Road

SAWT Expansion SITA Elizabeth Drive Appendix A-6 Noise Assessment Report No. 04092-R Version A
Project: SAWT EIS Location: 55 Taylors Road
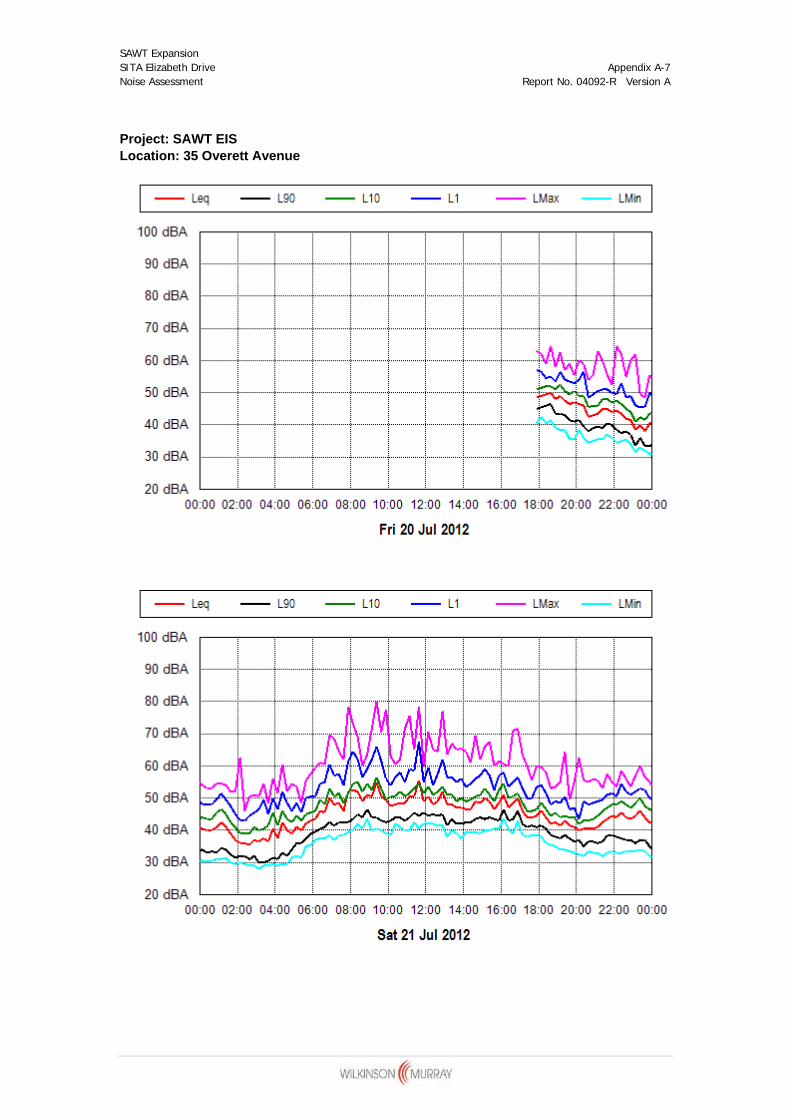
SAWT Expansion SITA Elizabeth Drive Appendix A-7 Noise Assessment Report No. 04092-R Version A
Project: SAWT EIS Location: 35 Overett Avenue

SAWT Expansion SITA Elizabeth Drive Appendix A-8 Noise Assessment Report No. 04092-R Version A
Project: SAWT EIS Location: 35 Overett Avenue

SAWT Expansion SITA Elizabeth Drive Appendix A-9 Noise Assessment Report No. 04092-R Version A
Project: SAWT EIS Location: 35 Overett Avenue
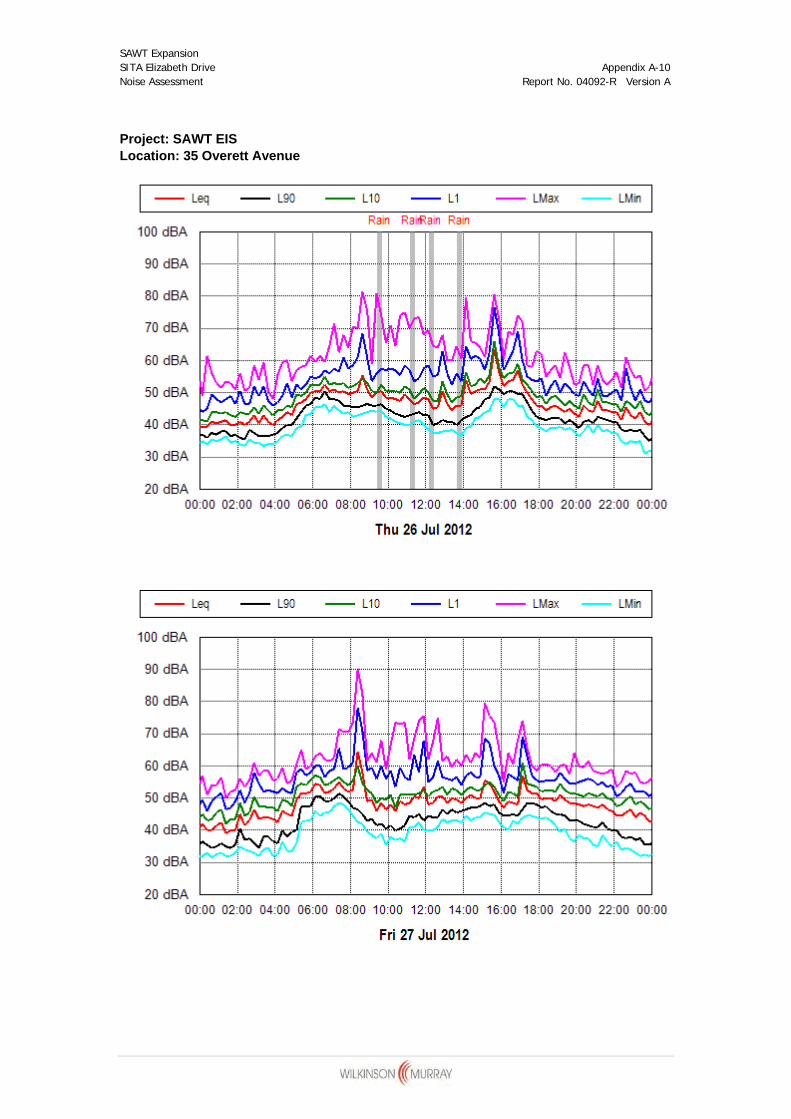
SAWT Expansion SITA Elizabeth Drive Appendix A-10 Noise Assessment Report No. 04092-R Version A
Project: SAWT EIS Location: 35 Overett Avenue

SAWT Expansion SITA Elizabeth Drive Appendix A-11 Noise Assessment Report No. 04092-R Version A
Project: SAWT EIS Location: 35 Overett Avenue

SAWT Expansion SITA Elizabeth Drive Appendix A-12 Noise Assessment Report No. 04092-R Version A
Project: SAWT EIS Location: 35 Overett Avenue

SAWT Expansion SITA Elizabeth Drive Appendix A-13 Noise Assessment Report No. 04092-R Version A
Project: SAWT EIS Location: 28 Twins Creek Drive
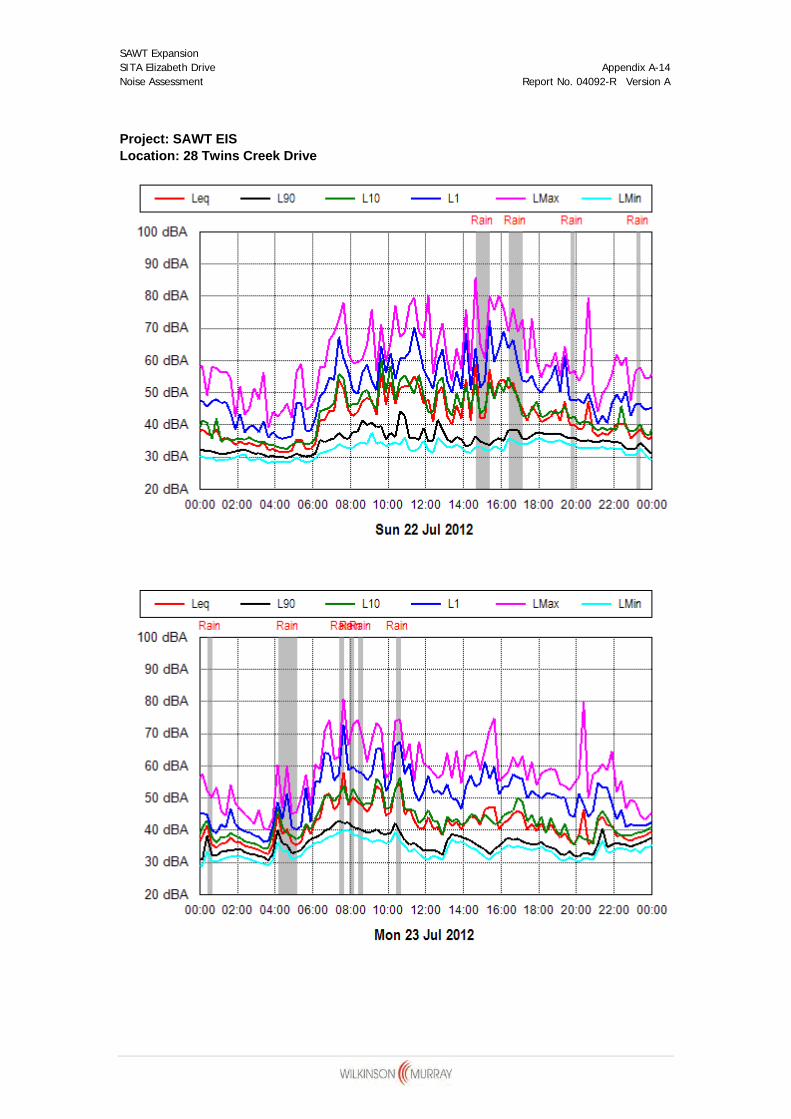
SAWT Expansion SITA Elizabeth Drive Appendix A-14 Noise Assessment Report No. 04092-R Version A
Project: SAWT EIS Location: 28 Twins Creek Drive

SAWT Expansion SITA Elizabeth Drive Appendix A-15 Noise Assessment Report No. 04092-R Version A
Project: SAWT EIS Location: 28 Twins Creek Drive

SAWT Expansion SITA Elizabeth Drive Appendix A-16 Noise Assessment Report No. 04092-R Version A
Project: SAWT EIS Location: 28 Twins Creek Drive

SAWT Expansion SITA Elizabeth Drive Appendix A-17 Noise Assessment Report No. 04092-R Version A
Project: SAWT EIS Location: 28 Twins Creek Drive

SAWT Expansion SITA Elizabeth Drive Appendix A-18 Noise Assessment Report No. 04092-R Version A
Project: SAWT EIS Location: 28 Twins Creek Drive

APPENDIX B NOISE CONTOURS

SAWT Expansion SITA Elizabeth Drive Appendix B-1 Noise Assessment Report No. 04092-R Version A
DAY - 10 Percentile Intrusiveness Noise Predictions (SAWT + Landfill)

SAWT Expansion SITA Elizabeth Drive Appendix B-2 Noise Assessment Report No. 04092-R Version A
EVENING - 10 Percentile Intrusiveness Noise Predictions (SAWT + Landfill)

SAWT Expansion SITA Elizabeth Drive Appendix B-3 Noise Assessment Report No. 04092-R Version A
NIGHT - 10 Percentile Intrusiveness Noise Predictions (SAWT + Landfill)

SAWT Expansion SITA Elizabeth Drive Appendix B-4 Noise Assessment Report No. 04092-R Version A
DAY - 10 Percentile Intrusiveness Noise Predictions (SAWT)

SAWT Expansion SITA Elizabeth Drive Appendix B-5 Noise Assessment Report No. 04092-R Version A
EVENING - 10 Percentile Intrusiveness Noise Predictions (SAWT)

SAWT Expansion SITA Elizabeth Drive Appendix B-6 Noise Assessment Report No. 04092-R Version A
NIGHT - 10 Percentile Intrusiveness Noise Predictions (SAWT)

APPENDIX C MODELLED METEOROLOGICAL CONDITIONS

SAWT Expansion SITA Elizabeth Drive Appendix C-1 Noise Assessment Report No. 04092-R Version A
Wind Speed
(m/s)
Wind Direction
(degrees)
Temperature Inversion Strength
(degrees / 100m)
0 0 0
0.75 0 0
0.75 45 0
0.75 90 0
0.75 135 0
0.75 180 0
0.75 225 0
0.75 270 0
0.75 315 0
1.25 0 0
1.25 45 0
1.25 90 0
1.25 135 0
1.25 180 0
1.25 225 0
1.25 270 0
1.25 315 0
1.75 0 0
1.75 45 0
1.75 90 0
1.75 135 0
1.75 180 0
1.75 225 0
1.75 270 0
1.75 315 0
2.25 0 0
2.25 45 0
2.25 90 0
2.25 135 0
2.25 180 0
2.25 225 0
2.25 270 0
2.25 315 0
2.75 0 0
2.75 45 0
2.75 90 0
2.75 135 0
2.75 180 0
2.75 225 0

SAWT Expansion SITA Elizabeth Drive Appendix C-2 Noise Assessment Report No. 04092-R Version A
Wind Speed
(m/s)
Wind Direction
(degrees)
Temperature Inversion Strength
(degrees / 100m)
2.75 270 0
2.75 315 0
0 0 3
0.75 0 3
0.75 45 3
0.75 90 3
0.75 135 3
0.75 180 3
0.75 225 3
0.75 270 3
0.75 315 3
1.25 0 3
1.25 45 3
1.25 90 3
1.25 135 3
1.25 180 3
1.25 225 3
1.25 270 3
1.25 315 3
1.75 0 3
1.75 45 3
1.75 135 3
1.75 180 3
1.75 225 3
1.75 270 3
1.75 315 3
2.25 0 3
2.25 45 3
2.25 135 3
2.25 180 3
2.25 225 3
2.25 270 3
2.25 315 3
2.75 315 3
2.75 0 3
2.75 135 3
2.75 225 3
2.75 270 3


15 January 2013
Expansion of the Advanced Waste
Treatment Facility, Kemps Creek
Resource Recovery Precinct
Traffic Impact Assessment

AECOM Expansion of the Advanced Waste Treatment Facility, Kemps Creek Resource Recovery Precinct - Traffic Impact Assessment
15 January 2013
Expansion of the Advanced Waste Treatment Facility, Kemps Creek Resource Recovery Precinct Traffic Impact Assessment
Prepared for
SITA Australia Pty Ltd
Prepared by
AECOM Australia Pty Ltd Level 21, 420 George Street, Sydney NSW 2000, PO Box Q410, QVB Post Office NSW 1230, Australia T +61 2 8934 0000 F +61 2 8934 0001 www.aecom.com ABN 20 093 846 925
15 January 2013
60250100
AECOM in Australia and New Zealand is certified to the latest version of ISO9001 and ISO14001.
© AECOM Australia Pty Ltd (AECOM). All rights reserved.
AECOM has prepared this document for the sole use of the Client and for a specific purpose, each as expressly stated in the document. No other party should rely on this document without the prior written consent of AECOM. AECOM undertakes no duty, nor accepts any responsibility, to any third party who may rely upon or use this document. This document has been prepared based on the Client’s description of its requirements and AECOM’s experience, having regard to assumptions that AECOM can reasonably be expected to make in accordance with sound professional principles. AECOM may also have relied upon information provided by the Client and other third parties to prepare this document, some of which may not have been verified. Subject to the above conditions, this document may be transmitted, reproduced or disseminated only in its entirety.

AECOM Expansion of the Advanced Waste Treatment Facility, Kemps Creek Resource Recovery Precinct - Traffic Impact Assessment
15 January 2013
Quality Information
Document Expansion of the Advanced Waste Treatment Facility, Kemps Creek Resource Recovery Precinct – Traffic Impact Assessment
Ref 60250100
Date 15 January 2013
Prepared by Dan Riley
Reviewed by Andy Yung
Revision History
Revision Revision Date
Details Authorised
Name/Position Signature
1 1-Jan-2013 Draft for Client Review Andy Yung Principal Transport Planner – Strategic Planning & Advisory
2 15-Jan-2013 Final Andy Yung Principal Transport Planner – Strategic Planning & Advisory

AECOM Expansion of the Advanced Waste Treatment Facility, Kemps Creek Resource Recovery Precinct - Traffic Impact Assessment
15 January 2013
Table of Contents 1.0 Introduction 3
1.1 Purpose and Scope 3 1.1.1 Report Structure 3
2.0 Existing Conditions 5 2.1 Site Location 5 2.2 Road Network 11
2.2.1 Strategic Road Network 11 2.2.2 Local Road Network 11 2.2.3 Traffic Accident History 11 2.2.4 Daily Traffic Volumes (AADT) 13 2.2.5 Peak Hour Traffic Volumes 13 2.2.6 Existing Operational Performance 15
2.3 Public and Active Transport 18 3.0 Future Year Base Case Traffic Conditions 19
3.1 Peak Hour Traffic Volumes (EMME) 19 3.2 Future Road Upgrades 20 3.3 Future Year Traffic Volumes (Without Development) 20 3.4 Intersection Performance (Without Development) 24
3.4.1 Elizabeth Drive / The Northern Road 24 3.4.2 Elizabeth Drive / Resource Recovery Precinct Access Road 24 3.4.3 Elizabeth Drive / Mamre Road 24
4.0 Impacts of Development 27 4.1 Construction Phase 27
4.1.1 Hours and Workforce 27 4.1.2 Traffic Generation 27 4.1.3 Light Vehicle Traffic and Parking Requirements 28 4.1.4 Heavy Vehicle Traffic 28 4.1.5 Traffic Distribution 29 4.1.6 Impact of Construction Traffic 29 4.1.7 Construction Traffic Management Plan (CTMP) 29
4.2 Operation Phase 30 4.2.1 Hours and Workforce 30 4.2.2 Traffic Distribution 31 4.2.3 Future Year Traffic Volumes (With Development) 31 4.2.4 Intersection Upgrade 33 4.2.5 Impacts of Operation Traffic 37
5.0 Conclusions 39 5.1 Trip Generation 39 5.2 Project Construction Impacts 39 5.3 Project Operation Impacts 39

AECOM Expansion of the Advanced Waste Treatment Facility, Kemps Creek Resource Recovery Precinct - Traffic Impact Assessment
15 January 2013
1
List of Figures Figure 1: Site Location and Road Network 7 Figure 2: Existing Elizabeth Drive and Site Access Road Intersections 9 Figure 3: Existing Layout of Elizabeth Drive and The Northern Road Intersection 16 Figure 4: Existing layout of Elizabeth Drive and Resource Recovery Precinct Access Road intersection 17 Figure 5: Existing Layout of Elizabeth Drive and Mamre Road Intersection 17 Figure 6: Modified Elizabeth Drive and Site Access Road Intersection 35
List of Tables Table 1: Accident Data in the Vicinity of the Site 12 Table 2: Average Annual Daily Traffic (AADT) on Adjacent Road Network 13 Table 3: Existing Traffic Volume on Elizabeth Drive / The Northern Road 14 Table 4: Existing Traffic Volume on Elizabeth Drive / Resource Recovery Precinct Access Road 14 Table 5: Existing Traffic Volume on Elizabeth Drive / Mamre Road 15 Table 6: Performance Criteria for Intersection Assessment 15 Table 7: SIDRA Intersection Assessment Results for 2012 Base Case 18 Table 8: RMS EMME Peak Hour Forecast Traffic Growth Rates 19 Table 9: Future Year Traffic Volume at the Elizabeth Drive / The Northern Road Intersection (Without
Development) 20 Table 10: Future Year Traffic Volume at Elizabeth Drive / Resource Recovery Precinct Access Road
Intersection (Without Development) 22 Table 11: Future Year Traffic Volume at the Elizabeth Drive / Mamre Road Intersection (Without Development) 23 Table 12: SIDRA Outputs for The Northern Road / Elizabeth Drive Roundabout, Without Development 24 Table 13: SIDRA Outputs for Elizabeth Drive / Resource Recovery Precinct Access Road Intersection, Without
Development 24 Table 14: SIDRA Outputs for Elizabeth Drive / Mamre Road Roundabout, Without Development 25 Table 15: Light Vehicle Movements and Parking Requirements 28 Table 16: Construction Heavy Vehicle Movements (Daily) 28 Table 17: SIDRA Results for 2014 Construction Traffic 29 Table 18: Operation Staff Numbers and Light Vehicle Movements (Daily) 30 Table 19: Operational Heavy Vehicle Movements (Daily) 31 Table 20: Traffic Volume on Elizabeth Drive / The Northern Road (With Development) 31 Table 21: Traffic Volume on Elizabeth Drive / Resource Recovery Precinct Access Road (With Development) 32 Table 22: Traffic Volume on Elizabeth Drive / Mamre Road Roundabout (With Development) 33 Table 23: SIDRA Results for Elizabeth Drive / The Northern Road, With Development 37 Table 24: SIDRA Results for Elizabeth Drive / Resource Recovery Precinct Access Road, With Development 37 Table 25: SIDRA Results for Elizabeth Drive / Mamre Road Roundabout, With Development 37

AECOM Expansion of the Advanced Waste Treatment Facility, Kemps Creek Resource Recovery Precinct - Traffic Impact Assessment
15 January 2013
2
This page has been left blank intentionally.

AECOM Expansion of the Advanced Waste Treatment Facility, Kemps Creek Resource Recovery Precinct - Traffic Impact Assessment
15 January 2013
3
1.0 Introduction
1.1 Purpose and Scope
AECOM has been engaged by SITA to prepare a Traffic Impact Assessment (TIA) to support an Environmental Impact Statement (EIS) for the proposed expansion of the existing SITA Advanced Waste Treatment (SAWT) facility at its Kemps Creek Resource Recovery Precinct in Western Sydney (the Development). The Development would comprise an expansion of the existing SAWT facility only and would not change operations at the adjacent Elizabeth Drive landfill.
The purpose of the EIS is to anticipate environmental the impacts of this expansion, and suggest mitigation measures, if necessary. The purpose of the TIA is to determine the impacts of the proposed development during the construction phase and the operation phase, recommending any infrastructure upgrades required to alleviate any traffic impacts.
Consultation was undertaken with Roads and Maritime Service (RMS) on 27 June, 2012 to discuss the scope and methodology for the TIA. Given the relatively small amount of additional traffic as a result of the Development, RMS agreed that the scope of the TIA would only require the assessment of three key intersections along Elizabeth Drive. This assessment has been undertaken using SIDRA 5.1. The intersections RMS agreed should be modelled are:
- Elizabeth Drive/access to Kemps Creek Resource Recovery Precinct
- Elizabeth Drive/The Northern Road
- Elizabeth Drive/Mamre Road.
These intersections have been modelled for the AM (7:30am-8:30am) and PM (4:45pm-5:45pm) peak periods, as well as a different morning peak hour of 5:00am-6:00am for the construction peak period. The agreed years of assessment for each intersection are:
- 2014 (Construction year)
- 2016 (Full operation)
- 2026 (Full operation + ten years).
1.1.1 Report Structure
This report is structured as follows:
- Section 2 summarises the existing transport conditions in the area surrounding the Site
- Section 3 considers the likely future transport conditions in the area without the Development
- Section 4 provides an assessment of the trip generation and distribution associated with the Development for both construction and operation, together with a review of their impacts on the local road network. Details of recommended works required to mitigate any potential impacts associated with the Development for both construction and operation are discussed in this section
- Section 5 provides a summary and study conclusions.

AECOM Expansion of the Advanced Waste Treatment Facility, Kemps Creek Resource Recovery Precinct - Traffic Impact Assessment
15 January 2013
4
This page has been left blank intentionally.

AECOM Expansion of the Advanced Waste Treatment Facility, Kemps Creek Resource Recovery Precinct - Traffic Impact Assessment
15 January 2013
5
2.0 Existing Conditions
2.1 Site Location
The Site is located approximately 41 kilometres west of the Sydney Central Business District (CBD). The towns of Kemps Creek and Badgerys Creek are located approximately five kilometres (km) east and five km south west of the Site, respectively. The Site is located within the Penrith Local Government Area (LGA). The regional context in which the Site is situated is illustrated in Figure 1.
The Site is located within the boundary of the existing Kemps Creek Resource Recovery Precinct (refer to Figure 2). The Site covers an area of approximately eight hectares and is located in the north eastern corner of the Resource Recovery Precinct. The Site currently comprises the existing Kemps Creek Resource Recovery Precinct.
Access to the Precinct is via Elizabeth Drive, which is an east-west connector road providing access from the M7 Westlink from the east, and The Northern Road from the west. The existing Kemps Creek Resource Recovery Precinct is located within a fully fenced compound at the end of a dedicated access road between the facility and the main entrance to the Resource Recovery Precinct.

AECOM Expansion of the Advanced Waste Treatment Facility, Kemps Creek Resource Recovery Precinct - Traffic Impact Assessment
15 January 2013
6
This page has been left blank intentionally.

110
102
MulgoaMulgoa
ErskinePark
KempsCreekKempsCreek
BadgerysCreek
BadgerysCreek
LuddenhamLuddenham
MountVernonMountVernon
Abbotsbury
Bossley Park
Greenfield Park
Bonnyrigg
Bonnyrigg Heights
Greendale
HeckenbergBusby
SadleirMiller
Cartwright
Lurnea
Cecil HillsCeci
Green Valley
AustralAustral
Hinchinbrook
Hoxton ParkH
Carnes Hill
CecilParkCecilPark
West HoxtonWest Hoxt
Middleton GrangeMiddleton Gran
RossmoreRossmore
Elizabeth DriveElizabeth Drive
Ludden
ham
Road
Ludden
ham
Road
Mam
reR
oad
Mam
reR
oad
Weste
rnR
oad
Weste
rnR
oad
Devo
nsh
ire
Ro
ad
Devo
nsh
ire
Ro
ad
Derw
en
tR
oad
Derw
en
tR
oad
Fifteenth AvenueFifteenth Avenue
Gurner AvenueGurner Avenue
WE
STLIN
KM
7
WE
STLIN
KM
7
Mart
inR
oad
Mart
inR
oad
Law
so
nR
oad
Law
so
nR
oad
BoralBadgerys Creek
Business Park
Twin CreeksGolf Club and
Residential Estate
KempsCreekNatureReserve
Kemps CreekKemps Creek
Kemps CreekKemps Creek
South CreekSouth Creek
South CreekSouth Creek
Badgerys CreekBadgerys Creek
Badgerys CreekBadgerys Creek
Cosgrove CreekCosgrove Creek
South CreekSouth Creek
Badgerys Creek Park
Department of Defence Land
Warragamba-Prospect Water Pipeline
50
50
100ANL
Intersection of The Northern Road
and Elizabeth Drive
Intersection of Mamre Road
and Elizabeth Drive
To M4 Motorway
Site Access
Kemps Creek Resource
Recovery Precinct
Existing SAWT Facility
Elizabeth Drive
Landfill
SITE LOCATION AND ROAD NETWORK
FIGURE 1
Environmental Impact Statement - Expansion of the Advanced Waste Treatment Facility,
Kemps Creek Resource Recovery Precinct
G:\
Pro
jects
\602
Pro
jects
\60250100
Kem
ps
Cre
ek\F
IGU
RE
S\E
IS\T
raffic
and
Tra
nsport
\60250100
F1
Site
Location
and
Road
Netw
ork
15
01
2013
TO
Re
vA
KEY
Site boundary
NPWS estate
Parks and reserves
Native vegetation
Urban area
0 2.5km

AECOM Expansion of the Advanced Waste Treatment Facility, Kemps Creek Resource Recovery Precinct - Traffic Impact Assessment
15 January 2013
8
This page has been left blank intentionally.
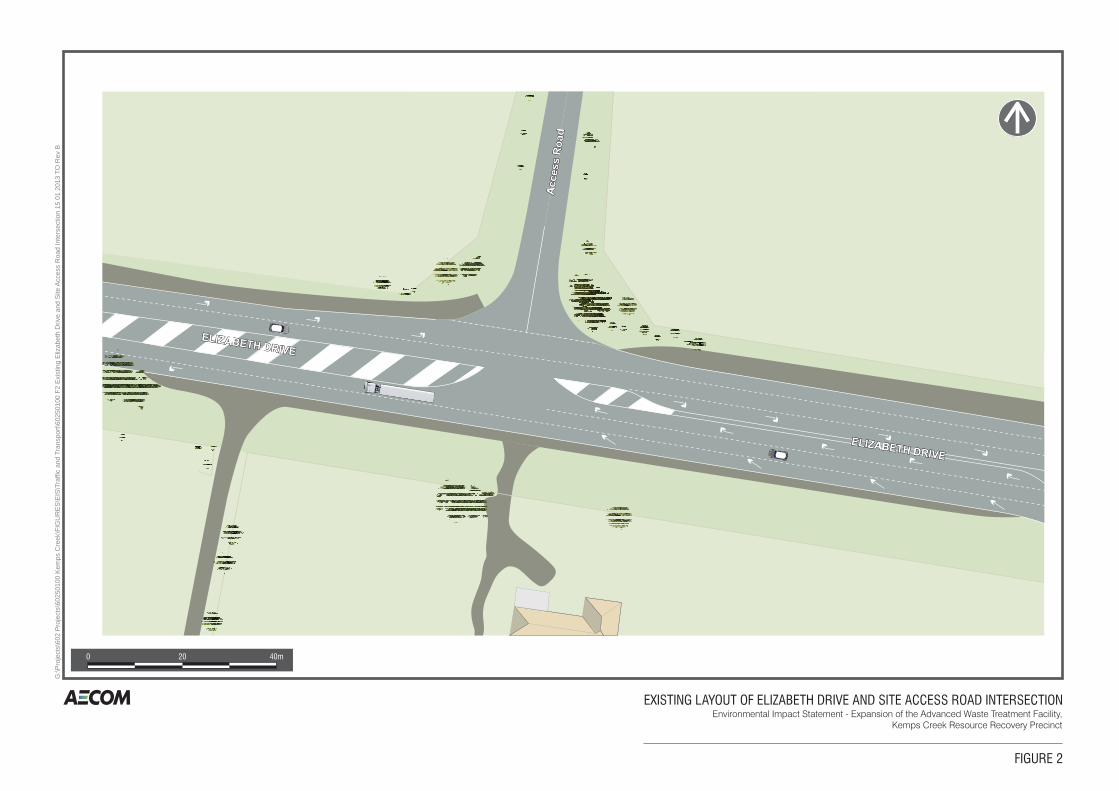
ELIZABETH DRIVE
ELIZABETH DRIVE
Access
Ro
ad
Access
Ro
ad
ELIZABETH DRIVE
ELIZABETH DRIVE
0 20 40m
INTERSECTION XXXXINTERSECTION XXXX
FIGURE xFIGURE x
Environmental Impact Statement - Upgrade of Kemps Creek AWT Facility
Kemps Creek, New South Wales
Environmental Impact Statement - Upgrade of Kemps Creek AWT Facility
Kemps Creek, New South Wales
G:\
Pro
jects
\602
Pro
jects
\60250100
Kem
ps
Cre
ek\F
IGU
RE
S\E
IS\T
raffic
and
Tra
nsport
\Fx
Land
Zonin
g04
09
2012
TO
G:\
Pro
jects
\602
Pro
jects
\60250100
Kem
ps
Cre
ek\F
IGU
RE
S\E
IS\T
raffic
and
Tra
nsport
\Fx
Land
Zonin
g04
09
2012
TO
EXISTING LAYOUT OF ELIZABETH DRIVE AND ACCESS ROAD INTERSECTIONSITE
FIGURE 2
Environmental Impact Statement - Expansion of the Advanced Waste Treatment Facility,
Kemps Creek Resource Recovery Precinct
G:\
Pro
jects
\602
Pro
jects
\60250100
Kem
ps
Cre
ek\F
IGU
RE
S\E
IS\T
raffic
and
Tra
nsport
\60250100
F2
Exis
ting
Eliz
abeth
Drive
and
Site
Acce
ss
Roa
dIn
ters
ectio
n15
01
2013
TO
Rev
B

AECOM Expansion of the Advanced Waste Treatment Facility, Kemps Creek Resource Recovery Precinct - Traffic Impact Assessment
15 January 2013
10
This page has been left blank intentionally.

AECOM Expansion of the Advanced Waste Treatment Facility, Kemps Creek Resource Recovery Precinct - Traffic Impact Assessment
15 January 2013
11
2.2 Road Network
The Site has a good vehicular connection to major arterial roads and the highway network in western Sydney. Access to the facility is via an existing access road off Elizabeth Drive, midway between Mamre Road and Luddenham Road. Elizabeth Drive is a major east-west arterial road connecting The Northern Road and the Westlink M7 and currently provides local access to many rural and industrial developments along its length. Traffic flow gradually increases from the west to the east as it approaches the Westlink M7. In addition, a number of roads in the vicinity of the site are classified as 25 to 26-metre B-Double routes. This includes Elizabeth Drive, Mamre Road, The Northern Road and Badgerys Creek Road.
2.2.1 Strategic Road Network
Westlink M7
Westlink M7 is an urban motorway that forms part of the Sydney Orbital Network. It connects three Metroads: M5 at Prestons, M4 at Eastern Creek and M2 at Baulkham Hills. It is a high standard four-lane two way toll road with a posted speed of 100 kilometres per hour (km/h).
Elizabeth Drive
Elizabeth Drive is an arterial road connecting the Westlink M7 and The Northern Road. It is predominantly a two-lane road with an upgraded section to four lanes east of the M7. The posted speed limit on the road is 80 km/h from The Northern Road to Westlink M7 and 70 km/h to the east of Westlink M7.
The Northern Road
The Northern Road is a major arterial road to the west of Sydney. It runs parallel to the Westlink M7 as an outer ring road connecting the south-west and north-west regions. It connects to Elizabeth Drive via a two-lane roundabout approximately six km west of the Site. The posted speed limit on The Northern Road is 80 km/h.
Mamre Road
Mamre Road is an arterial road linking the M4 motorway and Elizabeth Drive. It is a two-lane road with a posted speed limit of 80 km/h. It connects to Elizabeth Drive via a two-lane roundabout approximately four km east of the Site.
Luddenham Road
Luddenham Road is a sub-arterial road linking the M4 motorway to the western section of Elizabeth Drive. It is a two-lane road with a posted speed limit of 80 km/h. Luddenham Road is not classified as a B-Double route and connects to Elizabeth Drive via a priority intersection four km west of the Site.
2.2.2 Local Road Network
There are two local roads on the opposite side of Elizabeth Drive namely; Lawson Road and Martin Road, providing access to a few houses and small scale agricultural operations. The nearest residential area to the Site by road is Kemps Creek which is located approximately 2.5 km to the east of the Site. It should also be noted that the Twin Creeks residential estate is the closest residential area to the north of the Site; however this is accessed from Luddenham Road, approximately nine km by road from the Kemps Creek Resource Recovery Precinct.
2.2.3 Traffic Accident History
A review of historical crash data on Elizabeth Drive between The Northern Road and Cowpasture Road (a 16 km stretch of road) was undertaken to establish the number of traffic accidents over the five year period between 2006 and 2011. The review indicates:
- A total of 200 reported crashes, including:
101 (50.5 percent) injury accidents
96 (48.0 percent) non-casualty accidents
3 (1.5 percent) fatal accidents.
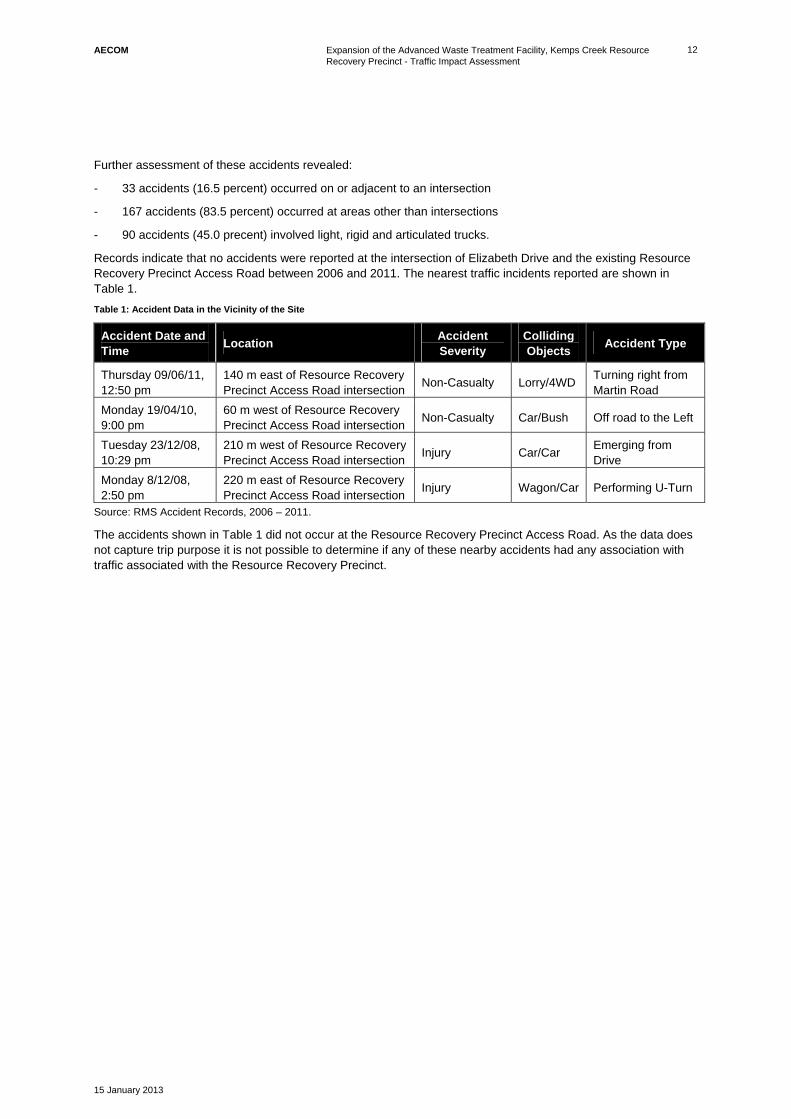
AECOM Expansion of the Advanced Waste Treatment Facility, Kemps Creek Resource Recovery Precinct - Traffic Impact Assessment
15 January 2013
12
Further assessment of these accidents revealed:
- 33 accidents (16.5 percent) occurred on or adjacent to an intersection
- 167 accidents (83.5 percent) occurred at areas other than intersections
- 90 accidents (45.0 precent) involved light, rigid and articulated trucks.
Records indicate that no accidents were reported at the intersection of Elizabeth Drive and the existing Resource Recovery Precinct Access Road between 2006 and 2011. The nearest traffic incidents reported are shown in Table 1.
Table 1: Accident Data in the Vicinity of the Site
Accident Date and Time
Location Accident Severity
Colliding Objects
Accident Type
Thursday 09/06/11, 12:50 pm
140 m east of Resource Recovery Precinct Access Road intersection
Non-Casualty Lorry/4WD Turning right from Martin Road
Monday 19/04/10, 9:00 pm
60 m west of Resource Recovery Precinct Access Road intersection
Non-Casualty Car/Bush Off road to the Left
Tuesday 23/12/08, 10:29 pm
210 m west of Resource Recovery Precinct Access Road intersection
Injury Car/Car Emerging from Drive
Monday 8/12/08, 2:50 pm
220 m east of Resource Recovery Precinct Access Road intersection
Injury Wagon/Car Performing U-Turn
Source: RMS Accident Records, 2006 – 2011.
The accidents shown in Table 1 did not occur at the Resource Recovery Precinct Access Road. As the data does not capture trip purpose it is not possible to determine if any of these nearby accidents had any association with traffic associated with the Resource Recovery Precinct.

AECOM Expansion of the Advanced Waste Treatment Facility, Kemps Creek Resource Recovery Precinct - Traffic Impact Assessment
15 January 2013
13
2.2.4 Daily Traffic Volumes (AADT)
Several RMS permanent vehicle counting stations are located on the road network in the vicinity of the Site. RMS Annual Average Daily Traffic (AADT) data is shown in Table 2 and provides a summary of traffic volumes recorded at these stations between 1996 and 2005. More recent AADT data has not been made available from the RMS. It should be noted that the area in the vicinity of the site has not experienced any considerable changes since 2005, so the data collected during this assessment year remains relevant. Traffic volumes and trends indicate that:
- Traffic flow on Elizabeth Drive gradually increases from the west to the east as it approaches the Westlink M7
- AADT on Elizabeth Drive near the entrance to the Resource Recovery Precinct Access Road (Station no. 64.037) increased by approximately 2.2 percent per annum between 1996 and 2005
- AADT on Elizabeth Drive, west of Luddenham Road (Station no. 64.032) experienced an annual growth rate of approximately 2.5 percent between 1996 and 2005, while AADT on Elizabeth Drive between Cecil Park and Wallgrove Road remained constant over the 10 year period between 1996 and 2005.
Table 2: Average Annual Daily Traffic (AADT) on Adjacent Road Network
Station Number
Station Location
AADT Volumes - Year Annual Growth Rate
(1996 – 2005) 1996 1999 2002 2005
64.037 Elizabeth Drive at South Creek Bridge 8,041 9,117 9,098 9,757 2.2%
64.032 Elizabeth Drive between The Northern Road and Luddenham Road
5,879 6,753 6,592 7,311 2.5%
64.033 Elizabeth Drive between Cecil Park and Wallgrove Road
17,274 19,180 17,910 17,311 0.0%
86.044 Mamre Road between Bakers Lane and Erskine Park
10,859 12,153 12,446 14,074 2.9%
Source: RMS Traffic Volume Data 2005 Sydney Region Volume 1.
2.2.5 Peak Hour Traffic Volumes
To provide a better understanding of peak hour traffic conditions, a classified Intersection traffic count was conducted by AECOM on 19 June 2012 for the following three intersections:
- Elizabeth Drive / The Northern Road
- Elizabeth Drive / Resource Recovery Precinct Access Road
- Elizabeth Drive / Mamre Road.
The survey was conducted for two hours in the AM peak (7:00 to 9:00 am) and the PM peak (4:30 to 6:30 pm) at the three intersections above. The survey identifies network peak hours of 7:30 to 8:30 am and 4:45 to 5:45 pm in the AM and PM, respectively with PM peak hour demand approximately nine percent higher than AM peak hour demand.

AECOM Expansion of the Advanced Waste Treatment Facility, Kemps Creek Resource Recovery Precinct - Traffic Impact Assessment
15 January 2013
14
Table 3 illustrates the existing traffic movements at the intersection of Elizabeth Drive and The Northern Road in the AM and PM peak hour.
Table 3: Existing Traffic Volume on Elizabeth Drive / The Northern Road
Elizabeth Drive / The Northern Road – AM Peak Elizabeth Drive / The Northern Road – PM Peak
Source: AECOM, 2012.
Table 4 illustrates the existing traffic movements at the intersection of Elizabeth Drive and the Resource Recovery Precinct Access Road in the AM and PM peak hour.
Table 4: Existing Traffic Volume on Elizabeth Drive / Resource Recovery Precinct Access Road
Elizabeth Drive / Resource Recovery Precinct Access Road – AM Peak
Elizabeth Drive / Resource Recovery Precinct Access Road – PM Peak
Source: AECOM, 2012
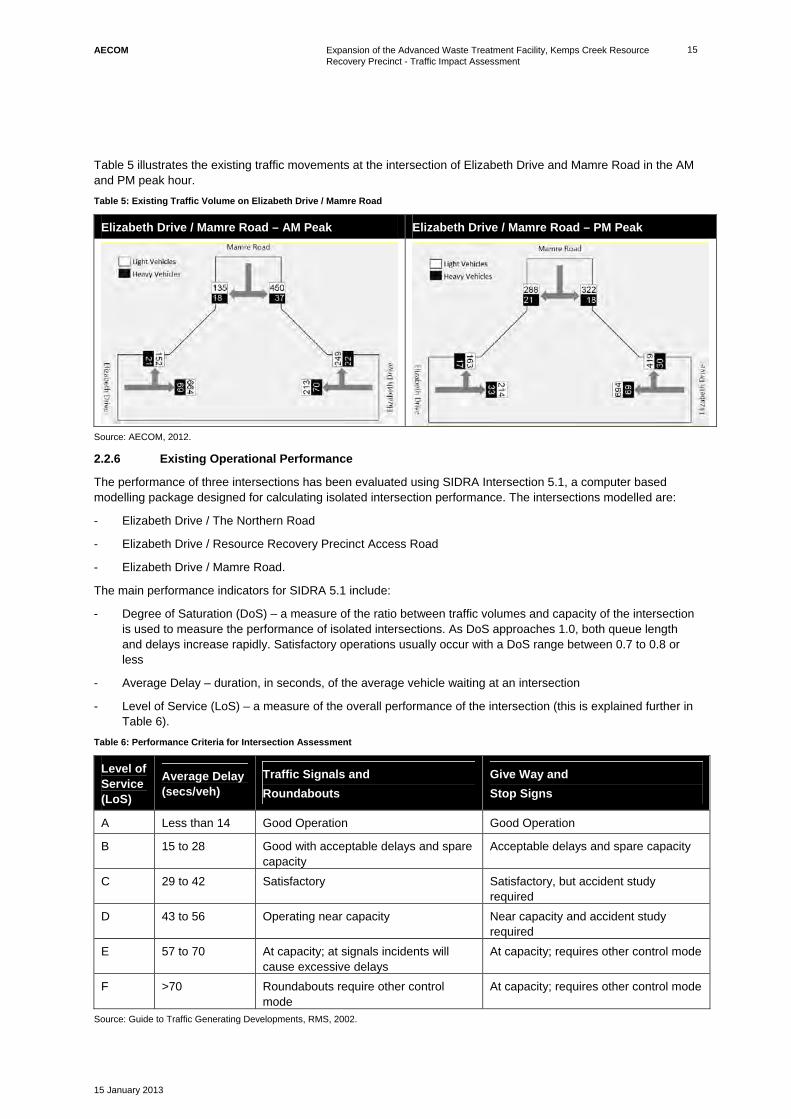
AECOM Expansion of the Advanced Waste Treatment Facility, Kemps Creek Resource Recovery Precinct - Traffic Impact Assessment
15 January 2013
15
Table 5 illustrates the existing traffic movements at the intersection of Elizabeth Drive and Mamre Road in the AM and PM peak hour.
Table 5: Existing Traffic Volume on Elizabeth Drive / Mamre Road
Elizabeth Drive / Mamre Road – AM Peak Elizabeth Drive / Mamre Road – PM Peak
Source: AECOM, 2012.
2.2.6 Existing Operational Performance
The performance of three intersections has been evaluated using SIDRA Intersection 5.1, a computer based modelling package designed for calculating isolated intersection performance. The intersections modelled are:
- Elizabeth Drive / The Northern Road
- Elizabeth Drive / Resource Recovery Precinct Access Road
- Elizabeth Drive / Mamre Road.
The main performance indicators for SIDRA 5.1 include:
- Degree of Saturation (DoS) – a measure of the ratio between traffic volumes and capacity of the intersection is used to measure the performance of isolated intersections. As DoS approaches 1.0, both queue length and delays increase rapidly. Satisfactory operations usually occur with a DoS range between 0.7 to 0.8 or less
- Average Delay – duration, in seconds, of the average vehicle waiting at an intersection
- Level of Service (LoS) – a measure of the overall performance of the intersection (this is explained further in Table 6).
Table 6: Performance Criteria for Intersection Assessment
Level of Service (LoS)
Average Delay (secs/veh)
Traffic Signals and
Roundabouts
Give Way and
Stop Signs
A Less than 14 Good Operation Good Operation
B 15 to 28 Good with acceptable delays and spare capacity
Acceptable delays and spare capacity
C 29 to 42 Satisfactory Satisfactory, but accident study required
D 43 to 56 Operating near capacity Near capacity and accident study required
E 57 to 70 At capacity; at signals incidents will cause excessive delays
At capacity; requires other control mode
F >70 Roundabouts require other control mode
At capacity; requires other control mode
Source: Guide to Traffic Generating Developments, RMS, 2002.

AECOM Expansion of the Advanced Waste Treatment Facility, Kemps Creek Resource Recovery Precinct - Traffic Impact Assessment
15 January 2013
16
Each intersection has been modelled in SIDRA 5.1 as per the existing arrangement. A schematic of the current intersection layouts are shown below in Figures 3, 4 and 5. This is followed by intersection analysis results under existing traffic conditions.
Figure 3: Existing Layout of Elizabeth Drive and The Northern Road Intersection
Source: AECOM, 2013.

AECOM Expansion of the Advanced Waste Treatment Facility, Kemps Creek Resource Recovery Precinct - Traffic Impact Assessment
15 January 2013
17
Figure 4: Existing layout of Elizabeth Drive and Resource Recovery Precinct Access Road intersection
Source: AECOM, 2013.
Figure 5: Existing Layout of Elizabeth Drive and Mamre Road Intersection
Source: AECOM, 2013.
The existing Kemps Creek Resource Recovery Precinct Access Road intersection with Elizabeth Drive has been modelled based on the layout shown in Figure 4. Note that in reality a 500-metre-long auxiliary lane exists to the south of the westbound traffic lane as shown in the figure. However this lane has been excluded from the modelled layout as it is not used by through traffic. In practice the lane operates as an entry/exit lane for vehicles

AECOM Expansion of the Advanced Waste Treatment Facility, Kemps Creek Resource Recovery Precinct - Traffic Impact Assessment
15 January 2013
18
accessing Lawson Road and Martin Road. Also note that roundabouts at The Northern Road and Mamre Road with Elizabeth Drive were both modelled as two-lane roundabouts.
Table 7 shows that The Northern Road / Elizabeth Drive and the Mamre Road / Elizabeth Drive roundabouts operate with minimal queuing under existing traffic flows (LoS B) during both the AM peak (7:30 to 8:30 am) and PM peak (4:45 to 5:45 pm) hour periods. The Elizabeth Drive / Resource Recovery Precinct Access Road intersection currently operates at LoS F during the AM Peak period. This is due to the high average delay caused by Heavy Goods Vehicles (HGVs) seeking to exit the Resource Recovery Precinct during peak hour traffic flows on Elizabeth Drive. The traffic flows along Elizabeth Drive make it difficult for HGVs to exit, particularly in a westbound direction. The Elizabeth Drive / Resource Recovery Precinct Access Road intersection currently operates at LoS B during the PM Peak period.
Table 7: SIDRA Intersection Assessment Results for 2012 Base Case
Intersection
AM Peak PM Peak
Peak hour
volume DoS
Average Delay
LoS Peak hour
volume DoS
Average Delay
LoS
The Northern Road / Elizabeth Drive
1,463 0.256 16.7 B 1,633 0.246 16.9 B
Elizabeth Drive / Resource Recovery Precinct Access Road
941 0.370 156.7 F 994 0.390 25.5 B
Elizabeth Drive / Mamre Road
2,101 0.376 19.8 B 2,289 0.667 20.8 B
DoS – Degree of Saturation
LoS – Level of Service
Source: AECOM, 2013.
2.3 Public and Active Transport
The Site is not well serviced by public transport, with one bus route (Badgerys Creek to Liverpool) passing in proximity to the Resource Recovery Precinct access road with a combined total of six daily services during morning and evening peak. Given the low level of public transport service, the rural nature of the surrounding area and the distance to nearby centres, the likelihood or opportunity for employees to travel to and from the Site via public transport is minimal. However, as the region develops further, public transport provision may be provided.
The area is not well suited to walking, with footways or leisure routes not provided. This reflects the nature of land use in the vicinity of the site. In addition, Elizabeth Drive is not well utilised by cyclists, however there is scope for this to occur in future, with Elizabeth Drive potentially suited to the development of cycleway as the area continues to develop.

AECOM Expansion of the Advanced Waste Treatment Facility, Kemps Creek Resource Recovery Precinct - Traffic Impact Assessment
15 January 2013
19
3.0 Future Year Base Case Traffic Conditions This section assesses the impacts of forecast background traffic growth on the surrounding transport network, including the operational performance of the three assessed intersections during the expected peak construction and operational years for the proposed Development.
This section of the report considers.
- 2014 - Peak construction period (including background traffic growth).
- 2016 - Opening of the fully operational Development (including background traffic growth).
- 2026 - Ten years post opening of the Development with 10 additional years of background traffic growth.
3.1 Peak Hour Traffic Volumes (EMME)
The RMS EMME model represents the estimated traffic flows on the Sydney road network for a number of future year scenarios. The model assumes the level of future year traffic based on forecast population and employment growth.
EMME traffic flows are available for the road network within the study area. They have been used to determine forecast background traffic growth rates along Elizabeth Drive by measuring traffic growth between the years 2011, 2016 and 2026. The growth rates generated were then used to factor up the survey data collected at three key intersections in 2012. The resulting data was then modelled in SIDRA 5.1 as part of 2014, 2016 and 2026 future year assessments.
It was found during analysis that growth rates varied considerably within the study area. The most sensitive location on the local road network is Elizabeth Drive in the vicinity of the Resource Recovery Precinct Access Road, which demonstrates a traffic growth rate of 6.9 percent per annum to 2016 (Elizabeth Drive eastbound in the PM Peak). In order to reflect this high forecast growth rate, it was deemed appropriate to calculate the traffic growth rate for each of the eight movements (intersection approaches) on an individual basis. This provided a higher level of accuracy compared to the application of a single traffic growth rate.
This method for determining the growth rate was agreed with RMS in a meeting on 24 September 2012. The growth rate applied to each movement is shown in Table 8. Note that the table shows forecast negative growth rates for some movements which have also been applied and assessed in SIDRA 5.1.
Table 8: RMS EMME Peak Hour Forecast Traffic Growth Rates
Intersection with Elizabeth Drive Approach
Annual Growth Rates (%)
2011-2016 2016-2026
AM PM AM PM
The Northern Road The Northern Road southbound
2.3 5.2 -0.4 1.7
The Northern Road The Northern Road northbound
4.8 2.2 2.5 0.1
The Northern Road Elizabeth Drive westbound 5.4 3.0 2.6 1.2
Resource Recovery Precinct Access Road Elizabeth Drive eastbound 4.4 6.9 0.9 2.9
Resource Recovery Precinct Access Road Elizabeth Drive westbound 6.0 6.1 4.9 1.5
Mamre Road Elizabeth Drive eastbound 7.1 4.4 4.0 3.2
Mamre Road Elizabeth Drive westbound 3.8 -0.3 1.2 1.3
Mamre Road Mamre Road southbound -3.5 8.5 1.4 3.2
Source: RMS EMME Traffic Forecast, 2012.

AECOM Expansion of the Advanced Waste Treatment Facility, Kemps Creek Resource Recovery Precinct - Traffic Impact Assessment
15 January 2013
20
Future performance and capacity assessment using background traffic growth has been undertaken to provide a base case and benchmark for the impact assessment presented in Section 4. Note that no growth rate has been applied to the Resource Recovery Precinct Access Road in the future base year as this traffic is dependent on any increase in the SAWT facility and landfill operations.
3.2 Future Road Upgrades
Based on consultation with RMS, it is understood that no major road upgrades are proposed for Elizabeth Drive during the assessment years of 2014 and 2016. According to the forecast traffic volumes, Elizabeth Drive may need to be widened to four lanes after 2021. However, no upgrade strategy including intersection layout for Elizabeth Drive has been determined by the RMS. Therefore, it was agreed with the RMS that the intersections have been assessed using existing layouts, with appropriate upgrades recommended if required.
3.3 Future Year Traffic Volumes (Without Development)
The peak hour traffic forecasts for 2014, 2016 and 2026 at each of the three assessed intersections, determined using growth rates as shown in Table 8 are provided in Table 9, Table 10 and Table 11.
Table 9: Future Year Traffic Volume at the Elizabeth Drive / The Northern Road Intersection (Without Development)
Year Elizabeth Drive / The Northern Road – AM Peak Elizabeth Drive / The Northern Road – PM Peak
2014

AECOM Expansion of the Advanced Waste Treatment Facility, Kemps Creek Resource Recovery Precinct - Traffic Impact Assessment
15 January 2013
21
Year Elizabeth Drive / The Northern Road – AM Peak Elizabeth Drive / The Northern Road – PM Peak
2016
2026
Source: AECOM, 2013.
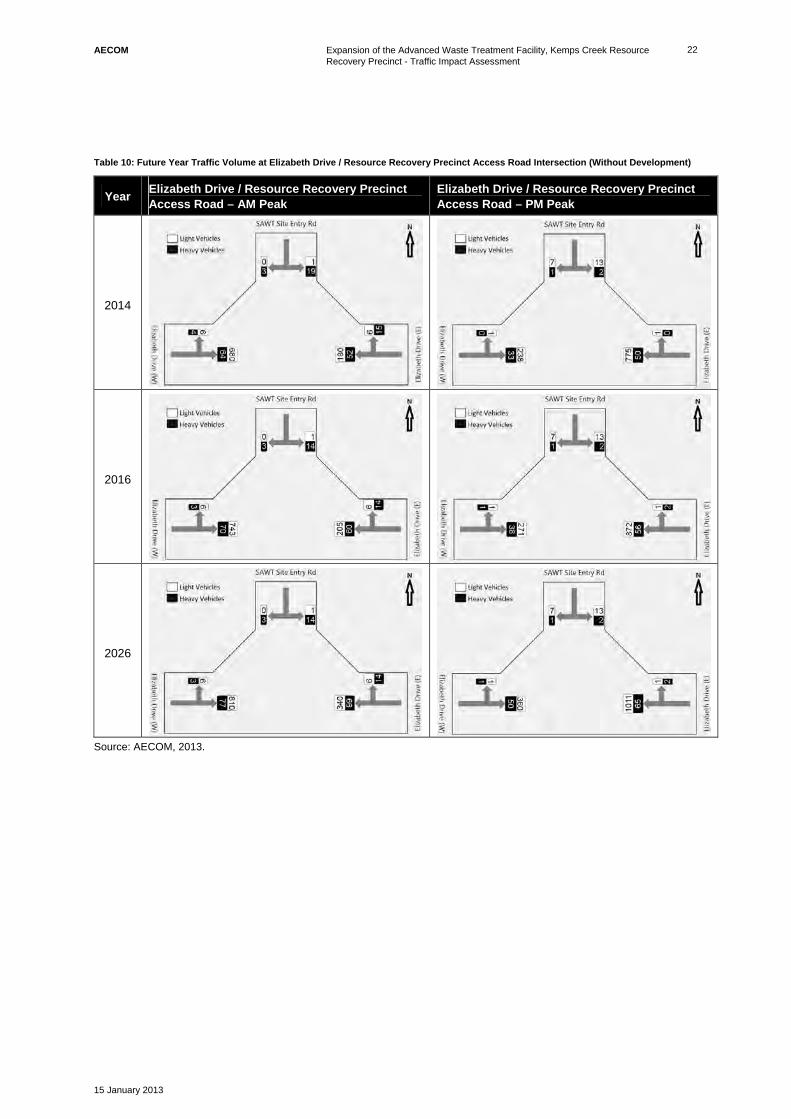
AECOM Expansion of the Advanced Waste Treatment Facility, Kemps Creek Resource Recovery Precinct - Traffic Impact Assessment
15 January 2013
22
Table 10: Future Year Traffic Volume at Elizabeth Drive / Resource Recovery Precinct Access Road Intersection (Without Development)
Year Elizabeth Drive / Resource Recovery Precinct Access Road – AM Peak
Elizabeth Drive / Resource Recovery Precinct Access Road – PM Peak
2014
2016
2026
Source: AECOM, 2013.

AECOM Expansion of the Advanced Waste Treatment Facility, Kemps Creek Resource Recovery Precinct - Traffic Impact Assessment
15 January 2013
23
Table 11: Future Year Traffic Volume at the Elizabeth Drive / Mamre Road Intersection (Without Development)
Year Elizabeth Drive / Mamre Road – AM Peak Elizabeth Drive / Mamre Road – PM Peak
2014
2016
2026
Source: AECOM, 2013.
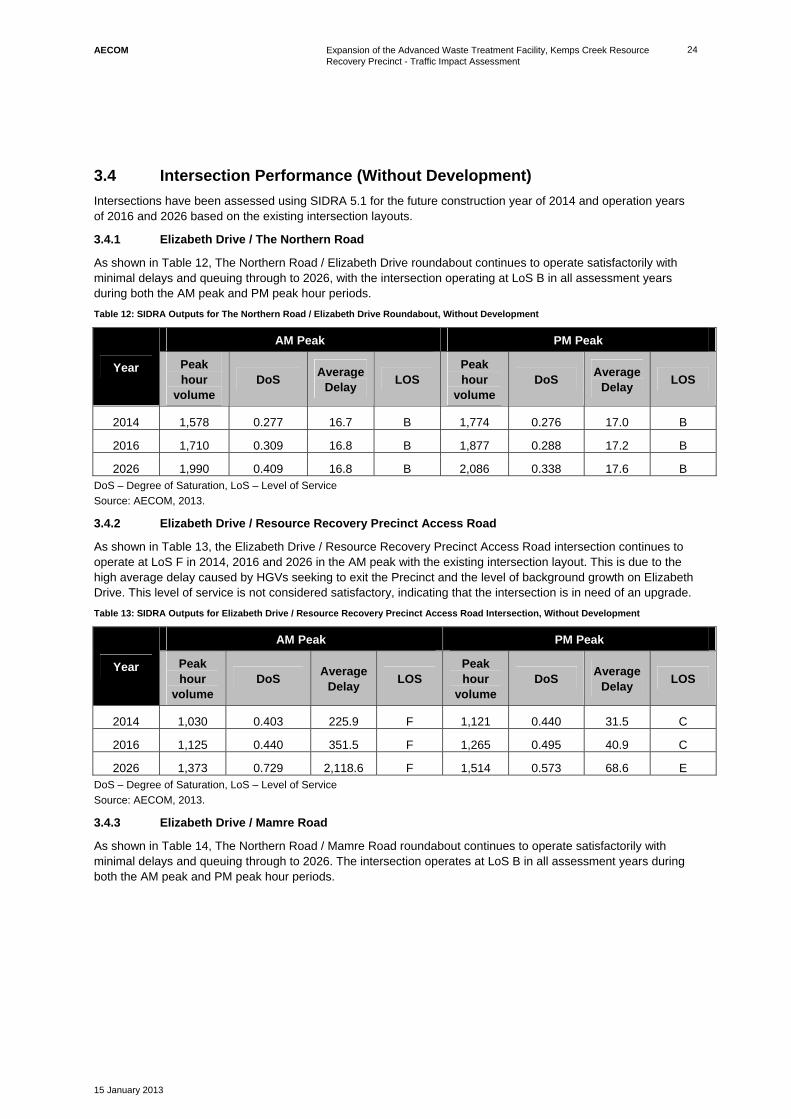
AECOM Expansion of the Advanced Waste Treatment Facility, Kemps Creek Resource Recovery Precinct - Traffic Impact Assessment
15 January 2013
24
3.4 Intersection Performance (Without Development)
Intersections have been assessed using SIDRA 5.1 for the future construction year of 2014 and operation years of 2016 and 2026 based on the existing intersection layouts.
3.4.1 Elizabeth Drive / The Northern Road
As shown in Table 12, The Northern Road / Elizabeth Drive roundabout continues to operate satisfactorily with minimal delays and queuing through to 2026, with the intersection operating at LoS B in all assessment years during both the AM peak and PM peak hour periods.
Table 12: SIDRA Outputs for The Northern Road / Elizabeth Drive Roundabout, Without Development
Year
AM Peak PM Peak
Peak hour
volume DoS
Average Delay
LOS Peak hour
volume DoS
Average Delay
LOS
2014 1,578 0.277 16.7 B 1,774 0.276 17.0 B
2016 1,710 0.309 16.8 B 1,877 0.288 17.2 B
2026 1,990 0.409 16.8 B 2,086 0.338 17.6 B DoS – Degree of Saturation, LoS – Level of Service
Source: AECOM, 2013.
3.4.2 Elizabeth Drive / Resource Recovery Precinct Access Road
As shown in Table 13, the Elizabeth Drive / Resource Recovery Precinct Access Road intersection continues to operate at LoS F in 2014, 2016 and 2026 in the AM peak with the existing intersection layout. This is due to the high average delay caused by HGVs seeking to exit the Precinct and the level of background growth on Elizabeth Drive. This level of service is not considered satisfactory, indicating that the intersection is in need of an upgrade.
Table 13: SIDRA Outputs for Elizabeth Drive / Resource Recovery Precinct Access Road Intersection, Without Development
Year
AM Peak PM Peak
Peak hour
volume DoS
Average Delay
LOS Peak hour
volume DoS
Average Delay
LOS
2014 1,030 0.403 225.9 F 1,121 0.440 31.5 C
2016 1,125 0.440 351.5 F 1,265 0.495 40.9 C
2026 1,373 0.729 2,118.6 F 1,514 0.573 68.6 E DoS – Degree of Saturation, LoS – Level of Service
Source: AECOM, 2013.
3.4.3 Elizabeth Drive / Mamre Road
As shown in Table 14, The Northern Road / Mamre Road roundabout continues to operate satisfactorily with minimal delays and queuing through to 2026. The intersection operates at LoS B in all assessment years during both the AM peak and PM peak hour periods.

AECOM Expansion of the Advanced Waste Treatment Facility, Kemps Creek Resource Recovery Precinct - Traffic Impact Assessment
15 January 2013
25
Table 14: SIDRA Outputs for Elizabeth Drive / Mamre Road Roundabout, Without Development
Year
AM Peak PM Peak
Peak hour
volume DoS
Average Delay
LOS Peak hour
volume DoS
Average Delay
LOS
2014 2,234 0.439 20.1 B 2,541 0.691 20.8 B
2016 2,415 0.522 20.5 B 2,607 0.713 20.8 B
2026 3,158 0.797 26.2 B 3,291 0.894 24.7 B DoS – Degree of Saturation, LoS – Level of Service
Source: AECOM, 2013.
Overall, the analysis indicates that the Northern Road / Elizabeth Drive and Mamre Road / Elizabeth Drive roundabouts would continue to operate effectively through 2026 with their existing layouts and the expected forecast background traffic growth.
The Elizabeth Drive / Resource Recovery Precinct Access Road intersection is currently operating at LoS F in the AM peak period and continues to do so with background traffic growth. In the PM Peak the intersection continues to operate satisfactorily in 2014 and 2016 (LoS C), however in 2026 background traffic growth causes the intersection to operate at LoS E.
Through consultation with the RMS, it was acknowledged that the Elizabeth Drive / Resource Recovery Precinct Access Road intersection requires an upgrade to cater for any additional background traffic growth. However, the RMS currently has no plan and funding to upgrade this intersection. Therefore, SITA has considered appropriate upgrades at this intersection that can be undertaken as part of the expansion of the Facility, to improve the safety and capacity of this intersection. This is further discussed in Section 4.2.4.

AECOM Expansion of the Advanced Waste Treatment Facility, Kemps Creek Resource Recovery Precinct - Traffic Impact Assessment
15 January 2013
26
This page has been left blank intentionally.

AECOM Expansion of the Advanced Waste Treatment Facility, Kemps Creek Resource Recovery Precinct - Traffic Impact Assessment
15 January 2013
27
4.0 Impacts of Development SITA is seeking approval for the expansion of the existing SAWT facility (the Development) at its Kemps Creek Resource Recovery Precinct in Western Sydney. The Development would comprise an expansion of the existing SAWT facility only and would not change operations at the adjacent Elizabeth Drive landfill. The existing SAWT facility currently accepts up to 134,400 tonnes per annum (tpa) of MSW materials, SSO materials and biosolids. This is sourced from a number of councils including Penrith, Campbelltown, Camden, Wollondilly, Wingecarribee, Liverpool, Randwick City and City of Sydney.
The Development would result in the following key changes:
- An increase in capacity of the facility to 220,000 tpa of input waste
- Modifications to the current layout of operations at the Site and enhancements to the management of waste material (including a fully enclosed composting process) and process water
- An increase in operating hours for indoor operations from 7 am to 11 pm Monday through Saturday to 24 hours per day, seven days a week.
The Development would be entirely contained within areas which are already occupied by the existing SAWT facility and landfill.
It is anticipated that construction of the Development would commence in mid-2013 and would be completed in mid-2015. The Development would not immediately accept 220,000 tpa of waste but would accept a gradual increase in the volume of waste material over time as new contracts become available. It is anticipated that the Development would be at full operational capacity sometime in 2016.
This section assesses the impacts of the proposed Development on the surrounding transport network during both the construction and operational phases. This includes:
- An evaluation of potential impacts associated with construction and operation of the proposed development
- Consideration of measures to mitigate traffic impacts, if required.
4.1 Construction Phase
4.1.1 Hours and Workforce
Construction would be carried out over a period of approximately two years, commencing in June 2013 and being completed in May 2015. The construction peak is proposed to occur in 2014, thus 2014 has been assessed for construction traffic impacts. The majority of staff-related light vehicle movements would be travelling in and out of the Site at the start and end of the construction hours, respectively. Construction hours would be from 6 am to 4 pm on weekdays and between 7 am and 4 pm on Saturday.
The on-site construction workforce would vary, peaking at a maximum of approximately 130 workers per day. Construction activities would generate a maximum of 60 heavy vehicle movements in a typical day during the peak construction periods. As these vehicle movements would occur during off peak traffic hours, these vehicles are unlikely to impact upon the road network or the operation of the Resource Recovery Precinct Access Road. Note that during construction there would also be a total of 10 deliveries using oversize vehicles. These additional 20 movements would occur throughout the entire construction period.
4.1.2 Traffic Generation
The construction stage of the Development is likely to result in a short term and temporary spike in traffic flows of construction machinery, private vehicles and delivery vehicles.
Operation of the existing SAWT facility and landfill would continue during the construction phase, therefore construction vehicle impacts have been considered together with existing base (operational) traffic.
The construction workforce would include up to 130 people at its peak. With limited public transport provision in the surrounding area; it is assumed that all staff would travel in their own private vehicle to the Site. Given the work hours described in Section 4.1.1, workers would be arriving/departing the Site outside the peak hour periods.
The peak construction period in terms of the operation of heavy equipment would occur between February and May 2014 when buildings would be constructed. The peak construction period in terms of the construction

AECOM Expansion of the Advanced Waste Treatment Facility, Kemps Creek Resource Recovery Precinct - Traffic Impact Assessment
15 January 2013
28
workforce would occur between June 2014 and January 2015 when plant and services would be installed and internal fit out and miscellaneous works conducted.
4.1.3 Light Vehicle Traffic and Parking Requirements
Table 15 outlines the light vehicle movements associated with the construction personnel estimated for various phases during the construction of the facility. A ratio of 1.0 construction personnel per vehicle has been assumed for car parking requirements and vehicles travelling to and from Site.
Table 15: Light Vehicle Movements and Parking Requirements
Activity Timeframe Vehicles per Day and Minimum Car Parking
Requirements
Vehicle Movements
Site establishment and establishment of temporary facilities
November 2013 to December2013
15 30
Earthworks and civil Infrastructure January 2014 to February2014 50 100
Construction of building foundations and buildings
February 2014 to May 2014 85 170
Plant and services installation June 2014 to January 2015
130 260 Internal fit out and miscellaneous works
December 2014 to January 2015
Commissioning February 2015 to May 2015 58 116
Construction personnel would require on-site parking for the duration of the construction program, with the greatest number of parking spaces required between June 2014 and January 2015 during plant and services installation and internal fit out. During the peak, it is estimated that up to approximately 260 light vehicle movements would be generated in a typical day, with the need for up to 130 on-site parking spaces.
It should be noted that existing operations would continue during the construction period, and as such, car parking for the construction workforce would be provided in addition to those existing car parks allocated to operational personnel.
4.1.4 Heavy Vehicle Traffic
Construction heavy vehicles would also be generated on a regular basis to support construction activities in relation to the expanded facility. Table 16 summarises the expected amount of heavy vehicles to be generated during the whole construction period. At peak times for heavy vehicle movements between February and March 2014, it is expected there would be up to 30 heavy vehicles (60 heavy vehicle movements) generated per day. Information provided by SITA indicates that the majority of these heavy vehicles are most likely to originate from the east.
Table 16: Construction Heavy Vehicle Movements (Daily)
Activity Time Period Type of Vehicle
Deliveries
Maximum Number of Heavy Vehicles per
Day
Average deliveries for the whole of construction period
November 2013 to June 2015
Couriers, steel and equipment except concrete trucks
20
Additional vehicles during peak construction period
February 2014 to March 2014
Concrete Trucks 10

AECOM Expansion of the Advanced Waste Treatment Facility, Kemps Creek Resource Recovery Precinct - Traffic Impact Assessment
15 January 2013
29
4.1.5 Traffic Distribution
It is assumed that 80 percent of construction traffic would travel to and from the east and the remaining 20 percent would do so from the west.
4.1.6 Impact of Construction Traffic
The 2014 intersection assessment has been undertaken during a morning period of 5 to 6 am and an afternoon period of 4 to 5 pm to reflect the time when the majority of construction vehicle movements are expected to enter and leave the Site. Any safety implications of the construction activities to the operation of the intersections will be reviewed and addressed as part of the preparation of a Construction Traffic Management Plan (CTMP).
Table 17 summarises the 2014 intersection performance of the three assessed intersections during 2014. This assessment is undertaken using the existing intersection layout.
Table 17: SIDRA Results for 2014 Construction Traffic
Intersection
AM Peak (5 to 6 am) PM Peak (4 to 5 pm)
Peak hour
volume DoS
Average Delay
LOS Peak hour
volume DoS
Average Delay
LOS
The Northern Road / Elizabeth Drive
874 0.149 10.9 B 1,774 0.276 17.0 B
Elizabeth Drive / Resource Recovery Precinct Access Road
676 0.218 2.4 A 1,154 0.440 29.0 C
Elizabeth Drive / Mamre Road
1,303 0.208 10.4 B 2,541 0.691 20.8 B
DoS – Degree of Saturation, LoS – Level of Service
Source: AECOM, 2013.
Due to the lower level of traffic along Elizabeth Drive between 5 to 6 am and 4 to 5 pm (compared to the traffic peak hours of 7:30 to 8:30 am and 4:45 to 5:45 pm) the Elizabeth Drive / Resource Recovery Precinct Access Road intersection is expected to operate at LoS A between 5 to 6 am The results also demonstrate that additional light vehicle traffic associated with the construction staff does not impact the level of service during the PM Peak period, with the level of service being the same as that in 2014 without development. The level of service of The Northern Road / Elizabeth Drive and Mamre Road / Elizabeth Drive intersections would be the same in 2014 with or without development. It can therefore be concluded that there is minimal impact to the road network as a result of construction traffic generated by the proposed Development.
Although no intersection upgrade is required for the construction stage , SITAs preference is to undertake part of the proposed operational upgrade discussed in Section 4.2.4 (widening on the Resource Recovery Precinct Access Road) prior to construction in 2013 in order to enhance the operability of the intersection during construction.
4.1.7 Construction Traffic Management Plan (CTMP)
Although construction traffic is expected to have negligible impacts on the surrounding road network during the peak construction period, it is however, recommended that a CTMP be put in place during construction in order to ensure the safest possible management of construction traffic. The CTMP would detail vehicle routes, the number of construction vehicles, hours of operation, access arrangements and traffic control measures. Traffic control measures in the CTMP would include, but not be limited to:
- Implementing appropriate signage to warn road users of the presence of construction vehicles
- Ensuring heavy vehicles meet the Australian Road Rules and RMS standards so that road safety is not compromised
- Proper safety signs to be placed in the event of a road closure
- Notifying the local community by means of public notifications and advertisements on the progress of the works and the scheduling of works so as to inform the local community of any additional vehicles added to the local road network
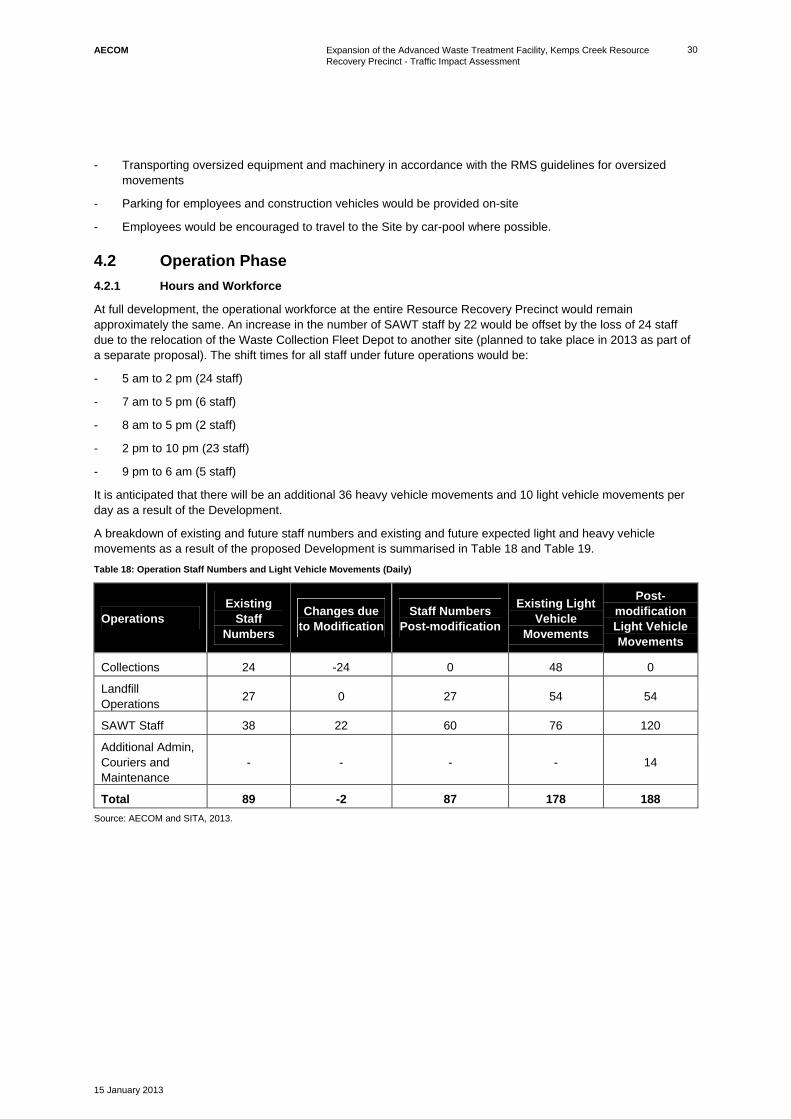
AECOM Expansion of the Advanced Waste Treatment Facility, Kemps Creek Resource Recovery Precinct - Traffic Impact Assessment
15 January 2013
30
- Transporting oversized equipment and machinery in accordance with the RMS guidelines for oversized movements
- Parking for employees and construction vehicles would be provided on-site
- Employees would be encouraged to travel to the Site by car-pool where possible.
4.2 Operation Phase
4.2.1 Hours and Workforce
At full development, the operational workforce at the entire Resource Recovery Precinct would remain approximately the same. An increase in the number of SAWT staff by 22 would be offset by the loss of 24 staff due to the relocation of the Waste Collection Fleet Depot to another site (planned to take place in 2013 as part of a separate proposal). The shift times for all staff under future operations would be:
- 5 am to 2 pm (24 staff)
- 7 am to 5 pm (6 staff)
- 8 am to 5 pm (2 staff)
- 2 pm to 10 pm (23 staff)
- 9 pm to 6 am (5 staff)
It is anticipated that there will be an additional 36 heavy vehicle movements and 10 light vehicle movements per day as a result of the Development.
A breakdown of existing and future staff numbers and existing and future expected light and heavy vehicle movements as a result of the proposed Development is summarised in Table 18 and Table 19.
Table 18: Operation Staff Numbers and Light Vehicle Movements (Daily)
Operations Existing
Staff Numbers
Changes due to Modification
Staff Numbers Post-modification
Existing Light Vehicle
Movements
Post-modification Light Vehicle Movements
Collections 24 -24 0 48 0
Landfill Operations
27 0 27 54 54
SAWT Staff 38 22 60 76 120
Additional Admin, Couriers and Maintenance
- - - - 14
Total 89 -2 87 178 188
Source: AECOM and SITA, 2013.

AECOM Expansion of the Advanced Waste Treatment Facility, Kemps Creek Resource Recovery Precinct - Traffic Impact Assessment
15 January 2013
31
Table 19: Operational Heavy Vehicle Movements (Daily)
Waste Type Existing Daily Vehicles
Additional Daily Vehicles
Total Daily Vehicles
Existing Daily Movements
Additional Daily Vehicles
Total Daily Vehicles
Collections 19 -19 0 38 -38 0
Council delivered tonnes
51 17
82 102 34
164 Transfer trailer tonnes 14 28
Recovered Steel/Aluminium
4 1
10 8 2
20 Compost Sales 5 10
Total 74 18 92 148 36 184
Source: AECOM and SITA, 2013.
During operations, there would be an increase of both light and heavy vehicles due to the expansion of the SAWT facility. At the peak of operation of the expanded facility, it is anticipated that an additional 46 vehicle movements per day would be generated, of which 10 are light vehicle movements generated by operation staff and 36 are heavy vehicle movements generated by waste deliveries and compost sales.
4.2.2 Traffic Distribution
Based on existing vehicle movements, information provided by SITA, and forecast traffic growth, it is assumed that 80 percent of the operation traffic would travel to and from the east and the remaining 20 percent from the west. Note that the majority of urban development and population of Sydney is located to the east of the Site.
4.2.3 Future Year Traffic Volumes (With Development)
The traffic forecasts for 2016 and 2026 at each of the three assessed intersections, with the addition of operation vehicles associated with the proposed Development are provided in Table 20, Table 21 and Table 22.
Table 20: Traffic Volume on Elizabeth Drive / The Northern Road (With Development)
Year Elizabeth Drive / The Northern Road – AM Peak (7-8am)
Elizabeth Drive / The Northern Road – PM Peak (4:45-5:45pm)
2016
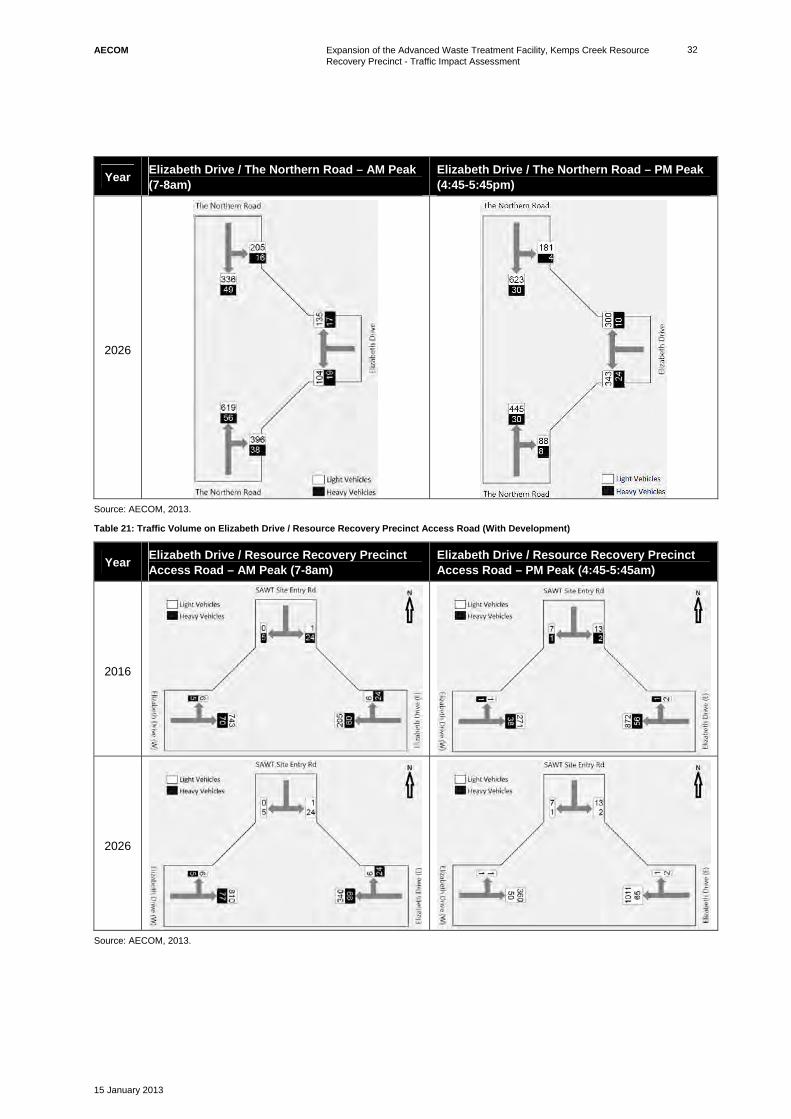
AECOM Expansion of the Advanced Waste Treatment Facility, Kemps Creek Resource Recovery Precinct - Traffic Impact Assessment
15 January 2013
32
Year Elizabeth Drive / The Northern Road – AM Peak (7-8am)
Elizabeth Drive / The Northern Road – PM Peak (4:45-5:45pm)
2026
Source: AECOM, 2013.
Table 21: Traffic Volume on Elizabeth Drive / Resource Recovery Precinct Access Road (With Development)
Year Elizabeth Drive / Resource Recovery Precinct Access Road – AM Peak (7-8am)
Elizabeth Drive / Resource Recovery Precinct Access Road – PM Peak (4:45-5:45am)
2016
2026
Source: AECOM, 2013.

AECOM Expansion of the Advanced Waste Treatment Facility, Kemps Creek Resource Recovery Precinct - Traffic Impact Assessment
15 January 2013
33
Table 22: Traffic Volume on Elizabeth Drive / Mamre Road Roundabout (With Development)
Year Elizabeth Drive / Mamre Road – AM Peak (7-8am)
Elizabeth Drive / The Mamre Road – PM Peak (4:45-5:45pm)
2016
2026
Source: AECOM, 2013.
4.2.4 Intersection Upgrade
The assessment has shown that there are currently delays experienced at the Elizabeth Drive/Resource Recovery Precinct Access Road intersection during the AM peak hour. Background traffic growth on Elizabeth Drive necessitates that this intersection is upgraded to improve capacity and safety for vehicles exiting the Resource Recovery Precinct Access Road.
Consultation was undertaken with RMS on 24 September 2012 to discuss the most appropriate intersection treatment for the intersection between the Resource Recovery Precinct Access Road and Elizabeth Drive. RMS expressed a preference for the intersection to be upgraded to a ‘seagull’ intersection and agreed that the traffic assessment ought to assume that the intersection is upgraded to a ‘seagull’ intersection. Thus, for future years during the full operation of the expanded facility, this report has assessed this intersection with the upgrade as described in further detail below.
The improvements include dedicated left and right turn lanes for vehicles exiting the site and any associated widening of the kerb. This would reduce queuing exiting the site, particularly for left (eastbound) turning vehicles. In addition, a seagull intersection will be provided to include a waiting bay for westbound vehicles exiting the Resource Recovery Precinct. This would be located in the median of the major intersection arm. In this instance a waiting bay would be provided in the median of Elizabeth Drive immediately to the west of the Resource Recovery Precinct Access Road. Westbound vehicles leaving the Site turn into this bay before merging with other westbound traffic. Although the detailed design is yet to be undertaken, this type of intersection layout ensures that vehicles do not need to cross two lanes of traffic in a single manoeuver, improving the operation of the intersection. A concept of the proposed upgrade is shown in Figure 6.
The upgrades described above are not required until full operation of The Development. Nevertheless, SITAs preference is to undertake part of this upgrade (widening on the Resource Recovery Precinct Access Road) prior to construction in 2013 in order to enhance the operability of the intersection during construction. The RMS will be consulted prior to this work going ahead in order to ensure compatibility with the proposed ‘seagull’ upgrade required at full operation of the Development.

AECOM Expansion of the Advanced Waste Treatment Facility, Kemps Creek Resource Recovery Precinct - Traffic Impact Assessment
15 January 2013
34
This page has been left blank intentionally.

ELIZABETH DRIVE
ELIZABETH DRIVE
ELIZABETH DRIVE
ELIZABETH DRIVE
Access
Ro
ad
Access
Ro
ad
0 20 40m
INTERSECTION XXXXINTERSECTION XXXX
FIGURE xFIGURE x
Environmental Impact Statement - Upgrade of Kemps Creek AWT Facility
Kemps Creek, New South Wales
Environmental Impact Statement - Upgrade of Kemps Creek AWT Facility
Kemps Creek, New South Wales
G:\
Pro
jects
\602
Pro
jects
\60250100
Kem
ps
Cre
ek\F
IGU
RE
S\E
IS\T
raffic
and
Tra
nsport
\Fx
Land
Zonin
g04
09
2012
TO
G:\
Pro
jects
\602
Pro
jects
\60250100
Kem
ps
Cre
ek\F
IGU
RE
S\E
IS\T
raffic
and
Tra
nsport
\Fx
Land
Zonin
g04
09
2012
TO
MODIFIED ELIZABETH DRIVE AND ACCESS ROAD INTERSECTIONSITE
FIGURE 6
G:\
Pro
jects
\602
Pro
jects
\60250100
Kem
ps
Cre
ek\F
IGU
RE
S\E
IS\T
raffic
and
Tra
nsport
\60250100
F6
Modifie
dE
lizabeth
Drive
and
Site
Acce
ss
Roa
dIn
ters
ectio
n15
01
2013
TO
Rev
B
Environmental Impact Statement - Expansion of the Advanced Waste Treatment Facility,
Kemps Creek Resource Recovery Precinct
CONCEPT ONLY. SUBJECT TO DETAILED DESIGN

AECOM Expansion of the Advanced Waste Treatment Facility, Kemps Creek Resource Recovery Precinct - Traffic Impact Assessment
15 January 2013
36
This page has been left blank intentionally.

AECOM Expansion of the Advanced Waste Treatment Facility, Kemps Creek Resource Recovery Precinct - Traffic Impact Assessment
15 January 2013
37
4.2.5 Impacts of Operation Traffic
In order to assess the impact of future Site traffic, the additional traffic movements were applied to the 2016 and 2026 traffic flows and assessed with SIDRA 5.1. This assessment includes an upgraded Elizabeth Drive/Resource Recovery Precinct Access Road Intersection as discussed in Section 4.2.4. This includes dedicated left and right turn lanes exiting the Resource Recovery Precinct Access Road and a waiting lane (‘seagull’ intersection) on Elizabeth Drive for westbound vehicles exiting the Site. The following tables show the traffic impacts of operations traffic at full development for the future years 2016 and 2026 (including background traffic growth).
Table 23: SIDRA Results for Elizabeth Drive / The Northern Road, With Development
AM Peak (7-8am) PM Peak (4:45-5:45pm)
Peak hour
volume DoS
Average Delay
LOS Peak hour
volume DoS
Average Delay
LOS
2016 1,710 0.309 16.8 B 1,877 0.288 17.2 B
2026 1,990 0.409 16.8 B 2,086 0.338 17.6 B DoS – Degree of Saturation, LoS – Level of Service
Source: AECOM, 2013.
Table 24: SIDRA Results for Elizabeth Drive / Resource Recovery Precinct Access Road, With Development
Year
AM Peak (7-8am) PM Peak (4:45-5:45pm)
Peak hour
volume DoS
Average Delay
LOS Peak hour
volume DoS
Average Delay
LOS
2016 1,125 0.440 57.1 E 1,265 0.495 16.8 B
2026 1,397 0.481 68.7 E 1,514 0.573 22.9 B DoS – Degree of Saturation, LoS – Level of Service
Source: AECOM, 2013.
Table 25: SIDRA Results for Elizabeth Drive / Mamre Road Roundabout, With Development
Year
AM Peak (7-8am) PM Peak (4:45-5:45pm)
Peak hour
volume DoS
Average Delay
LOS Peak hour
volume DoS
Average Delay
LOS
2016 2,415 0.522 20.5 B 2,607 0.713 20.8 B
2026 3,158 0.797 26.2 B 3,291 0.894 24.7 B DoS – Degree of Saturation, LoS – Level of Service
Source: AECOM, 2013.
The future year assessment for 2016 and 2026 shows that the Elizabeth Drive / Resource Recovery Precinct Access Road intersection operates at LoS E during the AM Peak (with the proposed upgrade). This is considered acceptable given the improvement on the existing situation and the likelihood of further upgrades to this intersection as part of the overall strategy for the upgrade of Elizabeth Drive post-2021. In 2026 it can be expected that HGVs departing the Site may still experience some delays when turning to the west despite the upgrade (due to the increasing eastbound traffic volume on Elizabeth Drive during the AM Peak). Other movements at the intersection show improved performance, particularly as eastbound vehicles departing the Site are no longer required to wait behind westbound vehicles. This allows for the safer and more efficient operation of the intersection. The Elizabeth Drive / The Northern Road and Elizabeth Drive / Mamre Road intersections continue to operate at LoS B during both the AM and PM peak hours in 2016 and 2026.

AECOM Expansion of the Advanced Waste Treatment Facility, Kemps Creek Resource Recovery Precinct - Traffic Impact Assessment
15 January 2013
38
This page has been left blank intentionally.

AECOM Expansion of the Advanced Waste Treatment Facility, Kemps Creek Resource Recovery Precinct - Traffic Impact Assessment
15 January 2013
39
5.0 Conclusions
5.1 Trip Generation
Construction activities would generate a maximum of 30 heavy vehicles per day or approximately 60 vehicle movements per day. As these vehicle movements would occur during off peak traffic hours, these vehicles are unlikely to impact upon the road network. During operations, there would be an increase of both light and heavy vehicles. At the peak of operation of the expanded facility, it is anticipated that an additional 46 vehicle movements per day would be generated, of which 10 are light vehicle movements generated by operations staff and 36 are heavy vehicle movements generated by waste deliveries and compost sales.
The construction and additional operations traffic would access the site via the existing Resource Recovery Precinct Access Road at Elizabeth Drive (between Lawson Road and Martin Road).
5.2 Project Construction Impacts
The 2014 intersection assessment has been undertaken during a morning period of 5-6am and an afternoon period of 4-5pm to reflect the time when the majority of construction vehicle movements are expected to enter and leave the Site. This includes both heavy vehicles and up to 130 construction light vehicles (staff). Due to the lower traffic volumes on Elizabeth Drive at these times, the Elizabeth Drive / Resource Recovery Precinct Access Road intersection is expected to operate at LoS A during the 5-6am construction peak. The results demonstrate that additional light vehicle traffic associated with the construction staff does not impact the level of service, with LoS being comparable to 2014 without the Development. The LoS of The Northern Road / Elizabeth Drive and Mamre Road / Elizabeth Drive intersections would be the same in 2014 with or without development. It can therefore be concluded that there is minimal impact to the road network as a result of construction traffic generated by the proposed Development. Having construction vehicles arrive and depart the Resource Recovery Precinct outside peak traffic hours ensures minimal conflict between construction vehicles and Elizabeth Drive traffic, improving the safety of intersections and the local road network. Nevertheless, to ensure the safe operation of construction vehicles it is recommended that a CTMP be put in place to manage the traffic generated during construction.
Although no intersection upgrade is required for the construction stage , SITAs preference is to undertake part of the proposed operational upgrade discussed below in Section 5.1.3 (widening on the Resource Recovery Precinct Access Road) prior to construction in 2013 in order to enhance the operability of the intersection during construction. The RMS will be consulted prior to this work going ahead in order to ensure compatibility with the proposed ‘seagull’ intersection upgrade required at full operation of the Development.
5.3 Project Operation Impacts
Background traffic growth on Elizabeth Drive is the major traffic issue for The Development, with high volumes of additional traffic forecast to use the road in future years. This growth necessitates that the Elizabeth Drive/Resource Recovery Precinct Access Road intersection is upgraded prior to full operations commencing at The Development in order to improve the safe and efficient operation of the intersection. Recommended improvements include a dedicated left and right turn lane for vehicles exiting the site and any associated widening of the kerb. This would reduce queuing exiting the site, particularly for left (east) turning vehicles. The intersection would also be upgraded to include a waiting bay for westbound vehicles exiting the Site located in the median of Elizabeth Drive immediately to the west of the Resource Recovery Precinct Access Road (a ‘seagull’ intersection). Westbound vehicles leaving the site turn into this bay before merging with other westbound traffic. This layout improves the operation of the intersection from both a traffic and safety perspective and has been agreed to in principle with the RMS.
With the intersection upgrade, the future year assessment for 2016 and 2026 shows that the Elizabeth Drive / Resource Recovery Precinct Access Road intersection operates at LoS E during the AM Peak. This is a considerable improvement on the existing situation and the likelihood of further upgrades to this intersection as part of the overall strategy for the upgrade of Elizabeth Drive post-2021. In 2026 HGVs departing the site may still experience some delays when turning to the west. Other movements at the intersection, namely eastbound traffic exiting the site, show improved performance as they are no longer required to wait behind westbound vehicles. The Elizabeth Drive / The Northern Road and Elizabeth Drive / Mamre Road intersections continue to operate at LoS B during both the AM and PM peak hours in 2016 and 2026 and therefore are not impacted by the proposed Development.


SITA Australia Pty Ltd
10 January 2013
Expansion of the Advanced Waste Treatment Facility, Kemps Creek Resource Recovery Precinct Water Balance and Leachate Management Strategy
AECOM Expansion of the Advanced Waste Treatment Facility, Kemps Creek Resource Recovery Precinct - Water Balance and Leachate Management Strategy
10 January 2013
Expansion of the Advanced Waste Treatment Facility, Kemps Creek Resource Recovery Precinct Water Balance and Leachate Management Strategy
Prepared for
SITA Australia Pty Ltd
Prepared by
AECOM Australia Pty Ltd Level 21, 420 George Street, Sydney NSW 2000, PO Box Q410, QVB Post Office NSW 1230, Australia T +61 2 8934 0000 F +61 2 8934 0001 www.aecom.com ABN 20 093 846 925
10 January 2013
60250100
AECOM in Australia and New Zealand is certified to the latest version of ISO9001 and ISO14001.
© AECOM Australia Pty Ltd (AECOM). All rights reserved.
AECOM has prepared this document for the sole use of the Client and for a specific purpose, each as expressly stated in the document. No other party should rely on this document without the prior written consent of AECOM. AECOM undertakes no duty, nor accepts any responsibility, to any third party who may rely upon or use this document. This document has been prepared based on the Client’s description of its requirements and AECOM’s experience, having regard to assumptions that AECOM can reasonably be expected to make in accordance with sound professional principles. AECOM may also have relied upon information provided by the Client and other third parties to prepare this document, some of which may not have been verified. Subject to the above conditions, this document may be transmitted, reproduced or disseminated only in its entirety.

AECOM Expansion of the Advanced Waste Treatment Facility, Kemps Creek Resource Recovery Precinct - Water Balance and Leachate Management Strategy
10 January 2013
Quality Information
Document Expansion of the Advanced Waste Treatment Facility, Kemps Creek Resource Recovery Precinct- Water Balance and Leachate Management Strategy
Ref 60250100
Date 10 January 2013
Prepared by Clare Williams
Reviewed by David Kennewell / Sukru Ozger
Revision History
Revision Revision Date
Details Authorised
Name/Position Signature
A 10-Sep-2012 Draft For Review Scott Jeffries – Associate Director
[original signed]
B 14-Dec-2012 Final Draft Scott Jeffries – Associate Director
[original signed]
C 10-Jan-2013 Final Lee Sellick Associate Director

AECOM Expansion of the Advanced Waste Treatment Facility, Kemps Creek Resource Recovery Precinct - Water Balance and Leachate Management Strategy
10 January 2013
Table of Contents Executive Summary i 1.0 Introduction 1
1.1 Overview 1 1.2 Objectives 1
2.0 Proposed Water Management System 3 2.1 Water System Process Flow Diagram 3 2.2 Overview of Water Storages 3 2.3 Leachate Pond Storage Capacity Assumptions 3 2.4 Description of Water Storages 4
2.4.1 Admin Harvested Stormwater Pond 4 2.4.2 Composting Hall Harvested Stormwater Pond 4 2.4.3 Central Leachate Tank 4 2.4.4 MSW Compost Leachate Pond 5 2.4.5 SSO Compost Leachate Pond 5 2.4.6 Overflow from SSO Compost Leachate Pond to the MSW Compost Leachate
Pond 5 3.0 Water Balance Model 6
3.1 General 6 3.2 Key Modelling Assumptions 6 3.3 Rainfall and Evaporation Data 6 3.4 Runoff Coefficients 7
3.4.1 Runoff Coefficient for Stored Compost 8 3.5 A Review of the Impact of Variable MSW Compost Storage Volumes on Leachate
Generation 8 4.0 Leachate Management Options 9
4.1 General 9 4.1.1 Leachate Tankering Assumptions 9
4.2 Base Assessment Case 9 4.3 Supplementary Mitigation Option – Increasing the Size of the SSO Compost Leachate
Pond 10 4.4 Comparison with existing SAWT Environment Protection Licence Conditions 12
5.0 Water Reuse and Potable Water Demand 15 5.1 General 15 5.2 Reuse of Stormwater 15 5.3 Reuse of Leachate 15 5.4 Potable Water Demand 16
6.0 Recommendations 17 References 19
Appendix A Appendix A - Modelled Time History Graphs of MSW Compost A Leachate Pond A

AECOM Expansion of the Advanced Waste Treatment Facility, Kemps Creek Resource Recovery Precinct - Water Balance and Leachate Management Strategy
10 January 2013
i
Executive Summary SITA commissioned AECOM Australia to assess the potential impacts of the proposed Kemps Creek SAWT facility upgrade on the leachate management strategy at the site.
Leachate would be generated by a number of mechanisms at the site, including water entrained in waste arriving at the site, rainfall landing on compost windrows, odour scrubbing processes and facility cleaning.
To understand the behaviour of the proposed system, a continuous time-series water balance modelling approach was used. A water balance accounts for all water inputs and outputs into a defined system. By evaluating the difference over time between system inputs and outputs, the water balance model was used to estimate the volume of water generated at the site requiring management. The methodology used daily historic rainfall and evaporation records (123 years) together with system inputs provided by SITA of the proposed storage volumes for the leachate management ponds, catchment areas for each pond, and predicted potable water demands.
Outputs from the water balance are typically reported in a statistical manner. A key reporting metric adopted for this study is the average annual number of 25kL tanker trucks required to capture and transport excess leachate off-site for treatment. This metric has been used to compare the effectiveness of design options that mitigate leachate generation.
The SITA Kemps Creek site has an existing Environment Protection Licence (EPL) that allows discharge of stormwater subject to water both quality and quantity criteria. Where leachate does not meet the EPL criteria, it would be collected and tankered off-site for treatment prior to discharge. It is proposed the existing EPL quality and quantity criteria are maintained with the facility upgrade, and facility operations improved to reduce unnecessary tankering where possible.
For the purposes of this assessment, it has been assumed that all leachate would contain pollutant levels above the EPL criteria. This “worst case” assumption was adopted because it is not practical to quantitatively predict potential leachate quality, as pollutant generation will be highly variable depending on varying waste composition, rainfall, and dilution within pond storages. There will, however, be occasions where site discharge of excess leachate is in compliance with the existing EPL discharge criteria.
The proposed design was assessed as the Base Assessment Case. This assessment provides a quantitative understanding of the potential sources of leachate generation, and the base case number of tanker trucks per year required to prevent leachate overflow. Under the Base Assessment Case an average of 115 tanker trucks would be required per year, spread over an average of 11 days per year.
An additional leachate management method was also assessed. This assessment considered an increase to the working volume of the Source Separated Organics (SSO) Compost Leachate Pond. A range of volumes were assessed from 1,000kL to 10,000kL. For a working volume of 4,000k, an average of 68 tanker trucks would be required per year. For comparison, the Base Case Assessment assumed a pond working volume of 1,300kL.
It is recommended that tankering be adopted as the preferred leachate management measure, in accordance with the Base Assessment Case. To optimise site leachate management, expanding the volume of SSO Compost Leachate Pond could be adopted during the detailed design phase, subject to technical and financial feasibility.
As part of the Base Assessment Case, stormwater and leachate collected in pond and tank storages would be reused on-site where possible. Stormwater would be reused in the composting systems, biofilters, for some on-site amenities, and for cleaning and maintenance purposes. Leachate would be reused for irrigation of compost on storage pads and to supply the indoor composting processes. The reuse of stormwater and leachate on-site reduces the potable water demand from 88.7 ML/year to 5.0 ML/year on average, when compared to using potable water only.

AECOM Expansion of the Advanced Waste Treatment Facility, Kemps Creek Resource Recovery Precinct - Water Balance and Leachate Management Strategy
10 January 2013
ii
This page has been left blank intentionally.

AECOM Expansion of the Advanced Waste Treatment Facility, Kemps Creek Resource Recovery Precinct - Water Balance and Leachate Management Strategy
10 January 2013
1
1.0 Introduction
1.1 Overview
The upgrade of the Kemps Creek SAWT Facility would include modifications that alter the site’s current leachate management processes.
This report assesses how the modified facility would manage leachate in order to prevent discharge to the environment.
For the purpose of this report, leachate is defined as any liquid that has come in contact with waste or compost, or their by-products, regardless of the quality of the water which might remain high.
In practice, there are four processes that would generate significant leachate quantities at the SAWT Facility.
- The process of converting waste to compost generates leachate from water entrained in the waste when it arrives on-site, as well as water added to the waste during composting.
- Waste is processed in an enclosed building to contain odour. In order to treat this odorous air prior to discharge to the atmosphere, the air is passed through a biofiltration unit. This unit requires water to keep the filter media moist. During the process pollutants dissolve from the air into the water, producing leachate.
- When compost is stored outside it is both exposed to rainfall and irrigated to maintain moisture content and suppress dust. All runoff from compost would be collected in a leachate management system.
- Cleaning and maintenance of facilities.
As a result of these differing generation mechanisms, the water quality of leachate is highly variable. It is assumed that all leachate generated on-site is not of a suitable quality to discharge to receiving waters untreated.
The volume of leachate generated can be highly variable. Volumes can be significantly influenced by rainfall rates, evaporation, waste composition, waste process volumes and a number of less significant factors, for example the shape of the stocked compost windrows and the duration finished compost is stored on-site.
This report describes the use of time series modelling to assess the effects of variability in rainfall and evaporation on leachate generation. This historical analysis is used to assess the likely effectiveness of the proposed leachate management strategy.
1.2 Objectives
A water balance model was created of the site’s water management system to simulate its operation. A 123-year historical rainfall record has been used as an input, in order that an understanding could be developed of the expected future system behaviour.
Specifically, the objectives of the site water balance model were to:
- Assess the likelihood of the proposed leachate collection ponds exceeding capacity
- Identify leachate management options
- Assess probable potable water savings through on-site re-use of collected stormwater
- Assess the likely shortfall of collected stormwater with respect to on-site water demands.


Composting Hall Harvested
Stormwater Pond
Composting System and
Biofilters
Composting Hall and Biofilters
Biofilters Demand
Leachate
Compost Processing Demand
Leachate
Biofilters DemandExcess Leachate Removal by Tanker Truck
Facility Amenities
SSO Pad
MSW Pad
Inter-site Clean Stormwater Back-up
Inter-site Clean Stormwater Back-up
Transfer to meet Composting Hall supply shortfall
(equal third preference)
Transfer to meet Composting Hall supply shortfall
(equal third preference)
Admin Harvested Stormwater Pond
Evaporation
Leachate Pond
Key
Process
Water Process Flow Diagram - Base Assessment CaseUpgrade of the Kemps Creek Advanced Waste Treatment Facility
Irrigation
Proposed SSO Compost
Leachate Pond
Leachate Runoff
Overflow in case of leachate management failure
LeachateRunoff
Pavements and Buildings
Catchment
Central Leachate Tank (500kL)
Controlled spill of the SSO Leachate Pond to the
MSW Leachate Pond
Transfer to meet Composting Hall supply shortfall (first preference)
Irrigation
Batched Piles
Rainfall
MSW CompostLeachate Pond
Transfer to meet Composting Hall supply shortfall (second preference)
Pavements and Buildings
Catchment
Compost
Compost
Pump
glennanj
Text Box
Figure 1: Site Water Management Process Flow Diagram

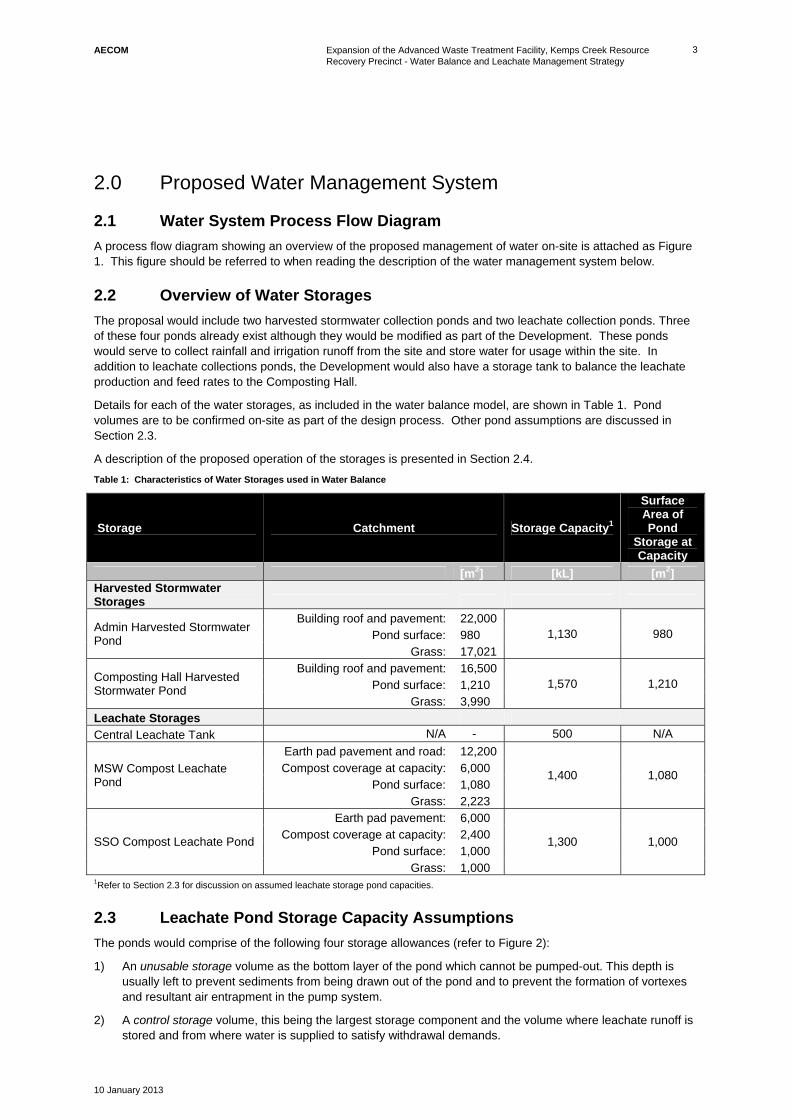
AECOM Expansion of the Advanced Waste Treatment Facility, Kemps Creek Resource Recovery Precinct - Water Balance and Leachate Management Strategy
10 January 2013
3
2.0 Proposed Water Management System
2.1 Water System Process Flow Diagram
A process flow diagram showing an overview of the proposed management of water on-site is attached as Figure 1. This figure should be referred to when reading the description of the water management system below.
2.2 Overview of Water Storages
The proposal would include two harvested stormwater collection ponds and two leachate collection ponds. Three of these four ponds already exist although they would be modified as part of the Development. These ponds would serve to collect rainfall and irrigation runoff from the site and store water for usage within the site. In addition to leachate collections ponds, the Development would also have a storage tank to balance the leachate production and feed rates to the Composting Hall.
Details for each of the water storages, as included in the water balance model, are shown in Table 1. Pond volumes are to be confirmed on-site as part of the design process. Other pond assumptions are discussed in Section 2.3.
A description of the proposed operation of the storages is presented in Section 2.4.
Table 1: Characteristics of Water Storages used in Water Balance
Storage Catchment Storage Capacity1
Surface Area of Pond
Storage at Capacity
[m2] [kL] [m2] Harvested Stormwater Storages
Admin Harvested Stormwater Pond
Building roof and pavement: 22,000 1,130 980 Pond surface: 980
Grass: 17,021
Composting Hall Harvested Stormwater Pond
Building roof and pavement: 16,500 1,570 1,210 Pond surface: 1,210
Grass: 3,990 Leachate Storages Central Leachate Tank N/A - 500 N/A
MSW Compost Leachate Pond
Earth pad pavement and road: 12,200
1,400 1,080 Compost coverage at capacity: 6,000
Pond surface: 1,080 Grass: 2,223
SSO Compost Leachate Pond
Earth pad pavement: 6,000
1,300 1,000 Compost coverage at capacity: 2,400
Pond surface: 1,000 Grass: 1,000
1Refer to Section 2.3 for discussion on assumed leachate storage pond capacities.
2.3 Leachate Pond Storage Capacity Assumptions
The ponds would comprise of the following four storage allowances (refer to Figure 2):
1) An unusable storage volume as the bottom layer of the pond which cannot be pumped-out. This depth is usually left to prevent sediments from being drawn out of the pond and to prevent the formation of vortexes and resultant air entrapment in the pump system.
2) A control storage volume, this being the largest storage component and the volume where leachate runoff is stored and from where water is supplied to satisfy withdrawal demands.
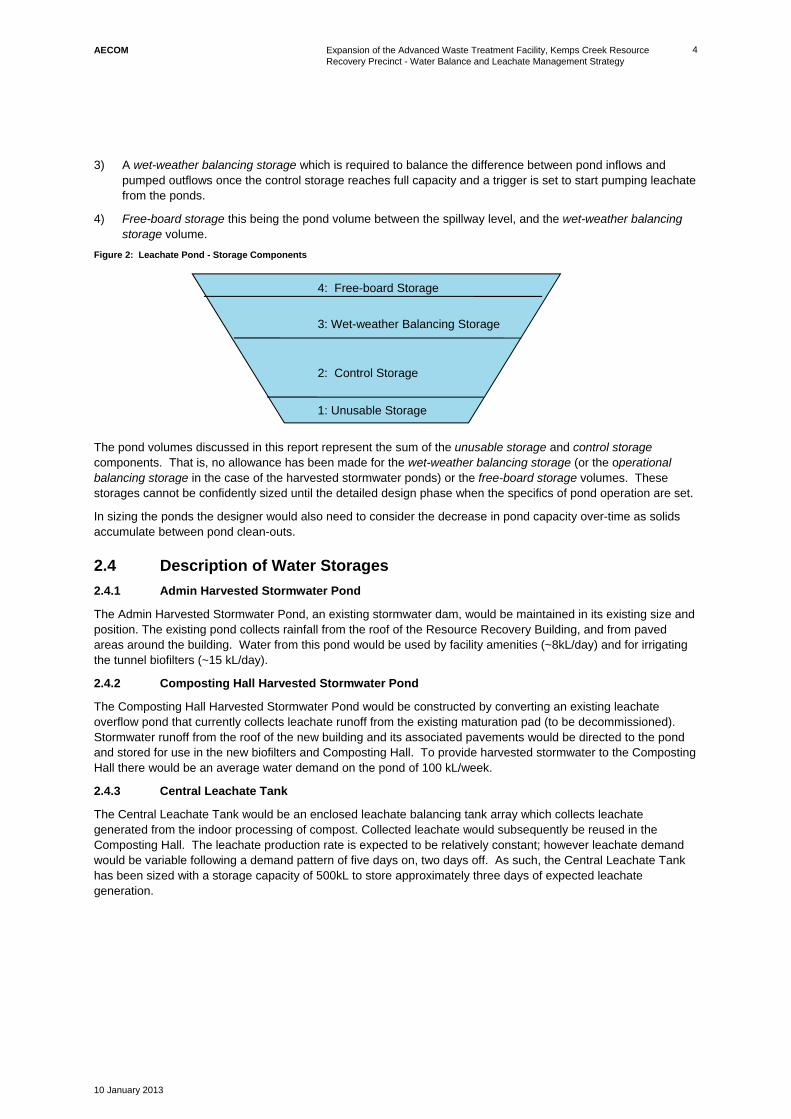
AECOM Expansion of the Advanced Waste Treatment Facility, Kemps Creek Resource Recovery Precinct - Water Balance and Leachate Management Strategy
10 January 2013
4
3) A wet-weather balancing storage which is required to balance the difference between pond inflows and pumped outflows once the control storage reaches full capacity and a trigger is set to start pumping leachate from the ponds.
4) Free-board storage this being the pond volume between the spillway level, and the wet-weather balancing storage volume.
Figure 2: Leachate Pond - Storage Components
The pond volumes discussed in this report represent the sum of the unusable storage and control storage components. That is, no allowance has been made for the wet-weather balancing storage (or the operational balancing storage in the case of the harvested stormwater ponds) or the free-board storage volumes. These storages cannot be confidently sized until the detailed design phase when the specifics of pond operation are set.
In sizing the ponds the designer would also need to consider the decrease in pond capacity over-time as solids accumulate between pond clean-outs.
2.4 Description of Water Storages
2.4.1 Admin Harvested Stormwater Pond
The Admin Harvested Stormwater Pond, an existing stormwater dam, would be maintained in its existing size and position. The existing pond collects rainfall from the roof of the Resource Recovery Building, and from paved areas around the building. Water from this pond would be used by facility amenities (~8kL/day) and for irrigating the tunnel biofilters (~15 kL/day).
2.4.2 Composting Hall Harvested Stormwater Pond
The Composting Hall Harvested Stormwater Pond would be constructed by converting an existing leachate overflow pond that currently collects leachate runoff from the existing maturation pad (to be decommissioned). Stormwater runoff from the roof of the new building and its associated pavements would be directed to the pond and stored for use in the new biofilters and Composting Hall. To provide harvested stormwater to the Composting Hall there would be an average water demand on the pond of 100 kL/week.
2.4.3 Central Leachate Tank
The Central Leachate Tank would be an enclosed leachate balancing tank array which collects leachate generated from the indoor processing of compost. Collected leachate would subsequently be reused in the Composting Hall. The leachate production rate is expected to be relatively constant; however leachate demand would be variable following a demand pattern of five days on, two days off. As such, the Central Leachate Tank has been sized with a storage capacity of 500kL to store approximately three days of expected leachate generation.
1: Unusable Storage
3: Wet-weather Balancing Storage
2: Control Storage
4: Free-board Storage

AECOM Expansion of the Advanced Waste Treatment Facility, Kemps Creek Resource Recovery Precinct - Water Balance and Leachate Management Strategy
10 January 2013
5
The Central Leachate Tank would be the source from which water is drawn for waste processing. As such it would require regular supplementation with water from elsewhere on-site. The sources for make-up water (in order of preference) would be:
1) MSW Compost Leachate Pond
2) SSO Compost Leachate Pond
3) Transfer from harvested stormwater ponds within the Development
4) Transfer from harvested stormwater ponds within the landfill
5) Potable water.
The MSW Compost Leachate Pond would be preferred over the SSO Compost Leachate Pond as it is expected that the quality of runoff from the MSW Compost Leachate Pond would be poorer than from the SSO Compost Leachate Pond. By preferentially transferring from this pond the risk of spilling the poorer quality leachate is reduced.
2.4.4 MSW Compost Leachate Pond
The MSW Compost Storage Pad is a demand balancing pad used to store finished MSW compost before it is provided to market. The MSW Compost Leachate Pond would collect leachate runoff from the MSW Compost Storage Pad. The pond is an existing leachate collection pond however its proposed catchment area would be increased to capture runoff from an extension to the pad area.
The volume of matured MSW compost stored on the pad would vary throughout the year depending on market demand. Demand for the finished compost is expected to vary seasonally, with peak product demand, and therefore minimal storage volumes, likely to occur in the summer months.
This pond would be the first preference for water make-up to the Central Leachate Tank, and would also supply water to irrigate finished MSW compost in storage at an estimated average rate of 10 kL/week. Water from the pond would be preferentially pumped to the Composting Hall before being used for irrigation. If there is insufficient water to irrigate the stockpiled MSW compost product then water would be transferred to the pond from elsewhere on-site.
2.4.5 SSO Compost Leachate Pond
The SSO Compost Leachate Pond is a proposed leachate collection pond which would collect leachate draining from the proposed SSO composting pad. This pond would be used to provide water to the Composting Hall if there is a demand at the facility which cannot be met by supply from the MSW Compost Leachate Pond. The pond also provides water to irrigate the batched piles of SSO compost at an estimated average rate of 20 kL/week. Water from this pond would be preferentially allocated to the Composting Hall before use for compost irrigation. If there is insufficient water available for compost irrigation then water would be transferred to the pond from elsewhere on-site.
SITA considers the leachate from the SSO Compost Leachate Pond of acceptable quality for mixing with the MSW Compost Leachate Pond. It is therefore proposed that the SSO Compost Leachate Pond would be pumped to the MSW Compost Leachate Pond, as discussed below.
2.4.6 Overflow from SSO Compost Leachate Pond to the MSW Compost Leachate Pond
It is proposed that the SSO Compost Leachate Pond would be pumped to the MSW Compost Leachate Pond. This is complementary to the proposed operating rule that make-up water to the Composting Hall would preferentially be supplied from the MSW Compost Leachate Pond, before being supplied from the SSO Compost Leachate Pond. As a consequence, pond withdrawal rates are consistently higher from the MSW Compost Leachate Pond when compared to the SSO Compost Leachate Pond. As such the MSW Compost Leachate Pond would often have a greater available capacity to receive leachate than the SSO Compost Leachate Pond.
Pumping the SSO Compost Leachate Pond to the MSW Compost Leachate Pond would prevent the scenario of the SSO Compost Leachate Pond requiring leachate tankering whilst the MSW Compost Leachate Pond has spare capacity.

AECOM Expansion of the Advanced Waste Treatment Facility, Kemps Creek Resource Recovery Precinct - Water Balance and Leachate Management Strategy
10 January 2013
6
3.0 Water Balance Model
3.1 General
A model of the site water management system was created in GoldSim, a dynamic simulation software program. GoldSim was used to develop an understanding of the behaviour of the water management system by allowing its operation to be simulated over a period of 123 years using synthetic rainfall and evaporation data.
3.2 Key Modelling Assumptions
To build and run the water balance model, various assumptions regarding the management of on-site water have been made:
- An initial starting volume of 50% for all water storages.
- Compost storage on MSW Compost Storage Pad at 50% of full capacity (i.e. 3,000m2 of 12,200 m2 total pad area).
- Compost storage on SSO Pad at full capacity (i.e. 2,400m2 of 6,000 m2 total pad area).
- No allowance was made for inaccessible (dead) storage volumes in the harvested stormwater ponds.
- Assumptions regarding leachate pond volumes are summarised in Section 4.1.1.
- Assumed no pond water loss due to seepage.
3.3 Rainfall and Evaporation Data
A rainfall and evaporation data time series spanning from 01/01/1889 to 25/06/2012 was used in the water balance model. This data was sourced from the SILO database. Data was extracted from this database for the coordinates of the site at a Latitude/Longitude of 33 51'S 150 45'E.
The SILO database contains about 120 years of continuous weather records for Australia and is a useful source of input data for time-series climatic modelling. The records in the SILO database are mainly based on observed data, however the observed values have been adjusted to account for spatial averaging between gauges where required, and interpolated values inserted where there are gaps in recorded observations.
The average annual rainfall depth for the site from the SILO rainfall record was 755 mm. The average monthly rainfall and evaporation values are presented in Figure 3 and Figure 4 below.
Figure 3: Average Monthly Rainfall Depths from SILO Time Series Data
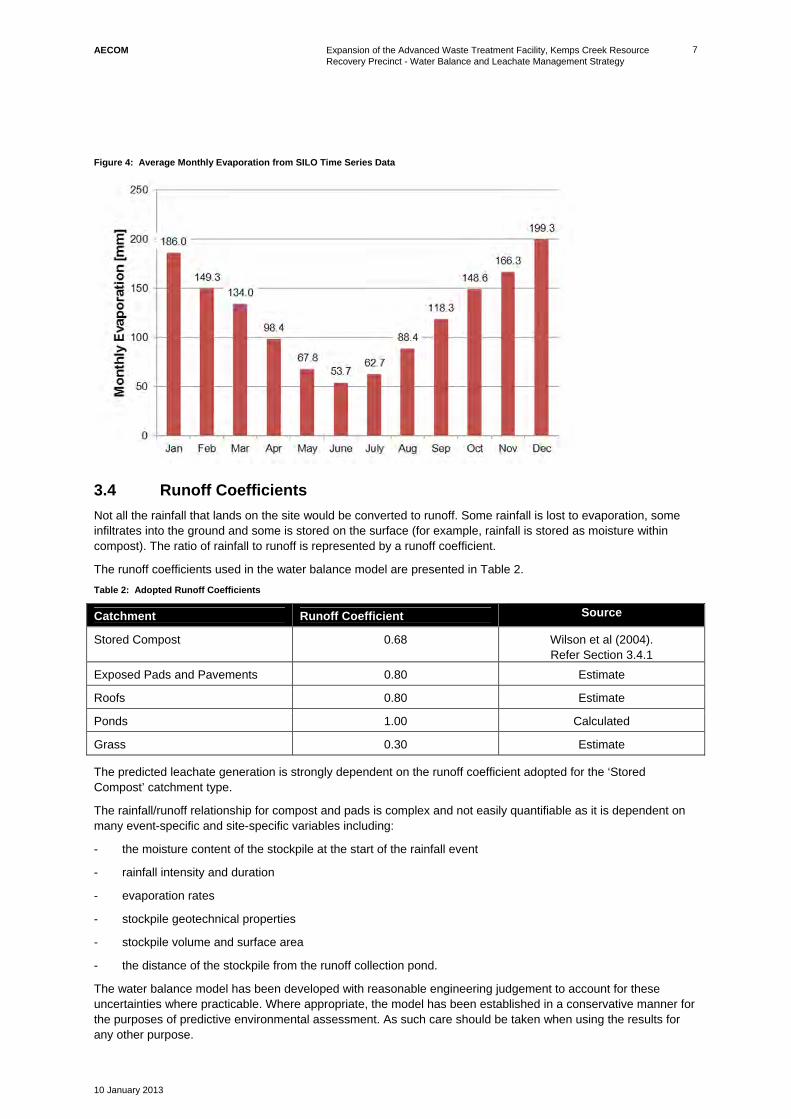
AECOM Expansion of the Advanced Waste Treatment Facility, Kemps Creek Resource Recovery Precinct - Water Balance and Leachate Management Strategy
10 January 2013
7
Figure 4: Average Monthly Evaporation from SILO Time Series Data
3.4 Runoff Coefficients
Not all the rainfall that lands on the site would be converted to runoff. Some rainfall is lost to evaporation, some infiltrates into the ground and some is stored on the surface (for example, rainfall is stored as moisture within compost). The ratio of rainfall to runoff is represented by a runoff coefficient.
The runoff coefficients used in the water balance model are presented in Table 2.
Table 2: Adopted Runoff Coefficients
Catchment Runoff Coefficient Source
Stored Compost 0.68 Wilson et al (2004). Refer Section 3.4.1
Exposed Pads and Pavements 0.80 Estimate
Roofs 0.80 Estimate
Ponds 1.00 Calculated
Grass 0.30 Estimate
The predicted leachate generation is strongly dependent on the runoff coefficient adopted for the ‘Stored Compost’ catchment type.
The rainfall/runoff relationship for compost and pads is complex and not easily quantifiable as it is dependent on many event-specific and site-specific variables including:
- the moisture content of the stockpile at the start of the rainfall event
- rainfall intensity and duration
- evaporation rates
- stockpile geotechnical properties
- stockpile volume and surface area
- the distance of the stockpile from the runoff collection pond.
The water balance model has been developed with reasonable engineering judgement to account for these uncertainties where practicable. Where appropriate, the model has been established in a conservative manner for the purposes of predictive environmental assessment. As such care should be taken when using the results for any other purpose.

AECOM Expansion of the Advanced Waste Treatment Facility, Kemps Creek Resource Recovery Precinct - Water Balance and Leachate Management Strategy
10 January 2013
8
3.4.1 Runoff Coefficient for Stored Compost
Leachate runoff resulting from rainfall on the compost windrows consists of two components:
- Immediate runoff from rainfall which runs directly down the side of the windrow and does not infiltrate the windrow mass, and
- Rainfall absorbed by the compost which percolates down through the mass and is later leached from the toe of the windrow.
A technical paper by Wilson B. et al (2004) found that based on lab and field experiment results, approximately 68% of incident rainfall on a saturated compost windrow would eventually runoff. As this value assumes that the compost windrow is saturated at the start of the rainfall event this can be considered an upper-bound value given similar conditions. This value would therefore be an overestimate of runoff volumes generated during 1) rainfall after dry weather, and 2) relatively minor rainfall events. However, as the MSW and SSO compost leachate ponds would be sized to accommodate rainfall from relatively major rainfall events (either a singular event of successive days of high rainfall) it is likely that an over-estimate of runoff from minor rainfall events and rainfall following dry weather would not significantly affect the pond sizing.
As the incident rainfall during minor events is low, the resultant runoff volumes would be minor even with a relatively high runoff coefficient assumed. Furthermore, if a rainfall event is significant enough to result in the risk of pond overflow, then the compost is highly likely to be in a saturated state on which occasion assuming a 68% runoff value would be reasonable.
3.5 A Review of the Impact of Variable MSW Compost Storage Volumes on Leachate Generation
Compost material would not be permanently stocked on the MSW Compost Storage Pad, but would vary according to seasonal demand for the product. It is expected that during winter, stockpiles would increase, and that during summer there would be limited stockpiling of finished product. When there is no compost in storage on the pad, the quality of the produced leachate would be higher than when compost is in storage. However this runoff would still contain remnant contamination and has been adopted as leachate in this study.
Runoff from the MSW Compost Storage Pad under both full and empty conditions was reviewed so an understanding of the impact of compost storage on the volume of generated leachate could be developed. In the review it was assumed that the pad would be irrigated at the rate of 10kL/week if there was compost on the pad, and that there would be no irrigation when no compost was stored on the pad. As the runoff coefficient for an uncovered pad area is higher than for a composted pad area (refer to Table 2), there is a rainfall rate at which more leachate is produced from an empty pad area, than a compost covered pad area. This was found to occur at rainfall depths of greater than 1mm.
There was less than 6% difference in leachate volume generated when assuming an empty MSW Compost Storage Pad versus a full pad. This difference is not deemed significant when factoring in the other uncertainties associated with the compost runoff coefficient. Therefore it is considered a reasonable assumption that the MSW Compost Storage Pad contains a constant storage volume of 50% capacity.
As discussed in Section 3.2 it has been assumed for modelling that the SSO Compost Storage Pad will operate at 100% capacity.
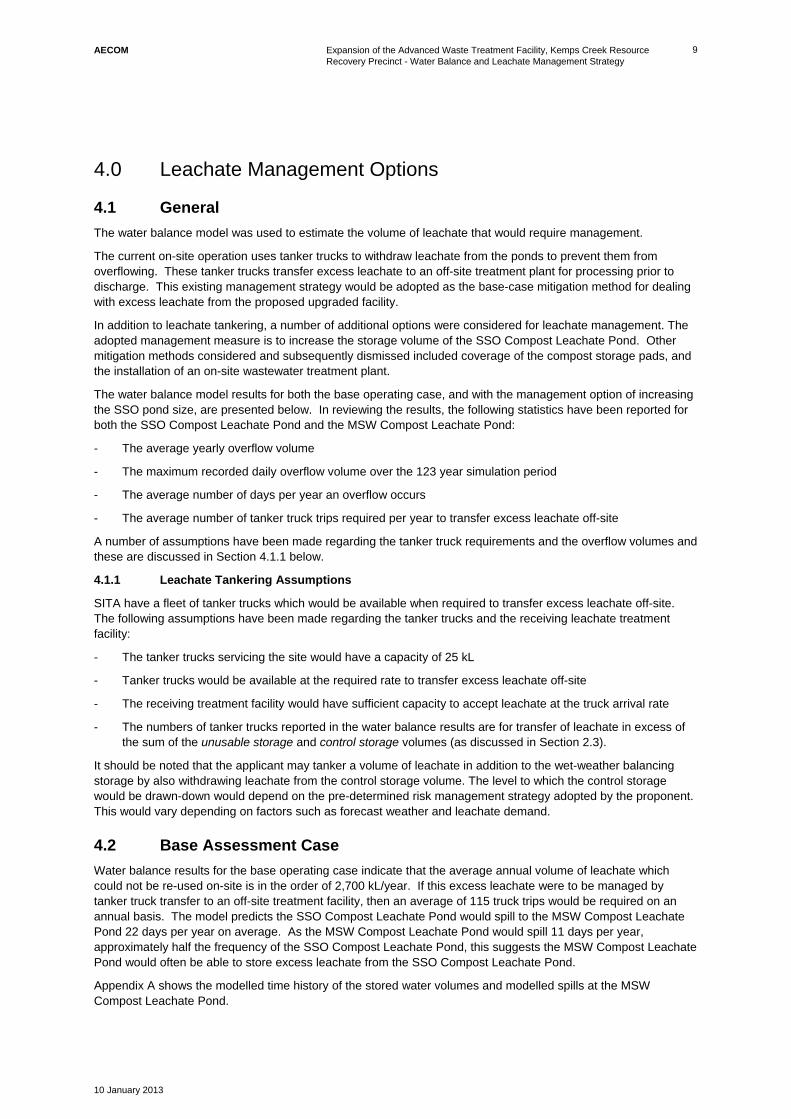
AECOM Expansion of the Advanced Waste Treatment Facility, Kemps Creek Resource Recovery Precinct - Water Balance and Leachate Management Strategy
10 January 2013
9
4.0 Leachate Management Options
4.1 General
The water balance model was used to estimate the volume of leachate that would require management.
The current on-site operation uses tanker trucks to withdraw leachate from the ponds to prevent them from overflowing. These tanker trucks transfer excess leachate to an off-site treatment plant for processing prior to discharge. This existing management strategy would be adopted as the base-case mitigation method for dealing with excess leachate from the proposed upgraded facility.
In addition to leachate tankering, a number of additional options were considered for leachate management. The adopted management measure is to increase the storage volume of the SSO Compost Leachate Pond. Other mitigation methods considered and subsequently dismissed included coverage of the compost storage pads, and the installation of an on-site wastewater treatment plant.
The water balance model results for both the base operating case, and with the management option of increasing the SSO pond size, are presented below. In reviewing the results, the following statistics have been reported for both the SSO Compost Leachate Pond and the MSW Compost Leachate Pond:
- The average yearly overflow volume
- The maximum recorded daily overflow volume over the 123 year simulation period
- The average number of days per year an overflow occurs
- The average number of tanker truck trips required per year to transfer excess leachate off-site
A number of assumptions have been made regarding the tanker truck requirements and the overflow volumes and these are discussed in Section 4.1.1 below.
4.1.1 Leachate Tankering Assumptions
SITA have a fleet of tanker trucks which would be available when required to transfer excess leachate off-site. The following assumptions have been made regarding the tanker trucks and the receiving leachate treatment facility:
- The tanker trucks servicing the site would have a capacity of 25 kL
- Tanker trucks would be available at the required rate to transfer excess leachate off-site
- The receiving treatment facility would have sufficient capacity to accept leachate at the truck arrival rate
- The numbers of tanker trucks reported in the water balance results are for transfer of leachate in excess of the sum of the unusable storage and control storage volumes (as discussed in Section 2.3).
It should be noted that the applicant may tanker a volume of leachate in addition to the wet-weather balancing storage by also withdrawing leachate from the control storage volume. The level to which the control storage would be drawn-down would depend on the pre-determined risk management strategy adopted by the proponent. This would vary depending on factors such as forecast weather and leachate demand.
4.2 Base Assessment Case
Water balance results for the base operating case indicate that the average annual volume of leachate which could not be re-used on-site is in the order of 2,700 kL/year. If this excess leachate were to be managed by tanker truck transfer to an off-site treatment facility, then an average of 115 truck trips would be required on an annual basis. The model predicts the SSO Compost Leachate Pond would spill to the MSW Compost Leachate Pond 22 days per year on average. As the MSW Compost Leachate Pond would spill 11 days per year, approximately half the frequency of the SSO Compost Leachate Pond, this suggests the MSW Compost Leachate Pond would often be able to store excess leachate from the SSO Compost Leachate Pond.
Appendix A shows the modelled time history of the stored water volumes and modelled spills at the MSW Compost Leachate Pond.

AECOM Expansion of the Advanced Waste Treatment Facility, Kemps Creek Resource Recovery Precinct - Water Balance and Leachate Management Strategy
10 January 2013
10
Table 3: Modelled Capacity Exceedance of the Leachate Ponds - Base Case
Modelling Statistics SSO Compost
Leachate Pond1 MSW Compost Leachate Pond
Average Annual Overflow [kL/year] 1,500 2,700
Maximum Daily Overflow [kL] 900 3,100
Average Number of Overflow Days [days/year] 22 11
Average Number of Tanker Truck Trips to Prevent Overflow
[truck trips/year] N/A 115
1For the Base Case scenario the SSO Compost Leachate Pond overflows to the MSW Compost Leachate Pond.
4.3 Supplementary Mitigation Option – Increasing the Size of the SSO Compost Leachate Pond
This supplementary leachate management measure investigates the effect of increasing the size of the SSO Compost Leachate Pond. Increasing the size (relative to the base case) of the SSO Compost Leachate Pond rather than the MSW Compost Leachate Pond is preferred, as the SSO Compost Leachate Pond would be a proposed pond whereas the MSW Compost Leachate Pond already exists. It is considered preferable to expand the proposed pond, as expansion of an existing leachate pond could result in disturbance of contaminated sediment and may be constrained by space.
For the base case scenario, the SSO Compost Leachate Pond was modelled to spill to the MSW Product Pond. This arrangement was adopted to maximise the use of both pond storages thereby minimising leachate overflows. The optimal direction to spill between the two ponds (to minimise leachate overflows) switches as the SSO Compost Leachate Pond is increased in volume. From modelling results, this switch was found to occur at a volume of 2,000 kL. The results below assume the ponds have been designed with the optimal spill direction for the specific SSO Compost Leachate Pond volume modelled. That is, for a proposed SSO Compost Leachate Pond volume of greater than 2,000 kL, the MSW Compost Leachate Pond would spill to the SSO Compost Leachate Pond; and for volumes 2,000 kL or less, the reverse direction is adopted.
Figure 5 below shows the effect of increasing the volume of the SSO Compost Leachate Pond on the volume of leachate spilling from the MSW Compost Leachate Pond. The water balance results for this mitigation method are presented in Table 4 below.
The results show that increasing the pond size would significantly reduce the potential for leachate overflows.
Appendix A shows the modelled time history of the stored water volumes and modelled spills at the MSW Compost Leachate Pond.

AECOM Expansion of the Advanced Waste Treatment Facility, Kemps Creek Resource Recovery Precinct - Water Balance and Leachate Management Strategy
10 January 2013
11
Figure 5: Decrease in Leachate Overflow with an Increase in the Storage Volume of the SSO Compost Leachate Pond

AECOM Expansion of the Advanced Waste Treatment Facility, Kemps Creek Resource Recovery Precinct - Water Balance and Leachate Management Strategy
10 January 2013
12
Table 4: Leachate Overflows from the MSW Compost Leachate Pond with increasing Volume of the proposed SSO Compost Leachate Pond
Scenario ID Adopted Volume for SSO Compost
Leachate Pond
Average Leachate Overflow from
Site if no Tankering
Overflow Reduction on
Base Case
Average Number of Tanker Truck Trips to Prevent
Overflow
[kL] [kL/year] [%] [trips/year]
A (Base Case) 1300 (Base Case) 2,700 - 115
B 1,600 2,600 6% 108
C 2,000 2,400 12% 101
D 2,400 2,200 20% 94
E 2,800 2,000 26% 86
F 3,200 1,800 32% 80
G 3,600 1,700 37% 73
H 4,000 1,600 41% 68
I 6,000 1,100 59% 48
J 8,000 800 70% 35
K 10,000 600 78% 26
4.4 Comparison with existing SAWT Environment Protection Licence Conditions
The SITA Kemps Creek site has an existing Environment Protection Licence (EPL) that allows discharge of stormwater subject to water both quality and quantity criteria. Where leachate does not meet the EPL criteria, it would be collected and tankered off-site for treatment prior to discharge.
The existing SAWT Environment Protection Licence (EPL) (number 12889) states “Exceedance of the discharge [quality] limits … is permitted if the discharge occurs solely as a result of rainfall at the premises greater than 91 millimetres within any consecutive period of up to 5 days.” At other times discharge from site is only permitted if the concentration of pollutant discharged is within the limits specified in the EPL licence.
For the purposes of this assessment, it has been assumed that all leachate would contain pollutant levels above the EPL criteria. This “worst case” assumption was adopted because it is not practical to quantitatively predict potential leachate quality, as pollutant generation will be highly variable depending on varying waste composition, rainfall, and dilution within pond storages.
The development was therefore assessed against the quantity discharge criteria to provide an indication of the likelihood of compliant discharge relative to non-compliant discharge. In carrying out the assessment it was assumed that there would be no off-site trucking of excess leachate. Results are presented in Table 5 below.

AECOM Expansion of the Advanced Waste Treatment Facility, Kemps Creek Resource Recovery Precinct - Water Balance and Leachate Management Strategy
10 January 2013
13
Table 5: Assessment of Yearly Average Compliance of Overflows against EPL 12889 without Tankering of Excess Leachate
Scenario Average Compliant Overflows per year
Average Non-compliant Overflows per year
Base Assessment Case 2.9 7.8
With Supplementary Mitigation Option (Increased SSO pond; results for 4,000 kL capacity)
1.5 6.0

AECOM Expansion of the Advanced Waste Treatment Facility, Kemps Creek Resource Recovery Precinct - Water Balance and Leachate Management Strategy
10 January 2013
14
This page has been left blank intentionally.
AECOM Expansion of the Advanced Waste Treatment Facility, Kemps Creek Resource Recovery Precinct - Water Balance and Leachate Management Strategy
10 January 2013
15
5.0 Water Reuse and Potable Water Demand
5.1 General
Water collected in pond and tank storages would be reused on-site where possible. This approach minimises the site’s demand for potable water and significantly reduces the volume of leachate which would otherwise require management through tankering.
5.2 Reuse of Stormwater
Table 6 below shows the water balance results for allocation of water from the Admin Harvested Stormwater Pond and Composting Hall Harvested Stormwater Pond. The table indicates that through the capture of on-site stormwater up to 15 ML of potable water is saved on average each year.
In the event that leachate from the MSW Compost Leachate Pond spills to the Admin Harvested Stormwater Pond, depending on the resultant pond water quality it may be necessary to pump all water stored in the Admin Harvested Stormwater Pond into tankers for treatment off-site. If a pump-out is necessary, reuse of water from the Admin Harvested Stormwater Pond will be temporarily suspended until this has occurred and storage levels have then recovered. This has not been accounted for in generation of the values in Table 6 however it is not expected that these discrete events will have a significant impact on the average annual volume of stormwater reused.
The modelled results below assume that there would be no transfer of water between the two on-site harvested stormwater ponds, however water can be sourced from either pond for use within the Composting Hall or Composting System biofilters. Development of a transfer scheme could help to reduce supply shortfalls and optimise pond operation by balancing differences in storage and demand between the two ponds.
Table 6: Stormwater Reuse from Harvested Stormwater Ponds
1This shortfall would be met by supplying harvested stormwater from the landfill. If this is not available potable water would be
used.
5.3 Reuse of Leachate
Collected leachate would be reused on-site for
- Irrigation of compost on pads
- Supplying the SCT composting Process.
As described in Section 2.2, all leachate collected from the indoor processing of compost would be reused. As the demand for leachate in the Composting Hall exceeds the leachate volume collected in the Composting Hall Leachate Storage Tank, make-up leachate would be sourced from the MSW Compost Leachate Pond and the SSO Compost Leachate Pond. If both of these ponds are empty, then the shortfall in demand would be supplied from the on-site harvested stormwater ponds, or from other harvested stormwater ponds in the landfill.
The average yearly volume of water captured from indoor compost processing that would be reused in the Composting Hall, along with the make-up water provided from the MSW and SSO compost leachate ponds, would be 67.6 ML. This value assumes the base case leachate management option as discussed in Section 4.2. On average 98% of the water demand at the Composting Hall can be met by reusing the leachate collected on-site.
The compost stockpiled on the MSW Compost Storage Pad and the compost maturing on the SSO Pad is supplied with irrigation water from their respective leachate collection ponds. If there is insufficient leachate
Pond Average Water
Demand from Pond (kL/day)
Average Stormwater Reused from Pond
(kL/year)
Average Water Supply Shortfall1 (kL/year)
Admin Harvested Stormwater Pond
Amenities - 8 Composting System
and Biofilters - 15
7,600 900
Composting Hall Harvested Stormwater
Pond
SCT Biofilters - 12 SCT Processing – 14
7,300 2,800

AECOM Expansion of the Advanced Waste Treatment Facility, Kemps Creek Resource Recovery Precinct - Water Balance and Leachate Management Strategy
10 January 2013
16
available in the leachate ponds, then water would be sourced from elsewhere in accordance with the priorities as described in Section 2.2. Leachate collected in the Leachate Ponds is first allocated to the Composting Hall (if required) before being made available for irrigation. The average yearly volume of leachate used for compost irrigation sourced directly from the MSW and SSO compost leachate ponds is 1.3 ML (with the base leachate management option).
5.4 Potable Water Demand
The reuse of stormwater and leachate on-site reduces the potable water demand from 88.7 ML/year to 5.0 ML/year on average, when compared to using potable water only.

AECOM Expansion of the Advanced Waste Treatment Facility, Kemps Creek Resource Recovery Precinct - Water Balance and Leachate Management Strategy
10 January 2013
17
6.0 Recommendations It is recommended that:
1. Tankering be adopted as the preferred leachate management measure, in accordance with the Base Assessment Case.
2. Subject to further investigation during the detail design phase of the project, the SSO Compost Leachate Pond could be expanded in size to assist with site leachate management. For this option consideration would need to be given to additional construction and operating costs, the time required for development of the mitigation method, site space and technical constraints, and impacts on operational flexibility.
3. The existing Environment Protection Licence (EPL 12889) discharge criteria are maintained.

AECOM Expansion of the Advanced Waste Treatment Facility, Kemps Creek Resource Recovery Precinct - Water Balance and Leachate Management Strategy
10 January 2013
18
This page has been left blank intentionally.

AECOM Expansion of the Advanced Waste Treatment Facility, Kemps Creek Resource Recovery Precinct - Water Balance and Leachate Management Strategy
10 January 2013
19
References Wilson, B, Haralampides, K, Levesque, S 2004, ‘Stormwater runoff from open windrow composting facilities’, Environ. Eng. Sci, 3: pp. 537-540

AECOM Expansion of the Advanced Waste Treatment Facility, Kemps Creek Resource Recovery Precinct - Water Balance and Leachate Management Strategy
10 January 2013
20
This page has been left blank intentionally.

AECOM Expansion of the Advanced Waste Treatment Facility, Kemps Creek Resource Recovery Precinct - Water Balance and Leachate Management Strategy
10 January 2013
A
Appendix A
Appendix A - Modelled Time History Graphs of MSW Compost Leachate Pond

0
100
200
300
400
500
600
700
800
900
1000
1100
1200
1300
1400
1500
1890 1900 1910 1920 1930 1940 1950 1960 1970 1980 1990 2000 2010
Sto
red
Le
ach
ate
Vo
lum
e (
kL)
Time
0
1000
2000
3000
4000
Po
nd
Ove
rflo
w (
kL/d
ay)
MSW Compost Leachate Pond - Base Operating Case

0
100
200
300
400
500
600
700
800
900
1000
1100
1200
1300
1890 1900 1910 1920 1930 1940 1950 1960 1970 1980 1990 2000 2010
Sto
red
Le
ach
ate
Vo
lum
e (
kL)
Time
0
100
200
300
400
500
600
700
Po
nd
Ove
rflo
w (
kL/d
ay)
SSO Compost Leachate Pond with Mitigation Method 1 (covering the MSW Compost Pad)
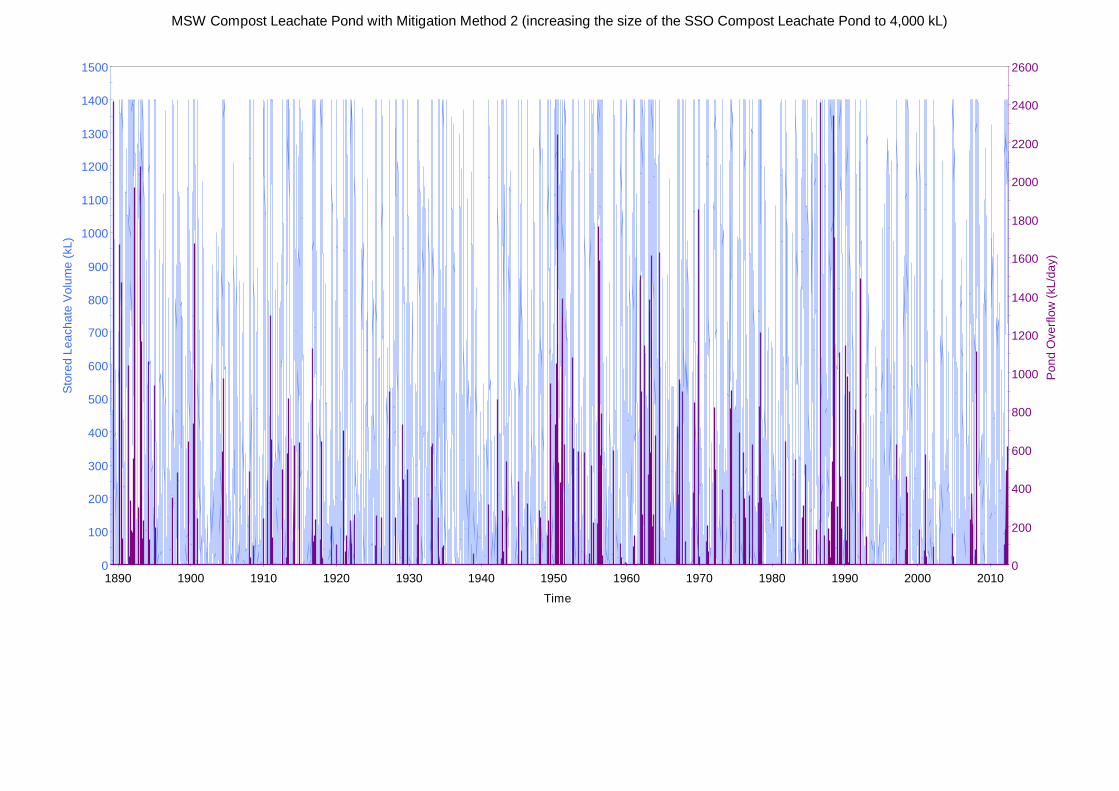
0
100
200
300
400
500
600
700
800
900
1000
1100
1200
1300
1400
1500
1890 1900 1910 1920 1930 1940 1950 1960 1970 1980 1990 2000 2010
Sto
red
Le
ach
ate
Vo
lum
e (
kL)
Time
0
200
400
600
800
1000
1200
1400
1600
1800
2000
2200
2400
2600
Po
nd
Ove
rflo
w (
kL/d
ay)
MSW Compost Leachate Pond with Mitigation Method 2 (increasing the size of the SSO Compost Leachate Pond to 4,000 kL)


AECOM
1
23 November 2012
Appendix F - Ecology
1.1 EPBC Act and TSC Act Register Search Results Table 1 Nationally Threatened Ecological Communities (EPBC Act)
Name Scientific Name EPBC Act Status Presence
Cumberland Plain Shale Woodlands and Shale- Gravel Transition Forest
Critically Endangered Community likely to occur within area
Table 2 Threatened Ecological Communities (TSC Act)
Name Scientific Name TSC Act Status Presence
Agnes Banks Woodland in the Sydney Basin Bioregion
Endangered
Blue Gum High Forest in the Sydney Basin Bioregion
Endangered
Castlereagh Scribbly Gum Woodland in the Sydney Basin Bioregion
Vulnerable
Castlereagh Swamp Woodland Community
Endangered
Cooks River/Castlereagh Ironbark Forest in the Sydney Basin Bioregion
Endangered
Cumberland Plain Woodland in the Sydney Basin Bioregion
Endangered Present within the adjoining riparian area/re-vegetation area
River-Flat Eucalypt Forest on Coastal Floodplains of the New South Wales North Coast, Sydney Basin and South East Corner Bioregions
Endangered Present within the adjoining riparian area/re-vegetation area
Shale gravel Transition Forest in the Sydney Basin Bioregion
Endangered
Shale/Sandstone Transition Forest Endangered
Southern Sydney sheltered forest on transitional sandstone soils in the Sydney Basin Bioregion
Endangered
Swamp Oak Floodplain Forest of the New South Wales North Coast, Sydney Basin and South East Corner Bioregions
Endangered
Western Sydney Dry Rainforest in the Sydney Basin Bioregion
Endangered
Table 3 Threatened Species (EPBC Act and TSC Act)
Name Scientific Name EPBC Status TSC Act Status
Presence
Birds
Regent Honeyeater Anthochaera phrygia
Endangered Species or species habitat likely to occur within area
Australasian Bittern Botaurus Endangered Species or species

AECOM
2
23 November 2012
Name Scientific Name EPBC Status TSC Act Status
Presence
poiciloptilus habitat known to occur within area
Red Goshawk Erythrotriorchis radiatus
Vulnerable Species or species habitat may occur within area
Swift Parrot Lathamus discolor Endangered Species or species habitat may occur within area
Australian Painted Snipe Rostratula australis Vulnerable Species or species habitat likely to occur within area
Black-necked Stork Ephippiorhynchus asiaticus
Endangered 1 record
Bush Stone-curlew Burhinus grallarius Endangered 2 records
Speckled Warbler Chthonicola sagittata
Vulnerable 10 records
Varied Sittella Daphoenositta chrysoptera
Vulnerable 6 records
Scarlet Robin Petroica boodang Vulnerable 1 record
Diamond Firetail Stagonopleura guttata
Vulnerable 1 record
Fish
Macquarie Perch Macquaria australasica
Endangered Species or species habitat may occur within area
Australian Grayling Prototroctes maraena
Vulnerable Species or species habitat may occur within area
Frogs
Giant Burrowing Frog Heleioporus australiacus
Vulnerable Species or species habitat likely to occur within area
Green and Golden Bell Frog Litoria aurea Vulnerable Species or species habitat may occur within area
Giant Barred Frog, Southern Barred Frog
Mixophyes iteratus Endangered Species or species habitat likely to occur within area
Mammals
Large-eared Pied Bat, Large Pied Bat
Chalinolobus dwyeri Vulnerable Species or species habitat may occur within area
Spot-tailed Quoll, Spotted-tail Quoll, Tiger Quoll (southeastern mainland population)
Dasyurus maculatus maculatus (SE mainland population)
Endangered Species or species habitat may occur within area
Brush-tailed Rock-wallaby Petrogale penicillata Vulnerable Species or species habitat may occur within area
Koala (combined populations of Queensland, New
Phascolarctos Vulnerable Species or species habitat known to

AECOM
3
23 November 2012
Name Scientific Name EPBC Status TSC Act Status
Presence
South Wales and the Australian Capital Territory)
cinereus (combined populations of Qld, NSW and the ACT)
occur within area
Long-nosed Potoroo (SE mainland)
Potorous tridactylus tridactylus
Vulnerable Species or species habitat may occur within area
New Holland Mouse Pseudomys novaehollandiae
Vulnerable Species or species habitat likely to occur within area
Grey-headed Flying-fox Pteropus poliocephalus
Vulnerable Vulnerable Foraging, feeding orrelated behaviour known to occur within area
Eastern Freetail-bat Mormopterus norfolkensis
Vulnerable 6 records
Eastern Bentwing-bat Miniopterus schreibersii oceanensis
Vulnerable 4 records
Southern Myotis Myotis macropus Vulnerable 1 record
Greater Broad-nosed Bat Scoteanax rueppellii Vulnerable 1 record
Reptiles
Broad-headed Snake Hoplocephalus bungaroides
Vulnerable Species or species habitat likely to occur within area
Gastropoda
Cumberland Plain Land Snail Meridolum corneovirens
Endangered 55 records (2004 recording within the riparian area)
Flora
Downy Wattle, Hairy Stemmed Wattle
Acacia pubescens Vulnerable Species or species habitat likely to occur within area
White-flowered Wax Plant Cynanchum elegans
Endangered Species or species habitat likely to occur within area
Small-flower Grevillea Grevillea parviflora subsp. parviflora
Vulnerable Species or species habitat likely to occur within area
Nodding Geebung Persoonia nutans Endangered Species or species habitat likely to occur within area
Pimelea curviflora var. curviflora
Vulnerable
Pimelea spicata Endangered Species or species habitat likely to occur within area
Rufous Pomaderris Pomaderris brunnea
Vulnerable Species or species habitat likely to occur within area
Sydney Plains Greenhood Pterostylis saxicola Endangered Species or species habitat may occur within area

AECOM
4
23 November 2012
Name Scientific Name EPBC Status TSC Act Status
Presence
Pultenaea parviflora Vulnerable Species or species habitat likely to occur within area
Siah's Backbone, Sia's Backbone, Isaac Wood
Streblus pendulinus Endangered Species or species habitat may occur within area
Marsdeniaviridiflora subsp. viridiflora
Endangered 12 records
Dillwynia tenuifolia Endangered 14 records
Pultenaea parviflora Endangered 81 records
Hypsela sessiliflora Endangered 7 records
Juniper-leaved Grevillea Grevillea juniperina subsp. juniperina
Vulnerable 13 records
Small-flower Grevillea Grevillea parviflora subsp. parviflora
Vulnerable 10 records
Nodding Geebung Persoonia nutans Endangered 3 records
Spiked Rice-flower Pimelea spicata Endangered 1 record
Table 4 Migratory Species
Name Scientific Name EPBC Status Presence
Migratory Marine Birds
Fork-tailed Swift Apus pacificus Species or species habitat may occur within area
Great Egret, White Egret Ardea alba Species or species habitat may occur within area
Cattle Egret Ardea ibis Species or species habitat may occur within area
Migratory Terrestrial Species
White-bellied Sea-Eagle Haliaeetus leucogaster
Species or species habitat likely to occur within area
White-throated Needletail Hirundapus caudacutus
Species or species habitat known to occur within area
Rainbow Bee-eater Merops ornatus Species or species habitat may occur within area
Black-faced Monarch Monarcha melanopsis
Species or species habitat known to occur within area
Satin Flycatcher Myiagra cyanoleuca Breeding likely to occur within area
Rufous Fantail Rhipidura rufifrons Breeding likely to occur within area
Regent Honeyeater Xanthomyza phrygia
Endangered Species or species habitat likely to occur within area
Migratory Wetland Species
Great Egret, White Egret Ardea alba Species or species habitat may occur within area
Cattle Egret Ardea ibis Species or species habitat may occur within area

AECOM
5
23 November 2012
Name Scientific Name EPBC Status Presence
Latham's Snipe, Japanese Snipe
Gallinago hardwickii Species or species habitat may occur within area
Painted Snipe Rostratula benghalensis (sensulato)
Vulnerable Species or species habitat likely to occur within area


SITA Australia Pty Ltd
16 January 2013
Expansion of the Advanced Waste Treatment Facility, Kemps Creek Resource Recovery Precinct Greenhouse Gas Assessment

AECOM Expansion of the Advanced Waste Treatment Facility, Kemps Creek Resource Recovery Precinct - Greenhouse Gas Assessment
16 January 2013
Expansion of the Advanced Waste Treatment Facility, Kemps Creek Resource Recovery Precinct
Prepared for
SITA Australia Pty Ltd
Prepared by
AECOM Australia Pty Ltd Level 21, 420 George Street, Sydney NSW 2000, PO Box Q410, QVB Post Office NSW 1230, Australia T +61 2 8934 0000 F +61 2 8934 0001 www.aecom.com ABN 20 093 846 925
16 January 2013
60250100
AECOM in Australia and New Zealand is certified to the latest version of ISO9001 and ISO14001.
© AECOM Australia Pty Ltd (AECOM).All rights reserved.
AECOM has prepared this document for the sole use of the Client and for a specific purpose, each as expressly stated in the document. No other party should rely on this document without the prior written consent of AECOM. AECOM undertakes no duty, nor accepts any responsibility, to any third party who may rely upon or use this document. This document has been prepared based on the Client’s description of its requirements and AECOM’s experience, having regard to assumptions that AECOM can reasonably be expected to make in accordance with sound professional principles. AECOM may also have relied upon information provided by the Client and other third parties to prepare this document, some of which may not have been verified. Subject to the above conditions, this document may be transmitted, reproduced or disseminated only in its entirety.

Expansion of the Advanced Waste Treatment Facility, Kemps Creek Resource Recovery Precinct - Greenhouse Gas Assessment
16 January 2013
Quality Information
Document Expansion of the Advanced Waste Treatment Facility, Kemps Creek Resource Recovery Precinct – Greenhouse Gas Assessment
Ref 60250100
Date 16 January 2013
Prepared by Nicole Hansen
Reviewed by Sharmin Lubonski
Revision History
Revision Revision Date Details Authorised
Name/Position Signature
A 14-Sept-2012 Draft Issue Sharmin Lubonski Associate Director- Sustainability & Climate Change
B 21-Sept-2012 Draft Issue to SITA For Review
Sharmin Lubonski Associate Director- Sustainability & Climate Change
C 30-Nov-2012 Final Draft Sharmin Lubonski Associate Director- Sustainability & Climate Change
D 16-Jan-2013 Final Sharmin Lubonski Associate Director

Expansion of the Advanced Waste Treatment Facility, Kemps Creek Resource Recovery Precinct - Greenhouse Gas Assessment
16 January 2013
Table of Contents Executive Summary i 1.0 Introduction 1
1.1 Project Description 1 1.2 Climate Change and Greenhouse Gases 1 1.3 GHG Emissions from Landfill 2 1.4 Director-General’s Requirements 3 1.5 Assessment Objective 3 1.6 Legislative and Policy Context 4
2.0 Methodology 6 2.1 Assessment Boundary 6 2.2 GHG Emission Sources and Scope 7
2.2.1 Construction 7 2.2.2 Operation 7 2.2.3 Exclusions 7
3.0 Results 10 3.1 Construction 10 3.2 Operation 10
3.2.1 Annual Emissions from the Development 10 3.2.2 Annual Business as Usual Emissions 11
3.3 Comparison with Emissions in NSW 12 3.3.1 Construction 12 3.3.2 Operation 12
4.0 Mitigation Measures 14 5.0 Energy Efficiency 16 6.0 Conclusion 18 References 20
Appendix A GHG Assessment Calculations A

Expansion of the Advanced Waste Treatment Facility, Kemps Creek Resource Recovery Precinct - Greenhouse Gas Assessment
16 January 2013
i
Executive Summary Greenhouse gas (GHG) emissions would be generated during the construction and operation of the proposed expansion of SITA’s existing SAWT facility at Kemps Creek (referred to as the Development).
During the construction stage, electricity, fuel and materials would be consumed. These activities would generate GHG emissions directly (for example, as the diesel fuel is combusted on-site by construction equipment) and indirectly (for example, the embodied GHG emissions associated with the production and transportation of construction materials).
Operation of the Development would also generate GHG emissions, for example from the consumption of diesel fuel and electricity to run the facility. As a result of the Development an additional 100,000 tonnes per annum (tpa) of waste would be transported to the facility during operation. The majority of this waste would be classified as Municipal Solid Waste (MSW), the remainder being Source Separated Organic (SSO) waste and a small proportion of biosolids. Approximately 55,000 tpa of waste would be composted (in a climate controlled and aerated environment) and approximately 55,000 tpa of waste (known as residual waste) would be sent to landfill. Landfilling of MSW and SSO generates GHG emissions as the organic matter within the waste decomposes in an anaerobic environment (an oxygen deprived environment) and produces methane and nitrous oxides. However, composting the organic fraction of the waste in a climate controlled and aerated environment prevents the generation of methane. The GHG emissions associated with composting, rather than landfilling (Business as usual) waste during the operational stage has also been estimated as part of this GHG assessment.
GHG emissions are categorised into three different Scopes (either Scope 1, 2 or 3) in accordance with the Greenhouse Gas Protocol (World Resources Institute (WRI) and World Business Council for Sustainable Development (WBCSD), 2004), Intergovernmental Panel on Climate Change (IPCC) and Australian Government GHG accounting/classification systems. Emissions are categorised into the different scopes to help delineate between direct emissions from sources that are owned or controlled by the Development, and indirect emissions that are a consequence of Development activities but occur at sources owned or controlled by another entity. The three GHG scopes are:
- Scope 1 emissions, also called “direct emissions”. These emissions are generated directly by the project, e.g. methane emissions generated as waste decomposes in an anaerobic environment.
- Scope 2 emissions, also referred to as “indirect emissions”. Scope 2 emissions are generated outside of the project’s boundaries to provide energy to the project, e.g. the use of purchased electricity from the grid.
- Scope 3 emissions, are all indirect emissions (not included in Scope 2) due to upstream or downstream activities. For example indirect upstream emissions associated with the extraction, production and transport of purchased construction materials.
It is estimated that the construction stage of the Development would generate approximately:
- 720 tonnes of carbon dioxide equivalent (tCO2-e) of direct Scope 1 GHG emissions
- 16 tCO2-e of indirect Scope 2 GHG emissions
- 2,068 tCO2-e of indirect upstream Scope 3 GHG emissions.
The total construction stage (Scope 1, 2 and 3) GHG emissions would be approximately 2,805tCO2-e. This is approximately equivalent to 0.002 percent of NSW’s annual GHG emissions (in 2009 to 2010).
GHG emissions are reported as tonnes of carbon dioxide equivalent (tCO2-e). There are numerous GHGs which contribute to the Greenhouse Effect. These gases have varying Global Warming Potential (GWP). The higher GWP, the higher the intensity of effect each tonne of that gas has on the Greenhouse Effect. GHGs are standardised by expressing them as carbon dioxide equivalent emissions (CO2-e) and carbon dioxide has a GWP of 1. From 2017 onwards the Australian Government has committed to adopt updated GWPs in accordance with updated international GHG accounting (DCCEE, 2012D). Hence from 2017 onwards the GWP of methane, for example, will increase from 21 to 25. For this reason the operational emissions have been presented below as pre- and post- 2017.

Expansion of the Advanced Waste Treatment Facility, Kemps Creek Resource Recovery Precinct - Greenhouse Gas Assessment
16 January 2013
ii
It is estimated that the annual operation of the Development pre-2017 would generate approximately:
- 10,129 tCO2-e of direct Scope 1 GHG emissions
- 3,960 tCO2-e of indirect Scope 2 GHG emissions
- 52,595 tCO2-e of indirect upstream/downstream Scope 3 GHG emissions.
The total annual operational (Scope 1, 2 and 3) GHG emissions pre-2017 would be approximately 66,684 tCO2-e. This is approximately equivalent to 0.042 percent of NSW’s annual GHG emissions (in 2009 to 2010).
It is estimated that the annual operation of the Development post-2017 would generate approximately:
- 10,811 tCO2-e of direct Scope 1 GHG emissions
- 3,960 tCO2-e of indirect Scope 2 GHG emissions
- 62,426 tCO2-e of indirect upstream/downstream Scope 3 GHG emissions.
The total annual operational (Scope 1, 2 and 3) GHG emissions post-2017 would be approximately 77,197tCO2-e. This is approximately equivalent to 0.049 percent of NSW’s annual GHG emissions (in 2009 to 2010).
Fugitive GHG emissions from the composting process represent the major source (96 percent) of the estimated annual operational Scope 1 GHG emissions (pre and post-2017). The Development would use fully automated enclosed composting methodology; however this assessment conservatively uses the Australian Government’s National Greenhouse Accounts factors for composting, which assumes that some anaerobic decomposition occurs (for example, that fugitive emissions of methane and nitrous oxide would be generated from the composting process).
MSW releases methane as the waste decomposes in a landfill over a period of decades. One tonne of MSW releases methane approximately equivalent to 1.2 tCO2-e pre-2017 and 1.4 tCO2-e post-2017 (NGA Factors, DCCEE, 2012). Therefore the lifetime methane generation potential of landfilling 100,000 tonnes of MSW is approximately equivalent to 120,000 tCO2-e pre-2017 and 142,000 tCO2-e post-2017.This would be approximately equivalent to 0.1 percent of NSW’s annual GHG emissions (in 2009 to 2010).
It should be noted that the estimated GHG emissions results provided above are an estimate only, and subject to the accuracy of the estimated construction and operational project data and all other project assumptions.
To avoid/reduce GHG emissions associated with the Development, mitigation measures are recommended which relate to:
- Minimising the quantity and/or emissions intensity of electricity used, fuel used by plant and equipment, and fuel used in the transport of materials
- Minimising the quantity and/or embodied carbon of materials used
- Avoiding the generation of fugitive GHG emissions.

Expansion of the Advanced Waste Treatment Facility, Kemps Creek Resource Recovery Precinct - Greenhouse Gas Assessment
16 January 2013
1
1.0 Introduction
1.1 Project Description
SITA is seeking approval for the expansion of the existing SAWT facility at its Kemps Creek site in western Sydney. The Development would comprise an expansion of the existing SAWT facility only and would not involve alterations to the landfill.
The existing SAWT facility site (referred to herein as the Site) currently accepts up to 120,000 tonnes per annum (tpa) of municipal solid, organic and commercial and industrial waste, plus up to 14,400 tpa of biosolids. This material is processed using a combination of mechanical separation, manual sorting, and biological composting technologies to produce approximately 41,000 tpa of compost.
The Development would result in the following key changes:
- A 100,000 tpa increase in the capacity of waste entering the facility (55 percent of this waste is expected to be unsuitable as compost and would be transported to the adjacent Kemps Creek landfill)
- Modifications to the current layout of operations on the Site and enhancements to the management of composted material, including the use of internal composting for all stages
- An increase in operating hours for indoor operations from the existing 7 am to 11 pm Monday through Saturday to 24 hours per day, seven days a week.
The Development would comprise an expansion of the existing SAWT facility, which would involve:
- An upgrade to the Resource Recovery Building plant
- A new enclosed Composting Hall
- A new Refining Building
- Reconfiguration of the existing Biofilters
- Installation of new Biofilters
- Extension of the existing Compost Pad for storage of both MSW and SSO compost material
- Associated Site infrastructure upgrades to:
Access roads and car parking
Water storage and reuse infrastructure, including stormwater ponds, leachate tanks and ponds.
It is anticipated that construction of the Development would commence in the latter half of 2013 and would be completed in early 2015. The Development would not immediately accept an additional 100,000 tpa of waste, but would accept a gradual increase in volume over time as new contracts become available. It is anticipated that the Development would commence operations in mid-2015 and ramp up to full capacity in 2016.
The Development would provide long term employment for 60 people (an additional 22 FTE positions) with a peak employment during construction expected to be approximately 130 people.
It is anticipated that during the composting process approximately 55 percent of incoming waste (by weight), originally transported to the SAWT Facility, would be removed as residual material and transferred to the adjacent Kemps Creek landfill.
Expansion of the Advanced Waste Treatment Facility, Kemps Creek Resource Recovery Precinct - Greenhouse Gas Assessment
16 January 2013
1
1.2 Climate Change and Greenhouse Gases
GHGs are emitted into the Earth’s atmosphere as a result of natural processes (for example carbon dioxide released from leaf litter decomposing on a forest floor) and human activities (for example methane released from organic waste decomposing in a capped landfill). GHGs absorb and re-radiate heat from the sun.
Since the industrial revolution there has been an increase in the amount of GHGs emitted which has increased the concentration of GHG emissions in the atmosphere. This has led to an increase in the Earth’s average temperature (surface temperature) and has caused Climate Change (or global warming) to occur.
The recent State of the Climate 2012 report (CSIRO and Bureau of Meteorology, 2012) confirms the long term warming trend over Australia’s land and oceans, showing that in Australia, each decade has been warmer than the previous since the 1950s. Other observed trends include an increase in record hot days, a decrease in record cold days, ocean warming, sea-level rise and increases in global GHG concentrations (IPCC, 2007).
The predicted future effects of climate change for the environment and for human life are numerous and varied. The main effect is an increasing global average temperature. From this flow a variety of resulting impacts, such as rising sea levels, increased extreme weather and extreme weather events.
The two key responses to climate change are:
- Climate change adaptation – that is, adapting to the physical impacts (for example more frequent and longer heatwaves) of climate change
- Climate change mitigation – that is, reducing the amount of GHG emissions emitted into the atmosphere.
GHG emissions are reported as tonnes of carbon dioxide equivalent (tCO2-e). There are numerous GHGs which contribute to the Greenhouse Effect. These gases have varying Global Warming Potential (GWP). The higher GWP, the higher the intensity of effect each tonne of that gas has on the Greenhouse Effect. GHGs are standardised by expressing them as carbon dioxide equivalent emissions (CO2-e) and carbon dioxide has a GWP of 1. For example, the GHG methane (CH4) has a GWP of 21, thus one tonne of methane has a Greenhouse Effect equivalent to 21 tonnes of carbon dioxide. However it should be noted that from 2017 onwards the Australian Government has committed to adopt a methane GWP of 25, in accordance with updated international GHG accounting (DCCEE, 2012D).
GHG emissions are categorised into three different scopes (either Scope 1, 2 or 3) in accordance with the Greenhouse Gas Protocol (World Resources Institute (WRI) and World Business Council for Sustainable Development (WBCSD), 2004), IPCC and Australian Government GHG accounting/classification systems. Emissions are categorised into the different scopes to help delineate between direct emissions from sources that are owned or controlled by the project and indirect emissions that are a consequence of project activities but occur at sources owned or controlled by another entity. The three GHG scopes, illustrated in Figure1 below, include:
- Scope 1 emissions, also called “direct emissions”. These emissions are generated directly by the project, e.g. methane emissions generated as waste decomposes in an anaerobic environment.
- Scope 2 emissions, also referred to as “indirect emissions”. Scope 2 emissions are generated outside of the project’s boundaries to provide energy to the project, e.g. the use of purchased electricity from the grid.
- Scope 3 emissions, are all indirect emissions (not included in Scope 2) due to upstream or downstream activities. For example indirect upstream emissions associated with the extraction, production and transport of purchased construction materials.

Expansion of the Advanced Waste Treatment Facility, Kemps Creek Resource Recovery Precinct - Greenhouse Gas Assessment
16 January 2013
2
Source: WRI&WBCSD, 2011
Figure 1 GHG Scopes
1.3 GHG Emissions from Landfill
Landfilling of MSW and organic waste generates GHG emissions as the organic matter within the waste decomposes in an anaerobic (oxygen deprived) environment and produces methane and nitrous oxides. In the period from 2010 to 2011 solid waste disposal to landfill generated approximately 11.3 million tCO2-e nationally (equivalent to around three percent of Australia’s national emissions) (DCCEE, 2012A).
Figure 2 illustrates the GHG emissions released over time for different waste types in a typical landfill in the NSW region. As shown, landfill waste continues to generate GHG emissions decades after initial placement in a landfill.

Expansion of the Advanced Waste Treatment Facility, Kemps Creek Resource Recovery Precinct - Greenhouse Gas Assessment
16 January 2013
3
Source: Bygrave (Clean Energy Regulator), 2012
Figure 2 GHG emissions released of over time for different waste types (NSW region)
Two strategies to reduce GHG emissions associated with solid waste disposal include:
1) Diverting the organic fraction of waste from landfills (to avoid methane generation)
2) Collecting and burning methane produced from landfills (Bygrave (Clean Energy Regulator), 2012).
1.4 Director-General’s Requirements
The Director-General’s Requirements (DGRs), dated 16 May 2012, include the following environmental assessment requirements:
The EIS must address the following specific issues: Greenhouse Gas – including: - a quantitative assessment of the potential Scope 1, 2 and 3 greenhouse gas emissions of the project, and a
qualitative assessment of the potential impacts of these emissions on the environment; and
- a detailed description of the measure that would be implemented on-site to ensure that the project is energy efficient.
1.5 Assessment Objective
The objective of this GHG Assessment is to:
1) Quantitatively assess the potential Scope 1, 2 and 3 GHG emissions of the construction and operational stages of the Development
2) Qualitatively assess the potential impacts of these emissions on the environment
3) Describe the measures which would be implemented to mitigate GHG emissions and identify measures to improve the energy efficiency of the Development.
Expansion of the Advanced Waste Treatment Facility, Kemps Creek Resource Recovery Precinct - Greenhouse Gas Assessment
16 January 2013
4
1.6 Legislative and Policy Context
An increasing number of legislative and policy mechanisms include considerations and requirements relating to reducing GHG emissions. The following provides a summary of these legislative and policy mechanisms:
- The Australian Government has committed to reducing GHG emissions and the Clean Energy Plan (Securing a clean energy future: the Australian Government's climate change plan, 2011) includes the following targets:
five percent emission reduction from 2000 levels by 2020, irrespective of commitments made by other countries
15 percent or 25 percent emission reduction from 2000 levels by 2020, if commitments are made by other countries
80 percent emission reduction from 2000 levels by 2050.
- The Carbon Price Mechanism (CPM) set out in the Clean Energy Act 2011 is the central national climate change mitigation instrument which will put a price on Scope 1 GHG emissions and provide a financial incentive for reducing GHG emissions.
- The CPM is underpinned by the National Greenhouse and Energy Reporting Act, 2007 (NGER). NGER is the national framework for reporting and disseminating information on GHG emissions, energy use and energy production associated with the activities of Australian corporations.
- the Energy Efficiency Opportunities Act 2006 (EEO Act) requires users (corporations or corporate groups) of more than 0.5 petajoules of energy per year to assess their energy use, identify cost-effective energy efficiency opportunities, and report publicly on the outcomes.
GHG emissions reduction is one of the four key objectives of the National Waste Policy. The National Waste Policy (developed in 2009 and endorsed by the Council of Australian Governments in 2010) sets the direction for Australia’s waste management from 2010 to 2020.The National Waste Policy Implementation Plan, developed in 2010, includes 16 priority strategies. Strategy 7 of the plan focuses on reducing the amount of biodegradable material disposed of to landfills1.
The NSW Waste Avoidance and Resource Recovery Strategy 2007 provides NSW’s waste management framework and includes waste avoidance and resource recovery goals and targets for the year 2014. The strategy was reviewed by the NSW Government in 2010 (Review of Waste Strategy and Policy in New South Wales). The review noted that to meet the 2014 MSW diversion from landfill disposal target of 66 percent, an additional 1.3 million to 1.7 million tonnes of resources needs to be recovered [and that] there will need to be significant improvements in source separation and/or processing of household waste (including construction of additional or enhanced AWT facilities, or new technologies including dedicated energy from waste facilities)'.
1 Strategy 7: Building on existing commitments, continue to phase down the amount of biodegradable material sent to landfill. National Waste Policy Implementation Report 2011.

Expansion of the Advanced Waste Treatment Facility, Kemps Creek Resource Recovery Precinct - Greenhouse Gas Assessment
16 January 2013
5
This page has been left blank intentionally.

Expansion of the Advanced Waste Treatment Facility, Kemps Creek Resource Recovery Precinct - Greenhouse Gas Assessment
16 January 2013
6
2.0 Methodology This GHG assessment was conducted in accordance with the general principles outlined in:
- The Greenhouse Gas Protocol: A Corporate Accounting and Reporting Standard (Revised Edition), WRI and WBCSD (2004)
- National Greenhouse Accounts (NGA) Factors, Australian Department of Climate Change and Energy Efficiency (2012).
The assessment was guided by the following generally accepted GHG accounting and reporting principles (WRI and WBCSD, 2004):
- Relevance – ensure that the GHG inventory appropriately reflects the activities and GHG emissions of the Development and contains information to support decision making by stakeholders internal and external to the Development.
- Completeness – inclusion of all relevant GHG emission sources within the chosen inventory boundary and the disclosure and justification of omissions and instances where estimates have been made with an insufficient level of quality.
- Consistency – use consistent calculation methods, data, criteria and assumptions to enable valid comparisons.
- Transparency – include clear and sufficient information on the procedures, assumptions and limitations of the GHG inventory, to enable others to understand the basis of the results and to make decisions regarding the use of GHG inventory results with reasonable confidence.
- Accuracy – reduce bias and uncertainties, as much as practical, to enable users to make decisions with reasonable confidence in the integrity of the results.
To calculate the GHG emissions associated with the construction and operational stages of the Development, the following four steps were undertaken:
1) The GHG assessment boundary was determined for the Development
2) GHGs relevant to the Development were identified
3) The emission sources were classified according to scope
4) The quantity of GHG emissions was calculated.
It should be noted that the estimated GHG emissions are based on data provided by the project design team and SITA at the 30 percent complete design stage of the Development. Hence the estimated GHG emissions results provided are an estimate only, and subject to the accuracy of the estimated operational project data / construction material / resource quantities and current project design stage and all other project assumptions.
Refer to Appendix A for further details on the GHG calculations and assumptions used in the assessment.
2.1 Assessment Boundary
The GHG assessment boundary defines the scope of GHG emissions and activities included in the GHG assessment. The principal of relevance is an important consideration in development of the boundary. This relates to selection of an appropriate boundary that considers (WRI and WBCSD, 2004):
- The intended use of the GHG assessment results
- The needs of decision makers
- The activities of the Development that generate GHG emissions
- Construction and operational boundaries relating to the Development and the activities that incur GHG emissions.
The next section summarises the GHG emissions sources which have been included within the GHG Assessment boundary.

Expansion of the Advanced Waste Treatment Facility, Kemps Creek Resource Recovery Precinct - Greenhouse Gas Assessment
16 January 2013
7
2.2 GHG Emission Sources and Scope
GHG emissions would be generated during the construction and operation of the Development. During the construction stage, electricity, fuel and materials would be consumed. These activities would generate GHG emissions directly (for example, as the diesel fuel is combusted on-site by construction equipment) and indirectly (for example, the embodied GHG emissions associated with the production and transportation of construction materials). It is assumed that no vegetation would be cleared during the construction of the Development.
Operation of the Development would also generate GHG emissions, for example from the consumption of diesel fuel and electricity to run the facility. The facility includes composting of the organic fraction of the waste in a climate controlled and aerated environment, which avoids the generation of methane and nitrous oxides.
2.2.1 Construction
The GHG emission sources which were included in the assessment boundary for the construction of the Development and the relevant GHG scope are listed in Table 1.
Table 1 GHG Assessment Boundary – Construction Stage
Emission Source Activity Emission Scope
1 2 3
Fuel used for transport purposes
Transport of construction materials to site
Fuel used Operation of construction equipment and site vehicles
Materials Use of construction materials (embodied emissions)
Electricity used Operation of site infrastructure including site offices, etc.
2.2.2 Operation
The GHG emission sources which were included in the assessment boundary for the operational stage of the Development and the relevant GHG scope are listed in Table 2.
Table 2 GHG Assessment Boundary – Operational Stage
Emission Source Activity Emission Scope
1 2 3
Fuel used for transport purposes
Transport of materials (residual waste / recovered recyclables / compost) from site
Fuel used Operation of stationary equipment
Operation of mobile equipment
Operation of site vehicles
Electricity used Operation of facility
Fugitive composting emissions
Methane and nitrous oxides generated during composting
Materials Use of materials (embodied emissions)
Residuals to landfill Emissions generated from residual waste sent to landfill
2.2.3 Exclusions
The following emission sources have been excluded from the GHG inventory boundary for the reasons stated below:
Expansion of the Advanced Waste Treatment Facility, Kemps Creek Resource Recovery Precinct - Greenhouse Gas Assessment
16 January 2013
8
- Emission sources that are less than five percent of total construction/operational emissions are considered immaterial and may be excluded from the assessment.
- Fuel used by construction and operational workers travelling to/from the site. These GHG emissions would be less than five percent of the total emissions associated with the Development (i.e. immaterial).
- Fuel used to transport waste to the site during operation. Comparable emissions would also be generated in the ‘business as usual’ scenario, for example, landfilling of the waste.
- Emissions associated with works carried out prior to the construction stage (for example, to power design offices and office supplies). These GHG emissions have already been generated and would be a small percentage of total emissions associated with the Development.
- Emissions associated with the transport, placement and decomposition of construction waste –construction waste emissions are considered negligible as this waste is inert and does not decompose in a landfill and generate GHG emissions (specifically methane).

Expansion of the Advanced Waste Treatment Facility, Kemps Creek Resource Recovery Precinct - Greenhouse Gas Assessment
16 January 2013
9
This page has been left blank intentionally.

Expansion of the Advanced Waste Treatment Facility, Kemps Creek Resource Recovery Precinct - Greenhouse Gas Assessment
16 January 2013
10
3.0 Results
3.1 Construction
It is estimated that the construction stage of the Development would generate approximately:
- 720 tCO2-e of direct Scope 1 GHG emissions
- 16 tCO2-e of indirect Scope 2 GHG emissions
- 2,068 tCO2-e of indirect upstream Scope 3 GHG emissions.
The total (Scope 1, 2 and 3) construction GHG emissions would be approximately 2,805 tCO2-e.
The estimated construction GHG emissions for each of the key emission sources are given in Table3.
Table 3 GHG Emissions for the Construction Stage of the Development
Emission Category Emission Source
Quantity Units GHG Emissions (tCO2-e)
Scope 1 Scope 2 Scope 3
Fuel use - construction equipment and site vehicles
267 kL 720 NA 55
Fuel use –transport of construction materials
16 kL NA NA 43
Electricity use – site offices 18,200 kWh NA 16 3
Material use - Aggregate 15,264 T NA NA 61
Material use - Asphalt 953 T NA NA 53
Material use - Concrete 11,002 T NA NA 984
Material use - Steel 756 T NA NA 869
Sub total 720 16 2,068
Total 2,805
Note: The estimated GHG emissions are based on data provided by the project design team and SITA at the 30 percent complete design stage of
the Development. Hence the estimated GHG emissions results provided are an estimate only, and subject to the accuracy of the estimated
construction material / resource quantities and current project design stage and all other project assumptions.
The fuel used on-site by construction equipment is the only source of direct Scope 1 GHG emissions. The use of electricity to power a site office is the only source of Scope 2 GHG emissions.
The major source of Scope 3 emissions is from the use of construction materials, with the most significant sources being the use of concrete and steel.
3.2 Operation
3.2.1 Annual Emissions from the Development
The estimated annual operational GHG emissions associated with the Development are given in Table 4. The table identifies the estimated GHG emissions pre and post 2017 as the Australian Government has committed to using updated GWPs from 1 July 2017 onwards.
Table 4 GHG Emissions (annual) for the Operation Stage of the Development
Emission Category Emission Source
Quantity Units
Annual GHG Emissions (tCO2-e)
Scope 1 Scope 2 Scope 3
Electricity use 4,500,000 kWhr/yr NA 3,960 810
Fugitive 55,000 t waste/yr Pre-2017 Post-2017 NA NA
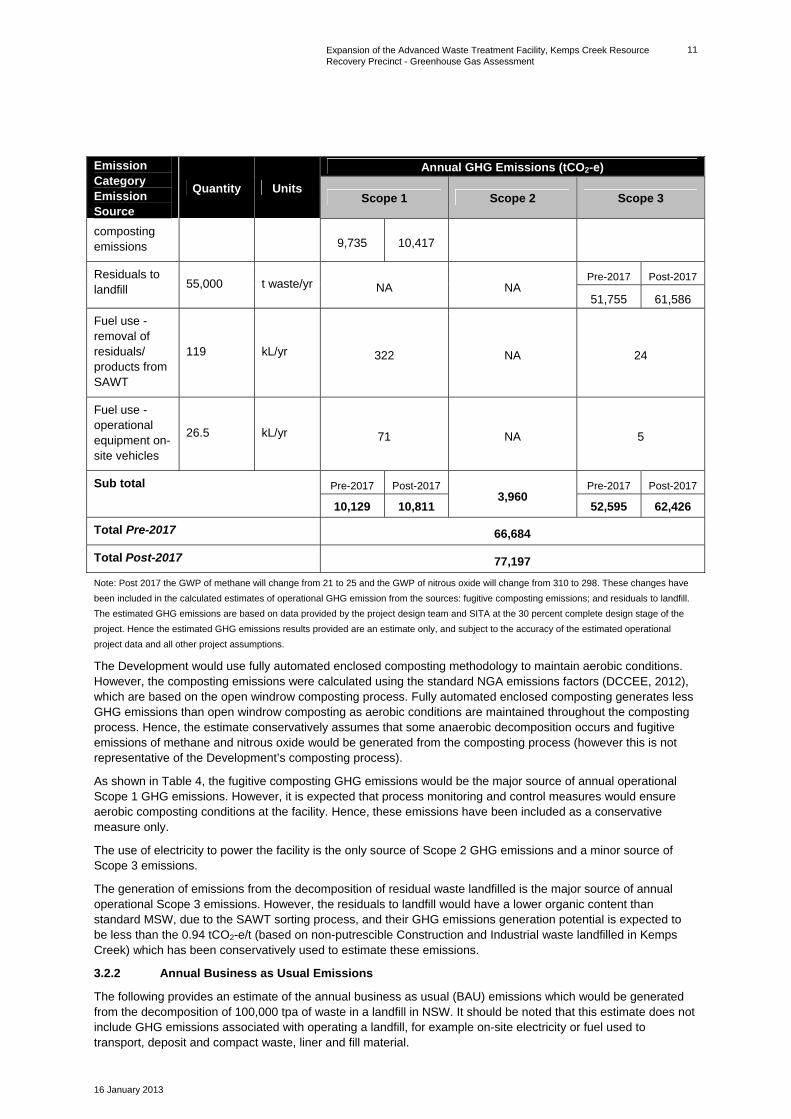
Expansion of the Advanced Waste Treatment Facility, Kemps Creek Resource Recovery Precinct - Greenhouse Gas Assessment
16 January 2013
11
Emission Category Emission Source
Quantity Units
Annual GHG Emissions (tCO2-e)
Scope 1 Scope 2 Scope 3
composting emissions 9,735 10,417
Residuals to landfill 55,000 t waste/yr NA NA
Pre-2017 Post-2017
51,755 61,586
Fuel use - removal of residuals/ products from SAWT
119 kL/yr 322 NA 24
Fuel use - operational equipment on-site vehicles
26.5 kL/yr 71 NA 5
Sub total Pre-2017 Post-2017 3,960
Pre-2017 Post-2017
10,129 10,811 52,595 62,426
Total Pre-2017 66,684
Total Post-2017 77,197
Note: Post 2017 the GWP of methane will change from 21 to 25 and the GWP of nitrous oxide will change from 310 to 298. These changes have
been included in the calculated estimates of operational GHG emission from the sources: fugitive composting emissions; and residuals to landfill.
The estimated GHG emissions are based on data provided by the project design team and SITA at the 30 percent complete design stage of the
project. Hence the estimated GHG emissions results provided are an estimate only, and subject to the accuracy of the estimated operational
project data and all other project assumptions.
The Development would use fully automated enclosed composting methodology to maintain aerobic conditions. However, the composting emissions were calculated using the standard NGA emissions factors (DCCEE, 2012), which are based on the open windrow composting process. Fully automated enclosed composting generates less GHG emissions than open windrow composting as aerobic conditions are maintained throughout the composting process. Hence, the estimate conservatively assumes that some anaerobic decomposition occurs and fugitive emissions of methane and nitrous oxide would be generated from the composting process (however this is not representative of the Development’s composting process).
As shown in Table 4, the fugitive composting GHG emissions would be the major source of annual operational Scope 1 GHG emissions. However, it is expected that process monitoring and control measures would ensure aerobic composting conditions at the facility. Hence, these emissions have been included as a conservative measure only.
The use of electricity to power the facility is the only source of Scope 2 GHG emissions and a minor source of Scope 3 emissions.
The generation of emissions from the decomposition of residual waste landfilled is the major source of annual operational Scope 3 emissions. However, the residuals to landfill would have a lower organic content than standard MSW, due to the SAWT sorting process, and their GHG emissions generation potential is expected to be less than the 0.94 tCO2-e/t (based on non-putrescible Construction and Industrial waste landfilled in Kemps Creek) which has been conservatively used to estimate these emissions.
3.2.2 Annual Business as Usual Emissions
The following provides an estimate of the annual business as usual (BAU) emissions which would be generated from the decomposition of 100,000 tpa of waste in a landfill in NSW. It should be noted that this estimate does not include GHG emissions associated with operating a landfill, for example on-site electricity or fuel used to transport, deposit and compact waste, liner and fill material.

Expansion of the Advanced Waste Treatment Facility, Kemps Creek Resource Recovery Precinct - Greenhouse Gas Assessment
16 January 2013
12
Landfilling of MSW generates GHG emissions as the organic matter within the waste decomposes in an anaerobic (oxygen deprived) environment and produces methane. The GHG emissions are released over many years, as shown in Figure 2.
The GHG emissions are classified as ‘anthropogenic’ (human induced) as burying the waste creates the unnaturally low oxygen environment (anaerobic conditions). The natural aerobic decomposition that occurs when waste is not buried does not produce methane, therefore methane produced in landfill decomposition is considered to be anthropogenic.
One tonne of MSW releases methane approximately equivalent to 1.2 tCO2-e as the waste decomposes in a landfill over a period of decades (NGA Factors, DCCEE, 2012). Therefore the lifetime GHG generation potential of landfilling 100,000 tonnes of MSW is approximately equivalent to 120,000 tCO2-e (100,000 t x 1.2 tCO2-e) pre-2017 and142,000 tCO2-e (100,000 t x 1.42 tCO2-e) post-2017.
If landfill gas capture and combustion (e.g. flaring or electricity generation) was implemented approximately 55percent2 of the landfill gas would be captured and combusted to form carbon dioxide, which is considered part of the natural carbon cycle, and not included in national GHG inventories. The default methane destruction efficiency of a standard landfill gas flare is 98 percent. Hence, the lifetime GHG emissions associated with landfilling 100,000 tonnes of MSW waste, with a landfill gas capture and combustion system in place, would be equivalent to approximately 55,320 tCO2-e pre-2017 and 65,462 tCO2-e post-2017.
3.3 Comparison with Emissions in NSW
3.3.1 Construction
The annual GHG emissions (including emissions and removals from land use and land use change) for NSW were 157.4 million tCO2-e in the year 2009 to 2010.
The estimated total (Scope 1, 2 and 3) GHG emissions associated with the construction of the Development (approximately 2,805 tCO2-e) are approximately equivalent to 0.002 percent of NSW’s annual GHG emissions (in 2009 to 2010).
3.3.2 Operation
The estimated total annual operational (Scope 1, 2 and 3) GHG emissions associated with the Development (approximately 66,000 to 77,000 tCO2-e) are approximately equivalent to 0.05 percent of NSW’s annual GHG emissions (in 2009 to 2010).
Solid waste disposal on land in NSW generated approximately 4.2 million tCO2-e in the year 2009 to 2010.The estimated total annual operational (Scope 1, 2 and 3) GHG emissions associated with the Development are approximately equivalent to 0.3 percent of NSW’s annual (2009 to 2010) waste sector (solid waste disposal on land) GHG emissions.
However, as discussed above, the BAU lifetime GHG emissions (approximately 120,000 to 142,000 tCO2-e) associated with landfilling 100,000 tonnes of MSW (assuming no landfill gas capture) would be approximately equivalent to 3.4 percent of NSW’s annual (2009 to 2010) waste sector (solid waste disposal on land) GHG emissions (post-2017). If landfill gas capture and combustion were in place the BAU lifetime GHG emissions with landfilling 100,000 tonnes of MSW, would be approximately equivalent to 1.6 percent of NSW’s annual (2009 to 2010) waste sector (solid waste disposal on land) GHG emissions (post-2017).
2 55% is an approximate national average ‘whole-of-life’ landfill gas capture efficiency rate. Source: Warnken ISE, 2007. The
Potential Greenhouse Gas Liability from Landfill in Australia: An Examination of the Climate Change Risk from Landfill
Emissions to 2050.

Expansion of the Advanced Waste Treatment Facility, Kemps Creek Resource Recovery Precinct - Greenhouse Gas Assessment
16 January 2013
13
This page has been left blank intentionally.

Expansion of the Advanced Waste Treatment Facility, Kemps Creek Resource Recovery Precinct - Greenhouse Gas Assessment
16 January 2013
14
4.0 Mitigation Measures The following mitigation measures could be implemented during construction and operation to reduce the GHG emissions associated with the Development, where reasonable and feasible:
- Preferential use of local materials to reduce fuel consumption associated with material transportation
- Minimise fill and construction materials handling to reduce quantity of fuel consumption
- Use low GHG intensive alternative fuels (for example biofuels) in equipment and vehicles
- Preferential use/purchase of vehicles with low fuel consumption ratings and energy efficient equipment/plant
- Train staff in practices to reduce fuel consumption in use equipment and vehicles such as eliminating idling
- Regularly maintain equipment and vehicles to maximise fuel efficiency
- Preferential selection of materials with lower embodied emissions, such as:
low carbon concrete (where Portland cement is substituted with waste products including granulated blast furnace slag and fly ash)
recycled material as aggregate
demolition waste as fill material
- Use of electricity generated by the landfill gas powered generator proposed at the Resource Recovery Precinct (subject to a separate DA, and undetermined at the time of writing this EIS)
- Manage and monitor the composting process to ensure that aerobic conditions are maintained (thereby avoiding the generation of fugitive GHG emissions associated with anaerobic decomposition of organic waste).

Expansion of the Advanced Waste Treatment Facility, Kemps Creek Resource Recovery Precinct - Greenhouse Gas Assessment
16 January 2013
15
This page has been left blank intentionally.
Expansion of the Advanced Waste Treatment Facility, Kemps Creek Resource Recovery Precinct - Greenhouse Gas Assessment
16 January 2013
16
5.0 Energy Efficiency The Development would improve the energy efficiency of operations at the existing SAWT facility. A summary of the key energy efficiency advantages of the Development, relative to existing operations, is provided below:
- A reduction in the amount of front end loader operations and manual handling would reduce fuel and electricity consumption
- The exhaust air from the pre-treatment buildings would be reused in the composting process, thereby minimising energy usage
- The roof of the enclosed composting hall would include translucent panel sheeting to maximise natural light within the building, thereby minimising energy used for lighting
- All leachate produced as a result of operations in the Composting Hall and Tunnel Composting System would be directed to enclosed leachate tanks, reducing the need for electricity powered aeration of leachate ponds
- Enclosed composting for the entire process reduces fugitive emissions from composting material outdoors.

Expansion of the Advanced Waste Treatment Facility, Kemps Creek Resource Recovery Precinct - Greenhouse Gas Assessment
16 January 2013
17
This page has been left blank intentionally.

Expansion of the Advanced Waste Treatment Facility, Kemps Creek Resource Recovery Precinct - Greenhouse Gas Assessment
16 January 2013
18
6.0 Conclusion During the construction stage, electricity, fuel and materials would be consumed. These activities would generate GHG emissions directly and indirectly. The total construction stage (Scope 1, 2 and 3) GHG emissions would be approximately 2,805 tCO2-e. This is approximately equivalent to 0.002 percent of NSW’s annual GHG emissions (in 2009 to 2010).
Operation of the Development would also generate GHG emissions, for example from the consumption of diesel fuel and electricity to run the facility and the generation of fugitive emissions. It is estimated that the total annual operational (Scope 1, 2 and 3) GHG emissions associated with the Development (approximately 66,000 to 77,000 tCO2-e) are approximately equivalent to 0.05 percent of NSW’s annual GHG emissions (in 2009 to 2010).
The Development would use fully automated enclosed composting methods, however this assessment conservatively assumes that some anaerobic decomposition occurs (for example, that fugitive emissions of methane and nitrous oxide would be generated from the composting process). Fugitive GHG emissions from the composting process represent the major source (96 percent) of the estimated annual operational Scope 1 GHG emissions. However the Development includes composting of the organic fraction of the waste in a climate controlled and aerated environment, which prevents the generation of GHG emissions (e.g. methane). The Development would compost 55,000 tpa of waste each year. The majority of this waste would be MSW, the remainder being SSO and a small volume of biosolids. MSW releases methane as the waste decomposes in a landfill over a period of decades. One tonne of MSW releases methane approximately equivalent to 1.2 tCO2-e pre-2017 and 1.4 tCO2-e post-2017 (NGA Factors, DCCEE, 2012). Therefore the lifetime methane generation potential of landfilling 100,000 tonnes of MSW is approximately equivalent to 120,000 tCO2-e pre-2017 and 142,000 tCO2-e post-2017.This would be approximately equivalent to 3.4 percent of NSW’s annual (2009 to 2010) waste sector (solid waste disposal on land) GHG emissions (post-2017). If landfill gas capture and combustion (for example, flaring or electricity generation) was implemented approximately 55 percent3 of the landfill gas would be captured and combusted to form carbon dioxide, which is considered part of the natural carbon cycle, and not an anthropogenic GHG emission.
It should be noted that the estimated GHG emissions results provided above are an estimate only, and subject to the accuracy of the estimated construction and operational project data and all other project assumptions.
To avoid/reduce GHG emissions associated with the Development, mitigation measures are recommended which relate to:
- Minimising the quantity and/or emissions intensity of electricity used, fuel used by plant and equipment and fuel used in the transport of materials
- Minimising the quantity and/or embodied carbon of materials used
- Avoiding the generation of fugitive GHG emissions.
3 55 percent is an approximate national average ‘whole-of-life’ landfill gas capture efficiency rate. Source: Warnken ISE, 2007,
The Potential Greenhouse Gas Liability from Landfill in Australia: An Examination of the Climate Change Risk from Landfill
Emissions to 2050.

Expansion of the Advanced Waste Treatment Facility, Kemps Creek Resource Recovery Precinct - Greenhouse Gas Assessment
16 January 2013
19
This page has been left blank intentionally.

Expansion of the Advanced Waste Treatment Facility, Kemps Creek Resource Recovery Precinct - Greenhouse Gas Assessment
16 January 2013
20
References Australian Department of Climate Change and Energy Efficiency (DCCEE), 2010, Australian National Greenhouse Accounts State and Territory Greenhouse Gas Inventories, 2009–10. Available at: http://www.climatechange.gov.au/~/media/climate-change/emissions/2011-12/StateAndTerritoryGreenhouseGasInventories-2009-10.pdf
Bygrave, S. (General Manager, Clean Energy Regulator), April 2012, Carbon pricing mechanism and waste - technical session,ALGA National Waste Forum.
DCCEE, 2012A, Australian National Greenhouse Accounts, Quarterly Update of Australia’s National Greenhouse Inventory, March Quarter 2012.Available at: http://www.climatechange.gov.au/publications/greenhouse-acctg/national-greenhouse-gas-inventory-march-2012.aspx
DCCEE, 2012B, National Greenhouse Accounts (NGA) Factors. Available at: http://www.climatechange.gov.au/publications/greenhouse-acctg/national-greenhouse-factors.aspx
DCCEE, 2012C, The Carbon Farming (Capture and Combustion of Methane in Landfill Gas from Legacy Waste) Methodology Determination 2012. Available at: http://www.climatechange.gov.au/government/initiatives/carbon-farming-initiative/methodology-development/approved-methodologies/capture-combustion-of-landfill-gas.aspx
DCCEE, 2012D, Global Warming Potentials. Available at: http://www.climatechange.gov.au/government/initiatives/gwp.aspx
Australian Government, Clean Energy Future, 2012A, Securing a clean energy future: the Australian Government's climate change plan, 2011. Available at: http://www.cleanenergyfuture.gov.au/clean-energy-future/our-plan/
Australian Government, Clean Energy Future, 2012B, Fact Sheet – Emissions from landfill facilities. Available at: http://www.cleanenergyfuture.gov.au/wp-content/uploads/2011/10/FactSheet-Emissions-from-landfill-facilities.pdf
Australian Government, Department of Sustainability, Environment, Water, Population and Communities, 2009, The National Waste Policy: Less waste, more resources. Available at: http://www.environment.gov.au/wastepolicy/about/index.html
CSIRO and Bureau of Meteorology, 2012, State of the Climate 2012.Available at: http://www.csiro.au/Outcomes/Climate/Understanding/State-of-the-Climate-2012.aspx
NSW Department of Energy, Utilities and Sustainability (DEUS), 2005, Guidelines for Energy Savings Action Plans. Available at: http://www.environment.nsw.gov.au/resources/sustainbus/08595energyguidelines.pdf
Intergovernmental Panel on Climate Change (IPCC), 2007.Climate Change 2007, Synthesis Report. Available at: http://www.ipcc.ch/
IPCC, 2006, Guidelines for National Greenhouse Gas Inventories.Available at: http://www.ipcc-nggip.iges.or.jp/public/2006gl/pdf/5_Volume5/V5_4_Ch4_Bio_Treat.pdf
NSW Government, 2007, Waste Avoidance and Resource Recovery Strategy 2007.Available at:
NSW Government, 2011, National Waste Policy Implementation Report 2011.Available at: http://www.scew.gov.au/strategic-priorities/national-waste-policy.html
Steering Committee forthe Review of NSW Waste Strategy and Policy, 2010, Review of Waste Strategy and Policy in New South Wales. Available at:http://www.environment.nsw.gov.au/resources/warr/101034RevWasteStrat.pdf
Warnken ISE, 2007, The Potential Greenhouse Gas Liability from Landfill in Australia: An Examination of the Climate Change Risk from Landfill Emissions to 2050.
World Resources Institute (WRI) and World Business Council for Sustainable Business Development (WBCSD), 2004, The Greenhouse Gas Protocol: A Corporate Accounting and Reporting Standard (Revised Edition).

Expansion of the Advanced Waste Treatment Facility, Kemps Creek Resource Recovery Precinct - Greenhouse Gas Assessment
16 January 2013
21
This page has been left blank intentionally.

Expansion of the Advanced Waste Treatment Facility, Kemps Creek Resource Recovery Precinct - Greenhouse Gas Assessment
16 January 2013
Appendix A
GHG Assessment Calculations

Expansion of the Advanced Waste Treatment Facility, Kemps Creek Resource Recovery Precinct - Greenhouse Gas Assessment
16 January 2013
a-1
Appendix A GHG Assessment Calculations

Construction
Emission CategoryEmission Source Scope 1 Scope 2 Scope 3Fuel use - construction equipment & site vehicles
267 kL 720 55
Fuel use – transport of construction materials 16 kL 43Electricity use – site offices 18200 kWhr 16 3Material use - Aggregate 15,264 T 61Material use - Asphalt 953 T 53Material use - Concrete 11,002 T 984Material use - Steel 756 T 869 Total
Totals 720 16 2,068 2,805720.4 16.0 2,068.4 2,804.7
Operational (annual) Pre 2017Emission CategoryEmission Source Scope 1 Scope 2 Scope 3Electricity use 4,500,000 kWhr / yr 3,960 810Fugitive composting emissions 55,000
t waste / yr
9,735Residual waste emissions 55,000
t waste / yr
51,755Fuel use - removal of material (residual/recyclables/compost) from site
119 kL / yr 322 24
Fuel use - operational equipment 26.5 kL / yr 71 5 Total
Total 10,129 3,960 52,595 66,684
Operational (annual) Post 2017Emission CategoryEmission Source Scope 1 Scope 2 Scope 3Electricity use 4,500,000 kWhr / yr 3,960 810Fugitive composting emissions 55,000
t waste / yr
10,417Residual waste emissions 55,000
t waste / yr
61,586Fuel use - removal of material (residual/recyclables/compost) from site
119 kL / yr 322 24
Fuel use - operational equipment 26.5 kL / yr 71 5 Total
Total 10,811 3,960 62,426 77,197
Solid waste disposal on land in NSW generated approximately 4.2 million tCO 2-e in the year 2009-20110.Source: Department of Cllimate Change, 2011.NSW GHG emissions (incl. LULUC) 2009/10 157.4 million tCO2-eNSW GHG emissions (incl. LULUC) 2009/10 157,400,000 tCO2-eConstruction Scope 1, 2 &3 as a % of NSW 0.002 %NSW Solid Waste Emissions (2009-2010) 4.2 million tCO2-eNSW Solid Waste Emissions (2009-2010) 4,200,000 tCO2-e Post 2017
Pre-2017 Post 2017Operational Scope 1, 2 &3 as a % of NSW 0.04 0.05 % 0.05 %Operational Scope 1 as a % of NSW Waste 0.2 0.3 % 0.3 %Operational Scope 1, 2 &3 as a % of NSW Wast 1.6 1.8 % 1.838 %Landfilling of 100,000t MSW as a % of NSW (without landfill gas capture) 0.1 0.1 % 0.1 %Landfilling of 100,000t MSW as a % of NSW (with landfill gas capture & combustion) 0.04 0.04 % 0.04 %Landfilling of 100,000t MSW as a % of NSW Waste (without landfill gas capture) 2.9 3.4 % 3.4 %Landfilling of 100,000t MSW as a % of NSW Waste (with landfill gas capture & combustion) 1.3 1.6 % 1.6 %
5900085600
NSW’s annual GHG emissions (including emissions and removals from land use and land use change) were 157.4 million tCO2-e in the year 2009-20110.
Quantity UnitsGHG Emissions (tCO2-e)
Quantity UnitsAnnual GHG Emissions (tCO2-
Quantity UnitsAnnual GHG Emissions (tCO2-
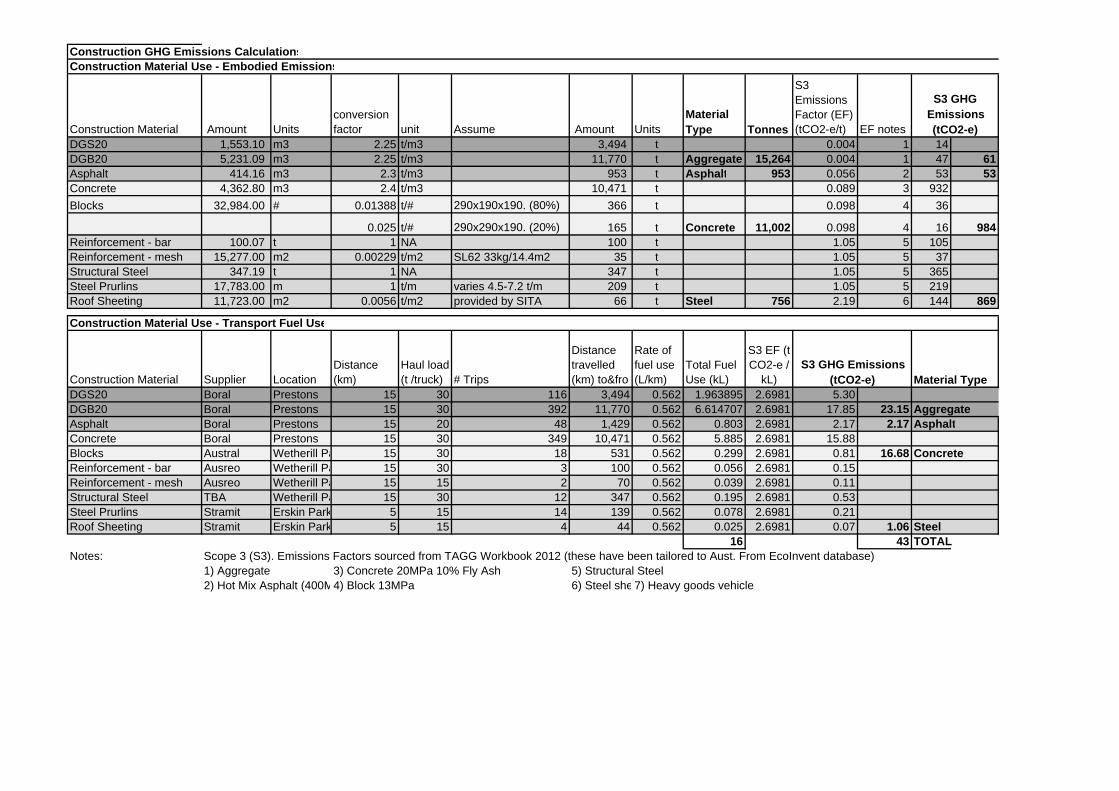
Construction GHG Emissions CalculationsConstruction Material Use - Embodied Emissions
Construction Material Amount Unitsconversion factor unit Assume Amount Units
Material Type Tonnes
S3 Emissions Factor (EF) (tCO2-e/t) EF notes
DGS20 1,553.10 m3 2.25 t/m3 3,494 t 0.004 1 14DGB20 5,231.09 m3 2.25 t/m3 11,770 t Aggregate 15,264 0.004 1 47 61Asphalt 414.16 m3 2.3 t/m3 953 t Asphalt 953 0.056 2 53 53Concrete 4,362.80 m3 2.4 t/m3 10,471 t 0.089 3 932
Blocks 32,984.00 # 0.01388 t/# 290x190x190. (80%) 366 t 0.098 4 36
0.025 t/# 290x290x190. (20%) 165 t Concrete 11,002 0.098 4 16 984Reinforcement - bar 100.07 t 1 NA 100 t 1.05 5 105Reinforcement - mesh 15,277.00 m2 0.00229 t/m2 SL62 33kg/14.4m2 35 t 1.05 5 37Structural Steel 347.19 t 1 NA 347 t 1.05 5 365Steel Prurlins 17,783.00 m 1 t/m varies 4.5-7.2 t/m 209 t 1.05 5 219Roof Sheeting 11,723.00 m2 0.0056 t/m2 provided by SITA 66 t Steel 756 2.19 6 144 869
Construction Material Use - Transport Fuel Use
Construction Material Supplier LocationDistance (km)
Haul load (t /truck) # Trips
Distance travelled (km) to&fro
Rate of fuel use (L/km)
Total Fuel Use (kL)
S3 EF (t CO2-e /
kL) Material TypeDGS20 Boral Prestons 15 30 116 3,494 0.562 1.963895 2.6981 5.30DGB20 Boral Prestons 15 30 392 11,770 0.562 6.614707 2.6981 17.85 23.15 AggregateAsphalt Boral Prestons 15 20 48 1,429 0.562 0.803 2.6981 2.17 2.17 AsphaltConcrete Boral Prestons 15 30 349 10,471 0.562 5.885 2.6981 15.88Blocks Austral Wetherill Pa 15 30 18 531 0.562 0.299 2.6981 0.81 16.68 ConcreteReinforcement - bar Ausreo Wetherill Pa 15 30 3 100 0.562 0.056 2.6981 0.15Reinforcement - mesh Ausreo Wetherill Pa 15 15 2 70 0.562 0.039 2.6981 0.11Structural Steel TBA Wetherill Pa 15 30 12 347 0.562 0.195 2.6981 0.53Steel Prurlins Stramit Erskin Park 5 15 14 139 0.562 0.078 2.6981 0.21Roof Sheeting Stramit Erskin Park 5 15 4 44 0.562 0.025 2.6981 0.07 1.06 Steel
16 43 TOTALNotes: Scope 3 (S3). Emissions Factors sourced from TAGG Workbook 2012 (these have been tailored to Aust. From EcoInvent database)
1) Aggregate 3) Concrete 20MPa 10% Fly Ash 5) Structural Steel2) Hot Mix Asphalt (400M4) Block 13MPa 6) Steel she7) Heavy goods vehicle
S3 GHG Emissions (tCO2-e)
S3 GHG Emissions (tCO2-e)

Construction GHG Emissions CalculationsConstruction Equiptment - Fuel Use
Construction Equiptment NumberDuration (Days) Total Days Total Hrs Fuel Use (L/hr)
Fuel Use (kL)
30t Excavators (Earthworks) 2 30 60 480 45 21.6Truck & Dog or 30T Dump Trucks (Earthworks Stockpiling) 4 30 120 960 16 15.3620KL Water Cart (Earthworks) 1 30 30 240 25 630t excavators (Building Works Stage) 2 40 80 640 45 28.8Trucks (Building Works Stage) 2 30 60 480 16 7.6820t excavator (Hydraulic Works Stage) 1 90 90 720 30 21.65t Excavator (Hydraulic Stage) 1 90 90 720 6 4.32Stage) 2 10 20 160 16 2.565t Excavator (Electrical Cabling/Trenching Stage) 1 90 90 720 6 4.32Trucks (Electrical Cabling/Trenching Stage) 2 10 20 160 16 2.56Concrete pump truck 1 20 20 160 20 3.2Scissor Lifts (Building Works Stage) 4 90 360 2880 6 17.28Frannas Cranes (Any Stage) 3 260 780 6240 20 124.850-100T cranes (Building Works Stage) 1 20 20 160 45 7.2
TOTAL 267.28 kL
EF (tCO2-e/kL) GHG Emissions (tCO2-e)Scope 1 Scope 3 Scope 1 Scope 3
267 2.698 0.20458 720 55
Construction Electricity Use
Construction months
Electricity use (KWh/mth)
Total Electricity use (KWh)
EF (S2) (kgCO2-e/kWh)
EF (S3) (kgCO2-e/kWh)
S2 GHG emissions (tCO2-e)
S3 GHG emissions (tCO2-e)
14 1300 18200 0.88 0.18 16 3
Total Fuel use (kL)
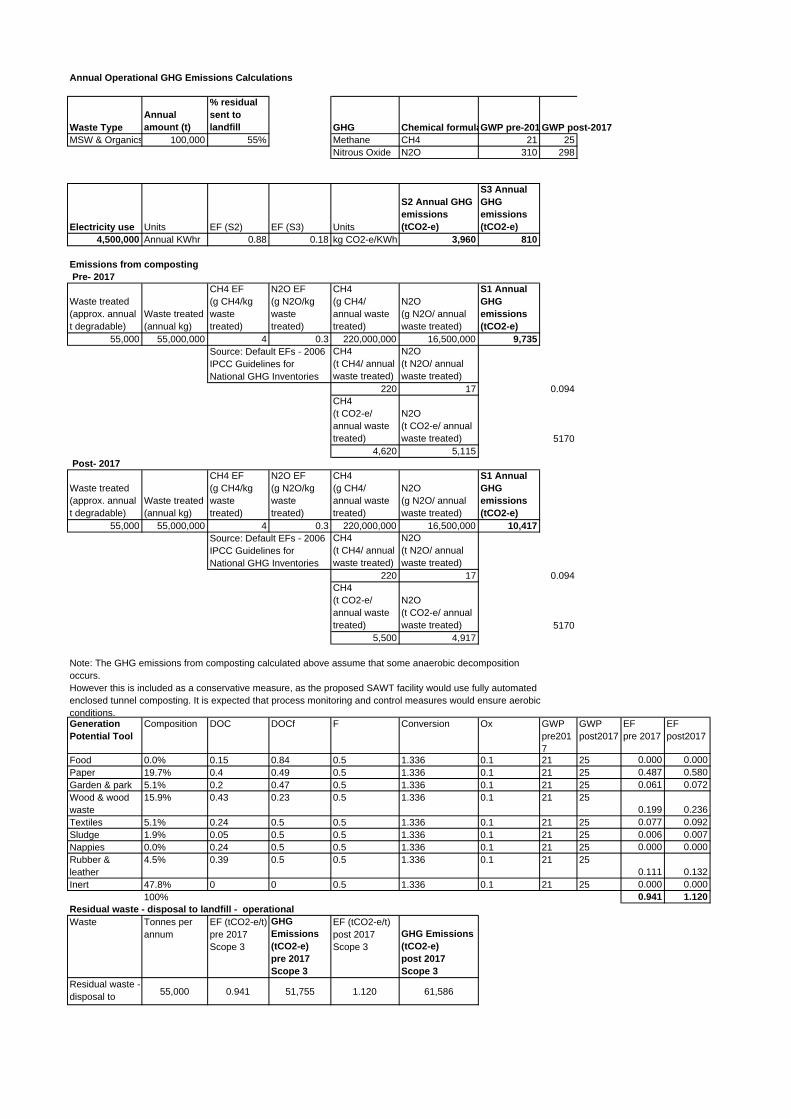
Annual Operational GHG Emissions Calculations
Waste TypeAnnual amount (t)
% residual sent to landfill GHG Chemical formulaGWP pre-201 GWP post-2017
MSW & Organics 100,000 55% Methane CH4 21 25Nitrous Oxide N2O 310 298
Electricity use Units EF (S2) EF (S3) Units
S2 Annual GHG emissions (tCO2-e)
S3 Annual GHG emissions (tCO2-e)
4,500,000 Annual KWhr 0.88 0.18 kg CO2-e/KWh 3,960 810
Emissions from composting Pre- 2017
Waste treated (approx. annual t degradable)
Waste treated (annual kg)
CH4 EF (g CH4/kg waste treated)
N2O EF (g N2O/kg waste treated)
CH4(g CH4/ annual waste treated)
N2O(g N2O/ annual waste treated)
S1 Annual GHG emissions (tCO2-e)
55,000 55,000,000 4 0.3 220,000,000 16,500,000 9,735CH4(t CH4/ annual waste treated)
N2O(t N2O/ annual waste treated)
220 17 0.094CH4(t CO2-e/ annual waste treated)
N2O(t CO2-e/ annual waste treated) 5170
4,620 5,115 Post- 2017
Waste treated (approx. annual t degradable)
Waste treated (annual kg)
CH4 EF (g CH4/kg waste treated)
N2O EF (g N2O/kg waste treated)
CH4(g CH4/ annual waste treated)
N2O(g N2O/ annual waste treated)
S1 Annual GHG emissions (tCO2-e)
55,000 55,000,000 4 0.3 220,000,000 16,500,000 10,417CH4(t CH4/ annual waste treated)
N2O(t N2O/ annual waste treated)
220 17 0.094CH4(t CO2-e/ annual waste treated)
N2O(t CO2-e/ annual waste treated) 5170
5,500 4,917
Generation Potential Tool
Composition DOC DOCf F Conversion Ox GWPpre2017
GWPpost2017
EFpre 2017
EFpost2017
Food 0.0% 0.15 0.84 0.5 1.336 0.1 21 25 0.000 0.000Paper 19.7% 0.4 0.49 0.5 1.336 0.1 21 25 0.487 0.580Garden & park 5.1% 0.2 0.47 0.5 1.336 0.1 21 25 0.061 0.072Wood & wood waste
15.9% 0.43 0.23 0.5 1.336 0.1 21 250.199 0.236
Textiles 5.1% 0.24 0.5 0.5 1.336 0.1 21 25 0.077 0.092Sludge 1.9% 0.05 0.5 0.5 1.336 0.1 21 25 0.006 0.007Nappies 0.0% 0.24 0.5 0.5 1.336 0.1 21 25 0.000 0.000Rubber & leather
4.5% 0.39 0.5 0.5 1.336 0.1 21 250.111 0.132
Inert 47.8% 0 0 0.5 1.336 0.1 21 25 0.000 0.000100% 0.941 1.120
Residual waste - disposal to landfill - operationalWaste Tonnes per
annumEF (tCO2-e/t) pre 2017Scope 3
GHG Emissions (tCO2-e) pre 2017Scope 3
EF (tCO2-e/t) post 2017Scope 3
GHG Emissions (tCO2-e) post 2017Scope 3
Residual waste - disposal to 55,000 0.941 51,755 1.120 61,586
Source: Default EFs - 2006 IPCC Guidelines for National GHG Inventories
Note: The GHG emissions from composting calculated above assume that some anaerobic decomposition occurs.However this is included as a conservative measure, as the proposed SAWT facility would use fully automated enclosed tunnel composting. It is expected that process monitoring and control measures would ensure aerobic conditions.
Source: Default EFs - 2006 IPCC Guidelines for National GHG Inventories

Fuel use - on-site operationalEquiptment Movements/dayAve operating Ave. operatingFuel use (L/hr) Operational fuel use (L/yr)Trucks - deliverin 16 1.25 456.25 16 7,300Landfill delivery f 42 3 1095 16 17,520Light truck 10 0.75 273.75 6 1,643
26,463 Total (L/yr) EF (tCO2-e/kL) GHG Emissions (tCO2-e) 26.5 Total (kL/yr)Scope 1 Scope 3 Scope 1 Scope 3
26.5 2.698 0.20458 71 5
Fuel use - removal of residual waste, recyclables and compost from SAWT facility
MaterialTonnes per annum
Haul load (t /truck) # Trips per yr Distance (km)
travelled (km/yr) to&fro
Rate of fuel use (L/km)
Fuel Use
Residual waste sent to landfill 55,000 10 5,500 2.5 27,500 0.562 15Metals, glass, plastics 17,500 10 1,750 30 105,000 0.562 59Compost 20,000 10 2,000 20 80,000 0.562 45
EF (tCO2-e/kL) GHG Emissions (tCO2-e) Total (kL/yr) 119Scope 1 Scope 3 Scope 1 Scope 3
119 2.698 0.20458 322 24
Total Fuel use (kL)
Total Fuel use (kL)
Note: It has been assumed that the trucks used to transport residual/recyclable materials and compost would be owned and operated by SITA.

Annual Operational 'Business as usual' GHG Emissions Comparison Calculations
Waste Type
Emissions Factor
(t CO2e/ t waste)
Source
MSW (Municipal Solid Waste) 1.2 NGA Factors, 2012, derived from NGER (Measurement) Determination 2008MSW post 2017 1.4 derived from NGER (Measurement) Determination 2008 using updated GWPsFood 1.6 NGA Factors, 2012, derived from NGER (Measurement) Determination 2008Garden & green 1.2 NGA Factors, 2012, derived from NGER (Measurement) Determination 2008
MaterialSAWT - Est.
Avg SAWT Est. Range
EFSource: NGA Factors 2012
Waste (tpa)
Lifetime GHG Potential (tCO2-e)
Recyclable Waste (t/yr)
Food & other compostables 35.0% 25 - 40% 1.6 35,000 56,000 0Green waste and wood 4.0% 3 - 6% 1.2 4,000 4,800 0Other organics (non compostable) 1.5% 0 1,500 0 0Nappies 6.0% 4 - 8% 1.5 6,000 0 0Paper & cardboard 15.0% 10 - 18% 2.5 15,000 37,500 0Bricks, concrete, ceramics etc 2.0% 0 2,000 0 0E-waste, batteries, other special waste 1.0% 0 - 2% 0 1,000 0 0Ferrous metals 3.0% 2 - 4% 0 3,000 0 3,000Non-ferrous metals 1.0% 0.5 - 1.5% 0 1,000 0 1,000Glass 4.0% 2 - 6% 0 4,000 0 4,000Rigid plastics 8.0% 8 - 12% 0 8,000 0 8,000PET 1.5% 0.5 - 2.5% 0 1,500 0 1,500Plastic films 10.0% 8 - 12% 0 10,000 0 0Textiles, clothing 4.0% 3 - 9% 1.5 4,000 0 0Other 4.0% 0 4,000 0 0Total 100.0% 100,000 98,300 17,500
64,000 tpa of which is degradableNote: rounded up to 29,000tpa
BAU (pre-2017)EF pre 2017 (Source: NGA Factors 2012)
Lifetime GHG Potential (tCO2-e)
MSW Waste landfilled (tonnes per an 100,000.0 1.2 120,000
Approximate GHGe 120,000 BAU (without landfill gas capture & combustion)LFG capture efficiency 55 % (Source: Warnken, ISE, 2007)Fugitive GHGe 54,000Methane destruction efficiency 98 % (DCCEE, 2012, The Carbon Farming Methodology Determination 2012) Fugitive GHGe (destruction) 1,320Total fugitive GHGe 55,320 BAU (with landfill gas capture & combustion)
BAU (post-2017) EF post 2017
Lifetime GHG Potential (tCO2-e)
MSW Waste landfilled (tonnes per an 100,000.0 1.42 142,000
Approximate GHGe 142,000 BAU (without landfill gas capture & combustion)LFG capture efficiency 55 % (Source: Warnken, ISE, 2007)Fugitive GHGe 63,900Methane destruction efficiency 98 % (DCCEE, 2012, The Carbon Farming Methodology Determination 2012) Fugitive GHGe (destruction) 1,562Total fugitive GHGe 65,462 BAU (with landfill gas capture & combustion)