6. Significant Unavoidable Adverse Impacts - City of Clovis
80
June 2014 Page 6-1 6. Significant Unavoidable Adverse Impacts The table at the end of Chapter 1, Executive Summary, summarizes the impacts, mitigation measures, and levels of significance before and after mitigation. Although mitigation measures would reduce the level of impact, the following impacts would remain significant, unavoidable, and adverse after mitigation measures are applied: Agricultural Resources 2035 Scenario and Full Buildout Impact 5.2-1, Loss of Important Farmland. Buildout of the proposed General Plan Update would convert 2,651 acres of Prime Farmland, 1,528 acres of Farmland of Statewide Importance, and 1,411 acres of Unique Farmland to nonagricultural land uses. Impact 5.2-2, Conversion of Agriculture to Nonagricultural Use. The General Plan Update would change the land use designation of 4,610 acres designated for agriculture to other land use designations. Impact 5.2-3, Williamson Act. General Plan Update buildout would convert 3,047 acres of farmland bearing Williamson act contracts to nonagricultural land uses. Implementation of the General Plan Update would result in significant, unavoidable impacts to these three impact areas. Implementation of Mitigation Measure 2-1 would not fully mitigate the direct loss of farmlands associated with the implementation of the General Plan Update because there would still be a net reduction in the total amount of land suitable for agricultural use. The impacts would therefore be significant and unavoidable under both scenarios. Air Quality 2035 Scenario and Full Buildout Impact 5.3-1, Inconsistency with Air Quality Management Plan. The General Plan Update would be consistent with the San Joaquin Valley Air Pollution Control District’s control measures; however, development associated with the buildout of the General Plan Update would exceed the SJVAPCD significance thresholds and be inconsistent with the applicable air quality management plan. The proposed project would generate a substantial increase in criteria air pollutants that would exceed the SJVAPCD’s significance thresholds. Because dispersion modeling is not applicable for a program EIR, projects with emissions of any criteria air pollutant that exceed these values are considered to have the potential to exceed the ambient air quality standards, resulting in a potentially significant impact with regard to consistency with SJVAPCD’s air quality plans. Therefore, even though the proposed project is consistent with the control measures
-
Upload
khangminh22 -
Category
Documents
-
view
1 -
download
0
Transcript of 6. Significant Unavoidable Adverse Impacts - City of Clovis
June 2014 Page 6-1
6. Significant Unavoidable Adverse Impacts The table at the end of Chapter 1, Executive Summary, summarizes the impacts, mitigation measures, and levels of significance before and after mitigation. Although mitigation measures would reduce the level of impact, the following impacts would remain significant, unavoidable, and adverse after mitigation measures are applied:
Agricultural Resources
2035 Scenario and Full Buildout
Impact 5.2-1, Loss of Important Farmland. Buildout of the proposed General Plan Update would convert 2,651 acres of Prime Farmland, 1,528 acres of Farmland of Statewide Importance, and 1,411 acres of Unique Farmland to nonagricultural land uses.
Impact 5.2-2, Conversion of Agriculture to Nonagricultural Use. The General Plan Update would change the land use designation of 4,610 acres designated for agriculture to other land use designations.
Impact 5.2-3, Williamson Act. General Plan Update buildout would convert 3,047 acres of farmland bearing Williamson act contracts to nonagricultural land uses.
Implementation of the General Plan Update would result in significant, unavoidable impacts to these three impact areas. Implementation of Mitigation Measure 2-1 would not fully mitigate the direct loss of farmlands associated with the implementation of the General Plan Update because there would still be a net reduction in the total amount of land suitable for agricultural use. The impacts would therefore be significant and unavoidable under both scenarios.
Air Quality
2035 Scenario and Full Buildout
Impact 5.3-1, Inconsistency with Air Quality Management Plan. The General Plan Update would be consistent with the San Joaquin Valley Air Pollution Control District’s control measures; however, development associated with the buildout of the General Plan Update would exceed the SJVAPCD significance thresholds and be inconsistent with the applicable air quality management plan.
The proposed project would generate a substantial increase in criteria air pollutants that would exceed the SJVAPCD’s significance thresholds. Because dispersion modeling is not applicable for a program EIR, projects with emissions of any criteria air pollutant that exceed these values are considered to have the potential to exceed the ambient air quality standards, resulting in a potentially significant impact with regard to consistency with SJVAPCD’s air quality plans. Therefore, even though the proposed project is consistent with the control measures
G E N E R A L P L A N A N D D E V E L O P M E N T C O D E U P D A T E D R A F T P E I R C I T Y O F C L O V I S
6. Significant Unavoidable Adverse Impacts
Page 6-2 PlaceWorks
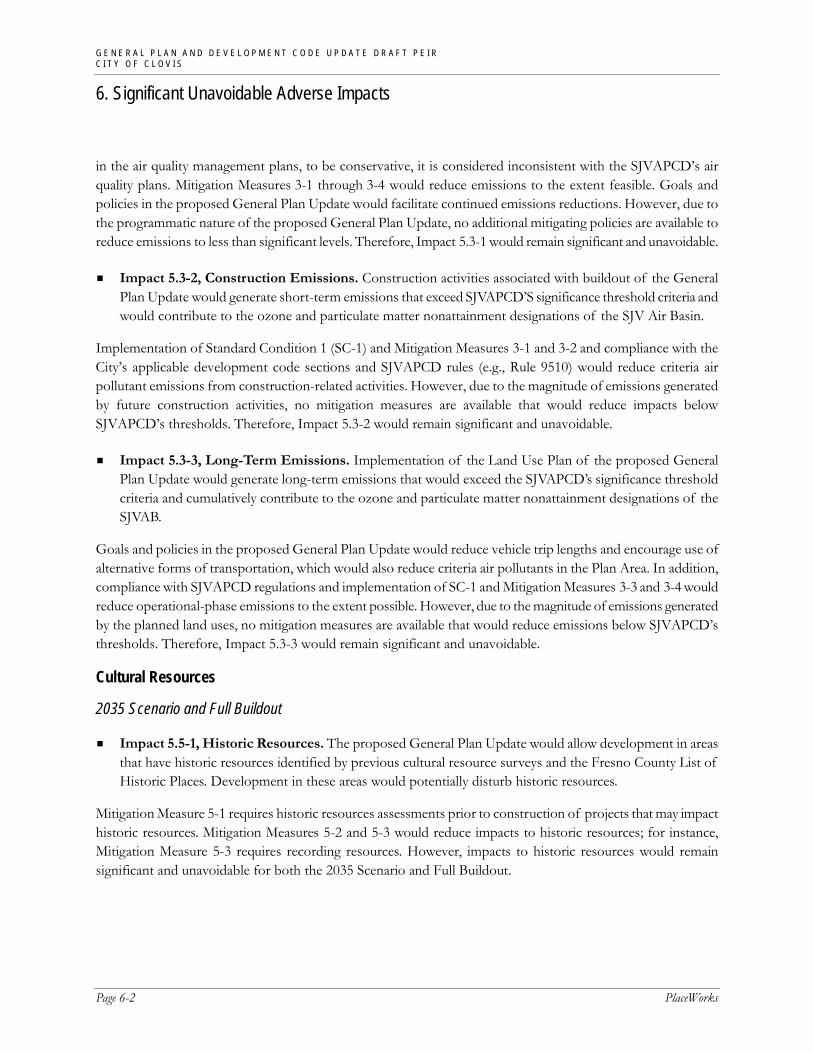
in the air quality management plans, to be conservative, it is considered inconsistent with the SJVAPCD’s air quality plans. Mitigation Measures 3-1 through 3-4 would reduce emissions to the extent feasible. Goals and policies in the proposed General Plan Update would facilitate continued emissions reductions. However, due to the programmatic nature of the proposed General Plan Update, no additional mitigating policies are available to reduce emissions to less than significant levels. Therefore, Impact 5.3-1 would remain significant and unavoidable.
Impact 5.3-2, Construction Emissions. Construction activities associated with buildout of the General Plan Update would generate short-term emissions that exceed SJVAPCD’S significance threshold criteria and would contribute to the ozone and particulate matter nonattainment designations of the SJV Air Basin.
Implementation of Standard Condition 1 (SC-1) and Mitigation Measures 3-1 and 3-2 and compliance with the City’s applicable development code sections and SJVAPCD rules (e.g., Rule 9510) would reduce criteria air pollutant emissions from construction-related activities. However, due to the magnitude of emissions generated by future construction activities, no mitigation measures are available that would reduce impacts below SJVAPCD’s thresholds. Therefore, Impact 5.3-2 would remain significant and unavoidable.
Impact 5.3-3, Long-Term Emissions. Implementation of the Land Use Plan of the proposed General Plan Update would generate long-term emissions that would exceed the SJVAPCD’s significance threshold criteria and cumulatively contribute to the ozone and particulate matter nonattainment designations of the SJVAB.
Goals and policies in the proposed General Plan Update would reduce vehicle trip lengths and encourage use of alternative forms of transportation, which would also reduce criteria air pollutants in the Plan Area. In addition, compliance with SJVAPCD regulations and implementation of SC-1 and Mitigation Measures 3-3 and 3-4 would reduce operational-phase emissions to the extent possible. However, due to the magnitude of emissions generated by the planned land uses, no mitigation measures are available that would reduce emissions below SJVAPCD’s thresholds. Therefore, Impact 5.3-3 would remain significant and unavoidable.
Cultural Resources
2035 Scenario and Full Buildout
Impact 5.5-1, Historic Resources. The proposed General Plan Update would allow development in areas that have historic resources identified by previous cultural resource surveys and the Fresno County List of Historic Places. Development in these areas would potentially disturb historic resources.
Mitigation Measure 5-1 requires historic resources assessments prior to construction of projects that may impact historic resources. Mitigation Measures 5-2 and 5-3 would reduce impacts to historic resources; for instance, Mitigation Measure 5-3 requires recording resources. However, impacts to historic resources would remain significant and unavoidable for both the 2035 Scenario and Full Buildout.

G E N E R A L P L A N A N D D E V E L O P M E N T C O D E U P D A T E D R A F T P E I R C I T Y O F C L O V I S
6. Significant Unavoidable Adverse Impacts
June 2014 Page 6-3
Greenhouse Gas Emissions
2035 Scenario and Full Buildout
Impact 5.7-1, Greenhouse Gas Emissions. Implementation of the proposed General Plan Update would result in a substantial increase in GHG emissions for year 2035 and beyond year 2035 (Full Buildout) compared to existing conditions. Additionally, though community-wide GHG emissions at year 2035 and Full Buildout would be less than business-as-usual (BAU) conditions, the proposed General Plan Update would not meet the SJVAPCD’s threshold of 29 percent below BAU or the long-term reduction target of Executive Order S-03-05.
Compliance with statewide measures would reduce GHG emissions associated with implementation of the proposed General Plan Update. Implementation of the proposed General Plan Update would improve the job-to-housing ratio (see Table 5.13-9) to 0.93 job per household in year 2035 compared to the current 0.75 ratio, and to 1.0 job per household after full buildout. This improved ratio would contribute to shortening the average trip distance of residents to their jobs and to the reduction of total vehicle miles traveled in the Plan Area, resulting in a per capita reduction in GHG emissions in the Plan Area. Furthermore, the policies in the proposed General Plan Update; SC-1; Mitigation Measures 3-1, 3-4, and 3-5 identified in Section 5.3, Air Quality; and Mitigation Measure 7-1 would ensure that GHG emissions from buildout of the proposed General Plan Update would be minimized to the extent feasible.
However, due to the magnitude of the proposed General Plan Update’s development, its implementation would substantially increase GHG emissions from existing conditions in year 2035 and Full Buildout, exceeding the SJVAPCD threshold of 29 percent below BAU. Additional statewide measures would be necessary to reduce GHG emissions under the proposed General Plan Update to meet the SJVAPCD BAU threshold and the reduction target of Executive Order S-03-05. As identified by the California Council on Science and Technology, the state cannot meet the 2050 goal without major advancements in technology. Since no additional statewide measures to reduce emissions beyond year 2020 are available, Impact 5.7-1 would be significant and unavoidable.
Hydrology and Water Quality
2035 Scenario and Full Buildout
Impact 5.9-2, Groundwater Use. Development pursuant to the General Plan Update would increase the demand on groundwater use and also increase impervious surfaces in the Plan Area, which would impact opportunities for groundwater recharge.
Based on the 2010 Urban Water Management Plan, forecast water supplies available to the City of Clovis would meet estimated water demands generated by buildout of the General Plan Update under the 2035 Scenario, but would not meet demands at full buildout (see the analysis of impacts on water supplies in Section 5.17.1, Water Service, of this Draft PEIR). Although the estimated population of the Plan Area at buildout of the 2035 Scenario (184,100 persons) is lower than the 2035 population estimate in the 2010 City of Clovis UWMP (188,224 persons), as discussed in the Section 5.17.1, Water Service, the duration and severity of the current drought is unknown. In addition, full buildout would require the City to obtain expanded water supplies other than

G E N E R A L P L A N A N D D E V E L O P M E N T C O D E U P D A T E D R A F T P E I R C I T Y O F C L O V I S
6. Significant Unavoidable Adverse Impacts
Page 6-4 PlaceWorks
groundwater—that is, local surface water, imported water, recycled water (for nonpotable uses), or some combination thereof—to avoid depleting groundwater to meet water demands by full General Plan Update buildout. The potential for development in accordance with the General Plan Update to deplete groundwater or interfere with groundwater recharge, therefore, is determined to be potentially significant in both the 2035 Scenario and Full Buildout.
Details on long-term water planning and regulatory measures are included in Section 5.17, Utilities and Service Systems. However, no mitigation measures beyond the long-term facility planning, conservation measures, recycling projects, and existing regulatory measures (e.g., SB 610 and SB 221) have been identified to address the proposed project’s significant impact on water supply and groundwater depletion/recharge opportunities. Thus, Impact 5.9-2 would remain significant and unavoidable.
Noise
2035 Scenario and Full Buildout
Impact 5.12-1, Traffic Noise. Traffic-related noise impacts from the implementation of the General Plan are significant. Traffic generated by buildout of the General Plan Update would substantially increase noise along major traffic corridors in the Plan Area and could expose existing and planned residents to substantial noise levels.
To reduce potential noise impacts to new sensitive land uses, Environmental Safety Element Policy 3.1 would require mitigation measures to ensure existing and future land use compatibility. Policy 3.2 would discourage land use and traffic patterns that would expose sensitive land uses or noise-sensitive areas to unacceptable noise levels. Policy 3.5 would minimize noise impacts by requiring appropriate site, circulation, equipment, and building design; sound walls; landscaping; and other buffers. Policy 3.9 would require the City to coordinate with Caltrans to ensure the inclusion of noise mitigation measures in the design of new highway projects or improvements to existing facilities. However, these policies would only affect new land uses. There are no feasible mitigation measures available that would prevent impacts to existing homes fronting the major transportation corridors. Thus, Impact 5.12-1 would remain significant and unavoidable.
Impact 5.12-4, Construction Vibrations. Buildout of the individual land uses and projects for implementation of the General Plan could expose sensitive uses to strong groundborne vibration.
Mitigation Measure 12-1 would reduce vibration impacts by requiring alternative construction methods. However, it cannot be guaranteed that these methods can be implemented and that vibration impacts from construction of future projects would not occur. Consequently, Impact 5.12-4 would remain significant and unavoidable.
Impact 5.12-5, Construction Noise. Construction activities associated with buildout of the individual land uses and projects for implementation of the General Plan would substantially elevate noise levels in the vicinity of noise-sensitive land uses.
Mitigation Measure 12-2 would reduce construction noise impacts to the extent feasible. However, factors such as distance, source to receiver geometry, and other site conditions may render the mitigation measure

G E N E R A L P L A N A N D D E V E L O P M E N T C O D E U P D A T E D R A F T P E I R C I T Y O F C L O V I S
6. Significant Unavoidable Adverse Impacts
June 2014 Page 6-5
infeasible or ineffective for individual future projects in the Plan Area. Thus, Mitigation Measure NOI-2 would not guarantee that construction noise impacts would be reduced to less than significant levels. Consequently, Impact 5.12-5 would remain significant and unavoidable.
Population and Housing
Full Buildout
Impact 5.13-1, Population Growth. Under the 2035 Scenario, buildout of the General Plan Update would result in similar population growth as projected by the Fresno COG; however, Full Buildout would substantially increase population in the Plan Area by over 150 percent by year 2080, which is also beyond Fresno COG’s planning horizon.
Full Buildout of the proposed project would result in up to 294,300 people compared to the existing 115,000 person population in the Plan Area. This substantial 156 percent increase in population would occur both directly through proposed residential, commercial, and office uses under the proposed land use plan and indirectly through planned extensions and improvements of roads and infrastructure into the SOI and non-SOI Plan Area. Furthermore, because the Fresno COG population projections do not exceed its 25-year planning horizon, it is uncertain whether the City of Clovis’s population growth beyond 2035 would keep pace with the proposed project’s population growth.
Transportation and Traffic
2035 Scenario
Impact 5.16-1, Roadway Segment Operation. Upon implementation of the land uses and circulation element included in the General Plan Update, one roadway segment in the City of Clovis and several segments in the County of Fresno are projected to operate at unacceptable level of service (LOS) in 2035.
City of Clovis
Minnewawa Avenue: Shaw Avenue to Ashlan Avenue (LOS F in PM peak hour)
This segment of Minnewawa Avenue from Shaw Avenue to Ashlan Avenue would operate at LOS F in PM peak hour; however, it is a roadway segment to which an exception to the City’s LOS standard would apply, per Policy 2.1 of the General Plan Update. Thus, no roadways in the City of Clovis would operate at unacceptable LOS in the 2035 Scenario.
County of Fresno
Copper Avenue: Willow Avenue to Auberry Road (LOS E in AM peak hour)
Copper Avenue: Auberry Road to Minnewawa Avenue (LOS F in AM and PM peak hours)
Behymer Avenue: Clovis Avenue to Fowler Avenue (LOS D in PM peak hour)
Herndon Avenue: McCall Avenue to Academy Avenue (LOS D in PM peak hour)
Ashlan Avenue: Minnewawa Avenue to Clovis Avenue (LOS F in AM and PM peak hours)

G E N E R A L P L A N A N D D E V E L O P M E N T C O D E U P D A T E D R A F T P E I R C I T Y O F C L O V I S
6. Significant Unavoidable Adverse Impacts
Page 6-6 PlaceWorks
Ashlan Avenue: McCall Avenue to Academy Avenue (LOS D in PM peak hour)
Minnewawa Avenue: Copper Avenue to Behymer Avenue (LOS F in AM and PM peak hours)
Fowler Avenue: Behymer Avenue to Shepherd Avenue (LOS E in PM peak hour)
DeWolf Avenue: Herndon Avenue to Bullard Avenue (LOS D in AM and PM peak hour)
McCall Avenue: Herndon Avenue to Shaw Avenue (LOS F in AM and PM peak hours)
Academy Avenue: Herndon Avenue to Shaw Avenue (LOS D in PM peak hour)
Since these roadways are not under the City’s jurisdiction, impacts would remain significant and unavoidable.
Caltrans Facilities
SR 168 Eastbound: McKinley Avenue to Shields Avenue (LOS E in AM and PM peak hours)
SR 168 Eastbound: Shields Avenue to Ashlan Avenue (LOS E in AM and PM peak hours)
SR 168 Westbound: Ashlan Avenue to Shields Avenue (LOS E in AM peak hour)
SR 168 Eastbound: Herndon Avenue to Fowler Avenue (LOS E in PM peak hour)
SR 168 Westbound: Fowler Avenue to Herndon Avenue (LOS F in AM peak hour; LOS E in PM peak hour)
SR 168 Westbound: Temperance Avenue to Fowler Avenue (LOS E in AM peak hour)
SR 168: Temperance Avenue to Owens Mountain Parkway (LOS F in PM peak hour)
Although traffic improvements have been identified that could mitigate these impacts, these improvements would be under the jurisdiction of Caltrans. Since the City of Clovis does not have control over the implementation of these mitigation measures, this impact would remain significant and unavoidable.
Full Buildout
Impact 5.16-1 – Roadway Segment Operation. At Full Buildout, several roadway segments in the City of Clovis and County of Fresno, and several Caltrans facilities would be impacted and require improvements, including segment extensions and lane expansions.
City of Clovis (includes roadways in Clovis’s future jurisdictional boundary)
Copper Avenue: Willow Avenue to Auberry Road
Copper Avenue: Auberry Road to Clovis Avenue
Behymer Avenue: Willow Avenue to Clovis Avenue
Minnewawa Avenue: Shepherd Avenue to Behymer Avenue
Clovis Avenue: extended north from Behymer Avenue to Copper Avenue as a 4-lane arterial
Clovis Avenue: Shepherd Avenue to Perrin Avenue
Owens Mountain Parkway: DeWolf Avenue to “Muncie Avenue” (east-west collector street east of SR 168)

G E N E R A L P L A N A N D D E V E L O P M E N T C O D E U P D A T E D R A F T P E I R C I T Y O F C L O V I S
6. Significant Unavoidable Adverse Impacts
June 2014 Page 6-7
Owens Mountain Parkway: McCall Avenue to “Dockery Avenue” (north-south arterial street east of McCall Avenue in Northeast Urban Center)
Herndon Avenue: McCall Avenue to “Del Rey Avenue” (north-south collector street west of Academy Avenue in Northeast Urban Center)
McCall Avenue: SR 168 to Owens Mountain Parkway
McCall Avenue: north of Herndon Avenue
Ashlan Avenue: Thompson Avenue to McCall Avenue
DeWolf Avenue: Bullard Avenue south to City Limits
Leonard Avenue: Bullard Avenue south to City Limits
Shepherd Avenue: Willow Avenue to Temperance Road
Alluvial Avenue: Clovis Avenue to Temperance Avenue
Herndon Avenue: Temperance Avenue to DeWolf Avenue
Gettysburg Avenue: Clovis Avenue to Sierra Vista Parkway
Willow Avenue: Herndon Avenue to Escalon Avenue
Sunnyside Avenue: Alluvial Avenue to Fifth Street
Fowler Avenue: Enterprise Canal to Nees Avenue
Armstrong Avenue: Alluvial Avenue to Herndon Avenue
County of Fresno
McCall Avenue: Herndon Avenue to SR 180
Academy Avenue: Herndon Avenue to Shaw Avenue
Caltrans Facilities
SR 168: Herndon Avenue to Temperance Avenue
SR 168: Temperance Avenue to Shepherd Avenue/McCall Avenue
SR 168: Shepherd Avenue/McCall Avenue to “Dockery Avenue”
SR 168: east of “Dockery Avenue” to east of “Indianola Avenue” (north-south arterial west of Academy Avenue in Northeast Urban Center)
Changes in technology, demographics, and economic conditions, particularly over a long time frame (e.g., 40+ years), may affect people’s travel behavior in ways that are not captured by the traffic model and would be speculative to predict at this time. Because the full buildout of the General Plan is not expected to occur until approximately 2080, and given the limitations to predicting traffic, it is not possible to reasonably predict future traffic volumes on roadways and the required capacity to meet applicable LOS standards.
As presented above, several segments would need to be expanded and extended. At the time of the preparation of this analysis, no funding sources have been identified to implement the required

G E N E R A L P L A N A N D D E V E L O P M E N T C O D E U P D A T E D R A F T P E I R C I T Y O F C L O V I S
6. Significant Unavoidable Adverse Impacts
Page 6-8 PlaceWorks
improvements, and many of the segments are outside of the City of Clovis’s jurisdiction. Therefore, this would be a significant unavoidable impact.
Utilities and Service Systems
2035 Scenario and Full Buildout
Impact 5.17-1, Water Supply. Projected water supply is inadequate to meet projected water demand at both 2035 Scenario and Full Buildout of the proposed General Plan Update.
Although adequate water supplies have been identified in the 2010 Urban Water Management Plan for demand as projected for 2035, this information does not take into account recent drought conditions. Given the uncertainty of the potential ongoing severity and duration of the drought, water supply for neither the 2035 Scenario and Full Buildout is reliably sourced. In addition, water supply for Full Buildout of the General Plan has not yet been identified beyond the total 2035 forecast water supply of 71,798 acre feet per year. Considering current water supply constraints—including the record 2013–2014 California drought and the critically overdrafted status of the Kings Sub-basin—it is uncertain whether the City would be able to secure water supplies. Therefore, water supply impacts under the 2035 Scenario and Full Buildout of the General Plan Update are significant and unavoidable.
June 2014 Page 7-1
7. Alternatives to the Proposed Project 7.1 INTRODUCTION 7.1.1 Purpose and Scope The California Environmental Quality Act (CEQA) requires that an Environmental Impact Report (EIR ) include a discussion of reasonable project alternatives that would “feasibly attain most of the basic objectives of the project, but would avoid or substantially lessen any significant effects of the project, and evaluate the comparative merits of the alternatives” (CEQA Guidelines Section 15126.6). This chapter identifies potential alternatives to the proposed project and evaluates them, as required by CEQA.
Key provisions of the CEQA Guidelines on alternatives (Section 15126.6[a] through [f]) are summarized below to explain the foundation and legal requirements for the alternatives analysis in the EIR.
“The discussion of alternatives shall focus on alternatives to the project or its location which are capable of avoiding or substantially lessening any significant effects of the project, even if these alternatives would impede to some degree the attainment of the project objectives, or would be more costly” (15126.6[b]).
“The specific alternative of ‘no project’ shall also be evaluated along with its impact” (15126.6[e][1]).
“The no project analysis shall discuss the existing conditions at the time the Notice of Preparation (NOP) is published, and at the time the environmental analysis is commenced, as well as what would reasonably be expected to occur in the foreseeable future if the project were not approved, based on current plans and consistent with available infrastructure and community services. If the environmentally superior alternative is the ‘no project’ alternative, the EIR shall also identify an environmentally superior alternative among the other alternatives” (15126.6[e][2]).
“The range of alternatives required in an EIR is governed by a ‘rule of reason’ that requires the EIR to set forth only those alternatives necessary to permit a reasoned choice. The alternatives shall be limited to ones that would avoid or substantially lessen any of the significant effects of the project” (15126.6[f]).
“Among the factors that may be taken into account when addressing the feasibility of alternatives are site suitability, economic viability, availability of infrastructure, general plan consistency, other plans or regulatory limitations, jurisdictional boundaries, and whether the proponent can reasonably acquire, control or otherwise have access to the alternative site (or the site is already owned by the proponent)” (15126.6[f][1]).
“For alternative locations, “only locations that would avoid or substantially lessen any of the significant effects of the project need be considered for inclusion in the EIR” (15126.6[f][2][A]).

G E N E R A L P L A N A N D D E V E L O P M E N T C O D E U P D A T E D R A F T P E I R C I T Y O F C L O V I S
7. Alternatives to the Proposed Project
Page 7-2 PlaceWorks
“An EIR need not consider an alternative whose effect cannot be reasonably ascertained and whose implementation is remote and speculative” (15126.6[f][3]).
For each development alternative, this analysis:
Describes the alternative,
Analyzes the impact of the alternative as compared to the proposed project,
Identifies the impacts of the project that would be avoided or lessened by the alternative,
Assesses whether the alternative would meet most of the basic project objectives,
Evaluates the comparative merits of the alternative and the project.
Per the CEQA Guidelines Section 15126.6(d), additional significant effects of the alternatives are discussed in less detail than the significant effects of the project as proposed.
7.1.2 Project Objectives As described in Section 3.2, Statement of Objectives, the following objectives have been established for the proposed project and will aid decision makers in their review of the project, the project alternatives, and associated environmental impacts:
1. Preserve the authenticity of Old Town and plan new development that creates a sense of community and place.
2. Preserve the character and quality of life of existing residential neighborhoods.
3. Accommodate 80 years of growth in the Clovis Planning Area in a sustainable urban development pattern.
4. Develop complete communities in urban centers that accommodate growth while maintaining the small town character and feel of Clovis.
5. Balance residential growth with employment generating development to ensure fiscal sustainability.
6. Create housing, employment, and lifestyle opportunities for all ages and incomes of residents.
7. Use and design public open space resources for trails, parks, and recreation.
7.1.3 Significant Impacts of the Project The following significant and unavoidable impacts are identified in Chapter 5, Environmental Analysis, of this Draft PEIR:
G E N E R A L P L A N A N D D E V E L O P M E N T C O D E U P D A T E D R A F T P E I R C I T Y O F C L O V I S
7. Alternatives to the Proposed Project
June 2014 Page 7-3
Agricultural Resources
2035 Scenario and Full Buildout
Impact 5.2-1 – Loss of Important Farmland. Buildout of the proposed General Plan Update would convert 2,651 acres of Prime Farmland, 1,528 acres of Farmland of Statewide Importance, and 1,411 acres of Unique Farmland to nonagricultural land uses.
Impact 5.2-2 – Conversion of Agriculture to Nonagricultural Use. The General Plan Update would change the land use designation of 4,610 acres designated for agriculture to other land use designations.
Impact 5.2-3 – Williamson Act. General Plan Update buildout would convert 3,047 acres of farmland bearing Williamson act contracts to nonagricultural land uses.
Implementation of the General Plan Update would result in significant, unavoidable impacts to these three impact areas. Implementation of Mitigation Measure 2-1 would not fully mitigate the direct loss of farmlands because there would still be a net reduction in the amount of land suitable for agricultural use. The impacts would therefore be significant and unavoidable under both scenarios.
Air Quality
2035 Scenario and Full Buildout
Impact 5.3-1 – Inconsistency with Air Quality Management Plan. The General Plan Update would be consistent with the San Joaquin Valley Air Pollution Control District (SJVAPCD) control measures; however, development associated with the buildout of the General Plan Update would exceed the SJVAPCD significance thresholds and be inconsistent with the applicable air quality management plans.
The proposed project would generate a substantial increase in criteria air pollutants that would exceed the SJVAPCD’s significance thresholds. Because dispersion modeling is not applicable for a program EIR, projects with emissions that exceed these values are considered to have the potential to exceed the ambient air quality standards (AAQS), resulting in a potentially significant impact with regard to consistency with SJVAPCD’s air quality plans. Therefore, despite being consistent with the control measures in the air quality management plans, to be conservative, the proposed project is considered inconsistent with the SJVAPCD’s air quality plans because emissions would exceed the regional significance thresholds. Mitigation Measures 3-1 through 3-4 would reduce emissions to the extent feasible. Goals and policies in the proposed General Plan Update would facilitate continued emissions reductions. However, due to the programmatic nature of the proposed General Plan Update, no additional mitigating policies are available to reduce emissions to less than significant levels. Therefore, Impact 5.3-1 would remain significant and unavoidable.
Impact 5.3-2 – Construction Emissions. Construction activities associated with buildout of the General Plan Update would generate short-term emissions in exceedance of SJVAPCD’S significance

G E N E R A L P L A N A N D D E V E L O P M E N T C O D E U P D A T E D R A F T P E I R C I T Y O F C L O V I S
7. Alternatives to the Proposed Project
Page 7-4 PlaceWorks
threshold criteria and would contribute to the ozone and particulate matter nonattainment designations of the SJVAB.
Implementation of Standard Condition (SC)1, Mitigation Measures 3-1 and 3-2, compliance with the City’s applicable development code sections ,and SJVAPCD rules (e.g., Rule 9510) would reduce criteria air pollutant emissions from construction-related activities. However, due to the magnitude of emissions generated by future construction, no mitigation measures are available that would reduce impacts below SJVAPCD’s thresholds. Therefore, Impact 5.3-2 would remain significant and unavoidable.
Impact 5.3-3 – Long-term Emissions. Implementation of the Land Use Plan of the proposed General Plan Update would generate long-term emissions that would exceed the SJVAPCD’s significance threshold criteria and cumulatively contribute to the ozone and particulate matter nonattainment designations of the San Joaquin Valley Air Basin (SJVAB).
Goals and policies are included as part of the proposed General Plan Update to reduce vehicle trip lengths and encourage use of alternative forms of transportation that would also reduce criteria air pollutants within the City. In addition, compliance with SJVAPCD regulations and implementation of SC-1 and Mitigation Measures 3-3 and 3-4 would reduce operational-phase emissions to the extent possible. However, due to the magnitude of emissions generated by the planned land uses, no mitigation measures are available that would reduce emissions below SJVAPCD’s thresholds. Therefore, Impact 5.3-3 would remain significant and unavoidable.
Cultural Resources
2035 Scenario and Full Buildout
Impact 5.5-1 – Historic Resources. Development in accordance with the General Plan Update could impact up to 30 historic buildings, structures, or objects identified through previous cultural research studies and up to 12 additional historic resources identified and listed on the Fresno County List of Historic Resources.
The proposed General Plan Update would allow development in areas that have historic resources identified by previous cultural resource surveys and the Fresno County List of Historic Places. Development in these areas would, therefore, potentially cause the disturbance of historic resources in the Plan Area. Mitigation Measure 5-1 requires historic resources assessments prior to construction of projects that may impact historic resources. Mitigation Measures 5-2 and 5-3 would reduce impacts to historic resources, for instance, through recordation of resources required under Mitigation Measure 5-3. However, impacts to historic resources would remain significant and unavoidable for both the 2035 Scenario and Full Buildout.

G E N E R A L P L A N A N D D E V E L O P M E N T C O D E U P D A T E D R A F T P E I R C I T Y O F C L O V I S
7. Alternatives to the Proposed Project
June 2014 Page 7-5
Greenhouse Gas Emissions
2035 Scenario and Full Buildout
Impact 5.7-1 – Greenhouse Gas Emissions. Implementation of the proposed General Plan Update would result in a substantial increase in GHG emissions for year 2035 and Full Buildout compared to existing conditions. Additionally, though community-wide GHG emissions at year 2035 and Full Buildout would be less than business-as-usual (BAU) conditions, the proposed General Plan Update would not meet the SJVAPCD threshold of 29 percent below BAU and would also not meet the long-term reduction target of Executive Order S-03-05.
Compliance with statewide measures would reduce GHG emissions associated with implementation of the proposed General Plan Update. Implementation of the proposed General Plan Update would improve the job-to-housing ratio (see Table 5.13-9) to 0.93 job per household in year 2035 compared to the current 0.74 ratio, and to 1.0 job per household after Full Buildout. This improved ratio would contribute to shortening the average trip distance of residents to their place of employment and would contribute to the reduction of total vehicle miles traveled in the City and its areas, resulting in a reduction in GHG emissions per capita in the Clovis Plan Area. Furthermore, the policies in the proposed General Plan Update, SC-1, Mitigation Measures 3-1, 3-4, and 3-5 identified in Section 5.3, Air Quality, and Mitigation Measure 7-1 would ensure that GHG emissions from buildout of the proposed General Plan Update would be minimized to the extent feasible.
However, due to the magnitude of the proposed General Plan Update, its implementation would result in a substantial increase in GHG emissions over existing conditions in year 2035 and Full Buildout and would not meet the SJVAPCD threshold of 29 percent below BAU. Additional statewide measures would be necessary to reduce GHG emissions under the proposed General Plan Update to meet the SJVAPCD BAU threshold and the reduction target of Executive Order S-03-05. As identified by the California Council on Science and Technology, the state cannot meet the 2050 goal without major advancements in technology. Since no additional statewide measures to reduce emissions beyond year 2020 are available, Impact 5.7-1 would be significant and unavoidable.
Hydrology and Water Quality
2035 Scenario and Full Buildout Impact 5.9-2 – Groundwater Use. Development pursuant to the General Plan Update would increase
the demand on groundwater use and also increase impervious surfaces in the Plan Area, which would impact opportunities for groundwater recharge.
Based on the 2010 Urban Water Management Plan, forecast water supplies available to the City of Clovis would meet estimated water demands generated by buildout of the General Plan Update under the 2035 Scenario, but would not meet demands at full buildout (see the analysis of impacts on water supplies in Section 5.17.1, Water Service, of this Draft PEIR). Although the estimated population of the Plan Area at buildout of the 2035 Scenario (184,100 persons) is lower than the 2035 population estimate in the 2010
G E N E R A L P L A N A N D D E V E L O P M E N T C O D E U P D A T E D R A F T P E I R C I T Y O F C L O V I S
7. Alternatives to the Proposed Project
Page 7-6 PlaceWorks
City of Clovis UWMP (188,224 persons), as discussed in the Section 5.17.1, Water Service, the duration and severity of the current drought is unknown. In addition, full buildout would require the City to obtain expanded water supplies other than groundwater—that is, local surface water, imported water, recycled water (for nonpotable uses), or some combination thereof—to avoid depleting groundwater to meet water demands by full General Plan Update buildout. The potential for development in accordance with the General Plan Update to deplete groundwater or interfere with groundwater recharge, therefore, is determined to be potentially significant in both the 2035 Scenario and Full Buildout.
Details on long-term water planning and regulatory measures are included in Section 5.17, Utilities and Service Systems. However, no mitigation measures beyond the long-term facility planning, conservation measures, recycling projects, and existing regulatory measures (e.g., SB 610 and SB 221) have been identified to address the proposed project’s significant impact on water supply and groundwater depletion/recharge opportunities. Thus, Impact 5.9-2 would remain significant and unavoidable.
Noise
2035 Scenario and Full Buildout
Impact 5.12-1 –Traffic Noise. Development of the proposed land use plan would result in an increase in traffic, which would cause a substantial environmental noise increase to noise-sensitive uses adjacent to roadways.
Traffic generated by buildout of the General Plan Update would substantially increase traffic noise along major traffic corridors in the Plan Area and could expose existing and planned residents to substantial noise levels. To reduce potential noise impacts to new sensitive land uses, Environmental Safety Element Policy 3.1 would require mitigation measures to ensure existing and future land use compatibility; Policy 3.2 would discourage land use and traffic patterns that would expose sensitive land uses or noise-sensitive areas to unacceptable noise levels; Policy 3.5 would minimize noise impacts by requiring appropriate site, circulation, equipment, and building design, and sound walls, landscaping, and other buffers; and Policy 3.9 would require the City to coordinate with Caltrans to ensure the inclusion of noise mitigation measures in the design of new highway projects or improvements to existing facilities. However, these policies would only affect new land uses. There are no feasible mitigation measures available that would prevent impacts to existing homes fronting the major transportation corridors. Thus, Impact 5.12-1 would remain significant and unavoidable.
Impact 5.12-4 – Construction Vibration. Buildout of the individual land uses and projects for implementation of the General Plan could expose sensitive uses to strong groundborne vibration.
Mitigation Measure 12-1 would reduce vibration impacts associated with construction by requiring alternate construction methods to reduce vibration. However, it cannot be guaranteed that these methods can be implemented and that vibration impacts from future projects would not occur. Consequently, Impact 5.12-4 would remain significant and unavoidable.

G E N E R A L P L A N A N D D E V E L O P M E N T C O D E U P D A T E D R A F T P E I R C I T Y O F C L O V I S
7. Alternatives to the Proposed Project
June 2014 Page 7-7
Impact 5.12-5 – Construction Noise. Construction activities associated with buildout of the individual land uses and projects for implementation of the General Plan would substantially elevate noise levels in the vicinity of noise-sensitive land uses.
Mitigation Measure 12-2 would reduce construction noise impacts to the extent feasible. However, distance, source to receiver geometry, and other site conditions may render the mitigation measure infeasible or ineffective for all future projects in the Plan Area. Thus, Mitigation Measure 12-2 would not guarantee that construction noise impacts would be reduced to less than significant levels. Consequently, Impact 5.12-5 would remain significant and unavoidable.
Population and Housing
Full Buildout Impact 5.13-1 – Population Growth. Under the 2035 Scenario, buildout of the General Plan Update
would result in similar population growth as projected by the Fresno COG; however, Full Buildout of the proposed project would increase population in the Plan Area by over 150 percent by year 2080, which is beyond Fresno COG’s planning horizon.
Full buildout of the proposed project would result in up to 294,300 people compared to the existing population of 115,000 person in the Plan Area. This 156 percent increase in population would occur both directly through proposed residential, commercial, and office uses under the proposed land use plan and indirectly through planned extensions and improvements of roads and infrastructure into the SOI and non-SOI Plan Area. Furthermore, because the Fresno COG population projections do not exceed its 25-year planning horizon, it is uncertain whether the City of Clovis’ population growth beyond 2035 would keep pace with the proposed project’s population growth.
Transportation and Traffic
2035 Scenario
Impact 5.16-1 – Roadway Segment Operation. Project-related trip generation would impact levels of service for the existing area roadway system.
Upon implementation of the land uses and circulation element included in the General Plan Update, one roadway segment in the City of Clovis and several segments in the County of Fresno are projected to operate at unacceptable level of service (LOS) in 2035.
City of Clovis
Minnewawa Avenue: Shaw Avenue to Ashlan Avenue (LOS F in PM peak hours)
Within the City of Clovis, this segment of Minnewawa Avenue from Shaw Avenue to Ashlan Avenue would operate at LOS F in PM peak hour; however, it is a roadway segment in which an exception to the

G E N E R A L P L A N A N D D E V E L O P M E N T C O D E U P D A T E D R A F T P E I R C I T Y O F C L O V I S
7. Alternatives to the Proposed Project
Page 7-8 PlaceWorks
City’s LOS standard would apply, per Policy 2.1 of the General Plan Update. Thus, no roadways in the City of Clovis would operate at unacceptable LOS in the 2035 Scenario.
County of Fresno
Copper Avenue: Willow Avenue to Auberry Road (LOS E in AM peak hour)
Copper Avenue: Auberry Road to Minnewawa Avenue (LOS F in AM and PM peak hours)
Behymer Avenue: Clovis Avenue to Fowler Avenue (LOS D in PM peak hour)
Herndon Avenue: McCall Avenue to Academy Avenue (LOS D in PM peak hour)
Ashlan Avenue: Minnewawa Avenue to Clovis Avenue (LOS F in AM and PM peak hours)
Ashlan Avenue: McCall Avenue to Academy Avenue (LOS D in PM peak hour)
Minnewawa Avenue: Copper Avenue to Behymer Avenue (LOS F in AM and PM peak hours)
Fowler Avenue: Behymer Avenue to Shepherd Avenue (LOS E in PM peak hour)
DeWolf Avenue: Herndon Avenue to Bullard Avenue (LOS D in AM and PM peak hour)
McCall Avenue: Herndon Avenue to Shaw Avenue (LOS F in AM and PM peak hours)
Academy Avenue: Herndon Avenue to Shaw Avenue (LOS D in PM peak hour)
Since these roadways are not under the City’s jurisdiction, impacts would remain significant and unavoidable.
Caltrans Facilities
SR 168 Eastbound: McKinley Avenue to Shields Avenue (LOS E in AM and PM peak hours)
SR 168 Eastbound: Shields Avenue to Ashlan Avenue (LOS E in AM and PM peak hours)
SR 168 Westbound: Ashlan Avenue to Shields Avenue (LOS E in AM peak hour)
SR 168 Eastbound: Herndon Avenue to Fowler Avenue (LOS E in PM peak hour)
SR 168 Westbound: Fowler Avenue to Herndon Avenue (LOS F in AM peak hour; LOS E in PM peak hour)
SR 168 Westbound: Temperance Avenue to Fowler Avenue (LOS E in AM peak hour)
SR 168: Temperance Avenue to Owens Mountain Parkway (LOS F in PM peak hour)
Although traffic improvements have been identified that could mitigate these impacts, these improvements would be under the jurisdiction of Caltrans. Since the City of Clovis does not have control over the implementation of these mitigation measures, this impact would remain significant and unavoidable.
Full Buildout
Impact 5.16-1 – Roadway Segment Operation. At Full Buildout, several roadway segments in the City of Clovis and County of Fresno and several Caltrans facilities would be impacted and require improvements, including segment extensions and lane expansions:

G E N E R A L P L A N A N D D E V E L O P M E N T C O D E U P D A T E D R A F T P E I R C I T Y O F C L O V I S
7. Alternatives to the Proposed Project
June 2014 Page 7-9
City of Clovis (includes roadways in Clovis’ future jurisdictional boundary)
Copper Avenue: Willow Avenue to Auberry Road
Copper Avenue: Auberry Road to Clovis Avenue
Behymer Avenue: Willow Avenue to Clovis Avenue
Minnewawa Avenue: Shepherd Avenue to Behymer Avenue
Clovis Avenue: extended north from Behymer Avenue to Copper Avenue as a 4-lane arterial
Clovis Avenue: Shepherd Avenue to Perrin Avenue
Owens Mountain Parkway: DeWolf Avenue to “Muncie Avenue” (east-west collector street east of SR 168)
Owens Mountain Parkway: McCall Avenue to “Dockery Avenue” (north-south arterial street east of McCall Avenue in Northeast Urban Center)
Herndon Avenue: McCall Avenue to “Del Rey Avenue” (north-south collector street west of Academy Avenue in Northeast Urban Center)
McCall Avenue: SR 168 to Owens Mountain Parkway
McCall Avenue: north of Herndon Avenue
Ashlan Avenue: Thompson Avenue to McCall Avenue
DeWolf Avenue: Bullard Avenue south to City Limits
Leonard Avenue: Bullard Avenue south to City Limits
Shepherd Avenue: Willow Avenue to Temperance Road
Alluvial Avenue: Clovis Avenue to Temperance Avenue
Herndon Avenue: Temperance Avenue to DeWolf Avenue
Gettysburg Avenue: Clovis Avenue to Sierra Vista Parkway
Willow Avenue: Herndon Avenue to Escalon Avenue
Sunnyside Avenue: Alluvial Avenue to Fifth Street
Fowler Avenue: Enterprise Canal to Nees Avenue
Armstrong Avenue: Alluvial Avenue to Herndon Avenue
County of Fresno
McCall Avenue: Herndon Avenue to SR 180
Academy Avenue: Herndon Avenue to Shaw Avenue
Caltrans Facilities
SR 168: Herndon Avenue to Temperance Avenue
SR 168: Temperance Avenue to Shepherd Avenue/McCall Avenue
SR 168: Shepherd Avenue/McCall Avenue to “Dockery Avenue”

G E N E R A L P L A N A N D D E V E L O P M E N T C O D E U P D A T E D R A F T P E I R C I T Y O F C L O V I S
7. Alternatives to the Proposed Project
Page 7-10 PlaceWorks
SR 168: east of “Dockery Avenue” to east of “Indianola Avenue” (north-south arterial west of Academy Avenue in Northeast Urban Center)
Changes in technology, demographics, and economic conditions, particularly over a long timeframe (e.g., 40+ years), may affect people’s travel behavior in ways that are not captured by the traffic model and would be speculative to predict at this time. Because the Full Buildout of the General Plan is not expected to occur until approximately 2080, and given the limitations to predicting traffic, it is not possible to reasonably predict future traffic volumes on roadways and the required capacity to meet applicable LOS standards.
As presented above, several segments would need to be expanded and extended. At the time of the preparation of this analysis, no funding sources have been identified to implement the required improvements, and many of the segments are outside of the City of Clovis’ jurisdiction. Therefore, this would be a significant unavoidable impact.
Utilities and Service Systems
2035 Scenario and Full Buildout
Impact 5.17-1 – Water Supply. Projected water supply is inadequate to meet projected water demand at both 2035 Scenario and Full Buildout of the proposed General Plan.
Although adequate water supplies have been identified in the 2010 Urban Water Management Plan for demand as projected for 2035, this volume of water would only be available if all SOI land within Fresno Irrigation District (FID) boundary was developed. The water supply associated with any undeveloped land within FID boundary would not be available to the City, and for any development that is outside the boundaries of FID, Garfield Water District or International Water District does not bring with it a supply of surface water. Furthermore, all of this information does not take into account recent drought conditions. Given the uncertainty of the ongoing severity and duration of the drought, water supply availability for both the 2035 Scenario and Full Buildout is not reliably sourced. In addition, water supply for Full Buildout of the General Plan has not yet been identified beyond the total 2035 forecast water supply of 71,798 acre feet per year. Considering current water supply constraints—including the record 2013–2014 California drought and the critically overdrafted status of the Kings Subbasin—it is uncertain whether the City would be able to secure water supplies. Therefore, water supply impacts under the 2035 Scenario and Full Buildout of the General Plan Update are significant and unavoidable.
7.2 ALTERNATIVES CONSIDERED AND REJECTED DURING THE SCOPING/PROJECT PLANNING PROCESS
The following is a discussion of the land use alternatives considered during the scoping and planning process and the reasons why they were not selected for detailed analysis in this Draft PEIR.

G E N E R A L P L A N A N D D E V E L O P M E N T C O D E U P D A T E D R A F T P E I R C I T Y O F C L O V I S
7. Alternatives to the Proposed Project
June 2014 Page 7-11
7.2.1 Alternative Development Areas CEQA requires that the discussion of alternatives focus on alternatives to the project or its location that are capable of avoiding or substantially lessening any significant effects of the project. The key question and first step in the analysis is whether any of the significant effects of the project would be avoided or substantially lessened by putting the project in another location. Only locations that would avoid or substantially lessen any of the significant effects of the project need be considered for inclusion in the EIR (Guidelines Sec. 15126[5][B][1]). The proposed project is the General Plan Update for the City of Clovis. The City does not have authority to carry out functions pursuant to its General Plan, including regulating land uses, outside of the City’s boundaries. Therefore, an alternative development area would be infeasible and was not analyzed.
7.3 ALTERNATIVES SELECTED FOR FURTHER ANALYSIS In addition to the No Project Alternative required by CEQA, the following three alternatives have been determined to represent a reasonable range of alternatives with the potential to feasibly attain most of the basic objectives of the project but may avoid or substantially lessen any of the significant effects of the project. The No Project Alternative and these alternatives are analyzed in detail in the following sections.
Moderate Growth within SOI Alternative
Concentrated Growth within SOI Alternative
Low Density Growth Alternative
An EIR must identify an “environmentally superior” alternative, and where the No Project Alternative is identified as environmentally superior, the EIR is then required to identify as environmentally superior an alternative from among the others evaluated. Each alternative's environmental impacts are compared to the proposed project and determined to be environmentally superior, neutral, or inferior. However, only those impacts found significant are used in making the final determination of whether an alternative is environmentally superior or inferior to the proposed project. Impacts involving agricultural resources, air quality, cultural resources, greenhouse gas emissions, hydrology and water quality, noise, population and housing, traffic, and utilities and service systems were found to be significant and unavoidable for the proposed General Plan Update. Section 7.8 identifies the Environmentally Superior Alternative.
The Preferred Land Use Alternative (proposed General Plan and Development Code Update) is analyzed in detail in Chapter 5 of this Draft PEIR.
7.3.1 Alternatives Comparison The following statistical analysis provides a summary of general socioeconomic buildout projections for the four land use alternatives and the proposed project. The statistics do not represent growth projections, but provide buildout scenarios that would only occur if all the areas of the City were to develop to the densities likely under the respective land use alternatives. Table 7-1 identifies City-wide information regarding dwelling units, households, population and employment, and building square footage buildouts for each of the alternatives.

G E N E R A L P L A N A N D D E V E L O P M E N T C O D E U P D A T E D R A F T P E I R C I T Y O F C L O V I S
7. Alternatives to the Proposed Project
Page 7-12 PlaceWorks
Table 7-1 Buildout Statistical Summary Acres Units Household Population Employment Building SF PROPOSED PROJECT 2035 Scenario 47,805 67,200 63,900 184,100 62,400 37,410,000 Full Buildout 47,805 107,100 101,800 294,300 106,900 51,300,000 ALTERNATIVES No Project/Existing General Plan 2035 Scenario 47,805 66,825 63,425 184,185 50,422 25,950,000 Full Buildout 47,805 80,100 76,000 221,400 87,200 52,000,000 Moderate Growth within SOI 2035 Scenario 47,805 66,990 63,930 183,240 49,003 40,262,500 Full Buildout 47,805 73,850 70,450 202,100 73,925 40,262,500 Concentrated Growth within SOI 2035 Scenario 47,805 50,470 48,085 138,285 43,060 15,537,000 Full Buildout 47,805 107,450 102,150 295,200 106,900 51,300,000 Low Density Growth 2035 Scenario 47,805 54,050 51,650 148,125 43,550 18,507,500 Full Buildout 47,805 54,050 51,650 148,125 43,550 18,507,500 Source: City of Clovis 1993 General Plan Land Use Element Alternative buildout statistics generated by PlaceWorks.
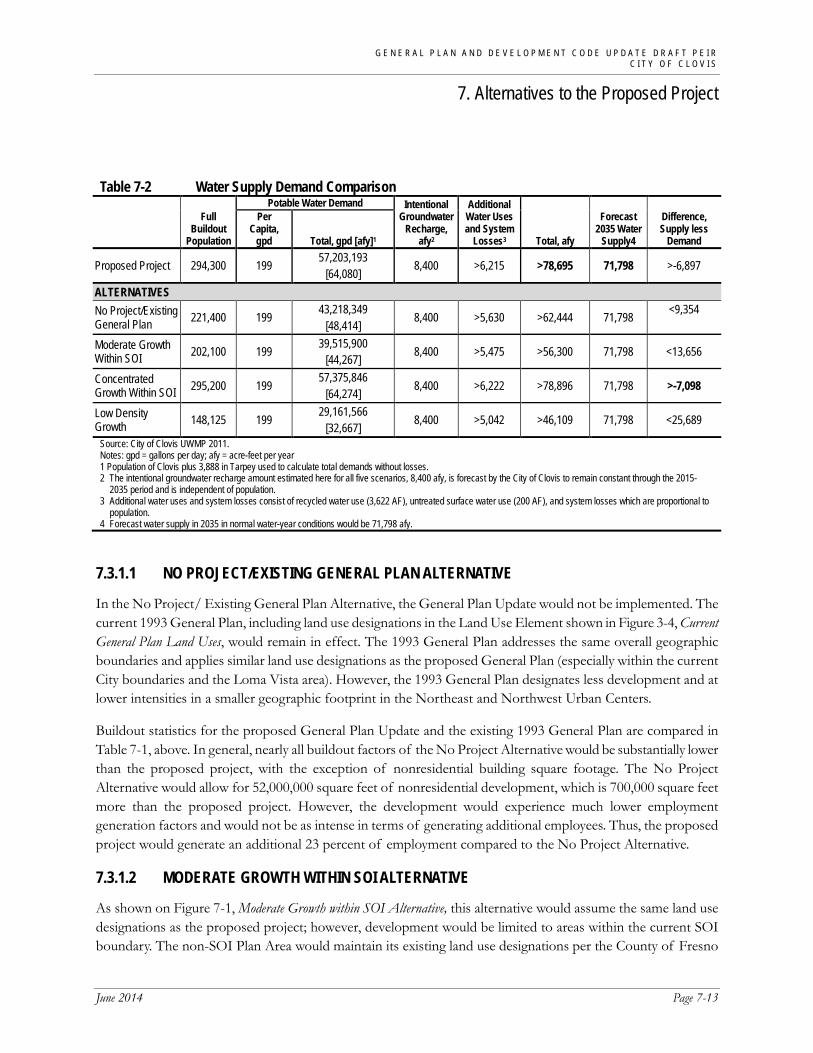
Table 7-2 provides a comparison of water supply demand that would be generated at Full Buildout of the proposed General Plan Update and each of the alternatives. Because the City’s 2010 Urban Water Management Plan (UWMP) does not forecast water supply past year 2035, the table compares Full Buildout water demands to 2035 forecast water supply.
G E N E R A L P L A N A N D D E V E L O P M E N T C O D E U P D A T E D R A F T P E I R C I T Y O F C L O V I S
7. Alternatives to the Proposed Project
June 2014 Page 7-13
Table 7-2 Water Supply Demand Comparison
Full Buildout
Population
Potable Water Demand Intentional Groundwater
Recharge, afy2
Additional Water Uses and System
Losses3 Total, afy
Forecast 2035 Water
Supply4
Difference, Supply less
Demand
Per Capita,
gpd Total, gpd [afy]1
Proposed Project 294,300 199 57,203,193 [64,080] 8,400 >6,215 >78,695 71,798 >-6,897
ALTERNATIVES No Project/Existing General Plan 221,400 199 43,218,349
[48,414] 8,400 >5,630 >62,444 71,798 <9,354
Moderate Growth Within SOI 202,100 199 39,515,900
[44,267] 8,400 >5,475 >56,300 71,798 <13,656
Concentrated Growth Within SOI 295,200 199 57,375,846
[64,274] 8,400 >6,222 >78,896 71,798 >-7,098
Low Density Growth 148,125 199 29,161,566
[32,667] 8,400 >5,042 >46,109 71,798 <25,689
Source: City of Clovis UWMP 2011. Notes: gpd = gallons per day; afy = acre-feet per year 1 Population of Clovis plus 3,888 in Tarpey used to calculate total demands without losses. 2 The intentional groundwater recharge amount estimated here for all five scenarios, 8,400 afy, is forecast by the City of Clovis to remain constant through the 2015-
2035 period and is independent of population. 3 Additional water uses and system losses consist of recycled water use (3,622 AF), untreated surface water use (200 AF), and system losses which are proportional to
population. 4 Forecast water supply in 2035 in normal water-year conditions would be 71,798 afy.
7.3.1.1 NO PROJECT/EXISTING GENERAL PLAN ALTERNATIVE
In the No Project/ Existing General Plan Alternative, the General Plan Update would not be implemented. The current 1993 General Plan, including land use designations in the Land Use Element shown in Figure 3-4, Current General Plan Land Uses, would remain in effect. The 1993 General Plan addresses the same overall geographic boundaries and applies similar land use designations as the proposed General Plan (especially within the current City boundaries and the Loma Vista area). However, the 1993 General Plan designates less development and at lower intensities in a smaller geographic footprint in the Northeast and Northwest Urban Centers.
Buildout statistics for the proposed General Plan Update and the existing 1993 General Plan are compared in Table 7-1, above. In general, nearly all buildout factors of the No Project Alternative would be substantially lower than the proposed project, with the exception of nonresidential building square footage. The No Project Alternative would allow for 52,000,000 square feet of nonresidential development, which is 700,000 square feet more than the proposed project. However, the development would experience much lower employment generation factors and would not be as intense in terms of generating additional employees. Thus, the proposed project would generate an additional 23 percent of employment compared to the No Project Alternative.
7.3.1.2 MODERATE GROWTH WITHIN SOI ALTERNATIVE
As shown on Figure 7-1, Moderate Growth within SOI Alternative, this alternative would assume the same land use designations as the proposed project; however, development would be limited to areas within the current SOI boundary. The non-SOI Plan Area would maintain its existing land use designations per the County of Fresno

G E N E R A L P L A N A N D D E V E L O P M E N T C O D E U P D A T E D R A F T P E I R C I T Y O F C L O V I S
7. Alternatives to the Proposed Project
Page 7-14 PlaceWorks
General Plan. The only change of land use designation within the SOI boundary would be to the eastern Loma Vista parcels adjacent to McCall Avenue. These parcels would be lowered in density from Mixed Use Business Campus to Low Density Residential given that McCall Avenue would not be developed to accommodate such high use if development stays only within the SOI boundary. In this alternative only 5,250 residential units and 262,500 square feet of nonresidential uses would be developed in the non-SOI Plan Area, compared to 38,500 units and 11,300,000 square feet that would be developed in that area by the proposed General Plan Update. The total numbers of residents and employees in the Plan Area at buildout of this alternative would each be approximately 31 percent less than corresponding numbers at full buildout of the proposed General Plan Update.
7.3.1.3 CONCENTRATED GROWTH WITHIN SOI ALTERNATIVE
The Concentrated Growth within SOI Alternative would accommodate the same level of development as the proposed project; however, there would be no change to designations outside of the SOI boundary, which would maintain its existing land use designations per the County of Fresno land use plan. In order to accommodate the same level of development, this alternative would substantially increase density in various areas within the City and SOI, particularly in Loma Vista and Northwest Urban Center (see Figure 7-2, Concentrated Growth within SOI Alternative). For example, proposed residential uses would increase from Very Low or Low Density Residential to Medium High, High, and Very High Density Residential. At buildout of this alternative, over 96 percent of residential units and over 99 percent of nonresidential building in the Plan Area would be within the SOI.
7.3.1.4 LOW DENSITY GROWTH ALTERNATIVE
Similar to the proposed General Plan Update, the Low Density Growth Alternative would designate land uses across the entire Plan Area. However, it would substantially reduce development intensity. This alternative would significantly lower density in various areas within the City’s SOI and the Northeast and Northwest Urban Centers (see Figure 7-3, Low Density Growth Alternative). For example, the highest density residential designation would be Medium Density Residential with a maximum density of seven units per acre. In the urban centers, parcels adjacent to agricultural uses and rural residential areas are further reduced to Very Low Density Residential. Employment would also be limited to a handful of retail and business centers. Population and the number of housing units at buildout of this alternative would each be reduced by about half compared to the proposed project; employment would be reduced by about 59 percent; and nonresidential building area would be reduced by approximately 64 percent.

Ak
Ak
International
Shaw
Gettysburg
Academ
y
Greenw
oodBethel
Indian
ola
Del Re
y
Copper
Dakota
Behymer
Perrin
Shepherd
Teague
Nees
Alluvial
Herndon
Sierra
Bullard
Barstow
Ashlan
Dockne
y
McCall
Thomp
sonHighlan
d
Leonar
d
DeWolf
Locan
Temper
ance
Armstro
ng
Fowler
Sunnys
ideClovis
Minnew
awaPeach
Willow
Shields
FRIANT - KERN CANAL
CLO-14.0 6.9.14
City of Clovis Proposed General Plan Land UseAG - Agrilculture (1 DU/20 AC)RR - Rural Residential (1 DU/2 AC)VL - Very Low Density Residential (0.6-2.0 DU/Ac)L - Low Density Residential (2.1-4.0 DU/Ac)M -Medium Density Residential (4.1-7.0 DU/Ac)MH - Medium High Density Resid.(7.1-15.0 DU/Ac)H - High Density Residential (15.1-25.0 DU/Ac)VH - Very High Density Residential (25.1-43.0 DU/Ac)MU-V - Mixed Use VillageMU-BC - Mixed Use/Business CampusO - OfficeI - IndustrialNC - Neighborhood CommercialGC - General CommercialOS - Open SpaceP - Public/Quasi-Public FacilitiesPK - ParkS - SchoolW - Water
Fresno County General Plan Land UseAG - AgricultureRR - Rural ResidentialC-SP - Special CommercialPRC-FC - Planned Residental CommunityFlood Control Facilities Outside SOICity BoundarySphere of Influence BoundaryUrban Center BoundaryPlan Area Boundary
0 10.5Miles
Source: PlaceWorks, 2014
Environmental Impact Report
Moderate Growth withinSOI AlternativeFigure 7-17. Project Alternatives

G E N E R A L P L A N A N D D E V E L O P M E N T C O D E U P D A T E D R A F T P E I R C I T Y O F C L O V I S
7. Alternatives to the Proposed Project
Page 7-16 PlaceWorks
This page intentionally left blank.

Ak
Ak
International
Shaw
Gettysburg
Academ
y
Greenw
oodBethel
Indian
ola
Del Re
y
Copper
Dakota
Behymer
Perrin
Shepherd
Teague
Nees
Alluvial
Herndon
Sierra
Bullard
Barstow
Ashlan
Dockne
y
McCall
Thomp
sonHighlan
d
Leonar
d
DeWolf
Locan
Temper
ance
Armstro
ng
Fowler
Sunnys
ideClovis
Minnew
awaPeach
Willow
Shields
FRIANT - KERN CANAL
CLO-14.0 6.9.14
City of Clovis Proposed General Plan Land UseAG - Agrilculture (1 DU/20 AC)RR - Rural Residential (1 DU/2 AC)VL - Very Low Density Residential (0.6-2.0 DU/Ac)L - Low Density Residential (2.1-4.0 DU/Ac)M -Medium Density Residential (4.1-7.0 DU/Ac)MH - Medium High Density Resid.(7.1-15.0 DU/Ac)H - High Density Residential (15.1-25.0 DU/Ac)VH - Very High Density Residential (25.1-43.0 DU/Ac)MU-V - Mixed Use VillageMU-BC - Mixed Use/Business CampusO - OfficeI - IndustrialNC - Neighborhood CommercialGC - General CommercialOS - Open SpaceP - Public/Quasi-Public FacilitiesPK - ParkS - SchoolW - Water
Fresno County General Plan Land UseAG - AgricultureRR - Rural ResidentialC-SP - Special CommercialPRC-FC - Planned Residental CommunityFlood Control Facilities Outside SOICity BoundarySphere of Influence BoundaryUrban Center BoundaryPlan Area Boundary
0 10.5Miles
Source: PlaceWorks, 2014
Environmental Impact Report
Concentrated Growth withinSOI AlternativeFigure 7-27. Project Alternatives
G E N E R A L P L A N A N D D E V E L O P M E N T C O D E U P D A T E D R A F T P E I R C I T Y O F C L O V I S
7. Alternatives to the Proposed Project
Page 7-18 PlaceWorks
This page intentionally left blank.

Ak
Ak
International
Shaw
Gettysburg
Academ
y
Greenw
oodBethel
Indian
ola
Del Re
y
Copper
Dakota
Behymer
Perrin
Shepherd
Teague
Nees
Alluvial
Herndon
Sierra
Bullard
Barstow
Ashlan
Dockne
y
McCall
Thomp
sonHighlan
d
Leonar
d
DeWolf
Locan
Temper
ance
Armstro
ng
Fowler
Sunnys
ideClovis
Minnew
awaPeach
Willow
Shields
FRIANT - KERN CANAL
CLO-14.0 6.9.14
City of Clovis Proposed General Plan Land UseAG - Agrilculture (1 DU/20 AC)RR - Rural Residential (1 DU/2 AC)VL - Very Low Density Residential (0.6-2.0 DU/Ac)L - Low Density Residential (2.1-4.0 DU/Ac)M -Medium Density Residential (4.1-7.0 DU/Ac)MH - Medium High Density Resid.(7.1-15.0 DU/Ac)H - High Density Residential (15.1-25.0 DU/Ac)MU-V - Mixed Use VillageMU-BC - Mixed Use/Business CampusO - OfficeI - IndustrialNC - Neighborhood CommercialGC - General CommercialOS - Open SpaceP - Public/Quasi-Public FacilitiesPK - ParkS - SchoolW - Water
Fresno County General Plan Land UsePRC-FC - Planned Residential CommunityC-SP - Commercial SpecializedCity BoundarySphere of Influence BoundaryUrban Center BoundaryPlan Area Boundary
0 10.5Miles
Source: PlaceWorks, 2014
Environmental Impact Report
Low Density GrowthAlternativeFigure 7-37. Project Alternatives

G E N E R A L P L A N A N D D E V E L O P M E N T C O D E U P D A T E D R A F T P E I R C I T Y O F C L O V I S
7. Alternatives to the Proposed Project
Page 7-20 PlaceWorks
This page intentionally left blank.

G E N E R A L P L A N A N D D E V E L O P M E N T C O D E U P D A T E D R A F T P E I R C I T Y O F C L O V I S
7. Alternatives to the Proposed Project
June 2014 Page 7-21
7.4 NO PROJECT/EXISTING GENERAL PLAN ALTERNATIVE Aesthetics
The current land use plan designates development primarily in the SOI and three growth areas at a lower intensity than the proposed project. For example, most of the land use designations within the three urban centers under the current general plan are Low Density Residential, Rural Residential, and Agriculture; the General Plan Update land use plan would allow for mostly Medium, Medium-High, and High Density Residential, Mixed Use Village, and Mixed Use Business Campuses. Within the City limits, the General Plan Update has similar land use designations as the current General Plan. Lower density development in the SOI and non-SOI Plan Area would preserve the rural, agricultural nature, and scenic views of the Sierra Nevada. However, under the General Plan Update, the three urban centers would be developed as mixed-use neighborhoods, which would enhance the aesthetic appeal and quality of the urban centers by providing residential, commercial, and office uses. Thus, overall aesthetic impacts under the No Project Alternative would be similar to the proposed project in both the 2035 and Full Buildout Scenarios.
Agriculture and Forestry Resources
Agriculture resource impacts would be reduced under this alternative because the existing land use plan has a reduced development footprint compared to the proposed land use plan. Much of the Northeast and Northwest Urban Centers and Loma Vista would preserve agricultural and rural residential uses, and fewer areas of important farmland in the Plan Area would be impacted. This alternative preserves a total of 12,417 acres in the Plan Area designated for uses compatible with current and/or future agricultural use—that is, agriculture, park, or open space. By comparison, the proposed General Plan Update would designate 10,400 acres for such uses. Though conversion of farmland to nonagricultural uses would be reduced in this alternative, it is expected that this impact would remain significant and unavoidable for both the 2035 and Full Buildout Scenarios.
Air Quality
This alternative would result in a reduction of 27,000 residential units and a slight increase of 700,000 square feet of nonresidential uses in the Plan Area. Overall, the reduction in residential units would result in a reduction in average daily trips (ADT) and mobile-source emissions. Furthermore, stationary-source emissions would be reduced because there would be fewer homes and buildings developed under the No Project Alternative. Additionally, a reduction in developments would reduce short-term emissions related to project construction activities. Although this alternative would reduce both long- and short-term pollutant emissions, it would not eliminate significant short- and long-term criteria pollutant contributions of volatile organic compounds (VOC), NOX, CO, PM10, and PM2.5; it would not be consistent with the air quality management plan, since criteria pollutants thresholds would be exceeded; and it would cumulatively contribute to the SJVAB nonattainment designations for O3 and PM2.5. Implementation of the proposed land use plan was found to have significant and unavoidable impacts to short- and long-term air quality. In comparison, this alternative would reduce but not eliminate short- and long-term air quality impacts for the 2035 and Full Buildout Scenarios.
G E N E R A L P L A N A N D D E V E L O P M E N T C O D E U P D A T E D R A F T P E I R C I T Y O F C L O V I S
7. Alternatives to the Proposed Project
Page 7-22 PlaceWorks
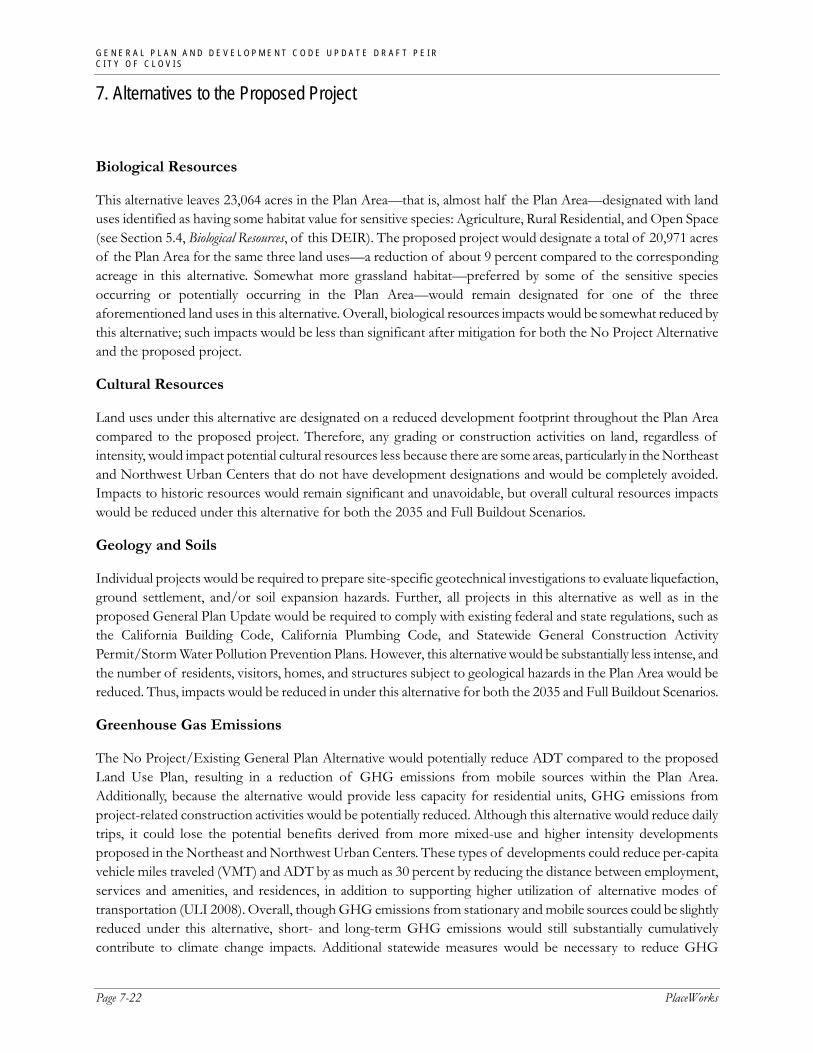
Biological Resources
This alternative leaves 23,064 acres in the Plan Area—that is, almost half the Plan Area—designated with land uses identified as having some habitat value for sensitive species: Agriculture, Rural Residential, and Open Space (see Section 5.4, Biological Resources, of this DEIR). The proposed project would designate a total of 20,971 acres of the Plan Area for the same three land uses—a reduction of about 9 percent compared to the corresponding acreage in this alternative. Somewhat more grassland habitat—preferred by some of the sensitive species occurring or potentially occurring in the Plan Area—would remain designated for one of the three aforementioned land uses in this alternative. Overall, biological resources impacts would be somewhat reduced by this alternative; such impacts would be less than significant after mitigation for both the No Project Alternative and the proposed project.
Cultural Resources
Land uses under this alternative are designated on a reduced development footprint throughout the Plan Area compared to the proposed project. Therefore, any grading or construction activities on land, regardless of intensity, would impact potential cultural resources less because there are some areas, particularly in the Northeast and Northwest Urban Centers that do not have development designations and would be completely avoided. Impacts to historic resources would remain significant and unavoidable, but overall cultural resources impacts would be reduced under this alternative for both the 2035 and Full Buildout Scenarios.
Geology and Soils
Individual projects would be required to prepare site-specific geotechnical investigations to evaluate liquefaction, ground settlement, and/or soil expansion hazards. Further, all projects in this alternative as well as in the proposed General Plan Update would be required to comply with existing federal and state regulations, such as the California Building Code, California Plumbing Code, and Statewide General Construction Activity Permit/Storm Water Pollution Prevention Plans. However, this alternative would be substantially less intense, and the number of residents, visitors, homes, and structures subject to geological hazards in the Plan Area would be reduced. Thus, impacts would be reduced in under this alternative for both the 2035 and Full Buildout Scenarios.
Greenhouse Gas Emissions
The No Project/Existing General Plan Alternative would potentially reduce ADT compared to the proposed Land Use Plan, resulting in a reduction of GHG emissions from mobile sources within the Plan Area. Additionally, because the alternative would provide less capacity for residential units, GHG emissions from project-related construction activities would be potentially reduced. Although this alternative would reduce daily trips, it could lose the potential benefits derived from more mixed-use and higher intensity developments proposed in the Northeast and Northwest Urban Centers. These types of developments could reduce per-capita vehicle miles traveled (VMT) and ADT by as much as 30 percent by reducing the distance between employment, services and amenities, and residences, in addition to supporting higher utilization of alternative modes of transportation (ULI 2008). Overall, though GHG emissions from stationary and mobile sources could be slightly reduced under this alternative, short- and long-term GHG emissions would still substantially cumulatively contribute to climate change impacts. Additional statewide measures would be necessary to reduce GHG

G E N E R A L P L A N A N D D E V E L O P M E N T C O D E U P D A T E D R A F T P E I R C I T Y O F C L O V I S
7. Alternatives to the Proposed Project
June 2014 Page 7-23
emissions to meet the SJVAPCD threshold of 29 percent below BAU and the reduction target of Executive Order S-03-05, which identified a goal to reduce GHG emissions by 80 percent of 1990 levels by 2050. Therefore, GHG impacts would remain significant and unavoidable under this alternative for both the 2035 and Full Buildout Scenarios.
Hazards and Hazardous Materials
In both this alternative and the proposed General Plan Update, land uses throughout the City would be required to comply with existing state, federal, and county regulations governing use, storage, transport, and disposal of hazardous materials and hazardous wastes. Structures built in fire hazard severity zones would be required to comply with building standards in California Building Code, Chapters 7 and 7A, and California Fire Code, Chapter 49. Further, developments and redevelopments in both scenarios would be required to comply with regulations related to safety compatibility zones and airspace protection surfaces for Fresno Yosemite International Airport. Therefore, hazards and hazardous materials impacts would be similar for the No Project Alternative and the proposed General Plan Update for both the 2035 and Full Buildout Scenarios.
Hydrology and Water Quality
This alternative would somewhat reduce total permitted development intensity and development footprint in the Plan Area. Thus, amounts of pollutants that could contaminate water would be slightly reduced in this alternative. This alternative would reduce water demands by General Plan buildout and thus would reduce impacts of the proposed General Plan Update on groundwater depletion. However, groundwater use impacts would remain significant and unavoidable given the current drought condition and uncertainty of reliable water sources. This alternative, as well as the proposed project, would require construction of drainage and flood control improvements—components of the Fresno Metropolitan Flood Control District’s urban flood control system—in and near development sites. Similar to the proposed General Plan Update, no significant flooding impacts would occur under the 2035 or Full Buildout Scenario. Overall, hydrology and water quality impacts would be reduced by this alternative for both scenarios.
Land Use and Planning
California Government Code, Sections 65300 et seq., requires that cities and counties prepare and adopt general plans. This alternative would leave the current 1993 General Plan in place rather than updating it. Neither this alternative nor the proposed project would divide an established community. Development and redevelopment in both scenarios would be required to comply with land use controls in the Airport Land Use Compatibility Plan for the Fresno Yosemite International Airport. However, the 1993 General Plan, is not consistent with new or updated state and local planning laws such as the California Complete Streets Act of 2008, the Fresno COG Regional Transportation Plan, and the San Joaquin Valley Blueprint. For example, the current land use plan would not benefit from the proposed Mixed Use Village, Mixed Use Business Campus, and Residential uses proposed in the Northwest and Northeast Urban Centers under the proposed project, which would allow for compact, walkable neighborhoods and help to establish the growth areas as self-sustaining, urban villages. Furthermore, at lower intensity of development, the potential to generate enough demand to implement an efficient multimodal transportation system, as outlined in the goals and policies of the Fresno COG RTP, may be more difficult to

G E N E R A L P L A N A N D D E V E L O P M E N T C O D E U P D A T E D R A F T P E I R C I T Y O F C L O V I S
7. Alternatives to the Proposed Project
Page 7-24 PlaceWorks
achieve. Thus, land use impacts would be increased under this alternative in comparison to the proposed General Plan Update for both the 2035 and Full Buildout Scenarios.
Mineral Resources
Mineral resource impacts would be similar under the No Project Alternative. There are no significant mineral resources, active or inactive mines, or mineral resource sectors in the entire Plan Area. Thus, implementation of either the No Project Alternative or proposed General Plan Update would not cause a loss of availability of known mineral resources and would result in similar impacts for both the 2035 and Full Buildout Scenarios.
Noise
This alternative would reduce total permitted development intensity in the Plan Area compared to the General Plan Update, thus generally reducing vehicular traffic and traffic noise. However, similar to the proposed General Plan Update, development of the land use plan in the 1993 General Plan would still result in substantial traffic noise increases to sensitive uses adjacent to roadways. Moreover, buildout of the currently adopted land use plan would result in an increase in residential, commercial, industrial, and institutional development in the City, SOI, and non-SOI Plan Area compared to existing conditions. Noise impacts would be slightly reduced under this alternative, but would still be significant for both the 2035 and Full Buildout Scenarios.
Population and Housing
Under the No Project Alternative, population growth and allowable housing units would be reduced by approximately 25 percent compared to the proposed General Plan Update. The overall development potential of the No Project Alternative is approximately 75 percent of the proposed project; however, similar to the proposed project, the full buildout population under this alternative (221,400 persons) is still nearly 100 percent more than the Plan Area’s existing population, and Fresno COG population projections do not go beyond its 25-year planning horizon. Thus, Full Buildout of the No Project Alternative would similarly induce substantial population growth in Clovis. Therefore, though population growth impacts are reduced under the 2035 Scenario, impacts remain significant and unavoidable for Full Buildout.
Public Services
Public services impacts would be similar under this alternative compared to the proposed project, since the 1993 General Plan buildout population would still be approximately 75 percent of the proposed General Plan Update buildout population. In addition, the No Project Alternative would have a nominal decrease in development footprint, primarily in the Northeast and Northwest Urban Centers. Similar public service demands to expand their service areas towards the City’s growth areas would occur; however, more intense development in the Northwest and Northeast Urban Centers under the proposed General Plan Update would facilitate more cost-efficient services. Overall, impacts would be similar under the alternative for both the 2035 and Full Buildout Scenarios.
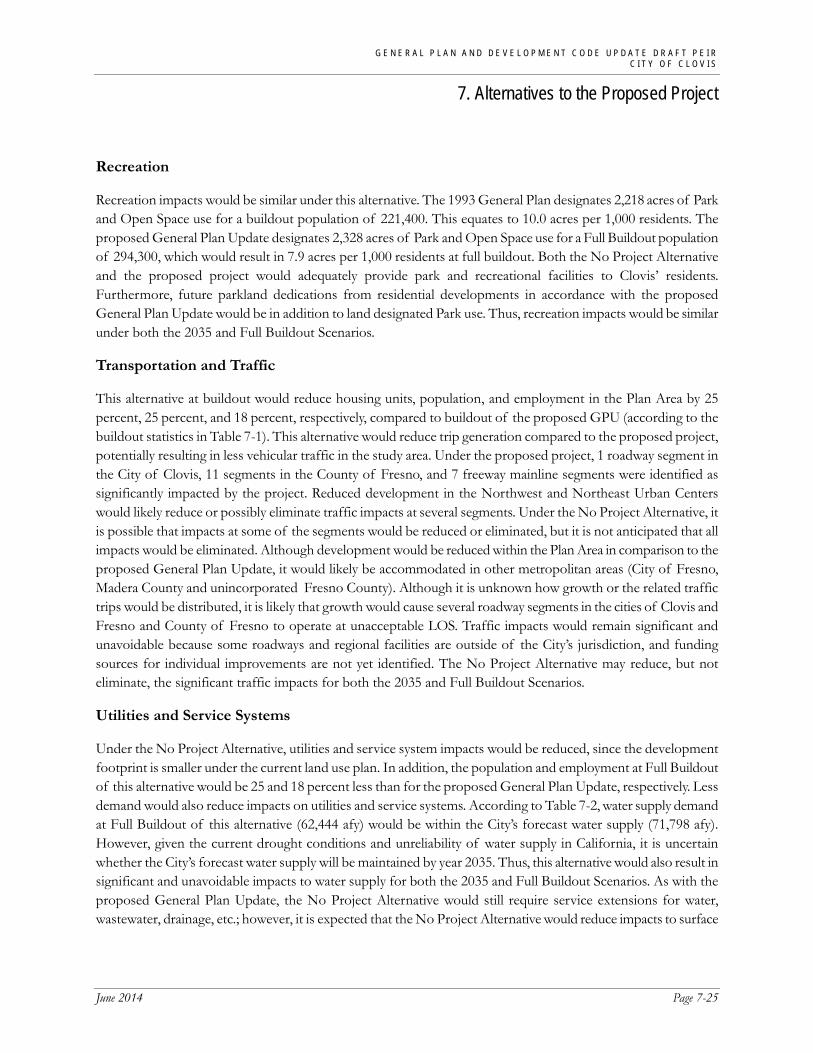
G E N E R A L P L A N A N D D E V E L O P M E N T C O D E U P D A T E D R A F T P E I R C I T Y O F C L O V I S
7. Alternatives to the Proposed Project
June 2014 Page 7-25
Recreation
Recreation impacts would be similar under this alternative. The 1993 General Plan designates 2,218 acres of Park and Open Space use for a buildout population of 221,400. This equates to 10.0 acres per 1,000 residents. The proposed General Plan Update designates 2,328 acres of Park and Open Space use for a Full Buildout population of 294,300, which would result in 7.9 acres per 1,000 residents at full buildout. Both the No Project Alternative and the proposed project would adequately provide park and recreational facilities to Clovis’ residents. Furthermore, future parkland dedications from residential developments in accordance with the proposed General Plan Update would be in addition to land designated Park use. Thus, recreation impacts would be similar under both the 2035 and Full Buildout Scenarios.
Transportation and Traffic
This alternative at buildout would reduce housing units, population, and employment in the Plan Area by 25 percent, 25 percent, and 18 percent, respectively, compared to buildout of the proposed GPU (according to the buildout statistics in Table 7-1). This alternative would reduce trip generation compared to the proposed project, potentially resulting in less vehicular traffic in the study area. Under the proposed project, 1 roadway segment in the City of Clovis, 11 segments in the County of Fresno, and 7 freeway mainline segments were identified as significantly impacted by the project. Reduced development in the Northwest and Northeast Urban Centers would likely reduce or possibly eliminate traffic impacts at several segments. Under the No Project Alternative, it is possible that impacts at some of the segments would be reduced or eliminated, but it is not anticipated that all impacts would be eliminated. Although development would be reduced within the Plan Area in comparison to the proposed General Plan Update, it would likely be accommodated in other metropolitan areas (City of Fresno, Madera County and unincorporated Fresno County). Although it is unknown how growth or the related traffic trips would be distributed, it is likely that growth would cause several roadway segments in the cities of Clovis and Fresno and County of Fresno to operate at unacceptable LOS. Traffic impacts would remain significant and unavoidable because some roadways and regional facilities are outside of the City’s jurisdiction, and funding sources for individual improvements are not yet identified. The No Project Alternative may reduce, but not eliminate, the significant traffic impacts for both the 2035 and Full Buildout Scenarios.
Utilities and Service Systems
Under the No Project Alternative, utilities and service system impacts would be reduced, since the development footprint is smaller under the current land use plan. In addition, the population and employment at Full Buildout of this alternative would be 25 and 18 percent less than for the proposed General Plan Update, respectively. Less demand would also reduce impacts on utilities and service systems. According to Table 7-2, water supply demand at Full Buildout of this alternative (62,444 afy) would be within the City’s forecast water supply (71,798 afy). However, given the current drought conditions and unreliability of water supply in California, it is uncertain whether the City’s forecast water supply will be maintained by year 2035. Thus, this alternative would also result in significant and unavoidable impacts to water supply for both the 2035 and Full Buildout Scenarios. As with the proposed General Plan Update, the No Project Alternative would still require service extensions for water, wastewater, drainage, etc.; however, it is expected that the No Project Alternative would reduce impacts to surface

G E N E R A L P L A N A N D D E V E L O P M E N T C O D E U P D A T E D R A F T P E I R C I T Y O F C L O V I S
7. Alternatives to the Proposed Project
Page 7-26 PlaceWorks
water treatment capacity, wastewater treatment capacity, and landfill capacity, based on comparisons of buildout populations for the two alternatives for both 2035 and Full Buildout Scenarios.
7.4.1 Ability to Reduce Environmental Impacts Impacts of this alternative on agriculture, air quality, greenhouse gas emissions, groundwater use, noise, population and housing, transportation and traffic, and water supply would be reduced compared to those of the proposed project, but would remain significant and unavoidable. Historical resources would be impacted similarly to the proposed project and would remain significant and unavoidable as well. Impacts to aesthetics, hazards and hazardous materials, mineral resources, and recreation would be similar to the proposed project; however, land use and planning impacts would be greater under the No Project Alternative. Impacts to biological resources, cultural resources, geology and soils, hydrology and water quality, public services, and utilities and service systems would be reduced under this alternative. Overall, the No Project Alternative would be able to reduce several environmental impacts, but would not reduce any significant and unavoidable impacts.
7.4.2 Ability to Achieve Project Objectives The No Project/Existing General Plan Alternative would achieve project objectives 1, 2, and 5: preserve the authenticity of Old Town and plan new development that creates a sense of community and place, preserve the character and quality of life of existing residential neighborhoods; and balance residential growth with employment generating development. However, the No Project Alternative would not be as successful in accommodating 80 years of growth in the Clovis Plan Area in a sustainable urban development pattern (No. 3) nor develop complete communities in two of the three urban centers, the Northeast and Northwest Urban Centers (No. 4), given the lower intensity of development under the current land use plan. Furthermore, public open space resources (e.g., open space, recreation, and parks), housing, employment, and lifestyle opportunities would be more limited under the No Project Alternative in comparison to the proposed General Plan Update (No. 6 and 7) because of the reduced development capacity. Overall, the No Project Alternative would not be as effective in meeting the project objectives.
7.5 MODERATE GROWTH WITHIN SOI ALTERNATIVE Aesthetics
Aesthetic impacts would be reduced under this alternative given that development would be limited to areas within the SOI boundary. This would ensure that no development would occur in the non-SOI Plan Area that could potentially impact scenic vistas and vantage points of the rural eastern Plan Area, grassy hills near Tollhouse Road/SR-168 and the Friant-Kern Canal, and foothills of the Sierra Nevada. Furthermore, the lower density development along McCall Avenue in Loma Vista under this alternative would preserve the existing rural and agricultural character of Loma Vista’s eastern portion. Impacts would be reduced in both the 2035 and Full Buildout Scenarios.

G E N E R A L P L A N A N D D E V E L O P M E N T C O D E U P D A T E D R A F T P E I R C I T Y O F C L O V I S
7. Alternatives to the Proposed Project
June 2014 Page 7-27
Agriculture and Forestry Resources
This alternative would reduce impacts of converting mapped important farmland to nonagricultural uses. About 3,058 acres—or 55 percent of the 5,590 total acres of important farmland conversion to nonagricultural land uses by the proposed General Plan Update in the Plan Area—would be outside of the SOI (see Section 5.2, Agricultural Resources), and thus would not be converted by this alternative. However, the remaining farmland conversion—about 2,532 acres—would occur in the City and SOI. Based on the same comparison used to identify farmland conversion impacts of the proposed project as significant and unavoidable in Section 5.2—2,242 acres of important farmland converted to nonagricultural use in all of Fresno County between 2006 and 2008—impacts of this alternative would remain significant and unavoidable in both the 2035 and Full Buildout Scenarios.
Air Quality
This alternative would result in a capacity reduction of 33,250 residential units and 11,037,500 square feet of nonresidential uses. This reduction would reduce ADT and mobile-source emissions. Stationary-source emissions would also be reduced. Additionally, the reduction in land use developments would reduce short-term emissions related to project construction activities. Although this alternative would reduce both long- and short-term pollutant emissions, due to the scale of development activity associated with buildout of this alternative, it would not eliminate significant short- and long-term criteria pollutant contributions of VOCs, NOX, CO, PM10, and PM2.5; it would not be consistent with the air quality management plan, since criteria pollutants thresholds would be exceeded; and it would cumulatively contribute to the SJVAB nonattainment designations for O3 and PM2.5. Implementation of the proposed land use plan was found to have significant and unavoidable impacts to short- and long-term air quality. In comparison to the proposed land use plan, this alternative would reduce, but not eliminate short- and long-term air quality impacts in both the 2035 and Full Buildout Scenarios.
Biological Resources
This alternative would vastly reduce permitted development intensity in the non-SOI Planning Area compared to the proposed General Plan Update: residential units would be reduced by about 86 percent, and nonresidential building area would be reduced by almost 98 percent (see Table 7-1). In the proposed project, about 94 percent of the three land use designations that have some habitat value for sensitive species (Agriculture, Open Space, and Rural Residential) would be in the non-SOI Plan Area (see acreages per land use designation in Table 3-3). Thus, this alternative would leave much more vacant land in the non-SOI Plan Area that has some habitat value for sensitive species. Impacts to biological resources would be reduced by this alternative and would be less than significant after mitigation for both this alternative and the proposed General Plan Update for both the 2035 and Full Buildout Scenarios.
Cultural Resources
Cultural resource impacts would be reduced under this alternative because all development would be limited to areas within the City and SOI boundaries. The rural, undisturbed non-SOI Plan Area would maintain its existing land use designations under the County of Fresno General Plan, and because development in accordance with this alternative would not occur in the non-SOI Plan Area, cultural resources in these areas would not be impacted. Impacts to historical resources still have the potential to occur within the SOI boundaries and would

G E N E R A L P L A N A N D D E V E L O P M E N T C O D E U P D A T E D R A F T P E I R C I T Y O F C L O V I S
7. Alternatives to the Proposed Project
Page 7-28 PlaceWorks
remain significant and unavoidable, although overall impacts to cultural resources would be reduced for both the 2035 and Full Buildout Scenarios.
Geology and Soils
Geology and soil impacts under the Moderate Growth within SOI Alternative would be reduced compared to the proposed project. The development footprint would be mostly limited to areas within the SOI boundaries, thus potential hazards in the non-SOI Plan Area would be reduced. The total numbers of residents and employees in the Plan Area at buildout of this alternative would be reduced by 31 percent compared to the proposed General Plan Update; thus, the numbers of people that could be exposed to geologic hazards the Plan Area would be reduced. Impacts would be less than significant for both the proposed project and this alternative for both the 2035 and Full Buildout Scenarios.
Greenhouse Gas Emissions
Under this alternative, mobile- and stationary-source emissions, in addition to indirect emissions from energy usage from operation of the project, would be reduced due to the reduction in residential uses and nonresidential square footage. The reduction in land uses would result in fewer vehicle trips generated upon project buildout, which would reduce the amount of GHGs emitted. Additionally, GHG emissions from stationary sources and energy usage would be reduced compared to the proposed project due to the reduction in building square footage. Because this alternative would result in fewer mixed uses compared to the proposed land use plan due to the elimination of the Northeast Urban Center, the overall potential reduction in VMT per capita due to higher density and reduced distances between services and amenities could be lessened. However, potential benefits from higher concentration of mixed uses would be offset by overall less growth under this alternative. This alternative would still include the Mixed Use Village land use designation within the City and the SOI and advance California’s goal of developing and fostering sustainable communities that reduce GHG emissions.
Overall, under the Moderate Growth within SOI Alternative, GHG emissions from stationary and mobile sources and energy use would be reduced compared to the proposed project. However, due to the scale of development activity associated with buildout of this alternative, short- and long-term GHG emissions would still cumulatively contribute to climate change impacts. Additional statewide measures would be necessary to reduce GHG emissions to meet the SJVAPCD threshold of 29 percent below BAU and the reduction target of Executive Order S-03-05, which identified a goal to reduce GHG emissions by 80 percent of 1990 levels by 2050. Therefore, GHG impacts would remain significant and unavoidable under this alternative for both the 2035 and Full Buildout Scenarios.
Hazards and Hazardous Materials
This alternative would have slightly reduced impacts compared to the proposed project because the project area would exclude land outside of the SOI. According to Figure 5.8-1, Fire Hazard Zones, the majority of areas in the moderate fire hazard zone are in the non-SOI Plan Area. Thus, fire hazards would be reduced under this alternative. Other impacts related to hazardous materials and hazardous wastes would be regulated by existing state, federal, and county regulations. As with the proposed General Plan Update, hazards and hazardous materials impacts would be less than significant for both the 2035 and Full Buildout Scenarios.
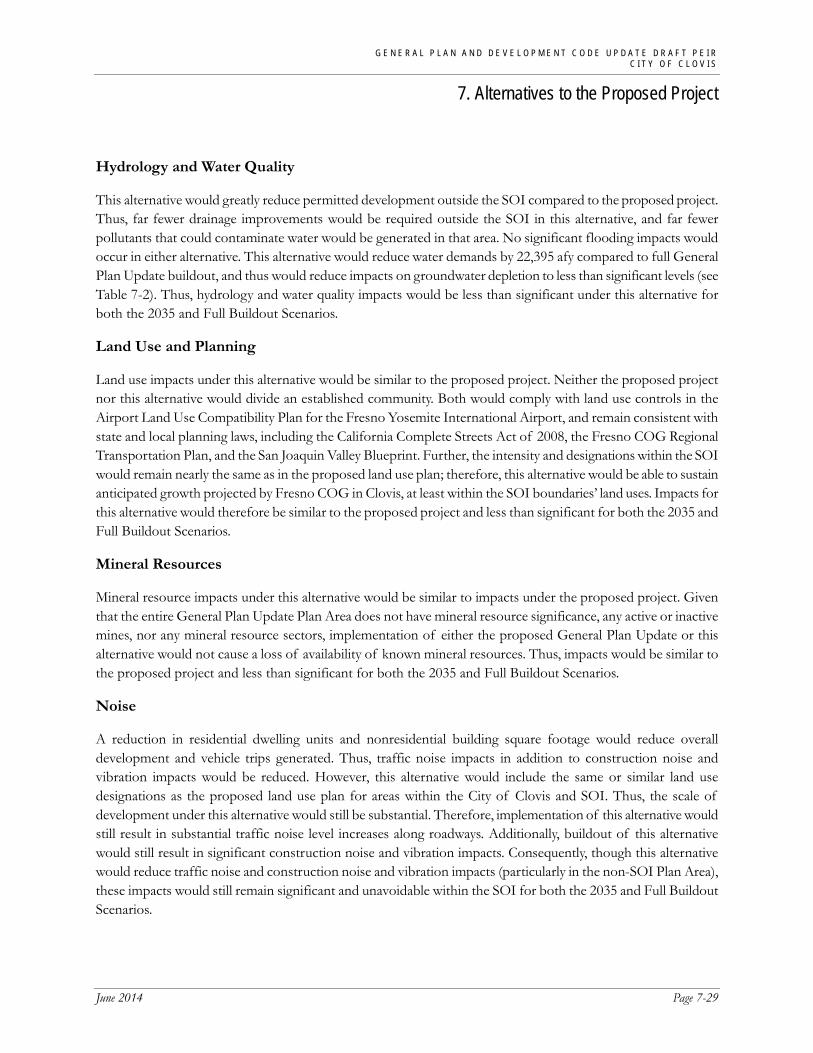
G E N E R A L P L A N A N D D E V E L O P M E N T C O D E U P D A T E D R A F T P E I R C I T Y O F C L O V I S
7. Alternatives to the Proposed Project
June 2014 Page 7-29
Hydrology and Water Quality
This alternative would greatly reduce permitted development outside the SOI compared to the proposed project. Thus, far fewer drainage improvements would be required outside the SOI in this alternative, and far fewer pollutants that could contaminate water would be generated in that area. No significant flooding impacts would occur in either alternative. This alternative would reduce water demands by 22,395 afy compared to full General Plan Update buildout, and thus would reduce impacts on groundwater depletion to less than significant levels (see Table 7-2). Thus, hydrology and water quality impacts would be less than significant under this alternative for both the 2035 and Full Buildout Scenarios.
Land Use and Planning
Land use impacts under this alternative would be similar to the proposed project. Neither the proposed project nor this alternative would divide an established community. Both would comply with land use controls in the Airport Land Use Compatibility Plan for the Fresno Yosemite International Airport, and remain consistent with state and local planning laws, including the California Complete Streets Act of 2008, the Fresno COG Regional Transportation Plan, and the San Joaquin Valley Blueprint. Further, the intensity and designations within the SOI would remain nearly the same as in the proposed land use plan; therefore, this alternative would be able to sustain anticipated growth projected by Fresno COG in Clovis, at least within the SOI boundaries’ land uses. Impacts for this alternative would therefore be similar to the proposed project and less than significant for both the 2035 and Full Buildout Scenarios.
Mineral Resources
Mineral resource impacts under this alternative would be similar to impacts under the proposed project. Given that the entire General Plan Update Plan Area does not have mineral resource significance, any active or inactive mines, nor any mineral resource sectors, implementation of either the proposed General Plan Update or this alternative would not cause a loss of availability of known mineral resources. Thus, impacts would be similar to the proposed project and less than significant for both the 2035 and Full Buildout Scenarios.
Noise
A reduction in residential dwelling units and nonresidential building square footage would reduce overall development and vehicle trips generated. Thus, traffic noise impacts in addition to construction noise and vibration impacts would be reduced. However, this alternative would include the same or similar land use designations as the proposed land use plan for areas within the City of Clovis and SOI. Thus, the scale of development under this alternative would still be substantial. Therefore, implementation of this alternative would still result in substantial traffic noise level increases along roadways. Additionally, buildout of this alternative would still result in significant construction noise and vibration impacts. Consequently, though this alternative would reduce traffic noise and construction noise and vibration impacts (particularly in the non-SOI Plan Area), these impacts would still remain significant and unavoidable within the SOI for both the 2035 and Full Buildout Scenarios.
G E N E R A L P L A N A N D D E V E L O P M E N T C O D E U P D A T E D R A F T P E I R C I T Y O F C L O V I S
7. Alternatives to the Proposed Project
Page 7-30 PlaceWorks
Population and Housing
Under the Moderate Growth within SOI Alternative, population and housing opportunities would be reduced because development would only occur within the SOI boundary. Infrastructure would not need to be extended into the non-SOI Plan Area that may induce additional population growth. Similar to the proposed project, the population of this alternative for the 2035 Scenario (183,240 persons) would be very similar to that forecast by the Fresno Council of Governments (177,200 persons), and therefore less than significant. However, Full Buildout population of this alternative (202,100 persons)would be less than for the proposed General Plan Update Full Buildout (294,300), and reduce the significant and unavoidable population growth impact at Full Buildout. Therefore, the alternative would reduce population growth impacts to less than significant for both the 2035 and Full Buildout Scenarios.
Public Services
Public service impacts related to fire, police, schools, and library services would be reduced under this alternative. Proposed land use changes would be limited to areas within the SOI boundaries. Furthermore, the City’s population would not increase as much as under the proposed project, thereby reducing the number of calls for service. Thus, potential needs to expand service areas for the various public services (e.g., fire stations, police stations, schools, and libraries) and their associated infrastructure, equipment, and personnel would be reduced dramatically. Overall, public service impacts would be reduced under this alternative for both the 2035 and Full Buildout Scenarios.
Recreation
Given that development would be within the SOI, the parkland designations in the non-SOI Plan Area would not be implemented. In particular, the proposed Dry Creek Basin Regional Park in the non-SOI Plan Area would provide a substantial amount of parkland to the entire Plan Area at Full Buildout of the proposed General Plan Update. However, this regional park would not be built under the Moderate Growth within SOI Alternative, but would remain Agriculture use as designated under the Fresno County General Plan. Furthermore, as shown on Figure 7-1, Moderate Growth within SOI Alternative, there is not enough park space designated in the SOI to meet the parkland standard. Thus, impacts would be greater than the proposed project for both the 2035 and Full Buildout Scenarios.
Transportation and Traffic
This alternative at buildout would decrease housing units, population, and employment in the Plan Area by about 31 percent each compared to the proposed General Plan Update. The northeast area and portions of the northwest areas would not be developed. The decrease in population would be outside the SOI (according to the buildout statistics in Table 7-1). Under the General Plan Update, 1 roadway segment in the City of Clovis, 11 in the County of Fresno, and 7 freeway segments were identified as significantly impacted. This alternative would reduce trip generation compared to the proposed project, potentially resulting in less vehicular traffic in the study area. Traffic impacts may be reduced by this alternative, particularly roadway segments that serve development. Under the Moderate Growth within SOI Alternative, it is possible that traffic would be reduced because fewer trips would be generated in the areas beyond the City and SOI. However, because the impacted locations are in
G E N E R A L P L A N A N D D E V E L O P M E N T C O D E U P D A T E D R A F T P E I R C I T Y O F C L O V I S
7. Alternatives to the Proposed Project
June 2014 Page 7-31
the vicinity of the City’s SOI and there would be no reductions in housing units, population, and employment within the SOI, this alternative would not substantially reduce traffic at all areas where the impacts were identified. This alternative may reduce but not eliminate impacts at all the roadway segments anticipated to operate at unacceptable LOS. Traffic impacts would remain significant and unavoidable for both the 2035 and Full Buildout Scenarios, since no specific funding sources have been identified for improvements, and because some segments that would be impacted are outside the City’s jurisdiction.
Utilities and Service Systems
Under this alternative, utilities and service system impacts would be reduced given that the alternative would not require extension of infrastructure beyond the City and SOI limits. The population and employment at buildout of this alternative would each be about 31percent less than for the proposed General Plan Update, which would result in reduced utility demand and capacity requirements. Under this alternative, water supply demands would be reduced to approximately 56,300 afy at Full Buildout, in comparison to 78,695 afy for the proposed General Plan Update (see Table 7-2). The water demand at full buildout of this alternative would be within the City’s 2035 water supply forecast, thus reducing both the 2035 and Full Buildout Scenarios water supply impacts to less than significant. Impacts to wastewater, solid waste, and other utilities (i.e., natural gas and electricity) would also be reduced for both the 2035 and Full Buildout Scenarios.
7.5.1 Ability to Reduce Environmental Impacts The Moderate Growth within SOI Alternative would reduce impacts to aesthetics, biological resources, geology and soils, hazards and hazardous materials, hydrology and water quality, public services, and utilities and service systems. This alternative would also reduce impacts of the proposed project to agriculture, air quality, historical resources, greenhouse gas emissions, noise, transportation and traffic, and water supply; however, all of these impacts would still remain significant and unavoidable under this alternative for both the 2035 and Full Buildout Scenarios. The significant and unavoidable impact to population growth at full buildout and groundwater use and water supply for both 2035 and Full Buildout Scenarios would be eliminated under this alternative. Impacts to land use and planning and mineral resources would be similar to the proposed General Plan Update. Overall, the Moderate Growth within SOI Alternative would reduce a majority of environmental impacts compared to the proposed project; however, all significant unavoidable impacts would remain with the exception of groundwater use and water supply impacts.
7.5.2 Ability to Achieve Project Objectives The Moderate Growth within SOI Alternative would not be able to accommodate 80 years of growth at the defined moderate densities (No. 3) because growth would only be addressed within the limits of the SOI boundaries. Preserving the authenticity of Old Town and creating a sense of community and place (No. 1) and preserving the character of existing residential neighborhoods (No. 2) would be achieved under this alternative. However, the Moderate Growth within SOI Alternative would not include developing the majority of the Northeast Urban Center nor provide funding for development of the Northwest Urban Center and Loma Vista. Thus, it would not be able to develop complete communities in the City’s urban centers (No. 4). This alternative would also not be as effective as the proposed General Plan Update in balancing residential growth with
G E N E R A L P L A N A N D D E V E L O P M E N T C O D E U P D A T E D R A F T P E I R C I T Y O F C L O V I S
7. Alternatives to the Proposed Project
Page 7-32 PlaceWorks
employment generating development (No. 5); creating housing, employment and lifestyle opportunities for all ages and income (No. 6); and providing public open space resources (No. 7). Overall, this alternative would only achieve two of the seven project objectives.
7.6 CONCENTRATED GROWTH WITHIN SOI ALTERNATIVE Aesthetics
Under this alternative, concentrated growth within the SOI would alter the scenic character of the Northwest Urban Center and Loma Vista because of the substantial increase in density proposed in these areas. For example, parcels within Loma Vista and the Northwest Urban Center would be designated as Medium High, High, or Very High Density Residential rather than Very Low, Low, and Medium Density Residential. Further, a small portion in the northeast SOI (south of SR-168) would be designated as Mixed Use/Business Campus instead of Rural Residential. With such high intensity development, the character of existing neighborhoods would be altered, particularly along the edges of the SOI, and the small town character of Clovis would be impacted. Nevertheless, under this alternative, no aesthetic impacts would occur outside of the SOI boundary, which is primarily where the City’s scenic vista and undisturbed, natural character thrives. Scenic vistas and landforms toward the Sierra Nevada would also not be impacted by development in the non-SOI Plan Area. Thus, though concentrated development would occur within the SOI, areas outside of the SOI would not be impacted at all under this alternative. Overall aesthetic impacts to the Plan Area’s scenic character and quality would balance out and result in similar impacts to the proposed project for both the 2035 Scenario and Full Buildout.
Agriculture and Forestry Resources
Agricultural resource impacts would be reduced under this alternative because proposed development would be limited to areas within the SOI boundary. Thus, the prime agricultural lands, primarily in the non-SOI Plan Area, would not be impacted by this alternative. However, 2,532 acres of Important Farmland Conversion to nonagricultural land uses by the proposed General Plan Update in the Plan Area—about 45 percent of the total—are in the City and SOI (see Section 5.2, Agricultural Resources). Based on the same comparison used to identify farmland conversion impacts of the proposed project as significant and unavoidable in Section 5.2—2,242 acres of important farmland converted to nonagricultural use in all of Fresno County between 2006 and 2008—impacts of this alternative would remain significant and unavoidable for both the 2035 and Full Buildout Scenarios.
Air Quality
The increased land use intensities and smaller plan area under this alternative could potentially reduce VMT by concentrating land uses closer together, reducing air pollutant emissions from mobile sources. Because this alternative would have similar residential and nonresidential capacities as the proposed land use plan, it would still generate similar amounts of air pollutant emissions from construction activities and stationary sources. The increased land use intensities within a smaller plan area could potentially result in a higher number of sensitive uses sited near sources of pollution. However, as with the proposed project, application of Mitigation Measure 3-5 would reduce impacts on sensitive uses to less than significant. Overall, though mobile-source air pollutant

G E N E R A L P L A N A N D D E V E L O P M E N T C O D E U P D A T E D R A F T P E I R C I T Y O F C L O V I S
7. Alternatives to the Proposed Project
June 2014 Page 7-33
emissions could be reduced, impacts from this alternative for both the 2035 and Full Buildout Scenarios would still be significant and unavoidable.
Biological Resources
This alternative would reduce permitted residential units and nonresidential building area in the non-SOI Plan Area by about 90 percent compared to the proposed General Plan Update. Under the proposed project, about 94 percent of the three land use designations that have some habitat value for sensitive species (Agriculture, Open Space, and Rural Residential) would be in the non-SOI Plan Area (see acreages per land use designation in Table 3-3). Thus, this alternative would leave much more vacant land in the non-SOI Plan Area that has some habitat value for sensitive species than would the proposed General Plan Update. Impacts to biological resources would be reduced by this alternative and would be less than significant after mitigation for this alternative and the proposed General Plan Update for both the 2035 and Full Buildout Scenarios.
Cultural Resources
Cultural resource impacts would be reduced under this alternative because development intensification would shift within the City and SOI limits, eliminating potential impacts to undisturbed areas in the non-SOI Plan Area. Additionally, future development within the SOI would primarily be in areas already disturbed and built out, so potential to impact previously undiscovered cultural resources would be less likely. Nevertheless, impacts to historical resources would remain significant and unavoidable. Overall cultural resource impacts would be reduced for both the 2035 and Full Buildout Scenarios.
Geology and Soils
Geology and soil impacts would be reduced under this alternative because the project area would be limited to areas within the SOI. The non-SOI Plan Area would remain as designated in the County of Fresno General Plan, and hazards from liquefaction, ground settlement, and/or soil expansion and erosion would be reduced given the smaller development footprint. The number of residents and workers in the Plan Area at buildout of this alternative would be similar to the respective numbers at buildout of the proposed project; thus, similar numbers of people could be exposed to geologic hazards under this alternative and the proposed General Plan Update for both the 2035 and Full Buildout Scenarios.
Greenhouse Gas Emissions
The increased land use intensities and smaller plan area under this alternative could potentially reduce VMT, resulting in a reduction of GHG emissions from mobile sources. However, as this alternative would result in similar residential and non-residential capacities as the proposed land use plan, it would generate similar amounts of GHG emissions from construction activities and stationary sources. Therefore, while mobile-source GHG emissions could be reduced, impacts under this alternative would still be significant and unavoidable for both the 2035 and Full Buildout Scenarios.

G E N E R A L P L A N A N D D E V E L O P M E N T C O D E U P D A T E D R A F T P E I R C I T Y O F C L O V I S
7. Alternatives to the Proposed Project
Page 7-34 PlaceWorks
Hazards and Hazardous Materials
Similar to the Moderate Growth within SOI Alternative, this alternative would designate land uses only in the City and SOI limits. The majority of fire hazard zones are in the non-SOI Plan Area. Therefore, fire hazards would be reduced under this alternative. All other hazard impacts related to hazardous materials and hazardous wastes would be similar to the proposed General Plan Update since development would be required to comply with existing state, federal, and county regulations. Further, developments would be required to comply with regulations related to safety compatibility zones and airspace protection surfaces for Fresno Yosemite International Airport. Overall, hazards and hazardous materials impacts would be slightly reduced in this alternative for both the 2035 and Full Buildout Scenarios.
Hydrology and Water Quality
This alternative would greatly reduce permitted development outside the SOI compared to the proposed project. Thus, far fewer drainage improvements would be required outside the SOI in this alternative, and far fewer pollutants that could contaminate water would be generated in that area. No significant flooding impacts would occur under either alternative. Generation of pollutants that could contaminate water would be concentrated within the SOI in this alternative due to the concentration of development there and, conversely, would be reduced outside the SOI. Population and employment in the Plan Area at buildout of this alternative would be the same as for the proposed General Plan Update. Therefore, water supply demands and groundwater use impacts would be similar (approximately 78,800 afy) and remain significant and unavoidable (see Table 7-2). Overall, hydrology and water quality impacts of this alternative would be similar to those of the proposed project for both the 2035 and Full Buildout Scenarios.
Land Use and Planning
Overall land use impacts under this alternative would be greater than for the proposed project. As with the proposed General Plan Update, this alternative would respond to the anticipated growth projected by the Fresno COG; however it would change the nature of development given that all anticipated growth would be condensed into the SOI boundary, which is approximately 43 percent of the entire Plan Area. The increased density in the City could potentially enhance the efficiency of a multimodal transportation system. For example, the City’s density may promote public transit use and active transportation, which would reduce vehicle trips, vehicle miles travelled, and traffic congestions, which are all goals of Fresno COG’s 2011 Regional Transportation Plan. Nevertheless, the densification of existing neighborhoods and potential to divide or disrupt established communities in Clovis through infill and intensification would cause greater land use impacts and would not be in character with Clovis. Overall impacts would be greater than the proposed General Plan Update for both the 2035 and Full Buildout Scenarios.
Mineral Resources
Mineral resource impacts under this alternative would be similar to impacts under the proposed project. The entire Plan Area does not have mineral resource significance; any active or inactive mines; or any mineral resource sectors. Thus, implementation of both scenarios would not cause a loss of availability of known mineral resources, and impact results would be similar for both the 2035 and Full Buildout Scenarios.
G E N E R A L P L A N A N D D E V E L O P M E N T C O D E U P D A T E D R A F T P E I R C I T Y O F C L O V I S
7. Alternatives to the Proposed Project
June 2014 Page 7-35
Noise
This alternative would result in higher development intensities within a smaller planning area and would also permit a slightly higher number of dwelling units. The total service population would also slightly increase under this alternative. The higher concentration of residential development could cause a higher number of sensitive users to be impacted by construction-related noise and vibration. The increase in service population could generate more vehicle trips and thereby increase traffic-related noise impacts. However, higher development intensities could potentially place a higher number of the service population closer to amenities and encourage active transit (e.g., bicycling, walking, etc.), thereby reducing overall ADT. Overall, noise impacts under this alternative would be similar to the proposed project and remain significant and unavoidable for both the 2035 and Full Buildout Scenario.
Population and Housing
Under the Concentrated Growth within SOI Alternative, the forecast 2035 Scenario population (138,285) and Full Buildout population (295,200 persons) are similar to the proposed General Plan Update 2035 (184,100 persons) and full buildout (294,300 persons) populations. Thus, population growth impacts under the alternative would be similar to the proposed General Plan Update, and would be less than significant by the 2035 Scenario and significant and unavoidable at Full Buildout. This alternative would not displace housing because it would not change designation of residential to nonresidential uses as compared to the proposed project. Overall, impacts would be similar for both 2035 and Full Buildout Scenarios.
Public Services
Public service demands under this alternative would be reduced compared to the proposed project. Growth would be concentrated within the SOI, so additional fire and police stations, schools, and libraries would not have to be constructed outside of the SOI limits, and there would be increased efficiency in providing services within a more concentrated area. However, population growth anticipated under this alternative would be similar to the proposed project. Therefore, while additional fire and police stations and expanded service areas may not be needed in the non-SOI Plan Area, additional staffing and equipment would still be necessary to meet the demands of these residents. Further, the increase in student population would create similar demands for more schools and libraries. Nevertheless, public service demands would be reduced for both the 2035 and Full Buildout Scenario.
Recreation
This alternative would provide parkland as designated within only the SOI boundaries for essentially the same buildout population as the proposed General Plan Update. As shown on Figure 7-2, Concentrated Growth within SOI Alternative, there would not be adequate parkland designated within the SOI, especially because Dry Creek Basin Regional Park, in the non-SOI Plan Area, would not be developed. Thus, impacts on parks and recreational facilities would be greater under this alternative for both the 2035 and Full Buildout Scenarios.
G E N E R A L P L A N A N D D E V E L O P M E N T C O D E U P D A T E D R A F T P E I R C I T Y O F C L O V I S
7. Alternatives to the Proposed Project
Page 7-36 PlaceWorks
Transportation and Traffic
This alternative at buildout would generate similar population and employment in the entire Plan Area as the proposed project. However, the vast majorities of population and employment would be concentrated in the City and SOI. Thus, population and employment in the SOI in this alternative would be about 51 percent and 36 percent greater, respectively, than for the proposed project (according to the buildout statistics in Table 7-1). Under the proposed project, 1 roadway segment in the City of Clovis, 11 in the County of Fresno, and 7 freeway mainline segments were identified as significantly impacted by the project. Traffic impacts outside the SOI would likely be reduced by this alternative, particularly roadway segments that serve development in the northeast area. However, this alternative would increase trips generation within the SOI compared to the proposed project, resulting in more vehicular traffic in the study area where impacts were identified. Under the Concentrated Growth within SOI Alternative, it is possible that traffic impacts may be increased in the SOI, because more trips would be generated there. On the other hand, greater density may promote a mode shift— density usually enables other modes of transportation such as transit, pedestrian, and bicycle trips. It is not likely that the increased density would be characteristic of a dense urban area (e.g., San Francisco or Los Angeles) where a substantial mode shift would offset the increased demand for transportation within the SOI. Therefore, within the SOI, this alternative would likely increase traffic impacts at the roadway segments already anticipated to operate at unacceptable LOS under the proposed project and possibly cause more segments to operate at unacceptable LOS. Traffic impacts would be significant and unavoidable, and potentially increase under the proposed project for both the 2035 and Full Buildout Scenarios.
Utilities and Service Systems
This alternative would generate the same buildout population and employment as would the proposed project. Thus, demands for water, electricity, and natural gas—and generation of wastewater and solid waste—under this alternative would all be generally similar to the proposed project. Concentration of land uses in this alternative may reduce landscaped area needing irrigation somewhat compared to the proposed project, but such a reduction in water demand would be minor compared to total water demands by buildout of this alternative. Nevertheless, this alternative minimizes growth outside of FID and Garfield Water District, thereby reducing the amount of development that does not bring with it a supply of surface water. Furthermore, the concentration of permitted development within the SOI in this alternative would greatly reduce needs to extend utility infrastructure beyond the SOI. Therefore, overall utilities impacts for both the 2035 and Full Buildout Scenario would be reduced somewhat by this alternative compared to those of the proposed project. However, significant and unavoidable impacts to water supply would remain for both the 2035 and Full Buildout Scenarios.
7.6.1 Ability to Reduce Environmental Impacts The Concentrated Growth within the SOI Alternative would reduce impacts to biological resources, cultural resources, geology and soils, hazards and hazardous materials, public services, and utilities and service systems. Similar impacts would occur to aesthetics, hydrology and water quality, and mineral resources. This alternative would not reduce any significant and unavoidable impacts of the proposed project to less than significant though it would reduce some: agricultural resources, air quality, historical resources, greenhouse gas emissions. This alternative would increase impacts to land use and planning, transportation and traffic, and recreation. Significant
G E N E R A L P L A N A N D D E V E L O P M E N T C O D E U P D A T E D R A F T P E I R C I T Y O F C L O V I S
7. Alternatives to the Proposed Project
June 2014 Page 7-37
and unavoidable impacts to noise, population growth, and water supply would be similar for this alternative. Overall, the Concentrated Growth within SOI Alternative would reduce or have similar impacts to a number of environmental impacts, but it would not eliminate any significant or unavoidable impacts.
7.6.2 Ability to Achieve Project Objectives The Concentrated Growth within SOI Alternative would substantially intensify development within the SOI boundaries. Thus, much of the existing character and small-town feel of the City would be replaced by dense, infill development. This alternative would not achieve the objectives of preserving the character and quality of life of existing residents (No. 2); preserving the authenticity of Old Town (No. 1); accommodating 80 years of growth (No. 3); or maintaining the small town character and feel of Clovis while developing complete communities in the three urban centers (No. 4). In addition, public open space resources for trails, parks, and recreation would be reduced to accommodate the concentrated growth within the SOI (No. 7). This alternative would provide the same amount of anticipated growth as the proposed project (i.e., jobs, housing, dwelling units); therefore, it would still provide balanced residential growth with employment-generating development and create similar housing, employment, and lifestyle opportunities for Clovis residents (No. 5 and 6). Overall, the concentrated development alternative would not achieve the project objectives as well as the proposed General Plan Update.
7.7 LOW DENSITY GROWTH ALTERNATIVE Aesthetics
Aesthetic impacts would be reduced under this alternative since development would dramatically decrease in intensity compared to the proposed project. Much of the SOI and non-SOI Plan Area would be designated Very Low or Low Density Residential with minimal Mixed Use Village/Business Campus and Commercial uses (see Figure 7-3, Low Density Growth Alternative). Therefore, existing scenic qualities and character would not be altered as drastically, and potential light and glare impacts would be reduced. Scenic vistas toward the grassy landforms near Tollhouse Road/SR-168 and the Sierra Nevada to the northeast would not be impacted as heavily, since development towards the non-SOI Plan Area would occur at a less intense pace. Thus, overall aesthetic impacts would be reduced for both 2035 and Full Buildout Scenarios.
Agriculture and Forestry Resources
Under this alternative, agricultural impacts would be similar to the proposed project because development designations would be proposed across the entire Plan Area. Though density would be dramatically lowered in this alternative, land use designation would still convert the same amount of land from Agricultural to nonagricultural uses. Therefore, no additional important farmland would be preserved under the alternative. Impacts would be significant and unavoidable in this alternative and the proposed General Plan Update for both 2035 and Full Buildout Scenarios.

G E N E R A L P L A N A N D D E V E L O P M E N T C O D E U P D A T E D R A F T P E I R C I T Y O F C L O V I S
7. Alternatives to the Proposed Project
Page 7-38 PlaceWorks
Air Quality
This alternative would result in a reduction of 53,050 residential units and 32,732,500 square feet of nonresidential uses. This would substantially reduce ADT and mobile-source emissions in the Plan Area. Furthermore, stationary-source emissions would be reduced because there would be fewer residential and nonresidential developments. And the reduction in development would reduce short-term emissions related to construction activities. Although this alternative would substantially reduce both long- and short-term pollutant emissions, due to the scale of development activity that would still occur under this alternative, it would not eliminate significant short- and long-term criteria pollutant contributions of VOCs, NOX, CO, PM10, and PM2.5; it would not be consistent with the air quality management plan, since criteria pollutants thresholds would be exceeded; and it would cumulatively contribute to the SJVAB nonattainment designations for O3 and PM2.5. Therefore, air quality impacts would remain significant and unavoidable under this alternative for both 2035 and Full Buildout Scenarios.
Biological Resources
This alternative would have the same overall development footprint, both within and beyond the SOI, as the proposed project. Therefore, impacts to biological resources would be similar for this alternative as for the proposed General Plan Update, and would be less than significant after mitigation for both 2035 and Full Buildout Scenarios.
Cultural Resources
Impacts to cultural resources would generally be similar to impacts under the proposed project. Cultural resource impacts would primarily be associated with potential ground disturbance and development of previously undisturbed areas, or demolition of historic structures. Though, this alternative would reduce intensity of development, the distribution of permitted land uses in this alternative would be across the entire Plan Area, similar to the proposed General Plan Update. Impacts to historical resources would be significant and unavoidable for this alternative, as for the proposed project for both 2035 and Full Buildout Scenarios.
Geology and Soils
This alternative would reduce growth intensity substantially across the entire Plan Area. Individual projects would be required to prepare a geotechnical investigation specific to the project site to evaluate liquefaction, ground settlement, and/or soil expansion hazards onsite. All projects would be required to comply with existing federal and state regulations, such as the California Building Code, California Plumbing Code, and Statewide General Construction Activity Permit/Storm Water Pollution Prevention Plans. However, low density growth would reduce the number of residents, visitors, and structures subject to geological hazards in the Plan Area. Impacts would be reduced for both 2035 and Full Buildout Scenarios.
Greenhouse Gas Emissions
Under this alternative, mobile- and stationary-source emissions, and indirect emissions from energy usage from operation of the project would be substantially reduced due to the reduction in residential uses and nonresidential

G E N E R A L P L A N A N D D E V E L O P M E N T C O D E U P D A T E D R A F T P E I R C I T Y O F C L O V I S
7. Alternatives to the Proposed Project
June 2014 Page 7-39
square footage. The reduction in land uses would result in fewer vehicle trips generated upon project buildout in the Plan Area, which would reduce the amount of GHGs emitted. Additionally, GHG emissions from stationary sources and energy usage would be reduced compared to the proposed project due to the reduction in building square footage. Because this alternative would result in fewer mixed-use-designated areas compared to the proposed land use plan, the overall potential reduction in VMT due to higher density and reduced distances between services and amenities could be lessened. However, any potential benefits from higher concentration of mixed uses under the proposed General Plan Update would be offset by fewer trips generated in the Plan Area under this alternative. In addition, this alternative would still include some Mixed Use Village land use designations throughout the Clovis Plan Area. Overall, under the Low Density Growth Alternative, GHG emissions from stationary and mobile sources and energy use would be substantially reduced compared to the proposed project. However, due to the scale of development that would still occur under this alternative, short- and long-term GHG emissions would still substantially cumulatively contribute to climate change impacts. Additional statewide measures would be necessary to reduce GHG emissions to meet the SJVAPCD threshold of 29 percent below BAU and the reduction target of Executive Order S-03-05, which identified a goal to reduce GHG emissions to 80 percent of 1990 levels by 2050. Therefore, GHG impacts would remain significant and unavoidable under this alternative for both 2035 and Full Buildout Scenarios.
Hazards and Hazardous Materials
Although this alternative would substantially reduce development density, all land uses throughout the City would be required to comply with existing state, federal, and county regulations governing use, storage, transport, and disposal of hazardous materials and hazardous wastes. Structures built in fire hazard severity zones would be required to comply with building standards in California Building Code, Chapters 7 and 7A, and California Fire Code, Chapter 49. Developments and redevelopments in both this alternative and the proposed General Plan Update would be required to comply with regulations related to safety compatibility zones and airspace protection surfaces for Fresno Yosemite International Airport. This alternative would reduce the numbers of residents and workers that would be exposed to existing hazards in the Plan Area, such as wildfire hazards, existing hazardous materials, and aviation-related hazards. Overall, hazards and hazardous materials impacts would be slightly reduced by this alternative and would be less than significant for both 2035 and Full Buildout Scenarios.
Hydrology and Water Quality
This alternative would reduce water demands by 41 percent, which would reduce the proposed General Plan Update’s significant and unavoidable impact to groundwater use to less than significant levels. . It would also reduce generation of pollutants that could contaminate water by reducing development intensity. The same drainage improvements would be required for this alternative as for the proposed project, since both would involve development of most of the Plan Area, regardless of intensity. No significant flooding impacts would occur in either this alternative or the proposed General Plan Update. Overall, hydrology and water quality impacts would be reduced by this alternative for both 2035 and Full Buildout Scenarios.

G E N E R A L P L A N A N D D E V E L O P M E N T C O D E U P D A T E D R A F T P E I R C I T Y O F C L O V I S
7. Alternatives to the Proposed Project
Page 7-40 PlaceWorks
Land Use and Planning
The Low Density Growth Alternative would lower permitted density in the City, but buildout of this alternative would still occupy the entire Plan Area. This alternative would lead to more dispersed, lower-density development than would the proposed General Plan Update. Therefore, this alternative would somewhat conflict with existing and proposed policies favoring more concentrated and compact development, such as those in the Fresno COG Regional Transportation Plan and the San Joaquin Valley Blueprint. The low density environment would not promote mass transit or active transportation since land uses would be more spread out across the City, and the minimal increase in population would not favor transit use. Land use and planning impacts would be greater for this alternative than for the proposed project for both 2035 and Full Buildout Scenarios.
Mineral Resources
Under the Low Density Growth Alternative, mineral resource impacts would be similar to impacts under the proposed project. The entire Plan Area does not have significant mineral resources, active or inactive mines, nor mineral resource sectors. Thus, implementation of the alternative would not cause a loss of availability of known mineral resources, and impacts would be similar for both 2035 and Full Buildout Scenarios.
Noise
This alternative would substantially reduce the number of dwelling units, nonresidential square footage, population, and employment and result in a substantial reduction in vehicle trips. A reduction in vehicle trips would reduce traffic noise levels along roadways and lessen traffic-related noise impacts. However, due to the low volumes under existing conditions and the scale of development that would still occur under this alternative, significant traffic impacts along certain roadways could still result. Similarly, though a reduction in overall development would also reduce construction-related noise and vibration impacts, construction activities associated with buildout of this alternative could still occur in proximity to sensitive uses. Thus, construction-related noise and vibration impacts would still be significant. Therefore, while noise impacts under this alternative would be reduced, they would remain significant and unavoidable for both 2035 and Full Buildout Scenarios.
Population and Housing
Population growth under this alternative would be reduced by nearly 50 percent in comparison to the proposed project. This alternative would considerably reduce the significant population growth impact of the proposed project, as the population projection for the entire Plan Area at full buildout of this alternative would be lower than the Fresno COG 2035 projection for just the City of Clovis. Thus, the significant and unavoidable impact of population growth at full General Plan Update buildout would be eliminated under this alternative for Full Buildout.
However, the jobs-housing ratio would be reduced from 0.99 to 0.81, because though the population growth impact would be reduced under this low density alternative, over half of the employment opportunities (nearly 60 percent) would be eliminated. As shown on Figure 7-3, Low Density Growth Alternative, employment would be limited to only a handful of retail and business centers. The 0.81 jobs-housing ratio is a housing-rich situation, which is not ideal given that the California Department of Finance identifies a 1.50 ratio as a healthy jobs-housing

G E N E R A L P L A N A N D D E V E L O P M E N T C O D E U P D A T E D R A F T P E I R C I T Y O F C L O V I S
7. Alternatives to the Proposed Project
June 2014 Page 7-41
balance. A 0.81 jobs-housing ratio means that many of Clovis’ residents would have to travel out of the City for employment opportunities, which increases commuting vehicle trips and vehicle miles traveled. Thus, although the significant, unavoidable population growth impact would be eliminated under this alternative, the jobs-housing balance would worsen. Overall impacts to population and housing would therefore be similar to the proposed project under this alternative.
Public Services
Given the lower intensity of development under this alternative, public service demands for fire, police, school, and library services would be reduced. The population, residential units, and jobs expected at Full Buildout of this alternative would all be approximately 50 to 60 percent less than that proposed by the proposed project. Because development density would be much lower, calls for service would not be as high as those in Clovis’ urban areas, resulting in less efficient use of new fire and police stations and resources and increased response times in the non-SOI Plan Area. By Full Buildout, the stations serving the low density developments in the non-SOI Plan Area may become cost-prohibitive. Therefore, demand for public services and overall impacts would increase under this alternative.
Recreation
Recreation impacts would be reduced under this alternative because population growth expected at Full Buildout of this alternative would be nearly 50 percent less than for the proposed project. With a substantial decrease in population, demands on parks and recreational facilities would also greatly decrease, and result in less demand for improvements, expansions, and/or maintenance of existing parks and recreational facilities. Impacts would be reduced under this alternative for both 2035 and Full Buildout Scenarios.
Transportation and Traffic
This alternative at buildout would decrease population and employment in the Plan Area by about 50 percent and 59 percent, respectively, compared to the proposed project (according to the buildout statistics in Table 7-1). This alternative would reduce trip generation compared to the proposed project, resulting in less vehicular traffic in the study area. Traffic impacts would thus likely be reduced by this alternative. Under the proposed project, one segment in the City of Clovis, 11 in the County of Fresno, and 7 freeway mainline segments were identified as significantly impacted by the project. Under this alternative, impacts would be greatly reduced and perhaps eliminated. There would be less capital available from transportation funds that are based on dwelling unit development, but the circulation network would not need as robust to serve the traffic demand generated by the project. Thus, traffic impacts would be reduced but remain significant and unavoidable under both 2035 and Full Buildout Scenarios.
Utilities and Service Systems
This alternative would reduce utilities demands substantially compared to the proposed project by reducing buildout population by about half and employment by about 59 percent. Thus, this alternative would reduce demands for natural gas and electricity and reduce generation of wastewater and solid waste for both 2035 and Full Buildout Scenarios. In addition, water supply demand at Full Buildout of this alternative would be
G E N E R A L P L A N A N D D E V E L O P M E N T C O D E U P D A T E D R A F T P E I R C I T Y O F C L O V I S
7. Alternatives to the Proposed Project
Page 7-42 PlaceWorks
approximately 46,000 afy, which is about 25,000 afy under the forecast water supply in the City’s 2010 UWMP (see Table 7-2). Therefore, the significant and unavoidable impact to water supply would be eliminated for both the 2035 and Full Buildout Scenarios. However, similar to the proposed project, this alternative would designate uses across the entire Plan Area. Thus, extensions of utilities and service systems into the non-SOI Plan Area would still be needed. Overall, utilities and service systems impacts would be reduced by this alternative for both 2035 and Full Buildout Scenarios.
7.7.1 Ability to Reduce Environmental Impacts This low density alternative would reduce impacts to aesthetics, geology and soils, hazards and hazardous materials, hydrology and water quality, recreation, and utilities and service systems. Similar impacts would occur to biological resources, cultural resources, and mineral resources. Greater impacts would occur to land use and planning, and public services. This alternative would reduce significant and unavoidable impacts related to population growth at Full Buildout, and groundwater use and water supply for both 2035 and Full Buildout Scenarios. However, while this alternative would reduce impacts to the following, it would not avoid significant and unavoidable impacts to air quality, greenhouse gas emissions, historical resources, construction-related noise and vibration, and traffic.
7.7.2 Ability to Achieve Project Objectives The Low Density Growth Alternative would preserve the authenticity of Old Town and plan new development that creates a sense of community and place (No. 1); preserve the character and quality of life of existing residential neighborhoods (No. 2); and design public open space resources for trails, parks, and recreation (No. 7). However, this alternative drastically decreases development density and would encourage sprawled development in the Plan Area. Under a low density development plan, the City would not be able to develop complete communities in the three urban centers (No. 4) because there are far fewer commercial and employment centers. By substantially decreasing growth, this alternative would not be able to accommodate 80 years of growth in the Clovis Plan Area (No. 3); balance residential growth with employment generating development (No. 5); or create adequate housing, employment, and lifestyle opportunities for all ages and incomes of residents (No. 6).
7.8 ENVIRONMENTALLY SUPERIOR ALTERNATIVE CEQA requires a lead agency to identify the “environmentally superior alternative” and, in cases where the “No Project” Alternative is environmentally superior to the proposed project, the environmentally superior development alternative must be identified from the other alternatives (CEQA 15126.6(e)(2)). Table 7-3 provides a summary of the alternatives impact analysis.

G E N E R A L P L A N A N D D E V E L O P M E N T C O D E U P D A T E D R A F T P E I R C I T Y O F C L O V I S
7. Alternatives to the Proposed Project
June 2014 Page 7-43
Table 7-3 Proposed Project vs. Alternatives: Impacts Comparison
Resource Proposed Project
Impacts
Alternatives: Impact Relative to Proposed Project No Project/ Existing
General Plan Moderate Growth
within SOI Concentrated
Growth within SOI Low Density Growth Aesthetics LS = < = < Agriculture and Forestry Resources
S/U < < < =
Air Quality S/U < < < < Biological Resources LS/M < < < = Cultural Resources S/U < < < = Geology and Soils LS < < < < Greenhouse Gas Emissions
S/U < < < <
Hazards and Hazardous Materials
LS = < < <
Hydrology and Water Quality
S/U < <* = <*
Land Use and Planning
LS > = > >
Mineral Resources LS = = = = Noise S/U < < = < Population and Housing
S/U < <* = =*
Public Services LS/M = < < > Recreation LS = > > < Transportation and Traffic
S/U < < > <
Utilities and Service Systems
S/U < <* < <*
Symbols: < Impacts would be less than those of the proposed project > Impacts would be greater than those of the proposed project = Impacts would be similar to the proposed project LS Less than Significant Impact LS/M Less than Significant Impact with Mitigation Incorporated S/U Significant Impact * Eliminates a significant, unavoidable impact
Each alternative selected for analysis in this document has a different combination of effects whose significance would be equal to, greater than, or less than the proposed project. The proposed project has nine environmental impacts that would be significant and unavoidable: Agricultural Resources, Air Quality (inconsistency with air quality management plan, construction and long-term emissions), Cultural Resources (historic resources), Greenhouse Gas Emissions, Hydrology and Water Quality (groundwater use), Noise (traffic, construction noise and vibration), Population and Housing (population growth), Transportation and Traffic (roadway segment operations), and Utilities and Service Systems (water supply). One alternative has been identified as “environmentally superior” to the proposed project:
Moderate Growth within SOI Alternative

G E N E R A L P L A N A N D D E V E L O P M E N T C O D E U P D A T E D R A F T P E I R C I T Y O F C L O V I S
7. Alternatives to the Proposed Project
Page 7-44 PlaceWorks
The Moderate Growth within SOI Alternative has been identified as the environmentally superior alternative. This alternative would lessen impacts associated with the following impacts: Aesthetics, Agriculture and Forestry Resources, Air Quality, Biological Resources, Cultural Resources, Geology and Soils, Greenhouse Gas Emissions, Hazards and Hazardous Materials, Hydrology and Water Quality, Noise, Population and Housing, Public Services, Transportation and Traffic, and Utilities and Service Systems. This alternative would also eliminate the significant and unavoidable impact to population and housing, groundwater use, and water supply. The following remaining impacts are generally the same as the proposed project: Land Use and Planning and Mineral Resources.

June 2014 Page 8-1
8. Impacts Found Not to Be Significant California Public Resources Code Section 21003 (f) states: “…it is the policy of the state that…[a]ll persons and public agencies involved in the environmental review process be responsible for carrying out the process in the most efficient, expeditious manner in order to conserve the available financial, governmental, physical, and social resources with the objective that those resources may be better applied toward the mitigation of actual significant effects on the environment.” This policy is reflected in the State California Environmental Quality Act (CEQA) Guidelines (Guidelines) Section 15126.2(a), which states that “[a]n EIR [Environmental Impact Report] shall identify and focus on the significant environmental impacts of the proposed project” and Section 15143, which states that “[t]he EIR shall focus on the significant effects on the environment.” The Guidelines allow use of an Initial Study to document project effects that are less than significant (Guidelines Section 15063[a]). Guidelines Section 15128 requires that an EIR contain a statement briefly indicating the reasons that various possible significant effects of a project were determined not to be significant, and were therefore not discussed in detail in the Draft PEIR.
As described in the Notice of Preparation (NOP) prepared for the proposed project, all impact categories were found to have at least one potentially significant impact; therefore, all general categories have been evaluated in the Draft PEIR.
8.1 ASSESSMENT IN THE INITIAL STUDY The Initial Study prepared for the proposed project in June 2012 determined that the specific impacts listed below would be less than significant. Consequently, they have not been further analyzed in this Draft PEIR. Please refer to Appendix A, Initial Study, for explanation of the basis of these conclusions. Impact categories and questions below are summarized directly from the CEQA Environmental Checklist, as contained in the Initial Study.
Table 8-1 Impacts Found Not to Be Significant Environmental Issues Initial Study Determination
II. AGRICULTURE AND FOREST RESOURCES. In determining whether impacts to agricultural resources are significant environmental effects, lead agencies may refer to the California Agricultural Land Evaluation and Site Assessment Model (1997) prepared by the California Dept. of Conservation as an optional model to use in assessing impacts on agriculture and farmland. In determining whether impacts to forest resources, including timberland, are significant environmental effects, lead agencies may refer to information compiled by the California Department of Forestry and Fire Protection regarding the state’s inventory of forest land, including the Forest and Range Assessment Project and the Forest Legacy Assessment project; and forest carbon measurement methodology provided in Forest Protocols adopted by the California Air Resources Board. Would the project: c) Conflict with existing zoning for, or cause rezoning of, forest land (as defined in
Public Resources Code section 12220(g)), timberland (as defined by Public Resources Code section 4526), or timberland zoned Timberland Production (as defined by Government Code section 51104(g))?
No Impact
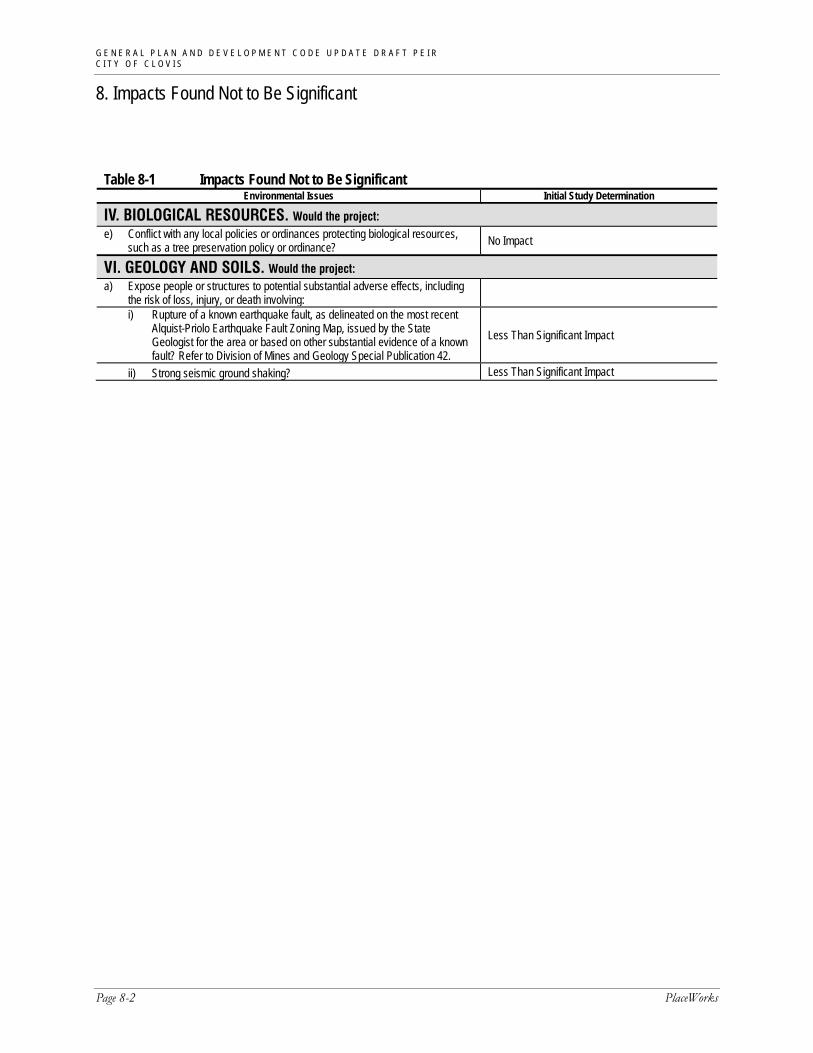
G E N E R A L P L A N A N D D E V E L O P M E N T C O D E U P D A T E D R A F T P E I R C I T Y O F C L O V I S
8. Impacts Found Not to Be Significant
Page 8-2 PlaceWorks
Table 8-1 Impacts Found Not to Be Significant Environmental Issues Initial Study Determination
IV. BIOLOGICAL RESOURCES. Would the project: e) Conflict with any local policies or ordinances protecting biological resources,
such as a tree preservation policy or ordinance? No Impact
VI. GEOLOGY AND SOILS. Would the project: a) Expose people or structures to potential substantial adverse effects, including
the risk of loss, injury, or death involving:
i) Rupture of a known earthquake fault, as delineated on the most recent Alquist-Priolo Earthquake Fault Zoning Map, issued by the State Geologist for the area or based on other substantial evidence of a known fault? Refer to Division of Mines and Geology Special Publication 42.
Less Than Significant Impact
ii) Strong seismic ground shaking? Less Than Significant Impact
June 2014 Page 9-1
9. Significant Irreversible Changes Due to the Proposed Project
Section 15126.2(c) of the CEQA Guidelines requires that an environmental impact report (EIR) describe any significant irreversible environmental changes that would be caused by the proposed project should it be implemented. In the case of the proposed General Plan Update, implementation would cause the following significant irreversible changes:
Future development would involve construction activities that entail the commitment of nonrenewable and/or slowly renewable energy resources, including gasoline, diesel fuel, and electricity; human resources (e.g., labor and time); and natural resources such as lumber and other forest products, sand and gravel, asphalt, steel, copper, lead, other metals, and water.
An increased, long-term commitment of social services and public maintenance services (e.g., police, fire, and sewer and water services) would also be required.
Population growth related to project implementation would increase vehicle trips over the long term. Emissions associated with such vehicle trips would continue to contribute to the San Joaquin Valley Air Basin’s nonattainment designation for ozone (O3) and fine inhalable particulate matter (PM2.5) under the California and National ambient air quality standards.
Future development in accordance with the City of Clovis General Plan and Development Code Update is a long-term irreversible commitment of vacant parcels of land or redevelopment of existing developed land in the City’s Plan Area. More specifically, land use designations under the proposed project would convert important agricultural land to nonagricultural uses and result in the loss of important farmland.
Given the low likelihood that the land would revert to lower intensity uses or to its current form, the proposed project would generally commit future generations to these environmental changes.

G E N E R A L P L A N A N D D E V E L O P M E N T C O D E U P D A T E D R A F T P E I R C I T Y O F C L O V I S
9. Significant Irreversible Changes Due to the Proposed Project
Page 9-2 PlaceWorks
This page intentionally left blank.

June 2014 Page 10-1
10. Growth-Inducing Impacts of the Proposed Project Pursuant to Sections 15126(d) and 15126.2(d) of the CEQA Guidelines, this section is provided to examine ways in which the proposed project could foster economic or population growth or the construction of additional housing, either directly or indirectly, in the surrounding environment. Also required is an assessment of other projects that would foster activities that could affect the environment, individually or cumulatively. To address this issue, potential growth-inducing effects will be examined through analysis of the following questions:
Would this project remove obstacles to growth, e.g., through the construction or extension of major infrastructure facilities that do not presently exist in the project area, or through changes in existing regulations pertaining to land development?
Would this project result in the need to expand one or more public services to maintain desired levels of service?
Would this project encourage or facilitate economic effects that could result in other activities that could significantly affect the environment?
Would approval of this project involve some precedent-setting action that could encourage and facilitate other activities that could significantly affect the environment?
Please note that growth-inducing effects are not to be construed as necessarily beneficial, detrimental, or of little significance to the environment. This issue is presented to provide additional information on how this project could contribute to significant changes in the environment, beyond the direct consequences of developing the land use concept examined in the preceding sections of this Draft PEIR.
Would this project remove obstacles to growth, e.g., through the construction or extension of major infrastructure facilities that do not presently exist in the project area, or through changes in existing regulations pertaining to land development?
Buildout of the Clovis General Plan and Development Code Update would directly induce substantial growth in the City of Clovis’s Plan Area through both major infrastructure improvements and changes in existing regulations.
Construction or Extension of Major Infrastructure
Development in accordance with the General Plan Update would extend from the City limits into the sphere of influence (SOI) and non-SOI Plan Area. This would require construction of infrastructure extensions and improvements, such as roadways, storm drains, water pipes, solid waste collection systems, and energy/communication extensions out toward the non-SOI Plan Area as development occurs. As

G E N E R A L P L A N A N D D E V E L O P M E N T C O D E U P D A T E D R A F T P E I R C I T Y O F C L O V I S
10. Growth-Inducing Impacts of the Proposed Project
Page 10-2 PlaceWorks
infrastructure is extended throughout the Plan Area, obstacles to growth would be removed. Impacts to existing utilities and service systems and potential needs for future improvements are discussed further in Section 5.17, Utilities and Service Systems.
Both the 2035 scenario and Full Buildout of the General Plan Update would require additional firefighting and police protection personnel and require construction of new and/or expanded fire and police stations. Buildout would also require construction and operation of new and/or expanded schools in Clovis Unified School District and Sanger Unified School District. The Clovis Regional Library anticipates the need to expand or construct new library facilities to accommodate the expected population growth. Impacts from the proposed project on public services facilities are discussed in detail in Section 5.14, Public Services.
Buildout of roadways in the SOI and non-SOI Plan Area per roadway classifications in the proposed General Plan Circulation Element would increase roadway capacity in the Plan Area to maintain adequate levels of service. This would allow for more efficient multimodal transportation throughout the Plan Area and would promote the development of land near these enhanced roadways. Proposed roadway classifications and their impacts are described in Section 5.16, Transportation and Traffic.
Changes in Existing Regulations
Much of the SOI and non-SOI Plan Area are currently designated Agriculture, Rural Residential, Park, Open Space, Industrial, and Very Low Density Residential. The proposed land use plan would change existing land use designations to include Low- to High-Density Residential, Mixed-Use Village, Mixed-Use Business Campus, General Commercial, Parks, Open Space, and School uses, predominantly in the three urban centers—Loma Vista and the Northwest and Northeast Urban Centers. The proposed land use plan would maintain the majority of the Agriculture and Rural Residential land uses in the remaining areas of the non-SOI Plan Area. At full buildout of the General Plan Update, the proposed intensification of uses in the Plan Area would allow up to 294,300 persons, 179,300 more than the City’s existing 2013 population. Additional buildout statistics, including employment, housing units, households, and building square footage, are detailed in Table 3-4, Buildout Statistical Summary, in Chapter 3, Project Description.
Would this project result in the need to expand one or more public services to maintain desired levels of service?
As stated above, proposed project buildout would require additional fire and police services, school facilities, and library space to maintain desired levels of service. This would include expanding existing facilities and/or acquiring land to construct new stations, schools, and libraries, and adequately equipping and staffing these new facilities. Section 5.14, Public Services, analyzes the impacts of the proposed project on existing public services in more detail.
Would this project encourage or facilitate economic effects that could result in other activities that could significantly affect the environment?
Implementation of the proposed project would not encourage or facilitate economic effects that could result in other activities that could significantly affect the environment. Full buildout of the Clovis General Plan Update

G E N E R A L P L A N A N D D E V E L O P M E N T C O D E U P D A T E D R A F T P E I R C I T Y O F C L O V I S
10. Growth-Inducing Impacts of the Proposed Project
June 2014 Page 10-3
would increase employment in the City to 63,200 jobs, 33,200 more jobs than existing. Impacts of the increases in job-generating land uses and employment pursuant to the General Plan Update are analyzed throughout Chapter 5 of this Draft PEIR. No additional impacts would occur.
Would approval of this project involve some precedent-setting action that could encourage and facilitate other activities that could significantly affect the environment?
Cities and counties in California periodically update their general plans pursuant to California Government Code Sections 65300 et seq. Thus, approval of the proposed Clovis General Plan and Development Code Update would not set a precedent that could encourage and facilitate other activities that could significantly affect the environment.
G E N E R A L P L A N A N D D E V E L O P M E N T C O D E U P D A T E D R A F T P E I R C I T Y O F C L O V I S
10. Growth-Inducing Impacts of the Proposed Project
Page 10-4 PlaceWorks
This page intentionally left blank.

June 2014 Page 11-1
11. Organizations and Persons Consulted CITY OF CLOVIS
Robert Woolley, City Manager
John Holt, Assistant City Manager
David Wolfe, City Attorney
Planning and Development Services
Dwight Kroll, AICP, Director of Planning and Development Services
Steve E. White, P.E., Assistant Director/City Engineer
Tina Sumner, Community and Economic Development Director
Ryan C. Burnett, AICP, Management Analyst
Bryan Araki, Senior Planner
George Gonzalez, Associate Planner
Mike Harrison, Associate Engineer
David E. Fey, AICP, Fresno LAFCo Executive Officer (Former Deputy City Planner)
Public Utilities Department
Lisa Koehn, Assistant Public Utilities Director
Eric Aller, Parks Manager
Eric Zetz, Solid Waste Manager
Fire Department
Michael Despain, Fire Chief
Lee Kraft, Former Fire Chief
Chad Fitzgerald, Life Safety Enforcement Manager
Police Department
Matthew Basgall, Police Captain

G E N E R A L P L A N A N D D E V E L O P M E N T C O D E U P D A T E D R A F T P E I R C I T Y O F C L O V I S
11. Organizations and Persons Consulted
Page 11-2 PlaceWorks
California Department of Transportation, District 6
Steven McDonalds, Senior, District 6 Technical Planning Unit
Fresno Council of Governments
Kathy Chung, Senior Regional Planner
Fresno Metropolitan Flood Control District
Daniel Rourke, Environmental Resources Manager
Fresno Irrigation District
Oscar Carreon, Engineering Technician
Fresno County Fire Protection District
Chris Bump, Battalion Chief
Fresno County Public Library
Kelley Worman-Landano, Associate County Librarian
Fresno County Sheriff’s Department
Jennifer Horton, Captain
Valerie Mull, Secretary
Clovis Unified School District
Don Ulrich, Assistant Superintendent, Facility Services
Fresno Unified School District
Lisa LeBlanc, Executive Officer, Facilities Management & Planning
Sanger Unified School District
Richard Sepulveda, Chief Operations Officer
Sequoia Riverlands Trust
Chris Moi, Director of Land Transactions

June 2014 Page 12-1
12. Qualifications of Persons Preparing EIR PLACEWORKS JoAnn C. Hadfield Principal, Environmental Services
BS, University of Utah, Urban Planning
Coursework Completion, BS, Engineering, California State University, San Diego
Engineer-in-Training Certificate
Colin Drukker Associate Principal
Master of Urban and Regional Planning, University of California, Irvine
BA, Urban Studies and Planning, University of California, San Diego
Stephen Gunnells Chief Economist
MSc, Development Management, London School of Economics
Master of Urban and Regional Planning, University of Virginia
BA, Urban Planning, Virginia Tech
Nicole Vermilion Associate Principal, Air Quality & GHG
Master of Urban and Regional Planning, University of California, Irvine
BA, Environmental Studies and BS Ecology and Evolutionary Biology, University of California, Santa Cruz
Fernando Sotelo, INCE Senior Associate, Transportation and Noise
MS, Civil Engineering, University of Southern California
BS, Naval Engineering, University of Sao Paulo, Brazil
Jorge Estrada Associate Planner
BS, Urban and Regional Planning, California State Polytechnic University, Pomona
Certificate in Engineering/Architectural AutoCAD, Cal State Long Beach

G E N E R A L P L A N A N D D E V E L O P M E N T C O D E U P D A T E D R A F T P E I R C I T Y O F C L O V I S
12. Qualifications of Persons Preparing EIR
Page 12-2 PlaceWorks
John Vang, JD Associate Planner
JD, Cleveland State University
MUPDD, Cleveland State University
BA, Anthropology, University of California, Los Angeles
Michael Milroy Associate Planner
MS, Interdisciplinary Studies/Neuroscience, California State University, Long Beach
BS, Biological Science, California State University, Long Beach
Frances Ho Planner
Master of City and Regional Planning, Cornell University
BS, Environmental Systems, University of California, San Diego
Robert Kain GIS Manager
BS, Urban and Regional Planning, California State Polytechnic University, Pomona.
Cary Nakama Graphic Designer
BA, Business Administration: Data Processing and Marketing, California State University, Long Beach
AA, Computer Graphic Design, Platt College of Computer Graphic Design
FEHR & PEERS David Robinson Senior Associate
Rob Hananouchi Senior Transportation Planner

G E N E R A L P L A N A N D D E V E L O P M E N T C O D E U P D A T E D R A F T P E I R C I T Y O F C L O V I S
12. Qualifications of Persons Preparing EIR
June 2014 Page 12-3
LIVE OAK ASSOCIATES, INC. David Hartesveldt Principal
Austin Pearson Director of Ecological Services
Jeff Gurule Senior Project Manager, Staff Ecologist
SWCA ENVIRONMENTAL CONSULTANTS John Dietler Cultural and Paleontological Resources Program Director
Steven Treffers Cultural Resources Specialist, Architectural Historian
G E N E R A L P L A N A N D D E V E L O P M E N T C O D E U P D A T E D R A F T P E I R C I T Y O F C L O V I S
12. Qualifications of Persons Preparing EIR
Page 12-4 PlaceWorks
This page intentionally left blank.

June 2014 Page 13-1
13. Bibliography Airnav 2014. http://www.airnav.com/airport/L22.
Aller, Eric (parks manager). 2013, June 6. Response to service questionnaire. City of Clovis.
American Farmland Trust. 2008, December. Model Farmland Conservation Program for Fresno County. http://www.fresnocog.org/files/FarmlandConservation/Fresno%20County%20Report_01-06-09.pdf.
Basgall, Matthew (captain). 2013, August 7. Response to service questionnaire. Clovis Police Department.
Bay Area Air Quality Management District. 2011, May (Revised). California Environmental Quality Act Air Quality Guidelines.
Bies, David A. and Colin H. Hansen. 2003. Engineering Noise Control: Theory and Practice. 3rd ed. New York: Spon Press.
Blair, Church & Flynn Consulting Engineers. 2008, June 30. Wastewater Master Plan Update Phase 2: Wastewater Collection System Master Plan. http://www.ci.clovis.ca.us/Portals/0/Documents/PublicUtilities/Clovis%20WWMP%20Draft%20Final%20Report.pdf.
Bolt, Beranek and Newman, Inc. 1971. Noise from Construction Equipment and Operations, Building Equipment and Home Appliances. Prepared for the United States Environmental Protection Agency. Washington, DC.
Bump, Chris (battalion chief). 2013, August 9. Response to service questionnaire. Fresno County Fire Protection District.
California Air Resources Board. 1999, December. Final Staff Report: Update to the Toxic Air Contaminant List.
———. 2005, April. Air Quality and Land Use Handbook: A Community Health Perspective.
———. 2007, April. Air Resources Board’s Proposed State Strategy for California’s 2007 State Implementation Plan.
———. 2008, October. Climate Change Proposed Scoping Plan: A Framework for Change.
———. 2010, May. Local Government Operations Protocol (LGOP). Version 1.1.

G E N E R A L P L A N A N D D E V E L O P M E N T C O D E U P D A T E D R A F T P E I R C I T Y O F C L O V I S
3. Bibliography
Page 13-2 PlaceWorks
———. 2010, August. Proposed Regional Greenhouse Gas Emission Reduction Targets for Automobiles and Light Trucks Pursuant to Senate Bill 375. Staff Report.
———. 2011, November 14. Landfill Emissions Tool Model, Version 1.3.
———. 2011. EMFAC2011. Modeling software.
———. 2012, April. California Greenhouse Gas Inventory for 2000–2009: By Category as Defined by the Scoping Plan.
———. 2012. Status of Scoping Plan Recommended Measures. http://www.arb.ca.gov/cc/scopingplan/status_of_scoping_plan_measures.pdf.
———. 2013, January 15. Staff Report Update on Senate Bill 375 Implementation in the San Joaquin Valley. http://www.arb.ca.gov/cc/sb375/finalstaffreport_011513.pdf.
———. 2013, April 1. Area Designations Maps/State and National. http://www.arb.ca.gov/desig/adm/adm.htm.
———. 2013, June 4. Ambient Air Quality Standards. http://www.arb.ca.gov/research/aaqs/aaqs2.pdf.
———. 2014, February 10. Proposed First Update to the Climate Change Scoping Plan: Building on the Framework. http://www.arb.ca.gov/cc/scopingplan/2013_update/draft_proposed_first_update.pdf.
———. 2014. Air Pollution Data Monitoring Cards (2008, 2009, 2010, 2011, and 2012), Accessed January 2014. http://www.arb.ca.gov/adam/topfour/topfour1.php.
California Council of Land Trusts. 2014, April 10. Map of CA Land Trusts. http://www.calandtrusts.org/map-ca-land-trusts/.
California Council on Science and Technology. 2012, September. California’s Energy Future: Portraits of Energy Systems for Meeting Greenhouse Gas Reduction Targets. http://www.ccst.us/publications/2012/2012ghg.pdf.
California Department of Conservation. 2007. Watershed Browser. http://www.conservation.ca.gov/dlrp/watershedportal/WatershedBrowser/Pages/WatershedBrowser.aspx.
California Department of Finance. 2012, November. Report E-8: Historical Population and Housing Estimates for Cities, Counties, and the State, 2000–2010. http://www.dof.ca.gov/research/demographic/reports/estimates/e-8/2000-10/.
———. 2013, January. Report P-1: State and County Population Projections: 2010–2060. http://www.dof.ca.gov/research/demographic/reports/projections/P-1/.
G E N E R A L P L A N A N D D E V E L O P M E N T C O D E U P D A T E D R A F T P E I R C I T Y O F C L O V I S
13. Bibliography
June 2014 Page 13-3
———. 2013, May 1. Report E-1: Population Estimates for Cities, Counties, and the State, January 1, 2012 and 2013. http://www.dof.ca.gov/research/demographic/reports/estimates/e-1/view.php.
———. 2013, May 10. Report E-5: Population and Housing Estimates for Cities, Counties, and the State, January 1, 2011–2013, with 2010 Benchmark. http://www.dof.ca.gov/research/demographic/reports/estimates/e-5/2011-20/view.php.
California Department of Food and Agriculture. 2010, June 15. California Agricultural Highlights 2010. www.cdfa.ca.gov/statistics/files/AgHighlightsBrochure10.pdf.
California Department of Forestry and Fire Prevention. 2007, November 6. Fire Hazard Severity Zones in SRA: Fresno County. http://frap.cdf.ca.gov/webdata/maps/fresno/fhszs_map.10.pdf.
———. 2014, April 14. Frequently Asked Questions. http://calfire.ca.gov/fire_prevention/fire_prevention_wildland_faqs.php#model02.
California Department of Resources Recycling and Recovery. 2012, November 2. Article 5.9. Construction and Demolition and Inert Debris Transfer/Processing Regulatory Requirements. http://www.calrecycle.ca.gov/Laws/Regulations/title14/ch3a59a.htm.
———. 2014, May 15. Countywide, Regionwide, and Statewide Jurisdiction Diversion/Disposal Progress Report. http://www.calrecycle.ca.gov/LGCentral/reports/diversionprogram/JurisdictionDiversionPost2006.aspx.
———. 2014. Disposal Reporting System: Jurisdiction Reporting by Facility. http://www.calrecycle.ca.gov/LGCentral/Reports/DRS/Destination/JurDspFa.aspx.
———. 2014, May 16. Facility/Site Listing: Active Composters in Fresno County. http://www.calrecycle.ca.gov/SWFacilities/Directory/SearchList/List?COUNTY=Fresno&FAC=Composting&OPSTATUS=Active.
———. 2014, May 16. Facility/Site Listing: Active Transfer/Processing Facilities in Fresno County. http://www.calrecycle.ca.gov/SWFacilities/Directory/SearchList/List?COUNTY=Fresno&FAC=Transfer%2fProcessing&OPSTATUS=Active.
———. 2014, May 16. Facility/Site Summary Details: American Avenue Disposal Site. http://www.calrecycle.ca.gov/SWFacilities/Directory/10-AA-0009/Detail/.
———. 2014, May 16. Facility/Site Summary Details: Avenal Regional Landfill. http://www.calrecycle.ca.gov/SWFacilities/Directory/16-AA-0004/Detail/.
———. 2014, May 16. Facility/Site Summary Details: City Of Clovis Landfill. http://www.calrecycle.ca.gov/SWFacilities/Directory/10-AA-0004/Detail/.

G E N E R A L P L A N A N D D E V E L O P M E N T C O D E U P D A T E D R A F T P E I R C I T Y O F C L O V I S
3. Bibliography
Page 13-4 PlaceWorks
———. 2014, May 16. Jurisdiction Disposal by Facility. http://www.calrecycle.ca.gov/LGCentral/Reports/Viewer.aspx?P=OriginJurisdictionIDs%3d89%26ReportYear%3d2012%26ReportName%3dReportEDRSJurisDisposalByFacility.
California Department of Transportation. 2004, June. Transportation- and Construction-Induced Vibration Guidance Manual. Prepared by Jones & Stokes [ICF International]. Available at http://www.dot.ca.gov/hq/env/noise/pub/vibrationmanFINAL.pdf.
———. 2009, November. Technical Noise Supplement. Prepared by ICF International. Available at http://www.dot.ca.gov/hq/env/noise/pub/tens_complete2009RedlineScreenProcess.pdf.
———. 2011, September 7. California Scenic Highway Mapping System. http://www.dot.ca.gov/hq/LandArch/scenic_highways/.
———. 2012. Annual Average Daily Truck Traffic on the California State Highway System. Available at http://traffic-counts.dot.ca.gov/truck2012final.pdf.
———. 2012, November 9. Fresno County Economic Forecast. http://www.dot.ca.gov/hq/tpp/offices/eab/socio_economic_files/2012/Fresno.pdf#zoom=65.
———, Division of Design. 2007. California Scenic Highway Mapping System. http://www.dot.ca.gov/hq/LandArch/scenic_highways/.
California Department of Water Resources. 2006. Groundwater Information Center. http://www.water.ca.gov/groundwater/#.
———. California Data Exchange Center. 2014, May 21. 2014 Water Year Monthly Precipitation (ALL stations). http://cdec.water.ca.gov/cgi-progs/reports/PRECIPOUT.2014.
California Division of Mines and Geology. 1999, April 1. Open File Report 99-02: Update of Mineral Land Classification: Aggregate Materials in the Fresno Production-Consumption Region, California.
California Employment Development Department. 2012, October 17. Monthly Labor Force Data for Counties: August 2012, Preliminary. Report 400C. http://www.calmis.ca.gov/file/lfmonth/1208pcou.pdf.
———. 2013. Historical Labor Force and Employment Data for Fresno County. http://www.labormarketinfo.edd.ca.gov/cgi/dataanalysis/areaselection.asp?tablename=labforce.
———. 2014. Labor Force and Unemployment Rate for Cities and Census Designated Areas. http://www.labormarketinfo.edd.ca.gov.
California Energy Commission. 2006, December. Inventory of California Greenhouse Gas Emissions and Sinks, 1990 to 2004. Report CEC-600-2006-013-SF.
———. 2006. Our Changing Climate: Assessing the Risks to California. 2006 Biennial Report. CEC-500-2006-077.
G E N E R A L P L A N A N D D E V E L O P M E N T C O D E U P D A T E D R A F T P E I R C I T Y O F C L O V I S
13. Bibliography
June 2014 Page 13-5
———. 2006, December. Refining Estimates of Water-Related Energy Use in California. CEC-500-2006-118. Prepared by Navigant Consulting, Inc. Based on the electricity use for Northern California.
———. 2008. The Future Is Now: An Update on Climate Change Science, Impacts, and Response Options for California. CEC-500-2008-0077.
———. 2012, May. Renewables Portfolio Standard Eligibility, Fifth Edition Commission Guidebook. http://www.energy.ca.gov/2012publications/CEC-300-2012-002/CEC-300-2012-002-CMF.pdf.
———. 2012, June. California Energy Demand 2012 Final Forecast. http://www.energy.ca.gov/2012publications/CEC-200-2012-001/CEC-200-2012-001-CMF-V2.pdf.
———. 2013, May 10. California Electrical Energy Generation. http://energyalmanac.ca.gov/electricity/electricity_generation.html.
California Farmland Conservancy Program. 2014, April 10. Agricultural Conservation Easements. http://www.conservation.ca.gov/dlrp/cfcp/overview/Pages/ag_consrv_easements.aspx.
California Gas and Electric Utilities. 2012, July. 2012 California Gas Report. http://www.socalgas.com/regulatory/documents/cgr/2012%20CGR_Final.pdf.
California Geological Survey. 2012, January 26. 2010 Geologic Map of California. http://www.quake.ca.gov/gmaps/GMC/stategeologicmap.html.
———. 2012. Map Sheet 52: Aggregate Sustainability in California. http://www.conservation.ca.gov/cgs/information/publications/ms/Documents/MS_52.pdf.
———. 2013, May 29. 2010 Fault Activity Map of California. http://www.quake.ca.gov/gmaps/FAM/faultactivitymap.html.
California Office of Mining Reclamation. 2012. Mines Map. http://maps.conservation.ca.gov/mol/mol-app.html.
California State Parks. 2012, December 20. Millerton Lake State Recreation Area. http://www.parks.ca.gov/pages/587/files/MillertonSRAWebBrochure2008Rev.pdf.
California Stormwater Quality Association. 2003, January. Stormwater Best Management Practice Handbook: Construction.
Central Valley Regional Water Quality Control Board. 2014, March 28. Storm Water: MS4 Municipal Program.
Chung, Kathy (senior regional planner). 2013. Email correspondence. Fresno Council of Governments.
Climate Action Team. 2006, March. Climate Action Team Report to Governor Schwarzenegger and the Legislature.

G E N E R A L P L A N A N D D E V E L O P M E N T C O D E U P D A T E D R A F T P E I R C I T Y O F C L O V I S
3. Bibliography
Page 13-6 PlaceWorks
Clinkenbeard, John (senior geologist). 2014, May 15. Phone call. California Geological Survey.
Clovis, City of. 1989, June 5. Clovis Corridor Specific Plan. http://www.ci.clovis.ca.us/Portals/0/Documents/Planning/SpecificPlans/ClovisCorridorSP.pdf.
———. 1993. General Plan, Chapter 2: Land Use. http://www.ci.clovis.ca.us/Portals/0/Documents/Planning/ClovisGeneralPlan/ GeneralPlanChapter2.pdf.
———. 1994, December 5. Shaw Avenue Specific Plan. http://www.ci.clovis.ca.us/Portals/0/Documents/Planning/SpecificPlans/ShawAvenueSP.pdf.
———. 2009, July. City of Clovis Sewer System Management Plan. http://www.ci.clovis.ca.us/Portals/0/Documents/PublicUtilities/Wastewater/SSMP.pdf.
———. 2010, January 15. Trails of Clovis.
———. 2011, May. Clovis Bicycle Transportation Master Plan. Prepared by Fehr & Peers. https://www.ci.clovis.ca.us/Portals/0/Documents/Engineering/Bikeways/2011ClovisBTMP.pdf.
———. 2011, November. City of Clovis Urban Water Management Plan 2010 Update. http://www.water.ca.gov/urbanwatermanagement/2010uwmps/Clovis,%20City%20of/20111213%20Clovis%202010%20UWMP.pdf. Prepared by Provost & Pritchard Consulting.
———. 2012, October 26. A Brief History of Clovis. http://www.ci.clovis.ca.us/ABOUTCLOVIS/FACTS/Pages/HistoryofClovis.aspx.
———. 2013, March 6. Park Reservations. http://www.ci.clovis.ca.us/Portals/0/Documents/PublicUtilities/Parks/Park%20Reservation%20fees-web.pdf.
———. 2013, May 20. City of Clovis 2013-2014 Annual Budget. http://www.ci.clovis.ca.us/Portals/0/Documents/Finance/2013-14AnnualBudget.pdf.
———. 2013, June 3. City of Clovis Report to the City Council: Consider Approval – Res. No. 13-__, Confirming the Diagram and Assessments for the Annual Levy, 2013-14 Landscape Maintenance District No. 1. http://www.ci.clovis.ca.us/Portals/0/Documents/CityCouncil/Agendas/2013/20130603/1-B.pdf
———. 2013, June 10. Findings & Recommendations from Community Facilities District Citizens Committee. Finance Department. Report to the City Council: Receive and File. https://www.ci.clovis.ca.us/Portals/0/Documents/CityCouncil/Agendas/2013/20130610/CC-D-3.pdf.
Department of Toxic Substances Control (DTSC). 2012, September 13. EnviroStor. State of California. http://www.envirostor.dtsc.ca.gov/public/.

G E N E R A L P L A N A N D D E V E L O P M E N T C O D E U P D A T E D R A F T P E I R C I T Y O F C L O V I S
13. Bibliography
June 2014 Page 13-7
Despain, Michael (fire chief). 2013, November 18. City of Clovis Report to the City Council: Consider Approval—Authorize the City Manager and Fire Chief to sign an Automatic Aid Agreement between the City of Clovis Fire Department and the Fresno County Fire Protection District for provision of defined emergency services. Clovis Fire Department.
———. 2014, May 15. Email correspondence. Clovis Fire Department.
Division of Land Resource Protection. 2011, January. California Farmland Conversion Report 2006–2008. CA Department of Conservation. http://www.conservation.ca.gov/dlrp/fmmp/Documents/fmmp/pubs/2006-2008/fcr/FCR_0608_final.pdf.
———. 2012, October 9. Williamson Act Participation/Open Space Subvention Act Survey. http://www.conservation.ca.gov/dlrp/lca/Pages/Index.aspx.
———. 2013, April 25. Watershed Browser. http://www.conservation.ca.gov/dlrp/watershedportal/WatershedBrowser/Pages/WatershedBrowser.aspx.
———.2013. Geographic Information Systems (GIS) data layer: Williamson Act lands. CA Department of Conservation.
———. Farmlands of Local Importance. CA Department of Conservation. Accessed May 19, 2014. http://www.conservation.ca.gov/dlrp/fmmp/Documents/Local_definitions_00.pdf.
Ewing, Reid; Bartholomew, Keith; Winkelman, Steve; Walters, Jerry; and Chen, Don. 2008. Growing Cooler. ULI-the Urban Land Institute. Washington, D.C.
Federal Aviation Administration. 2012, October 31. Air Traffic Activity System (ATADS): Airport Operations, Standard Report. http://aspm.faa.gov/opsnet/sys/opsnet-server-x.asp.
Federal Transit Administration. 2006, May. Transit Noise and Vibration Impact Assessment. United States Department of Transportation. FTA-VA-90-1003-06.
Fitzgerald, Chad (life safety enforcement manager). 2014, March 19. Email correspondence. Clovis Fire Department.
Fresno, City of. 2012, May 8. Proposed Policies from General Plan Working Papers. http://www.fresno.gov/NR/rdonlyres/F60E1B25-635E-4349-9C28-89FE1E9C3721/0/PoliciesProposedMay82012.pdf. Accessed May 21. 2014.
———. 2012, September 19. Wastewater Management: Wastewater Plant History. http://www.fresno.gov/Government/DepartmentDirectory/PublicUtilities/Wastewater/AboutWastewater/WastewaterPlantHistory.htm.
G E N E R A L P L A N A N D D E V E L O P M E N T C O D E U P D A T E D R A F T P E I R C I T Y O F C L O V I S
3. Bibliography
Page 13-8 PlaceWorks
———. 2012, November 6. City of Fresno General Plan and Development Code Update Initial Study. http://www.fresno.gov/NR/rdonlyres/807307E2-BCBE-4631-B1C1-69AD2BCA80C8/0/31680016_IS_Fresno_GPCode_11062012c.pdf. Accessed May 21, 2014.
Fresno Council of Governments. 2012, March 27. San Joaquin Valley Demographic Forecasts, 2010 to 2050. http://www.fresnocog.org/sites/default/files/publications/Demographics/San_Joaquin_Valley_Demographic_Forecasts_-_Final_28_Mar_2012.pdf.
———. 2014, March. Draft 2014–2040 Regional Transportation Plan & Sustainable Communities Strategy. http://www.fresnocog.org/sites/default/files/publications/RTP/Draft_RTP/Draft_2014_RTP.pdf.
Fresno County. 2000. Fresno County General Plan Draft EIR.
———. 2000, October. Agriculture and Land Use Element. General Plan. http://www.co.fresno.ca.us/4510/4360/General_Plan/GP_Final_policy_doc/AgElement_rj.pdf. Accessed December 6, 2007.
———. 2006, October 3. Fresno County General Plan Background Report. http://www.co.fresno.ca.us/departmentpage.aspx?id=19705.
———. 2008. Fresno County List of Historic Places. http://www.fresnolibrary.org/hlrc/historicplaces.pdf.
———. 2009. Fresno County Multi-Jurisdictional Local Hazard Mitigation Plan. http://hazardmitigation.calema.ca.gov/docs/approved_lhmps_under_2008_fema_guidance/Fresno_MHMP.pdf.
———. 2010, April 21. Figure LU-1d: Northeast FCMA Land Use Diagram. Fresno County General Plan. http://www.co.fresno.ca.us/DepartmentPage.aspx?id=19705.
———. 2010, August 11. Part 2: Goals and Policies: Health and Safety Element. Fresno County 2000 General Plan. http://www.co.fresno.ca.us/departmentpage.aspx?id=19705.
———. 2011. Parks, After School, Recreation & Community Services – Woodward Park. http://www.fresno.gov/government/departmentdirectory/parksandrecreation/parksandfacilities/regional+parks/woodwardpark.htm.
———. 2013, April 23. Lost Lake Recreation Area. http://www.co.fresno.ca.us/DepartmentPage.aspx?id=51939.
———.2014, June 17. About Fresno County Office of Emergency Services. http://www.co.fresno.ca.us/DivisionPage.aspx?id=31561.
Fresno County Airport Land Use Commission. 2012, June 4. Fresno Yosemite International Airport Land Use Compatibility Plan. http://www.fresno.gov/NR/rdonlyres/20ADACA8-D1A3-4E48-B9A9-6007EB9E8701/0/FYIAirportLandUseCompatibilityPlan12611.pdf.

G E N E R A L P L A N A N D D E V E L O P M E N T C O D E U P D A T E D R A F T P E I R C I T Y O F C L O V I S
13. Bibliography
June 2014 Page 13-9
Fresno County Public Library. 2012. Fresno County Public Library Annual Report 2012.
Fresno Irrigation District. 2006, December. Fresno Area Regional Groundwater Management Plan. http://fresnofloodcontrol.org/water_resources/Fresno%20Area%20Regional%20GWMP%20Final.pdf.
———. 2009, January. Fresno Area Regional Groundwater Management Plan Annual Report: 2008 Depth to Water in Wells. http://www.fresnoirrigation.com/index.php?c=42.
———. 2013, March 13. FID to Start 2013 Water Deliveries on April 1 and April 16. http://www.fresnoirrigation.com/index.php?id=113.
———. 2013, June 24. Drought-Shortened Water Deliveries Will End July 15 for Portions and Completely on July 31. http://www.fresnoirrigation.com/index.php?id=116.
———. 2013, September 3. Fresno Area Regional Groundwater Management Plan. Annual Report. Depth to Water in Wells (Spring 2012).
———. 2014b, January 31. FID Facilitates Emergency Banking to Provide Dry-Year Water for Small Valley Cities, Towns. http://www.fresnoirrigation.com/index.php?id=120.
———. 2014a, May 14. Water Deliveries Will Begin June 1. http://www.fresnoirrigation.com/index.php?id=125.
———. 2014, May 23. FID Pond Measurement: State of California DWR LGA Grant (AB303). http://www.fresnoirrigation.com/index.php?c=36.
Fresno Metropolitan Flood Control District. 1999, February. Fresno-Clovis Storm Water Quality Management Plan.
———. 2007, November 19. Storm Water Facts. http://fresnofloodcontrol.org/flood_control_system/urban%20system/urban%20storm%20drain%20service.pdf.
———. 2009, September 23. District Services Plan 2009. http://fresnofloodcontrol.org/About%20Us/2009%20District%20Services%20Plan%20web.pdf.
———. 2012, August 7. Storm Drainage and Flood Control Master Plan. http://fresnofloodcontrol.org/flood_control_system/urban%20system/Basin%20map.pdf.
———. 2013, September 1. Fresno-Clovis Storm Water Quality Management Plan FY 2012-2013 Annual Report. http://www.fresnofloodcontrol.org/clean_stormwater/2012-13%20Final%20Annual%20Report%20&%20attachments.pdf.
———. 2014, April 18. Pollutant Removal. http://www.fresnofloodcontrol.org/water_resources/pollutant_removal.html.

G E N E R A L P L A N A N D D E V E L O P M E N T C O D E U P D A T E D R A F T P E I R C I T Y O F C L O V I S
3. Bibliography
Page 13-10 PlaceWorks
Galloway, D. L., and F. S. Riley. 1999. “San Joaquin Valley, California: Largest Human Alteration of the Earth’s Surface.” In Land Subsidence in the United States. Edited by D. L. Galloway, D. R, Jones, and S. E. Ingebritsen. U.S. Geological Survey Circular 1182, pp. 23–34. http://pubs.usgs.gov/circ/circ1182/.
Governor’s Office of Planning and Research. 2003, October. State of California General Plan Guidelines. Available at http://opr.ca.gov/docs/General_Plan_Guidelines_2003.pdf.
———. 2008, June. CEQA and Climate Change: Addressing Climate Change through CEQA Review. Technical Advisory. http://www.opr.ca.gov/ceqa/pdfs/june08-ceqa.pdf.
Hart, Katherine. 2013, August 22. Court Puts Onus on County to Demonstrate Infeasibility of Agricultural Conservation Easements to Mitigate Loss of Prime Farmland. Abbott & Kindermann Land Use Law Blog. http://blog.aklandlaw.com/2013/08/articles/ceqa/court-puts-onus-on-county-to-demonstrate-infeasibility-of-agricultural-conservation-easements-to-mitigate-loss-of-prime-farmland/.
Horton, Jennifer (captain). 2013, April 17. Response to service questionnaire. Fresno County Sheriff ’s Department.
Koehn, Lisa (assistant director). 2013, April 4. Written response to wastewater questionnaire. City of Clovis Public Utilities Department.
Kraft, Lee (fire chief). 2012 November 16. Response to service questionnaire. Clovis Fire Department.
Intergovernmental Panel on Climate Change. 2001. Third Assessment Report: Climate Change 2001.
———. 2007. Fourth Assessment Report: Climate Change 2007. New York: Cambridge University Press.
LeBlanc, Lisa (executive officer, facilities management and planning). 2012, November 26. Response to service questionnaire. Fresno Unified School District.
Little Hoover Commission. 2013. Problems Surrounding California’s Housing Crisis factsheet. http://www.lhc.ca.gov/lhc/house/JCHProblems.pdf.
Los Angeles County Waterworks Districts. 2013, March 14. Antelope Valley Groundwater Restoration and Subsidence Mitigation Project. ftp://dpwftp.co.la.ca.us/pub/PDD/Wash%20DC%20Docs/4%20-%20Fact%20Sheets%20&%20Correspondence/Funding%20Priorities/Antelope%20Valley%20Groundwater%20Restoration%20and%20Subsidence%20Mitigation%20Project%20%28Fact%20Sheet%29.pdf.
Madera County. 1995, March 21. Final Rio Mesa Area Plan. Prepared by The Keith Companies.
———. 1995, October 24. Madera County General Plan Policy Document.
Michaels, Ryan (public information/media relations fire captain). 2013, September 26. Phone correspondence. Fresno County Fire Protection District.
G E N E R A L P L A N A N D D E V E L O P M E N T C O D E U P D A T E D R A F T P E I R C I T Y O F C L O V I S
13. Bibliography
June 2014 Page 13-11
Office of Environmental Health Hazard Assessment. 2010, December. Impervious Cover Calculator. http://oehha.ca.gov/ecotox/iscug123110.html.
———. User’s Guide for the California Impervious Surface Coefficients. http://oehha.ca.gov/ecotox/pdf/ISCUsersGuide.pdf.
Pacific Gas & Electric. 2013, September. Power Content Label 2012. http://www.pge.com/en/myhome/myaccount/explanationofbill/billinserts/previous/2013/september.page.
Planning Center, The. 2002 December. Southeast Urban Center Specific Plan Environmental Impact Report. Volume I. http://www.ci.clovis.ca.us/Portals/0/Documents/Planning/SpecificPlans/LomaVistaDraftEIR.pdf.
Planning Center|DC&E, The. 2009, June. City of Clovis Community Profile.
Provost & Pritchard Consulting Group. 2011, November. City of Clovis Urban Water Management Plan 2010 Update. http://www.water.ca.gov/urbanwatermanagement/2010uwmps/Clovis,%20City%20of/20111213%20Clovis%202010%20UWMP.pdf.
Rourke, Daniel (environmental resources manager). 2014, April 11. Phone call. Fresno Metropolitan Flood Control District.
RRM Design Group. 1996, October 22. Clovis Avenue Railroad Corridor Area Plan. http://www.ci.clovis.ca.us/Portals/0/Documents/Planning/SpecificPlans/ClovisAveRRCorridorSP.pdf.
Sanger, City of. 2003, November. City of Sanger 2025 General Plan. http://www.ci.sanger.ca.us/devserv/planning/2025%20GENERAL%20PLAN.pdf.
San Joaquin River Parkway and Conservation Trust. 2014, April 11. Land and Trails. http://www.riverparkway.org/index.php/land-and-trails.
San Joaquin Valley Air Pollution Control District. 2005, December 15. Final Staff Report: Rule 9510 – Indirect Source Review (ISR), Rule 3180 – Administrative Fees for Indirect Source Review. http://www.valleyair.org/ISR/Documents/Rule_9510_StaffReport.pdf.
———.2009, December 17. Climate Change Action Plan, Final Staff Report, Addressing Greenhouse Gas Emissions Impacts under the California Environmental Quality Act.
———. 2009, December 17. Guidance for Valley Land-Use Agencies in Addressing GHG Emissions for New Projects.
G E N E R A L P L A N A N D D E V E L O P M E N T C O D E U P D A T E D R A F T P E I R C I T Y O F C L O V I S
3. Bibliography
Page 13-12 PlaceWorks
———. 2012, April. Draft Guidance for Assessing and Mitigating Air Quality Impacts, 2012. http://www.valleyair.org/workshops/postings/2012/4-25-12GAMAQI/draft_GAMAQI_2012_April11.pdf.
———. 2012, December 20. 2012 PM2.5 Plan.
———. 2013, September 19. 2013 Plan for the Revoked 1-Hour Ozone Standard. http://www.valleyair.org/Air_Quality_Plans/Ozone-OneHourPlan-2013.htm.
———. Frequently Asked Questions. http://www.valleyair.org/general_info/frequently_asked_questions.htm#What%20is%20being%20done%20to%20improve%20air%20quality%20in%20the%20San%20Joaquin%20Valley. Accessed June 2014.
———. San Joaquin Valley Attainment Status. http://www.valleyair.org/aqinfo/attainment.htm, accessed March 2014.
San Joaquin Valley Blueprint. 2013, July. San Joaquin Valley Blueprint Integration Final Report. Prepared by URS Corporation. http://www.valleyblueprint.org/files/BPI_FinalReport2013-07.pdf.
Sepulveda, Richard (chief operations officer). 2013, April 9. Response to service questionnaire. Sanger Unified School District.
Sequoia Riverlands Trust. 2014, April 11. Quick Facts about SRT. http://www.sequoiariverlands.org/about/fact-sheet.
Sierra Foothill Conservancy. 2014, April 11. Facts about Sierra Foothill Conservancy. http://www.sierrafoothill.org/index.php/about-us/facts/.
South Coast Air Quality Management District. 2006, October. Final Methodology to Calculate Particulate Matter (PM) 2.5 and PM2.5 Significance Thresholds.
State Water Resources Control Board. 2012, September 13. GeoTracker. http://geotracker.waterboards.ca.gov/default.asp.
Sumner, Tina (community and economic development director). 2014, June 3. E-mail correspondence. City of Clovis.
SWCA Environmental Consultants. 2012, December. Cultural Resources Study in Support of the Clovis General Plan Update Environmental Impact Report.
Ulrich, Don (assistant superintendent, facility services). 2013, May 7. Response to service questionnaire. Clovis Unified School District.

G E N E R A L P L A N A N D D E V E L O P M E N T C O D E U P D A T E D R A F T P E I R C I T Y O F C L O V I S
13. Bibliography
June 2014 Page 13-13
United States Bureau of Reclamation. 2003, October. Upper San Joaquin River Basin Storage Investigation: Big Dry Creek Reservoir Modification. http://www.usbr.gov/mp/sccao/storage/docs/phase1_rpt_fnl/tech_app/01_big_dry_creek.pdf.
———. 2014, February 21. Reclamation Announces Initial 2014 Central Valley Project Water Supply Allocation. http://www.usbr.gov/newsroom/newsrelease/detail.cfm?RecordID=46045.
United States Census Bureau. 2000. Profile of General Demographic Characteristics: 2000, Census 2000 Summary File 1 (SF-1), 100-Percent Data.
———. 2010. Profile of General Demographic Characteristics: 2010, Census 2010 Summary File 1 (SF-1), 100-Percent Data.
———. 2012. 2008–2012 American Community Survey 5-Year Estimates: Selected Economic Characteristics. http://factfinder2.census.gov/faces/nav/jsf/pages/searchresults.xhtml?refresh=t.
United States Department of Agriculture, Farm Services Agency. 2014, January 15. USDA Designates 27 Counties in California as Primary Natural Disaster Areas. http://www.fsa.usda.gov/FSA/newsReleases?area=newsroom&subject=landing&topic=edn&newstype=ednewsrel&type=detail&item=ed_20140115_rel_0007.html.
United States Environmental Protection Agency. 2004. Water Permitting 101. http://www.epa.gov/npdes/pubs/101pape.pdf.
———. 2012, April 20. What Are the Six Common Air Pollutants? http://www.epa.gov/airquality/urbanair.
———. eGRID2012. Version 1.0. Year 2009 GHG Annual Emission Rates. http://www.epa.gov/cleanenergy/documents/egridzips/eGRID2012V1_0_year09_GHGOutputrates.pdf.
———. 2013, October 23. EnviroMapper for EnviroFacts. http://www.epa.gov/emefdata/em4ef.home.
———. 2013, October 23. RCRAInfo Search [Resource Conservation and Recovery Act]. http://www.epa.gov/enviro/facts/rcrainfo/search.html.
———. 2013, December 5. The Green Book Nonattainment Areas for Criteria Pollutants. http://www.epa.gov/air/oaqps/greenbk/index.html.
United States Fish and Wildlife Service. 2012. National Wetlands Inventory. http://www.fws.gov/wetlands/data/Mapper.html.
United States Forest Service. 2013, April 23. Sierra National Forest. http://www.fs.usda.gov/sierra/.
United States Geological Survey. 2012, October 7. The National Map. http://viewer.nationalmap.gov/viewer/.

G E N E R A L P L A N A N D D E V E L O P M E N T C O D E U P D A T E D R A F T P E I R C I T Y O F C L O V I S
3. Bibliography
Page 13-14 PlaceWorks
University of California Center for Hydrologic Modeling. 2014, February 3. Water Storage Changes in California’s Sacramento and San Joaquin River Basins from GRACE: Preliminary Updated Results for 2003–2013. UCCHM Water Advisory. https://webfiles.uci.edu/jfamigli/Advisory/UCCHM_Water_Advisory_1.pdf.
Vidaver, David (electric generation system program specialist). 2013, May 10. Email. California Energy Commission.
Worman-Landano, Kelley (associate county librarian). 2012, November 27. Response to service questionnaire. Fresno County Public Library.
Zets, Eric (solid waste manager). 2013, February 14. Written response to service questionnaire. City of Clovis Public Utilities Department.