53l-G F.riction Loss Of Fracturjng fluids - OnePetro
10
PETROLEUM BRANCH, AIME Fidelity Union Building Dallas, Texas THIS IS A PREPRINT --- SUBJECT TO CORRECTION PAPER NUMBER 53l-G F.riction Loss Of Fracturjng fluids By C. O. Bundrant, Member AIME and Thomas-A7 Matthews II, Junior Member AIME, Western Midland, Tex. Publication Rights Reserved This paper i5 to be presented at the 30th Annual Fall Meeting of the Petroleum Branch of the American Institute of Mining and Metallurgical Engineers in New October 2-5; 1955, and is considered the property of.the Petroleum Branch. Permission to pUblish is hereby restricted to an abstract of not more than 300 words, with no unless the paper is specifically released to the press by the Branch Publications Committee Chai:rtv.anor. the Executive .secretary on his behalf. Such abstr.act should contain appropriate, conspicuous PubH.cation elsewhere after pUblication Journal of Petroleum Technology ,is granted on request, providing proper credit is given that publication and the original presentation of the paper. Discussion of this paper is invited. Three copies of any discussion should be sent to the Petroleum Branch office; it will be presented at the above meeting with the paper and considered for publication in Journal of Petroleum Technology. INTRODUCTION For many years thickened fluids have been used Ln fracturing work. These fluids have included heavy oils, gels, and emulsions. It has long been recognized that it would be desirable to know the pressure losses due to friction while pumping, in order that the formation injection pressure could be known. Heretofore, all attempts to calculate pressure drop of emulsions and gels by standard engineering formulas have resulted in failure. The reason for this is that the apparent viscosity of gels and emulsions falls off sharply with an in- crease in shear rate [pumping rate], so that cal- culations based on laboratory viscosities usually give unrealistically high friction losses. GENERAL CORRELATION The pseudoplastic properties of these gels and emulsions can be characterized in laboratory by a log-log plot of measured viscosity vs shear rate. In this case, measured Viscosity is that obtained on the Brookfield Viscometer, and shear rate is re- presented by Spindle rpm. This data is shown plot- ted in Graph 1 and in Table 1. A straight line log-log plot of vs V/D was made from data on tests in 2-in tUbing, illus- trating the correlation used in this paper [Graph 2]. The correlations shown are based on the methods used by research engineers in other chemical industries. 2 TRANSITION FLOW Examination of the calculations shows that for The relationship between shear rate and yis- cosity has been thoroughly investigated in this paper. The gels and emulsions used in oil well fracturing were found to fall into a general class of fluids known as pseudoplastics. l The name is derived from the property of these fluids to ex- hibit plastic flow at low rates of shear, yet be- have as low-viscosity liquids at high rates of flow. These gels and emUlsions will be referred to as pseudoplastics in this paper. References and illustrations at end of paper V D = = = Velocity, ft/sec Tubing diameter, ft Hagen-Poiseuille calculated pressure drop for viscosity measured at 2 rpm on Brookfield viscometer. Recorded pressure drop [actual] Downloaded from http://onepetro.org/SPEATCE/proceedings-pdf/55FM/All-55FM/SPE-531-G/2086042/spe-531-g.pdf by guest on 25 January 2022
-
Upload
khangminh22 -
Category
Documents
-
view
3 -
download
0
Transcript of 53l-G F.riction Loss Of Fracturjng fluids - OnePetro
PETROLEUM BRANCH, AIMEFidelity Union BuildingDallas, Texas
THIS IS A PREPRINT --- SUBJECT TO CORRECTION
PAPERNUMBER 53l-G
F.riction Loss Of Fracturjng fluidsBy
C. O. Bundrant, Member AIME andThomas-A7 Matthews II, Junior Member AIME,~he Western Co~ Midland, Tex.
Publication Rights Reserved
This paper i5 to be presented at the 30th Annual Fall Meeting of the Petroleum Branch of theAmerican Institute of Mining and Metallurgical Engineers in New Or~eans, October 2-5; 1955, andis considered the property of.the Petroleum Branch. Permission to pUblish is hereby restrictedto an abstract of not more than 300 words, with no ll1ustration5~ unless the paper is specificallyreleased to the press by the Branch Publications Committee Chai:rtv.anor. the Executive .secretary onhis behalf. Such abstr.act should contain appropriate, conspicuous acknowl~gtIlents. PubH.cationelsewhere after pUblication ~n Journal of Petroleum Technology ,is granted on request, providingproper credit is given that publication and the original presentation of the paper.
Discussion of this paper is invited. Three copies of any discussion should be sent to thePetroleum Branch office; it will be presented at the above meeting with the paper and consideredfor publication in Journal of Petroleum Technology.
INTRODUCTION
For many years thickened fluids have been usedLn fracturing work. These fluids have includedheavy oils, gels, and emulsions. It has long beenrecognized that it would be desirable to know thepressure losses due to friction while pumping, inorder that the formation injection pressure couldbe known. Heretofore, all attempts to calculatepressure drop of emulsions and gels by standardengineering formulas have resulted in failure. Thereason for this is that the apparent viscosity ofgels and emulsions falls off sharply with an increase in shear rate [pumping rate], so that calculations based on laboratory viscosities usuallygive unrealistically high friction losses.
GENERAL CORRELATION
The pseudoplastic properties of these gels andemulsions can be characterized in th~ laboratory bya log-log plot of measured viscosity vs shear rate.In this case, measured Viscosity is that obtainedon the Brookfield Viscometer, and shear rate is represented by Spindle rpm. This data is shown plotted in Graph 1 and in Table 1.
A straight line log-log plot of ~Pcalc vs V/D~Pact
was made from data on tests in 2-in tUbing, illustrating the correlation used in this paper [Graph 2].The correlations shown are based on the methods usedby research engineers in other chemical industries. 2
TRANSITION FLOW
Examination of the calculations shows that for
The relationship between shear rate and yiscosity has been thoroughly investigated in thispaper. The gels and emulsions used in oil wellfracturing were found to fall into a general classof fluids known as pseudoplastics. l The name isderived from the property of these fluids to exhibit plastic flow at low rates of shear, yet behave as low-viscosity liquids at high rates of flow.These gels and emUlsions will be referred to aspseudoplastics in this paper.References and illustrations at end of paper
VD =~Pcalc =
~Pact =
Velocity, ft/secTubing diameter, ftHagen-Poiseuille calculated pressure
drop for viscosity measured at2 rpm on Brookfield viscometer.
Recorded pressure drop [actual]
Dow
nloaded from http://onepetro.org/SPEATC
E/proceedings-pdf/55FM/All-55FM
/SPE-531-G/2086042/spe-531-g.pdf by guest on 25 January 2022

2 FRICTION LOSS OF FRACTURING FLUIDS 531-G
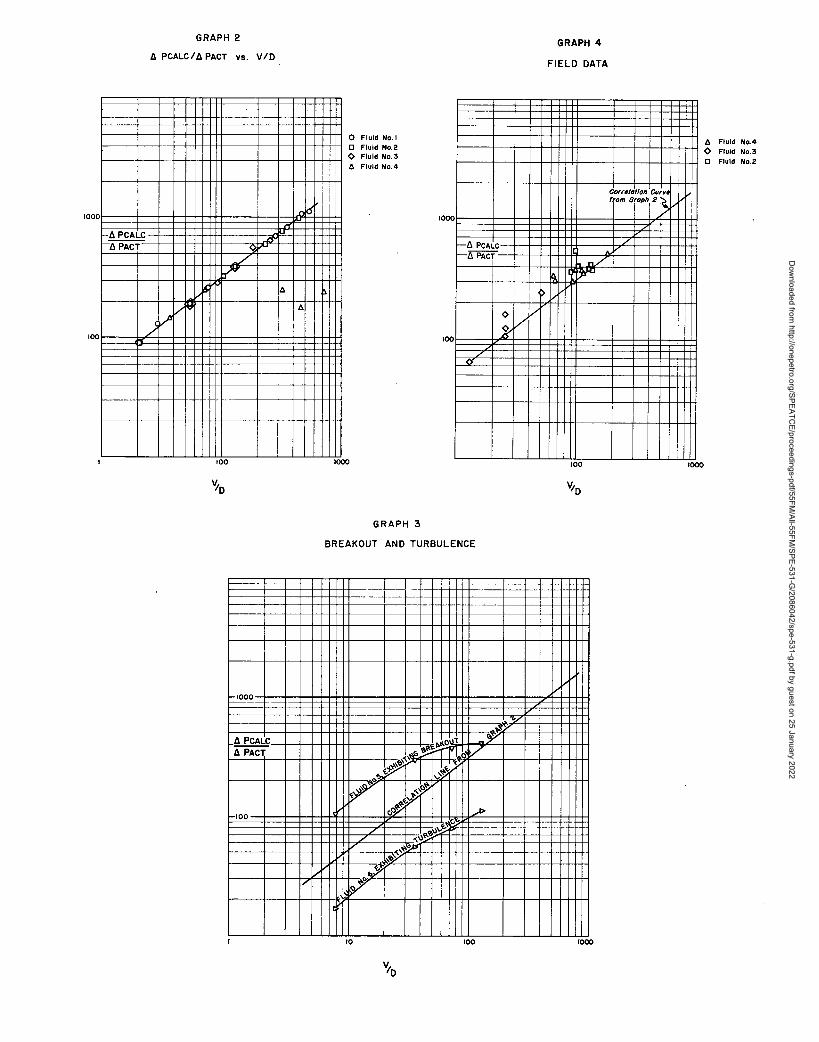
low-viscosity gels the correlation expressed inGraph 2 will begin to predict incredibly low pressure drops. It is natural to expect the gel oremulsion to go into turbulent flow at this point,in order that its friction loss will not be lessthan the base liquid from which it was made. Actually a transition flow occurs, with increasing degrees of turbulence as flow rate is increased. Anexample of this is plotted in Graph 3 against theline from Graph 2, Fluid No.6. The increasingdistance from the gel lines to the correlation lineindicates the increasing turbulence and consequentincreased friction loss.
The fact that the friction loss for this gel isless than that for its base liquid alone indicatesthat true turbulent flow is never reached, but thatsome streamlining or slugging remains to reduce thefriction. ThUS, the seeming paradox is attained:placing a gel agent in kerosene reduces the friction loss.
From Table 2, 91 ft of 2-in tubing:
Kerosene [turbulent] 26 psi at 4.6 BIMGelled Kerosene [trans~.tion] 18 psi at
5.0 BIMBy this paper's prediction, the pressure drop
of the gelled kerosene would be 5.5 psi.
Another flUid, No.4, shows non-turbulent flowin the 2-in tubing and for most of the tests in theI-in tubing. SUddenly the points in Graph 2 veersharply away to the right of the correlation line,indicating some turbulence;' A check of the datareveals a relatively low viscosity, less than20,000 cp, which would tend to confirm the assumption of turbulence.
BREAKOUT
Fluid No.5, plotted in Graph 3, shows a pressure drop even less than that predicted by thecorrelations .of this paper. This w~s attributedto the fact that the high shear rates caused anactual breakdown of the gel near the pipe wall, releasing some free base liquid for the gel to slideon. This supposition is supported by observationof free liquid separation in small amounts when thegel is at rest. ?urther data not presented hereindicates that o~ly about 75 per cent as much poweris needed to stir this gel at the same viscosity asother gels. This characteristic of separationcauses a greater reduction in pressure drop thanthat obtained for the other gels and emUlsions,where gel thinning near the wall was probably theonly mechanism of friction reduction.
Some gels showed a reduction in viscosity afterbeing pumped through large tubing, as indicated bythe fluctuating viscosities for Fluid No. 2 inTable 2.
THICKENING
Some emulsions behave as ideal fracturing'fluidsalthough accepted laboratory tests do not predict
this. Usually formation conditions require the useof a low-fluid-loss material. The standard muapress test shows certain successful fracturing'emulsions have a high fluid loss. When testing theseemulsions at .low pressures, a high rate of flow wasobtained through small tubing. However, when thepressure was increased to 500 psi on 1/16-in IDtubing, a high flow rate occurred momentarily andthen an almost complete shut-off was observed.' Onincreasing the pressure to 1,000 psi, a high frowrate was resumed momentarily and then shut offagain.. This was repeated at 2,000 psi. Repeatedtesting ruled out the probability of accidentalplugging by foreign matter. Since these emulsionscan be thickened almost without limit by increasingly vigorous stirring, we must assume that thehigh ~low rates forced the emulsions into turbulentflow, and that this turbulence thickened the emulsions immeasurably. Back-flushing the tUbingdid no good,' but after several days the emulsionscould be forced out under low pressures.
On i/8-in ID tubing, flow rates were high enough so that samples CQuld be collected and thyviscosities measured. A great deal of thickeningoccurred as is shown by the data:
Emulsion, before testing -- 100,000 cpAfter 500 psi drop across 25 ft -- 118,000 cpAfter 1,000 psi drop across 25 ft
170,000 cpAfter 2,000 psi drop across 25 ft
211 ,000 cp
These viscosities were measured at 2 rpm on theBrookfield viscometer. [Data not presented herewas taken on sand columns. Flow through varioussands indicates that these emulsions become harderand harder to pump through finer sands, compared toflow of other fluids.] Here, then, is evidence thatcertain emulsions may thicken-up in the formationand fractures when pumped at high pressures, andact as low-fluid-loss materials. Of course, commercial materials always carry.an internal breakerwhich would permit removal of the thickened emulsions in hours instead of days.
Sufficient turbulence to cause excessive thickening was never reached in large tubing. However,some increase in viscosity was noted, as can be seenfrom the fluctuating viscosities of Fluid No. 1 inthe various runs presented in Table 2.
REYNOLDS NUMBER VS FANNING FRICTION FACTOR
As will be noted in the calCUlations, theReynolds number based on the laboratory viscosityis always below 2,100 indicating streamline flow.However, the viscosity decreases with increasingshear rates [Graph 1], so that much higher Reynoldsnumbers are anticipated. A difficulty is encountered in determining the precise Reynolds number. Theapparent viscosity calculated from test data dependson the degree of turbulence assumed. Using the datafrom Table 3 for gelled kerosene [Fluid No.6], thefollowing results are obtained at 5 BIM for variousassumptions:
Dow
nloaded from http://onepetro.org/SPEATC
E/proceedings-pdf/55FM/All-55FM
/SPE-531-G/2086042/spe-531-g.pdf by guest on 25 January 2022

531-G C. O. BUNDRANT AND THOMAS A. MATTHEWS II 3
rREAMLINE FLOW
To find which picture most truly represents thesituation, consider that these gels do not followthe classic predictions for streamline flow, thus~ling out column 1. Column 2 presents an extreme
ly low friction factor, requiring a pressure dropabout one-third that actually observed. Column 4could be valid excepting for the extremely smallvalue of viscosity which must be assumed~ it isapparently ridiculous that the formation of a gelstructure could lower the actual viscosity of aliquid. This leaves column 3 as the most likelypossibility, assuming that the high velocity hasbroken the apparent viscosity' of the gel almost tothat of the base liquid from which it was made, andattributing the reduced friction loss to a certainamount of streamlining or slugging from the weakgel structure remaining. Here, then, is a casewhere transition flow apparently occurs at aReynolds number of 161,000, causing a reduction infriction loss from that obtained in true turbulentflow [keros-:lne].
This Paper's Prediction
161,800.0.003201.7
presented in this paper makes use of comparativeresults because changes in shear rate are proportional to spindle rpm [using the same spindle].It is possible then to visualize streamline flow,with a reduced viscosity caused by high shearingrates.
The advantage to be gained from consideringthese fluids as beIng in streamline flow is that asimple statement can be made concerning the application of the general correlation. If the fluid showsviscosity vs shear rate characteristics as in Graph1, the correlation will apply whenever the materialis in streamline flow. Evidence of slug flow orturbulence will then serve as a warning that the relationships have changed, resulting in a lower thanpredicted pressure drop for slug flow and a higherdrop for turbulence.
The section entitled IIBreakout ll describing FluidNo. 5 in this report could be more easily explainedby an assumption of streamline flow as the underlying mechanism. Then this section would be calledIIS1ug Flow" i.nstead of IIBreakout ll and would be citedas the only known example of slugging in largetubing.
Data presented by other papers indicate thatslug flow dq~s sometimes occur. However. experiments by Chu ,in 1954 show that slug flow occursonly at low rates of shear or in tubing less than0.199 cm in diameter.
There is the possibility that the ,observedviscosity reduction on the Brookfield might becaused by spindle sllp. However, -the indicator wassmooth and uniform, showing none of the rapid fluctuation noted with certain gels of high viscosity andlow adhesion. Experiments by Green3 using smoothand roughened spindles show no a~preciable effect ofslippage.
SLUG FLOW
[4]Turbulent
Flow
600,000.0.003200.456
[2]
17,680.0.000906
15.48
Flow,Kerosene
[3]Transition
Viscosity of
45.9.0.3 49
6000
[1]Streamline FlowHagen-Poiseuille
It will be noted that while the occurrence ofturbulence is described in certain tests, the typeof flow present in the majority of the experimentsis not definitely named. Ambiguous terms such asII s treamline or slug flow ll and II non-turbulent ll floware used. Rather than to make a definite statementas to the mechanism of fluid flow, whether streamline or slug or a combination of both, evidence tosupport various theories will be presented below.
In order to explain the low pressure drops encountered with gels and emulsions it is necessaryto assume that viscosity reduction or slugging orboth occur. In support of the streamline flowtheory is the phenomenal reduction in observedviscosities at increased rpm of the Brookfieldviscometer. A tenfold increase in shear rate results in approximately a sixfold decrease inviscosity. If this trend continued, it couldeasily explain the low observed pressure drops athigh rates of shear. It is impossible to calculateshear rate on the Brookfield viscometer, so aprediction of viscosity at normal pumping ratescannot be made. However, the general correlation
A paper by Bundrant5 on flow of gel and oilthrough 0.032-in, 0.043-in, and 0.070-in diametertubing gives clear evidence of slug flow.
FIELD DATA
Field data was collected from well treatment reports. Values of ~Pcalc/~Pact and V/D were foundand plotted as circled points on Graph 4. It issignificant that all of the points either fall closeto the line or indicate a lower actual pressure dropthan predicted. It is possible that in some casesthe fluids had not been mixed to the requJred viscosities.
PRACTICAL APPLICATION
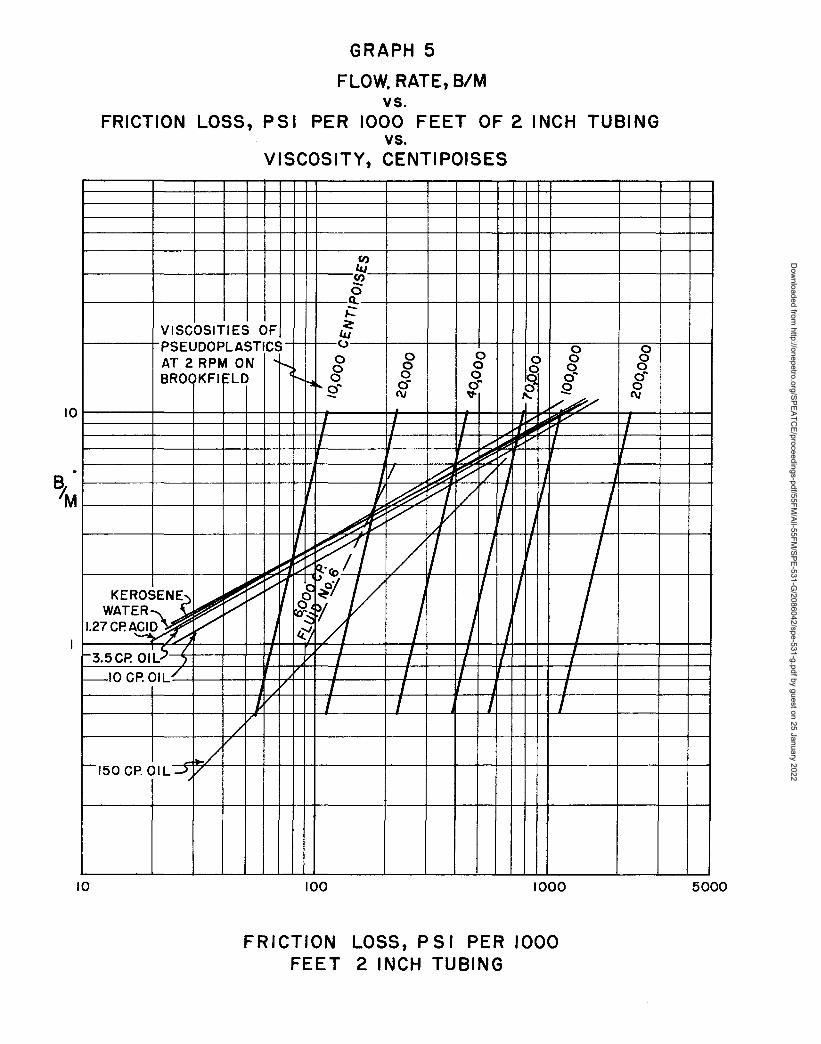
A pl~t of pressure drop vs flow rate on log-logpaper is shown in Graph 5. The straight lines shownare good only for pseudoplasticsl showing the viscosity vs rate-of-shear characteristics as in Graph1. A check of the fiel~ data of Table 2 againstthis graph shows the substantial validity. Lines
Dow
nloaded from http://onepetro.org/SPEATC
E/proceedings-pdf/55FM/All-55FM
/SPE-531-G/2086042/spe-531-g.pdf by guest on 25 January 2022
4 FRICTION LOSS OF FRACTURING FLUIDS 531-G
representing a 380 API 10-cp crude oil, a 15 percent hydrochloric acid, a 150-cp residual fuel oil,water and kerosene are included for comparison.These lines for water and kerosene cutting acrossthe upper left-hand corner of the graph representthe approximate limits of this correlation. As canbe seen from the data on Fluid No.6, the velocitiefwill exceed the Newtonian velocities in this region;however, until more data is ~vailable, theseNewtonian lines should be considered as limiting.
CALCULATIONS AND DATA
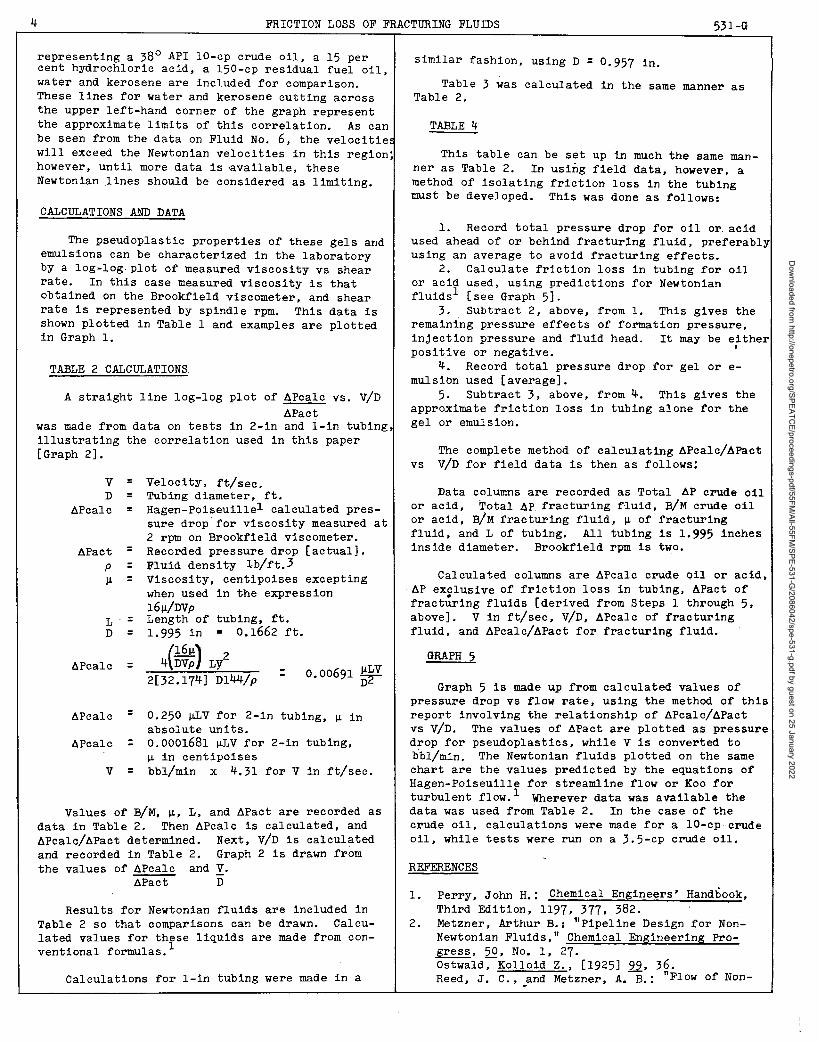
The pseudoplastic properties of these gels andemulsions can be characterized in the laboratoryby a log-log, plot of measured viscosity vs shearrate. In this case measured viscosity is thatobtained on the Brookfield viscometer, and shearrate is represented by spindle rpm. This data isshown plotted in Table 1 and examples are plottedin Graph 1.
TABLE 2 CALCULATIONS.
A straight line log-log plot of ~Pcalc vs. V/D~Pact
was made from data on tests in 2-in and i-in tubing,illustrating the correlation used in this paper[Graph 2].
similar fashion, using D = 0.957 in.
Table 3 was calculated in the same manner asTable 2.
TABLE 4
This table can be set up in much the same manner as Table 2. In using field data, however, amethod of isolating friction loss in the tubingmust be developed. This was done as follows:
1. Record total pressure drop for oil or, acidused ahead of or behind fractur~ng fluid, preferablyusing an average to avoid fracturing effects.
2. Calculate friction 1055 in tubing for oilor acid used, using predictions for Newtonianfluids 1 [see Graph 5].
3. Subtract 2, above, from 1. This gives theremaining pressure effects of formation pressure,injection pressure and fluid head. It may be eitherpositive or negative. '
4. Record total pressure drop for gel or emulsibn used [average].
5. Subtract 3, above, from 4. This gives theapproximate friction 1055 in tubing alone for thegel or emulsion.
The complete method of calculating ~Pcalc/~Pact
vs V/D for field data is then as follows:
Calculations for I-in tubing were made in a
Results for Newtonian fluids are included inTable 2 50 that comparisons can be drawn. Calculated values for these liquids are made from conventional formulas. l
Values of B/M, 11, L, and ~Pact are recorded asdata in Table 2. Then ~Pcalc is calculated, and~Pcalc/~Pact determined. Next, V/D is calculatedand recorded in Table 2. Graph 2 is drawn fromthe values of ~Pcalc and!.
~Pact D
VD
~Pcalc
~Pact
p
Il
LD
~Pcalc
~Pcalc
~Pcalc
V
===
===
==
=
=
:
=
Velocity, ft/sec.Tubing diameter, ft.Hagen-Poiseuillel calculated pressure drop for viscosity measured at2 rpm on Brookfield viscometer.Recorded pressure drop [actual].Fluid density Ib/ft. 3Viscosity, centipoises exceptingwhen used in the expressionl61l/DVpLength of tubing, ft.1.995 in 0.1662 ft.
(ili) 24 DVp LV
0.00691 DIl~V2[32.174] Dl44/p
0.250 IlLV for 2-in tubing, Il inabsolute units.0.0001681 ~V for 2-in tUbing,11 in centipoisesbbl/min x 4.31 for V in ft/sec.
Data columns are recorded as Total ~p crude oilor acid, Total ~P. fracturing flUid, B/M crude oilor acid, BIM fracturing fluid, 11 of fracturingfluid, and L of tUbing. All tUbing is 1.995 inchesinside diameter. Brookfield rpm is two.
Calculated columns are ~Pcalc crude Oil or acid,. ~p exclusive of friction loss in tubing, ~Pact offract~ring fluids [derived from Steps 1 through 5,above]. V in ft/sec, V/D, ~Pcalc of fracturingfluid, and ~Pcalc/~Pact for fracturing fluid.
GRAPH 5
Graph 5 is made up from calculated values ofpressure drop vs flow rate, using the method of thisreport involving the relationship of ~Pcalc/~Pact
vs ViDe The values of ~Pact are plotted as pressuredrop for pseudoplastics, while V is converted tobbl/min. The Newtonian fluids plotted on the samechart are the values predicted by the equations ofHagen-Poiseuille for streamline flow or Koo forturbulent flow. l Wherever data was available thedata was used from Table 2. In the case of thecrude oil, calculations were made for a lO-cp· crudeoil, while tests were run on a 3.5-cp crude oil.
REFERENCES
1. Perry, John H.: Chemical Engineers' Handbook,Third Edition, 1197, 377, 382.
2. Metzner, Arthur B.: l' Pipel ine Design for NonNewtonian Fluids," Chemical Engineering Progress, 50, No.1, 27.Ostwald, Kolloid Z., [1925] 22, 36.Reed, J. C., _and Metzner, A. B.: "Flow of Non-
Dow
nloaded from http://onepetro.org/SPEATC
E/proceedings-pdf/55FM/All-55FM
/SPE-531-G/2086042/spe-531-g.pdf by guest on 25 January 2022

531-G C. O. BUNDRANT AND THOMAS A. MATTHEWS II 5
Newtonian Fluids -- Correlation fo~ the Laminar, 3. Green, Ind. Eng. Chern., Anal. Ed., [1946] ~,Transition and Turbulent Flow Regions," AICE 38.Meeting, Louisville, Ky., [March, 1955]. 4. Chu, Ju Chin, Burridge, K. C., and Brown, Frank:Salt, D. L.: MS Thesis, [1949], University of "The Viscosity of Pseudo-Plastic Fluids," ~.Utah. Engr. Sci., [Dec. 1954] L' 229.Stevens, Wayne E., Christiansen, E. B., and 5. Bundrant, C. 0., and Dehlinger, Peter: "Flow ofRyan, N. W.: "The Flow of Non-Newtonian Fluids Gel and Oil in Open and Tight Formation Frac·in Circular Conduits," AICE Meeting, Springfield, tures," to be pUblished in ~., AmericanMass., [May, 1954]. Geophysical Union, [1955].
TABlE 1
Fluid Test Brookfield ViscosityNo. No. 2 RPM 4 RPM 10 RPM 20 RFM
1 1 68,,500 36,,500 16,,300 9,0001 2 110,,000 54,000 24,000 13,2001 3 140,,000 75,000 32,800 17,9001 4 60,000 32,000 14,800 8,0001 5 129,000 61,,500 26,,400 14,,2001 6 130,000
2 7 60,,000 34,000 17,000 10,0002 8 210,,000 120,,000 58,000 33,0002 9 55,200 35,,000 18,000 12,,0002 10 75,400 47,000 24,000 16,0002 11 85,700 51,000 28,000 18,0002 12 51,100 32,,000 16,600 10,,0002 13 49,300 30,500 16,600 10,0002 14 58,,400 37,200 17,,000 10,700
3 15 32,000 18,,000 8,500 4,5003 16 34,500 19,250 9,,000 5,0003 17 32,0003 18 32,0003 19 32,0003 20 31,500 17,500 8,400 4,,300
4 21 68,000 36,000 16,,800 9,5004 22 24,000 13,900 6,700 4,0004 23 15,000 8,000 4,350 2,6104 24 22,000 12,800 6,300 3,7004 25 16,0004 26 16,800 9,750 4,850 2,9504 27 21,400 12,200
5 28 80,000 43,000 20,800 15,2005 29 80,000 43,000 gO, 800 15,2005 30 80,000 43,000 20,800 15,2005 31 80,000 43,000 20,800 15,200
6 32 6,000 3,00~ 1,600 8006 33 6,000 3,00 1,600 8006 34 6,000 3,000 1,600 8006 35 6,000 3,000 1,600 800
Dow
nloaded from http://onepetro.org/SPEATC
E/proceedings-pdf/55FM/All-55FM
/SPE-531-G/2086042/spe-531-g.pdf by guest on 25 January 2022

TABlE 2--Fluid Test ..,.u. V L nominal
No. No. cp E/M ft/sec ft pipe 6Pcalc Mact APcalc v/nsize psi psi APact
1 1 68,500 1.5 28.1 105 1 147,600 181 815 3521 2 110,000 2.0 37.5 105 1 316,300 301 1051 4701 3 140,000 2.3 43.1 105 1 462,600 421 1099 5401 4 60,000 1.15 4.96 91 2 4,552 35 130 29.81 5 129,000 2.1 9·05 91 2 17,860 95 188 54.5 '1 6 130,000 3·0 12.93 91 2 25,710 100 257 77.8
2 7 60,000 5·0 21.6 91 2 19,820 50 396 130.02 8 210,00{> 5·0 21.6 91 2 69,390 180 386 130.02 9 55,200 0.8 3.45 91 2 2,913 32 91 20.82 10 75,400 2.1 9.05 91 2 10,440 55 190 54.52 11 85,700 4.1 17.67 91 2 23,170 72 322 106.32 12 51,100 1.0 18.73 105 1 73,380 126 582 2352 13 49,300 1.4 26.2 105 1 99,030 132 750 3292 14 58,400 1.9 35.6 105 1 159,400 164 972 446
3 15 32,000 2.0 8.62 91 2 4,219 23 183 51.93 16 34,500 3.6 15·52 91 2 8,191 28 293 93.43 17 32,000 0.8 3.45 91 2 1,689 19 89 20.8:3 18 32,000 0.8 15.0 105 1 36,800 70 526 188.13 19 32,000 1.2 22·5 105 1 55,200 80 690 2823 20 31,500 1.1 20.6 105 1 49,750 80 622 258
4 21 68,000 5.0 21.6 91 2 22,470 60 374 1304 22 24,000 4.5 19.4 91 2 7,122 21 339 116.74 23 15,000 1.46 6.29 91 2 1,443 10 144 37.84 24 22,000 2.9 12·5 91 2 4,207 16 263 ·75·24 25 16,000 1.4 26.2 105 1 32,140 132 243 3294 26 16,800 2.0 37·5 105 1 48,300 274 176 4704 27 21,400 3.1 58.1 105 1 95,320 402 237 729
Columns showingAP~t are plotted against v/n for Graph 2.
Test ~ V L APca1c &,actFluid No. cp ElM rt/sec ft psi psi
Kerosene 55 1.7 4.6 19.83 91 26 2656 1.7 2.8 12.08 91 10 1057 1.7 1.4 6.03 91 3 358 1.7 0.3 1.29 91 1/6 0
Crude Oil 59 3.5 5 21.6 91 32 3060 3·5 2.8 12.08 91 11 1161 3·5 1.4 6.04 91 3 462 J·5 0.3 1.29 91 1/4 0
F'rac Oil 63 150 5 21.6 91 49 5064 150 2.8 12.08 91 28 3365 150 1.4 6.04 91 14 1166 150 0.3 1.29 91 3 4
Water 67 0.68 4.8 20.7 91 30 3168 0.68 2.8 12.08 91 10 969 0.68 1.4 6.04 91 2 2/3 370 0.68 0.3 1.29 91 1/5 1
Pressure drop values for Newtonian fluids are multiplied by 1000/91 andplotted against E/M in Graph 5.
Dow
nloaded from http://onepetro.org/SPEATC
E/proceedings-pdf/55FM/All-55FM
/SPE-531-G/2086042/spe-531-g.pdf by guest on 25 January 2022
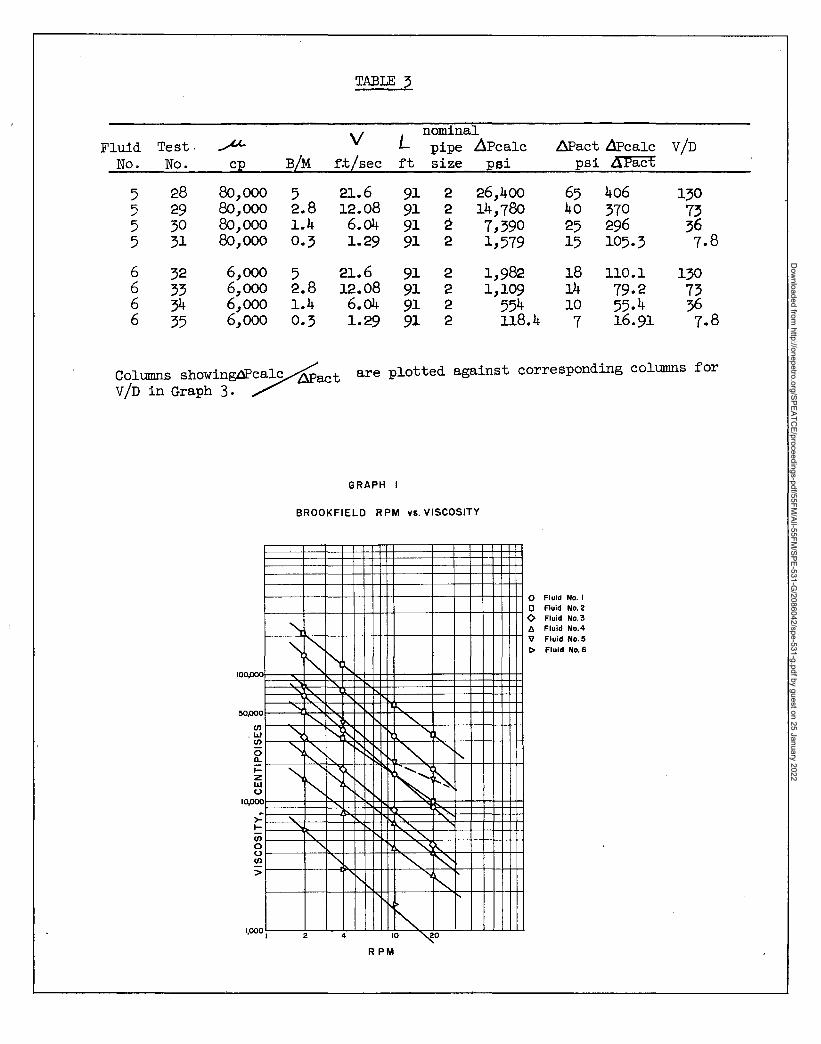
TABLE 3
V Lnominal
Fluid Test· ~ pipe ~Pcalc &act LlPcalc v/nNo. No. cp B/M fx,jsec ft size psi psi APiict
5 28 80,000 5 21.6 91 2 26,400 65 406 1305 29 80,000 2.8 12.08 91 2 14,780 40 370 735 30 80,000 1.4 6.04 91 2 7,390 25 296 365 31 80,000 0.3 1.29 91 2 1,579 15 105·3 7.8
6 32 6,000 5 21.6 91 2 1,982 18 110.1 1306 33 6,000 2.8 12.08 91 2 1,109 14 79.2 736 34 6,000 1.4 6.04 91 2 554 10 55.4 366 35 6,000 0.3 1.29 91 2 118.4 7 16.91 7.8
Columns shoWingOP~act are plotted against corresponding columns for
v/n in Graph 3.
GRAPH I
BROOKFIELD RPM V5. VISCOSITY
000,סס1
50,000
lI). ILl
lI)
oa..fzILlto)
10.000
)0
flI)
oto)lI)
>
1,000
'""- """'"'" !'-.
............ " "-
",
~ ..........
'\ N i'.r--. ..............., 0r--. ,~r-. ""-
......,I'" .......
~~
I"" ~~......, "
........... ......
..... "..... '-.:1\.'\ '" ~, "'I'.....
r--
~I 2 4 10 ~o
RPM
o Fluid No. Io Fluid No.2<> Fluid No.3Ii Fluid No.4V Fluid No.5l> Fluid No.6
Dow
nloaded from http://onepetro.org/SPEATC
E/proceedings-pdf/55FM/All-55FM
/SPE-531-G/2086042/spe-531-g.pdf by guest on 25 January 2022

TABLE 4
2-in Tubingvis, at 2 rpm on Brookfield
OIL OR ACID PSEUDOPLASTIC FRACTURING FLUIDTotal & Total VFluid Test 6P 6!'calc exclusive AP APact .;tL
No. No. psi B/M psi of friction psi psi cp B/M ft/secloss in
psi
4 ~6 2,750 4 1,800 950 4,000 ~,05° 50,000 4.6 19.8~4 ~7 3,300 4.6 2,~10 990 4,000 ~,010 50,000 4.4 18.964 ~8 3,600 4 1,570 2,0~0 4,500 2,470 50,000 ~.6 15.524 ~9 1,100 2.8 653 447 2,050 1,603 50,000 3.8 16.384 40 1,600 2.6 719 88l. 2,500 1,619 50,000 2.5 10.784 41 1,600 2.5 582 1,018 2,500 1,482 50,000 2.6 11.214 42 2,200 4.33 1,430 770 2,800 2,030 50,000 4.33 18.664 43 1,500 4.6 1,534 -34 2,200 2,234 50,000 7.20 31.0
2 44 2,800 5·2 3,190 -390 2,300 2,690 40,000 5·1 22.02 45 2,600 6.0 3,740 -1,140 1,700 2,840 40,000 5·3 22.82 46 2,500 3.6 1,735 765 2,300 1,535 40,000 3.8 16.382 47 2,100 4.8 2,500 -400 1,500 1,900 40,000 3·5 15·092 48 2,900 4.6 2,510 390 2,450 2,060 40,000 4 17.242 49 2,800 4.87 2,940 -140 2,800 2,940 40,000 5·07 21.9
3 50 1,400 2.8 548 852 4,000 3,148 105,000 1 4.313 51 3,000 5 1,500 1,500 4,500 3,000 105,000 1/2 2.163 52 2,000 6 2,500 -500 3,400 3,900 105,000 2 8.623 53 1,700 3.6 1,010 690 ~,500 2,810 105,000 1 4.313 54 2,050 3.2 600 1,450 4,600 3,150 105,000 1 4.~1
Please note that the same fluids lIl8y be mixed to a different viscosity, and that
different fluids lIl8y be mixed to the same Viscosity.
Fluid Test PSEUDOPLASTIC FRACTURED FLUIDNo. No. L 6Pcalc 2SP~ctft psi v/n4 ~6 6,527 1,088,000 357 119.34 37 6,607 1,05~,000 350 114.14 ~8 5,720 746,000 302 93.44 39 4,350 599,000 ~74 98.64 40 5,982 542,000 335 64.94 41 4,855 457,000 308 67.44 42 4,834 758,000 373 112.34 43 4,380 1,141,000 511 186.5
2 44 7,409 1,096,000 -407 132.42 45 6,896 1,057,000 372 137·22 46 7,545 831,000 541 98.62 47 6,745 684,000 360 90.82 48 7,140 828,000 402 103.72 49 7,740 1,140,000 388 131.8
3 50 4,982 379,000 120.4 25.93 51 5,086 193,900 64.6 13.03 52 6,243 950,000 244 51.9~ 53 5,956 453,000 161.2 25·93 54 4,502 342,000 108.6 25.9
The values ofAP~ct are plotted against v/n in Graph 4.
Dow
nloaded from http://onepetro.org/SPEATC
E/proceedings-pdf/55FM/All-55FM
/SPE-531-G/2086042/spe-531-g.pdf by guest on 25 January 2022
GRAPH 2
d PCALC 1d PACT vs. V10GRAPH 4
FIELD DATA
/:; Fluid No.4<> Fluid NO.3C Fluid No.2
1000100
CDrrelDtion Curve
VIfrom Graph 2 ~V-
Y
c-d PCALC '""" I-~
n/ I~ ~ I
I
V- i<>
./V
~0
"<:F
o Fluid No.1o Fluid No.2<> Fluid NO.3A Fluid No.4
10
1000
000100
! I,,
II!, ..oid I I
0
f-d PCALCI:Y
-d PACT Q
/'
if'/:;
v~ /:;
vA/'
r--'
I
100
100
~D
GRAPH 3
BREAKOUT AND TURBULENCE
1-10001------
100
I'
10 100 1000
Dow
nloaded from http://onepetro.org/SPEATC
E/proceedings-pdf/55FM/All-55FM
/SPE-531-G/2086042/spe-531-g.pdf by guest on 25 January 2022
GRAPH 5
FLOW. RATE, BIMYs.
FRICTION LOSS, PSI PER 1000 FEET OF 2 INCH TUBINGYs.
VISCOSITY, CENTIPOISES
CI)IIICI)-0
Q..- il-IVISCOSITIES OF ~ iIII
PSEUDOPLASTICS (.)0 0
AT 2 RPM ON 'r--. 0 0 0 0 0 00 0 0 0 f} 0
BRO( KFI ""LD <r-..~~~
0 0 0 o~
I o~ oaf2 S? 0- i rv ~
/~rv
10 I I I 1/ ~ I1 1 I 'r"l IIIIlII '/ 'I I
II 1/ I / A r;. I~~~.
I 11/ la~ / J JEj. IJ f ~v/] / I I IM ~l/
~V,y I IJ II 6'/ / I / I /~::::
.J~ ;;.-"" I
KE~ ~~t:::-10-if v / /WATER ~ ~.:; I /1.27 CPO ACI 0 ~ J
~
J~~3.5CP.0ILc., ~
I I I I I II I I I I I
1--10 CPo OIL/ I I II II I ~ I
t/ I I I I/V
-150 CPO OIL~..//
10 100 1000 5000
FRICTION LOSS, PSI PER 1000FEET 2 INCH TUBING
Dow
nloaded from http://onepetro.org/SPEATC
E/proceedings-pdf/55FM/All-55FM
/SPE-531-G/2086042/spe-531-g.pdf by guest on 25 January 2022