(51) InternationalPatent Classification: (74) Agent: DAVIES ...
89
( (51) International Patent Classification: (74) Agent: DAVIES COLLISON CAVE PTY LTD; 1 G06F 17/00 (2019.01) H04L 12/00 (2006.01) Nicholson Street, Melbourne, Victoria 3000 (AU). (21) International Application Number: (81) Designated States (unless otherwise indicated, for every PCT/AU20 19/05 1373 kind of national protection av ailable) . AE, AG, AL, AM, AO, AT, AU, AZ, BA, BB, BG, BH, BN, BR, BW, BY, BZ, (22) International Filing Date: CA, CH, CL, CN, CO, CR, CU, CZ, DE, DJ, DK, DM, DO, 13 December 2019 (13. 12.2019) DZ, EC, EE, EG, ES, FI, GB, GD, GE, GH, GM, GT, HN, (25) Filing Language: English HR, HU, ID, IL, IN, IR, IS, JO, JP, KE, KG, KH, KN, KP, KR, KW, KZ, LA, LC, LK, LR, LS, LU, LY, MA, MD, ME, (26) Publication Language: English MG, MK, MN, MW, MX, MY, MZ, NA, NG, NI, NO, NZ, (30) Priority Data: OM, PA, PE, PG, PH, PL, PT, QA, RO, RS, RU, RW, SA, 2018904759 14 December 2018 (14. 12.2018) AU SC, SD, SE, SG, SK, SL, SM, ST, SV, SY, TH, TJ, TM, TN, TR, TT, TZ, UA, UG, US, UZ, VC, VN, ZA, ZM, ZW. (71) Applicant: NEWSOUTH INNOVATIONS PTY LIMITED [AU/AU]; Rupert Myers Building, Gate 14, (84) Designated States (unless otherwise indicated, for every Barker Street, University of New South Wales, Sydney, kind of regional protection available) . ARIPO (BW, GH, New South Wales 2052 (AU). GM, KE, LR, LS, MW, MZ, NA, RW, SD, SL, ST, SZ, TZ, UG, ZM, ZW), Eurasian (AM, AZ, BY, KG, KZ, RU, TJ, (72) Inventors: SIVARAMAN, Vijay; c/o NewSouth Inno¬ TM), European (AL, AT, BE, BG, CH, CY, CZ, DE, DK, vations Pty Limited, Rupert Myers Building, Gate 14, EE, ES, FI, FR, GB, GR, HR, HU, IE, IS, IT, LT, LU, LV, The University of New South Wales, Sydney, New South MC, MK, MT, NL, NO, PL, PT, RO, RS, SE, SI, SK, SM, Wales 2052 (AU). GHARAKHEILI, Hassan Habibi; c/ TR), OAPI (BF, BJ, CF, CG, Cl, CM, GA, GN, GQ, GW, o NewSouth Innovations Pty Limited, Rupert Myers Build¬ KM, ML, MR, NE, SN, TD, TG). ing, Gate 14, The University of New South Wales, Sydney, New South Wales 2052 (AU). SIVANATHAN, Arunan; c/ Published: o NewSouth Innovations Pty Limited, Rupert Myers Build¬ — with international search report (Art. 21(3)) ing, Gate 14, The University of New South Wales, Sydney, New South Wales 2052 (AU). (54) Title: A NETWORK DEVICE CLASSIFICATION APPARATUS AND PROCESS (57) Abstract: A network device classification process, including: monitoring network traffic of networked devices in a communica¬ tions network to generate device behaviour data representing network traffic behaviours of the networked devices at different time granularities; processing the device behaviour data to classify a plurality of the networked devices as IoT devices, and others of the networked devices as non-IoT devices; accessing IoT device type data representing predetermined network traffic characteristics of respective known IoT device types; processing the device behaviour data of the IoT devices and the IoT device type data to classify each of the IoT devices as being a corresponding one of the plurality of known IoT device types; and for each of the IoT devices classified as a corresponding known IoT device type, classifying the IoT device as being in a corresponding operating state based on network traffic behaviours of the IoT device at different time granularities.
-
Upload
khangminh22 -
Category
Documents
-
view
0 -
download
0
Transcript of (51) InternationalPatent Classification: (74) Agent: DAVIES ...

(
(51) International Patent Classification: (74) Agent: DAVIES COLLISON CAVE PTY LTD; 1G06F 17/00 (2019.01) H04L 12/00 (2006.01) Nicholson Street, Melbourne, Victoria 3000 (AU).
(21) International Application Number: (81) Designated States (unless otherwise indicated, for everyPCT/AU20 19/05 1373 kind of national protection av ailable) . AE, AG, AL, AM,
AO, AT, AU, AZ, BA, BB, BG, BH, BN, BR, BW, BY, BZ,(22) International Filing Date:
CA, CH, CL, CN, CO, CR, CU, CZ, DE, DJ, DK, DM, DO,13 December 2019 (13. 12.2019)
DZ, EC, EE, EG, ES, FI, GB, GD, GE, GH, GM, GT, HN,(25) Filing Language: English HR, HU, ID, IL, IN, IR, IS, JO, JP, KE, KG, KH, KN, KP,
KR, KW, KZ, LA, LC, LK, LR, LS, LU, LY, MA, MD, ME,(26) Publication Language: English MG, MK, MN, MW, MX, MY, MZ, NA, NG, NI, NO, NZ,(30) Priority Data: OM, PA, PE, PG, PH, PL, PT, QA, RO, RS, RU, RW, SA,
2018904759 14 December 2018 (14. 12.2018) AU SC, SD, SE, SG, SK, SL, SM, ST, SV, SY, TH, TJ, TM, TN,TR, TT, TZ, UA, UG, US, UZ, VC, VN, ZA, ZM, ZW.
(71) Applicant: NEWSOUTH INNOVATIONS PTYLIMITED [AU/AU]; Rupert Myers Building, Gate 14, (84) Designated States (unless otherwise indicated, for every
Barker Street, University of New South Wales, Sydney, kind of regional protection available) . ARIPO (BW, GH,New South Wales 2052 (AU). GM, KE, LR, LS, MW, MZ, NA, RW, SD, SL, ST, SZ, TZ,
UG, ZM, ZW), Eurasian (AM, AZ, BY, KG, KZ, RU, TJ,(72) Inventors: SIVARAMAN, Vijay; c/o NewSouth Inno¬ TM), European (AL, AT, BE, BG, CH, CY, CZ, DE, DK,
vations Pty Limited, Rupert Myers Building, Gate 14, EE, ES, FI, FR, GB, GR, HR, HU, IE, IS, IT, LT, LU, LV,The University of New South Wales, Sydney, New South MC, MK, MT, NL, NO, PL, PT, RO, RS, SE, SI, SK, SM,Wales 2052 (AU). GHARAKHEILI, Hassan Habibi; c/ TR), OAPI (BF, BJ, CF, CG, Cl, CM, GA, GN, GQ, GW,o NewSouth Innovations Pty Limited, Rupert Myers Build¬ KM, ML, MR, NE, SN, TD, TG).ing, Gate 14, The University of New South Wales, Sydney,New South Wales 2052 (AU). SIVANATHAN, Arunan; c/ Published:o NewSouth Innovations Pty Limited, Rupert Myers Build¬ — with international search report (Art. 21(3))ing, Gate 14, The University of New South Wales, Sydney,New South Wales 2052 (AU).
(54) Title: A NETWORK DEVICE CLASSIFICATION APPARATUS AND PROCESS
(57) Abstract: A network device classification process, including: monitoring network traffic of networked devices in a communica¬tions network to generate device behaviour data representing network traffic behaviours of the networked devices at different timegranularities; processing the device behaviour data to classify a plurality of the networked devices as IoT devices, and others of thenetworked devices as non-IoT devices; accessing IoT device type data representing predetermined network traffic characteristics ofrespective known IoT device types; processing the device behaviour data of the IoT devices and the IoT device type data to classify eachof the IoT devices as being a corresponding one of the plurality of known IoT device types; and for each of the IoT devices classifiedas a corresponding known IoT device type, classifying the IoT device as being in a corresponding operating state based on networktraffic behaviours of the IoT device at different time granularities.

A NETWORK DEVICE CLASSIFICATION APPARATUS AND PROCESS
TECHNICAL FIELD
The present invention relates to a network device classification apparatus and process,
and in particular to a process for classifying IoT ("Internet of things") devices.
BACKGROUND
Networked devices continue to become increasingly ubiquitous in a wide variety of
settings, including businesses and other organisations, and domestic settings. In
particular, the addition of network connectivity to sensors and appliance-type devices
generally dedicated to a specific task has created a new class of devices and
interconnectivity, generally referred to as forming an 'Internet-of-things', or simply
Ί οΤ ' . Thus examples of IoT devices include lightbulbs, doorbells, power switches, weight
scales, security cameras, air conditioning equipment, home automation and voice-
activated Internet interfaces in the general form of audio speakers (e.g., Google Home
and Amazon Echo) and other 'smart' devices, including a wide variety of networked
sensors most commonly used to sense environmental parameters such as temperature,
humidity, motion, smoke and air quality.
There are now so many such devices available that their management has become
challenging, particularly from a security standpoint, for large networks such as those
found in large enterprises and university campuses, for example. Such networks may
include literally thousands of such devices which largely remain unidentified and may
pose significant security risks to the network. Most IoT devices are relatively simple,
and cannot defend themselves from cyber attacks. For example, a recent cyber attack
on a casino relied upon compromised fish tank sensors, and a recent attack on a
university campus network relied upon networked vending machines.
It is desired to provide a network device classification apparatus and process that
alleviate one or more difficulties of the prior art, or that at least provide a useful
alternative.

SUMMARY
In accordance with some embodiments of the present invention, there is provided a
network device classification process, including:
monitoring network traffic of networked devices in a communications network to
generate device behaviour data representing network traffic behaviours of
the networked devices at different time granularities;
processing the device behaviour data to classify a plurality of the networked
devices as IoT devices, and others of the networked devices as non-IoT
devices;
accessing IoT device type data representing predetermined network traffic
characteristics of respective known IoT device types;
processing the device behaviour data of the IoT devices and the IoT device type
data to classify each of the IoT devices as being a corresponding one of the
plurality of known IoT device types; and
for each of the IoT devices classified as a corresponding known IoT device type,
classifying the IoT device as being in a corresponding operating state based
on network traffic behaviours of the IoT device at different time granularities.
In some embodiments, the device behaviour data includes network flow attributes
generated from packet and byte counts of upstream and downstream flows at different
time granularities.
In some embodiments, the processing includes identifying correlations between the
generated attributes, selecting a subset of the attributes based on the correlations, and
using the selected subset of attributes to classify the networked devices.
In some embodiments, the different time granularities are substantially in the form of
a geometric series. In some embodiments, the different time granularities include at
least four different time granularities.
In some embodiments, the device behaviour data includes network traffic attributes of
the networked devices at a first set of different time granularities, and each IoT device
is classified as being in a corresponding operating state based on network flow attributes
of the IoT device at a second set of different time granularities different to the first set
of different time granularities.

In some embodiments, the second set of different time granularities is a subset of the
first set of different time granularities.
In some embodiments, the network device classification process includes generating an
alert when a classification of a networked device other than operating state is different
to a previous corresponding classification of the networked device.
In some embodiments, the network device classification process includes retraining one
or more classifiers used to classify the networked devices to account for changes in
network behaviours of the networked devices over time.
In some embodiments, the IoT devices are classified as known IoT device types by a
multi-class classifier.
In other embodiments, the IoT devices are classified as known IoT device types by
respective one-class classifiers.
In some embodiments, the network device classification process includes generating,
for each of the one-class classifiers, a confidence score indicative of the classification
confidence of the one-class classifier when classifying an IoT device as belonging to a
cluster of the classifier, and in the event that two or more of the one-class classifiers
generate respective outputs indicative of the IoT device as being successfully classified
by those one-class classifiers, selecting, on the basis of the respective confidence
scores, only one of those one-class classifiers to classify the IoT device.
In some embodiments, the confidence score is generated according to:
p r inwhere jS a likelihood of the nearest cluster Cj within the corresponding
Xp tr
-in
model Mi, and · is a probability of an annular or circular distance band Dl
inside the cluster Ci.

I n some embodiments, the network device classification process includes generating
consistency scores representing measures of the classification consistencies of the one-
class classifiers over time, and labelling an unlabelled IoT device as being a
corresponding known IoT device type when the consistency score of the corresponding
one-class classifier satisfies a threshold consistency score.
I n some embodiments, the network device classification process includes updating the
consistency score for each one-class classifier over time to generate an updated value
St from the previous value St-i, according to:
where λ is given by:
A
where T is a time to reach a target score S* (between 0 and 1) from a mid-level score
of 0.50.
In some embodiments, the device behaviour data represents network traffic behaviours
of each networked device as successive instances of a set of network traffic attributes
for each of a plurality of flows of the networked device, the network traffic attributes for
each flow being generated from byte counts and packet counts of the flow for different
time granularities.
In some embodiments, the network traffic behaviours of each of the networked devices
include packet and byte counts of network flows of the device at different time
granularities, the network flows being:
(i) upstream and downstream DNS flows;
(ii) upstream and downstream NTP flows;
(iii) downstream SSDP flows;
(iv) upstream and downstream remote network flows; and
(v) upstream local network flows.

I n accordance with some embodiments of the present invention, there is provided a
network device classification apparatus configured to execute the process of any one of
the above processes.
I n accordance with some embodiments of the present invention, there is provided at
least one computer-readable storage medium having stored thereon executable
instructions and/or FPGA configuration data that, when the instructions are executed by
at least one processor and/or when an FPGA is configured in accordance with the FPGA
configuration data, cause the at least one processor and/or the FPGA t o execute the
device classification process of any one of the above processes.
I n accordance with some embodiments of the present invention, there is provided a
network device classification apparatus, including:
a flow metric generator to generate device behaviour data representing network
traffic behaviours of networked devices in a communications network at
different time granularities;
a first classifier component to process the device behaviour data to classify a
plurality of the networked devices as IoT devices, and others of the
networked devices as non-IoT devices;
a second classifier component to access IoT device type data representing
predetermined network traffic characteristics of respective known IoT device
types, and t o process the device behaviour data of the IoT devices and the
IoT device type data to classify each of the IoT devices as being a
corresponding one of the plurality of known IoT device types; and
a third classifier component to classify each of the IoT devices classified as a
corresponding known IoT device type as being in a corresponding operating
state based on network traffic behaviours of the IoT device at different time
granularities.
I n some embodiments, the network traffic behaviours of the networked devices include
packet and byte counts of upstream and downstream flows at different time
granularities.

In some embodiments, the network device classification apparatus includes a
component to identify correlations between the behaviours, and select a subset of the
behaviours based on the correlations, wherein the classifiers use the selected subset of
behaviours to classify the networked devices.
In some embodiments, the different time granularities are substantially in the form of
a geometric series.
In some embodiments, the different time granularities include at least four different
time granularities.
In some embodiments, the device behaviour data represents network traffic behaviours
of the networked devices at a first set of different time granularities, and each IoT device
is classified as being in a corresponding operating state based on network traffic
behaviours of the IoT device at a second set of different time granularities different to
the first set of different time granularities.
In some embodiments, the second set of different time granularities is a subset of the
first set of different time granularities.
In some embodiments, the network device classification apparatus includes a device
behaviour change detector to detect when a classification of a networked device other
than its operating state is different to a previous corresponding classification of the
networked device.
In some embodiments, the network device classification apparatus includes retraining
one or more of the classifiers to account for changes in network behaviours of the
networked devices over time.
In some embodiments, the second classifier component is a multi-class classifier.
In some embodiments, the second classifier component includes a set of one-class
classifiers for respective known IoT device types.
In some embodiments, the network device classification apparatus includes one or more
confidence score generators configured to generate, for each of the one-class classifiers,
a corresponding confidence score indicative of the classification confidence of the one-

class classifier when classifying an IoT device as belonging to a cluster of the
corresponding model, and in the event that two or more of the one-class classifiers
generate respective outputs indicative of the IoT device as being successfully classified
by those one-class classifiers, selecting, on the basis of the respective confidence
scores, only one of those one-class classifiers to classify the IoT device.
In some embodiments, the confidence score is generated according to:
p ir in
where is a likelihood of the nearest cluster Cj within the corresponding
r in
model Mi, and is a probability of an annular or circular distance band Dl
inside the cluster Ci.
In some embodiments, the network device classification apparatus includes a
consistency score generator configured to generate consistency scores representing
measures of the classification consistencies of the one-class classifiers over time,
wherein an unlabelled IoT device is labelled as a corresponding known IoT device type
when the consistency score of the corresponding one-class classifier satisfies a threshold
consistency score.
In some embodiments, the consistency score generator is configured to update the
consistency score for each one-class classifier over time to generate an updated value
St from the previous value St-i, according to:
where T is a time to reach a target score S* (between 0 and 1) from a mid-level score
of 0.50.

I n some embodiments, the device behaviour data represents network traffic behaviours
of each networked device as successive instances of a set of network traffic attributes
for each of a plurality of flows of the networked device, the network traffic attributes for
each flow including byte counts and packet counts of the flow for different time
granularities.
In some embodiments, each of the one-class classifiers assigns an instance of the set
of network traffic attributes to a cluster
In some embodiments, the network traffic behaviours of each of the networked devices
include packet and byte counts of network flows of the device at different time
granularities, the network flows being:
(i) upstream and downstream DNS flows;
(ii) upstream and downstream NTP flows;
(iii) downstream SSDP flows;
(iv) upstream and downstream remote network flows; and
(v) upstream local network flows.
Also described herein is a network device classification process, including:
monitoring network traffic of networked devices in a communications network to
generate device behaviour data representing network traffic behaviours of the
networked devices at different time granularities;
processing the device behaviour data to classify a plurality of the networked
devices as IoT devices, and others of the networked devices as non-IoT devices;
accessing IoT device type data representing predetermined network traffic
metrics for respective known IoT device types;
processing the device behaviour data of the IoT devices and the IoT device type
data to classify each of the IoT devices as being a corresponding one of the plurality of
known IoT device types; and
for each of the IoT devices classified as a corresponding known IoT device type,
classifying the IoT device as being in a corresponding operating state based on network
traffic behaviours of the IoT device at different time granularities.

Also described herein is a network device classification apparatus, including:
a flow metric generator to generate device behaviour data representing network
traffic behaviours of networked devices at different time granularities in a
communications network;
a first classifier component to process the device behaviour data to classify a
plurality of the networked devices as IoT devices, and others of the networked devices
as non-IoT devices;
a second classifier component to access IoT device type data representing
predetermined network traffic metrics for respective known IoT device types, and to
process the device behaviour data of the IoT devices and the IoT device type data to
classify each of the IoT devices as being a corresponding one of the plurality of known
IoT device types; and
a third classifier component to classify each of the IoT devices classified as a
corresponding known IoT device type as being in a corresponding operating state based
on network traffic behaviours of the IoT device at different time granularities.
BRIEF DESCRIPTION OF THE DRAWINGS
Some embodiments of the present invention are hereinafter described, by way of
example only, with reference to the accompanying drawings, wherein:
Figure 1 is a schematic diagram of a communications network including IoT and
non-IoT networked devices and a network device classification apparatus in accordance
with the described embodiments of the present invention;
Figure 2 is a block diagram of the network device classification apparatus of the
network shown in Figure 1, in accordance with the described embodiments of the
present invention;
Figure 3 is a flow diagram of a network device classification process in
accordance with the described embodiments of the present invention;
Figure 4 is a schematic diagram illustrating the hierarchical classification of IoT
devices and their operating states in accordance with the network device classification
process of Figure 3;
Figure 5 is a graph showing the probability distributions of the volume of Internet
download traffic over a period of 32 minutes for IoT and non-IoT networked devices,
respectively;
Figure 6 is a graph showing the probability distributions of the number of DNS
queries over a period of 64 minutes for IoT and non-IoT networked devices,
respectively;
Figures 7 to 9 are graphs showing probability distributions for four different IoT
devices of respectively: the number of NTP response packets over a period of 16
minutes, the volume of Internet traffic over a period of eight minutes, and the volume
of SSDP traffic over a period of eight minutes;
Figures 10 t o 12 are graphs showing probability distributions of Internet
download traffic for different operating states of the following three IoT devices: Figure
10: Amazon Echo (over a period of two minutes); Figure 11: Belkin switch (over a period
of one minute), and Figure 12: Dropcam (over a period of two minutes);
Figure 13 is a confusion matrix of IoT versus non-IoT identification;
Figure 14 is a confusion matrix of IoT device classification based on training data
collected over an initial three month period;
Figures 15 and 16 are graphs showing the classification results as a function of
time for a Hewlett-Packard printer and a Hue light bulb, respectively;
Figure 17 is a confusion matrix of IoT device classification based on training data
collected over the initial three month period (compare Figure 14) and an additional two-
week period;
Figures 18 to 2 1 are confusion matrices of operating states for the following IoT
devices, respectively: Amazon Echo, Belkin switch, Dropcam, and LiFX lightbulb;
Figures 22 and 23 are matrices illustrating the information gain values of
attributes, respectively for: Figure 22: all attributes, and Figure 23: a reduced set of
attributes;
Figure 24 is a graph illustrating the effect of the number of high-merit attributes
on performance in terms of precision, recall, and accuracy;
Figure 25 is a graph illustrating the effect of the number of high-merit attributes
on the cost of state management and switch TCAM;
Figures 26 to 29 are charts illustrating the performance of operating state
classification for different reduced attributes, respectively for the following different IoT
devices: Figure 26: Amazon Echo, Figure 27: Belkin switch, Figure 28: Dropcam, and
Figure 29: LiFX lightbulb;

Figure 30 is a set of three graphs showing clusters of data instances in two-
dimensional principal component space for respective representative IoT devices,
namely: (a) an Amazon Echo, (b) a Belkin switch, and (c) an LiFX bulb;
Figure 3 1 is a set of charts illustrating the distance probability of clusters selected
from Figure 30, namely: (a) the C3 cluster of the LiFX bulb, (b) the B3 cluster of the
Belkin switch, and (c) the A 1 cluster of the Amazon Echo device;
Figure 32 is a graph illustrating the elbow method used t o select an optimal
number of clusters for each device type class;
Figure 33 is a diagram illustrating the use of each clustering model for a test
instance;
Figure 34 is a graph of the cumulative distribution function as a function of
associate probability value for training instances of three device types;
Figure 35 is a block diagram of a device type classification component of an
alternative embodiment of a network device classification apparatus;
Figure 36 is a graph showing the evolution of a consistency score generated in
real-time by the device type classification component as a function of time for a Smart
Things IoT device;
Figure 37 is a graph showing the real-time update rate of the consistency score
- for a given model, it falls fast (from highest to lowest value in 3 hours) on continuous
negative outputs, and rises slowly (from lowest to highest value in 24 hours) on
continuous positive outputs;
Figures 38 (a) and (b) are confusion matrices of device classification,
respectively for: (a) the raw output of the set of clustering models, and (b) after conflict
resolution;
Figure 39 (a) and (b) are graphs showing respective time-traces of the
consistency score respectively for: (a) a Belkin switch, and (b) a Triby speaker device;
Figure 40 (a) and (b) are graphs showing respective time-traces of the
consistency score of a Dropcam traffic: (a) showing a rapid drop of the score due to an
automatic firmware upgrade, and (b) following the firmware upgrade and model
retraining; and
Figure 4 1 is a screenshot of a Wireshark capture of Triby speaker packets,
showing outage of a SIP server use by the Triby speaker device.

DETAILED DESCRIPTION
Embodiments of the present invention include a network device classification process
and apparatus that monitor network traffic in a communications network in order to
automatically determine network traffic patterns ( .e., behaviour) of the networked
devices in that network, and to use those network traffic patterns as fingerprints to
automatically identify which of the networked devices are IoT devices and which are
not, and for each IoT device, to automatically identify the type of that IoT device
(typically including its function, manufacturer, and even model number) and its current
operating state (/.e., whether it is currently booting, processing input, or idle). This
information is automatically generated, and can be updated periodically (e.g., on a daily
basis) in order for network managers to have available a complete list of all of the IoT
devices on their networks and their current operating states.
Additionally, any changes in the traffic patterns of an IoT device can be automatically
identified quickly, and an alert generated so that a network administrator can be alerted
to a potential security risk or malfunctioning device, and can take corrective action
where appropriate.
In particular, the described process and apparatus are scalable to large networks, and
can be implemented at low-cost using standard and commercially available software
defined networking (SDN) hardware, including OpenFlow switches.
As shown in Figure 1, a communications network includes one or more interconnected
network switches 102 and a gateway 104 that provides access to a wide area network
106 such as the Internet. The switches 102 provide wired and wireless access to the
network for network devices, including IoT devices 110 and non-IoT devices 112. The
non-IoT devices 112 typically include computing devices such as desktop and portable
general purpose computers, tablet computers, smart phones and the like.
In accordance with the described embodiments of the present invention, the
communications network also includes a network device classification apparatus 200,
as shown in Figure 2, that executes a network device classification process 300, as
shown in Figure 3, to automatically identify which of the networked devices are IoT
devices and which are not, and for each of the IoT devices 110, to automatically identify
the type of that IoT device (e.g., that one IoT device is an 1 FX lightbulb IoT device)
and its current operating state (e.g., whether it is currently booting, processing input,
or idle).
In the described embodiments, the switches 102 are OpenFlow switches under control
of an SDN controller. However, it will be apparent to those skilled in the art that other
embodiments of the present invention may be implemented using other types of
network switches to identify and quantify network traffic flows of networked devices.
As shown in Figure 2, in the described embodiments the network device classification
process 300 is implemented in the form of executable instructions of software
components or modules 202 stored on a non-volatile storage medium 204 such as a
solid-state memory drive (SSD) or hard disk drive (HDD). However, it will be apparent
to those skilled in the art that at least parts of the process 300 can alternatively be
implemented in other forms, for example as configuration data of a field-programmable
gate arrays (FPGA), and/or as one or more dedicated hardware components, such as
application-specific integrated circuits (ASICs), or any combination of these forms.
The network device classification apparatus 200 includes random access memory (RAM)
206, at least one processor 208, and external interfaces 210, 212, 214, all
interconnected by at least one bus 216. The external interfaces include a network
interface connector (NIC) 212 which connects the apparatus 200 to the network
switches 102network, and may include universal serial bus (USB) interfaces 210, at
least one of which may be connected to a keyboard 218 and a pointing device such as
a mouse 219, and a display adapter 214, which may be connected to a display device
such as a panel display 222.
The network device classification apparatus 200 also includes an operating system 224
such as Linux or Microsoft Windows, and an SDN controller 226 such as the Ryu
framework, available from http://osrq.qithub.io/rYu/ · Although the network device
classification components 202 and the SDN controller 226 are shown as being hosted
on a single operating system 224 and hardware platform, it will be apparent to those
skilled in the art that in other embodiments the SDN controller 226 may be hosted on a
separate virtual machine or hardware platform with a separate operating system.

As described below, the network device classification process 300 monitors network
traffic of networked devices to generate what can be called device behaviour data
representing network traffic behaviours of the networked devices at different time
granularities. The device behaviour data is then processed t o classify some of the
networked devices as IoT devices, and others as non-IoT devices. For those classified
as IoT devices, the device behaviour data is further processed t o classify each of the
IoT devices as being an instance of one of a set of known IoT device types. Finally, for
those known IoT device types, the device behaviour data is processed yet again to
classify the operating state of the IoT device as one of a set of known operating states
of that particular device.
Traffic Trace Datasets
Datasets of network traffic traces recorded from a testbed network were used t o
demonstrate the basis for, and the performance of, the network device classification
apparatus and process described herein. The first dataset represents network packets
of more than 30 IoT/non-IoT devices collected over a period of 6 months (from Ol-Oct-
2016 to 31-Mar-2017), and the second dataset represents network packets of four IoT
devices collected over two days with labels/annotations representing their known
operational states, namely boot ( .e., getting connected to the network), active ( .e.,
interacting with users), and idle (/.e., not being booted or actively used).
In the described embodiments, the MAC address of each device was used as its unique
network identifier in order to isolate its traffic from the traffic mix of other devices in
the network. However, it will be apparent to those skilled in the art that other identifiers
such as I P address (without NAT), physical port number, or VLAN can be used in other
embodiments to provide a one-to-one mapping of each traffic trace to its physical
device.
The following analysis focuses on 17 IoT devices that were operating in the inventors'
laboratory for at least 60 days in the first dataset.
To label or annotate operating states in the training data, the RepetiTouch Pro mobile
app (available from
https ://play. google. com/ store/a pps/details?id=com.cygery.repetitouch. pro) was used

to record and replay touch events on an Android tablet in order to simulate user
interactions with three IoT devices via their manufacturer mobile apps. In this example,
the three IoT devices were a Belkin switch, a Google Dropcam camera, and an I2FX
lightbulb. The user interactions included turning the Belkin switch on and off, streaming
video from the camera, and turning the LiFX bulb on and off.
To label or annotate active states of an Amazon Echo, the espeak text-to-speech engine
(available from http://espeak.sourceforge.net/) was used t o periodically ask questions
of the device. Additionally, for boot states, the four IoTs described above were powered-
up using a separate TP-Link HS110 smart plug (whose traffic is not considered in the
analysis) controlled by an automated script to turn the switch off and on (with sufficient
time gap therebetween) to capture the boot state of these four IoT devices.
Traffic Flows
I n the described embodiments, the fine-grained visibility provided by an OpenFlow
network switch was used to monitor the dynamics of network device activity on a per-
flow basis over timescales ranging from 1 minute to 1 hour. Table 1 below shows eight
flow-rules specific to each device that were inserted into the packet forwarding table of
the OpenFlow switch upon discovery of a device on the network, where <devMAC>
represents the MAC address of the device, and <gwMAC> represents the MAC address
of the network's Internet gateway. These flow-rules allow the OpenFlow switch to
provide telemetry that enables network traffic profiles of the device to be characterised
in real-time.
Table 1 - the flow-rules used to split network traffic of a device into several streams
Flow description E 'H. rc ETH_dst IP_src IP_dst Port_src Port_dst Priority Action
DNS query (DNS†) « β Α > 00 forwardDNS response (DNS†.) * <devMAC> 0 forwardN P query (NTP† <devMAC> * 23 100 forward
SSDP upstream (SSDP <d MAC> > 1 00 0 forwardDevice to Internet (In . ) <devMAC> <g AC> ! forwardInternet to device (Int..|.) <g AC> <d v A > ! forwardDevice to Local ( o .†) <devMAC> s ❖ forward

The priorities of these flow rules splits the traffic threefold, as follows:
(i) DNS query (upstream), DNS response(downstream), NTP query(upstream),
NTP response(downstream), SSDP upstream;
(ii) from IoT to Internet (internet upstream), from Internet t o IoT (internet
downstream); and
(iii) from IoT to other devices in the local area network (local upstream).
The SSDP downstream and local downstream traffic received by the IoT is ignored in
order t o eliminate ambiguity with upstream traffic flows of other devices in the same
local network.
With these rules in place for each device, the data and packet counters of each individual
flow rule is received periodically and accumulated for different time granularities, in this
example over the seven time periods of 1, 2, 4, 8, 16, 32 and 64 minutes. I n total, 112
attributes (8 flows x 2 counters (upstream and downstream)x 7 time granularities) are
calculated to characterize network devices and their operating states.
PCAP Parsing and Attribute Generation
I n order t o evaluate the performance of the network device classification process
without posing any risk to the live network, the operation of an OpenFlow switch with
the described sets of rules installed was simulated by synthesising flow entries and
counters from the captured network traces. Specifically, a native PCAP parsing tool was
used t o process raw PCAP files as input and split the traffic into defined flows in the
same manner as an OpenFlow switch, the byte counts and packet counters of each flow
entry being calculated for a configurable time interval (e.g., 1 sec or 60 sec).
Then, an attribute vector was generated for each network device by accumulating the
values of each counter over different time scales as described above. I n order t o
eliminate nearly identical and redundant attribute vectors during the training, only one
vector out of every fifteen vectors was sampled for the classification of IoT devices from
non-IoT devices and for the classification of IoT devices into different device types.
Conversely, because state identification is sensitive to relatively small variations of
traffic, all of the attribute vectors were used t o classify operating states of IoT devices.

IoT vs non-IoT characterization
Figures 5 and 6 show the probability distributions of two different network traffic profiles
of IoT and non-IoT devices accumulated over time periods of 32 and 64 minutes,
respectively. Since the values of those attributes are spread across long ranges, a
logarithmic scale is used for the x-axes.
It can be observed from Figure 5 that the volume of internet traffic over 32 minute
periods was less than ~500KB for 90% of the IoT devices, whereas only 30% of the
non-IoT traffic was less than 500KB. As shown in Figure 6, a similar pattern can be seen
in the probability distribution of DNS request packet counts as well. Specifically, over a
period of 64 minutes, 90% of IoT traffic contains around 83 DNS packets, while 65% of
non-IoT traffic is spread from ~100 to ~3100 packets. These characteristics clearly
demonstrate that IoT devices tend to generate less network traffic compared to non-
IoT devices over a long time period (e.g., 32 min, 64 min).
Device level characterization
Figures 7 to 9 show probability distribution histograms of: (i) NTP request packet count,
(ii) internet upload traffic volume (in bytes), and (iii) SSDP upload traffic volume (in
bytes) for accumulation time periods of 16, 8, and 8 minutes, respectively, for four IoT
devices selected from the set of 17 IoT devices.
The four selected IoT devices are the Amazon Echo, Belkin switch, Belkin motion sensor
and Lifx. Because the Belkin switch and the Belkin motion sensor are from same vendor
and share similar behaviours in most attributes, it is challenging to recognize them
correctly. It can be seen in Figure 7 for a traffic accumulation period of 16 minutes that
70% of times the Belkin switch (depicted in solid line with triangle markers) sends
around 2 NTP request packets, whereas 33% of the time the Belkin motion sensor
(depicted in dotted line with filled-circle markers) sends the same number of packets.
In the same graph, 1 FX light bulbs has a peak of over 90% at ~ 3 packets, and the
Amazon Echo (dashed line) has a range of NTP request counts, ranging from 7 to 42
packets.

Figure 8 shows relatively minor overlapping in the distributions of internet upload traffic
volumes of the Belkin switch and the Belkin motion sensor for an accumulation period
of 8 minutes (with maximum peak values at 285 bytes and 575 bytes, respectively).
The major portion of network Internet upload sizes for the LiFx bulb and the Amazon
Echo lie in the range of 500-3000 bytes and 7000-33000 bytes, respectively.
However, in contrast t o the overlapping distributions described above, and as shown in
Figure 9, the volume of SSDP upload traffic over an 8 minute period shows a clear
classifiable distinction between the Belkin switch and the Belkin motion sensor. For the
case of the Belkin switch, 82% of the traffic has a size of ~8100 bytes, whereas 73%
of the Belkin motion sensor uploads are only ~800 bytes using the SSDP protocol. For
the sake of completeness, it is noted that the Amazon Echo has a 100% peak at around
650 bytes. The LiFX lightbulb does not use SSDP protocols for device discovery or
advertisement purposes.
State level characterization
Network traffic attributes of the Amazon Echo, Belkin switch and Dropcam IoT devices
in different device operating states (/.e., booting, active and idle) are shown in Figures
10 to 12, respectively. The volume of the last two minutes of internet downloads of the
Amazon Echo is shown in Figure 10 because it makes frequent communication with
cloud servers. Figure 11 shows the last 1 minute of local upload traffic of the Belkin
switch, since it communicates with a mobile app connected to the local area network.
Finally, Figure 12 shows the last 2 minutes of internet upload traffic of the Dropcam
IoT device to show its behavior while it is streaming videos. It is noted that the IoT
devices exchange a lower volume of network traffic during the majority of their idle
periods compared to the active or booting periods. For example, 75% of Amazon echo
idle traffic downloads only 500 - 1,000 bytes from the internet, whereas 90% of booting
traffic and 50% of active periods download 1600 - 43000 bytes and 60,000 - 82,000
bytes, respectively. The Belkin switch and dropcam display similar behaviour in this
respect.
Table 2 - Evaluation Matrix of IoT versus non-IoT classification
1 Τ Νβ Τ T P F F Precision Recall T P av . n i ce F avg, njf c
IoT 0.987 0.013 0.022 1.000 0. 87 0.993 0.968 0.635Non-IoT 0.978 0.022 . 3 0.286 0.978 0.443 0.947 0.701

Multi-Stage Classification
Architecture
The apparatus and process described herein accomplish the following three tasks when
a device is connected to a network:
1) detection of IoT devices (as distinguished from non-IoT devices),
2) IoT device type labelling (e.g., whether it is an August Doorbell, or an HP
printer, or ...), and
3) operating state identification of each IoT device (e.g., Boot/ Active/ Idle).
However, classifying all three in a single classifier would not be scalable for a large-scale
network such as in an enterprise, for example. In particular, when using ensemble
decision trees as classifiers, the size of the trees can grow exponentially with the number
of devices and their operating states. For instance, to differentiate three states of four
devices, the classifier would need to be trained against 12 labels. This would lead to
very dense trees, and become very sensitive to network traffic patterns.
Further, definable states of the devices can vary between different kinds of devices. For
example, an Awair air quality sensor updates its air quality score to the cloud regularly.
Meanwhile, the corresponding mobile app pulls the latest air quality score from the cloud
instead of from the device. Thus, user interaction on the mobile app does not directly
affect the network traffic of the air quality sensor itself. This makes it impossible to
define an active state for the Awair air quality sensor, leaving only the boot and idle
states able to be identified. For at least these reasons, a single classifier cannot
practically be used to classify a wide variety of network devices in the long run.
In order to tackle these problems, the IoT device classification process and apparatus
described herein use a hierarchical classification process as shown schematically in
Figure 4 . The process includes three layers of the Random-forest based, multi-class
classifiers described in L. Breiman, Random Forests, Machine Learning Vol. 45 No. 1,
pp 5-32, 2001. Initially, when a device gets connected to the network, a layer-1
classifier uses flow counter values for that device traffic accumulated over all of the
available time granularities (in the described embodiment being 1, 2, 4, 8, 16, 32, and
64 minute traffic accumulation periods) to distinguish IoT devices from non-IoT devices.

If a device is classified or 'detected' as an IoT device, then a layer-2 (device classifier)
is triggered to label the specific type of the IoT device (e.g., as an August Doorbell, or
an HP printer, etc.)· Alternatively, if the layer-1 classifier classifies a device as a non-
IoT device, then no further classification (/.e., on layer-2 and layer-3) is performed.
Layer-3 includes an individually specialized classifier for each known type of IoT device.
After the layer-2 classification confirms the device type, then the dedicated operating
state classifier for that device type is invoked to continuously monitor changes in the
operating state of the device in real time. State changes such as boot and active occur
instantaneously. Thus, unlike the layer-1 and layer-2 classifiers, the state identification
classifiers of level 3 do not require long historical network activity patterns. Thus in the
described embodiment, the state classifiers process only attributes calculated for the
shorter accumulation periods of 1,2 and 4 minutes. This enables rapid responses to
changes in operating state.
The quality of each individual classifier was evaluated using the stored network traces.
First, the attribute vectors were converted to labeled instances in order to train the
classifiers. Then Weka (available from https ://sou c for e.net/ projects/ eka/ ) was
used as a tool to evaluate the classifiers.
Altogether, network traces were collected for ~115,000 flow instances of IoT and non-
IoT devices over the 6 month accumulation period, and ~10,500 instances with
operating state annotations from four devices (the Belkin switch, Dropcam, Amazon
Echo and Lifx lightbulb devices). The number of instances from each network device
varied based on factors such as how long the device was online in the testbed network,
and how frequently it communicated with cloud servers or other devices.
It was found that the lowest instance count of 865 was for a Nest smoke sensor, which
makes communication only for a short time with its server each day. The highest
number of ~12,000 was for the Dropcam device because it makes frequent calls to its
server and it was online for 90% of the days of the 6 month accumulation period.

Because the class distribution was uneven, the quality of each classifier was evaluated
using several performance metrics, including accuracy, precision, recall, and Fi,
together with a confusion matrix. These performance matrices were defined based on
True Positive(TP), True Negative(77V), False Positive(FP) and False Negative(F/V) values,
as follows:
TP + TNaccuracy ( )
TP ~l· TN + FP 4- FNTP
precision (2TP + F P
TPrecall 3
TP + FNprecision x recall
l· 2 (4)precision + recall
The metric Fi is a harmonic mean of the precision and recall metrics. It provides a better
indication of classifier quality in the case of an unbalanced dataset. Fi gets its best
value at 1 and its worst at 0 .
In addition to the performance matrix, the average confidence levels for correctly
classified instances and incorrectly classified instances were determined separately. In
an ideal scenario, a classifier would have high confidence (/.e., close to 1) when it
correctly classifies instances, and low confidence (/.e., close to 0) when it incorrectly
classifies due to inadequate information in the instance or unseen behaviour in the
training set.
IoT versus non-IoT Classification
In order to evaluate the IoT vs non-IoT classifier, 800 instances (66% of total non-IoT
instances) were randomly chosen from non-IoT devices, and 50 instances from each
distinct IoT device (/.e., 850 total IoT instances) as a training set.
Figure 13 shows the resulting confusion matrix of IoT vs non-IoT classification. The rows
show actual classes (IoT or non-IoT), and the columns show how they were classified
by the classifier. The confusion matrix of Figure 13 and the evaluation matrix of Table
2 above show that IoT and Non-IoT devices were classified with a high True Positive
(TP) rate of 98.7% (Average confidence: 0.96), and 97.8% (Average confidence: 0.96),

respectively, while the incorrectly classified 1.3 % of IoT instances and 2.2 % of non-
IoT instances show relatively low confidence rates of 0.635 and 0.701. Also, the
weighted accuracy, precision, recall and Fi values of this classifier are 98.7%, 0.996,
0.987, and 0.991, respectively.
IoT device type classification
The quality of the IoT device type classifier was also evaluated, including its degradation
over time. The training and test instances were not divided randomly as they were for
the IoT versus non-IoT classifier evaluation. I n order t o observe the quality of classifier
over time, the first 3 months (i.e: Ol-Oct-2016 t o 31-Dec-2016) of the 6 month
accumulation period was used as a training set, and the later part {i.e., 01-Jan-2017 t o
31-Mar-2017) was used as a testing set.
Figure 14 and Table 3 below respectively show the confusion matrix and the evaluation
matrix of the IoT device type classifier. When inspecting individual classes, it was
observed that certain classes showed a high rate of misclassification. For example,
12.0% of the Nest smoke sensor instances were misclassified as a Withings weight
scale, and 39.8% of the HP printer instances were misclassified as Belkin switch
instances.
Table 3 - Evaluation Matrix of IoT device classification for an initial 3 month period of network traceaccumulation
T TP N FP Precision Recall f- TP «vg. confidence N avg. confidence
A azon Echo .9 7 0 .0 . 0.989 0.977 0. 83 0.995 0.332August Doorbell 0.985 0.015 0.001 0.992 0 .98 0. 88 0.926 0.422Awair air quality 0.77 0,229 0 X 2 0.794 0,77 0.783 0.706 0.485Be kin Motion Sensor 0,996 0,004 0.0 0,995 0,996 0.995 0 . 7 0.328Belkin Switch OO . - 5 0.82 1 .000 0.902 0.990 0.484
ro a 0.991 0.009 . 0.997 0.991 0.994 0.986 0.503HP Primer 0 5 9 0.4 1 0.001 0.975 0 .5 9 0.734 0.961 0.535
PX Bulb 0.977 0 . 23 . 1 0.97 0.977 0.975 0.888 0.595NEST Smoke Sensor 0.866 0 . 134 0.0 0.893 0.866 0.879 0 854 0.38N atm Weather 0.997 0.003 0 4X 2 0.986 0 . 9 0. 92 0.943 0. 0
etatm Camera 0.974 0.026 04X12 0.984 0.974 0. 79 0.979 0.351Hue Bul 0.9 0 0.070 04X12 0.978 0.930 0.954 0.572 0.419Samsung Smart Camera 0.983 0.01 0.008 0.908 0.983 0.944 0.987 0.532Smart Things 0.9 2 0.088 . 0.987 0 .9 2 0 .94 0,983 0387Tr y Speaker 0.949 0.051 0.001 0.979 0.949 0.964 0 . 9 1 0.429Withings sensor 0.957 0.043 0.003 0.957 0.957 0.957 0.901 0.479Withings Scale 0.985 0.015 04X14 0.791 0.985 0,877 0.884 0.525

Similarly, only 77.1% of Awair air quality sensor test instances were correctly classified,
and the remaining 8.6% and 13.0% were misclassified as instances of the August
doorbell and the Withings scale, respectively. However, the incorrectly classified
instances of these three devices had low average confidence levels (Awair air quality
sensor: 0.485, HP printer: 0.535, and Nest sensor: 0.389).
94.0% of the instances of the Hue light bulb were classified correctly, but with a low
average confidence level for most of them, indicating that they cannot be treated as
correctly classified instances.
The reasons for these misclassifications were investigated by analysing the classifier
output along the time domain. Figures 15 and 16 respectively show the classified labels
of "HP printer" and "Hue light bulb" over time, from 01-01-2017 to 31-03-2017. The
colour of the dots represents the confidence level of the classifier for each instance, with
a colour close to green depicting high confidence, and close to yellow depicting low
confidence.
Figure 15 shows that instances of the HP printer in the early part of the period (until
09-01-2017) in January were classified correctly with a high confidence level. Then the
device is offline for a month, and returns back online on 11-02-2017. However, after
this period the HP printer is mostly misclassified as a Belkin switch, but with a low
confidence level. Thus the HP printer has changed its behaviour when it came back
online again.
Figure 16 shows the classifier output for the Hue light bulb over the same period.
Although most of the instances are classified correctly during the entire testing period,
the average confidence level drops from 0.93 to 0.50 on 15-02-2017.
A similar kind of partial or full behavioural change was seen for other devices which
were classified incorrectly early in the training set followed by behavioural change. To
investigate this further, another two weeks (for the period from 12-02-2017 to 25-02-
2017) of data was added to the previous training set to augment the behavioural
changes in the training set. Figure 17 shows the confusion map of the classifier trained
with the new set of training data. It is observed that, with the new training set, the
confusion matrix is almost diagonal, and all classes have gained accuracy to more than
90%.
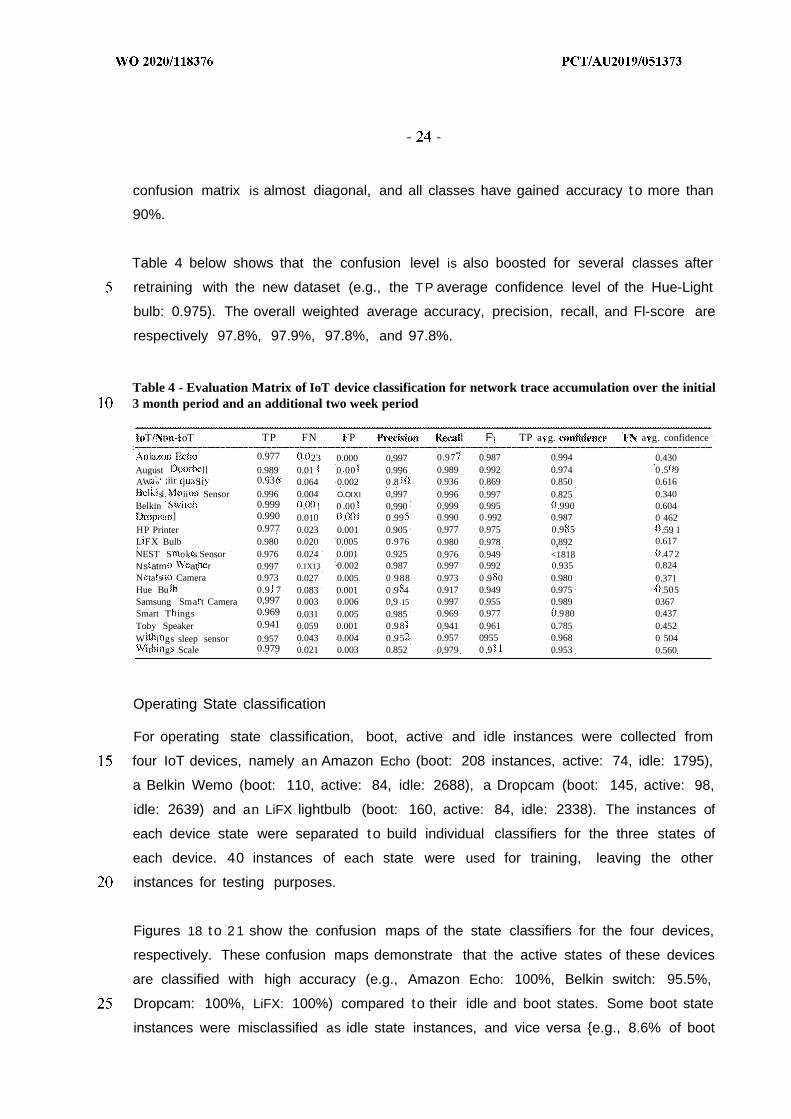
Table 4 below shows that the confusion level is also boosted for several classes after
retraining with the new dataset (e.g., the T P average confidence level of the Hue-Light
bulb: 0.975). The overall weighted average accuracy, precision, recall, and Fl-score are
respectively 97.8%, 97.9%, 97.8%, and 97.8%.
Table 4 - Evaluation Matrix of IoT device classification for network trace accumulation over the initial3 month period and an additional two week period
T t - oT TP FN P l F TP a g. a g. confidence
i 0.977 23 0.000 0,997 0.97 0.987 0.994 0.430August ll 0.989 0.01 0 00 0.996 0.989 0.992 0.974 0.5 9AW » ;iir j Sit 0. 3 0.064 0.002 0 .8 0.936 0.869 0.850 0.616
si ii Sensor 0.996 0.004 Ο.ΟΙΧΙ 0,997 0.996 0.997 0.825 0.340Belkin 0.999 . ! 0 .00 0,990 0,999 0.995 .990 0.604
- ] 0.990 0.010 . 0 .99 0.990 0 992 0.987 0 462HP Printer 0.977 0.023 0.001 0.905 0.977 0.975 0.9 5 .59 1L FX Bulb 0.980 0.020 0.005 0 976 0.980 0.978 0,892 0.617NEST S ok s Sensor 0.976 0.024 0.001 0.925 0.976 0.949 <1818 .472Ns atm at r 0.997 0.1X13 0.002 0.987 0.997 0.992 0.935 0.824N ta s Camera 0.973 0.027 0.005 0 988 0.973 0 .9 0 0.980 0.371Hue Bu 0.9 7 0.083 0.001 0 .9 4 0.917 0.949 0.975 .505Samsung Sma t Camera 0,997 0.003 0.006 0,9 15 0.997 0.955 0.989 0367Smart T ings 0.969 0.031 0.005 0.985 0.969 0.977 .980 0.437Toby Speaker 0.941 0.059 0.001 0.98 0.941 0.961 0.785 0.452W i gs sleep sensor 0.957 0.043 0.004 0 .95 0.957 0955 0.968 0 504
t g Scale 0.979 0.021 0.003 0.852 0.979 0 ,9 0.953 0.560
Operating State classification
For operating state classification, boot, active and idle instances were collected from
four IoT devices, namely an Amazon Echo (boot: 208 instances, active: 74, idle: 1795),
a Belkin Wemo (boot: 110, active: 84, idle: 2688), a Dropcam (boot: 145, active: 98,
idle: 2639) and an LiFX lightbulb (boot: 160, active: 84, idle: 2338). The instances of
each device state were separated to build individual classifiers for the three states of
each device. 40 instances of each state were used for training, leaving the other
instances for testing purposes.
Figures 18 t o 2 1 show the confusion maps of the state classifiers for the four devices,
respectively. These confusion maps demonstrate that the active states of these devices
are classified with high accuracy (e.g., Amazon Echo: 100%, Belkin switch: 95.5%,
Dropcam: 100%, LiFX: 100%) compared to their idle and boot states. Some boot state
instances were misclassified as idle state instances, and vice versa {e.g., 8.6% of boot

instances of the Belkin switch were misclassified as idle states, and 7.5% of boot
instances of the LiFx were misclassified as idle states). The inventors speculate that the
reason for these misclassifications might be that some of the boot state annotations are
incorrect.
Operational Considerations
The performance of the classifiers has been described above with respect to all of the
attributes calculated from traffic flows. However, high impact attributes are described
below, including ways to achieve the same performance level with a reduced set of
attributes and at reduced cost.
Cost optimization
Information Gain
"Information Gain" (IG) refers to a measure of the partitioning ability of individual
attributes to all classes. In other words, the attribute that can distinguish the classes
better than all other attributes will have the highest IG value of all attributes.
The IG values for all attributes were calculated individually for each classifier. The total
number of attributes for the IoT classifier and the device type classifier was 112, and
for the state classifiers, 48.
Figure 22 shows the IG value matrix of all attributes for the device type classifier. The
matrix compares the traffic flow counters (represented by rows) against time granularity
(represented by columns). It is observed that the highest IG value of 3.36 is for the
attribute "Int. B " (representing "upstream byte count to the internet") for 8 min),
followed by "Int. B ' ("downstream byte count from the internet") for 4 mins', with an
IG value of 3.32. It is also noted that the attributes generated from the byte counters
of the top four attributes representing bytes and packet counts for "downstream from
internet" and "upstream to internet" for the mid-range time granularities (4, 8, and 16
minutes) show a high impact on classification compared to the other counters. In
addition, coarse time granularity DNS counter attributes (/.e., 32 and 64 mins) also
show considerable impacts on classification.

Flow entries for local downstream and SSDP upstream flows show the least impact on
classification because only a few devices included in the analysis use local and SSDP
traffic during their communication. Although these flow entries are not contributing to
classify many devices, they may nevertheless help to precisely identify the devices that
generate these types of traffic flows.
A similar analysis of other classifier attributes also revealed interesting facts such as
that coarse grain attributes have a high impact on IoT vs non-IoT classification, and
short-range attributes have a high impact on state identification.
Attribute reduction
Although all of the attributes described herein have been used in the classifiers, not all
attributes may be required in all circumstances (e.g., for IoT versus non-IoT, or device
and state classification). Additionally, correlations between attributes can make some
of them redundant.
In order to identify and remove redundant attributes, the Correlation-based Feature
Subset ("CFS") selection algorithm described in M. A. Hall, Correlation-based Feature
Subset Selection for Machine Learning, PhD thesis, University of Waikato, Hamilton,
New Zealand, 1998 was used with a best-first searching method. CFS is a filter algorithm
that ranks attribute subsets according to a correlation based heuristic evaluation
function. It helps to identify the subset of attributes that are highly correlated with
classes and uncorrelated among them.
Figure 23 shows a subset of 35 attributes that were identified after eliminating
correlated attributes from the device type classifier. The subset of attributes provided a
weighted accuracy (97.3%), precision (97.5%), recall (97.3%) and Fl-score (97.4%)
similar to the device type classifier that used the full set of attributes.
Using a similar approach, reduced numbers of attributes for the other classifiers were
determined as follows: IoT classifier - 11; State classifiers: Amazon Echo-6, Belkin
switch-8, Dropcam-5, and LiFX-11.
Attribute cost
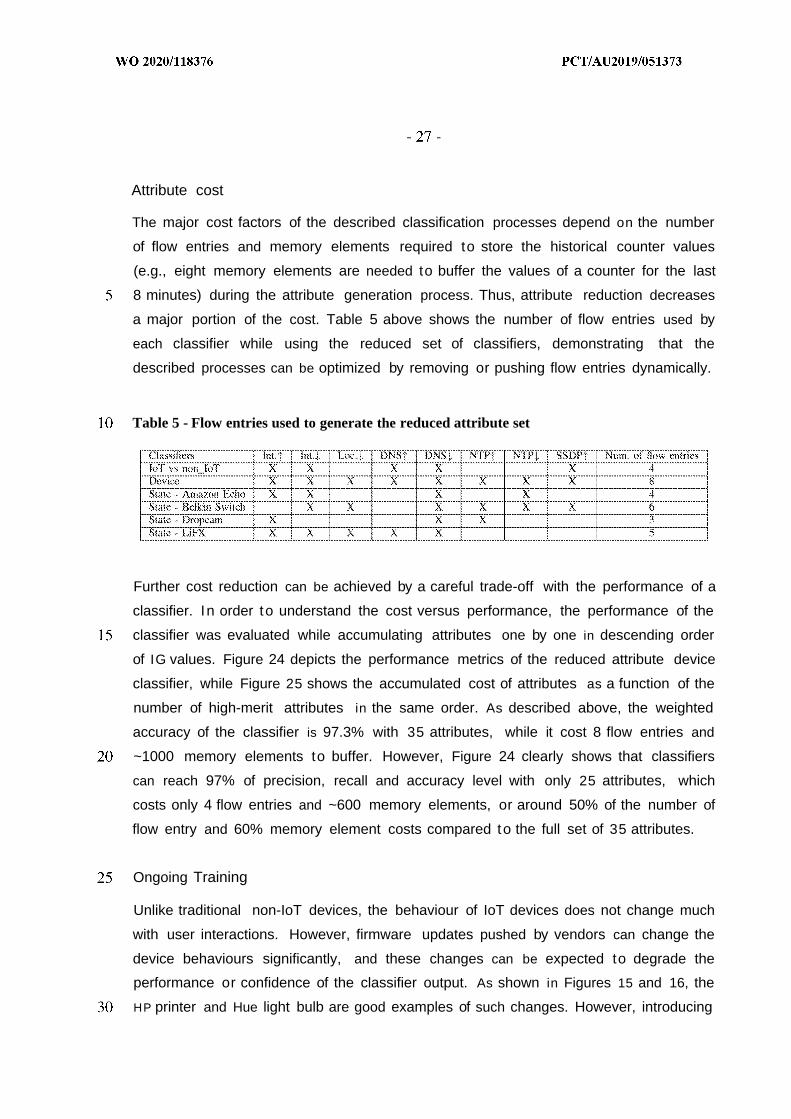
The major cost factors of the described classification processes depend on the number
of flow entries and memory elements required to store the historical counter values
(e.g., eight memory elements are needed to buffer the values of a counter for the last
8 minutes) during the attribute generation process. Thus, attribute reduction decreases
a major portion of the cost. Table 5 above shows the number of flow entries used by
each classifier while using the reduced set of classifiers, demonstrating that the
described processes can be optimized by removing or pushing flow entries dynamically.
Table 5 - Flow entries used to generate the reduced attribute set
Further cost reduction can be achieved by a careful trade-off with the performance of a
classifier. In order to understand the cost versus performance, the performance of the
classifier was evaluated while accumulating attributes one by one in descending order
of IG values. Figure 24 depicts the performance metrics of the reduced attribute device
classifier, while Figure 25 shows the accumulated cost of attributes as a function of the
number of high-merit attributes in the same order. As described above, the weighted
accuracy of the classifier is 97.3% with 35 attributes, while it cost 8 flow entries and
~1000 memory elements to buffer. However, Figure 24 clearly shows that classifiers
can reach 97% of precision, recall and accuracy level with only 25 attributes, which
costs only 4 flow entries and ~600 memory elements, or around 50% of the number of
flow entry and 60% memory element costs compared to the full set of 35 attributes.
Ongoing Training
Unlike traditional non-IoT devices, the behaviour of IoT devices does not change much
with user interactions. However, firmware updates pushed by vendors can change the
device behaviours significantly, and these changes can be expected to degrade the
performance or confidence of the classifier output. As shown in Figures 15 and 16, the
HP printer and Hue light bulb are good examples of such changes. However, introducing

the changed behaviour of IoT devices to classifiers through an augmented training set
can restore performance and confidence levels.
Accordingly, the deployment of a classifier model is not a one-time exercise, but rather
a continuous or ongoing process. It is good practice to monitor the traffic of each IoT
device and retrain the classifier models when the traffic pattern of a device deviates
significantly from the original pattern. If observing the traffic to detect such changes is
considered to put high overheads on the apparatus, this can be mitigated by
continuously collecting sparsely sampled traffic data from network devices and
retraining the models periodically (e.g., monthly).
The IoT device classification process and apparatus described above address difficulties
of the prior art by providing a scalable solution to identify IoT devices in a network, the
type of each device (including manufacturer and model), and the operating state of each
IoT device with more than 90% accuracy. This allows network operator and
administrators to accurately identify the IoT devices in their networks, and to detect
changes in the behaviour of these devices, which may be indicative of a security breach,
for example.
However, a disadvantage of the embodiments described above is that the scalability of
the apparatus and process are limited by the need to regenerate the entire multi-class
classifier model when a new device type is added to the network or the behaviour of
even one of the previously classified device types legitimately changes due to a firmware
upgrade by the device manufacturer.
Moreover, to reduce the impact of over-fitting the trained multi-class model to specific
classes, it is necessary to carefully balance the training dataset by representing classes
equally, which is a nontrivial task. IoT devices with richer features and diverse
functionalities require more instances to capture their normal behaviour than other
types of IoT devices.
In order to address these difficulties, alternative embodiments of the present invention
replace the multi-class (IoT device type) classifier with an 'inference engine' having a
set of one-class clustering models (one model per IoT device), each of which can be
independently trained and updated when required.
These two approaches are fundamentally different in their way of modeling: one-class
models are generative (each learns the distribution of its class), whereas multi-class
models are discriminative (they learn the decision boundaries between different
classes). As a result, one-class models become sensitive to changes in any attribute,
whereas multi-class models become sensitive to changes in discriminative attributes
only.
To demonstrate the basis for the alternative IoT device type one-class classification
process, the first network traffic trace dataset described above was used as a
representative dataset, specifically the eight flows described above and shown in Table
1 for each IoT device. As with the other embodiments described above, per-flow packet
and byte counts were generated every minute (as they would be retrieved from the
network switches 102 in a live network environment), and flow attributes/features were
generated for time-granularities of 1-, 2-, 4-, and 8-minutes, providing eight attributes
for each flow and a total of 8 x 8 = 64 attributes per IoT device.
I n order t o synthesize flow entries and thereby extract attributes from the traffic traces,
the native packet-level parsing tool described above was again used to process the raw
PCAP files as input, generates a table of flows (like an SDN switch), and export
byte/packet counters of each flow at a configurable resolution (60 sec in the described
embodiment and example). For each specific IoT device, a corresponding stream of
instances (a vector of attributes periodically generated every minute) was then
generated from the byte and packet counts.
A month of data from the first network trace dataset (i.e., corresponding to the period
from Ol-Oct-2016 to 31-Oct-2016) was used for training, and data from the following
2 week period was used for evaluating the generated models. The second column in
Table 10 below summarizes the number of training /testing instances per each device
type contained in this part of the dataset.
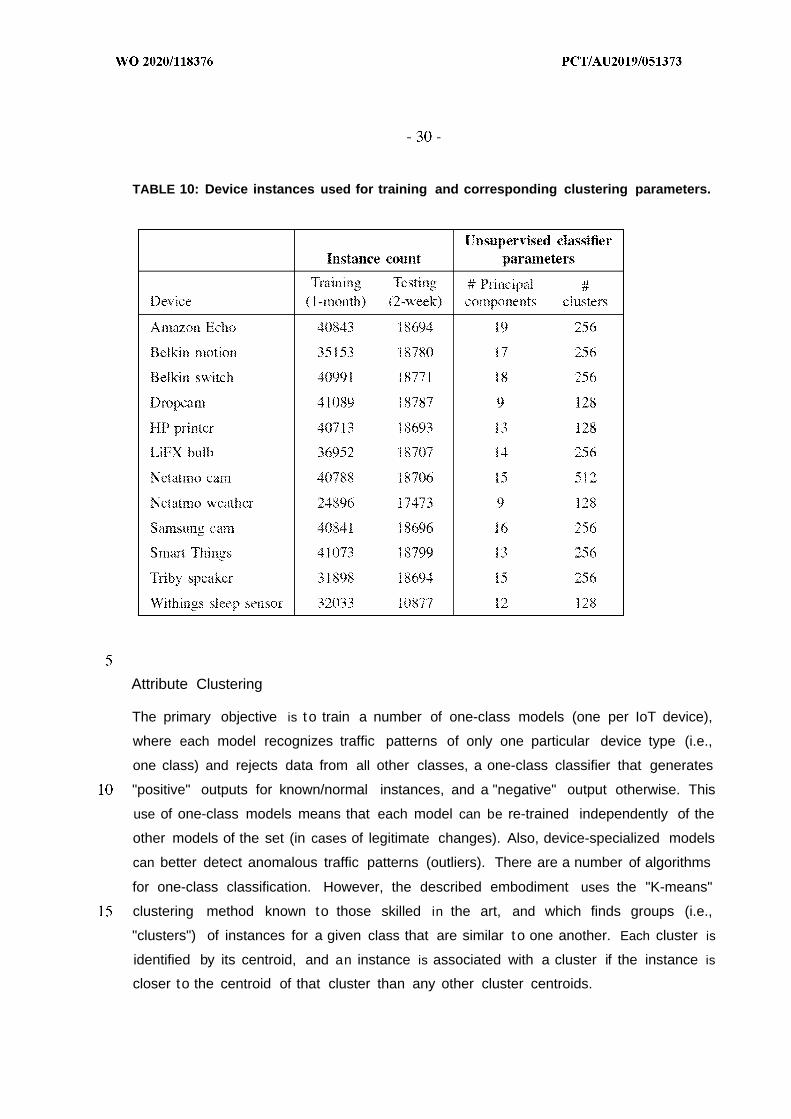
TABLE 10: Device instances used for training and corresponding clustering parameters.
Attribute Clustering
The primary objective is t o train a number of one-class models (one per IoT device),
where each model recognizes traffic patterns of only one particular device type (i.e.,
one class) and rejects data from all other classes, a one-class classifier that generates
"positive" outputs for known/normal instances, and a "negative" output otherwise. This
use of one-class models means that each model can be re-trained independently of the
other models of the set (in cases of legitimate changes). Also, device-specialized models
can better detect anomalous traffic patterns (outliers). There are a number of algorithms
for one-class classification. However, the described embodiment uses the "K-means"
clustering method known to those skilled in the art, and which finds groups (i.e.,
"clusters") of instances for a given class that are similar to one another. Each cluster is
identified by its centroid, and an instance is associated with a cluster if the instance is
closer to the centroid of that cluster than any other cluster centroids.

To provide insights into the traffic characteristics of IoT devices, Figures 30(a), (b) and
(c) show the resulting clusters of instances for three representative devices,
respectively, from the dataset: namely, the Amazon Echo, Belkin switch, and LiFX bulb.
Note that the instances are multi-dimensional (each instance including 64 attributes),
and thus cannot be easily visualized. Accordingly, for illustration purposes only, Principal
Component Analysis (PCA) was used t o project the data instances onto two-dimensions.
In Figure 30, data instances are represented as dots, and cluster centroids are
represented as crosses. Only 10% of instances in each cluster are shown for better
visualization; for example, four dots in cluster A 1 of the Amazon Echo device, shown in
Figure 30 (a), represent approximately 40 instances.
Dotted circles depict the boundary of clusters. These boundaries are used to determine
whether a test instance belongs to the clusters of a class. I n the described embodiment,
a boundary for each cluster is chosen t o exclude data points whose distance from the
centroid is relatively large, specifically values more than 1.5 times the interquartile
range from the third quartile. In other words, the boundary for each cluster is defined
to include the first 97.5% of data points closest to the cluster center, and to exclude
farther instances.
It is important to note that an actual cluster forms a contour (enclosing associated data
points) which could be a complex shape. In practice, the inventors have found that each
model for a corresponding IoT device consists of some tens of clusters, and
consequently to make the IoT device type classification process computationally cost-
effective and more efficient, the shapes of the cluster contours are approximated. Noting
also that the K-Means method attempts to partition the training dataset into spherical
clusters when it is tuned optimally (i.e., equal distance from centroids in all dimensions),
in the described embodiment the cluster boundaries are approximated as being
spherical for the purpose of determining whether a test instance belongs to the clusters
of a class.
As shown in Figure 30, instances of the Amazon Echo, Belkin switch, and LiFX bulb IoT
devices are grouped into 16, 4, and 8 clusters, respectively. Figure 1(a) shows that
instance clusters of the Amazon Echo are fairly spread across the two component space.
For the Belkin switch device, the clusters in Figure 1(b) are mainly spread across the
principal component-1 while their principal-component-2 values are narrowly confined

between —20 and 20. Lastly, the LiFX bulb instances in Figure 1(c) are spread along
the principal-component-2, but are narrowly confined between —20 and 20 in principal-
component-1. Each cluster of a class has a probability (referred to as "cluster
likelihood") of covering training instances from the corresponding device type,
depending upon device traffic patterns seen in the training dataset. As annotated in
Figure 30, highly probable clusters for the Amazon Echo are A2 (25: 1%) and A3
(22:2%), for the Belkin switch are B1 (77:4%) and B2 (19:7%), and for the LiFX bulb
are Cl (38:8%) and C2 (20:0%). These clusters highlight the dominant traffic
characteristics of their corresponding device.
The distribution of instances within each cluster also varies across clusters. Figures 3 1
(a), (b) and (c) show zoomed views of one cluster for each of the three representative
IoT devices, with instances shown by dots. Each cluster is divided into 10 concentric
annular bands of the same area, starting from the centroid to the cluster boundary.
Each band in Figure 3 1 is shown with a shading that indicates the fraction of training
instances it covers, as indicated by the linear scale at the right-hand side of each Figure.
It can be seen in Figure 3 1 (a) that 95% of LiFX instances inside cluster C3 fall within
the four central bands of this cluster. Regarding the Belkin switch in Figure 31(b), 81%
of instances of cluster B3 fall within the middle bands (from the 4th to the 8t h bands).
Lastly, looking at a less probable cluster A 1 of the Amazon Echo in Figure 31(c), 85%
of instances are covered by the last five bands farthest from the centroid.
Unsupervised Classification Of IoT Device Attributes
This section describes the architecture of the inference engine, which consists of a set
of one-class models for individual device types. Next, methods to resolve conflicts
between multiple models for device classification are described. Finally, a scoring
technique is introduced to measure the consistency of the models in classifying IoT
devices , using two monitoring phases namely initial and stable, and detect behavioural
changes.

Clustering Models: Generation, Tuning, and Testing
Prior to generating clustering models, the raw data is pre-processed as follows. First,
each attribute is normalized independently to avoid outweighing large-value attributes
(e.g., average bytes rate of incoming remote traffic at 8-min timescale) over smaller
attributes (e.g., average packet size of outgoing NTP traffic at 1-min timescale) as the
magnitudes of different attributes varies significantly (over several orders of
magnitude). In the described embodiments, the Z-score method known to those skilled
in the art (i.e., computing the mean µ and standard deviation ofrom the training dataset
and normalising by calculating the deviation from the mean divided by the standard
deviation) is used to scale individual attributes. Second, data instances are projected
onto a lower dimensional space by using PCA to generate linearly uncorrelated principal
components. This is because the direct use of 64-dimensional attribute instances for
classification can be computationally expensive for real-time prediction, and can also
degrade the clustering performance (possibly causing bias towards less significant
attributes). The use of orthogonal principal components enables the K-means clustering
to generate clusters more clearly by removing redundant and noisy attributes from the
training dataset. In the described embodiments, PCA was used to determine the number
of principal components to retain the optimum "cumulative variance".
Following dimension reduction, K-means clustering is applied, with K values varying as
powers-of-2 (i.e., 2 ' where / = 1,..., 10). Setting K to small values would not generate
an accurate model of network behavior for IoT devices, and large values increase the
computational cost in both training and testing phases. Also, a very large K results in
smaller-size clusters, and hence a rigid classifier which cannot correctly detect normal
(legitimate) instances with small deviations from the training data - i.e., over-fitting.
The optimal number of clusters is determined using the elbow method described in D.
Ketchen et al., "The Application of Cluster Analysis in Strategic Management Research:
An Analysis and Critique," Strategic Management Journal, vol. 17, no. 6, pp. 441-458,
1996.
Figure 32 is a graph showing the average square distance of instances from the cluster
centers (i.e., Inertia per instance) as a function of the number of clusters for each of
two representative device types. The optimal number of clusters (marked by 'x' on each
curve) is deemed to be when the first derivative of inertia per instance exceeds a very
small negative value -0.01 (the curve is becoming flat). It can be seen that the model

for the Amazon Echo device needs 256 clusters for optimal performance, whereas the
Dropcam device needs only 128 clusters. The rightmost column of Table 10 shows the
optimal model parameters for individual device types, determined as described above.
Having generated the clustering models, each instance of IoT traffic attributes (after
scaling and dimension reduction) is processed as shown by the sequence of steps in
Figure 33. The test instance is provided to all of the device-specific (once-class) models
to determine the nearest centroid of each model, using the Euclidean distance between
the test instance and each cluster centroid. Given a nearest centroid, the instance is
checked against the corresponding cluster to determine whether it falls inside or outside
of that cluster's boundary, and if inside, a confidence level is calculated.
To better illustrate this process, consider the two-dimensional space of clusters
described above with reference to Figure 30. Assume that a test instance has its
principal component-1 and component-2 equal to 0 and 20, respectively. The nearest
cluster centroids to this test instance are of cluster A 1 of the Amazon Echo, cluster B2
of the Belkin switch, and C4 of cluster of the LiFX bulb. Since the test instance falls
outside of the A 1 boundary, the Amazon Echo model provides a negative output, while
the other two models both give positive outputs. In such cases where multiple models
provide positive outputs for the same instance, a conflict resolution process is used to
select the "winner" model.
Conflict Resolution
Although each model learns the normal behavior of one device type, different devices
can display somewhat similar traffic behaviour (e.g., DNS, NTP or SSDP) for a short
period of time, which can result in multiple positive outputs generated by the clustering
models for an instance. In such cases, "confidence" values are generated for the models
that gave positive outputs, and the model with the highest confidence value is selected
as the winner.
Each "confidence" value (also referred to herein as "associate probability") represents
a probability value for an instance to be associated with a cluster of that model. Given
an instance Ins receiving a positive output from a model M/ and falling within a distance
band D/ of the nearest cluster Cj (of the model Mi), the corresponding associate
probability is estimated by:
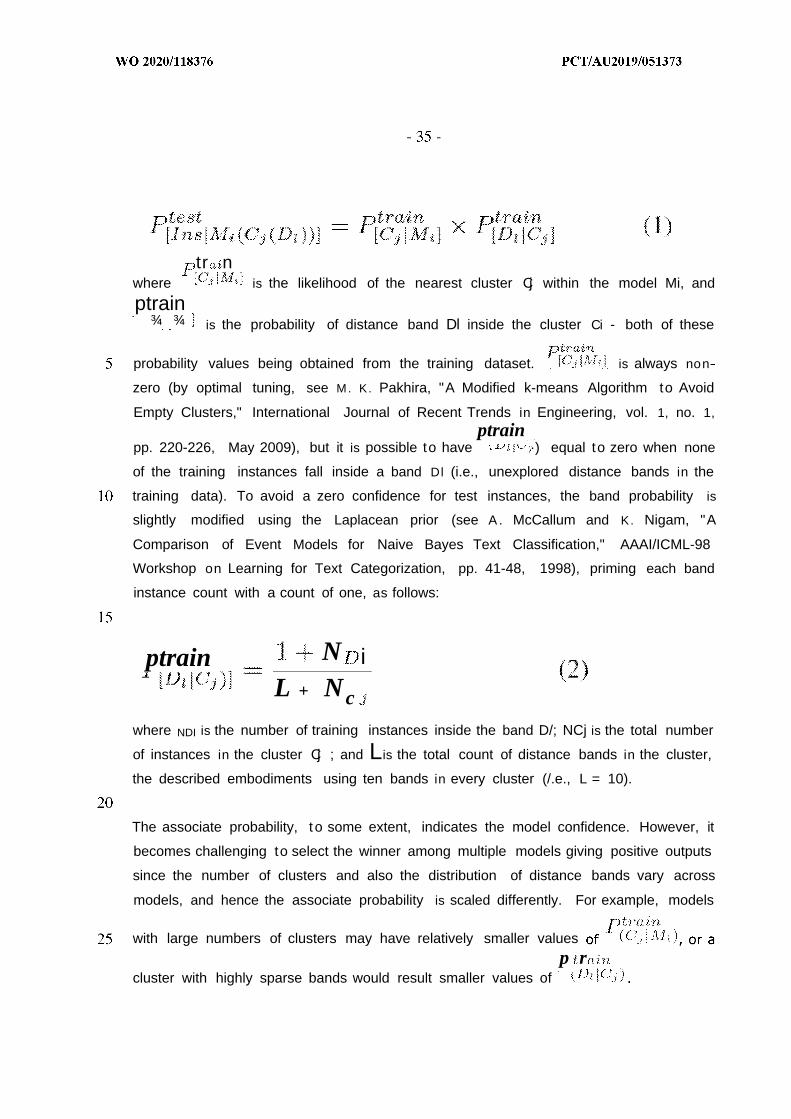
tr nwhere is the likelihood of the nearest cluster Cj within the model Mi, and
ptrain¾ ¾ is the probability of distance band Dl inside the cluster Ci - both of these
probability values being obtained from the training dataset. is always non
zero (by optimal tuning, see M. K. Pakhira, "A Modified k-means Algorithm to Avoid
Empty Clusters," International Journal of Recent Trends in Engineering, vol. 1, no. 1,
ptrainpp. 220-226, May 2009), but it is possible to have ·) equal to zero when none
of the training instances fall inside a band Dl (i.e., unexplored distance bands in the
training data). To avoid a zero confidence for test instances, the band probability is
slightly modified using the Laplacean prior (see A. McCallum and K. Nigam, "A
Comparison of Event Models for Naive Bayes Text Classification," AAAI/ICML-98
Workshop on Learning for Text Categorization, pp. 41-48, 1998), priming each band
instance count with a count of one, as follows:
ptrain N iL + Nc
where NDI is the number of training instances inside the band D/; NCj is the total number
of instances in the cluster Cj ; and Lis the total count of distance bands in the cluster,
the described embodiments using ten bands in every cluster (/.e., L = 10).
The associate probability, t o some extent, indicates the model confidence. However, it
becomes challenging to select the winner among multiple models giving positive outputs
since the number of clusters and also the distribution of distance bands vary across
models, and hence the associate probability is scaled differently. For example, models
with large numbers of clusters may have relatively smaller values
p rcluster with highly sparse bands would result smaller values of
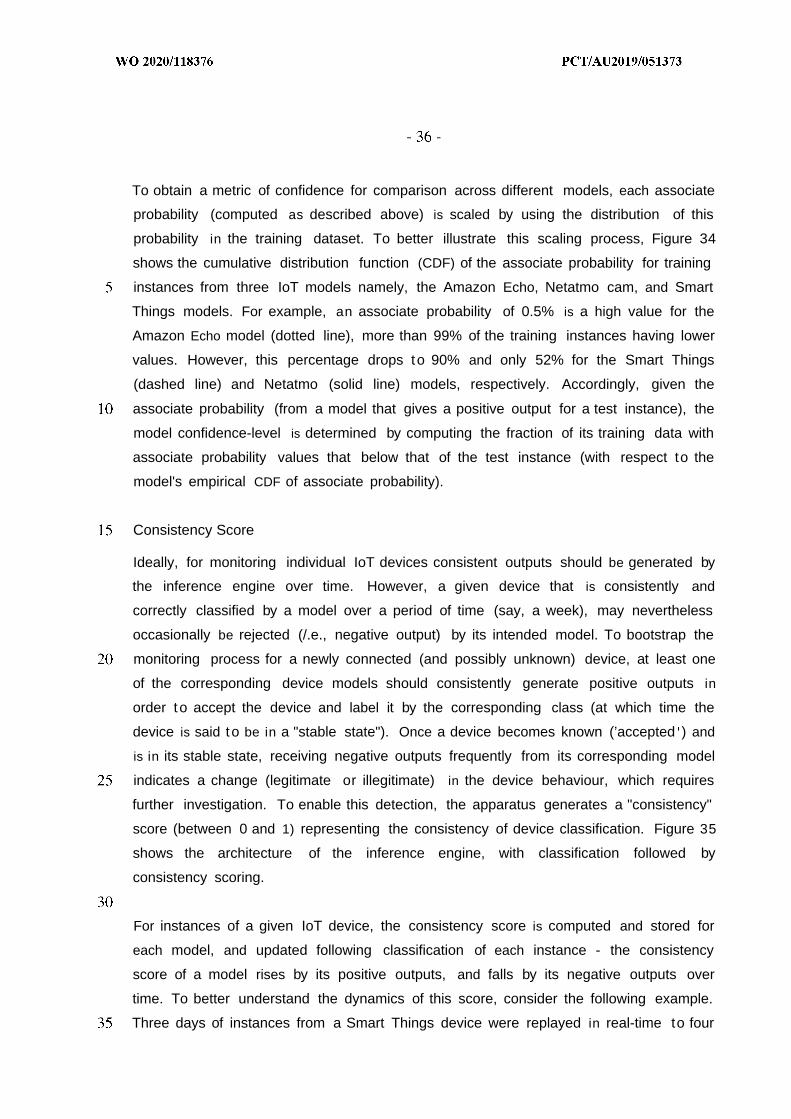
To obtain a metric of confidence for comparison across different models, each associate
probability (computed as described above) is scaled by using the distribution of this
probability in the training dataset. To better illustrate this scaling process, Figure 34
shows the cumulative distribution function (CDF) of the associate probability for training
instances from three IoT models namely, the Amazon Echo, Netatmo cam, and Smart
Things models. For example, an associate probability of 0.5% is a high value for the
Amazon Echo model (dotted line), more than 99% of the training instances having lower
values. However, this percentage drops to 90% and only 52% for the Smart Things
(dashed line) and Netatmo (solid line) models, respectively. Accordingly, given the
associate probability (from a model that gives a positive output for a test instance), the
model confidence-level is determined by computing the fraction of its training data with
associate probability values that below that of the test instance (with respect to the
model's empirical CDF of associate probability).
Consistency Score
Ideally, for monitoring individual IoT devices consistent outputs should be generated by
the inference engine over time. However, a given device that is consistently and
correctly classified by a model over a period of time (say, a week), may nevertheless
occasionally be rejected (/.e., negative output) by its intended model. To bootstrap the
monitoring process for a newly connected (and possibly unknown) device, at least one
of the corresponding device models should consistently generate positive outputs in
order to accept the device and label it by the corresponding class (at which time the
device is said t o be in a "stable state"). Once a device becomes known (’accepted ) and
is in its stable state, receiving negative outputs frequently from its corresponding model
indicates a change (legitimate or illegitimate) in the device behaviour, which requires
further investigation. To enable this detection, the apparatus generates a "consistency"
score (between 0 and 1) representing the consistency of device classification. Figure 35
shows the architecture of the inference engine, with classification followed by
consistency scoring.
For instances of a given IoT device, the consistency score is computed and stored for
each model, and updated following classification of each instance - the consistency
score of a model rises by its positive outputs, and falls by its negative outputs over
time. To better understand the dynamics of this score, consider the following example.
Three days of instances from a Smart Things device were replayed in real-time to four

trained models respectively for the Smart Things, Netatmo, Amazon Echo, and Withing
Sleep sensor IoT devices. Figure 36 is a graph of the resulting consistency scores of
these four models over time. As expected, the score of the Smart Things model (shown
by solid lines) is dominant, while the scores for the other three models are negligible
(and hence not apparent in the Figure). The Smart Things model score slowly rises and
reaches a high level of 0.8 after about 30 hours. It is also observed that sometimes the
score of the intended model, as in this example, falls slightly and then rises again
because some instances display patterns closer to other models. The inset in Figure 36
is a magnified view of the gray band region (corresponding to Nov 4, 11pm - Nov 5,
2am) which shows the scores of the other models. It is observed that once any other
model gives a positive output, its score quickly spikes, but soon after drops back to zero
(shown by dotted lines for the Netatmo cam device) as the intended model Smart Things
wins again.
The consistency score is updated with two rates: rising on positive outputs at rate Ar,
and falling on negative outputs at rate Af - these rates being configurable by network
operators. To update the consistency score, a sigmoid function is used in the described
embodiment because its exhibits soft start and end, and is bounded within 0 and 1.
Specifically, a raw score represented by sequence {St} beginning at time t = 0, is
dynamically updated according to:
where, St-i is the previous value of the estimated score, and A is set dynamically,
depending on the latest output of the model (/.e., Ar > 0 for a positive output, and Af <
0 for a negative output). Network operators can set their Ar and Af values based on their
preferred policy in terms of how quickly (or slowly) they want the score to rise and fall.
Depending upon the time expected T to reach to "target score" S* (between 0 and 1)
from the mid-level score 0.50, the value A is given by:

The described embodiment takes a conservative approach whereby the consistency
score rises at slower rate than it falls. The same values are used for all models, and are
configured in such a way that it will take 12 hours to reach a very high score of 0.99
from a score of 0.50 (Ar = 0:0064) in case of successive positive outputs from the
model, whereas it needs only 1.5 hours to reach a very small score of 0.01 from a score
of 0.50 (Af = -0:0511) in case of successive negative outputs. Figure 37 shows two
sample curves of consistency score using these A values, each monotonically rising and
falling on successive positive and negative outputs, respectively. Both curves saturate
(reaching the ultimate values of 0 and 1) in infinite time, and change very slowly beyond
certain levels, i.e., above 0:99 for the rising curve, and below 0:01 for the falling curve.
In other words, entering into these regimes can stifle the agility of real-time monitoring
(especially for detecting attacks in real-time).
For example, it will take at least 45 minutes to fall from 0.999 to 0.99 (half the time
needed to fall from 0.99 to 0.50). Similarly, it takes 6 hours to rise from 0.001 to 0.01.
Therefore, the scores are capped at 0.99 and 0.01 as the saturation (minimum and
maximum) levels, and also each score is initialized at S O = 0:01.
Monitoring Phases
For monitoring the behavior of each IoT device, two phases are considered : (1) the
initial phase, and (2) the stable phase. The initial phase begins when a device connects
to the network for the first time (discovery), and can therefore be considered to be
'unlabelled'. During this phase, the inference engine (shown in Figure 35) aims to
determine the IoT device type (classification) by asking all of the existing models. To
achieve this aim, every instance of the device traffic is fed to all models in real-time,
and their outputs are obtained. If multiple models give a positive output, then the
conflict resolution process described above is applied to select one of those models as
a winner. During the initial phase, the consistency score of all winner models for a device
is tracked until the consistency score of one of these winner models reaches an
acceptable level (i.e., a threshold value chosen by the network operator, say 0.90) at
which time the device type is deemed to be verified. At this point the device is labeled
as the corresponding known class {i.e., device type), its intended model is determined,
and its state changes from the initial phase to the stable phase. I n the stable phase,
the inference engine uses only the intended model to monitor the real-time behavior of
the (labelled) device. However, as described below, the consistency score of the
intended model is used to detect changes in behaviour of that device.
Performance Evaluation
The efficacy of the inference engine was evaluated as described below. First, the
performance of one-class models and conflict resolution in selecting an intended model
for a given device during its initial phase of monitoring was evaluated. Once the device
type is classified (with a sufficiently high level of consistency), we next demonstrate
behavioral changes using temporal consistency score of the intended model during its
stable phase of monitoring. Finally, we show the efficacy of our inference engine. We
also compare our one-class classification with a multi-class classification method.
Device Classification
The performance of device classification was evaluated using a subset of the test
instances from the first dataset, corresponding to only two weeks from l-Nov-2016 to
14-Nov-2016. Figures 38 9a) and (b) show the resulting confusion matrix of device type
classification respectively before and after resolving conflicts as described above. Every
clustering model (listed in rows) is presented by test instances of IoT devices (listed in
columns). For a given cell of the matrix, the value of that cell indicates the percentage
of instances (from the device in corresponding column) that receive a positive output
from the model in the corresponding row.
Starting from the raw outputs of Figure 38(a), it can be seen that all models correctly
detect the majority of instances from their own class as shown by the diagonal elements
of the confusion matrix - except for the Triby speaker with only 88.9%, the others
display more than 93.5% of correct detection (i.e., true positives). However, models
also incorrectly detect device instances from other classes (i.e., false positives), as
shown by the non-diagonal elements of the confusion matrix. For example, the models
for the Amazon Echo and Belkin motion devices incorrectly give a positive output for
99.8% and 98.9% of instances of the HP printer. Considering the raw outputs of the
various models, 70% of test instances were detected by more than one model (in

addition to their expected model), and 2% of test instances were not detected by any
of the models. The winner model for each test instance was selected using the model
confidence-levels.
Figure 38(b) shows the same confusion map but after the conflict resolution process.
Comparison with Figure 38(a) clearly demonstrates a significant enhancement in
performance of IoT device type classification by selecting the model with the highest
confidence. Note that the average false positive rate has reduced to less than 0.4%
while the average true positive rate is 93.9%.
It was also observed that the conflict resolver slightly reduced the rate of true positives
for almost all models. The Smart Things device is impacted more compared to other
models by experiencing a drop from 96.9% to 88.9% in its true positive rate, largely
because the Netatmo camera model gives positive output with high confidence for 8.3%
of Smart Things instances. Focusing on the model for the Netatmo camera, it was found
that its clusters overlap with a number of clusters of several other IoT devices, including
the Belkin switch, I2FX, Smart things, and Triby speaker devices, and hence resulting in
false positives. This is mainly due to the aperiodic behavior of the Netatmo camera,
which is event-triggered : the camera transmits video to its cloud server whenever it
recognizes a human face or detects a motion. As a result, it displays a wider range of
activity patterns over longer time scales, overlapping with the traffic patterns of other
devices. For example, the average byte rate of incoming NTP traffic of Netatmo camera
over an 8-min timescale can take a value anywhere from 0 to 700 bytes-per-min. Such
a wide range overlaps with the value range of the same attribute for the LiFX bulb
(varying between 8 - 12 bytes-per-min) and the Smart Things device (varying between
15 - 25 bytes-per-min).
Detecting Behavioral Change
Once an IoT device has been classified as a particular type of IoT device, its activity is
monitored in real-time. The models can be used t o highlight behavioral changes by
tracking dynamics of their consistency scores. To demonstrate this, a longer portion of
the first dataset spanning dates from 01-Nov-2016 to 31-Mar-2017 was used.

Figure 39 (a) is a graph of the consistency score generated by the inference engine for
traffic instances of the Belkin switch device over a period between Nov 1, 2016 and Jan
28, 2017. The score ramps up to 99% within the first 48 hours before the device goes
offline for a day, as shown by the dashed line, and then comes back online on Nov 4 .
After that, device instances are consistently detected by the intended model, and hence
the consistency score remains high with only minor changes over this extended period.
Figure 39 (b) illustrates a scenario where a consistency score drops for a relatively short
period of time (due to a temporary change of behavior in traffic of a Triby speaker
device), and then rises afterwards. Manual inspection of packet traces corresponding to
these temporary drops of the score revealed that a remote SIP server
(sip.invoxia.com), with which Triby speaker keeps a continuous TCP connection, was
responding with ACK/RST packets during those periods, as highlighted by red rows in
the wireshark screenshot of Figure 41, indicating that the expected SIP service was not
operational. Other services for the Triby speaker were functioning normally.
The behavior of a device can also change permanently due to a firmware upgrade. Figure
40 (a) illustrates this scenario for a Dropcam device. The consistency score of the
Dropcam model remains high throughout Nov 2016 until Dec 5, 2016, when the device
goes off-line, as shown by the dotted line. A couple of slight drops are observed on Nov
15 and Nov 22, but are restored fairly quickly (infrequent mis-classification is not
surprising due to minor overlaps between clusters of various models). However, once
the Dropcam device comes back online on Dec 25, the score drops steeply to its lowest
possible value of 0.01, and stays at that level during the whole of January. The score
sometimes jumps up to 0.20 or even 0.30, but quickly drops back to its minimum value.
The corresponding packet traces of the Dropcam device were manually inspected, and
its behavior was found to have permanently changed. Dropcam network activity is
dominated by a single TLS connection which the device establishes with its cloud server
(nexus-usl.dropcam.com), typically sending packets of size 156 bytes and receiving
packets of size 66 bytes. Manual inspection revealed that the rate of packets for this
flow changed in both directions (while packet sizes remained unchanged), resulting in
a decrease of upstream bitrate from 1896 bps to 1120 bps and a decrease of
downstream bitrate from 584 bps to 424 bps. Firmware upgrades of the Dropcam device
are performed automatically when it reboots. Once the firmware upgrade of the device
was confirmed, the Dropcam model was retrained using an additional 2-weeks of data
(between Dec 25, 2016 and Jan 07, 2017) following the firmware upgrade. Adding new

instances to the training dataset resulted in an increase in the number of PCA
components (from 9 to 11) for the Dropcam device, while the number of clusters
remained the same. Figure 40 (b) shows how the consistency score returns back to its
perfect level after augmenting the Dropcam model with attributes of the upgraded
firmware - the score is shown by dashed a gray line during the two week re-training
period.
Many modifications will be apparent to those skilled in the art without departing from
the scope of the present invention.

CLAIMS:
1. A network device classification process, including:
monitoring network traffic of networked devices in a communications network to
generate device behaviour data representing network traffic behaviours of
the networked devices at different time granularities;
processing the device behaviour data to classify a plurality of the networked
devices as IoT devices, and others of the networked devices as non-IoT
devices;
accessing IoT device type data representing predetermined network traffic
characteristics of respective known IoT device types;
processing the device behaviour data of the IoT devices and the IoT device type
data to classify each of the IoT devices as being a corresponding one of the
plurality of known IoT device types; and
for each of the IoT devices classified as a corresponding known IoT device type,
classifying the IoT device as being in a corresponding operating state based
on network traffic behaviours of the IoT device at different time granularities.
2 . The network device classification process of claim 1, wherein the device behaviour
data includes network flow attributes generated from packet and byte counts of
upstream and downstream flows at different time granularities.
3 . The network device classification process of claim 2, wherein the processing includes
identifying correlations between the generated attributes, selecting a subset of the
attributes based on the correlations, and using the selected subset of attributes to
classify the networked devices.
4 . The network device classification process of any one of claims 1 to 3, wherein the
different time granularities are substantially in the form of a geometric series.
5 . The network device classification process of any one of claims 1 to 4, wherein the
different time granularities include at least four different time granularities.
6 . The network device classification process of any one of claims 1 to 5, wherein the
device behaviour data includes network traffic attributes of the networked devices
at a first set of different time granularities, and each IoT device is classified as being
in a corresponding operating state based on network flow attributes of the IoT device
at a second set of different time granularities different to the first set of different
time granularities.
7 . The network device classification process of claim 6, wherein the second set of
different time granularities is a subset of the first set of different time granularities.
8 . The network device classification process of any one of claims 1 to 7, including
generating an alert when a classification of a networked device other than operating
state is different to a previous corresponding classification of the networked device.
9 . The network device classification process of any one of claims 1 to 8, including
retraining one or more classifiers used to classify the networked devices to account
for changes in network behaviours of the networked devices over time.
10. The network device classification process of any one of claims 1 to 9, wherein the
IoT devices are classified as known IoT device types by a multi-class classifier.
11. The network device classification process of any one of claims 1 to 9, wherein the
IoT devices are classified as known IoT device types by respective one-class
classifiers.
12. The network device classification process of claim 11, including generating, for each
of the one-class classifiers, a confidence score indicative of the classification
confidence of the one-class classifier when classifying an IoT device as belonging to
a cluster of the classifier, and in the event that two or more of the one-class
classifiers generate respective outputs indicative of the IoT device as being
successfully classified by those one-class classifiers, selecting, on the basis of the
respective confidence scores, only one of those one-class classifiers to classify the
IoT device.

13. The network device classification process of claim 12, wherein the confidence score
is generated according to:
ptrainwhere is a likelihood of the nearest cluster Cj within the corresponding
1ptrain
model Mi, and is a probability of an annular or circular distance band DI
inside the cluster Ci.
14. The network device classification process of claim 12 or 13, including generating
consistency scores representing measures of the classification consistencies of the
one-class classifiers over time, and labelling an unlabelled IoT device as being a
corresponding known IoT device type when the consistency score of the
corresponding one-class classifier satisfies a threshold consistency score.
15. The network device classification process of claim 14, including updating the
consistency score for each one-class classifier over time to generate an updated
value St from the previous value St-i, according to:
where T is a time to reach a target score S* (between 0 and 1) from a mid-level score
of 0.50.
16. The network device classification process of any one of claims 1 to 15, wherein the
device behaviour data represents network traffic behaviours of each networked
device as successive instances of a set of network traffic attributes for each of a
plurality of flows of the networked device, the network traffic attributes for each flow
being generated from byte counts and packet counts of the flow for different time
granularities.
17. The network device classification process of any one of claims 1 to 16, wherein the
network traffic behaviours of each of the networked devices include packet and byte
counts of network flows of the device at different time granularities, the network
flows being:
(i) upstream and downstream DNS flows;
(ii) upstream and downstream NTP flows;
(iii) downstream SSDP flows;
(iv) upstream and downstream remote network flows; and
(v) upstream local network flows.
18. A network device classification apparatus configured to execute the process of any
one of claims 1 to 17.
19. At least one computer-readable storage medium having stored thereon executable
instructions and/or FPGA configuration data that, when the instructions are executed
by at least one processor and/or when an FPGA is configured in accordance with the
FPGA configuration data, cause the at least one processor and/or the FPGA t o
execute the device classification process of any one of claims 1 to 17.
20. A network device classification apparatus, including:
a flow metric generator to generate device behaviour data representing network
traffic behaviours of networked devices in a communications network at
different time granularities;
a first classifier component to process the device behaviour data to classify a
plurality of the networked devices as IoT devices, and others of the
networked devices as non-IoT devices;
a second classifier component to access IoT device type data representing
predetermined network traffic characteristics of respective known IoT device
types, and t o process the device behaviour data of the IoT devices and the

IoT device type data to classify each of the IoT devices as being a
corresponding one of the plurality of known IoT device types; and
a third classifier component to classify each of the IoT devices classified as a
corresponding known IoT device type as being in a corresponding operating
state based on network traffic behaviours of the IoT device at different time
granularities.
21. The network device classification apparatus of claim 20, wherein the network traffic
behaviours of the networked devices include packet and byte counts of upstream
and downstream flows at different time granularities.
22. The network device classification apparatus of any one of claims 20 or 21, including
a component to identify correlations between the behaviours, and select a subset of
the behaviours based on the correlations, wherein the classifiers use the selected
subset of behaviours to classify the networked devices.
23. The network device classification apparatus of any one of claims 20 to 22, wherein
the different time granularities are substantially in the form of a geometric series.
24. The network device classification apparatus of any one of claims 20 to 23, wherein
the different time granularities include at least four different time granularities.
25. The network device classification apparatus of any one of claims 20 to 24, wherein
the device behaviour data represents network traffic behaviours of the networked
devices at a first set of different time granularities, and each IoT device is classified
as being in a corresponding operating state based on network traffic behaviours of
the IoT device at a second set of different time granularities different to the first set
of different time granularities.
26. The network device classification apparatus of claim 25, wherein the second set of
different time granularities is a subset of the first set of different time granularities.
27. The network device classification apparatus of any one of claims 20 to 26, including
a device behaviour change detector to detect when a classification of a networked
device other than its operating state is different to a previous corresponding
classification of the networked device.

28. The network device classification apparatus of any one of claims 20 to 27, including
retraining one or more of the classifiers to account for changes in network
behaviours of the networked devices over time.
29. The network device classification apparatus of any one of claims 20 to 28, wherein
the second classifier component is a multi-class classifier.
30. The network device classification apparatus of any one of claims 20 to 28, wherein
the second classifier component includes a set of one-class classifiers for respective
known IoT device types.
31. The network device classification apparatus of claim 30, including one or more
confidence score generators configured to generate, for each of the one-class
classifiers, a corresponding confidence score indicative of the classification
confidence of the one-class classifier when classifying an IoT device as belonging to
a cluster of the corresponding model, and in the event that two or more of the one-
class classifiers generate respective outputs indicative of the IoT device as being
successfully classified by those one-class classifiers, selecting, on the basis of the
respective confidence scores, only one of those one-class classifiers to classify the
IoT device.
32. The network device classification apparatus of claim 31, wherein the confidence
score is generated according to:
ptrai n·
where - is a likelihood of the nearest cluster Cj within the corresponding
i r imodel Mi, and X 7 is a probability of an annular or circular distance band Dl
inside the cluster Ci.
33. The network device classification apparatus of claim 32 or 33, including a
consistency score generator configured to generate consistency scores representing
measures of the classification consistencies of the one-class classifiers over time,
wherein an unlabelled IoT device is labelled as a corresponding known IoT device
type when the consistency score of the corresponding one-class classifier satisfies a

threshold consistency score.
34. The network device classification apparatus of claim 33, wherein the consistency
score generator is configured to update the consistency score for each one-class
classifier over time to generate an updated value St from the previous value St-i,
according to:
r
where T is a time to reach a target score S* (between 0 and 1) from a mid-level score
of 0.50.
35. The network device classification apparatus of any one of claims 20 to 34, wherein
the device behaviour data represents network traffic behaviours of each networked
device as successive instances of a set of network traffic attributes for each of a
plurality of flows of the networked device, the network traffic attributes for each flow
including byte counts and packet counts of the flow for different time granularities.
36. The network device classification apparatus of claim 35, wherein each of the one-
class classifiers assigns an instance of the set of network traffic attributes to a cluster
37. The network device classification apparatus of any one of claims 20 to 36, wherein
the network traffic behaviours of each of the networked devices include packet and
byte counts of network flows of the device at different time granularities, the
network flows being:
(i) upstream and downstream DNS flows;
(ii) upstream and downstream NTP flows;
(iii) downstream SSDP flows;
(iv) upstream and downstream remote network flows; and
(v) upstream local network flows.


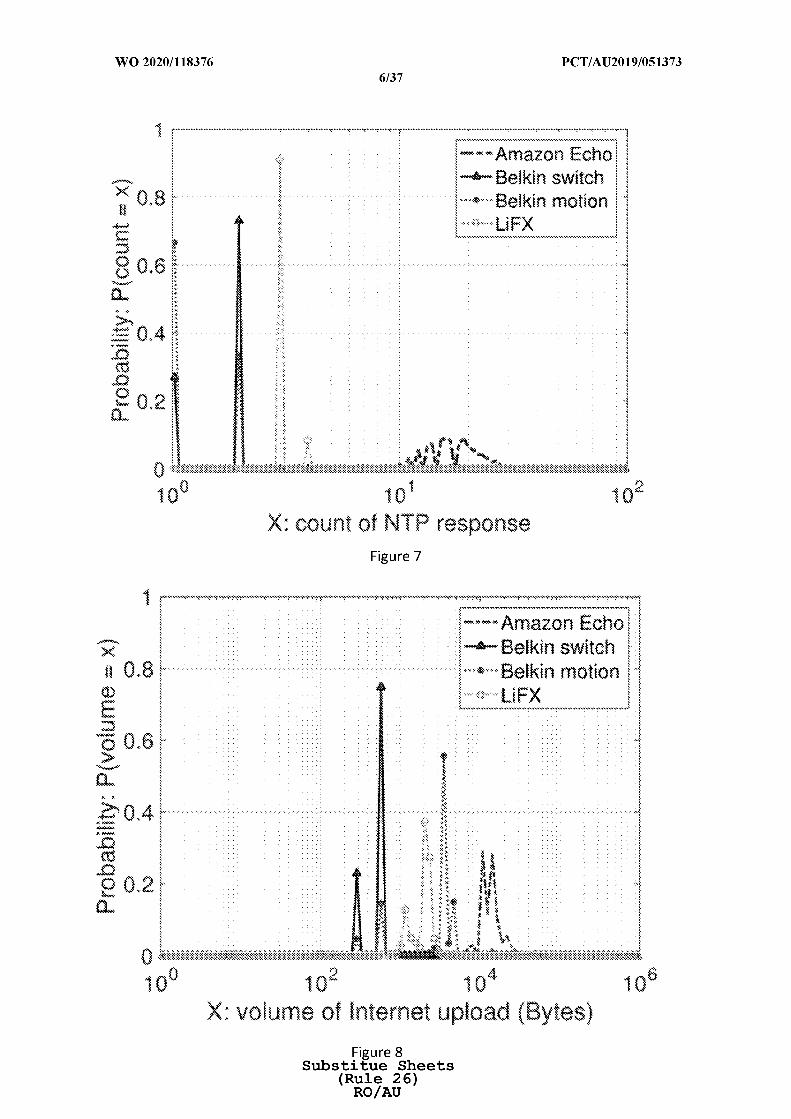


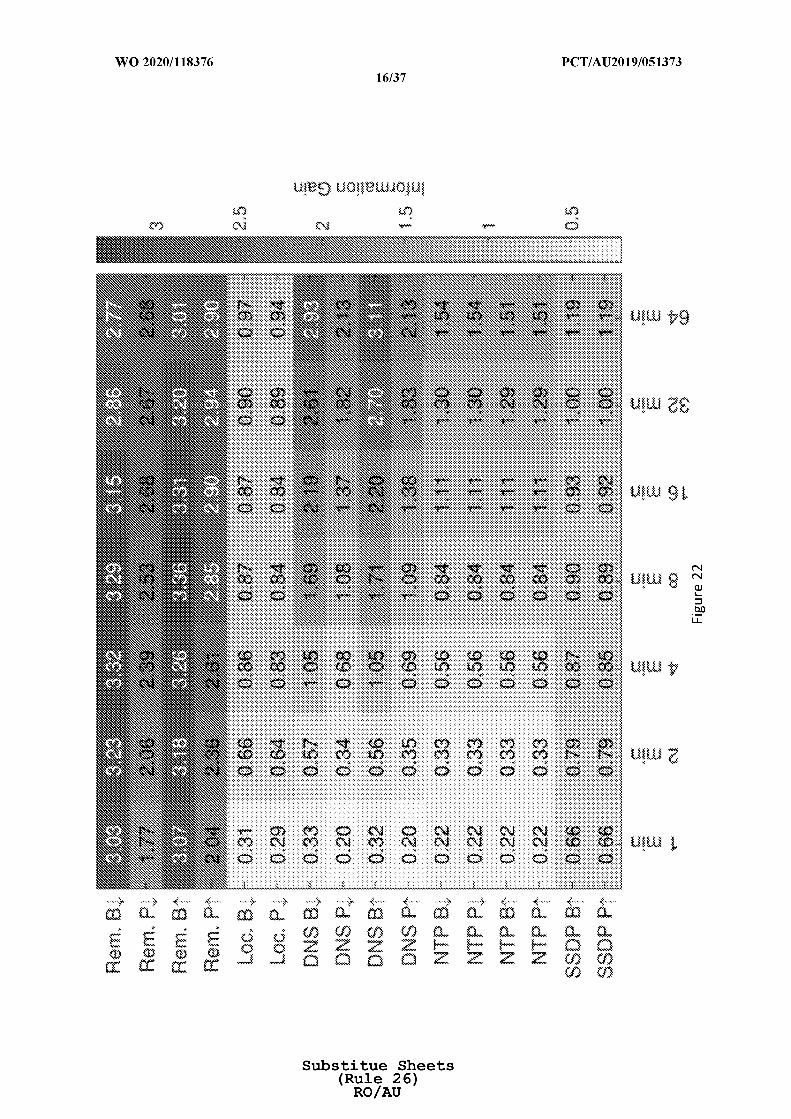


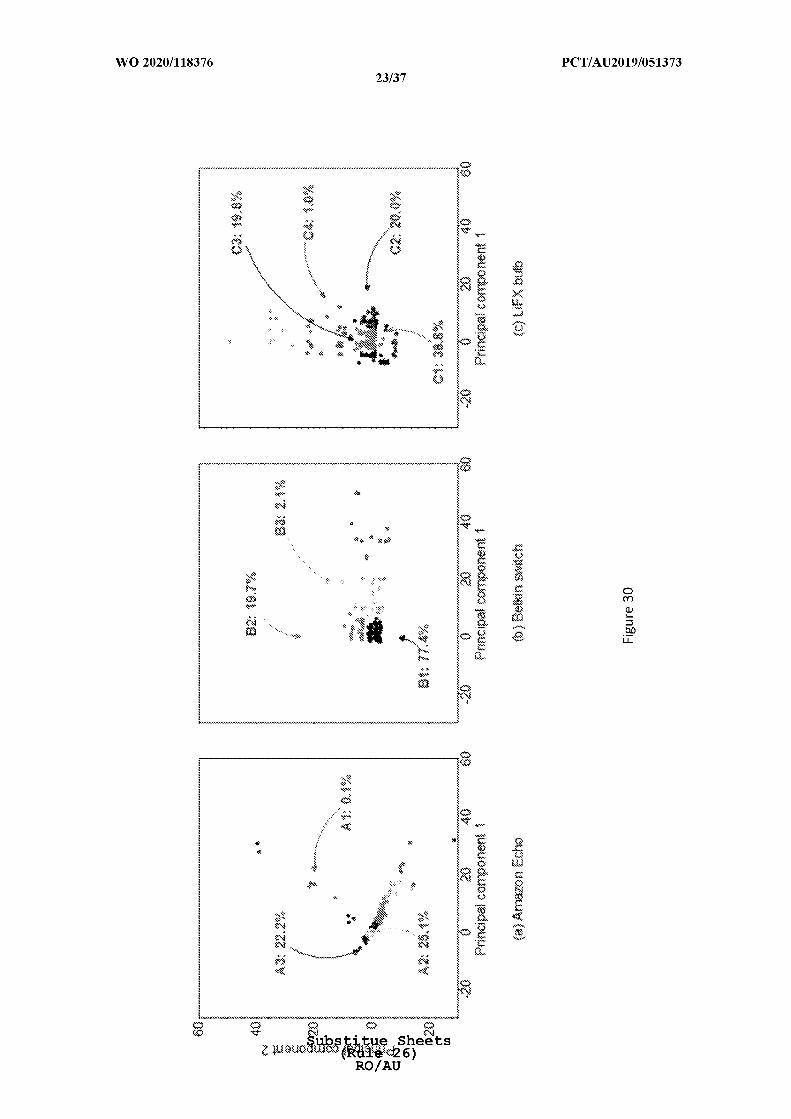

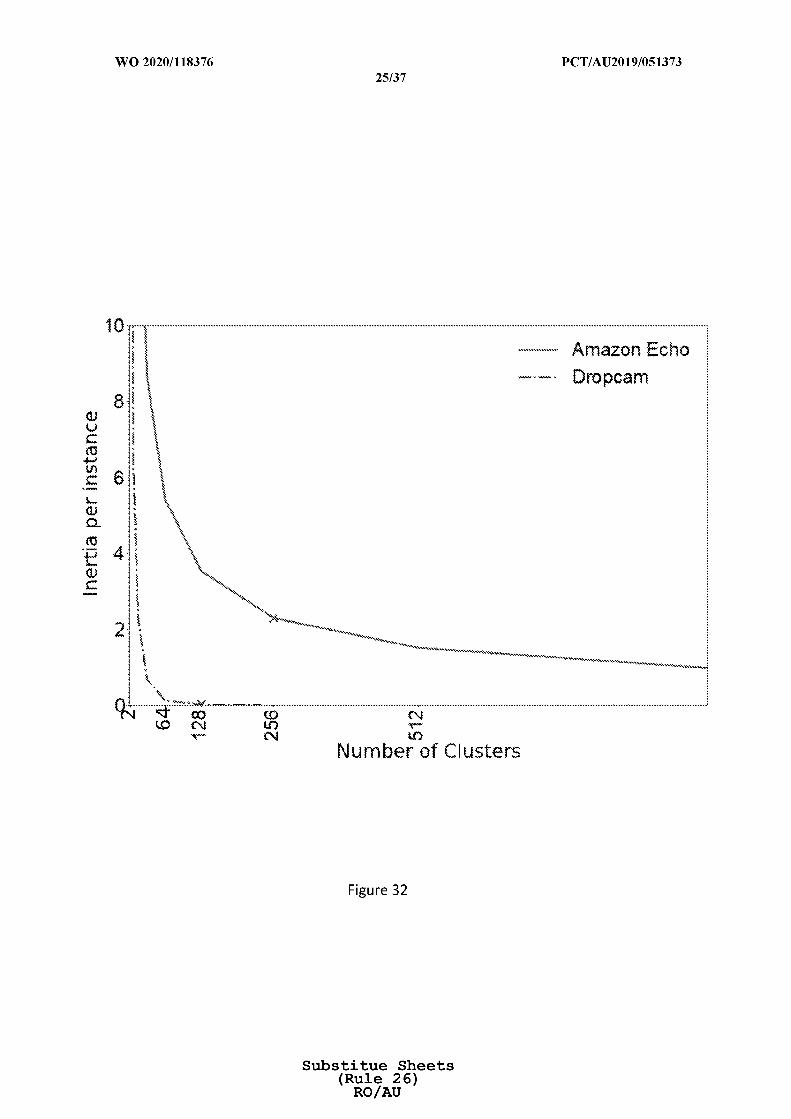


Form PCT/ISA/210 (fifth sheet) (July 2019)

Form PCT/ISA/210 (fifth sheet) (July 2019)