第42卷第1期 - 中央銀行
181
-
Upload
khangminh22 -
Category
Documents
-
view
0 -
download
0
Transcript of 第42卷第1期 - 中央銀行


中央銀行季刊第42卷 第1期
中央銀行 編印
中華民國 109 年 3 月


中央銀行季刊
目錄 第42卷 第1期
專 載
中央銀行理監事聯席會議決議 .............................................中 央 銀 行 1
論著與分析
Why is the Hong Kong housing market unaffordable?Some stylized facts and estimations .............................Charles Ka Yui LEUNG, 5
Joe Cho Yiu NG,Edward Chi Ho TANG
即時預報台灣的經濟成長率:MIDAS模型之應用 ............吳俊毅、朱浩榜 59
經濟金融動態
國內經濟金融情勢(民國108年第4季)總體經濟 ..............................................................................國 內 經 濟 科 85國際收支 ..............................................................................國 際 收 支 科 95貨幣與信用 ..........................................................................金 融 統 計 科 103金融市場 ..............................................................................金 融 統 計 科 111 國 際 收 支 科
國際經濟金融情勢(民國108年第4季) ..............................國 際 經 濟 科 131
經濟金融日誌
國內經濟金融日誌(民國109年1月至3月) ........................國 內 經 濟 科 159國際經濟金融日誌(民國109年1月至3月) ........................國 際 經 濟 科 163


中央銀行理監事聯席會議決議∣ 1
中央銀行理監事聯席會議決議
(109年3月19日發布)
一、國際經濟金融情勢
本(2020)年初以來,嚴重特殊傳染
性肺炎(COVID-19)疫情擴散,衝擊全球
供應鏈運作,削弱國際貿易與消費需求
動能,影響實質經濟活動,引發全球金
融市場劇烈波動;國際原油等商品價格
重挫,導致全球通膨面臨向下壓力。此
外,主要經濟體貿易談判結果未定、地
緣政治衝突等因素,致全球經濟下行風
險急遽升高,國際機構陸續大幅下修本
年全球經濟成長率預測值。
由於肺炎疫情對經濟金融衝擊之不
確定性持續擴大,近期主要經濟體紛紛
採行寬鬆貨幣政策,並推出擴張性財政
政策,以激勵經濟成長。
二、國內經濟金融情勢
(一) 隨著肺炎疫情擴散,預期本年國際
景氣明顯趨緩,不利台灣出口,加
以來台旅客劇減,抑制服務輸出成
長。內需方面,疫情影響國內消費
信心及就業市場,預期民間消費支
出保守;另外,廠商投資計畫亦可
能受影響,且上(2019)年資本設備
進口大幅擴增,墊高比較基期,民
間投資成長將趨溫和。
預期本年上半年經濟將受疫情衝
擊,本行下修上半年經濟成長率預
測值至1.07%;下半年若全球供應
鏈生產逐步回復,台灣輸出動能可
望回升,且民間消費具遞延回補效
果,加以政府推動紓困與振興措施
支撐內需,下半年經濟成長率可望
回升;全年經濟成長率預測值則下
修為1.92%(詳附表1)。肺炎疫情後
續發展,將是影響全年經濟成長的
主要變數。
(二) 本年1至2月消費者物價指數(CPI)平
均年增率為0.81%,不含蔬果及能
源之核心CPI年增率則為0.48%。由
於肺炎疫情蔓延,不利國內消費需
求,加以國際原油等原物料價格下
跌,對於本年通膨展望,本行分別
下修本年CPI及核心CPI年增率預測
值至0.59%及0.55%(詳附表2)。
(三) 國內金融體系流動性充裕,金融中
介運作正常。本年1至2月銀行體系
淨超額準備維持在450億元至550 億
元左右,銀行授信穩定成長。短期
利率低檔波動,長期利率下滑。
三、本行理事會一致決議調降政策利率0.25
個百分點及推出中小企業融通機制
鑑於肺炎疫情蔓延導致全球經濟前

2 ∣中央銀行季刊 第42卷第1期 民國109年3月
景急遽惡化,國際金融市場劇烈波動;
國內受疫情衝擊,製造業恐面臨生產供
應斷鏈,部分服務業則因消費萎縮而經
營困難,尤其中小企業可能面臨融資受
限而加重其經營困境,並衝擊就業市
場。另外,近期主要國家貨幣貶幅較
大,新台幣相對較強。
為協助企業正常營運及考量大量資
金移動影響金融穩定,本行理事會認為
有必要調降政策利率,並推出中小企業
融通機制,協助中小企業度過難關,穩
定家計部門及企業信心,有助維持經濟
活動順利運作,以達成本行法定職責。
(一) 本行重貼現率、擔保放款融通利
率及短期融通利率各調降0.25個百
分點,分別由年息1.375%、1.75%
及3.625%調整為1.125%、1.5%及
3.375%,自本年3月20日起實施。
本行將持續關注肺炎疫情發展、主
要經濟體貨幣政策走向及其對國內
外經濟金融的影響。若有必要時,
本行將召開常務理事會或臨時理事
會,妥適運用貨幣政策工具,以達
成本行法定職責。
(二) 本行將提供銀行轉融通資金,額
度、利率分別暫訂為新臺幣二千億
元及依本行擔保放款融通利率減1
個百分點,供銀行辦理中小企業貸
款,該貸款最高利率暫訂為本專案
融通利率加1個百分點(詳附件1)。
本行將定期檢討實際辦理情形,適
時做必要的調整。
四、另為充分支應金融體系流動性,銀行
若有資金需求,可隨時持本行定存單,
向本行辦理提前解約或質借;在緊急情
況下,本行在全球金融危機時期即備有
擴大附買回操作機制,對象除涵蓋銀行
及票券業外,尚包括證券、保險公司等
(詳附件2),將可充分提供金融市場所需
流動性。本行籲請銀行在資金充裕情況
下,發揮金融中介功能,對營運正常之
企業提供所需資金。
五、近期短期資金移動頻繁,不利國內外匯
市場及金融市場穩定;本行將密切注意
資金進出情況,並本於職責維護外匯市
場秩序及金融市場之穩定。
六、肺炎疫情對全球經濟供給面及需求面
帶來嚴重衝擊,近來政府陸續推動各項
紓困與振興措施,本行亦營造寬鬆貨幣
環境,並推出支持中小企業融通機制,
預期將共同發揮成效,促進經濟穩定成
長。

中央銀行理監事聯席會議決議∣ 3
附件1 中央銀行辦理銀行對中小企業放款之專案融通方案重點
一、為加強銀行對受嚴重特殊傳染性肺炎疫
情影響之中小企業辦理紓困,降低疫情
對經濟及金融之衝擊,本行訂定專案融
通方案,提供銀行融通資金,以辦理對
該類企業營運所需資金之擔保放款。
二、本專案融通方案重點
(一) 專案融通利率:暫訂按本行擔保放
款融通利率減1個百分點。
(二) 專案融通額度:暫訂新臺幣二千億
元。
(三) 專案融通期限:暫訂6個月。
(四) 銀行貸款對象:受疫情影響之中
小企業(需經財團法人中小企業信
用保證基金保證,或提供擔保品
者)。
(五) 銀行貸款用途:支應受疫情影響企
業之營運需求。
(六) 銀行貸款利率上限:暫訂本項專案
融通利率加1個百分點。
(七) 本項貸款可搭配政府其他紓困貸款
措施。
附件2 中央銀行「一般附買回操作機制」與「擴大附買回操作機
制」之比較
一般附買回操作機制 擴大附買回操作機制
操作方式 本行公告操作。
1. 本行公告操作。2. 由金融機構向本行申請操作。 (適用於緊急流動性需求)
操作對象
1. 銀行2. 票券公司3. 郵政公司4. 證券公司(具公開市場操作指定交易商資格者)
(全體操作對象得直接與本行操作)
1. 銀行2. 票券公司3. 郵政公司4. 證券公司5. 保險公司
(保險公司與未具公開市場操作指定交易商資格之證券公司,得透過指定交易商間接與本行操作;其他操作對
象得直接與本行操作。)附買回期限 30天以內 180天以內
附買回利率參酌市場利率及本行存單發行利率
訂定參酌市場利率及本行存單發行利率訂定
合格標的依央行法第26、27條規定辦理,但以本行定期存單及公債為主。
依央行法第26、27條規定辦理,但以本行定期存單及公債為主。
註:為因應全球金融危機,民國97年9月26日本行擴大附買回之操作機制,充分提供金融機構所需流動性。

4 ∣中央銀行季刊 第42卷第1期 民國109年3月
附表1 主要機構對本年台灣經濟成長率預測值單位:%
預測機構 2020年(f)
國內機構
中央銀行(2020/3/19) 1.92
台大國泰(2020/3/18) 2.00主計總處(2020/2/12) 2.37
平均數 2.10
國外機構
Barclays Capital(2020/3/18) 1.50IHS Markit(2020/3/17) 1.05Morgan Stanley(2020/3/17) 1.30Deutsche Bank(2020/3/17) 1.70Standard Chartered(2020/3/16) 1.90Goldman Sachs(2020/3/16) 1.60J.P. Morgan(2020/3/16) 1.90HSBC(2020/3/16) 1.80BofA Merrill Lynch(2020/3/13) 1.70Credit Suisse(2020/3/12) 2.00
平均數 1.65
附表2 主要機構對本年台灣CPI年增率預測值單位:%
預測機構 2020年(f)
國內機構
中央銀行(2020/3/19)
0.59(CPI)0.55
(核心CPI*)
主計總處(2020/2/12) 0.62平均數 0.61
國外機構
Barclays Capital(2020/3/18) 0.30IHS Markit(2020/3/17) 0.46Morgan Stanley(2020/3/17) 0.80Deutsche Bank(2020/3/17) 0.80Standard Chartered(2020/3/16) 1.00Goldman Sachs(2020/3/16) 0.80J.P. Morgan(2020/3/16) 0.70HSBC(2020/3/16) 0.70BofA Merrill Lynch(2020/3/13) 0.30Credit Suisse(2020/3/12) 1.20
平均數 0.71
*核心CPI (core CPI),係指扣除蔬果及能源後之CPI。
Why is the Hong Kong housing market unaffordable? Some stylized facts and estimations∣ 5
Why is the Hong Kong housing market unaffordable? Some stylized facts and estimations*
Charles Ka Yui LEUNG, Joe Cho Yiu NG, Edward Chi Ho TANG **
Abstract
The house price in Hong Kong is well-known to be “unaffordable.” This paper argues that the commonly used house price-to-income ratio may be misleading in an economy with almost half of the population living in either public rental housing or subsidized ownership. Moreover, we re-focus on the relationships between economic fundamentals and the housing market of Hong Kong. While the aggregate GDP, population, longevity continues to grow, the real wage and household income fall behind. The trend component of the real GDP growth suffers a permanent downward shift after the first quarter of 1989 (a “political scar”). The trend component of real wage growth is close to zero, and the counterpart of real consumption and real investment decline steadily. Meanwhile, the trend component of the real housing rent and price display patterns that decouple from the macroeconomic variables. We also discuss the directions for future research.Keywords: housing demand, migration, structural break, time series decomposition,
wage index and household income
* This paper draws a part of its content from a seminar made by Leung at the Central Bank of the ROC (Taiwan) on December 10, 2019, under the theme of “External shocks or internal causes? The property markets of two Asian financial centers.” The authors would like to thank the two anonymous referees for their helpful comments. They are also grateful to Alain Bertaud, Nan-Kuang Chen (who currently serves as Deputy Governor, the Central Bank of the Republic of China(Taiwan)), Bob Edelstein, Eric Hanushek, Fred Kwan, Tommy Leung, Steve Malpezzi, Shane Su, Byron Tsang, Isabel Yan, Matthew Yiu, seminar participants of the National Taiwan University for many helpful discussion, and City University of Hong Kong (through the Internal Grant No. 7005001) and Hong Kong Shue Yan University for financial support. Part of the research is conducted when Leung visits the Hoover Institution; Ng visits the Virginia Tech through a Junior Fulbright Scholarship. The hospitality of these institutions is gratefully acknowledged. Leung's visit to Taiwan was financially supported by the Center for Research in Econometric Theory and Applications (Grant No. 109L900201) from The Featured Areas Research Center Program within the framework of the Higher Education Sprout Project by the Ministry of Education (MOE) in Taiwan, and by the Ministry of Science and Technology (MOST), Taiwan under Grant No. MOST 109-2634-F-002-045. Part of the work described in this paper was supported by a grant from the Research Grants Council of the Hong Kong Special Administrative Region, China (Project No.: UGC/FDS15/B01/18). The views expressed in this paper are the views of the authors and do not reflect the views or policies of the Central Bank of the ROC (Taiwan). The authors are accountable for any mistakes in this paper.
** Leung and Ng, Department of Economics and Finance, City University of Hong Kong, Kowloon Tong, Hong Kong, [email protected], [email protected]; Tang, Department of Economics and Finance, Hong Kong Shue Yan University, North Point, Hong Kong, [email protected].
6 ∣中央銀行季刊 第42卷第1期 民國109年3月
1. Introduction
Housing affordability has become a global
concern. According to McKinsey (2017), “One
feeling unites billions of people in cities around
the world: a sense of sticker shock whenever
they attempt to find a new home. From London
to Lagos, housing costs are creating financial
stress for a large share of the world’s urban
residents.” Some authors claim that Hong Kong
performs worst in providing affordable housing
among the global cities. For instance, according
to Demographia (2019), “The 29 severely
unaffordable major housing markets are shown
in Table 7. Hong Kong has a Median Multiple
of 20.9, the least affordable Median Multiple
yet recorded. For the ninth year in a row, Hong
Kong has the worst housing affordability
in the Demographia International Housing
Affordability Survey...”
Motivated by these observations, this
paper addresses the following questions: Is
Hong Kong housing that unaffordable? Why is
it so prohibitive? What can other places learn
from the Hong Kong experience? To make this
paper as accessible as possible, we first present
some stylized facts graphically. We provide
explanations and interpretations of those graphs.
We will also provide some statistical analysis
when necessary.
This paper builds on several strands of the
literature. First, there is an effort to compare and
contrast the institutions and performance across
different housing markets.1 Second, many works
of literature have studied how the housing
market is related to the macroeconomy.2 Third,
there is relatively small literature that focuses
on the Hong Kong real estate markets.3 Fourth,
since most residents in Hong Kong are ethnic
Chinese and at the same time being exposed to
the global culture, this paper is also related to
the literature on the Chinese housing market.4
Fifth, the trade conflict between China and the
United States has non-trivial consequences to
other countries, as some authors have found
preliminary evidence on that.5 Hong Kong,
being a part of China and intermediates many
goods trade as well as financial transactions
for China, is affected. It also sheds light on
the “spillover effects” of the China-USA trade
conflicts. And while the Hong Kong housing
market has been discussed previously (Leung
and Tang, 2012, 2015a, b, and the reference
therein), this paper provides some updated
analysis on the housing affordability and
conduct a time-series decomposition of the

Why is the Hong Kong housing market unaffordable? Some stylized facts and estimations∣ 7
key macro variables. This paper intends to
be accessible to a broad audience in Asian
and other countries, as economic lessons are
typically general. Therefore, we present our
results graphically.
T h e s t r u c t u r e o f t h i s p a p e r i s
straightforward. We present some stylized
facts of the Hong Kong housing market and
the macroeconomy. We then decompose the
time series of the main variables of the housing
market and the macroeconomy. The evidence
suggests that the “unaffordability” of the
housing market may have its roots in some long
term trend. We provide some simple thoughts in
the concluding section.
2. Hong Kong Housing Market and the Macroeconomy
As an international financial center, Hong
Kong is mentioned in global media from time
to time. With a fixed boundary and a fixed
exchange rate with the United States, Hong
Kong has been able to attract much non-local
investment in its real estate sector.6 Therefore,
the housing unaffordability concerns by
Demographia and other organizations deserve
serious attention. We begin our discussion with
the house price. Unless specified otherwise, our
data comes from the Hong Kong government
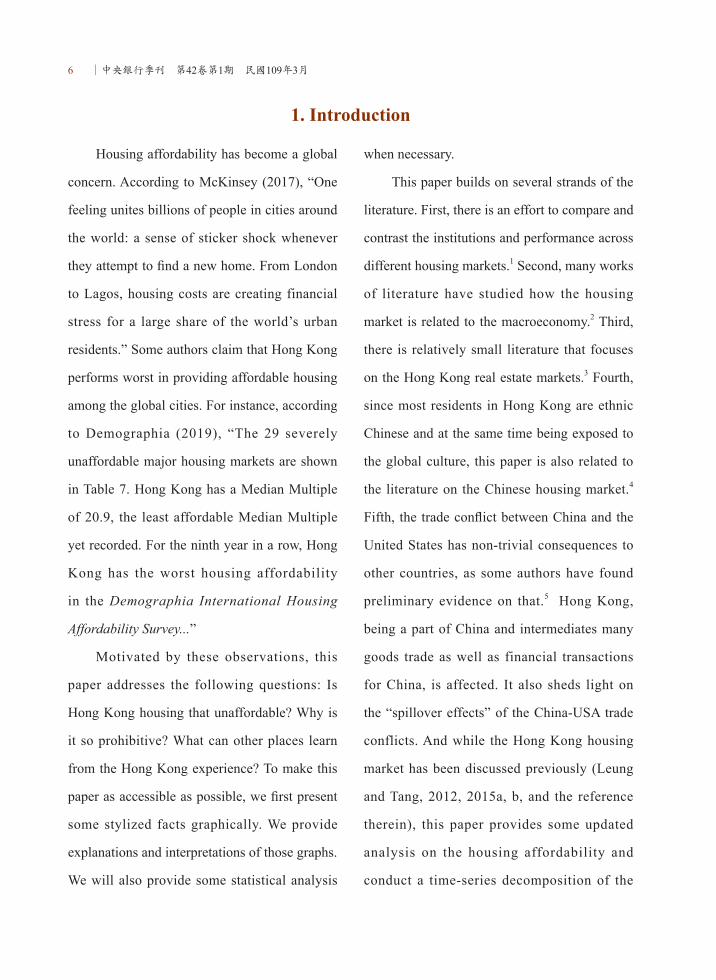
official website.7 Figure 1a shows that the real
house price in 2018, i.e., the house price after
removing the inflation factor, is 400% of the
1979 level. It also shows that the house price
and stock price, while both have an upward
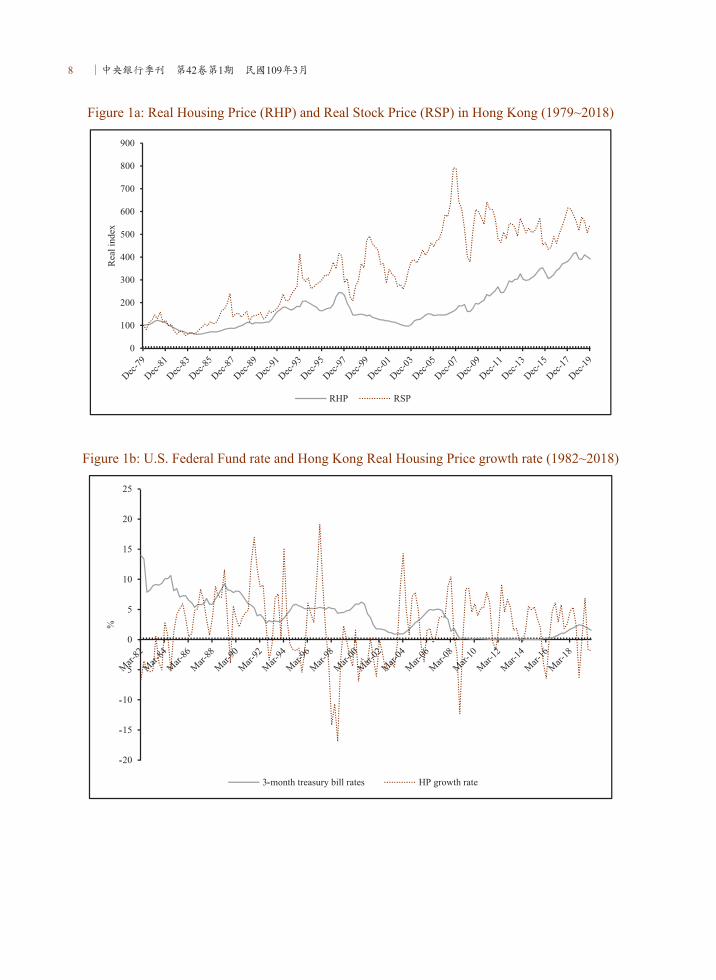
trend, do not always move together.8 Also,
some authors suggest that, since the Hong Kong
dollar exchange rate is linked with the U.S.,
the U.S. monetary policy will dictate the Hong
Kong house price. Figure 1b shows that while
the U.S. interest rate influences the Hong Kong
real housing price growth rate, it is not the only
factor.
Moreover, Figure 1c suggests that the
house price increases faster than the wage, as
the house price-to-wage ratio increases from
100 (1982 level) to about 270 (2018 level). To
facilitate the comparison, we also plot the same
ratio for the United States. The U.S. counterpart
increases from 100 to 160 during the same
period. These figures confirm the Demographia
assertion that the housing affordability in Hong
Kong has indeed deteriorated.
8 ∣中央銀行季刊 第42卷第1期 民國109年3月
Figure 1a: Real Housing Price (RHP) and Real Stock Price (RSP) in Hong Kong (1979~2018)
Figure 1b: U.S. Federal Fund rate and Hong Kong Real Housing Price growth rate (1982~2018)

Why is the Hong Kong housing market unaffordable? Some stylized facts and estimations∣ 9
Figure 1c: House price-to-wage ratio in Hong Kong and U.S. (1982~2018)
However, those figures overlook an
essential feature of the Hong Kong housing
market; namely, a significant number of
households live in need-based public rental
hous ing , and hence they are somehow
“protected” from the appreciation of the house
price.9 To illustrate the point that the size of the
public rental housing matters, let us consider
an economy with only three agents, A, B, and
C. The agents are labeled in such a way that the
income of agent A is lower than agent B, and
the income of agent B is, in turn, more moderate
than agent C. In this artificial economy, the
median agent is B. Hence, agent B’s house
price-to-income ratio is the economy’s median
house price-to-income ratio. Now assume
that agent A instead lives in public housing,
whose rent is subsidized by the government.
The private housing market consists of only
two agents, B, and C. The median house price-
to-income ratio of the economy becomes the
average of the house price-to-income ratio of
agent B and C. In other words, the existence of
public housing changes the median house price-
to-income ratio in the private housing market.
Let us consider another economy with five
agents, A, B, C, D, and E. As in the previous
example, the agents are arranged so that the
income of agent A is lower than that of agent
B, and so on. Agent E has the highest income.
10 ∣中央銀行季刊 第42卷第1期 民國109年3月
In a scenario with no government intervention,
the median agent is agent C. The house price-
to-income ratio of agent C is the economy’s
median house price-to-income ratio. Now the
government provides not only public rental
housing to agent A but also subsidized ownership
to agent B. In this new scenario, only agents C,
D, and E face the private housing market, and the
(new) median agent in the private housing market
is agent D. And if we want to measure the house
price-to-income ratio in the private housing
market, we should measure the ratio of agent D,
not agent C. In other words, in a world without
any government intervention, the median agent
in the income distribution and the private housing
market would be the same person. However,
when the government intervenes through public
rental housing or subsidized ownership, the
median agent in the income distribution will no
longer coincide with the median agent in the
private housing market. Hence, if the government
participation in the housing market is sizable, we
expect the distortion of using the median house
price-to-income ratio would be sizable as well.
In Hong Kong, government involvement
in the housing market is indeed massive.
The public rental housing project began in
1953 and since then grows with the economy
(Smart, 2006; Yeung and Wong, 2003).10 Figure
2a shows the number of households lives
in different types of housing: public rental,
subsidized ownership, and private. Figure 2b
shows the number of housing units for each
kind of shelter. While the growth rate of public
rental housing and occupants seem to be lower
than the private housing in recent years, the
public rental sector still accounts for roughly
one-third of the housing market. The subsidized
ownership approximately accounts for another
one-seventh of the housing market. Together, it
means that the private housing market (rental
plus ownership) accounts for roughly half of the
population.
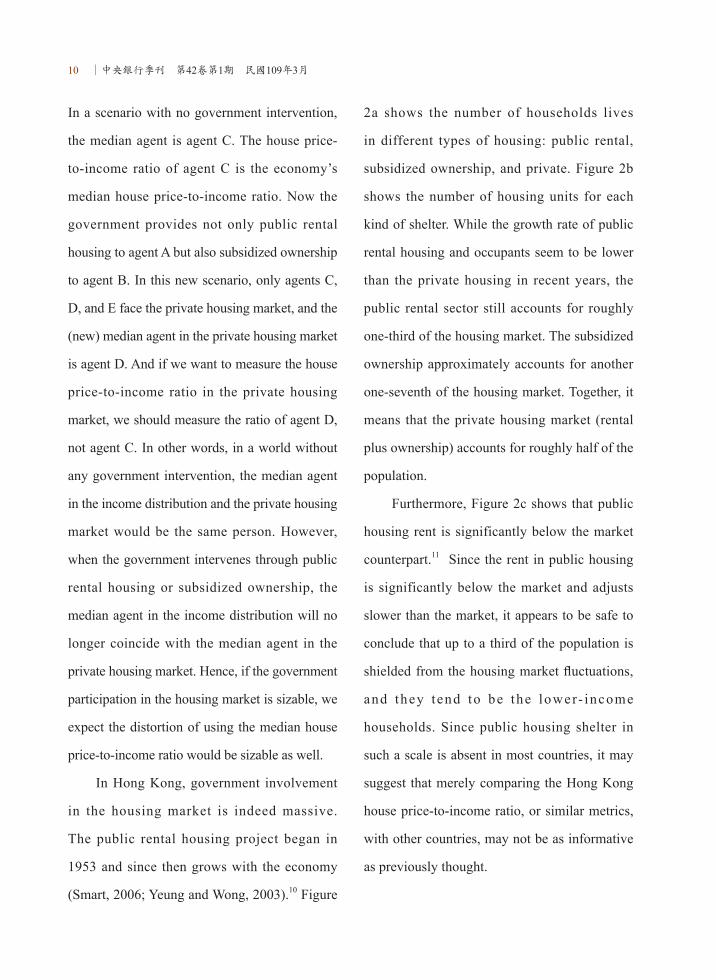
Furthermore, Figure 2c shows that public
housing rent is significantly below the market
counterpart.11 Since the rent in public housing
is significantly below the market and adjusts
slower than the market, it appears to be safe to
conclude that up to a third of the population is
shielded from the housing market fluctuations,
and they tend to be the lower- income
households. Since public housing shelter in
such a scale is absent in most countries, it may
suggest that merely comparing the Hong Kong
house price-to-income ratio, or similar metrics,
with other countries, may not be as informative
as previously thought.

Why is the Hong Kong housing market unaffordable? Some stylized facts and estimations∣ 11
Figure 2a: Distribution of household by types of housing (in thousand)
Figure 2b: Distribution of housing stock by type (in thousand)
12 ∣中央銀行季刊 第42卷第1期 民國109年3月
Figure 2c: The rent in public housing is below the private sector counterpart in Hong Kong (1993~2019)
Key: To make the two rental indices comparable, we use the New Territories rental indices. For the public housing rent, we use the one with size 43.3 square meters. For the private housing rent, we use the class B rental index.
Many authors compare the housing
market of Hong Kong with Singapore. While
the two economies have many similarities, we
caution a direct comparison of the two housing
markets. For instance, while nearly 90% of
the population in Singapore live in “public
housing,” most of those public housing units
are “subsidized ownership.” Those Singaporean
owner-occupiers would need to bear the capital
risk should they need to re-sell the housing units
in the market. The portion of the population
living in pure public rental housing is less than
10% of the whole population (Deng et al.,
2014). It is very different from the case of Hong
Kong.
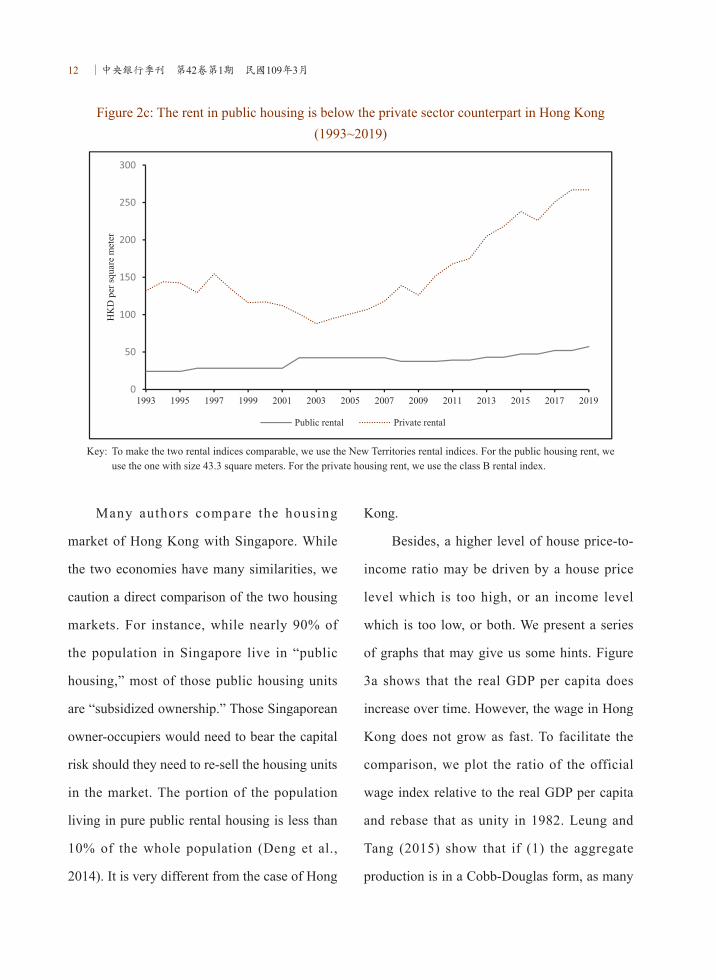
Besides, a higher level of house price-to-
income ratio may be driven by a house price
level which is too high, or an income level
which is too low, or both. We present a series
of graphs that may give us some hints. Figure
3a shows that the real GDP per capita does
increase over time. However, the wage in Hong
Kong does not grow as fast. To facilitate the
comparison, we plot the ratio of the official
wage index relative to the real GDP per capita
and rebase that as unity in 1982. Leung and
Tang (2015) show that if (1) the aggregate
production is in a Cobb-Douglas form, as many

Why is the Hong Kong housing market unaffordable? Some stylized facts and estimations∣ 13
macroeconomics textbooks suggest, and (2)
both the product markets and input markets are
perfectly competitive, then the ratio of wage
relative to GDP per capita should be a constant.
This result holds even when the aggregate
productivity fluctuates. This analytical result
gives us a handy benchmark.
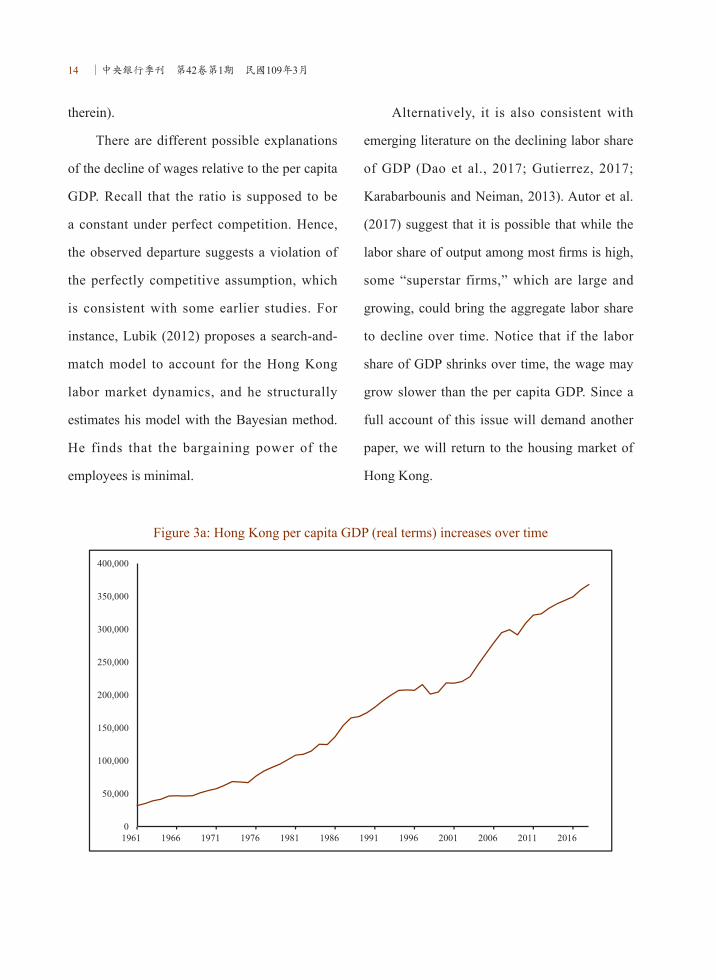
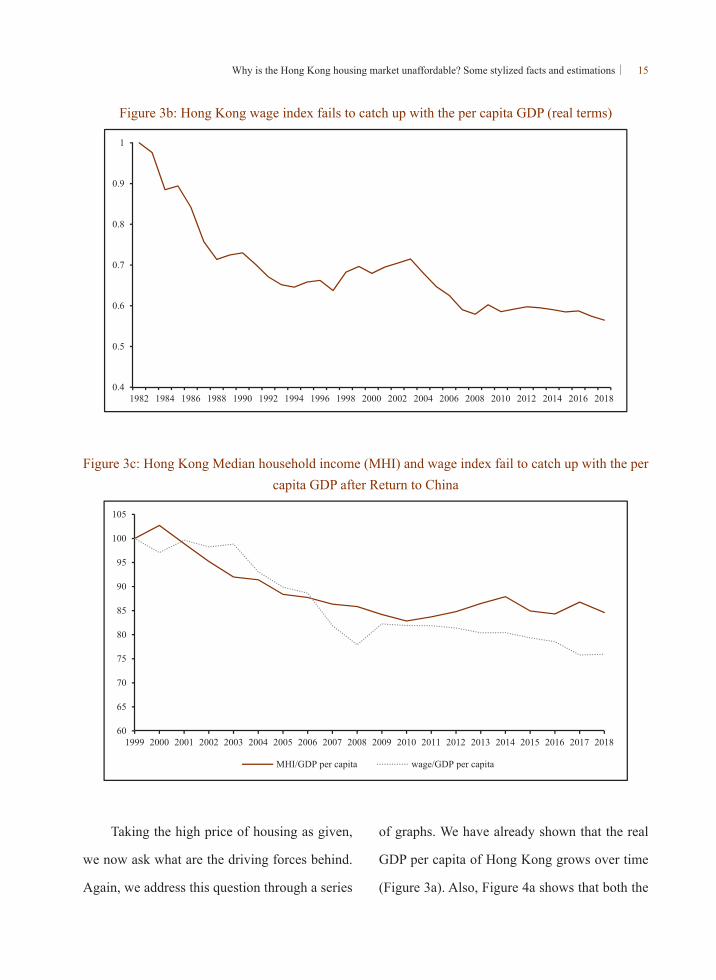
Figure 3b shows that this is not the case.
The ratio drops from unity to around 0.6 over
the years, which significantly and persistently
departs from the theoretical benchmark.
There are different possible interpretations.
For instance, some suggest that alternative
contractual arrangements are now available
in Hong Kong, and hence the wage index has
ceased to be an informative indicator. OECD
(2016) recognizes that in Europe, at least half
of the employees benefit from various kinds
of flexible working arrangements, including
working part-time, working at home, etc. The
presence of this arrangement could affect the
information contents of the wage index. Also,
the wage index concerns an individual, while
in practice, there are many multi-member
households. There is evidence that in multi-
member families, some members may specialize
in market production while other members may
specialize in household production (Becker,
1994; Erosa et al. 2017). In that case, household
income-based measures may be more relevant
than the individual-based wage index.
Figure 3c presents both the ratio of median
household income relative to the GDP per
capita and the ratio of wage index relative to
the GDP per capita. Again, we normalize both
ratios as unity at the initial period that we can
access the relevant data, which is 1999. Several
patterns are apparent. First, relative to the GDP
per capita, both the median household income
and the wage index roughly declines at the
same speed as the wage index between 1999
to 2006. In other words, the median household
income series and the wage index follow the
same downward trend during the period 1999
to 2006, and hence our previous result is robust
in this sense. After the global financial crisis
(GFC) began, the median household income
almost stays constant, while the wage index
continues to decline from roughly 85% to 75%
of the per capita GDP. The difference between
the individual-based wage index and the
household income is consistent with the “income
insurance” view of marriage. When a husband,
for instance, loses his job in a recession, the
labor supply of his wife tends to increase and
hence stabilizes the household income (e.g.,
Bredtmann et al., 2018; Bryan and Longhi,
2018, Greenwood et al., 2017, and the reference
14 ∣中央銀行季刊 第42卷第1期 民國109年3月
therein).
There are different possible explanations
of the decline of wages relative to the per capita
GDP. Recall that the ratio is supposed to be
a constant under perfect competition. Hence,
the observed departure suggests a violation of
the perfectly competitive assumption, which
is consistent with some earlier studies. For
instance, Lubik (2012) proposes a search-and-
match model to account for the Hong Kong
labor market dynamics, and he structurally
estimates his model with the Bayesian method.
He finds that the bargaining power of the
employees is minimal.
Alternatively, it is also consistent with
emerging literature on the declining labor share
of GDP (Dao et al., 2017; Gutierrez, 2017;
Karabarbounis and Neiman, 2013). Autor et al.
(2017) suggest that it is possible that while the
labor share of output among most firms is high,
some “superstar firms,” which are large and
growing, could bring the aggregate labor share
to decline over time. Notice that if the labor
share of GDP shrinks over time, the wage may
grow slower than the per capita GDP. Since a
full account of this issue will demand another
paper, we will return to the housing market of
Hong Kong.
Figure 3a: Hong Kong per capita GDP (real terms) increases over time
Why is the Hong Kong housing market unaffordable? Some stylized facts and estimations∣ 15
Figure 3b: Hong Kong wage index fails to catch up with the per capita GDP (real terms)
Figure 3c: Hong Kong Median household income (MHI) and wage index fail to catch up with the per capita GDP after Return to China
Taking the high price of housing as given,
we now ask what are the driving forces behind.
Again, we address this question through a series
of graphs. We have already shown that the real
GDP per capita of Hong Kong grows over time
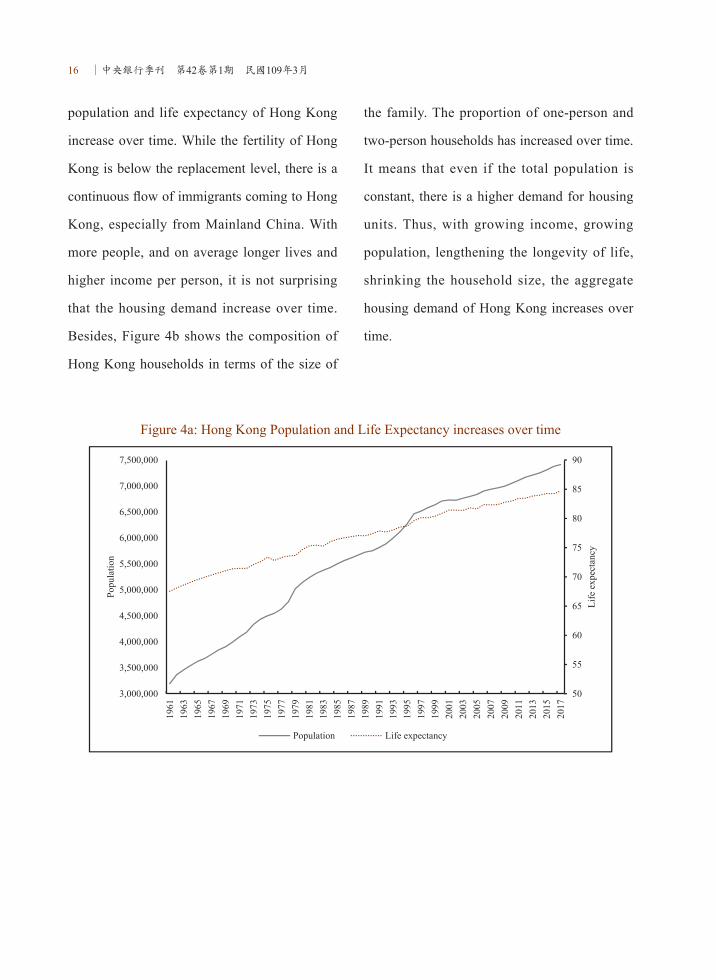
(Figure 3a). Also, Figure 4a shows that both the
16 ∣中央銀行季刊 第42卷第1期 民國109年3月
population and life expectancy of Hong Kong
increase over time. While the fertility of Hong
Kong is below the replacement level, there is a
continuous flow of immigrants coming to Hong
Kong, especially from Mainland China. With
more people, and on average longer lives and
higher income per person, it is not surprising
that the housing demand increase over time.
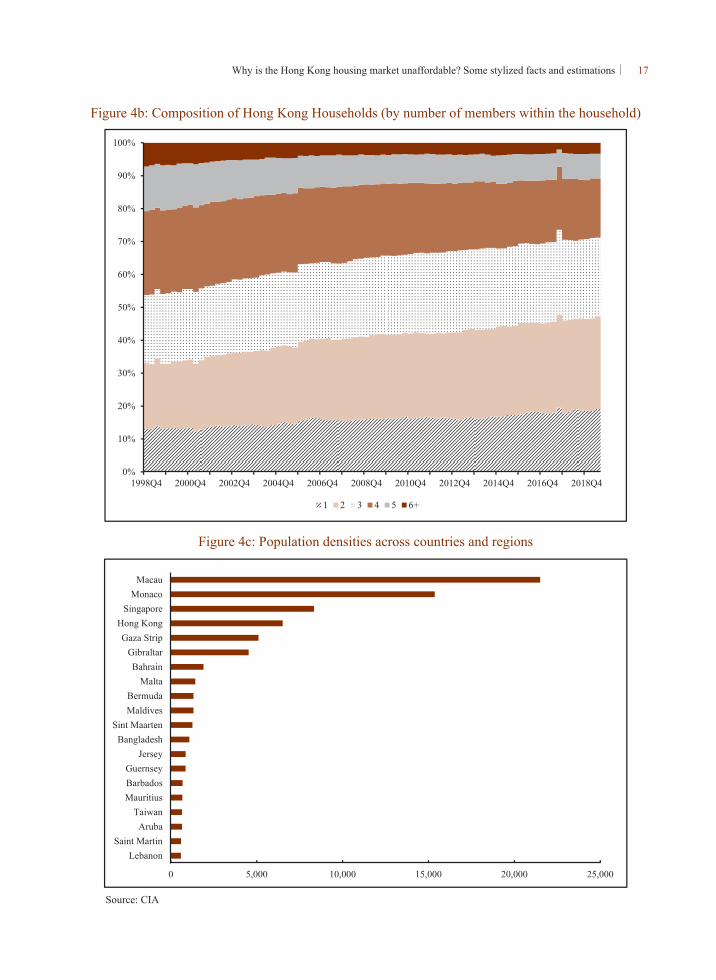
Besides, Figure 4b shows the composition of
Hong Kong households in terms of the size of
the family. The proportion of one-person and
two-person households has increased over time.
It means that even if the total population is
constant, there is a higher demand for housing
units. Thus, with growing income, growing
population, lengthening the longevity of life,
shrinking the household size, the aggregate
housing demand of Hong Kong increases over
time.
Figure 4a: Hong Kong Population and Life Expectancy increases over time
Why is the Hong Kong housing market unaffordable? Some stylized facts and estimations∣ 17
Figure 4b: Composition of Hong Kong Households (by number of members within the household)
Figure 4c: Population densities across countries and regions
Source: CIA
18 ∣中央銀行季刊 第42卷第1期 民國109年3月
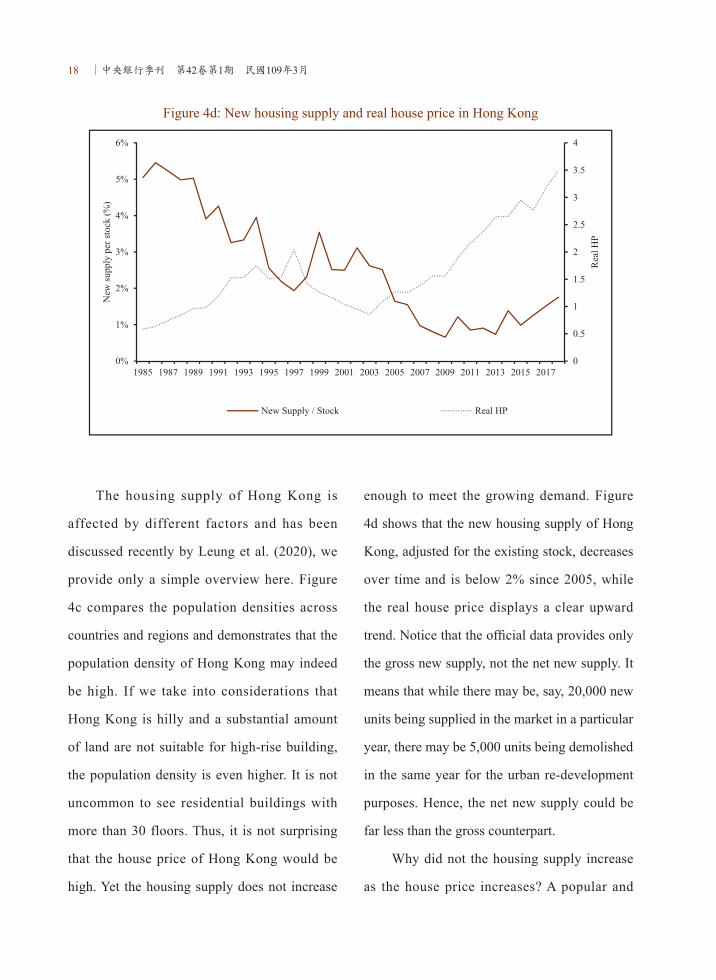
Figure 4d: New housing supply and real house price in Hong Kong
The housing supply of Hong Kong is
affected by different factors and has been
discussed recently by Leung et al. (2020), we
provide only a simple overview here. Figure
4c compares the population densities across
countries and regions and demonstrates that the
population density of Hong Kong may indeed
be high. If we take into considerations that
Hong Kong is hilly and a substantial amount
of land are not suitable for high-rise building,
the population density is even higher. It is not
uncommon to see residential buildings with
more than 30 floors. Thus, it is not surprising
that the house price of Hong Kong would be
high. Yet the housing supply does not increase
enough to meet the growing demand. Figure
4d shows that the new housing supply of Hong
Kong, adjusted for the existing stock, decreases
over time and is below 2% since 2005, while
the real house price displays a clear upward
trend. Notice that the official data provides only
the gross new supply, not the net new supply. It
means that while there may be, say, 20,000 new
units being supplied in the market in a particular
year, there may be 5,000 units being demolished
in the same year for the urban re-development
purposes. Hence, the net new supply could be
far less than the gross counterpart.
Why did not the housing supply increase
as the house price increases? A popular and
Why is the Hong Kong housing market unaffordable? Some stylized facts and estimations∣ 19
convincing reason is that the housing supply
is artificially constrained by regulation under
different justifications. Many studies have
confirmed that as a nearly universal reason for
limited housing supply.12 In Hong Kong, the
density of residential development is guided
by the plot ratio. It compares the gross floor
area of a building and the site’s area.13 While
the institution of the plot ratio may enhance the
environmentally friendly dimension of the city,
it restricts the gross floor area to be completed
in a project. Hence, it may reduce the incentives
for developers to redevelop some areas, which
indirectly limits the new housing supply. Such
distortion in housing supply can lead to severe
economic consequences.14
The institutions of Hong Kong may
contribute to this housing supply shortage
problem. Unlike many countries with similar
income levels per capita, land ownership in
Hong Kong is public. Strictly speaking, the
“land sale” in Hong Kong is the sale of the right
of usage of a particular piece of land during
a specific period. Thus, the official name of
the "land sale revenue" is “land premium.”
An alternative way for the developers to
obtain land is to apply for changes in land use.
Usually, it involves a shift of agricultural land
to residential land, and the developer needs to
pay a mutually agreed price to the government.
The Government can also invoke the Lands
Resumption Ordinance to resume three types
of private land for developing public housing
and Starter Homes.15 Hence, the Hong Kong
government almost control the land supply of
Hong Kong and influence the land price. Leung
and Tang (2015b), among others, promote
the view that the Hong Kong government
effectively operates as a durable goods
monopoly with limited supply, dynamically
tradeoffs the quantity of land and revenue that
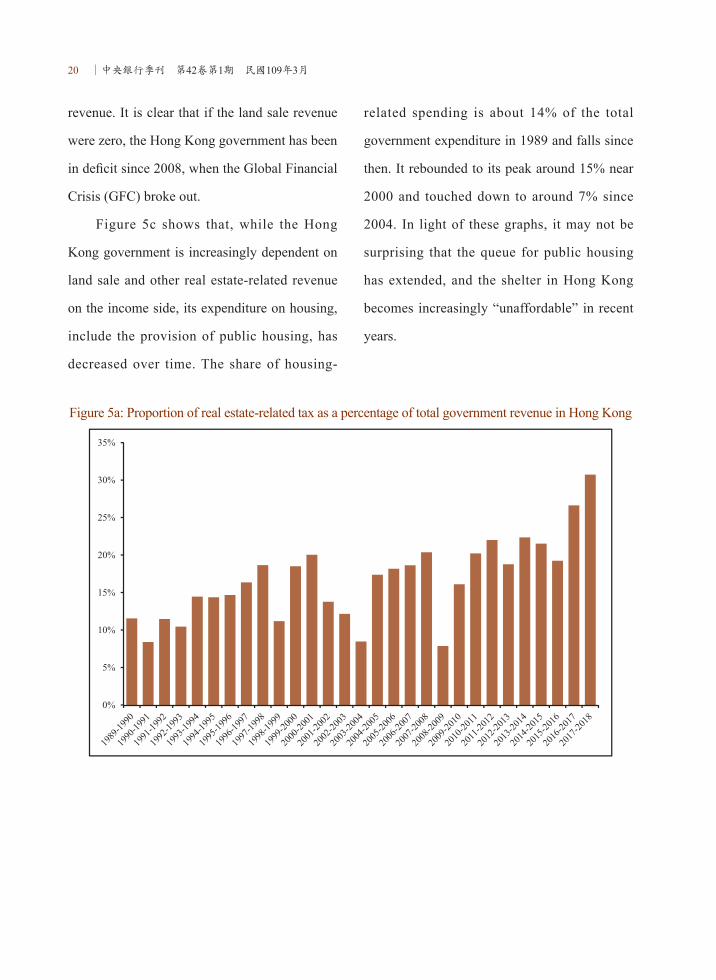
can be generated from the land sale. Figure 5a
demonstrates the increasing tendency for the
Hong Kong government to depend on real-
estate related tax. Here we only include the
revenue from land sale (“land premium”) and
property tax (“rate”).16 Between 1990 and
1996, the proportion of real estate-related
tax constitutes no more than 15% of the total
revenue. The ratio experiences ups and downs
since the 1997 handover to China and reaches
a historical high of 30% in 2018. Figure 5b
provides another illustration of the Hong Kong
government's real estate-dependency. It shows
that both the fiscal-GDP and hypothetical fiscal
surplus-GDP ratio of Hong Kong over time,
where the hypothetical fiscal surplus is the
official budgetary surplus minus the land sale
20 ∣中央銀行季刊 第42卷第1期 民國109年3月
revenue. It is clear that if the land sale revenue
were zero, the Hong Kong government has been
in deficit since 2008, when the Global Financial
Crisis (GFC) broke out.
Figure 5c shows that, while the Hong
Kong government is increasingly dependent on
land sale and other real estate-related revenue
on the income side, its expenditure on housing,
include the provision of public housing, has
decreased over time. The share of housing-
related spending is about 14% of the total
government expenditure in 1989 and falls since
then. It rebounded to its peak around 15% near
2000 and touched down to around 7% since
2004. In light of these graphs, it may not be
surprising that the queue for public housing
has extended, and the shelter in Hong Kong
becomes increasingly “unaffordable” in recent
years.
Figure 5a: Proportion of real estate-related tax as a percentage of total government revenue in Hong Kong

Why is the Hong Kong housing market unaffordable? Some stylized facts and estimations∣ 21
Figure 5b: Fiscal surplus-GDP and hypothetical fiscal surplus-GDP ratios of Hong Kong
Note: The hypothetical fiscal surplus is the official fiscal surplus minus the land sale revenue

22 ∣中央銀行季刊 第42卷第1期 民國109年3月
Figure 5c: The composition of the Hong Kong government expenditure

Why is the Hong Kong housing market unaffordable? Some stylized facts and estimations∣ 23
We should stress that the dependence
of real estate tax revenue needs not to be
undesirable. For instance, Henry George argues
that the government should use land tax to
replace other forms of taxation. According
to George (1879, chapter 22), as “population
grows and technology advances, land values
rise. This steady increase leads to speculation,
as future increases are anticipated. Land values
are carried beyond the point at which labor and
capital would receive their customary returns.
Production, therefore, begins to stop.”
Furthermore, George (1879, chapter 32)
argues that “to formally confiscate all land
would involve a needless shock, and would
require a needless extension of government.
Both can be avoided… It is not necessary to
confiscate land—only to confiscate rent…
Land values increase as population grows and
progress advances… Taxation of rent would
increase as we abolish other taxes… To abolish
all taxes—except on land values.” While
this idea seems radical, it has been widely
discussed by economists (e.g., Behrens et al.,
2015; Kawano, 2014; Newton, 1971; Stigler,
1974). On the other hand, we are not aware
of any severe calibration work to examine the
optimality or practicality of the Henry George
theorem. We recommend future research to
take up this challenge, which may enhance our
discussion of the policy design for Hong Kong
or economies in similar conditions.
Another factor that may contribute to the
apparent “housing shortage” in Hong Kong
is the change in immigration. Interestingly,
the Hong Kong government does not collect
the immigrant data, or they have not made it
publicly accessible. We have access to the data
for the so-called “one-way permit,” which
keeps track of the number of immigrants from
Mainland China to Hong Kong. Also, there is
the Admission Scheme for Mainland Talents
and Professionals (ASMTP), which allows
Mainland Chinese with unique talents to migrate
to Hong Kong.17 We have no information about
how many people from other places move to
Hong Kong, or how many moves from Hong
Kong to other countries.
Several remarks regarding this one-
way permit system are in order. First, the
one-way permits are issued by the Mainland
China government, and hence the Hong Kong
government cannot select who would be
granted access to Hong Kong. Second, since
we do not have access to the out-migrant data,
we are unable to distinguish those Mainland
Chinese immigrants permanently stay in Hong
Kong and those who ultimately migrate to other

24 ∣中央銀行季刊 第42卷第1期 民國109年3月
countries through Hong Kong. The daily quota
of the one-way permit has also changed over
time. It increases from 75 to 105 in 1994 and
further to 150 in 1995. The age composition of
Chinese immigrants to Hong Kong is displayed
in Figure 6. There exhibits a clear trend that
the proportion of young Mainland immigrants
decreases while the percentage of senior adult
increases, especially in recent years.
These changes may have significant
consequences. First, since the Hong Kong
government cannot select the immigrants, and
hence skill-mismatch is likely, meaning that
those who immigrate to Hong Kong might not
have the skill set that Hong Kong’s economy
demands. Since it is easier to train young
people than senior adults, the composition
change may have implications for the quality
of the workforce in Hong Kong. Second, the
literature suggests that other things being equal,
immigrant workers are paid less in the labor
market (Chiswick and Miller, 2008, 2009;
Ferrer and Riddell, 2008; Nanos and Schluter,
2014). The early study of Hong Kong is also
consistent with the literature (Lam and Liu,
2002). Hence, although the immigrants to
Hong Kong might have a little overall effect on
the general wage (Suen, 2000), the coming of
immigrants contribute to the increase in income
inequality in Hong Kong (Lam and Liu, 1998).
While the immigrants affect the labor market
in different dimensions, their very presence
would imply a further tightening of the housing
market, because every human being demands a
shelter. An increase in the population imposes
additional pressure on the apparent housing
shortage. Some social scientists report that there
is a deterioration of attitude against Mainland
Chinese immigrants in Hong Kong (Lee et al.,
2016; Lee and Chou, 2018). Some authors seek
to investigate the effect of Mainland Chinese
immigrants on the housing price and rent in
Hong Kong. We conjecture that the immigrant
issue compounds with the Hong Kong identity
problem, and exerts pressure on the housing
market policies in Hong Kong. We leave the
empirical validation to future research.

Why is the Hong Kong housing market unaffordable? Some stylized facts and estimations∣ 25
Figure 6 Age Composition of the Immigrants from Mainland China
3. More Time Series Analysis
The previous section provides an informal
overview of the Hong Kong housing market and
the macroeconomy. In this section, we attempt
to provide more stylized facts with the minimum
statistical model. In particular, we show how the
time series of the aggregate data in Hong Kong
can be decomposed into different components
and the implications of such a diagnosis. To our
knowledge, this is the first time to apply the
unobserved component approach to decompose
time series of aggregate data in Hong Kong. In
section 3.1, we explain the justifications and
the setup of our econometric model. Readers
who are not interested in such technical issues
can go directly to section 3.2, which presents
our decomposition results of the Hong Kong
aggregate data.
3.1. Econometric Model
We have several considerations. First, for
Hong Kong and Mainland China, the aggregate
data is non-stationary. There are some “upward
trend” or “growth components” in the data.
Hence, statistical moments are not well defined
in the raw data, and we need to appropriately
“de-trend” the data. Second, it is well known
that the growth of GDP and other aggregate
variables are stochastic (Chu et al., 2012;

26 ∣中央銀行季刊 第42卷第1期 民國109年3月
Durlauf and Quah, 1999; King et al., 1988;
Leung and Quah, 1996; Leung et al., 2006;
Tang et al., 2008). It means that the traditional
method of removing a linear trend would not be
appropriate. Third, we try to maintain a “reduced
form” approach and do not impose much
“structure” in the statistical model. A merit of
this approach is to establish some stylized facts
that would inform the future development of
theoretical modeling (Cooley, 1995). Fourth,
the model should help us to visualize the
differences between changes that happen in the
“trend” component (i.e., changes that would
have lasting effects) from structural breaks
(i.e., dramatic changes that occur once and for
all). Fifth, if possible, we would like to take
advantage of the relatively new development in
time series econometrics, which may help us to
uncover overlooked “stylized facts.”
Based on these considerations, we consider
the following unobserved component model to
be appropriate (Commandeur and Koopman,
2007). It allows us to decompose a time series
into a trend component, a seasonal component,
a cyclical component, an irregular component,
and the possible structural breaks. Both the
number and timing of structural breaks are
endogenous in the sense that if there is no
structural break in the data, our econometric
model would truthfully report there is no
break. On the other hand, if there are multiple
structural breaks, the model would also
faithfully reflect those breaks. Formally, our
econometric model for the aggregate quarterly
data is as follows,18
Where is the raw time series data, is the
trend component, is the seasonal component,
is the cyclical component, are the level
breaks, and is the irregular component.
Following the literature, the trend component is
specified as
where is the slope or gradient of the trend.
, , and are mutually uncorrelated. Thus,
our formulation allows for a change in the
“growth rate,” if any. Some previous research
argues that the seasonal component is important
and may bias our estimation if we neglect it
(Beaulieu and Miron, 1992; Brendstrup et al.,
2004). We do not ex-ante conduct seasonal
adjustment on the series. Rather, we remove the
seasonal component through the unobserved
component model. The time-varying seasonal
Why is the Hong Kong housing market unaffordable? Some stylized facts and estimations∣ 27
can be established in a time-varying dummy
seasonal form (see, among others, Koopman
and Oom (2011)):
where is the number of seasonal frequencies in
a period (i.e., for quarterly data), and the
disturbance series is serially independent and
mutually independent of all other disturbance
series, for and
The initial variables are treated as
unknown coefficients that need to be estimated
together with the other coefficients in the model.
If the disturbance variance is estimated to
be zero, this stochastic formulation of seasonal
component reduces to a deterministic form.
Our specification of the cyclical component
is standard,
w h e r e i s a d a m p i n g f a c t o r ,
is the frequency, in radians. and
are two mutually uncorrelated NID disturbances
with zero mean and common variance . A
merit of this specification is to include both
regular and irregular cycles.
The structural break terms , which are
also known as “intervention variables,” take the
following forms:
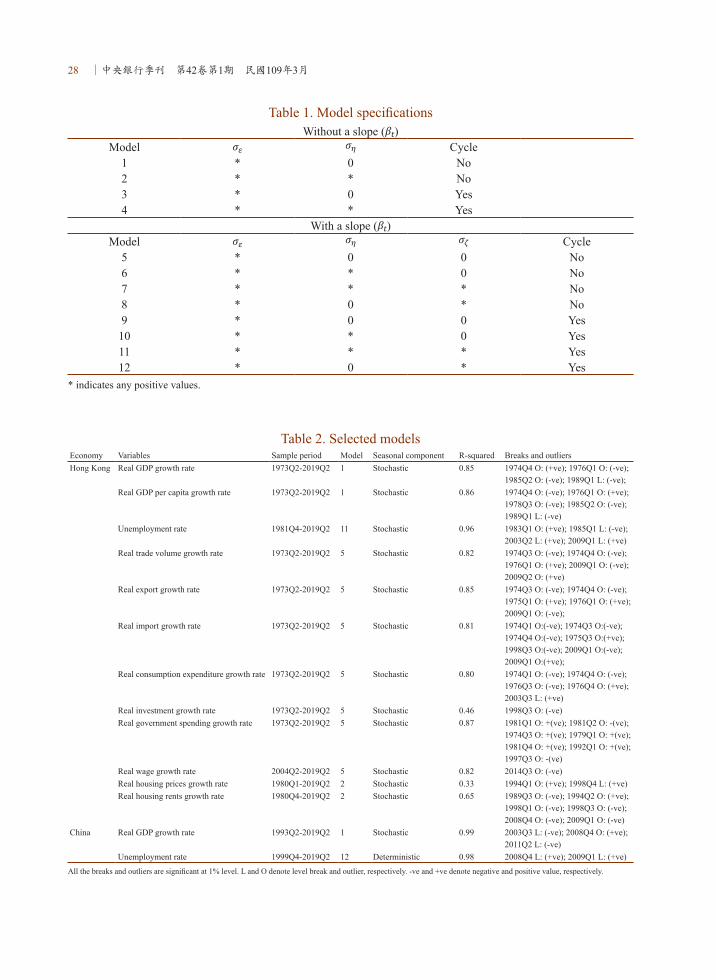
For detecting level breaks and outliers, a
t-test for auxiliary residuals would be carried
out. Table 1 shows different variations of the
unobserved component model. For growth
rates, we employ model 1-2 and 5-8 (without a
cycle); for level data, we use 3-4 and 9-12 (with
a cycle). Our model selection procedures are
as follows. (1) We estimate a candidate model
without any level breaks. (2) We conduct a
t-test for the auxiliary residuals to detect level
breaks. (3) We include level breaks detected
into the candidate model and repeat (2). To
guard against the possibility of “over-fitting,”
we, therefore, do not add interventions for every
level break detected. (4) We use both AIC and
BIC for model selection. Table 2 shows the
selected models.
28 ∣中央銀行季刊 第42卷第1期 民國109年3月
Table 1. Model specificationsWithout a slope ( )
Model Cycle1 * 0 No2 * * No3 * 0 Yes4 * * Yes
With a slope ( )Model Cycle
5 * 0 0 No6 * * 0 No7 * * * No8 * 0 * No9 * 0 0 Yes10 * * 0 Yes11 * * * Yes12 * 0 * Yes
* indicates any positive values.
Table 2. Selected modelsEconomy Variables Sample period Model Seasonal component R-squared Breaks and outliersHong Kong Real GDP growth rate 1973Q2-2019Q2 1 Stochastic 0.85 1974Q4 O: (+ve); 1976Q1 O: (-ve);
1985Q2 O: (-ve); 1989Q1 L: (-ve);Real GDP per capita growth rate 1973Q2-2019Q2 1 Stochastic 0.86 1974Q4 O: (-ve); 1976Q1 O: (+ve);
1978Q3 O: (-ve); 1985Q2 O: (-ve); 1989Q1 L: (-ve)
Unemployment rate 1981Q4-2019Q2 11 Stochastic 0.96 1983Q1 O: (+ve); 1985Q1 L: (-ve);2003Q2 L: (+ve); 2009Q1 L: (+ve)
Real trade volume growth rate 1973Q2-2019Q2 5 Stochastic 0.82 1974Q3 O: (-ve); 1974Q4 O: (-ve); 1976Q1 O: (+ve); 2009Q1 O: (-ve); 2009Q2 O: (+ve)
Real export growth rate 1973Q2-2019Q2 5 Stochastic 0.85 1974Q3 O: (-ve); 1974Q4 O: (-ve); 1975Q1 O: (+ve); 1976Q1 O: (+ve); 2009Q1 O: (-ve);
Real import growth rate 1973Q2-2019Q2 5 Stochastic 0.81 1974Q1 O:(-ve); 1974Q3 O:(-ve); 1974Q4 O:(-ve); 1975Q3 O:(+ve); 1998Q3 O:(-ve); 2009Q1 O:(-ve); 2009Q1 O:(+ve);
Real consumption expenditure growth rate 1973Q2-2019Q2 5 Stochastic 0.80 1974Q1 O: (-ve); 1974Q4 O: (-ve); 1976Q3 O: (-ve); 1976Q4 O: (+ve); 2003Q3 L: (+ve)
Real investment growth rate 1973Q2-2019Q2 5 Stochastic 0.46 1998Q3 O: (-ve)Real government spending growth rate 1973Q2-2019Q2 5 Stochastic 0.87 1981Q1 O: +(ve); 1981Q2 O: -(ve);
1974Q3 O: +(ve); 1979Q1 O: +(ve); 1981Q4 O: +(ve); 1992Q1 O: +(ve); 1997Q3 O: -(ve)
Real wage growth rate 2004Q2-2019Q2 5 Stochastic 0.82 2014Q3 O: (-ve)Real housing prices growth rate 1980Q1-2019Q2 2 Stochastic 0.33 1994Q1 O: (+ve); 1998Q4 L: (+ve)Real housing rents growth rate 1980Q4-2019Q2 2 Stochastic 0.65 1989Q3 O: (-ve); 1994Q2 O: (+ve);
1998Q1 O: (-ve); 1998Q3 O: (-ve); 2008Q4 O: (-ve); 2009Q1 O: (-ve)
China Real GDP growth rate 1993Q2-2019Q2 1 Stochastic 0.99 2003Q3 L: (-ve); 2008Q4 O: (+ve);2011Q2 L: (-ve)
Unemployment rate 1999Q4-2019Q2 12 Deterministic 0.98 2008Q4 L: (+ve); 2009Q1 L: (+ve)
All the breaks and outliers are significant at 1% level. L and O denote level break and outlier, respectively. -ve and +ve denote negative and positive value, respectively.
Why is the Hong Kong housing market unaffordable? Some stylized facts and estimations∣ 29
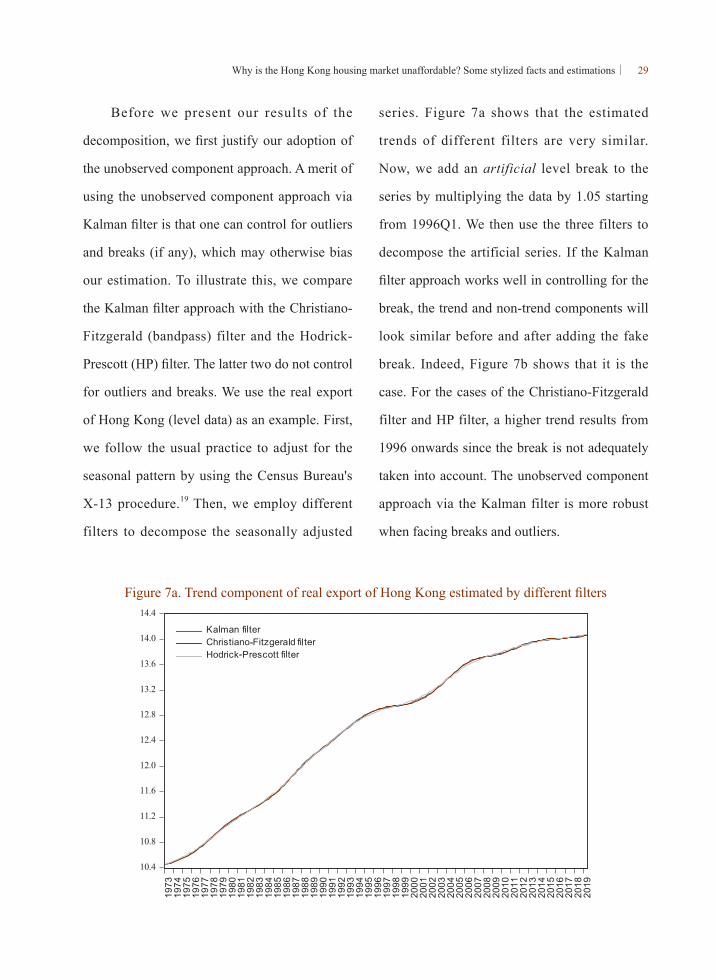
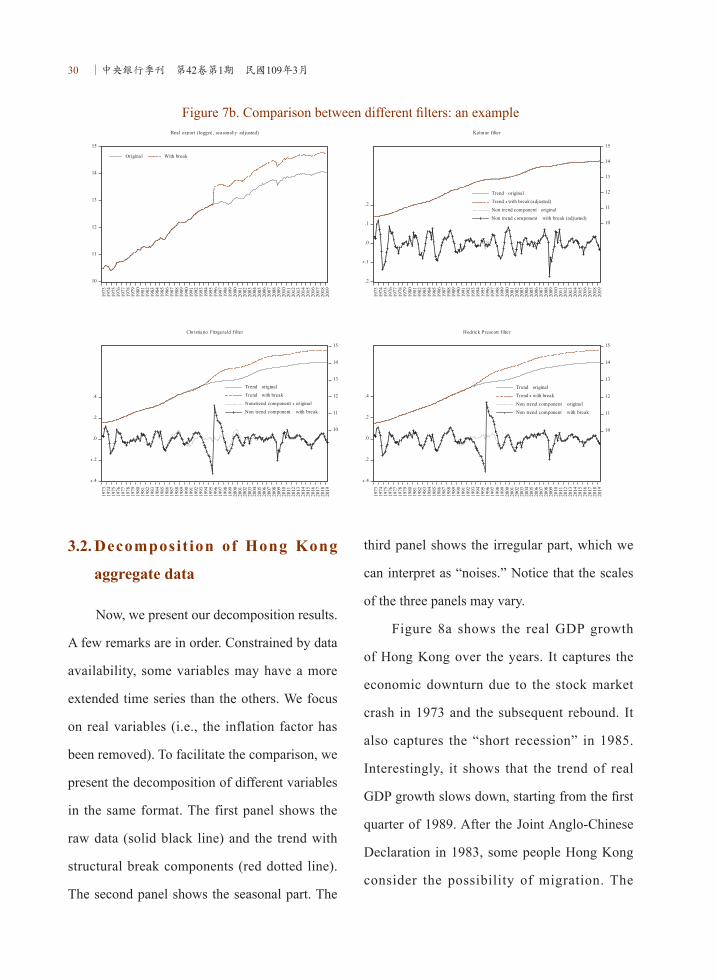
Before we present our results of the
decomposition, we first justify our adoption of
the unobserved component approach. A merit of
using the unobserved component approach via
Kalman filter is that one can control for outliers
and breaks (if any), which may otherwise bias
our estimation. To illustrate this, we compare
the Kalman filter approach with the Christiano-
Fitzgerald (bandpass) filter and the Hodrick-
Prescott (HP) filter. The latter two do not control
for outliers and breaks. We use the real export
of Hong Kong (level data) as an example. First,
we follow the usual practice to adjust for the
seasonal pattern by using the Census Bureau's
X-13 procedure.19 Then, we employ different
filters to decompose the seasonally adjusted
series. Figure 7a shows that the estimated
trends of different filters are very similar.
Now, we add an artificial level break to the
series by multiplying the data by 1.05 starting
from 1996Q1. We then use the three filters to
decompose the artificial series. If the Kalman
filter approach works well in controlling for the
break, the trend and non-trend components will
look similar before and after adding the fake
break. Indeed, Figure 7b shows that it is the
case. For the cases of the Christiano-Fitzgerald
filter and HP filter, a higher trend results from
1996 onwards since the break is not adequately
taken into account. The unobserved component
approach via the Kalman filter is more robust
when facing breaks and outliers.
Figure 7a. Trend component of real export of Hong Kong estimated by different filters
30 ∣中央銀行季刊 第42卷第1期 民國109年3月
Figure 7b. Comparison between different filters: an example
3.2. Decomposit ion of Hong Kong
aggregate data
Now, we present our decomposition results.
A few remarks are in order. Constrained by data
availability, some variables may have a more
extended time series than the others. We focus
on real variables (i.e., the inflation factor has
been removed). To facilitate the comparison, we
present the decomposition of different variables
in the same format. The first panel shows the
raw data (solid black line) and the trend with
structural break components (red dotted line).
The second panel shows the seasonal part. The
third panel shows the irregular part, which we
can interpret as “noises.” Notice that the scales
of the three panels may vary.
Figure 8a shows the real GDP growth
of Hong Kong over the years. It captures the
economic downturn due to the stock market
crash in 1973 and the subsequent rebound. It
also captures the “short recession” in 1985.
Interestingly, it shows that the trend of real
GDP growth slows down, starting from the first
quarter of 1989. After the Joint Anglo-Chinese
Declaration in 1983, some people Hong Kong
consider the possibility of migration. The
Why is the Hong Kong housing market unaffordable? Some stylized facts and estimations∣ 31
4th June event occurred in Beijing 1989, and
the subsequent trade restrictions imposed by
the U.S. on China accelerate the migration.20
According to Skeldon (1990, p.502), the
average emigration from Hong Kong is around
20,000 people between 1980 and 1986. Starting
1987, the annual emigration from 1987 to
1991 are 30,000, 45,800, 42,000, 62,000, and
58,000 respectively. Furthermore, Skeldon
(1990, p.505-6) reports that “… For example,
the applications for certificates of no criminal
conviction, which are required by most countries
in the course of visa applications, averaged
around 3,200 a month over the first half of 1989
but jumped to an average of 6,200 a month for
the second half of the year (there were 7,225
applications in August 1989 alone). The number
of visa petitions to the United States consulate
in August 1989 was 85 percent higher than for
the same month in the previous year while the
number of petitions for September was up by
233 percent.” Since emigrants tend to be well-
educated, the sudden increase in emigration
gives pressure to the supply of human capital,
and the Hong Kong government is forced to
respond. Wong (1992, p.13) reports that “…
Hong Kong government announced in 1989
an accelerated plan to increase the number of
first year, first degree places from about 7,000
at that time to 15,000 in 1995. This meant
making tertiary places available to 18 per cent
of the relevant age group in 1995 as compared
to the 7 per cent in 1989. The dramatic move
was made after the shock of the Tiananmen
incident in China. The main aims, according to
the government, were to cope with the exodus
of talents, to upgrade skills for the future, and to
satisfy parental demands so as to restore public
confidence in the territory.”

32 ∣中央銀行季刊 第42卷第1期 民國109年3月
Figure 8a. Decomposition of Hong Kong real GDP growth rate
Why is the Hong Kong housing market unaffordable? Some stylized facts and estimations∣ 33
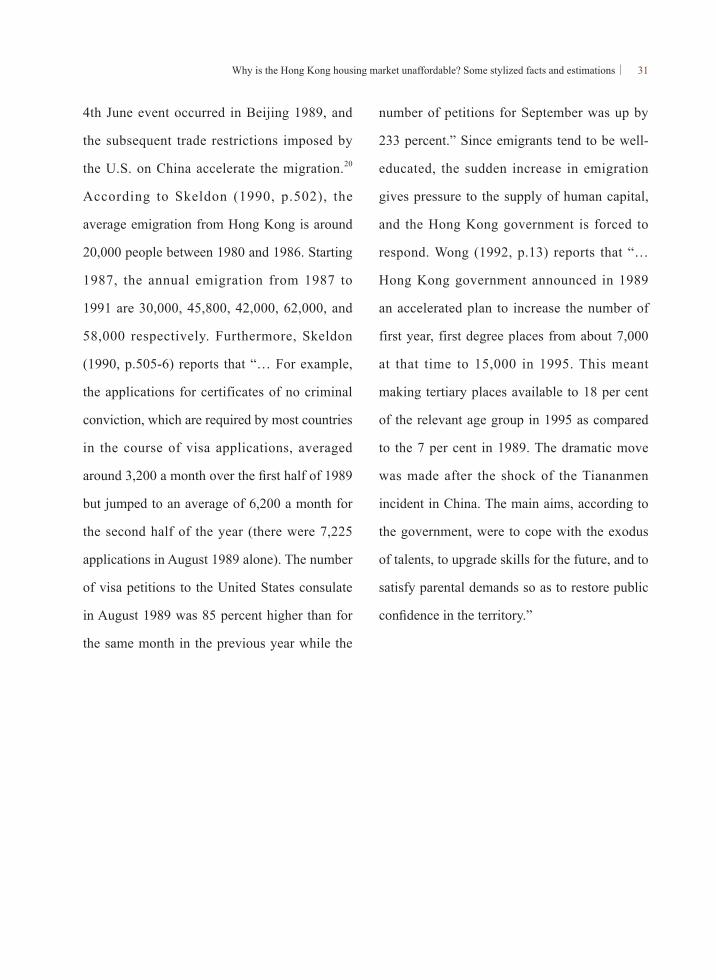
Figure 8b. Decomposition of China real GDP growth rate
34 ∣中央銀行季刊 第42卷第1期 民國109年3月
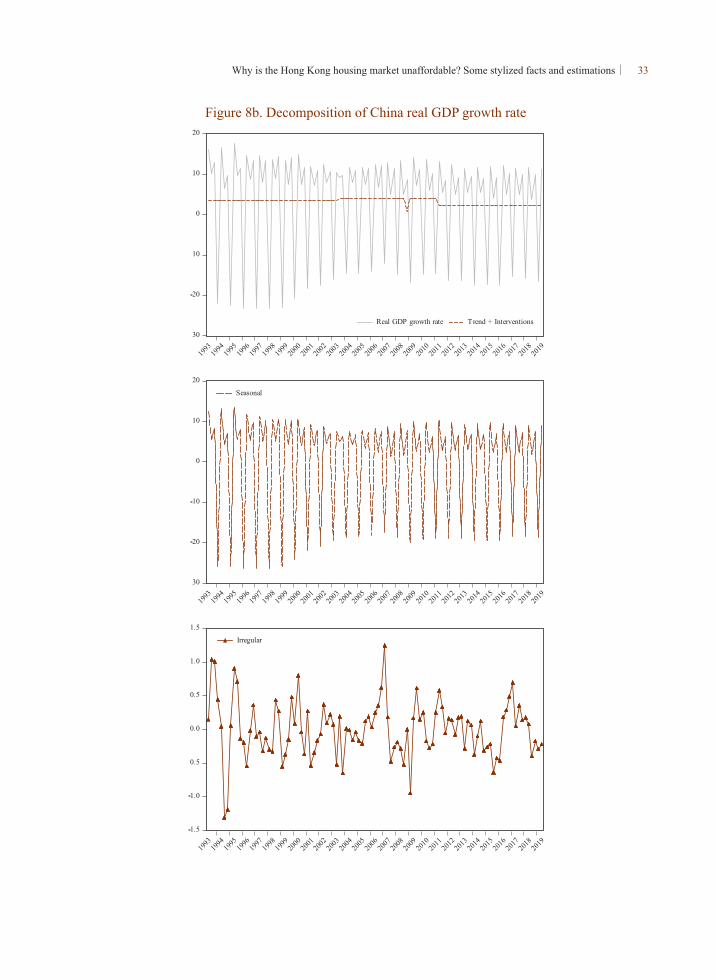
Figure 8c. Decomposition of Hong Kong real GDP per capita growth rate

Why is the Hong Kong housing market unaffordable? Some stylized facts and estimations∣ 35
Figure 8d. Decomposition of Hong Kong unemployment rate
Figure 8e. Decomposition of China unemployment rate
36 ∣中央銀行季刊 第42卷第1期 民國109年3月
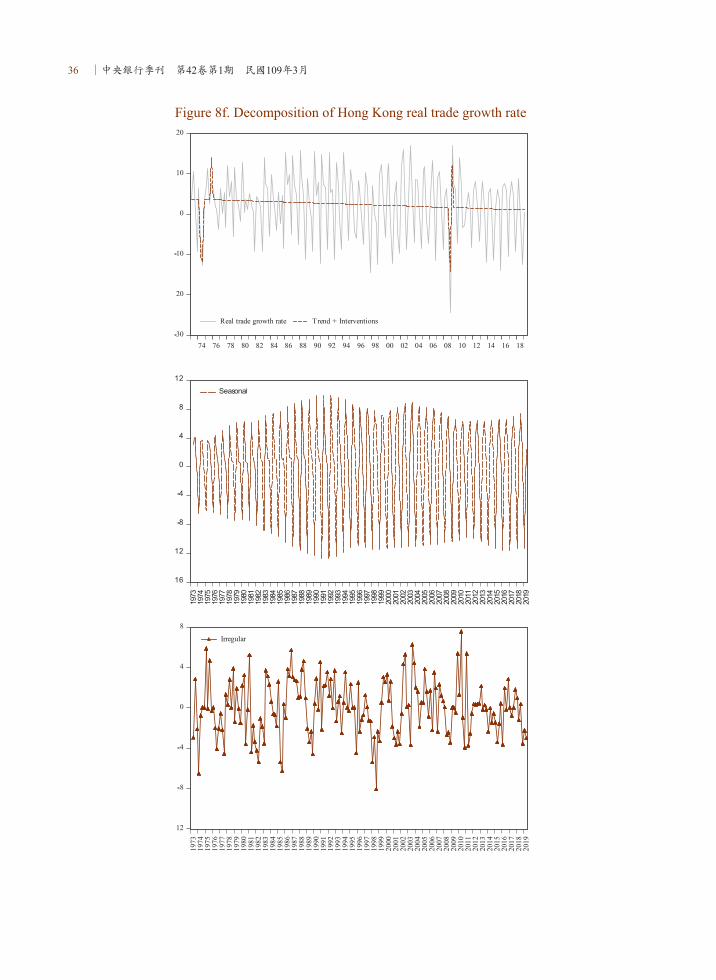
Figure 8f. Decomposition of Hong Kong real trade growth rate
Why is the Hong Kong housing market unaffordable? Some stylized facts and estimations∣ 37
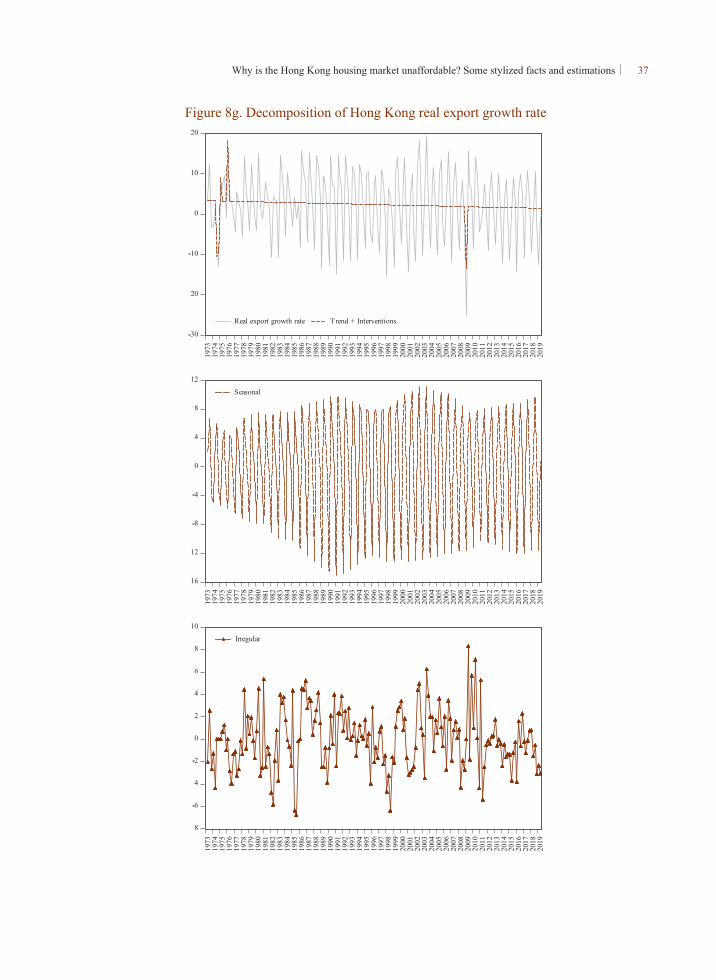
Figure 8g. Decomposition of Hong Kong real export growth rate
38 ∣中央銀行季刊 第42卷第1期 民國109年3月
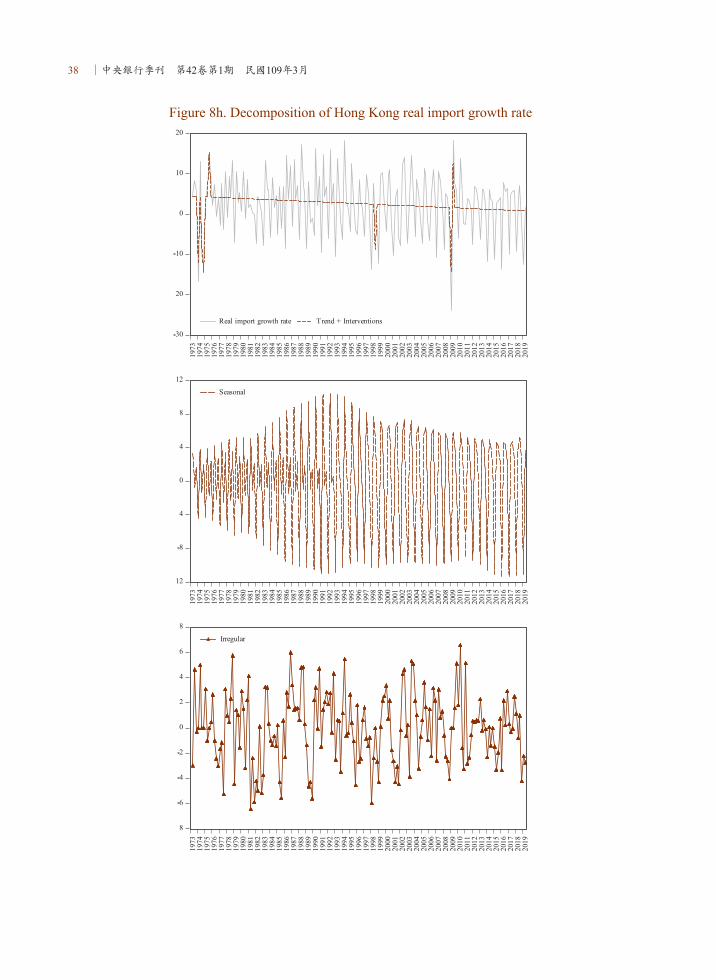
Figure 8h. Decomposition of Hong Kong real import growth rate
Why is the Hong Kong housing market unaffordable? Some stylized facts and estimations∣ 39
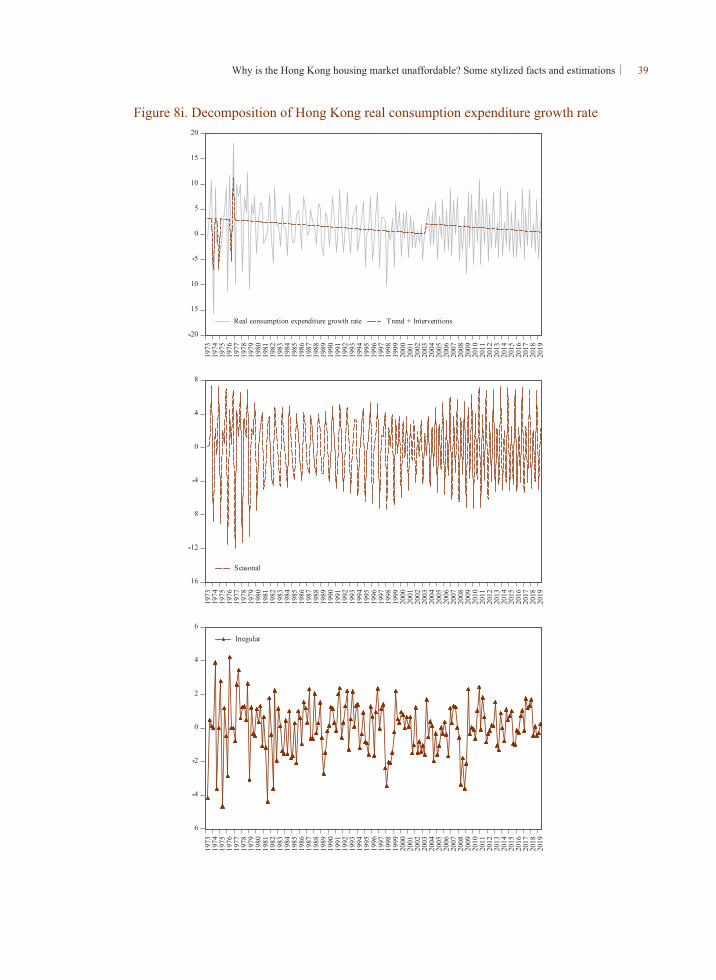
Figure 8i. Decomposition of Hong Kong real consumption expenditure growth rate

40 ∣中央銀行季刊 第42卷第1期 民國109年3月
Figure 8j. Decomposition of Hong Kong real investment growth rate

Why is the Hong Kong housing market unaffordable? Some stylized facts and estimations∣ 41
Figure 8k. Decomposition of Hong Kong real wage growth rate

42 ∣中央銀行季刊 第42卷第1期 民國109年3月
Figure 8l. Decomposition of Hong Kong real government spending growth rate
Why is the Hong Kong housing market unaffordable? Some stylized facts and estimations∣ 43
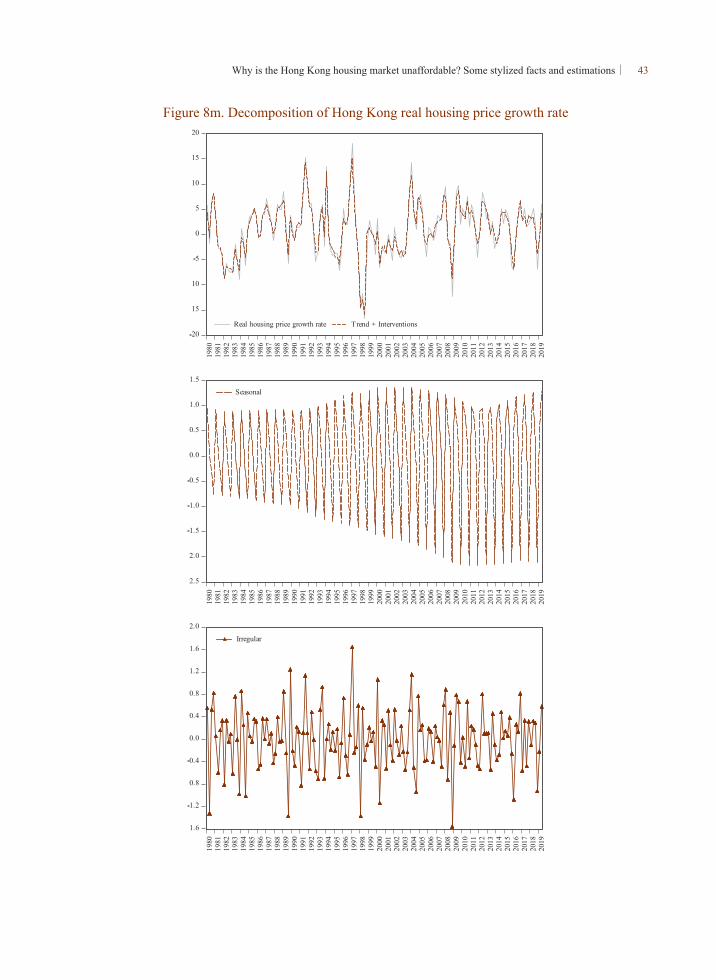
Figure 8m. Decomposition of Hong Kong real housing price growth rate

44 ∣中央銀行季刊 第42卷第1期 民國109年3月
Figure 8n. Decomposition of Hong Kong real housing rent growth rate
Why is the Hong Kong housing market unaffordable? Some stylized facts and estimations∣ 45
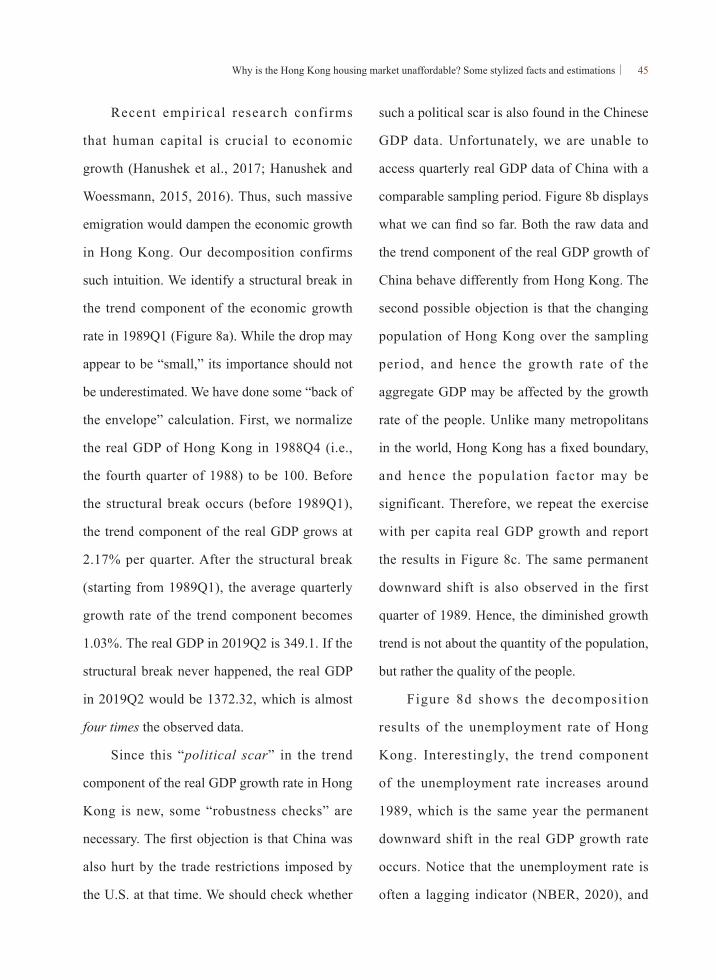
Recent empirical research confirms
that human capital is crucial to economic
growth (Hanushek et al., 2017; Hanushek and
Woessmann, 2015, 2016). Thus, such massive
emigration would dampen the economic growth
in Hong Kong. Our decomposition confirms
such intuition. We identify a structural break in
the trend component of the economic growth
rate in 1989Q1 (Figure 8a). While the drop may
appear to be “small,” its importance should not
be underestimated. We have done some “back of
the envelope” calculation. First, we normalize
the real GDP of Hong Kong in 1988Q4 (i.e.,
the fourth quarter of 1988) to be 100. Before
the structural break occurs (before 1989Q1),
the trend component of the real GDP grows at
2.17% per quarter. After the structural break
(starting from 1989Q1), the average quarterly
growth rate of the trend component becomes
1.03%. The real GDP in 2019Q2 is 349.1. If the
structural break never happened, the real GDP
in 2019Q2 would be 1372.32, which is almost
four times the observed data.
Since this “political scar” in the trend
component of the real GDP growth rate in Hong
Kong is new, some “robustness checks” are
necessary. The first objection is that China was
also hurt by the trade restrictions imposed by
the U.S. at that time. We should check whether
such a political scar is also found in the Chinese
GDP data. Unfortunately, we are unable to
access quarterly real GDP data of China with a
comparable sampling period. Figure 8b displays
what we can find so far. Both the raw data and
the trend component of the real GDP growth of
China behave differently from Hong Kong. The
second possible objection is that the changing
population of Hong Kong over the sampling
period, and hence the growth rate of the
aggregate GDP may be affected by the growth
rate of the people. Unlike many metropolitans
in the world, Hong Kong has a fixed boundary,
and hence the population factor may be
significant. Therefore, we repeat the exercise
with per capita real GDP growth and report
the results in Figure 8c. The same permanent
downward shift is also observed in the first
quarter of 1989. Hence, the diminished growth
trend is not about the quantity of the population,
but rather the quality of the people.
Figure 8d shows the decomposition
results of the unemployment rate of Hong
Kong. Interestingly, the trend component
of the unemployment rate increases around
1989, which is the same year the permanent
downward shift in the real GDP growth rate
occurs. Notice that the unemployment rate is
often a lagging indicator (NBER, 2020), and
46 ∣中央銀行季刊 第42卷第1期 民國109年3月
hence the structural break occurs in 1989Q1
would affect the unemployment rate in
subsequent quarters. The unemployment rate
experiences a further upward change around
the Asian Financial Crisis. It hits a peak around
2003 and then started to decline. It stabilizes at
a relatively low level after 2011. Yet the trend
component of the unemployment rate never
restores the low level in the late 1980s. Again,
to facilitate comparison, Figure 8e displays
the decomposition results for the counterpart
of China. Adjusting for the fact that the
sampling period of China is shorter, the China
unemployment rate exhibits a very different
pattern. It is not surprising since China is a vast
country and has a more complicated economic
environment.
Since some authors argue that international
trade tends to lead the housing market in Hong
Kong (Ho and Wong, 2008; Leung et al., 2006),
Figure 8f shows the growth rate of the real trade
volume, which is the sum of import and export
(including re-exports). The trend component
displays a downward trend. It means that the
trade volume grows at a decreasing rate over
the sampling period. Figures 8g and 8h show
the decomposition of the growth rates of export
and import, respectively. They are qualitatively
the same. These graphs are consistent with
the observation that Hong Kong becomes
increasingly dependent on the financial sector,
and the weight on international trade diminishes
over time.
Some authors debate whether we should
model the joint dynamics of non-durable
consumption and housing (Davis and Martin,
2009; Kwan et al., 2015; Leung, 2007, 2014;
Leung et al., 2011; Piazzesi, 2007). Therefore,
we also conduct a decomposition of the
aggregate consumption of Hong Kong and
present the results in Figure 8i. The trend
component is downward sloping, suggesting
that the aggregate real consumption of Hong
Kong is growing at a decreasing rate. Such a
downward trend may go unnoticed because the
seasonal fluctuations of consumption are large.
One possible interpretation is as follows. In
contrast to many theoretical models, housing
in practice is not infinitely divisible. Facing
continually increasing housing prices, potential,
as well as constrained home-buyers, need to
reduce non-durable consumption to pay for the
home mortgage.
We also decompose the aggregate time-
series of investment, as some authors highlight
the joint dynamics of residential and commercial
investment (Greenwood and Hercowitz, 1991;
Iacoviello and Neri, 2010; Jin et al., 2012; Jin

Why is the Hong Kong housing market unaffordable? Some stylized facts and estimations∣ 47
and Zeng, 2004). Unfortunately, there is only
one aggregate investment time series for Hong
Kong, and we are unable to separate residential
investment from commercial investment.
Figure 8j shows that the trend component of the
aggregate real investment in Hong Kong also
displays a downward trend. Again, covered by
the volatile seasonal cycles, an average citizen
might not detect such a downward trend. At
the same time, as the aggregate investment is
growing at a decreasing rate, and the population
is increasing at the same time, the economy may
not be able to generate enough “good jobs.”
Figure 8k shows the decomposition results of
the real wage in Hong Kong. While the raw
data of the wage growth rate is volatile, the
trend component is close to zero. It is consistent
with our previous result that, relative to the per
capita GDP, the wage index and the household
income suffers a deterioration over time.
Fiscal Policies impact the housing market
(Alpanda and Zubairy, 2017; Jin and Zeng,
2007). Economists have developed different
tools to assess the impact of various fiscal
policies, such as generational accounting
(Auerbach et al., 1994). Unfortunately, we have
no access to the needed data. Therefore, we only
decompose the growth rate of real government
spending. Figure 8l shows that except for a few
“unusual quarters,” the trend component of the
real government spending is almost a constant.
Throughout the sampling period, there are many
structural reforms in the government, including
the privatization of some shopping malls and
parking lots located in public rental housing.
However, the data we can access is simply an
aggregate sum, and we can only leave a more
detailed analysis of future research.
Finally, Figures 8m and 8n present the
decomposition results of the real house price
and rent. Several observations are in order.
While the trend components of the real GDP
growth, real wage, real trade volume, real
consumption, real investment, etc. are like
straight lines, the counterparts of the real house
price and rent behave very differently. In other
words, it may not be easy to predict the “trend”
of the house price and rent with merely the
trend components of the real variables. Figures
8m and 8n also show that, relative to the trend
components, the irregular components of both
house prices and rent are small. The seasonal
factors are significant, but by our construction,
they are predictable.
48 ∣中央銀行季刊 第42卷第1期 民國109年3月
4. Concluding Remarks
Why is the housing in Hong Kong so
“unaffordable”? We propose a variety of
reasons. First, there is a measurement issue.
Hong Kong has an unusually large public rental
sector, and about one-third of the population is
insulated from the market fluctuations. Another
one-seventh live in the housing of subsidized
ownership. The private housing market
accounts for roughly half of the people. The
usual house price-to-income ratio may not be an
appropriate metric for the housing affordability
in Hong Kong. Second, there seem to be some
long term reasons, including persistent GDP
growth, persistent population growth, extended
longevity, etc., which tend to drive up the
housing demand.
On the other hand, relative to the GDP per
capita, we show that the wage index and the
household income are unable to catch up with
the house price. The “competitive labor market
paradigm” is apparently at odds with the data.
Besides, we provide time series decomposition
of many time-series data of Hong Kong. We
find that since early 1989, the trend component
of the real GDP growth suffers a significant
drop, which we label as a “political scar.”
The trend component of the real wage growth
is almost zero, and the counterpart of real
consumption growth and real investment growth
declines steadily. Thus, the unaffordability of
Hong Kong housing may reflect the loss of
growth momentum in Hong Kong. At the same
time, the trend component of both real house
prices and rent are volatile and do not seem
to be in line with the counterparts of the real
variables we have decomposed. In Leung et al.
(2020) and other ongoing research, we point to
the possibility of restricted housing supply. This
issue alone may not explain the whole puzzle,
and more research efforts are needed in the
future.

Why is the Hong Kong housing market unaffordable? Some stylized facts and estimations∣ 49
Notes
1. It is beyond the scope of this paper to review the literature. Among others, see Bardhan et al. (2012), Ben-Shahar et al. (2008),
Bertaud (2018), Hårsman and Quigley (1991), Mera and Renaud (2000), Renaud et al. (2016).
2. It is beyond the scope of this paper to review the literature. Among others, see Case and Quigley (2008), Chang et al. (2012,
2013, 2016), Chen and Leung (2008), Favilukis et al. (2017), Garriga et al. (2017), Jin et al. (2012), Kan et al. (2004), Kiyotaki
and Moore (1997), Leung (1999, 2001, 2003), Leung and Chen (2006), Leung and Teo (2011), Leung and Tse (2017), Lin et al.
(2004), Malpezzi (2017), Tse and Leung (2002). For a review of the literature, see Davis and Van Nieuwerburgh (2014), Leung
(2004, 2017), Leung and Chen (2017), Leung and Ng (2019), Piazzesi and Schneider (2016).
3. It is beyond the scope of this paper to review the literature. Among others, see Cheung et al. (2017), Chong and Yiu (2019),
Chow et al. (2002), Funke and Paetz (2018), Huang et al. (2018), Kwan et al. (2015), Leung and So (2004), Leung and Sung
(2006), Leung and Tang (2012, 2015a, b), Leung and Wong (2004), Leung et al. (2013, 2014, 2015, 2019), Oxfam (2018), Sung
et al. (2015), Tang (2017, 2019), Wong (1998), Wong et al. (2018), Wu et al. (2017).
4. It is beyond the scope of this paper to review the literature. Among others, see Chen and Wen (2016), Chen et al. (2017), Deng
et al. (2017), Huang et al. (2015), Leung and Wang (2007), Leung et al. (2011), Wu et al. (2012, 2016).
5. The literature related to this recent trade war is growing. Among others, see Abiad et al. (2018), Amiti et al. (2019), Guo et al.
(2018), Mandelman and Waddle (2019), Tham et al. (2019).
6. Notice that the United States follows (approximately) a version of the Taylor rule, which is an interest rate rule (Koenig et
al., 2012). Since Hong Kong maintains a fixed exchange rate with the U.S., Hong Kong nominal interest rate follows the U.S.
counterpart. See Chang et al. (2012, 2013, 2016) for more discussion.
7. The government official website for data is https://www.censtatd.gov.hk/home.html.
8. For the co-movement between the stock price and housing price, see Leung (2007), Leung and Teo (2011) for theoretical
analysis, Chen and Shen (2005) for the case of Taiwan, and Chang et al. (2013), Kwan et al. (2015) for the case of Hong Kong.
9. For more details, see https://www.housingauthority.gov.hk/en/flat-application
10. Among others, see Gong and Leung (2019), Leung et al. (2012), Leung and Tang (2015) for more discussion on the public
housing allocation.
11. Since the public rental housing is highly subsidized, there is rationing. To be eligible for applying for public housing, the family
should satisfy the income and asset test prescribed by the Housing Authority. It typically takes several years for a household to
receive a public housing unit.
The official account of the rent policy in those public rental units can be downloaded from the government website: https://
www.housingauthority.gov.hk/en/common/pdf/about-us/policy-focus/policies-on-public-housing/B01/B01.pdf.
In October 2017, the Housing Authority tightened “Well-off Tenants Policies.” Households whose income exceeds five times
the current income limits (PRHILS) or whose total household net asset value exceeds 100 times PRHILs should vacate the flats.
For an earlier discussion, see Wong (1998) and the reference therein.
12. Among others, see Glaeser and Gyourko (2018), Green et al. (2005), Saiz (2010), and the reference therein.
13. For details, see https://www.pland.gov.hk/pland_en/tech_doc/hkpsg/full/pdf/ch2.pdf.
14. Among others, see Herkenhoff et al. (2017) for a structural estimation for the U.S. case.
15. For details, please visit https://www.policyaddress.gov.hk/2019/eng/highlights.html.

50 ∣中央銀行季刊 第42卷第1期 民國109年3月
16. The Hong Kong government also collects “stamp duties,” which are transaction taxes in the stock market and the real estate
market. However, we are unable to identify an official breakdown of the two markets. Hence, our measure of the “real estate-
related tax revenue” is indeed a lower bound.
17. For details, see https://www.immd.gov.hk/eng/faq/admission-scheme-mainland-talents-professionals.html
18. Data for Hong Kong is collected from Census and Statistic Department and Rating and Valuation Department. Data for China
is collected from CEIC. Real variables are obtained directly from the official sources, except for real housing prices and rents
of Hong Kong and the real GDP of China which is calculated by dividing the nominal variables by CPI. Real GDP per capita of
Hong Kong is calculated by dividing Real GDP by population (interpolated from semi-annual data).
19. Previously, we estimate the seasonal components by formulating in our model. However, the usual practice before applying
the HP filter and the Christiano-Fitzgerald is to conduct seasonal adjustments on the series since they do not consider seasonal
components within their frameworks. Therefore, to be consistent, we drop in our model for this comparison part and adjust
for the seasonal pattern by using the Census Bureau’s X-13 procedure before applying any filters.
20. Due to the lobby of the U.S. business sector, those trade restrictions were removed soon (Dietrich, 1999; Skidmore and Gates,
1997). For more discussion of the 4th June event, see Zhao (2001), among others.

Why is the Hong Kong housing market unaffordable? Some stylized facts and estimations∣ 51
Reference
Abiad, A., Baris, K., Bernabe, J. A., Bertulfo, D. J., Camingue-Romance, S., Feliciano, P. N., Mariasingham, M. J., and Mercer-
Blackman, V., 2018, The impact of trade conflict on developing Asia, Asian Development Bank, mimeo.
Alpanda, S., and Zubairy, S., 2017, Addressing household indebtedness: Monetary, fiscal or macroprudential policy?, European
Economic Review, 92(C), 47-73.
Amiti, M., Redding, S. J., and Weinstein, D., 2019, The Impact of the 2018 Trade War on U.S. Prices and Welfare, mimeo.
Auerbach, A. J., Gokhale, J., and Kotlikoff, L. J., 1994, Generational Accounting: A Meaningful Way to Evaluate Fiscal Policy,
Journal of Economic Perspectives, 8(1), 73-94.
Autor, D., Dorn, D., Katz, L. F., Patterson, C., and Van Reenen, J., 2017, The Fall of the Labor Share and the Rise of Superstar
Firms, mimeo.
Bardhan, A., Edelstein, R., and Kroll, C., eds, 2012, Global Housing Markets: Crises, Institutions and Policies, New York: John
Wiley & Sons.
Bardhan, A., Edelstein, R., and Leung, C. K. Y., 2004, A Note on Globalization and Urban Residential Rents, Journal of Urban
Economics, 56, 505-513.
Beaulieu, J.K., and Miron, J.A., 1992, Why do countries and industries with large seasonal cycles also have large business cycles?
Quarterly Journal of Economics 107, 621–656.
Becker, G., 1994, Human Capital: A Theoretical and Empirical Analysis with Special Reference to Education, Third Edition,
National Bureau of Economic Research.
Behrens, K., Kanemoto, Y., and Murata, Y., 2015, The Henry George Theorem in a second-best world, Journal of Urban Economics,
85(C), 34-51.
Ben-Shahar, D., Leung, C., and Ong, S. E., 2008, Mortgage Market Worldwide, Oxford: Blackwell.
Bertaud, A., 2018, Order without Design: How Markets Shape Cities, Cambridge: MIT Press.
Bredtmann, J., Otten, S., and Rulff, C., 2018, Husband’s Unemployment and Wife’s Labor Supply: The Added Worker Effect across
Europe, ILR Review, 71(5), 1201-1231.
Brendstrup, B., Hylleberg, S., Nielsen, M. R., Skipper, L., and Stentoft, L., 2004, Seasonality In Economic Models, Macroeconomic
Dynamics, 8(3), 362-394.
Bryan, M., and Longhi, S., 2018, Couples' Labour Supply Responses to Job Loss: Growth and Recession Compared, Manchester
School, 86(3), 333-357.
Case, K., and Quigley, J., 2008, How Housing Booms Unwind: Income Effects, Wealth Effects, and Feedbacks through Financial
Markets, European Journal of Housing Policy, 8(2), 161-180.
Chang, K. L., Chen, N. K., and Leung, C. K. Y., 2012, The Dynamics of Housing Returns in Singapore: How Important are the
International Transmission Mechanisms?, Regional Science and Urban Economics, 42(3), 516-530.
Chang, K. L., Chen, N. K., and Leung, C. K. Y., 2013, In the shadow of the United States: The International Transmission Effect of
Asset Returns, Pacific Economic Review, 18(1), 1-40.
Chang, K. L., Chen, N. K., and Leung, C. K. Y., 2016, Losing Track of The Asset Markets: The Case of Housing and Stock,
International Real Estate Review 19(4), 435-492.
Chen, K., and Wen, Y., 2016, The Great Housing Boom of China, mimeo.
52 ∣中央銀行季刊 第42卷第1期 民國109年3月
Chen, N. K., and Leung, C. K. Y., 2008, Asset Price Spillover, Collateral and Crises: with an Application to Property Market Policy,
Journal of Real Estate Finance and Economics, 37(4), 351-385.
Chen, T., Liu, L. X., Xiong, W., and Zhou, L. A., 2017, Real Estate Boom and Misallocation of Capital in China, mimeo.
Chen, S. W., and Shen, C. H., 2006, When Wall Street conflicts with Main Street—The divergent movements of Taiwan’s leading
indicators, International Journal of Forecasting, 22, 317– 339.
Cheung, Y. W., Chow, K. K., and Yiu, M. S., 2017, Effects of capital flow on the equity and housing markets in Hong Kong, Pacific
Economic Review, 22(3), 332-349.
Chiswick, B. R., and Miller, P. W., 2008, Why is the payoff to schooling smaller for immigrants?, Labour Economics, 15(6),
1317-1340.
Chiswick, B. R., and Miller, P. W., 2009, The international transferability of immigrants' human capital, Economics of Education
Review, 28(2), 162-169.
Chong, T. T. L., and Yiu, A. W. H., 2019, The Nexus between Visitor Arrivals and Residential Property Rents in Hong Kong, Pacific
Economic Review, forthcoming.
Chow, Y. F., Wong, N., Leung, C. K. Y., Cheng, E. H. F., and Yan, W. H., 2002, Hong Kong Real Estate Market: Facts and
Policies, Hong Kong: Ming Pao Publishing (In Chinese).
Chu, A. C., Leung, C. K.Y., and Tang, E., 2012, Intellectual property rights, technical progress and the volatility of economic growth,
Journal of Macroeconomics, 34(3), 749-756.
Commandeur, J.F., and Koopman, S.J., 2007, An Introduction to State Space Time Series Analysis, Oxford: Oxford University
Press
Cooley, T., ed., 1995, Frontiers of Business Cycle Research, Princeton: Princeton University Press.
Dao, M., Das, M., Koczan, Z., Lian, W., 2017, Why is Labor Receiving a Smaller Share of Global Income? Theory and Empirical
Evidence, mimeo.
Davis, M., and Martin, R. F., 2009, Housing, home production, and the equity- and value-premium puzzles, Journal of Housing
Economics, 18(2), 81-91.
Davis, M., and Van Nieuwerburgh, S., 2014, Housing, Finance and The Macroeconomy, NBER Working paper No. 20287.
Demographia, 2019, 15th Annual Demographia International Housing Affordability Survey: 2019, mimeo.
Deng, Y., Girardin, E., Joyeux, R., and Shi, S., 2017, Did Bubbles Migrate from The Stock to The Housing Market in China Between
2005 and 2010, Pacific Economic Review 22(3): 276-292.
Deng, Y., Sing, T. F., and C. Ren, 2014, The Story of Singapore’s Public Housing: From a Nation of Home-Seekers to a Nation of
Homeowners, in J. Chen et al. (eds.), The Future of Public Housing: Ongoing Trends in the East and the West, Berlin:
Springer-Verlag, DOI 10.1007/978-3-642-41622-4_7.
Dietrich, J. W., 1999, Interest Groups and Foreign Policy: Clinton and the China MFN Debates, Presidential Studies Quarterly,
29(2), pp. 280-296.
DiPasquale, D., 1999, Why don’t we know more about housing supply? Journal of Real Estate Finance and Economics, 18(1), 9-23.
DiPasquale, D., and Wheaton, W., 1996, Urban Economics and Real Estate Markets. Englewood Cliffs, NJ: Prentice-Hall.
Durlauf, S. N., and Quah, D. T., 1999, The new empirics of economic growth, in Taylor, J. B.., and Woodford, M., ed., Handbook of
Macroeconomics, volume 1, 235-308.
Erosa, A., Luisa Fuster, L., Kambourov, G., and R. Rogerson, 2017, Hours, Occupations, and Gender Differences in Labor Market

Why is the Hong Kong housing market unaffordable? Some stylized facts and estimations∣ 53
Outcomes, NBER Working Papers 23636.
Favilukis, J., Ludvigson, S., and Van Nieuwerburgh, S., 2017, The Macroeconomic Effects of Housing Wealth, Housing Finance and
Limited Risk Sharing in General Equilibrium, Journal of Political Economy 125(1), 140-222.
Ferrer, A., and Riddell, W. C., 2008, Education, credentials, and immigrant earnings, Canadian Journal of Economics, 41(1),
186-216.
Funke, M., and Paetz, M., 2018, Dynamic Stochastic General equilibrium-based Assessment of Nonlinear Macroprudential Policies:
Evidence from Hong Kong, Pacific Economic Review, 23(4), 632-657.
Garriga, C., Hedlund, A., Tang, Y., and Wang, P., 2017, Rural-Urban Migration, Structural Transformation, and Housing Markets in
China, NBER Working paper No. 23819.
George, H., 1879, Progress and Poverty, available from http://www.henrygeorge.org/pcontents.htm
Glaeser, E., and Gyourko, J., 2018, The Economic Implications of Housing Supply, Journal of Economic Perspectives, 32(1), 3–30.
Gong, Y., and Leung, C. K. Y., 2019, When education policy and housing policy interact: can they correct for the externalities?,
mimeo.
Green, R., and Malpezzi, S., 2003, A Primer on U.S. Housing markets and Housing Policy, Washington, D.C.: Urban Institute
Press.
Green, R., Malpezzi, S., and Mayo, S., 2005, Metropolitan-Specific Estimates of The Price Elasticity of Supply of Housing, and
Their Sources. American Economic Review, 95(2), 334-339.
Greenwood, J., and Hercowitz, Z., 1991, The Allocation of Capital and Time over the Business Cycle, Journal of Political Economy,
99(6), 1188–1214.
Greenwood, J., Guner, N., and Vandenbroucke, G., 2017, Family Economics Writ Large, Journal of Economic Literature, 55(4),
1346-1434.
Gutierrez, G., 2017, Investigating Global Labor and Profit Shares, mimeo.
Guo, M., Lu, L., Sheng, L., and Yu, M., 2018, The Day After Tomorrow: Evaluating the Burden of Trump's Trade War, Asian
Economic Papers, 17(1), 101-120.
Hanushek, E., Rivkin, S., and L.L. Taylor, L., 1996, Aggregation and the estimated effects of school resources, Review of Economics
and Statistics, 78(4), 611-627.
Hanushek, E., Ruhose, J., and Woessmann, L., 2017, Knowledge capital and aggregate income differences: Development accounting
for US states, American Economic Journal: Macroeconomics, 9(4), 184-224.
Hanushek, E., and Woessmann, L., 2015, The Knowledge Capital of Nations: Education and The Economics of Growth, Cambridge,
MA: MIT Press.
Hanushek, E., and Woessmann, L., 2016, Knowledge capital, growth, and the East Asian miracle, Science, 351(6271), 344-345.
Hårsman, B., and Quigley, J., 1991, Housing Markets and Housing Institutions: An International Comparison, Berlin: Kluwer
Academic Publishers.
Herkenhoff, K., Ohanian, L., and Prescott, E., 2017, Tarnishing The Golden and Empire States: Land-Use Restrictions and The U.S.
Economic Slowdown, NBER working paper 23790.
Ho, L. S., and Wong, G., 2008, Nexus Between Housing And The Macro Economy: The Hong Kong Case, Pacific Economic
Review, 13(2), 223-239.
Huang, D., Leung, C. K. Y., and Qu, B., 2015, Do Bank Loans and Local Amenities Explain Chinese Urban House Prices? China

54 ∣中央銀行季刊 第42卷第1期 民國109年3月
Economic Review, 34(C), 19-38.
Huang, D., Leung, C. K. Y., and Tse, C. Y., 2018, What account for the differences in rent-price ratio and turnover rate? A search-
and-matching approach, Journal of Real Estate Finance and Economics, 57(3), 431-475.
Hubbard, R. G., and O’Brien, A. P., 2016, Economics. New York: Pearson (6th Edition).
Iacoviello, M., and Neri, S., 2010, Housing Market Spillovers: Evidence from an Estimated DSGE Model, American Economic
Journal: Macroeconomics, 2(2), 125-164.
Jin, Y., Leung, C. K. Y., and Zeng, Z., 2012, Real Estate, The External Finance Premium and Business Investment: A Quantitative
Dynamic General Equilibrium Analysis, Real Estate Economics 40(1), 167-195.
Jin, Y., and Zeng, Z., 2004, Residential investment and house prices in a multi-sector monetary business cycle model, Journal of
Housing Economics, 13(4), 268-286.
Jin, Y., and Zeng, Z., 2007, Real estate and optimal public policy in a credit-constrained economy, Journal of Housing Economics,
16(2), 143-166.
Kan, K., Kwong, S. K. S., and Leung, C., 2004, The Dynamics and Volatility of Commercial and Residential Property Prices:
Theory and Evidence, Journal of Regional Science, 44(1), 95-123.
Kaplan, S. N., and Rauh, J., 2010, Wall Street and Main Street: What Contributes to the Rise in the Highest Incomes?, Review of
Financial Studies, 23(3), 1004-1050.
Karabarbounis, L., and Neiman, B., 2013, The Global Decline of the Labor Share, Quarterly Journal of Economics, 129(1), 61-103.
Kawano, M., 2014, Optimal process of urbanization in a developing country dynamic Henry George theorem, Letters of Spatial
Resource Sciences, 7, 195–204.
King, R. G., Plosser, C. I., and Rebelo, S. T., 1988, Production, growth and business cycles : I. The basic neoclassical model, Journal
of Monetary Economics, 21(2-3), 195-232.
Kiyotaki, N., and Moore, J., 1997, Credit Cycles, Journal of Political Economy 105(2), 211-248.
Koenig, E. F., Leeson, R., and Kahn, G. A. ed., 2012, The Taylor Rule and the Transformation of Monetary Policy, Stanford:
Hoover Institution Press.
Koopman, S. J., and Ooms, M., 2011, Forecasting economic time series using unobserved components time series models, in M.P.
Clements and D.F. Hendry (eds.), Oxford Handbook of Economic Forecasting, Oxford: Oxford University Press, Chapter 5,
pp. 129-162.
Kwan, Y. K., Leung, C. K. Y., and Dong, J., 2015, Comparing consumption-based asset pricing models: the case of an Asian city,
Journal of Housing Economics, 28(C), 18-41.
Lam, K. C., and Liu, P. W., 1998, Immigration, population heterogeneity, and earnings inequality in Hong Kong, Contemporary
Economic Policy, 16, 265-276.
Lam, K. C., and Liu, P. W., 2002, Relative returns to skills and assimilation of immigrants in Hong Kong, Pacific Economic Review,
7(2), 229–243.
Lee, S. Y., Ng, I. F. S., and Chou, K. L., 2016, Exclusionary attitudes toward the allocation of welfare benefits to Chinese immigrants
in Hong Kong, Asian and Pacific Migration Journal, 25(1), 41–61.
Lee, S. Y., and Chou, K. L., 2018, Explaining attitudes toward immigrants from Mainland China in Hong Kong, Asian and Pacific
Migration Journal, 27(3), 273–298.
Leung, C. K. Y., 1999, Income Tax, Property Tax, and Tariff in A Small Open Economy. Review of International Economics, 7(3),
Why is the Hong Kong housing market unaffordable? Some stylized facts and estimations∣ 55
541-554.
Leung, C. K. Y., 2001, Relating International Trade to The Housing Market. Review of Development Economics, 5(2), 328-35.
Leung, C. K. Y., 2003, Economic growth and increasing house price, Pacific Economic Review, 8(2), 183-190.
Leung, C. K. Y., 2004, Macroeconomics and Housing: a review of the literature, Journal of Housing Economics, 13(4), 249-267.
Leung, C. K. Y., 2007, Equilibrium Correlations of Asset Price and Return, Journal of Real Estate Finance and Economics, 34(2),
233-256.
Leung, C. K. Y., 2014, Error correction dynamics of house prices: An equilibrium benchmark, Journal of Housing Economics,
25(C), 75-95.
Leung, C. K. Y., 2017, Special issue on housing and financial stability: an introduction, Pacific Economic Review, 22(3), 273-275.
Leung, C. K. Y., and Chen, N. K., 2006, Intrinsic cycles of land price: a simple model, Journal of Real Estate Research, 28(3),
293-320.
Leung, C. K. Y., and Chen, N. K., 2017, A special issue on housing, credit markets, and the marcoeconomy: an introduction, Taiwan
Economic Review, 45(1), 1-3.
Leung, C. K. Y., Cheung, P. K. Y., and Tang, E. C. H., 2013, Financial Crisis and the Comovements of Housing Sub-markets: Do
relationships change after a crisis? International Real Estate Review, 16(1), 68-118.
Leung, C. K. Y., Chow, K. K., Yiu, M. S., and Tam, D. C., 2011, House Market in Chinese Cities: Dynamic Modeling, In-Sampling
Fitting and Out-of-Sample Forecasting, International Real Estate Review, 14(1), 85-117.
Leung, C. K. Y., Leong, Y. C. F., and Wong, K. S. K., 2006, Housing price dispersion: an empirical investigation, Journal of Real
Estate Finance and Economics, 32(3), 357-385.
Leung, C. K. Y., Leung, T. T. C., and Tsang, B. K. P., 2015, Tax-driven Bunching of Housing Market Transactions: The case of Hong
Kong, International Real Estate Review, 18(4), 473-501.
Leung, C. K. Y., Ma, W. Y., and Zhang, J., 2014, The Market Valuation of Interior Design and Developers strategies: a simple
Theory and some Evidence, International Real Estate Review, 17(1), 63-107.
Leung, C. K. Y., and Ng, J. C. Y., 2019, Macroeconomic Aspects of Housing, in Jonathan H. Hamilton, J. H., Dixit, A., Edwards, S.,
and Judd, K., ed., Oxford Research Encyclopedia of Economics and Finance, Oxford University Press. doi: http://dx.doi.
org/10.1093/acrefore/9780190625979.013.294
Leung, C. K. Y., Ng, J. C. Y. and Tang, E. C. H., 2020, What do we know about Housing Supply? The case of Hong Kong,
Economic and Political Studies, 8(1), 6-20.
Leung, C. K. Y., and Quah, D. T., 1996, Convergence, endogenous growth, and productivity disturbances, Journal of Monetary
Economics, 38(3), 535-547.
Leung, C. K. Y., Sarpca, S., and Yilmaz, K., 2012, Public Housing Units vs. Housing Vouchers: Accessibility, Local Public Goods,
and Welfare, Journal of Housing Economics, 21(4), 310-321.
Leung, C. K. Y., and So, R. W. M., 2004, Hong Kong Asset Market, Hong Kong: Ming Pao Publishing (In Chinese).
Leung, C. K. Y., and Sung, Y. W. ed., 2006, Economic Issues of Hong Kong and the Chinese Mainland: Challenges and
Opportunities, Hong Kong: Ming Pao Publishing (In Chinese).
Leung, C. K. Y., and Tang, E. C. H., 2012, Comparing two financial crises: the case of Hong Kong Real Estate Markets, in Bardhan,
A., Edelstein, R., and Kroll, C., ed., Global Housing Markets: Crises, Institutions and Policies, eds. by New York: John
Wiley & Sons, 377-398.
56 ∣中央銀行季刊 第42卷第1期 民國109年3月
Leung, C. K. Y., and Tang, E. C. H., 2015a, Speculating China economic growth through Hong Kong? Evidence from the stock
market IPO and real estate markets, International Real Estate Review, 18(1), 45-87.
Leung, C. K. Y., and Tang, E. C. H., 2015b, Availability, affordability and volatility: the case of Hong Kong housing market,
International Real Estate Review, 18(3), 383-428.
Leung, C. K. Y., Tang, S., and Groenewold, N., 2006, Growth Volatility and Technical Progress: A Simple Rent-seeking Model,
Journal of Economics, 88(2), 159-178.
Leung, C. K. Y., and Teo, W. L., 2011, Should the optimal portfolio be region-specific? A multi-region model with monetary policy
and asset price co-movements, Regional Science and Urban Economics, 41(3), 293-304.
Leung, C. K. Y., and Tse, C. Y., 2017, Flipping in the housing market, Journal of Economic Dynamics and Control, 76(C), 232-263.
Leung, C. K. Y., and Wang, W., 2007, Chinese Housing Market through the lens of DiPasquale-Wheaton model: a graphical attempt,
International Real Estate Review, 10(2), 131-165.
Leung, C. K. Y., and Wong, K. S., 2004, The construction and related industries in a changing socio-economic environment: the case
of Hong Kong, International Real Estate Review, 7(1), 139-176.
Lin, C. C., Mai, C. C., and Wang, P., 2004, Urban Land Policy and Housing in An Endogenously Growing Monocentric City.
Regional Science and Urban Economics, 34(3), 241-261.
Lubik, T., 2012, Aggregate labour market dynamics in Hong Kong, Pacific Economic Review, 17(2), 257-279.
Malpezzi, S., 2017, Residential real estate in the U.S. financial crisis, the Great Recession, and their aftermath, Taiwan Economic
Review, 45(1), 5–56.
Mandelman, F. and Waddle, A., 2019, Intellectual Property, Tariffs, and International Trade Dynamics, mimeo.
McKinsey, 2017, Housing affordability: A supply-side tool kit for cities, mimeo.
Mera, K., and Renaud, B., eds., 2000, Asia's Financial Crisis and the Role of Real Estate, New York: M. E. Sharpe.
Nanos, P., and Schluter, C., 2014, The composition of wage differentials between migrants and natives, European Economic Review,
65(C), 23-44.
NBER, 2020, The NBER's Business Cycle Dating Procedure: Frequently Asked Questions, available at https://www.nber.org/cycles/
recessions_faq.html
Newton, B., 1971, The Impact of Henry George on British Economists, I: The First Phase of Response, 1879-82; Leslie, Wicksteed
and Hobson, American Journal of Economics and Sociology, 30(2), 179-186.
OECD, 2016, Be flexible! Background brief on how workplace flexibility can help European employees to balance work and family,
mimeo.
Oxfam, 2018, Hong Kong Inequality Report, mimeo.
Piazzesi, M., and Schneider, M., 2016, Housing and Macroeconomics, NBER Working paper No. 22354.
Piazzesi, M., Schneider, M., and Tuzel, S., 2007, Housing, consumption and asset pricing, Journal of Financial Economics, 83(3),
531-569.
Renaud, B., Kim, K. H., and Cho, M., 2016, Dynamics of Housing in East Asia, New York: John Wiley & Sons, Ltd.
Saiz, A., 2010, The Geographic Determinants of Housing Supply. Quarterly Journal of Economics, 125(3), 1253-1296.
Skeldon, R., 1990, Emigration and the Future of Hong Kong, Pacific Affairs, 63(4), 500-523.
Skidmore, D., and Gates, W., 1997, After Tiananmen: The Struggle over U.S. Policy toward China in the Bush Administration,
Presidential Studies Quarterly, 27(3), 514-539.

Why is the Hong Kong housing market unaffordable? Some stylized facts and estimations∣ 57
Smart, A., 2006, The Shek Kip Mei Myth: Squatters, Fires and Colonial Rule in Hong Kong, 1950-1963, Hong Kong: Hong
Kong University Press.
Somerville, C. T., 1999, The Industrial Organization of Housing Supply: Market Activity, Land Supply and the Size of Homebuilder
Firms. Real Estate Economics, 27(4), 669-694.
Stigler, G., 1974, Henry Calvert Simons, Journal of Law & Economics, 17(1), 1-5.
Suen, W., 2000, Estimating the Effects of Immigration in One City, Journal of Population Economics, 13(1), 99-112.
Sung, Y. W., Ng, A. C. Y., Wu, Y., and Yiu, A. W. H., 2015, The Economic Benefits of Mainland Tourists for Hong Kong: The
Individual Visit Scheme (IVS) and Multiple Entry Individual Visit Endorsements (M-Permit), mimeo.
Tang, E. C. H., 2017, Real Estate Cycles and Housing Policies in Hong Kong, in Business Cycles: External / Internal Causes,
Economic Implications and Consumer Misconceptions, edited by K. Mitchell, Nova Science Publishers, 21-46.
Tang, E. C. H., 2019, Speculate a lot, mimeo.
Tang, S. H. K., Groenewold, N. and Leung, C. K. Y., 2008, The link between institutions, technical change and macroeconomic
volatility, Journal of Macroeconomics, 30(4), 1520-1549.
Tham, S. Y., Kam, A. J. Y. and Tee, B. A., 2019, US-China Trade War: Potential Trade and Investment Spill-overs into Malaysia,
mimeo.
Tirole, J., 1988, The Theory of Industrial Organization. Cambridge: MIT Press.
Tsai, I.C., 2013, The asymmetric impacts of monetary policy on housing prices: a viewpoint of housing price rigidity, Economic
Modelling, 31(C), 405-413.
Tse, C. Y., and Leung, C., 2002, Increasing Wealth and Increasing Instability: The Role of Collateral, Review of International
Economics 10(1), 45-52.
Wang, K., and Zhou, Y., 2006, Equilibrium Real Options Exercise Strategies with Multiple Players: The Case of Real Estate Market,
Real Estate Economics, 34(1), 1-49.
Wong, R.Y.C., 1998, On Privatizing Public Housing. Hong Kong: City University of Hong Kong Press.
Wong, S. K., Chau, K. W., Karato, K. and Shimizu, C., 2018, Separating the Age Effect from a Repeat Sales Index: Land and
Structure Decomposition, Journal of Real Estate Finance and Economics, 57, 351-366.
Wong, S. L., 1992, Emigration and stability in Hong Kong, Social Sciences Research Centre, Occasional Paper 7, University of
Hong Kong.
Wu, J., Gyourko, J. and Deng, Y., 2012, Evaluating Conditions in Major Chinese Housing Markets, Regional Science and Urban
Economics, 42(3) 531-543.
Wu, J., Gyourko, J. and Deng, Y., 2016, Evaluating The Risk of Chinese Housing Markets: What We Know and What We Need to
Know, China Economic Review, 39(C), 91-114.
Wu, T., Cheng, M. and Wong, K., 2017, Bayesian analysis of Hong Kong's housing price dynamics, Pacific Economic Review, 22,
312–331.
Yeung, Y. M. and Wong, T. K. Y., 2003, Fifty Years of Public Housing in Hong Kong: A Golden Jubilee Review and Appraisal,
Hong Kong: Chinese University Press and Hong Kong Housing Authority.
Zhao, D., 2001, The Power of Tiananmen: State-Society Relations and the 1989 Beijing Student Movement. Chicago:
University of Chicago Press.
58 ∣中央銀行季刊 第42卷第1期 民國109年3月
Reference in Chinese
香港移民潮,維基百科,https://zh.wikipedia.org/wiki/%E9%A6%99%E6%B8%AF%E7%A7%BB%E6%B0%91%E6%BD%AE。
BBC,2014,民調:五分之一香港居民考慮移民海外, 2014年9月22日https://www.bbc.com/zhongwen/trad/china/2014/09/
140922_hk_survey_migration。
股榮,2019,一年逾2萬內地[專才] 批來港,香港新生代的絕望,蘋果日報(即時財經),https://hk.finance.appledaily.com/
finance/realtime/article/20191204/ 。
鄒崇銘 主編,2013,不是土地供應:香港土地問題的迷思與真象,印象文字 InPress. ISBN : 978-988-12005-0-1。
鄒崇銘,2019,港鐵前路,何去何從,信報 Hong Kong Economic Journal,2019 10 22。
葉潔明,2019,政府沒統計移民,領事館去年數字顯示,港人定居加拿大台灣創13年新高,眾新聞 Citizen News,2019 07
16。
即時預報台灣的經濟成長率:MIDAS模型之應用∣ 59
即時預報台灣的經濟成長率:
MIDAS模型之應用*
吳俊毅、朱浩榜**
摘 要
經濟成長率係按季發布且公布時間較為落後,因此,若能充分利用頻率較高且
較為即時的經濟指標,將有助掌握當前的經濟成長情況。由於混合頻率資料抽樣
(mixed-data sampling, MIDAS)模型可直接建構高頻與低頻變數之間的關係,加上
大量經濟變數可提供有助預測經濟成長率的訊息,故本文應用MIDAS模型及大量月
頻指標,對台灣的經濟成長率進行即時預報(nowcast)。本文建構MIDAS、未受限
MIDAS、因子MIDAS及馬可夫轉換因子MIDAS等模型,發現:(1)月資料之即時資
訊的確有助提升當季經濟成長率的預報績效;(2)結合因子模型之預報績效相對較
佳;(3)若將變數依特性區分成商品部門、金融部門及勞動部門等類別,則使用金融
部門變數的共同因子將更能提升預報績效;(4)整體而言,萃取金融部門共同因子作
為高頻變數之MIDAS模型係表現最佳的即時預報模型,而考慮馬可夫轉換之非線性模
型則未表現較佳。
* 本文初稿完成於民國107年10月,108年11月修正完稿。本文感謝兩位匿名審稿人與中央銀行陳副總裁南光、林處長宗耀、林副處長淑華、吳副處長懿娟、蔡副處長烱民、陳科長裴紋、徐副研究員婉容及其他經濟研究處同仁,以及姚睿
教授於108年「總體金融與經濟情勢預測研討會」給予之寶貴意見。本文觀點為作者個人意見,與服務單位無關,若有任何疏漏或錯誤,概由作者負責。
** 作者分別為中央銀行經濟研究處副研究員與四等專員。

60 ∣中央銀行季刊 第42卷第1期 民國109年3月
壹、前 言
舉凡家計單位、企業之消費、投資等經
濟活動規畫,或是政府政策之制定、施行
等,均須參考整體經濟情勢的當前概況及未
來展望,據以擬定相關決策。然而,有些重
要經濟指標的資料頻率較低且發布時間較為
落後(如經濟成長率),較難即時提供有效
資訊,故可借助具有同時或領先性質、且資
料頻率較高的經濟指標,據此推估其當前走
勢,此即「即時預報」(nowcast)註1。即
時預報可隨時更新資訊,以供決策參考。
若欲借助高頻指標,則須面臨資料
頻率不一的問題;而混合頻率(m i x e d
frequency)模型同時包含高頻與低頻資料,
其最重要的課題即為處理高、低頻資料之
間的轉換。文獻上,若干模型均可用於處理
混合頻率資料。例如,橋樑方程式(bridge
equa t ions)先將高頻資料轉換成低頻資
料,再以模型建構兩者間的關係。而近期
仍在蓬勃發展的混頻模型,則是以Ghysels
et al.(2004)為濫觴之混合頻率資料抽樣
(mixed-data sampling, MIDAS)模型,其
設定簡便,並可直接建構高頻與低頻變數的
關係,毋須轉換資料頻率。國內方面,在
運用混頻資料預測台灣經濟成長率的文獻
中,實證模型仍多以橋樑方程式為主,如彭
素玲與周濟(2001)、林依伶(2013)、
張志揚(2013)等;以MIDAS模型預測台
灣經濟成長的實證研究仍偏少,如涂育嘉
(2015)。
爰此,本文以MIDAS模型即時預報台
灣的經濟成長率,且除了線性MIDAS模型
外,亦參照Guérin and Marcellino(2013)
與Bessec and Bouabdallah(2015)之做法,
結合MIDAS與馬可夫轉換模型(Markov-
switching model),建構非線性的即時預報
模型,藉以分析何種模型設定較能提升台
灣經濟成長率的預報績效。此外,本文運
用大量經濟變數,並透過因子模型(factor
model)萃取共同因子作為模型的高頻變
數,避免橋樑模型僅採少量的高頻變數,而
產生的變數選擇問題。本文亦參採徐士勛等
(2005)與陳宜廷等(2011),將各變數依
照其特性及定義分類成商品部門、金融部門
及勞動部門,探討是否能以不同部門的共同
因子改善經濟成長率的預報績效。
本文樣本期間為1992年第1季至2017年
第3季,蒐集79個月頻經濟指標,對2012
年第1季至2017年第3季的資料進行樣本外
即時預報與績效評估。實證結果可歸納如
下:(1)月資料之即時資訊的確有助預報
當季經濟成長率;(2)萃取共同因子作為
MIDAS模型的高頻變數,其預報績效將相
對優於僅以平均的方式混合(pool)不同高
頻資料的即時預報結果;(3)運用金融部
即時預報台灣的經濟成長率:MIDAS模型之應用∣ 61
門變數之共同因子的即時預報績效表現頗
佳,可能與台灣為小型開放經濟體易受國
際影響之特性有關;(4)萃取金融部門共
同因子作為高頻變數之MIDAS模型表現最
佳,考慮馬可夫轉換之非線性預測模型則未
表現較佳。
除本節為前言外,後續各節安排如下。
第2節回顧MIDAS及國內應用混合頻率模型
的相關文獻,第3節介紹本文使用的MIDAS
預測模型。第4節將進行即時預報並評估其
績效,內容包括評估方法、資料說明,以及
評估的結果等。最後,第5節為本文結論。
貳、文獻回顧
在混合頻率的樣本資料上,橋樑方程式
是一種常見的處理方法,其透過線性迴歸
模型建構高頻與低頻資料之間的統計關係
(如Baffigi et al., 2004; Paragi and Golinelli,
2007)。然而,在即時預報時,高頻資料往
往僅部分可得,故須先代入尚未發布的高頻
資料之預測值,再將其轉為低頻資料,方能
建構兩者之間的關係。
相異於橋樑方程式, G h y s e l s e t
a l .( 2 0 0 4)另闢蹊徑,藉由較為精簡
( p a r s i m o n i o u s)的落後分配多項式
(distributed lag polynomial)的形式,直
接建構高頻與低頻變數之間的關係,此即
MIDAS模型。因此,不僅毋須代入高頻資料
的預測值,亦不必將高頻資料轉為低頻註2。
其後,MIDAS模型延伸出其他形式,並
可結合其他不同的模型,使其應用範圍更加
廣泛。例如,Clements and Galvão(2008)
以加入AR項的AR-MIDAS模型預測美國經
濟成長率;而Andreou et al.(2013)則先萃
取日頻金融變數的共同因子,再以加入AR
項的ADL-MIDAS(augmented distributed
lag MIDAS)模型預測美國經濟成長率,
且兩者的短期預測績效均佳。兩者皆含
AR項,箇中差異在於AR-MIDAS為受限
(restricted)模型,而ADL-MIDAS則為未
受限(unrestricted)模型。另為充分利用
大量總體變數蘊含的訊息,Marcellino and
Schumacher(2010)將MIDAS模型結合因
子模型,從大量的月頻變數萃取共同因子,
藉以預測德國的經濟成長率;Guérin and
Marcellino(2013)則將MIDAS模型結合馬
可夫轉換模型,並預測美國經濟成長率,發
現其預測績效優於線性的MIDAS模型。
一般而言,MIDAS模型在經濟成長率
的短期預測方面往往有不錯的表現。除前述
以美國、德國之經濟成長率為預測標的之相
關研究外,Kuzin et al.(2011)、Foroni and
Marcellino(2014)及Schumacher(2016)
等均使用大量的經濟指標,比較不同混合頻
62 ∣中央銀行季刊 第42卷第1期 民國109年3月
率模型對歐元區GDP或其組成分的預測績
效,並皆得到類似的結論。
在國內方面,運用不同資料頻率預測
經濟成長率的文獻可溯自沈中華與劉瑞文
(1994)。該文建立共含14條方程式的總
體計量模型,其中包含6個月頻變數。在預
測上,該文先以貝氏VAR(Bayesian VAR,
BVAR)模型求得月頻變數之預測值,再轉
為季頻資料並代入總體計量模型進行預測。
彭素玲與周濟(2001)則建構台灣的總體
經濟即期季模型(current quarterly model,
CQM)。該文篩選與GDP各組成分關係密切
的月頻變數,利用ARIMA模型求得月頻變
數之預測值後,再以橋樑方程式預測GDP各
組成分。
張志揚(2013)與林依伶(2013)採
用的方法與彭素玲與周濟(2001)相似。
其中,張志揚(2013)以BVAR模型預測
高頻資料,再以動態最小平方法(dynamic
OLS)估計橋樑方程式,並預測GDP及其組
成分。另因月頻資料易受農曆春節等季節性
因素干擾,林依伶(2013)先對月頻資料進
行X-12季節調整,建構適合台灣月頻資料的
模型,再將月頻資料的實際值或預測值透過
橋樑方程式代入CQM,以預測GDP及其組成
分。
相較橋樑方程式或C Q M的做法,涂
育嘉(2015)運用單、多變量與因子等線
性MIDAS模型預測台灣經濟成長率,發現
MIDAS模型的預測績效頗佳。姚睿與洪嘉陽
(2016)則將混合頻率資料結合小型開放經
濟之動態隨機一般均衡(dynamic stochastic
general equilibrium)模型,建立台灣的混合
頻率動態結構總體模型,以預測GDP走勢。
綜上所述,MIDAS模型毋須透過橋樑
方程式的轉換,可直接建構高頻與低頻變數
之間的關係,並在短期預測方面有不錯的表
現。國內相關文獻多採橋樑方程式的做法,
有關MIDAS模型的研究仍不多,故本文擬藉
月頻經濟指標,以MIDAS模型對台灣的經濟
成長率進行即時預報。其次,在不同的經濟
成長狀態(regime)下,經濟變數之間的關
係亦可能不同(徐士勛與管中閔,2001),
線性模型未必配適得宜。因此,本文亦考慮
Guérin and Marcellino(2013)提出的馬可夫
轉換MIDAS(Markov-switching MIDAS, MS-
MIDAS)模型,以彌補上述缺點。最後,
目前國內文獻多採用少量與預測標的關聯性
高的變數,但使用大量經濟變數蘊含的訊息
有助預測台灣的經濟成長率(徐士勛等,
2005),故本文不特別挑選變數,而逕將大
量的月頻經濟指標用於即時預報,俾提升對
經濟成長率的預測能力。

即時預報台灣的經濟成長率:MIDAS模型之應用∣ 63
參、預測模型簡介
一、MIDAS模型
藉由較為精簡的落後分配多項式的形
式,MIDAS模型可直接建構高頻與低頻變數
之間的關係(Ghysels et al., 2004)。首先,
定義符號如下: 為低頻資料的時間單位,
且 ; 為時間單位內,高頻資料
出現的次數; 為低頻變數; 為高
頻變數,而 表過去第 個出現的
變數,且 。因此,若資料型態為
季與月頻率之混合,則在第 季時,最後出
現、第二個出現及第一個出現的月資料將分
別為 、 及 。
假設要預測向前 期的低頻變數,基本
的MIDAS模型可表示為
(1)
其中 且
; ;
為誤差項。其中, 為落後分配多項
式,具有「exponential Almon Lag」的形
式:
在模型估計上,可用非線性最小平方法
(nonlinear least square, NLS)估計。
由於在時間序列模型中,落後期的被解
釋變數往往可提供有助預測的資訊,故本文
參照Andreou et al.(2013)註3,在(1)式中
加入被解釋變數的落後項 :
(2)
二、未受限MIDAS模型
若在低頻資料的單位時間內,高頻資
料出現的次數 不大(如季與月之混合頻
率資料),Foroni et al.(2015)建議可不
必予以(1)式中 的限制,此
即未受限的MIDAS(unrestricted MIDAS,
U-MIDAS)模型。由於本文利用月資料作為
高頻指標預測季頻的經濟成長率,故可使用
U-MIDAS模型作為預測模型。
同樣地,本文在U-MIDAS模型加入被解
釋變數的落後項,其模型可表示為
(3)
由於(3)式並無 的限制,故可
逕以OLS估計。
三、因子MIDAS模型
若欲將大量的經濟變數應用於經濟分
析,一種常見的做法是利用因子模型從大
量變數中萃取有效資訊(Stock and Watson,
2002)。Marcellino and Schumacher(2010)

64 ∣中央銀行季刊 第42卷第1期 民國109年3月
建議可結合因子模型與MIDAS模型,利用因
子MIDAS(factor MIDAS, f-MIDAS)模型
將大量高頻變數的資訊應用於低頻變數之預
測。該模型屬於插件式(plug-in)的計量模
型,其先估計所有經濟變數的因子向量後,
再將萃取出的因子代入預測迴歸式進行預
測。
首先說明因子模型的建立與估計方式。
假設 是第 個定態(stationary)的月頻經
濟變數在時間點 的觀察值,則可將 標
準化後,建立因子模型如下:
其中, 為維度 且不隨變數改變的因
子向量, 為維度 之第 個變數的因
子負載(factor loading)向量, 則是誤差
項。接著,將 個經濟變數與因子堆疊後,
可得
(4)
其中, 為維度 的
因子負載矩陣,而 且
;代表 個經濟變數
係由 個共同因子 所決定。
至於(4)式因子模型之估計,本文
係以主成分分析(principal components
analysis)方法估計因子與因子負載向量。在
估計時,模型須滿足標準化的限制條件
以避免產生參數認定問題。其中, 為 堆
疊而成且維度為 的矩陣, 則為單位矩
陣(identity matrix)。詳見Stock and Watson
(2002)或徐士勛等(2005)之說明。
其次,將(4)式之因子模型所萃取出
的共同因子 代入(2)式中的 ,可得到
(5)
其估計方法與MIDAS模型相同,可採NLS估
計之。
四、馬可夫轉換因子MIDAS模型
前述之MIDAS、U-MIDAS或f-MIDAS
模型均屬線性模型,但在不同的經濟成長狀
態下,經濟變數之間的關係亦可能不同,線
性模型未必配適得宜。因此,本文考慮以
Guérin and Marcellino(2013)提出的馬可夫
轉換MIDAS(Markov-switching MIDAS, MS-
MIDAS)模型彌補上述缺點。
根據Hamilton(1989),馬可夫轉換模
型透過不可觀察的狀態變數(state variable)
區分時間序列資料在不同狀態下的行為,
且狀態變數依循馬可夫鏈(Markov chain)
變動,是一種非線性模型。G u é r i n a n d
Marcellino(2013)之MS-MIDAS模型即是
將馬可夫轉換模型結合MIDAS模型。簡介如
下。
首先,可將(2)式改寫成:

即時預報台灣的經濟成長率:MIDAS模型之應用∣ 65
(6)
其 中 , 為 間 斷 變 數 ( d i s c r e t e
v a r i a b l e),可視為無法觀察的經濟狀
態 ; 。 假 設
且 的變動遵循一階馬可
夫鏈,則轉換機率(transition probability)
為:
;
(7)
此外,不同於MIDAS模型通常採NLS方法進
行估計,MS-MIDAS模型係以最大概似估計
法(maximum likelihood estimation, MLE)
估計(6)式及(7)式註4。
其次,將(4)式之因子模型所萃取
出的共同因子 代入(6)式中的 ,此
即馬可夫轉換之因子MIDAS(MS-factor
MIDAS)模型(Bessec and Bouabdallah,
2015)。同樣地,馬可夫轉換之因子MIDAS
模型採兩階段方式進行估計:先從經濟變
數中萃取共同因子註5,再將共同因子代入
MIDAS模型,以MLE估計高頻資料與低頻
資料之間的關係。
由於徐士勛與管中閔(2001)、林常青
等(2002)均建構兩種狀態的馬可夫轉換
模型分析台灣總體經濟之相關議題,故本文
亦建構兩種狀態的馬可夫轉換因子MIDAS
模型(即 )。仿照文獻上的做法
(Guérin and Marcellino, 2013; Bessec and
Bouabdallah, 2015),本文建構的馬可夫轉
換因子MIDAS模型可分為僅截距項、誤差變
異數可隨不同狀態而改變的MSI-f-MIDAS模
型
(8)
以及截距項、高頻資料(即因子)係數與
誤差變異數均可隨不同狀態改變的MS-f-
MIDAS模型
(9)
肆、預測績效評估
一、資料
在資料方面,本文參考徐士勛等
(2005)、黃裕烈等(2005)與陳宜廷等
(2011),選取涵蓋工業生產、政府稅收、景
氣動向、物價指數、就業與薪資、貨幣與金
融等面向之79個經濟變數,資料來源為主計
總處之「總體統計資料庫」與美國聖路易聯
邦準備銀行之「FRED經濟資料庫」(Federal
Reserve Economic Data)。本文不僅全數使用
79個變數,亦參考徐士勛等(2005)與陳宜廷
66 ∣中央銀行季刊 第42卷第1期 民國109年3月
等(2011)之做法,將變數依照其特性及定義
分類成商品、勞動與金融等3個部門。商品部
門含有32個變數,包括景氣動向、政府稅收、
生產與銷售指數、貿易、消費與投資等資料;
勞動部門則含15個變數,包括就業、失業、受
僱人數、工時及薪資等資料;金融部門含有32
個變數,包括貨幣總計數、存款、放款、利
率、匯率、油價及物價指數等資料。由於主成
分分析不受變數間的線性關係影響,因此,即
使變數之間密切相關,仍可同時將所有變數均
納入分析。
本文依據變數為水準值(level)或比率
(ratio),採取不同的方式處理資料。若變
數為水準值,則除了利率之外均取對數,再
依ADF(augmented Dickey–Fuller)檢定的
結果決定是否須取差分;若變數為比率,則
直接進行ADF檢定後,再決定是否須取差
分註6。此處的差分係用「年差分」(annual
difference),即以當期變數對其上年同期差
分。依上述方式將變數處理完後,再將其標
準化,相關步驟可參見徐士勛等(2005)與
陳宜廷等(2011)。本文各變數之說明、處
理方式及部門類別等,詳見附表。
二、評估方法說明
本文目的係即時預報台灣的經濟成長
率,考慮的模型包括(2)式之MIDAS模
型、(3)式之U-MIDAS模型、(5)式
之f-MIDAS模型,以及(8)式之MSI-f-
MIDAS模型與(9)式之MS-f-MIDAS模型
等,共5個模型。
如前所述,本文使用大量的月頻經濟
指標作為高頻資料。在應用上,f-MIDAS、
MSI-f-MIDAS與MS-f-MIDAS等模型係利
用因子模型萃取單一共同因子後,再代入
模型進行估算。至於MIDAS與U-MIDAS
模型,由於直接將大量高頻資料代入不僅
增加模型求解的複雜度,且有自由度的問
題,故本文參照相關文獻,以平均的方式
混合不同高頻資料的即時預報結果(Kuzin
et al., 2011; Schumacher, 2016)註7。至於模
型的落後期數,本文選擇經濟成長率的落
後期為4( )、月資料的落後期為12
( ),以納入過去一年內的訊息。
為評估各模型對台灣經濟成長率的即時
預報績效,本文將樣本區分成樣本內(in-
sample)與樣本外(out-of-sample)之資
料,再以樣本外預測的方式,評估各模型的
預測表現。由於部分資料僅能溯自1991年,
且為保留部分資料作為模型的落後期,故本
文以1992年做為樣本起始點。
首先,本文將以1992年第1季至2011年
第4季的資料進行樣本內估計,再參考多數
文獻上的做法,以遞迴(recursive)的方
式,對2012年第1季至2017年第3季逐月進行
樣本外即時預報及績效評估註8。由於台灣的
即時資料(real-time data)並不完整,故本
文使用修正後資料(revised data)。其次,
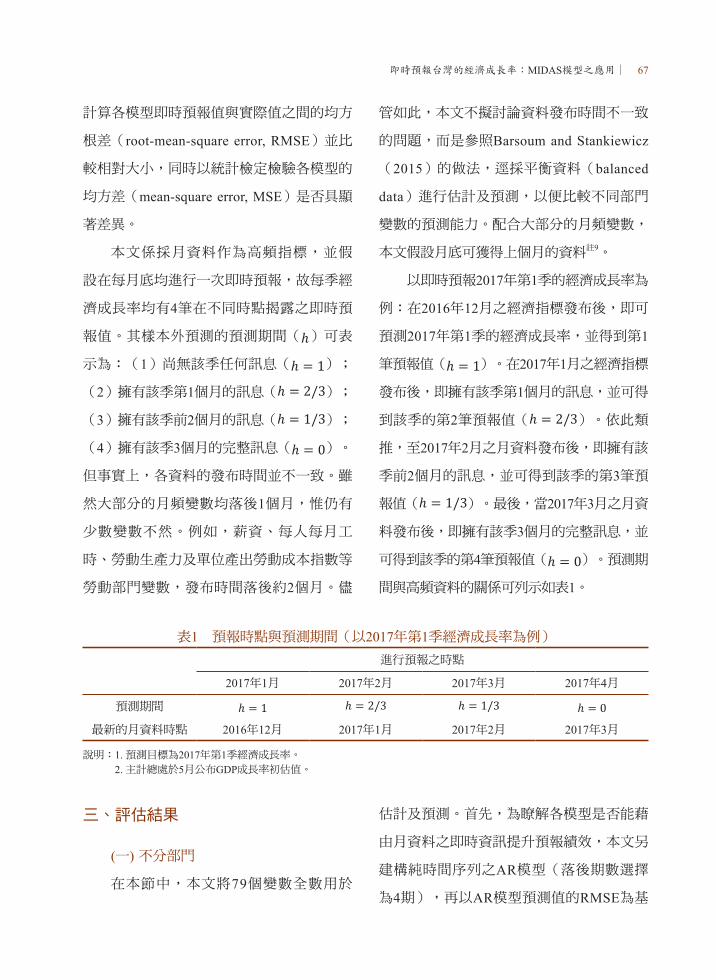
即時預報台灣的經濟成長率:MIDAS模型之應用∣ 67
計算各模型即時預報值與實際值之間的均方
根差(root-mean-square error, RMSE)並比
較相對大小,同時以統計檢定檢驗各模型的
均方差(mean-square error, MSE)是否具顯
著差異。
本文係採月資料作為高頻指標,並假
設在每月底均進行一次即時預報,故每季經
濟成長率均有4筆在不同時點揭露之即時預
報值。其樣本外預測的預測期間( )可表
示為:(1)尚無該季任何訊息( );
(2)擁有該季第1個月的訊息( );
(3)擁有該季前2個月的訊息( );
(4)擁有該季3個月的完整訊息( )。
但事實上,各資料的發布時間並不一致。雖
然大部分的月頻變數均落後1個月,惟仍有
少數變數不然。例如,薪資、每人每月工
時、勞動生產力及單位產出勞動成本指數等
勞動部門變數,發布時間落後約2個月。儘
管如此,本文不擬討論資料發布時間不一致
的問題,而是參照Barsoum and Stankiewicz
(2015)的做法,逕採平衡資料(balanced
data)進行估計及預測,以便比較不同部門
變數的預測能力。配合大部分的月頻變數,
本文假設月底可獲得上個月的資料註9。
以即時預報2017年第1季的經濟成長率為
例:在2016年12月之經濟指標發布後,即可
預測2017年第1季的經濟成長率,並得到第1
筆預報值( )。在2017年1月之經濟指標
發布後,即擁有該季第1個月的訊息,並可得
到該季的第2筆預報值( )。依此類
推,至2017年2月之月資料發布後,即擁有該
季前2個月的訊息,並可得到該季的第3筆預
報值( )。最後,當2017年3月之月資
料發布後,即擁有該季3個月的完整訊息,並
可得到該季的第4筆預報值( )。預測期
間與高頻資料的關係可列示如表1。
表1 預報時點與預測期間(以2017年第1季經濟成長率為例)進行預報之時點
2017年1月 2017年2月 2017年3月 2017年4月
預測期間
最新的月資料時點 2016年12月 2017年1月 2017年2月 2017年3月
說明:1. 預測目標為2017年第1季經濟成長率。2. 主計總處於5月公布GDP成長率初估值。
三、評估結果
(一) 不分部門
在本節中,本文將79個變數全數用於
估計及預測。首先,為瞭解各模型是否能藉
由月資料之即時資訊提升預報績效,本文另
建構純時間序列之AR模型(落後期數選擇
為4期),再以AR模型預測值的RMSE為基
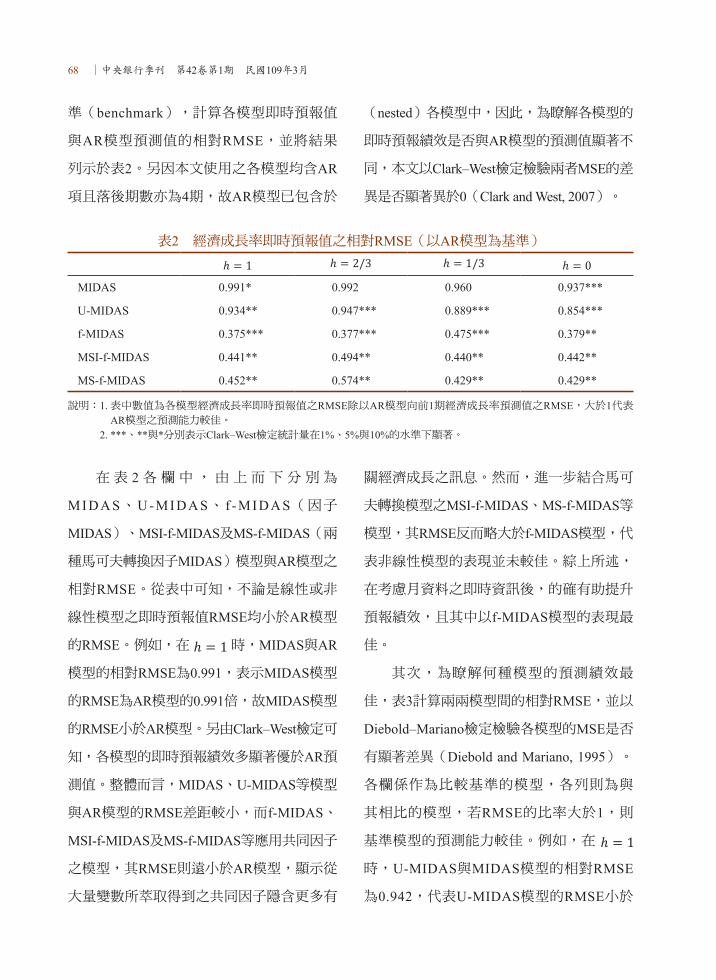
68 ∣中央銀行季刊 第42卷第1期 民國109年3月
表2 經濟成長率即時預報值之相對RMSE(以AR模型為基準)
MIDAS 0.991* 0.992 0.960 0.937***
U-MIDAS 0.934** 0.947*** 0.889*** 0.854***
f-MIDAS 0.375*** 0.377*** 0.475*** 0.379**
MSI-f-MIDAS 0.441** 0.494** 0.440** 0.442**
MS-f-MIDAS 0.452** 0.574** 0.429** 0.429**
說明:1. 表中數值為各模型經濟成長率即時預報值之RMSE除以AR模型向前1期經濟成長率預測值之RMSE,大於1代表AR模型之預測能力較佳。
2. ***、**與*分別表示Clark–West檢定統計量在1%、5%與10%的水準下顯著。
在 表 2各欄中,由上而下分別為
M I D A S、U - M I D A S、 f - M I D A S(因子
MIDAS)、MSI-f-MIDAS及MS-f-MIDAS(兩
種馬可夫轉換因子MIDAS)模型與AR模型之
相對RMSE。從表中可知,不論是線性或非
線性模型之即時預報值RMSE均小於AR模型
的RMSE。例如,在 時,MIDAS與AR
模型的相對RMSE為0.991,表示MIDAS模型
的RMSE為AR模型的0.991倍,故MIDAS模型
的RMSE小於AR模型。另由Clark–West檢定可
知,各模型的即時預報績效多顯著優於AR預
測值。整體而言,MIDAS、U-MIDAS等模型
與AR模型的RMSE差距較小,而f-MIDAS、
MSI-f-MIDAS及MS-f-MIDAS等應用共同因子
之模型,其RMSE則遠小於AR模型,顯示從
大量變數所萃取得到之共同因子隱含更多有
關經濟成長之訊息。然而,進一步結合馬可
夫轉換模型之MSI-f-MIDAS、MS-f-MIDAS等
模型,其RMSE反而略大於f-MIDAS模型,代
表非線性模型的表現並未較佳。綜上所述,
在考慮月資料之即時資訊後,的確有助提升
預報績效,且其中以f-MIDAS模型的表現最
佳。
其次,為瞭解何種模型的預測績效最
佳,表3計算兩兩模型間的相對RMSE,並以
Diebold–Mariano檢定檢驗各模型的MSE是否
有顯著差異(Diebold and Mariano, 1995)。
各欄係作為比較基準的模型,各列則為與
其相比的模型,若RMSE的比率大於1,則
基準模型的預測能力較佳。例如,在
時,U-MIDAS與MIDAS模型的相對RMSE
為0.942,代表U-MIDAS模型的RMSE小於
準(benchmark),計算各模型即時預報值
與AR模型預測值的相對RMSE,並將結果
列示於表2。另因本文使用之各模型均含AR
項且落後期數亦為4期,故AR模型已包含於
(nested)各模型中,因此,為瞭解各模型的
即時預報績效是否與AR模型的預測值顯著不
同,本文以Clark–West檢定檢驗兩者MSE的差
異是否顯著異於0(Clark and West, 2007)。
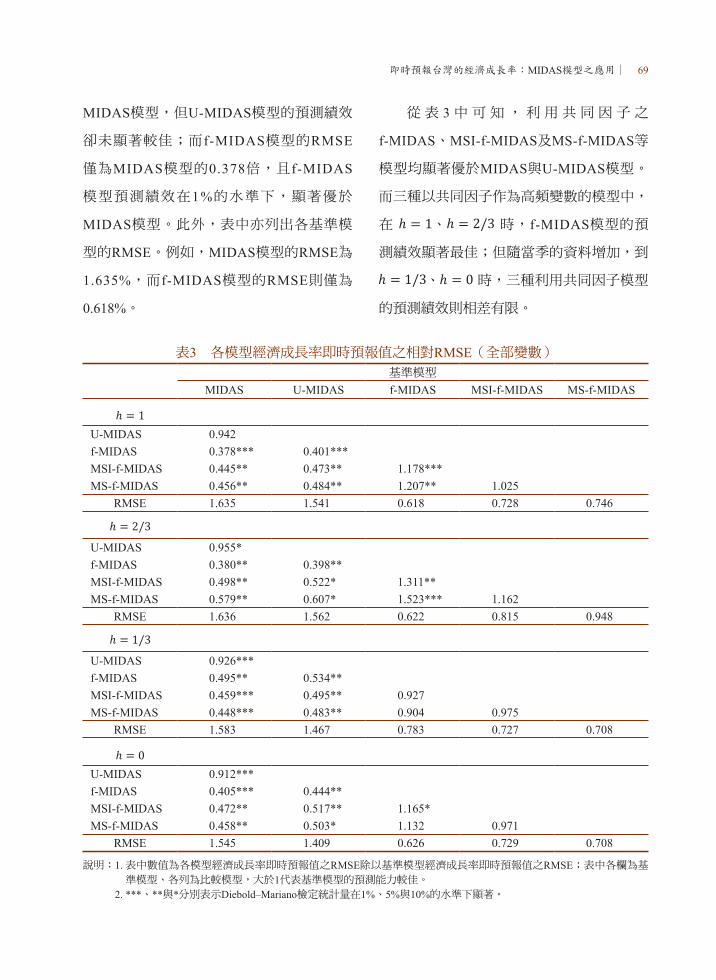
即時預報台灣的經濟成長率:MIDAS模型之應用∣ 69
MIDAS模型,但U-MIDAS模型的預測績效
卻未顯著較佳;而f-MIDAS模型的RMSE
僅為MIDAS模型的0.378倍,且f-MIDAS
模型預測績效在1%的水準下,顯著優於
MIDAS模型。此外,表中亦列出各基準模
型的RMSE。例如,MIDAS模型的RMSE為
1.635%,而f-MIDAS模型的RMSE則僅為
0.618%。
從表 3中可知,利用共同因子之
f-MIDAS、MSI-f-MIDAS及MS-f-MIDAS等
模型均顯著優於MIDAS與U-MIDAS模型。
而三種以共同因子作為高頻變數的模型中,
在 、 時,f-MIDAS模型的預
測績效顯著最佳;但隨當季的資料增加,到
、 時,三種利用共同因子模型
的預測績效則相差有限。
表3 各模型經濟成長率即時預報值之相對RMSE(全部變數)
基準模型
MIDAS U-MIDAS f-MIDAS MSI-f-MIDAS MS-f-MIDAS
U-MIDAS 0.942f-MIDAS 0.378*** 0.401***MSI-f-MIDAS 0.445** 0.473** 1.178***MS-f-MIDAS 0.456** 0.484** 1.207** 1.025
RMSE 1.635 1.541 0.618 0.728 0.746
U-MIDAS 0.955*f-MIDAS 0.380** 0.398**MSI-f-MIDAS 0.498** 0.522* 1.311**MS-f-MIDAS 0.579** 0.607* 1.523*** 1.162
RMSE 1.636 1.562 0.622 0.815 0.948
U-MIDAS 0.926***f-MIDAS 0.495** 0.534**MSI-f-MIDAS 0.459*** 0.495** 0.927MS-f-MIDAS 0.448*** 0.483** 0.904 0.975
RMSE 1.583 1.467 0.783 0.727 0.708
U-MIDAS 0.912***f-MIDAS 0.405*** 0.444**MSI-f-MIDAS 0.472** 0.517** 1.165*MS-f-MIDAS 0.458** 0.503* 1.132 0.971
RMSE 1.545 1.409 0.626 0.729 0.708
說明:1. 表中數值為各模型經濟成長率即時預報值之RMSE除以基準模型經濟成長率即時預報值之RMSE;表中各欄為基準模型、各列為比較模型,大於1代表基準模型的預測能力較佳。
2. ***、**與*分別表示Diebold–Mariano檢定統計量在1%、5%與10%的水準下顯著。

70 ∣中央銀行季刊 第42卷第1期 民國109年3月
(二) 區分不同部門
由於各經濟變數皆有不同的特性,且與
經濟成長的關係不盡相同,故本節依變數特
性,將各變數分為商品部門、金融部門及勞
動部門等三種不同類別,再分別以各模型對
不同類別的變數進行即時預報。表4、表5及
表6分別為各模型使用商品部門變數、金融
部門變數及勞動部門變數的預測績效評估結
果。
首先,將表4至表6與表3的RMSE兩相
對照,可發現使用不同部門變數的MIDAS
及U-MIDAS模型與使用全部變數時的RMSE
相差有限。對三種以共同因子作為高頻變數
的模型而言,使用商品部門變數及勞動部門
變數的RMSE亦與使用全部變數時的差距不
大,甚至略為上升;但僅使用金融部門變數
卻能使RMSE明顯下降。例如,同樣在
時,f-MIDAS模型使用商品部門變數(表
4)與勞動部門變數(表6)之RMSE分別為
0.613%與0.706%,與使用全部變數時(表
3)的0.618%相差不大;然而,MIDAS模型
僅用金融部門變數(表5)之RMSE卻能降至
0.437%。整體而言,各模型中以f-MIDAS模
型的RMSE平均降幅最大,而MS-f-MIDAS
模型的RMSE在 時亦大幅下降。
其次,觀察表 4至表 6,可發現無論
何種部門類別,萃取共同因子作為高頻
變數之f-MIDAS、MSI-f-MIDAS及MS-f-
MIDAS等3個模型的表現仍顯著優於MIDAS
與U-MIDAS模型;且其中f-MIDAS模型
的RMSE普遍小於MSI-f-MIDAS與MS-f-
MIDAS模型,惟MSE的差距大多未達顯著水
準。
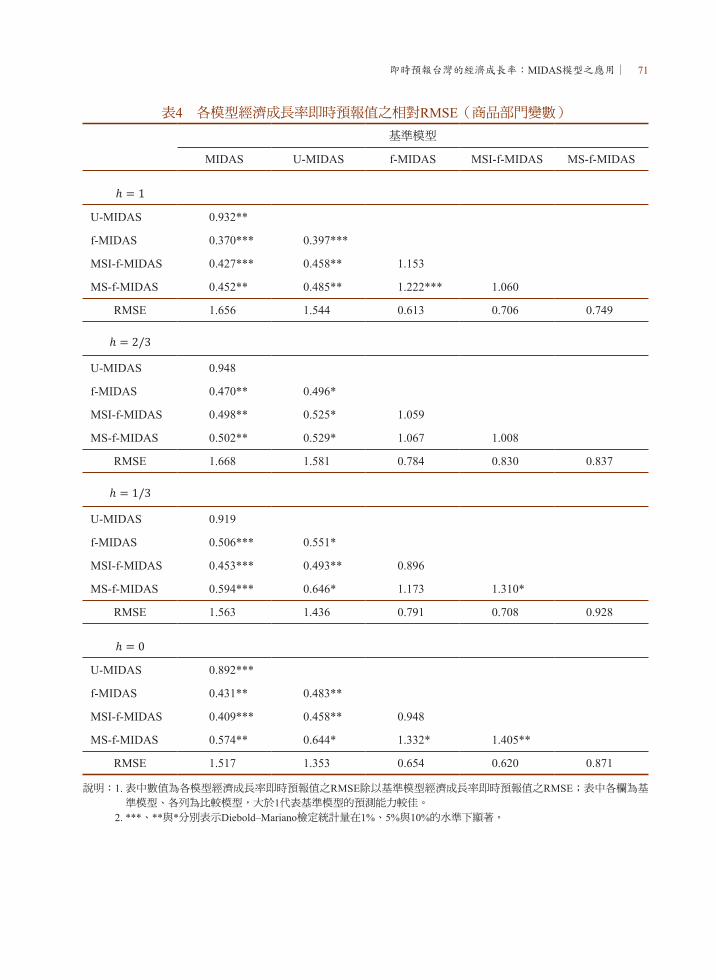
即時預報台灣的經濟成長率:MIDAS模型之應用∣ 71
表4 各模型經濟成長率即時預報值之相對RMSE(商品部門變數)
基準模型
MIDAS U-MIDAS f-MIDAS MSI-f-MIDAS MS-f-MIDAS
U-MIDAS 0.932**
f-MIDAS 0.370*** 0.397***
MSI-f-MIDAS 0.427*** 0.458** 1.153
MS-f-MIDAS 0.452** 0.485** 1.222*** 1.060
RMSE 1.656 1.544 0.613 0.706 0.749
U-MIDAS 0.948
f-MIDAS 0.470** 0.496*
MSI-f-MIDAS 0.498** 0.525* 1.059
MS-f-MIDAS 0.502** 0.529* 1.067 1.008
RMSE 1.668 1.581 0.784 0.830 0.837
U-MIDAS 0.919
f-MIDAS 0.506*** 0.551*
MSI-f-MIDAS 0.453*** 0.493** 0.896
MS-f-MIDAS 0.594*** 0.646* 1.173 1.310*
RMSE 1.563 1.436 0.791 0.708 0.928
U-MIDAS 0.892***
f-MIDAS 0.431** 0.483**
MSI-f-MIDAS 0.409*** 0.458** 0.948
MS-f-MIDAS 0.574** 0.644* 1.332* 1.405**
RMSE 1.517 1.353 0.654 0.620 0.871
說明:1. 表中數值為各模型經濟成長率即時預報值之RMSE除以基準模型經濟成長率即時預報值之RMSE;表中各欄為基準模型、各列為比較模型,大於1代表基準模型的預測能力較佳。
2. ***、**與*分別表示Diebold–Mariano檢定統計量在1%、5%與10%的水準下顯著。
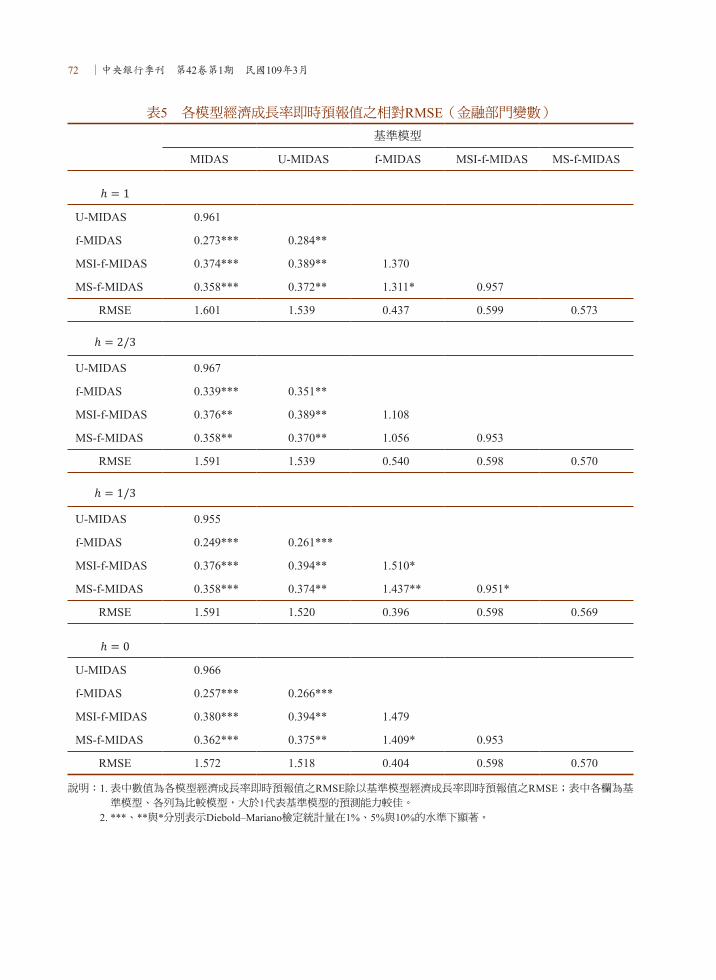
72 ∣中央銀行季刊 第42卷第1期 民國109年3月
表5 各模型經濟成長率即時預報值之相對RMSE(金融部門變數)
基準模型
MIDAS U-MIDAS f-MIDAS MSI-f-MIDAS MS-f-MIDAS
U-MIDAS 0.961
f-MIDAS 0.273*** 0.284**
MSI-f-MIDAS 0.374*** 0.389** 1.370
MS-f-MIDAS 0.358*** 0.372** 1.311* 0.957
RMSE 1.601 1.539 0.437 0.599 0.573
U-MIDAS 0.967
f-MIDAS 0.339*** 0.351**
MSI-f-MIDAS 0.376** 0.389** 1.108
MS-f-MIDAS 0.358** 0.370** 1.056 0.953
RMSE 1.591 1.539 0.540 0.598 0.570
U-MIDAS 0.955
f-MIDAS 0.249*** 0.261***
MSI-f-MIDAS 0.376*** 0.394** 1.510*
MS-f-MIDAS 0.358*** 0.374** 1.437** 0.951*
RMSE 1.591 1.520 0.396 0.598 0.569
U-MIDAS 0.966
f-MIDAS 0.257*** 0.266***
MSI-f-MIDAS 0.380*** 0.394** 1.479
MS-f-MIDAS 0.362*** 0.375** 1.409* 0.953
RMSE 1.572 1.518 0.404 0.598 0.570
說明:1. 表中數值為各模型經濟成長率即時預報值之RMSE除以基準模型經濟成長率即時預報值之RMSE;表中各欄為基準模型、各列為比較模型,大於1代表基準模型的預測能力較佳。
2. ***、**與*分別表示Diebold–Mariano檢定統計量在1%、5%與10%的水準下顯著。
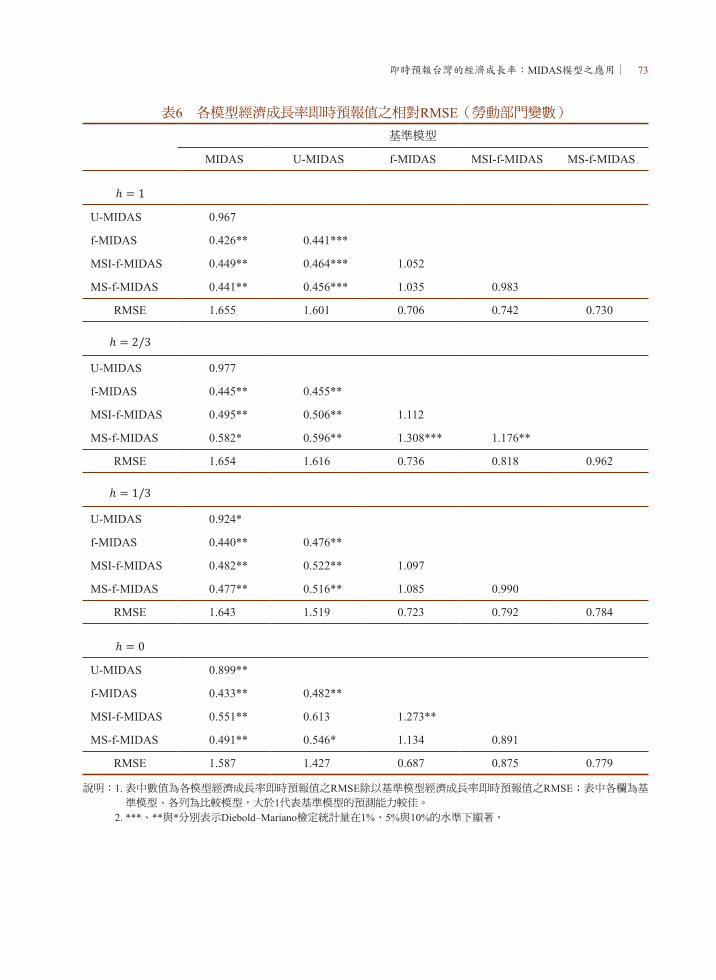
即時預報台灣的經濟成長率:MIDAS模型之應用∣ 73
表6 各模型經濟成長率即時預報值之相對RMSE(勞動部門變數)
基準模型
MIDAS U-MIDAS f-MIDAS MSI-f-MIDAS MS-f-MIDAS
U-MIDAS 0.967
f-MIDAS 0.426** 0.441***
MSI-f-MIDAS 0.449** 0.464*** 1.052
MS-f-MIDAS 0.441** 0.456*** 1.035 0.983
RMSE 1.655 1.601 0.706 0.742 0.730
U-MIDAS 0.977
f-MIDAS 0.445** 0.455**
MSI-f-MIDAS 0.495** 0.506** 1.112
MS-f-MIDAS 0.582* 0.596** 1.308*** 1.176**
RMSE 1.654 1.616 0.736 0.818 0.962
U-MIDAS 0.924*
f-MIDAS 0.440** 0.476**
MSI-f-MIDAS 0.482** 0.522** 1.097
MS-f-MIDAS 0.477** 0.516** 1.085 0.990
RMSE 1.643 1.519 0.723 0.792 0.784
U-MIDAS 0.899**
f-MIDAS 0.433** 0.482**
MSI-f-MIDAS 0.551** 0.613 1.273**
MS-f-MIDAS 0.491** 0.546* 1.134 0.891
RMSE 1.587 1.427 0.687 0.875 0.779
說明:1. 表中數值為各模型經濟成長率即時預報值之RMSE除以基準模型經濟成長率即時預報值之RMSE;表中各欄為基準模型、各列為比較模型,大於1代表基準模型的預測能力較佳。
2. ***、**與*分別表示Diebold–Mariano檢定統計量在1%、5%與10%的水準下顯著。
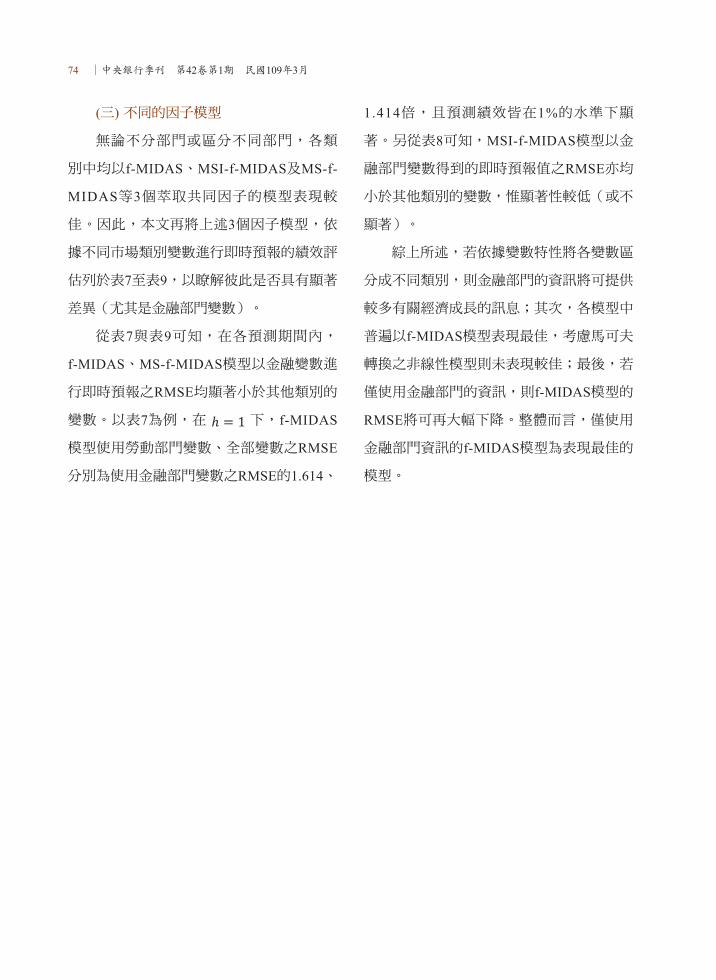
74 ∣中央銀行季刊 第42卷第1期 民國109年3月
(三) 不同的因子模型
無論不分部門或區分不同部門,各類
別中均以f-MIDAS、MSI-f-MIDAS及MS-f-
MIDAS等3個萃取共同因子的模型表現較
佳。因此,本文再將上述3個因子模型,依
據不同市場類別變數進行即時預報的績效評
估列於表7至表9,以瞭解彼此是否具有顯著
差異(尤其是金融部門變數)。
從表7與表9可知,在各預測期間內,
f-MIDAS、MS-f-MIDAS模型以金融變數進
行即時預報之RMSE均顯著小於其他類別的
變數。以表7為例,在 下,f-MIDAS
模型使用勞動部門變數、全部變數之RMSE
分別為使用金融部門變數之RMSE的1.614、
1.414倍,且預測績效皆在1%的水準下顯
著。另從表8可知,MSI-f-MIDAS模型以金
融部門變數得到的即時預報值之RMSE亦均
小於其他類別的變數,惟顯著性較低(或不
顯著)。
綜上所述,若依據變數特性將各變數區
分成不同類別,則金融部門的資訊將可提供
較多有關經濟成長的訊息;其次,各模型中
普遍以f-MIDAS模型表現最佳,考慮馬可夫
轉換之非線性模型則未表現較佳;最後,若
僅使用金融部門的資訊,則f-MIDAS模型的
RMSE將可再大幅下降。整體而言,僅使用
金融部門資訊的f-MIDAS模型為表現最佳的
模型。
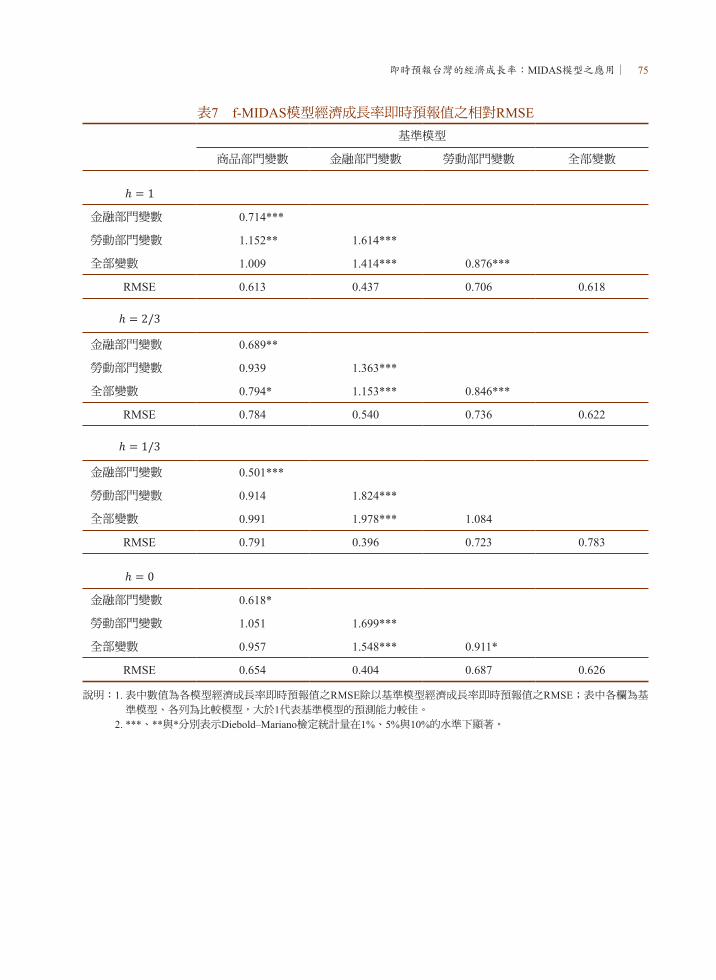
即時預報台灣的經濟成長率:MIDAS模型之應用∣ 75
表7 f-MIDAS模型經濟成長率即時預報值之相對RMSE
基準模型
商品部門變數 金融部門變數 勞動部門變數 全部變數
金融部門變數 0.714***
勞動部門變數 1.152** 1.614***
全部變數 1.009 1.414*** 0.876***
RMSE 0.613 0.437 0.706 0.618
金融部門變數 0.689**
勞動部門變數 0.939 1.363***
全部變數 0.794* 1.153*** 0.846***
RMSE 0.784 0.540 0.736 0.622
金融部門變數 0.501***
勞動部門變數 0.914 1.824***
全部變數 0.991 1.978*** 1.084
RMSE 0.791 0.396 0.723 0.783
金融部門變數 0.618*
勞動部門變數 1.051 1.699***
全部變數 0.957 1.548*** 0.911*
RMSE 0.654 0.404 0.687 0.626
說明:1. 表中數值為各模型經濟成長率即時預報值之RMSE除以基準模型經濟成長率即時預報值之RMSE;表中各欄為基準模型、各列為比較模型,大於1代表基準模型的預測能力較佳。
2. ***、**與*分別表示Diebold–Mariano檢定統計量在1%、5%與10%的水準下顯著。
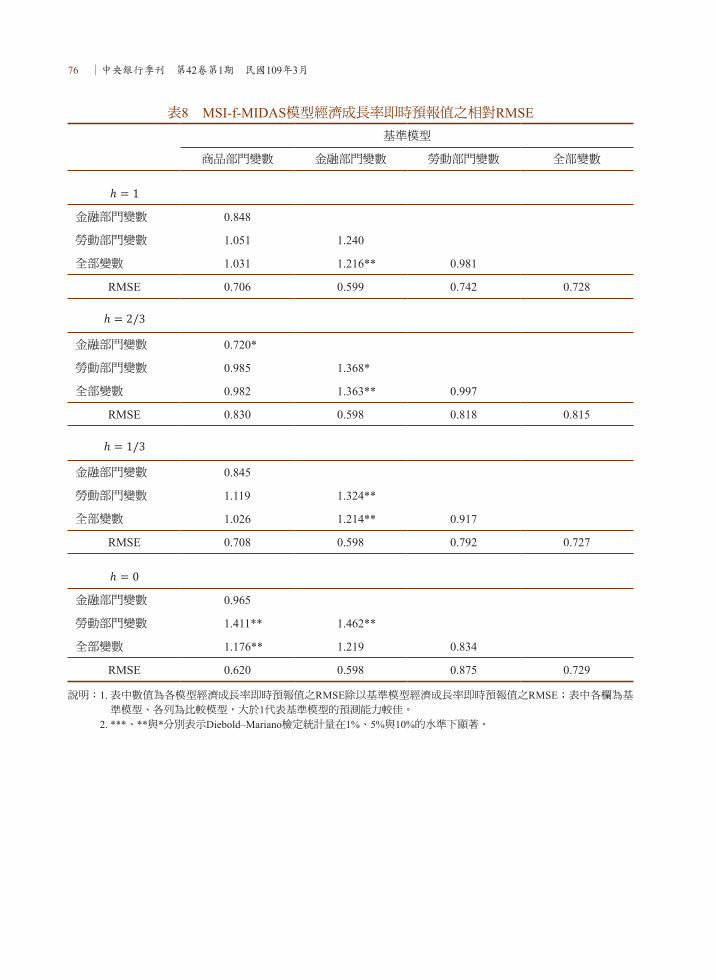
76 ∣中央銀行季刊 第42卷第1期 民國109年3月
表8 MSI-f-MIDAS模型經濟成長率即時預報值之相對RMSE
基準模型
商品部門變數 金融部門變數 勞動部門變數 全部變數
金融部門變數 0.848
勞動部門變數 1.051 1.240
全部變數 1.031 1.216** 0.981
RMSE 0.706 0.599 0.742 0.728
金融部門變數 0.720*
勞動部門變數 0.985 1.368*
全部變數 0.982 1.363** 0.997
RMSE 0.830 0.598 0.818 0.815
金融部門變數 0.845
勞動部門變數 1.119 1.324**
全部變數 1.026 1.214** 0.917
RMSE 0.708 0.598 0.792 0.727
金融部門變數 0.965
勞動部門變數 1.411** 1.462**
全部變數 1.176** 1.219 0.834
RMSE 0.620 0.598 0.875 0.729
說明:1. 表中數值為各模型經濟成長率即時預報值之RMSE除以基準模型經濟成長率即時預報值之RMSE;表中各欄為基準模型、各列為比較模型,大於1代表基準模型的預測能力較佳。
2. ***、**與*分別表示Diebold–Mariano檢定統計量在1%、5%與10%的水準下顯著。

即時預報台灣的經濟成長率:MIDAS模型之應用∣ 77
表9 MS-f-MIDAS模型經濟成長率即時預報值之相對RMSE
基準模型
商品部門變數 金融部門變數 勞動部門變數 全部變數
金融部門變數 0.765**
勞動部門變數 0.975 1.274***
全部變數 0.997 1.302** 1.022
RMSE 0.749 0.573 0.730 0.746
金融部門變數 0.681**
勞動部門變數 1.150** 1.689***
全部變數 1.133 1.663*** 0.985
RMSE 0.837 0.570 0.962 0.948
金融部門變數 0.613**
勞動部門變數 0.845 1.378***
全部變數 0.764 1.245** 0.904***
RMSE 0.928 0.569 0.784 0.708
金融部門變數 0.654***
勞動部門變數 0.895 1.368***
全部變數 0.813 1.243** 0.909***
RMSE 0.871 0.570 0.779 0.708
說明:1. 表中數值為各模型經濟成長率即時預報值之RMSE除以基準模型經濟成長率即時預報值之RMSE;表中各欄為基準模型、各列為比較模型,大於1代表基準模型的預測能力較佳。
2. ***、**與*分別表示Diebold–Mariano檢定統計量在1%、5%與10%的水準下顯著。
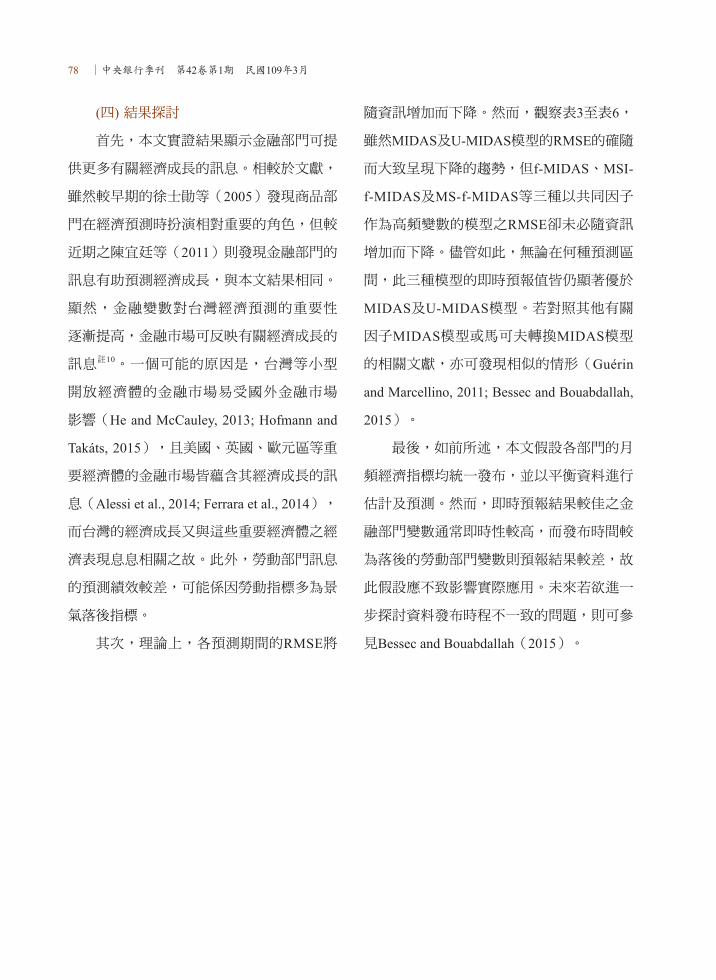
78 ∣中央銀行季刊 第42卷第1期 民國109年3月
(四) 結果探討
首先,本文實證結果顯示金融部門可提
供更多有關經濟成長的訊息。相較於文獻,
雖然較早期的徐士勛等(2005)發現商品部
門在經濟預測時扮演相對重要的角色,但較
近期之陳宜廷等(2011)則發現金融部門的
訊息有助預測經濟成長,與本文結果相同。
顯然,金融變數對台灣經濟預測的重要性
逐漸提高,金融市場可反映有關經濟成長的
訊息註10。一個可能的原因是,台灣等小型
開放經濟體的金融市場易受國外金融市場
影響(He and McCauley, 2013; Hofmann and
Takáts, 2015),且美國、英國、歐元區等重
要經濟體的金融市場皆蘊含其經濟成長的訊
息(Alessi et al., 2014; Ferrara et al., 2014),
而台灣的經濟成長又與這些重要經濟體之經
濟表現息息相關之故。此外,勞動部門訊息
的預測績效較差,可能係因勞動指標多為景
氣落後指標。
其次,理論上,各預測期間的RMSE將
隨資訊增加而下降。然而,觀察表3至表6,
雖然MIDAS及U-MIDAS模型的RMSE的確隨
而大致呈現下降的趨勢,但f-MIDAS、MSI-
f-MIDAS及MS-f-MIDAS等三種以共同因子
作為高頻變數的模型之RMSE卻未必隨資訊
增加而下降。儘管如此,無論在何種預測區
間,此三種模型的即時預報值皆仍顯著優於
MIDAS及U-MIDAS模型。若對照其他有關
因子MIDAS模型或馬可夫轉換MIDAS模型
的相關文獻,亦可發現相似的情形(Guérin
and Marcellino, 2011; Bessec and Bouabdallah,
2015)。
最後,如前所述,本文假設各部門的月
頻經濟指標均統一發布,並以平衡資料進行
估計及預測。然而,即時預報結果較佳之金
融部門變數通常即時性較高,而發布時間較
為落後的勞動部門變數則預報結果較差,故
此假設應不致影響實際應用。未來若欲進一
步探討資料發布時程不一致的問題,則可參
見Bessec and Bouabdallah(2015)。

即時預報台灣的經濟成長率:MIDAS模型之應用∣ 79
伍、結 論
經濟情勢的當前概況及未來展望往往是
決策上的重要參考依據。然而,經濟成長率
等重要經濟指標的資料頻率較低且發布時間
較為落後,若能充分利用頻率較高且較為即
時的經濟指標,即時預報當前的經濟情勢,
當可提供決策者更為充分的資訊。
目前國內文獻多採用與預測標的關聯性
較高的少數高頻變數,再透過橋樑方程式處
理混頻資料後,再進行預測;而近年蓬勃發
展且廣受運用的MIDAS模型,則可直接建構
高頻與低頻變數之間的關係,惟國內相關研
究仍較少。爰此,本文綜合考量數種線性、
非線性的MIDAS模型及大量月頻經濟指標,
即時預報台灣的經濟成長率。
本文運用1992年第1季至2017年第3季的
資料,建構MIDAS、U-MIDAS與結合因子
模型的f-MIDAS等三種線性模型,以及結合
馬可夫轉換模型與因子模型的MSI-f-MIDAS
及MS-f-MIDAS等兩種非線性模型,對2012
年第1季至2017年第3季的資料進行樣本外預
報及績效評估。
本文實證結果總結如下。首先,無論何
種模型,應用月資料之即時資訊有助提升
當季經濟成長率的預報績效。其次,萃取
共同因子作為高頻變數之f-MIDAS、MSI-f-
MIDAS及MS-f-MIDAS等模型的預報績效相
對較好,顯示大量月頻經濟指標蘊含的資
訊確實與經濟成長率密切相關;且其中以
f-MIDAS模型表現最佳。接著,若將變數依
特性區分成商品部門、金融部門及勞動部門
等類別,則使用金融部門變數的共同因子將
較其他部門更能提升預報績效,顯示金融部
門可提供更多有關經濟成長的訊息。整體而
言,以金融部門變數的共同因子為高頻變數
的f-MIDAS模型係本文表現最佳的即時預報
模型,而考慮馬可夫轉換之非線性模型則未
有較佳的表現。
80 ∣中央銀行季刊 第42卷第1期 民國109年3月
附 註
(註1) 關於即時預報的介紹與發展,可參見Bańbura et al.(2013)。
(註2) 除MIDAS模型外,將混合頻率模型表示成狀態空間模型(state-space model)的形式,據以進行估計及預測的做法
亦頗為常見。包括動態因子模型(dynamic factor model),如Giannone et al.(2008)、Aruoba et al.(2009)等;
或是混合頻率VAR(mixed frequency VAR, MF-VAR)模型,如Mariano and Murasawa(2003, 2010)、Schorfheid
and Song(2015)等。相較MIDAS模型,狀態空間模型較為複雜且不易求解,關於兩者間的差異,詳見Bai et
al.(2013)。
(註3) 本文亦曾嘗試以Clements and Galvão(2008)的受限AR-MIDAS模型進行即時預報,惟結果差距有限。
(註4) 本文採用Gauss套裝程式Optimization中的BFGS演算法計算參數的最大概似估計值。作者感謝Christian Schumacher博
士與Hyun Hak Kim博士對於程式碼之協助。
(註5) 本文與Bessec and Bouabdallah(2015)萃取因子的方式並不相同。主要差異在於,Bessec and Bouabdallah(2015)
的高頻資料為非平衡(unbalanced)資料,故採用Doz et al.(2011)的方法;而本文使用平衡資料,故採Stock and
Waston(2002)的方法萃取因子。
(註6) 囿於篇幅限制,本文不擬檢附各變數之ADF檢定結果。
(註7) 本文亦曾嘗試以中位數的方式混合不同高頻資料的即時預報結果,惟結果差異不大。
(註8) 本文樣本外期間占全樣本之比重約為22%。一般而言,樣本外期間占全樣本比率約為10%或15%(陳旭昇,
2007);惟本文全樣本期間共103筆季資料,其10%或15%僅約10或15筆,恐嫌不足,故放寬至約22%。
(註9) 發布時間落後較多的資料均為勞動市場變數,而本文欲評估各模型使用不同部門變數的預測績效,故若缺漏大部分
的勞動部門變數,將難以比較勞動部門變數與其他部門變數對經濟成長的預測能力。此外,相對所有的月頻資料,
勞動市場發布較為落後的變數不多,故對全部變數的估計及預測結果之影響應屬有限,且亦不影響商品及金融部門
變數的估計及預測結果。
(註10) 許多文獻皆發現金融部門對經濟預測的重要性頗高(如Stock and Watson, 2003),因此,越來越多理論或實證上的
預測模型將金融變數納入考量(Gebauer, 2017)。Espinoza et al.(2012)說明,金融情勢攸關廠商與投資人的決策
行為,如緊縮的金融情勢,可能抑制廠商投資與僱用人員意願,進而影響總體經濟活動。

即時預報台灣的經濟成長率:MIDAS模型之應用∣ 81
參考文獻
中文文獻
沈中華、劉瑞文(1994),「使用不同頻率資料改善總體模型預測」,經濟論文叢刊,22(1),63–94。
林依伶(2013),「台灣總體經濟即期季模型—考量月指標之農曆春節效果」,中央銀行季刊,35(3),61–92。
林常青、洪茂蔚、管中閔(2002),「台灣短期利率的動態行為:狀態轉換模型的應用」,經濟論文,30(1),29–55。
姚睿、洪嘉陽(2016),「建構台灣的混合頻率動態結構總體模型」,中央銀行季刊,38(2),3–31。
徐士勛、管中閔(2001),「九零年代台灣的景氣循環:馬可夫轉換模型與紀卜斯抽樣法的應用」,人文及社會科學集
刊,13(5),515–540。
徐士勛、管中閔、羅雅慧(2005),「以擴散指標為基礎之總體經濟預測」,臺灣經濟預測與政策,36(1),1–28。
涂育嘉(2015),「台灣經濟成長率之混合頻率預測—MIDAS迴歸應用」,碩士論文,國立中央大學經濟學系。
張志揚(2013),「台灣總體經濟即期季模型之建立—運用月資料改善國民所得預測」,中央銀行季刊,35(3),37–
60。
陳宜廷、徐士勛、劉瑞文、莊額嘉(2011),「經濟成長率預測之評估與更新」,經濟論文叢刊,39(1),1–44。
陳旭昇(2007),時間序列分析:總體經濟與金融之應用,台北:東華書局。
彭素玲、周濟(2001),「台灣總體經濟即期季模型之建立與應用」,臺灣經濟預測與政策,32(1),1–64。
黃裕烈、徐之強、陳惠薇(2005),「景氣基準循環指數之檢討與修訂」,經濟論文叢刊,33(4),295–319。
英文文獻
Alessi, L., E. Ghysels, E., Onorante, L., Peach, R., and S. Potter (2014), “Central Bank Macroeconomic Forecasting During the
Global Financial Crisis: The European Central Bank and Federal Reserve Bank of New York Experiences,” Journal of
Business and Statistics, 32(4), 483–500.
Andreou, E., E. Ghysels, and A. Kourtellos (2013), “Should Macroeconomic Forecasters Use Daily Financial Data and How?”
Journal of Business and Economic Statistics, 31(2), 240–251.
Aruoba, S. B., F. X. Diebold, and C. Scotti (2009), “Real-time Measurement of Business Conditions,” Journal of Business and
Economic Statistics, 27(4), 417–427.
Baffigi, A., R. Golinelli, and G. Parigi (2004), “Bridge Models to Forecast the Euro Area GDP,” International Journal of
Forecasting, 20(3), 447–460.
Bai, J., E. Ghysels, and J. H. Wright (2013), “State Space Models and MIDAS Regressions,” Econometric Reviews, 32(7), 779–813.
Bańbura, M., D. Giannone, M. Modugno, and L. Reichlin (2013), Now-casting and the Real-time Data Flow, in: G. Elliott and A.
Timmermann (eds.), Handbook of Economic Forecasting, Volume 2A, Amsterdam: Elsevier, pp.195–237.
Barsoum, F., and S. Stankiewicz (2015), “Forecasting GDP Growth Using Mixed-frequency Models with Switching Regimes,”
International Journal of Forecasting, 31(1), 33–50.
Bessec, M., and O. Bouabdallah (2015), “Forecasting GDP over the Business Cycle in a Multi-frequency and Data-rich
Environment,” Oxford Bulletin of Economics and Statistics, 77(3), 360–384.
Clark, T. E., and K. D. West (2007), “Approximately Normal Tests for Equal Predictive Accuracy in Nested Models,” Journal of
Econometrics, 138(1), 291–311.
82 ∣中央銀行季刊 第42卷第1期 民國109年3月
Clements, M. P., and A. B. Galvão (2008), “Macroeconomic Forecasting with Mixed Frequency Data: Forecasting US Output
Growth,” Journal of Business and Economic Statistics, 26(4), 546–554.
Diebold, F. X., and R. S. Mariano (1995), “Comparing Predictive Accuracy,” Journal of Business and Economic Statistics, 13(3),
253–263.
Doz, C., D. Giannone, and L. Reichlin (2011), “A Two-step Estimator for Large Approximate Dynamic Factor Models Based on
Kalman Filtering,” Journal of Econometrics, 164(1), 188–205.
Espinoza, R., F. Fornari, and M. J. Lombardi (2012), “The Role of Financial Variables in Predicting Economic Activity,” Journal of
Forecasting, 31(1), 15–46.
Ferrara, L., C. Marsilli, and J. P. Ortega (2014), “Forecasting Growth during the Great Recession: Is Financial Volatility the Missing
Ingredient?” Economic Modelling, 36(1), 44–50.
Foroni, C., and M. G. Marcellino (2014), “A Comparison of Mixed Frequency Approaches for Nowcasting Euro Area
Macroeconomic Aggregates,” International Journal of Forecasting, 30(3), 554–568.
Foroni, C., M. G. Marcellino, and C. Schumacher (2015), “Unrestricted Mixed Data Sampling (MIDAS): MIDAS Regressions with
Unrestricted Lag Polynomials,” Journal of the Royal Statistical Society: Series A, 178(1), 57–82.
Gebauer, S. (2017), “The Use of Financial Market Variables in Forecasting,” DIW Roundup No.115.
Ghysels, E., P. Santa-Clara and R. Valkanov (2004), “The MIDAS Touch: Mixed Data Sampling Regressions,” Discussion Paper
UNC/UCLA.
Giannone, D., L. Reichlin, and D. Small (2008), “Nowcasting: The Real-time Informational Content of Macroeconomic Data,”
Journal of Monetary Economics, 55(4), 665–676.
Guérin, P., and M. Marcellino (2011), “Markov-switching MIDAS Models,” EUI Working Paper ECO 2011/03.
Guérin, P., and M. Marcellino (2013), “Markov-switching MIDAS Models,” Journal of Business and Economic Statistics, 31(1),
45–56.
Hamilton, J. D. (1989), “A New Approach to Economic Analysis of Nonstationary Time Series and the Business Cycle,”
Econometrica, 57(2), 357–384.
He, D., and R. N. McCauley (2013), “Transmitting Global Liquidity to East Asia: Policy Rates, Bond Yields, Currencies and Dollar
Credit,” BIS Working Papers No.431.
Hofmann, B., and E. Takáts (2015), “International Monetary Spillovers,” BIS Quarterly Review, September, 105–118.
Kuzin, V., M. Marcellino, and C. Schumacher (2011), “MIDAS vs. Mixed-frequency VAR: Nowcasting GDP in the Euro Area,”
International Journal of Forecasting, 27(2), 529–542.
Marcellino, M., and C. Schumacher (2010), “Factor MIDAS for Nowcasting and Forecasting with Ragged-edge Data: A Model
Comparison for German GDP,” Oxford Bulletin of Economics and Statistics, 72(4), 518–550.
Mariano, R. S., and Y. Murasawa (2003), “A New Coincident Index of Business Cycles Based on Monthly and Quarterly Series,”
Journal of Applied Econometrics, 18(4), 427–443.
Mariano, R., and Y. Murasawa (2010), “A Coincident Index, Common Factors, and Monthly Real GDP,” Oxford Bulletin of
Economics and Statistics, 72(1), 27–46.
Paragi, G., and R. Golinelli (2007), “The Use of Monthly Indicators to Forecast Quarterly GDP in the Short Run: An Application to
the G7 Countries,” Journal of Forecasting, 26(2), 77–94.
Schorfheide, F., and D. Song (2015), “Real-time Forecasting with a Mixed-frequency VAR,” Journal of Business and Economic

即時預報台灣的經濟成長率:MIDAS模型之應用∣ 83
Statistics, 33(3), 336–380.
Schumacher, C. (2016), “A Comparison of MIDAS and Bridge Equations,” International Journal of Forecasting, 32(2), 257–270.
Stock, J., and M. Watson (2002), “Macroeconomic Forecasting Using Diffusion Index,” Journal of Business and Economic
Statistics, 20(2), 147–162.
Stock, J., and M. Watson (2003), “Forecasting Output and Inflation: The Role of Asset Prices,” Journal of Economic Literature,
41(3), 788–829.
附表:變數說明與處理方式
變數說明 處理方式
1. 商品部門臺灣地區鐵路貨運量—噸數—總計(千公噸) 3臺灣地區公路汽車貨運業營運—貨運噸數 (千公噸) 3來臺旅客人數—總計(人次) 3國人出國人數—總計(人次) 3出口—價值指數(Index 2011=100) 3進口—價值指數(Index 2011=100) 3出口—數量指數(Index 2011=100) 3進口—數量指數(Index 2011=100) 3出口—單位價值指數(Index 2011=100) 3進口—單位價值指數(Index 2011=100) 3純貿易條件 3所得貿易條件 3進口—資本設備進口(新台幣百萬元) 3出口—基本金屬及其製品(新台幣百萬元) 3出口—電子產品(新台幣百萬元) 3出口—機械(新台幣百萬元) 3出口—資訊與通信產品(新台幣百萬元) 3領先指標不含趨勢指數(點) 3核發建照面積(千平方公尺) 3同時指標不含趨勢指數(點) 3工業生產指數(Index 2011=100) 3電力(企業)總用電量(十億度) 3製造業銷售量指數(Index 2011=100) 3海關出口值(十億元) 3生產量指數—製造業(Index 2011=100) 3生產量指數—化學工業(Index 2011=100) 3生產量指數—民生工業(Index 2011=100) 3存貨率—製造業(%) 3全國賦稅實徵淨額—總計(新台幣百萬元) 3全國賦稅實徵淨額—契稅(新台幣百萬元) 3全國賦稅實徵淨額—土地稅—土地增值稅(新台幣百萬元) 3全國賦稅實徵淨額—關稅(新台幣百萬元) 3
2. 勞動部門非農業部門就業人數(千人) 3
續接下頁
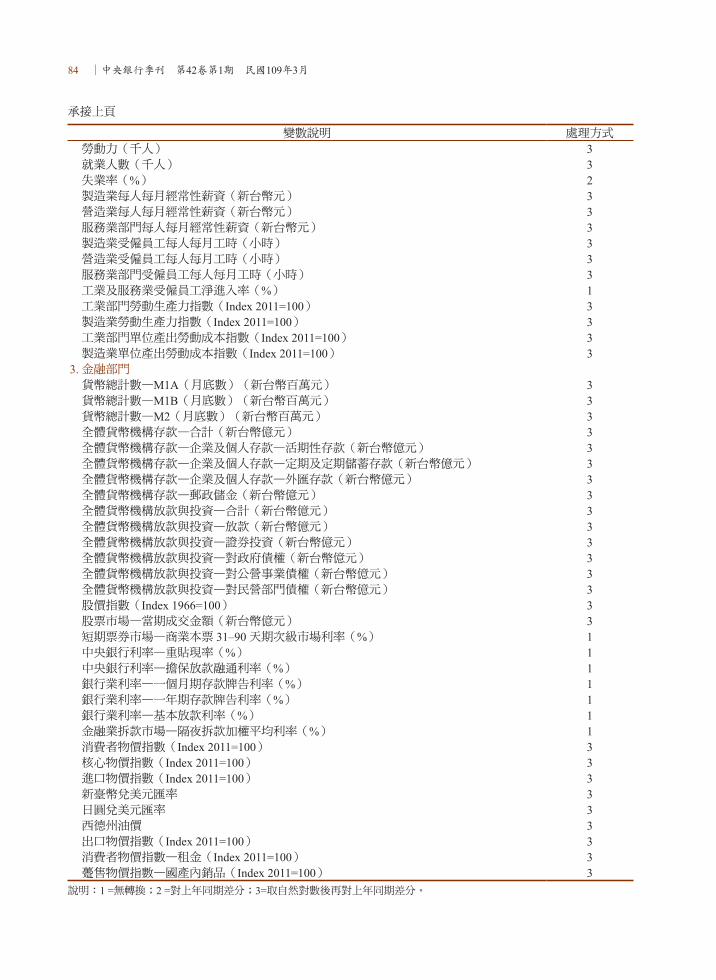
84 ∣中央銀行季刊 第42卷第1期 民國109年3月
變數說明 處理方式
勞動力(千人) 3就業人數(千人) 3失業率(%) 2製造業每人每月經常性薪資(新台幣元) 3營造業每人每月經常性薪資(新台幣元) 3服務業部門每人每月經常性薪資(新台幣元) 3製造業受僱員工每人每月工時(小時) 3營造業受僱員工每人每月工時(小時) 3服務業部門受僱員工每人每月工時(小時) 3工業及服務業受僱員工淨進入率(%) 1工業部門勞動生產力指數(Index 2011=100) 3製造業勞動生產力指數(Index 2011=100) 3工業部門單位產出勞動成本指數(Index 2011=100) 3製造業單位產出勞動成本指數(Index 2011=100) 3
3. 金融部門貨幣總計數—M1A(月底數)(新台幣百萬元) 3貨幣總計數—M1B(月底數)(新台幣百萬元) 3貨幣總計數—M2(月底數)(新台幣百萬元) 3全體貨幣機構存款—合計(新台幣億元) 3全體貨幣機構存款—企業及個人存款—活期性存款(新台幣億元) 3全體貨幣機構存款—企業及個人存款—定期及定期儲蓄存款(新台幣億元) 3全體貨幣機構存款—企業及個人存款—外匯存款(新台幣億元) 3全體貨幣機構存款—郵政儲金(新台幣億元) 3全體貨幣機構放款與投資—合計(新台幣億元) 3全體貨幣機構放款與投資—放款(新台幣億元) 3全體貨幣機構放款與投資—證券投資(新台幣億元) 3全體貨幣機構放款與投資—對政府債權(新台幣億元) 3全體貨幣機構放款與投資—對公營事業債權(新台幣億元) 3全體貨幣機構放款與投資—對民營部門債權(新台幣億元) 3股價指數(Index 1966=100) 3股票市場—當期成交金額(新台幣億元) 3短期票券市場—商業本票 31–90 天期次級市場利率(%) 1中央銀行利率—重貼現率(%) 1中央銀行利率—擔保放款融通利率(%) 1銀行業利率—一個月期存款牌告利率(%) 1銀行業利率—一年期存款牌告利率(%) 1銀行業利率—基本放款利率(%) 1金融業拆款市場—隔夜拆款加權平均利率(%) 1消費者物價指數(Index 2011=100) 3核心物價指數(Index 2011=100) 3進口物價指數(Index 2011=100) 3新臺幣兌美元匯率 3日圓兌美元匯率 3西德州油價 3出口物價指數(Index 2011=100) 3消費者物價指數—租金(Index 2011=100) 3躉售物價指數—國產內銷品(Index 2011=100) 3
說明:1 =無轉換;2 =對上年同期差分;3=取自然對數後再對上年同期差分。
承接上頁
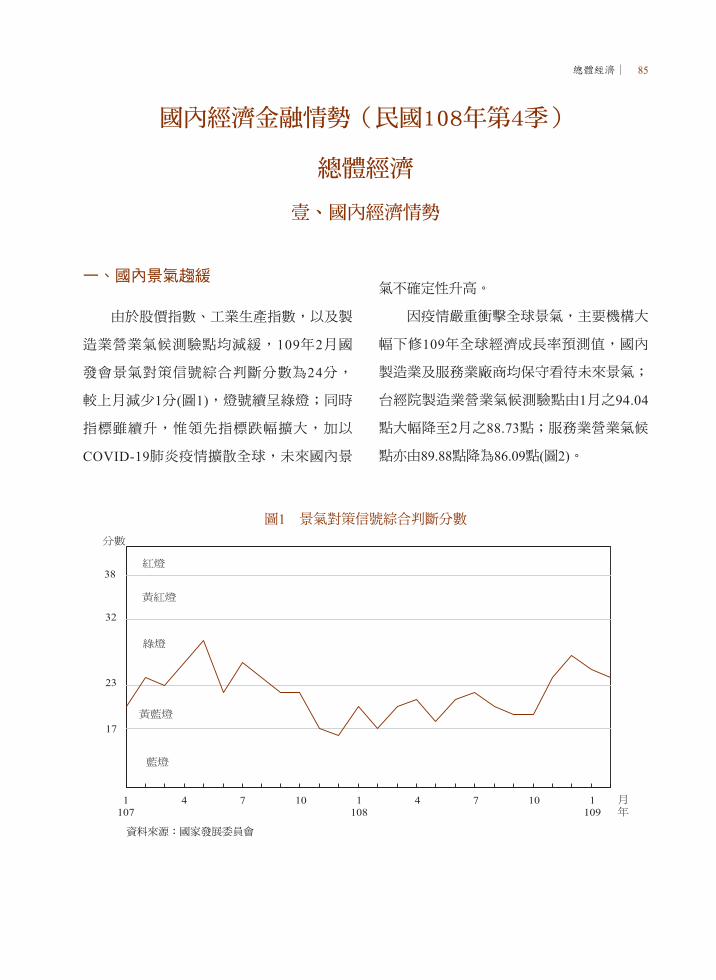
總體經濟∣ 85
國內經濟金融情勢(民國108年第4季)
總體經濟
壹、國內經濟情勢
一、國內景氣趨緩
由於股價指數、工業生產指數,以及製
造業營業氣候測驗點均減緩,109年2月國
發會景氣對策信號綜合判斷分數為24分,
較上月減少1分(圖1),燈號續呈綠燈;同時
指標雖續升,惟領先指標跌幅擴大,加以
COVID-19肺炎疫情擴散全球,未來國內景
氣不確定性升高。
因疫情嚴重衝擊全球景氣,主要機構大
幅下修109年全球經濟成長率預測值,國內
製造業及服務業廠商均保守看待未來景氣;
台經院製造業營業氣候測驗點由1月之94.04
點大幅降至2月之88.73點;服務業營業氣候
點亦由89.88點降為86.09點(圖2)。
圖1 景氣對策信號綜合判斷分數
資料來源:國家發展委員會
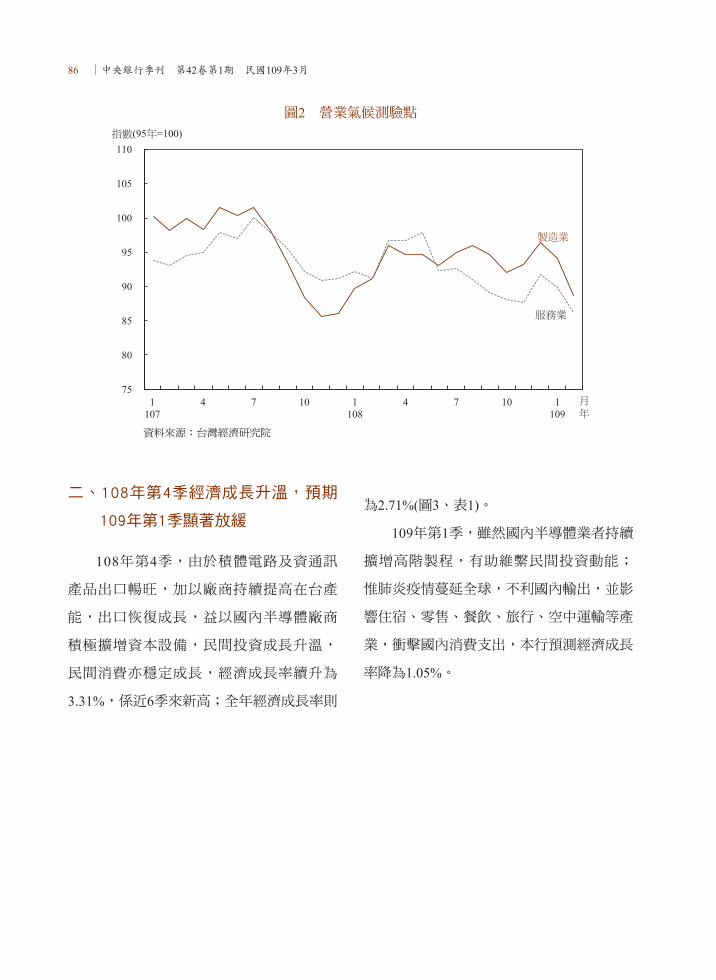
86 ∣中央銀行季刊 第42卷第1期 民國109年3月
二、108年第4季經濟成長升溫,預期
109年第1季顯著放緩
108年第4季,由於積體電路及資通訊
產品出口暢旺,加以廠商持續提高在台產
能,出口恢復成長,益以國內半導體廠商
積極擴增資本設備,民間投資成長升溫,
民間消費亦穩定成長,經濟成長率續升為
3.31%,係近6季來新高;全年經濟成長率則
為2.71%(圖3、表1)。
109年第1季,雖然國內半導體業者持續
擴增高階製程,有助維繫民間投資動能;
惟肺炎疫情蔓延全球,不利國內輸出,並影
響住宿、零售、餐飲、旅行、空中運輸等產
業,衝擊國內消費支出,本行預測經濟成長
率降為1.05%。
圖2 營業氣候測驗點
資料來源:台灣經濟研究院
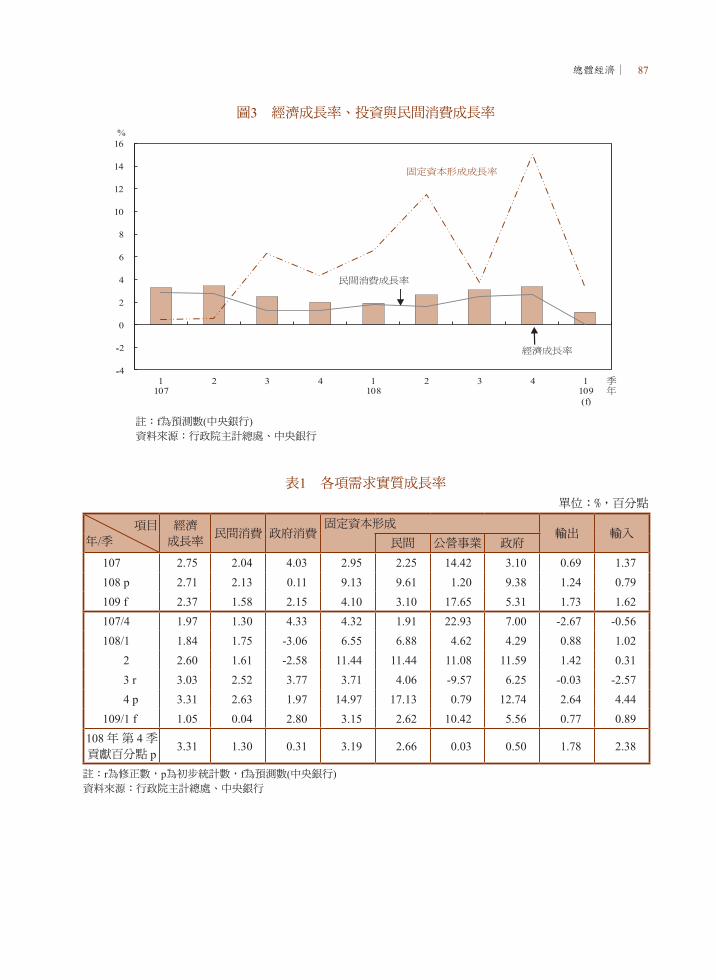
總體經濟∣ 87
圖3 經濟成長率、投資與民間消費成長率
註:f為預測數(中央銀行)資料來源:行政院主計總處、中央銀行
表1 各項需求實質成長率單位:%,百分點
項目
年/季經濟
成長率民間消費 政府消費
固定資本形成輸出 輸入
民間 公營事業 政府
107 2.75 2.04 4.03 2.95 2.25 14.42 3.10 0.69 1.37108 p 2.71 2.13 0.11 9.13 9.61 1.20 9.38 1.24 0.79109 f 2.37 1.58 2.15 4.10 3.10 17.65 5.31 1.73 1.62107/4 1.97 1.30 4.33 4.32 1.91 22.93 7.00 -2.67 -0.56108/1 1.84 1.75 -3.06 6.55 6.88 4.62 4.29 0.88 1.02
2 2.60 1.61 -2.58 11.44 11.44 11.08 11.59 1.42 0.313 r 3.03 2.52 3.77 3.71 4.06 -9.57 6.25 -0.03 -2.574 p 3.31 2.63 1.97 14.97 17.13 0.79 12.74 2.64 4.44
109/1 f 1.05 0.04 2.80 3.15 2.62 10.42 5.56 0.77 0.89108 年 第 4 季貢獻百分點 p
3.31 1.30 0.31 3.19 2.66 0.03 0.50 1.78 2.38
註:r為修正數,p為初步統計數,f為預測數(中央銀行)資料來源:行政院主計總處、中央銀行

88 ∣中央銀行季刊 第42卷第1期 民國109年3月
四、民間投資可望溫和成長
108年第4季,由於國內半導體業者持續
擴增先進製程,帶動資本設備進口大幅增
加,使民間機器設備投資成長50.92%,加以
民間運輸工具投資續增4.61%,民間投資成
長率由第3季之4.06%升為17.13% (圖5、表
1),係民國99年第4季以來新高。
109年第1季,半導體設備進口持續增
加,帶動資本設備進口(以美元計價)年增
4.12%,加以投資台灣三大方案逐步落實,
民間投資可望持續成長;惟因基期較高,本
行預測民間投資成長率降為2.62%。
三、民間消費將明顯降溫
108年第4季,由於台股上漲,股市交易
轉趨熱絡(上市櫃股票成交值成長20.68%),
加以零售業及餐飲業營業額續分別成長
4.17%及3.97%,以及汽車新增掛牌數續增
12.9%,民間消費成長率升為2.63%,係近6
季來新高(圖4、表1)。
109年第1季,隨肺炎疫情擴大,影響國
人外出餐飲及旅遊等消費意願,且受疫情衝
擊較深之住宿餐飲、批發零售、觀光等業減
班休息(即俗稱無薪假)人數大幅攀升,影響
就業市場穩定,本行預測民間消費成長率降
為0.04%。
圖4 消費者信心指數與民間消費成長率
註:f為預測數(中央銀行)資料來源:中央大學台灣經濟發展研究中心、行政院主計總處、中央銀行
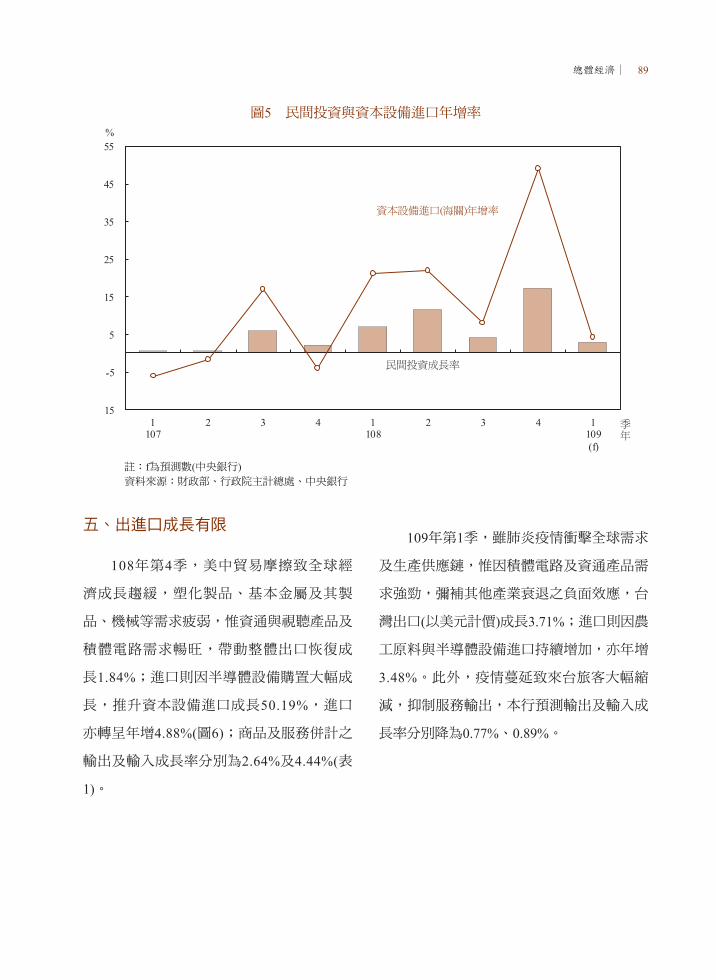
總體經濟∣ 89
五、出進口成長有限
108年第4季,美中貿易摩擦致全球經
濟成長趨緩,塑化製品、基本金屬及其製
品、機械等需求疲弱,惟資通與視聽產品及
積體電路需求暢旺,帶動整體出口恢復成
長1.84%;進口則因半導體設備購置大幅成
長,推升資本設備進口成長50.19%,進口
亦轉呈年增4.88%(圖6);商品及服務併計之
輸出及輸入成長率分別為2.64%及4.44%(表
1)。
109年第1季,雖肺炎疫情衝擊全球需求
及生產供應鏈,惟因積體電路及資通產品需
求強勁,彌補其他產業衰退之負面效應,台
灣出口(以美元計價)成長3.71%;進口則因農
工原料與半導體設備進口持續增加,亦年增
3.48%。此外,疫情蔓延致來台旅客大幅縮
減,抑制服務輸出,本行預測輸出及輸入成
長率分別降為0.77%、0.89%。
圖5 民間投資與資本設備進口年增率
註:f為預測數(中央銀行)資料來源:財政部、行政院主計總處、中央銀行

90 ∣中央銀行季刊 第42卷第1期 民國109年3月
圖6 進出口貿易
資料來源:財政部
六、工業生產持續成長
108年第4季,由於電腦電子產品及光學
製品業、積體電路業大幅增產,抵銷因全球
景氣趨緩致機械設備及基本金屬等傳統產業
需求下滑而減產之影響,工業生產持續成長
1.57%;全年則微幅衰退0.35%。
109年1至2月受春節因素影響,工業
生產成長波動較大 (圖7),惟平均仍年增
7.85%。其中,權重最大之製造業(92.0%)年
增8.27%;四大業別中,資訊電子工業年增
22.58%,主因積體電路需求增加帶動電子零
組件業大幅增產;惟民生、金屬機電及化學
工業則分別減產5.79%、5.20%及1.74%。

總體經濟∣ 91
七、失業率季節性回升,薪資成長趨緩
受春節後部分臨時性工作結束影響,
109年2月就業人數略減為1,152.3萬人(年增
率為0.44%);失業率則由1月之3.64%升至
3.70%(圖8),惟較上年同月仍下降0.02個百
分點。近期受疫情影響,實施減班休息之
事業單位家數及人數大幅增加,至3月底分
別為308家及7,916人,人數為101年2月以來
新高,以製造業之2,846人及住宿餐飲業之
2,693人最多。
108年工業及服務業受僱員工經常性薪
資年增率為2.26%;惟因企業獲利成長減
緩,致獎金等非經常性薪資增幅下降,平均
薪資年增2.39%,則係近3年最低。109年1月
經常性薪資續溫和成長1.59%;平均薪資年
增率則為5.26%(圖9),主因適逢春節,廠商
發放年終獎金所致。
資料來源:經濟部
圖7 工業生產年增率
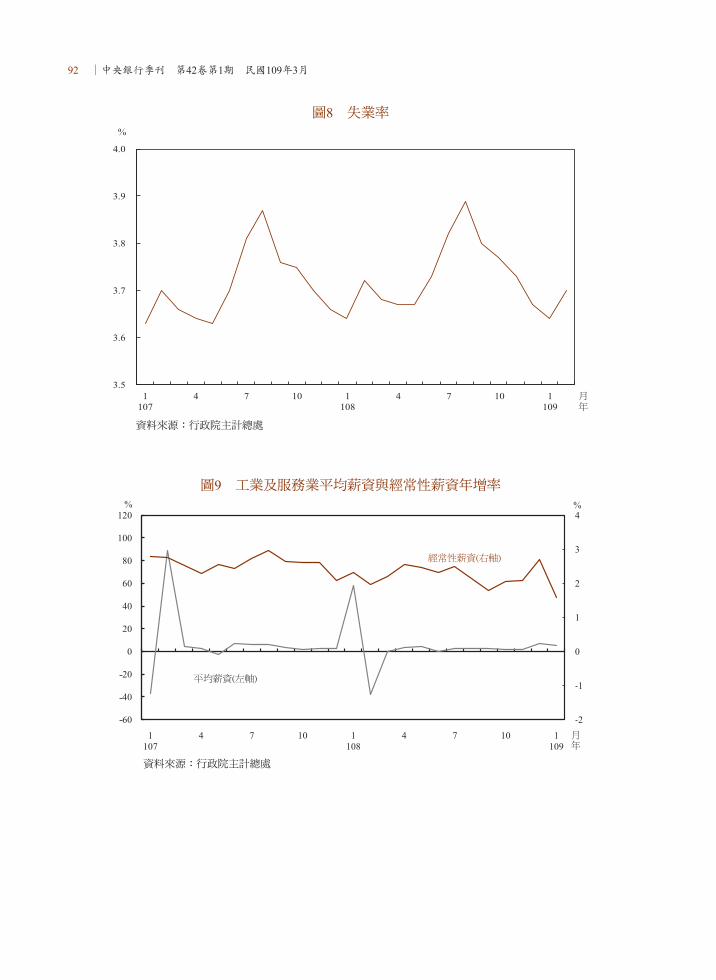
92 ∣中央銀行季刊 第42卷第1期 民國109年3月
圖9 工業及服務業平均薪資與經常性薪資年增率
資料來源:行政院主計總處
圖8 失業率
資料來源:行政院主計總處

總體經濟∣ 93
圖10 消費者物價與核心物價年增率
資料來源:行政院主計總處
八、CPI漲幅溫和
108年10月,因國際油價回跌,油料費
調降,加以通訊費續跌,CPI年增率降至
0.38%;嗣因107年同期天候良好,比較基
期較低,蔬果價格漲幅逐漸擴大,加以油
料費轉呈上漲,CPI年增率回升,至12月為
1.13%(圖10)。全年CPI年增率為0.56%;不
含蔬果及能源之CPI(即核心CPI)年增率為
0.49%,漲幅溫和。
109年1至3月,雖然水果、房租及外食
費價格等上漲,惟通訊費及油料費走低(表
2),抵銷部分漲幅, CPI年增率為0.55%,核
心CPI年增率則為0.44%,漲幅和緩。

94 ∣中央銀行季刊 第42卷第1期 民國109年3月
貳、經濟展望
展望109年,肺炎疫情擴散衝擊全球供
應鏈正常運作與市場需求,國際景氣下行風
險加劇,不利台灣出口,加上來台旅客大幅
縮減,抑制台灣輸出成長。內需方面,疫情
影響民間消費支出,亦可能影響廠商投資計
畫,加以上年資本設備進口大幅擴增,墊高
比較基期,民間投資成長將趨溫和。本行預
期疫情衝擊主要在上半年,下修全年經濟成
長率預測值至1.92%(表3);國內外各預測機
構預測值之平均數則為1.36%。
表3 國內外預測機構預測109年經濟成長率單位:%
預測機構
項 目中央銀行 主計總處 EIU 國泰台大 元大寶華 IHS Markit 平均值
發布日期 109.3.19 109.2.12 109.2.21 109.3.18 109.3.25 109.4.6實質國內生產毛額 1.92 2.37 2.00 2.00 1.50 -1.65 1.36實質民間消費支出 1.08 1.58 1.30 --- 1.04 -1.74 0.65實質政府消費支出 2.12 2.15 2.70 --- --- 4.15 2.78實質固定投資 3.79 4.10 4.20 --- --- -4.98 1.78實質民間投資 2.73 3.10 --- --- 2.79 --- 2.87實質政府投資 5.28 5.31 --- --- --- --- 5.30實質輸出 1.21 1.73 1.40 --- 1.27 -3.48 0.43實質輸入 1.20 1.62 1.70 --- 1.30 -4.35 0.29資料來源:各預測機構
表2 影響109年1至3月CPI年增率主要項目
項目權數
(千分比)年變動率
(%)對CPI年增率之影響
(百分點)CPI 1000 0.55 0.55 水果 19 11.81 0.25 房租 143 1.03 0.15 外食費 98 1.40 0.12 個人隨身用品 22 3.24 0.07 蔬菜 13 4.22 0.05 成衣 36 2.28 0.05合計 0.69 通訊費 24 -5.61 -0.14 油料費 28 -4.96 -0.13 蛋類 3 -16.38 -0.05 燃氣 4 -7.87 -0.04合計 -0.36其他 0.22
資料來源:行政院主計總處

國際收支∣ 95
國際收支
壹、概況
本(1 0 8)年第4季我國經常帳順差
17,016百萬美元,金融帳淨資產增加9,948百
萬美元,央行準備資產增加7,481百萬美元
(表1及圖1)。
表1 國際收支108年第4季暨107年第4季
單位:百萬美元
(1) 108年 第4季
(2) 107年 第4季
(1)-(2)
A.經常帳 17,016 20,512 -3,496 商品貿易淨額 14,309 16,970 -2,661 商品:收入(出口) 85,508 86,897 -1,389 商品:支出(進口) 71,199 69,927 1,272 服務收支淨額 -1,114 -609 -505 服務:收入(輸出) 13,440 13,644 -204 服務:支出(輸入) 14,554 14,253 301 初次所得收支淨額 4,769 4,997 -228 初次所得:收入 10,476 9,977 499 初次所得:支出 5,707 4,980 727 二次所得收支淨額 -948 -846 -102 二次所得:收入 2,116 1,940 176 二次所得:支出 3,064 2,786 278B.資本帳 -7 60 -67C.金融帳 9,948 19,530 -9,582 直接投資:資產 3,551 7,379 -3,828 股權和投資基金 3,794 6,897 -3,103 債務工具 -243 482 -725 直接投資:負債 3,881 1,507 2,374 股權和投資基金 3,306 1,595 1,711 債務工具 575 -88 663 證券投資:資產 10,666 13,084 -2,418 股權和投資基金 1,855 1,801 54 債務證券 8,811 11,283 -2,472 證券投資:負債 9,538 -5,512 15,050 股權和投資基金 9,407 -5,539 14,946 債務證券 131 27 104 衍生金融商品:資產 -3,559 -4,668 1,109 衍生金融商品:負債 -3,827 -4,791 964 其他投資:資產 7,231 -13,347 20,578 其他投資:負債 -1,651 -8,286 6,635 經常帳 + 資本帳 - 金融帳 7,061 1,042 6,019D.誤差與遺漏淨額 420 1,179 -759E.準備與相關項目 7,481 2,221 5,260註:正號表示經常帳及資本帳的收入、支出,以及金融資產或負債的增加;負號表示相關項目的減少。在經常帳及資本帳
餘額,正號表示順差,負號表示逆差;在金融帳及準備資產餘額,正號表示淨資產的增加;負號表示淨資產的減少。
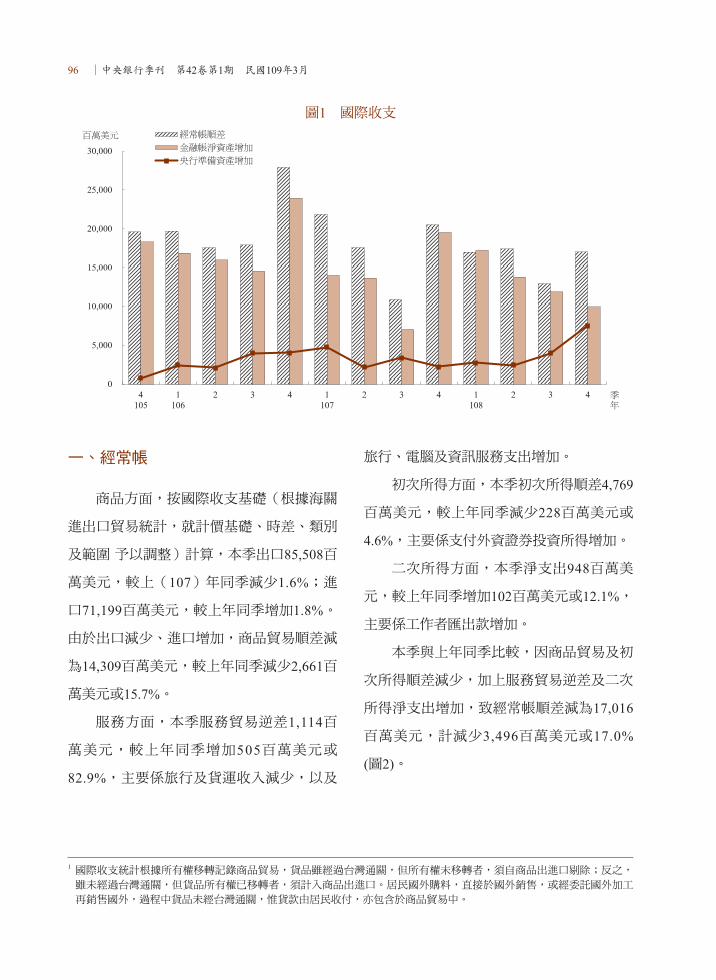
96 ∣中央銀行季刊 第42卷第1期 民國109年3月
圖1 國際收支
一、經常帳
商品方面,按國際收支基礎(根據海關
進出口貿易統計,就計價基礎、時差、類別
及範圍 予以調整)計算,本季出口85,508百
萬美元,較上(107)年同季減少1.6%;進
口71,199百萬美元,較上年同季增加1.8%。
由於出口減少、進口增加,商品貿易順差減
為14,309百萬美元,較上年同季減少2,661百
萬美元或15.7%。
服務方面,本季服務貿易逆差1,114百
萬美元,較上年同季增加505百萬美元或
82.9%,主要係旅行及貨運收入減少,以及
旅行、電腦及資訊服務支出增加。
初次所得方面,本季初次所得順差4,769
百萬美元,較上年同季減少228百萬美元或
4.6%,主要係支付外資證券投資所得增加。
二次所得方面,本季淨支出948百萬美
元,較上年同季增加102百萬美元或12.1%,
主要係工作者匯出款增加。
本季與上年同季比較,因商品貿易及初
次所得順差減少,加上服務貿易逆差及二次
所得淨支出增加,致經常帳順差減為17,016
百萬美元,計減少3,496百萬美元或17.0%
(圖2)。
1 國際收支統計根據所有權移轉記錄商品貿易,貨品雖經過台灣通關,但所有權未移轉者,須自商品出進口剔除;反之,雖未經過台灣通關,但貨品所有權已移轉者,須計入商品出進口。居民國外購料,直接於國外銷售,或經委託國外加工
再銷售國外,過程中貨品未經台灣通關,惟貨款由居民收付,亦包含於商品貿易中。
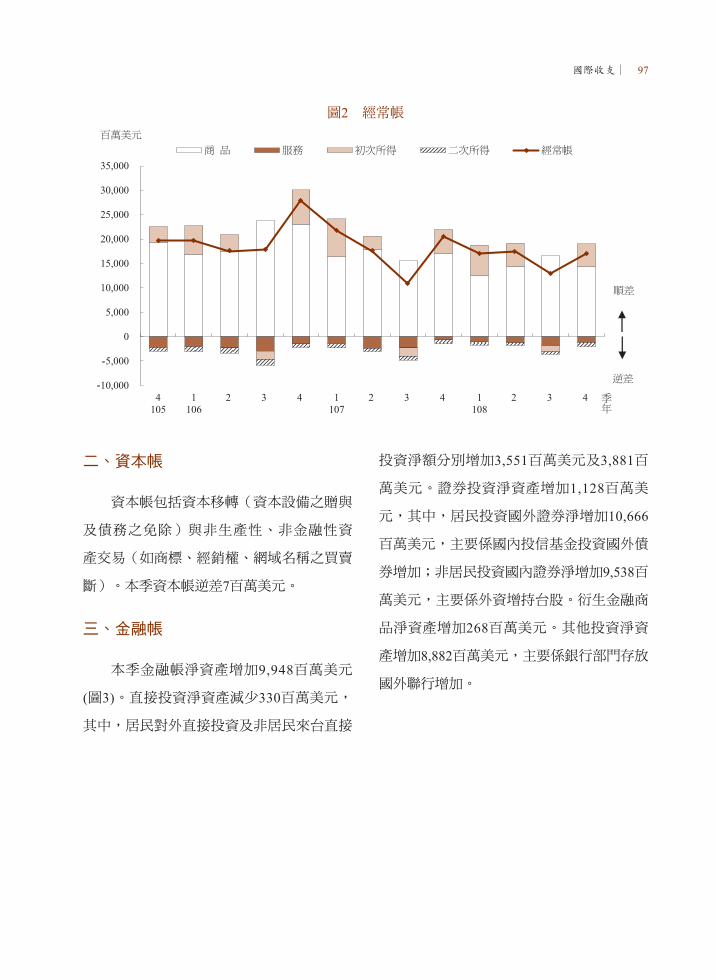
國際收支∣ 97
圖2 經常帳
二、資本帳
資本帳包括資本移轉(資本設備之贈與
及債務之免除)與非生產性、非金融性資
產交易(如商標、經銷權、網域名稱之買賣
斷)。本季資本帳逆差7百萬美元。
三、金融帳
本季金融帳淨資產增加9,948百萬美元
(圖3)。直接投資淨資產減少330百萬美元,
其中,居民對外直接投資及非居民來台直接
投資淨額分別增加3,551百萬美元及3,881百
萬美元。證券投資淨資產增加1,128百萬美
元,其中,居民投資國外證券淨增加10,666
百萬美元,主要係國內投信基金投資國外債
券增加;非居民投資國內證券淨增加9,538百
萬美元,主要係外資增持台股。衍生金融商
品淨資產增加268百萬美元。其他投資淨資
產增加8,882百萬美元,主要係銀行部門存放
國外聯行增加。

98 ∣中央銀行季刊 第42卷第1期 民國109年3月
圖3 金融帳
貳、經常帳
一、商品貿易
本季商品貿易,依國際收支基礎計算,
商品出口85,508百萬美元,較上年同季減少
1,389百萬美元或1.6%,主要係受全球經濟
趨緩及國際原物料價格跌多漲少等影響,此
外,受到中國大陸經營環境改變,商仲貿
易商品淨出口與涉及委外加工貿易的商品
出口均減少。商品進口71,199百萬美元,較
上年同季增加1,272百萬美元或1.8%,主要
係半導體設備投資強勁影響。由於出口減
少、進口增加,商品貿易順差減為14,309百
萬美元,較上年同季減少2,661百萬美元或
15.7%。
以下根據海關進出口貿易統計,就貿易
結構與主要貿易地區別進一步分析出、進口
概況。
就貿易結構而言,本季出口及進口分別
較上年同季增加1.8%及4.9%,出口方面,中
間產品出口減少0.6%,資本財出口則因5G基
礎建設拉貨增加,加上美中貿易摩擦,部分
廠商將資通產品生產線移回,出口較上年同
季增加10.5%,另消費品出口亦增加11.7%。
進口方面,因廠商增購半導體設備,資本設
備進口較上年同季鉅增50.5%,另消費品進
口較上年同季增加8.1%,惟農工原料進口則
減少5.0%。
就主要貿易地區而言,出口方面,本季
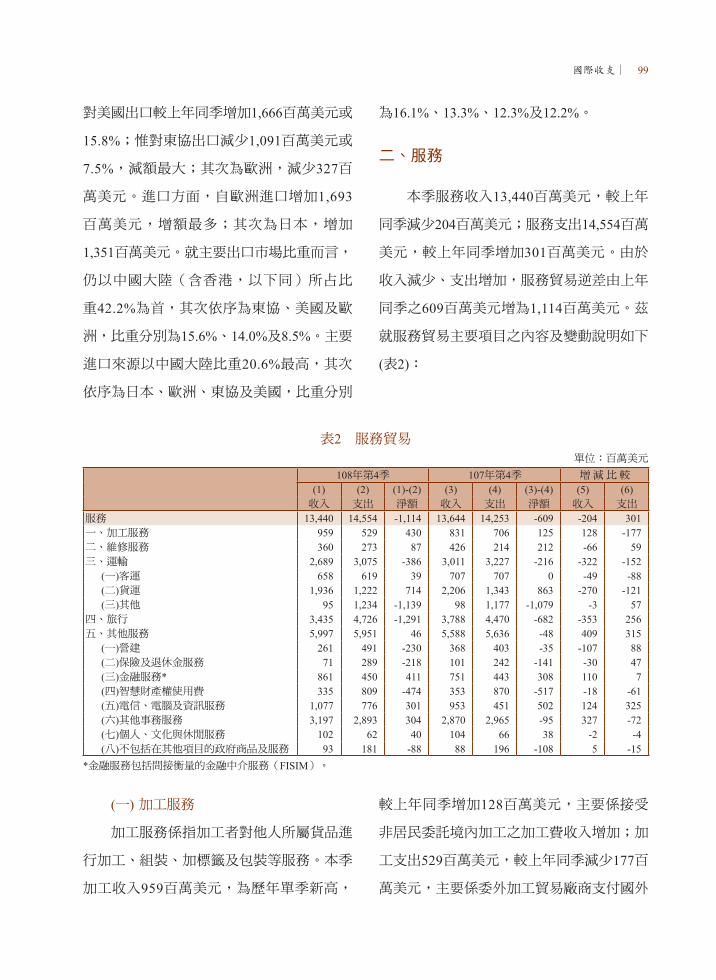
國際收支∣ 99
對美國出口較上年同季增加1,666百萬美元或
15.8%;惟對東協出口減少1,091百萬美元或
7.5%,減額最大;其次為歐洲,減少327百
萬美元。進口方面,自歐洲進口增加1,693
百萬美元,增額最多;其次為日本,增加
1,351百萬美元。就主要出口市場比重而言,
仍以中國大陸(含香港,以下同)所占比
重42.2%為首,其次依序為東協、美國及歐
洲,比重分別為15.6%、14.0%及8.5%。主要
進口來源以中國大陸比重20.6%最高,其次
依序為日本、歐洲、東協及美國,比重分別
為16.1%、13.3%、12.3%及12.2%。
二、服務
本季服務收入13,440百萬美元,較上年
同季減少204百萬美元;服務支出14,554百萬
美元,較上年同季增加301百萬美元。由於
收入減少、支出增加,服務貿易逆差由上年
同季之609百萬美元增為1,114百萬美元。茲
就服務貿易主要項目之內容及變動說明如下
(表2):
表2 服務貿易單位:百萬美元
108年第4季 107年第4季 增 減 比 較(1) (2) (1)-(2) (3) (4) (3)-(4) (5) (6)收入 支出 淨額 收入 支出 淨額 收入 支出
服務 13,440 14,554 -1,114 13,644 14,253 -609 -204 301一、加工服務 959 529 430 831 706 125 128 -177二、維修服務 360 273 87 426 214 212 -66 59三、運輸 2,689 3,075 -386 3,011 3,227 -216 -322 -152 (一)客運 658 619 39 707 707 0 -49 -88 (二)貨運 1,936 1,222 714 2,206 1,343 863 -270 -121 (三)其他 95 1,234 -1,139 98 1,177 -1,079 -3 57四、旅行 3,435 4,726 -1,291 3,788 4,470 -682 -353 256五、其他服務 5,997 5,951 46 5,588 5,636 -48 409 315 (一)營建 261 491 -230 368 403 -35 -107 88 (二)保險及退休金服務 71 289 -218 101 242 -141 -30 47 (三)金融服務* 861 450 411 751 443 308 110 7 (四)智慧財產權使用費 335 809 -474 353 870 -517 -18 -61 (五)電信、電腦及資訊服務 1,077 776 301 953 451 502 124 325 (六)其他事務服務 3,197 2,893 304 2,870 2,965 -95 327 -72 (七)個人、文化與休閒服務 102 62 40 104 66 38 -2 -4 (八)不包括在其他項目的政府商品及服務 93 181 -88 88 196 -108 5 -15*金融服務包括間接衡量的金融中介服務(FISIM)。
(一) 加工服務
加工服務係指加工者對他人所屬貨品進
行加工、組裝、加標籤及包裝等服務。本季
加工收入959百萬美元,為歷年單季新高,
較上年同季增加128百萬美元,主要係接受
非居民委託境內加工之加工費收入增加;加
工支出529百萬美元,較上年同季減少177百
萬美元,主要係委外加工貿易廠商支付國外
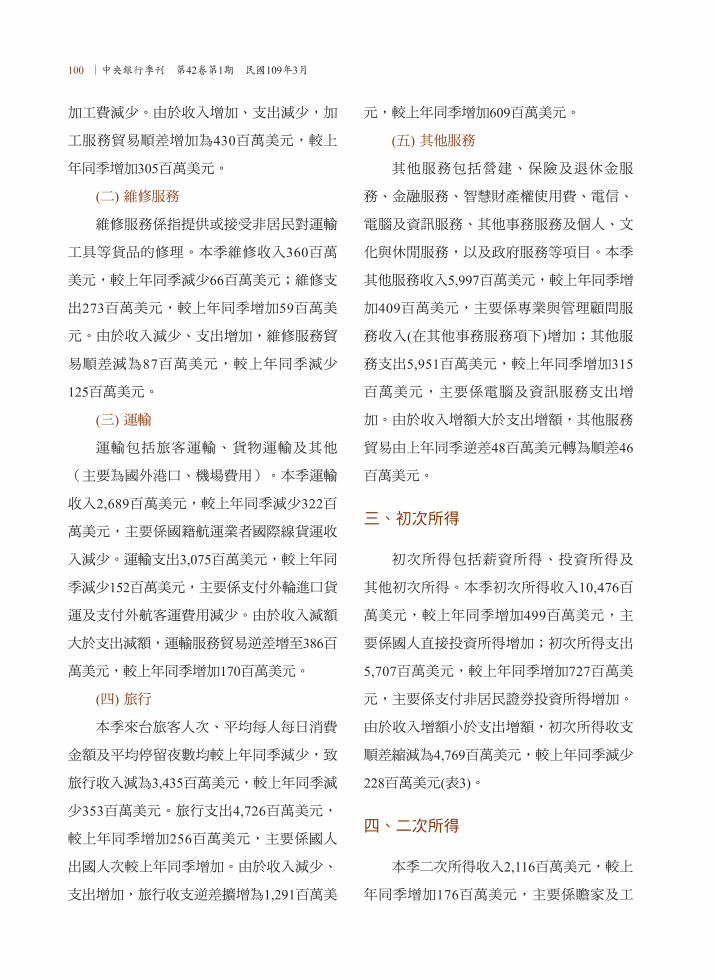
100 ∣中央銀行季刊 第42卷第1期 民國109年3月
加工費減少。由於收入增加、支出減少,加
工服務貿易順差增加為430百萬美元,較上
年同季增加305百萬美元。
(二) 維修服務
維修服務係指提供或接受非居民對運輸
工具等貨品的修理。本季維修收入360百萬
美元,較上年同季減少66百萬美元;維修支
出273百萬美元,較上年同季增加59百萬美
元。由於收入減少、支出增加,維修服務貿
易順差減為87百萬美元,較上年同季減少
125百萬美元。
(三) 運輸
運輸包括旅客運輸、貨物運輸及其他
(主要為國外港口、機場費用)。本季運輸
收入2,689百萬美元,較上年同季減少322百
萬美元,主要係國籍航運業者國際線貨運收
入減少。運輸支出3,075百萬美元,較上年同
季減少152百萬美元,主要係支付外輪進口貨
運及支付外航客運費用減少。由於收入減額
大於支出減額,運輸服務貿易逆差增至386百
萬美元,較上年同季增加170百萬美元。
(四) 旅行
本季來台旅客人次、平均每人每日消費
金額及平均停留夜數均較上年同季減少,致
旅行收入減為3,435百萬美元,較上年同季減
少353百萬美元。旅行支出4,726百萬美元,
較上年同季增加256百萬美元,主要係國人
出國人次較上年同季增加。由於收入減少、
支出增加,旅行收支逆差擴增為1,291百萬美
元,較上年同季增加609百萬美元。
(五) 其他服務
其他服務包括營建、保險及退休金服
務、金融服務、智慧財產權使用費、電信、
電腦及資訊服務、其他事務服務及個人、文
化與休閒服務,以及政府服務等項目。本季
其他服務收入5,997百萬美元,較上年同季增
加409百萬美元,主要係專業與管理顧問服
務收入(在其他事務服務項下)增加;其他服
務支出5,951百萬美元,較上年同季增加315
百萬美元,主要係電腦及資訊服務支出增
加。由於收入增額大於支出增額,其他服務
貿易由上年同季逆差48百萬美元轉為順差46
百萬美元。
三、初次所得
初次所得包括薪資所得、投資所得及
其他初次所得。本季初次所得收入10,476百
萬美元,較上年同季增加499百萬美元,主
要係國人直接投資所得增加;初次所得支出
5,707百萬美元,較上年同季增加727百萬美
元,主要係支付非居民證券投資所得增加。
由於收入增額小於支出增額,初次所得收支
順差縮減為4,769百萬美元,較上年同季減少
228百萬美元(表3)。
四、二次所得
本季二次所得收入2,116百萬美元,較上
年同季增加176百萬美元,主要係贍家及工
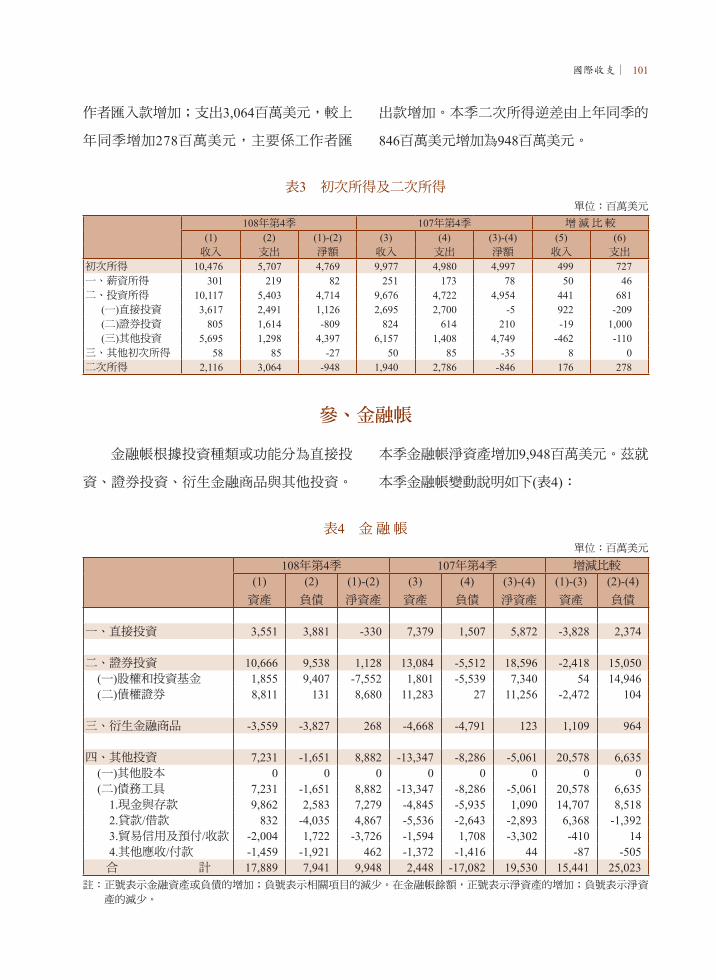
國際收支∣ 101
表3 初次所得及二次所得單位:百萬美元
108年第4季 107年第4季 增 減 比 較(1) (2) (1)-(2) (3) (4) (3)-(4) (5) (6)收入 支出 淨額 收入 支出 淨額 收入 支出
初次所得 10,476 5,707 4,769 9,977 4,980 4,997 499 727一、薪資所得 301 219 82 251 173 78 50 46二、投資所得 10,117 5,403 4,714 9,676 4,722 4,954 441 681 (一)直接投資 3,617 2,491 1,126 2,695 2,700 -5 922 -209 (二)證券投資 805 1,614 -809 824 614 210 -19 1,000 (三)其他投資 5,695 1,298 4,397 6,157 1,408 4,749 -462 -110三、其他初次所得 58 85 -27 50 85 -35 8 0二次所得 2,116 3,064 -948 1,940 2,786 -846 176 278
參、金融帳
金融帳根據投資種類或功能分為直接投
資、證券投資、衍生金融商品與其他投資。
本季金融帳淨資產增加9,948百萬美元。茲就
本季金融帳變動說明如下(表4):
表4 金 融 帳單位:百萬美元
108年第4季 107年第4季 增減比較
(1)資產
(2)負債
(1)-(2)淨資產
(3)資產
(4)負債
(3)-(4)淨資產
(1)-(3)資產
(2)-(4)負債
一、直接投資 3,551 3,881 -330 7,379 1,507 5,872 -3,828 2,374
二、證券投資 10,666 9,538 1,128 13,084 -5,512 18,596 -2,418 15,050 (一)股權和投資基金 1,855 9,407 -7,552 1,801 -5,539 7,340 54 14,946 (二)債權證券 8,811 131 8,680 11,283 27 11,256 -2,472 104
三、衍生金融商品 -3,559 -3,827 268 -4,668 -4,791 123 1,109 964
四、其他投資 7,231 -1,651 8,882 -13,347 -8,286 -5,061 20,578 6,635 (一)其他股本 0 0 0 0 0 0 0 0 (二)債務工具 7,231 -1,651 8,882 -13,347 -8,286 -5,061 20,578 6,635 1.現金與存款 9,862 2,583 7,279 -4,845 -5,935 1,090 14,707 8,518 2.貸款/借款 832 -4,035 4,867 -5,536 -2,643 -2,893 6,368 -1,392 3.貿易信用及預付/收款 -2,004 1,722 -3,726 -1,594 1,708 -3,302 -410 14 4.其他應收/付款 -1,459 -1,921 462 -1,372 -1,416 44 -87 -505合 計 17,889 7,941 9,948 2,448 -17,082 19,530 15,441 25,023
註:正號表示金融資產或負債的增加;負號表示相關項目的減少。在金融帳餘額,正號表示淨資產的增加;負號表示淨資
產的減少。
作者匯入款增加;支出3,064百萬美元,較上
年同季增加278百萬美元,主要係工作者匯
出款增加。本季二次所得逆差由上年同季的
846百萬美元增加為948百萬美元。
102 ∣中央銀行季刊 第42卷第1期 民國109年3月
一、直接投資
本季直接投資淨資產減少330百萬美
元。其中,對外直接投資淨增加3,551百萬美
元,投資行業則以金融及保險業、批發及零
售業及電子零組件製造業為主;非居民來台
直接投資淨增加3,881百萬美元,主要投資行
業為資訊及通訊傳播業、金融及保險業與專
業、科學及技術服務業。
二、證券投資
本季證券投資淨資產增加1,128百萬美
元。茲就資產與負債分別說明如下:
(一) 資產方面
本季居民投資國外證券淨增加10,666百
萬美元。其中股權和投資基金淨增加1,855
百萬美元,主要係退休基金增持國外股權證
券;債務證券淨增加8,811百萬美元,主要係
國內投信基金投資國外債務證券增加。
(二) 負債方面
本季非居民投資國內證券淨增加9,538百
萬美元。其中股權及投資基金淨增加9,407百
萬美元,主要係外資增持國內股票;債務證
券投資淨增加131百萬美元,主要係外資增
持我國公債。
三、衍生金融商品
本季衍生金融商品淨資產增加268百萬
美元。其中,資產淨減少3,559百萬美元,主
要係其他金融機構收取衍生金融商品處分利
得;負債淨減少3,827百萬美元,主要係其他
金融機構支付衍生金融商品處分損失。
四、其他投資
其他投資包括其他股本及債務工具,本
季其他投資淨資產增加8,882百萬美元,主要
係銀行部門存放國外聯行增加。
肆、中央銀行準備資產
本季國際收支呈現順差,反映在中央銀行準備資產增加7,481百萬美元。

貨幣與信用∣ 103
貨幣與信用
108年第4季,M2年增率大抵呈上升走
勢,自9月的3.40%上升至12月的4.12%;累
計全年M2平均年增率為3.46%。109年初以
來,受春節因素及資金移動影響,M2年增
率先升後降,至2月為4.35%(表1);累計1至2
月M2平均年增率為4.47%,落在貨幣成長參
考區內,市場資金維持適度成長。
鑑於嚴重特殊傳染性肺炎蔓延,全球經
濟前景急遽惡化,本行除下修經濟成長率預
測及通膨展望外,並在109年3月理事會決議
調降政策利率0.25個百分點,重貼現率、擔
保放款融通利率及短期融通利率目前分別為
1.125%、1.5%及3.375%。在存放款利率方
面,108年第4季主要銀行存款利率持穩,惟
至109年3月,因受本行降息影響,五大銀行
平均一年期存款固定利率調降為0.769%;至
於五大銀行平均基準放款利率至109年3月底
均仍持穩於2.631%。另在五大銀行新承做
放款利率方面,除因新承做利率較低的大額
公民營企業與政府機關貸款外,由於市場競
爭激烈,加以台商回台投資專案貸款增加,
108年第4季五大銀行新承做放款加權平均利
率升降互見,至12月底為1.398%。
壹、概述
表1 重要金融指標年增率單位:%
年 / 月貨幣總計數
準備貨幣全體貨幣
機構存款
全體貨幣機構
放款與投資
全體貨幣機構
對
民間部門債權M1B M2
106 4.65 3.75 5.04 3.38 4.82 5.97107 5.32 3.52 5.61 2.62 5.39 5.33108 7.15 3.46 6.42 4.38 4.96 5.66108/ 2 5.97 2.92 6.46 3.00 5.48 5.45
3 6.87 3.10 5.59 3.24 5.00 4.854 7.65 3.71 6.38 3.51 4.97 4.955 7.23 3.40 6.50 3.15 4.38 4.256 7.35 3.05 6.32 3.23 4.04 4.247 7.33 3.38 5.67 2.97 4.26 4.698 7.53 3.35 6.40 3.18 3.95 4.309 7.39 3.40 6.32 3.32 4.21 4.49
10 6.99 3.79 6.57 4.16 4.89 5.3311 7.46 4.14 6.70 4.03 4.51 5.1012 7.44 4.12 7.08 4.38 4.96 5.66
109/ 1 7.61 4.60 9.38 4.71 4.90 5.962 7.00 4.35 4.89 4.79 5.47 6.89
註:M1B、M2與準備貨幣年增率係日平均資料(準備貨幣為經調整存款準備率變動因素後之資料);其餘各項年增率則係期底資料。放款與投資之「證券投資」係以原始成本衡量。

104 ∣中央銀行季刊 第42卷第1期 民國109年3月
貳、準備貨幣年增率先升後降
由於外資轉呈淨匯入,以及放款與投資
成長增加,致準備金需求上升,108年第4季
日平均準備貨幣年增率為6.79%,高於上季
之6.13%。其中,10月受放款與投資成長增
加,以及外資淨匯入擴增影響,準備貨幣年
增率上升為6.57%;11月因活期性存款成長增
加,致準備金需求上升,準備貨幣年增率續
升為6.70%;12月因放款與投資成長增加,加
以外資淨匯入擴增,準備貨幣年增率再升為
7.08%。至於109年1月受農曆春節前資金需求
轉強影響,準備貨幣年增率升至9.38%;2月則
因春節過後通貨陸續回籠,加以外資轉呈淨匯
出,準備貨幣年增率降至4.89%,1至2月平均
準備貨幣年增率為7.08%(圖1)。
就準備貨幣變動來源分析,108年第4季雖
有財政部發行公債與國庫券、國庫向銀行借
款、稅款繳庫,以及本行發行定存單等緊縮因
素,惟受國庫券與公債還本付息、財政部償還
銀行借款、發放各項補助款與統籌分配款,以
及本行定存單到期等寬鬆因素影響,日平均準
備貨幣水準值較上季增加。至於109年1月及2
月,日平均準備貨幣水準值續呈上升趨勢。
圖1 準備貨幣及M2年增率
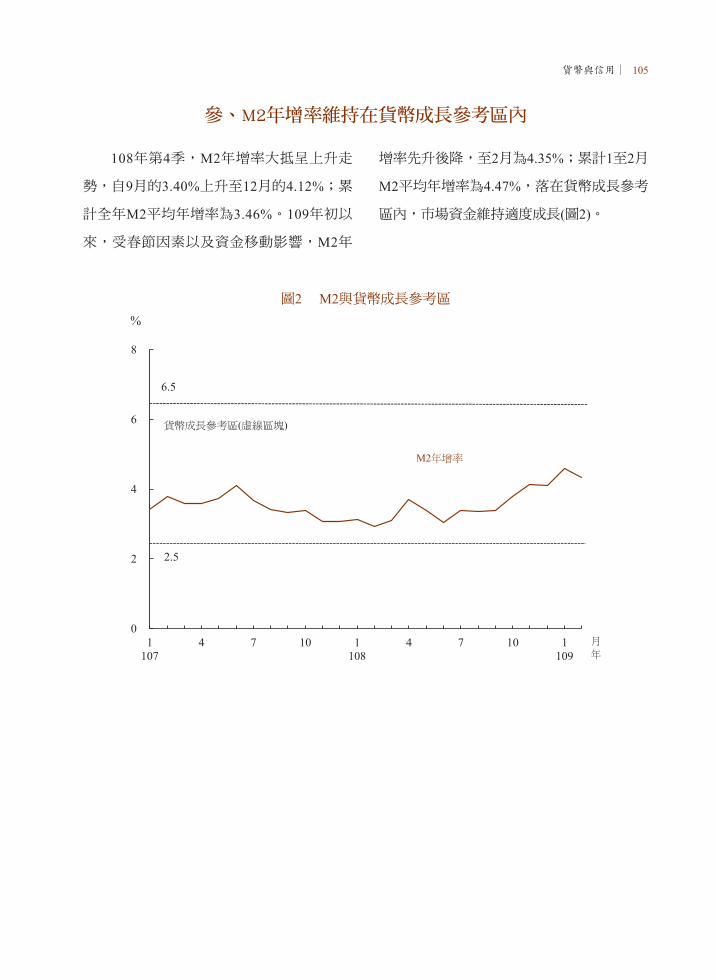
貨幣與信用∣ 105
參、M2年增率維持在貨幣成長參考區內
108年第4季,M2年增率大抵呈上升走
勢,自9月的3.40%上升至12月的4.12%;累
計全年M2平均年增率為3.46%。109年初以
來,受春節因素以及資金移動影響,M2年
增率先升後降,至2月為4.35%;累計1至2月
M2平均年增率為4.47%,落在貨幣成長參考
區內,市場資金維持適度成長(圖2)。
圖2 M2與貨幣成長參考區
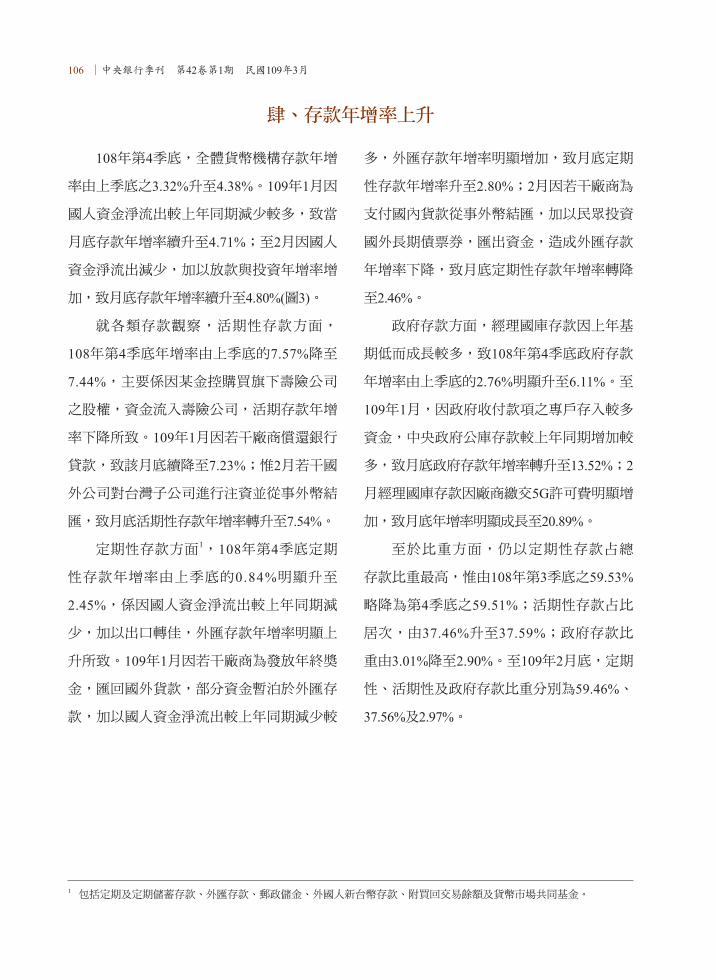
106 ∣中央銀行季刊 第42卷第1期 民國109年3月
肆、存款年增率上升
108年第4季底,全體貨幣機構存款年增
率由上季底之3.32%升至4.38%。109年1月因
國人資金淨流出較上年同期減少較多,致當
月底存款年增率續升至4.71%;至2月因國人
資金淨流出減少,加以放款與投資年增率增
加,致月底存款年增率續升至4.80%(圖3)。
就各類存款觀察,活期性存款方面,
108年第4季底年增率由上季底的7.57%降至
7.44%,主要係因某金控購買旗下壽險公司
之股權,資金流入壽險公司,活期存款年增
率下降所致。109年1月因若干廠商償還銀行
貸款,致該月底續降至7.23%;惟2月若干國
外公司對台灣子公司進行注資並從事外幣結
匯,致月底活期性存款年增率轉升至7.54%。
定期性存款方面1,108年第4季底定期
性存款年增率由上季底的0.84%明顯升至
2.45%,係因國人資金淨流出較上年同期減
少,加以出口轉佳,外匯存款年增率明顯上
升所致。109年1月因若干廠商為發放年終獎
金,匯回國外貨款,部分資金暫泊於外匯存
款,加以國人資金淨流出較上年同期減少較
多,外匯存款年增率明顯增加,致月底定期
性存款年增率升至2.80%;2月因若干廠商為
支付國內貨款從事外幣結匯,加以民眾投資
國外長期債票券,匯出資金,造成外匯存款
年增率下降,致月底定期性存款年增率轉降
至2.46%。
政府存款方面,經理國庫存款因上年基
期低而成長較多,致108年第4季底政府存款
年增率由上季底的2.76%明顯升至6.11%。至
109年1月,因政府收付款項之專戶存入較多
資金,中央政府公庫存款較上年同期增加較
多,致月底政府存款年增率轉升至13.52%;2
月經理國庫存款因廠商繳交5G許可費明顯增
加,致月底年增率明顯成長至20.89%。
至於比重方面,仍以定期性存款占總
存款比重最高,惟由108年第3季底之59.53%
略降為第4季底之59.51%;活期性存款占比
居次,由37.46%升至37.59%;政府存款比
重由3.01%降至2.90%。至109年2月底,定期
性、活期性及政府存款比重分別為59.46%、
37.56%及2.97%。
1 包括定期及定期儲蓄存款、外匯存款、郵政儲金、外國人新台幣存款、附買回交易餘額及貨幣市場共同基金。
貨幣與信用∣ 107
圖3 全體貨幣機構存款及放款與投資年增率
伍、銀行放款與投資年增率上升
108年第4季底全體貨幣機構放款與投資
之餘額,以成本計價,較上季底增加4,571億
元。就性質別觀察,放款增加2,530億元,投
資增加2,042億元;放款與投資年增率由上
季底之4.21%升至4.96%,主要因第4季底銀
行對民間部門債權成長上升所致;109年1月
底,由於銀行對政府債權成長下降,致放款
與投資年增率略降至4.90%;2月底,隨銀行
對民間部門債權成長上升,放款與投資年增
率回升至5.47%(圖3)。若包含人壽保險公司
放款與投資,並加計銀行轉列之催收款及轉
銷呆帳金額,以及直接金融,108年第4季底
全體非金融部門取得資金總額年增率由上季
底之3.43%上升至4.03%;109年1月底,年增
率續升至4.15%,主因民間部門持有之政府
債券較上年同期為多,致直接金融之年增率
減幅縮小;2月底升至4.58%。
就放款與投資之對象別觀察,108年第
4季底全體貨幣機構對民間部門債權年增率
由上季底之4.49%上升至5.66%,主因積體電
路及資通訊產品出口熱絡及建商土建融資需
求增加,加以年底銀行新台幣資金充足,增
持較多民營商業本票,致銀行對民間部門放
款與投資成長均上升;對政府債權年增率由
上季底之3.07%續降至1.65%,主因政府發
行國庫券及公債,並償還較多借款,致對政
府放款成長下降;對公營事業債權年增率由
2.41%上升至2.84%,主因台電、中油及台鐵
發行商業本票,致銀行對公營事業投資轉呈
正成長。
比重方面,108年第4季底以對民間部
門債權比重最高,由上季底之82.03%續升
108 ∣中央銀行季刊 第42卷第1期 民國109年3月
2 包括本國銀行、外國銀行及大陸銀行在台分行。3 包括批發及零售業、運輸及倉儲業、住宿及餐飲業、資訊及通訊傳播業、金融及保險業、不動產業及其他服務業等。
至82.25%,109年2月底降至82.01%;對政
府債權比重次之,由上季底之14.86%降至
14.59%,109年2月底續降至14.80%;對公營
事業債權比重由上季底之3.11%升至3.16%,
109年2月底續升至3.19%。
在全體銀行2 對民營企業放款行業別方
面,108年第4季底對民營企業放款餘額較上
季底增加1,229億元。行業別方面,全體銀行
對製造業放款增加97億元,其中,以對金屬
製品製造業之放款金額增加187億元最多,
主因某手機與筆電機殼大廠營運週轉之資金
需求增加;對服務業3 放款增加1,064億元,
以對不動產業放款增加964億元最多,主因
房市景氣增溫,土建融資金需求續升所致。
109年2月底,全體銀行對民營企業放款餘額
較108年第4季底增加1,530億元,其中,對製
造業放款增加101億元,對服務業放款增加
1,323億元。
就各業別比重而言,108年第4季底對服
務業放款比重最高,自上季底之51.86%上升
至52.25%;對製造業放款比重則自上季底之
43.84%下降至43.44%;對營建工程業放款比
重則自上季底之2.58%下降至2.53%。109年2
月底對服務業放款比重續升至52.67%;對製
造業放款比重續降至42.98%;對營建工程放
款比重則微降至2.52%。
陸、銀行業利率持穩
鑑於肺炎疫情蔓延,全球經濟前景急
遽惡化,本行下修109年經濟成長率預測及
通膨展望,並在109年3月理事會決議調降重
貼現率、擔保放款融通利率及短期融通利率
各0.25個百分點,分別由1.375%、1.75%及
3.625%調整為1.125%、1.5%及3.375%,營
造寬鬆貨幣環境,並推出支持中小企業專案
融通機制。
108年10月以來,主要銀行存款利率持
穩;惟109年3月受本行降息影響,主要銀
行調降存款牌告利率,以臺銀、合庫銀、土
銀、華銀及一銀等五大銀行平均利率為例,
一年期存款固定利率由2月底之1.039%降至3
月24日之0.769%,至3月底維持不變。至於
基準放款利率,五大銀行平均基準放款利率
則持穩於2.631%,至109年3月底亦維持不
變。
在五大銀行新承做放款加權平均利率
方面,由108年9月的1.390%先升至10月之
1.431%,12月再回降至1.398%,主因新承做
利率較低的大額公民營企業與政府機關貸款
先減後增,加以11月因放款市場競爭激烈,

貨幣與信用∣ 109
以及12月新承做利率較低的台商回台投資專
案貸款增加所致。之後加權平均利率仍受大
額政府借款及政府機關貸款增減而變化,致
平均利率先降至109年1月之1.297%,爾後回
升至2月之1.434%,仍較108年9月上升0.044
個百分點;若不含國庫借款的新承做放款加
權平均利率則自108年9月的1.415%升至109
年2月的1.443%,亦較108年9月上升0.028個
百分點(圖4)。
圖4 本國五大銀行平均利率
註:五大銀行係指臺銀、合庫銀、土銀、華銀及一銀。

110 ∣中央銀行季刊 第42卷第1期 民國109年3月
金融市場∣ 111
金融市場
壹、貨幣市場
108年12月年底資金需求較高,銀行資
金調度轉趨保守,致金融業隔夜拆款加權平
均利率微升至0.177%;109年1月適逢農曆年
關,銀行資金調度續呈保守,致金融業隔夜
拆款利率續升至0.180%;2月年關過後通貨
回籠,市場資金較為充裕,金融業隔夜拆款
加權平均利率回降至0.178%。貨幣機構109
年1月及2月的日平均超額準備為501億元,
較108年第4季平均之459億元上升。
本行108年12月理事會決議維持現行政
策利率不變。之後,因肺炎疫情擴散全球,
衝擊全球供應鏈運作,全球金融市場劇烈波
動,加上國際原油等商品價格重挫,在預期
經濟成長率及通膨展望下修情況下,且主要
經濟體紛紛採行寬鬆貨幣政策,本行109年3
月理事會決議調降政策利率0.25個百分點。
以下分別就108年12月至109年2月之資金
情勢、利率走勢及票券流通餘額加以分析:
一、資金情勢
108年12月因年底資金需求較高,銀行
為因應短期資金移動,遂維持較高部位的超
額準備,致日平均超額準備由11月之395億
元上升至527億元。109年1月雖受政府發行
國庫券、大額國庫借款及稅款繳庫等緊縮因
素影響,惟外資續呈淨匯入,加以農曆春節
將至,資金需求增加,銀行為因應短期資金
移動,續維持較高部位的超額準備,致日平
均超額準備續升至539億元。2月農曆年後通
貨陸續回籠,市場資金仍屬寬鬆,惟受本行
發行定存單收回市場餘裕資金、稅款繳庫、
政府發行公債與國庫券,以及外資轉呈淨匯
出等緊縮因素影響,致日平均超額準備回降
至463億元。
二、利率走勢
108年12月雖市場資金充裕,且外資呈
淨匯入,惟受公債及國庫券發行等緊縮因
素影響,加以年底資金需求增加,銀行資金
調度審慎保守,致金融業隔夜拆款加權平均
利率由11月0.176%微升至0.177%。之後,
109年1月雖市場資金仍屬充裕,惟國庫券發
行、國庫借款增加,加上適逢農曆年關,通
貨需求明顯增加,致金融業隔拆加權平均利
率續升至0.180%。2月年關過後通貨回籠,
市場資金充裕,金融業隔拆加權平均利率微
降至0.178%(表1)。
至於票券市場短期利率方面,各天期利
率大抵呈現下降趨勢,其中商業本票1-30天
期發行利率由108年11月之0.63%略降至109
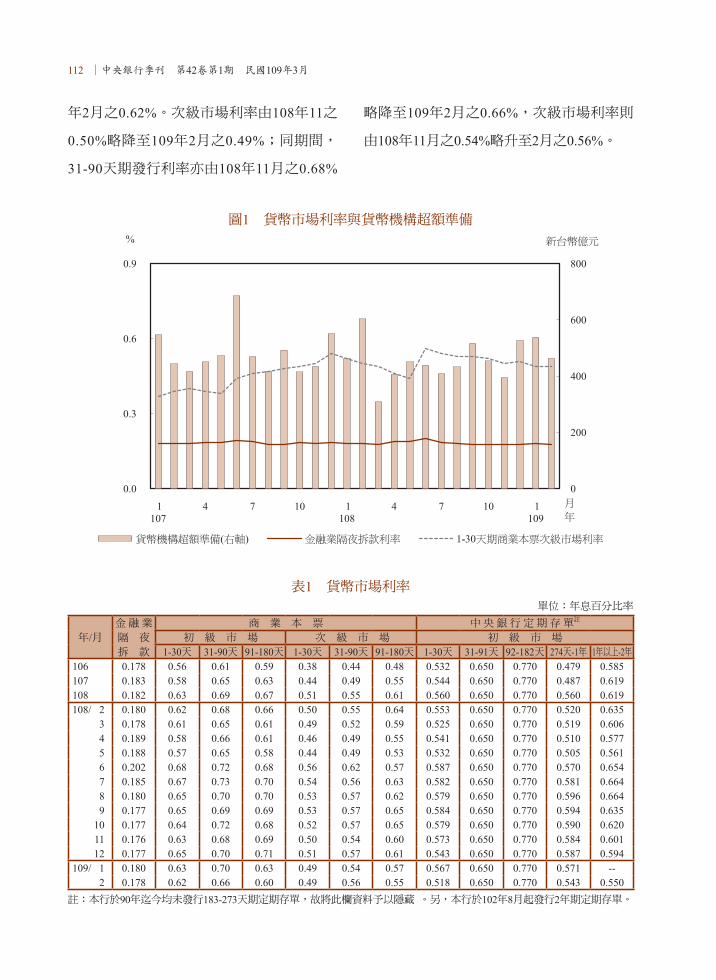
112 ∣中央銀行季刊 第42卷第1期 民國109年3月
圖1 貨幣市場利率與貨幣機構超額準備
表1 貨幣市場利率單位:年息百分比率
年/月金 融 業 商 業 本 票 中 央 銀 行 定 期 存 單註
隔 夜 初 級 市 場 次 級 市 場 初 級 市 場拆 款 1-30天 31-90天 91-180天 1-30天 31-90天 91-180天 1-30天 31-91天 92-182天 274天-1年 1年以上-2年
106 0.178 0.56 0.61 0.59 0.38 0.44 0.48 0.532 0.650 0.770 0.479 0.585107 0.183 0.58 0.65 0.63 0.44 0.49 0.55 0.544 0.650 0.770 0.487 0.619108 0.182 0.63 0.69 0.67 0.51 0.55 0.61 0.560 0.650 0.770 0.560 0.619108/ 2 0.180 0.62 0.68 0.66 0.50 0.55 0.64 0.553 0.650 0.770 0.520 0.635
3 0.178 0.61 0.65 0.61 0.49 0.52 0.59 0.525 0.650 0.770 0.519 0.6064 0.189 0.58 0.66 0.61 0.46 0.49 0.55 0.541 0.650 0.770 0.510 0.5775 0.188 0.57 0.65 0.58 0.44 0.49 0.53 0.532 0.650 0.770 0.505 0.5616 0.202 0.68 0.72 0.68 0.56 0.62 0.57 0.587 0.650 0.770 0.570 0.6547 0.185 0.67 0.73 0.70 0.54 0.56 0.63 0.582 0.650 0.770 0.581 0.6648 0.180 0.65 0.70 0.70 0.53 0.57 0.62 0.579 0.650 0.770 0.596 0.6649 0.177 0.65 0.69 0.69 0.53 0.57 0.65 0.584 0.650 0.770 0.594 0.635
10 0.177 0.64 0.72 0.68 0.52 0.57 0.65 0.579 0.650 0.770 0.590 0.62011 0.176 0.63 0.68 0.69 0.50 0.54 0.60 0.573 0.650 0.770 0.584 0.60112 0.177 0.65 0.70 0.71 0.51 0.57 0.61 0.543 0.650 0.770 0.587 0.594
109/ 1 0.180 0.63 0.70 0.63 0.49 0.54 0.57 0.567 0.650 0.770 0.571 --2 0.178 0.62 0.66 0.60 0.49 0.56 0.55 0.518 0.650 0.770 0.543 0.550
註:本行於90年迄今均未發行183-273天期定期存單,故將此欄資料予以隱藏 。另,本行於102年8月起發行2年期定期存單。
年2月之0.62%。次級市場利率由108年11之
0.50%略降至109年2月之0.49%;同期間,
31-90天期發行利率亦由108年11月之0.68%
略降至109年2月之0.66%,次級市場利率則
由108年11月之0.54%略升至2月之0.56%。

金融市場∣ 113
表2 短期票券之發行、償還及餘額單位:新台幣億元
年 / 月合 計 國 庫 券 市 庫 券 商 業 本 票 銀行承兌匯票 可轉讓定期存單
發行額 償還額 餘 額 發行額 償還額 餘 額 發行額 償還額 餘 額 發行額 償還額 餘 額 發行額 償還額 餘 額 發行額 償還額 餘 額106 148,785 145,975 21,545 2,200 2,850 250 0 0 0 130,778 128,489 17,090 194 193 42 15,613 14,443 4,164
107 149,719 149,033 22,231 1,600 1,550 300 0 0 0 129,650 129,134 17,606 185 186 40 18,285 18,163 4,285
108 149,273 147,973 23,532 3,140 2,790 650 0 0 0 136,136 133,401 20,341 140 155 26 9,857 11,627 2,515
108/ 2 10,567 9,655 24,071 650 0 1,540 0 0 0 9,272 8,712 18,637 11 12 37 633 932 3,857
3 13,497 12,775 24,793 300 0 1,840 0 0 0 11,897 11,396 19,139 11 15 33 1,289 1,364 3,781
4 13,166 12,751 25,208 650 590 1,900 0 0 0 11,852 11,222 19,769 14 13 34 650 926 3,505
5 12,158 12,727 24,638 0 0 1,900 0 0 0 11,556 11,616 19,708 11 12 33 591 1,099 2,997
6 9,578 11,108 23,109 0 300 1,600 0 0 0 8,799 9,705 18,802 12 10 35 768 1,093 2,671
7 12,885 13,200 22,794 0 650 950 0 0 0 12,121 11,868 19,055 12 16 31 753 667 2,757
8 12,532 12,749 22,577 0 350 600 0 0 0 11,974 11,451 19,578 12 10 33 547 938 2,366
9 11,726 11,773 22,529 0 0 600 0 0 0 10,605 11,016 19,167 10 13 30 1,110 744 2,733
10 13,717 13,430 22,816 0 300 300 0 0 0 12,988 12,305 19,850 11 13 28 718 812 2,639
11 13,222 13,139 22,900 0 300 0 0 0 0 12,489 12,147 20,191 11 9 29 723 682 2,679
12 12,408 11,777 23,532 650 0 650 0 0 0 11,021 10,872 20,341 10 14 26 727 892 2,515
109/ 1 11,712 9,870 25,374 1,000 0 1,650 0 0 0 10,235 9,245 21,331 10 11 24 467 613 2,369
2 13,657 12,485 26,546 316 0 1,966 0 0 0 12,866 11,971 22,226 11 9 26 464 505 2,328
註:細項加總因四捨五入,容或與總數未盡相符。
三、票券流通餘額
108年第4季底票券流通餘額合計為2兆
3,532億元,較上季底增加1,002億元,其中
以商業本票增加1,174億元為最多,主要係票
券市場利率維持低檔,吸引部分公、民營企
業發行商業本票籌資所致。至於可轉讓定期
存單(NCD)則減少218億元,係因部分銀行審
慎衡量資金情勢,到期不續發或持有NCD的
企業另有資金用途,到期NCD不續做所致。
之後,109年1、2月票券流通餘額續揚,2月
底流通餘額合計為2兆6,546億元,較108年第
4季底增加3,015億元(表2)。其中以商業本票
增加1,885億元為最多,主要係票券市場利率
維持低檔,吸引部分公、民營企業發行商業
本票籌資所致。其次是國庫券增加1,316億
元,係因國庫基於資金調度,發行金額較多
所致。至於可轉讓定期存單(NCD)則減少187
億元,係因部分銀行審慎衡量資金情勢,到
期不續發所致。

114 ∣中央銀行季刊 第42卷第1期 民國109年3月
貳、債券市場
108年第4季債券發行市場,政府公債方
面,中央政府為因應舉新還舊之需,持續定
期適量發行政策,發行公債1,000億元,與
上季相同;公司債方面,發行規模為976億
元,較上季減少125億元,主要因企業轉向
銀行借款所致;金融債券方面,國內銀行發
債總額為390億元,較上季減少116億元,主
要因基期較高所致;至於國際債券方面,
108年第4季外國機構在台發行總額折合新台
幣為1,884億元,較上季增加452億元,主要
因部分外國機構借新債以償還舊債所致。
債券流通市場方面,108年第4季債券交
易量為13兆2,741億元,較上季減少1兆4,592
億元或9.90%。
以下就發行市場與流通市場分別加以說
明:
一、發行市場
(一) 中央政府公債
108年第4季中央政府發行甲類建設公債
1,000億元,與上季相同,發行年期有2年、
10年及30年期。就行業得標比重觀察,本
季平均以證券業得標比重39.35%為最高,
其次為銀行業的39.00%,再次為保險業的
12.95%,至於票券業平均只標得8.70%。
累計至第4季底,中央政府公債發行餘額
為5兆4,833億元,較上季底增加655億元
或1.21%,至109年2月底發行餘額則為5兆
5,283億元。
表3 中央政府公債標售概況表
期別 發行日 年期 發行額 (億元)
最高得標 利率(%)
行業得標比重(%)
銀行業 證券業 票券業 保險業
108甲9 108.10.14 10 300 0.701 31.83 45.50 12.67 10.00
108甲10 108.11.08 30 200 1.000 40.25 49.00 0.00 10.75
108甲11 108.11.22 2 200 0.532 57.00 31.00 3.00 9.00
※108甲9 108.12.13 10 300 0.679 33.34 32.33 14.33 20.00
※為增額公債。
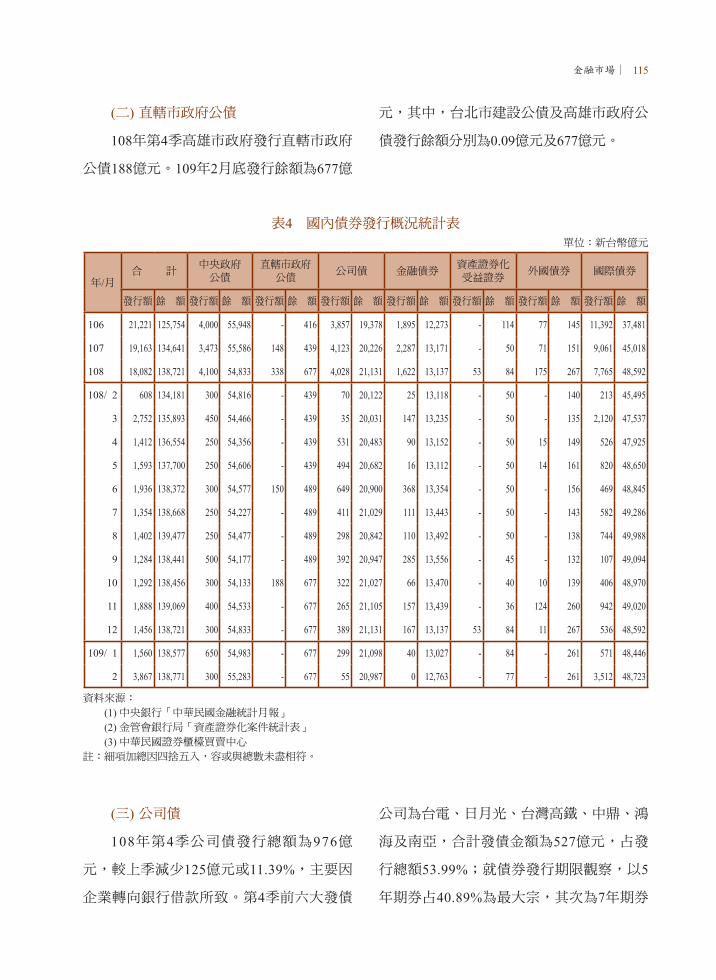
金融市場∣ 115
表4 國內債券發行概況統計表單位:新台幣億元
年/月合 計 中央政府
公債直轄市政府公債
公司債 金融債券資產證券化 受益證券
外國債券 國際債券
發行額 餘 額 發行額 餘 額 發行額 餘 額 發行額 餘 額 發行額 餘 額 發行額 餘 額 發行額 餘 額 發行額 餘 額
106 21,221 125,754 4,000 55,948 - 416 3,857 19,378 1,895 12,273 - 114 77 145 11,392 37,481
107 19,163 134,641 3,473 55,586 148 439 4,123 20,226 2,287 13,171 - 50 71 151 9,061 45,018
108 18,082 138,721 4,100 54,833 338 677 4,028 21,131 1,622 13,137 53 84 175 267 7,765 48,592
108/ 2 608 134,181 300 54,816 - 439 70 20,122 25 13,118 - 50 - 140 213 45,495
3 2,752 135,893 450 54,466 - 439 35 20,031 147 13,235 - 50 - 135 2,120 47,537
4 1,412 136,554 250 54,356 - 439 531 20,483 90 13,152 - 50 15 149 526 47,925
5 1,593 137,700 250 54,606 - 439 494 20,682 16 13,112 - 50 14 161 820 48,650
6 1,936 138,372 300 54,577 150 489 649 20,900 368 13,354 - 50 - 156 469 48,845
7 1,354 138,668 250 54,227 - 489 411 21,029 111 13,443 - 50 - 143 582 49,286
8 1,402 139,477 250 54,477 - 489 298 20,842 110 13,492 - 50 - 138 744 49,988
9 1,284 138,441 500 54,177 - 489 392 20,947 285 13,556 - 45 - 132 107 49,094
10 1,292 138,456 300 54,133 188 677 322 21,027 66 13,470 - 40 10 139 406 48,970
11 1,888 139,069 400 54,533 - 677 265 21,105 157 13,439 - 36 124 260 942 49,020
12 1,456 138,721 300 54,833 - 677 389 21,131 167 13,137 53 84 11 267 536 48,592
109/ 1 1,560 138,577 650 54,983 - 677 299 21,098 40 13,027 - 84 - 261 571 48,446
2 3,867 138,771 300 55,283 - 677 55 20,987 0 12,763 - 77 - 261 3,512 48,723
資料來源: (1) 中央銀行「中華民國金融統計月報」
(2) 金管會銀行局「資產證券化案件統計表」 (3) 中華民國證券櫃檯買賣中心註:細項加總因四捨五入,容或與總數未盡相符。
(二) 直轄市政府公債
108年第4季高雄市政府發行直轄市政府
公債188億元。109年2月底發行餘額為677億
元,其中,台北市建設公債及高雄市政府公
債發行餘額分別為0.09億元及677億元。
(三) 公司債
108年第4季公司債發行總額為976億
元,較上季減少125億元或11.39%,主要因
企業轉向銀行借款所致。第4季前六大發債
公司為台電、日月光、台灣高鐵、中鼎、鴻
海及南亞,合計發債金額為527億元,占發
行總額53.99%;就債券發行期限觀察,以5
年期券占40.89%為最大宗,其次為7年期券
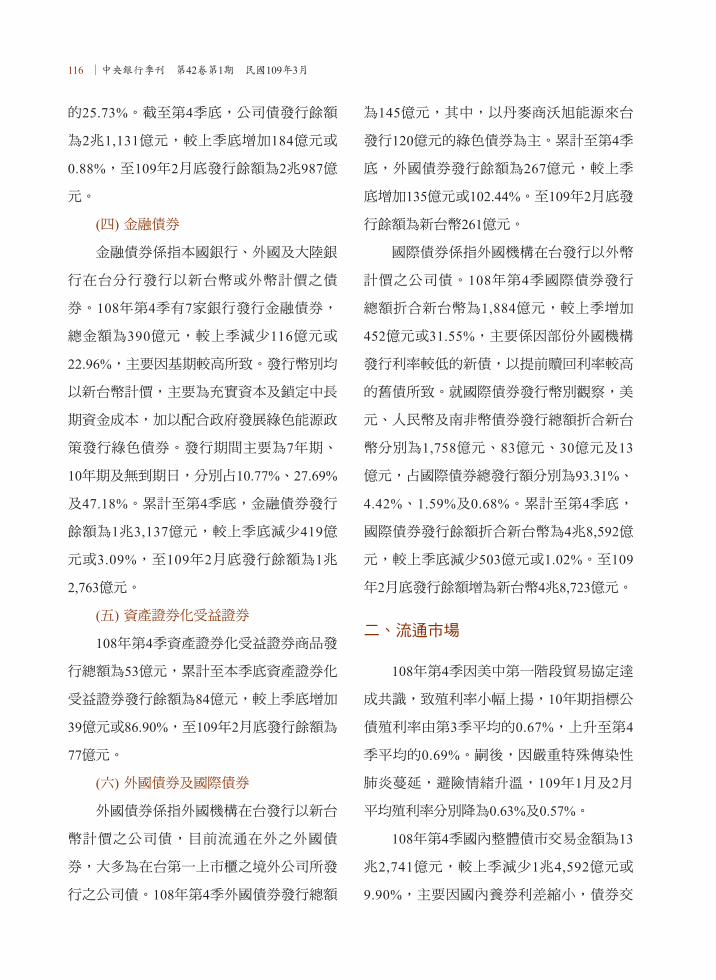
116 ∣中央銀行季刊 第42卷第1期 民國109年3月
的25.73%。截至第4季底,公司債發行餘額
為2兆1,131億元,較上季底增加184億元或
0.88%,至109年2月底發行餘額為2兆987億
元。
(四) 金融債券
金融債券係指本國銀行、外國及大陸銀
行在台分行發行以新台幣或外幣計價之債
券。108年第4季有7家銀行發行金融債券,
總金額為390億元,較上季減少116億元或
22.96%,主要因基期較高所致。發行幣別均
以新台幣計價,主要為充實資本及鎖定中長
期資金成本,加以配合政府發展綠色能源政
策發行綠色債券。發行期間主要為7年期、
10年期及無到期日,分別占10.77%、27.69%
及47.18%。累計至第4季底,金融債券發行
餘額為1兆3,137億元,較上季底減少419億
元或3.09%,至109年2月底發行餘額為1兆
2,763億元。
(五) 資產證券化受益證券
108年第4季資產證券化受益證券商品發
行總額為53億元,累計至本季底資產證券化
受益證券發行餘額為84億元,較上季底增加
39億元或86.90%,至109年2月底發行餘額為
77億元。
(六) 外國債券及國際債券
外國債券係指外國機構在台發行以新台
幣計價之公司債,目前流通在外之外國債
券,大多為在台第一上市櫃之境外公司所發
行之公司債。108年第4季外國債券發行總額
為145億元,其中,以丹麥商沃旭能源來台
發行120億元的綠色債券為主。累計至第4季
底,外國債券發行餘額為267億元,較上季
底增加135億元或102.44%。至109年2月底發
行餘額為新台幣261億元。
國際債券係指外國機構在台發行以外幣
計價之公司債。108年第4季國際債券發行
總額折合新台幣為1,884億元,較上季增加
452億元或31.55%,主要係因部份外國機構
發行利率較低的新債,以提前贖回利率較高
的舊債所致。就國際債券發行幣別觀察,美
元、人民幣及南非幣債券發行總額折合新台
幣分別為1,758億元、83億元、30億元及13
億元,占國際債券總發行額分別為93.31%、
4.42%、1.59%及0.68%。累計至第4季底,
國際債券發行餘額折合新台幣為4兆8,592億
元,較上季底減少503億元或1.02%。至109
年2月底發行餘額增為新台幣4兆8,723億元。
二、流通市場
108年第4季因美中第一階段貿易協定達
成共識,致殖利率小幅上揚,10年期指標公
債殖利率由第3季平均的0.67%,上升至第4
季平均的0.69%。嗣後,因嚴重特殊傳染性
肺炎蔓延,避險情緒升溫,109年1月及2月
平均殖利率分別降為0.63%及0.57%。
108年第4季國內整體債市交易金額為13
兆2,741億元,較上季減少1兆4,592億元或
9.90%,主要因國內養券利差縮小,債券交

金融市場∣ 117
易不易活絡。其中,買賣斷交易減少7,587億
元或29.75%,附條件交易減少7,005億元或
5.75%。若就交易比重觀察,買賣斷交易金
額占交易總額比重則由上季平均之17.31%下
降至當季平均之13.50%,附條件交易金額占
交易總額比重由上季平均之82.69%上升至當
季平均之86.50%。若就各類債券交易來看,
第4季以政府公債交易比重占58.28%為最
高,交易金額為7兆7,367億元,其次依序為
公司債4兆4,641億元、金融債券6,813億元、
國際債券3,069億元、外國債券773億元及資
產證券化受益證券78億元。109年1月至2月
債券交易金額為8兆7,973億元,較上年同期
減少5,390億元或5.77%。
圖2 各期別公債殖利率走勢圖
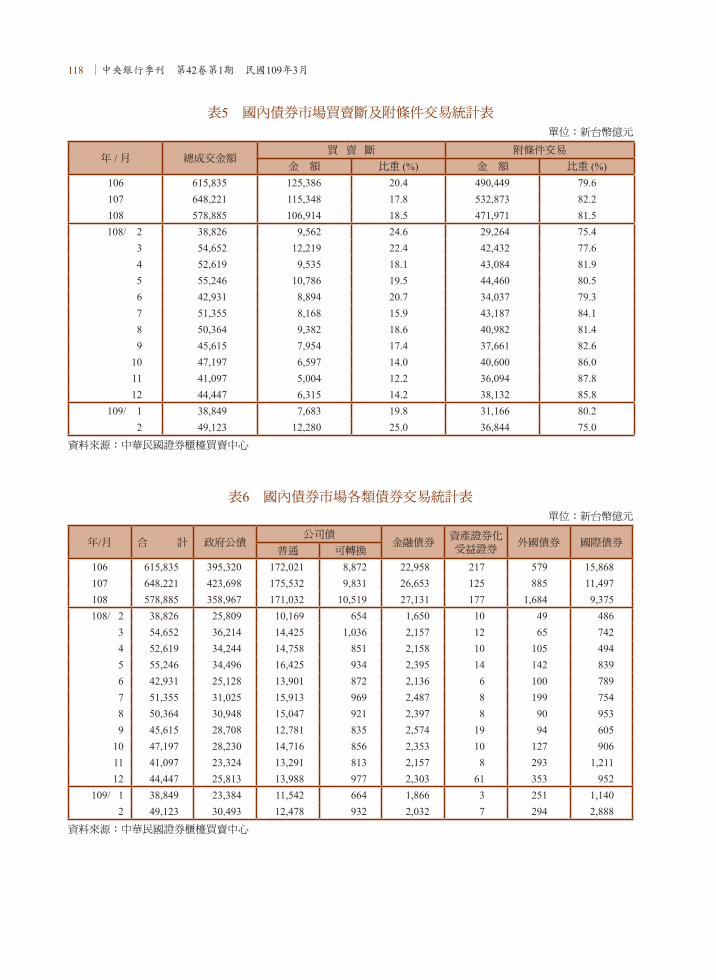
118 ∣中央銀行季刊 第42卷第1期 民國109年3月
表6 國內債券市場各類債券交易統計表單位:新台幣億元
年/月 合 計 政府公債公司債
金融債券資產證券化 受益證券
外國債券 國際債券普通 可轉換
106 615,835 395,320 172,021 8,872 22,958 217 579 15,868107 648,221 423,698 175,532 9,831 26,653 125 885 11,497108 578,885 358,967 171,032 10,519 27,131 177 1,684 9,375108/ 2 38,826 25,809 10,169 654 1,650 10 49 486
3 54,652 36,214 14,425 1,036 2,157 12 65 7424 52,619 34,244 14,758 851 2,158 10 105 4945 55,246 34,496 16,425 934 2,395 14 142 8396 42,931 25,128 13,901 872 2,136 6 100 7897 51,355 31,025 15,913 969 2,487 8 199 7548 50,364 30,948 15,047 921 2,397 8 90 9539 45,615 28,708 12,781 835 2,574 19 94 605
10 47,197 28,230 14,716 856 2,353 10 127 90611 41,097 23,324 13,291 813 2,157 8 293 1,21112 44,447 25,813 13,988 977 2,303 61 353 952
109/ 1 38,849 23,384 11,542 664 1,866 3 251 1,1402 49,123 30,493 12,478 932 2,032 7 294 2,888
資料來源:中華民國證券櫃檯買賣中心
表5 國內債券市場買賣斷及附條件交易統計表單位:新台幣億元
年 / 月 總成交金額買 賣 斷 附條件交易
金 額 比重 (%) 金 額 比重 (%)106 615,835 125,386 20.4 490,449 79.6107 648,221 115,348 17.8 532,873 82.2108 578,885 106,914 18.5 471,971 81.5108/ 2 38,826 9,562 24.6 29,264 75.4
3 54,652 12,219 22.4 42,432 77.64 52,619 9,535 18.1 43,084 81.95 55,246 10,786 19.5 44,460 80.56 42,931 8,894 20.7 34,037 79.37 51,355 8,168 15.9 43,187 84.18 50,364 9,382 18.6 40,982 81.49 45,615 7,954 17.4 37,661 82.6
10 47,197 6,597 14.0 40,600 86.011 41,097 5,004 12.2 36,094 87.812 44,447 6,315 14.2 38,132 85.8
109/ 1 38,849 7,683 19.8 31,166 80.22 49,123 12,280 25.0 36,844 75.0
資料來源:中華民國證券櫃檯買賣中心
金融市場∣ 119
參、股票市場
108年10月以來,由於美中貿易摩擦降
溫、美股屢創新高、美國Fed降息、蘋果新
機銷售優於預期、主計總處上修國內經濟成
長率、美中第一階段貿易協議正式簽署、外
資買超台股,帶動台股走升至109年1月14日
之12,180點。嗣因中國大陸爆發嚴重特殊傳
染性肺炎,且擴散蔓延至其他國家,台股隨
全球股市下跌,至2月底為11,292點,較上年
9月底上漲4.27%(圖3)。
一、大盤股價指數變動
108年10月份股市走高,10月底加權指
數較上月底大漲4.89%。此期間主要利多因
素包括:1.美中貿易協議談判進展順利,美
股頻創新高;2.外資大幅買超台股,推升股
價指數創新高;3.蘋果新機銷售優於預期;
4.英國下議院通過脫歐協議基本原則。
108年11月份股市延續漲勢,11月底加
權指數較上月底上漲1.15%。此期間主要利
多因素包括:1.美股續創新高;2.美國Fed降
息一碼及歐洲央行重啟量化寬鬆政策,熱錢
持續流入買超台股;3.主計總處上修今、明
兩年國內經濟成長率。
108年12月份股市續漲,12月底加權指
數較上月底上漲4.42%。此期間主要利多因
素包括:1.美股與台積電股價持續創高;
2.外資持續加碼買超台股;3.美中第一階段
貿易協議談判完成;4.市場資金寬鬆;5.集
團與投信積極作帳。
109年1月份股市先升後跌,1月底加權
指數較上月底下跌4.18%。1月2日至14日股
市上漲,此期間主要利多因素包括:1.美中
第一階段貿易協議正式簽署,美股續創新
高;2.電子權值股財報公布優於預期。1月
15至31日股市下跌,此期間主要利空因素包
括:1.嚴重特殊傳染性肺炎爆發且疫情迅速
擴散;2.外資大幅賣超台股。
109年2月份股市先升後跌,2月底加權
指數較上月底下跌1.77%。2月3日至14日股
市上漲,此期間主要利多因素包括:1.美股
續創新高;2.台廠因肺炎疫情帶來電子急單
效應。2月15至27日股市下跌,此期間主要
利空因素包括:1.肺炎疫情在全球擴散,南
韓、義大利等國確診人數急速攀升;2.外資
大幅賣超台股。
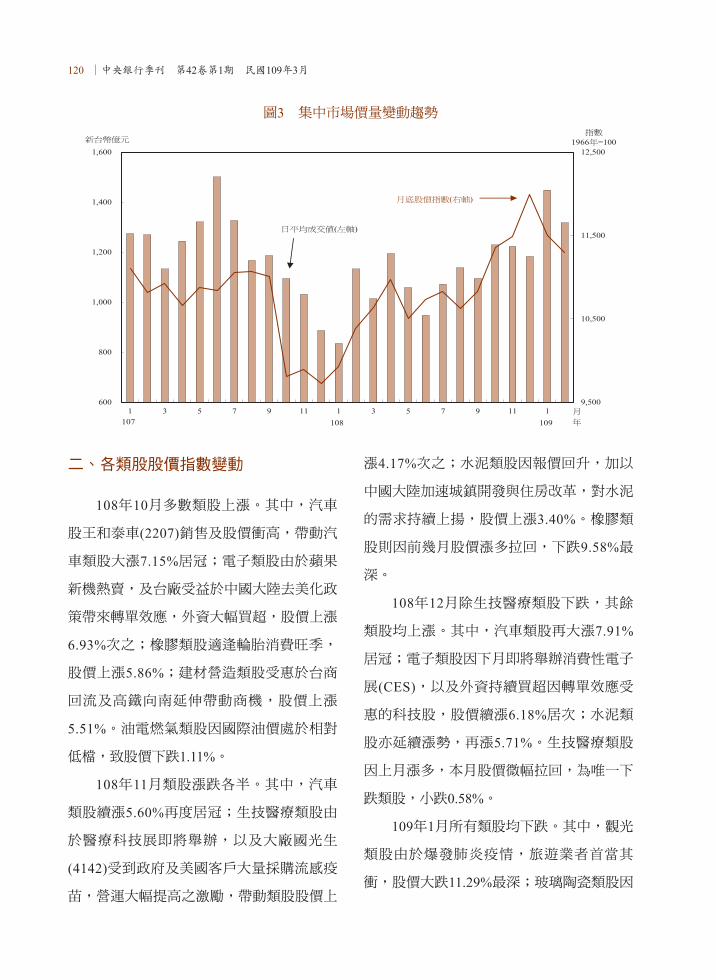
120 ∣中央銀行季刊 第42卷第1期 民國109年3月
二、各類股股價指數變動
108年10月多數類股上漲。其中,汽車
股王和泰車(2207)銷售及股價衝高,帶動汽
車類股大漲7.15%居冠;電子類股由於蘋果
新機熱賣,及台廠受益於中國大陸去美化政
策帶來轉單效應,外資大幅買超,股價上漲
6.93%次之;橡膠類股適逢輪胎消費旺季,
股價上漲5.86%;建材營造類股受惠於台商
回流及高鐵向南延伸帶動商機,股價上漲
5.51%。油電燃氣類股因國際油價處於相對
低檔,致股價下跌1.11%。
108年11月類股漲跌各半。其中,汽車
類股續漲5.60%再度居冠;生技醫療類股由
於醫療科技展即將舉辦,以及大廠國光生
(4142)受到政府及美國客戶大量採購流感疫
苗,營運大幅提高之激勵,帶動類股股價上
漲4.17%次之;水泥類股因報價回升,加以
中國大陸加速城鎮開發與住房改革,對水泥
的需求持續上揚,股價上漲3.40%。橡膠類
股則因前幾月股價漲多拉回,下跌9.58%最
深。
108年12月除生技醫療類股下跌,其餘
類股均上漲。其中,汽車類股再大漲7.91%
居冠;電子類股因下月即將舉辦消費性電子
展(CES),以及外資持續買超因轉單效應受
惠的科技股,股價續漲6.18%居次;水泥類
股亦延續漲勢,再漲5.71%。生技醫療類股
因上月漲多,本月股價微幅拉回,為唯一下
跌類股,小跌0.58%。
109年1月所有類股均下跌。其中,觀光
類股由於爆發肺炎疫情,旅遊業者首當其
衝,股價大跌11.29%最深;玻璃陶瓷類股因
圖3 集中市場價量變動趨勢
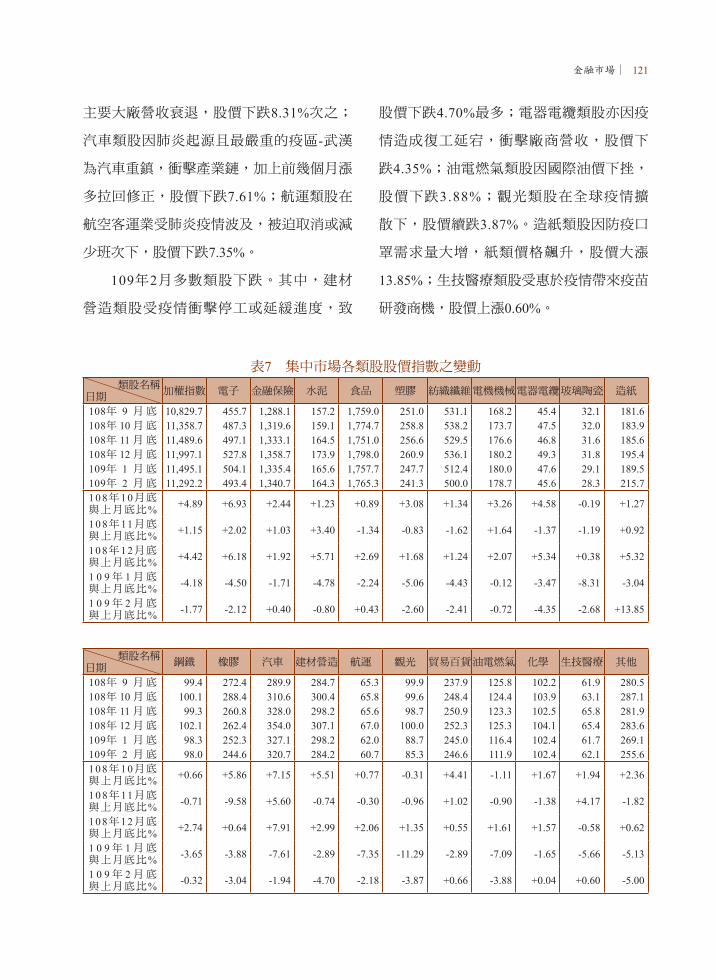
金融市場∣ 121
表7 集中市場各類股股價指數之變動類股名稱
日期加權指數 電子 金融保險 水泥 食品 塑膠 紡織纖維電機機械電器電纜玻璃陶瓷 造紙
108年 9 月 底 10,829.7 455.7 1,288.1 157.2 1,759.0 251.0 531.1 168.2 45.4 32.1 181.6108年 10 月 底 11,358.7 487.3 1,319.6 159.1 1,774.7 258.8 538.2 173.7 47.5 32.0 183.9108年 11 月 底 11,489.6 497.1 1,333.1 164.5 1,751.0 256.6 529.5 176.6 46.8 31.6 185.6108年 12 月 底 11,997.1 527.8 1,358.7 173.9 1,798.0 260.9 536.1 180.2 49.3 31.8 195.4109年 1 月 底 11,495.1 504.1 1,335.4 165.6 1,757.7 247.7 512.4 180.0 47.6 29.1 189.5109年 2 月 底 11,292.2 493.4 1,340.7 164.3 1,765.3 241.3 500.0 178.7 45.6 28.3 215.71 0 8年1 0月底與上月底比% +4.89 +6.93 +2.44 +1.23 +0.89 +3.08 +1.34 +3.26 +4.58 -0.19 +1.27
1 0 8年11月底與上月底比% +1.15 +2.02 +1.03 +3.40 -1.34 -0.83 -1.62 +1.64 -1.37 -1.19 +0.92
1 0 8年1 2月底與上月底比% +4.42 +6.18 +1.92 +5.71 +2.69 +1.68 +1.24 +2.07 +5.34 +0.38 +5.32
1 0 9年 1月底與上月底比% -4.18 -4.50 -1.71 -4.78 -2.24 -5.06 -4.43 -0.12 -3.47 -8.31 -3.04
1 0 9年 2月底與上月底比% -1.77 -2.12 +0.40 -0.80 +0.43 -2.60 -2.41 -0.72 -4.35 -2.68 +13.85
類股名稱日期
鋼鐵 橡膠 汽車 建材營造 航運 觀光 貿易百貨油電燃氣 化學 生技醫療 其他
108年 9 月 底 99.4 272.4 289.9 284.7 65.3 99.9 237.9 125.8 102.2 61.9 280.5108年 10 月 底 100.1 288.4 310.6 300.4 65.8 99.6 248.4 124.4 103.9 63.1 287.1108年 11 月 底 99.3 260.8 328.0 298.2 65.6 98.7 250.9 123.3 102.5 65.8 281.9108年 12 月 底 102.1 262.4 354.0 307.1 67.0 100.0 252.3 125.3 104.1 65.4 283.6109年 1 月 底 98.3 252.3 327.1 298.2 62.0 88.7 245.0 116.4 102.4 61.7 269.1109年 2 月 底 98.0 244.6 320.7 284.2 60.7 85.3 246.6 111.9 102.4 62.1 255.61 0 8年1 0月底與上月底比% +0.66 +5.86 +7.15 +5.51 +0.77 -0.31 +4.41 -1.11 +1.67 +1.94 +2.36
1 0 8年11月底與上月底比% -0.71 -9.58 +5.60 -0.74 -0.30 -0.96 +1.02 -0.90 -1.38 +4.17 -1.82
1 0 8年1 2月底與上月底比% +2.74 +0.64 +7.91 +2.99 +2.06 +1.35 +0.55 +1.61 +1.57 -0.58 +0.62
1 0 9年 1月底與上月底比% -3.65 -3.88 -7.61 -2.89 -7.35 -11.29 -2.89 -7.09 -1.65 -5.66 -5.13
1 0 9年 2月底與上月底比% -0.32 -3.04 -1.94 -4.70 -2.18 -3.87 +0.66 -3.88 +0.04 +0.60 -5.00
主要大廠營收衰退,股價下跌8.31%次之;
汽車類股因肺炎起源且最嚴重的疫區-武漢
為汽車重鎮,衝擊產業鏈,加上前幾個月漲
多拉回修正,股價下跌7.61%;航運類股在
航空客運業受肺炎疫情波及,被迫取消或減
少班次下,股價下跌7.35%。
109年2月多數類股下跌。其中,建材
營造類股受疫情衝擊停工或延緩進度,致
股價下跌4.70%最多;電器電纜類股亦因疫
情造成復工延宕,衝擊廠商營收,股價下
跌4.35%;油電燃氣類股因國際油價下挫,
股價下跌3.88%;觀光類股在全球疫情擴
散下,股價續跌3.87%。造紙類股因防疫口
罩需求量大增,紙類價格飆升,股價大漲
13.85%;生技醫療類股受惠於疫情帶來疫苗
研發商機,股價上漲0.60%。
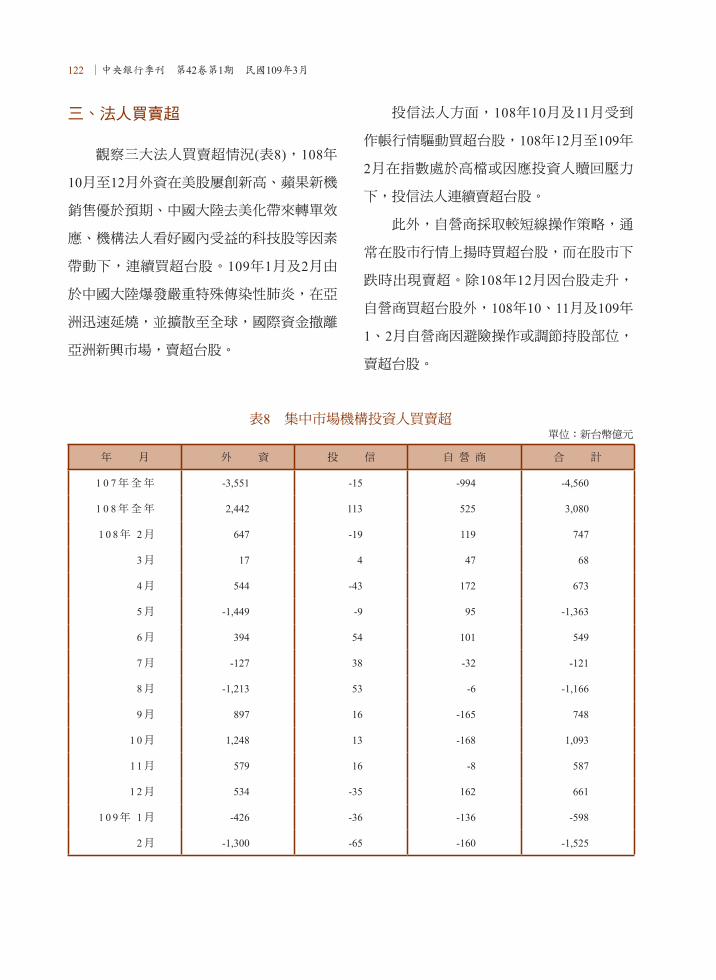
122 ∣中央銀行季刊 第42卷第1期 民國109年3月
三、法人買賣超
觀察三大法人買賣超情況(表8),108年
10月至12月外資在美股屢創新高、蘋果新機
銷售優於預期、中國大陸去美化帶來轉單效
應、機構法人看好國內受益的科技股等因素
帶動下,連續買超台股。109年1月及2月由
於中國大陸爆發嚴重特殊傳染性肺炎,在亞
洲迅速延燒,並擴散至全球,國際資金撤離
亞洲新興市場,賣超台股。
投信法人方面,108年10月及11月受到
作帳行情驅動買超台股,108年12月至109年
2月在指數處於高檔或因應投資人贖回壓力
下,投信法人連續賣超台股。
此外,自營商採取較短線操作策略,通
常在股市行情上揚時買超台股,而在股市下
跌時出現賣超。除108年12月因台股走升,
自營商買超台股外,108年10、11月及109年
1、2月自營商因避險操作或調節持股部位,
賣超台股。
表8 集中市場機構投資人買賣超單位:新台幣億元
年 月 外 資 投 信 自 營 商 合 計
1 0 7年全年 -3,551 -15 -994 -4,560
1 0 8年全年 2,442 113 525 3,080
1 0 8年 2月 647 -19 119 747
3月 17 4 47 68
4月 544 -43 172 673
5月 -1,449 -9 95 -1,363
6月 394 54 101 549
7月 -127 38 -32 -121
8月 -1,213 53 -6 -1,166
9月 897 16 -165 748
1 0月 1,248 13 -168 1,093
1 1月 579 16 -8 587
1 2月 534 -35 162 661
1 0 9年 1月 -426 -36 -136 -598
2月 -1,300 -65 -160 -1,525
金融市場∣ 123
四、股市重要措施
本期間股市主要措施有:
(一) 108年10月3日,為鼓勵證券期貨業
提供創新金融商品或服務,金管會
頒布「證券期貨業申請業務試辦作
業要點」,以提升競爭力及金融消
費者權益。
(二) 109年2月26日,證交所公告,自
109年10月26日起,投資人可於普
通交易時段(上午9:00至下午1:30)
買賣零股,於上午9:10起第一次
撮合,之後每3分鐘以集合競價撮
合,依價格優先及時間優先原則依
序成交。
124 ∣中央銀行季刊 第42卷第1期 民國109年3月
肆、外匯市場
一、新台幣匯率走勢
108年第4季新台幣對美元匯率最低為10
月3日之31.064元,最高為12月31日之30.106
元,差距為0.958元。季底新台幣對美元匯
率為30.106元,較第3季底升值3.1%,同期
間,對日圓、人民幣及歐元分別升值3.9%、
0.9%及0.4%,對韓元則貶值0.8%。
本季(109年第1季)底與上季(108年
第4季)底比較,新台幣雖對美元及日圓
貶值,惟對韓元、歐元及人民幣升值(圖
4),致對主要貿易對手一籃通貨之加權平
均匯價(以貿易資料計算權數)升值2.3%。
以下分別分析本季新台幣對各幣別之匯率變
動。
新台幣對美元匯率:109年初,嚴重特
殊傳染性肺炎(COVID-19)疫情首先衝擊亞洲
各國經濟金融,台灣受疫情影響較為輕微,
新台幣區間震盪;嗣後,疫情擴散至歐美,
加劇全球市場波動,美元避險需求升溫,3
月聯準會雖二度降息,並推出寬鬆貨幣政
策,穩定美元流動性,壓抑美元走勢,惟因
外資持續賣超台股匯出,新台幣對美元貶
值。本季底新台幣對美元匯率為30.254元,
較12月底貶值0.5%;惟就平均匯率而言,本
季新台幣對美元較上季升值1.2%。
新台幣對歐元匯率:年初以來,歐元
區經濟數據不如預期,且2月起,肺炎疫情
於歐洲擴散,衝擊經濟活動,3月歐洲央行
宣布將在6月底前進行更多長期再融資操作
(LTRO)提供歐元區金融體系即時流動性;
並在年底前,額外增加1,200億歐元資產購
買規模;此外,將在109年6月至110年6月期
間對定向長期再融資(TLTRO III)提供更優惠
利率支持銀行貸放給受疫情嚴重影響的中小
企業,擴大寬鬆措施,歐元貶值。本季新台
幣對歐元匯率震盪走升,季底新台幣對歐元
匯率為33.269元,較上季底升值1.4%;就平
均匯率而言,本季新台幣對歐元較上季升值
1.6%。
新台幣對日圓匯率:年初全球肺炎疫情
未見受控,部分避險需求支撐日圓匯價,惟
3月中旬疫情於日本擴散,日本央行雖未採
行降息,惟擴大資產購買規模,加上國際資
金轉向其他避險資產,日圓轉貶,嗣後因美
國採無限量購債措施,日圓升值。本季底新
台幣對日圓匯率為0.2791元,較上季底貶值
0.7%;惟就平均匯率而言,本季新台幣對日
圓較上季升值1.4%。
新台幣對人民幣匯率:1月中旬美中簽
署第一階段經濟貿易協議,人民幣升值;下
旬,中國大陸疫情快速蔓延,生產活動嚴重
受創;嗣後,中國人民銀行進行逆回購操作
及下調中期借貸便利(MLF)利率,並於3月再

金融市場∣ 125
圖4 新台幣對主要貿易對手國貨幣之升貶幅度(與108/12/31比較)
二、外匯市場交易
108年11月至109年1月外匯市場(含
DBU及OBU交易)各類商品之全體外匯交易
淨額為18,945.9億美元,較上期(108年8月
至10月,以下同)減少8.2%,日平均交易淨
額為315.8億美元。其中,OBU外匯交易淨
額為1,536.9億美元,較上期減少20.9%,占
外匯市場交易比重8.1%。
各交易類別中,以換匯交易最多,交易
量為9,920.9億美元,較上期減少1.5%;即
期交易居次,交易量為6,854.0億美元,較上
期減少16.9%;占外匯市場交易比重分別為
52.4%及36.2%。遠匯交易居第三,交易量為
1,638.0億美元,占8.6%,較上期減少2.1%。
匯率選擇權居第四,交易量為447.1億美元,
占2.4%,較上期減少18.3%(表9及圖5)。
執行定向降準0.5至1個百分點等多次流動性
措施以舒緩金融市場流動性,人民幣貶值。
本季底新台幣對人民幣匯率為4.2653元,較
上季底升值1.3%;就平均匯率而言,本季新
台幣對人民幣較上季升值0.3%。
新台幣對韓元匯率:年初南韓出口疲
弱,加上肺炎疫情在南韓境內快速擴散,影
響生產、消費及就業等經濟活動,3月16日
南韓央行宣布降息,以降低衝擊,韓元對美
元持續貶值,新台幣對韓元升值。本季底新
台幣對韓元匯率為0.0249元,較上季底升值
4.9%;就平均匯率而言,本季新台幣對韓元
較上季升值2.9%。

126 ∣中央銀行季刊 第42卷第1期 民國109年3月
圖5 外匯交易-按交易類別
表9 台北外匯市場各類商品交易量(含OBU之交易)1
單位:百萬美元
年 / 月 即期 換匯 國內銀行間新台幣 對外幣
遠期 新台幣對外幣無本金交割遠匯2
保證金 交易
換匯換利 選擇權 交易淨額 OBU 交易淨額
日平均 交易淨額
106 2,826,236 3,550,558 1,241,359 423,119 28,857 12,402 43,934 242,537 7,098,786 646,369 28,624
107 3,111,414 3,992,873 1,361,832 567,790 29,278 7,876 58,354 249,254 7,987,560 731,895 32,079
108 3,079,471 4,007,094 1,301,435 661,954 30,090 6,430 45,308 213,734 8,013,990 758,203 32,445
107/11 237,476 335,523 118,405 45,040 2,052 616 4,521 20,362 643,538 57,269 29,252
12 226,502 307,126 109,024 47,503 2,110 597 4,353 12,017 598,098 54,144 28,481
108/ 1 284,320 373,964 139,240 61,150 2,943 779 7,505 22,126 749,844 70,844 32,602
2 187,752 255,968 83,168 39,606 1,715 594 3,295 15,179 502,393 49,705 33,493
3 263,673 334,862 102,536 50,396 1,934 944 3,926 19,456 673,258 65,066 33,663
4 232,938 331,264 109,588 54,661 2,107 774 2,756 18,080 640,474 59,174 32,024
5 310,913 342,712 111,917 60,127 4,200 499 3,553 21,122 738,925 80,955 33,588
6 256,817 303,364 95,357 56,106 2,438 561 4,102 18,405 639,356 75,034 33,650
7 252,924 373,194 120,332 58,759 2,703 363 6,750 19,373 711,363 65,208 30,929
8 306,708 327,386 100,189 53,126 2,880 387 2,381 20,517 710,505 82,888 33,834
9 279,841 326,950 106,729 55,371 2,268 302 3,661 16,316 682,441 58,825 35,918
10 238,435 352,860 114,668 58,842 2,779 461 2,407 17,898 670,902 52,586 30,496
11 232,980 337,586 102,363 55,281 2,442 336 2,119 13,779 642,082 49,304 30,575
12 232,168 346,983 115,348 58,529 1,681 430 2,853 11,484 652,446 48,615 29,657
109/ 1 220,254 307,525 100,467 49,988 2,864 337 2,517 19,445 600,067 55,770 35,298
註:1. 本表各類交易量已剔除「銀行間交易」重複計算部分。此外,與匯率有關之衍生金融商品交易均列於此表。 2. 新台幣對外幣無本金交割遠匯(NDF)為遠期交易之一部分。
金融市場∣ 127
按交易幣別分,以新台幣對美元交易
最多,108年11月至109年1月的交易比重為
48.7%,較上期增加0.9個百分點;新台幣對
其他外幣交易比重則甚低,僅1.7%;外幣
間的交易比重為49.7%,其中美元對人民幣
交易比重為14.2%,較上期增加0.4個百分
點;歐元對美元交易比重為8.8%,較上期
減少0.2個百分點;美元對日圓交易比重為
6.2%,較上期減少1.2個百分點;其他外幣
間交易比重為20.5%,較上期增加0.1個百分
點(圖6)。
圖6 外匯交易-按幣別
按交易對象別分,以國內銀行與國外銀
行間的交易最多,108年11月至109年1月交
易比重為42.8%,較上期減少0.5個百分點;
國內銀行與顧客間交易比重為33.1%,較上
期減少0.2個百分點;國內銀行間交易比重為
24.1%,較上期增加0.7個百分點(圖7)。

128 ∣中央銀行季刊 第42卷第1期 民國109年3月
三、銀行間換匯及外幣拆款交易
國內銀行間新台幣與外幣換匯市場及銀
行間外幣拆款市場係銀行調度外幣資金的主
力市場,以下分別說明之。
新台幣與外幣換匯交易方面(表9),
108年11月換匯交易量為1,023.6億美元,較
上月減少10.7%,主要係歐美公司債發行利
率下跌,部分國際板債券發行人提前贖回,
加上新發行規模縮減,壽險業換匯需求下
降。12月交易量為1,153.5億美元,較上月增
加12.7%,係因年底銀行資金調度頻繁,加
上壽險業換匯展期金額多,於銀行間換匯市
場拋補金額增加。109年1月交易量為1,004.7
億美元,較上月減少12.9%,主係市場預期
國際板債券發行人提前贖回,壽險客戶換匯
需求下降,加上農曆春節假期,營業天數減
少,交易量因而降低。
銀行間外幣拆款市場交易方面(圖
8),108年11月外幣拆款交易量為1,534.1億
美元,較上月減少0.3%,係因主要經濟體持
續寬鬆貨幣政策,外幣市場資金寬裕,銀行
拆借需求減少。12月交易量1,596.6億美元,
較上月增加4.1%,主要係Fed維持利率不
變,且美中貿易協議與全球經濟前景樂觀,
國際資金流入新興市場,銀行增加隔夜拆
款。109年1月交易量1,588.7億美元,較上月
減少0.5%,主係美中簽署第一階段經濟貿易
協議,銀行間資金寬鬆,且農曆春節假期營
業天數減少,拆借金額降低。
圖7 外匯交易-按交易對象別

金融市場∣ 129
圖8 外幣拆款市場月交易量
四、匯率以外涉及外幣之衍生金融商品
108年11月至109年1月匯率以外涉及外
幣之衍生金融商品交易為256.0億美元,較上
期減少30.9%。其中,以外幣利率期貨125.4
億美元最多,占匯率以外涉及外幣之衍生
金融商品交易量的49.0%,較上期增加6.9個
百分點;外幣換利居次為97.8億美元,所占
比重為38.2%,較上期減少9.0個百分點(表
10)。
表10 匯率以外涉及外幣之衍生金融商品的交易金額單位:百萬美元
年 / 月外 幣 換 利
外幣遠期 利率協議
外幣利率 選 擇 權
外幣利率 期 貨
商品價格交換與選擇權
股價交換 與選擇權
信用衍生 商 品 合 計
106 49,453 0 11,412 116,911 2,802 121 857 181,556107 78,848 0 25,974 149,310 3,524 403 2,861 260,920108 70,809 0 12,429 96,751 3,771 384 969 185,113107/11 7,904 0 749 8,070 281 0 242 17,246
12 7,766 0 1,364 7,675 247 7 209 17,268108/ 1 8,984 0 121 12,269 429 14 86 21,901
2 2,664 0 198 8,367 241 7 103 11,5803 8,357 0 328 14,368 378 12 191 23,6344 3,669 0 716 8,995 271 16 16 13,6825 6,230 0 1,853 10,164 391 17 94 18,7496 6,005 0 2,823 13,159 334 7 101 22,4287 11,169 0 1,445 4,557 408 74 50 17,7028 8,625 0 884 11,356 425 55 30 21,3759 4,951 0 1,525 2,030 211 56 35 8,808
10 3,919 0 176 2,228 316 27 200 6,86611 2,973 0 1,467 6,019 214 95 34 10,80112 3,266 0 894 3,240 155 4 30 7,588
109/ 1 3,537 0 215 3,285 126 21 23 7,207

130 ∣中央銀行季刊 第42卷第1期 民國109年3月
五、外匯自由化與外匯管理
為持續落實自由化、國際化既定政策,
以及促進外匯業務健全發展,本行持續同意
指定銀行採事後報備方式,函報開辦新種外
匯業務及衍生外匯商品業務等。
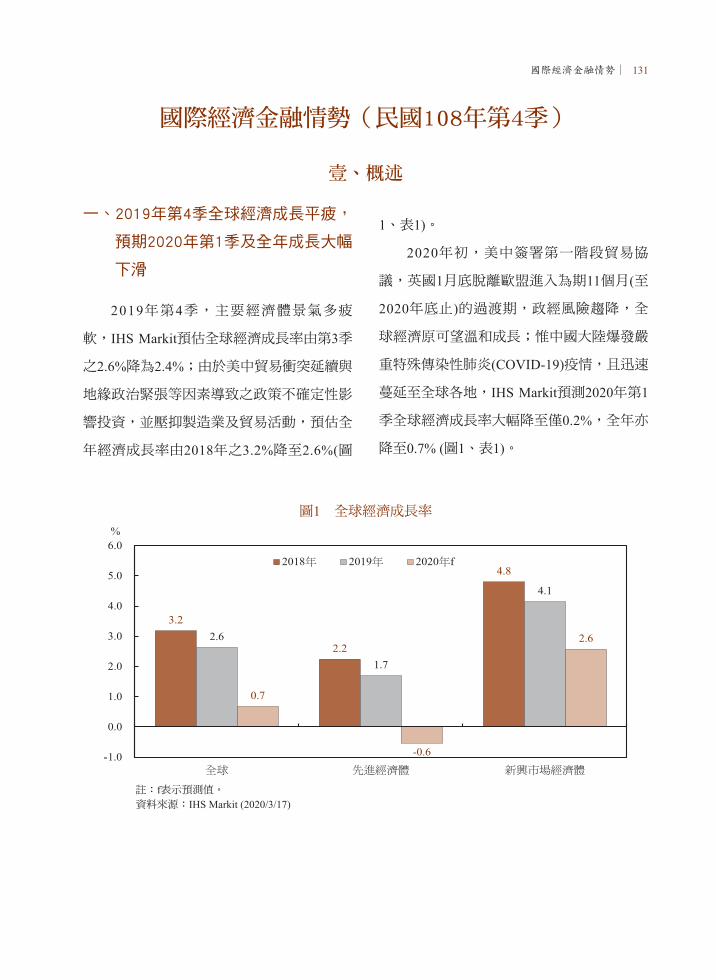
國際經濟金融情勢∣ 131
國際經濟金融情勢(民國108年第4季)
壹、概述
一、2019年第4季全球經濟成長平疲,
預期2020年第1季及全年成長大幅
下滑
2019年第4季,主要經濟體景氣多疲
軟,IHS Markit預估全球經濟成長率由第3季
之2.6%降為2.4%;由於美中貿易衝突延續與
地緣政治緊張等因素導致之政策不確定性影
響投資,並壓抑製造業及貿易活動,預估全
年經濟成長率由2018年之3.2%降至2.6%(圖
1、表1)。
2020年初,美中簽署第一階段貿易協
議,英國1月底脫離歐盟進入為期11個月(至
2020年底止)的過渡期,政經風險趨降,全
球經濟原可望溫和成長;惟中國大陸爆發嚴
重特殊傳染性肺炎(COVID-19)疫情,且迅速
蔓延至全球各地,IHS Markit預測2020年第1
季全球經濟成長率大幅降至僅0.2%,全年亦
降至0.7% (圖1、表1)。
圖1 全球經濟成長率
註:f表示預測值。資料來源:IHS Markit (2020/3/17)

132 ∣中央銀行季刊 第42卷第1期 民國109年3月
表1 經濟成長率單位:%
區域或經濟體2018年 2019年 2020年
(1) (2)
全球 3.6 (3.2) 2.9 (2.6) 3.3 0.7
先進經濟體 2.2 (2.2) 1.7 (1.7) 1.6 -0.6
OECD國家 2.3 (2.3) 1.7 (1.7) 1.6 -0.5
美國 2.9 2.3 2.0 -0.2
日本 0.3 0.7 0.7 -0.8
德國 1.5 0.6 1.1 -1.3
英國 1.3 1.4 1.4 -0.7
歐元區 1.9 1.2 1.3 -1.5
台灣 2.75 2.71 1.9 1.0
香港 2.9 -1.2 1.5 -3.0
新加坡 3.4 0.7 1.0 -1.0
南韓 2.7 2.0 2.2 0.2
東協五國 5.2 4.7 4.8 ─
泰國 4.1 2.4 3.0 1.7
馬來西亞 4.7 4.3 4.4 3.1
菲律賓 6.2 5.9 6.2 5.0
印尼 5.2 5.0 5.1 4.6
越南 7.1 7.0 6.5 6.1
中國大陸 6.7 6.1 6.0 3.9
印度 6.1 5.0 5.8 5.1
新興市場暨開發中經濟體 4.5 3.7 4.4 ─
註:1. 資料中粗體字表實際值,其餘為預測值。2. 2018、2019年區域經濟體為IMF資料,OECD國家為OECD資料,括弧內數字均為IHS Markit資料;各國為官方資料,其中印度為財政年度(當年第2季至次年第1季)資料,且2019年為官方預測值。
3. 2020年(1)為IMF資料,僅OECD國家為OECD資料,(2)為IHS Markit資料;其中印度為財政年度(當年第2季至次年第1季)資料。
4. IMF與IHS Markit 計算全球經濟成長率方式不同,IMF以國際比較計畫(International Comparison Program, ICP)發布的2011年調查版本之PPP計價GDP計算全球各經濟體權重,IHS Markit則以美元計價之名目GDP計算權重。
資料來源:IMF (2019), “World Economic Outlook,” Oct. 15、IMF (2019), “Regional Economic Outlook: Asia and Pacific,” Oct. 22、IMF (2020), “World Economic Outlook Update,” Jan. 20、OECD (2019), “OECD Economic Outlook,” Nov. 21、IHS Markit (2020/3/17)
2019年全球受貿易緊張情勢升高及美中
等國關稅調升等影響,貿易量成長率降至
1.0%,係全球金融危機以來最低。隨美中達
成第一階段貿易協議,2020年初各主要機構
預測2020年全球貿易成長率可望緩步回升;
惟2月公布之WTO商品貿易指標(Goods Trade
Barometer)顯示第1季全球貿易成長動能仍疲
(圖2),且肺炎疫情擴散全球勢將削弱貿易活
動。

國際經濟金融情勢∣ 133
圖2 WTO商品貿易指標
註:1. 該指標為領先指標,領先全球商品貿易量統計值2~3個月。2. 2020年2月係公布2019年12月之指數值,可預示2020年第1季之全球商品貿易成長狀況。3. 指數高於100代表商品貿易成長高於趨勢值,低於100則表示低於趨勢值。
資料來源:WTO Trade Barometers News Archive
二、2020年初全球通膨率上升,惟預
期全年通膨面臨向下壓力
2020年初,因國際油價高於2019年同
期,IHS Markit預估2020年第1季全球通膨率為
3.0%,高於2019年第4季之2.8%;然而近期國
際油價暴跌,致全球通膨面臨向下壓力,2020
年全球通膨率預測值亦將由2019年之2.6%降至
2.4%,其中美國、歐元區及日本通膨率預測值
均下滑,其他亞洲主要經濟體亦多呈低緩,惟
中國大陸受豬瘟影響而續升(圖3)。
圖3 主要經濟體通膨率
註:f表示預測值。資料來源:各國官方資料、IHS Markit (2020/3/17)
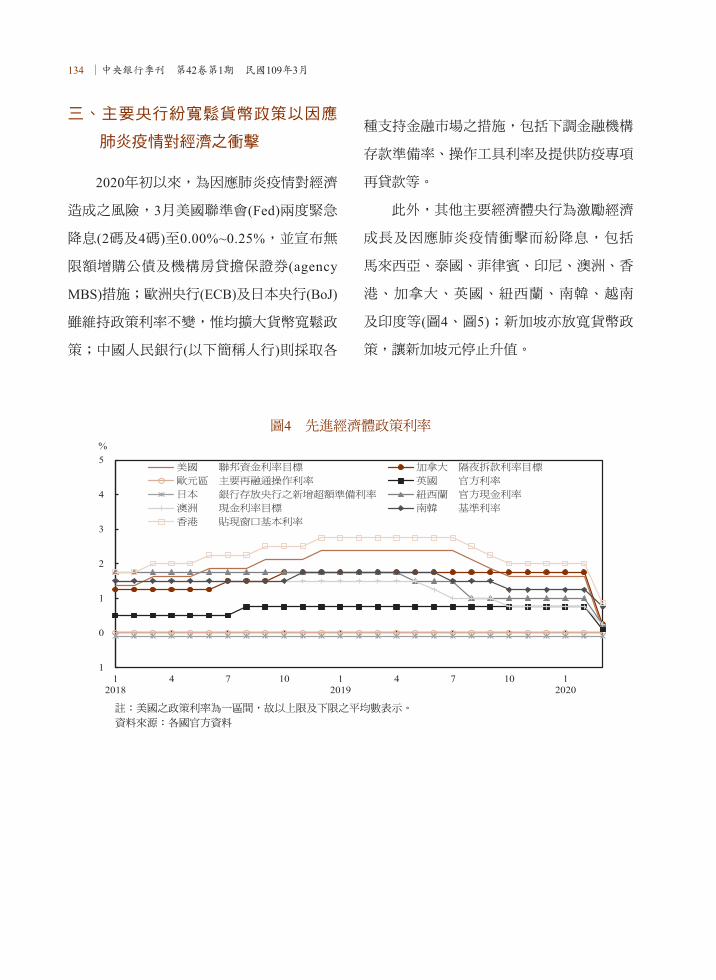
134 ∣中央銀行季刊 第42卷第1期 民國109年3月
三、主要央行紛寬鬆貨幣政策以因應
肺炎疫情對經濟之衝擊
2020年初以來,為因應肺炎疫情對經濟
造成之風險,3月美國聯準會(Fed)兩度緊急
降息(2碼及4碼)至0.00%~0.25%,並宣布無
限額增購公債及機構房貸擔保證券(agency
MBS)措施;歐洲央行(ECB)及日本央行(BoJ)
雖維持政策利率不變,惟均擴大貨幣寬鬆政
策;中國人民銀行(以下簡稱人行)則採取各
種支持金融市場之措施,包括下調金融機構
存款準備率、操作工具利率及提供防疫專項
再貸款等。
此外,其他主要經濟體央行為激勵經濟
成長及因應肺炎疫情衝擊而紛降息,包括
馬來西亞、泰國、菲律賓、印尼、澳洲、香
港、加拿大、英國、紐西蘭、南韓、越南
及印度等(圖4、圖5);新加坡亦放寬貨幣政
策,讓新加坡元停止升值。
圖4 先進經濟體政策利率
註:美國之政策利率為一區間,故以上限及下限之平均數表示。
資料來源:各國官方資料

國際經濟金融情勢∣ 135
圖5 亞洲新興經濟體政策利率
資料來源:各國官方資料
貳、預期美國經濟恐陷萎縮,通膨下滑,Fed兩度緊急降息共6碼
一、2019年第4季經濟穩定成長,預期
2020年第1季及全年成長下降
2019年第4季,雖然淨輸出大增,惟民
間消費成長減緩,且民間投資因企業消化
庫存致衰退幅度擴大,美國GDP成長率(年
化季增率)為2.1%,與第3季持平(圖6、表
2)。由於企業投資成長趨緩及貿易活動疲
軟,2019年經濟成長率由2018年之2.9%降至
2.3%(表1、表2),係近3年來最低。
圖6 美國經濟成長率
資料來源:Bureau of Economic Analysis

136 ∣中央銀行季刊 第42卷第1期 民國109年3月
2020年1~2月就業市場表現熱絡,非農
就業平均新增27.3萬人,高於2019年第4季平
均之21萬人;惟失業率平均值由2019年第4
季之3.5%略升至3.6%,主要係更多尋職者進
入就業市場所致;平均時薪年增3.0%,略低
於2019年第4季之3.2%(表2、圖7)。
圖7 美國非農就業新增人數及失業率
資料來源:Bureau of Labor Statistics
表2 美國重要經濟指標
年 / 月經 濟成 長 率
%
失 業 率
%
工業生產年 增 率
%
核心消費者物價指數
(1982-84=100)
消費者物價指數
(1982-84=100)
生產者物價指數
(2009/11=100)
貿 易 餘 額
(百萬美元)年增率 % 年增率 % 年增率 %
2017 2.4 4.3 2.3 1.9 2.1 2.3 -793,411
2018 2.9 3.9 3.9 2.1 2.4 2.9 -874,814
2019 2.3 3.7 0.9 2.2 1.8 1.7 -852,788
2019/ 2 3.8 2.3 2.1 1.5 1.8 -70,308
3 3.1 3.8 2.3 2.0 1.9 2.0 -72,235
4 3.6 0.7 2.1 2.0 2.3 -71,362
5 3.6 1.7 2.0 1.8 2.1 -75,233
6 2.0 3.7 1.0 2.1 1.6 1.6 -74,608
7 3.7 0.4 2.2 1.8 1.7 -72,813
8 3.7 0.3 2.4 1.7 1.8 -73,454
9 2.1 3.5 -0.2 2.4 1.7 1.4 -71,087
10 3.6 -0.8 2.3 1.8 1.0 -67,124
11 3.5 -0.4 2.3 2.1 1.0 -63,731
12 2.1 3.5 -0.9 2.3 2.3 1.3 -68,484
2020/ 1 3.6 -1.0 2.3 2.5 2.1 -65,897
2 3.5 0.0 2.4 2.3 1.3
資料來源:Board of Governors of the Federal Reserve System、Bureau of Economic Analysis、Bureau of Labor Statistics

國際經濟金融情勢∣ 137
2020年初以來就業市場表現強勁,原預
期民間消費可望受此帶動而穩健成長,惟2月
下旬起肺炎疫情在美國擴散並趨嚴峻,防疫
管制措施造成經濟活動停頓,恐導致經濟急
速降溫,IHS Markit預測2020年第1季經濟成
長率降至1.9%,全年則恐負成長0.2%(表1)。
二、2020年初通膨率上揚,惟預測全
年通膨率低於2019年
受能源價格上漲影響,2020年1~2月消
費者物價指數(CPI)年增率由2019年第4季之
2.1%升至2.4%;扣除食品與能源之核心CPI
年增率則因運輸服務價格上揚,由2019年第
4季之2.3%略升至2.4%(表2)。IHS Markit預
測2020年CPI年增率為1.5%,低於2019年之
1.8%(圖3)。
三、Fed兩度緊急降息共6碼,並推出
多項流動性機制因應疫情帶來之
經濟風險
聯邦公開市場委員會(FOMC)鑑於肺炎
疫情將影響近期經濟活動,且對經濟前景帶
來風險,於2020年3月3日及15日舉行非例行
政策會議,分別緊急調降聯邦資金利率目標
區間0.50及1個百分點至0.00%~0.25%(圖8)。
圖8 美國聯邦資金利率目標與市場利率
註:美國聯邦資金利率目標為一區間,故以上限及下限之平均數表示。
資料來源:Refinitiv Datastream
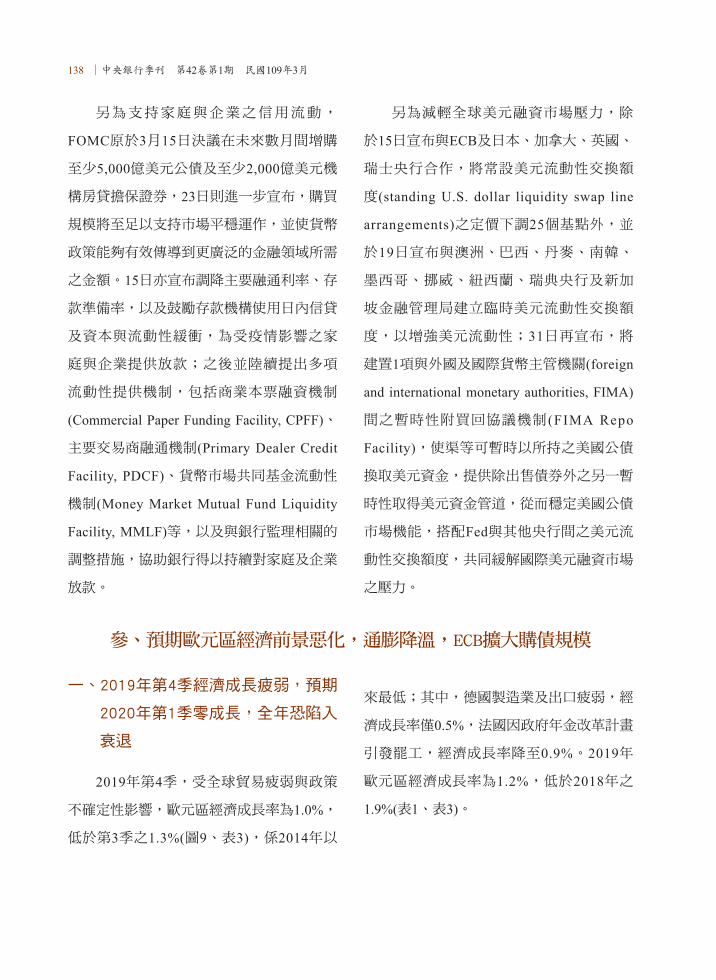
138 ∣中央銀行季刊 第42卷第1期 民國109年3月
另為支持家庭與企業之信用流動,
FOMC原於3月15日決議在未來數月間增購
至少5,000億美元公債及至少2,000億美元機
構房貸擔保證券,23日則進一步宣布,購買
規模將至足以支持市場平穩運作,並使貨幣
政策能夠有效傳導到更廣泛的金融領域所需
之金額。15日亦宣布調降主要融通利率、存
款準備率,以及鼓勵存款機構使用日內信貸
及資本與流動性緩衝,為受疫情影響之家
庭與企業提供放款;之後並陸續提出多項
流動性提供機制,包括商業本票融資機制
(Commercial Paper Funding Facility, CPFF)、
主要交易商融通機制(Primary Dealer Credit
Facility, PDCF)、貨幣市場共同基金流動性
機制(Money Market Mutual Fund Liquidity
Facility, MMLF)等,以及與銀行監理相關的
調整措施,協助銀行得以持續對家庭及企業
放款。
另為減輕全球美元融資市場壓力,除
於15日宣布與ECB及日本、加拿大、英國、
瑞士央行合作,將常設美元流動性交換額
度(standing U.S. dollar liquidity swap line
arrangements)之定價下調25個基點外,並
於19日宣布與澳洲、巴西、丹麥、南韓、
墨西哥、挪威、紐西蘭、瑞典央行及新加
坡金融管理局建立臨時美元流動性交換額
度,以增強美元流動性;31日再宣布,將
建置1項與外國及國際貨幣主管機關(foreign
and international monetary authorities, FIMA)
間之暫時性附買回協議機制(FIMA Repo
Facility),使渠等可暫時以所持之美國公債
換取美元資金,提供除出售債券外之另一暫
時性取得美元資金管道,從而穩定美國公債
市場機能,搭配Fed與其他央行間之美元流
動性交換額度,共同緩解國際美元融資市場
之壓力。
參、預期歐元區經濟前景惡化,通膨降溫,ECB擴大購債規模
一、2019年第4季經濟成長疲弱,預期
2020年第1季零成長,全年恐陷入
衰退
2019年第4季,受全球貿易疲弱與政策
不確定性影響,歐元區經濟成長率為1.0%,
低於第3季之1.3%(圖9、表3),係2014年以
來最低;其中,德國製造業及出口疲弱,經
濟成長率僅0.5%,法國因政府年金改革計畫
引發罷工,經濟成長率降至0.9%。2019年
歐元區經濟成長率為1.2%,低於2018年之
1.9%(表1、表3)。
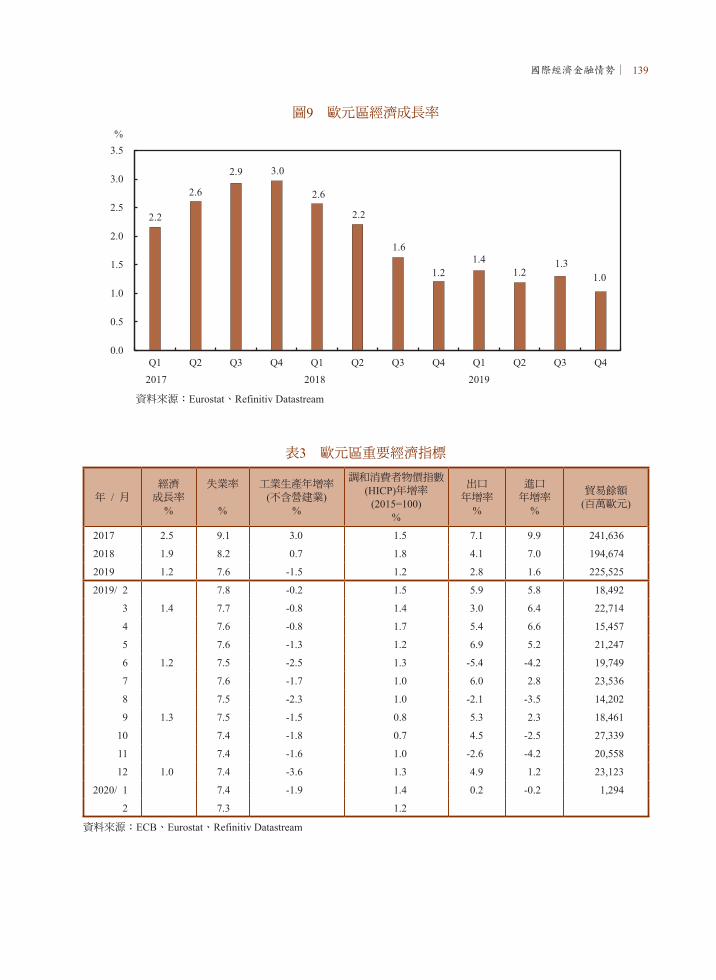
國際經濟金融情勢∣ 139
圖9 歐元區經濟成長率
資料來源:Eurostat、Refinitiv Datastream
表3 歐元區重要經濟指標
年 / 月經濟成長率
%
失業率
%
工業生產年增率(不含營建業)
%
調和消費者物價指數(HICP)年增率
(2015=100)%
出口年增率
%
進口年增率
%
貿易餘額(百萬歐元)
2017 2.5 9.1 3.0 1.5 7.1 9.9 241,636
2018 1.9 8.2 0.7 1.8 4.1 7.0 194,674
2019 1.2 7.6 -1.5 1.2 2.8 1.6 225,525
2019/ 2 7.8 -0.2 1.5 5.9 5.8 18,492
3 1.4 7.7 -0.8 1.4 3.0 6.4 22,714
4 7.6 -0.8 1.7 5.4 6.6 15,457
5 7.6 -1.3 1.2 6.9 5.2 21,247
6 1.2 7.5 -2.5 1.3 -5.4 -4.2 19,749
7 7.6 -1.7 1.0 6.0 2.8 23,536
8 7.5 -2.3 1.0 -2.1 -3.5 14,202
9 1.3 7.5 -1.5 0.8 5.3 2.3 18,461
10 7.4 -1.8 0.7 4.5 -2.5 27,339
11 7.4 -1.6 1.0 -2.6 -4.2 20,558
12 1.0 7.4 -3.6 1.3 4.9 1.2 23,123
2020/ 1 7.4 -1.9 1.4 0.2 -0.2 1,294
2 7.3 1.2
資料來源:ECB、Eurostat、Refinitiv Datastream

140 ∣中央銀行季刊 第42卷第1期 民國109年3月
圖10 歐元區失業率
資料來源:Eurostat、Refinitiv Datastream
由於英國與歐盟間貿易協定談判仍無共
識,加以肺炎疫情日趨嚴峻,製造業與服務
業均遭受嚴重衝擊,IHS Markit預測2020年
第1季歐元區經濟成長率降至0.0%,全年恐
衰退1.5% (表1)。
二、2020年初通膨回穩,惟預測全年
通膨率較2019年大幅下降
因食品與能源產品價格年增率上升,
2020年1~2月歐元區調和消費者物價指數
(HICP)年增率回升至1.3%,高於2019年第4
季之1.0%(表3、圖11);扣除能源及未加工
食品之核心HICP年增率為1.3%,與2019年
第4季持平。IHS Markit預測2020年通膨率為
0.6%,大幅低於2019年之1.2%(圖3)。
肺炎疫情在歐洲迅速擴散前,勞動市場
仍屬穩健,歐元區2020年1~2月平均失業率
為7.4%,與2019年第4季持平(表3、圖10);
德國及法國1~2月平均失業率分別為5.0%及
8.2%,均與2019年第4季持平(圖10)。

國際經濟金融情勢∣ 141
圖11 歐元區調和消費者物價指數(HICP)年增率
資料來源:Refinitiv Datastream
三、ECB擴大購債規模因應肺炎疫情衝
擊
2020年3月12日ECB決議維持主要再
融通操作利率、邊際放款利率與存款利率
分別於0.00%、0.25%及-0.50%不變(表4),
惟為因應肺炎疫情導致之經濟衝擊與高度
不確定性,購債規模除現行每月200億歐
元外,將於2020年底前額外增加1,200億歐
元,並將進行更多長期再融通操作(Long-
Term Refinancing Operation, LTRO),提供更
優惠的利率條件支持銀行放貸;另於3月18
日緊急宣布新增因應流行病緊急購買計畫
(Pandemic Emergency Purchase Programme,
PEPP),將於2020年底前購買7,500億歐元之
公部門與私部門證券資產。
表4 ECB之各項利率單位:%
名稱
實施日期
2014/6/11 2014/9/10 2015/12/9 2016/3/16 2019/9/12
主要再融通操作利率
0.15 0.05 0.05 0.00 0.00
存款利率 -0.10 -0.20 -0.30 -0.40 -0.50
邊際放款利率 0.40 0.30 0.30 0.25 0.25
註:存款利率為ECB支付銀行存放央行之隔夜存款(即超額準備金)利率,該利率自2014年6月以來為負值。
資料來源:ECB
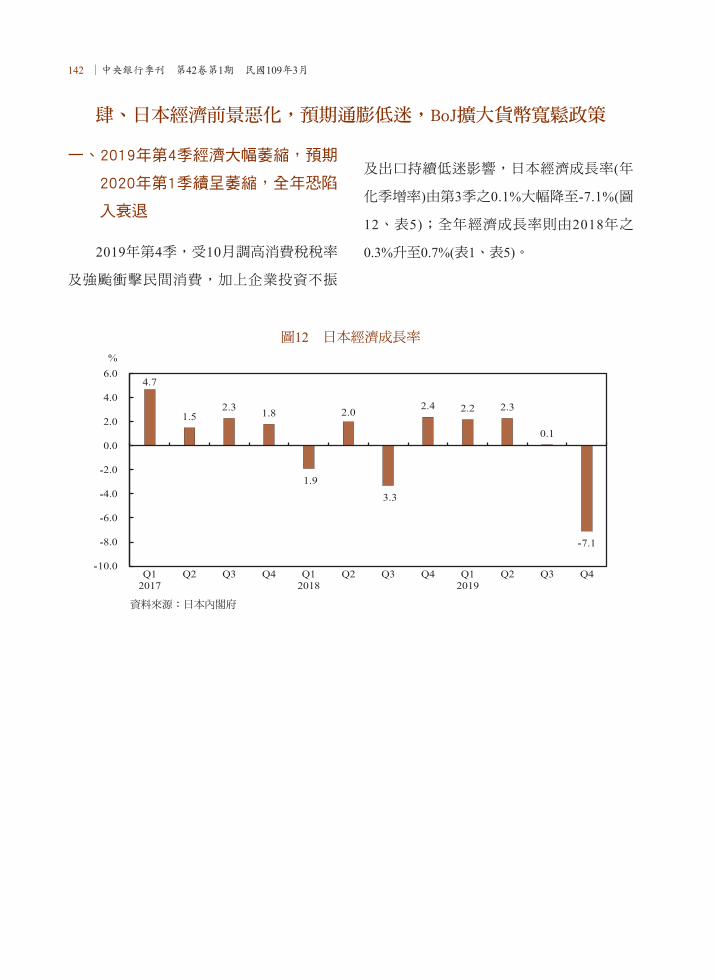
142 ∣中央銀行季刊 第42卷第1期 民國109年3月
肆、日本經濟前景惡化,預期通膨低迷,BoJ擴大貨幣寬鬆政策
一、2019年第4季經濟大幅萎縮,預期
2020年第1季續呈萎縮,全年恐陷
入衰退
2019年第4季,受10月調高消費稅稅率
及強颱衝擊民間消費,加上企業投資不振
及出口持續低迷影響,日本經濟成長率(年
化季增率)由第3季之0.1%大幅降至-7.1%(圖
12、表5);全年經濟成長率則由2018年之
0.3%升至0.7%(表1、表5)。
圖12 日本經濟成長率
資料來源:日本內閣府
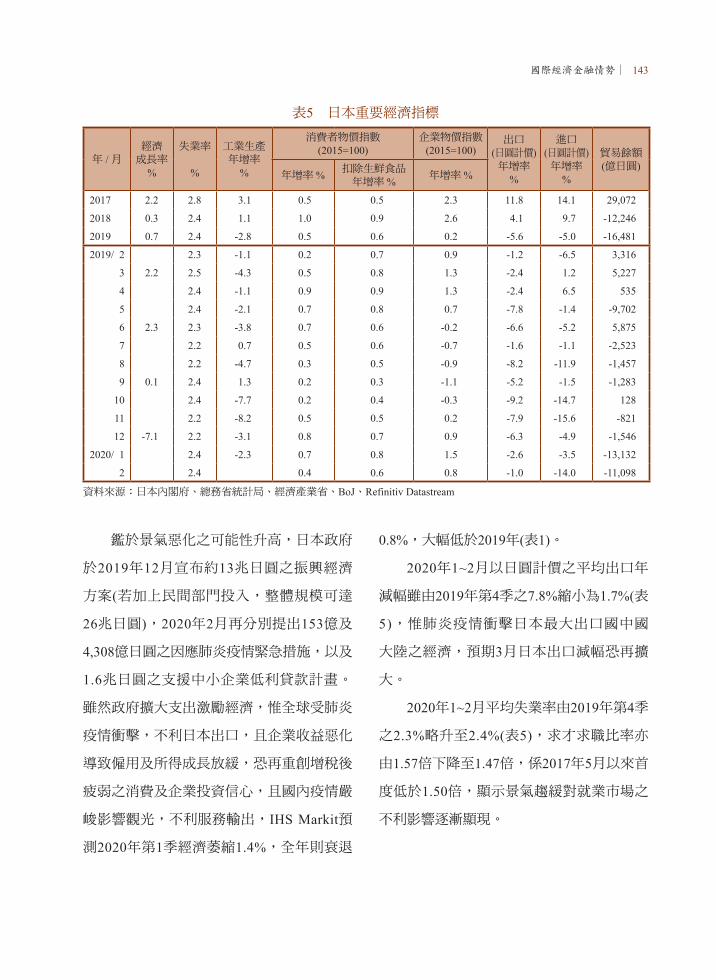
國際經濟金融情勢∣ 143
鑑於景氣惡化之可能性升高,日本政府
於2019年12月宣布約13兆日圓之振興經濟
方案(若加上民間部門投入,整體規模可達
26兆日圓),2020年2月再分別提出153億及
4,308億日圓之因應肺炎疫情緊急措施,以及
1.6兆日圓之支援中小企業低利貸款計畫。
雖然政府擴大支出激勵經濟,惟全球受肺炎
疫情衝擊,不利日本出口,且企業收益惡化
導致僱用及所得成長放緩,恐再重創增稅後
疲弱之消費及企業投資信心,且國內疫情嚴
峻影響觀光,不利服務輸出,IHS Markit預
測2020年第1季經濟萎縮1.4%,全年則衰退
0.8%,大幅低於2019年(表1)。
2020年1~2月以日圓計價之平均出口年
減幅雖由2019年第4季之7.8%縮小為1.7%(表
5),惟肺炎疫情衝擊日本最大出口國中國
大陸之經濟,預期3月日本出口減幅恐再擴
大。
2020年1~2月平均失業率由2019年第4季
之2.3%略升至2.4%(表5),求才求職比率亦
由1.57倍下降至1.47倍,係2017年5月以來首
度低於1.50倍,顯示景氣趨緩對就業市場之
不利影響逐漸顯現。
表5 日本重要經濟指標
年 / 月經濟成長率
%
失業率
%
工業生產年增率
%
消費者物價指數(2015=100)
企業物價指數(2015=100)
出口(日圓計價)年增率
%
進口(日圓計價)年增率
%
貿易餘額(億日圓)
年增率 % 扣除生鮮食品年增率 % 年增率 %
2017 2.2 2.8 3.1 0.5 0.5 2.3 11.8 14.1 29,072
2018 0.3 2.4 1.1 1.0 0.9 2.6 4.1 9.7 -12,246
2019 0.7 2.4 -2.8 0.5 0.6 0.2 -5.6 -5.0 -16,481
2019/ 2 2.3 -1.1 0.2 0.7 0.9 -1.2 -6.5 3,316
3 2.2 2.5 -4.3 0.5 0.8 1.3 -2.4 1.2 5,227
4 2.4 -1.1 0.9 0.9 1.3 -2.4 6.5 535
5 2.4 -2.1 0.7 0.8 0.7 -7.8 -1.4 -9,702
6 2.3 2.3 -3.8 0.7 0.6 -0.2 -6.6 -5.2 5,875
7 2.2 0.7 0.5 0.6 -0.7 -1.6 -1.1 -2,523
8 2.2 -4.7 0.3 0.5 -0.9 -8.2 -11.9 -1,457
9 0.1 2.4 1.3 0.2 0.3 -1.1 -5.2 -1.5 -1,283
10 2.4 -7.7 0.2 0.4 -0.3 -9.2 -14.7 128
11 2.2 -8.2 0.5 0.5 0.2 -7.9 -15.6 -821
12 -7.1 2.2 -3.1 0.8 0.7 0.9 -6.3 -4.9 -1,546
2020/ 1 2.4 -2.3 0.7 0.8 1.5 -2.6 -3.5 -13,132
2 2.4 0.4 0.6 0.8 -1.0 -14.0 -11,098
資料來源:日本內閣府、總務省統計局、經濟產業省、BoJ、Refinitiv Datastream

144 ∣中央銀行季刊 第42卷第1期 民國109年3月
伍、南韓經濟成長動能疲弱,預期通膨率回升,南韓央行緊急降息
一、2019年第4季經濟成長率略升,預
期2020年第1季放緩,全年則幾近
零成長
2019年第4季,因政府持續擴大公共支
出,加以商品出口恢復成長,南韓經濟成
長率由第3季之2.0%略升至2.3%(圖13、表
6),惟全年成長率由2018年之2.7%大幅降至
2.0%(表1、表6),係2009年以來低點。
二、通膨降溫,預測2020年恐再陷通
縮
2020年1月CPI年增率為0.7%,2月受能
源價格下跌影響降至0.4%,扣除生鮮食品
之核心CPI年增率亦由0.8%降至0.6%;企
業物價指數(PPI)年增率則由1月之1.5%降至
0.8%(表5)。IHS Markit預測2020年CPI年增
率為-0.1%,低於2019年之0.5%(圖3)。
三、BoJ擴大寬鬆貨幣因應肺炎疫情對
經濟金融之衝擊
2020年3月16日BoJ提前召開貨幣政策會
議,決議維持短期政策利率(銀行存放央行
之新增超額準備金利率)於-0.10%,且為促使
長期利率目標(10年期公債殖利率)維持於0%
左右,將持續執行每年增加購買公債80兆日
圓計畫不變,惟將擴大寬鬆貨幣,包括實施
新的企業金融支援特別操作(金融機構以民
間企業債務為擔保,融通期間最長1年,利
率為0%,實施至2020年9月底)、增加商業
本票及公司債之購買額度各1兆日圓至3.2兆
及4.2兆日圓(實施至2020年9月底),以及擴
大指數股票型基金(ETF)及不動產投資信託
基金(J-REIT)之購買額度,分別由每年6兆及
900億日圓,擴大至12兆及1,800億日圓,以
因應肺炎疫情對經濟金融之衝擊。

國際經濟金融情勢∣ 145
圖13 南韓經濟成長率
資料來源:南韓央行
表6 南韓重要經濟指標
年 / 月經濟成長率
%
失業率
%
工業生產年增率
%
消費者物價指數(2015=100)
生產者物價指數(2015=100) 出口
年增率%
進口年增率
%
貿易餘額(百萬美元)
年增率 %扣除食品及能源年增率
%年增率 %
2017 3.2 3.7 2.3 1.9 1.5 3.5 15.8 17.8 95,2162018 2.7 3.8 1.4 1.5 1.2 1.9 5.4 11.9 69,6572019 2.0 3.8 0.1 0.4 0.7 0.0 -10.4 -6.0 38,8902019/ 2 4.7 -3.7 0.5 1.1 0.1 -11.3 -12.4 2,830
3 1.7 4.3 -2.7 0.4 0.7 0.5 -8.4 -6.6 5,0114 4.4 0.1 0.6 0.7 0.6 -2.1 2.9 3,7345 4.0 0.5 0.7 0.6 0.4 -9.8 -1.9 2,0846 2.0 4.0 -2.2 0.7 0.7 0.1 -13.8 -10.9 3,9047 3.9 1.9 0.6 0.9 -0.3 -11.1 -2.6 2,3168 3.0 -2.2 0.0 0.8 -0.6 -14.0 -4.3 1,5639 2.0 3.1 1.6 -0.4 0.5 -0.8 -11.9 -5.6 5,888
10 3.0 -0.9 0.0 0.6 -0.7 -15.0 -14.6 5,25211 3.1 1.3 0.2 0.5 -0.1 -14.5 -13.0 3,31212 2.3 3.4 7.0 0.7 0.6 0.7 -5.3 -0.8 1,981
2020/ 1 4.1 -2.2 1.5 0.8 1.1 -6.3 -5.4 5352 4.1 1.1 0.5 0.7 4.5 1.4 4,115
資料來源:Refinitiv Datastream

146 ∣中央銀行季刊 第42卷第1期 民國109年3月
南韓政府續採史上最大規模預算以支撐
經濟動能,並於2020年3月陸續提出11.7兆韓
元追加預算及100兆韓元之政府緊急援助計
畫,以因應肺炎疫情對經濟之衝擊;惟全球
受肺炎疫情衝擊,恐拖累南韓IT產業復甦,
不利出口及企業設備投資,IHS Markit預測
2020年第1季經濟成長率放緩至1.8%,全年
則大幅降至0.2%(表1)。
2020年1月出口年增率由2019年第4季
之-11.7%回升至-6.3%,2月則因工作天數較
上年同期多,致出口年增率再升至4.5%(表
6);南韓產業通商部表示,肺炎疫情對出口
之衝擊將大於2003年SARS時期,且至3月才
會顯現。
2020年1~2月平均失業率較2019年同期
下降0.5個百分點至4.1%(表6),主因政府為60
歲以上中高齡者創造更多就業機會(主要在衛
生與社會福利部門)之政策發揮效果所致。
二、近期通膨降溫,預期2020年通膨
率高於2019年
2020年1月CPI年增率受能源價格上漲影
響,由2019年第4季之0.3%升至1.5%,2月則
回降至1.1%,主因能源價格回跌,加上肺炎
疫情影響需求;扣除食品及能源之核心CPI年
增率亦由1月之0.8%降至0.5%。1~2月生產者
物價指數(PPI)年增率則由2019年第4季之0.0%
升至0.9%(表6)。IHS Markit預測2020年CPI年
增率為1.2%,高於2019年之0.4%(圖3)。
三、南韓央行緊急降息2碼
2020年3月16日南韓央行為因應肺炎疫
情之衝擊及穩定經濟金融情勢,緊急調降基
準利率0.50個百分點至0.75%之歷史低點;
另將放款支援機制利率(Bank Intermediated
Lending Support Facility Interest Rates)由
0.50%~0.75%調降至0.25%,以支援中小企業
之資金需求,並擴大公開市場操作之合格擔
保品範圍,以因應金融業之資金需求。另於
3月26日首度推出無限量流動性供給機制,3
個月內將無限量挹注資金至貨幣市場。
陸、中國大陸經濟降溫,通膨升溫,人行下調操作工具利率以因應疫情
一、2019年第4季經濟成長平疲,預期
2020年第1季及全年成長大幅下降
2019年第4季中國大陸經濟成長率為
6.0%,與第3季持平(圖14、表7),係1992年
以來最低,主因美中貿易衝突趨緩帶動製造
業投資增加,投資對經濟成長貢獻上升,惟
服務類消費增速減慢,加以進口因製造業景
氣回升而增加,致消費及淨輸出對經濟成長
貢獻下降所致;全年成長率則為6.1%,低於
2018年之6.7%(表1、表7)。
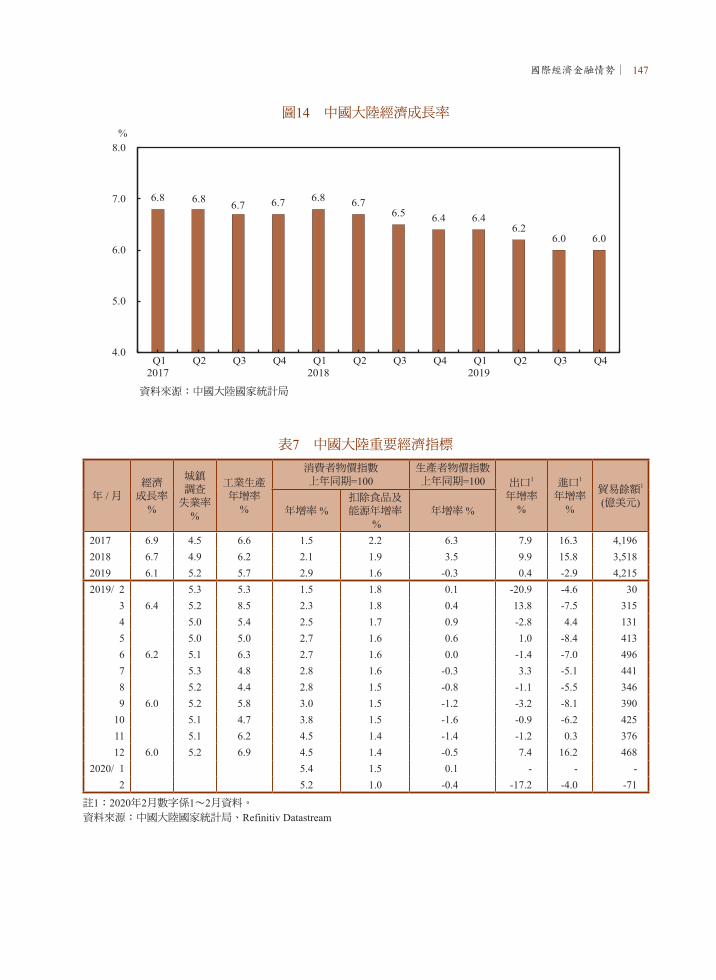
國際經濟金融情勢∣ 147
圖14 中國大陸經濟成長率
資料來源:中國大陸國家統計局
表7 中國大陸重要經濟指標
年 / 月經濟成長率
%
城鎮調查失業率
%
工業生產年增率
%
消費者物價指數上年同期=100
生產者物價指數上年同期=100 出口1
年增率%
進口1
年增率%
貿易餘額1
(億美元)年增率 %
扣除食品及能源年增率
%年增率 %
2017 6.9 4.5 6.6 1.5 2.2 6.3 7.9 16.3 4,1962018 6.7 4.9 6.2 2.1 1.9 3.5 9.9 15.8 3,5182019 6.1 5.2 5.7 2.9 1.6 -0.3 0.4 -2.9 4,2152019/ 2 5.3 5.3 1.5 1.8 0.1 -20.9 -4.6 30
3 6.4 5.2 8.5 2.3 1.8 0.4 13.8 -7.5 3154 5.0 5.4 2.5 1.7 0.9 -2.8 4.4 1315 5.0 5.0 2.7 1.6 0.6 1.0 -8.4 4136 6.2 5.1 6.3 2.7 1.6 0.0 -1.4 -7.0 4967 5.3 4.8 2.8 1.6 -0.3 3.3 -5.1 4418 5.2 4.4 2.8 1.5 -0.8 -1.1 -5.5 3469 6.0 5.2 5.8 3.0 1.5 -1.2 -3.2 -8.1 390
10 5.1 4.7 3.8 1.5 -1.6 -0.9 -6.2 42511 5.1 6.2 4.5 1.4 -1.4 -1.2 0.3 37612 6.0 5.2 6.9 4.5 1.4 -0.5 7.4 16.2 468
2020/ 1 5.4 1.5 0.1 - - -2 5.2 1.0 -0.4 -17.2 -4.0 -71
註1:2020年2月數字係1∼2月資料。資料來源:中國大陸國家統計局、Refinitiv Datastream
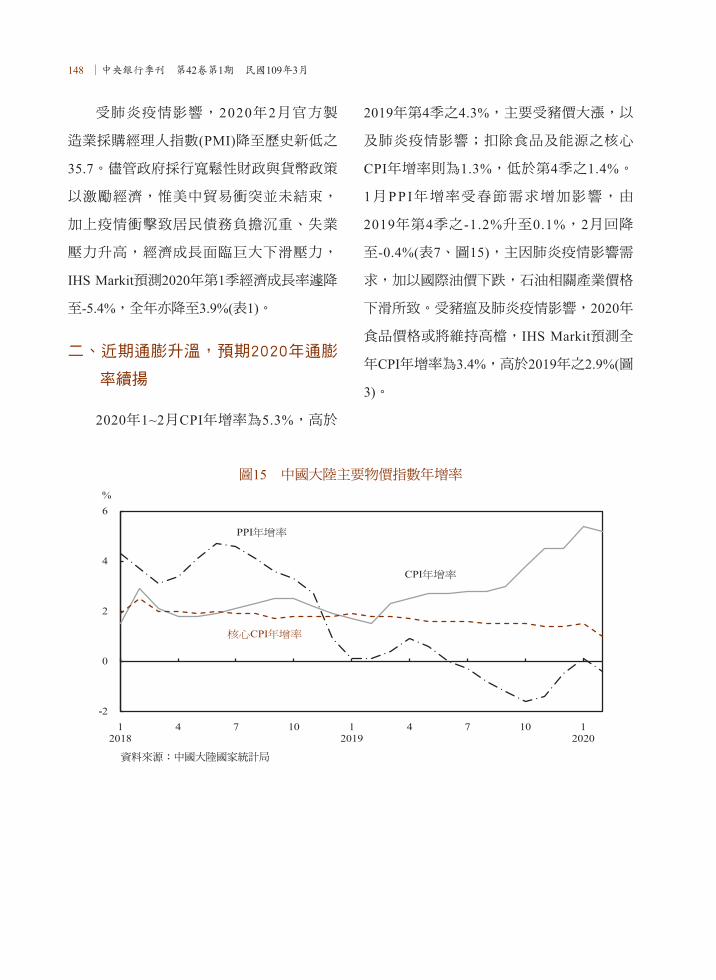
148 ∣中央銀行季刊 第42卷第1期 民國109年3月
圖15 中國大陸主要物價指數年增率
資料來源:中國大陸國家統計局
受肺炎疫情影響,2020年2月官方製
造業採購經理人指數(PMI)降至歷史新低之
35.7。儘管政府採行寬鬆性財政與貨幣政策
以激勵經濟,惟美中貿易衝突並未結束,
加上疫情衝擊致居民債務負擔沉重、失業
壓力升高,經濟成長面臨巨大下滑壓力,
IHS Markit預測2020年第1季經濟成長率遽降
至-5.4%,全年亦降至3.9%(表1)。
二、近期通膨升溫,預期2020年通膨
率續揚
2020年1~2月CPI年增率為5.3%,高於
2019年第4季之4.3%,主要受豬價大漲,以
及肺炎疫情影響;扣除食品及能源之核心
CPI年增率則為1.3%,低於第4季之1.4%。
1月P P I年增率受春節需求增加影響,由
2019年第4季之-1.2%升至0.1%,2月回降
至-0.4%(表7、圖15),主因肺炎疫情影響需
求,加以國際油價下跌,石油相關產業價格
下滑所致。受豬瘟及肺炎疫情影響,2020年
食品價格或將維持高檔,IHS Markit預測全
年CPI年增率為3.4%,高於2019年之2.9%(圖
3)。
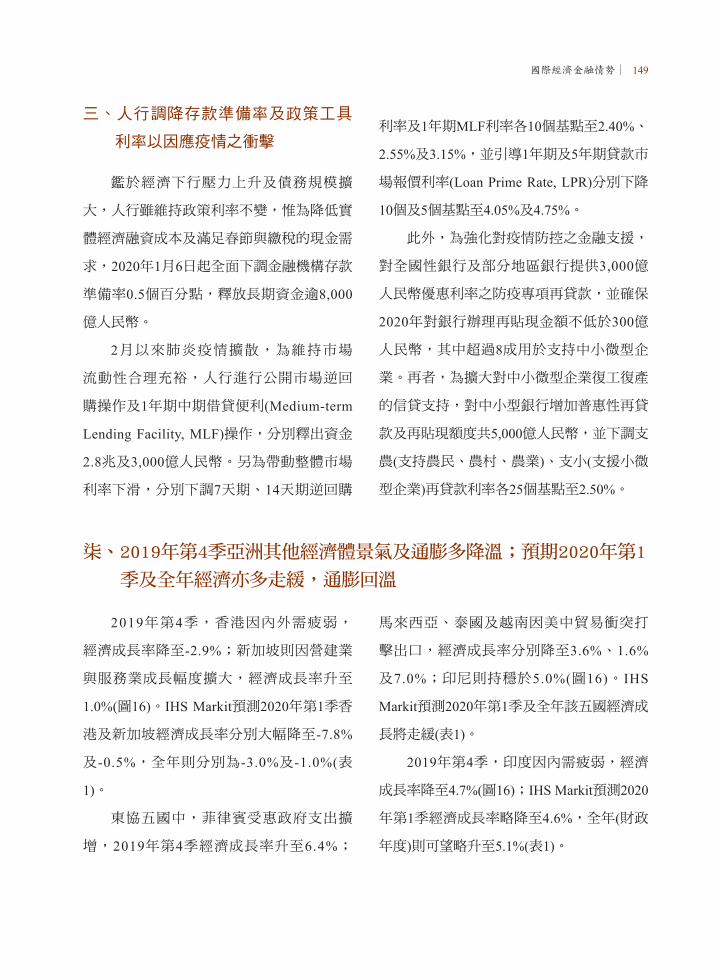
國際經濟金融情勢∣ 149
三、人行調降存款準備率及政策工具
利率以因應疫情之衝擊
鑑於經濟下行壓力上升及債務規模擴
大,人行雖維持政策利率不變,惟為降低實
體經濟融資成本及滿足春節與繳稅的現金需
求,2020年1月6日起全面下調金融機構存款
準備率0.5個百分點,釋放長期資金逾8,000
億人民幣。
2月以來肺炎疫情擴散,為維持市場
流動性合理充裕,人行進行公開市場逆回
購操作及1年期中期借貸便利(Medium-term
Lending Facility, MLF)操作,分別釋出資金
2.8兆及3,000億人民幣。另為帶動整體市場
利率下滑,分別下調7天期、14天期逆回購
利率及1年期MLF利率各10個基點至2.40%、
2.55%及3.15%,並引導1年期及5年期貸款市
場報價利率(Loan Prime Rate, LPR)分別下降
10個及5個基點至4.05%及4.75%。
此外,為強化對疫情防控之金融支援,
對全國性銀行及部分地區銀行提供3,000億
人民幣優惠利率之防疫專項再貸款,並確保
2020年對銀行辦理再貼現金額不低於300億
人民幣,其中超過8成用於支持中小微型企
業。再者,為擴大對中小微型企業復工復產
的信貸支持,對中小型銀行增加普惠性再貸
款及再貼現額度共5,000億人民幣,並下調支
農(支持農民、農村、農業)、支小(支援小微
型企業)再貸款利率各25個基點至2.50%。
柒、2019年第4季亞洲其他經濟體景氣及通膨多降溫;預期2020年第1
季及全年經濟亦多走緩,通膨回溫
2019年第4季,香港因內外需疲弱,
經濟成長率降至-2.9%;新加坡則因營建業
與服務業成長幅度擴大,經濟成長率升至
1.0%(圖16)。IHS Markit預測2020年第1季香
港及新加坡經濟成長率分別大幅降至-7.8%
及-0.5%,全年則分別為-3.0%及-1.0%(表
1)。
東協五國中,菲律賓受惠政府支出擴
增,2019年第4季經濟成長率升至6.4%;
馬來西亞、泰國及越南因美中貿易衝突打
擊出口,經濟成長率分別降至3.6%、1.6%
及7.0%;印尼則持穩於5.0%(圖16)。IHS
Markit預測2020年第1季及全年該五國經濟成
長將走緩(表1)。
2019年第4季,印度因內需疲弱,經濟
成長率降至4.7%(圖16);IHS Markit預測2020
年第1季經濟成長率略降至4.6%,全年(財政
年度)則可望略升至5.1%(表1)。
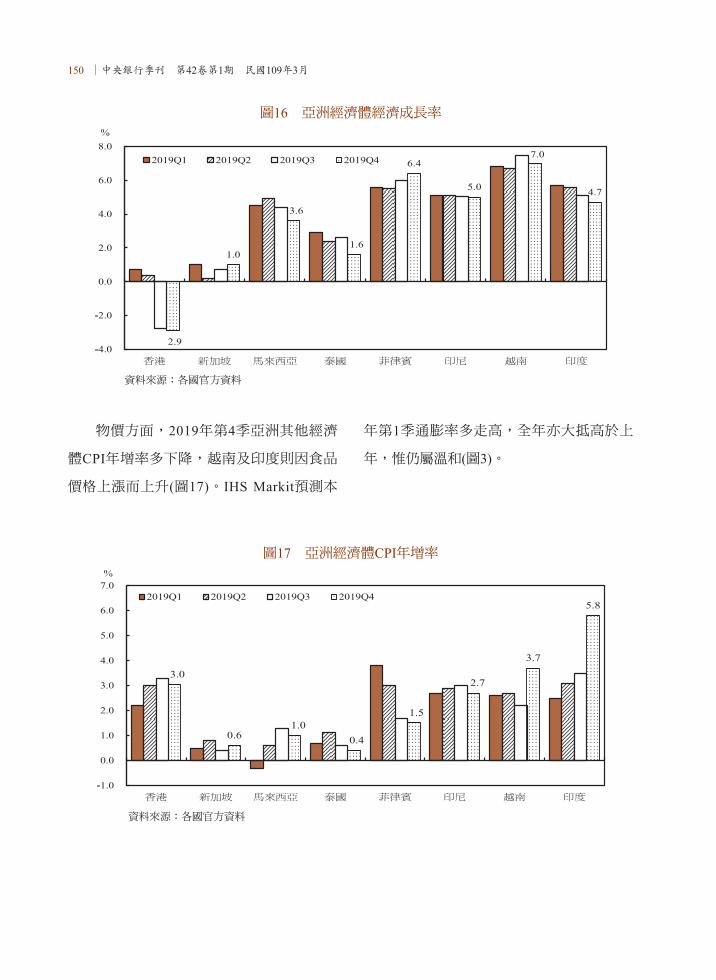
150 ∣中央銀行季刊 第42卷第1期 民國109年3月
圖16 亞洲經濟體經濟成長率
資料來源:各國官方資料
物價方面,2019年第4季亞洲其他經濟
體CPI年增率多下降,越南及印度則因食品
價格上漲而上升(圖17)。IHS Markit預測本
年第1季通膨率多走高,全年亦大抵高於上
年,惟仍屬溫和(圖3)。
圖17 亞洲經濟體CPI年增率
資料來源:各國官方資料
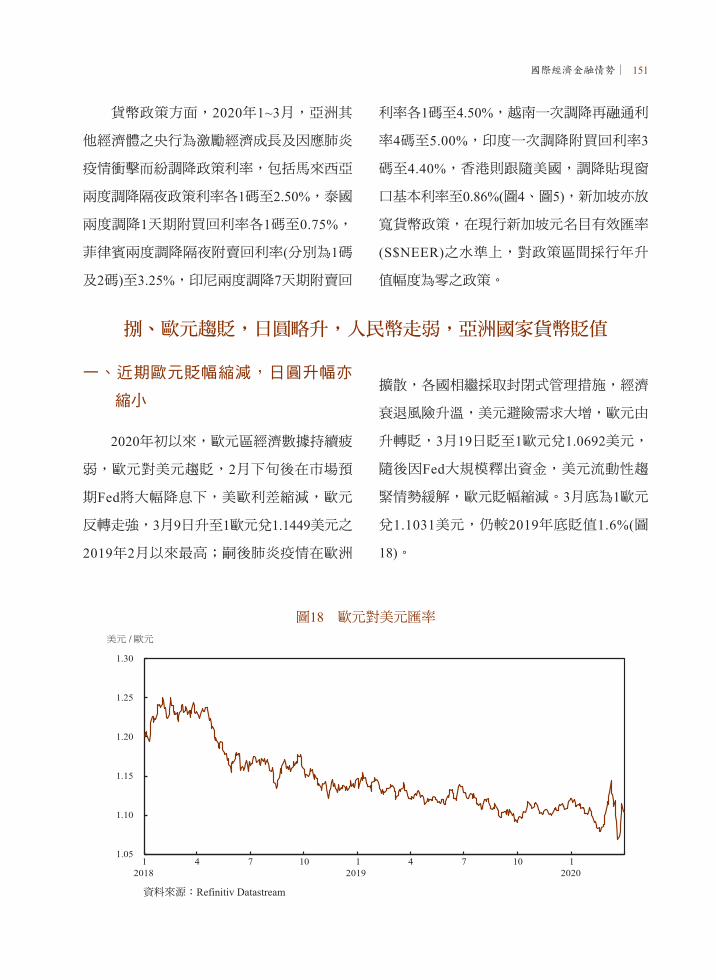
國際經濟金融情勢∣ 151
貨幣政策方面,2020年1~3月,亞洲其
他經濟體之央行為激勵經濟成長及因應肺炎
疫情衝擊而紛調降政策利率,包括馬來西亞
兩度調降隔夜政策利率各1碼至2.50%,泰國
兩度調降1天期附買回利率各1碼至0.75%,
菲律賓兩度調降隔夜附賣回利率(分別為1碼
及2碼)至3.25%,印尼兩度調降7天期附賣回
利率各1碼至4.50%,越南一次調降再融通利
率4碼至5.00%,印度一次調降附買回利率3
碼至4.40%,香港則跟隨美國,調降貼現窗
口基本利率至0.86%(圖4、圖5),新加坡亦放
寬貨幣政策,在現行新加坡元名目有效匯率
(S$NEER)之水準上,對政策區間採行年升
值幅度為零之政策。
一、近期歐元貶幅縮減,日圓升幅亦
縮小
2020年初以來,歐元區經濟數據持續疲
弱,歐元對美元趨貶,2月下旬後在市場預
期Fed將大幅降息下,美歐利差縮減,歐元
反轉走強,3月9日升至1歐元兌1.1449美元之
2019年2月以來最高;嗣後肺炎疫情在歐洲
擴散,各國相繼採取封閉式管理措施,經濟
衰退風險升溫,美元避險需求大增,歐元由
升轉貶,3月19日貶至1歐元兌1.0692美元,
隨後因Fed大規模釋出資金,美元流動性趨
緊情勢緩解,歐元貶幅縮減。3月底為1歐元
兌1.1031美元,仍較2019年底貶值1.6%(圖
18)。
捌、歐元趨貶,日圓略升,人民幣走弱,亞洲國家貨幣貶值
圖18 歐元對美元匯率
資料來源:Refinitiv Datastream

152 ∣中央銀行季刊 第42卷第1期 民國109年3月
圖19 日圓對美元匯率
資料來源:Refinitiv Datastream
2020年初以來,日圓對美元匯率隨市
場避險情緒變化波動,2月中旬日本公布上
年第4季經濟成長遠低於預期,衰退隱憂浮
現,復以日本國內肺炎疫情益趨嚴峻,2月
20日貶至1美元兌112.13日圓之低點;隨後
美、歐股市與國際油價大跌,日圓因避險需
求升溫而大幅轉強,3月9日升值至1美元兌
102.36日圓之2016年10月以來高點,嗣因市
場預期BoJ將擴大貨幣寬鬆政策,加以主要
國家相繼推出大規模財政激勵政策,日圓升
幅縮減。3月底為1美元兌107.55日圓,惟仍
較2019年底升值1.0%(圖19)。
二、人民幣由升轉貶,亞洲國家貨幣
貶值
2020年初,美中貿易緊張情勢緩和,加
以美國財政部將中國大陸自匯率操縱國名單
中移除,人民幣走升,1月17日升至1美元兌
6.86人民幣之高點,嗣隨肺炎疫情發展,2月
後貶破7.0人民幣之重要心理關卡後呈盤整
格局,3月中旬以來美元需求大增,人民幣
續貶,3月底為1美元兌7.09人民幣,較2019
年底貶值1.8%。亞洲國家貨幣則受肺炎疫情
影響而走貶,其中印尼因境外投資人拋售印
尼股、債資產,3月23日印尼盾貶至1美元兌
16,575印尼盾之歷史新低,3月底則較2019年
底貶值14.9%,貶幅較大(圖20)。
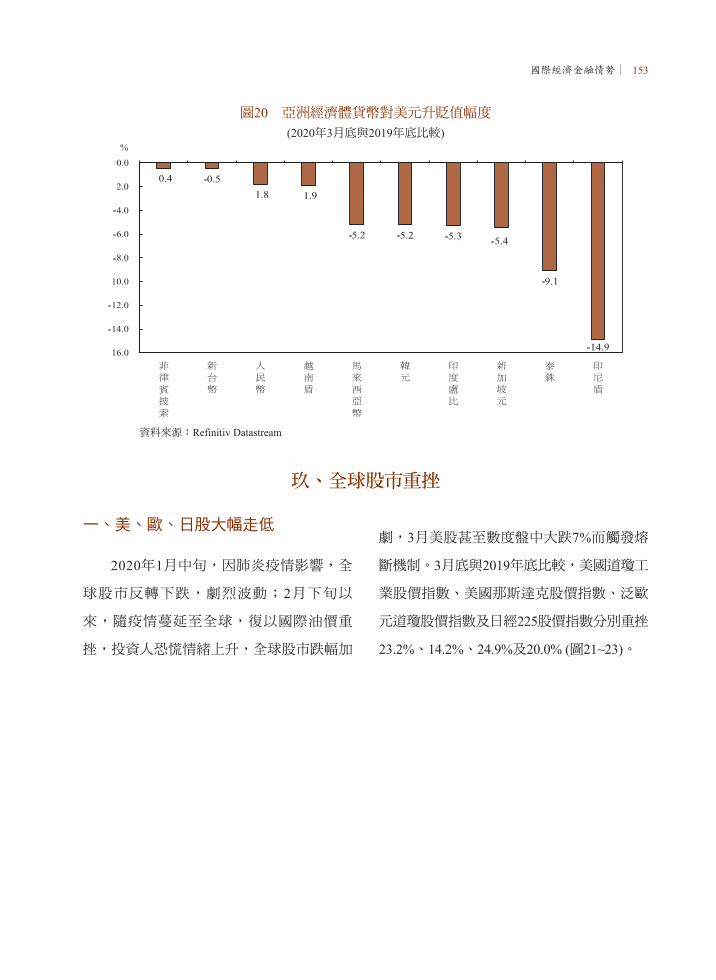
國際經濟金融情勢∣ 153
圖20 亞洲經濟體貨幣對美元升貶值幅度(2020年3月底與2019年底比較)
資料來源:Refinitiv Datastream
玖、全球股市重挫
一、美、歐、日股大幅走低
2020年1月中旬,因肺炎疫情影響,全
球股市反轉下跌,劇烈波動;2月下旬以
來,隨疫情蔓延至全球,復以國際油價重
挫,投資人恐慌情緒上升,全球股市跌幅加
劇,3月美股甚至數度盤中大跌7%而觸發熔
斷機制。3月底與2019年底比較,美國道瓊工
業股價指數、美國那斯達克股價指數、泛歐
元道瓊股價指數及日經225股價指數分別重挫
23.2%、14.2%、24.9%及20.0% (圖21~23)。
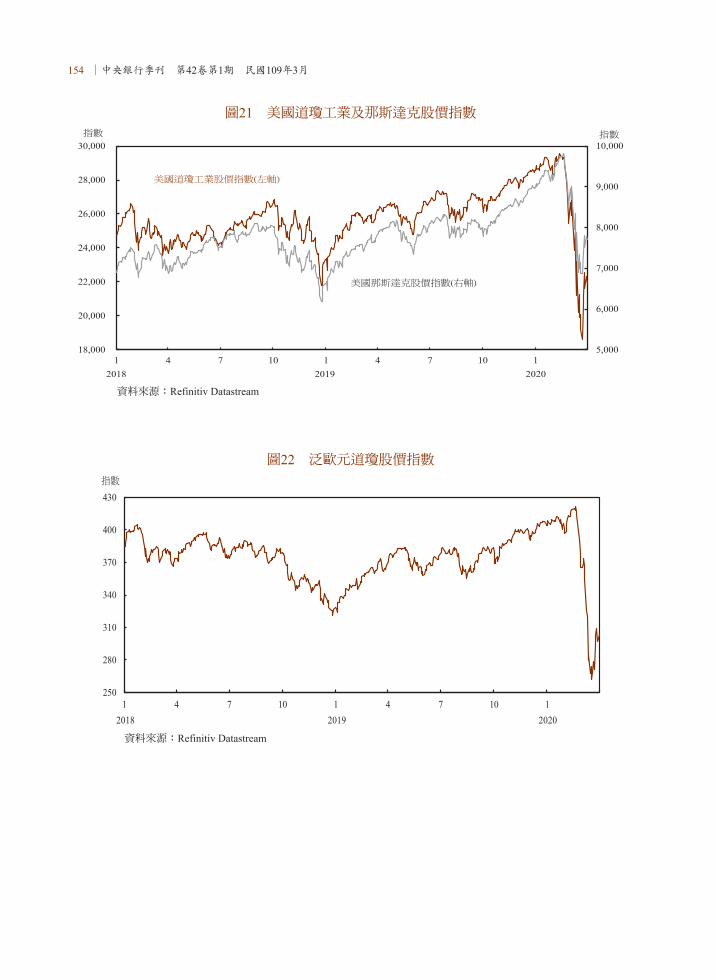
154 ∣中央銀行季刊 第42卷第1期 民國109年3月
圖21 美國道瓊工業及那斯達克股價指數
資料來源:Refinitiv Datastream
圖22 泛歐元道瓊股價指數
資料來源:Refinitiv Datastream
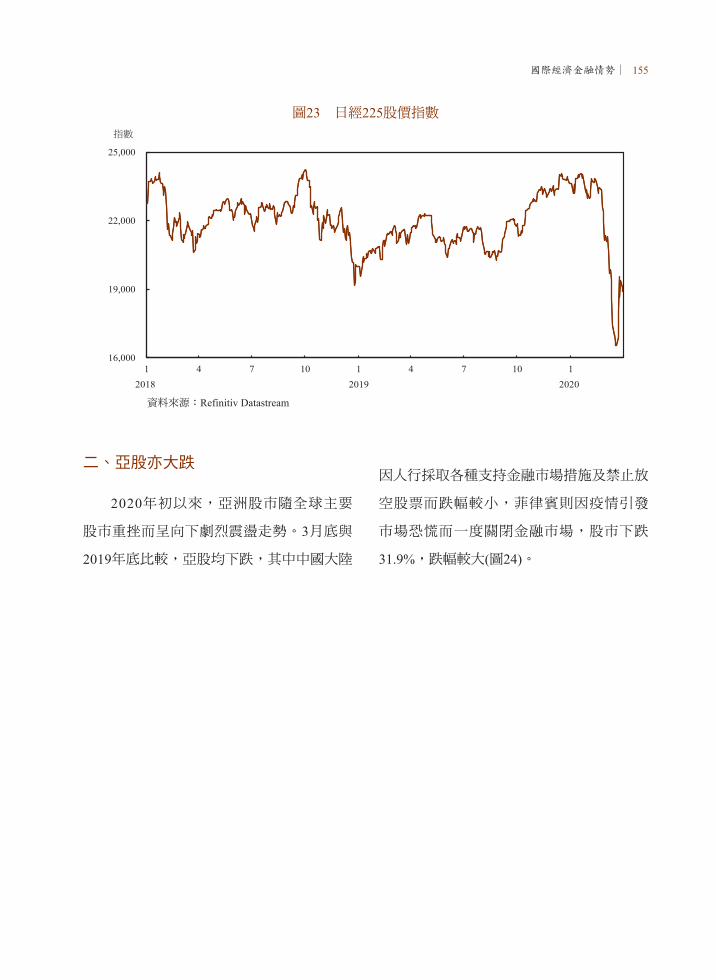
國際經濟金融情勢∣ 155
圖23 日經225股價指數
資料來源:Refinitiv Datastream
二、亞股亦大跌
2020年初以來,亞洲股市隨全球主要
股市重挫而呈向下劇烈震盪走勢。3月底與
2019年底比較,亞股均下跌,其中中國大陸
因人行採取各種支持金融市場措施及禁止放
空股票而跌幅較小,菲律賓則因疫情引發
市場恐慌而一度關閉金融市場,股市下跌
31.9%,跌幅較大(圖24)。
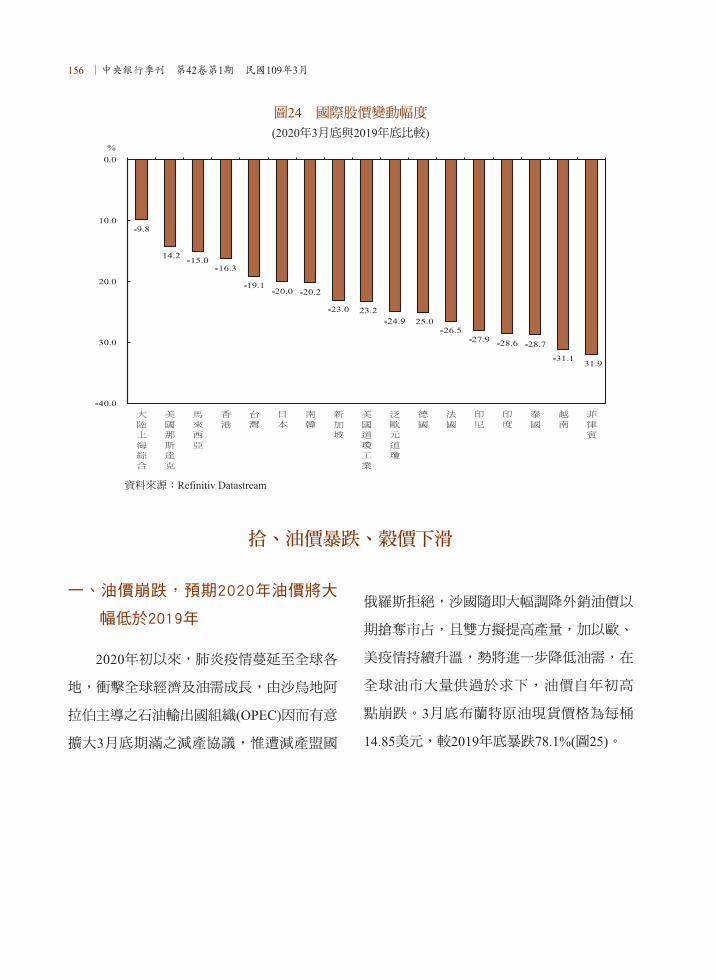
156 ∣中央銀行季刊 第42卷第1期 民國109年3月
拾、油價暴跌、穀價下滑
一、油價崩跌,預期2020年油價將大
幅低於2019年
2020年初以來,肺炎疫情蔓延至全球各
地,衝擊全球經濟及油需成長,由沙烏地阿
拉伯主導之石油輸出國組織(OPEC)因而有意
擴大3月底期滿之減產協議,惟遭減產盟國
俄羅斯拒絕,沙國隨即大幅調降外銷油價以
期搶奪市占,且雙方擬提高產量,加以歐、
美疫情持續升溫,勢將進一步降低油需,在
全球油市大量供過於求下,油價自年初高
點崩跌。3月底布蘭特原油現貨價格為每桶
14.85美元,較2019年底暴跌78.1%(圖25)。
圖24 國際股價變動幅度(2020年3月底與2019年底比較)
資料來源:Refinitiv Datastream
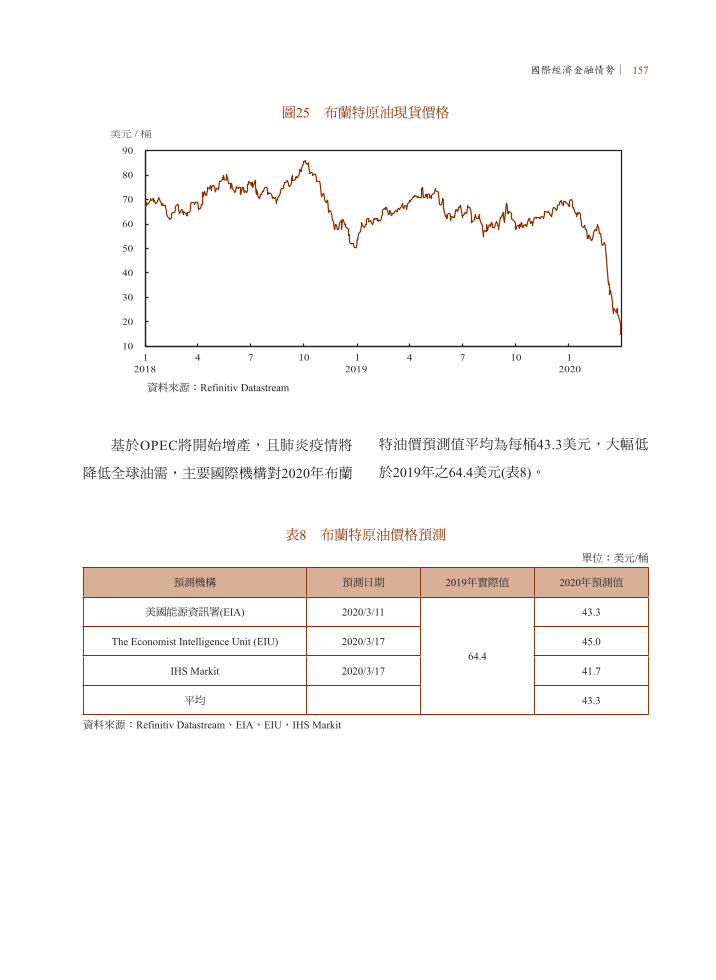
國際經濟金融情勢∣ 157
圖25 布蘭特原油現貨價格
資料來源:Refinitiv Datastream
基於OPEC將開始增產,且肺炎疫情將
降低全球油需,主要國際機構對2020年布蘭
特油價預測值平均為每桶43.3美元,大幅低
於2019年之64.4美元(表8)。
表8 布蘭特原油價格預測單位:美元/桶
預測機構 預測日期 2019年實際值 2020年預測值
美國能源資訊署(EIA) 2020/3/11
64.4
43.3
The Economist Intelligence Unit (EIU) 2020/3/17 45.0
IHS Markit 2020/3/17 41.7
平均 43.3
資料來源:Refinitiv Datastream、EIA、EIU、IHS Markit

158 ∣中央銀行季刊 第42卷第1期 民國109年3月
圖26 Thomson Reuters穀物期貨價格指數與R/J CRB期貨價格指數
資料來源:Refinitiv Datastream
二、穀價下跌後回漲
2020年初以來,肺炎疫情蔓延使中國大
陸恐延後擴大購買美國農產品,且美國農業
部預估之玉米及黃豆種植面積大於預期,加
以受國際油價大跌及金融市場恐慌拖累,
Thomson Reuters穀物期貨價格指數下滑;3
月下旬則因巴西產區天氣乾旱恐損及黃豆產
量,加以肺炎疫情嚴峻致全球各地出現糧食
搶購潮,致該指數回漲,惟3月底仍較2019
年底下跌6.3%(圖26)。
三、整體國際商品價格重挫
2020年初以來,代表整體國際商品價
格之R/J CRB期貨價格指數則隨原油等大
宗商品價格波動,3月底較2019年底大跌
34.4%(圖26)。
國內經濟金融日誌∣ 159
國內經濟金融日誌
民國109年1月份
15日 △配合公司法修正廢除外國公司認許制度等,金管會修正「外國銀行分行及代表人
辦事處設立及管理辦法」。
△為加強獨立董事及薪酬委員會相關獨立性規範,金管會修正「公開發行公司獨立
董事設置及應遵循事項辦法」、「公開發行公司審計委員會行使職權辦法」、
「股票上市或於證券商營業處所買賣公司薪資報酬委員會設置及行使職權辦法」
及「公開發行公司董事會議事辦法」。
△金管會函釋證券交易法,核准證券自營商得經營自行買賣具證券性質之虛擬通貨
業務,並修正「證券商設置標準」、「證券商管理規則」、「證券商負責人與業
務人員管理規則」及「證券集中保管事業管理規則」。
16日 △為強化利變型保險商品售後管理機制,金管會修正「人身保險業辦理利率變動型
保險商品業務應注意事項」,督促壽險業者建立宣告利率平穩機制等,自109年7
月1日生效。
20日 △依據金管會授權,櫃買中心訂定「證券商經營自行買賣具證券性質之虛擬通貨業
務管理辦法」及相關規章。
22日 △金管會修正「公司募集發行有價證券公開說明書應行記載事項準則」及「公開發
行公司年報應行記載事項準則」,以強化公司治理之資訊揭露,促進董事、監察
人及高階經理人酬金資訊透明化等。
31日 △配合法務部函釋財團法人法之財產運用方法,中央銀行修正「中央銀行對財團法
人法授權規定事項所定辦法」,刪除配合政府政策所為投資持股比率之規定。
民國109年2月份
3日 △為增加證券商發行指數投資證券之避險操作彈性及自營商交易彈性,金管會修正
「證券商管理規則」。
5日 △金管會修正「投資型保險資訊揭露應遵循事項」,強化類全委保單相關費用之揭
露等,自109年7月1日生效。
160 ∣中央銀行季刊 第42卷第1期 民國109年3月
11日 △為強化證券商與期貨商董事、監察人及高階經理人酬金資訊透明化等,金管會修
正「證券商財務報告編製準則」及「期貨商財務報告編製準則」。
13日 △為強化保險業對招攬及核保等作業程序之控管,以及保障身心障礙者權益,金管
會修正「保險業招攬及核保理賠辦法」及「投資型保險商品銷售應注意事項」。
15日 △為強化保險業董事、監察人及高階經理人酬金資訊透明化等,金管會修正「保險
業財務報告編製準則」。
20日 △金管會修正「保險業負責人應具備資格條件準則」,提高資產規模1兆元以上之
保險業專業董監事人數,並落實競業禁止等。
24日 △金管會修正「電子支付機構專用存款帳戶管理辦法」,以增加電子支付機構及專
用存款帳戶銀行作業彈性,並確保支付安全。
△金管會修正「投資型保險專設帳簿保管機構及投資標的應注意事項」及「人身保
險商品審查應注意事項」,加強對投資型保單連結目標到期債券基金之監理,自
109年3月1日生效。
25日 △立法院三讀通過「嚴重特殊傳染性肺炎防治及紓困振興特別條例」,以提升防疫
作為,充實所需設備及物資,並對受影響而發生營運困難的產業,提供相關紓困
及振興措施。
27日 △考量金融機構之資本額龐大,金管會修正「公開發行公司出席股東會使用委託書
規則」,增列個別股東擔任委託書徵求人最低應持有金融機構已發行股份二百萬
股之持股數門檻。
民國109年3月份
2日 △配合證券市場將實施逐筆交易制度,金管會修正「證券經紀商受託買賣有價證券
製作委託書買賣報告書及對帳單應行記載事項準則」,自109年3月23日施行。
5日 △配合「產業創新條例」之修訂,財政部修正「產業創新條例緩課所得稅適用辦
法」。
9日 △財政部核釋「使用牌照稅法」、「房屋稅條例」規定,因嚴重特殊傳染性肺炎接
受隔離治療、居家隔離、居家檢疫、集中隔離或集中檢疫之納稅人,稅繳納期限
准予分別展延至109年5月31日及6月30日。
12日 △經濟部訂定「經濟部對受嚴重特殊傳染性肺炎影響發生營運困難產業事業紓困振
國內經濟金融日誌∣ 161
興辦法」,追溯自109年1月15日施行。
16日 △經濟部訂定「經濟部對受嚴重特殊傳染性肺炎影響發生營運困難事業資金紓困振
興貸款及利息補貼作業要點」。
18日 △為強化公司治理,並提升財務報告透明度等,金管會修正「證券商財務報告編製
準則」、「期貨商財務報告編製準則」及「證券發行人財務報告編製準則」,自
109會計年度施行。
△因應疫情影響,為維持證券交易市場之秩序及穩定,金管會宣布調降每日盤中借
券賣出委託數量及放寬信用交易追繳差額之抵繳擔保品範圍等措施,自109年3月
19日起3個月內施行。
19日 △中央銀行理事會決議,重貼現率、擔保放款融通利率及短期融通利率各調降0.25
個百分點,分別由年息1.375%、1.75%及3.625%調整為1.125%、1.5%及3.375%,
自109年3月20日起實施;並推出二千億元中小企業貸款專案融通方案,以加強銀
行對受疫情影響之中小企業辦理紓困。
△為維持證券市場之秩序及穩定,金管會宣布投資人於有價證券當日收盤價跌幅達
3.5%以上,次一交易日不得以低於前一交易日收盤價放空。
20日 △因應金管會修正銀行最低資本要求等,中央銀行修正「公開市場操作指定交易商
實施要點」。
△金管會修正「鼓勵投信躍進計畫」,調整適用優惠措施之評估指標標準。
23日 △中央銀行宣布自109年4月起定期辦理小規模附買回測試操作,以提升公開市場操
作彈性,有效因應市場不確定性,並確保操作工具之完備性。
△考量銀行資金調度實務,並強化央行存單利率對市場利率之引導效果,中央銀
行宣布自109年4月起調整央行存單發行頻率,包括7天期存單由每週改為每日發
行、停發14天期,及91天、182天期由每日改為每2週發行。
△為強化公司治理,並提升股權及財務報告透明度,金管會修正「金融控股公司財
務報告編製準則」、「公開發行銀行財務報告編製準則」、「公開發行票券金融
公司財務報告編製準則」,自109會計年度施行。
27日 △中央銀行調降金融機構存款準備金乙戶給息利率,源自活期性存款部分給付年息
0.068%,源自定期性存款部分給付年息0.56%。
△勞動部訂定「安心就業計畫」,由政府提供部分薪資差額補貼給因疫情衝擊而減

162 ∣中央銀行季刊 第42卷第1期 民國109年3月
班休息勞工,追溯自109年1月15日生效。
30日 △勞動部核釋勞動基準法所定平均工資之計算,勞工所請之防疫隔離、照顧假的工
資與日數不列入計算,追溯自109年1月15日生效。
31日 △為加強銀行對受疫情影響之中小企業辦理紓困,中央銀行修正「中央銀行對銀行
辦理融通作業要點」,自109年4月1日生效。
△中央銀行訂定「中央銀行辦理銀行承作受嚴重特殊傳染性肺炎疫情影響之中小企
業貸款專案融通作業規定」,自109年4月1日生效。
國際經濟金融日誌∣ 163
國際經濟金融日誌
民國109年1月份
1日 △為支持實體經濟發展及降低社會融資成本,中國人民銀行宣布自2020年1月6日起
全面下調金融機構存款準備率0.5個百分點,釋放長期資金逾8,000億人民幣。
2日 △新加坡2019年第4季GDP年增率初估值為0.8%,略高於第3季之0.7%,製造業雖仍
衰退,惟服務業成長加速;GDP與上季比換算年率初估值則為0.1%,較第3季之
2.4%大幅下滑,主因製造業大幅衰退;全年成長率初估值因製造業大幅衰退,由
2018年之3.1%大幅滑落至0.7%。
8日 △世界銀行(World Bank)發布「全球經濟展望」(Global Economic Prospects)報
告指出,全球經濟活動普遍疲弱,2019年全球經濟成長率由2018年之3.0%降至
2.4%,為全球金融危機以來最低;預測2020年因投資及貿易漸呈復甦,成長率將
升至2.5%。
16日 △聯合國(UN)發布「全球經濟情勢與展望」(World Economic Situation and
Prospects)報告指出,2019年因美中貿易衝突及政策不確定性影響投資,全球經
濟成長率由2018年之3.0%滑落至2.3%,係全球金融危機以來最低;預期2020年在
貿易衝突、英國脫歐及地緣政治摩擦等風險不致加劇下,全球經濟成長率將略升
至2.5%。
17日 △中國大陸2019年第4季GDP年增率為6.0%,與第3季持平,係1992年以來最低,
其中消費及淨輸出成長下滑,投資成長則上揚,全年成長率由2018年之6.6%降至
6.1%。
20日 △國際貨幣基金(IMF)發布「世界經濟展望更新」(World Economic Outlook
Update)報告指出,2019年因貿易政策不確定性、地緣政治情勢緊張,及部分新
興市場經濟體動盪等因素持續壓抑全球製造業及貿易活動,全球經濟成長率由
2018年之3.6%降至2.9%;在風險可望不致加劇,加以為數不少之經濟體採行寬
鬆貨幣及財政政策之效果持續發揮下,預測2020年全球經濟成長率將緩步回升至
3.3%。
22日 △馬來西亞央行基於全球地緣政治緊張、政策不確定及金融市場波動加劇所致之下

164 ∣中央銀行季刊 第42卷第1期 民國109年3月
行風險持續,為激勵經濟成長,決議調降隔夜政策利率0.25個百分點至2.75%。
△南韓2019年第4季GDP年增率為2.2%,高於第3季之2.0%,主因商品出口恢復成
長,加以政府持續擴大公共支出所致,全年成長率為2.0%,低於2018年之2.7%,
係2009年以來低點。
23日 △歐洲央行(ECB)貨幣政策會議維持政策利率不變,且正式宣布開始檢視貨幣政
策架構,將評估物價穩定目標、貨幣政策工具、經濟與貨幣分析及公眾溝通策
略,並將考量金融穩定、就業與環境的可持續性,預計於2020年底前完成檢視。
29日 △美國聯邦公開市場委員會(FOMC)為確保準備金供給維持充裕,及減輕貨幣市
場壓力,決議延長隔夜及定期附買回操作執行期間至少至2020年4月。
30日 △美國2019年第4季GDP成長率(與上季比,換算成年率)為2.1%,與第3季持平。
與第3季相較,民間消費成長幅度較溫和,民間投資則因企業消化庫存致衰退幅
度擴大,淨輸出大增為挹注成長之主要來源;全年成長率因企業投資成長趨緩及
貿易活動疲軟,由2018年之2.9%降至2.3%,為近3年來最低。
31日 △歐元區2019年第4季GDP年增率初估值為1.0%,低於第3季之1.2%,為2014年第1
季以來最低,主因德國、法國與義大利等主要經濟體表現疲弱;全年成長率則由
2018年之1.9%降至1.2%,為2014年來最低。
△英國正式脫離歐盟,進入為期11個月的過渡期(至2020年底止),雙方將就貿
易、漁權及國防安全等各項協定展開談判。
民國109年2月份
5日 △泰國央行鑑於嚴重特殊傳染性肺炎(COVID-19)疫情致來自中國大陸之觀光客大
幅減少,且乾旱、出口下滑及預算延遲等因素將拖累經濟展望,決議調降1天期
附買回利率0.25個百分點至1.00%。
6日 △菲律賓央行因COVID-19疫情為經濟展望增添不確定性,為支撐經濟,決議調降隔
夜附賣回利率0.25個百分點至3.75%。
14日 △歐元區2019年第4季GDP年增率為0.9%,低於第3季之1.2%,德國、法國與義大利
等主要成員國經濟表現疲弱;歐元區全年GDP成長1.2%,低於2018年之1.9%。
17日 △日本2019年第4季GDP較上季衰退1.6%,換算年率為衰退6.3%,大幅低於市場預
期,主要係受2019年10月調高消費稅稅率及強颱衝擊民間消費,加上全球經濟成
國際經濟金融日誌∣ 165
長減速導致汽車及機械等出口低迷所致;全年則成長0.7%,高於2018年之0.3%。
△新加坡2019年第4季GDP年增率為1.0%,高於第3季之0.7%,主因營建業與服務業
成長幅度擴大;全年成長率則因製造業衰退,由2018年之3.4%降至0.7%。2020年
經濟成長率預測區間則自0.5%~2.5%下修至-0.5%~1.5%。
20日 △印尼央行為降低COVID-19疫情對國內經濟之衝擊,宣布調降7天期附賣回利率
0.25個百分點至4.75%。
22日 △IMF總裁Kristalina Georgieva於G-20財長及央行總裁會議上表示,考量COVID-19
疫情影響,並假設中國大陸經濟可於2020年第2季恢復正常下,IMF將2020年中國
大陸經濟成長率預測值由6.0%下調至5.6%,全球經濟成長率預測值則下調0.1個百
分點至3.2%。
民國109年3月份
2日 △經濟合作暨發展組織(OECD)發布「OECD期中經濟展望」(OECD Interim
Economic Assessment)報告,將2020年全球經濟成長率預測值降至2.4%,而在較
差情境下則將大幅降至1.5%,主因COVID-19疫情致全球成長展望具高度不確定
性。
3日 △美國聯邦公開市場委員會(FOMC)舉行非例行政策會議,鑑於COVID-19
疫情對經濟活動造成風險,緊急調降聯邦資金利率目標區間0.50個百分點至
1.00%~1.25%。
△馬來西亞央行鑑於國內經濟成長已放緩,加以COVID-19疫情衝擊觀光及製造
業,全球及國內經濟成長面臨下行風險,為支持經濟成長,決議調降隔夜政策利
率0.25個百分點至2.50%。
△澳洲央行為因應COVID-19疫情影響,調降現金利率目標0.25個百分點至0.50%,
並表示準備進一步寬鬆貨幣政策以支持經濟發展。
4日 △加拿大央行因COVID-19疫情恐為全球及國內經濟展望帶來重大衝擊,決議調降隔
夜拆款利率目標0.50個百分點至1.25%。
△香港金融管理局伴隨美國降息,將基本利率調降0.50個百分點至1.50%。
10日 △歐元區2019年第4季GDP年增率終值為1.0%,低於第3季之1.3%,德國、法國與義
大利等主要成員國經濟表現疲弱;全年GDP成長率為1.2%,低於2018年之1.9%。
166 ∣中央銀行季刊 第42卷第1期 民國109年3月
11日 △英國央行為協助家計單位及企業因應COVID-19疫情之影響,緊急宣布調降官方利
率0.50個百分點至0.25%。
12日 △ECB宣布維持主要再融通操作利率、邊際放款利率與存款利率分別於0.00%、
0.25%及-0.50%不變,而為因應COVID-19疫情導致的經濟衝擊與高度不確定性,
購債規模除現行每月200億歐元外,將於2020年底前額外增加1,200億歐元,且6月
前將進行更多長期再融通操作(LTRO),6月起至2021年6月止的第三輪定向長
期再融通操作(TLTRO III)則將提供更優惠的利率條件,以支持銀行放貸。
13日 △加拿大央行為緩解COVID-19疫情蔓延及油價暴跌對經濟造成之巨大衝擊,緊急宣
布調降隔夜拆款利率目標0.50個百分點至0.75%,為本月第2度降息。
15日 △美國FOMC提前召開原訂於本月17、18日舉行之政策會議,鑑於COVID-19疫情影
響經濟活動,且對經濟前景帶來風險,決議調降聯邦資金利率目標區間1個百分
點至0%~0.25%,為本月第2度降息;另宣布將增持5,000億美元公債及2,000億美元
機構房貸擔保證券(agency MBS),並將機構債及agency MBS到期本金全數再投
資於agency MBS,以使該市場順利運行;此外,亦將擴大隔夜及定期附買回交易
規模。
△Fed為支持國內外家庭與企業信用需求,減輕全球美元融資市場壓力,宣布與ECB
及日本、加拿大、英國、瑞士央行合作,將常設美元流動性交換額度(standing
U.S. dollar liquidity swap line arrangements)定價下調25個基點,並增設84天期之
操作。
△Fed為促進家庭及企業之信用流動,宣布一系列支持措施,包括調降主要融通利
率1.5個百分點至0.25%、存款準備率降至0%,以及鼓勵存款機構使用日內信貸及
資本與流動性緩衝,為受疫情影響之家庭與企業提供貸款。
16日 △紐西蘭央行為因應COVID-19疫情對貿易、旅遊觀光及國內生產之衝擊,宣布調降
官方現金利率0.75個百分點至0.25%,並表示若有必要將採取進一步的貨幣寬鬆措
施。
△香港金融管理局伴隨美國降息,將基本利率調降至0.86%。
△日本央行為因應COVID-19疫情對經濟及金融市場之衝擊,提前召開貨幣政策會
議,決議擴大貨幣寬鬆政策,包括實施新的企業金融支援特別操作(金融機構以
民間企業債務為擔保,融通期間最長1年,利率為0%,實施至2020年9月底)、增
國際經濟金融日誌∣ 167
加商業本票及公司債之購買額度各1兆日圓至3.2兆及4.2兆日圓(實施至2020年9
月底),以及擴大指數股票型基金(ETF)及不動產投資信託基金(J-REIT)之
購買額度,分別由每年6兆及900億日圓,擴大至12兆及1,800億日圓。
△南韓央行為因應COVID-19疫情及穩定經濟金融情勢,召開緊急貨幣政策會議,
調降基準利率0.50個百分點至0.75%之歷史低點。另將放款支援機制利率(Bank
Intermediated Lending Support Facility Interest Rates)由0.50%~0.75%調降至
0.25%,以支援中小企業之資金需求,並擴大公開市場操作之合格擔保品範圍,
以因應金融業之資金需求。
△中國人民銀行為因應COVID-19疫情及加強對小微及民營企業之信貸,對達普惠金
融考核標準的銀行定向降準0.5至1個百分點,對符合條件的股份制銀行再額外定
向降準1個百分點,釋出長期資金5,500億人民幣。
△越南央行為因應COVID-19疫情對生產及企業之衝擊,決議調降再融通利率1個百
分點至5.00%。
17日 △Fed宣布推出「商業本票融資機制」(Commercial Paper Funding Facility, CPFF)
及「主要交易商融通機制」(Primary Dealer Credit Facility, PDCF),以支持家庭
及企業之信用需求。CPFF將透過特殊目的機構(SPV)直接向合格企業買進商業
本票;PDCF將對主要交易商提供隔夜及最長90天期之融資,並以商業本票、地
方政府債等投資等級債券,及各類股權證券等作為擔保。
18日 △Fed為增進貨幣市場流動性及運作,以擴大支持家庭及企業信用需求,推出「貨
幣市場共同基金流動性機制」(Money Market Mutual Fund Liquidity Facility,
MMLF),貸款予合格金融機構,並以該機構自貨幣市場共同基金購入之高品質
資產作為擔保。
△ECB宣布新增「因應流行病緊急購買計畫」(Pandemic Emergency Purchase
Programme, PEPP),將於2020年底前購買7,500億歐元之公部門與私部門證券資
產。
19日 △印尼央行為降低COVID-19疫情對國內經濟之衝擊,宣布調降7天期附賣回利率
0.25個百分點至4.50%。
△澳洲央行宣布擴大寬鬆貨幣政策,除調降現金利率目標0.25個百分點至0.25%(為
本月第2度降息)外,另推出殖利率曲線控制政策,將在次級市場購債,控制3年
168 ∣中央銀行季刊 第42卷第1期 民國109年3月
期澳洲公債殖利率在0.25%附近。
△英國央行宣布調降官方利率0.15個百分點至0.10%,為本月第2度降息,另將資產
購買規模增加2,000億英鎊至6,450億英鎊。
△Fed宣布與澳洲、巴西、丹麥、南韓、墨西哥、挪威、紐西蘭、瑞典央行及新加
坡金融管理局建立臨時美元流動性交換額度至少6個月以上,其中對丹麥、挪
威、紐西蘭央行提供300億美元之流動性,其餘則提供最高達600億美元之流動
性,以減輕全球美元融資市場的壓力。
23日 △美國FOMC舉行非例行政策會議,宣布將持續購買公債及agency MBS,規模為足
以支持市場平穩運作及貨幣政策有效傳遞至更廣泛的金融領域所需之金額,且所
購買的agency MBS範圍將納入機構商業不動產貸款擔保證券(agency CMBS);
此外,亦將持續提供大規模隔夜及定期附買回操作。
△Fed宣布推出「初級市場公司融通機制」(Primary Market Corporate Credit
Facility, PMCCF)、「次級市場公司融通機制」(Secondary Market Corporate
Credit Facility, SMCCF)及「定期資產擔保證券貸款機制」(Term Asset-Backed
Securities Loan Facility, TALF),以對家庭及企業之信用需求提供強力支持。
PMCCF機制係由Fed設立之SPV向符合條件之企業購買其新發行債券或提供貸
款;SMCCF機制由SPV於次級市場買進符合條件之公司債或公司債ETF;TALF
機制由SPV提供以消費者貸款或小型企業貸款等為擔保之資產擔保證券(asset-
backed securities)之融通。
26日 △南韓央行決定於2020年4月起每週二以債券附買回方式無限量提供金融機構流動
性支援,為期3個月。
△新加坡2020年第1季GDP年增率初估值為-2.2%,大幅低於2019年第4季之1.0%,而
GDP與上季比換算年率初估值為-10.6%,亦大幅低於2019年第4季之0.6%,兩者均
因COVID-19疫情致營建及服務業轉呈負成長所致。
27日 △加拿大央行因COVID-19疫情持續蔓延及油價暴跌已對經濟造成重大影響,緊急
宣布調降隔夜拆款利率目標0.50個百分點至0.25%,為本月第3度降息,以支撐
國內經濟及金融體系抵禦疫情之衝擊;另啟動1項新的「商業本票購買計畫」
(Commercial Paper Purchase Program),及每週至少50億加元之政府債券購買計
畫,以確保市場流動性充裕。

國際經濟金融日誌∣ 169
△印度央行提前召開貨幣政策會議,決議調降附買回利率0.75個百分點至4.4%,並
調降附賣回利率0.90個百分點至4.0%,以因應COVID-19疫情引發的危機。另調降
存款準備率1個百分點至3.0%,為期1年,並宣布多項措施,以確保資金寬鬆。
30日 △新加坡貨幣管理局(MAS)基於預期2020年新加坡經濟將陷入衰退,近期至中
期之核心通膨可能續低於歷史平均,以及新加坡元名目有效匯率(S$NEER)已
貶至略低於政策區間中點等因素,決議放寬貨幣政策,將在現行S$NEER之水準
上,對政策區間採行年升值幅度為零的政策,至於區間寬度則維持不變,以維持
匯率穩定。
△世界銀行(World Bank)發布「東亞暨太平洋地區經濟展望更新」(East Asia and
Pacific Economic Update)報告,預期若COVID-19疫情可有效控制,2020年東亞
開發中經濟體成長率雖將大幅放緩至2.1%,2021年可望重回成長趨勢;惟若經濟
深度衰退後僅疲弱復甦,恐將伴隨持續的金融困境與負面循環,各經濟體均將遭
受重大衝擊。
31日 △Fed宣布建置1項與外國及國際貨幣主管機關(foreign and international monetary
authorities, FIMA)間之暫時性附買回協議機制(FIMA Repo Facility),為期至少
6個月,使渠等可暫時以所持之美國公債換取美元資金,提供除出售債券外之另
一暫時性取得美元資金管道,從而穩定美國公債市場機能,搭配Fed與其他央行
間之美元流動性交換額度,共同緩解國際美元融資市場之壓力。

170 ∣中央銀行季刊 第42卷第1期 民國109年3月
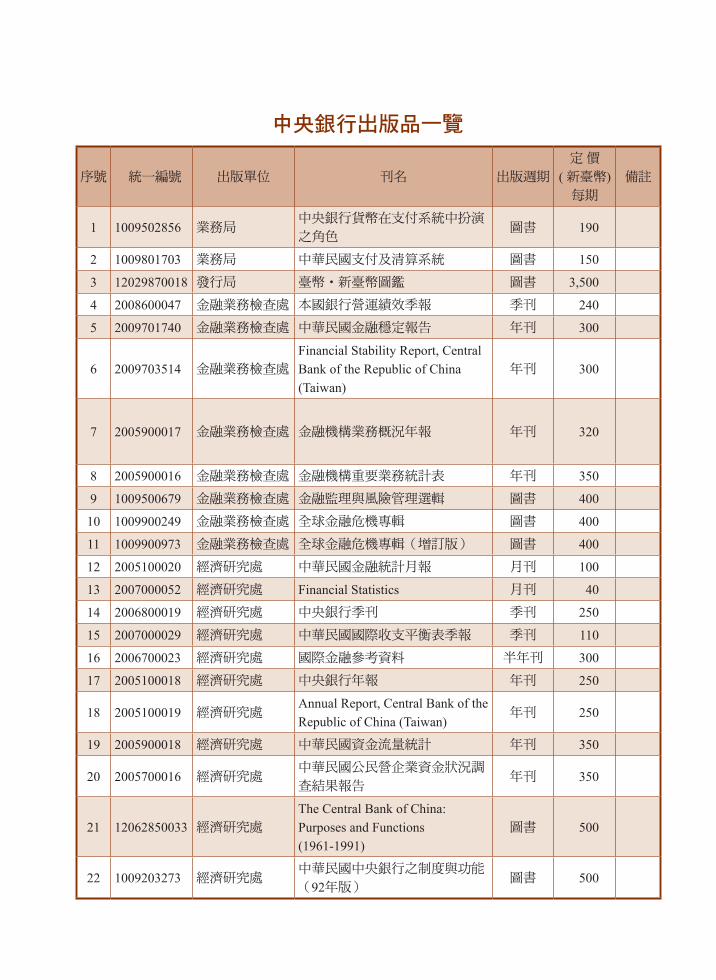
中央銀行出版品一覽
序號 統一編號 出版單位 刊名 出版週期
定 價( 新臺幣)每期
備註
1 1009502856 業務局 中央銀行貨幣在支付系統中扮演
之角色圖書 190
2 1009801703 業務局 中華民國支付及清算系統 圖書 150
3 12029870018 發行局 臺幣‧新臺幣圖鑑 圖書 3,500
4 2008600047 金融業務檢查處 本國銀行營運績效季報 季刊 240
5 2009701740 金融業務檢查處 中華民國金融穩定報告 年刊 300
6 2009703514 金融業務檢查處
Financial Stability Report, Central Bank of the Republic of China (Taiwan)
年刊 300
7 2005900017 金融業務檢查處 金融機構業務概況年報 年刊 320
8 2005900016 金融業務檢查處 金融機構重要業務統計表 年刊 350
9 1009500679 金融業務檢查處 金融監理與風險管理選輯 圖書 400
10 1009900249 金融業務檢查處 全球金融危機專輯 圖書 400
11 1009900973 金融業務檢查處 全球金融危機專輯(增訂版) 圖書 400
12 2005100020 經濟研究處 中華民國金融統計月報 月刊 100
13 2007000052 經濟研究處 Financial Statistics 月刊 40
14 2006800019 經濟研究處 中央銀行季刊 季刊 250
15 2007000029 經濟研究處 中華民國國際收支平衡表季報 季刊 110
16 2006700023 經濟研究處 國際金融參考資料 半年刊 300
17 2005100018 經濟研究處 中央銀行年報 年刊 250
18 2005100019 經濟研究處Annual Report, Central Bank of the Republic of China (Taiwan)
年刊 250
19 2005900018 經濟研究處 中華民國資金流量統計 年刊 350
20 2005700016 經濟研究處中華民國公民營企業資金狀況調
查結果報告年刊 350
21 12062850033 經濟研究處The Central Bank of China: Purposes and Functions (1961-1991)
圖書 500
22 1009203273 經濟研究處中華民國中央銀行之制度與功能
(92年版)圖書 500

23 1009203552 經濟研究處中華民國中央銀行之制度與功能
(92年版)圖書 600 精裝
24 1009501943 經濟研究處 The Central Bank of China (Taiwan) : Purposes and Functions (1992-2004)
圖書 350
25 12061810019 經濟研究處 各國中央銀行法選譯(第一輯) 圖書 500
26 12061820026 經濟研究處 各國中央銀行法選譯(第二輯) 圖書 500
27 1009203958 法務室 各國中央銀行法選譯(92年版) 圖書 600
28 1009302083 法務室各國中央銀行法選輯(2003年版)《中英對照本》
圖書 1,200
29 1010203391 法務室各國中央銀行法選輯(2013年版)(上冊)
圖書 1,200
30 1010203393 法務室各國中央銀行法選輯(2013年版)(下冊)
圖書 1,000
31 1010802049 法務室各國中央銀行法選輯(2019年版)(上冊)《中英對照本》
圖書 1,300
32 1010802050 法務室各國中央銀行法選輯(2019年版)(中冊)《中英對照本》
圖書 1,150
33 1010802052 法務室各國中央銀行法選輯(2019年版)(下冊)《中英對照本》
圖書 1,250
34 1009801079 法務室 各國中央銀行法選譯(續編) 圖書 600
35 1009801080 法務室各國中央銀行法選輯(續編)
《中英文對照》圖書 1,200
36 12072880010 秘書處 認識通貨膨脹(88年12月) 圖書 贈閱
37 12072890017 秘書處 認識中央銀行(89年12月) 圖書 贈閱
38 1009004168 秘書處中央銀行在我國經濟發展中的貢
獻(90年12月)圖書 贈閱
39 1009200895 秘書處The Central Bank of China (Taiwan)(2003/6)
圖書 贈閱
40 2007300032 中央印製廠 印刷科技季刊 季刊 100
41 1009701447 中央印製廠中央印製廠遷台60週年歷年印製鈔券圖輯
圖書 1,200
42 1009200061 中央造幣廠 中央造幣廠幣章圖鑑82年至92年 圖書 600
43 1009803376 中央造幣廠 中央造幣廠幣章圖鑑92年至98年 圖書 600
44 1010600376 中央造幣廠中央造幣廠幣章圖鑑98年至105年
圖書 600

檢 肅 貪 瀆
中央銀行暨所屬中央印製廠、中央造幣廠均設有行政革新信
箱,供各界革新建言,歡迎多加利用:
中央銀行:
信箱號碼:台北郵政第5-64號信箱
專線電話:02-2357-1870
傳真號碼:02-2357-1981
另於國庫局及業務局營業大廳設有革新專用信箱
中央印製廠:
信箱號碼:台北郵政第16-1號信箱
專線電話:02-2215-7011
傳真號碼:02-2214-2636
中央造幣廠:
信箱號碼:桃園郵政第224號信箱
專線電話:03-3295174 轉 150 分機
傳真號碼:03-3291412
以 廉 潔 為 榮以 貪 瀆 為 恥

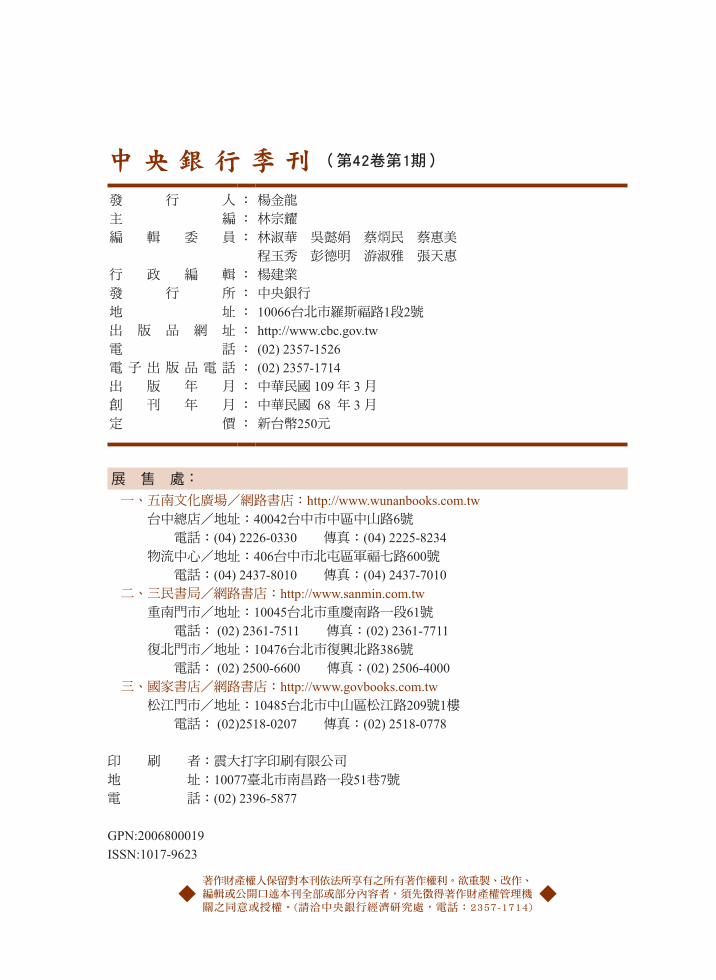
中 央 銀 行 季 刊 (第42卷第1期)
發 行 人
主 編
編 輯 委 員
行 政 編 輯
發 行 所
地 址
出 版 品 網 址
電 話
電 子 出 版 品 電 話
出 版 年 月
創 刊 年 月
定 價
:
:
:
:
:
:
:
:
:
:
:
:
楊金龍
林宗耀
林淑華 吳懿娟 蔡烱民 蔡惠美
程玉秀 彭德明 游淑雅 張天惠
楊建業
中央銀行
10066台北市羅斯福路1段2號http://www.cbc.gov.tw(02) 2357-1526(02) 2357-1714中華民國 109 年 3 月中華民國 68 年 3 月新台幣250元
展 售 處:
一、五南文化廣場/網路書店:http://www.wunanbooks.com.tw 台中總店/地址:40042台中市中區中山路6號 電話:(04) 2226-0330 傳真:(04) 2225-8234 物流中心/地址:406台中市北屯區軍福七路600號 電話:(04) 2437-8010 傳真:(04) 2437-7010 二、三民書局/網路書店:http://www.sanmin.com.tw 重南門市/地址:10045台北市重慶南路一段61號 電話: (02) 2361-7511 傳真:(02) 2361-7711 復北門市/地址:10476台北市復興北路386號 電話: (02) 2500-6600 傳真:(02) 2506-4000 三、國家書店/網路書店:http://www.govbooks.com.tw 松江門市/地址:10485台北市中山區松江路209號1樓 電話: (02)2518-0207 傳真:(02) 2518-0778
印 刷 者:震大打字印刷有限公司
地 址:10077臺北市南昌路一段51巷7號電 話:(02) 2396-5877
GPN:2006800019ISSN:1017-9623
◆ 著作財產權人保留對本刊依法所享有之所有著作權利。欲重製、改作、編輯或公開口述本刊全部或部分內容者,須先徵得著作財產權管理機關之同意或授權。(請洽中央銀行經濟研究處,電話:2357-1714)
◆