
4.1 Simulation Tool & Statistics(OPNET). 4.2 Network Model ...
10
Chapter four [OPNET modeler] ٣٨ 4.1 Simulation Tool & Statistics(OPNET). The simulation tool adopted in this research is Optimized Network Engineering Tools (OPNET). OPNET is an object-orientated simulation tool for making network modeling and QoS analysis of simulation of network communication, network devices and protocols. OPNET Modeler has a vast number of models for network elements, and it has many different real-life network configuration capabilities. These make real-life network environment simulations in OPNET very close to reality and provide full phases of a study. OPNET also includes features such as comprehensive library of network protocols and models, user friendly GUI (Graphical User Interface), Web report is feature allows you to organize and distribute the results of your simulations in form graphical results and statistics. OPNET doesn’t have any programming knowledge so that it’s easy to use and to deal with for any person [15]. Automatic simulation generation OPNET models can be compiled into executable code. In this simulation study, statistics of queuing delay, queue delay variation, end-to-end delay, are collected. These metrics describe the strength of QoS in a network. 4.2 Network Model & Configurations In order to analyze queuing disciplines, a hypotheticalnetwork topology is considered in this simulation as shownin figure.
-
Upload
khangminh22 -
Category
Documents
-
view
0 -
download
0
Transcript of 4.1 Simulation Tool & Statistics(OPNET). 4.2 Network Model ...
Chapter four [OPNET modeler]
٣٨
4.1 Simulation Tool & Statistics(OPNET). The simulation tool adopted in this research is Optimized Network Engineering Tools (OPNET). OPNET is an object-orientated simulation tool for making network modeling and QoS analysis of simulation of network communication, network devices and protocols. OPNET Modeler has a vast number of models for network elements, and it has many different real-life network configuration capabilities. These make real-life network environment simulations in OPNET very close to reality and provide full phases of a study. OPNET also includes features such as comprehensive library of network protocols and models, user friendly GUI (Graphical User Interface), Web report is feature allows you to organize and distribute the results of your simulations in form graphical results and statistics. OPNET doesn’t have any programming knowledge so that it’s easy to use and to deal with for any person [15]. Automatic simulation generation OPNET models can be compiled into executable code. In this simulation study, statistics of queuing delay, queue delay variation, end-to-end delay, are collected. These metrics describe the strength of QoS in a network. 4.2 Network Model & Configurations In order to analyze queuing disciplines, a hypotheticalnetwork topology is considered in this simulation as shownin figure.

Chapter four [OPNET modeler]
٣٩
Figure4-1Network Topology for Simulation. In this dissertationwehave a network that carries three applications: FTP, Video, and VoIP. We will study how the choice of the queuing discipline in the routers can affect the performance of the applications and the utilization of the network resources. There are some important objects in OPNET that are used to simplify and facilitate the work with it. In this research, some of these objects that are used are Application Configuration, Profile Configuration and QoS Attribute Configuration as show in Fig.4-1 1. Application Configuration Object: is an object used to define and configure all Applications in the network according to the user requirements. OPNET has most commonapplications like: HTTP, E-mail, video, File transfer, Voice, database. In this research, there isone application in the network model is a Voice.

Chapter four [OPNET modeler]
٤٠
2. Profile Configuration Object: is an object that can be used to create users profiles, profile can contains one or more applications and each application can be configured by the starting time and ending time. In this research, there is only one profile to all users called VoIP_ profile. 3. The QoS Attribute node: is a mean of attribute configuration details that assess protocols at the IP layer. It deals with the three queuing profiles: FIFO, Priority queuing and weighted fair queuing.
4.3 Simulation Results & Analysis In this research, a Comparison between the effects of different queuing duplicates such as FIFO, PQ and WFQ on FTP, Video and VoIPQoS. To measure the QoS of these applications during collected statistics (parameters) such as: delay (sec), jitter (sec), traffic sends (packet/sec) and traffic received (packet/sec). The duration of simulation is 150 second and the results are obtained as shown from figure4-2 to 4-9. To test the performance of the applications defined in the network, some statistics was collected as follows:
Table 4-1 some statisticsto test the performance of the applications IP Video conferencing Voice
Traffic dropped
Packet End-to-End Delay(sec)
Packet delay variation
Traffic send (packets/sec)
Packet End-to-End Delay(sec)
Traffic Received (packets /sec)
Traffic Received( packets/sec)

Chapter four [OPNET modeler]
٤١
4.3.1 Configure Application:
Table 4-2 Configure Application
Application
Load
Inter request time(s)
Type of service (ToS)
FTP
High load to
FTP
Start time: constant(100)
Duration: end of simulation
Best effort(0)
Video
Low resolution video to
video conferencing
Start time: constant(100)
Duration: end of simulation.
Streaming
multimedia(4)
VoIP
PCM quality speech to
voice
Start time:
constant(100) Duration: end of
simulation.
Interactive
voice(6)
The blue line represent FIFO algorithm; whereas the red line represent PQ algorithm; whereas the green line represent WFQ algorithm. 4.3.2 Graphical Analysis: Analyzing graphs, we examined the overlapping of the voice packets with end to end delay and voice packet delay variation graphs. Compared the three queuing disciplines and explained their effect on the performance of the three applications.

Chapter four [OPNET modeler]
٤٢
Figure 4-2 IP traffic dropped (packets/sec)
Figure 4-2 shows that the highest rate of dropped packets occurs with the FIFO queuing discipline. The lowest rate is provided by the WFQ queuing discipline. This is because, FIFO drops packets without regard to which flow the packet belongs to but only depending on its arrival time. PQ and WFQ disciplines implement multipleFIFO queues and provide a service that depends on the ToSvalue associated with the packets.

Chapter four [OPNET modeler]
٤٣
Figure 4-3 Voice Traffic Send (packet/sec)
Figure 4-3 shows the voice traffic sent in all three cases = 400 Packets/sec.
Figure 4-4 Voice Traffic Received (packet/sec)
Figure 4-4 shows the voice traffic received using FIFO algorithm = 380 (Packets/sec), the voicetraffic received using PQ and WFQ = 400 (Packets/sec).
Chapter four [OPNET modeler]
٤٤
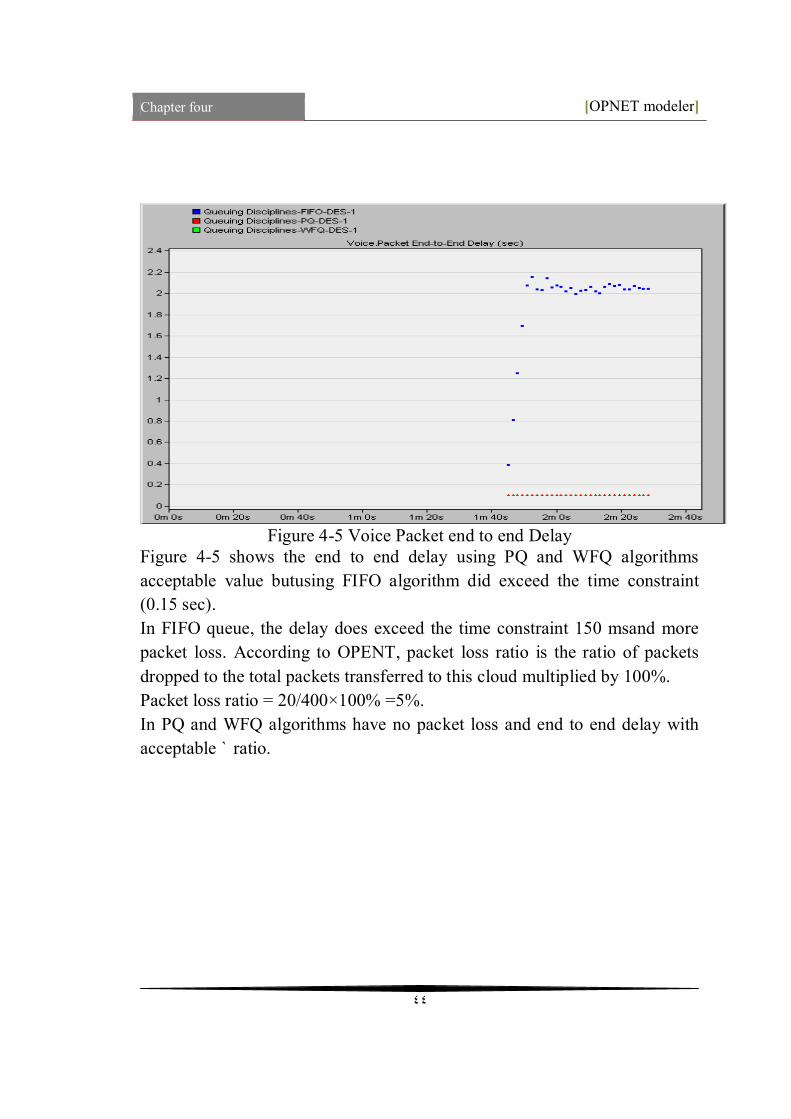
Figure 4-5 Voice Packet end to end Delay
Figure 4-5 shows the end to end delay using PQ and WFQ algorithms acceptable value butusing FIFO algorithm did exceed the time constraint (0.15 sec). In FIFO queue, the delay does exceed the time constraint 150 msand more packet loss. According to OPENT, packet loss ratio is the ratio of packets dropped to the total packets transferred to this cloud multiplied by 100%. Packet loss ratio = 20/400×100% =5%. In PQ and WFQ algorithms have no packet loss and end to end delay with acceptable ` ratio.

Chapter four [OPNET modeler]
٤٥
Figure 4-6 Video conferencingPacket end to end Delay
Figure 4-7 Video conferencing Traffic Send (packets/sec)

Chapter four [OPNET modeler]
٤٦
Figure 4-8 Video conferencing Traffic Received (packets/sec)
The following graph compares the queuing delay for the FIFO, PQ, and WFQ disciplines. It shows that the highest delay is experienced by the FIFO queuing discipline. The best delay is provided by the WFQ as expected.
Figure 4-9 Queuing delay

Chapter four [OPNET modeler]
٤٧
VoIP and VC services under given configurations (as evident in figure 4.9), experience same queuing delays and in respective FIFO, PQ & WFQ disciplines. This behavior of voice and video is obtained since they are high priority traffic in the network and thus bear hard QoS guarantees for delay and its variants in both PQ and WFQ disciplines. Our tested scenario is configured with such values of traffic generation that it produces same delay in both PQ and WFQ. Therefore, it indicates that same delay may be observed for high priority traffic in both PQ and WFQ disciplines when clearly distinct service classes are present in a network. Voice has the lowest delay amongst all other type of traffic in the network. The voice packet is not very long but it is highly sensitive to delay and jitter due to the nature of service. The priority of voice in QoS configuration is therefore the highest. If its priority is brought down, the end user will receive low grade and broken voice [16]. On the other hand, video has the highest delay in the network being a service with high payload packets. Therefore, live streaming video transmission demands high quality link as well as disturbance less connection. In this analysis, it is observed that queuing delay of video is the highest amongst all network traffic.